Results of Shipboard Approval Tests of Ballast Water Treatment Systems in Freshwater Distribution Statement A: Approved for public release; distribution is unlimited. November 2014 Report No. CG-D-05-15

Welcome message from author
This document is posted to help you gain knowledge. Please leave a comment to let me know what you think about it! Share it to your friends and learn new things together.
Transcript

Results of Shipboard Approval Tests of Ballast Water Treatment Systems in Freshwater
Distribution Statement A: Approved for public release; distribution is unlimited.
November 2014
Report No. CG-D-05-15

Results of Shipboard Approval Tests of BWT Systems in Freshwater
ii UNCLAS//Public | CG-926 R&DC | Cangelosi, et al. | Public
November 2014
N O T I C E
This document is disseminated under the sponsorship of the Department of
Homeland Security in the interest of information exchange. The United
States Government assumes no liability for its contents or use thereof.
The United States Government does not endorse products or manufacturers.
Trade or manufacturers’ names appear herein solely because they are
considered essential to the object of this report.
This report does not constitute a standard, specification, or regulation.
Mr. Timothy Girton
Technical Director
United States Coast Guard
Research & Development Center
1 Chelsea Street
New London, CT 06320

Results of Shipboard Approval Tests of BWT Systems in Freshwater
iii
UNCLAS//Public | CG-926 R&DC | Cangelosi, et al. | Public
November 2014
Technical Report Documentation Page 1. Report No.
2. Government Accession Number
3. Recipient’s Catalog No.
4. Title and Subtitle
Results of Shipboard Approval Tests of Ballast Water Treatment Systems in
Freshwater
5. Report Date
November 2014 6. Performing Organization Code
Project No. 41012 7. Author(s)
Allegra Cangelosi, Meagan Aliff, Lisa Allinger, Mary Balcer, Kimberly
Beesley, Meghana Desai, Lana Fanberg, Michelle Gutsch, Steve Hagedorn,
Travis Mangan, Adam Marksteiner, Nicole Mays, Christine Polkinghorne,
Kelsey Prihoda, Euan Reavie, Deanna Regan, Heidi Saillard, Heidi Schaefer,
Tyler Schwerdt, Matthew TenEyck.
8. Performing Report No.
R&DC UDI #1241
9. Performing Organization Name and Address
Great Ships Initiative
Northeast-Midwest Institute
50 F St. NW, Suite 950
Washington, DC 20001
U.S. Coast Guard
Research and Development Center
1 Chelsea Street
New London, CT 06320
10. Work Unit No. (TRAIS)
11. Contract or Grant No.
HSCG32-11-X-R00017
12. Sponsoring Organization Name and Address
U.S. Department of Homeland Security
Commandant (CG-OES)
United States Coast Guard
2100 Second St. SW
Washington, DC 20593-0001
13. Type of Report & Period Covered
Final Report
14. Sponsoring Agency Code
Commandant (CG-OES)
U.S. Coast Guard Headquarters
Washington, DC 20593-0001 15. Supplementary Notes
The R&D Center’s technical point of contact is Chris Turner, Phone: 860-271-2623, email: [email protected] 16. Abstract (MAXIMUM 200 WORDS)
The U.S. Coast Guard Research and Development Center (USCG RDC) tasked the Great Ships Initiative (GSI) with
implementing the United States Environmental Protection Agency, Environmental Technology Verification (ETV) Program’s
Draft Generic Protocol for the Verification of Ballast Water Treatment Technology in Shipboard Installations, version 5.2,
(ETV DSP) on board an operating commercial vessel to identify areas of possible improvement. ETV DSP implementation
included use of a prototype Shipboard Filter Skid (p3SFS), which the ETV DSP incorporates as an optional sampling
approach. A secondary objective of Project 41012 was to evaluate, on a limited basis, the biological efficacy and
environmental soundness of a prototype ballast water management system (BWMS). Four test cycles took place on board a
Great Lakes self-unloading bulk freighter, the Motor Vessel Indiana Harbor, with the prototype BWMS active during two of
them. Overall GSI found both the ETV DSP and p3SFS to be feasible and promising approaches to shipboard validation of
prospective BWMSs, and identified specific ways to improve them. The prototype BWMS operated during these tests reduced
the densities of live plankton in the Indiana Harbor’s ballast tanks, but the treated discharges did not meet International
Maritime Organization (IMO) standards in these tests.
17. Key Words
Ballast Water, Ballast Water Treatment, Ballast Water
Management, Great Lakes, Environmental Technology
Verification, Great Ships Initiative, Shipboard Testing,
Shipboard Protocol
18. Distribution Statement
Distribution Statement A: Approved for public release;
distribution is unlimited.
19. Security Class (This Report)
UNCLAS//Public
20. Security Class (This Page)
UNCLAS//Public
21. No of Pages
136
22. Price
CG-D-05-15

Results of Shipboard Approval Tests of BWT Systems in Freshwater
iv
UNCLAS//Public | CG-926 R&DC | Cangelosi, et al. | Public
November 2014
(This page intentionally left blank.)

Results of Shipboard Approval Tests of BWT Systems in Freshwater
v
UNCLAS//Public | CG-926 R&DC | Cangelosi, et al. | Public
November 2014
EXECUTIVE SUMMARY
This United States Coast Guard Research and Development Center (USCG RDC) Technical Report (TR)
fulfills Great Ships Initiative (GSI) contract implementation of USCG RDC Project No. 41012 titled
Shipboard Approval Tests of Ballast Water Treatment Systems in Freshwaters (hereafter, Project 41012).
Specifically, this TR presents GSI methods, results, conclusions and recommendations in its role of
implementing, and identifying areas of improvement in, the United States Environmental Protection Agency
(USEPA) Environmental Technology Verification (ETV) Program’s Draft Generic Protocol for the
Verification of Ballast Water Treatment Technology in Shipboard Installations, version 5.2, (hereafter, ETV
DSP) (USEPA, 2012). The first objective of the ETV DSP demonstration and review exercise was
implementation of the ETV DSP on an operating commercial vessel, including a skid-mounted sampling
system, known as the prototype 3 Shipboard Filter Skid (p3SFS), developed by the Naval Research
Laboratory (NRL) in Key West, Florida, which the ETV DSP incorporates as an optional sampling
approach. A secondary objective of Project 41012 was to evaluate, on a limited basis, the biological
treatment efficacy and environmental soundness of a prototype ballast water management system (BWMS).
GSI’s evaluation of the ETV DSP and p3SFS took place during four test cycles (TCs) on board a Great
Lakes self-unloading bulk freighter, the Motor Vessel (M/V) Indiana Harbor (IH). During two test cycles, a
partial and temporary NaOH prototype BWMS also was activated. Intake sampling occurred during IH
ballasting at a southern Lake Michigan or southeastern Lake Erie port. Discharge sampling occurred during
IH deballasting operations in western Lake Superior.
GSI implemented each of the four TCs following a Test/Quality Assurance Plan (TQAP), which itself was
consistent with the ETV DSP. All TCs generally met ETV DSP physical/chemical and biological validity
requirements; though there were some potentially relevant inconsistencies which are noted in this report.
The GSI team found both the ETV DSP and p3SFS to be feasible and promising approaches to shipboard
validation of prospective BWMSs, but identified specific ways to improve them. For the ETV DSP, these
include:
Requiring test organizations (TOs) to explicitly define in the TQAP how they will protect personnel
health and safety through preventing exposure to harmful substances and organisms in ballast water,
and overextension of staff;
Requiring acceptable limits for sampling to be considered proportional so that at a minimum the TO
can make a post facto determination of validity;
Requiring that TOs provide evidence, from the literature or from new empirical tests, to eliminate
intake water toxicity as a source of BWMS discharge toxicity; and
Removing requirements for meeting intake water chemistry challenge water target conditions,
lowering the presumed percent live for the ≥ 50 µm size class of organisms in preserved intake
samples, and allowing a higher presumption only with seasonal validation.
For the p3SFS, these include:
Providing enough sample ports if a vessel requires multiple sampling locations such that vessel
crews do not need to move the ports during testing;

Results of Shipboard Approval Tests of BWT Systems in Freshwater
vi
UNCLAS//Public | CG-926 R&DC | Cangelosi, et al. | Public
November 2014
Installing a second pressure sensor downstream of the canister so that the differential pressure across
the canister can be measured more reliably than with the differential pressure sensor;
Switching the p3SFS pump to a self-priming model to expand the range of conditions in which the
sampling system can operate;
Modifying the p3SFS to allow collection of discrete grab samples and for collection of two drip
samples simultaneously into two 19 L carboys;
Adding alarms, including to indicate overly high or low sample flow; and
Conducting validation experiments to determine the most accurate inline sensors to measure
temperature and turbidity, as well as, the data output type for the p3SFS that produces the most
accurate and reliable results; and
Based on post shipboard validations at the GSI land-based facility of the p3SFS performance
(Appendix A), installing the sample flow meter in a straight length of pipe long enough to ensure
accurate readings.
The secondary objective of this project, GSI’s assessment of the prototype NaOH BWMS’s performance
against the USCG’s Standards for Living Organisms in Ships’ Ballast Water Discharged in U.S. Waters
(USCG, 2012) using the ETV DSP (with necessary deviations), successfully produced a partial assessment
of the BWMS’s performance in the context of the ETV DSP. The zooplankton analysis alone was
unsuccessful due to interference issues associated with the p3SFS flow meter and flow control apparatus
(detected only in follow-up validation exercises at the GSI land-based facility). The GSI team was able to
complete all sampling and necessary biological efficacy analyses, however, consistent with the ETV DSP.
Valid results pertaining to densities of live organisms ≥ 10 µm and < 50 µm in minimum dimension in
treatment discharge showed the BWMS’s discharge were two orders of magnitude above the USCG’s
standard. Concentrations of regulated organisms < 10 µm in minimum dimension (E. coli and Enterococcus
spp.) were already below the discharge limit upon intake. No trihalomethanes, haloacetic acids, or bromate
ions were detected in the treatment discharge samples. However, measurable concentrations of sodium ion
were found in the treatment discharge from tanks 3P and 4P in both TCs where the prototype BWMS was
activated. Whole Effluent Toxicity (WET) tests conducted according to protocols described here showed a
significant reduction in the cladoceran Ceriodaphnia dubia reproduction exposed to treated effluent and
dilutions thereof, relative to controls. No reproduction effects were detected in any other test organism, and
no acute effects were detected.
The report concludes the ETV DSP represents a strong starting point for a standard shipboard BWMS
verification protocol, but greater specificity and clarity in specific areas are needed to assure that TOs have
sufficient guidance to avoid expensive false starts or compromised outcomes. For example, the ETV DSP should
provide guidance for: protecting TO staff health and safety during shipboard tests; unplanned changes to ballast
flow rates; sample proportionality; and whether “whole tanks” need to be sampled on discharge or whether
partial tanks are valid sources of discharge water. Given resident toxicity of many harbors, GSI also recommends
that the ETV DSP require a qualitative determination for WET of intake water, and perhaps allow greater
flexibility around valid threshold conditions. In particular, particulate organic matter (POM) and particulate
organic carbon (POC) requirements are more easily and thoroughly addressed in land-based testing. In terms of
the p3SFS, GSI recommends relocation of the p3SFS flow meter to a length of pipe free of upstream
obstructions; provision of additional sample ports; improved filter sock construction; enhanced drip and grab
sample collection capacity; more accurate temperature and turbidity detection capability; digital card error
reporting; and improved pause and resume capacity. The user-interface would be improved by revised alarms,
better p3SFS “cleanability” and guidance, a trend screen, installation checklists, and a flow-rate display.

Results of Shipboard Approval Tests of BWT Systems in Freshwater
vii
UNCLAS//Public | CG-926 R&DC | Cangelosi, et al. | Public
November 2014
TABLE OF CONTENTS
EXECUTIVE SUMMARY ............................................................................................................................ v
LIST OF FIGURES ....................................................................................................................................... ix
LIST OF TABLES ......................................................................................................................................... xi
LIST OF ACRONYMS, ABBREVIATIONS, AND SYMBOLS............................................................. xiii
1 INTRODUCTION AND BACKGROUND .......................................................................................... 1
1.1 Overview and Objectives ................................................................................................................... 1 1.2 Roles and Responsibilities of Organizations ...................................................................................... 2
1.2.1 Testing Organization ................................................................................................................... 2
1.2.2 Ballast Water Management System Developer .......................................................................... 2 1.2.3 Ship Operator .............................................................................................................................. 3 1.2.4 Verification Organization ........................................................................................................... 3 1.2.5 Federal Partners .......................................................................................................................... 3
1.2.6 External Collaborators ................................................................................................................ 3 1.3 Purpose and Features of the Environmental Technology Verification Program’s Draft Shipboard
Protocol .............................................................................................................................................. 3 1.4 Description of the Test Vessel ........................................................................................................... 7 1.5 Description of the Ballast Water Management System ..................................................................... 7
2 Experimental design ............................................................................................................................... 9
2.1 Overview and Calendar ...................................................................................................................... 9
2.2 Sample Collection and Analysis Locations ...................................................................................... 12 2.3 Description of the p3SFS Sampling System .................................................................................... 13
2.4 Sample Collection ............................................................................................................................ 15 2.4.1 Determination of Proportionality of Sample Flow to Ballast Flow .......................................... 17
2.5 Sample Handling and Storage .......................................................................................................... 18 2.6 Sample Analysis ............................................................................................................................... 24
2.6.1 Water Chemistry Detection Limits ........................................................................................... 24
2.6.2 Total Suspended Solids, Particulate Organic Matter, Percent Transmittance and Mineral
Matter ........................................................................................................................................ 24 2.6.3 Non-Purgeable Organic Carbon, Dissolved Organic Carbon and Particulate Organic Carbon 24
2.6.4 YSI Multiparameter Water Quality Sonde Measurements ....................................................... 24 2.6.5 Biology ...................................................................................................................................... 24 2.6.6 Disinfection Byproducts ........................................................................................................... 25
2.6.7 Whole Effluent Toxicity ........................................................................................................... 25 2.7 Data Processing, Verification, Validation and Storage .................................................................... 25
3 BALLAST WATER MANAGEMENT SYSTEM PERFORMANCE RESULTS ......................... 26
3.1 Ballast Water Management System Operational Outcomes ............................................................ 26
3.1.1 Test Cycle 2 .............................................................................................................................. 26 3.1.2 Test Cycle 3 .............................................................................................................................. 26
Results of Shipboard Approval Tests of BWT Systems in Freshwater
viii
UNCLAS//Public | CG-926 R&DC | Cangelosi, et al. | Public
November 2014
TABLE OF CONTENTS (Continued)
3.2 Sampling Operations ........................................................................................................................ 27 3.2.1 Intake Sampling ........................................................................................................................ 27 3.2.2 Discharge Sampling .................................................................................................................. 31 3.2.3 Proportionality of Sample Flow to Ballast Flow ...................................................................... 35
3.3 Characterization of Ballast Water Sampled in Test Cycles 1-4 ....................................................... 40
3.3.1 Total Suspended Solids, Particulate Organic Matter, Percent Transmittance and Mineral
Matter ........................................................................................................................................ 40 3.3.2 Non-Purgeable Organic Carbon, Dissolved Organic Carbon and Particulate Organic ...............
Carbon ....................................................................................................................................... 40 3.3.3 Other Water Quality Parameters ............................................................................................... 51
3.3.4 Biology ...................................................................................................................................... 57 3.4 Characterization of Test Validity Based on Challenge Conditions .................................................. 71
3.5 Biological Performance (BWMS) Efficacy ..................................................................................... 71 3.6 Environmental Acceptability............................................................................................................ 72
3.6.1 Disinfection Byproducts ........................................................................................................... 73 3.6.2 Whole Effluent Toxicity ........................................................................................................... 73
3.8 Quality Assurance/Quality Control .................................................................................................. 84
3.8.1 Calibration of Multiparameter Water Quality Sondes .............................................................. 84 3.8.2 Data Quality Indicators ............................................................................................................. 84
3.8.3 Deviations from the Test/Quality Assurance Plans .................................................................. 98
4 LESSONS LEARNED AND SUMMARY ........................................................................................ 104
4.1 ETV Draft Shipboard Protocol ....................................................................................................... 104
4.1.1 Protecting Health and Safety of Personnel ............................................................................. 104
4.1.2 Managing Sampling Logistics ................................................................................................ 106 4.1.3 Requirements around Challenge Conditions .......................................................................... 107
4.2 The p3SFS ...................................................................................................................................... 108
4.2.1 Hardware ................................................................................................................................. 108 4.2.2 Software .................................................................................................................................. 110 4.2.3 User Interface .......................................................................................................................... 112
5 CONCLUSION ................................................................................................................................... 113
6 REFERENCES .................................................................................................................................... 115
APPENDIX A. p3SFS FLOW CONTROL/FLOW METER POST-EXPERIMENT PROBLEM
DIAGNOSIS ................................................................................................................... A-1
APPENDIX B. GSI TEST/QUALITY ASSURANCE PLAN (TQAP) ............................................... B-1
APPENDIX C. GSI QUALITY ASSURANCE PROJECT PLAN (QAPP) FOR SHIPBOARD
TESTS ............................................................................................................................. C-1
Results of Shipboard Approval Tests of BWT Systems in Freshwater
ix
UNCLAS//Public | CG-926 R&DC | Cangelosi, et al. | Public
November 2014
LIST OF FIGURES
Figure 1. Location of the ballast water management system’s sodium hydroxide inline injection point
relative to the GSI intake sample port. ..............................................................................................6
Figure 2. Map of the Great Lakes showing Test Cycle 1 - 4 ballast intake and discharge locations. ............12
Figure 3. The GSI mobile laboratory. .............................................................................................................12
Figure 4. Side view of the Prototype Three Skid Filter System (p3SFS). ......................................................14
Figure 5. Three-dimensional drawing of the Prototype Three Skid Filter (p3SFS) showing placement in
the M/V Indiana Harbor’s engine room with respect to the ballast header during discharge.
Note: during intake the flow in the header travels in the opposite direction to the ballast tanks
and the SV and RV are switched for sample collection. .................................................................15
Figure 6. GSI sample collection team waiting to board the M/V Indiana Harbor. ........................................16
Figure 7. Full p3SFS filter bag after completion of a sampling event. ...........................................................16
Figure 8. GSI sample collection team rinsing the inside of the p3SFS filter bag. ..........................................17
Figure 9. Ballast tank levels displayed in the M/V Indiana Harbor control room. ........................................18
Figure 10. GSI personnel conducting analysis of organisms ≥ 10 µm and < 50 µm. .....................................25
Figure 11. Cracked nipple on the p3SFS leading to the drip sampler. ...........................................................32
Figure 12. Calculated rate of ballast water loaded into tanks 2P and 5P during Test Cycle 2 intake
operations compared to the target rate of sample water collected using the p3SFS. .....................36
Figure 13. Calculated rate of ballast water loaded into tanks 2P and 5P during Test Cycle 3 intake
operations compared to the target rate of sample water collected using the p3SFS. .....................37
Figure 14. Estimated volume of ballast water discharged from tanks 3P, 4P and 5P during Test Cycle 2
discharge operations compared volume of sample water collected using the p3SFS....................38
Figure 15. Estimated volume of water discharged from tanks 3P, 4P and 5P during Test Cycle 3
discharge operations compared volume of sample water collected using the p3SFS....................39
Figure 16. Test Cycle 1-4 intake and discharge concentrations of total suspended solids. *Tank 3P and
4P were treated during Test Cycles 2 and 3. ..................................................................................43
Figure 17. Test Cycle 1-4 intake and discharge concentrations of particulate organic matter. *Tank 3P
and 4P were treated during Test Cycles 2 and 3. ...........................................................................44
Figure 18. Test Cycle 1-4 intake and discharge concentrations of percent transmittance - filtered. *Tank
3P and 4P were treated during Test Cycles 2 and 3. ......................................................................45
Figure 19. Test Cycle 1-4 intake and discharge concentrations of percent transmittance - unfiltered.
*Tank 3P and 4P were treated during Test Cycles 2 and 3. ..........................................................46
Figure 20. Test Cycle 1-4 intake and discharge concentrations of mineral matter. *Tank 3P and 4P were
treated during Test Cycles 2 and 3. ................................................................................................47
Figure 21. Test Cycle 1-4 intake and discharge concentrations of non-purgeable organic carbon. *Tank
3P and 4P were treated during Test Cycles 2 and 3. ......................................................................48
Figure 22. Test Cycle 1-4 intake and discharge concentrations of dissolved organic carbon. *Tank 3P
and 4P were treated during Test Cycles 2 and 3. ...........................................................................49
Figure 23. Test Cycle 1-4 intake and discharge concentrations of particulate organic carbon. *Tank 3P
and 4P were treated during Test Cycles 2 and 3. ...........................................................................50
Figure 24. Test Cycle 1-4 intake and discharge temperature measurements (measured using a
Multiparameter Sonde and the p3SFS in-line sensor). ..................................................................53
Figure 25. Test Cycle 1-4 intake and discharge specific conductivity measurements (measured using a
YSI Multiparameter Sonde). ..........................................................................................................53
Results of Shipboard Approval Tests of BWT Systems in Freshwater
x
UNCLAS//Public | CG-926 R&DC | Cangelosi, et al. | Public
November 2014
LIST OF FIGURES (Continued)
Figure 26. Test Cycle 1-4 intake and discharge salinity measurement (measured using a YSI
Multiparameter Sonde). .................................................................................................................54
Figure 27. Test Cycle 1-4 intake and discharge pH measurements (measured using a YSI
Multiparameter Sonde). .................................................................................................................54
Figure 28. Test Cycle 1-4 intake and discharge turbidity measurements (measured using a
Multiparameter Sonde and the p3SFS in-line sensor). ..................................................................55
Figure 29. Test Cycle 1-4 intake and discharge total chlorophyll measurements (measured using a YSI
Multiparameter Sonde). .................................................................................................................55
Figure 30. Test Cycle 1-4 intake and discharge dissolved oxygen (percent saturation) measurements
(measured using a YSI Multiparameter Sonde). ............................................................................56
Figure 31. Test Cycle 1-4 intake and discharge dissolved oxygen measurements (measured using a YSI
Multiparameter Sonde). .................................................................................................................56
Figure 32. AquaSensors display on the p3SFS showing the in-line temperature and turbidity data in real
time. ...............................................................................................................................................57
Figure 33. Test Cycle 1-4 intake and discharge concentrations of live organisms ≥ 50 µm. *Tanks 3P
and 4P were treated during Test Cycles 2 and 3. ...........................................................................59
Figure 34. Test Cycle 1-4 intake composition of live organisms ≥ 50 µm. ....................................................60
Figure 35. Test Cycle 1-4 intake and discharge density and composition of live organisms ≥ 50 µm. ..........60
Figure 36. Test Cycle 1-4 intake and discharge concentrations of live organisms ≥ 10 µm and < 50 µm.
*Tanks 3P and 4P were treated during Test Cycles 2 and 3. .........................................................61
Figure 37. Test Cycle 1-4 intake and discharge concentrations of total heterotrophic bacteria measured
using the SimPlate® Method of Analysis.*Tanks 3P and 4P were treated during Test Cycles
2 and 3. ...........................................................................................................................................62
Figure 38. Test Cycle 1-4 intake and discharge concentrations of total heterotrophic bacteria measured
using the spread plate method of analysis. *Tanks 3P and 4P were treated during Test Cycles
2 and 3. ...........................................................................................................................................63
Figure 39. Test Cycle 1-4 intake and discharge concentrations of Escherichia coli. *Tanks 3P and 4P
were treated during Test Cycles 2 and 3. .......................................................................................64
Figure 40. Test Cycle 1-4 intake and discharge concentrations of total coliform bacteria. *Tanks 3P and
4P were treated during Test Cycles 2 and 3. ..................................................................................65
Figure 41. Test Cycle 1-4 intake and discharge concentrations of enterococcus spp. *Tanks 3P and 4P
were treated during Test Cycles 2 and 3. .......................................................................................66
Figure 42. Proposed Test Cycle 2-4 GSI personnel hours. ...........................................................................105

Results of Shipboard Approval Tests of BWT Systems in Freshwater
xi
UNCLAS//Public | CG-926 R&DC | Cangelosi, et al. | Public
November 2014
LIST OF TABLES
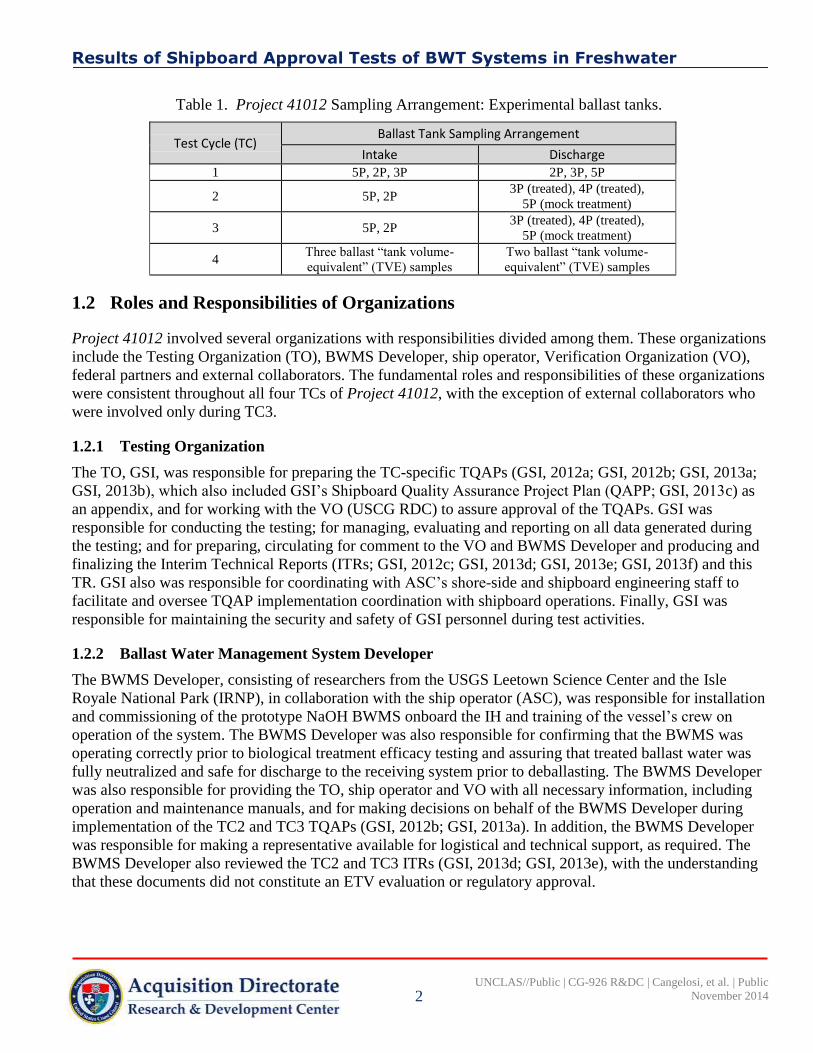
Table 1. Project 41012 Sampling Arrangement: Experimental ballast tanks. ..................................................2 Table 2. Summary of deviations made to the U.S. Environmental Protection Agency, Environmental
Technology Verification Program’s Draft Shipboard Protocol (ETV DSP; USEPA 2012)
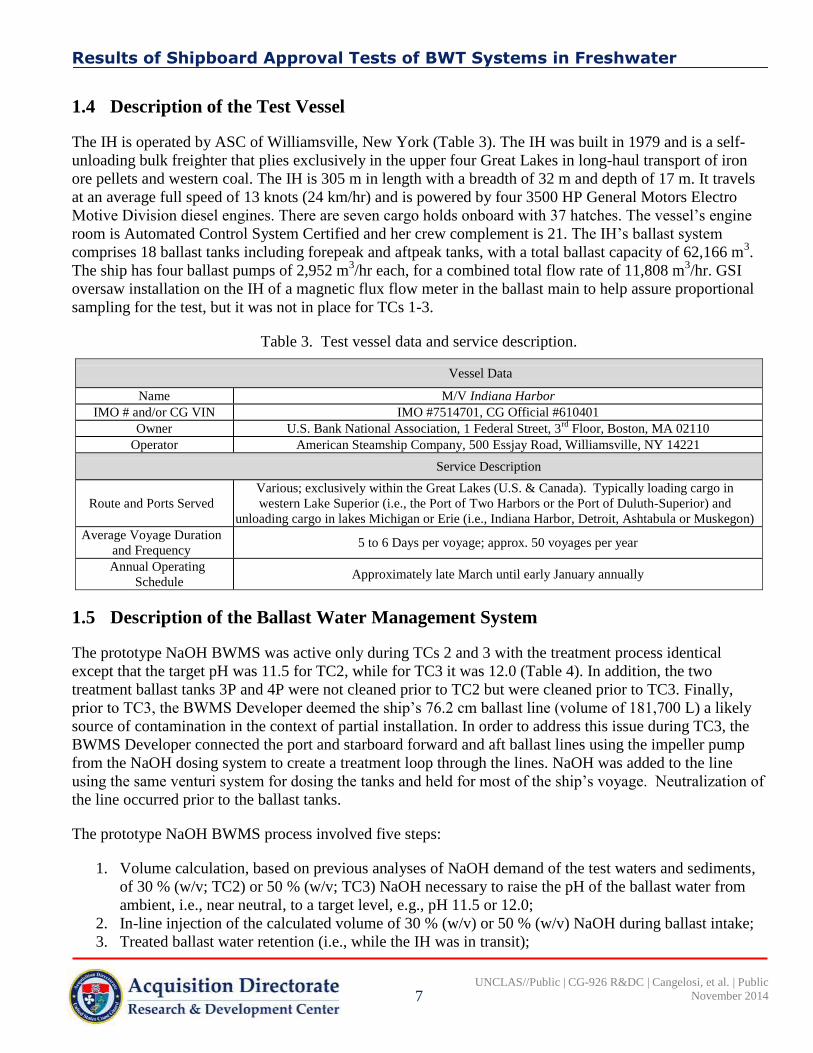
during implementation of Project 41012. ...........................................................................................4 Table 3. Test vessel data and service description. ............................................................................................7
Table 4. Technical specifications of the prototype sodium hydroxide ballast water management system
during Test Cycles 2 and 3..................................................................................................................8 Table 5. Calendar of testing, evaluation, and reporting for Test Cycles 1-4 of Project 41012. .....................10 Table 6. Class, type and number of samples collected during Test Cycle 1-4 ballast intake operations. ......19 Table 7. Class, type and number of samples collected during Test Cycle 1-4 ballast discharge
operations. .........................................................................................................................................20 Table 8. Sample handling and storage requirements of samples collected during Test Cycle 1-4.................22
Table 9. 2012 and 2013 GSI method detection limits and limit of quantifications for total suspended
solids, non-purgeable organic carbon, dissolved organic carbon and particulate organic matter. ...24
Table 10. Summary of p3SFS operating conditions during Project 41012 intake sampling events. For
Test Cycle 1, output includes hand recorded and auto-logged electronic data. The auto-
logged data is provided in parenthesis. For all TCs, values marked with an asterisk (*) are
outside the valid range for that parameter. .....................................................................................29 Table 11. Summary of p3SFS operating conditions during Project 41012 discharge sampling events.
Values marked with an asterisk (*) are outside the valid range for that parameter. ......................33 Table 12. Water chemistry parameters (Average ± Standard Deviation) measured from discrete grab
samples collected during Test Cycles 1–4 Intake Operations. Values marked with an asterisk
(*) are outside the valid range for that parameter. .........................................................................41
Table 13. Water chemistry parameters (Average ± Standard Deviation) measured from discrete grab
samples collected during Test Cycles 1–4 discharge operations. MDL = Method Detection
Limit. ..............................................................................................................................................42
Table 14. Water quality parameters (Average ± Standard Deviation) measured by YSI Multiparameter
Sondes and the p3SFS in-line sensors during Test Cycles 1–4 intake operations. ........................52
Table 15. Water quality parameters (Average ± Standard Deviation) measured by YSI Multiparameter
Sondes and the p3SFS in-line sensors during Test Cycles 1–4 discharge operations. ..................52 Table 16. Density of organisms (Average ± Standard Error) in intake samples (Test Cycles 1–4).
Values marked with an asterisk (*) are outside the valid range for that parameter. ......................67 Table 17. Density of organisms (Average ± Standard Error) in discharge samples (Test Cycles 1–4). ........69 Table 18. Biological concentrations in treated discharge by size class from Test Cycles 2 and 3
compared to maximum treated discharge concentrations specified in the U.S. Coast Guard’s
Standards for Living Organisms in Ships’ Ballast Water Discharged in U.S. Waters (USCG,
2012). MDL = Method Detection Limit. .......................................................................................72 Table 19. Concentrations of disinfection byproducts measured in Test Cycle 2 and 3 treated and
untreated discharge samples. MDL = Method Detection Limit. ..................................................73 Table 20. Percent survival (Average ± Standard Error; n = 10) and total number of offspring per female
(Average ± Standard Error; n = 10) in a three-brood Ceriodaphnia dubia whole effluent toxicity
test after 5 days exposure to treated and untreated ballast discharge collected during Test Cycles
2 and 3. ...........................................................................................................................................74

Results of Shipboard Approval Tests of BWT Systems in Freshwater
xii
UNCLAS//Public | CG-926 R&DC | Cangelosi, et al. | Public
November 2014
LIST OF TABLES (Continued)
Table 21. Average (Minimum, Maximum) water chemistry parameters measured in exposure solutions
during the Ceriodaphnia dubia whole effluent toxicity tests for Test Cycles 2 and 3. .................75 Table 22. Percent survival (Average ± Standard Error; n = 4) and weight (Average ± Standard Error; n
= 4) in a Pimephales promelas whole effluent toxicity test after 7 days exposure to treated
and untreated ballast discharge collected during Test Cycles 2 and 3. ..........................................76
Table 23. Average (Minimum, Maximum) water chemistry parameters measured in exposure solutions
during the Pimephales promelas whole effluent toxicity tests for Test Cycles 2 and 3. ...............77 Table 24. Cell density (Average ± Standard Error; n = 4) in a Selenastrum capricornutum whole
effluent toxicity test after 96 hours exposure to treated and untreated ballast discharge
collected during Test Cycles 2 and 3. ............................................................................................78
Table 25. Average (Minimum, Maximum) water chemistry parameters measured in exposure solutions
during the Selenastrum capricornutum whole effluent toxicity tests for Test Cycles 2 and 3. .....79
Table 26. Average (Minimum, Maximum) water chemistry results from measurements of stock
solutions used during Test Cycle 2 whole effluent toxicity tests with Ceriodaphnia dubia and
Pimephales promelas. ....................................................................................................................82 Table 27. Average (Minimum, Maximum) water chemistry results from measurements of stock
solutions used during Test Cycle 3 whole effluent toxicity tests with Ceriodaphnia dubia and
Pimephales promelas. ....................................................................................................................83 Table 28. Dates of YSI 6600 V2-4 multiparameter water quality sonde calibration relevant to Test
Cycles 1-4 of the Project 41012. ...................................................................................................84 Table 29. Data quality objectives, criteria, and results from water chemistry/quality analyses during
Test Cycles 1-4. Values marked by an asterisk (*) did not meet GSI’s data quality objective. ....87
Table 30. Data quality objectives, criteria, and results from analyses of organisms ≥ 50 m during Test
Cycles 1-4. Values marked by an asterisk (*) did not meet GSI’s data quality objective. ............91
Table 31. Data quality objectives, criteria, and results from analyses of organisms ≥ 10 and < 50 m
during Test Cycles 1-4. Values marked by an asterisk (*) did not meet GSI’s data quality
objective. ........................................................................................................................................92
Table 32. Data quality objectives, criteria, and results from analyses of organisms < 10 m during Test
Cycles 1-3. Values marked by an asterisk (*) did not meet GSI’s data quality objective. ............93
Table 33. Data quality objectives, criteria, and results from whole effluent toxicity tests during Test
Cycles 2 and 3. Values marked by an asterisk (*) did not meet GSI’s data quality objective. .....96
Table 34. Summary of deviations to the Test Cycle 1 through 4 test/quality assurance plans. ......................99 Table 35. Test Cycle 1 - comparison of temperature results measured using the p3SFS data log (average
of in-line, continuous data), p3SFS data summary (average provided at end of each
operation), p3SFS AquaSensors display (average of hand-recorded measurements), and GSI
YSI Multiparameter Water Quality Sonde (from integrated sample). .........................................111 Table 36. Test Cycle 1 - comparison of turbidity results measured using the p3SFS data log (average of
in-line, continuous data), p3SFS data summary (average provided at end of each operation),
p3SFS AquaSensors display (average of hand-recorded measurements), and GSI YSI
Multiparameter Water Quality Sonde (from integrated sample). ................................................111

Results of Shipboard Approval Tests of BWT Systems in Freshwater
xiii
UNCLAS//Public | CG-926 R&DC | Cangelosi, et al. | Public
November 2014
LIST OF ACRONYMS, ABBREVIATIONS, AND SYMBOLS
%D Percent Difference
%T Percent Transmittance
µM Micrometer
AOC Area of Concern
ASC American Steamship Company
BWMS Ballast Water Management System
BWT Ballast Water Treatment
CFD Computational Fluid Dynamics
CFU Colony Forming Unit
CMFDA 5-Chloromethylfluorescein Diacetate
CO2 Carbon Dioxide
COC Chain of Custody
DI Deionized
DO Dissolved Oxygen
DOC Dissolved Organic Carbon
DOM Dissolved Organic Matter
DQO Data Quality Objective
DSP Draft Shipboard Protocol
DST Defined Substrate Technology
ETV Environmental Technology Verification
FDA Fluorescein Diacetate
FH Filter Housing
Ft. Feet
GSI Great Ships Initiative
HCl Hydrochloric Acid
HDPE High Density Polyethylene
HMI Human Machine Interface
HPC Heterotrophic Plate Counts
HPCA Heterotrophic Plate Count Agar
ID Internal Diameter
IH M/V Indiana Harbor
IMO International Maritime Organization
IRNP Isle Royale National Park
ITR Interim Technical Report
LAN Local Area Network
LOQ Limit of Quantification
LSRI Lake Superior Research Institute
M/V Motor Vessel
MARAD United State Maritime Administration
MDL Method Detection Limit
MM Mineral Matter
MPN Most Probable Number
Results of Shipboard Approval Tests of BWT Systems in Freshwater
xiv
UNCLAS//Public | CG-926 R&DC | Cangelosi, et al. | Public
November 2014
LIST OF ACRONYMS, ABBREVIATIONS, AND SYMBOLS (Continued)
NaOH Sodium Hydroxide
ND University of Notre Dame
NEMWI Northeast Midwest Institute
NPOC Non-Purgeable Organic Carbon
NRL Naval Research Laboratory
NRRI Natural Resources Research Institute
p3SFS Prototype 3 Shipboard Filter Skid
PI Principal Investigator
PLC Programmable Logic Controller
POC Particulate Organic Carbon
POM Particulate Organic Matter
PP Polypropylene
PPE Personal Protective Equipment
PSC Percent Similarity
QA Quality Assurance
QA/QC Quality Assurance/Quality Control
QAPP Quality Assurance Project Plan
QC Quality Control
RDC Research and Development Center
RDTE Research, Development, Testing, and Evaluation
RPD Relative Percent Difference
SD Secure Digital
SOP Standard Operating Procedure
SOW Scope of Work
SBW Sterile Ballast Water
TC Test Cycle
TO Testing Organization
TOC Total Organic Carbon
TQAP Test/Quality Assurance Plan
TR Technical Report
TSS Total Suspended Solids
TVE Tank Volume Equivalent
UMD University of Minnesota-Duluth
US GPM United States Gallons per Minute
USCG RDC United States Coast Guard Research and Development Center
USCG United States Coast Guard
USEPA United States Environmental Protection Agency
UV Ultraviolet
UWS University of Wisconsin-Superior
VO Verification Organization
WET Whole Effluent Toxicity
YSI Yellow Springs Instruments

Results of Shipboard Approval Tests of BWT Systems in Freshwater
1
UNCLAS//Public | CG-926 R&DC | Cangelosi, et al. | Public
November 2014
1 INTRODUCTION AND BACKGROUND
1.1 Overview and Objectives
This United States Coast Guard Research and Development Center (USCG RDC) Technical Report (TR)
presents methods, results, conclusions and recommendations relative to Test Cycles (TCs) 1 through 4 of
the USCG RDC Project No. 41012 titled Shipboard Approval Tests of Ballast Water Treatment Systems in
Freshwaters, hereafter referred to as Project 41012. The two primary objectives of Project 41012 were to:
I. Implement and identify areas of improvement to the United States Environmental Protection Agency
(USEPA) Environmental Technology Verification (ETV) Program’s Draft Generic Protocol for the
Verification of Ballast Water Treatment Technology in Shipboard Installations, version 5.2,
hereafter referred to as ETV DSP (USEPA, 2012), to improve its effectiveness for verification of the
biological treatment efficacy and environmental acceptability of a ballast water management system
(BWMS) on an operating cargo ship; and
II. Implement in fresh water a skid-mounted sampling system, known as the prototype 3 Shipboard
Filter Skid (p3SFS), developed by the Naval Research Laboratory (NRL) in Key West, Florida,
which the ETV DSP incorporates as an optional sampling approach, and identify areas of possible
improvement.
A secondary objective of Project 41012 was to evaluate, on a limited basis, the biological treatment efficacy
and environmental soundness of a prototype BWMS being developed by the United States Geological
Survey (USGS) and others that utilizes sodium hydroxide (NaOH) treatment to a high pH followed by
carbon dioxide (CO2) neutralization to pH 6.0 to 8.8.
The four TCs of Project 41012 took place onboard the Great Lakes self-unloading bulk freighter Motor
Vessel (M/V) Indiana Harbor (IH). The IH, operated by the American Steamship Company (ASC), is a 305
meter bulk freighter that travels exclusively in the upper four Great Lakes. The vessel has 18 ballast tanks,
including forepeak and aftpeak tanks, and a total ballast capacity of 62,166 m3. The NaOH BWMS
functioned as a partial and temporary installation onboard the IH during TCs 2 and 3 only.
In keeping with the ETV DSP, the four TCs took place following separate Test/Quality Assurance Plans
(TQAPs; GSI, 2012a; GSI, 2012b; GSI, 2013a; GSI, 2013b). Intake sampling occurred during IH ballasting
operations either at a port located in southern or central Lake Michigan (TCs 1-3) or a port located in
southeastern Lake Erie (TC4 only). Discharge sampling occurred during IH deballasting operations at ports
located in western Lake Superior.
During TCs 1-3, ballast intake and discharge samples were collected from up to three experimental ballast
tanks located on the port side of the IH (Table 1). During TC2 and TC3, the NaOH BWMS was active. Two
ballast tanks were treated and one tank was untreated. The untreated tank was referred to as a “mock
treatment” tank, as the ETV DSP requires whole-ship treatment and the untreated tank needed to be handled
as though it were treated for purposes of validating the ETV DSP (Table 1). During TC4, which occurred
during an atypical IH ballast operation, i.e., the vessel did not ballast on a tank by tank basis; up to three
ballast tank volume-equivalent (TVE) samples were collected during both intake and discharge operations
irrespective of any association with specific ballast tanks (Table 1).
Results of Shipboard Approval Tests of BWT Systems in Freshwater
2
UNCLAS//Public | CG-926 R&DC | Cangelosi, et al. | Public
November 2014
Table 1. Project 41012 Sampling Arrangement: Experimental ballast tanks.
Test Cycle (TC) Ballast Tank Sampling Arrangement
Intake Discharge 1 5P, 2P, 3P 2P, 3P, 5P
2 5P, 2P 3P (treated), 4P (treated),
5P (mock treatment)
3 5P, 2P 3P (treated), 4P (treated),
5P (mock treatment)
4 Three ballast “tank volume-
equivalent” (TVE) samples
Two ballast “tank volume-
equivalent” (TVE) samples
1.2 Roles and Responsibilities of Organizations
Project 41012 involved several organizations with responsibilities divided among them. These organizations
include the Testing Organization (TO), BWMS Developer, ship operator, Verification Organization (VO),
federal partners and external collaborators. The fundamental roles and responsibilities of these organizations
were consistent throughout all four TCs of Project 41012, with the exception of external collaborators who
were involved only during TC3.
1.2.1 Testing Organization
The TO, GSI, was responsible for preparing the TC-specific TQAPs (GSI, 2012a; GSI, 2012b; GSI, 2013a;
GSI, 2013b), which also included GSI’s Shipboard Quality Assurance Project Plan (QAPP; GSI, 2013c) as
an appendix, and for working with the VO (USCG RDC) to assure approval of the TQAPs. GSI was
responsible for conducting the testing; for managing, evaluating and reporting on all data generated during
the testing; and for preparing, circulating for comment to the VO and BWMS Developer and producing and
finalizing the Interim Technical Reports (ITRs; GSI, 2012c; GSI, 2013d; GSI, 2013e; GSI, 2013f) and this
TR. GSI also was responsible for coordinating with ASC’s shore-side and shipboard engineering staff to
facilitate and oversee TQAP implementation coordination with shipboard operations. Finally, GSI was
responsible for maintaining the security and safety of GSI personnel during test activities.
1.2.2 Ballast Water Management System Developer
The BWMS Developer, consisting of researchers from the USGS Leetown Science Center and the Isle
Royale National Park (IRNP), in collaboration with the ship operator (ASC), was responsible for installation
and commissioning of the prototype NaOH BWMS onboard the IH and training of the vessel’s crew on
operation of the system. The BWMS Developer was also responsible for confirming that the BWMS was
operating correctly prior to biological treatment efficacy testing and assuring that treated ballast water was
fully neutralized and safe for discharge to the receiving system prior to deballasting. The BWMS Developer
was also responsible for providing the TO, ship operator and VO with all necessary information, including
operation and maintenance manuals, and for making decisions on behalf of the BWMS Developer during
implementation of the TC2 and TC3 TQAPs (GSI, 2012b; GSI, 2013a). In addition, the BWMS Developer
was responsible for making a representative available for logistical and technical support, as required. The
BWMS Developer also reviewed the TC2 and TC3 ITRs (GSI, 2013d; GSI, 2013e), with the understanding
that these documents did not constitute an ETV evaluation or regulatory approval.

Results of Shipboard Approval Tests of BWT Systems in Freshwater
3
UNCLAS//Public | CG-926 R&DC | Cangelosi, et al. | Public
November 2014
1.2.3 Ship Operator
The ship operator, ASC, was responsible for working with the GSI Test Manager to schedule and organize
logistics associated with the testing. ASC was also responsible for notifying GSI of any logistical or
operational developments that could affect the Project 41012 testing process and/or results and for ensuring
proper installation and operation of the BWMS onboard the IH, including preparation of sample ports and
neutralization of the treated discharge prior to deballasting (relevant to TCs 2 and 3 only). ASC was also
responsible for ensuring that IH ballast operations (i.e., location, holding time, sampling, etc.) were
consistent with those criteria detailed in the TC-specific TQAPs (GSI, 2012a; GSI, 2012b; GSI, 2013a; GSI,
2013b).
1.2.4 Verification Organization
The VO, USCG RDC, was responsible for reviewing and approving the TC-specific TQAPs (GSI, 2012a;
GSI, 2012b; GSI, 2013a; GSI, 2013b), and ITRs (GSI, 2012c; GSI, 2013d; GSI, 2013e; GSI, 2013f), and
this TR. The VO also received and reviewed periodic progress reports and other relevant Project 41012
documents. In addition, the VO was responsible for collaborating with GSI and the United States Maritime
Organization (MARAD) to administer testing activities on board the IH; USEPA ETV personnel to provide
Project 41012 updates; and participating in conferences/discussions of TC implementation, results, and
suggested changes.
1.2.5 Federal Partners
The MARAD Project Officer and USCG RDC Project Manager were responsible for obtaining federal
partner reviews of the TC-specific TQAPs (GSI, 2012a; GSI, 2012b; GSI, 2013a; GSI, 2013b), TC-specific
ITRs (GSI, 2012c; GSI, 2013d; GSI, 2013e; GSI, 2013f) and this TR.
1.2.6 External Collaborators
During TC3, personnel from the University of Notre Dame (ND), and Yellow Springs Instruments (YSI)
obtained subsamples from the TO for independent research on automated and/or expedited detection and
enumeration methodologies.
1.3 Purpose and Features of the Environmental Technology Verification Program’s
Draft Shipboard Protocol
The USCG RDC tasked GSI with implementing the ETV DSP (USEPA, 2012) and identifying areas of
improvement through a series of four TCs undertaken on board a commercial cargo ship operating solely in
the Great Lakes. The ETV DSP, under development by the USEPA ETV Program and several federal and
non-governmental partners, provides guidance to TOs on the necessary elements of shipboard BWMS
verification tests. These include technology acceptability criteria, BWMS specifications and information,
TQAP content requirements, experimental design requirements, sampling and analysis procedures, quality
assurance/quality control (QA/QC) and data management and reporting (USEPA, 2012). Most importantly,
the ETV DSP guides TOs in evaluating the performance characteristics of commercial-ready BWMS
technologies with regard to three verification factors: Biological Treatment Efficacy, Environmental
Acceptability and Operational Performance. Project 41012’s scope encompassed evaluation of the ETV
DSP relative to biological treatment efficacy and environmental acceptability only. In order to achieve this
evaluation using the ship and BWMS of opportunity, several deviations to the ETV DSP were deemed
necessary and acceptable by the TO and VO. These deviations are summarized in Table 2.
Results of Shipboard Approval Tests of BWT Systems in Freshwater
4
UNCLAS//Public | CG-926 R&DC | Cangelosi, et al. | Public
November 2014
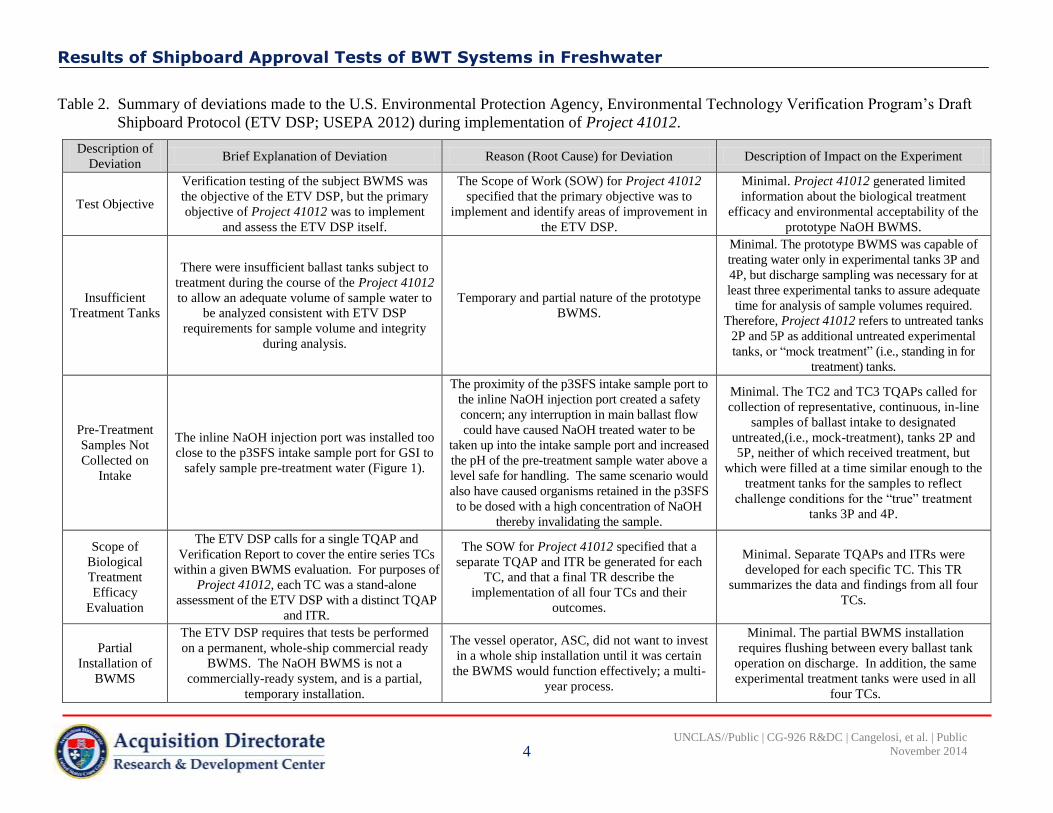
Table 2. Summary of deviations made to the U.S. Environmental Protection Agency, Environmental Technology Verification Program’s Draft
Shipboard Protocol (ETV DSP; USEPA 2012) during implementation of Project 41012.
Description of
Deviation Brief Explanation of Deviation Reason (Root Cause) for Deviation Description of Impact on the Experiment
Test Objective
Verification testing of the subject BWMS was
the objective of the ETV DSP, but the primary
objective of Project 41012 was to implement
and assess the ETV DSP itself.
The Scope of Work (SOW) for Project 41012
specified that the primary objective was to
implement and identify areas of improvement in
the ETV DSP.
Minimal. Project 41012 generated limited
information about the biological treatment
efficacy and environmental acceptability of the
prototype NaOH BWMS.
Insufficient
Treatment Tanks
There were insufficient ballast tanks subject to
treatment during the course of the Project 41012
to allow an adequate volume of sample water to
be analyzed consistent with ETV DSP
requirements for sample volume and integrity
during analysis.
Temporary and partial nature of the prototype
BWMS.
Minimal. The prototype BWMS was capable of
treating water only in experimental tanks 3P and
4P, but discharge sampling was necessary for at
least three experimental tanks to assure adequate
time for analysis of sample volumes required.
Therefore, Project 41012 refers to untreated tanks
2P and 5P as additional untreated experimental
tanks, or “mock treatment” (i.e., standing in for
treatment) tanks.
Pre-Treatment
Samples Not
Collected on
Intake
The inline NaOH injection port was installed too
close to the p3SFS intake sample port for GSI to
safely sample pre-treatment water (Figure 1).
The proximity of the p3SFS intake sample port to
the inline NaOH injection port created a safety
concern; any interruption in main ballast flow
could have caused NaOH treated water to be
taken up into the intake sample port and increased
the pH of the pre-treatment sample water above a
level safe for handling. The same scenario would
also have caused organisms retained in the p3SFS
to be dosed with a high concentration of NaOH
thereby invalidating the sample.
Minimal. The TC2 and TC3 TQAPs called for
collection of representative, continuous, in-line
samples of ballast intake to designated
untreated,(i.e., mock-treatment), tanks 2P and
5P, neither of which received treatment, but
which were filled at a time similar enough to the
treatment tanks for the samples to reflect
challenge conditions for the “true” treatment
tanks 3P and 4P.
Scope of
Biological
Treatment
Efficacy
Evaluation
The ETV DSP calls for a single TQAP and
Verification Report to cover the entire series TCs
within a given BWMS evaluation. For purposes of
Project 41012, each TC was a stand-alone
assessment of the ETV DSP with a distinct TQAP
and ITR.
The SOW for Project 41012 specified that a
separate TQAP and ITR be generated for each
TC, and that a final TR describe the
implementation of all four TCs and their
outcomes.
Minimal. Separate TQAPs and ITRs were
developed for each specific TC. This TR
summarizes the data and findings from all four
TCs.
Partial
Installation of
BWMS
The ETV DSP requires that tests be performed
on a permanent, whole-ship commercial ready
BWMS. The NaOH BWMS is not a
commercially-ready system, and is a partial,
temporary installation.
The vessel operator, ASC, did not want to invest
in a whole ship installation until it was certain
the BWMS would function effectively; a multi-
year process.
Minimal. The partial BWMS installation
requires flushing between every ballast tank
operation on discharge. In addition, the same
experimental treatment tanks were used in all
four TCs.

Results of Shipboard Approval Tests of BWT Systems in Freshwater
5
UNCLAS//Public | CG-926 R&DC | Cangelosi, et al. | Public
November 2014
Table 2. Summary of deviations made to the U.S. Environmental Protection Agency, Environmental Technology Verification Program’s Draft
Shipboard Protocol (ETV DSP; USEPA 2012) during implementation of Project 41012 (Continued).
Description of
Deviation Brief Explanation of Deviation Reason (Root Cause) for Deviation Description of Impact on the Experiment
Operation of the
BWMS
The ETV DSP requires that the vessel’s crew
operate the BWMS, and requires it to be
operated continuously during a ≥ 1 year testing
period. During Project 41012, the NaOH
BWMS was operated by the BWMS Developer
and the system was operated only during TCs 2
and 3 of the four TCs.
The NaOH BWMS is not commercially-ready
and could not be operated by the ship’s crew.
Minimal. Analyses of operational, safety,
reliability, and cost of BWMS operation were
not conducted because it was not in the purview
of Project 41012.
Technical
Report (TR)
Deliverable
The ETV DSP requires a Verification Report of
the test results from five TCs conducted over ≥
1 year period. During Project 41012, an ITR
detailing the results and findings from each TC
was drafted, with this TR developed to
summarize Project 41012 results across all four
TCs.
Project 41012 deliverables required each TC to
have its own TQAP and ITR.
Minimal. Four separate TQAPs and ITRs were
developed for each of the four TCs. This TR
summarizes the data from all four TCs and is
consistent with the format provided to GSI by
the VO.
Continuous, In
Situ Water
Quality Data
Collected for
Temperature and
Turbidity Only
The ETV DSP specifies that in situ, continuous
measurements be made for the following core
water quality parameters: temperature, pH and
chlorophyll a plus the auxiliary parameter
turbidity. During Project 41012, only
temperature and turbidity were measured
continuously in situ.
The NRL p3SFS has been developed to measure
temperature and turbidity only using the in situ,
continuous approach.
Minimal. Discrete measurement data were
available for pH and total chlorophyll (rather
than chlorophyll a).
Lack of In Situ
Flow
Monitoring
The ETV DSP specifies that in situ, continuous
measurements be made for ballast system flow
rate. During TCs 1-4, ballast system flow rate
was not measured.
For TCs 1-4, the magnetic flux flow meter was
not installed, or correctly wired to the pSFS3.
Minimal. In lieu of in situ, continuous flow
monitoring, GSI recorded tank heights every
five to ten minutes to approximate flow rates in
the ballast main.
Integrated
Samples
Collected for
Water Quality
rather than Grab
Samples
The ETV DSP specifies that the following water
quality samples be collected in triplicate as
discrete grab samples: total suspended solids
(TSS), particulate organic matter (POM) and
dissolved organic matter (DOM).
The p3SFS does not permit the collection of
grab samples. These samples were collected
from the time-integrated drip sample.
Minimal. Samples for TSS, POM and DOM
were still collected and analyzed.

Results of Shipboard Approval Tests of BWT Systems in Freshwater
6
UNCLAS//Public | CG-926 R&DC | Cangelosi, et al. | Public
November 2014
Table 2. Summary of deviations made to the U.S. Environmental Protection Agency, Environmental Technology Verification Program’s Draft
Shipboard Protocol (ETV DSP; USEPA 2012) during implementation of Project 41012 (Continued).
Description of
Deviation Brief Explanation of Deviation Reason (Root Cause) for Deviation Description of Impact on the Experiment
Use of Single
Vital Stain and
Extended
Length of
Analysis Time
The ETV DSP specifies that a combination of
two vital stains, Fluorescein Diacetate (FDA)
and 5-Chloromethylfluorescein Diacetate, be
used for analysis of organisms in the ≥ 10 and <
50 µm size class and that samples be examined
for a maximum of 20 min. For Project 41012,
this size class was stained using FDA only.
The GSI standard operating procedure (SOP) for
this size class specifies the use of FDA only and
samples are examined for up to 90 minutes.
Minimal. GSI, per ETV DSP requirements, split
the treatment discharge samples in half and heat
killed one half to determine the false positive
error rate.
Figure 1. Location of the ballast water management system’s sodium hydroxide inline injection point relative to the GSI intake sample port.
Results of Shipboard Approval Tests of BWT Systems in Freshwater
7
UNCLAS//Public | CG-926 R&DC | Cangelosi, et al. | Public
November 2014
1.4 Description of the Test Vessel
The IH is operated by ASC of Williamsville, New York (Table 3). The IH was built in 1979 and is a self-
unloading bulk freighter that plies exclusively in the upper four Great Lakes in long-haul transport of iron
ore pellets and western coal. The IH is 305 m in length with a breadth of 32 m and depth of 17 m. It travels
at an average full speed of 13 knots (24 km/hr) and is powered by four 3500 HP General Motors Electro
Motive Division diesel engines. There are seven cargo holds onboard with 37 hatches. The vessel’s engine
room is Automated Control System Certified and her crew complement is 21. The IH’s ballast system
comprises 18 ballast tanks including forepeak and aftpeak tanks, with a total ballast capacity of 62,166 m3.
The ship has four ballast pumps of 2,952 m3/hr each, for a combined total flow rate of 11,808 m
3/hr. GSI
oversaw installation on the IH of a magnetic flux flow meter in the ballast main to help assure proportional
sampling for the test, but it was not in place for TCs 1-3.
Table 3. Test vessel data and service description.
Vessel Data
Name M/V Indiana Harbor
IMO # and/or CG VIN IMO #7514701, CG Official #610401
Owner U.S. Bank National Association, 1 Federal Street, 3rd
Floor, Boston, MA 02110
Operator American Steamship Company, 500 Essjay Road, Williamsville, NY 14221
Service Description
Route and Ports Served
Various; exclusively within the Great Lakes (U.S. & Canada). Typically loading cargo in
western Lake Superior (i.e., the Port of Two Harbors or the Port of Duluth-Superior) and
unloading cargo in lakes Michigan or Erie (i.e., Indiana Harbor, Detroit, Ashtabula or Muskegon)
Average Voyage Duration
and Frequency 5 to 6 Days per voyage; approx. 50 voyages per year
Annual Operating
Schedule Approximately late March until early January annually
1.5 Description of the Ballast Water Management System
The prototype NaOH BWMS was active only during TCs 2 and 3 with the treatment process identical
except that the target pH was 11.5 for TC2, while for TC3 it was 12.0 (Table 4). In addition, the two
treatment ballast tanks 3P and 4P were not cleaned prior to TC2 but were cleaned prior to TC3. Finally,
prior to TC3, the BWMS Developer deemed the ship’s 76.2 cm ballast line (volume of 181,700 L) a likely
source of contamination in the context of partial installation. In order to address this issue during TC3, the
BWMS Developer connected the port and starboard forward and aft ballast lines using the impeller pump
from the NaOH dosing system to create a treatment loop through the lines. NaOH was added to the line
using the same venturi system for dosing the tanks and held for most of the ship’s voyage. Neutralization of
the line occurred prior to the ballast tanks.
The prototype NaOH BWMS process involved five steps:
1. Volume calculation, based on previous analyses of NaOH demand of the test waters and sediments,
of 30 % (w/v; TC2) or 50 % (w/v; TC3) NaOH necessary to raise the pH of the ballast water from
ambient, i.e., near neutral, to a target level, e.g., pH 11.5 or 12.0;
2. In-line injection of the calculated volume of 30 % (w/v) or 50 % (w/v) NaOH during ballast intake;
3. Treated ballast water retention (i.e., while the IH was in transit);

Results of Shipboard Approval Tests of BWT Systems in Freshwater
8
UNCLAS//Public | CG-926 R&DC | Cangelosi, et al. | Public
November 2014
4. Neutralization of the treated ballast water with CO2 injected into treated tanks; and
5. Verification of complete neutralization, i.e., pH 6 to 8.8, prior to ballast discharge.
The partial and temporary BWMS installation tested as part of Project 41012 comprised an in-line dosing
system to inject 30 % (w/v) NaOH during TC2 and 50 % (w/v) NaOH during TC3 into ballast water
destined for tanks 3P and 4P, and an in-tank dispersal system to distribute shore-positioned CO2 gas through
the treated ballast water prior to discharge. Over time, the BWMS design will integrate the CO2 source as
part of the onboard system, possibly employing stack emissions.
The 30 % (w/v) or 50 % (w/v) NaOH was stored on the IH’s deck in temporary temperature-controlled
holding tanks. A series of valves, flow meters, pressure gauges and a programmable logic controller (PLC)
regulated the flow of NaOH into a venturi to assure that the ballast was dosed with a target mass of NaOH.
A high pressure water line introduced the treated water into the main ballast line header in the engine room
and then into the two designated treatment ballast tanks. NaOH loading occurred during approximately 30
minutes followed by a rinse of the remaining water entering the two ballast tanks. Both tanks branch off of
the ballast main header with similar downward-facing bell mouths on the interior bottom tank surface.
When the target volume was reached, the data logger closed the three-way valve to flush the venturi injector
with water. Multiple conductivity/pH meters downstream of the mixing point confirmed reagent flow. A
data logger recorded a running total of 30 % (w/v) or 50 % (w/v) NaOH injected (data not available to GSI).
Ballast tank 3P was equipped with fifteen discrete water quality sampling points inside the tank and tank 4P
was equipped with eight. The sample tubing used in these ballast tanks was 1.9 cm clear PVC. Each
sampling tube ran from its selected position to isolation valves with steel pipe nipples that extended through
a single steel plate bolted to the bulkhead between the tank and the conveyor tunnel. During testing
operations, ballast water gravity flowed through each in-tank sampling tube, on demand, to a single
sampling valve mounted outside each tank in the conveyor tunnel. The BWMS Developer monitored and
documented, from the IH control room, pH and conductivity data from two conductivity and one pH wet tap
probes (Signet type) located in each treated tank and the ballast line (data not available to GSI).
Table 4. Technical specifications of the prototype sodium hydroxide ballast water management system
during Test Cycles 2 and 3.
Test
Cycle
BWMS
Treatment
Retention
Time Neutralization Time
Post-
Neutralization
Process for Confirmation of
Successful Neutralization
2
Target: 11.5;
Actual: Data
not provided
to GSI
2 days,
12 hours
Tank 3P:
3+ hours;
Tank 4P:
3 hours
Target: 6.0 – 8.0;
Actual: Data not
provided to GSI
The BWMS Developer’s representative
confirmed successful neutralization prior to
ballast discharge on 21 October 2012 by
completing and signing GSI FORM: Ballast
Water Management System Neutralization
Verification.
3 Target: 12.0;
Actual: 11.7
3 days,
10 hours
Tank 3P took longer to
neutralize than Tank 4P.
Neutralization times not
provided to GSI.
Target: 6.0 – 8.0;
Actual: Data not
provided to GSI
The BWMS Developer’s representative
confirmed successful neutralization prior to
ballast discharge on 16 August 2013 by
completing and signing GSI FORM: Ballast
Water Management System Neutralization
Verification.

Results of Shipboard Approval Tests of BWT Systems in Freshwater
9
UNCLAS//Public | CG-926 R&DC | Cangelosi, et al. | Public
November 2014
2 EXPERIMENTAL DESIGN
2.1 Overview and Calendar
The experimental objective of Project 41012 was to implement the ETV DSP, including the p3SFS
sampling approach, in the context of four TCs conducted onboard the IH to generate recommendations for
improvement, and/or implementation guidelines. For each TC, the TO developed and implemented
individual TQAPs (GSI, 2012a; GSI, 2012b; GSI, 2013a; GSI, 2013b) and submitted ITRs to the VO (GSI,
2012c; GSI, 2013d; GSI, 2013e; GSI, 2013f) with recommendations for ETV DSP improvement. Table 5
summarizes the overall sequence of Project 41012 testing, evaluation and reporting activities.
Intake sampling always occurred during normal IH ballasting operations either at a port located in Lake
Michigan (TCs 1–3; Table 5) or a port in southeastern Lake Erie (TC4; Table 5). All discharge sampling
occurred during normal IH deballasting operations in western Lake Superior (Table 5). During TCs 1
through 3, ballast intake and discharge samples were collected from up to three experimental ballast tanks
located on the port side of the IH (Table 5). During TC4, owing to an atypical IH ballast operation that the
vessel did not ballast on a tank by tank basis, up to three ballast (TVE) samples were collected during both
intake and discharge operations irrespective of any association with specific ballast tanks (Table 5). In lieu
of in situ, continuous ballast flow monitoring, GSI personnel recorded the rate of change in tank heights
(based on tank height observations every five to ten minutes) and associated the information with tank
volume to approximate flow rates in the ballast main. This information was then contrasted with recorded
sample flow rates to determine proportionality with recorded p3SFS sample flow rates.

Results of Shipboard Approval Tests of BWT Systems in Freshwater
10
UNCLAS//Public | CG-926 R&DC | Cangelosi, et al. | Public
November 2014
Table 5. Calendar of testing, evaluation, and reporting for Test Cycles 1-4 of Project 41012.
Test Cycle Date Project Activity
1
May 24, 2012 - July 23, 2012 Test/Quality Assurance Plan (TQAP) development, review and finalization
July 25, 2012
M/V Indiana Harbor ballast intake sampling at the Port of Indiana Harbor, Hammond, Indiana, in southern Lake Michigan:
TEST CODE: 12-ETV-1F
Tank 5P intake sampling:
15:35 to 17:09
Tank 2P intake sampling:
17:58 to 19:30
Tank 3P intake sampling:
21:37 to 23:08
July 26, 2012 – July 29, 2012 M/V Indiana Harbor voyage to Port of Superior, Wisconsin
July 29, 2012
M/V Indiana Harbor ballast discharge sampling at the Port of Superior, Wisconsin, in western Lake Superior: TEST CODE: 12-
ETV-1D
Tank 5P discharge sampling:
02:54 to 04:24
Tank 3P discharge sampling:
05:59 to 07:29
Tank 2P discharge sampling:
07:54 to 09:24
July 30, 2012 – August 8,
2012 Data entry, raw data analysis and validation matrix completion
August 8, 2012 – September 7,
2012 Drafting of GSI Interim Technical Report (GSI/SB/QAQC/VR/ETV/1)
September 7, 2012 –
September 8, 2012 Verification Organization review and finalization of GSI Interim Technical Report
2
September 6, 2012 –
October 13, 2012 Test/Quality Assurance Plan (TQAP) development, review and finalization
October 17, 2012 –
October 18, 2012
M/V Indiana Harbor ballast intake sampling at the Port of Gary, Indiana, in southern Lake Michigan: TEST CODE: 12-ETV-2F
Tank 5P intake sampling:
21:01 to 22:23
Tank 2P intake sampling:
22:59 to 00:06 (18 Oct. 12)
October 18, 2012 –
October 21, 2012 M/V Indiana Harbor voyage to Port of Superior, Wisconsin
October 21, 2012 Neutralization of treated ballast tanks 3P and 4P (~13:00 to ~21:30)
October 21, 2012 –
October 22, 2012
M/V Indiana Harbor ballast discharge sampling at the Port of Superior, Wisconsin, in western Lake Superior: TEST CODE: 12-
ETV-2D
Tank 3P discharge sampling:
23:12 to 00:30 (22 Oct. 12)
Tank 4P discharge sampling:
01:19 to 02:40
Tank 5P discharge sampling:
04:04 to 05:34
October 23, 2012 –
November 9, 2012 Data entry, raw data analysis and validation matrix completion
October 30, 2012 –
December 17, 2012 Drafting of GSI Interim Technical Report (GSI/SB/QAQC/VR/ETV/2)
December 18, 2012 –
February 1, 2013 Verification Organization review and finalization of GSI Interim Technical Report

Results of Shipboard Approval Tests of BWT Systems in Freshwater
11
UNCLAS//Public | CG-926 R&DC | Cangelosi, et al. | Public
November 2014
Table 5. Calendar of testing, evaluation, and reporting for Test Cycles 1-4 of Project 41012 (Continued).
Test Cycle Date Project Activity
3
April 17, 2013 –
August 2, 2013 Test/Quality Assurance Plan (TQAP) development, review and finalization
August 12, 2013
M/V Indiana Harbor ballast intake sampling at the Port of Muskegon, Michigan, in central Lake Michigan. TEST CODE: 13-
ETV-3F
Tank 5P intake sampling:
18:53 to 20:38
Tank 2P intake sampling:
21:56 to 22:45
August 13, 2013 –
August 16, 2013 M/V Indiana Harbor voyage from Port of Muskegon to Port of Duluth-Superior
August 15, 2013 Neutralization of treated ballast tanks 3P and 4P (initiated 18:45)
August 16, 2013
M/V Indiana Harbor ballast discharge sampling at the Port of Superior, Wisconsin, in western Lake Superior: TEST CODE: 13-
ETV-3D
Tank 4P discharge sampling:
04:14 to 05:22
Tank 3P discharge sampling:
06:56 to 08:25
Tank 5P discharge sampling:
09:45 to 11:15
August 17, 2013 –
October 17, 2013 Data entry, raw data analysis and validation matrix completion
October 1, 2013 –
October 31, 2013 Drafting of GSI Interim Technical Report (GSI/SB/QAQC/VR/ETV/3)
November 1, 2013 Verification Organization review and finalization of GSI Interim Technical Report
4
October 26, 2013 –
November 5, 2013 Test/Quality Assurance Plan (TQAP) development, review and finalization
November 9, 2013
M/V Indiana Harbor ballast intake sampling at the Port of Ashtabula, Ohio, in southeastern Lake Erie: TEST CODE: 13-ETV-4F
Tank Volume Equivalent #1
intake sampling:
03:07 to 04:22
Tank Volume Equivalent #2
intake sampling:
04:22 to 05:09
Tank Volume Equivalent #3
intake sampling:
06:28 to 07:43
November 9, 2013 –
November 12, 2013 M/V Indiana Harbor voyage from Port of Ashtabula to Port of Two Harbors
November 12, 2013
M/V Indiana Harbor ballast discharge sampling at the Port of Two Harbors, Minnesota, in western Lake Superior: TEST CODE:
13-ETV-4D
Tank Volume Equivalent #1
discharge sampling:
21:30 to 22:44
Tank Volume Equivalent #2
discharge sampling:
22:44 to 23:56
Tank Volume Equivalent #3 discharge sampling: Aborted due
to unexpected change in ship ballast operations
November 13, 2013 –
December 3, 2013 Data entry, raw data analysis and validation matrix completion
November 18, 2013 –
December 17, 2013 Drafting of GSI Interim Technical Report (GSI/SB/QAQC/VR/ETV/4)
December 17, 2013 Verification Organization review and finalization of GSI Interim Technical Report

Results of Shipboard Approval Tests of BWT Systems in Freshwater
12
UNCLAS//Public | CG-926 R&DC | Cangelosi, et al. | Public
November 2014
2.2 Sample Collection and Analysis Locations
Sample collection and analysis dates and locations for each TC are listed in Table 5, and shown in Figure 2.
Intake and discharge ballast sampling always occurred in the ship’s engine room. Time-sensitive sample
analysis took place in the GSI mobile laboratory (Figure 3) which was located adjacent to the vessel or at a
nearby hotel room located 10 – 15 minutes by car from the berthed vessel, depending upon the TC and
sample type. Time-sensitive discharge samples were analyzed in laboratories at the GSI Land-Based
Research, Development, Testing and Evaluation (RDTE) Facility in Superior, Wisconsin, approximately 15
minutes by car from the docked vessel. Samples having a holding time, specifically those samples for
analysis of chemistry parameters and organisms < 10 μm, collected during both ballast intake and discharge
operations were transported per proper sample handling procedures to laboratories of the Lake Superior
Research Institute (LSRI) of the University of Wisconsin-Superior in Superior, Wisconsin, for analysis.
Figure 2. Map of the Great Lakes showing Test Cycle 1 - 4 ballast intake and discharge locations.
Figure 3. The GSI mobile laboratory.

Results of Shipboard Approval Tests of BWT Systems in Freshwater
13
UNCLAS//Public | CG-926 R&DC | Cangelosi, et al. | Public
November 2014
2.3 Description of the p3SFS Sampling System
All four TCs employed the p3SFS, a skid-mounted sampling system developed by the NRL in Key West,
Florida, which the ETV DSP incorporates as an optional sampling approach. Shown in Figure 4, the p3SFS
is a closed sampling system containing a flow-through filter device within a compact steel frame that
concentrates organisms nominally ≥ 50 μm entrained in the sample water. NRL personnel installed and
commissioned the p3SFS onboard the IH during March and April 2012, with the p3SFS located in the IH’s
engine room aft of the ballast pumps and directly underneath the ballast header (Figure 5).
In addition, two sample ports were installed in the IH’s ballast main at a position where ballast flow was as
well-mixed and as fully-developed as practicable, as demonstrated by a computational fluid dynamics
(CFD) model simulation of the system. During intake sampling, water was drawn from the ballast stream
through one sample port (using an NRL-supplied flange) into the p3SFS, where the samples were collected,
then returned to the ballast stream via the second sample port. Following completion of intake sampling,
GSI personnel were responsible for switching the hoses connected to the p3SFS inlet and outlet to reverse
the sample flow direction for deballasting (see Figure 5 for more details).
The p3SFS was set to automatically maintain a user-selected sample flow rate (up to 11.4 m3/hr) throughout
the sampling period. The p3SFS has an input for flow monitoring systems associated with the ballast main
flow but did not have a prepared scenario for assuring flow-proportional sampling at the time of this project.
Sample water flowed from the intake bent-elbow style sample port (5.1 cm internal diameter, ID) to the
p3SFS through a 7.6 m long, 5.1 cm ID rubber hose. The p3SFS filtered the water with two filter housings
(FHs) A and B connected in parallel, each containing a removable filter bag constructed of seam-sealed
nylon monofilament mesh (35 μm). The effluent water then passed through a 15.2 m long, 5.1 cm ID rubber
hose to the second sample port of similar design and back into the ballast stream. Typically, the p3SFS
effluent would be returned downstream of the intake port; however, in the case of the IH installation the
return port was upstream of the intake port. The system could nonetheless return at most 11.4 m3/hr, a
minimal amount compared to the main ballast flow of approximately 2,200 m3/hr and considered not
enough to alter experimental results.
Sensors within the p3SFS were set to measure key operational parameters (i.e., sample flow, main ballast
flow signal input, temperature, turbidity, inlet and outlet pressure, differential pressure, etc.), and resulting
data were recorded by a data logger. The p3SFS provided temperature and turbidity data, measured via the
system’s in-line sensors, in two formats: continuous in-line data automatically recorded every second and
accessible electronically as a Microsoft Excel file; and a summary of the continuous in-line data displayed
on the p3SFS at the conclusion of each sampling event. The latter data was recorded by hand.
The p3SFS’s drip sampler, located immediately upstream of the FHs, captured flow-controlled whole water
samples. This integrated whole water sample was then divided and used for enumeration of organisms ≥ 10
μm and < 50 μm, organisms < 10 μm and analysis of water quality parameters, as well as disinfection
byproducts and WET testing if applicable.
GSI use of the p3SFS was consistent with p3SFS installation and operation guidelines (NRL, 2012), and
p3SFS developer e-mails to GSI personnel regarding p3SFS sample collection. Consistent with these
guidelines, GSI sampling using the p3SFS was terminated prior to collection of the entire tank
ballasting/deballasting period if:

Results of Shipboard Approval Tests of BWT Systems in Freshwater
14
UNCLAS//Public | CG-926 R&DC | Cangelosi, et al. | Public
November 2014
The p3SFS sensors around the filter bags indicated a pressure differential equal to or greater than 5
psi (0.3 bar);
The ballasting operation ceased;
6 m3 of sample was concentrated; or
More than 90 minutes elapsed.
The p3SFS unit was the same for the four TCs, except prior to TC3, the turbidity sensor on the p3SFS was
replaced and the p3SFS’s software was updated (9 August 2013). In addition, prior to TC4, NRL upgraded
the p3SFS to enable sequential use of the two filter canisters to allow continuous sample flow under high
TSS conditions. This alteration permitted a sequential pattern of sampling with canister A and B, allowing
technicians to recommission individual canisters upon clogging without interrupting sample collection or
ballasting processes.
GSI received seven filter bags with the p3SFS, and designated three for untreated samples and four for
treated samples. This separation ensured no contamination of live organisms from intake samples into
discharge samples. The p3SFS sample collection procedure also involved thoroughly rinsing of filter bags to
ensure collection of all concentrated organisms. Therefore, after concentrate collection from each FH, filter
bags were well rinsed and ready for sample collection use during the next experimental ballast tank.
Figure 4. Side view of the Prototype Three Skid Filter System (p3SFS).

Results of Shipboard Approval Tests of BWT Systems in Freshwater
15
UNCLAS//Public | CG-926 R&DC | Cangelosi, et al. | Public
November 2014
Figure 5. Three-dimensional drawing of the Prototype Three Skid Filter (p3SFS) showing placement in the
M/V Indiana Harbor’s engine room with respect to the ballast header during discharge.
Note: during intake the flow in the header travels in the opposite direction to the ballast tanks and
the SV and RV are switched for sample collection.
2.4 Sample Collection
Tables 6 and 7 list the operational data, and water quality/chemistry, biological and external collaborator
samples collected during TCs 1-4 ballast intake and discharge operations. Overall, intake sample collection
methods were similar throughout TCs 1-4, with the exception of tank ballasting and deballasting order
(Table 5).
Consistent with each TC’s TQAP (GSI, 2012a; GSI, 2012b; GSI, 2013a; GSI, 2013b), three or more GSI
team members boarded the IH once it had docked at the respective intake or discharge location (Figures 2
and 6). Supplies were immediately loaded onboard the vessel and personnel set up for sample collection in
the engine room. The GSI Engineer initiated sampling using the prompt on the p3SFS’s human machine
interface (HMI). He recorded the start time in a bound laboratory notebook that was uniquely-identified by
coding and specific to Project 41012. The GSI Test Manager also recorded the start time on a pre-printed
datasheet during TCs 1-3.
During sampling the GSI Engineer observed FHs A and B inlet and outlet pressures to monitor if the
pressure differential was increasing to a level that would require switching the nets, i.e., ≥ 5 psi. He also
monitored the drip sampler throughout sampling and adjusted the flow rate if outside the target value. As
required, the GSI Engineer isolated the p3SFS from the IH for sample collection or maintenance.
The GSI Test Manager conducted sample collection and processing. Immediately upon completion of a
sampling interval, the GSI Test Manager isolated the FHs by closing the inlet and outlet valves. He then

Results of Shipboard Approval Tests of BWT Systems in Freshwater
16
UNCLAS//Public | CG-926 R&DC | Cangelosi, et al. | Public
November 2014
drained the filtrate water from the bottom drain on each of the FHs prior to unsealing the FH lid. Next he
added the filtrate water (each filter canister held 27.4 L) to a manual pump sprayer and sprayed each filter
bag (Figure 7) from the top of the filtrate bag towards the bottom to rinse the organisms off the filter bag
(Figure 8). The samples were then concentrated to 1 L for subsequent analysis. In addition, the GSI Test
Manager reserved 2 L of filtrate water per canister for use in processing the samples.
Figure 6. GSI sample collection team waiting to board the M/V Indiana Harbor.
Figure 7. Full p3SFS filter bag after completion of a sampling event.

Results of Shipboard Approval Tests of BWT Systems in Freshwater
17
UNCLAS//Public | CG-926 R&DC | Cangelosi, et al. | Public
November 2014
Figure 8. GSI sample collection team rinsing the inside of the p3SFS filter bag.
An additional GSI staff person collected time-integrated whole water samples from the p3SFS drip sampler.
After agitating the carboys to mix the sample water, GSI personnel collected subsamples for analysis of
organisms ≥ 10 µm and < 50 µm and organisms < 10 µm. The remaining carboy contents were mixed again
and subsampled for analysis of TSS, POM, %T, NPOC and DOC.
No water chemistry samples were collected during TC4 discharge because sampling and analysis were
abbreviated during this TC. No samples were collected for analysis of organisms ≥10 µm and <50 µm
during TC4 discharge, and no samples were collected for analysis of organisms < 10 µm during TC4 intake
or discharge. During the TC 2 and 3 discharge evolutions, a subsample also was collected for analysis of
disinfection byproducts and WET. The remaining sample water was used to measure temperature, dissolved
oxygen, pH, turbidity, salinity, specific conductivity and total chlorophyll; for QA/QC purposes; and in one
case, for external collaborators.
Following sample collection, GSI personnel transferred samples off the ship to analysts in accordance with
GSI chain of custody (COC) procedures. Following completion of all intake and discharge sampling
activities, the GSI Engineer and GSI Test Manager remained on board the IH to restore the engine room to
its pre-sampling condition.
2.4.1 Determination of Proportionality of Sample Flow to Ballast Flow
GSI team members recorded the tank height of each tank being ballasted/deballasted using the ballast tank
level display in the IH Control Room (Figure 9). Tank heights were recorded on a pre-printed datasheet at
various time points throughout each sampling operation. Following each sampling event, the heights were
entered into a Microsoft Excel spreadsheet and sent to the GSI Engineer who converted tank heights to
volumes using ballast tank diagrams provided by the IH Chief Engineer. The volume of water
ballasted/deballasted from each tank or TVE was compared to the volume of water sampled by the p3SFS to
indirectly determine sample flow to ballast flow proportionality.

Results of Shipboard Approval Tests of BWT Systems in Freshwater
18
UNCLAS//Public | CG-926 R&DC | Cangelosi, et al. | Public
November 2014
Figure 9. Ballast tank levels displayed in the M/V Indiana Harbor control room.
2.5 Sample Handling and Storage
Sample handling and storage requirements, including holding conditions and specific preservatives, for
samples collected during TCs 1-4 intake and discharge operations are detailed in Table 8. The GSI Senior
QAQC Officer assigned unique sample codes to each type of sample as described in the TC-specific TQAPs
(GSI, 2012a; GSI, 2012b; GSI, 2013a; GSI, 2013b).
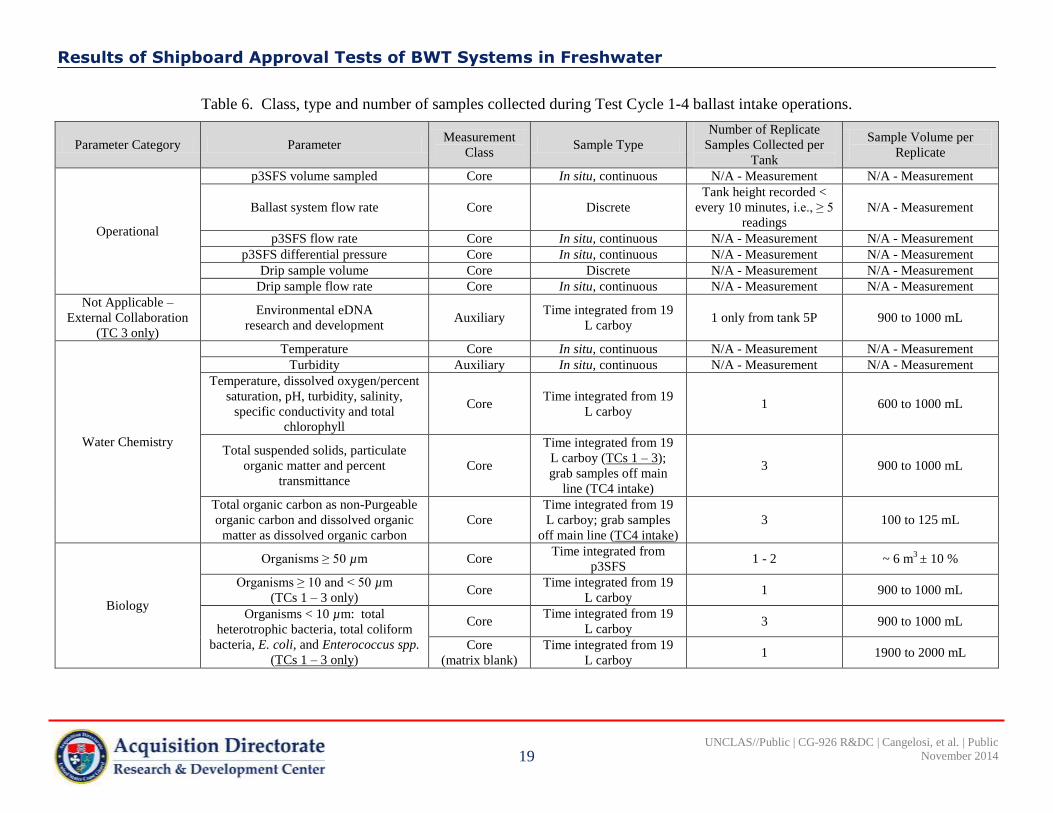
Results of Shipboard Approval Tests of BWT Systems in Freshwater
19
UNCLAS//Public | CG-926 R&DC | Cangelosi, et al. | Public
November 2014
Table 6. Class, type and number of samples collected during Test Cycle 1-4 ballast intake operations.
Parameter Category Parameter Measurement
Class Sample Type
Number of Replicate
Samples Collected per
Tank
Sample Volume per
Replicate
Operational
p3SFS volume sampled Core In situ, continuous N/A - Measurement N/A - Measurement
Ballast system flow rate Core Discrete
Tank height recorded <
every 10 minutes, i.e., ≥ 5
readings
N/A - Measurement
p3SFS flow rate Core In situ, continuous N/A - Measurement N/A - Measurement
p3SFS differential pressure Core In situ, continuous N/A - Measurement N/A - Measurement
Drip sample volume Core Discrete N/A - Measurement N/A - Measurement
Drip sample flow rate Core In situ, continuous N/A - Measurement N/A - Measurement
Not Applicable –
External Collaboration
(TC 3 only)
Environmental eDNA
research and development Auxiliary
Time integrated from 19
L carboy 1 only from tank 5P 900 to 1000 mL
Water Chemistry
Temperature Core In situ, continuous N/A - Measurement N/A - Measurement
Turbidity Auxiliary In situ, continuous N/A - Measurement N/A - Measurement
Temperature, dissolved oxygen/percent
saturation, pH, turbidity, salinity,
specific conductivity and total
chlorophyll
Core Time integrated from 19
L carboy 1 600 to 1000 mL
Total suspended solids, particulate
organic matter and percent
transmittance
Core
Time integrated from 19
L carboy (TCs 1 – 3);
grab samples off main
line (TC4 intake)
3 900 to 1000 mL
Total organic carbon as non-Purgeable
organic carbon and dissolved organic
matter as dissolved organic carbon
Core
Time integrated from 19
L carboy; grab samples
off main line (TC4 intake)
3 100 to 125 mL
Biology
Organisms ≥ 50 µm Core Time integrated from
p3SFS 1 - 2 ~ 6 m
3 ± 10 %
Organisms ≥ 10 and < 50 µm
(TCs 1 – 3 only) Core
Time integrated from 19
L carboy 1 900 to 1000 mL
Organisms < 10 µm: total
heterotrophic bacteria, total coliform
bacteria, E. coli, and Enterococcus spp.
(TCs 1 – 3 only)
Core Time integrated from 19
L carboy 3 900 to 1000 mL
Core
(matrix blank)
Time integrated from 19
L carboy 1 1900 to 2000 mL
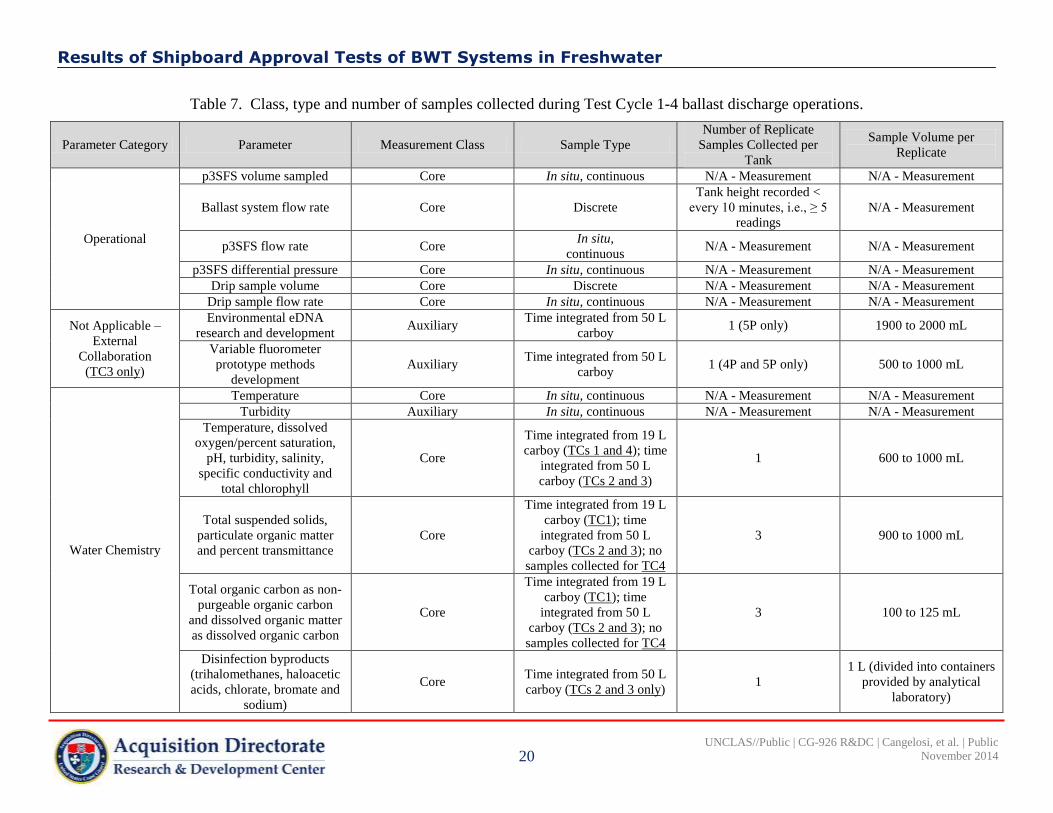
Results of Shipboard Approval Tests of BWT Systems in Freshwater
20
UNCLAS//Public | CG-926 R&DC | Cangelosi, et al. | Public
November 2014
Table 7. Class, type and number of samples collected during Test Cycle 1-4 ballast discharge operations.
Parameter Category Parameter Measurement Class Sample Type
Number of Replicate
Samples Collected per
Tank
Sample Volume per
Replicate
Operational
p3SFS volume sampled Core In situ, continuous N/A - Measurement N/A - Measurement
Ballast system flow rate Core Discrete
Tank height recorded <
every 10 minutes, i.e., ≥ 5
readings
N/A - Measurement
p3SFS flow rate Core In situ,
continuous N/A - Measurement N/A - Measurement
p3SFS differential pressure Core In situ, continuous N/A - Measurement N/A - Measurement
Drip sample volume Core Discrete N/A - Measurement N/A - Measurement
Drip sample flow rate Core In situ, continuous N/A - Measurement N/A - Measurement
Not Applicable –
External
Collaboration
(TC3 only)
Environmental eDNA
research and development Auxiliary
Time integrated from 50 L
carboy 1 (5P only) 1900 to 2000 mL
Variable fluorometer
prototype methods
development
Auxiliary Time integrated from 50 L
carboy 1 (4P and 5P only) 500 to 1000 mL
Water Chemistry
Temperature Core In situ, continuous N/A - Measurement N/A - Measurement
Turbidity Auxiliary In situ, continuous N/A - Measurement N/A - Measurement
Temperature, dissolved
oxygen/percent saturation,
pH, turbidity, salinity,
specific conductivity and
total chlorophyll
Core
Time integrated from 19 L
carboy (TCs 1 and 4); time
integrated from 50 L
carboy (TCs 2 and 3)
1 600 to 1000 mL
Total suspended solids,
particulate organic matter
and percent transmittance
Core
Time integrated from 19 L
carboy (TC1); time
integrated from 50 L
carboy (TCs 2 and 3); no
samples collected for TC4
3 900 to 1000 mL
Total organic carbon as non-
purgeable organic carbon
and dissolved organic matter
as dissolved organic carbon
Core
Time integrated from 19 L
carboy (TC1); time
integrated from 50 L
carboy (TCs 2 and 3); no
samples collected for TC4
3 100 to 125 mL
Disinfection byproducts
(trihalomethanes, haloacetic
acids, chlorate, bromate and
sodium)
Core Time integrated from 50 L
carboy (TCs 2 and 3 only) 1
1 L (divided into containers
provided by analytical
laboratory)

Results of Shipboard Approval Tests of BWT Systems in Freshwater
21
UNCLAS//Public | CG-926 R&DC | Cangelosi, et al. | Public
November 2014
Table 7. Class, type and number of samples collected during Test Cycle 1-4 ballast discharge operations (Continued).
Parameter Category Parameter Measurement Class Sample Type
Number of Replicate
Samples Collected per
Tank
Sample Volume per
Replicate
Whole Effluent
Toxicity (WET) Whole effluent toxicity Auxiliary
Time integrated from 50 L
carboy (TCs 2 and 3 only) 1
32 – 36 L for treated
discharge;
13 to 19 L for untreated
discharge
Biology
Organisms ≥ 50 µm Core Time integrated from
p3SFS 1-2 4.57 – 6.02 m
3
Organisms ≥ 10 and < 50 µm Core
Time integrated from 19 L
carboy (TC1); time
integrated from 50 L
carboy (TCs 2 and 3). No
samples collected
for TC4
1 900 to 1000 mL
Organisms < 10 µm: total
heterotrophic bacteria, total
coliform bacteria, E. coli,
and Enterococcus spp.
Core
Time integrated from 19 L
carboy (TC1); time
integrated from 50 L
carboy (TCs 2 and 3). No
samples collected
for TC4
3 900 to 1000 mL
Core (matrix blank)
Time integrated from 19 L
carboy (TC1); time
integrated from 50 L
carboy (TCs 2 and 3). No
samples collected
for TC4
1 1900 to 2000 mL
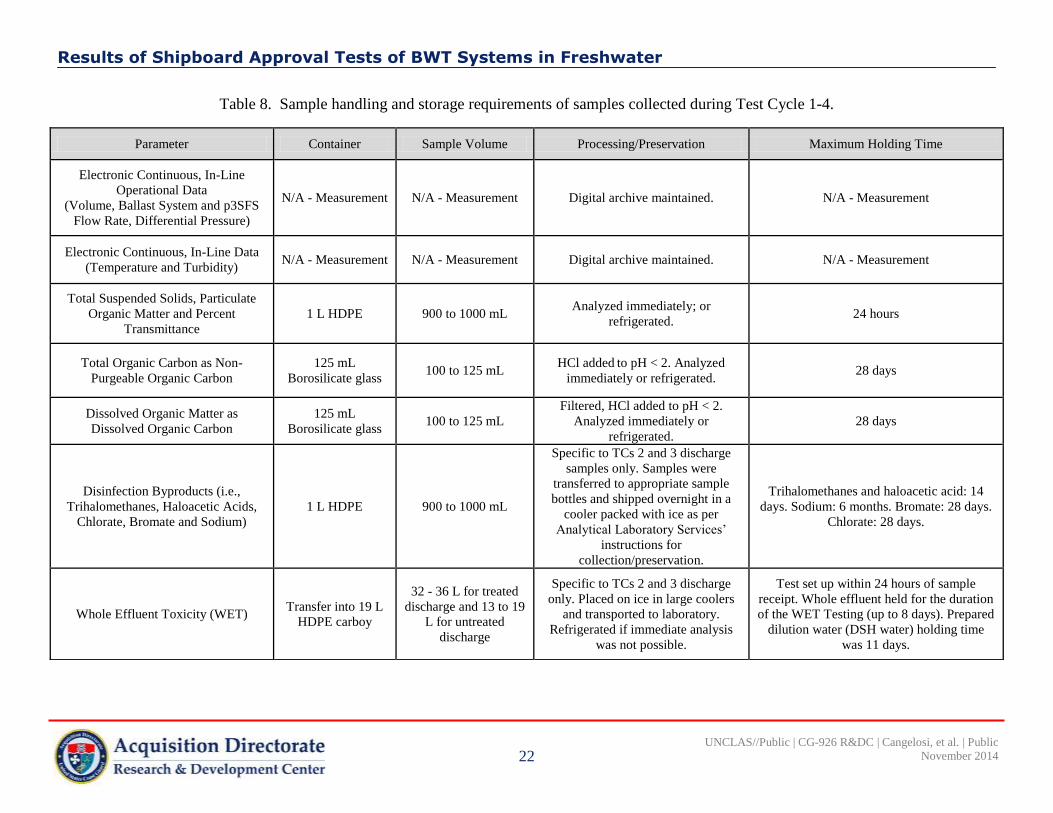
Results of Shipboard Approval Tests of BWT Systems in Freshwater
22
UNCLAS//Public | CG-926 R&DC | Cangelosi, et al. | Public
November 2014
Table 8. Sample handling and storage requirements of samples collected during Test Cycle 1-4.
Parameter Container Sample Volume Processing/Preservation Maximum Holding Time
Electronic Continuous, In-Line
Operational Data
(Volume, Ballast System and p3SFS
Flow Rate, Differential Pressure)
N/A - Measurement N/A - Measurement Digital archive maintained. N/A - Measurement
Electronic Continuous, In-Line Data
(Temperature and Turbidity) N/A - Measurement N/A - Measurement Digital archive maintained. N/A - Measurement
Total Suspended Solids, Particulate
Organic Matter and Percent
Transmittance
1 L HDPE 900 to 1000 mL Analyzed immediately; or
refrigerated. 24 hours
Total Organic Carbon as Non-
Purgeable Organic Carbon
125 mL
Borosilicate glass 100 to 125 mL
HCl added to pH < 2. Analyzed
immediately or refrigerated. 28 days
Dissolved Organic Matter as
Dissolved Organic Carbon
125 mL
Borosilicate glass 100 to 125 mL
Filtered, HCl added to pH < 2.
Analyzed immediately or
refrigerated.
28 days
Disinfection Byproducts (i.e.,
Trihalomethanes, Haloacetic Acids,
Chlorate, Bromate and Sodium)
1 L HDPE 900 to 1000 mL
Specific to TCs 2 and 3 discharge
samples only. Samples were
transferred to appropriate sample
bottles and shipped overnight in a
cooler packed with ice as per
Analytical Laboratory Services’
instructions for
collection/preservation.
Trihalomethanes and haloacetic acid: 14
days. Sodium: 6 months. Bromate: 28 days.
Chlorate: 28 days.
Whole Effluent Toxicity (WET) Transfer into 19 L
HDPE carboy
32 - 36 L for treated
discharge and 13 to 19
L for untreated
discharge
Specific to TCs 2 and 3 discharge
only. Placed on ice in large coolers
and transported to laboratory.
Refrigerated if immediate analysis
was not possible.
Test set up within 24 hours of sample
receipt. Whole effluent held for the duration
of the WET Testing (up to 8 days). Prepared
dilution water (DSH water) holding time
was 11 days.

Results of Shipboard Approval Tests of BWT Systems in Freshwater
23
UNCLAS//Public | CG-926 R&DC | Cangelosi, et al. | Public
November 2014
Table 8. Sample handling and storage requirements of samples collected during Test Cycle 1-4 (Continued).
Parameter Container Sample Volume Processing/Preservation Maximum Holding Time
Organisms ≥ 50 µm 1 L cod end 4.57 – 6.02 m3 to 1 L
Live samples processed and analyzed
within 3.5 hours of collection.
Unanalyzed samples preserved using
formalin solution.
Maximum hold time of 6 hours from
collection. Samples that were preserved in
lieu of live/dead analysis were preserved
immediately.
Organisms ≥ 10 and < 50 µm 1 L HDPE 900 to 1000 mL
Stained with Fluorescein Diacetate
(FDA). Processed and analyzed
within 1.5 hours of collection.
Unanalyzed samples preserved using
Lugol’s solution. Alternatively, for
TC3 and TC4 intake, samples were
preserved with 10 mL of Lugol’s
solution and analyzed with 72 hours
of collection.
Maximum hold time of 2 hours from
collection. Samples that were preserved in
lieu of live/dead analysis were preserved
immediately.
Organisms < 10 µm: Total
Heterotrophic Bacteria, Total Coliform
Bacteria, E. coli, and Enterococcus
spp.
1 L sterile PP
900 to 950 mL (leave
2.5 cm of headspace in
the bottle)
Placed on ice in coolers and
transported to laboratory for
immediate analysis. Refrigerated if
immediate analysis was not possible.
Note: no microbial samples were
collected on intake or discharge for
TC4.
24 hours

Results of Shipboard Approval Tests of BWT Systems in Freshwater
24
UNCLAS//Public | CG-926 R&DC | Cangelosi, et al. | Public
November 2014
2.6 Sample Analysis
2.6.1 Water Chemistry Detection Limits
Prior to the start of the 2012 and 2013 GSI shipboard testing seasons, the method detection limit (MDL) and
limit of quantification (LOQ) for the water chemistry parameters that GSI directly measured in TCs 1
through 4 (i.e., TSS, NPOC, DOC and POM) were determined following relevant GSI and LSRI standard
operating procedures (SOPs). The 2012 and 2013 MDLs and LOQs for TSS, NPOC, DOC and POM are
listed in Table 9.
Table 9. 2012 and 2013 GSI method detection limits and limit of quantifications for total suspended solids,
non-purgeable organic carbon, dissolved organic carbon and particulate organic matter.
Year Parameter Determination Date Method Detection Limit
(MDL)
Limit of
Quantification (LOQ)
2012
Total Suspended Solids 23 May 2012 1.07 mg/L 3.57 mg/L
Non-Purgeable Organic Carbon 28 June 2012 0.11 mg/L 0.35 mg/L
Dissolved Organic Carbon 28 June 2012 0.11 mg/L 0.35 mg/L
Particulate Organic Matter 25 September 2012 0.45 mg/L 1.50 mg/L
2013
Total Suspended Solids June 4 2013 0.78 mg/L 2.60 mg/L
Non-Purgeable Organic Carbon May 29 2013 0.20 mg/L 0.65 mg/L
Dissolved Organic Carbon May 29 2013 0.20 mg/L 0.65 mg/L
Particulate Organic Matter June 4 2013 0.59 mg/L 1.96 mg/L
2.6.2 Total Suspended Solids, Particulate Organic Matter, Percent Transmittance and Mineral
Matter
Intake and discharge samples collected for analysis of TSS, POM (TCs 2-4), %T and mineral matter (MM)
during TCs 1-4 are listed in Tables 6 and 7, respectively. These samples were analyzed according to the TC-
specific TQAPs (GSI, 2012a; GSI, 2012b; GSI, 2013a; GSI, 2013b). POM is a filter, dry and combust
method. The ETV DSP assumes that the POM concentration is generally about twice the POC
concentration.
2.6.3 Non-Purgeable Organic Carbon, Dissolved Organic Carbon and Particulate Organic Carbon
Intake and discharge samples collected for analysis of NPOC, DOC and POC (POC is the difference
between measured NPOC and DOC) during TCs 1-4 are listed in Tables 6 and 7, respectively. These
samples were analyzed according to the TC-specific TQAPs (GSI, 2012a; GSI, 2012b; GSI, 2013a; GSI,
2013b).
2.6.4 YSI Multiparameter Water Quality Sonde Measurements
Water quality parameters measured during TC1-4 using a YSI Multiparameter Water Quality Sonde are
listed in Tables 6 and 7. These measurements were analyzed according to the TC-specific TQAPs (GSI,
2012a; GSI, 2012b; GSI, 2013a; GSI, 2013b).
2.6.5 Biology
Intake and discharge samples collected during TCs 1-4 for biological analysis are listed in Tables 6 and 7,
respectively. These samples were analyzed according to procedures detailed the TC-specific TQAPs (GSI,
2012a; GSI, 2012b; GSI, 2013a; GSI, 2013b; Figure 10).

Results of Shipboard Approval Tests of BWT Systems in Freshwater
25
UNCLAS//Public | CG-926 R&DC | Cangelosi, et al. | Public
November 2014
Figure 10. GSI personnel conducting analysis of organisms ≥ 10 µm and < 50 µm.
2.6.6 Disinfection Byproducts
Intake and discharge samples collected for analysis of selected disinfection byproducts during TC2 and TC3
(i.e., samples were not collected during TC1 and TC4 due to the lack of a BWMS) are listed in Tables 6 and
7, respectively. These samples were analyzed according to the TC-specific TQAPs (GSI, 2012b; GSI,
2013a).
2.6.7 Whole Effluent Toxicity
Discharge samples collected for analysis of WET during TCs 2 and 3, in which the BWMS was active, are
listed in Tables 6 and 7, respectively. These samples were analyzed according to procedures detailed in the
TC-specific TQAPs (GSI, 2012b; GSI, 2013a).
2.7 Data Processing, Verification, Validation and Storage GSI personnel recorded sample collection and operational data according to procedures detailed in the TC-
specific TQAPs (GSI, 2012a; GSI, 2012b; GSI, 2013a; GSI, 2013b). Completed data collection forms were
secured in uniquely-identified three ring binders specific to Project 41012. Biological and chemical data
that were recorded by hand were manually entered into either a Microsoft Access Database or a Microsoft
Excel Spreadsheet.
A percentage of data that was recorded by hand and entered into Microsoft Access or Excel was verified
against the original raw data by the GSI Senior QAQC Officer. This procedure also included verification of
the accuracy of computer-generated data through hand-calculation. The percentage of verified raw data
depended upon the amount of raw data that was generated, and ranged from 10 % to 100 % of the original
raw data.

Results of Shipboard Approval Tests of BWT Systems in Freshwater
26
UNCLAS//Public | CG-926 R&DC | Cangelosi, et al. | Public
November 2014
All electronic data files are stored on the LSRI’s secured Local Area Network that can be accessed only by
relevant GSI personnel. The electronic data files are also stored on the GSI’s internal SharePoint website
(greatshipsinitiative.net), which acts as a secondary data backup/storage mechanism. In addition, the GSI
Senior QAQC Officer is responsible for archiving and storing all original raw data applicable to Project
41012 in a climate-controlled, secure archive room at the LSRI for a period seven years following
finalization of this document.
3 BALLAST WATER MANAGEMENT SYSTEM PERFORMANCE RESULTS
This section presents information relevant to BWMS evaluation using the ETV DSP. Because the prototype
BWMS was operative in TC2 and TC3 only, operational, biological and environmental performance results
sections reflect information derived from only those two test cycles.
Results describe:
BWMS operational outcomes (TC2 and TC3, only);
Sampling operations;
Characterization of ballast water sampled in TCs 1-4;
Characterization and assessment of challenge conditions;
Biological performance of the prototype NaOH BWMS (TC2 and TC3, only);
Environmental acceptability of the prototype NaOH BWMS (TC2 and TC3, only); and
QA/QC, including data quality indicators and TQAP deviations.
3.1 Ballast Water Management System Operational Outcomes
The prototype NaOH BWMS operated (TC2 and TC3, only) consistently with BWMS developer objectives.
3.1.1 Test Cycle 2
According to the BWMS Developer, ballast treatment during TC2 took place as planned. The measured pH
of the water in the two ballast tanks after treatment with the prototype NaOH BWMS was not provided to
GSI. The IH retained the treated water onboard for the desired retention time (approximately 3 days), and
the water achieved the desired pH of 6.0 – 8.8 after neutralization. The BWMS Developer also confirmed
successful neutralization prior to ballast discharge on 12 October 2012 by completing and signing GSI
FORM: Ballast Water Management System Neutralization Verification.
3.1.2 Test Cycle 3
The BWMS Developer reported that the prototype NaOH BWMS operated as planned during TC3, with a
few deviations summarized here:
Approximately 5 cm of clay-like material covered the bottom of both treatment ballast tanks, with
the material up to 12 cm deep in certain areas (mainly isolated to a few sections under the ballast
line) despite cleaning of both tanks prior to TC3;
The prototype NaOH BWMS achieved a pH of 11.7 in tanks 3P and 4P, rather than the expected pH
of 12.0;
Tank 3P took longer to neutralize than tank 4P due to a slower flow rate of CO2; and

Results of Shipboard Approval Tests of BWT Systems in Freshwater
27
UNCLAS//Public | CG-926 R&DC | Cangelosi, et al. | Public
November 2014
The IH’s crew had to introduce raw water into the vessel’s ballast pump seals towards the end of one
of the treatment tank discharges and a small amount of contaminated water was introduced.
The IH retained the treated water for the desired retention time of approximately three days, and the water in
the two treated tanks achieved the desired pH of 6.0 – 8.8 after neutralization. The BWMS developer
confirmed successful neutralization prior to ballast discharge on 16 August 2013 by completing and signing
GSI FORM: Ballast Water Management System Neutralization Verification. Prior to ballast discharge the
GSI Test Manager also verified that complete neutralization of the NaOH-treated ballast water had
occurred.
3.2 Sampling Operations
3.2.1 Intake Sampling
Table 10 summarizes p3SFS operating conditions during TC 1-4 intake sampling events.
3.2.1.1 Test Cycle 1
TC1 target operational conditions were met without interruption during intake of tanks 5P and 3P (Table
10). Approximately 50 minutes into tank 2P intake operation, the ballast pump on the IH was stopped for
2 minutes due to cargo loading operations, and the p3SFS sampling operation was paused. After the pause,
the IH’s ballast pump and the p3SFS were restarted, however, the p3SFS automatic pump start-up failed.
Although the p3SFS display read “Sampling” approximately 18 minutes after the restart, GSI personnel
observed that the p3SFS display was reading “0 US GPM.” Consequently, approximately 21 minutes of
tank 2P’s 90 minute intake operation was not sampled, which was approximately 23 % of the total sampling
operation time. As a result, less water, i.e., 4.7 m1, was filtered during tank 2P’s intake sampling operation,
which fell outside the target range of 6.0 m3
± 10 %2
(Table 10).
The operational data summary of the sampling operation during TC1 tank 2P intake also displayed lower
values than the auto-logged electronic data, with only the latter falling within the target range (Table 10).
Moreover, several discrepancies were noted with the automatically-logged data. For example, the p3SFS is
programmed to measure and record operational data once every second, such that the 69 minute intake
operation for tank 2P should have yielded 4,140 data points, rather than the 3,747 data points obtained
(approximately 10 % lower than expected) (Table 10). Similarly, the 94 minute intake operation for tank 5P
produced 4,899 data points, about 13 % less than expected, and the 91 minute intake operation for tank 3P
had 5,034 data points, about 8 % less than expected (Table 10).
3.2.1.2 Test Cycle 2
TC2 sampling was paused to accommodate IH cargo operations during intake of tanks 5P and 2P; data
provided in Table 10 are therefore either an average of the pre- and post-pause data, or the sum of the two
parts, depending on the specific parameter (Table 10). Based on historical data, GSI anticipated tank 2P and
5P ballasting times to be 70 to 100 minutes, which would accommodate the planned sampling duration of 90
minutes. However, ballasting times were 61 minutes for tank 5P and only 49 minutes for tank 2P. This high
ballasting rate truncated sampling time, causing GSI to miss several operational targets, including volume
1 Based on assumption that p3SFS flow meter was accurately recording flow rates.
2 As above.

Results of Shipboard Approval Tests of BWT Systems in Freshwater
28
UNCLAS//Public | CG-926 R&DC | Cangelosi, et al. | Public
November 2014
sampled, drip sample volume and drip sample flow rate (Table 10). The average sample flow rate, average
pressure and average differential pressure for tank 2P could not be calculated because the pre-pause data
from the first 29 minutes of sampling was lost when the p3SFS’s sampling condition was inadvertently
changed to “Stop” rather than “Pause”. Instead, averages calculated from the post-pause sampling data of 20
minutes are provided in Table 10, and are well inside the target range for these specific parameters3.
3.2.1.3 Test Cycle 3
During tank 2P intake, sampling was stopped 49 minutes into the ballast operation due to the pressure
differential of the p3SFS reaching 5 psi. However, with only 10 minutes of the IH’s scheduled ballast
operation remaining, the GSI PI made a decision not to resume sampling. Similarly, sampling of tank 5P
was paused for 26 minutes part-way through the intake operation when the pressure differential rose above 5
psi4. The clogged filters were replaced during this pause, and sampling resumed. Truncated sampling
operations during TC3 and, like for TC2, resulted in several operational targets not being met, including
volume sampled5, drip sample volume and drip sample flow rate (Table 10).
3.2.1.4 Test Cycle 4
In TC4, several operational parameters missed their target ranges due to circumstances outside GSI’s
control (Table 10). For example, during TVE#2, GSI ceased sampling operations at 37 minutes owing to an
anticipated prolonged pause in ballasting. As a result, tank heights were recorded at only two time points (at
the beginning and near the end of the sampling operation) and the average main ballast flow could not be
adequately calculated from the number of tank heights recorded (Table 10; Figure 9). The main ballast flow
rate for TVE#1 was also below the recommended range for subisokinetic sampling (i.e., ≥ 1700 m3/Hr)
(Table 10). The flow rate through the p3SFS drip sampler was also significantly slower than planned
(Table 10). In addition, GSI personnel detected a crack in the sampler’s plastic nipple that produced sample
water leakage just upstream of the drip sampler shut off valve. This leak reduced drip sample volumes to
below the target range for both TVE#1 and TVE#2 (Table 10).
3 Based on assumption that p3SFS flow meter was accurately recording flow rates.
4 As above.
5 As above.

Results of Shipboard Approval Tests of BWT Systems in Freshwater
29
UNCLAS//Public | CG-926 R&DC | Cangelosi, et al. | Public
November 2014
Table 10. Summary of p3SFS operating conditions during Project 41012 intake sampling events. For Test Cycle 1, output includes hand
recorded and auto-logged electronic data. The auto-logged data is provided in parenthesis. For all TCs, values marked with an asterisk
(*) are outside the valid range for that parameter.
Test Cycle Parameter Valid Range Tank 5P Tank 2P Tank 3P
1
Sampling duration (min) ≤ 90 94 69 91
Volume sampled (m3) 6 ± 10 % 6.0 4.7* 6.0
Ballast flow rate (m3/Hr) ≥ 1700 Did not determine Did not determine Did not determine
Sample flow rate (m3/hour) 4 ± 10 % 4.0 (3.9, n=4899) 0.8
* (3.8, n=3747) 4.0 (3.9, n=5034)
Pressure housing A (bar) No requirement 1.68 (1.67, n=4899) 0.46 (1.63, n=3747) 1.52 (1.52, n=5034)
Pressure differential housing A (bar) < 0.3 - 0.01 (- 0.005, n=4899) 0.00 (0.01, n=3747) 0.02 (0.02, n=5034)
Pressure housing B (bar) No requirement 1.73 (1.73, n=4899) 0.47 (1.69, n=3747) 1.58 (1.58, n=5034)
Pressure differential housing B (bar) < 0.3 - 0.07 (- 0.07, n=4899) - 0.01 (- 0.06, n=3747) - 0.05 (- 0.04, n=5034)
Drip sample volume (L) No requirement 11 13 12
Drip sample flow rate (L/Hr) No requirement 7.0 11.3 7.9
Test Cycle Parameter Valid Range Tank 5P Tank 2P
2
Sampling duration (min) ≤ 90 61 49
Volume sampled (m3) 5.4 – 6.6 4.2* ~3.4*
Ballast flow rate (m3/Hr) > 2,000 3490 3224
Sample flow rate (m3/hour) 3.6 – 4.4 4.0 4.1 (Post-Pause data only)
Pressure housing A (bar) No requirement 1.98 2.01 (Post-Pause data only)
Pressure differential housing A (bar) < 0.3 0.04 0.03 (Post-Pause data only)
Pressure housing B (bar) No requirement 2.15 2.19 (Post-Pause data only)
Pressure differential housing B (bar) < 0.3 0.10 0.08 (Post-Pause data only)
Drip sample volume (L) 13.5 – 16.5 13* 10*
Drip sample flow rate (L/Hr) 9 - 11 12.8* 12.2*
Test Cycle Parameter Valid Range Tank 5P Tank 2P
3
Sampling duration (min) ≤ 90 79 49
Volume sampled (m3) 1.6 – 10.4 (Target = 6) 5.16 3.33
Ballast flow rate (m3/Hr) ≥ 1,700 2,584 2,054
Sample flow rate (m3/hour) 1 – 7 (Target = 4) 4.12 3.92
Pressure differential housing A (psi) ≤ 5 ≤ 5.40* ≤ 5.48*
Pressure differential housing B (psi) ≤ 5 ≤ 5.38* ≤ 5.63*
Drip sample volume (L) 10 – 19 (Target = 15) 11.5 8.0*
Drip sample flow rate (L/Hr) 7 – 13 (Target = 10) 8.7 9.8

Results of Shipboard Approval Tests of BWT Systems in Freshwater
30
UNCLAS//Public | CG-926 R&DC | Cangelosi, et al. | Public
November 2014
Table 10. Summary of p3SFS operating conditions during Project 41012 intake sampling events. For Test Cycle 1, output includes hand
recorded and auto-logged electronic data. The auto-logged data is provided in parenthesis. For all TCs, values marked with an asterisk
(*) are outside the valid range for that parameter (Continued).
Test Cycle Parameter Valid Range Tank 5P Tank 2P Tank 3P
Test Cycle Parameter Valid Range Tank Volume Equivalent #1 Tank Volume Equivalent #2 Tank Volume Equivalent #3
4
Sampling duration (min) 75 75 37* 75
Volume sampled (m3) 1.6 – 10.4 (Target = 5) 5.1 2.6 5.1
Ballast flow rate (m3/Hr) ≥ 1,700 1,322*
Could not determine; too few
tank heights recorded. 2,142
Sample flow rate (m3/hour) 1 – 7 (Target = 4) 4.1 4.2 4.1
Average differential pressure (psi) ≤ 5 1.2 2.1 0.9
Drip sample volume (L) 10 – 19 (Target = 15) 8* 4* 10
Drip sample flow rate (L/Hr) 7 – 13 (Target = 10) 6.4* 6.5* 8.0*

Results of Shipboard Approval Tests of BWT Systems in Freshwater
31
UNCLAS//Public | CG-926 R&DC | Cangelosi, et al. | Public
November 2014
3.2.2 Discharge Sampling
Table 11 summarizes p3SFS operating conditions during the discharge sampling events.
3.2.2.1 Test Cycle 1
For TC1 discharge, all target operational conditions were met (Table 11). However, Table 11 displays only
hand-recorded operational data; the Micro Secure Digital (SD) Card used to save the continuously collected
electronic data was not properly formatted by GSI prior to data collection.
3.2.2.2 Test Cycle 2
Sample collection for the three tanks was uninterrupted during the TC2 discharge operation. The sample
collection time was, however, shortened when the ship’s crew decided to discharge less water than expected
resulting in the target value for total volume sampled from tank 3P likely not being met6 (Table 11). The
flow rate of the drip sampler during tank 3P discharge was increased to 35 L/hour to compensate for the
reduced ballasting time to ensure that an acceptable volume of whole water was collected (42 L; Table 11).
As a result, the drip sampler flow rate was above the valid range of 27 – 33 L/hour (Table 11). Similarly,
tank 3P sample volume fell slightly below the target volume range7 (Table 11).
3.2.2.3 Test Cycle 3
GSI increased the drip sample flow rate for Tank 4P above the target prior to the start of tank discharge to
ensure an adequate sample volume was available for WET testing due to an expected abbreviated ballast
pumping duration (Table 11).
3.2.2.4 Test Cycle 4
The target operating conditions were met for the two TVEs sampled during the TC4 discharge. The third
TVE was not collected because IH deballasting operations were paused for a prolonged period. The average
main ballast flow for TVE#2 on discharge could not be calculated because an insufficient number of tank
heights were recorded (Table 11). An equipment malfunction also reduced the drip sample flow rates for
TVE#1 and TVE#2 below the target range8 (Table 11; Figure 11). This malfunction also reduced drip
sample volumes below the valid range (Table 11).
6 Based on assumption that p3SFS flow meter was accurately recording flow rates.
7 As above.
8 On intake the GSI sample team detected a crack leaking water in the plastic nipple located just prior to the p3SFS drip sampler
shut off valve. GSI assumed the leak was causing the slow drip sampler flow rate, and attempted repair with negative results.
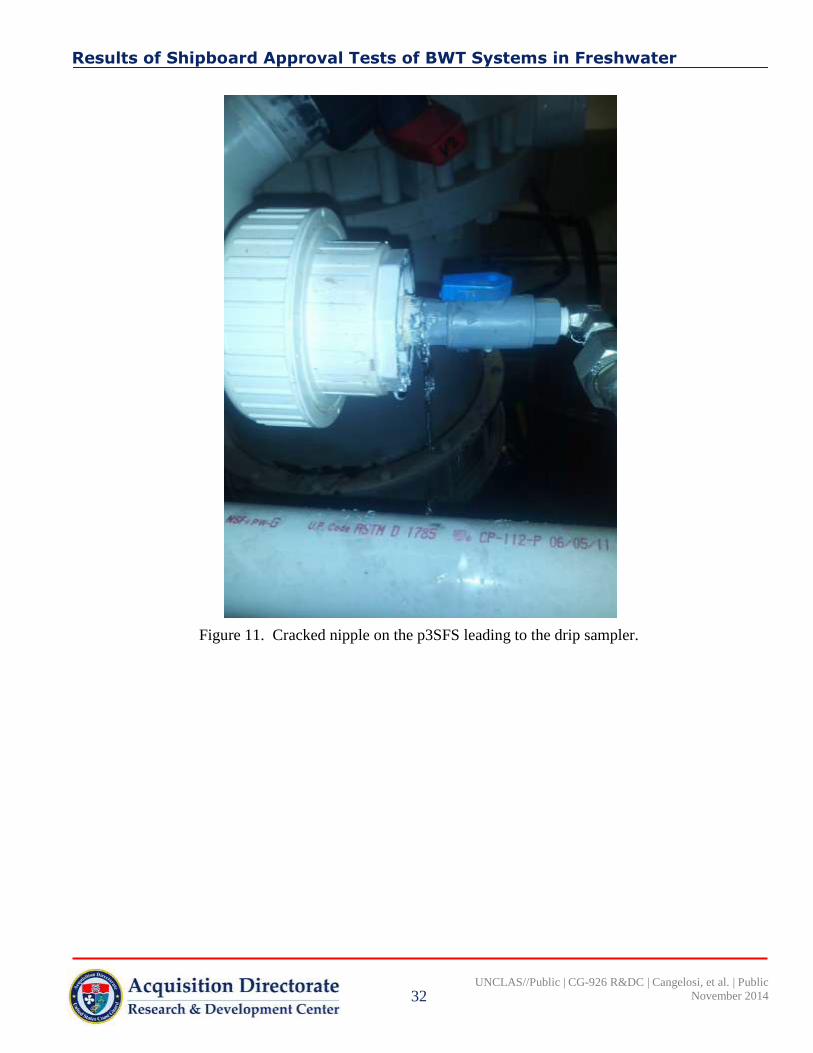
Results of Shipboard Approval Tests of BWT Systems in Freshwater
32
UNCLAS//Public | CG-926 R&DC | Cangelosi, et al. | Public
November 2014
Figure 11. Cracked nipple on the p3SFS leading to the drip sampler.

Results of Shipboard Approval Tests of BWT Systems in Freshwater
33
UNCLAS//Public | CG-926 R&DC | Cangelosi, et al. | Public
November 2014
Table 11. Summary of p3SFS operating conditions during Project 41012 discharge sampling events. Values marked with an asterisk (*) are
outside the valid range for that parameter.
Test Cycle Parameter Valid Range Tank 5P Tank 2P Tank 3P
1
Sampling duration (min) ≤ 90 90 90 90
Volume sampled (m3)
9 6 ± 10 % 6.0 6.0 6.0
Ballast flow rate (m3/Hr) > 1,700 Not determined Not determined Not determined
Sample flow rate (m3/hour) 4 ± 10 % 4.0 4.0 4.0
Pressure housing A (bar) No requirement 1.18 1.21 1.11
Pressure differential housing A (bar) < 0.3 - 0.02 0.05 0.08
Pressure housing B (bar) No requirement 1.33 1.35 1.26
Pressure differential housing B (bar) < 0.3 - 0.04 0.03 0.06
Drip sample volume (L) No requirement 11.5 12.0 12.0
Drip sample flow rate (L/Hr) No requirement 7.7 8.0 8.0
Test Cycle Parameter Valid Range Tank 3P
(Treatment)
Tank 4P
(Treatment)
Tank 5P
(Mock-Treatment)
2
Sampling duration (min) ≤ 90 78 81 90
Volume sampled (m3)
10 5.4 -6.6 5.3* 5.4 6.0
Ballast flow rate (m3/Hr) >1700 1,723 1,943 2,016
Sample flow rate (m3/hour) 3.6 – 4.4 4.0 4.0 4.0
Pressure housing A (bar) No requirement 0.96 0.96 1.05
Pressure differential housing A (bar) < 0.30 0.06 0.07 -0.04
Pressure housing B (bar) No requirement 1.19 1.21 1.30
Pressure differential housing B (bar) < 0.30 0.14 0.17 0.07
Drip sample volume (L) 40.5 – 49.5 42 43 45
Drip sample flow rate (L/Hr) 27 - 33 32 32 30
9 Based on assumption that p3SFS flow meter was accurately recording flow rates.
10 As above.

Results of Shipboard Approval Tests of BWT Systems in Freshwater
34
UNCLAS//Public | CG-926 R&DC | Cangelosi, et al. | Public
November 2014
Table 11. Summary of p3SFS operating conditions during Project 41012 discharge sampling events. Values marked with an asterisk (*) are
outside the valid range for that parameter (Continued).
Test Cycle Parameter Valid Range Tank 3P
(Treatment)
Tank 4P
(Treatment)
Tank 5P
(Mock-Treatment)
3
Sampling duration (min) ≤ 90 89 68 90
Volume sampled (m3)
11 1.6 – 10.4 (Target = 6) 6.01 4.57 6.02
Ballast flow rate (m3/Hr) ≥ 1,700 1,520* 1,792 1,820
Sample flow rate (m3/hour) 1 – 7 (Target = 4) 4.01 4.03 4.01
Pressure differential housing A (psi) ≤ 5 - 0.21 - 0.45 - 0.31
Pressure differential housing B (psi) ≤ 5 0.60 0.26 0.73
Drip sample volume (L) 35 – 50 (Target = 45) 49 50 48
Drip sample flow rate (L/Hr) 23 – 33 (Target = 30) 33 44* 32
Test Cycle Parameter Valid Range Tank Volume
Equivalent #1
Tank Volume Equivalent
#2
Tank Volume Equivalent
#3
4
Sampling duration (min) 75 75 72
Aborted due to unexpected
change in ship ballast
operations
Volume sampled (m3)
12 1.6 – 10.4 (Target = 6) 5.1 4.7
Ballast flow rate (m3/Hr) ≥ 1,700 6,284
13
Could not determine; too
few tank heights recorded.
Sample flow rate (m3/hour) 1 – 7 (Target = 4) 4.1 3.9
Average differential pressure (psi) ≤ 5 1.2 1.5
Drip sample volume (L) 10 – 19 (Target = 15) 4* 3*
Drip sample flow rate (L/Hr) 9 – 15 (Target = 12) 3.2* 2.5*
11
As above. 12
Based on assumption that p3SFS flow meter was accurately recording flow rates. 13
On previous visits the IH ballasted a single tank at a time but in TC 4 they ballasted multiple tanks at once.
Results of Shipboard Approval Tests of BWT Systems in Freshwater
35
UNCLAS//Public | CG-926 R&DC | Cangelosi, et al. | Public
November 2014
3.2.3 Proportionality of Sample Flow to Ballast Flow
The sample flow-ballast flow ratio could not be estimated as described in 2.4.1 because the p3SFS flow
sensor was found to be inaccurate. The sensor problem was discovered at the end of the study when the
sensor was compared to a reference flow sensor. The cause was traced to interference from the flow control
valve located a short distance upstream of the flow sensor. Turbulence from the valve produced inaccurate
sample flow data, which in turn affected flow control valve settings. The actual p3SFS system flow rates are
unknown. (Appendix A). However, the test still provided useful results regarding the proportionality of a
pre-programmed steady sample flow rate to a calculated actual ballast flow rate. GSI was able to assess
how proportional a p3SFS preset target sample flow rate would have been to an actual ballast flow rate
under real world conditions of uneven ballast flow rates.
Target volumes sampled and actual volume ballasted relative to TC2 and TC314
roughly corresponded only
when ballast flow was not interrupted (Figures 12–15). For example, during TC2, recorded (i.e., target)
sample flow was not proportional to calculated tank ballast flow when the IH ballasted ~500 m3 of water in
tank 5P before GSI sample collection started at 21:05 (Figure 12). The proportionality of the recorded
sample flow to actual ballast flow was also affected during TC3 tank 4P discharge, where water from the
tank was first used to flush the line (Figure 15).
14
The proportionality of flow was determined after TC2 and TC3 by calculating the IH ballast flow using tank height data.

Results of Shipboard Approval Tests of BWT Systems in Freshwater
36
UNCLAS//Public | CG-926 R&DC | Cangelosi, et al. | Public
November 2014
Figure 12. Calculated rate of ballast water loaded into tanks 2P and 5P during Test Cycle 2 intake
operations compared to the target rate of sample water collected using the p3SFS15
.
15
Based on assumption that p3SFS flow meter was accurately recording flow rates.
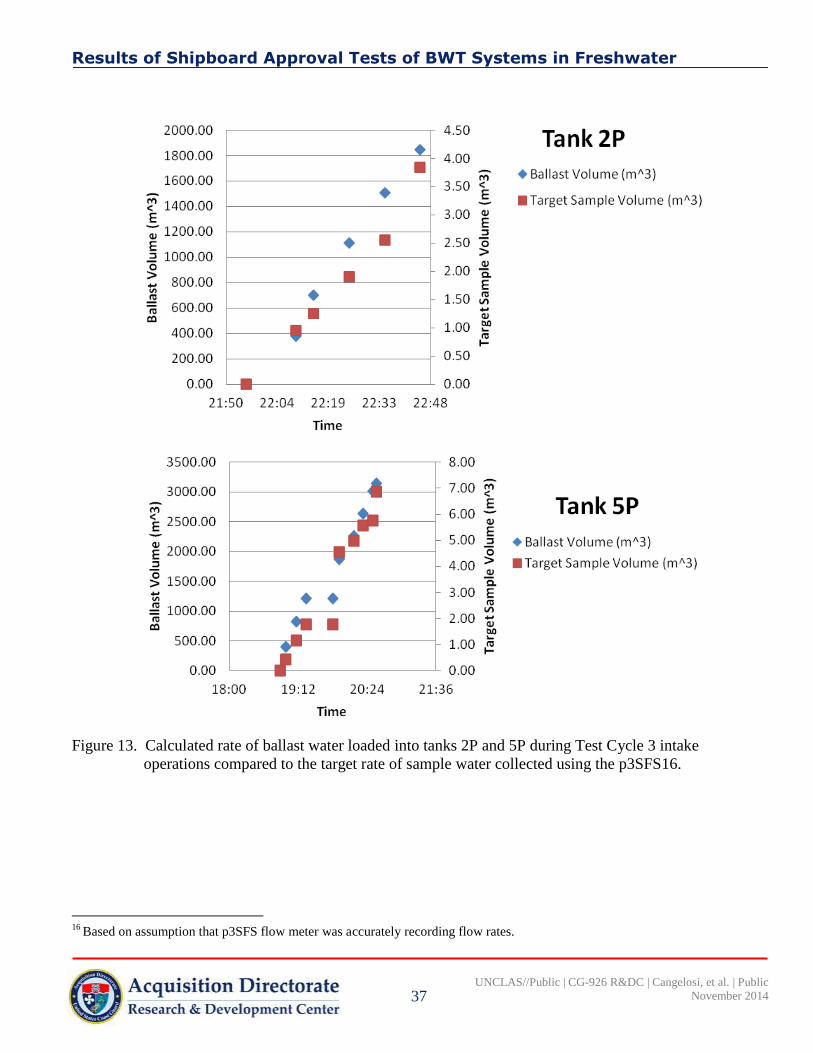
Results of Shipboard Approval Tests of BWT Systems in Freshwater
37
UNCLAS//Public | CG-926 R&DC | Cangelosi, et al. | Public
November 2014
Figure 13. Calculated rate of ballast water loaded into tanks 2P and 5P during Test Cycle 3 intake
operations compared to the target rate of sample water collected using the p3SFS16.
16
Based on assumption that p3SFS flow meter was accurately recording flow rates.
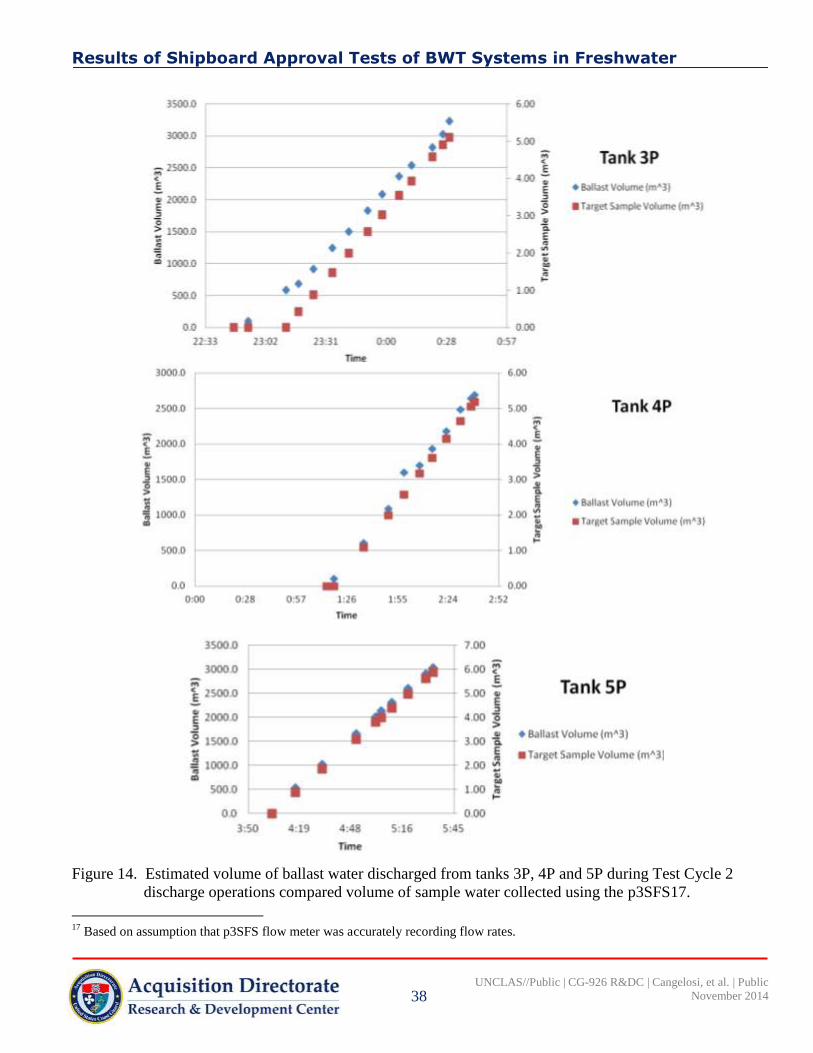
Results of Shipboard Approval Tests of BWT Systems in Freshwater
38
UNCLAS//Public | CG-926 R&DC | Cangelosi, et al. | Public
November 2014
Figure 14. Estimated volume of ballast water discharged from tanks 3P, 4P and 5P during Test Cycle 2
discharge operations compared volume of sample water collected using the p3SFS17.
17
Based on assumption that p3SFS flow meter was accurately recording flow rates.
3500.0 600
• 30001) ,~ SDO
;:; Tank3P • c: ;:; ?500.0 E < • =DO'; E j • e.!~ VOlume cm•.JJ • .0 • • E •• 0 • r argeot ~ \'ctumc! (m•<S) :::1 ]QC > 0 ..! ~ 1..001) • • A
E 2 • • 2.~ ~ .. &D 10000 • • -• ~
•• ... 500.0 100
• 01) •• • 0.00 2l:ll 23:02 23 31 0:00 0'.2! 057
Ti
30000 GOO
2~00 ·'- '500 Tank4P • 1 x 20000
I e 400-• ; ••• j 15000
15 300 >
> • 100 I 11000.0 • • 83tla~t Volume (m~3J
• l.IIF,f't S mplc Volullll! (m"lt k • ')00.0 1 00
00 .. o·oo 0 28 0 57 J •26
Time
3SOOO
30000 ;;;-e 2sooo e .,oooo ;;)
~ l~O • ... o'l
:2 10000 a a ID
5000 • 00 • 350 ~ 19 4 .l8
Ttme
IQ Acquisition Directorate 'W Research & D evelopment Center
000 1 :5'5 1 2·1 2;52
100
600 ~ E Tank SP •• soo .. E !)
~ 4 00 0 > .. • 8.Jllilu Volun~Cm"l)
JOO ii. E 8 lar t Sample! Volume! (m"31 ..
200 ~ Cl ..
100 ... t-
000 s 16 5 .15

Results of Shipboard Approval Tests of BWT Systems in Freshwater
39
UNCLAS//Public | CG-926 R&DC | Cangelosi, et al. | Public
November 2014
Figure 15. Estimated volume of water discharged from tanks 3P, 4P and 5P during Test Cycle 3 discharge
operations compared volume of sample water collected using the p3SFS18.
18
Based on assumption that p3SFS flow meter was accurately recording flow rates.
Results of Shipboard Approval Tests of BWT Systems in Freshwater
40
UNCLAS//Public | CG-926 R&DC | Cangelosi, et al. | Public
November 2014
3.3 Characterization of Ballast Water Sampled in Test Cycles 1-4
3.3.1 Total Suspended Solids, Particulate Organic Matter, Percent Transmittance and Mineral
Matter
3.3.1.1 Intake
Results from TC 1-4 analysis of intake samples for TSS, POM (TC 2-4 only), %T (filtered and unfiltered)
and MM are presented in Table 12, and Figures 16-20. Across TCs, TSS was primarily inorganic MM
(Table 12). For TC1, intake water chemistry challenge targets were met except for TSS (Table 12). For
TC2, intake water chemistry challenge targets were met except for POM (Table 12). For TC3, intake water
chemistry challenge targets were met except for TSS in tank 2P, measured from the only replicate available
for analysis (Table 12). For TC4, where discrete grab samples were collected from the main ballast line
instead of from the drip sampler, all intake water chemistry challenge targets were met (Table 12).
3.3.1.2 Discharge
Results from TC 1-3 analysis of discharge samples for TSS, POM (TC 2-4 only), %T (filtered and
unfiltered) and MM are presented in Table 13 and Figures 16-20. No water chemistry analysis was
conducted during TC4 because the sampling and analysis plan was reduced. Across TCs 1–3 however,
concentrations of TSS and MM ranged from 4.4 mg/L to below the MDL (Table 13; Figures 16 and 20).
3.3.2 Non-Purgeable Organic Carbon, Dissolved Organic Carbon and Particulate Organic Carbon
3.3.2.1 Intake
Results from TC 1-4 analysis of intake samples for NPOC, DOC and POC are presented in Table 12, and
Figures 21-23. Across TCs, TOC measured as NPOC was predominately in the form of DOC (Table 12).
3.3.2.2 Discharge
Results from TC 1-3 analysis of discharge samples for NPOC, DOC and POC are presented in Table 13 and
Figures 21-23. No water chemistry analysis was conducted during TC4 owing to a truncated sampling and
analysis plan. Across TCs 1–3, TOC concentrations (measured as NPOC) ranged from 2.7 mg/L to 6.7 mg/L
(Table 13; Figure 21).

Results of Shipboard Approval Tests of BWT Systems in Freshwater
41
UNCLAS//Public | CG-926 R&DC | Cangelosi, et al. | Public
November 2014
Table 12. Water chemistry parameters (Average ± Standard Deviation) measured from discrete grab
samples collected during Test Cycles 1–4 Intake Operations. Values marked with an asterisk (*)
are outside the valid range for that parameter.
Test
Cycle Parameter
Challenge Target
Valid Range Tank 5P Tank 2P Tank 3P
1
Total Suspended Solids (mg/L) ≥ 12 7.6 ± 0.2* 5.3 ± 0.2* 4.4 ± 0.1*
Percent Transmittance - Filtered No requirement 90.7 ± 0.1 90.3 ± 0.9 90.4 ± 0.8
Percent Transmittance - Unfiltered No requirement 86.4 ± 0.2 86.1 ± 0.6 87.2 ± 0.8
Non-Purgeable Organic Carbon (mg/L) No requirement 3.2 ± 0.1 3.3 ± 0.1 3.1 ± 0.1
Dissolved Organic Matter – as
Dissolved Organic Carbon (mg/L) ≥ 2 2.9 ± 0.2 2.9 ± 0.1 2.8 ± 0.1
Particulate Organic Carbon (mg/L) No requirement 0.2 ± 0.1 0.4 ± 0.0 0.3 ± 0.0
Mineral Matter (mg/L) No requirement 7.3 ± 0.3 4.9 ± 0.2 4.1 ± 0.1
Test
Cycle Parameter
Challenge Target
Valid Range Tank 5P Tank 2P
2
Total Suspended Solids (mg/L) ≥ 12 20.3 ± 0.3 13.4 ± 0.6
Percent Transmittance - Filtered No requirement 95.0 ± 0.6 94.9 ± 0.2
Percent Transmittance - Unfiltered No requirement 84.1 ± 1.3 88.0 ± 0.3
Non-Purgeable Organic Carbon (mg/L) No requirement 3.0 ± 0.3 2.7 ± 0.2
Dissolved Organic Matter – as
Dissolved Organic Carbon (mg/L) ≥ 2 2.6 ± 0.2 2.6 ± 0.1
Particulate Organic Carbon (mg/L) No requirement 0.5 ± 0.4 0.1 ± 0.2
Particulate Organic Matter (mg/L) ≥ 2 2.0 ± 0.1 1.4 ± 0.2*
Mineral Matter (mg/L) No requirement 19.9 ± 0.6 13.4 ± 0.8
Test
Cycle Parameter
Challenge Target
Valid Range Tank 5P Tank 2P
3
Total Suspended Solids (mg/L) ≥ 12 16.9 ± 0.3 9.3*
Percent Transmittance - Filtered No requirement 61.9 ± 1.3 61.5
Percent Transmittance - Unfiltered No requirement 53.2 ± 0.6 55.7
Non-Purgeable Organic Carbon (mg/L) No requirement 7.4 ± 0.1 7.0 ± 0.1
Dissolved Organic Matter – as
Dissolved Organic Carbon (mg/L) ≥ 2 6.5 ± 0.1 6.4 ± 0.2
Particulate Organic Carbon (mg/L) No requirement 0.9 ± 0.1 0.6 ± 0.1
Particulate Organic Matter (mg/L) > 2 4.3 ± 0.1 3.3
Mineral Matter (mg/L) No requirement 12.5 ± 0.2 6.0
Test
Cycle Parameter
Challenge Target
Valid Range
Tank Volume
Equivalent #1
Tank Volume
Equivalent #2
Tank Volume
Equivalent #3
4
Total Suspended Solids (mg/L) ≥ 12 76.9 ± 4.3 70.0 ± 0.1 40.7 ± 8.5
Percent Transmittance - Filtered No requirement 58.0 ± 1.2 57.3 ± 0.1 55.6 ± 0.3
Percent Transmittance - Unfiltered No requirement 32.0 ± 1.7 33.2 ± 0.6 41.4 ± 1.5
Non-Purgeable Organic Carbon (mg/L) No requirement 6.2 ± 0.1 6.3 ± 0.1 6.2 ± 0.1
Dissolved Organic Matter – as
Dissolved Organic Carbon (mg/L) ≥ 2 6.4 ± 0.1 6.4 ± 0.1 6.6 ± 0.1
Particulate Organic Matter (mg/L) ≥ 2 6.2 ± 0.5 5.7 ± 0.1 3.3 ± 0.8
Mineral Matter (mg/L) No requirement 70.6 ± 4.0 64.3 ± 0.0 37.4 ± 7.7

Results of Shipboard Approval Tests of BWT Systems in Freshwater
42
UNCLAS//Public | CG-926 R&DC | Cangelosi, et al. | Public
November 2014
Table 13. Water chemistry parameters (Average ± Standard Deviation) measured from discrete grab
samples collected during Test Cycles 1–4 discharge operations. MDL = Method Detection
Limit.
Test Cycle Parameter Tank 2P Tank 3P Tank 5P
1
Total Suspended Solids (mg/L) 1.3 ± 0.2 < MDL < MDL
Percent Transmittance - Filtered 85.5 ± 0.2 87.5 ± 0.2 85.6 ± 0.3
Percent Transmittance - Unfiltered 83.9 ± 0.3 86.0 ± 0.1 84.1 ± 0.1
Non-Purgeable Organic Carbon (mg/L) 3.4 ± 0.1 3.2 ± 0.1 3.5 ± 0.3
Dissolved Organic Carbon (mg/L) 3.2 ± 0.2 3.1 ± 0.1 3.3 ± 0.2
Particulate Organic Carbon (mg/L) 0.2 ± 0.2 0.1 ± 0.1 0.2 ± 0.4
Mineral Matter (mg/L) 1.1 ± 0.2 0.8 ± 0.1 0.8 ± 0.4
Test Cycle Parameter Tank 3P
(Treatment)
Tank 4P
(Treatment) Tank 5P
2
Total Suspended Solids (mg/L) 2.3 ± 0.2 4.3 ± 0.2 3.7 ± 0.1
Percent Transmittance - Filtered 90.3 ± 0.2 90.2 ± 0.5 90.8 ± 0.3
Percent Transmittance - Unfiltered 89.3 ± 0.1 88.4 ± 0.3 85.5 ± 0.2
Non-Purgeable Organic Carbon (mg/L) 2.8 ± 0.2 2.7 ± 0.1 2.9 ± 0.0
Dissolved Organic Carbon (mg/L) 2.6 ± 0.0 2.8 ± 0.2 2.7 ± 0.1
Particulate Organic Carbon (mg/L) 0.1 ± 0.2 0.0 ± 0.1 0.2 ± 0.1
Particulate Organic Matter (mg/L) 0.5 ± 0.1 0.4 ± 0.2 < MDL
Mineral Matter (mg/L) 2.2 ± 0.4 4.4 ± 0.1 3.5 ± 0.2
Test Cycle Parameter Tank 3P
(Treatment)
Tank 4P
(Treatment) Tank 5P
3
Total Suspended Solids (mg/L) 1.2 ± 0.1 3.0 ± 0.0 3.3 ± 0.2
Percent Transmittance - Filtered 68.3 ± 0.3 68.1 ± 0.2 61.2 ± 0.2
Percent Transmittance - Unfiltered 67.0 ± 0.2 67.0 ± 0.1 58.2 ± 0.1
Non-Purgeable Organic Carbon (mg/L) 5.8 ± 0.1 6.0 ± 0.0 6.7 ± 0.1
Dissolved Organic Carbon (mg/L) 5.8 ± 0.1 5.8 ± 0.2 6.2 ± 0.0
Particulate Organic Carbon (mg/L) < MDL < MDL 0.5 ± 0.1
Particulate Organic Matter (mg/L) < MDL < MDL 1.0 ± 0.3
Mineral Matter (mg/L) 1.2 ± 0.1 3.0 ± 0.0 2.3 ± 0.4
Test Cycle Parameter Tank Volume
Equivalent #1
Tank Volume
Equivalent #2
Tank Volume
Equivalent #3
4
Total Suspended Solids (mg/L)
No water chemistry samples collected due to truncated
sampling plan.
Percent Transmittance - Filtered
Percent Transmittance - Unfiltered
Non-Purgeable Organic Carbon (mg/L)
Dissolved Organic Carbon (mg/L)
Particulate Organic Matter (mg/L)
Mineral Matter (mg/L)

Results of Shipboard Approval Tests of BWT Systems in Freshwater
43
UNCLAS//Public | CG-926 R&DC | Cangelosi, et al. | Public
November 2014
Figure 16. Test Cycle 1-4 intake and discharge concentrations of total suspended solids. *Tank 3P and 4P
were treated during Test Cycles 2 and 3.
INTAKE
10
{)
Test Cvcle 1 Test Cycle 2 Test Cycle 3
DISCHARGE
10
10
0 ~~--------------------~ Test Cvde 1
IQ Acquisition Directorate 'W Research & D evelopment Center
Test Cycle 2
Test Cycle 4
• Tank 2P
Tank 3P
Tank SP
TVE#l
• TVE#2
• TVE#3
12 m1/L T3r&et
• Tank2P
Tank 3P*
• Tank4P*
TankSP
Test Cycle 3
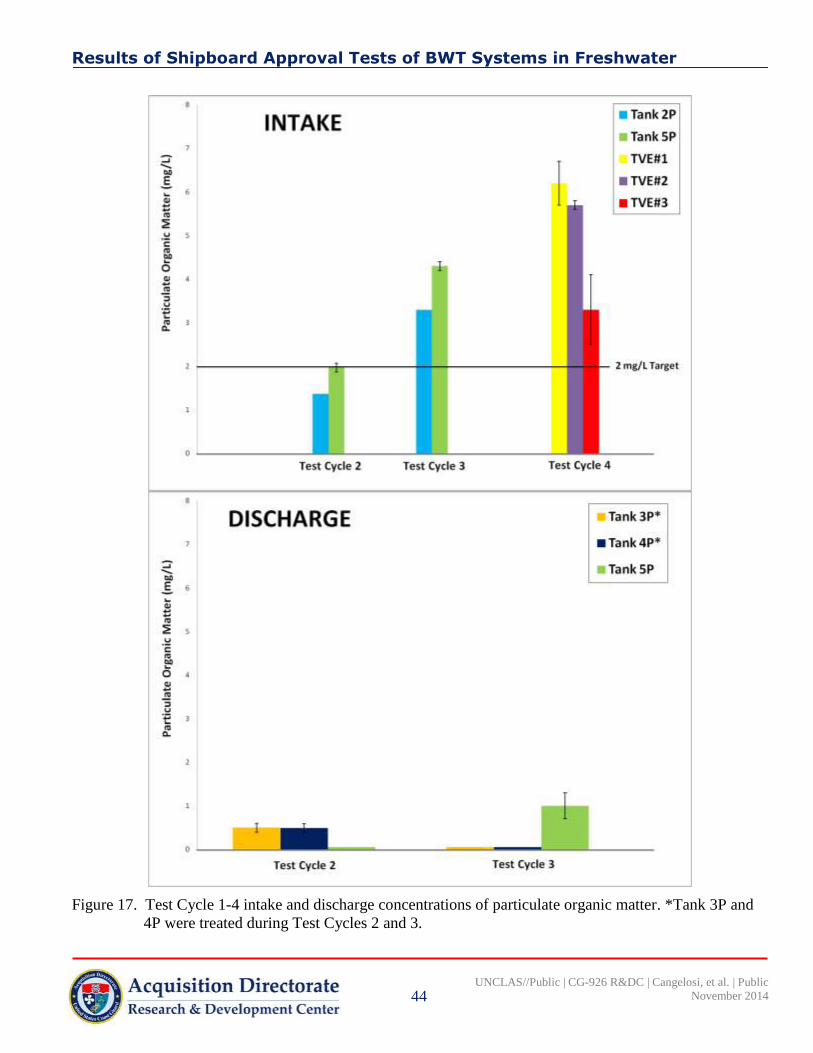
Results of Shipboard Approval Tests of BWT Systems in Freshwater
44
UNCLAS//Public | CG-926 R&DC | Cangelosi, et al. | Public
November 2014
Figure 17. Test Cycle 1-4 intake and discharge concentrations of particulate organic matter. *Tank 3P and
4P were treated during Test Cycles 2 and 3.
-.... ........ ao
7
7
E , .. G.l t: Ill
:E -.~ c: ~ .. 0 .j
~ Ill :; u ·e J Ill Q.
INTAKE
Test Cycle 2
DISCHARGE
Test Cycle 2
IQ Acquisition Directorate 'W Research & D evelopment Center
1
Test Cyc.le 3
• Tank 2P
Tank SP
TVE#l
• TVE#2
• TVE#3
2 mg/l Target
Test Cycle 4
Tank3P*
• Tank4P*
Tank SP
Test Cycle 3

Results of Shipboard Approval Tests of BWT Systems in Freshwater
45
UNCLAS//Public | CG-926 R&DC | Cangelosi, et al. | Public
November 2014
Figure 18. Test Cycle 1-4 intake and discharge concentrations of percent transmittance - filtered. *Tank 3P
and 4P were treated during Test Cycles 2 and 3.
100
INTAKE
80
I= ~ "1:1 Ill 61) ... ~ ..:: . Cl \,)
c:
t! <II) ·e .... c:
~ .... c: Ql ~ 21) Ql Q,
0
Test Cycle 1 Test Cycle 2
100
DISCHARGE
~ ao
~ ,;:,
~· ~ ~ .... 60
20
0
Test Cycle 1
IQ Acquisition Directorate 'W Research & D evelopment Center
Test Cycle 3
Test Cycle 2
• rank 2P
Tank 3P
Tank SP
TVE#l
• TVE#2
8 TVE#3
I
Test Cycle 4
Test Cycle 3
• Tank2P
• Tank3P•
• Tank 4P*
Tank SP

Results of Shipboard Approval Tests of BWT Systems in Freshwater
46
UNCLAS//Public | CG-926 R&DC | Cangelosi, et al. | Public
November 2014
Figure 19. Test Cycle 1-4 intake and discharge concentrations of percent transmittance - unfiltered. *Tank
3P and 4P were treated during Test Cycles 2 and 3.
100
INTAKE I .
~ 8Q
"tt ~ ~ i:i= c:
:::> 60 ' ~ ... &:;; , .; E "' &:;; 40 , ~ i: ~ u ... G.l
0..
20
0
Test Cycle 1 Test Cycle 2
100
DISCHARGE
~ 10
"g
~ 8 ii; &:;;
60 :::> ' ~ u c ~ e "' 40 c ~ -c Ql ... ~ 0..
10
0
Test Cycle 1
IQ Acquisition Directorate 'W Research & D evelopment Center
I
Test Cycle 3
Test Cycle 2
• Tank2P
Tank3P
TankSP
TVE#Il
• TVEII2
• TVEII3
Test Cycle 4
Test Cycle 3
• Tank ZP
• Tan k 3P*
• Tank4P*
Tank SP

Results of Shipboard Approval Tests of BWT Systems in Freshwater
47
UNCLAS//Public | CG-926 R&DC | Cangelosi, et al. | Public
November 2014
Figure 20. Test Cycle 1-4 intake and discharge concentrations of mineral matter. *Tank 3P and 4P were
treated during Test Cycles 2 and 3.

Results of Shipboard Approval Tests of BWT Systems in Freshwater
48
UNCLAS//Public | CG-926 R&DC | Cangelosi, et al. | Public
November 2014
Figure 21. Test Cycle 1-4 intake and discharge concentrations of non-purgeable organic carbon. *Tank 3P
and 4P were treated during Test Cycles 2 and 3.
INTAKE
:::; "ba .§. 6 c: 0
..0 ... ~ .~ c:
!a 0 41 ::c nl 41
I l ~ I ~ a. C: 0 z
Test Cycle 1 Test Cycle 2
• DISCHARGE
I
0
Test Cyde 1
IQ Acquisition Directorate 'W Research & D evelopment Center
Test Cycle 3 Test Cycle 4
I
Test Cycle 2 Test Cycle 3
• Tank2P
Tank3P
Tank SP
TVE#l
• TVE#2
• TVE#3
• Ta nk 2P
Ta nk 3P•
• Tank4P'
Tank SP
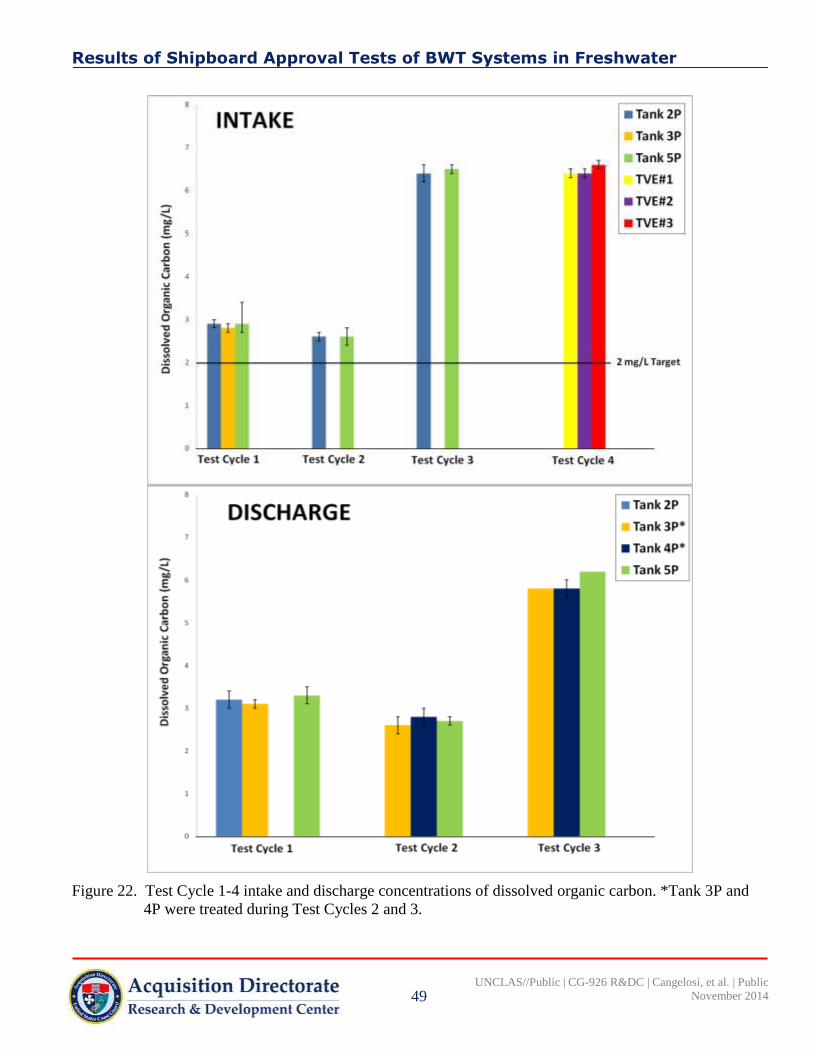
Results of Shipboard Approval Tests of BWT Systems in Freshwater
49
UNCLAS//Public | CG-926 R&DC | Cangelosi, et al. | Public
November 2014
Figure 22. Test Cycle 1-4 intake and discharge concentrations of dissolved organic carbon. *Tank 3P and
4P were treated during Test Cycles 2 and 3.
INTAKE
' ::; -.. bll .§. ~
c: 0 ~ ... ., u • .... ·c: ~
I I ... 0 'C
I Gl ~ 0 "' "' 2 0
Test Cycle 1 Test Cycle 2
DISCHARGE 7
0
Test Cycle 1
IQ Acquisition Directorate 'W Research & D evelopment Center
l
Te5t Cytle 3 Test Cycle 4
I
Test Cycle 2 Test Cycle 3
• Tank 2P]
Tank 3P
Tank 5P
TVE#l
2 mg/l Target
• Tank2P
Tank3P*
• Tank 4P*
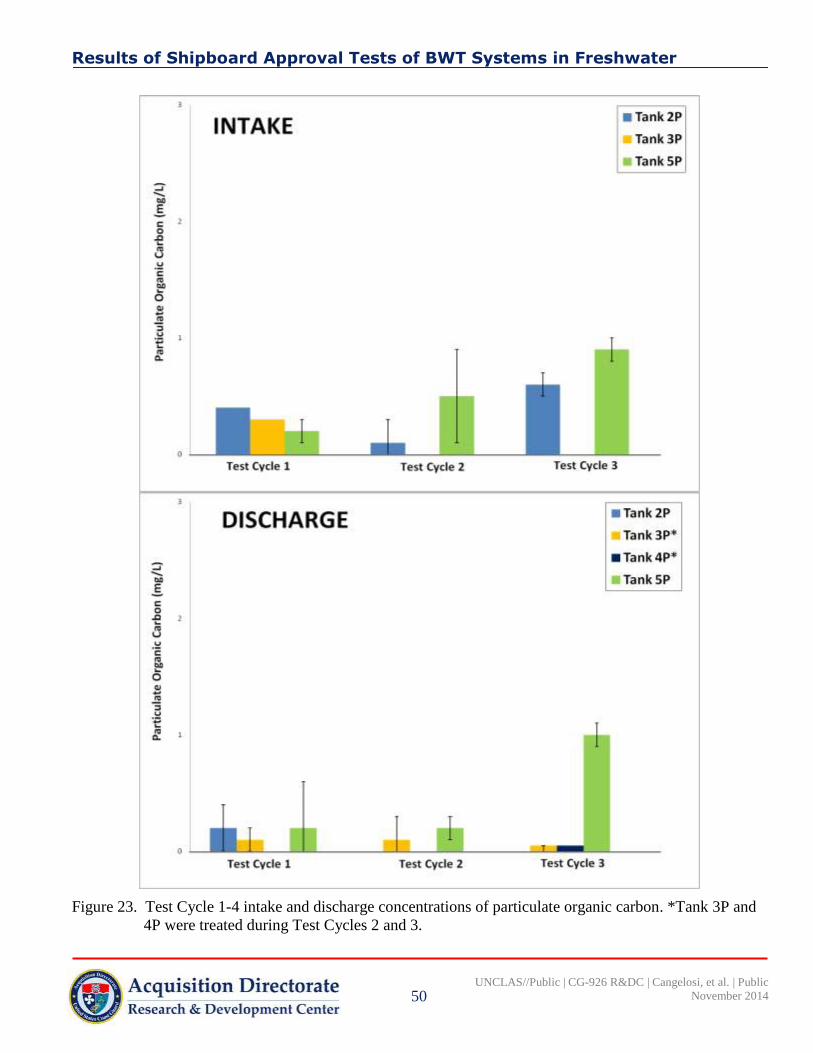
Results of Shipboard Approval Tests of BWT Systems in Freshwater
50
UNCLAS//Public | CG-926 R&DC | Cangelosi, et al. | Public
November 2014
Figure 23. Test Cycle 1-4 intake and discharge concentrations of particulate organic carbon. *Tank 3P and
4P were treated during Test Cycles 2 and 3.
INTAKE
0
Test Cycle 1
DISCHARGE
= ........ 1>11 E
0
Test Cycle 1
IQ Acquisition Directorate 'W Research & D evelopment Center
Test Cycle 2
I Test Cycle 2
[
• Tank2P
Tank 3P
Tank SP
Test Cyde 3
Test Cycle 3
• Tank2P
Tank3P*
• Tank4P*
Tank SP

Results of Shipboard Approval Tests of BWT Systems in Freshwater
51
UNCLAS//Public | CG-926 R&DC | Cangelosi, et al. | Public
November 2014
3.3.3 Other Water Quality Parameters
3.3.3.1 Intake
Table 14 and Figures 24–31 summarize TC 1-4 intake water quality parameters measured using calibrated
YSI Multiparameter Water Quality Sondes (including temperature, specific conductivity, salinity, pH,
turbidity, total chlorophyll and dissolved oxygen) and the p3SFS’s in-line temperature and turbidity sensors
(Figure 32). Across all TCs, where data were available, intake targets were met for temperature and salinity
(Table 14). However, the temperature and turbidity data reported by the YSI Sondes and p3SFS in-line
sensors are not comparable (Table 14; Figures 24 and 28). The p3SFS temperature sensor was either not
functioning or was out of calibration. For TC2 tank 2P, Table 14 and Figure 24 only report p3SFS in-line
sensor data for temperature after the ballasting pause because data measured prior to the pause were erased.
For TC3, no readings were obtained from the p3SFS in-line turbidity sensor because the turbidity probe
malfunctioned (Table 14; Figure 28). In addition, the specific conductivity and salinity data measured using
YSI Sondes for the two tanks sampled during TC3 intake are erroneous and therefore not reported (Table
14; Figures 25 and 26). The root cause of this error is unknown, but may be due to a recording error,
malfunction of the Sonde and/or a calibration issue.
3.3.3.2 Discharge
Table 15 and Figures 24–31 summarize TC 1-4 discharge water quality parameters measured using
calibrated YSI Multiparameter Water Quality Sondes (including temperature, specific conductivity, salinity,
pH, turbidity, total chlorophyll and dissolved oxygen) and the p3SFS’s in-line sensors (temperature and
turbidity only). There was no continuous, in-line electronic data available from the p3SFS’ sensors for
temperature or turbidity for TC1 discharge due to an error in the formatting of the SD card to which the
electronic data were transferred. Values from the p3SFS control screen were recorded by hand and are
provided in Table 15 and Figures 24 and 28. As with TC3 intake measurements, the specific conductivity
and salinity data from the YSI Sondes for all three tanks sampled on discharge are erroneous and are not
reported (Table 15; Figures 25 and 26). Similarly, for this TC, no p3SFS readings for turbidity were
available because the turbidity probe had failed (Table 15; Figure 28).
Overall, temperature data measured by the p3SFS’s in-line sensors and the YSI Sondes were somewhat
consistent with each other, however the turbidity data were not (Table 15; Figures 24 and 28). For TCs 2
and 3, there were several differences between treated and untreated discharge water quality parameters,
including salinity, turbidity and dissolved oxygen/percent saturation (Table 15; Figures 24, 25, 30 and 31).

Results of Shipboard Approval Tests of BWT Systems in Freshwater
52
UNCLAS//Public | CG-926 R&DC | Cangelosi, et al. | Public
November 2014
Table 14. Water quality parameters (Average ± Standard Deviation) measured by YSI Multiparameter Sondes and the p3SFS in-line sensors
during Test Cycles 1–4 intake operations.
Parameter Measurement Device Challenge Target Valid Range Test Cycle 1 Test Cycle 2 Test Cycle 3 Test Cycle 4
Temperature ( C) YSI Multiparameter Sonde
2-35 31.36 ± 0.72 17.38 ± 0.08 25.95 ± 0.78 12.03 ± 1.06
p3SFS In-Line Sensor 24.0 ± 0.0 15.0 ± 0.2 20.6 ± 0.0 13.4 ± 0.5
Specific Conductivity (mS/cm) YSI Multiparameter Sonde No requirement 0.416 ± 0.003 0.325 ± 0.001 Not reported 0.129 ± 0.123
Salinity (ppt) YSI Multiparameter Sonde < 1 (for freshwater) 0.20 ± 0.01 0.16 ± 0.00 Not reported 0.06 ± 0.06
pH YSI Multiparameter Sonde No requirement 8.06 8.74 8.07 7.57
Turbidity (NTU) YSI Multiparameter Sonde
No requirement 6.5 ± 1.8 12.6 ± 1.6 8.1 ± 2.1 45.5 ± 12.2
p3SFS In-Line Sensor 14.7 ± 9.3 90.5 ± 12.0 No logged data 205.3 ± 59.2
Total Chlorophyll (µg/L) YSI Multiparameter Sonde No requirement 10.0 ± 1.0 4.0 ± 0.2 3.8 ± 0.4 2.1 ± 0.3
Dissolved Oxygen (% Saturation) YSI Multiparameter Sonde No requirement 94.3 ± 0.2 76.2 ± 0.3 93.4 ± 1.3 85.3 ± 1.6
Dissolved Oxygen (mg/L) YSI Multiparameter Sonde No requirement 6.95 ± 0.07 7.27 ± 0.05 7.58 ± 0.21 9.14 ± 0.35
Table 15. Water quality parameters (Average ± Standard Deviation) measured by YSI Multiparameter Sondes and the p3SFS in-line sensors
during Test Cycles 1–4 discharge operations.
Parameter Measurement Device Test Cycle 1
Test Cycle 2 Test Cycle 3
Test Cycle 4 Mock-
Treatment (5P)
Treatment (3P
and 4P)
Mock-
Treatment (5P)
Treatment
(3P and 4P)
Temperature ( C) YSI Multiparameter Sonde 25.21 ± 0.02 12.77 12.62 ± 0.29 19.91 21.01 ± 0.25 9.15 ± 0.47
p3SFS In-Line Sensor 21.42 ± 0.2 12.8 ± 0.2 12.8 ± 0.1 18.2 ± 0.6 17.8 ± 0.0 11.8 ± 1.5
Specific Conductivity (mS/cm) YSI Multiparameter Sonde 0.390 ± 0.003 0.327 0.787 ± 0.026 Not reported Not reported 0.157 ± 0.064
Salinity (ppt) YSI Multiparameter Sonde 0.19 ± 0.01 0.16 0.39 ± 0.01 Not reported Not reported 0.08 ± 0.04
pH YSI Multiparameter Sonde 8.05 8.01 8.03 7.75 7.78 7.86
Turbidity (NTU) YSI Multiparameter Sonde 2.5 ± 0.3 4.3 3.7 ± 0.8 3.0 3.0 ± 0.6 14.1 ± 0.4
p3SFS In-Line Sensor 9.7 ± 5.5 28 ± 14 38.5 ± 9.2 No logged data No logged data 57.6 ± 2.1
Total Chlorophyll (µg/L) YSI Multiparameter Sonde 4.3 ± 0.3 2.0 1.7 ± 0.1 1.8 1.3 ± 0.3 1.3 ± 0.1
Dissolved Oxygen
(% Saturation) YSI Multiparameter Sonde 94.8 ± 0.9 66.5 72.6 ± 1.8 70.1 77.9 ± 4.8 87.0 ± 4.1
Dissolved Oxygen (mg/L) YSI Multiparameter Sonde 7.79 ± 0.07 7.01 7.69 ± 0.24 6.36 6.91 ± 0.40 10.00 ± 0.37

Results of Shipboard Approval Tests of BWT Systems in Freshwater
53
UNCLAS//Public | CG-926 R&DC | Cangelosi, et al. | Public
November 2014
Figure 24. Test Cycle 1-4 intake and discharge temperature measurements (measured using a
Multiparameter Sonde and the p3SFS in-line sensor).
Figure 25. Test Cycle 1-4 intake and discharge specific conductivity measurements (measured using a YSI
Multiparameter Sonde).

Results of Shipboard Approval Tests of BWT Systems in Freshwater
54
UNCLAS//Public | CG-926 R&DC | Cangelosi, et al. | Public
November 2014
Figure 26. Test Cycle 1-4 intake and discharge salinity measurement (measured using a YSI
Multiparameter Sonde).
Figure 27. Test Cycle 1-4 intake and discharge pH measurements (measured using a YSI
Multiparameter Sonde).

Results of Shipboard Approval Tests of BWT Systems in Freshwater
55
UNCLAS//Public | CG-926 R&DC | Cangelosi, et al. | Public
November 2014
Figure 28. Test Cycle 1-4 intake and discharge turbidity measurements (measured using a Multiparameter
Sonde and the p3SFS in-line sensor).
Figure 29. Test Cycle 1-4 intake and discharge total chlorophyll measurements (measured using a YSI
Multiparameter Sonde).

Results of Shipboard Approval Tests of BWT Systems in Freshwater
56
UNCLAS//Public | CG-926 R&DC | Cangelosi, et al. | Public
November 2014
Figure 30. Test Cycle 1-4 intake and discharge dissolved oxygen (percent saturation) measurements
(measured using a YSI Multiparameter Sonde).
Figure 31. Test Cycle 1-4 intake and discharge dissolved oxygen measurements (measured using a YSI
Multiparameter Sonde).

Results of Shipboard Approval Tests of BWT Systems in Freshwater
57
UNCLAS//Public | CG-926 R&DC | Cangelosi, et al. | Public
November 2014
Figure 32. AquaSensors display on the p3SFS showing the in-line temperature and turbidity data in real
time.
3.3.4 Biology
The densities of live zooplankton reported in this section are subject to error due to a malfunction in the
p3SFS flow meter detected after the tests reported here were completed. All other values are based on
whole water samples, and are therefore considered accurate.
3.3.4.1 Organisms ≥ 50 µm19
The density of live organisms ≥ 50 μm in intake samples was above the challenge target of 10,000/m3 for
TCs 1–3 (Table 16; Figure 33). For TC4, the density of organisms in this size class exceeded the winter
challenge target of 1,000/m3
(Table 16; Figure 33). In all TCs the organisms ≥ 50 μm also met the
requirements for challenge water diversity (Figure 34). Dominant taxa within the zooplankton community
varied across TCs (Figure 35).
On discharge, live densities of organisms ≥ 50 μm in untreated discharge ranged from > 400,000/m3 in TC3
to < 12,000 /m3 in TC4 (Table 17 and Figure 33). In some cases overall densities, driven by rotifer
reproduction, were higher in discharge than intake (Figure 35). In the treated tanks (TC2 and TC3), live
organism densities declined by 87 % and 93 % compared to the intake densities, primarily due to the loss of
rotifers (Figure 35).
19
All densities based on assumption that p3SFS flow meter was accurately recording flow rates.

Results of Shipboard Approval Tests of BWT Systems in Freshwater
58
UNCLAS//Public | CG-926 R&DC | Cangelosi, et al. | Public
November 2014
3.3.4.2 Organisms ≥ 10 and < 50 µm
The density of live organisms ≥ 10 μm and < 50 μm in intake samples was above the challenge target of 500
cells/mL for TCs 1 and 3 and below the challenge target for TCs 2 and 4 (Table 16; Figure 36). Although
the community composition of organisms ≥ 10 μm and < 50 μm in intake samples varied across TCs, at least
five species from at least three different phyla occurred in all intake samples, meeting target diversity
challenge conditions.
On discharge, live organism densities in the ≥ 10 and < 50 μm size class are reported in Table 17 and Figure
36. A treatment effect was not detected in TC2, but in TC3 organism densities were one order of magnitude
lower in treated versus untreated samples. Still, treated samples live organism densities exceeded the
discharge standard by one order of magnitude (Table 17; Figure 36). Time-integrated discharge samples
were collected during TC4 for analysis of organisms in the ≥ 10 and < 50 μm size class, but they were not
analyzed because of the drip sampler malfunction.
3.3.4.3 Organisms < 10 µm
TCs 1-3 intake samples contained concentrations of culturable, aerobic heterotrophic bacteria which
exceeded the minimum challenge condition of 500 per mL using the SimPlate® and spread plate analysis
methods (Table 16; Figures 37 and 38). TC4 was truncated and no time-integrated samples were collected
for analysis of organisms in the < 10 μm size class (Table 16; Figure 38). Densities of E. coli, total coliform
bacteria and Enterococcus spp., i.e., fecal contamination indicator organisms, were generally moderate to
low (Table 16; Figure 39-41).
Discharge densities of organisms < 10 μm are reported in Table 17 and Figures 37 to 41. Heterotrophic
bacteria, as measured by the SimPlate® method, ranged from 490 MPN/mL to 153,000 MPN/mL during
TCs 1–3, with treated and untreated samples during TC2 and TC3 not substantially different from one
another (Table 17; Figure 37). In comparison, discharge heterotrophic bacteria densities measured by the
spread plate method ranged from 935 CFU/mL to 31,900 CFU/mL; densities were slightly higher in
untreated samples than treated samples during TC2 and TC3 (Table 17; Figure 38). Densities of E. coli, total
coliform bacteria and Enterococcus spp., were extremely low on intake and (Table 17 and Figures 39 – 41).

Results of Shipboard Approval Tests of BWT Systems in Freshwater
59
UNCLAS//Public | CG-926 R&DC | Cangelosi, et al. | Public
November 2014
Figure 33. Test Cycle 1-4 intake and discharge concentrations of live organisms ≥ 50 µm. *Tanks 3P and
4P were treated during Test Cycles 2 and 3.
4.!0.000
!.!0.000
!f\3.000
"' ~ '2 100,000 , ~ 0 Qj tloO.ooo :> ::;
JOO,OOO
10.000
0
•00.000
lSOOOO
E ::s. 100.000
0 Ln 1\1 "' 250.000
E "' '2 ~ 200000 ~
0 Cll .:= 150.0~ _,
1000:.~
50000
0
INTAKE
I Test Cycle l Test Cyde Z
DISCHARGE
TeSlCyde 1 Test Cycle 2
IQ Acquisition Directorate 'W Research & D evelopment Center
Test Cyc:le 3
Test Cycle 3
• Tank 2P I Tank3P
TllnkSP
TVEifl
• TVEif2
• rvu3
Test Cycle 4
• Tank 2P
Tank 3P*
• Tank4P•
Tank SP
TVEIH
• TVE#2
Test Cycle 4
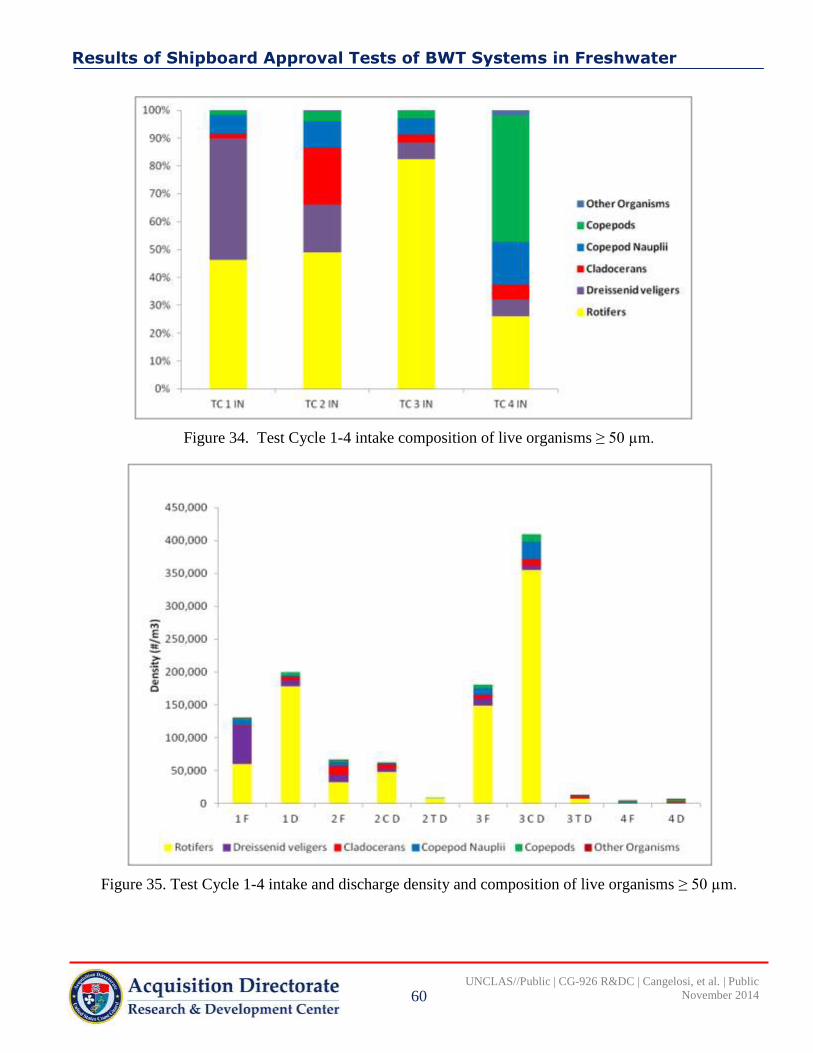
Results of Shipboard Approval Tests of BWT Systems in Freshwater
60
UNCLAS//Public | CG-926 R&DC | Cangelosi, et al. | Public
November 2014
Figure 34. Test Cycle 1-4 intake composition of live organisms ≥ 50 µm.
Figure 35. Test Cycle 1-4 intake and discharge density and composition of live organisms ≥ 50 µm.

Results of Shipboard Approval Tests of BWT Systems in Freshwater
61
UNCLAS//Public | CG-926 R&DC | Cangelosi, et al. | Public
November 2014
Figure 36. Test Cycle 1-4 intake and discharge concentrations of live organisms ≥ 10 µm and < 50 µm.
*Tanks 3P and 4P were treated during Test Cycles 2 and 3.
S,OOO
INTAKE
•ooo
E :I. 3.000 0 Ll'l v ~ r:; 1'0 0 ~
i\1 ~.000
"' E .l!l c; 1'0 IIIII .. 0
1,000 GJ .2: ......
ll • T I!St Cycle 1 Test Cyde 2
!..000
DISCHARGE
•.ooo
E ::s.
0 Ll'l v ),000
~ c 1'0 0 ~
i\1
"' E l.OOO "' ' i: 1'0
to 0 GJ >
::J ),000
0 II Test Cycle 1
IQ Acquisition Directorate 'W Research & D evelopment Center
Testtyde 3
-Test Cycle 2
• Tank2P
Tank3P
TankSP
TVElll
• TVE#2
• TVE#3
Test Cycle 4
Test Cycle 3
• rank2P
Tank3P~
• rank4P•
TankSP

Results of Shipboard Approval Tests of BWT Systems in Freshwater
62
UNCLAS//Public | CG-926 R&DC | Cangelosi, et al. | Public
November 2014
Figure 37. Test Cycle 1-4 intake and discharge concentrations of total heterotrophic bacteria measured
using the SimPlate® Method of Analysis.*Tanks 3P and 4P were treated during Test Cycles 2
and 3.
t6CIOOO
INTAKE
Test C-yde 1
160.0110
• lA
DISCHARGE Q) ... , n: E ii; U0.003
aD c 'iii :;:, ~
E -z CL
~ 10.000
, ·;: Q)
ti , co u :.c
40.000 CL 0 ... ... 0 ... Q) ... Q)
::1:
0
Test Cycle 1
IQ Acquisition Directorate 'W Research & D evelopment Center
1.
Test Cycle Z
T~st Cycle 2
..
a TankZP
Tank 3P
Tank SP
Test Cyde 3
• rank 2P
Tank 3~
• rank 4P ..
Tank SP
_.
Te$t Cyde 3

Results of Shipboard Approval Tests of BWT Systems in Freshwater
63
UNCLAS//Public | CG-926 R&DC | Cangelosi, et al. | Public
November 2014
Figure 38. Test Cycle 1-4 intake and discharge concentrations of total heterotrophic bacteria measured
using the spread plate method of analysis. *Tanks 3P and 4P were treated during Test Cycles 2
and 3.
INTAKE
0 Te$tCyde 1
OOC«J
.... DISCHARGE "' " tV ii: '0 1:.0.000 fll e. ... a. "" Clll c: 7i lOOOOl :I ~
E ........ =:1 ... ~
j<,()D')()
..!! ~ .. u
"' Ill ..!:! • l<»fW a. ~ 0 ~ ~
:X :.0 J
0 Test Cycle 1
Acquisition Directorate Research & D evelopment Center
Te5t Cyde 2
Test Cycle 2
Tt>st Cycle 3
• Tal'lk 2PI T01nk lP
Tank SP
8 Tank 2P
Tank 3P•
8 Tank4P•
Tank SP
Test Cycle 3
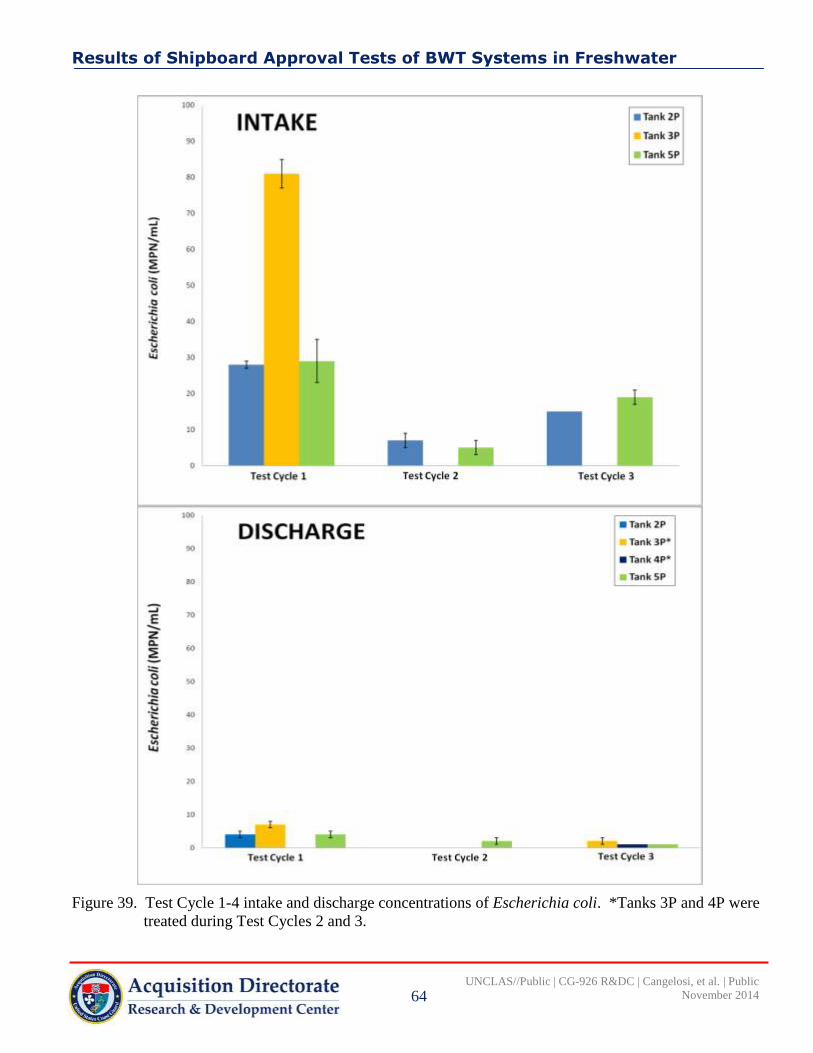
Results of Shipboard Approval Tests of BWT Systems in Freshwater
64
UNCLAS//Public | CG-926 R&DC | Cangelosi, et al. | Public
November 2014
Figure 39. Test Cycle 1-4 intake and discharge concentrations of Escherichia coli. *Tanks 3P and 4P were
treated during Test Cycles 2 and 3.
100
INTAKE 90
ao l 70 -_.
E -z 60 a. ~ ::::
50 e ~ -'= ~ ... 41)
Ql -'= ... -n JO I
lO
10
0
Test Cyc:Je 1
100
DISCHARGE !10
BQ
::; E 10 -z Q.
fi(l ~ :.::: 0 \.1 so ~ ~
·~ 4IJ Ql ~
~ L4,j JO
JO
10
I D
Test cyde 1
IQ Acquisition Directorate 'W Research & D evelopment Center
t"'" ank 3P
ank SP
Test Cycle 2 Test Cycle 3
• Tank 2P
Tank Jp•
• rank4P•
Tank 5P
r I -HiS I Cydc 2 Test Cyele 3

Results of Shipboard Approval Tests of BWT Systems in Freshwater
65
UNCLAS//Public | CG-926 R&DC | Cangelosi, et al. | Public
November 2014
Figure 40. Test Cycle 1-4 intake and discharge concentrations of total coliform bacteria. *Tanks 3P and 4P
were treated during Test Cycles 2 and 3.
1JO'J
INTAKE
1000
"'-'
0
Test Cycle 1
HOO
DISCHARGE
::; 1,000
E -z a. ~ -ftl
-= J.~.oo Qj ... u ftl
CD
E ... g 1.000 0 u iii .. ~ -
- 1
0 Te~t Cycle l
IQ Acquisition Directorate 'W Research & D evelopment Center
Iii Te,tCyde 2
Test Cyde 2
j_
• Tank 2P
I ~anlc 3P
~nkSP
L Test Cyc:le 3
8 Tc1nk 2P J
Tank 3P"
Tank SP
I
Test Cycle 3

Results of Shipboard Approval Tests of BWT Systems in Freshwater
66
UNCLAS//Public | CG-926 R&DC | Cangelosi, et al. | Public
November 2014
Figure 41. Test Cycle 1-4 intake and discharge concentrations of enterococcus spp. *Tanks 3P and 4P were
treated during Test Cycles 2 and 3.
J..$00
INTAKE
~ J(l
:; E ...... z a. ~
ci. I~
a. ... ... ;:, ... ... 0
~ I "10 ~ ~
0 ---Test Cycle 1
DISCHARGE
JOOO
:::;-E -z 0. ~ I \00
a. Q. Ill
"' ::1 I.;
~ l •'!0 I.;
~ ~ c:
l.u
~10
0 TestCyde 1
IQ Acquisition Directorate 'W Research & D evelopment Center
Test Cycle 2
Test Cycle 2
Test Cycle 3
• Tank 2P
Tank 3P
Ti.nk SP
• Tank 2P
Tank 3P'
• Tank4P'
Tank SP
Test Cyde 3

Results of Shipboard Approval Tests of BWT Systems in Freshwater
67
UNCLAS//Public | CG-926 R&DC | Cangelosi, et al. | Public
November 2014
Table 16. Density of organisms (Average ± Standard Error) in intake samples (Test Cycles 1–4). Values marked with an asterisk (*) are outside
the valid range for that parameter.
Test Cycle Parameter Unit Challenge Target
Valid Range Tank 5P Tank 2P Tank 3P
1
Organisms ≥ 50 µm20
Live #/m3 ≥ 10,000/m
3 122,000 144,000 125,000
Organisms ≥ 10 and < 50 µm Live cells/mL ≥ 500/mL 694 1,114 1,112
Organisms < 10 µm -Culturable,
Aerobic Heterotrophic Bacteria
Most probable number (MPN)/mL
(using SimPlates) ≥ 500/mL 153,000 56,700 80,000
Colony forming unit (CFU)/mL
(using Spread Plates) ≥ 500/mL 205,000 90,200 123,000
Total coliform bacteria MPN/100 mL No requirement 1,110 ± 203 1,050 ± 154 1,940 ± 291
Escherichia coli MPN/100 mL No requirement 29 ± 6 28 ± 1 81 ± 4
Enterococcus spp. MPN/100 mL No requirement 9 ± 4 27 ± 16 < 1
Test Cycle Parameter Unit Challenge Target
Valid Range Tank 5P Tank 2P
2
Organisms ≥ 50 µm21
Live #/m3 ≥ 10,000/m
3 58,600 73,700
Organisms ≥ 10 and < 50 µm Live cells/mL ≥ 500/mL 472* 162*
Organisms < 10 µm -Culturable,
Aerobic Heterotrophic Bacteria
MPN/mL (using SimPlates) ≥ 500/mL 5,400 ± 1,778 49,267 ±
11,332
CFU/mL (using Spread Plates) ≥ 500/mL 25,778 ± 4,857 130,200 ±
67,529
Total coliform bacteria MPN/100 mL No requirement 199 ± 18 152 ± 33
Escherichia coli MPN/100 mL No requirement 5 ± 2 7 ± 2
Enterococcus spp. MPN/100 mL No requirement 11 ± 8 6 ± 1
20
Based on assumption that p3SFS flow meter was accurately recording flow rates. 21
As above.
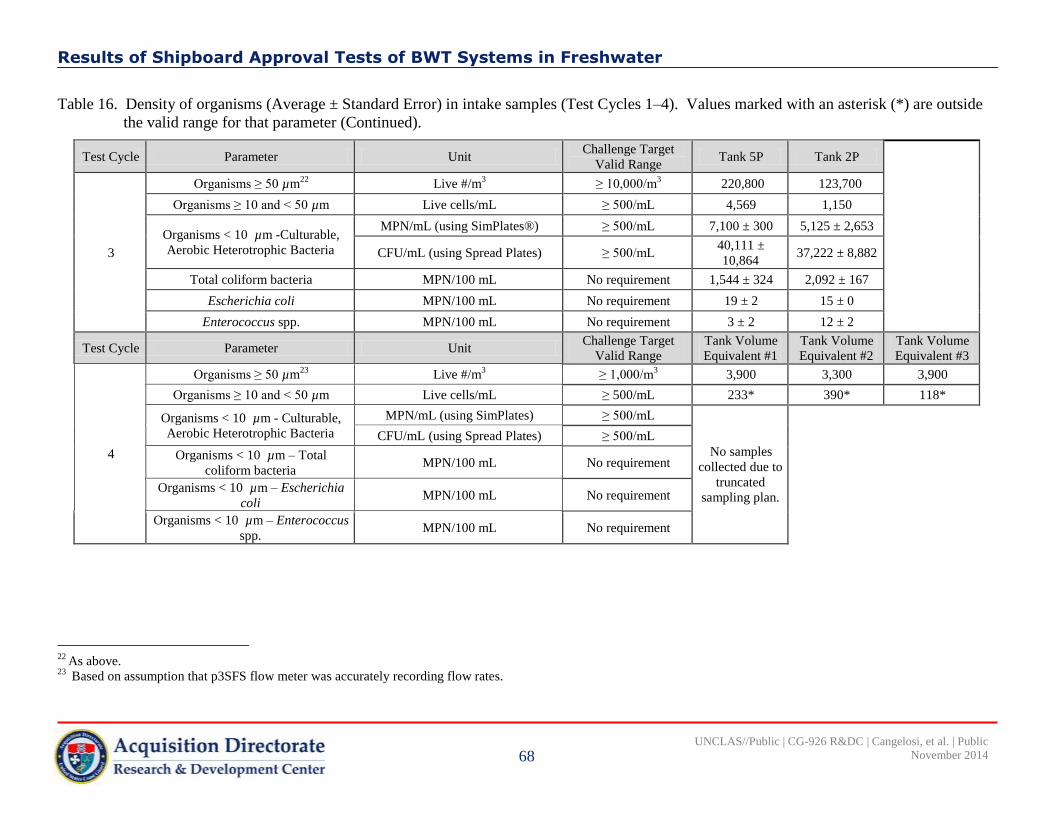
Results of Shipboard Approval Tests of BWT Systems in Freshwater
68
UNCLAS//Public | CG-926 R&DC | Cangelosi, et al. | Public
November 2014
Table 16. Density of organisms (Average ± Standard Error) in intake samples (Test Cycles 1–4). Values marked with an asterisk (*) are outside
the valid range for that parameter (Continued).
Test Cycle Parameter Unit Challenge Target
Valid Range Tank 5P Tank 2P
3
Organisms ≥ 50 µm22
Live #/m3 ≥ 10,000/m
3 220,800 123,700
Organisms ≥ 10 and < 50 µm Live cells/mL ≥ 500/mL 4,569 1,150
Organisms < 10 µm -Culturable,
Aerobic Heterotrophic Bacteria
MPN/mL (using SimPlates®) ≥ 500/mL 7,100 ± 300 5,125 ± 2,653
CFU/mL (using Spread Plates) ≥ 500/mL 40,111 ±
10,864 37,222 ± 8,882
Total coliform bacteria MPN/100 mL No requirement 1,544 ± 324 2,092 ± 167
Escherichia coli MPN/100 mL No requirement 19 ± 2 15 ± 0
Enterococcus spp. MPN/100 mL No requirement 3 ± 2 12 ± 2
Test Cycle Parameter Unit Challenge Target
Valid Range
Tank Volume
Equivalent #1
Tank Volume
Equivalent #2
Tank Volume
Equivalent #3
4
Organisms ≥ 50 µm23
Live #/m3 ≥ 1,000/m
3 3,900 3,300 3,900
Organisms ≥ 10 and < 50 µm Live cells/mL ≥ 500/mL 233* 390* 118*
Organisms < 10 µm - Culturable,
Aerobic Heterotrophic Bacteria
MPN/mL (using SimPlates) ≥ 500/mL
No samples
collected due to
truncated
sampling plan.
CFU/mL (using Spread Plates) ≥ 500/mL
Organisms < 10 µm – Total
coliform bacteria MPN/100 mL No requirement
Organisms < 10 µm – Escherichia
coli MPN/100 mL No requirement
Organisms < 10 µm – Enterococcus
spp. MPN/100 mL No requirement
22
As above. 23
Based on assumption that p3SFS flow meter was accurately recording flow rates.

Results of Shipboard Approval Tests of BWT Systems in Freshwater
69
UNCLAS//Public | CG-926 R&DC | Cangelosi, et al. | Public
November 2014
Table 17. Density of organisms (Average ± Standard Error) in discharge samples (Test Cycles 1–4).
Test
Cycle Parameter Unit Tank 2P Tank 3P Tank 5P
1
Organisms ≥ 50 µm24
Live #/m3 195,000 112,000 292,000
Organisms ≥ 10 and < 50 µm Live cells/mL 315 298 288
Organisms < 10 µm -Culturable, Aerobic
Heterotrophic Bacteria
Most probable number (MPN)/mL
(using SimPlates®) 7,830 ± 590 7,700 ± 300 13,800 ± 1,970
Colony forming unit (CFU)/mL
(using Spread Plates) 19,700 ± 1,090 23,200 ± 1,930 31,900 ± 1,750
Total coliform bacteria MPN/100 mL 83 ± 7 104 ± 11 125 ± 1
Escherichia coli MPN/100 mL 4 ± 1 7 ± 1 4 ± 1
Enterococcus spp. MPN/100 mL 3 ± 1 4 ± 1 3 ± 0
Test
Cycle Parameter Unit Tank 3P (Treatment) Tank 4P (Treatment) Tank 5P
2
Organisms ≥ 50 µm25
Live #/m3 7,100 3,400 61,900
Organisms ≥ 10 and < 50 µm Live cells/mL 116 125 121
Organisms < 10 µm -
Culturable, Aerobic Heterotrophic Bacteria
MPN/mL (using SimPlates) 900 ± 231 490 ± 101 667 ± 503
CFU/mL (using Spread Plates) 1,691 ± 147 1,557 ±300 8,911 ± 4,248
Total coliform bacteria MPN/100 mL 18 ± 4 5 ± 2 54 ± 3
Escherichia coli MPN/100 mL < MDL < MDL 2 ± 1
Enterococcus spp. MPN/100 mL < MDL < MDL 31 ± 14
24
Based on assumption that p3SFS flow meter was accurately recording flow rates. 25
As above.

Results of Shipboard Approval Tests of BWT Systems in Freshwater
70
UNCLAS//Public | CG-926 R&DC | Cangelosi, et al. | Public
November 2014
Table 17. Density of organisms (Average ± Standard Error) in discharge samples (Test Cycles 1–4) (Continued).
Test
Cycle Parameter Unit Tank 3P (Treatment) Tank 4P (Treatment) Tank 5P
3
Organisms ≥ 50 µm26
Live #/m3 8,900 7,600 409,000
Organisms ≥ 10 and < 50 µm Live cells/mL 45 36 255
Organisms < 10 µm -
Culturable, Aerobic Heterotrophic Bacteria
MPN/mL (using SimPlates) 1,567 ± 67 2,175 ± 530 2,733 ± 463
CFU/mL (using Spread Plates) 935 ± 129 1,056 ± 137 3,868 ± 632
Total coliform bacteria MPN/100 mL 50 ± 6 40 ± 4 228 ± 17
Escherichia coli MPN/100 mL 2 ± 1 1± 0 <MDL
Enterococcus spp. MPN/100 mL < MDL < MDL 83 ± 51
Test
Cycle Parameter Unit
Tank Volume
Equivalent #1
Tank Volume
Equivalent #2
Tank Volume
Equivalent #3
4
Organisms ≥ 50 µm27
Live #/m3 10,100 11,800
Aborted due to
unexpected change in
ship ballast operations
Organisms ≥ 10 and < 50 µm Live cells/mL
No samples collected
due to drip-sampler
malfunction.
Organisms < 10 µm -
Culturable, Aerobic Heterotrophic Bacteria
MPN/mL (using SimPlates)
No samples collected
due to truncated
sampling plan.
CFU/mL (using Spread Plates)
Total coliform bacteria MPN/100 mL
Escherichia coli MPN/100 mL
Enterococcus spp. MPN/100 mL
26
As above. 27
Based on assumption that p3SFS flow meter was accurately recording flow rates.

Results of Shipboard Approval Tests of BWT Systems in Freshwater
71
UNCLAS//Public | CG-926 R&DC | Cangelosi, et al. | Public
November 2014
3.4 Characterization of Test Validity Based on Challenge Conditions
According to the ETV DSP, for a TC to be valid, specific physical/chemical and biological challenge water
conditions must be met with minimum target conditions detailed in Tables 5-1 and 5-2 of the protocol
(USEPA, 2012). The ETV DSP states that while challenge water conditions for biological size fractions
must meet the specified target values in four of five valid biological treatment efficacy tests, the fifth test
must contain > 75 % of the specified challenge concentrations (USEPA, 2012). Failure to meet
physical/chemical targets will not invalidate a TC, unless the challenge water conditions are less than half of
the specified targets (USEPA, 2012). As such, GSI target biological and physical/chemical challenge water
requirements for TCs 1 through 4 were consistent with the ETV DSP. However, it should be noted that the
ETV DSP requirement for cells ≥ 10 and < 50 μm in minimum dimension is generally not met in GSI
analyses which measure and report cells ≥ 10 μm in any dimension, consistent with GSI’s USEPA ETV-
audited and accepted SOPs. Target vs. actual measurements for TCs 1-4 across key parameters are detailed
in Tables 12, 14 and 16.
TC1 parameters exceeded target levels except in the area of water chemistry; neither TSS nor POM
minimum challenge water targets were met (Table 12). Only one of the TSS samples, 7.6 mg/L measured in
tank 5P intake, was more than 50 % of the ≥ 12 mg/L target (Table 12). These low TSS and POM values
were likely the result of new ship practices in which the IH ballasts using a high sea chest to reduce
sediment and organism entrainment in ballast.
For TC2, the target POM level of ≥ 2 mg/L was not met, but intake concentrations were more than 50 % of
the target (Table 12). The biological challenge water requirement for the ≥ 10 and < 50 µm size class was
borderline even using the GSI method of counting, and would require a decision from the VO to determine
validity; tank 5P had 470 cell/mL and tank 2P had 160 cells/mL (Table 16). Samples from tank 5P did
contain > 75 % of the specified challenge concentration for organisms ≥ 10 and < 50 µm, however samples
from tank 2P did not (Table 16).
All TC3 physical/chemical and biological challenge water targets were met except for TSS concentrations in
tank 2P (Tables 12, 14 and 16). Failure to meet the TSS target did not invalidate the test since the measured
TSS value of 9.3 mg/L was still more than half of the minimum target value (Table 12).
All TC4 physical/chemical and biological challenge water targets were exceeded except for presumed live
densities of organisms ≥ 10 µm and < 50 µm which were below the target density of 500/mL (Table 12, 14
and 16). Concentrations in the TVEs ranged from 118/mL to 390/mL such that only one of the samples was
greater than 75 % of the specified requirement (Table 16).
3.5 Biological Performance (BWMS) Efficacy
Consistent with the ETV DSP, GSI analyzed treatment discharge data from TCs 2 and 3, the only TCs
where the BWMS was active, against the USCG’s Standards for Living Organisms in Ships’ Ballast Water
Discharged in U.S. Waters (USCG, 2012) to determine the biological treatment efficacy of the prototype
NaOH BWMS. For organisms ≥ 50 µm in minimum dimension, the USCG standard’s maximum
concentration allowable in treatment discharge is less than 10 live organisms per m3 (USCG, 2012; Table
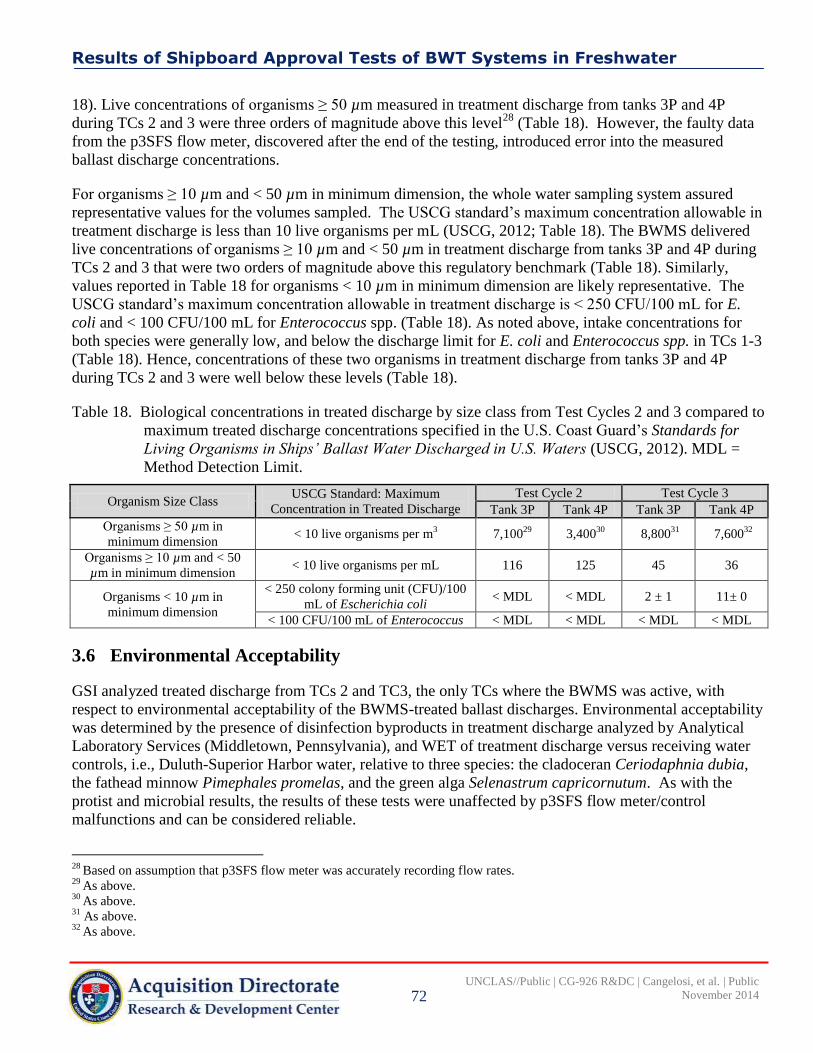
Results of Shipboard Approval Tests of BWT Systems in Freshwater
72
UNCLAS//Public | CG-926 R&DC | Cangelosi, et al. | Public
November 2014
18). Live concentrations of organisms ≥ 50 µm measured in treatment discharge from tanks 3P and 4P
during TCs 2 and 3 were three orders of magnitude above this level28
(Table 18). However, the faulty data
from the p3SFS flow meter, discovered after the end of the testing, introduced error into the measured
ballast discharge concentrations.
For organisms ≥ 10 µm and < 50 µm in minimum dimension, the whole water sampling system assured
representative values for the volumes sampled. The USCG standard’s maximum concentration allowable in
treatment discharge is less than 10 live organisms per mL (USCG, 2012; Table 18). The BWMS delivered
live concentrations of organisms ≥ 10 µm and < 50 µm in treatment discharge from tanks 3P and 4P during
TCs 2 and 3 that were two orders of magnitude above this regulatory benchmark (Table 18). Similarly,
values reported in Table 18 for organisms < 10 µm in minimum dimension are likely representative. The
USCG standard’s maximum concentration allowable in treatment discharge is < 250 CFU/100 mL for E.
coli and < 100 CFU/100 mL for Enterococcus spp. (Table 18). As noted above, intake concentrations for
both species were generally low, and below the discharge limit for E. coli and Enterococcus spp. in TCs 1-3
(Table 18). Hence, concentrations of these two organisms in treatment discharge from tanks 3P and 4P
during TCs 2 and 3 were well below these levels (Table 18).
Table 18. Biological concentrations in treated discharge by size class from Test Cycles 2 and 3 compared to
maximum treated discharge concentrations specified in the U.S. Coast Guard’s Standards for
Living Organisms in Ships’ Ballast Water Discharged in U.S. Waters (USCG, 2012). MDL =
Method Detection Limit.
Organism Size Class USCG Standard: Maximum
Concentration in Treated Discharge
Test Cycle 2 Test Cycle 3
Tank 3P Tank 4P Tank 3P Tank 4P
Organisms ≥ 50 µm in
minimum dimension < 10 live organisms per m
3 7,100
29 3,400
30 8,800
31 7,600
32
Organisms ≥ 10 µm and < 50
µm in minimum dimension < 10 live organisms per mL 116 125 45 36
Organisms < 10 µm in
minimum dimension
< 250 colony forming unit (CFU)/100
mL of Escherichia coli < MDL < MDL 2 ± 1 11± 0
< 100 CFU/100 mL of Enterococcus < MDL < MDL < MDL < MDL
3.6 Environmental Acceptability
GSI analyzed treated discharge from TCs 2 and TC3, the only TCs where the BWMS was active, with
respect to environmental acceptability of the BWMS-treated ballast discharges. Environmental acceptability
was determined by the presence of disinfection byproducts in treatment discharge analyzed by Analytical
Laboratory Services (Middletown, Pennsylvania), and WET of treatment discharge versus receiving water
controls, i.e., Duluth-Superior Harbor water, relative to three species: the cladoceran Ceriodaphnia dubia,
the fathead minnow Pimephales promelas, and the green alga Selenastrum capricornutum. As with the
protist and microbial results, the results of these tests were unaffected by p3SFS flow meter/control
malfunctions and can be considered reliable.
28
Based on assumption that p3SFS flow meter was accurately recording flow rates. 29
As above. 30
As above. 31
As above. 32
As above.
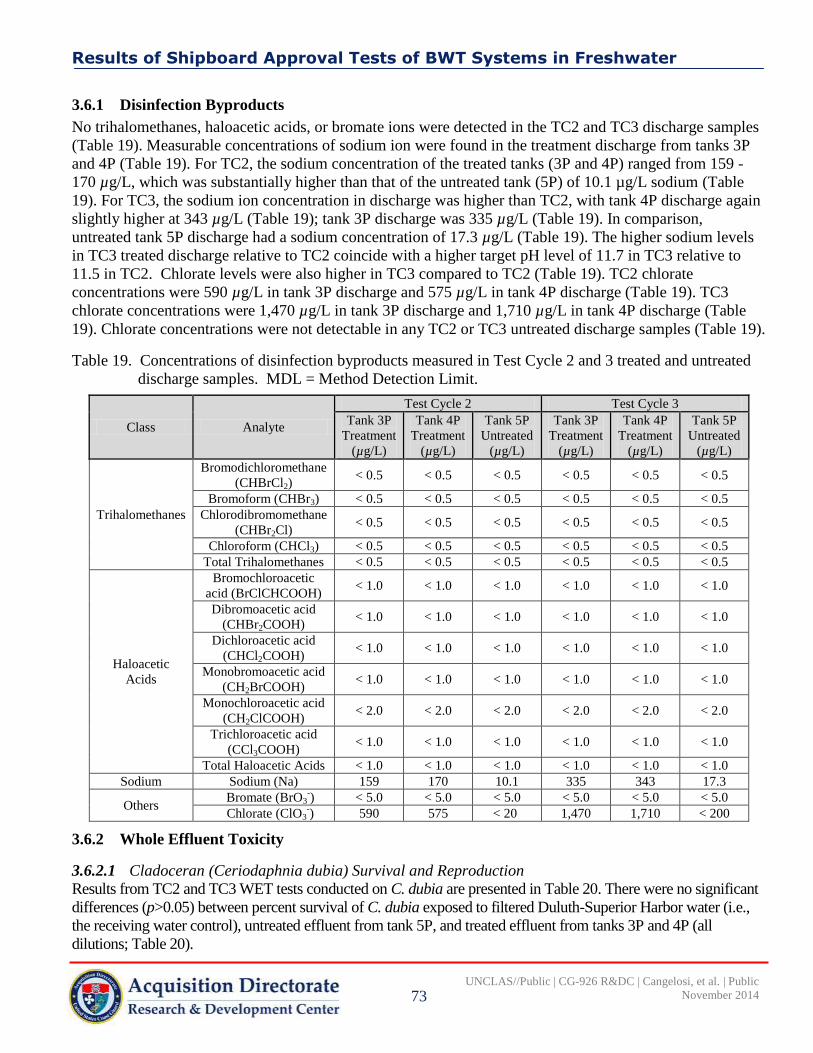
Results of Shipboard Approval Tests of BWT Systems in Freshwater
73
UNCLAS//Public | CG-926 R&DC | Cangelosi, et al. | Public
November 2014
3.6.1 Disinfection Byproducts
No trihalomethanes, haloacetic acids, or bromate ions were detected in the TC2 and TC3 discharge samples
(Table 19). Measurable concentrations of sodium ion were found in the treatment discharge from tanks 3P
and 4P (Table 19). For TC2, the sodium concentration of the treated tanks (3P and 4P) ranged from 159 -
170 µg/L, which was substantially higher than that of the untreated tank (5P) of 10.1 µg/L sodium (Table
19). For TC3, the sodium ion concentration in discharge was higher than TC2, with tank 4P discharge again
slightly higher at 343 µg/L (Table 19); tank 3P discharge was 335 µg/L (Table 19). In comparison,
untreated tank 5P discharge had a sodium concentration of 17.3 µg/L (Table 19). The higher sodium levels
in TC3 treated discharge relative to TC2 coincide with a higher target pH level of 11.7 in TC3 relative to
11.5 in TC2. Chlorate levels were also higher in TC3 compared to TC2 (Table 19). TC2 chlorate
concentrations were 590 µg/L in tank 3P discharge and 575 µg/L in tank 4P discharge (Table 19). TC3
chlorate concentrations were 1,470 µg/L in tank 3P discharge and 1,710 µg/L in tank 4P discharge (Table
19). Chlorate concentrations were not detectable in any TC2 or TC3 untreated discharge samples (Table 19).
Table 19. Concentrations of disinfection byproducts measured in Test Cycle 2 and 3 treated and untreated
discharge samples. MDL = Method Detection Limit.
Class Analyte
Test Cycle 2 Test Cycle 3
Tank 3P
Treatment
(µg/L)
Tank 4P
Treatment
(µg/L)
Tank 5P
Untreated
(µg/L)
Tank 3P
Treatment
(µg/L)
Tank 4P
Treatment
(µg/L)
Tank 5P
Untreated
(µg/L)
Trihalomethanes
Bromodichloromethane
(CHBrCl2) < 0.5 < 0.5 < 0.5 < 0.5 < 0.5 < 0.5
Bromoform (CHBr3) < 0.5 < 0.5 < 0.5 < 0.5 < 0.5 < 0.5
Chlorodibromomethane
(CHBr2Cl) < 0.5 < 0.5 < 0.5 < 0.5 < 0.5 < 0.5
Chloroform (CHCl3) < 0.5 < 0.5 < 0.5 < 0.5 < 0.5 < 0.5
Total Trihalomethanes < 0.5 < 0.5 < 0.5 < 0.5 < 0.5 < 0.5
Haloacetic
Acids
Bromochloroacetic
acid (BrClCHCOOH) < 1.0 < 1.0 < 1.0 < 1.0 < 1.0 < 1.0
Dibromoacetic acid
(CHBr2COOH) < 1.0 < 1.0 < 1.0 < 1.0 < 1.0 < 1.0
Dichloroacetic acid
(CHCl2COOH) < 1.0 < 1.0 < 1.0 < 1.0 < 1.0 < 1.0
Monobromoacetic acid
(CH2BrCOOH) < 1.0 < 1.0 < 1.0 < 1.0 < 1.0 < 1.0
Monochloroacetic acid
(CH2ClCOOH) < 2.0 < 2.0 < 2.0 < 2.0 < 2.0 < 2.0
Trichloroacetic acid
(CCl3COOH) < 1.0 < 1.0 < 1.0 < 1.0 < 1.0 < 1.0
Total Haloacetic Acids < 1.0 < 1.0 < 1.0 < 1.0 < 1.0 < 1.0
Sodium Sodium (Na) 159 170 10.1 335 343 17.3
Others Bromate (BrO3
-) < 5.0 < 5.0 < 5.0 < 5.0 < 5.0 < 5.0
Chlorate (ClO3-) 590 575 < 20 1,470 1,710 < 200
3.6.2 Whole Effluent Toxicity
3.6.2.1 Cladoceran (Ceriodaphnia dubia) Survival and Reproduction
Results from TC2 and TC3 WET tests conducted on C. dubia are presented in Table 20. There were no significant
differences (p>0.05) between percent survival of C. dubia exposed to filtered Duluth-Superior Harbor water (i.e.,
the receiving water control), untreated effluent from tank 5P, and treated effluent from tanks 3P and 4P (all
dilutions; Table 20).

Results of Shipboard Approval Tests of BWT Systems in Freshwater
74
UNCLAS//Public | CG-926 R&DC | Cangelosi, et al. | Public
November 2014
There were significant differences in C. dubia reproduction across sample types. In TC2, reproduction in
the 50 % and 100 % tank 3P treatment groups (16.5 ± 2.8 and 6.4 ± 1.9 young per female, respectively) was
significantly (p<0.05) lower than in the filtered Duluth-Superior Harbor water group, which had an average
number of 27.8 ± 1.8 young per female in three broods (Table 20). There was a similar significant (p<0.05)
difference in the number of young per female between the 12.5 %, 25 %, 50 %, and 100 % treatment groups
from tank 4P (21.0 ± 2.4, 18.3 ± 3.0, 13.8 ± 2.4 and 8.6 ± 1.4 young per female, respectively) and the
filtered Duluth-Superior Harbor water group (Table 20). Reproduction in effluent from the 100 % tank 3P,
and 50 % and 100 % tank 4P groups was significantly (p<0.05) lower than in the untreated whole effluent
from tank 5P group (Table 20). In TC3, there was significantly (p<0.05) less reproduction in the 100 %
exposures from tanks 3P and 4P (7.7 ± 1.0 and 3.6 ± 1.0 young per female, respectively) relative to the
receiving water control (26.9 ± 3.4 young per female; Table 20). C. dubia reproduction in the 100 %
effluent from the two treatment tanks was significantly (p<0.05) less than in the 100 % tank 5P effluent
(26.9 ± 3.3 young per female; Table 20).
Results for temperature and pH, measured daily, and hardness and alkalinity, measured on test termination
day (Day 5), for TC2 and TC3 are presented in Table 21. Temperature ranged from 22.8 ºC to 25.1 ºC
across all treatment groups and TCs, while pH ranged from a minimum of 7.78 in the performance control,
i.e., HRW, to a maximum of 8.91 in TC2’s 100 % effluent from tank 4P (Table 21). Hardness measured
highest in the performance control, followed by the untreated effluent from tank 5P, and lowest in the 100 %
treated effluent from tanks 3P and 4P (Table 21). Conversely, alkalinity measured highest in the 100 %
treated effluent from tanks 3P and 4P, and lowest in the receiving water control (Table 21).
Table 20. Percent survival (Average ± Standard Error; n = 10) and total number of offspring per female
(Average ± Standard Error; n = 10) in a three-brood Ceriodaphnia dubia whole effluent toxicity test
after 5 days exposure to treated and untreated ballast discharge collected during Test Cycles 2 and 3.
Treatment Group Exposure
Solution
Test Cycle 2 Test Cycle 3
Percent
Survival
Total Number of
Young per Female Percent Survival
Total Number of Young
per Female
Performance ControlA N/A 80 ± 13 10.3 ± 2.0 100 ± 0 24.6 ± 1.4
Receiving Water
Control
Filtered Duluth-
Superior
Harbor Water
100 ± 0 27.8 ± 1.8 90 ± 10 26.9 ± 3.3
Tank 5P (Untreated) 100 % 100 ± 0 25.4 ± 2.5 100 ± 0 29.6 ± 2.1
Tank 3P (Treated)
6.25 % 100 ± 0 21.8 ± 4.0 100 ± 0 28.7 ± 1.3
12.5 % 90 ± 10 28.7 ± 2.3 90 ± 10 25.7 ± 1.4
25 % 100 ± 0 24.4 ± 2.2 100 ± 0 20.9 ± 2.5
50 % 100 ± 0 16.5 ± 2.8^ 100 ± 0 21.2 ± 2.3
100 % 100 ± 0 6.4 ± 1.9^* 90 ± 10 7.7 ± 1.0^*
Tank 4P (Treated)
6.25 % 90 ± 10 26.0 ± 1.6 100 ± 0 24.0 ± 1.6
12.5 % 100 ± 0 21.0 ± 2.4^ 90 ± 10 26.0 ± 1.1
25 % 90 ± 10 18.3 ± 3.0^ 100 ± 0 24.8 ± 1.3
50 % 90 ± 10 13.8 ± 2.4^* 100 ± 0 19.0 ± 1.4^*
100 % 100 ± 0 8.6 ± 1.4^* 80 ± 13 3.6 ± 1.0^* A Hard reconstituted water (U.S. Environmental Protection Agency Office of Water, 2002)
^ The difference in average number of young per female are statistically (p<0.05) different from the receiving water control.
* The difference in average number of young per female are statistically (p<0.05) different from the untreated 100 % whole
effluent from tank 5P.
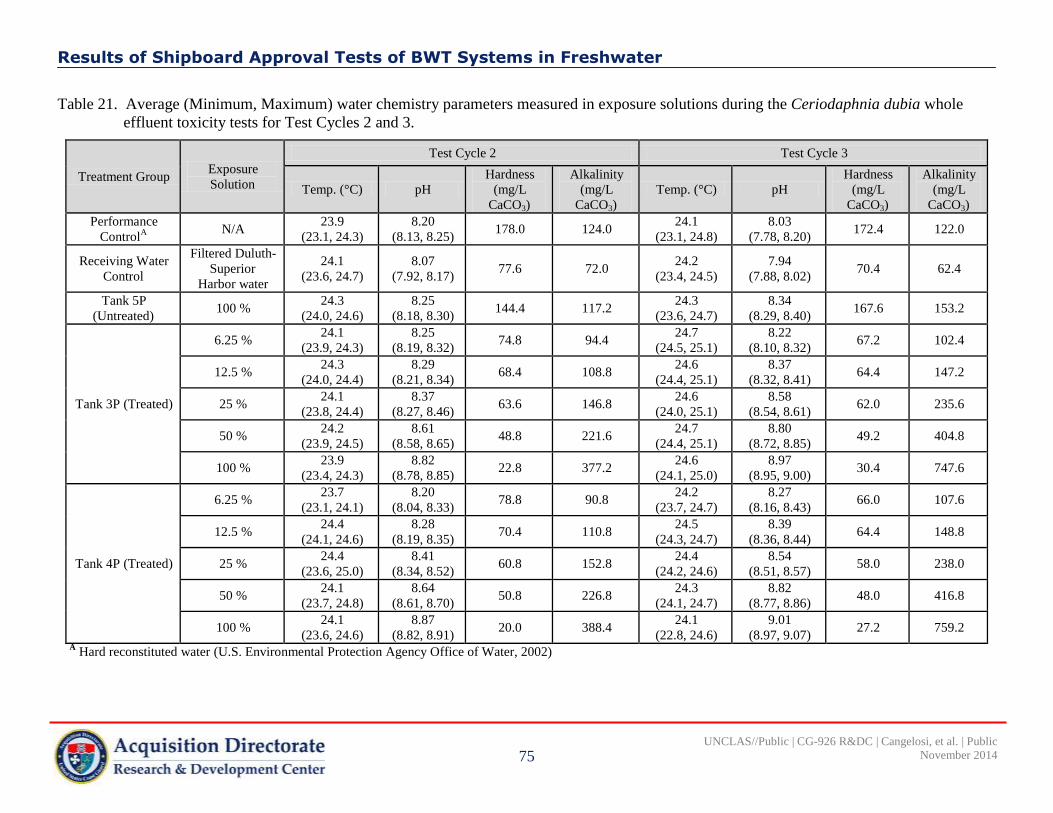
Results of Shipboard Approval Tests of BWT Systems in Freshwater
75
UNCLAS//Public | CG-926 R&DC | Cangelosi, et al. | Public
November 2014
Table 21. Average (Minimum, Maximum) water chemistry parameters measured in exposure solutions during the Ceriodaphnia dubia whole
effluent toxicity tests for Test Cycles 2 and 3.
Treatment Group Exposure
Solution
Test Cycle 2 Test Cycle 3
Temp. (°C) pH
Hardness
(mg/L
CaCO3)
Alkalinity
(mg/L
CaCO3)
Temp. (°C) pH
Hardness
(mg/L
CaCO3)
Alkalinity
(mg/L
CaCO3)
Performance
ControlA
N/A 23.9
(23.1, 24.3)
8.20
(8.13, 8.25) 178.0 124.0
24.1
(23.1, 24.8)
8.03
(7.78, 8.20) 172.4 122.0
Receiving Water
Control
Filtered Duluth-
Superior
Harbor water
24.1
(23.6, 24.7)
8.07
(7.92, 8.17) 77.6 72.0
24.2
(23.4, 24.5)
7.94
(7.88, 8.02) 70.4 62.4
Tank 5P
(Untreated) 100 %
24.3
(24.0, 24.6)
8.25
(8.18, 8.30) 144.4 117.2
24.3
(23.6, 24.7)
8.34
(8.29, 8.40) 167.6 153.2
Tank 3P (Treated)
6.25 % 24.1
(23.9, 24.3)
8.25
(8.19, 8.32) 74.8 94.4
24.7
(24.5, 25.1)
8.22
(8.10, 8.32) 67.2 102.4
12.5 % 24.3
(24.0, 24.4)
8.29
(8.21, 8.34) 68.4 108.8
24.6
(24.4, 25.1)
8.37
(8.32, 8.41) 64.4 147.2
25 % 24.1
(23.8, 24.4)
8.37
(8.27, 8.46) 63.6 146.8
24.6
(24.0, 25.1)
8.58
(8.54, 8.61) 62.0 235.6
50 % 24.2
(23.9, 24.5)
8.61
(8.58, 8.65) 48.8 221.6
24.7
(24.4, 25.1)
8.80
(8.72, 8.85) 49.2 404.8
100 % 23.9
(23.4, 24.3)
8.82
(8.78, 8.85) 22.8 377.2
24.6
(24.1, 25.0)
8.97
(8.95, 9.00) 30.4 747.6
Tank 4P (Treated)
6.25 % 23.7
(23.1, 24.1)
8.20
(8.04, 8.33) 78.8 90.8
24.2
(23.7, 24.7)
8.27
(8.16, 8.43) 66.0 107.6
12.5 % 24.4
(24.1, 24.6)
8.28
(8.19, 8.35) 70.4 110.8
24.5
(24.3, 24.7)
8.39
(8.36, 8.44) 64.4 148.8
25 % 24.4
(23.6, 25.0)
8.41
(8.34, 8.52) 60.8 152.8
24.4
(24.2, 24.6)
8.54
(8.51, 8.57) 58.0 238.0
50 % 24.1
(23.7, 24.8)
8.64
(8.61, 8.70) 50.8 226.8
24.3
(24.1, 24.7)
8.82
(8.77, 8.86) 48.0 416.8
100 % 24.1
(23.6, 24.6)
8.87
(8.82, 8.91) 20.0 388.4
24.1
(22.8, 24.6)
9.01
(8.97, 9.07) 27.2 759.2
A Hard reconstituted water (U.S. Environmental Protection Agency Office of Water, 2002)

Results of Shipboard Approval Tests of BWT Systems in Freshwater
76
UNCLAS//Public | CG-926 R&DC | Cangelosi, et al. | Public
November 2014
3.6.2.2 Fathead Minnow (Pimephales promelas) Survival and Reproduction
Results from TC2 and TC3 WET tests conducted on P. promelas are presented in Table 22. There were no
significant differences (p>0.05) in survival or growth of P. promelas exposed to filtered Duluth-Superior
Harbor water, i.e., the receiving water control, and P. promelas exposed to effluent from the untreated tank
5P and the treated tanks 3P and 4P (all dilutions; Table 22). P. promelas exposed to filtered Duluth-Superior
Harbor water, 100 % whole effluent from the untreated tank 5P, and 100 % whole effluent from the treated
tanks 3P and 4P all had 95 % or greater survival (Table 22). Mean average weight of fish was similar across
all treatment groups and dilutions, ranging 0.41 mg to 0.48 mg (Table 22).
Results for temperature, pH and dissolved oxygen which were measured daily and hardness and alkalinity
which were measured on test termination day (Day 7), are presented in Table 23. Temperature ranged from
22.3 ºC to 26.8 ºC across all treatment groups, while pH ranged from a minimum of 7.22 in the TC2
performance control to a maximum of 8.74 in the TC3 100 % effluent from tanks 3P and 4P (Table 23).
Dissolved oxygen concentration ranged from a minimum of 3.7 mg/L to 6.7 mg/L (Table 23). Hardness
measured highest in the effluent from the untreated tank 5P and lowest in the 100 % effluent from tanks 3P
and 4P (Table 23). Conversely, alkalinity measured highest in the 100 % effluent from tanks 3P and 4P, and
lowest in the performance control (Table 23).
Table 22. Percent survival (Average ± Standard Error; n = 4) and weight (Average ± Standard Error; n = 4)
in a Pimephales promelas whole effluent toxicity test after 7 days exposure to treated and
untreated ballast discharge collected during Test Cycles 2 and 3.
Treatment Group Exposure Solution
Test Cycle 2 Test Cycle 3
Percent
Survival
Weight/Fish
(mg)
Percent
Survival
Weight/Fish
(mg)
Performance ControlA N/A 98 ± 1.7 0.41 ± 0.01 100 ± 0 0.41 ± 0.02
Receiving Water Control
Filtered Duluth-
Superior
Harbor water
98 ± 1.7 0.44 ± 0.01 95 ± 0.48 0.42 ± 0.02
Tank 5P (Untreated) 100 % 98 ± 1.7 0.39 ± 0.02 97 ± 0.29 0.43 ± 0.01
Tank 3P (Treated)
6.25 % 97 ± 1.9 0.42 ± 0.01 100 ± 0 0.48 ± 0.01
12.5 % 97 ± 1.9 0.43 ± 0.01 100 ± 0 0.46 ± 0.03
25 % 98 ± 1.7 0.42 ± 0.01 100 ± 0 0.42 ± 0.01
50 % 100 ± 0 0.42 ± 0.01 100 ± 0 0.43 ± 0.01
100 % 98 ± 1.7 0.43 ± 0.01 100 ± 0 0.47 ± 0.01
Tank 4P (Treated)
6.25 % 100 ± 0 0.47 ± 0.02 100 ± 0 0.45 ± 0.01
12.5 % 98 ± 1.7 0.43 ± 0.03 98 ± 0.25 0.48 ± 0.02
25 % 97 ± 1.9 0.49 ± 0.01 100 ± 0 0.47 ± 0.02
50 % 98 ± 1.7 0.48 ± 0.01 98 ± 0.25 0.47 ± 0.02
100 % 98 ± 1.7 0.49 ± 0.01 100 ± 0 0.48 ± 0.02 A Dechlorinated Laboratory Water

Results of Shipboard Approval Tests of BWT Systems in Freshwater
77
UNCLAS//Public | CG-926 R&DC | Cangelosi, et al. | Public
November 2014
Table 23. Average (Minimum, Maximum) water chemistry parameters measured in exposure solutions during the Pimephales promelas whole
effluent toxicity tests for Test Cycles 2 and 3.
Treatment
Group
Exposure
Solution
Test Cycle 2 Test Cycle 3
Temp. (°C) pH
Dissolved
Oxygen
(mg/L)
Hardness
(mg/L
CaCO3)
Alkalinity
(mg/L
CaCO3)
Temp. (°C) pH
Dissolved
Oxygen
(mg/L)
Hardness
(mg/L
CaCO3)
Alkalinity
(mg/L
CaCO3)
Performance
ControlA
N/A 24.3
(23.2, 25.6)
7.34
(7.22, 7.52)
5.4
(4.5, 6.6) 48.4 50.0
24.5
(23.2, 25.8)
7.47
(7.32, 7.65)
6.7
(5.7, 7.4) 48.0 50.8
Receiving
Water
Control
Filtered
Duluth-
Superior
Harbor water
24.1
(23.4, 25.3)
7.47
(7.34, 7.61)
5.4
(4.7, 6.4) 75.6 68.0
24.4
(23.6, 25.8)
7.56
(7.29, 7.73)
6.4
(4.6, 7.1) 69.2 59.2
Tank 5P
(Untreated) 100 %
23.8
(23.0, 25.4)
7.85
(7.74, 8.10)
5.7
(4.8, 6.7) 144.4 116.0
24.4
(24.0, 25.5)
8.08
(7.95, 8.26)
6.3
(5.4, 7.0) 162.4 116.4
Tank 3P
(Treated)
6.25 % 24.2
(22.9, 24.8)
7.72
(7.58, 7.87)
5.5
(4.8, 6.1) 71.6 85.6
24.3
(22.3, 25.2)
7.84
(7.65, 7.97)
6.2
(4.5, 7.5) 64.0 98.4
12.5 % 24.2
(23.2, 25.1)
7.76
(7.65, 7.91)
5.1
(4.2, 6.1) 66.4 105.2
24.4
(23.3, 25.9)
8.07
(7.91, 8.16)
6.3
(4.9, 7.1) 62.8 141.2
25 % 24.2
(23.2, 25.2)
7.90
(7.81, 8.09)
5.1
(4.4, 6.1) 72.0 140.4
24.3
(23.6, 25.9)
8.32
(8.21, 8.44)
6.3
(5.2, 7.1) 56.0 228.4
50 % 24.0
(23.5, 25.0)
8.23
(8.16, 8.36)
5.7
(5.1, 6.6) 47.6 218.0
24.6
(22.9, 26.1)
8.53
(8.37, 8.68)
6.4
(5.4, 7.4) 48.0 396.4
100 % 24.2
(23.6, 25.2)
8.53
(8.38, 8.61)
5.3
(3.7, 6.0) 18.4 366.4
24.5
(23.1, 25.6)
8.68
(8.60, 8.74)
6.2
(5.1, 7.0) 27.2 740.0
Tank 4P
(Treated)
6.25 % 24.4
(23.5, 25.7)
7.84
(7.75, 7.99)
5.3
(4.5, 6.2) 68.0 91.2
24.6
(23.0, 25.6)
7.94
(7.79, 8.04)
6.2
(5.4, 7.0) 64.8 104.4
12.5 % 24.1
(22.7, 24.9)
7.73
(7.61, 8.01)
5.6
(4.7, 6.5) 66.4 106.8
24.7
(23.4, 25.8)
8.00
(7.85, 8.15)
6.1
(4.9, 6.8) 62.0 146.0
25 % 24.3
(23.3, 24.9)
7.89
(7.70, 8.15)
4.9
(4.2, 6.2) 57.6 148.4
24.4
(23.0, 25.7)
8.29
(8.14, 8.42)
6.3
(5.1, 6.9) 57.6 233.6
50 % 24.4
(23.7, 25.3)
8.19
(8.05, 8.41)
5.0
(4.0, 6.4) 42.8 226.0
24.6
(22.9, 26.8)
8.53
(8.46, 8.68)
6.0
(4.7, 6.9) 46.4 405.2
100 % 24.8
(23.8, 25.7)
8.51
(8.41, 8.64)
4.8
(4.1, 5.8) 18.0 382.0
24.6
(23.9, 25.8)
8.68
(8.58, 8.74)
6.2
(4.7, 7.2) 26.4 775.6
A Dechlorinated Laboratory Water.
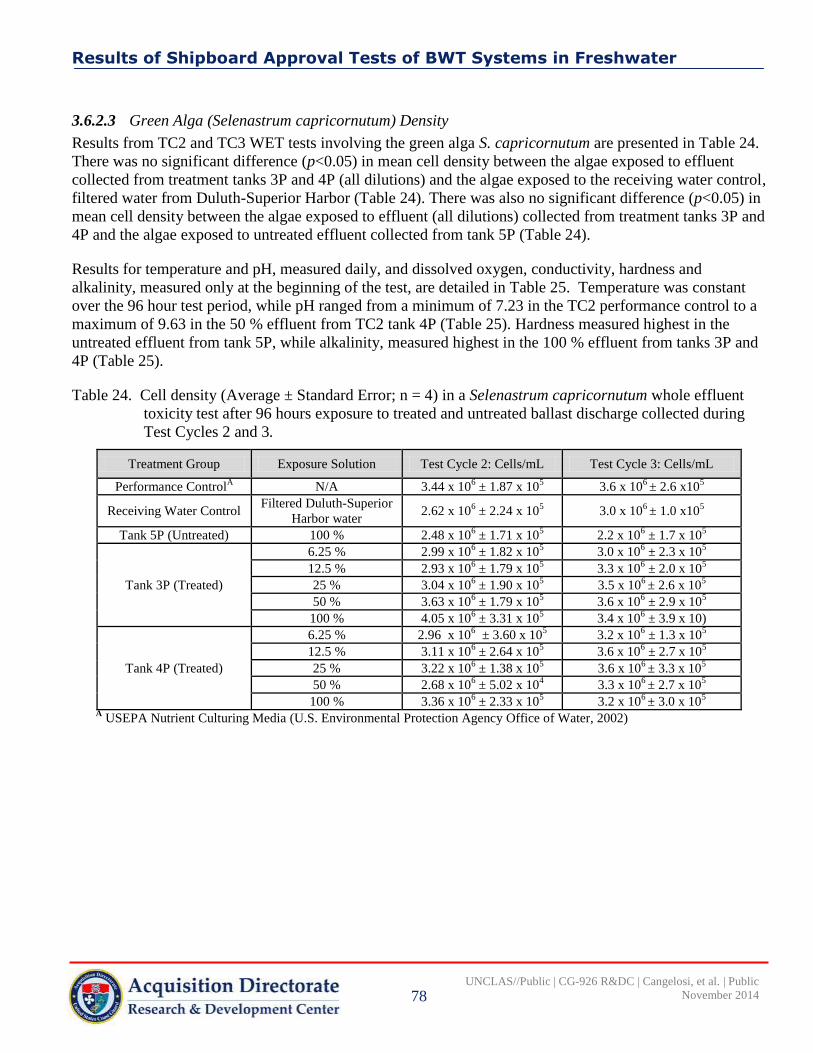
Results of Shipboard Approval Tests of BWT Systems in Freshwater
78
UNCLAS//Public | CG-926 R&DC | Cangelosi, et al. | Public
November 2014
3.6.2.3 Green Alga (Selenastrum capricornutum) Density
Results from TC2 and TC3 WET tests involving the green alga S. capricornutum are presented in Table 24.
There was no significant difference (p<0.05) in mean cell density between the algae exposed to effluent
collected from treatment tanks 3P and 4P (all dilutions) and the algae exposed to the receiving water control,
filtered water from Duluth-Superior Harbor (Table 24). There was also no significant difference (p<0.05) in
mean cell density between the algae exposed to effluent (all dilutions) collected from treatment tanks 3P and
4P and the algae exposed to untreated effluent collected from tank 5P (Table 24).
Results for temperature and pH, measured daily, and dissolved oxygen, conductivity, hardness and
alkalinity, measured only at the beginning of the test, are detailed in Table 25. Temperature was constant
over the 96 hour test period, while pH ranged from a minimum of 7.23 in the TC2 performance control to a
maximum of 9.63 in the 50 % effluent from TC2 tank 4P (Table 25). Hardness measured highest in the
untreated effluent from tank 5P, while alkalinity, measured highest in the 100 % effluent from tanks 3P and
4P (Table 25).
Table 24. Cell density (Average ± Standard Error; n = 4) in a Selenastrum capricornutum whole effluent
toxicity test after 96 hours exposure to treated and untreated ballast discharge collected during
Test Cycles 2 and 3.
Treatment Group Exposure Solution Test Cycle 2: Cells/mL Test Cycle 3: Cells/mL
Performance ControlA N/A 3.44 x 10
6 ± 1.87 x 10
5 3.6 x 10
6 ± 2.6 x10
5
Receiving Water Control Filtered Duluth-Superior
Harbor water 2.62 x 10
6 ± 2.24 x 10
5 3.0 x 10
6 ± 1.0 x10
5
Tank 5P (Untreated) 100 % 2.48 x 10⁶ ± 1.71 x 10
5 2.2 x 10
6 ± 1.7 x 10
5
Tank 3P (Treated)
6.25 % 2.99 x 10⁶ ± 1.82 x 10
5 3.0 x 10
6 ± 2.3 x 10
5
12.5 % 2.93 x 10⁶ ± 1.79 x 10
5 3.3 x 10
6 ± 2.0 x 10
5
25 % 3.04 x 10⁶ ± 1.90 x 10
5 3.5 x 10
6 ± 2.6 x 10
5
50 % 3.63 x 10⁶ ± 1.79 x 10
5 3.6 x 10
6 ± 2.9 x 10
5
100 % 4.05 x 10⁶ ± 3.31 x 10
5 3.4 x 10
6 ± 3.9 x 10)
Tank 4P (Treated)
6.25 % 2.96 x 10⁶ ± 3.60 x 10
5 3.2 x 10
6 ± 1.3 x 10
5
12.5 % 3.11 x 10⁶ ± 2.64 x 10
5 3.6 x 10
6 ± 2.7 x 10
5
25 % 3.22 x 10⁶ ± 1.38 x 10
5 3.6 x 10
6 ± 3.3 x 10
5
50 % 2.68 x 10⁶ ± 5.02 x 10
4 3.3 x 10
6 ± 2.7 x 10
5
100 % 3.36 x 10⁶ ± 2.33 x 10
5 3.2 x 10
6 ± 3.0 x 10
5
A USEPA Nutrient Culturing Media (U.S. Environmental Protection Agency Office of Water, 2002)

Results of Shipboard Approval Tests of BWT Systems in Freshwater
79
UNCLAS//Public | CG-926 R&DC | Cangelosi, et al. | Public
November 2014
Table 25. Average (Minimum, Maximum) water chemistry parameters measured in exposure solutions during the Selenastrum capricornutum
whole effluent toxicity tests for Test Cycles 2 and 3.
Treatment
Group
Exposure
Solution
Test Cycle 2 Test Cycle 3
Temp.
(°C) pH
Dissolved
Oxygen
(mg/L)
Cond.
(µS/cm)
Hardness
(mg/L
CaCO3)
Alkalinity
(mg/L
CaCO3)
Temp.
(°C) pH
Dissolved
Oxygen
(mg/L)
Cond.
(µS/cm)
Hardness
(mg/L
CaCO3)
Alkalinity
(mg/L
CaCO3)
Performance
ControlA
N/A
24.3
(22.6,
24.9)
7.62
(7.24,
10.13)
7.7 90.9 18.0 11.4
24.1
(22.6,
24.7)
7.63
(7.23,
9.95)
8.5 95 32.0 12.4
Receiving
Water
Control
Filtered
Duluth-
Superior
Harbor
water
24.4
(23.2,
25.1)
8.31
(7.88,
9.57)
8.1 272 86.0 73.8
24.2
(23.3,
24.7)
8.16
(7.77,
9.52)
8.2 255 82.8 68.0
Tank 5P
(Untreated) 100 %
24.5
(22.8,
25.2)
8.51
(8.13,
9.45)
8.2 464 148.0 119.8
24.2
(23.2,
24.7)
8.45
(8.01,
9.07)
8.2 470 178.8 162.8
Tank 3P
(Treated)
6.25 %
24.3
(23.1,
25.0)
8.37
(8.08,
9.71)
8.1 323 85.0 92.2
24.1
(23.2,
24.6)
8.39
(7.96,
9.46)
8.0 336 82.0 111.2
12.5 %
24.4
(23.1,
25.0)
8.46
(8.10,
9.47)
8.1 372 - -
24.1
(23.2,
24.5)
8.46
(7.98,
9.54)
8.0 410 - -
25 %
24.3
(23.0,
25.2)
8.54
(8.14,
9.64)
8.2 420 - -
24.1
(23.1,
24.5)
8.52
(8.00,
9.52)
8.1 578 - -
50 %
24.3
(23.0,
25.1)
8.62
(8.15,
9.63)
8.1 561 - -
24.0
(23.1,
24.6)
8.59
(8.02,
9.50)
8.2 890 - -
100 %
24.2
(23.0,
25.0)
8.76
(8.26,
9.67)
8.2 848 33.0 370.8
24.0
(23.4,
24.5)
8.57
(7.96,
9.59)
8.4 1483 41.2 760.0

Results of Shipboard Approval Tests of BWT Systems in Freshwater
80
UNCLAS//Public | CG-926 R&DC | Cangelosi, et al. | Public
November 2014
Table 25. Average (Minimum, Maximum) water chemistry parameters measured in exposure solutions during the Selenastrum capricornutum
whole effluent toxicity tests for Test Cycles 2 and 3 (Continued).
Treatment
Group
Exposure
Solution
Test Cycle 2 Test Cycle 3
Temp.
(°C) pH
Dissolved
Oxygen
(mg/L)
Cond.
(µS/cm)
Hardness
(mg/L
CaCO3)
Alkalinity
(mg/L
CaCO3)
Temp.
(°C) pH
Dissolved
Oxygen
(mg/L)
Cond.
(µS/cm)
Hardness
(mg/L
CaCO3)
Alkalinity
(mg/L
CaCO3)
Tank 4P
(Treated)
6.25 %
24.6
(23.1,
25.0)
8.45
(8.01,
9.59)
8.1 312 84.0 92.8
24.0
(23.2,
24.5)
8.40
(7.98,
9.51)
8.1 338 80.0 112.8
12.5 %
24.6
(23.2,
25.0)
8.50
(8.09,
9.52)
8.1 351 - -
24.2
(23.1,
24.9)
8.49
(8.03,
9.52)
8.1 415 - -
25 %
24.6
(23.1,
25.2)
8.59
(8.21,
9.55)
8.1 427 - -
24.1
(23.1,
24.7)
8.58
(8.08,
9.44)
8.1 582 - -
50 %
24.5
(23.0,
25.0)
8.73
(8.32,
9.63)
8.0 574 - -
24.1
(23.0,
25.0)
8.62
(8.07,
9.62)
8.2 897 - -
100 %
24.5
(23.0,
25.0)
8.85
(8.43,
9.50)
8.0 880 31.0 388.0
24.1
(22.9,
24.9)
8.67
(8.08,
9.55)
8.5 1506 41.6 775.2
A USEPA Nutrient Culturing Media (U.S. Environmental Protection Agency Office of Water, 2002)
Results of Shipboard Approval Tests of BWT Systems in Freshwater
81
UNCLAS//Public | CG-926 R&DC | Cangelosi, et al. | Public
November 2014
3.6.2.4 Performance Controls and Stock Solutions
TC2 and TC3 WET test performance controls met test acceptability criteria, indicating that the organisms
were healthy prior to test initiation and not damaged during the test due to handling. The filtered Duluth-
Superior Harbor water controls and untreated ballast water from tank 5P also met test acceptability criteria.
The water chemistry of the C. dubia and P. promelas stock solution was measured daily prior to being used
for renewal of each replicate exposure solution. Temperature, pH and dissolved oxygen did not vary greatly
between the performance control, receiving water control, untreated effluent from tank 5P and the various
dilutions of treated effluent from tanks 3P and 4P (Tables 26 and 27). Conductivity and alkalinity increased
with greater concentrations of treatment effluent from tanks 3P and 4P, while hardness decreased with
increasing concentrations of treatment effluent (Tables 26 and 27).

Results of Shipboard Approval Tests of BWT Systems in Freshwater
82
UNCLAS//Public | CG-926 R&DC | Cangelosi, et al. | Public
November 2014
Table 26. Average (Minimum, Maximum) water chemistry results from measurements of stock solutions used during Test Cycle 2 whole effluent
toxicity tests with Ceriodaphnia dubia and Pimephales promelas.
Treatment Group Exposure
Solution Temperature (°C)
Dissolved
Oxygen (mg/L) pH
Conductivity
(µS/cm)
Hardness
(mg/L CaCO3)
Alkalinity
(mg/L CaCO3)
C. dubia
Performance ControlA
N/A 24.4
(23.1, 26.6)
7.4
(7.3, 7.7)
8.26
(8.20, 8.31)
567
(557, 575) 168.0 114.8
P. promelas
Performance ControlB
N/A 25.7
(23.7, 27.9)
6.0
(5.6, 6.4)
7.37
(7.21, 7.51)
140
(132, 152) 52.0 49.0
Receiving Water Control
Filtered Duluth-
Superior
Harbor water
24.8
(23.9, 25.9)
8.2
(7.8, 8.4)
7.83
(7.65, 8.09)
195
(183, 211) 74.0 63.0
Tank 5P (Untreated) 100 % 24.9
(24.1, 27.0)
8.9
(8.2, 9.4)
7.96
(7.82, 8.10)
328
(323, 330) 160.0 109.8
Tank 3P (Treated)
6.25 % 24.9
(24.0, 25.9)
8.1
(7.8, 8.5)
7.91
(7.64, 8.09)
232
(229, 235) 69.0 82.6
12.5 % 24.9
(24.1, 25.8)
8.0
(7.8, 8.4)
7.96
(7.81, 8.09)
266
(261, 268) 67.0 102.4
25 % 24.9
(24.1, 25.8)
8.2
(7.9, 8.5)
8.05
(8.00, 8.12)
340
(338, 341) 58.0 137.8
50 % 25.0
(24.1, 26.3)
8.2
(7.9, 8.5)
8.13
(8.10, 8.19)
486
(481, 489) 45.0 210.8
100 % 25.3
(24.2, 27.1)
9.2
(8.5, 10.0)
8.19
(8.14, 8.24)
776
(770, 783) 20.0 359.0
Tank 4P (Treated)
6.25 % 24.6
(23.9, 25.3)
8.1
(7.8, 8.3)
7.92
(7.76, 8.03)
231
(222, 253) 68.0 84.4
12.5 % 24.5
(24.1, 25.1)
8.1
(7.9, 8.4)
7.97
(7.88, 8.11)
272
(269, 276) 66.0 103.4
25 % 24.5
(24.2, 24.8)
8.2
(7.9, 8.5)
8.11
(8.05, 8.14)
347
(342, 353) 58.0 142.2
50 % 24.8
(24.4, 25.4)
8.3
(8.1, 8.7)
8.22
(8.15, 8.27)
501
(495, 507) 44.0 220.6
100 % 25.3
(24.5, 26.0)
9.4
(8.6, 9.9)
8.34
(8.29, 8.38)
806
(790, 818) 20.0 379.0
A Hard Reconstituted Culture Water
B Dechlorinated Laboratory Water
C Filtered Duluth-Superior Harbor Water
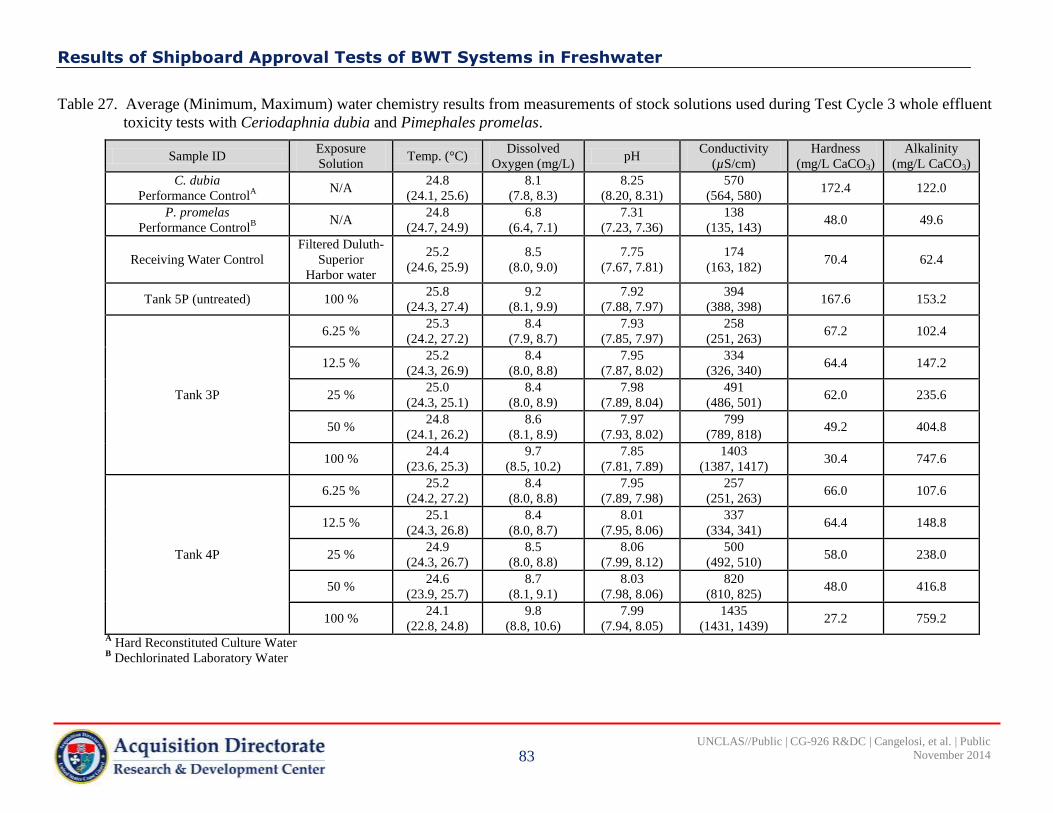
Results of Shipboard Approval Tests of BWT Systems in Freshwater
83
UNCLAS//Public | CG-926 R&DC | Cangelosi, et al. | Public
November 2014
Table 27. Average (Minimum, Maximum) water chemistry results from measurements of stock solutions used during Test Cycle 3 whole effluent
toxicity tests with Ceriodaphnia dubia and Pimephales promelas.
Sample ID Exposure
Solution Temp. (°C)
Dissolved
Oxygen (mg/L) pH
Conductivity
(µS/cm)
Hardness
(mg/L CaCO3)
Alkalinity
(mg/L CaCO3)
C. dubia
Performance ControlA
N/A 24.8
(24.1, 25.6)
8.1
(7.8, 8.3)
8.25
(8.20, 8.31)
570
(564, 580) 172.4 122.0
P. promelas
Performance ControlB
N/A 24.8
(24.7, 24.9)
6.8
(6.4, 7.1)
7.31
(7.23, 7.36)
138
(135, 143) 48.0 49.6
Receiving Water Control
Filtered Duluth-
Superior
Harbor water
25.2
(24.6, 25.9)
8.5
(8.0, 9.0)
7.75
(7.67, 7.81)
174
(163, 182) 70.4 62.4
Tank 5P (untreated) 100 % 25.8
(24.3, 27.4)
9.2
(8.1, 9.9)
7.92
(7.88, 7.97)
394
(388, 398) 167.6 153.2
Tank 3P
6.25 % 25.3
(24.2, 27.2)
8.4
(7.9, 8.7)
7.93
(7.85, 7.97)
258
(251, 263) 67.2 102.4
12.5 % 25.2
(24.3, 26.9)
8.4
(8.0, 8.8)
7.95
(7.87, 8.02)
334
(326, 340) 64.4 147.2
25 % 25.0
(24.3, 25.1)
8.4
(8.0, 8.9)
7.98
(7.89, 8.04)
491
(486, 501) 62.0 235.6
50 % 24.8
(24.1, 26.2)
8.6
(8.1, 8.9)
7.97
(7.93, 8.02)
799
(789, 818) 49.2 404.8
100 % 24.4
(23.6, 25.3)
9.7
(8.5, 10.2)
7.85
(7.81, 7.89)
1403
(1387, 1417) 30.4 747.6
Tank 4P
6.25 % 25.2
(24.2, 27.2)
8.4
(8.0, 8.8)
7.95
(7.89, 7.98)
257
(251, 263) 66.0 107.6
12.5 % 25.1
(24.3, 26.8)
8.4
(8.0, 8.7)
8.01
(7.95, 8.06)
337
(334, 341) 64.4 148.8
25 % 24.9
(24.3, 26.7)
8.5
(8.0, 8.8)
8.06
(7.99, 8.12)
500
(492, 510) 58.0 238.0
50 % 24.6
(23.9, 25.7)
8.7
(8.1, 9.1)
8.03
(7.98, 8.06)
820
(810, 825) 48.0 416.8
100 % 24.1
(22.8, 24.8)
9.8
(8.8, 10.6)
7.99
(7.94, 8.05)
1435
(1431, 1439) 27.2 759.2
A Hard Reconstituted Culture Water
B Dechlorinated Laboratory Water

Results of Shipboard Approval Tests of BWT Systems in Freshwater
84
UNCLAS//Public | CG-926 R&DC | Cangelosi, et al. | Public
November 2014
3.8 Quality Assurance/Quality Control
3.8.1 Calibration of Multiparameter Water Quality Sondes
Two YSI Sondes per TC were successfully calibrated according to the procedure outlined in
GSI/SOP/MS/G/C/1 - Procedure for Calibration, Deployment, and Storage of YSI Multiparameter Water
Quality Sondes (Table 28). For TC2, the conductivity in the intake samples and mock-treatment discharge
samples was expected to be substantially lower than the conductivity in the treatment discharge samples.
For this reason, two Sondes were used during TC2. The conductivity probe on one Sonde was calibrated
using a low-conductivity standard (e.g., 996 µS/cm) and was to be used for intake and mock-treatment
discharge sample measurements, while the probe on the second Sonde was calibrated with a high-
conductivity standard (e.g., 9977 µS/cm) to be used for treatment discharge sample measurements. For
TC3, the two Sondes were erroneously calibrated using the same conductivity standard, which was a low-
conductivity standard (e.g., 994 µS/cm). Therefore, the calibration standard did not bracket the measured
conductivity value in the treatment discharge tanks, and the conductivity data from tanks 3P and 4P on
discharge is not reported.
Table 28. Dates of YSI 6600 V2-4 multiparameter water quality sonde calibration relevant to Test
Cycles 1-4 of the Project 41012.
Test
Cycle YSI Sonde Date of Calibration Calibrated By Comments
1 GSI #3
20 July 2012 Christine
Polkinghorne Calibration successful for both Sondes.
GSI #4
2
GSI #1
15 October 2012 Christine
Polkinghorne
Calibration successful for both Sondes. The conductivity
probe on GSI #1 was calibrated using a low-conductivity
standard (used for intake and mock-treatment Tank 5P
discharge). The conductivity probe on GSI #2 was
calibrated using a high-conductivity standard (used for
treatment discharge Tank 3P and 4P). GSI #2
3
GSI #1
9 August 2013 Christine
Polkinghorne
Calibration successful for both Sondes. GSI #1 and #2
were calibrated using the same conductivity standard,
which did not bracket the measured conductivity values in
the treated tanks on discharge. GSI #2
4
GSI #2
(intake) 4 November 2013
(prior to intake);
11 November 2013
(prior to discharge)
Christine
Polkinghorne
and Kimberly
Beesley
Calibration successful for both Sondes prior to intake and
discharge.
GSI #4
(intake)
GSI #1
(discharge)
3.8.2 Data Quality Indicators
GSI used the following USEPA data quality indicators (where applicable) to determine compliance with
data quality objectives: representativeness, accuracy, precision, bias, sensitivity, comparability and
completeness. Data quality objectives and acceptance criteria for each of these indicators varied by analysis
type and are described in GSI/QAQC/QAPP/SB/1 - Quality Assurance Project Plan for Shipboard Tests
(GSI, 2013c).
Results of Shipboard Approval Tests of BWT Systems in Freshwater
85
UNCLAS//Public | CG-926 R&DC | Cangelosi, et al. | Public
November 2014
3.8.2.1 Water Chemistry
Results of the data quality analysis for precision, bias, accuracy, comparability, completeness and sensitivity
relative to water chemistry samples analyzed during TCs 1 through 4 intake and discharge are summarized
in Table 29. All data quality objectives were met for TC1 (Table 29).
For TC2, the precision data quality objective was met for all parameters measured, except NPOC (Table
29). The bias data quality objective was not met for NPOC or DOC, as the filter blank and blank samples
were on average greater than the LOQ (Table 29). As a result, the completeness objective for these two
parameters was also not met (Table 29). All other TC2 quantitative and qualitative data quality objectives
were met (Table 29).
For TC3, the precision data quality objective was met for all parameters, although an insufficient number of
duplicates were analyzed for TSS, %T, and POM (Table 29). However, duplicate samples were not
analyzed for NPOC and DOC and precision could not be determined (Table 29). The bias data quality
objective was met for all blanks (Table 29). The completeness objective was not met for %T unfiltered,
POM and MM, owing to not enough samples being collected from the drip sampler during tank 2P intake
(Table 29). All other quantitative and qualitative data quality objectives were met for water chemistry
analysis during TC3.
For TC4, the data quality objectives for precision, bias, and accuracy were met for all parameters (Table
29). The completeness objective was met for TSS, %T (filtered and unfiltered), POM, and MM (Table 29),
however, this objective was not met for NPOC, DOC or POC because only two samples were collected
during TVE#2 intake rather than three (Table 29). In addition, the sample container storing the first sample
collected for NPOC/DOC analysis from TVE#3 intake broke during shipment. All other quantitative and
qualitative data quality objectives were met for water chemistry analysis during TC4 (Table 29).
3.8.2.2 Organisms ≥ 50 µm33
The data quality assessment for organisms ≥ 50 m during TCs 1 through 4 is presented in Table 3034
. The
quantitative data quality objective for bias was met for TC1 and TC3. During TC2, the bias data quality
objective was met for percent taxonomic similarity but the relative percent difference of total number of live
organisms was just outside the acceptance criteria at 21% RPD. For TC4, no QA counts were conducted on
either of the discharge samples due to the truncated sampling and analysis plan, therefore, no data quality
objective for bias could be determined. The precision data quality objective was met for TC1 – TC3. For
TC4, the precision data quality objective was not met; the coefficient of variation was greater than 20 % for
all of the samples likely because the density of live zooplankton in the intake and discharge samples was
relatively low.
3.8.2.3 Organisms ≥ 10 and < 50 µm
The data quality assessment for organisms ≥ 10 and < 50 m for TCs 1 through 4 is presented in Table 31.
The quantitative data quality objective for bias and the qualitative data quality objective for comparability
were achieved for TCs 1 and 2 (Table 31). For TC3, the quantitative data quality objective for bias (with
regards to relative percent difference) was not achieved (Table 31), which is not surprising given the low
density of organisms. The data quality objective for comparability was however achieved (Table 31). For
33
Based on assumption that p3SFS flow meter was accurately recording flow rates. 34
As above.
Results of Shipboard Approval Tests of BWT Systems in Freshwater
86
UNCLAS//Public | CG-926 R&DC | Cangelosi, et al. | Public
November 2014
TC4, since no discharge samples were collected, the bias data quality objective could not be determined
(Table 31). The data quality objective for comparability was achieved, however (Table 31).
Heat-killing was performed on TC 1-3 discharge samples to assess accuracy of the FDA stain approach at
detecting live/dead with each specific assemblage. During the TC1 live assessment of heat-killed samples,
small numbers of “live” algae from the green algae genera Scenedesmus and Pediastrum, ranging from 16 to
19 cells/mL, were present in the samples. These false positive live counts were likely artifacts of the heating
process in combination with the FDA stain. If these taxa were being mischaracterized as alive due to heat-
killing assessment, then the ETV DSP requires that the mischaracterized green algae density must be
subtracted from the total density determined from the original non-heat-killed samples. However, almost no
specimens of Scenedesmus and Pediastrum were observed as alive during the full assessment, so the
incorrect live determination appeared to occur on specimens that died during the heat killing validation
procedure. Although this discrepancy is not well understood, we do not believe it is justified to alter full
discharge counts in response to it. TC2 and TC3 discharge samples revealed no “live” (i.e. stained, glowing
green) organisms.
3.8.2.4 Organisms < 10 µm
Data quality assessment results for organisms < 10 m relative to TC3 are presented in Table 32. A data
quality assessment was not conducted for this size class during TCs 1 and 2.
For TC3, the precision data quality objective was met for all analyses except Enterococcus spp. (Table 32).
The diluent blank for heterotrophic bacteria analyzed from both the SimPlate and spread plate methods were
positive, but at levels that did not affect the data. The accuracy data quality objective was not met for total
coliform analysis (Table 32). The percent completeness data quality objective was met for all analysis types
except total coliforms and total heterotrophic bacteria measured using the spread plate method (Table 32).
3.8.2.5 Whole Effluent Toxicity
Data quality assessment results for TCs 2 and 3 WET tests are presented in Table 33. The data quality
objective for C. dubia, the only species tested that has a requirement of monthly reference toxicant tests,
was met for both TCs with the relevant reference toxicant tests resulting in an LC50 value within the
acceptance range (Table 33). For TC2, the performance control culture water for C. dubia met test
acceptability for survival but not for reproduction (Table 33). All other quantitative and qualitative data
quality objectives were met (Table 33).

Results of Shipboard Approval Tests of BWT Systems in Freshwater
87
UNCLAS//Public | CG-926 R&DC | Cangelosi, et al. | Public
November 2014
Table 29. Data quality objectives, criteria, and results from water chemistry/quality analyses during Test Cycles 1-4. Values marked by an
asterisk (*) did not meet GSI’s data quality objective.
Data
Quality
Indicator
Evaluation
Process/
Performance
Measurement
Data
Quality
Objective
Test Cycle 1:
Performance Measurement
Result
Test Cycle 2:
Performance Measurement
Result
Test Cycle 3:
Performance Measurement
Result
Test Cycle 4:
Performance Measurement
Result
Precision
Samples (10 %)
are split in the
laboratory
analyzed in
duplicate.
Performance
measured by
average relative
percent difference
(RPD).
< 20 %
average
RPD.
Percentage
of samples
collected
and
analyzed in
duplicate:
11 %
TSS: Results
of duplicate
analysis
< MDL, and
too low to use
%T (filtered):
0.3 %. %T
(unfiltered):
0.1%. NPOC:
4.4%.
DOC: 5.2%
Percentage
of samples
collected and
analyzed in
duplicate:
13 %
TSS: 3.1 %
%T (Filtered):
0.4 %. %T
(Unfiltered):
0.2 %. NPOC:
84.2 %*.
POM: 1.3 %
Percentage
of
samples
collected and
analyzed in
duplicate = 8
%*;
NPOC and
DOC = 0 %*
TSS: 7.3%.
%T (filtered):
0.2 %. %T
(Unfiltered):
2.0 %.
POM: 5.9%
Percentage
of samples
collected and
analyzed in
duplicate:
13 %
TSS: 3.2 %.
%T filtered):
0.4 %. %T
(unfiltered):
1.0 %.
POM: 6.8 %.
NPOC: 0.6 %.
DOC: 2.0 %
Bias,
Blanks and
Filter
Blanks
Deionized water
samples (two per
analysis date)
filtered using the
procedure outlined
in
GSI/SOP/BS/RA/C/
8, and analyzed
using the
procedure outlined
in
GSI/SOP/BS/RA/C/
4.
> 98 %
average
transmittan
ce
Number of
%T Filter
blanks
analyzed:
4 (2 per
analysis
date)
Filter blank
(%T):
99.9 %
Number of
%T filter
blanks
analyzed:
4 each (2
each per
analysis
date)
Filter blank
(%T): 100.7
%
Number of
%T Filter
Blanks
analyzed:
4 each (2
each per
analysis
date)
Filter blank
(%T):
99.6 %
Number of
%T Filter
Blanks
analyzed:
2 each
Filter blank
(%T): 99.8 %
Deionized water
samples (two per
analysis date)
filtered, dried, and
weighed following
the procedure
outlined in
GSI/SOP/BS/RA/C/
8
< 0.3 mg/L
TSS (TC1);
< 3.6 mg/L
TSS (TC2);
< 2.6 mg/L
TSS (TC3
and TC4)
Number of
TSS filter
blanks
analyzed:
4 (2 per
analysis
date)
Filter blank
(TSS):
0.0 mg/L
Number of
TSS filter
blanks
analyzed:
4 each (2
each per
analysis
date)
Filter blank
(TSS):
0.0 mg/L
Number of
TSS filter
blanks
analyzed:
4 each (2
each per
analysis
date)
Filter blank
(TSS):
0.0 mg/L
Number of
TSS filter
blanks
analyzed:
2 each
Filter blank
(TSS): 0.0
mg/L
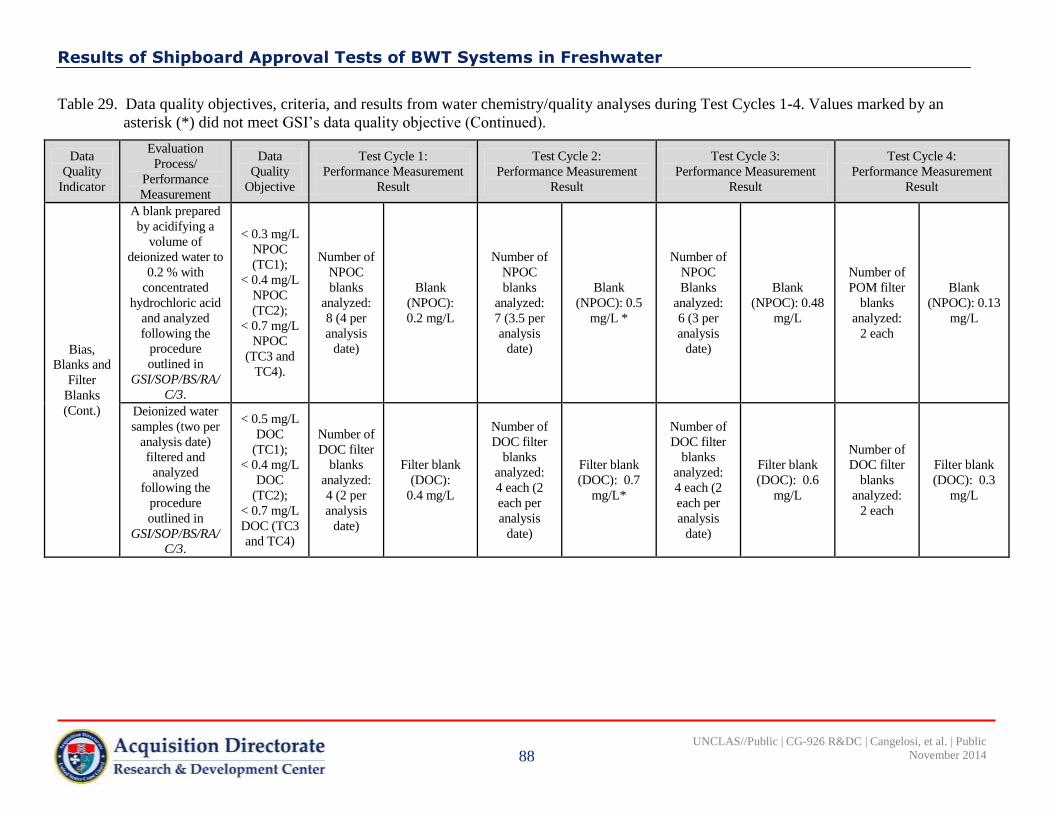
Results of Shipboard Approval Tests of BWT Systems in Freshwater
88
UNCLAS//Public | CG-926 R&DC | Cangelosi, et al. | Public
November 2014
Table 29. Data quality objectives, criteria, and results from water chemistry/quality analyses during Test Cycles 1-4. Values marked by an
asterisk (*) did not meet GSI’s data quality objective (Continued).
Data
Quality
Indicator
Evaluation
Process/
Performance
Measurement
Data
Quality
Objective
Test Cycle 1:
Performance Measurement
Result
Test Cycle 2:
Performance Measurement
Result
Test Cycle 3:
Performance Measurement
Result
Test Cycle 4:
Performance Measurement
Result
Bias,
Blanks and
Filter
Blanks
(Cont.)
A blank prepared
by acidifying a
volume of
deionized water to
0.2 % with
concentrated
hydrochloric acid
and analyzed
following the
procedure
outlined in
GSI/SOP/BS/RA/
C/3.
< 0.3 mg/L
NPOC
(TC1);
< 0.4 mg/L
NPOC
(TC2);
< 0.7 mg/L
NPOC
(TC3 and
TC4).
Number of
NPOC
blanks
analyzed:
8 (4 per
analysis
date)
Blank
(NPOC):
0.2 mg/L
Number of
NPOC
blanks
analyzed:
7 (3.5 per
analysis
date)
Blank
(NPOC): 0.5
mg/L *
Number of
NPOC
Blanks
analyzed:
6 (3 per
analysis
date)
Blank
(NPOC): 0.48
mg/L
Number of
POM filter
blanks
analyzed:
2 each
Blank
(NPOC): 0.13
mg/L
Deionized water
samples (two per
analysis date)
filtered and
analyzed
following the
procedure
outlined in
GSI/SOP/BS/RA/
C/3.
< 0.5 mg/L
DOC
(TC1);
< 0.4 mg/L
DOC
(TC2);
< 0.7 mg/L
DOC (TC3
and TC4)
Number of
DOC filter
blanks
analyzed:
4 (2 per
analysis
date)
Filter blank
(DOC):
0.4 mg/L
Number of
DOC filter
blanks
analyzed:
4 each (2
each per
analysis
date)
Filter blank
(DOC): 0.7
mg/L*
Number of
DOC filter
blanks
analyzed:
4 each (2
each per
analysis
date)
Filter blank
(DOC): 0.6
mg/L
Number of
DOC filter
blanks
analyzed:
2 each
Filter blank
(DOC): 0.3
mg/L

Results of Shipboard Approval Tests of BWT Systems in Freshwater
89
UNCLAS//Public | CG-926 R&DC | Cangelosi, et al. | Public
November 2014
Table 29. Data quality objectives, criteria, and results from water chemistry/quality analyses during Test Cycles 1-4. Values marked by an
asterisk (*) did not meet GSI’s data quality objective (Continued).
Data
Quality
Indicator
Evaluation
Process/
Performance
Measurement
Data
Quality
Objective
Test Cycle 1:
Performance Measurement
Result
Test Cycle 2:
Performance Measurement
Result
Test Cycle 3:
Performance Measurement
Result
Test Cycle 4:
Performance Measurement
Result
Accuracy
Samples (10 %)
spiked with a total
organic carbon
spiking solution –
with performance
measured by
average spike-
recovery (SPR).
75 %-125
% average
SPR.
Percentage
of
NPOC/DO
C samples
spiked:
16 %
NPOC/DOC:
99.8 %
Percentage
of
NPOC/DOC
samples
spiked:
27 %
NPOC/DOC:
96.9 %
Percentage
of
NPOC/DOC
samples
spiked:
13 %
NPOC/DOC:
100.4 %
Percentage
of
NPOC/DOC
samples
spiked: 12.5
%
NPOC: 101.2
% DOC:
100.3 %
Performance
measured by
average percent
difference (%D)
between all
measured and
nominal reference
standard values.
< 20%
average
Percentage
of analysis
days
containing
a reference
standard:
100 %
TSS:
1.7 % Percentage
of analysis
days
containing a
reference
standard:
100 %
TSS: 2.5 %
Percentage
of analysis
days
containing a
reference
standard:
100 %
TSS: 1.7 %
Percentage
of analysis
days
containing a
reference
standard:
100 %
TSS: 0.7 %
NPOC
reference
standard:
0.7 %
NPOC,
reference
standard:
0.5 %
NPOC
reference
standard:
1.9 %
NPOC
reference
standard:
4.1 %
NPOC, 10
mg/L
Standard:
1.7 %
NPOC, 10
mg/L standard:
1.8 %
NPOC 10
mg/L standard:
2.8 %
NPOC 10
mg/L
standard:
2.2 %
Comparabi
lity
Routine procedures
conducted
according to
appropriate SOPs
to ensure
consistency
between test
cycles.
Not
applicable
The following GSI SOPs were used for all water chemistry analyses conducted during the test cycles:
GSI/SOP/BS/RA/C/3 - Procedures for Measuring Organic Carbon in Aqueous Samples.
GSI/SOP/BS/RA/C/4 - Procedure for Determining Percent Transmittance (%T) of Light in Water at 254 nm.
TC1 and TC2: GSI/SOP/BS/RA/C/8 - Procedure for Analyzing Total Suspended Solids (TSS).
TC3 and TC4: GSI/SOP/BS/RA/C/8, v.3 – Procedure for Analyzing Total Suspended Solids (TSS), Particulate
Organic Matter (POM), and Mineral Matter (MM)

Results of Shipboard Approval Tests of BWT Systems in Freshwater
90
UNCLAS//Public | CG-926 R&DC | Cangelosi, et al. | Public
November 2014
Table 29. Data quality objectives, criteria, and results from water chemistry/quality analyses during Test Cycles 1-4. Values marked by an
asterisk (*) did not meet GSI’s data quality objective (Continued).
Data
Quality
Indicator
Evaluation
Process/
Performance
Measurement
Data
Quality
Objective
Test Cycle 1:
Performance Measurement
Result
Test Cycle 2:
Performance Measurement
Result
Test Cycle 3:
Performance Measurement
Result
Test Cycle 4:
Performance Measurement
Result
Completen
ess
Percentage of
valid (i.e.,
collected,
handled, analyzed
correctly and
meeting data
quality objectives)
water chemistry
samples measured
out of the total
number of water
chemistry samples
collected.
Performance is
measured by
percent
completeness
(%C).
> 90 %C.
TSS: 18 valid samples/
18 analyzed = 100 %C
TSS:23 valid samples/23
planned samples = 100 %C
TSS: 20 valid samples/22
planned samples = 91 %C
TSS: 12 valid samples/13
planned samples = 92 %C
%T, Filtered: 18 valid
samples/
18 analyzed = 100 %C
%T, Filtered:
21 valid samples/21 planned
samples = 100 %C
%T, Filtered: 18 valid
samples/20 planned samples =
90 %C
%T, Filtered: 11 valid
samples/12 planned samples =
92 %C
%T, Unfiltered: 18 valid
samples/
18 analyzed = 100 %C
%T, Unfiltered:
17 valid samples/17 planned
samples = 100 %C
%T, Unfiltered: 14 valid
samples/16 planned samples =
88 %C*
%T, Unfiltered: 9 valid
samples/10 planned samples =
90 %C
NPOC: 18 valid samples/
18 analyzed = 100 %C
NPOC: 27 valid samples/35
planned samples = 77 %C*
NPOC: 31 valid samples/32
planned samples = 97 %C
NPOC: 17 valid samples/19
planned samples = 89 %C*
DOC: 17 valid samples/21
planned samples = 81 %C*
DOC: 21 valid samples/22
planned samples = 95 %C
DOC: 10 valid samples/12
planned samples = 83 %C*
POC: 15 valid samples/15
planned samples = 100 %C
POC: 15 valid samples/16
planned samples = 94 %C
POC: 8 valid samples/10
planned samples = 80 %C*
DOC: 18 valid samples/
18 analyzed = 100 %C
POM:17 valid samples/17
planned samples = 100 %C
POM: 14 valid samples/16
planned samples = 88 %C*
POM: 11 valid samples/12
planned samples = 92 %C
MM: 15 valid samples/15
planned samples = 100 %C
MM: 14 valid samples/16
planned samples = 88 %C*
MM: 9 valid samples/10
planned samples = 90 %C
Sensitivity
The method
detection limit
(MDL) and limit
of quantification
(LOQ) for each
analyte and
analytical method
utilized
determined
annually prior to
the start of the
testing season.
Not
applicable
TSS MDL: 1.1 mg/L
TSS LOQ: 3.6 mg/L
TSS MDL: 1.1 mg/L
TSS LOQ: 3.6 mg/L
TSS MDL: 0.8 mg/L
TSS LOQ: 2.6 mg/L
TSS MDL: 0.8 mg/L
TSS LOQ: 2.6 mg/L
POM MDL: 0.5 mg/L
POM LOQ: 1.5 mg/L
POM MDL: 0.6 mg/L
POM LOQ: 2.0 mg/L
POM MDL: 0.6 mg/L
POM LOQ: 2.0 mg/L
NPOC MDL: 0.1 mg/L
NPOC LOQ: 0.4mg/L
NPOC MDL: 0.1 mg/L
NPOC LOQ: 0.4mg/L
NPOC MDL: 0.2 mg/L
NPOC LOQ: 0.7 mg/L
NPOC MDL: 0.2 mg/L
NPOC LOQ: 0.7 mg/L
DOC MDL: 0.1 mg/L
DOC LOQ: 0.4 mg/L
DOC MDL: 0.1 mg/L
DOC LOQ: 0.4 mg/L
DOC MDL: 0.2 mg/L
DOC LOQ: 0.7 mg/L
DOC MDL: 0.2 mg/L
DOC LOQ: 0.7 mg/L

Results of Shipboard Approval Tests of BWT Systems in Freshwater
91
UNCLAS//Public | CG-926 R&DC | Cangelosi, et al. | Public
November 2014
Table 30. Data quality objectives, criteria, and results35 from analyses of organisms ≥ 50 m during Test Cycles 1-4. Values marked by an
asterisk (*) did not meet GSI’s data quality objective.
Data Quality
Indicator
Evaluation Process/
Performance
Measurement
Data Quality
Objective
Test Cycle 1:
Performance Measurement
Result
Test Cycle 2:
Performance
Measurement Result
Test Cycle 3:
Performance
Measurement Result
Test Cycle 4:
Performance Measurement
Result
Bias
10% of treatment
discharge samples and
at least one intake per
set of tests of a specific
BWMS analyzed by
two separate
taxonomists – with
performance measured
by average percent
similarity (PS) of
taxonomic
identification (live
organisms only).
> 80 % average
PS and < 20 %
average RPD.
Percentage of
treatment
discharge
samples analyzed
by a second
taxonomist:
1 out of 3
= 33 %
91% PS
and 4%
RPD
Percentage
of treatment
discharge
samples
analyzed by
a Second
Taxonomist:
1 out of 3
= 33 %
81 %
PS and
21 %
RPD*
Percentage
of
treatment
discharge
samples
analyzed
by a
second
taxonomist
(2 out of
3): 67 %
85 %
PS and
10 %
RPD
Percentage
of
treatment
discharge
samples
analyzed
by a
second
taxonomist
:
0 %*
Cannot be
determined;
a second
(quality
assurance)
count was
not
conducted
on either of
the
discharge
samples.*
Precision
Analyzed at least two
subsamples from all
samples analyzed via
the “dead/total”
counting method –
with performance
measured by
coefficient of variation
among subsamples
(%CV) counted by the
same analyst.
≤ 20 % CV
Intake macrozooplankton:
17 %, n=3
Intake microzooplankton:
9 %, n=3
Discharge: 17 %, n=2
15 %, n=5 14 %, n=5
Intake: 27 %*; n = 3.
Discharge
macrozooplankton: 28
%*; n = 2.
Discharge
microzooplankton: 25 %*;
n = 2.
Comparability
Routine procedures are
conducted according to
appropriate SOPs to
ensure consistency
between tests.
Not applicable The following GSI SOP was used for all zooplankton sample analyses conducted during the test cycles:
GSI/SOP/MS/RA/SA/2 – Procedure for Zooplankton Sample Analysis
35
Based on assumption that p3SFS flow meter was accurately recording flow rates.
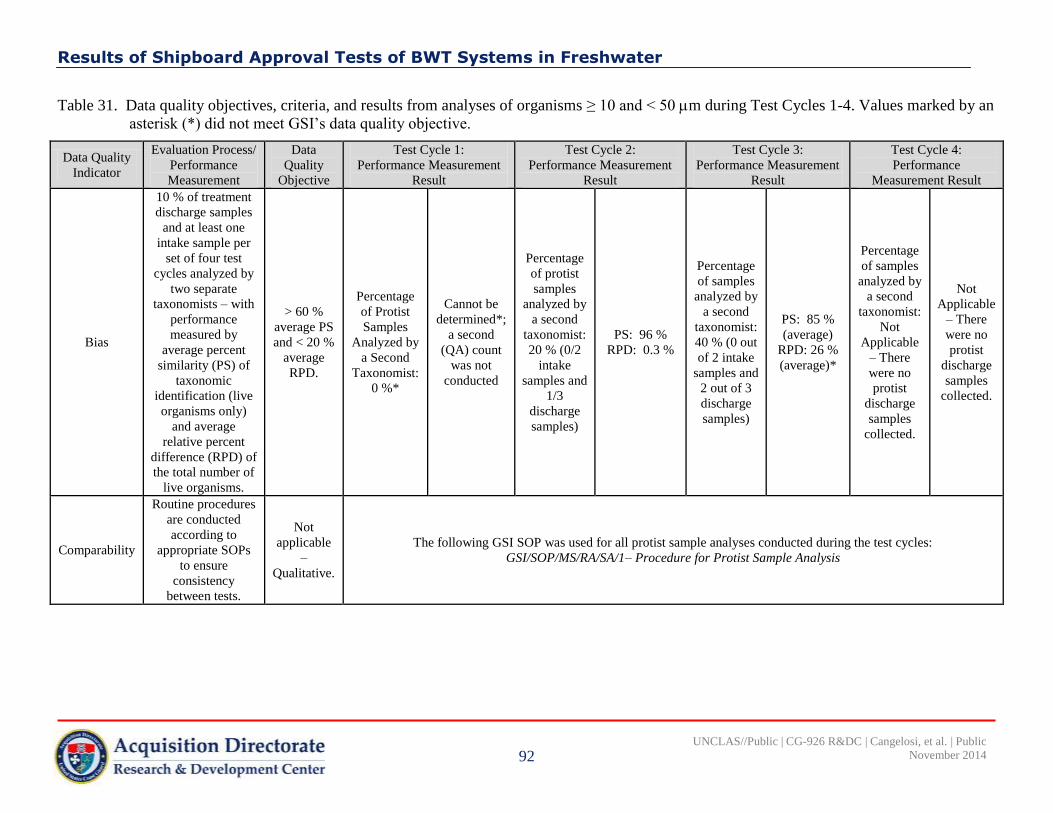
Results of Shipboard Approval Tests of BWT Systems in Freshwater
92
UNCLAS//Public | CG-926 R&DC | Cangelosi, et al. | Public
November 2014
Table 31. Data quality objectives, criteria, and results from analyses of organisms ≥ 10 and < 50 m during Test Cycles 1-4. Values marked by an
asterisk (*) did not meet GSI’s data quality objective.
Data Quality
Indicator
Evaluation Process/
Performance
Measurement
Data
Quality
Objective
Test Cycle 1:
Performance Measurement
Result
Test Cycle 2:
Performance Measurement
Result
Test Cycle 3:
Performance Measurement
Result
Test Cycle 4:
Performance
Measurement Result
Bias
10 % of treatment
discharge samples
and at least one
intake sample per
set of four test
cycles analyzed by
two separate
taxonomists – with
performance
measured by
average percent
similarity (PS) of
taxonomic
identification (live
organisms only)
and average
relative percent
difference (RPD) of
the total number of
live organisms.
> 60 %
average PS
and < 20 %
average
RPD.
Percentage
of Protist
Samples
Analyzed by
a Second
Taxonomist:
0 %*
Cannot be
determined*;
a second
(QA) count
was not
conducted
Percentage
of protist
samples
analyzed by
a second
taxonomist:
20 % (0/2
intake
samples and
1/3
discharge
samples)
PS: 96 %
RPD: 0.3 %
Percentage
of samples
analyzed by
a second
taxonomist:
40 % (0 out
of 2 intake
samples and
2 out of 3
discharge
samples)
PS: 85 %
(average)
RPD: 26 %
(average)*
Percentage
of samples
analyzed by
a second
taxonomist:
Not
Applicable
– There
were no
protist
discharge
samples
collected.
Not
Applicable
– There
were no
protist
discharge
samples
collected.
Comparability
Routine procedures
are conducted
according to
appropriate SOPs
to ensure
consistency
between tests.
Not
applicable
–
Qualitative.
The following GSI SOP was used for all protist sample analyses conducted during the test cycles:
GSI/SOP/MS/RA/SA/1– Procedure for Protist Sample Analysis

Results of Shipboard Approval Tests of BWT Systems in Freshwater
93
UNCLAS//Public | CG-926 R&DC | Cangelosi, et al. | Public
November 2014
Table 32. Data quality objectives, criteria, and results from analyses of organisms < 10 m during Test Cycles 1-3. Values marked by an asterisk
(*) did not meet GSI’s data quality objective.
Data Quality
Indicator
Evaluation Process/
Performance
Measurement
Data Quality
Objective
Test Cycle 1:
Performance Measurement
Result
Test Cycle 2:
Performance Measurement
Result
Test Cycle 3:
Performance Measurement Result
Precision
Samples (10 %)
analyzed in duplicate
– with performance
measured by average
relative percent
difference (RPD) of
all duplicate analyses.
< 30 %
average RPD.
Not
determined
Not
determined
Not
determined
Not
determined
Percentage of
samples analyzed
in duplicate: 0*-
13 %
(dependent upon
analysis type)
E. coli:
5 % RPD, n=3;
Total Coliforms:
28 % RPD, n=3;
Enterococcus spp.:
38 % RPD*, n=3;
Heterotrophic
SimPlate:
19 % RPD, n=4
Bias, Operator
Samples (10 %)
counted by two
separate analysts –
with performance
measured by average
RPD of all second
counts.
< 20 %
average RPD.
Not
determined
Not
determined
Not
determined
Not
determined
Percentage of
samples counted
by a second
analyst:
> 10 %
(dependent upon
analysis type)
E. coli:
1 % RPD, n=17;
Total Coliforms:
2 % RPD, n=19;
Enterococcus spp.:
0 % RPD, n=19;
Heterotrophic
SimPlate: 2 % RPD,
n=26;
Heterotrophic Spread
Plate:
12 % RPD, n=59.
Bias, Positive
Control
Qualitative positive
control samples
(American Type
Culture Collection)
analyzed on each
analysis date.
Results must
be greater
than the limit
of detection.
Not determined Not determined
E. coli:
All positive controls >1 most probable
number (MPN)/100 mL, n=2;
Total Coliforms:
All positive controls >1 MPN/100 mL, n=2;
Enterococcus spp.:
All positive controls >1 MPN/100 mL, n=2;
Heterotrophic SimPlate:
All positive controls >1 MPN/mL, n=2;
Heterotrophic Spread Plate:
All positive controls >1 CFU/mL, n=2.

Results of Shipboard Approval Tests of BWT Systems in Freshwater
94
UNCLAS//Public | CG-926 R&DC | Cangelosi, et al. | Public
November 2014
Table 32. Data quality objectives, criteria, and results from analyses of organisms < 10 m during Test Cycles 1-3. Values marked by an asterisk
(*) did not meet GSI’s data quality objective (Continued).
Data Quality
Indicator
Evaluation Process/
Performance
Measurement
Data Quality
Objective
Test Cycle 1:
Performance Measurement
Result
Test Cycle 2:
Performance Measurement
Result
Test Cycle 3:
Performance Measurement Result
Bias, Negative
Control
Qualitative negative
control samples
(American Type
Culture Collection)
analyzed on each
analysis date (note no
negative control for
Heterotrophic
analyses).
Results must
be less than
the limit of
detection.
Not determined Not determined
E. coli:
All negative controls <1 MPN/100 mL, n=2;
Total Coliforms:
All negative controls <1 MPN/100 mL, n=2;
Enterococcus spp.:
All negative controls <1 MPN/100 mL, n=2
Bias,
Method/Procedural
Blank
Filter-sterilized test
water analyzed on
each analysis date.
Results must
be less than
the limit of
detection.
Not determined Not determined
E. coli:
All method blanks <1 MPN/100 mL, n=2;
Total Coliforms:
All method blanks <1 MPN/100 mL, n=2;
Enterococcus spp.:
All method blanks <1 MPN/100 mL, n=2;
Heterotrophic SimPlate:
Intake blank <2 MPN/1 mL;
Discharge blank 12 MPN/1 mL*;
Heterotrophic Spread Plate:
Intake blank <1 CFU/1 mL;
Discharge blank 40 CFU/1 mL*
Bias, Diluent Blank
At least one day prior
to sampling, diluents
(sterile ballast or
sterile deionized
water) in growth
media prepared and
incubated overnight in
order to determine
sterility.
Results must
be less than
the limit of
detection.
Not determined Not determined
All diluent blanks negative for all E.
coli/Total Coliform and Enterococcus spp.
analyses.
Heterotrophic SimPlate:
Intake blank < 2 MPN/1 mL;
Discharge blank 12 MPN/1 mL*
Heterotrophic Spread Plate:
Intake blank < 1 CFU/1 mL;
Discharge blank 40 CFU/1 mL*

Results of Shipboard Approval Tests of BWT Systems in Freshwater
95
UNCLAS//Public | CG-926 R&DC | Cangelosi, et al. | Public
November 2014
Table 32. Data Quality Objectives, Criteria, and Results from Analyses of Organisms < 10 m during Test Cycles 1-3. Values marked by an
asterisk (*) did not meet GSI’s data quality objective (Continued).
Data Quality
Indicator
Evaluation Process/
Performance
Measurement
Data Quality
Objective
Test Cycle 1:
Performance Measurement
Result
Test Cycle 2:
Performance Measurement
Result
Test Cycle 3:
Performance Measurement Result
Accuracy
Quanti-cult®/Quanti-
cult PLUS® samples
(IDEXX Laboratories,
Inc.) analyzed as a
quantitative positive
control at least once
per ballast water
treatment system test
(note no quantitative
positive control for
Heterotrophic
analyses).
E. coli:
65 – 263
MPN/100
mL;
Total
Coliforms:
33 – 103
MPN/mL;
Enterococcus
spp.
43 – 161
MPN/100 mL
Not determined Not determined
E. coli: 98.8 MPN/100 mL;
Total Coliforms: 27.5 MPN/100 mL*;
Enterococcus spp.: 113.7 MPN/100 mL
Comparability
Routine procedures
conducted according
to appropriate SOPs to
ensure consistency
between tests.
Not
applicable –
Qualitative.
The following GSI SOPs were used for all microbial analyses conducted during the test cycles:
GSI/SOP/BS/RA/MA/1 – Procedure for Quantifying Heterotrophic Plate Counts (HPCs) using IDEXX’s
SimPlate® for HPC Method
GSI/SOP/BS/RA/MA/3 – Procedure for the Detection and Enumeration of Enterococcus using Enterolert®
GSI/SOP/BS/RA/MA/4 – Procedure for the Detection and Enumeration of Total Coliforms and E. coli using
IDEXX’s Colilert®
Completeness
Percentage of valid
(i.e., collected,
handled, analyzed
correctly and meeting
data quality
objectives) samples
measured out of the
total number of
samples collected.
Performance is
measured by percent
completeness (%C).
> 90 %C. Not determined Not determined
E. coli: 35 valid analyses/35
analyses total = 100 %C;
Total Coliforms: 31 valid
analyses/35 analyses total = 89
%C*;
Enterococcus spp.: 34 valid
analyses/35 analyses total = 97
%C;
Heterotrophic SimPlate: 26
valid analyses/29 analyses total
= 90 %C;
Heterotrophic Spread Plate: 49
valid analyses/60 analyses total
= 82 %C*
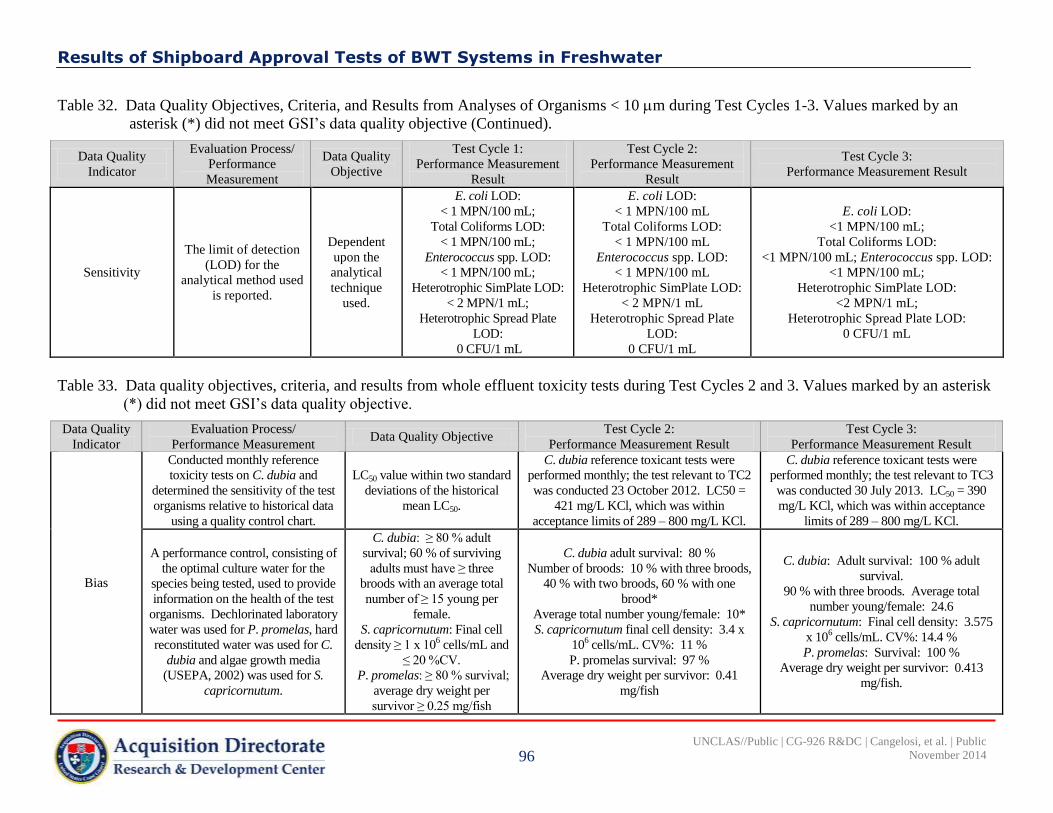
Results of Shipboard Approval Tests of BWT Systems in Freshwater
96
UNCLAS//Public | CG-926 R&DC | Cangelosi, et al. | Public
November 2014
Table 32. Data Quality Objectives, Criteria, and Results from Analyses of Organisms < 10 m during Test Cycles 1-3. Values marked by an
asterisk (*) did not meet GSI’s data quality objective (Continued).
Data Quality
Indicator
Evaluation Process/
Performance
Measurement
Data Quality
Objective
Test Cycle 1:
Performance Measurement
Result
Test Cycle 2:
Performance Measurement
Result
Test Cycle 3:
Performance Measurement Result
Sensitivity
The limit of detection
(LOD) for the
analytical method used
is reported.
Dependent
upon the
analytical
technique
used.
E. coli LOD:
< 1 MPN/100 mL;
Total Coliforms LOD:
< 1 MPN/100 mL;
Enterococcus spp. LOD:
< 1 MPN/100 mL;
Heterotrophic SimPlate LOD:
< 2 MPN/1 mL;
Heterotrophic Spread Plate
LOD:
0 CFU/1 mL
E. coli LOD:
< 1 MPN/100 mL
Total Coliforms LOD:
< 1 MPN/100 mL
Enterococcus spp. LOD:
< 1 MPN/100 mL
Heterotrophic SimPlate LOD:
< 2 MPN/1 mL
Heterotrophic Spread Plate
LOD:
0 CFU/1 mL
E. coli LOD:
<1 MPN/100 mL;
Total Coliforms LOD:
<1 MPN/100 mL; Enterococcus spp. LOD:
<1 MPN/100 mL;
Heterotrophic SimPlate LOD:
<2 MPN/1 mL;
Heterotrophic Spread Plate LOD:
0 CFU/1 mL
Table 33. Data quality objectives, criteria, and results from whole effluent toxicity tests during Test Cycles 2 and 3. Values marked by an asterisk
(*) did not meet GSI’s data quality objective.
Data Quality
Indicator
Evaluation Process/
Performance Measurement Data Quality Objective
Test Cycle 2:
Performance Measurement Result
Test Cycle 3:
Performance Measurement Result
Bias
Conducted monthly reference
toxicity tests on C. dubia and
determined the sensitivity of the test
organisms relative to historical data
using a quality control chart.
LC50 value within two standard
deviations of the historical
mean LC50.
C. dubia reference toxicant tests were
performed monthly; the test relevant to TC2
was conducted 23 October 2012. LC50 =
421 mg/L KCl, which was within
acceptance limits of 289 – 800 mg/L KCl.
C. dubia reference toxicant tests were
performed monthly; the test relevant to TC3
was conducted 30 July 2013. LC50 = 390
mg/L KCl, which was within acceptance
limits of 289 – 800 mg/L KCl.
A performance control, consisting of
the optimal culture water for the
species being tested, used to provide
information on the health of the test
organisms. Dechlorinated laboratory
water was used for P. promelas, hard
reconstituted water was used for C.
dubia and algae growth media
(USEPA, 2002) was used for S.
capricornutum.
C. dubia: ≥ 80 % adult
survival; 60 % of surviving
adults must have ≥ three
broods with an average total
number of ≥ 15 young per
female.
S. capricornutum: Final cell
density ≥ 1 x 10⁶ cells/mL and
≤ 20 %CV.
P. promelas: ≥ 80 % survival;
average dry weight per
survivor ≥ 0.25 mg/fish
C. dubia adult survival: 80 %
Number of broods: 10 % with three broods,
40 % with two broods, 60 % with one
brood*
Average total number young/female: 10*
S. capricornutum final cell density: 3.4 x
106 cells/mL. CV%: 11 %
P. promelas survival: 97 %
Average dry weight per survivor: 0.41
mg/fish
C. dubia: Adult survival: 100 % adult
survival.
90 % with three broods. Average total
number young/female: 24.6
S. capricornutum: Final cell density: 3.575
x 106 cells/mL. CV%: 14.4 %
P. promelas: Survival: 100 %
Average dry weight per survivor: 0.413
mg/fish.

Results of Shipboard Approval Tests of BWT Systems in Freshwater
97
UNCLAS//Public | CG-926 R&DC | Cangelosi, et al. | Public
November 2014
Table 33. Data quality objectives, criteria, and results from whole effluent toxicity tests during Test Cycles 2 and 3. Values marked by an asterisk
(*) did not meet GSI’s data quality objective (Continued).
Data Quality
Indicator
Evaluation Process/
Performance Measurement Data Quality Objective
Test Cycle 2:
Performance Measurement Result
Test Cycle 3:
Performance Measurement Result
Bias (Cont.)
Ensured a second, suitably-
qualified operator analyzes at least
10 % of all experimental units.
Performance measured by Relative
Percent Difference
(RPD).
< 10 % average RPD.
Percentage of C.
dubia test chambers
counted by a
second person:
34 % of test
chambers.
Percentage of S.
capricornutum test
chambers counted
by a second person:
23 % of test
chambers.
Percentage of P.
promelas test
chambers counted
by a second person:
73 % of test
chambers.
C. dubia:
0.3 % RPD
S. capricornutum:
13 %* RPD
P. promelas:
0.03 % RPD
Percentage of C.
dubia test chambers
counted by a
second person: 54.5
% (average);
Percentage of S.
capricornutum test
chambers counted
by a second person:
10.9 % (average);
Percentage of P.
promelas test
chambers counted
by a second person:
87.5 % (average)
C. dubia:
1 % RPD
S. capricornutum:
2 % RPD
P. promelas:
0 % RPD
Precision
Duplicate samples from at least 10
% of the test chambers (during
analysis of final cell density only)
analyzed with performance
measured by RPD of all duplicate
analyses.
< 20 % average RPD. Not calculated Duplicate analysis was conducted on 10.9
% of test chambers; RPD = 12 %
Comparability
Routine procedures conducted
according to appropriate SOPs to
ensure consistency between tests.
Not Applicable – Qualitative.
The following GSI SOPs were used for all WET tests conducted during test cycles 2
and 3:
GSI/SOP/BS/RA/WET/1 - Procedure for Assessing Chronic Residual Toxicity of a
Ballast Treatment System to Ceriodaphnia dubia
GSI/SOP/BS/RA/WET/2 - Procedure for Assessing Chronic Residual Toxicity of a
Ballast Treatment System to the Fathead Minnow (Pimephales promelas)
GSI/SOP/BS/RA/WET/3 - Procedure for Assessing Chronic Residual Toxicity of a
Ballast Treatment System to the Green Alga (Selenastrum capricornutum)

Results of Shipboard Approval Tests of BWT Systems in Freshwater
98
UNCLAS//Public | CG-926 R&DC | Cangelosi, et al. | Public
November 2014
3.8.3 Deviations from the Test/Quality Assurance Plans
Deviations from the TC 1 through 4 TQAPs are summarized in Table 34. The GSI PI deemed that none of
these deviations were consequential to the quality of Project 41012 BWMS evaluation findings. The source
causes of the deviations did, however, help GSI generate suggestions for improvements to its
implementation of the ETV DSP, and to the ETV DSP itself, including the p3SFS.
In TC1, unexpected ship operations forced several deviations from the intake and discharge sampling plan
(Table 34). Specifically, the TC1 TQAP stated that four experimental ballast tanks would be sampled on
intake and discharge to achieve sample water and analysis volume requirements, however, in light of
substantial ballasting delays, the GSI team limited the experimental ballast tanks to three. This meant that on
discharge, the rate of sample collection was increased to assure that the ETV DSP requirements were met.
Other deviations from the TC1 TQAP were associated with operation of the p3SFS, retrieval of electronic
data and measurement of POC instead of POM (Table 34).
In TC2, there were again deviations to the TQAP associated with IH ballast intake and discharge operations
(Table 34). Specifically, tank 5P and 2P ballasting times were expected to be 70 to 100 minutes based on
historical data, but were only 55 minutes and 52 minutes, respectively. Sufficient volumes of sample water
were collected for analysis, however. Other deviations associated with TC2 included loss of the first 29
minutes of tank 2P’s in-line, continuous data due to an operator error and two issues associated with
replicate exposures in the WET tests (Table 34).
For TC3, deviations from the TC3 TQAP were associated with the number and/or type of samples collected
(Table 34). Specifically, sample volumes collected from tank 2P on intake were lower than planned (Table
34). Sample collection was stopped 49 minutes into the ballast operation when the pressure differential of
the p3SFS reached 5 psi. This interruption resulted in less water collected from the drip sampler such that
only one replicate was available for water chemistry analysis, e.g., for analysis of TSS, %T and POM (Table
34). On discharge, the p3SFS’s turbidity probe malfunctioned such that no data was available for any of
three ballast tanks sampled (Table 34).
During TC4, deviations from the TQAP resulted from several causes (Table 34). First, the flow rate of the
p3SFS drip sampler on both intake and discharge was significantly slower than expected. GSI personnel
detected a crack in the plastic nipple of the p3SFS that leaked sample water. Though several attempts were
made to repair the nipple, the drip sampler flow rate was still extremely slow. In addition, only two TVEs
were collected during discharge operations instead of the planned three. TVE#2 sampling was stopped at
23:56 because IH deballasting ceased while the ship was waiting for additional cargo to load. The minimum
wait time for deballasting to continue was three to six hours, which would have caused the sample collection
team and analysts to time out. The GSI PI made the decision to abort sampling of TVE#3 as sampling the
remaining discharge was not mission-critical. Finally, GSI staff had unexpected problems with sample
containers and transport. Specifically, the temperature data logger was not placed into the cooler with the
intake water chemistry samples and one of the sample collection containers storing a sample collected
during intake for analysis of NPOC/DOC broke during shipment (Table 34).

Results of Shipboard Approval Tests of BWT Systems in Freshwater
99
UNCLAS//Public | CG-926 R&DC | Cangelosi, et al. | Public
November 2014
Table 34. Summary of deviations to the Test Cycle 1 through 4 test/quality assurance plans.
Test Cycle GSI ID
Number Description of Deviation Corrective Action Potential Impact on Study
1
SB-ETV-
01
During tank 2P intake, the p3SFS was paused
at 18:40 for approximately one minute to
accommodate the ship’s need to pause
ballasting. After the pause, sampling was to
resume. However, a technical issue with the
p3SFS display resulted in the p3SFS not
automatically starting.
Once the issue was discovered, the p3SFS
sampling operation was re-started. At this
point, the pump did automatically start and
the sampling operation resumed.
The lack of flow to the p3SFS was not
discovered for approximately 17 minutes,
which resulted in the sample volume being
1.29 m3 below that of the target volume.
However, the ETV DSP states that a minimum
sample volume of 20 L must be concentrated
for untreated water (enumerated using
dead/total count); the volume concentrated was
well over 200x the required volume.
SB-ETV-
02
There was no electronic data collected during
ballast discharge due to an unformatted
Micro SD card that the p3SFS would have
used to store data. The manual states: “Upon
boot-up of the controller, the operator will be
notified if the Micro SD card is missing or
improperly installed.” Although the
formatting instructions were provided, since
the warning was not observed the operator
made the incorrect assumption that the Micro
SD card was ready for use.
The summarized operational data provided
by the p3SFS after completion of each
tank’s ballast discharge operation was
recorded by hand into a laboratory
notebook and those data are used in this
report.
There are no time stamped data for discharge
flow rate, temperature, turbidity, pressure,
pressure differential, pump frequency, and
control valve position. Only what was
provided in the summary files was recorded.
SB-ETV-
03
A portion of Tank 5P intake and discharge
operations were not sampled while GSI was
attempting to get the p3SFS pump primed. It
was observed that the M/V Indiana Harbor
ballast system frequently functioned below
the p3SFS’s required pressure of 5 psi. From
observation, it appears that the 5 psi
requirement is only a requirement during
start up and that once the p3SFS is primed it
can function below that value.
GSI personnel requested the vessel’s crew
to temporarily increase the pressure in the
main ballast line to allow for priming of the
p3SFS pump.
The ship was able to accommodate the brief
jump in pressure without affecting the cargo
loading operation.

Results of Shipboard Approval Tests of BWT Systems in Freshwater
100
UNCLAS//Public | CG-926 R&DC | Cangelosi, et al. | Public
November 2014
Table 34. Summary of deviations to the Test Cycle 1 through 4 test/quality assurance plans (Continued).
Test Cycle GSI ID
Number Description of Deviation Corrective Action Potential Impact on Study
1
(Cont.)
SB-ETV-04
Three experimental ballast tanks were
sampled on intake and discharge (i.e., port-
side tanks 2P, 3P, and 5P) rather than four
experimental tanks. 4P was not sampled.
The USCG STEP Sample Volume Calculator
was used to determine the required discharge
sample collection volume for the >50 m size
class, given that three samples could be
combined in a single run rather than four. The
discharge sample collection volume was then
increased from 5.5 m3 to 6.0 m
3 for each
experimental ballast tank.
The total ballast volume sampled was less than
planned; however, it was still many times
greater than that required by the ETV DSP and
the appropriate sample volume for three tanks
was collected.
SB-ETV-05
Particulate organic carbon (POC = NPOC –
DOC) was empirically measured, rather than
directly measuring particulate organic matter
(POM).
The POC concentration was reported, rather
than the POM.
The ETV DSP states that the POM
concentration is approximately two times the
POC concentration. Therefore, TC1 POM
concentrations can be estimated using the POC
concentration.
2
SB-ETV-06
Tank 5P and 2P intake p3SFS sample volumes
were less than the target value of 6 m3, and the
drip sample volumes were less than the target
value of 15 L.
No corrective action could be taken. Tank
5P and 2P ballasting times were expected to
be 70 to 100 minutes based on historical
data, but were only 55 minutes and 52
minutes, respectively.
The minimum zooplankton sample volume for
untreated water is 20 L concentrated to 1 L,
according to the ETV DSP. For TC2, 4.17 m3
and 3.41 m3 were sampled from tanks 5P and
2P, respectively. Therefore, the volumes
collected greatly surpass the requirement. In
addition, the drip sample volume collected was
sufficient for all whole water samples.
SB-ETV-07
In-line, continuous data from the first 29
minutes of tank 2P intake operation was lost.
The only in-line, continuous data available for
tank 2P is from after the sampling pause.
The GSI Engineer estimated the volume of
water sampled using the p3SFS based on the
length of sampling pre-pause and the
average flow rate.
The volume of water sampled using the p3SFS
is an approximation based on the estimated
volume sampled pre-pause and the measured
volume sampled post-pause.
SB-ETV-08
Approximately 20 minutes into tank 4P’s
discharge operation, it was observed that the
spigot on the drip sampler carboy was leaking.
Attempts to repair were unsuccessful.
Instead GSI personnel switched to a
functioning, clean 50 L carboy and drained
the water from the leaking carboy into the
new carboy.
A volume of water was lost from the integrated
sample during the first 20 minutes of the
sampling operation. This volume is unknown,
but is relatively small in comparison to the 43 L
collected in the integrated sample over the entire
discharge operation.
SB-ETV-09
On WET test day 4, after siphoning exposure
water from replicate beakers in the 12.5 % and
25 % - tank 3P treatment groups, renewal
stock solution from 12.5 % was mistakenly
poured into the 25 % - Tank 3P beakers.
GSI personnel made new 12.5 % - Tank 3P
stock solution, and 90 % of the incorrect
exposure water was siphoned from the 25 %
- tank 3P solution and replaced with 25 % -
Tank 3P stock solution.
The organisms in the 25 % - tank 3P treatment
group were exposed to a lesser concentration of
the tank 3P whole effluent for a very short time
period (less than one hour).

Results of Shipboard Approval Tests of BWT Systems in Freshwater
101
UNCLAS//Public | CG-926 R&DC | Cangelosi, et al. | Public
November 2014
Table 34. Summary of deviations to the Test Cycle 1 through 4 test/quality assurance plans (Continued).
Test Cycle GSI ID
Number Description of Deviation Corrective Action Potential Impact on Study
2
(Cont.) SB-ETV-10
On WET test termination day (Day 5), it was
observed that there were two live organisms in
tank 5P replicates 1 and 2 and zero live
organisms (but no dead bodies) in 6.25 % -
tank 3P replicates 1 and 2. It is likely that the
organisms were inadvertently transferred to
the incorrect replicate cups (Tank 5P, 1 and 2)
on test day 4.
No corrective action could be taken, as the
test was being terminated. The issue was
documented on the datasheet.
Replicates 1 and 2 from the tank 5P group could
not be factored into the number of young per
female average. In addition, replicate 2 from
the 6.25% - tank 3P group was not used to
determine reproduction as it had not had three
broods before the deviation occurred.
3
SB-ETV-11
Sample volumes collected from tank 2P on
intake were lower than planned because
sample collection was stopped 49 minutes into
the ballast operation due to the pressure
differential of the p3SFS reaching 5 psi. This
resulted in less water being collected from the
“drip sampler” such that only one replicate
was available for water chemistry analysis.
No corrective action could be taken. Tank
2P ballasting time was expected to be 70 to
100 minutes based on historical data.
Sample collection was stopped at 49 minutes
owing to the pressure differential of the
p3SFS reaching 5 psi. However, at this point
there was only 10 minutes of the ballast
operation remaining, such that resuming
sample collection was not feasible.
Water chemistry analyses were conducted on
the one replicate available for testing. Results
are comparable to those measured in the three
replicate from tank 5P intake sampling.
SB-ETV-12
The p3SFS was not wired to the IH’s ballast
main signal properly so ballast flow rates were
not recorded continuously.
No corrective action could be taken. The
issue was fixed as soon as possible, and
prior to next sampling event.
Average flow rates were calculated by hand
collected data taken about every 10 minutes.
SB-ETV-13
The drip sample flow rate for tank 4P
discharge was above the target range of 23 to
33 L/Hr.
No corrective action could be taken. The
expected ballast pumping duration for tank
4P was less than anticipated. To ensure
enough volume for whole effluent toxicity
(WET) testing, the drip sample flow rate for
this tank was increased above the target
range prior to the start of tank discharge.
50 L of sample volume was collected by the
drip sampler, well within the target range.
SB-ETV-14
The p3SFS’s turbidity probe malfunctioned on
discharge such that no data was available for
any of three ballast tanks sampled.
No corrective action could be taken. The
probe was fixed as soon as possible, and
prior to next sampling event.
Turbidity data was recorded by the YSI
Multiparameter Water Quality Sonde.
SB-ETV-15 Not enough sample water collected for
external collaborators.
No corrective action could be taken. The
external collaborators were grateful for the
samples which they received.
No impact. Samples for external collaborators
were auxiliary to Project 41012.

Results of Shipboard Approval Tests of BWT Systems in Freshwater
102
UNCLAS//Public | CG-926 R&DC | Cangelosi, et al. | Public
November 2014
Table 34. Summary of deviations to the Test Cycle 1 through 4 test/quality assurance plans (Continued).
Test Cycle GSI ID
Number Description of Deviation Corrective Action Potential Impact on Study
3
(Cont.)
SB-ETV-16
A MadgeTech HiTemp 102 DataLogger
(MadgeTech, Inc.; Warner, NH) was to be
placed inside the cooler used to ship intake
samples from Muskegon to Superior to
automatically measure and record the
temperature every 15 minutes during shipment
and to ensure that the samples were
maintained at ≤ 6 °C. The DataLogger was
not placed with the samples inside the cooler.
The issue was communicated to the
responsible staff. Retraining of the
responsible staff was conducted.
Samples arrived in Superior as planned. Though
ice cubes had melted in transit, samples were
cool to touch.
SB-ETV-17
GSI Sonde #1 and #2 were calibrated prior to
TC3 using the same low-conductivity
calibration standard (i.e., 994 µS/cm), which
did not bracket the conductivity in the treated
tanks on discharge (i.e., tank 3P and 4P)
The conductivity data measured from tanks
3P and 4P are not reported.
The conductivity of the integrated water
samples collected for WET testing was
measured upon set up of the test, and these
values can be used as an approximation of what
the conductivity of the treated tanks were at the
time of discharge.
4
SB-ETV-18
The flow rate through the p3SFS drip sampler
on intake and discharge was significantly
slower than planned. GSI personnel detected
a crack in the plastic nipple that was leaking
water located just before the drip sampler shut
off valve.
Assuming the leak was the problem leading
to slow flow rates, GSI personnel attempted
to repair the nipple, and reinstalled it prior to
TC4 discharge, with negative results; the
drip sampler flow rate was still extremely
slow. After another attempt at repair, the
GSI team communicated the issue and
actions to the PI who directed the team to
discontinue use the drip sampler for the
remainder of TC4 as there was no obvious
way to fix the problem, and any sample
water would not be adequately quantitative.
No time-integrated protist samples were
collected on discharge. In addition, the sample
team collected grab samples for water chemistry
at approximately the beginning, middle, and end
of each intake sampling operation from a
separate line off of the ballast main, except
during TVE#2 intake when the sample
collection team was unable to collect grab
samples due to conflicting staffing demands.
Two replicate samples were instead collected
from the drip sampler carboy.
SB-ETV-19
The temperature data logger was not placed
into the cooler with the intake water chemistry
samples
The issue was communicated to the
responsible staff. Retraining of the
responsible staff was conducted.
Samples arrived as planned. Though the holding
temperature of the samples during shipment is
unknown, the cooler still had ice present upon
arrival.
SB-ETV-20
The sample collection container storing the
first grab sample collected for analysis of
NPOC/DOC from TVE3 intake broke during
shipment
Better packaging will be used for future
shipments.
There are no NPOC/DOC measurements for
TVE#3, however, NPOC/DOC data are
available for TVEs #1 and #2
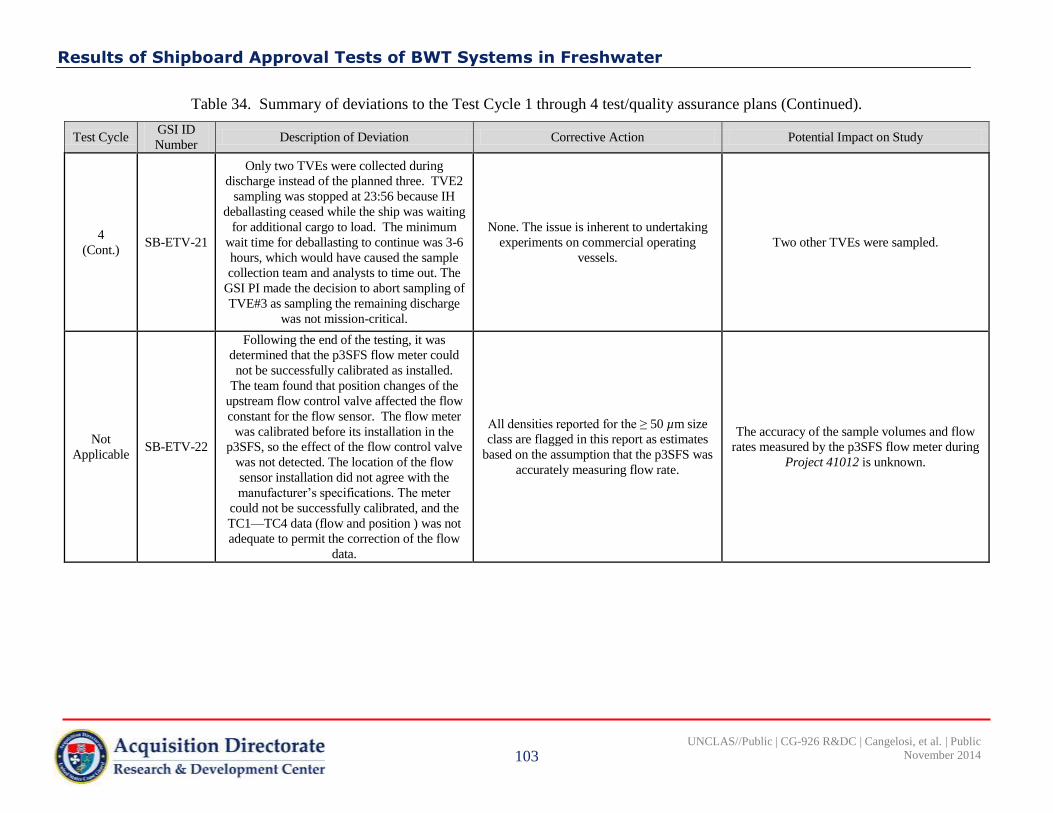
Results of Shipboard Approval Tests of BWT Systems in Freshwater
103
UNCLAS//Public | CG-926 R&DC | Cangelosi, et al. | Public
November 2014
Table 34. Summary of deviations to the Test Cycle 1 through 4 test/quality assurance plans (Continued).
Test Cycle GSI ID
Number Description of Deviation Corrective Action Potential Impact on Study
4
(Cont.) SB-ETV-21
Only two TVEs were collected during
discharge instead of the planned three. TVE2
sampling was stopped at 23:56 because IH
deballasting ceased while the ship was waiting
for additional cargo to load. The minimum
wait time for deballasting to continue was 3-6
hours, which would have caused the sample
collection team and analysts to time out. The
GSI PI made the decision to abort sampling of
TVE#3 as sampling the remaining discharge
was not mission-critical.
None. The issue is inherent to undertaking
experiments on commercial operating
vessels.
Two other TVEs were sampled.
Not
Applicable SB-ETV-22
Following the end of the testing, it was
determined that the p3SFS flow meter could
not be successfully calibrated as installed.
The team found that position changes of the
upstream flow control valve affected the flow
constant for the flow sensor. The flow meter
was calibrated before its installation in the
p3SFS, so the effect of the flow control valve
was not detected. The location of the flow
sensor installation did not agree with the
manufacturer’s specifications. The meter
could not be successfully calibrated, and the
TC1—TC4 data (flow and position ) was not
adequate to permit the correction of the flow
data.
All densities reported for the ≥ 50 µm size
class are flagged in this report as estimates
based on the assumption that the p3SFS was
accurately measuring flow rate.
The accuracy of the sample volumes and flow
rates measured by the p3SFS flow meter during
Project 41012 is unknown.

Results of Shipboard Approval Tests of BWT Systems in Freshwater
104
UNCLAS//Public | CG-926 R&DC | Cangelosi, et al. | Public
November 2014
4 LESSONS LEARNED AND SUMMARY
This section summarizes GSI’s lessons learned from execution of the ETV DSP and the p3SFS over the four
TCs, and provides recommendations for improvement based on these lessons. Some of the lessons learned
are generally applicable to ETV shipboard tests; while others are specifically applicable to ETV shipboard
tests of the partial NaOH BWMS installation onboard the IH. Through its implementation of Project 41012,
the GSI team also identified ways to improve the ETV DSP, including the p3SFS, and expand its use for the
verification of biological treatment efficacy and environmental acceptability of BWMSs.
4.1 ETV Draft Shipboard Protocol
Shipboard tests conducted according to the ETV DSP are expensive and time-consuming endeavors, and
often TOs have a limited number of opportunities at achieving them. As a result, the ETV DSP should
require a section within the TQAP for TO-anticipated problems and proposed TO measures to address them.
The ETV DSP also should provide useful guidance for TOs in troubleshooting and resolving likely issues.
Based on GSI experience with the ETV DSP in the Great Lakes, we identify the following examples of
likely pitfalls and ways to avoid them.
4.1.1 Protecting Health and Safety of Personnel
The ETV DSP has a great deal of focus on data quality, and justifiably so. However, TO personnel health
and safety is also a critical concern, intrinsically, and indirectly as it relates to data quality. Health and
safety concerns arise in the ETV DSP around operation of the BWMS, but not around implementation of the
shipboard tests. Based on GSI experience, there are critical areas in which TO personnel health and safety
protection would benefit from explicit protocols embedded in the TQAP.
4.1.1.1 Personnel Overextension
During implementation of the Project 41012, the overextension of GSI personnel was a major concern,
especially when there were unexpected changes to IH ballasting operations resulting in delayed or
prolonged sampling events. Even under routine circumstances, personnel were tasked with protracted
sample collection and/or analysis of time-sensitive samples at all hours of the day/night and interstate travel
to and from sampling events. Uneven port security systems, equipment failures, sudden changes in vessel
operations and transport logistics for time-sensitive samples added to the stress of these events.
All four sampling events during Project 41012 occurred overnight, with the earliest start in mid-afternoon
and the latest completed late morning. After TC1, the GSI PI analyzed the actual (as opposed to planned)
personnel effort associated with implementing the TC1 TQAP, and learned that some shift lengths for the
GSI Test Manager, GSI Engineer and GSI Senior QAQC Officer were in excess of 18 hours—clearly
unacceptable and unsustainable.
Accordingly the GSI PI set shift lengths between 8 and 12 hours during ship sampling events for TCs 2-4
(Figure 42) that included contingencies to provide additional staff in cases where the sampling schedules
were delayed. For example, in TC4 only two TVEs were sampled during discharge instead of the planned
for three; a six hour delay in IH cargo loading operations would have pushed GSI personnel over shift
limits. Such decisions will continue to be part of the landscape for ETV DSP tests, and generally for
shipboard tests.

Results of Shipboard Approval Tests of BWT Systems in Freshwater
105
UNCLAS//Public | CG-926 R&DC | Cangelosi, et al. | Public
November 2014
Figure 42. Proposed Test Cycle 2-4 GSI personnel hours.
Recommendation: Require that TOs explicitly demonstrate in the TQAP how they will protect personnel
health and safety in terms of preventing overextension, while maintaining data quality. Specifically, ideal
effort guidelines for personnel should be developed and stated in the TQAPs, and an adequate pool of
qualified personnel should be included to account for unprogrammed staffing needs that may occur, such as
those associated with ship schedule delays. These guidelines should be similar to Data Quality Objectives in
the QAQC system, and the QAQC audit should compare outcomes against them in the same way.
4.1.1.2 Exposure to Harmful Substances and Organisms
During TC1, GSI personnel noted that the first tank to receive ballast water had extremely high loads of
sediment produced by the action of the ship’s propellers on the bottom as it maneuvered into its berth. The
sediments clogged the sampling nets and made the microscopic analysis of samples more difficult. For
subsequent tests, the IH crew filled experimental tanks later in the ballasting process. The IH crew routinely
employs best management practices to reduce the amount of sediment uploaded into the vessel during
ballast intake operations, for example, by raising the position of the vessel’s sea chests. Ballasting order
decisions are not typically influenced by pollution or sampling staff health and safety concerns, however.
Concern over exposure to sediment and clogging of sampling equipment could negatively impact TC
validity, by reducing physical/chemical challenge water conditions to below ETV DSP requirements.
The presence of sediment in samples may also pose a health threat to the sampling team when the ballast
intake occurs in harbors with polluted waters and sediments. The TC1 intake sampling took place in
Hammond, Indiana, in the Grand Calumet River Area of Concern (AOC). This AOC notably has
contaminated sediments, including PCBs, PAHs and heavy metals such as mercury, cadmium, chromium
and lead (USEPA, 2014). Ports overseas may also have high pathogen concentrations that would pose a
health threat to sampling personnel.
Results of Shipboard Approval Tests of BWT Systems in Freshwater
106
UNCLAS//Public | CG-926 R&DC | Cangelosi, et al. | Public
November 2014
Recommendation: Require that TOs document in the TQAPs how personnel will be protected from
exposure to harmful substances and organisms in ballast water. Protection plans should include proper attire
and safeguard for handling hazardous liquids and ballast operational planning to reduce sources of exposure.
4.1.2 Managing Sampling Logistics
4.1.2.1 Unplanned Changes to Ballast Flow Rates
Ballasting rates were highly variable during the four tests, in response to vessel loading and unloading
requirements, cargo operations and crew decisions. This variability made it impossible to accurately predict
with certainty sampling duration and p3SFS and drip sampler flow rates. During Project 41012, the TO
sampling parameters did not adequately hedge against such variability, leading to specific operational
parameters not being within their valid range.
For example, a vessel crew operational decision in TC2 to deballast less water than expected resulted in an
abbreviated deballasting time and the target operational condition for total volume sampled from tank 3P
not being met. To compensate for the reduced deballasting time, GSI personnel increased the flow rate of
the drip sampler, thereby ensuring that an acceptable volume of whole water was collected. However, this
decision resulted in the drip sampler flow rate being above the target range for this specific TC.
Recommendation: Provide guidance to TOs to include safety margins in their TQAP experimental designs.
TQAPs should contain explicit safety cushions in valid range calculations to assure that sufficient volumes
for statistical certainty will be collected even if ballast flow rates and durations are altered. The ETV DSP
should provide for and recommend a sample volume cushion in the sample collection design.
4.1.2.2 Sample/Ballast Flow Proportionality
Section 5.4.3.1.1 of the ETV DSP states “…it is critical that ‘flow proportional’ samples for analysis be obtained
during the entire filling and emptying of the ballast tanks under study.” Ballast rates often vary as ballast tanks
fill/drain, as the ship rises and ballast pump height changes in relation to the water line, and especially when the
ship powers down and restarts its pumps during a ballasting operation. Indirect assessment of ballast rates using
rates of change in ballast tank heights have a significant lag time. The sample flow rate to ballast system flow
rate is difficult to determine under these circumstances in real time. The flow rate or its indirect measures must
be calculated after the fact, making proportionality ultimately a matter of chance. In the end, the ‘flow
proportional’ condition cannot be reliably accomplished without a reliable in situ ballast flow monitoring
capability, which many ballast systems will have but some may not, and a reliable flow meter and flow control
apparatus on the sampling system. In addition, TO sampling systems’ mechanisms for meeting target sample
flow rates and volumes, and any sensors they employ to maintain sample flow proportionality with the ballast
main flow, must be well-calibrated and validated prior to use in ETV DSP testing. GSI’s assessment of BWMS
effectiveness at inactivating zooplankton in these tests was severely compromised by a malfunctioning flow
control/meter apparatus in the p3SFS, a matter only discovered after the tests.
Recommendations: Define acceptable limits for how far the sampling system can stray from proportional
sampling so that at a minimum the TO can determine post facto whether to disqualify the test on the
grounds of disproportionality. GSI also recommends that the ETV DSP provide guidance as to how to best
measure against the limits and at what frequency. If tank heights are to be recorded, the data should be
collected and recorded every 5 minutes or less, and time recorded to seconds in order to give a useful
estimate of the ballasting rate. Sampling system flow meters and control equipment should be empirically
validated, and flow meters should be calibrated, at a land-based testing facility prior to installation on the
ship. Installation-related problems should be assessed prior to commencement of ship testing.
Results of Shipboard Approval Tests of BWT Systems in Freshwater
107
UNCLAS//Public | CG-926 R&DC | Cangelosi, et al. | Public
November 2014
4.1.2.3 Clarifying “Whole Tank” vs. “Partial Tank” Sampling Requirement
The experimental design contained in the ETV DSP requires that the same water in each ballast tank that was
sampled on intake should also be sampled on discharge to assure that challenge conditions are known and met for
experimental water (USEPA, 2012). As noted above, Section 5.4.3.1.1 of the ETV DSP states “…it is critical that
… samples for analysis be obtained during the entire filling and emptying of the ballast tanks under study.” This
requirement is supported by First et al. (2013) which describes the stratification of organisms in land-based tanks
and suggests collecting multiple time-integrated samples throughout the discharge event. However, it is not clear
that sampling a whole tank top to bottom is requisite to representativeness in the actual shipboard environment.
Moreover, in many cases, ship operational constraints may preclude it. For Project 41012, for example, sampling
whole tanks meant that GSI could perform tests on fewer voyages because coal was the only cargo load that
allowed the ship to deballast tanks completely. Sampling the entire contents of experimental ballast tanks on
intake, and a portion of the experimental ballast water on discharge, regardless of which tanks and what
proportion of those tanks, is another possibility that would allow more flexibility for ETV-consistent ship trials.
Recommendation: Validate the assumption that partial tank sampling gives different results from whole
tank sampling on board a ship.
4.1.2.4 Requiring a Qualitative Determination for Whole Effluent Toxicity (WET) on Intake
The ETV DSP experimental design does not require WET testing of ballast intake. Problems could arise,
however, if a BWMS developer fails an ETV DSP validation process as a result of apparent residual effluent
toxicity when the cause was with harbor water quality at the point of uptake.
Recommendation: Require that TOs provide some sort of evidence from the literature, or if necessary from
new empirical tests, to eliminate intake water toxicity as a source for WET post BWMS treatment.
4.1.2.5 Updating Isokinetic vs. Sub-Isokinetic Sampling Requirement
Guidance documents are ambiguous regarding the isokinetic sampling. For example, in Section 5.4.3.1.2 of the
ETV DSP an isokinetic sample port is suggested and this recommendation is expanded upon in Appendix B of
the protocol (USEPA, 2012). However, Appendix B does not recommend isokinetic sampling but a specific sub-
isokinetic range.
Recommendation: Update the ETV DSP text to consistently recommend the same sub-isokinetic range.
4.1.3 Requirements around Challenge Conditions
4.1.3.1 Sedimentation
The ETV DSP states that the TQAPs must include locations for ballasting that will have high likelihoods of
producing sufficiently challenging natural waters for testing subject BWMSs. The TQAPs must also provide the
rationale to support the location selections. TO selection of specific intake locations is often not an option, however.
Also, vessels regularly undertake best management practices to reduce the amount of sediment uploaded during
ballast intake operations, including by raising the position of the vessel’s sea chests. These decisions, though
beneficial in many ways, may result in challenge water parameters not meeting ETV DSP targets.
Maintaining a strict challenge condition for ship test cycles with respect to TSS and POC/POM could lead to the
invalidation of many useful shipboard tests. For example, TC1 would have been invalid on these grounds as the
IH crew employed best management practices to reduce the amount of contaminated sediment in the ballast
water intake.

Results of Shipboard Approval Tests of BWT Systems in Freshwater
108
UNCLAS//Public | CG-926 R&DC | Cangelosi, et al. | Public
November 2014
Recommendation: Since high levels of TSS and POC/POM are required in ETV land-based testing where
water chemistry manipulation is feasible, ETV DSP requirements for meeting these water chemistry
parameters should be removed and the values simply measured and reported.
4.1.3.2 Living Organisms
With regard to living organisms, for the ≥ 50 µm size class the ETV DSP permits TOs to assume 80 % of
organisms in intake are alive, so that live/dead analysis can be by-passed. The idea is sound as it will save
many hours of unnecessary analysis. On the other hand, the assumed percent live may be overly liberal. For
example, in TC1, the live zooplankton fractions in tanks 2P, 3P and 5P were 78, 76, and 72 % , respectively
on intake. In TC2, 84 % of the zooplankton were alive in tank 5P and 73 % in tank 2P, for an average of
79% live density. In TC3 only 41 % to 59% of the zooplankton in intake samples were alive. During TC4
intake, the percentage of live zooplankton in the samples ranged from 43 % to 63 %.
In the ≥10 m and <50 m size class, only two of the four Project 41012 TCs met the ETV DSP target
minimum for 500 cells/mL live organisms, suggesting that this minimum may be hard to meet in all cases.
Recommendation: Lower the presumed percent live for the ≥ 50 µm size class in preserved intake samples,
and allow a higher presumption only with seasonal validation. GSI also recommends that the ETV DSP
soften the requirement that at least four TCs meet biological challenge condition targets to three in the case
of the ≥10 m and <50 m size class.
4.1.3.3 Particulate Organic Matter and Particulate Organic Carbon Relationship
The ETV DSP states that “POM concentration is generally about twice the POC concentration”. Based on
this assumption, TOs could measure POC in place of POM, which requires more analysis effort. Based on
the data collected during TCs 1-3 intake and discharge and TC4 intake, the ETV DSP assumption does not
appear to be correct for the harbors that were sampled. There did not appear to be a consistent relationship
between POM and POC, and in all cases POC concentrations were less than half the POM concentration.
Recommendation: Revisit the assumption that POM concentration is twice that of POC and require that
POM be measured, rather than POC as a surrogate, to assess the challenge water conditions.
4.2 The p3SFS
4.2.1 Hardware
4.2.1.1 Flow Sensor
The flow meter on the p3SFS reported inaccurate flow rates. The movement of the p3SFS’s flow control
valve caused inaccurate reading of the sample flow meter. The sample volume as well as proportionality
with ballast flow is determined using the p3SFS flow meter.
Recommendation: Install the flow meter further downstream from major flow disturbances such as pumps,
control valves and bends. Most flow meter manufacturers provide guidance on these distances. Also,
calibrate the flow meter while it is installed in the p3SFS at a minimum two different flow rates.
4.2.1.2 Additional Sample Ports
In the case of the IH two sample ports were required to alleviate contamination issues given the partial installation
of the BWMS, however, vessels with more complex ballast systems also may require more than just a single

Results of Shipboard Approval Tests of BWT Systems in Freshwater
109
UNCLAS//Public | CG-926 R&DC | Cangelosi, et al. | Public
November 2014
intake and single discharge sampling location. As illustrated during TC 1-4 on the IH, moving the sample ports
after the vessel has taken on ballast can be a difficult and sometimes dangerous process for vessel crews.
Recommendation: Supply enough sample ports so that test vessel crews are not required to move the ports
after the vessel has taken on ballast. The hoses supplying each port should be switchable without unbolting
the port flange from the ballast main.
4.2.1.3 Differential Pressure Sensor
The p3SFS’s differential pressure sensor is unreliable. The manifold for the differential sensor had to be
reset at the start and end of each TC. The supply lines to the manifold also create a contamination concern
as they could potentially hold water from previous uses. Pressure sensors are already installed at the inlets of
each of the p3SFS’s filter canisters.
Recommendation: Install a second pressure sensor downstream of the canister to calculate the differential
pressure across the canister. This would give the pressure in the canister plus the differential over the
canister without the contamination risk of the supply lines to the manifold. It would also remove operational
steps dealing with the manifold.
4.2.1.4 p3SFS Pump Type
The operating range of the p3SFS is limited because the system must be primed by the ballast line.
Recommendation: Switch the p3SFS pump to a self-priming unit to expand the range of conditions in
which the sampling system can operate.
4.2.1.5 Filter Sock Construction
An excessive amount of silicone was used to seal the seams of the p3SFS filter socks, creating an area of
refuge for live organisms that is difficult to rinse. In addition, the filter sock rinsing procedure requires that
the operator place their hand and arm inside the sock in order to turn it inside out for the final rinsing.
Accidental contact with the sample during this procedure may affect the sample’s integrity, and poses the
hazard of contact between the operator and contaminated sediments in the sample.
Recommendation: Seal the p3SFS filter socks with a thinner bead of silicone, and include a cup at the
bottom of the sock (similar to a meshed cod end) that would collect the concentrated sample. The sock
could be rinsed into this cod end, which can then be removed and rinsed into the sample container.
4.2.1.6 Drip Sample Collection
The WET testing performed during TC 2 and 3 discharge sampling following BWMS treatment required a
sample volume up to 50 L. The 50 L carboy was too large for GSI personnel to safely invert to mix the sample.
Recommendation: Modify the p3SFS to allow collection of two drip samples simultaneously into two 19 L
carboys. Care would have to be taken to assure quantitative equivalency of the paired.
4.2.1.7 Grab Sample Collection
The collection of discrete grab samples is not possible using the current version of the p3SFS. Since discrete
grab samples are required by the ETV DSP it makes sense to have the sampling system be able to take grab
samples without the need of a separately installed sample port on the ballast main.
Results of Shipboard Approval Tests of BWT Systems in Freshwater
110
UNCLAS//Public | CG-926 R&DC | Cangelosi, et al. | Public
November 2014
Recommendation: Modify the p3SFS to provide for collection of discrete grab samples.
4.2.2 Software
4.2.2.1 Turbidity Sensor
The p3SFS in-line turbidity sensor reads (i.e., on the control screen) and reports (in the auto-logged data) that it
is measuring TSS and with data reported in “mg/L”, when in fact, the unit is reporting readings in NTU.
Recommendation: Modify the p3SFS control screen and auto-log so that this sensor is measuring turbidity
in NTU.
4.2.2.2 Secure Digital (SD) Card Error Reporting
No electronic data were collected during the TC1 discharge event because the Micro SD card used by the
p3SFS to store data was not formatted. The manual states: “Upon boot-up of the controller, the operator will
be notified if the Micro SD card is missing or improperly installed.” No notification was given, so the
operator believed that the Micro SD card was ready for use.
Recommendation: Modify the p3SFS’s SD card error screen to require user interaction to clear. In this
situation, if a SD card is not formatted properly the user would be alerted.
4.2.2.3 Turbidity Sensor
GSI personnel observed that the turbidity sensor of the p3SFS was prone to quick swings during
deballasting and that during one TC’s discharge operation, the sealant ring on the cable leading into the unit
was unexpectedly far from the body of the unit indicating that it could have been pulled from the unit.
Recommendation: Investigate and/or repair the p3SFS turbidity sensor.
4.2.2.4 Accuracy of Temperature and Turbidity Sensor Measurement Data
GSI personnel observed differences in temperature and turbidity values results depending upon the data
output type and measurement method. These differences raised concern about the accuracy of the
temperature and turbidity data provided by the p3SFS, as four distinct sets of data were derived from the
same parameters. The following data types were collected and compared after TC1:
1. In situ continuous data automatically logged every second by the p3SFS and saved to the SD card.
The output of this data type was an Excel spreadsheet, and basic descriptive statistics (i.e., average
and standard deviation) were performed by GSI.
2. In situ, continuous temperature and turbidity data provided as a summary by the p3SFS (i.e., basic
descriptive statistics performed by the p3SFS) and hand-recorded by GSI at the end of each
sampling operation.
3. Hand-recorded data from the p3SFS AquaSensors display, which was connected to the temperature
and turbidity sensors and provided real-time data. Basic descriptive statistics were performed by
GSI on these data.
4. Measurement data from GSI’s YSI Multiparameter Water Quality Sonde. The temperature and
turbidity (among other water quality parameters) were measured by GSI on the integrated (drip)
sample. This can be considered a time-integrated average of the entire sampling operation.
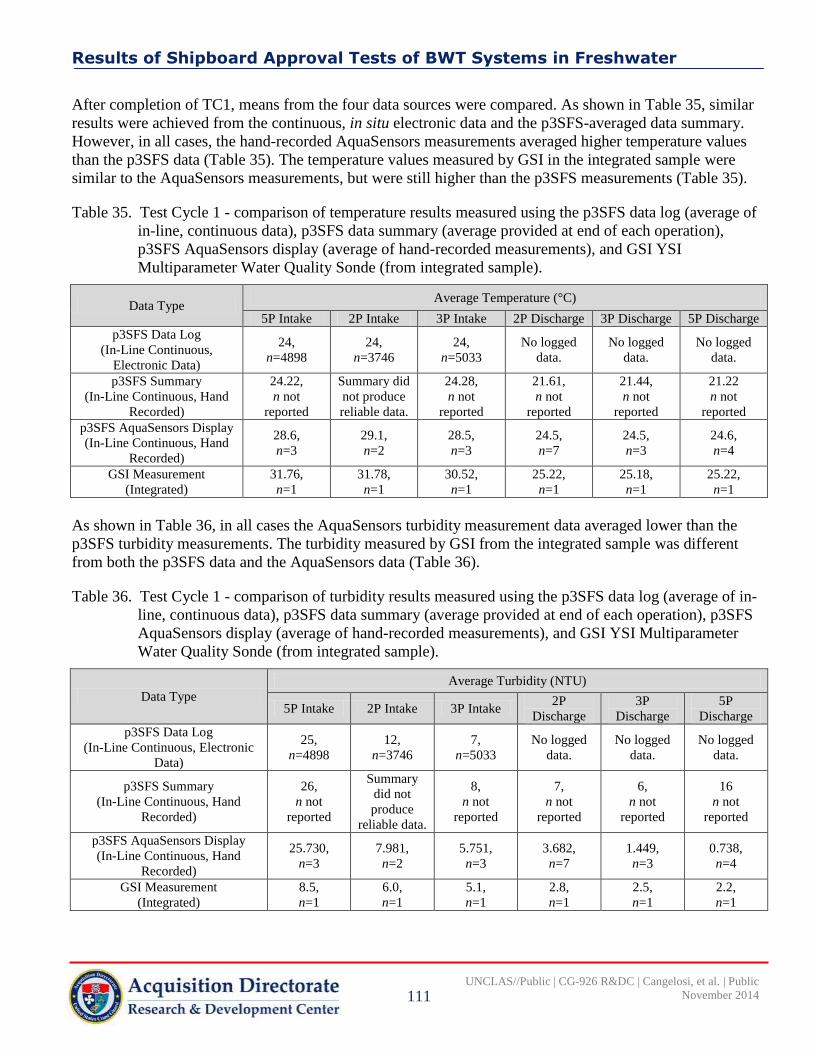
Results of Shipboard Approval Tests of BWT Systems in Freshwater
111
UNCLAS//Public | CG-926 R&DC | Cangelosi, et al. | Public
November 2014
After completion of TC1, means from the four data sources were compared. As shown in Table 35, similar
results were achieved from the continuous, in situ electronic data and the p3SFS-averaged data summary.
However, in all cases, the hand-recorded AquaSensors measurements averaged higher temperature values
than the p3SFS data (Table 35). The temperature values measured by GSI in the integrated sample were
similar to the AquaSensors measurements, but were still higher than the p3SFS measurements (Table 35).
Table 35. Test Cycle 1 - comparison of temperature results measured using the p3SFS data log (average of
in-line, continuous data), p3SFS data summary (average provided at end of each operation),
p3SFS AquaSensors display (average of hand-recorded measurements), and GSI YSI
Multiparameter Water Quality Sonde (from integrated sample).
Data Type Average Temperature (°C)
5P Intake 2P Intake 3P Intake 2P Discharge 3P Discharge 5P Discharge
p3SFS Data Log
(In-Line Continuous,
Electronic Data)
24,
n=4898
24,
n=3746
24,
n=5033
No logged
data.
No logged
data.
No logged
data.
p3SFS Summary
(In-Line Continuous, Hand
Recorded)
24.22,
n not
reported
Summary did
not produce
reliable data.
24.28,
n not
reported
21.61,
n not
reported
21.44,
n not
reported
21.22
n not
reported
p3SFS AquaSensors Display
(In-Line Continuous, Hand
Recorded)
28.6,
n=3
29.1,
n=2
28.5,
n=3
24.5,
n=7
24.5,
n=3
24.6,
n=4
GSI Measurement
(Integrated)
31.76,
n=1
31.78,
n=1
30.52,
n=1
25.22,
n=1
25.18,
n=1
25.22,
n=1
As shown in Table 36, in all cases the AquaSensors turbidity measurement data averaged lower than the
p3SFS turbidity measurements. The turbidity measured by GSI from the integrated sample was different
from both the p3SFS data and the AquaSensors data (Table 36).
Table 36. Test Cycle 1 - comparison of turbidity results measured using the p3SFS data log (average of in-
line, continuous data), p3SFS data summary (average provided at end of each operation), p3SFS
AquaSensors display (average of hand-recorded measurements), and GSI YSI Multiparameter
Water Quality Sonde (from integrated sample).
Data Type
Average Turbidity (NTU)
5P Intake 2P Intake 3P Intake 2P
Discharge
3P
Discharge
5P
Discharge
p3SFS Data Log
(In-Line Continuous, Electronic
Data)
25,
n=4898
12,
n=3746
7,
n=5033
No logged
data.
No logged
data.
No logged
data.
p3SFS Summary
(In-Line Continuous, Hand
Recorded)
26,
n not
reported
Summary
did not
produce
reliable data.
8,
n not
reported
7,
n not
reported
6,
n not
reported
16
n not
reported
p3SFS AquaSensors Display
(In-Line Continuous, Hand
Recorded)
25.730,
n=3
7.981,
n=2
5.751,
n=3
3.682,
n=7
1.449,
n=3
0.738,
n=4
GSI Measurement
(Integrated)
8.5,
n=1
6.0,
n=1
5.1,
n=1
2.8,
n=1
2.5,
n=1
2.2,
n=1

Results of Shipboard Approval Tests of BWT Systems in Freshwater
112
UNCLAS//Public | CG-926 R&DC | Cangelosi, et al. | Public
November 2014
Recommendation: Conduct validation experiments to determine the most accurate inline sensors for
temperature and turbidity, as well as the data output type for the p3SFS that produces the most accurate and
reliable results. Moreover, calibration activities should be performed on in situ measurement devices prior
to ETV DSP tests, and if possible, between TCs. Alternatively, if in-line sensor installation cannot be
routinely calibrated, replace measurements with hand-held calibrated sondes using the seep sampler whole
water samples only.
4.2.3 User Interface
4.2.3.1 Alarms
A low flow alarm sounds when the p3SFS system’s “pump is running at high speeds,” but no alarm warns
that measured flow is outside of the user-defined goal flow, regardless of pump speed.
Recommendation: Add alarms to the p3SFS, including indicating overly high or low sample flow. The
p3SFS’s alarms should be made more noticeable by using a rapid blinking feature since sound-based alarms
are lost in the background noise of the engine room.
4.2.3.2 p3SFS “Cleanability” and Guidance
During Project 41012 implementation, GSI personnel noted that the flexible intake and return hoses
suspended from the ceiling may pose a contamination threat. Internal surfaces in the p3SFS may also
present contamination concerns.
Recommendation: Improve the p3SFS’s cleaning methods and materials for surfaces exposed to sample
water, such as hoses and internal surfaces, in order to ease TO ability to thoroughly clean them.
4.2.3.3 Trend Screen
In their current state, the axes on the trend screen of the p3SFS are not scalable and are difficult to
understand without adequate axis labels.
Recommendation: Modify the usability of the trend screen on the p3SFS by labeling the axes.
4.2.3.4 Installation Checklists
Section 1.4.1 of the p3SFS manual recommends using an installation checklist if the system has not been
used for one week. Though use of an installation checklist is valuable, one week is a short duration of time
to have to recheck many of the items on the list. Also many of the issues would be caught by the p3SFS self
tests.
Recommendation: Relax the inactive period requirement that would trigger installation checks of the
p3SFS.
4.2.3.5 Flow Rate Display
Currently the p3SFS is programmed to display and record instantaneous flow rate to the nearest gallon per
minute. The p3SFS controls flow and calculates the TC summary using more significant digits than are
displayed or logged. During the tests, GSI found that flow rates displayed by the p3SFS controller screen
did not change for long periods of time, which raised questions as to whether the flow sensing system was
functioning properly.

Results of Shipboard Approval Tests of BWT Systems in Freshwater
113
UNCLAS//Public | CG-926 R&DC | Cangelosi, et al. | Public
November 2014
Recommendation: Change the p3SFS display to record flow rate to the 1/10th
gpm so that variations in
flow will appear to provide the user with assurance that the signal is live. This modification would also
make validating the calculated summary data from the p3SFS more feasible because currently averages
from the data log using whole numbers do not match well with system-reported averages because the data
log does not record significant figures. A programming change to the p3SFS should be made to allow
proportional flow control if a flow meter were installed onboard a test vessel.
5 CONCLUSION
GSI found both the ETV DSP and p3SFS to be feasible and promising approaches to shipboard validation of
prospective BWMSs. However, several improvements in both the ETV DSP and the p3SFS must be made to
achieve effective implementation over time, across ships, and across TOs. For example, the ETV DSP
should provide guidance and set requirements around protecting TO staff health and safety during shipboard
tests, including preventing personnel over-extension, and exposure to harmful substances and organisms. It
should also require contingency planning around unplanned changes to ballast flow rates, and implications
for sample/ballast flow proportionality. The protocol must define an acceptable proportionality envelope as
a data quality objective. Another significant logistical matter for the TO and the ship is whether “whole
tanks” need to be sampled on discharge or whether partial tanks are valid sources of discharge water
(provided in both cases that all subject intake water has been sampled and retained without amendment).
Given resident toxicity of many harbors, GSI also recommends that the ETV DSP require a qualitative
determination for WET of intake water to assure proper interpretation of WET outcomes relative to post-
treatment discharge. The ETV DSP required threshold conditions were rarely fully met in the Project 41012
TCs, though failure to meet some of these requirements may not warrant invalidation of entire TCs. Still,
POM and POC requirements are more easily and thoroughly addressed in land-based testing.
In terms of the p3SFS, GSI recommends retooling the positions of the flow control valve and flow meters to
achieve accurate flow meter readings and flow control; streamlining commissioning and operation,
including provision of additional sample ports; improving filter sock construction; and enhancing drip and
grab sample collection capacity. Software improvements are necessary to assure accurate temperature and
turbidity data, digital card error reporting, and pause and resume capacity. The user interface would be
improved by revised alarms, better p3SFS “cleanability” and guidance, a trend screen, installation
checklists, and a flow-rate display.
The BWMS undergoing testing in Project 41012 was a useful subject for the ETV DSP demonstration. The ETV
DSP of this BWMS on the M/V Indian Harbor showed that the BWMS reduced live organism concentrations
relative to those observed during ballast intake, but the treated ballast water discharged by the Indiana Harbor did
not meet the USCG’s March 2012 numerical standards for indicator organism concentrations. WET tests
conducted according to protocols described here showed a significant reduction in C. dubia reproduction
exposed to treated effluent and dilutions thereof, relative to controls. There were no reproduction effect detected
in any other test organism, and no acute effects detected in any test organism. There were also measurable
concentrations of sodium ion found in the treatment discharge from treated tanks.
In conclusion, the ETV DSP represents a strong starting point for a standard shipboard BWT verification
protocol, but greater specificity and clarity in specific areas are needed to assure that TOs have sufficient
guidance to implement the protocol effectively and to avoid expensive false starts or compromised outcomes.

Results of Shipboard Approval Tests of BWT Systems in Freshwater
114
UNCLAS//Public | CG-926 R&DC | Cangelosi, et al. | Public
November 2014
(This page intentionally left blank.)
Results of Shipboard Approval Tests of BWT Systems in Freshwater
115
UNCLAS//Public | CG-926 R&DC | Cangelosi, et al. | Public
November 2014
6 REFERENCES
American Public Health Association (2012). Method 2540 E: Fixed and Volatile Solids Ignited at 550°C. In
American Public Health Association, Standard Methods for the Examination of Water and
Wastewater, 22nd
Edition (pp. 2-67 to 2-68). Washington D.C.: American Public Health Association.
Drake LA, Moser CS, Wier T & Grant J (2012). Ship-Specific Protocol for the Third Prototype Filtration
Skid (p3SFS) During Shipboard Approval Tests of Ballast Water Management Systems. Washington,
D.C.: Naval Research Laboratory, Chemistry Division.
First MR, Robbins-Wamsley SH, Riley SC, Moser CS, Smith GE, Tamburri MN & Drake LA (2013).
Stratification of Living Organisms in Ballast Tanks: How Do Organism Concentrations Vary as
Ballast Water Is Discharged? Environmental Science and Technology; 47 (9): pp 4442–4448.
Great Ships Initiative (2012a). Test/Quality Assurance Plan for Test Cycle 1 of the GSI Evaluation of the
ETV Draft Generic Protocol for the Verification of Ballast Water Treatment Technology in
Shipboard Installations (Version 4.0). Washington, D.C.: Northeast-Midwest Institute.
Great Ships Initiative (2012b). Test/Quality Assurance Plan for Test Cycle 2 of the GSI Evaluation of the
ETV Draft Generic Protocol for the Verification of Ballast Water Treatment Technology in
Shipboard Installations (Version 5.2). Washington, D.C.: Northeast-Midwest Institute.
Great Ships Initiative (2012c). Interim Technical Report: Evaluation of the ETV Draft Protocol for the
Verification of Ballast Water Treatment Technology in Shipboard Installations (Version 4.0): Test
Cycle 1. Washington, D.C.: Northeast-Midwest Institute.
Great Ships Initiative (2013a). Test/Quality Assurance Plan for Test Cycle 3 of the GSI Evaluation of the
ETV Draft Generic Protocol for the Verification of Ballast Water Treatment Technology in
Shipboard Installations (Version 5.2). Washington, D.C.: Northeast-Midwest Institute.
Great Ships Initiative (2013b). Test/Quality Assurance Plan for Test Cycle 4 of the GSI Evaluation of the
ETV Draft Generic Protocol for the Verification of Ballast Water Treatment Technology in
Shipboard Installations (Version 5.2). Washington, D.C.: Northeast-Midwest Institute.
Great Ships Initiative (2013c). GSI/QAQC/QAPP/SB/1 - Quality Assurance Project Plan for Shipboard
Tests, Revision 1. Washington, D.C.: Northeast-Midwest Institute.
Great Ships Initiative (2013d). Interim Technical Report: Evaluation of the ETV Draft Protocol for the
Verification of Ballast Water Treatment Technology in Shipboard Installations (Version 5.2): Test
Cycle 2. Washington, D.C.: Northeast-Midwest Institute.
Great Ships Initiative (2013e). Interim Technical Report: Evaluation of the ETV Draft Protocol for the
Verification of Ballast Water Treatment Technology in Shipboard Installations (Version 5.2): Test
Cycle 3. Washington, D.C.: Northeast-Midwest Institute.
Results of Shipboard Approval Tests of BWT Systems in Freshwater
116
UNCLAS//Public | CG-926 R&DC | Cangelosi, et al. | Public
November 2014
Great Ships Initiative (2013f). Interim Technical Report: Evaluation of the ETV Draft Protocol for the
Verification of Ballast Water Treatment Technology in Shipboard Installations (Version 5.2): Test
Cycle 4. Washington, D.C.: Northeast-Midwest Institute.
United States Coast Guard (2011). Final Rule: Standards for Living Organisms in Ships' Ballast Water
Discharged in U.S. Waters. Published March 23, 2011.
United States Environmental Protection Agency (2014). Great Lakes Areas of Concern. Website:
http://www.epa.gov/greatlakes/aoc/grandcal/
United States Environmental Protection Agency Environmental Technology Verification Program (2012).
Generic Protocol for the Verification of Ballast Water Treatment in Shipboard Installations, Version
5.2. Ann Arbor, MI: National Sanitation Foundation, International.
United States Environmental Protection Agency Office of Water (2002). Short-term Methods for Estimating
the Chronic Toxicity of Effluents and Receiving Waters to Freshwater Organisms, Fouth Edition.
Washington, D.C.: USEPA.

Results of Shipboard Approval Tests of BWT Systems in Freshwater
A-1
UNCLAS//Public | CG-926 R&DC | Cangelosi, et al. | Public
November 2014
APPENDIX A. p3SFS FLOW CONTROL/FLOW METER POST-EXPERIMENT
PROBLEM DIAGNOSIS
After completing the IH-based testing reported here as part of USCG RDC Project No. 41012 titled
Shipboard Approval Tests of Ballast Water Treatment Systems in Freshwaters, GSI planned to undertake a
land-based empirical comparison test of the p3SFS vs. GSI Ship Discharge Monitoring System, using the
GSI land-based sampling system as a “control”, at the GSI land-based testing facility. The purpose was to
validate p3SFS performance under controlled circumstances against previously validated sampling
approaches36
. Prior to collecting biological samples, GSI set out to calibrate and validate performance of the
flow meters of both ships sampling systems subject to comparison. In calibrating and validating the p3SFS
flow meters, GSI directed water through the GSI land-based facility piping system into the p3SFS and a 227
gallon graduated tank. The calibration plan involved the following procedure.
1. The sample system was set to a target flow rate;
2. The sample system was started-up; water was not collected until the sample system had reached and
stabilized on its target flow rate;
3. Once stable, the discharge flow was channeled into a tank with known volume. The duration to fill
the tank was timed as well as the totalizer reading recorded at the start and end of the tank;
4. The flow meter reported volume was compared to the actual tank volume; and
5. If the flow meter was off, a correction factor would be calculated and applied and the system would
be rechecked starting with step 1.
The p3SFS calibration procedure required multiple repetitions of Step 5– the attempt to apply a correction
factor – because the p3SFS flow meter continued to give inaccurate results. NRL sent a replacement flow
meter of a similar make and GSI installed it and re-ran the calibration, but the same issue remained with the
new flowmeter. Attempted troubleshooting methods are listed below:
1. Replacement of the flow meter;
2. Using the flow meters built in flow calibration;
3. Manual calculation of k factors;
4. Restoring manufactures recommended k factor;
5. Better grounding the flow meter;
6. Changing the p3SFS pump speed;
7. Applying more back pressure to the skid to better simulate its intended installation;
8. Cleaning of the flow meters contacts;
9. Checking and realigning flow meter in its port; and
10. Running at different flow rates.
36
GSI (2014). Test/Quality Assurance Plan: Empirical Comparison of GSI and NRL Shipboard Sampling Systems at the GSI
Land-Based Testing Facility. Washington, D.C.: Northeast-Midwest Institute.

Results of Shipboard Approval Tests of BWT Systems in Freshwater
A-2
UNCLAS//Public | CG-926 R&DC | Cangelosi, et al. | Public
November 2014
Finally, it was concluded that the flow control valve upstream of the flow meter must be causing the
inaccurate flow meter results. It is likely that when the control valve moved in response to changes in net
porosity or other flow fluctuations, it caused turbulence in the flow meter. It would be possible to calibrate
the flow meter for a single flow rate if the control valve were held in a single position. Unfortunately, the
control valve must move to maintain a flow rate as the sample nets clog. As a result it is very unlikely that
the p3SFS could maintain the appropriate flow rate while collecting samples. The comparison between the
two sampling systems was abandoned pending redesign of the p3SFS. In addition, data from the USCG
RDC Project No. 41012 titled Shipboard Approval Tests of Ballast Water Treatment Systems in
Freshwaters, involving knowledge of flow (i.e. zooplankton concentrations) were invalidated.

Results of Shipboard Approval Tests of BWT Systems in Freshwater
B-1
UNCLAS//Public | CG-926 R&DC | Cangelosi, et al. | Public
November 2014
APPENDIX B. GSI TEST/QUALITY ASSURANCE PLAN (TQAP)
Double click to open the standalone file.

Results of Shipboard Approval Tests of BWT Systems in Freshwater
B-2
UNCLAS//Public | CG-926 R&DC | Cangelosi, et al. | Public
November 2014
(This page intentionally left blank.)

Results of Shipboard Approval Tests of BWT Systems in Freshwater
C-1
UNCLAS//Public | CG-926 R&DC | Cangelosi, et al. | Public
November 2014
APPENDIX C. GSI QUALITY ASSURANCE PROJECT PLAN (QAPP) FOR
SHIPBOARD TESTS
Double click to open the standalone file.
Results of Shipboard Approval Tests of BWT Systems in Freshwater
C-2
UNCLAS//Public | CG-926 R&DC | Cangelosi, et al. | Public
November 2014
(This page intentionally left blank.)

GSI/QAQC/QAPP/SB/1 Revision 1: May 13, 2013
Page 1 of 56
© Northeast-Midwest Institute 2013.
GREAT SHIPS INITIATIVE (GSI) QUALITY ASSURANCE PROJECT PLAN (QAPP)
FOR SHIPBOARD TESTS
REVISION 1 May 13, 2013
Compiled By: Name: Nicole Mays Title: GSI Senior Quality Systems Officer
Signed:
Name: Kelsey Prihoda Title: GSI Senior Quality Assurance/Quality
Control Officer Signed:
Approved By: Name: Allegra Cangelosi Title: GSI Principal Investigator & Director
Signed:

GSI/QAQC/QAPP/SB/1 Revision 1: May 13, 2013
Page 2 of 56
© Northeast-Midwest Institute 2013.
Reviewed By: Name: Mary Balcer Title: GSI Senior Zooplankton Scientist & LSRI
Team Leader Signed: Reviewed By: Name: Euan Reavie
Title: GSI Senior Protist Scientist & NRRI Team Leader
Signed: Reviewed By: Name: Matthew TenEyck
Title: GSI Lead Investigator for Whole Effluent Toxicity Tests and Bench-Scale Studies
Signed: Reviewed By: Name: Deanna Regan Title: GSI Chemist Signed: Reviewed By: Name: Heidi Saillard Title: GSI Microbial Analyst Signed:
Reviewed By: Name: Tyler Schwerdt Title: GSI Engineer
Signed: Reviewed By: Name: Travis Mangan
Title: GSI Test Manager Signed:

GSI/QAQC/QAPP/SB/1 Revision 1: May 13, 2013
Page 3 of 56
© Northeast-Midwest Institute 2013.
RecordofRevisions
RevisionNumber DescriptionofChanges1 General (minor) edits throughout.

GSI/QAQC/QAPP/SB/1 Revision 1: May 13, 2013
Page 4 of 56
© Northeast-Midwest Institute 2013.
TABLE OF CONTENTS
LIST OF ABBREVIATIONS AND ACRONYMS .......................................................................................................... 6
1. INTRODUCTION .............................................................................................................................................. 7
2. QAPP DISTRIBUTION LIST ............................................................................................................................... 7
3. BACKGROUND ................................................................................................................................................ 7
4. PROJECT MANAGEMENT ................................................................................................................................ 9
4.1. PROJECT ORGANIZATION .......................................................................................................................................... 9 4.1.1. Principal Investigator and Director ............................................................................................................ 9 4.1.2. Advisory Committee ................................................................................................................................... 9 4.1.3. Industry Outreach....................................................................................................................................... 9 4.1.4. Technical Advisors ...................................................................................................................................... 9 4.1.5. Financial Management ............................................................................................................................ 10 4.1.6. Quality Management ............................................................................................................................... 10 4.1.7. Senior Research Team .............................................................................................................................. 10
4.2. PROJECTS AND ACTIVITIES ....................................................................................................................................... 14
5. QAPP COVERAGE AND PROCESS FOR DEVIATIONS ......................................................................................... 14
5.1. QAPP COVERAGE ............................................................................................................................................. 14 5.2. AUTHORITY ...................................................................................................................................................... 14 5.3. PROCESS FOR DEVIATIONS ................................................................................................................................... 16
6. GSI SHIPBOARD TEST ACTIVITIES ................................................................................................................... 16
6.1. DOCUMENTATION ................................................................................................................................................. 16 6.2. TEST OBJECTIVES .................................................................................................................................................. 17 6.3. EXPERIMENTAL DESIGN .......................................................................................................................................... 17 6.4. APPLICABLE STANDARDS/CRITERIA ........................................................................................................................... 18
7. DATA GENERATION AND ACQUISITION ......................................................................................................... 23
7.1. DATA GENERATION ............................................................................................................................................... 23 7.2. DATA ACQUISITION ............................................................................................................................................. 25
7.2.1. Biology ...................................................................................................................................................... 26 7.2.2. Water Quality ......................................................................................................................................... 28 7.2.3. Water Chemistry ..................................................................................................................................... 28 7.2.4. Whole Effluent Toxicity (WET) ................................................................................................................ 29 7.2.5. Operational and Other Data ................................................................................................................... 30
8. SAMPLE LABELING, HANDLING AND CUSTODY ............................................................................................... 31
8.1. SAMPLE LABELING ............................................................................................................................................... 31 8.2. SAMPLE HANDLING .............................................................................................................................................. 31 8.2. SAMPLE CUSTODY ................................................................................................................................................ 31
9. QUALITY OBJECTIVES AND CRITERIA FOR MEASUREMENT DATA ................................................................... 32
9.1. REPRESENTATIVENESS ............................................................................................................................................ 32 9.2. ACCURACY ........................................................................................................................................................... 32 9.3. PRECISION ........................................................................................................................................................... 33 9.4. BIAS ................................................................................................................................................................... 34

GSI/QAQC/QAPP/SB/1 Revision 1: May 13, 2013
Page 5 of 56
© Northeast-Midwest Institute 2013.
9.4.1. Experimental Bias ..................................................................................................................................... 34 9.4.2. Operator Bias .......................................................................................................................................... 34
9.5. COMPARABILITY .................................................................................................................................................... 36 9.6. COMPLETENESS .................................................................................................................................................... 36 9.7. GSI PERFORMANCE CRITERIA .................................................................................................................................. 38
10. DATA ANALYSIS AND MANAGEMENT........................................................................................................... 39
10.1. DATA PROCESSING, REVIEW AND VERIFICATION, AND STORAGE ................................................................................... 39 10.2. DATA ANALYSIS .................................................................................................................................................. 40 10.3. DATA REPORTING ............................................................................................................................................... 40
11. SPECIAL TRAINING REQUIREMENTS/CERTIFICATION .................................................................................... 41
11.1. PROJECT‐SPECIFIC QAQC TRAINING FOR RESEARCH PERSONNEL ................................................................................. 41 11.2. PROJECT‐SPECIFIC TRAINING FOR RESEARCH PERSONNEL ............................................................................................ 41 11.3. CONTRACTING‐ENTITY TRAINING ........................................................................................................................... 41
12. DOCUMENTS AND RECORDS ........................................................................................................................ 42
12.1. DOCUMENT AND RECORDS MANAGEMENT .............................................................................................................. 42 12.1.1 Delegation of Authority ........................................................................................................................... 42 12.1.2. Format .................................................................................................................................................... 42 12.1.3. Revision .................................................................................................................................................. 42 12.1.4. Maintenance .......................................................................................................................................... 43
12.2. SPECIFIC DOCUMENTS AND RECORDS ...................................................................................................................... 43 12.2.1. Quality Management Plan (QMP) .......................................................................................................... 43 12.2.2. Quality Assurance Project Plans (QAPPs) ............................................................................................... 43 12.2.3. Test/Quality Assurance Plans (TQAPs) ................................................................................................... 44 12.2.4. Standard Operating Procedures (SOPs) .................................................................................................. 44 12.2.5. Field and Laboratory Notebooks ............................................................................................................ 45 12.2.6. Forms and Records ................................................................................................................................. 45 12.2.7. Personnel Records ................................................................................................................................ 45 12.2.8. Test Findings and Other GSI Products .................................................................................................... 46 12.2.9. Quality Assurance/Quality Control Records ........................................................................................... 46
13. QUALITY CONTROL REQUIREMENTS ............................................................................................................ 46
14. INSTRUMENT/EQUIPMENT INSPECTION, CALIBRATION AND MAINTENANCE ............................................... 48
15. QUALITY ASSURANCE ASSESSMENT AND OVERSIGHT .................................................................................. 51
15.1. ASSESSMENT ...................................................................................................................................................... 51 15.1.1. TQAP and QAPP Audits ........................................................................................................................... 51 15.1.2. SOP Audits .............................................................................................................................................. 51 15.1.3. Project‐Specific Data Recording and Archiving Audits ........................................................................... 52 15.1.4. Project‐Specific Data Quality Assessments ............................................................................................ 52 15.1.5. Project‐Specific Performance Criteria Assessments ............................................................................... 53
15.2. RESPONSE ......................................................................................................................................................... 53 15.2.1. Corrective Action Reports ....................................................................................................................... 53
16. REFERENCES ................................................................................................................................................ 53
APPENDIX 1. MATRIX OF RELEVANT GSI STANDARD OPERATING PROCEDURES (SOPS). ..................................... 55

GSI/QAQC/QAPP/SB/1 Revision 1: May 13, 2013
Page 6 of 56
© Northeast-Midwest Institute 2013.
LIST OF ABBREVIATIONS AND ACRONYMS %T: Percent Transmittance BWMS: Ballast Water Management System CFU: Colony Forming Units CMFDA: 5-Chloromethylfluorescein Diacetate DOC: Dissolved Organic Carbon DOM: Dissolved Organic Matter ETV: Environmental Technology Verification FDA: Fluorescein Diacetate GSI: Great Ships Initiative HCl: Hydrochloric Acid HDPE: High Density Polyethylene IMO: International Maritime Organization LSRI: Lake Superior Research Institute MM: Mineral Matter MPN: Most Probable Number MTSA: Maritime Transportation Security Act NEMWI: Northeast-Midwest Institute NPOC: Non-Purgeable Organic Carbon NRRI: Natural Resources Research Institute PI: Principal Investigator POC: Particulate Organic Carbon POM: Particulate Organic Matter PVC: Polyvinyl Chloride QA: Quality Assurance QAPP: Quality Assurance Project Plan QAQC: Quality Assurance/Quality Control QC: Quality Control QMP: Quality Management Plan RDTE: Research, Development, Testing, and Evaluation SOP: Standard Operating Procedure STEP: Shipboard Technology Evaluation Program TOC: Total Organic Carbon TQAP: Test/Quality Assurance Project Plan TRO: Total Residual Oxidants TSS: Total Suspended Solids TWICTM: Transportation Worker Identification Credential UMD: University of Minnesota-Duluth USCG: United States Coast Guard USEPA: United States Environmental Protection Agency UWS: University of Wisconsin-Superior WET: Whole Effluent Toxicity

GSI/QAQC/QAPP/SB/1 Revision 1: May 13, 2013
Page 7 of 56
© Northeast-Midwest Institute 2013.
1. INTRODUCTION
This Quality Assurance Project Plan (QAPP) describes the activities undertaken by the Great Ships Initiative (GSI) to assure the quality and credibility of its shipboard test findings. The plan covers all aspects of quality assurance/quality control (QAQC), including data quality indicators, evaluation processes, performance measures and acceptance criteria; instrument/equipment certification and calibration; personnel training requirements; documents and records; data management; and QAQC assessments and response actions.
2. QAPP DISTRIBUTION LIST
Recipients of this QAPP are listed in Table 1. The list includes the GSI Principal Investigator and Director (GSI PI), Ms. Allegra Cangelosi; GSI quality management personnel; and GSI biological, chemical and operational research members.
3. BACKGROUND GSI is a regional effort devoted to ending the problem of ship-mediated invasive species in the Great Lakes-St. Lawrence Seaway System and globally. Since its establishment in 2006, GSI has provided high quality independent performance/verification testing services to developers of ballast water management systems (BWMSs). GSI currently offers independent status-testing and certification/verification testing services at the bench, land-based and shipboard scales. GSI performs informal status-testing for BWMSs that are in the research and development stage, and formal certification/verification tests appropriate to market-ready BWMSs. Concurrent with its bench, land-based and shipboard testing activities, GSI undertakes methods development (including validation of U.S. Environmental Protection Agency (USEPA), Environmental Technology Verification (ETV) Program protocols; Ship Discharge Monitoring, and a collaborative project involving Ship-Mediated Harmful Microbes in the Great Lakes), as well as other relevant research activities. Most recent GSI research activities include a Risk Release Project that is generating empirical information on the relationship between numbers of invaders released, and the actual risk of establishment. To ensure GSI remains completely independent and is uncompromised by any real or perceived individual or project bias, GSI subjects itself to rigorous quality management policies and procedures, as outlined in GSI’s Quality Management Plan (QMP; GSI, 2013). In addition, GSI test activities are subject to rigorous QAQC procedures and documentation, as detailed in this document. This attention to quality management and QAQC assures the high quality and credible evaluation of both GSI and its findings.

GSI/QAQC/QAPP/SB/1 Revision 1: May 13, 2013
Page 8 of 56
© Northeast-Midwest Institute 2013.
Table 1. QAPP Distribution List.
QAPP Recipient Project Role Organization Contact Information
Ms. Allegra Cangelosi GSI Principal Investigator and
Director Northeast-Midwest Institute [email protected]
Ms. Nicole Mays GSI Senior Quality Systems Officer Northeast-Midwest Institute [email protected]
Ms. Kelsey Prihoda GSI Senior QAQC Officer Lake Superior Research Institute [email protected]
Dr. Mary Balcer GSI Senior Zooplankton Scientist
and LSRI Team Leader Lake Superior Research Institute [email protected]
Dr. Euan Reavie GSI Senior Protist Scientist
and NRRI Team Leader Natural Resources Research Institute [email protected]
Mr. Matthew TenEyck GSI Lead Investigator for Whole Effluent
Toxicity (WET) Tests and Bench-Scale Studies Lake Superior Research Institute [email protected]
Mr. Tyler Schwerdt GSI Engineer AMI Consulting Engineers PA [email protected]
Mr. Travis Mangan GSI Test Manager Northeast-Midwest Institute [email protected]
Mr. Adam Marksteiner Assistant GSI Engineer AMI Consulting Engineers PA [email protected]
Dr. Meghana Desai Senior Scientist Northeast-Midwest Institute [email protected]
Ms. Deanna Regan GSI Chemist Lake Superior Research Institute [email protected]
Ms. Heidi Saillard GSI Microbial Analyst Lake Superior Research Institute [email protected]
Ms. Kimberly Beesley GSI Assistant Microbial Analyst and Chemist Lake Superior Research Institute [email protected]
Ms. Heidi Schaffer GSI Zooplankton Analyst Lake Superior Research Institute [email protected]
Ms. Lana Fanberg GSI Zooplankton Analyst Lake Superior Research Institute [email protected]
Ms. Christine Polkinghorne GSI WET Test and Bench-Scale Analyst Lake Superior Research Institute [email protected]
Ms. Lisa Allinger GSI Protist Analyst Natural Resources Research Institute [email protected]
Ms. Elaine Ruzycki GSI Protist Analyst Natural Resources Research Institute [email protected]
Ms. Meagan Aliff GSI Protist Analyst Natural Resources Research Institute [email protected]
Dr. Esther Angert Microbial Consultant Cornell University [email protected]
Mr. Donald Reid GSI Biological Operations Specialist Independent Consultant [email protected]
Mr. Steven Hagedorn GSI Database Manager Lake Superior Research Institute [email protected]

GSI/QAQC/QAPP/SB/1 Revision 1: May 13, 2013
Page 9 of 56
© Northeast-Midwest Institute 2013.
4. PROJECT MANAGEMENT
4.1. PROJECT ORGANIZATION
GSI is a project of the Northeast-Midwest Institute (NEMWI)--a Washington, D.C-based private, non-profit, and non-partisan research organization dedicated to the economic vitality, environmental quality, and regional equity of Northeast and Midwest states. The project is carried out collaboratively with contracting entities including the University of Wisconsin-Superior (UWS), Broadreach Services, AMI Consulting Engineers and the University of Minnesota-Duluth (UMD). For purposes of this QAPP, GSI is defined as the testing organization.
4.1.1. PRINCIPAL INVESTIGATOR AND DIRECTOR Ms. Allegra Cangelosi of NEMWI is the GSI PI. She is responsible for planning and leading the overall GSI testing and research agenda; developing experimental designs; approving quality system documents, Test/Quality Assurance Project Plans (TQAPs) and standard operating procedures (SOPs); and making all final decisions on GSI shipboard sampling designs and modifications. In coordination with other GSI research team personnel, she is responsible for analyzing GSI experimental outcomes and writing up findings. She is also responsible for coordinating GSI testing and research activities and funds to support them, and interaction with the project Advisory Committee, BWMS developers, regulatory community, and public. She is assisted by Ms. Nicole Mays of NEMWI in many of these capacities.
4.1.2. ADVISORY COMMITTEE A GSI Advisory Committee comprising elected and top-level officials of key stakeholder groups provides direct input to Ms. Cangelosi, advising on GSI award decisions, program direction, finances and fund-raising. The GSI Advisory Committee, which meets approximately three times a year, includes elected leadership and top-level representatives of environmental organizations, Great Lakes port authorities, federal agencies from the United States and Canada, and industry.
4.1.3. INDUSTRY OUTREACH The American Great Lakes Ports Association advises the project, assuring that GSI is well targeted to the needs of the maritime industry in its effort to comply or exceed regulatory requirements, and coordinating maritime industry and supply chain outreach.
4.1.4. TECHNICAL ADVISORS GSI draws on advice from many technical advisors in protocol development, data analysis and to review applications for GSI services from time to time. The relationship with these advisors is informal, voluntary, and on an as-needed basis. Experts include marine engineers, process engineers, toxicologists, biologists and test facility operators.

GSI/QAQC/QAPP/SB/1 Revision 1: May 13, 2013
Page 10 of 56
© Northeast-Midwest Institute 2013.
4.1.5. FINANCIAL MANAGEMENT Ms. Amy Brooks, an independent consultant from Broadreach Services, is the GSI Financial Manager. In this role she is responsible for management of all GSI accounts and financial documents. She also works closely with the GSI PI to develop budget projections, planning documents, and financial information for grant applications.
4.1.6. QUALITY MANAGEMENT Ms. Nicole Mays of NEMWI is the GSI’s Senior Quality Systems Officer responsible for development and maintenance of the GSI QMP, and GSI’s QAPPs and SOPs, and assisting in the development and maintenance of TQAPs. Ms. Kelsey Prihoda of the UWS’s Lake Superior Research Institute (LSRI) is the GSI’s Senior QAQC Officer. She is responsible for implementing all GSI project-specific QAQC activities including audits and assessments, and write-up of QAQC reports on specific test activities. Ms. Prihoda is also responsible for assisting in the development of SOPs, TQAPs and QAPPs.
4.1.7. SENIOR RESEARCH TEAM Researchers from UWS’s LSRI and the UMD’s Natural Resources Research Institute (NRRI), among others, provide critical scientific and technical complementary expertise and implementation services to the GSI PI. Dr. Mary Balcer of LSRI is GSI’s Senior Zooplankton Scientist and LSRI Team Leader. In the first role, she is responsible for developing SOPs and coordinating with GSI research personnel to assure effective zooplankton sample collection and handling. She is also responsible for the supervision of LSRI technicians in the implementation of relevant SOPs. In the latter role she serves as LSRI’s primary contact and is responsible for LSRI’s GSI-related project activities, including development of budgets, statements of work, scheduling, hiring, and contractual matters. Mr. Matt TenEyck is GSI’s Lead Investigator for Whole Effluent Toxicity (WET) Tests and Bench-Scale Studies. In this role Mr. TenEyck is responsible for development and implementation of WET testing SOPs and coordinating with GSI research personnel to assure effective sample collection and handling. Dr. Euan Reavie of UMD’s NRRI is GSI’s Senior Protist Scientist and NRRI Team Leader. In the first role he is responsible for development of protist SOPs, coordinating with GSI research personnel to assure effective protist sample collection and handling, and supervision of technicians in the implementation of relevant SOPs. In the latter role he serves as NRRI’s primary contact and is responsible for NRRI’s GSI-related project activities, including development of budgets, statements of work, scheduling, hiring, and contractual matters. Ms. Heidi Saillard of LSRI is GSI’s Microbial Analyst. She is responsible for development and implementation of the microbial-related SOPs, coordinating with GSI personnel to assure appropriate microbial sample collection and handling, and analysis of microbial samples according to relevant SOPs. She is advised by Dr. Esther Angert of Cornell University’s

GSI/QAQC/QAPP/SB/1 Revision 1: May 13, 2013
Page 11 of 56
© Northeast-Midwest Institute 2013.
Department of Microbiology (Ithaca, New York). Ms. Deanna Regan of LSRI is GSI’s Chemist. In this role she is responsible for development and implementation of chemistry-related SOPs at all scales of testing. Ms. Regan also works closely with Mr. Matt TenEyck to help execute SOPs at the bench-scale, particularly those involving active substances. Mr. Tyler Schwerdt of AMI Consulting Engineers P.A. is GSI’s Engineer. In this role Mr. Schwerdt serves as the field engineer supporting GSI shipboard test activities. In addition Mr. Schwerdt is responsible for the development of SOPs as they relate to operational/engineering aspects of GSI shipboard tests, and coordinating with the GSI PI and senior researchers to assure effective sample and data collection. Mr. Schwerdt works under the supervision of Mr. Chad Scott, President and Principal of AMI Consulting Engineers, and is assisted by Mr. Adam Marksteiner, also of AMI Consulting Engineers. GSI’s Test Manager (Mr. Travis Mangan, NEMWI) works under the direct supervision of the GSI PI, and his role is to support GSI research and operational personnel to assure effective testing onboard ships. Mr. Mangan assures that all equipment and supplies are in a ready state for each testing event, and facilitates real-time communication between the research team and Ms. Cangelosi during test activities. During shipboard testing activities, Mr. Mangan also provides a central locus of communication with the PI to assure thorough transmittal of relevant new information to the active team. In addition, Mr. Mangan provides scientific and engineering/operational support as needed and is responsible for coordinating GSI’s discharge permit reporting requirements. Dr. Meghana Desai, Senior Scientist at NEMWI, advises and assists with TQAP development and implementation. Mr. Donald Reid, GSI’s Biological Operations Specialist, assists with biological sample collection operations. Mr. Steve Hagedorn of LSRI is GSI’s Database Manager, responsible for management of the GSI Zooplankton and Protist Databases and development and implementation of relevant SOPs. Mr. Hagedorn works closely with GSI’s senior scientists and the GSI Senior QAQC Officer to undertake this role. Overall, GSI personnel have extensive expertise in independent status-testing and certification/verification testing services of BWMSs. The GSI QMP (GSI, 2013) assures that personnel have the necessary education, qualifications, and experience needed to effectively carry out their specific roles and responsibilities within the project. Figure 1 details the GSI’s organizational structure while Table 2 lists all GSI personnel involved in shipboard testing activities, their role in the project, parent organization, educational background, and number of years of relevant professional experience. Specific to the suite of tests detailed in this document, i.e., shipboard testing, Table 2 also identifies those personnel with Transportation Worker Identification Credential (TWIC™). This credential allows for access to secure areas of Maritime Transportation Security Act (MTSA) regulated facilities and vessels.

GSI/QAQC/QAPP/SB/1 Revision 1: May 13, 2013
Page 12 of 56
© Northeast-Midwest Institute 2013.
Figure 1. Organizational Structure of the GSI.

GSI/QAQC/QAPP/SB/1 Revision 1: May 13, 2013
Page 13 of 56
© Northeast-Midwest Institute 2013.
Table 2. Name, Project Role, Parent Organization, Experience and Education of GSI Personnel, as well as Transportation Worker Identification Credential (TWIC™) Status.
GSI Personnel GSI Role in Project Parent
Organization
No. of Years of Relevant Experience
Education TWICTM
Ms. Allegra Cangelosi Principal Investigator and Director
Northeast-Midwest Institute
20+ MSc No
Ms. Nicole Mays Senior Quality Systems Officer 15+ BSc No
Mr. Travis Mangan Test Manager 3+ BSc Yes
Dr. Meghana Desai Senior Scientist 5+ PhD No
Mr. Tyler Schwerdt Engineer
AMI Consulting Engineers, PA
5+ BSc Yes
Mr. Adam Marksteiner Assistant Engineer 1+ BSc Yes
Mr. Donald Reid Biological Operations Specialist Independent Consultant
20+ MSc No
Dr. Mary Balcer Senior Zooplankton Scientist &
LSRI Team Leader
Lake Superior Research Institute,
University of Wisconsin-Superior
30+ PhD Yes
Mr. Matthew TenEyck Lead Investigator for Whole Effluent
Toxicity (WET) and Bench Tests 10+ MSc Yes
Ms. Deanna Regan Chemist 3+ BSc No
Ms. Christine Polkinghorne
Chemist 15+ MSc No
Ms. Kelsey Prihoda Senior QA/QC Officer 5+ MSc Yes
Ms. Heidi Saillard Senior Microbial Analyst 5+ BSc Yes
Mr. Steve Hagedorn Database Manger 10+ BSc No
Ms. Heidi Schaefer Zooplankton Analysts
5+ BSc No
Ms. Lana Fanberg 3+ BSc No
Ms. Kimberly Beesley Microbial and Zooplankton Analyst 2+ BSc No
Dr. Euan Reavie Senior Protist Scientist & NRRI
Team Leader Natural Resources Research Institute,
University of Minnesota-Duluth
20+ PhD Yes
Ms. Lisa Allinger
Protist Analysts
5+ MSc Yes
Ms. Elaine Ruzycki 10+ MSc No
Ms. Meagan Aliff 1+ BSc No

GSI/QAQC/QAPP/SB/1 Revision 1: May 13, 2013
Page 14 of 56
© Northeast-Midwest Institute 2013.
4.2. PROJECTS AND ACTIVITIES
GSI’s current suite of projects and activities includes independent status-testing and certification/verification testing services of BWMSs at three scales—bench, land-based, and onboard ship. Each scale is dedicated to addressing specific evaluation objectives. This QAPP is specific to GSI shipboard tests which generally take place on board commercial vessels in the Great-Lakes-St. Lawrence Seaway System during normal vessel operations and involve collection and analysis of continuous in-line samples during ballast intake and/or discharge operations. In general, the goals of GSI shipboard tests include:
Demonstration or confirmation of biological and operational BWMS performance as expected in the ship environment;
U.S. Coast Guard (USCG) Shipboard Technology Evaluation Program (STEP) testing; Type approval/USEPA ETV testing, i.e., formal assessment of performance against
international and other discharge standards; and Post-approval ballast discharge monitoring.
In terms of formal certification/verification tests, GSI can partner with the Maritime Environmental Research Center, NSF International and Retlif Testing Laboratories to conduct evaluation, inspection and testing of BWMSs under the auspices of a United States Coast Guard-approved "Independent Laboratory".
5. QAPP COVERAGE AND PROCESS FOR DEVIATIONS 5.1. QAPP COVERAGE This QAPP describes the activities undertaken by GSI to assure the quality and credibility of its shipboard test findings. The QAPP is valid from date of GSI PI signature for a period of five years. It will be reviewed annually, with revisions made on an as-needed basis following the annual review. 5.2. AUTHORITY The specific roles and responsibilities of GSI personnel with respect to this QAPP are:
GSI Principal Investigator and Director
Leads GSI research team; Approves budget and planning processes relative to GSI shipboard tests; Designs and implements the GSI shipboard testing agenda; Approves quality system documents, including shipboard QAPPs, BWMS-specific
TQAPs, and SOPs; Issues stop/go orders on day-to-day test activities;

GSI/QAQC/QAPP/SB/1 Revision 1: May 13, 2013
Page 15 of 56
© Northeast-Midwest Institute 2013.
Issues stop/go orders on any SOP deviations deemed necessary during testing; Ensures GSI addresses quality management in all shipboard testing areas, and that
appropriate documentation is developed; Ensures GSI complies with the GSI QMP and other quality system documents; Maintains an active line of communication with GSI quality management personnel; Requires and facilitates implementation of corrective actions and recommendations for
improvement; and Fosters an atmosphere where quality management practices are a beneficial, integral and
requisite part of GSI daily activities.
GSI Quality Management Personnel
Develop, review, revise and maintain shipboard QAPPs and TQAPs for GSI PI approval; Develop, review, revise and maintain shipboard SOPs for GSI PI approval; Facilitate GSI compliance on a day-to-day basis with the GSI QMP, QAPPs, TQAPs, and
other quality system documents during all shipboard test activities; Schedule and implement quality system audits and assessments; Generate and report results of audit and assessments; Monitor and report GSI quality system progress; Make recommendations to the GSI PI for GSI quality system improvements. Maintain adequate independence and separation from GSI personnel involved in data
collection and analysis to assure objective review. GSI Senior Research Team Personnel
Support the GSI PI in developing the shipboard test agenda, and experimental designs; Develop relevant methods for inclusion in shipboard TQAPs and SOPs; Directly implement shipboard test activities consistent with GSI quality system
documents; Help select, schedule and supervise GSI research team members to assure their work is
consistent with quality system documents; Support development of GSI quality system documents (i.e., QMP, QAPPs, TQAPs,
SOPs); Ensure GSI addresses and correctly implements quality management in all project areas
and that appropriate documentation is developed; Maintain active lines of communication with GSI quality management personnel; and Implement corrective actions required by the GSI PI in response to GSI QAQC
assessments. GSI Research Team Personnel
Support senior research team personnel; Implement shipboard test activities consistent with GSI QAPPs, TQAPs and SOPs;

GSI/QAQC/QAPP/SB/1 Revision 1: May 13, 2013
Page 16 of 56
© Northeast-Midwest Institute 2013.
Maintain active lines of communication with GSI quality management personnel; Respond and report to senior research staff and implement corrective actions that may be
required. 5.3. PROCESS FOR DEVIATIONS GSI senior research personnel are responsible for resolving any temporary or day-to-day issues pertaining to implementation of this QAPP, BWMS-specific TQAPs and SOPs relevant to GSI shipboard test activities. All known deviations must be communicated to the GSI Senior QAQC Officer and the GSI PI as they occur. The GSI PI has sole authority to issue stop/go orders on day-to-day test activities (except critical interventions needed to maintain worker health and safety), as well as on any SOP deviations deemed necessary during testing. Deviations must be recorded on a GSI Deviation Form—GSI/FORM/QAQC/1 - GSI QAPP, TQAP (Test Plan) and SOP Deviation Form—as they occur. This form lists the date and time of the deviation, the description of the deviation, any impact on testing, and any corrective actions taken. The deviation form is signed by the GSI PI and the relevant senior research team member. The GSI Senior QAQC Officer is responsible for maintaining GSI Deviation Forms on file and posting to the GSI SharePoint intranet site for storage and archiving. Deviations may also be discovered during technical systems audits or during the data verification and validation processes. The GSI Senior QAQC Officer is responsible for documenting all evident deviations on GSI Deviation Forms (GSI/FORM/QAQC/1 - GSI QAPP, TQAP (Test Plan) and SOP Deviation Form). At the end of each test’s duration, the GSI Senior QAQC Officer provides a report to the GSI Senior Quality Systems Officer and GSI PI. The report includes a table listing deviations to the specific TQAP and QAPP associated with the testing, as well as, a table listing deviations to the specific SOPs that were used during testing. The GSI Senior QAQC Officer posts final copies of the QAPP and SOP audit reports to the GSI SharePoint website for archiving and storage.
6. GSI SHIPBOARD TEST ACTIVITIES
6.1. DOCUMENTATION GSI has no involvement in the mechanics, design or market success of the actual BWMSs it tests. Organizational firewalls are in place to ensure that GSI testing activities are uncompromised. Successful applicants are required to enter into a contract or “Participation Agreement” prior to GSI program induction. NEMWI is responsible for negotiating the participation agreement terms and conditions, including the nature and extent of the services, the time-line, any stipulations or contingencies, and intellectual property terms. In this situation, non-disclosure agreements may also be drafted between the parties. GSI personnel also sign “No Conflict of Interest Statements” and “Confidentiality Agreements” prior to beginning any data collection activities for a BWMS developer.

GSI/QAQC/QAPP/SB/1 Revision 1: May 13, 2013
Page 17 of 56
© Northeast-Midwest Institute 2013.
GSI uses SOPs in conjunction with the GSI QMP (GSI, 2013), this ship-board QAPP and a BWMS-specific TQAP to implement all shipboard tests. The TQAP describes procedures for conducting a test onboard a specific vessel of a particular BWMS. At a minimum, GSI's shipboard TQAPs include detailed instructions for sample and data collection and analysis, sample handling and preservation, and QAQC requirements. Test objectives, dependent on the specific BWMS being tested, are also detailed in the TQAP. GSI works with the BWMS developer and verification organization (if applicable) to assure approval of each TQAP. 6.2. TEST OBJECTIVES
In general GSI shipboard test objectives involve evaluation of the performance of the subject BWMS with regard to biological treatment efficacy. Depending on the type of evaluation and the specifics of the subject BWMS, other verification factors may also be evaluated including: environmental acceptability, operation and maintenance, reliability, cost factors, and/or safety. GSI evaluates these verification factors consistent with requirements of the International Maritime Organization (IMO) and/or USEPA ETV Program protocols, and under challenge conditions specified in the TQAP. GSI shipboard testing also can be adapted to address other possible benchmarks such as stricter performance standards or non-regulatory end-points; these will be detailed in the BWMS-specific TQAP. 6.3. EXPERIMENTAL DESIGN In general, GSI shipboard tests involve collection and analysis of continuous in-line samples during ballast intake and/or discharge operations. If the intake or discharge operation is conducted outside of the Duluth-Superior Harbor of Lake Superior (i.e., GSI’s home port) or the port of Two Harbors, MN, live analysis of zooplankton and protist samples takes place either in a nearby hotel room, in facilities provided by the port, and/or in the GSI Mobile Laboratory (Figure 2). Samples for analysis of chemistry, microbiology and WET are transported or shipped to LSRI following appropriate sample handling and custody procedures. Analysis of chemistry samples takes place in the chemistry laboratories at LSRI, and analysis of microbiology samples takes place in the microbial laboratory at LSRI. All WET tests are conducted in the aquatic toxicology laboratory at LSRI. If the ballast operation is conducted in the Duluth-Superior Harbor or the port of Two Harbors, MN, zooplankton and protist samples are analyzed either at the GSI Land-Based Research, Development, Testing, and Evaluation (RDTE) Facility (Superior, Wisconsin) or in the LSRI Taxonomy Laboratory on the UWS campus. Chemistry, microbiology and WET test samples are analyzed in the appropriate laboratory at LSRI.

GSI/QAQC/QAPP/SB/1 Revision 1: May 13, 2013
Page 18 of 56
© Northeast-Midwest Institute 2013.
Figure 2. The GSI Mobile Field Laboratory.
6.4. APPLICABLE STANDARDS/CRITERIA GSI shipboard tests are directly relevant to international and domestic regulatory processes. To that end, GSI protocols are rooted in the essential features of the IMO’s G8 Guidelines for Approval of Ballast Water Management Systems (IMO, 2008a), the IMO’s G9 Guidelines for Approval of Ballast Water Management Systems that make use of Active Substances (IMO, 2008b) and the USEPA ETV Program’s Draft Generic Protocol for the Verification of Ballast Water Treatment Technology in Shipboard Installations (USEPA, 2012). As such, most (if not all) facets of GSI shipboard tests (e.g. flow rate, sample port size, sample size, sample collection and analysis equipment and data logging) are directly consistent with these requirements, though specifics are dependent on the test plan and will be detailed in the individual TQAPs. Table 3 compares GSI test protocols with those of the IMO’s G8 Guidelines and the USEPA ETV Program’s Draft Generic Protocol.

GSI/QAQC/QAPP/SB/1 Revision 1: May 13, 2013
Page 19 of 56
© Northeast-Midwest Institute 2013.
Table 3. Comparison of Key Test Parameters Proposed for GSI Shipboard Tests with those of IMO’s G8 Guidelines and the USEPA ETV Program’s Draft Generic Protocol (v. 4.0).1
Parameter Sub-Category IMO G8 ETV Draft Generic Protocol GSI Shipboard Tests
Organisms To Be Evaluated
Organisms ≥ 50 µm
Ambient organisms. Ambient organisms. Ambient organisms.
Organisms ≥10 µm and < 50
µm Ambient organisms. Ambient organisms. Ambient organisms.
Organisms < 10 µm
Ambient organisms. Ambient organisms. Ambient organisms.
Intake Organism Density
Organisms ≥ 50 µm
Valid tests indicated by uptake water, for both the control tank and
ballast water to be treated, with viable organism concentration
exceeding 10 times the maximum permitted values in regulation D-
2.1. i.e., more than 100 viable organisms per m
3 greater than or
equal to 50 µm in minimum dimension.
Minimum of 1 x10⁴ per m
3. To be detailed in TQAP.
Organisms ≥10 µm and < 50
µm
Valid tests indicated by uptake water, for both the control tank and
ballast water to be treated, with viable organism concentration
exceeding 10 times the maximum permitted values in regulation D-
2.1. i.e., more than 100 viable organisms per mL less than 50 µm in minimum dimension and greater than or equal to 10 µm in minimum
dimension for control water.
Minimum of 5 x 10² per mL. To be detailed in TQAP.
Organisms < 10 µm
Valid tests indicated by uptake water, for both the control tank and
ballast water to be treated, with viable organism concentration
exceeding 10 times the maximum permitted values in regulation D-
2.1. i.e., more than 10 cfu per 100 mL or more than 10 cfu per 1 g
(wet weight) zooplankton of Toxicogenic Vibrio cholerae (O1 and O139), more than 2500 cfu per 100 mL of E. coli, and more
than 1000 cfu per 100 mL of intestinal Enterococci for control
water.
Minimum 5 x 10² per mL. To be detailed in TQAP.
1 Comparison is limited to freshwater aspects of the IMO G8 and USEPA ETV Program’s Draft Generic Protocol (v. 4.0) only.

GSI/QAQC/QAPP/SB/1 Revision 1: May 13, 2013
Page 20 of 56
© Northeast-Midwest Institute 2013.
Parameter Sub-Category IMO G8 ETV Draft Generic Protocol GSI Shipboard Tests
Water Quality of Intake/Source Water
N/A Not specified.
Salinity: <1 PSU (for freshwater testing); Dissolved Organic Matter (DOM):
min. 2 mg/L as DOC; Particulate Organic Matter (POM):
min. 2 mg/L; Total Suspended Solids (TSS):
min. 12 mg/L; Temperature:
2 – 35 °C.
Salinity: <1 PSU; Dissolved Organic
Matter (DOM): min. 2 mg/L as DOC; Particulate Organic
Matter (POM): min. 2 mg/L;
Total Suspended Solids (TSS):
min. 12 mg/L; Temperature:
2 – 35 °C.
Sample Volume
Organisms ≥ 50 µm At least 1 m
3. Minimum 3 m
3 concentrated to 300 mL. To be detailed in TQAP.
Organisms ≥10 µm and < 50
µm At least 1 L.
Minimum 6 L concentrated to 1 L to detect 10 organisms/mL.
1000 mL
Organisms < 10 µm
At least 500 mL. 1000 mL. 1000 mL
Number of Intake Samples
Organisms ≥ 50 µm
Three replicate samples of influent water, collected over the period of uptake (e.g., beginning, middle,
end).
1 in-line, integrated challenge water sample. 1 in-line, integrated
challenge water sample.
Organisms ≥10 µm and < 50
µm
Three replicate samples of influent water, collected over the period of uptake (e.g., beginning, middle,
end).
1 in-line, integrated challenge water sample. 1 in-line, integrated
challenge water sample.
Organisms < 10 µm
Three replicate samples of influent water, collected over the period of uptake (e.g., beginning, middle,
end).
1 in-line, integrated challenge water sample. 3 replicate in-line,
integrated challenge water samples.
Number of Discharge Samples
Organisms ≥ 50 µm
Three replicate samples of discharge treated water collected at each of three times during the
period of discharge (e.g., 3 x beginning, 3 x middle, 3 x end); and three replicate samples of
discharge control water, collected over the period of discharge (e.g.,
beginning, middle, end).
1 in-line, integrated treatment discharge sample.
1 in-line, integrated treatment discharge
sample.
Organisms ≥10 µm and < 50
µm
Three replicate samples of discharge treated water collected at each of three times during the
period of discharge (e.g., 3 x beginning, 3 x middle, 3 x end); and three replicate samples of
discharge control water, collected over the period of discharge (e.g.,
beginning, middle, end).
1 in-line, integrated treatment discharge sample.
1 in-line, integrated treatment discharge
sample.
Organisms < 10 µm
Three replicate samples of discharge treated water collected at each of three times during the
period of discharge (e.g., 3 x beginning, 3 x middle, 3 x end); and three replicate samples of
discharge control water, collected over the period of discharge (e.g.,
beginning, middle, end).
1 in-line, integrated treatment discharge sample.
3 replicate in-line, integrated treatment discharge samples.

GSI/QAQC/QAPP/SB/1 Revision 1: May 13, 2013
Page 21 of 56
© Northeast-Midwest Institute 2013.
Parameter Sub-Category IMO G8 ETV Draft Generic Protocol GSI Shipboard Tests
Analytic Endpoints: Discharge
Organisms ≥ 50 µm
Less than 10 viable organisms per m3 greater than or equal to 50 µm in minimum dimension for treated
water. More than 10 viable organisms per m
3 greater than or equal to 50 µm in minimum dimension for control water.
Biological treatment efficacy determined by the measurement of living ambient organism concentrations in the treatment discharge.
To be detailed in TQAP.
Organisms ≥10 µm and < 50
µm
Less than 10 viable organisms per mL less than 50 µm in minimum dimension and greater than or
equal to 10 µm in minimum dimension for treated water. More than 10 viable organisms per mL
less than 50 µm in minimum dimension and greater than or
equal to 10 µm in minimum dimension for control water.
Biological treatment efficacy determined by the measurement of living ambient organism concentrations in the treatment discharge.
To be detailed in TQAP.
Organisms < 10 µm
Less than 1 colony forming unit (cfu) per 100 mL or less than 1 cfu per 1 g (wet weight) zooplankton
of Toxicogenic Vibrio cholerae (O1 and O139), less than 250 cfu per 100 mL of E. coli, and less than 100 cfu per 100 mL of intestinal Enterococci for treated water. More than 1 cfu per 100 mL or more than 1 cfu per 1 g (wet
weight) zooplankton of Toxicogenic Vibrio cholerae (O1
and O139), more than 250 cfu per 100 mL of E. coli, and more than 100 cfu per 100 mL of intestinal Enterococci for control water.
Biological treatment efficacy determined by the measurement of living ambient organism concentrations in the treatment discharge.
To be detailed in TQAP.
Water Quality/Chemistry
Measurements N/A
Salinity, temperature, particulate organic carbon and total
suspended solids.
Temperature, salinity, pH, dissolved oxygen, total suspended solids, dissolved organic
carbon, dissolved organic material, mineral matter, and environmental contaminants (if
applicable)
Temperature, salinity, pH, dissolved oxygen, total suspended solids, percent transmittance, non-purgeable organic
carbon, dissolved organic carbon,
particulate organic matter, mineral matter,
and environmental contaminants (if
applicable)
Toxicity N/A
Tests should be conducted in accordance with paragraphs 5.2.3
to 5.2.7 of the Procedure for Approval of Ballast Water
Management Systems That Make Use of Active Substances
(resolution MEPC.126(53) as amended.
Toxicity tests will be conducted for treatments involving biocides. Tests will be
selected from a short list of USEPA standard tests.
Whole Effluent Toxicity tests will be conducted for treatments involving
biocides/active substances.

GSI/QAQC/QAPP/SB/1 Revision 1: May 13, 2013
Page 22 of 56
© Northeast-Midwest Institute 2013.
Parameter Sub-Category IMO G8 ETV Draft Generic Protocol GSI Shipboard Tests
Biological Sample Analysis
Organisms ≥ 50 µm
Widely accepted standard methods for the collection,
handling (including concentration), storage, and analysis of samples should be used. These methods
should be clearly cited and described in test plans and
reports. This includes methods for detecting, enumerating, and identifying organisms and for
determining viability.
Concentrate using 35 µm mesh plankton nets (50 µm in the diagonal). Analyze
immediately; maximum hold time is 6 hours. Extract subsamples using 5 mL serological,
graduated pipettes with an Eppendorf pipette helper (or similar instrument). Examine
subsamples (i.e., direct counts) in multi-well plates, Bogorov chambers, Sedgewick-Rafter Counting Chambers, or counting
wheels placed under a stereo or compound microscope. Use Lugol’s, formalin or ethanol
to preserve sample aliquots.
To be detailed in TQAP.
Organisms ≥ 10 µm and <
50 µm
Process immediately. Laboratory concentration by gently passing the sample through a sieve with mesh ≤ 10 µm in the
diagonal, after first passing through the filter used to collect the > 50 µm fraction. Score
samples using manual epifluorescence microscopy: FDA (final concentration 5 µM) and CMFDA (final concentration 2.5 µM) are added to a 1 mL sample that is incubated in
the dark for 10 min, the sample is loaded into a Sedgewick-Rafter Counting Chamber, and it is examined under epifluorescence using a
Fluorescein Isothiocyanate (FITC) narrow pass filter cube.
To be detailed in TQAP.
Organisms < 10 µm
Process immediately. For cultivable, aerobic, heterotrophic bacteria, 1 mL samples should be diluted in a 10-fold dilution series out to
10-4
- 10-5
. 100 µL of each dilution should be spread onto media, with triplicate plates for each dilution. Plates should be incubated at 20 °C, monitored and counted after 5 days
and recorded as colony forming units (CFUs) per 100 mL of sample water. For E. coli
samples, use USEPA Method 1603: Alternatively, an IDEXX Colilert test
(Westbrook, ME). For Enterococci samples, a modified version of USEPA Method 1106.1
should be used: 10 mL and 100 mL water samples should be passed through 0.45 µm
membranes, the membranes transferred onto mEnterococcus agar (mEA) plates, and
the plates incubated at 35 ± 2ºC for 24 hours. Membranes with light and dark red
colonies should be transferred to bile esculin agar (BEA) plates, which should be
incubated for 4 hours at 35 ± 2 ºC. After incubation, colonies with black halos should be scored and data reported as Enterococci
per 100 mL. Alternatively, an IDEXX Enterolert kit (Westbrook, ME) can be used. Toxigenic Vibrio cholerae may be included as an optional assay using a DNA colony
blot hybridization method that detects ctxA gene.
To be detailed in TQAP.
Flow Rate N/A Not specified. At least 200 m3 per hour.
At least 200 m3 per
hour; to be detailed in TQAP.
Retention Time N/A Not specified. Typically 1-4 days. Typically 1-4 days; to be
detailed in TQAP.
Number of Tests N/A Three consecutive, valid test cycles showing discharge of
A minimum of five (5) valid biological efficacy (BE) tests must be completed within each
To be detailed in TQAP.

GSI/QAQC/QAPP/SB/1 Revision 1: May 13, 2013
Page 23 of 56
© Northeast-Midwest Institute 2013.
Parameter Sub-Category IMO G8 ETV Draft Generic Protocol GSI Shipboard Tests
treated ballast water in compliance with regulation D-2 over a period
of not less than 6 months.
selected salinity range over a 12 month period.
Quality Management and Test Plans
N/A
A Quality Management Plan (QMP), a Quality Assurance
Project Plan (QAPP) and a Test Plan.
A Test/Quality Assurance Plan (TQAP) and a Quality Assurance Project Plan (QAPP) to be
compiled by the Testing Organization.
A Quality Management Plan (QMP), Quality
Assurance Project Plan (QAPP), and a
Test/Quality Assurance Plan (TQAP).
Data Quality Indicators
N/A Not specified. Assessment of representativeness,
accuracy, precision, bias, comparability and completeness.
Assessment of representativeness, accuracy, precision,
bias, comparability and completeness.
7. DATA GENERATION AND ACQUISITION
7.1. DATA GENERATION In general, GSI shipboard tests take place during normal vessel operations and consist of several periods (i.e., sampling events) of sample/data collection. Sampling events will coincide with vessel ballast water intake or discharge operations, the details of which are described in the BWMS-specific TQAPs. Each sampling event will likely occur at or near a port and includes collection of samples/data to determine physical/chemical conditions of the water, the quality and quantity of entrained biota, and ship and BWMS operational parameters. Target values for challenge water quality, water chemistry, biological, and operational parameters associated with specific shipboard tests will be dependent upon the test objectives and are detailed in the individual TQAPs. The exact sampling approach will be detailed in the BWMS-specific TQAPs. At times, the TQAP will employ a GSI-designed sampling approach which is applicable to a range of shipboard test plans (Cangelosi et al., 2011). The approach employs simultaneous, in-line and continuous collection of large and small quantities of sample water from subject ballast water. The method is adaptable to a wide range of sampling intensities and ships with diverse ballast line diameters, and ballast system types. Fundamentally, the process involves:
Prior installation of two permanent blind flanges in a strategically selected segment of the ship’s ballast line, and insertion of a temporary sampling pitot in one such flange;
Space and services on the ship to support sample collection; A port-based set-up, sampling and ballast team of approximately four people, and nearby
analytical space and equipment; and A time window affording 45 minutes to one hour for sampling system set-up and 45
minutes to one hour for its break-down in addition to the selected sampling period duration.

GSI/QAQC/QAPP/SB/1 Revision 1: May 13, 2013
Page 24 of 56
© Northeast-Midwest Institute 2013.
Figure 3 illustrates the GSI sampling system layout. In summary, the installation of the blind flanges is completed according to strict location guidelines well before sampling is to occur. At the time of, or just prior to, a specific sampling event, an elbow shaped sampling pitot is installed in the upstream flange to deliver flow to the sampling system. In general, the pitot is pointed upstream of the direction of water flow and designed consistent with the USCG in-line sampling guidelines (Richard et al., 2008). For sampling of organisms ≥ 50 µm in minimum dimension, sample flow from the intake/discharge line is pumped (i.e., using an impeller pump) from the sampling pitot at a known flow rate through a plastic line equipped with a flow meter into a 35 µm plankton net that is suspended in a 120 L barrel (32 US gal) with a level transducer and a bottom discharge flange. The fraction of the ballast line flow pumped through the sample port should remain constant throughout the sampling process. This ratio is monitored using an in-line magnetic flux flow meter on the sample line. A second pump draws spent sample water from the 120 L tub through plastic line to the return flange in the ballast line for discharge overboard with other ballast water or for merging back with the water flow in the ballast main (in cases of intake sampling). The water level in the tub is maintained at 85 % full as the net filters the plankton into a bottom cod-end A small side stream of the sample water flow (pre-plankton net) is directed into one or two 19 L carboys (depending upon the planned sample collection volume) for whole water samples which can be used to assess organisms < 50 µm and ≥ than 10 µm in minimum dimension, organisms < 10 µm in minimum dimension, water chemistry/quality (including measurements using YSI Multiparameter Sondes), and WET, i.e., if the BWMS involves active substance(s). Grab samples can also be extracted from the line (i.e., hose) feeding into the nets, or through a dedicated side port off the main sample line which can be opened and closed. These samples can be used for sample collection for analysis of water chemistry parameters including total suspended solids (TSS), percent transmittance (%T), total organic carbon (TOC) as non-purgeable organic carbon (NPOC), dissolved organic matter (DOM) as dissolved organic carbon (DOC), and particulate organic matter (POM). Reliable, continuously recording in situ sensors can be used to collect operational data, including flow rate and pressure. Again, the specific repertoire of sample types, numbers and volumes, and types of data to be collected will be specified in the individual TQAPs.

GSI/QAQC/QAPP/SB/1 Revision 1: May 13, 2013
Page 25 of 56
© Northeast-Midwest Institute 2013.
Figure 3. Schematic of the GSI Ship Sampling System and Component Parts.
7.2. DATA ACQUISITION
If the sampling event occurs outside of Duluth-Superior Harbor or the Port of Two Harbors, Minnesota, live analysis of zooplankton and protist samples will take place either in a nearby hotel room, in facilities provided by the port, and/or in the GSI Mobile Laboratory. The specific locations will be detailed in the BWMS-specific TQAPs. Due to logistics involved with commercially operating vessels, sample analysis is often easiest to arrange off-ship. Samples not requiring immediate live analysis, i.e., water chemistry and organisms < 10 µm, can be stored in coolers with ice and transported or shipped overnight to LSRI for processing (Superior, Wisconsin). In general, all sample analysis locations will be climate-controlled, and have enough counter space to allow for simultaneous microscopic and analytical analysis of samples. Locations will also have access to power and water, and sufficient light. There will also be fully isolated spaces for analysis of organisms ≥ 10 µm and < 50 µm (which requires a darkened room) and other analyses (e.g., organisms ≥ 50 µm) which require light.

GSI/QAQC/QAPP/SB/1 Revision 1: May 13, 2013
Page 26 of 56
© Northeast-Midwest Institute 2013.
7.2.1. BIOLOGY Live/dead analysis of organisms ≥ 50 µm will be conducted according to GSI/SOP/MS/RA/SA/2 - Procedure for Zooplankton Sample Analysis and take place within two hours of collecting and concentrating the individual samples. Samples will be stored in coolers with ice packs immediately following collection, during transportation to the analysis location, and until analysis occurs. Microzooplankton (e.g., rotifers, copepod nauplii, and dreissenid veligers) and macrozooplankton (e.g., copepods, cladocerans, and macroinvertebrates), all generally greater than 50 µm in minimum dimension, may be analyzed simultaneously by separate taxonomists. Microzooplankton subsamples will be analyzed in a Sedgewick-Rafter counting chamber by examination under a compound microscope at a magnification of 40X to 100X. Macrozooplankton will be analyzed in a Ward’s Counting Wheel at a magnification of 20X to 30X using a dissecting microscope. Due to high densities, quantification of this size class of organisms in the challenge water on intake may require analysis of multiple sub-samples and extrapolation to the entire sample volume. For these samples, a subsample will be removed for analysis using a Henson-Stempel pipette. The dead organisms (i.e., those organisms that do not move or respond to stimuli) will be enumerated, then 50 % (v/v) acetic acid solution will be added to the counting chamber/wheel and the total number of organisms enumerated. The number of live organisms will be calculated by subtracting the number of dead organisms in the counting chamber/wheel from the total number of organisms. The treatment discharge samples will likely have lower organism densities, thereby allowing for analysis of a greater proportion of the sample. In this situation, samples may be split in half using a Folsom Plankton Splitter, with half of the sample analyzed for macrozooplankton and the other half analyzed for both macro- and microzooplankton. If there are very low densities of organisms in the sample, the sample will not be split, and both macro and microzooplankton will be analyzed simultaneously using a compound microscope. During these analyses, only live organisms will be enumerated using standard movement and response to stimuli techniques. To increase statistical accuracy, analyses may continue until at least a minimum volume of the initial sample has been examined in its entirety or until more than a defined number of live organisms have been counted; these values will be specified in the individual TQAPs. If the treatment discharge samples do not contain many organisms or much debris, 3 - 9 m3 of water may be processed during the 2 hour holding time that is allowed after sample concentration. Sample analysis for live organisms ≥ 10 µm to < 50 µm in minimum dimension will occur within 1.5 hours of sample collection. Samples will be stored in coolers with ice packs immediately following collection, during transportation, and until analysis occurs. Immediately prior to analysis, samples will be concentrated through a 7 µm mesh plankton net and stored in a 25 mL sample container. Sample analysis will be conducted according to GSI/SOP/MS/RA/SA/1 - Procedure for Protist Sample Analysis. Briefly, a 1.5 mL subsample of the concentrated sample will be transferred to a 2 mL sample container, with 5 µL of fluorescein diacetate (FDA) viability stain stock solution added. The subsample will then be allowed to incubate in the dark for 5 minutes. Then, the 1.5 mL incubated sample will be mixed and 1.1 mL immediately

GSI/QAQC/QAPP/SB/1 Revision 1: May 13, 2013
Page 27 of 56
© Northeast-Midwest Institute 2013.
transferred to a Sedgwick-Rafter cell, covered and placed on the stage of a compound microscope that is set for simultaneous observation using brightfield and epifluorescence. Horizontal transects will be analyzed (an area known to reflect greater than 1 mL of original sample water), to ensure at least 1.5 mL (intake or control discharge samples) or 10 mL (treated discharge samples) of original sample water are counted, aiming for at least 100 entities (i.e., unicellular organism, colony or filament). If entities are abundant in treated samples additional criteria will be used to determine the number of transects needed (as outlined in GSI/SOP/MS/RA/SA/1 - Procedure for Protist Sample Analysis). If time permits, additional transects will be counted to increase statistical power. Single cell entities and cells comprising colonial and filamentous entities will be characterized as follows: alive = cells showing obvious green fluorescence from cell contents; dead (not counted) = cells showing no or very little evidence of green fluorescence from cell contents. Records will be kept of transect lengths and widths so that the total counted area and volume analyzed can be calculated. Counting and measurement of all other entities will follow standard procedures for individuals (length and width), colonies (e.g., number of cells, cell length and width) and filaments (e.g., number of cells, cell length and width or total filament length if cells cannot be discerned). The remaining concentrated sample in the 25 mL bottle will be archived using Lugol’s preservative. Please note that the use of FDA as the primary stain for GSI analyses of the ≥ 10 and < 50 µm size class of organisms is based on a thorough investigation of several methods (see Reavie et al., 2010), and this method varies from the ETV Draft Generic Protocol (USEPA, 2012) in that CMFDA is not simultaneously used as a vital stain. Sample analysis of organisms < 10 µm, in general, will take place in the LSRI microbiology laboratory and involve analysis of total coliform bacteria, Escherichia coli, Enterococcus spp., and total heterotrophic bacteria. Samples will be shipped/transported to the LSRI in a cooler with ice packs, stored in a refrigerator and analyzed within 24 hours of collection. Analysis of total coliform bacteria and E. coli will follow GSI/SOP/BS/RA/MA/4 - Procedure for the Detection and Enumeration of Total Coliforms and E. coli Using IDEXX's Colilert®. Densities are determined using Quanti-Tray/2000® and Colilert®, which is based on IDEXX’s patented Defined Substrate Technology (DST®). Briefly, 100 mL sample and media will be mixed, poured into the Quanti-Tray, and sealed. Quanti-Trays are then incubated at 35 °C for 24-28hours. Results will be reported in most probable number (MPN)/100 mL, which correlate well with colony forming units (cfu)/100 mL. Please note total coliform analysis is not an additional analysis step, but a second result given from the Colilert test conducted for E. coli analysis.. The density of Enterococci (GSI/SOP/BS/RA/MA/3 - Procedure for the Detection and Enumeration of Enterococcus using Enterolert™) will be determined using Quanti-Tray/2000® and r Enterolert™, which is also based on IDEXX’s patented Defined Substrate Technology (DST®). Briefly, 100 mL sample and media will be mixed, poured into the Quanti-Tray, and sealed. Quanti-Trays are then incubated at 41 °C for 24-28 hours. Results will be reported in MPN/100 mL, which correlates well with cfu/100 mL. Culturable, aerobic, heterotrophic bacteria will be quantified following GSI/SOP/BS/RA/MA/1 –

GSI/QAQC/QAPP/SB/1 Revision 1: May 13, 2013
Page 28 of 56
© Northeast-Midwest Institute 2013.
Procedure for Quantifying Heterotrophic Plate Counts (HPCs) using IDEXX’s SimPlate® for HPC Method, which is based on IDEXX Laboratories’ patented multiple enzyme technology (IDEXX Laboratories, Inc.; Westbrook, Maine). Two dilutions/volumes of sample will be placed on SimPlates. Media will be added, and the SimPlate will be swirled and incubated at 35 °C for 48-72 hours. Fluorescing wells will be counted and MPN calculated. Results will be reported in MPN/mL, which correlates well with cfu/mL. Tests requiring the use of two different media types will also follow GSI/SOP/BS/RA/MA/7 – Procedure for Enumerating Culturable Heterotrophic Bacteria using the Spread Plate Method.
7.2.2. WATER QUALITY
A Multiparameter Sonde (YSI 6600 V2-4 Multiparameter Sondes; YSI Incorporated; Yellow Springs, OH) will be used to measure the following water quality parameters: temperature, dissolved oxygen, pH, turbidity, salinity, specific conductivity, and total chlorophyll. The Sonde will be calibrated prior to the subject ballast operation according to GSI/SOP/MS/G/C/4 - Procedure for Calibration, Deployment, and Storage of YSI Multiparameter Water Quality Sondes). Immediately following the grab sample collection operation, the sample collection container (i.e., a 19 L carboy) will be mixed well, and a subsample of approximately 1 L collected. Data will be recorded on a pre-printed datasheet.
7.2.3. WATER CHEMISTRY Water chemistry sample analysis, in general, will take place in the LSRI chemistry laboratory and involve analysis of some or all of the following: TSS, %T, NPOC, DOC and POM and determination of particulate organic carbon (POC) and mineral matter (MM). GSI uses NPOC as an alternative to TOC, though it may be a slight underestimate of TOC. The analytical instrument used to measure NPOC purges the sample with air to remove inorganic carbon before measuring organic carbon levels in the sample. Thus, the NPOC analysis may not incorporate volatile organic carbon which may be present in the sample. Similarly, DOC will be used as a surrogate measure for DOM, and POC will calculated as the difference between NPOC and DOC values for a given sample. MM can be determined from the difference between TSS and POM values (mass per liter basis). Analysis of TSS will be conducted according to GSI/SOP/BS/RA/C/8 – Procedure for Analyzing Total Suspended Solids (TSS). In this procedure, accurately measured sample volumes (± 1 %) will be vacuum filtered through pre-washed, dried and pre-weighed glass fiber filters (i.e. Whatman 934-AH). After each sample is filtered it will be dried in an oven and brought to constant weight. TSS values will be determined based on the weight of particulates collected on the filter and the volume of water filtered. Two aliquots of approximately 10 mL from each TSS sample collected will be used to measure %T. Sample analysis will be conducted according to GSI/SOP/BS/RA/C/4 – Procedure for Determining Percent Transmittance (%T) of Light in Water at 254 nm. For analysis of the filtered aliquot, an appropriate volume of sample will be filtered through a glass fiber filter (i.e., Whatman 934-AH). A UV-Vis spectrophotometer will be used to measure %T of the unfiltered

GSI/QAQC/QAPP/SB/1 Revision 1: May 13, 2013
Page 29 of 56
© Northeast-Midwest Institute 2013.
and filtered sample aliquots. Deionized water will be used as a reference to adjust the spectrophotometer to 100 %T, and then each unfiltered and filtered sample aliquot will be analyzed in a pre-rinsed sample cuvette with a 1 cm path length. The POM concentration will be determined following Standard Method 2540 E (American Public Health Association, 2012). The residue from the TSS analysis will be ignited to a constant weight at 550 °C in a muffle furnace. The concentration of POM is determined by the difference of the dry weight of the particulates on the filter before and after ignition (the mass lost to combustion). MM concentrations will be calculated following analysis of TSS and the determination of POM (i.e., TSS – POM = MM). Sample analysis for NPOC and DOC will be conducted according to GSI/SOP/BS/RA/C/3– Procedures for Measuring Organic Carbon in Aqueous Samples. Upon arrival at LSRI, an aliquot of each sample will be filtered through a Whatman GF/F filter and acidified with hydrochloric acid (HCl) for analysis of DOC. The remaining portion of the sample will be acidified with HCl and analyzed for NPOC. A Shimadzu Total Organic Carbon Analyzer (Model TOC-L) will be used for analysis of both NPOC and DOC. Concentrations of NPOC and DOC will be determined based on a calibration curve developed on the analyzer using organic carbon standards prepared from potassium hydrogen phthalate. Concentrations of POC will be determined as the difference between the NPOC and DOC values for a given sample.
7.2.4. WHOLE EFFLUENT TOXICITY (WET) GSI will collect whole water samples for WET testing during ballast discharge operations with the residual toxicity of the whole effluent determined using standard USEPA procedures (USEPA, 2002) and following the GSI SOPs detailed in Table 4.
Table 4. GSI Standard Operating Procedures (SOPs) Used for Whole Effluent Toxicity Testing.
GSI SOP Code Test Type Test Species Test Endpoint
GSI/SOP/BS/RA/WET/1 Chronic, Renewal Cladoceran
(Ceriodaphnia dubia) Survival and Reproduction
GSI/SOP/BS/RA/WET/2 Chronic, Renewal Fathead Minnow
(Pimephales promelas) Survival and Growth (growth
measured via dry weight)
GSI/SOP/BS/RA/WET/3 Chronic, Static Green Alga
(Selenastrum capricornutum) Growth (measured via direct
counts of density)
Immediately following collection, whole water samples contained in carboys (generally of 19 L and up to 28 L if a dilution series is conducted) will be transported to LSRI. Approximately 2.4 L of sample water from each sample is then used to set up the WET tests (more is used if a dilution series is conducted). The remaining sample water is refrigerated in the dark to retain as much of the initial sample water’s water quality/chemistry properties as possible. This water is also used as a source of renewal water (once warmed to 25 °C) each day throughout the WET test’s

GSI/QAQC/QAPP/SB/1 Revision 1: May 13, 2013
Page 30 of 56
© Northeast-Midwest Institute 2013.
duration. Filtered (i.e., using a Whatman 934-AH Glass Microfiber Filter, 1.5 m particle retention in liquid) Duluth-Superior Harbor water serves as the receiving water control if the ship is deballasting in the Duluth-Superior Harbor. At a minimum, treatment groups consist of 0 % treatment discharge water (i.e., all control water), 100 % treatment discharge water (i.e., no control water), and a performance control (i.e., culture water or algae growth media as appropriate). All tests will be conducted in temperature-controlled incubators or water baths following the species-specific SOPs listed in Table 4. Differences in mean percent survival, mean dry weight values (for Pimephales promelas), mean cell density (for Selenastrum capricornutum), and mean number of young per female (for Ceriodaphnia dubia) between treatment groups will be analyzed using an appropriate statistical software package (e.g., SigmaStat, version 3.5 (Systat Software, Inc.; Chicago, IL USA)) for statistical significance at α=0.050 using a One-Way Analysis of Variance and a post hoc statistical comparison. GSI will initiate WET tests with healthy, vigorous organisms. To determine the overall health of the test organisms, reference toxicant tests will be performed with the cladoceran, Ceriodaphnia dubia, and the minnow, Pimephales promelas, prior to the start of each definitive test or at least once per month. In addition, a performance control will be used for all species tested. The performance control consists of the normal culturing conditions for each species, providing the test organisms with the optimal environment for survival, growth, and reproduction. Therefore, the performance control along with the reference toxicant tests, provide verification of the health of the test organisms. To determine the validity of the WET tests, percent survival, dry weights of survivors, mean cell density for algae, and mean number of young per female for the cladocerans in the controls will be compared to the test acceptability criteria published in the USEPA’s Short-term Methods for Estimating the Chronic Toxicity of Effluents and Receiving Waters to Freshwater Organisms (USEPA, 2002a). Class I weights will be used as a check for the accuracy of the laboratory balance. Daily or weekly calibration of test meters will ensure optimal performance. The P. promelas drying process will be verified by re-weighing a percentage of fish after they had been dried for an additional length of time in the oven.
7.2.5. OPERATIONAL AND OTHER DATA
In general, GSI will record flow rate of water into and out of each of the subject ballast tanks using ballast tank height as a proxy. Flow rate of sample water into the sample collection barrel will be recorded automatically via flow meters and the logging function of a programmable logic controller (PLC), i.e., a digital computer used for automation of electromechanical processes. Following completion of the subject intake or discharge ballast operations, the data will be exported to Microsoft Excel for subsequent analysis. GSI can also assist with the monitoring of chemical usage for BWMSs that involve chemicals, as well as other operation and maintenance parameters including qualitative and quantitative maintenance indicators, system reliability and cost factors. The specific monitoring processes depend on the actual BWMS being tests and will therefore be outlined in the TQAP.

GSI/QAQC/QAPP/SB/1 Revision 1: May 13, 2013
Page 31 of 56
© Northeast-Midwest Institute 2013.
8. SAMPLE LABELING, HANDLING AND CUSTODY
8.1. SAMPLE LABELING The GSI Senior QAQC Officer is responsible for assigning a shipboard test ID code to uniquely identify each shipboard test that is conducted of a particular BWMS. Each test ID code will include the following basic information, when appropriate: the year, the BWMS, the trial number, and the operation type (intake or discharge). Depending on the BWMS being tested, additional information may need to be included to appropriately identify each test. The GSI Senior QAQC Officer is also responsible for assigning unique sample codes to each type of sample. Codes will be recorded on the sample container labels, field and laboratory datasheets and log books, and corresponding database entries. Sample labels will be prepared and placed onto the sample collection containers prior to sample preparation and/or collection. All samples will be labeled in a clear and precise manner to ensure proper identification in the field and also, tracking in the laboratory. 8.2. SAMPLE HANDLING Sample collection times will be recorded by GSI personnel on pre-printed datasheets or in coded laboratory notebooks using indelible ink. Samples will be transferred from GSI personnel involved in sample collection, to those involved in transportation, and subsequently to those involved in sample analysis. GSI sample analysts will record the time of sample receipt on pre-printed datasheets or in coded laboratory notebooks using indelible ink. These records will provide for reconstruction of all sample handling and custody procedures. 8.2. SAMPLE CUSTODY Chain-of-custody (COC) procedures will be strictly followed for all samples so that the possession of a sample from the time of its collection until the time of its analysis is traceable and is properly documented. These procedures will not only guarantee the integrity of a sample (i.e., that it was properly prepared, preserved and/or handled leading up to analysis), but also alleviate the possibility of sample mix-ups and/or extraneous contamination. All relevant GSI senior personnel will be responsible for ensuring that COC forms (GSI/FORM/QAQC/3 - Sample Chain of Custody Form) are correctly filled out at the time of changes to sample custody, and sample handling and storage. They will also be responsible for maintaining the forms on file, creating electronic copies, and posting to the GSI SharePoint website for storage. The GSI Senior QAQC Officer will be responsible for determining whether proper custody procedures are followed during the field work and also for determining if additional samples are required due to improper sample handling.

GSI/QAQC/QAPP/SB/1 Revision 1: May 13, 2013
Page 32 of 56
© Northeast-Midwest Institute 2013.
9. QUALITY OBJECTIVES AND CRITERIA FOR MEASUREMENT DATA
Consistent with the USEPA ETV Program’s Draft Generic Protocol for the Verification of Ballast Water Treatment Technology in Shipboard Installations (USEPA, 2012), GSI uses representativeness, accuracy, precision, bias, comparability and completeness as data quality indicators to determine data utility relative to its shipboard testing activities. Data quality objectives and acceptance criteria vary by analysis type and will be specified in the BWMS-specific TQAPs, though a summary is provided in Table 5. In general, data that do not meet or exceed these criteria will be flagged during the data verification and validation process, with the reason for the flagging described in the QAQC records. Flagged data may not be deemed invalid if the results of an analysis are very low (i.e., near the limit of quantification for chemical analyses), in which case very small, non-significant differences between chemical and biological measurements could cause the data to fall outside the acceptance criteria. 9.1. REPRESENTATIVENESS Representativeness is a qualitative measure of the degree to which data accurately and precisely represents a characteristic of a population. Specific to GSI shipboard tests, representativeness is achieved by ensuring that the installation of blind flanges and sampling pitots takes into consideration possible effects of the ship’s ballast system and piping, the BWMS and its components, and any other mechanical or operational factors that could negatively impact organism mortality or sample representativeness. Representativeness is also achieved by ensuring sample collection methods and analytical techniques are identical across sample types (i.e., control and treatment, intake and discharge). 9.2. ACCURACY Accuracy is a determination of the overall agreement of a measurement to a known value. It includes a combination of random error (precision) and systematic error (bias). GSI measures accuracy with respect to shipboard chemical and water quality analyses (including hardness and alkalinity titrations during WET tests) by using certified reference standards whenever one is available. This data quality indicator is evaluated by calculating the Percent Difference (%D) between the measured and nominal certified reference standard values using the following equation:
PercentDifference(%D)=
| |∗ 100%
Where:
x = reference standard nominal concentration (true concentration)
y = reference standard measured concentration (measured concentration)

GSI/QAQC/QAPP/SB/1 Revision 1: May 13, 2013
Page 33 of 56
© Northeast-Midwest Institute 2013.
In the case of GSI shipboard tests of BWMSs involving chemical analyses, GSI prepares and analyzes spike-recovery samples to estimate bias resulting from interferences in the matrix and to determine the effectiveness of the analytical method used. In this case, the GSI performance measure for experimental bias is Spike Percent Recovery (SPR). In general, SPR is calculated by subtracting the measured concentration of the unspiked sample from the measured concentration of the spiked sample, dividing by the theoretical concentration of the spike, and multiplying the result by 100 %. However, the specific equation for calculating SPR will vary depending upon the analyte and the spiking method used. 9.3. PRECISION Precision is a measure of agreement among repeated measurements of the same property under identical conditions. With respect to samples involving chemistry, water quality, and organisms < 10 µm collected during GSI shipboard tests, precision is evaluated by analyzing at least 10 % of samples in duplicate and calculating the Relative Percent Difference (RPD) as determined by the following equation:
RPD| |
2
∗ 100%
where:
x1= sample x2 = duplicate sample (water chemistry/quality) or duplicate analysis (organisms < 10 µm)
For samples of organisms ≥ 50 µm, within-sample precision is measured by analyzing at least two slides (i.e., in the case of microzooplankton) or two counting wheels (i.e., in the case of macrozooplankton) from all samples analyzed via the “dead/total” counting method (as specified in GSI/SOP/MS/RA/SA/2). Precision is quantified by calculating the coefficient of variation (CV) among the subsamples analyzed for each sample using the following equation:
% 100%
where:
S= Standard deviation among subsamples
= Mean live organism density among subsamples For samples of organisms ≥ 10 and < 50 µm, at least one treatment discharge sample and at least one intake sample per set of tests of a specific BWMS is selected for evaluation of within-sample precision. Precision is measured by the analysis of at least two subsamples by the same taxonomist. Precision is quantified by calculating RPD of the total number of organisms counted in subsample one and subsample two.

GSI/QAQC/QAPP/SB/1 Revision 1: May 13, 2013
Page 34 of 56
© Northeast-Midwest Institute 2013.
9.4. BIAS Bias refers to the systematic or persistent distortion of a measurement process that causes errors in one direction. It can be generated by the ship, the experiment, and/or the operator. GSI evaluates bias relative to experimental and operator bias as outlined below.
9.4.1. EXPERIMENTAL BIAS To minimize experimental bias, GSI ensures all equipment and analytical instrumentation used in shipboard tests are calibrated and/or verified prior to use according to the appropriate SOP and with the appropriate frequency. Equipment and analytical instrumentation also receive scheduled routine maintenance, which is documented, along with all non-routine maintenance, in the appropriate GSI records. To avoid bias that may result from contamination of samples, all sample containers are thoroughly cleaned and rinsed prior to sample collection and all sample containers are clearly labeled. GSI conducts reference toxicant tests on a monthly basis in order to verify the health and sensitivity of the WET test organisms cultured in-house (i.e., Ceriodaphnia dubia), with the exception of Selenastrum capricornutum (species of green algae). Reference toxicant test data is sent to LSRI by the supplier for test organisms that are obtained commercially, i.e. Pimephales promelas (fathead minnow). A species-specific quality control chart is prepared following each reference toxicant test, and the lethal concentration that kills 50 % of the population (LC50) is compared to the historical mean of previous (maximum n = 20) reference toxicant tests. A mean LC50 within two standard deviations of the historical mean indicates that the test organisms are of known and documented quality and may be used for testing. A second measure of experimental bias for WET testing is made through the use of a performance control. The performance control group consists of test organisms in culture water (e.g., dechlorinated laboratory water, hard reconstituted water, etc.), providing optimal conditions for survival. The performance control group is not used for statistical analyses; rather, it provides data regarding the health of the test organisms. Whenever possible, an appropriate sample blank (i.e., medium blank for microbial analysis or matrix blank for chemical analysis), procedural blank, and/or a positive and negative control are run for each set of chemistry and microbial samples analyzed.
9.4.2. OPERATOR BIAS GSI evaluates operator bias for samples of organisms < 10 µm and for WET tests by having a second, suitably-qualified operator count at least 10 % of all experimental units (e.g., IDEXX Quanti-Trays® or test chambers). Analysis occurs immediately following analysis by the first operator and is carried out in a manner such that the second operator does not know the results of the first operator’s analysis. The GSI performance measurement for both these sample types is relative percent difference (RPD):

GSI/QAQC/QAPP/SB/1 Revision 1: May 13, 2013
Page 35 of 56
© Northeast-Midwest Institute 2013.
RPD| |
2
∗ 100%
where:
x1= first count result x2 = second count result
Operator bias relative to organisms ≥ 50 µm is evaluated on a minimum of 10 % of treatment discharge samples collected and at least one intake sample per set of test cycles of a specific BWMS. For the intake QC measure, one of the microzooplankton slides and one of the macrozooplankton counting wheels analyzed by the primary taxonomists will be analyzed by a second, qualified zooplankton taxonomist. For the treatment discharge QC measure, one out of every ten slides (i.e., for microzooplankton) or one out of every ten counting wheels (i.e., for macrozooplankton) analyzed by the primary taxonomists is also analyzed by a second, suitably-qualified zooplankton taxonomist. The duplicate analysis is conducted such that the second operator does not know the results of the first operator’s analysis. Operator bias relative to samples of organisms ≥ 10 and < 50 µm is evaluated on a minimum of 10 % of treatment discharge samples collected and at least one intake sample per set of test cycles of a specific BWMS. In this situation, for every sample analyzed by the primary taxonomist that requires evaluation, a second, suitably qualified taxonomist simultaneously analyzes the same sample using a dual-headed compound microscope. The analysis is conducted such that the second operator does not know the results of the primary operator’s analysis, and vice versa. The GSI performance measurements for operator bias for samples of organisms ≥ 50 µm and organisms ≥ 10 and < 50 µm is the average percent similarity (PSC) of taxonomic identification and average RPD of the number of live organisms/entities counted for all second analyses performed. RPD is calculated using the above formula. The formula for PSC is 1 – ½ *(the sum over all species (i = 1 to n) of the absolute value of (the proportion of species i found by person 1 minus the proportion of species i found by person 2). This value is then multiplied by 100 to convert from a proportion to a percent:
. | | %
Where:
where ai and bi = the relative proportions of species i in the sample found by operator A and B, respectively

GSI/QAQC/QAPP/SB/1 Revision 1: May 13, 2013
Page 36 of 56
© Northeast-Midwest Institute 2013.
9.5. COMPARABILITY Comparability refers to the extent to which findings generated from GSI tests are comparable to findings generated by similar tests (i.e., either conducted onboard the same ship with the same BWMS but at different time of the year, etc.) or in the literature. It is a qualitative term that evaluates not only results, but also similarity between sampling and analytical methods. Results from GSI shipboard tests are comparable because they are conducted following specific TQAPs and SOPs, which allow for consistency of experimental method regardless of the individuals conducting the study. As such, GSI evaluates comparability by ensuring that all TQAPs and SOPs are correctly implemented. This is achieved through regular technical system audits and the analysis of deviations to these documents to ensure that they are minor and do not affect data quality. 9.6. COMPLETENESS
GSI defines completeness as a measure of the percentage of biological/chemical samples measured that are valid out of the total number of collected samples. GSI deems biological and/or chemical samples invalid if they are contaminated, fail to meet the data quality objectives or other quality assurance protocols, are lost through sample destruction, are incorrectly collected or analyzed, and/or if there is insufficient amount of sample for analysis. For GSI shipboard test activities, the performance measure for completeness is Percent Completeness (%C) as calculated by the following equation:
PercentCompleteness(%C)=
∗ 100%

GSI/QAQC/QAPP/SB/1 Revision 1: May 13, 2013
Page 37 of 56
© Northeast-Midwest Institute 2013.
Table 5. GSI Shipboard Data Quality Objectives and Criteria.
Data Quality Indicator
Category Evaluation Process Performance
Measure GSI Data Quality
Objective
Representativeness
Sampling Approach
Ensure that the installation of blind flanges and sampling pitots takes into consideration possible effects of the ship’s ballast system and piping, the BWMS and its components, and any
other mechanical or operational factors that could negatively impact organism
mortality or sample representativeness.N/A – Qualitative term. N/A – Qualitative term.
Sample Collection, Handling and Analysis
Ensure control/treatment and intake/discharge samples are handled
and analyzed in the same manner.
Analytical Equipment and Instruments
Ensure all equipment and instruments are maintained, calibrated, and have
been verified to be accurate.
Accuracy Chemistry and Water Quality
Where applicable, use a certified reference standard to determine
differences between the measured and nominal reference standard
concentrations.
Percent Difference (%D). < 20 % average %D.
When applicable, analyze spike and recovery samples to estimate bias
resulting from interferences in the matrix and to determine the effectiveness of the
analytical method used.
Spike Percent Recovery (SPR)
Dependent on the analyte and the spiking method
used.
Precision
Chemistry and Water Quality Collect and analyze at least 10 % of
samples in duplicate. Relative Percent Difference
(RPD). < 20 % average RPD.*
Organisms ≥ 50 µm
Analyze at least two slides (i.e., microzooplankton subsamples) or two
counting wheels (i.e., macrozooplankton) from all samples
analyzed via the “dead/total” counting method (as specified in GSI/SOP/MS/RA/SA/2).
Coefficient of variation among subsamples
(%CV). ≤ 20 % CV. *
Organisms ≥ 10 µm and < 50 µm
Analyze two subsamples from at least one treatment discharge sample and at least one intake sample per set of test
cycles of a specific BWMS.
Percent Similarity (PSC) ≥ 60 % average PSC
between paired replicates. *
Organisms < 10 µm Analyze at least 10 % of samples in
duplicate. Relative Percent Difference
(RPD). < 30 % average RPD. *
Bias General
Ensure proper calibration/verification and maintenance of equipment and instruments; ensure proper sample
handling to avoid contamination.
N/A N/A
Ensure sample containers are thoroughly cleaned and rinsed prior to
sample collection and all sample containers are clearly labeled.
N/A N/A

GSI/QAQC/QAPP/SB/1 Revision 1: May 13, 2013
Page 38 of 56
© Northeast-Midwest Institute 2013.
Various
Ensure an appropriate sample blank (i.e., medium blank for microbial analysis
or matrix blank for chemical analysis), procedural blank, and/or a positive and negative control are run for each set of
samples analyzed.
Dependent on sample type. Dependent on sample
type.
Organisms ≥ 50 µm
Ensure a second, qualified taxonomist analyzes a minimum of 10% of treatment discharge samples collected and at least
one intake sample per set of tests of a specific BWMS.
Percent Similarity (PSC) and Relative Percent
Difference (RPD)
≥ 80 % average PSC and ≤ 20% average RPD.
Organisms ≥ 10 µm and < 50 µm
Ensure a second, qualified taxonomist analyzes a minimum of 10% of treatment discharge samples collected and at least
one intake sample per set of tests of a specific BWMS.
Percent Similarity (PSC) and Relative Percent
Difference (RPD)
≥ 60 % average PSC and ≤ 20 % average RPD.
Organisms < 10 µm Ensure a second, suitably-qualified operator counts at least 10 % of all
experimental units.
Relative Percent Difference
(RPD).
< 20 % average RPD.
Whole Effluent Toxicity (WET)
Conduct monthly reference toxicity tests on test organisms and obtain reference toxicity test data from the test organism
supplier(s).
Determination of the sensitivity of the test organisms relative to historical data using a quality control chart.
LC50 value within 2 standard deviations of the
historical mean LC50.
Ensure a second, suitably-qualified operator analyzes at least 10 % of all
experimental units.
Relative Percent Difference (RPD).
< 10 % average RPD.
Comparability General
Routine procedures are conducted according to TQAPs and SOPs to ensure consistency between tests.
Ensure correct implementation of TQAPs and SOPs.
N/A – Qualitative term. N/A – Qualitative term.
Completeness Sample Collection and Analysis Calculate percentage of valid samples
analyzed out of the total number of samples collected and analyzed.
Percent Completeness (%C).
≥ 90 %C.
* Data not meeting this DQO may not be deemed invalid if the results of an analysis are very low, in which case very small, non-significant differences between chemical and biological measurements could cause the data to fall outside the acceptance criteria. 9.7. GSI PERFORMANCE CRITERIA
In order for a GSI shipboard biological efficacy/performance evaluation test to be valid (i.e., those tests conducted as formal assessments of performance against international and other discharge standards), data quality objectives must be met, as well as, specific levels of core parameters. These parameters include physical, chemical, biological and operational metrics such as biota abundance, water quality parameters, and system operation. Parameters are checked for validity following test completion. Table 6 details the reference limits (minimum and maximum values) for core parameters that may be applicable to challenge water (i.e., ballast intake) samples collected during GSI shipboard tests. However, the specific parameters and acceptable ranges will be detailed in the BWMS-specific TQAP.

GSI/QAQC/QAPP/SB/1 Revision 1: May 13, 2013
Page 39 of 56
© Northeast-Midwest Institute 2013.
Table 6. Reference Limits for Core Parameters in Challenge Water (i.e., Intake) Samples Collected During GSI Shipboard Tests.
Category Core Parameter Reporting
Units Acceptable Range
for Initiating Testing
Physical/Chemical/ Operational
Salinity PSU 0 – 1 (for freshwater testing)
Dissolved Organic Carbon (DOC) mg/L Dissolved Organic Matter (DOM):
min. 2 mg/L as DOC
Particulate Organic Carbon (POC) mg/L Particulate Organic Matter (POM):
min. 2 mg/L
Total Suspended Solids (TSS) mg/L Total Suspended Solids (TSS):
min. 12 mg/L
Temperature °C 2 - 35
Ballast Water Flow Rate m³/hr Minimum of 200 m3/hr; to be detailed in TQAP.
Biological
Organisms ≥ 50 µm Live
Organisms/m³
Minimum of 1 x10⁴ per m3 for warmer seasons or Minimum of 1 x 10³ per m3
for winter months
Organisms ≥ 10 and < 50 µm Live cells/mL Minimum of 5 x 10² per mL.
Organisms < 10 µm Viable
bacteria/mL Heterotrophic bacteria:
Minimum 5 x 10² per mL..
In general, “summer months” for Great Lakes shipboard sampling are May - September and “winter months” are October – January.
10. DATA ANALYSIS AND MANAGEMENT 10.1. DATA PROCESSING, REVIEW AND VERIFICATION, AND STORAGE
Sample collection data (e.g., date, time, and location of collected samples), water quality and chemistry analysis data (e.g., TSS, NPOC, and active substance concentration), organisms < 10 µm analysis data (e.g., sample preparation, incubation, and direct counts), organisms ≥ 10 and < 50 µm analysis data (e.g., number of live entities), organisms ≥ 50 µm analysis data (e.g., sample concentration; number of dead, total, and live organisms), and WET test data (e.g., test set up, direct counts, and test take down) will be recorded by hand (using indelible ink) on pre-printed data collection forms and/or in bound laboratory notebooks that are uniquely-identified and are specific to the BWMS being tested. All documentation is required to be truthful, accurate, legible, permanent, clear and complete. Documentation will also be made promptly at the time of the observation, and will be recorded directly onto the data collection form or laboratory notebook. All complete documentation will include the date, the initials of all personnel directly responsible for the data, and any information needed for reconstruction of the procedure. Any changes made to original data entries will not obscure the entry, and also will be initialed and dated by the analyst. Completed data collection forms will be secured in uniquely-identified three ring binders, specific to the type of data and to the BWMS. Biological and chemical data that are recorded by

GSI/QAQC/QAPP/SB/1 Revision 1: May 13, 2013
Page 40 of 56
© Northeast-Midwest Institute 2013.
hand will be manually entered into either a MS Access Database that was designed, developed, and is maintained by the GSI Database Manager, or the data are entered into a MS Excel Spreadsheet. The electronic data files will be stored on the LSRI secured Local Area Network (LAN) that can be accessed only by relevant GSI personnel. The GSI Database Manager is the single point of control for access to the LSRI LAN. The LSRI LAN is automatically backed up every 24 hours. The electronic data files will also be stored on the GSI’s internal SharePoint website, which acts as a secondary data backup/storage mechanism. All original raw data will be stored in a climate-controlled, secure archive room at the LSRI for at least five years after the technical report is finalized. A percentage of data that is recorded by hand and entered into MS Access or Excel will be verified against the original raw data, this also includes verification of formulas/calculations (i.e., hand-calculation of data) done using MS Access or Excel. The percentage of verified raw data will depend on the amount of raw data that was generated, and range from 10 % to 100 % of the original raw data. Data validation is detailed in Section 9 of this QAPP. This section also details the acceptable values, where appropriate, for the following quality objectives: representativeness, accuracy, precision, bias, completeness, and comparability. 10.2. DATA ANALYSIS The statistical method used to analyze data is dependent on the type of data (i.e., organisms ≥ 50 µm, organisms ≥ 10 and < 50 µm, etc.), and the relationships being analyzed (i.e., control vs. treatment, intake vs. discharge, treatment discharge vs. regulatory standard) and will be specified in the individual TQAPs. In all cases, appropriate and widely-used statistical software packages will be used to generate and report mean values (± standard deviation or standard error) across groups. 10.3. DATA REPORTING Consistent with the USEPA ETV Program’s Draft Generic Protocol for the Verification of Ballast Water Treatment Technology in Shipboard Installations (USEPA, 2012), GSI drafts verification reports (i.e., technical reports) following completion of each individual test of a BWMS, the specific details of which will be included in the TQAP. The draft reports are provided to the BWMS developer for review and comment. The verification reports, in general, include the following sections:
Verification Statement Executive Summary
Introduction and background Description of the BWMS Experimental Design (including a description of all deviations) Description of Challenge Conditions Methods and Procedures Results and Discussion

GSI/QAQC/QAPP/SB/1 Revision 1: May 13, 2013
Page 41 of 56
© Northeast-Midwest Institute 2013.
Verification Testing Operation and Monitoring QA/QC Appendices:
o TQAP/Test Plan o Biological Treatment Efficacy Validation Matrix o BWMS Operation and Maintenance Manual o Data Generated During Testing o QA/QC Logs o Maintenance Logs o Any other records maintained during testing such as chain of custody forms o Any other information provided by the BWMS vendor, which may be of use.
11. SPECIAL TRAINING REQUIREMENTS/CERTIFICATION
11.1. PROJECT‐SPECIFIC QAQC TRAINING FOR RESEARCH PERSONNEL
Project-specific QAQC training is provided at least every two years to all relevant GSI personnel. Training generally involves: (1) an overview of GSI’s Quality System; (2) specifics on GSI project-specific QAPPs; (3) data quality objectives and data verification and validation; and (4) technical assessments and auditing. GSI quality management personnel are responsible for recording and maintaining, on the GSI SharePoint intranet website, copies of all project-specific training activities. 11.2. PROJECT‐SPECIFIC TRAINING FOR RESEARCH PERSONNEL
Project-specific training is provided to those personnel involved with specific activities that require specialized training. For example, all personnel involved with active substances receive “Material Safety Data Sheet (MSDS)” training. Similar emergency training is provided to those handling chemicals in the laboratory. Specific training is also provided by LSRI on occupational health and safety issues concerning chemical spills, eye care and safety, fire safety, first aid, ergonomics, and laboratory safety. Training is also provided to those individuals that are required to operate specialized equipment, for sample collection and/or analysis purposes. GSI Senior Scientists are responsible for ensuring that technicians under their supervision possess and maintain adequate proficiency, expertise, and knowledge in their respective work disciplines. It is also their responsibility to ensure that these personnel are adequately trained in applicable policies, procedures, requirements, and their scope of application. 11.3. CONTRACTING‐ENTITY TRAINING Where GSI activities are undertaken at locations operated by other entities (i.e. onboard ship), GSI will adhere to the training requirements of those organizations and makes sure that all

GSI/QAQC/QAPP/SB/1 Revision 1: May 13, 2013
Page 42 of 56
© Northeast-Midwest Institute 2013.
relevant training is carried out. In general, specific training requirements relevant to test vessels will be detailed in the individual TQAPs.
12. DOCUMENTS AND RECORDS 12.1. DOCUMENT AND RECORDS MANAGEMENT
12.1.1 DELEGATION OF AUTHORITY
The GSI PI is responsible for delegating authority for the development of GSI documents and records, as well as providing a timeframe in which to start and complete the document. In general, it is this person—the “Document Manager”—who is also responsible for the document’s management. The Document Manager works in conjunction with the GSI PI to determine document format, scope, audience, length, etc. The Document Manager also works with GSI quality management personnel to coordinate assignment of a specific and unique GSI document code. Once complete, the Document Manager is responsible for distributing the document to the GSI PI, and other GSI senior research personnel (if required) for review. She/he is also responsible for maintaining a master version of the document on file, and also on GSI SharePoint. Once complete, the final version of the document is also saved in the appropriate subfolder on GSI SharePoint.
12.1.2. FORMAT At a minimum, all GSI documents and records must include the following specifications. The unique document code must be placed in the top right hand corner of the document header as well as the date and number of pages. Codes are provided by the GSI Senior Quality Systems Officer. The document cover page must include the GSI logo as well as the title and authors.
12.1.3. REVISION Changes to documents must be recorded on a record of amendments sheet that is attached to the original document. The record must describe the revision, as well as the date. GSI quality management personnel are responsible for updating the record of amendments for all quality documents (i.e., QMP, QAPPs, TQAPs, SOPs, etc.), as well as for informing personnel of revisions to documents, and for disseminating new copies. Applicable personnel are informed of revisions to SOPs via e-mail notifications titled “Notice of SOP Revision”. The newly revised SOP is attached to the e-mail, and it is the responsibility of the individuals receiving the “Notice of SOP Revision” to read and understand the changes to the SOP. In the same manner, all applicable personnel are informed of revisions to the QAPPs and TQAPs, as well as revisions to the GSI QMP.

GSI/QAQC/QAPP/SB/1 Revision 1: May 13, 2013
Page 43 of 56
© Northeast-Midwest Institute 2013.
12.1.4. MAINTENANCE
GSI quality management personnel are responsible for maintaining on file and on GSI SharePoint a matrix of all GSI documents and records. The matrix includes the following headings: document type (i.e., TQAP, SOP, Form, Technical Report, etc.), document code, title, manager, status and date. GSI quality management personnel are also responsible for maintaining all documents and records for a period of at least five years. Electronic versions of GSI documents and records are saved to the GSI SharePoint. Hard copies of GSI documents and records, including raw data, are scanned and also saved to the GSI SharePoint website. Due care and diligence is taken to properly dispose of documents and records that are no longer required after the five year period has lapsed. Disposal procedures involve electronic deletion of documents and records from the GSI SharePoint website and the personal computers of GSI personnel, as well as manual shredding of hard copies. 12.2. SPECIFIC DOCUMENTS AND RECORDS
12.2.1. QUALITY MANAGEMENT PLAN (QMP) This document details the structure of the GSI’s quality system from an organizational perspective. It covers all aspects of GSI’s commitment to quality including policies and procedures; criteria for and areas of application; roles, responsibilities, and authorities; and assessment and response. It is the framework for planning, implementing, documenting, and assessing the GSI’s QAQC activities. The GSI Senior Quality Systems Officer is responsible for preparing the QMP, with the document based on the USEPA’s “EPA Requirements for Quality Management Plans” (USEPA, 2001) to the greatest extent possible. The QMP is distributed to the GSI PI for review in draft form. Once a draft is finalized, the document is approved and forwarded to GSI senior research personnel and the GSI Senior QAQC Officer. Draft and final copies of the document are posted to the GSI SharePoint intranet website; the final version may also be posted to the GSI public website. The GSI’s QMP is valid for a maximum period of five years, with an annual review and revision (as needed) occurring at the end of each calendar year.
12.2.2. QUALITY ASSURANCE PROJECT PLANS (QAPPS) GSI’s QAPPs describes the activities undertaken by GSI to assure the quality and credibility of its project-specific research findings, i.e., onboard ship, at the land-based facility or at the bench-scale. Each QAPP covers all aspects of QAQC relative to the specific project area, including data quality indicators, evaluation processes, performance measures and acceptance criteria; instrument certification and calibration; personnel training requirements; documents and records; data management; and QAQC assessments and response actions. The GSI Senior Quality Systems Officer, in conjunction with the GSI Senior QAQC Officer, is

GSI/QAQC/QAPP/SB/1 Revision 1: May 13, 2013
Page 44 of 56
© Northeast-Midwest Institute 2013.
responsible for developing the QAPPs. The plans follow the format of the USEPA’s “EPA Guidance for Quality Assurance Plans” (USEPA, 2002) to the greatest extent possible. Draft QAPPs are distributed to relevant GSI senior research personnel for review and comment. Once a draft is finalized, the documents are then passed on to the GSI PI for review and approval. Draft and final copies of QAPPs are posted to the GSI SharePoint intranet website; the final versions may also be posted to the GSI public website. All QAPPs, once approved, are valid for a period of five years, though they are reviewed annually and revised as needed.
12.2.3. TEST/QUALITY ASSURANCE PLANS (TQAPS) GSI’s TQAPs describe the procedures for conducting a test of a particular BWMS on a specific platform, i.e., onboard ship, at the GSI Land-Based RDTE Facility, or at the bench-scale. At a minimum, the TQAPs include detailed instructions for sample and data collection, sample handling and preservation, precision, accuracy, goals, and quality assurance and quality control requirements relevant to the particular BWMS and platform. The relevant QAPPs are generally included as an appendix to the individual TQAPs. The GSI PI in conjunction with the GSI Senior Quality Systems Officer and GSI Senior QAQC Officer are responsible for developing the TQAPs. The plans follow the format of the USEPA ETV Program’s Draft Generic Protocol for the Verification of Ballast Water Treatment Technology in Shipboard Installations (USEPA, 2012), to the greatest extent possible. Draft TQAPs are distributed to relevant GSI senior research personnel for review and comment. Once a draft is finalized, the documents are then passed on to the GSI PI for final review and approval. Draft and final copies of TQAPs are posted to the GSI SharePoint intranet website.
12.2.4. STANDARD OPERATING PROCEDURES (SOPS)
SOPs are used to implement all GSI test activities. This facilitates consistent conformance to technical and quality system requirements and increases data quality. The SOPs include both programmatic and technical processes and procedures such as organism culturing; sample collection, labeling, analysis and custody; and safety. GSI SOPs are developed by the relevant GSI senior research personnel in conjunction with the GSI Senior Quality Systems Officer and GSI Senior QAQC Officer. The GSI Senior Quality Systems Officer is responsible for distributing finalized SOPs to the GSI PI for approval. The GSI Senior Quality Systems Officer is also responsible for distributing finalized SOPs to relevant GSI personnel. Personnel are required to confirm receipt of new and updated SOPs, as well as acknowledge (in writing) that they have read and understood the document. Confirmation records are recorded and maintained by GSI quality management personnel. Finalized SOPs are posted to the GSI SharePoint website, as well as to the GSI public website. All GSI SOPs are updated on an as-needed basis. To date approximately 50 SOPs have been finalized, with many more in draft form or planned. The SOPs follow a common format and include specific QAQC procedures and metrics. GSI SOPs are grounded in published standard methods. They are also consistent with international

GSI/QAQC/QAPP/SB/1 Revision 1: May 13, 2013
Page 45 of 56
© Northeast-Midwest Institute 2013.
and domestic guidelines where they exist. All GSI SOPs are subject to periodic review and revision to assure that the most up to date approaches are employed.
12.2.5. FIELD AND LABORATORY NOTEBOOKS Bound field and laboratory notebooks, each having a unique identification code, are used to record observations, sampling details, and laboratory and field measurements associated with project-specific research activities. Notebooks are also used to record instrument and equipment calibration and maintenance information. GSI personnel are responsible for maintaining the notebooks, creating electronic copies, and posting to the GSI SharePoint website for storage and archiving.
12.2.6. FORMS AND RECORDS
Specific GSI forms are used to detail and record administrative activities associated with individual projects. These include “No Conflict of Interest” and confidentiality statements, GSI QAPP, TQAP and SOP deviation forms, and the GSI SOP amendment forms. Specific forms are also used to record sample collection and analysis data associated with project-specific research activities. All relevant GSI senior research personnel are responsible for ensuring that the forms are correctly filled out. They are also responsible for maintaining the forms on file, creating electronic copies, and posting to the GSI SharePoint website for storage and archiving. In general, hard copies of all forms are stored in three-ring binders, each with a unique identification code. Specific forms are also used to record sample custody, handling and storage information. It is the responsibility of the individual collecting the sample to complete the relevant sample collection data form. All relevant GSI senior research personnel are responsible for ensuring that the forms are correctly filled out at the time of changes to sample custody, and sample handling and storage. They are also responsible for maintaining the forms on file, creating electronic copies, and posting to the GSI SharePoint website for storage. In addition, specific forms are used to record operation, maintenance and safety information associated with specific projects. The GSI Test Manager, in conjunction with the GSI Engineer, is responsible for ensuring that all forms associated with safety (i.e., confined space entry permit forms, daily safety checklist) and those related to operation and maintenance are correctly filled out. It is their responsibility to jointly ensure that equipment maintenance and instrument calibration is properly documented, and that forms are maintained on file, and also posted to the GSI SharePoint website for storage.
12.2.7. PERSONNEL RECORDS GSI quality management personnel are responsible for maintaining on the GSI SharePoint site copies of all GSI personnel resumes, and training and certification documents. The documents are updated on an as-needed basis by the relevant member of personnel.

GSI/QAQC/QAPP/SB/1 Revision 1: May 13, 2013
Page 46 of 56
© Northeast-Midwest Institute 2013.
12.2.8. TEST FINDINGS AND OTHER GSI PRODUCTS
GSI quality management personnel are responsible for maintaining on file and posting to the GSI SharePoint website test findings and other GSI products. These include reports of test findings, public summaries of test findings, peer-reviewed scientific papers and reports, outreach documents, and conference presentations. Quality management personnel are also responsible for distributing copies of these documents to relevant parties (only when in compliance with NEMWI-developer participation and non-disclosure agreements), and posting to the GSI public website, if required.
12.2.9. QUALITY ASSURANCE/QUALITY CONTROL RECORDS
GSI quality management personnel assess the implementation of project-specific QAPPs, TQAPs and SOPs during each test of a BWMS. At the end of the test duration, the GSI Senior QAQC Officer provides a report to the GSI PI, the GSI Senior Quality Systems Officer and other relevant personnel. The report includes a table listing deviations to the specific QAPP and TQAP associated with the testing and a table listing deviations to the specific SOPs that were used during the testing. The GSI QAQC Officer is also responsible for verifying data recording and archiving procedures by randomly evaluating data recording forms and field notebooks for completion, compliance and correct storage procedures. Following completion and verification of a data set associated with a specific BWMS, GSI quality system personnel determine if the data quality objectives outlined in the relevant GSI QAPP and TQAP have been successfully met. Personnel also determine if the performance criteria outlined in these documents have been successfully met. Results are provided in reports submitted to the GSI PI; final copies are stored on GSI SharePoint.
13. QUALITY CONTROL REQUIREMENTS GSI’s quality control requirements relative to its shipboard activities are summarized in Table 7, though more detailed information will be provided in the BWMS-specific TQAPs. All of these requirements and associated acceptance criteria and corrective actions ensure that data generated is acceptable and credible.

GSI/QAQC/QAPP/SB/1 Revision 1: May 13, 2013
Page 47 of 56
© Northeast-Midwest Institute 2013.
Table 7. Quality Control Requirements for GSI Shipboard Tests.
Applicability Quality Control Requirement Frequency Acceptance Criteria Corrective Action
Operational Proper documentation and archiving of all
operational data Following each set of tests of
a specific BWMS.
Qualitative spot-checks of documents and data
storage/archiving procedures at least once
per BWMS test.
Problems identified by the spot-checks will be
documented and included in a corrective action report. Follow-up communication with responsible staff to
address the problems will be conducted as soon as
possible. Retraining of the responsible staff will be conducted if needed.
Health and Safety
Adequately trained personnel. As required. Qualitative spot-checks of
documents and data storage/archiving
procedures at least once per BWMS test.
Compliance with all relevant ship and facility occupational health and safety procedures.
Daily
Chemical/Physical Water Parameters
See Table 5 for QC sample types; any BWMS-specific QC samples will be detailed
in the TQAP.
See Table 5 for frequency of QC sample collection; any
BWMS-specific QC samples will be detained in the TQAP.
See Table 5 for QC sample acceptance criteria (DQO);
any BWMS-specific QC samples will be detained in
the TQAP.
To be detailed in BWMS-specific TQAPs.
Biological Water Parameters
See Table 5 for QC sample types; any BWMS-specific QC samples will be detailed
in the TQAP.
See Table 5 for frequency of QC sample collection; any
BWMS-specific QC samples will be detained in the TQAP.
See Table 5 for QC sample acceptance criteria (DQO);
any BWMS-specific QC samples will be detained in
the TQAP.
To be detailed in BWMS-specific TQAPs.
Sample Collection Ensure correct implementation of SOPs. Periodically N/A - qualitative
Problems identified by the spot-checks will be
documented and included in a corrective action report. Follow-up communication with responsible staff to
address the problems will be conducted as soon as
possible. Retraining of the responsible staff will be conducted if needed.
Sample Analysis
Ensure correct implementation of SOPs. Periodically N/A - qualitative
Problems identified by the spot-checks will be
documented and included in a corrective action report. Follow-up communication with responsible staff to
address the problems will be conducted as soon as
possible. Retraining of the responsible staff will be conducted if needed.
Validation of data quality indicators. To be detailed in BWMS-
specific TQAPs. To be detailed in BWMS-
specific TQAPs. To be detailed in BWMS-
specific TQAPs.
Data Analysis To be detailed in BWMS-specific TQAPs. To be detailed in BWMS-
specific TQAPs. To be detailed in BWMS-
specific TQAPs. To be detailed in BWMS-
specific TQAPs.
Documents and Records
Proper recording, storage and archiving of all documents and records.
Regularly (i.e., monthly).
Qualitative spot-checks of documents and records recording, storage and archiving procedures at
least once per BWMS test.
Problems identified by the spot-checks will be
documented and included in a corrective action report. Follow-up communication with responsible staff to
address the problems will be conducted as soon as
possible. Retraining of the responsible staff will be

GSI/QAQC/QAPP/SB/1 Revision 1: May 13, 2013
Page 48 of 56
© Northeast-Midwest Institute 2013.
conducted if needed.
Sample Labeling, Handling and Custody
Checking of sample labels by a second individual to ensure that the same codes are
not used for more than one individual sample.
At the time of sample labeling.
Qualitative spot-checks of sample labeling, handling and custody procedures before the start of every
intake and discharge operation.
Problems identified by the spot-checks will be
documented and included in a corrective action report. Follow-up communication with responsible staff to
address the problems will be conducted as soon as
possible. Retraining of the responsible staff will be conducted if needed..
Determination as to whether proper custody procedures were followed during the field work and also if additional samples are
required.
Following completion of a sampling event.
Qualitative spot-checks of sample labeling, handling and custody procedures throughout every intake
and discharge operation.
Proper recording, storage and archiving of all Chain-of-Custody forms.
Regularly (i.e., monthly).
Qualitative spot-checks of Chain-of-Custody form recording, storage and archiving procedures at
least once per BWMS test.
Equipment and Instruments
Calibration or verification of analytical equipment/instrumentation. Maintenance
checks of equipment, and proper documentation and archiving of
maintenance data.
Dependent on the type of equipment; in some cases,
daily.
Qualitative spot-checks of documents and data
storage/archiving procedures at least once
per BWMS test.
Problems identified by the spot-checks will be
documented and included in a corrective action report. Follow-up communication with responsible staff to
address the problems will be conducted as soon as
possible. Retraining of the responsible staff will be conducted if needed.
14. INSTRUMENT/EQUIPMENT INSPECTION, CALIBRATION AND MAINTENANCE
For the purposes of this shipboard QAPP, GSI has two categories of apparatus that require inspection, calibration, and routine/non-routine maintenance: equipment and instruments. GSI defines equipment as “implements used in an operation or activity” and defines instruments as “a measuring device used for determining the present value of a quantity under observation”. Therefore, an instrument is a device used to carry out a measurement during shipboard testing, while equipment is a discrete non-consumable item operating during testing as a stand-alone apparatus or in combination with several instruments or pieces of equipment. The GSI Senior QAQC Officer (Ms. Kelsey Prihoda) is responsible for ensuring that all instruments used during GSI shipboard tests are inspected, calibrated and maintained according to the manufacturer’s manual and/or relevant GSI SOP. She is also responsible for ensuring that all personnel undertaking inspection, calibration and maintenance of specific instruments, as detailed in Table 8, are suitably qualified and that they have read and understood the manual and/or GSI SOP (as applicable) for each device prior to undertaking any inspection and/or maintenance procedures. In addition, Ms. Prihoda is responsible for ensuring that all activities related to inspection, calibration and maintenance of instruments to be used in GSI shipboard tests are correctly documented. She is also responsible for maintaining the documents on file, creating electronic copies, and posting copies to the GSI SharePoint website for storage.

GSI/QAQC/QAPP/SB/1 Revision 1: May 13, 2013
Page 49 of 56
© Northeast-Midwest Institute 2013.
The GSI Test Manager (Mr. Travis Mangan) is responsible for ensuring that all equipment used during GSI shipboard tests are inspected, calibrated and maintained according to the manufacturer’s manual and/or relevant GSI SOP. He is also responsible for ensuring that all personnel undertaking inspection, calibration and maintenance of specific pieces of equipment, as detailed in Table 8, are suitably qualified and that they have read and understood the manual for each device prior to undertaking any inspection and/or maintenance procedures. In addition, Mr. Mangan is responsible for ensuring that all activities related to inspection, calibration and maintenance of equipment to be used in GSI shipboard tests are correctly documented. He is also responsible for maintaining the documents on file, creating electronic copies, and posting copies to the GSI SharePoint website for storage. QAQC spot-checks of all forms associated with the inspection, calibration and maintenance of instruments and equipment relevant to GSI shipboard testing, and the processes used to complete and maintain them, will be undertaken periodically by the GSI Senior QAQC Officer. Problems identified by spot-checks will be documented and included in a corrective action report. Table 8. Inspection, Calibration and Maintenance of GSI Instruments and Equipment Relevant for
GSI Shipboard Tests. Asterisk (*) Denotes Instruments.
Apparatus Manufacturer Description
Inspection/ Calibration/ Maintenance
Schedule
Technician
Autoclave Yamato Yamato Sterilizer Monthly Heidi Saillard
Automatic Titrator* Mettler Toledo Used to measure alkalinity, hardness, DO (used with Rondolino Sample Changer)
Daily Deanna Regan,
Christine Polkinghorne
Balance* Mettler Toledo Analytical Balances (including models
AG245, PB303, XS105DU, and MS303S)
Annually; Daily verification of
accuracy
NBS Balances (annually); Technician
( Annually; Heidi Saillard, Deanna
Regan, Matt TenEyck, and Christine
Polkinghorne on a daily) basis
Data logger* MadgeTech MadgeTech HiTemp102 Data Logger for
checking autoclave performance Annually MadgeTech
Flow Meter* azbil / Yamatake 1.5” and 8” electromagnetic flow meters Annually Tyler Schwerdt/Adam
Marksteiner
Freezer
Thermo Fisher Scientific
ISOtemp Refrigerator/Freezer Weekly Heidi Saillard
VWR Scientific Chest Freezer at -70 °C Weekly Heidi Saillard
Hood-Biohazard/Chemical Nuaire Chemical Exhaust Hood Annually Carol Lindberg
Hood_Laminar Flow Nuaire Laminar Flow Hood Annually Heidi Saillard
HPLC* Agilent 1290 Infinity UHPLC Prior to each trial Deanna Regan

GSI/QAQC/QAPP/SB/1 Revision 1: May 13, 2013
Page 50 of 56
© Northeast-Midwest Institute 2013.
IDEXX Sealer IDEXX IDEXX Quanti-Tray® Sealer 2x Annually Heidi Saillard
Incubator
Multiple including Crosley Shelvador,
Eppendorf, Lab-Line, Percival,
Precision Scientific and VWR
Incubator and Incubator/Shakers Weekly temperature
checks
Heidi Saillard, Matt TenEyck, Christine
Polkinghorne
Level Transducers IFM Tank Level Indicators Annually Tyler Schwerdt/
Adam Marksteiner
Microscopes*
Olympus Equipped with 40X objective lens,
epifluorescence, able to excite samples at 450-490 nm
Following every assembly and
otherwise when needed
Christine Polkinghorne
Olympus Upright microscope with fluorescence for
200X and 400X observation of protist samples
Following every assembly and
otherwise when needed
Euan Reavie, Lisa Allinger
Oven Precision
Gravity convection oven (with Drierite or other desiccant present in a beaker or glass
dish)
Monthly Temperature Check
Heidi Saillard
VWR Symphony Convection Oven Monthly Deanna Regan
Pipettes*
Multiple including Eppendorf,
FinnPipette, and Fisher
Adjustable Volume Pipettes, Various Volumes
Every 3 months Deanna Regan, Heidi Saillard, Mary Balcer,
Euan Reavie
Henson-Stempel 1, 5, and 10 mL Henson-Stempel Every 3 months Mary Balcer
Pressure Transmitters* IFM Pressure transmitters Annually Tyler Schwerdt/Adam
Marksteiner
Reagent Water Milli-Q Several DI water System in LSRI
laboratories Annually Deanna Regan
Refrigerator Thermo Fisher
Scientific ISOtemp Refrigerator/Freezer
Weekly temperature check
Heidi Saillard
Sensor-multi parameter* YSI Sonde that measures dissolved oxygen, specific conductivity, temperature, pH,
turbidity and total chlorophyll
Prior to each trial/test cycle
Matt TenEyck, Christine
Polkinghorne, Deanna Regan, Kelsey
Prihoda
Spectrophotometer* Perkin Elmer Lambda 25 UV/Vis Daily Deanna Regan
Thermo Spectronic 20D+ Daily Deanna Regan
Thermometer* Thermo Fisher
Scientific Jumbo Refrigerator Freezer Thermometers Semi-Annually Heidi Saillard
TOC Analyzer* Shimadzu Total Organic Analyzer model TOC-5050A Prior to each test Deanna Regan
UV lamp Spectoline E-series UV light-6 watt, 365 nm. Annually Heidi Saillard
Vacuum pump Gast GAST vacuum pump, 0-760mmHg Range Annually Heidi Saillard

GSI/QAQC/QAPP/SB/1 Revision 1: May 13, 2013
Page 51 of 56
© Northeast-Midwest Institute 2013.
15. QUALITY ASSURANCE ASSESSMENT AND OVERSIGHT 15.1. ASSESSMENT GSI assesses its quality system on a project by project (or test by test) basis using a variety of tools. In this situation, one project/test is defined as a series of sampling events of a specific BWMS. The purpose, procedural details, and implementation frequency of each of these assessment tools are outlined below.
15.1.1. TQAP AND QAPP AUDITS The GSI Senior QAQC Officer assesses the implementation of individual TQAPs and relevant QAPPs during each test of a BWMS. At the end of the test duration, the Officer provides a report to the GSI Senior Quality Systems Officer and GSI PI. The report includes a table listing deviations to the specific Test Plan and QAPP associated with the testing. The following table headings are to be used:
TQAP/QAPP Section TQAP /QAPP Page No. Description Deviation/Inconsistency Date GSI Personnel Reconciliation/Corrective Action
The report also includes an assessment of personnel training requirements and certification, as well as procedures for storing and archiving documents and records; sample labeling, handling and custody requirements; and instrument and equipment maintenance. The GSI Senior QAQC Officer posts final copies of the TQAP/QAPP audit reports to the GSI SharePoint website for archiving and storage. Note: In the case of substantial deviations to TQAPs/QAPPs, the GSI Senior QAQC Officer will notify the GSI PI immediately, with the GSI PI responsible for determining the appropriate course of action.
15.1.2. SOP AUDITS
The GSI Senior QAQC Officer assesses the implementation of relevant SOPs during each test of a BWMS. At the end of the test duration, the officer provides a report to the GSI Senior Quality Systems Officer and GSI PI. The report includes a table listing deviations to the specific SOPs that were used during the testing. The following table headings are to be used:
SOP Code SOP Title

GSI/QAQC/QAPP/SB/1 Revision 1: May 13, 2013
Page 52 of 56
© Northeast-Midwest Institute 2013.
Description Deviation/Inconsistency Date GSI Personnel Reconciliation/Corrective Act
The GSI Senior QAQC Officer posts final copies of the SOP audit reports to the GSI SharePoint website for archiving and storage. Note: In the case of substantial deviations to SOPs during testing, the GSI Senior QAQC Officer will notify the GSI PI immediately, with the GSI PI responsible for determining the appropriate course of action.
15.1.3. PROJECT‐SPECIFIC DATA RECORDING AND ARCHIVING AUDITS
Following completion of test activities associated with a specific BWMS, the GSI Senior QAQC Officer verifies data recording and archiving procedures by randomly evaluating data recording forms and field notebooks for completion, compliance and correct storage procedures. This includes organism enumeration datasheets, sampling datasheets, chain of custody forms, etc. The GSI Senior QAQC Officer also undertakes regular random data verification checks by comparing electronic records (i.e., in database or Excel format) with raw datasheets (i.e., paper forms). This is a manual inspection process and though rather time consuming, is an essential procedure for discovering errors. Findings are summarized in a report provided to the GSI Senior Quality Systems Officer and GSI PI. Final reports are saved to GSI SharePoint for storage and archiving. Note: If data errors or deviations from quality documentation are found during the data verification and validation process, the GSI Senior QAQC Officer will notify the GSI PI immediately, with the GSI PI responsible for determining the appropriate course of action.
15.1.4. PROJECT‐SPECIFIC DATA QUALITY ASSESSMENTS
Following completion and verification of a data set associated with a specific BWMS, the GSI Senior QAQC Officer determines if the data quality objectives outlined in the relevant TQAP/QAPP have been successfully met. Findings are summarized in a series of tables detailing the data quality indicators by type of analysis, e.g., organisms ≥ 50 µm, organisms ≥ 10 and < 50 µm, organisms < 10 µm, etc. Reports are provided to the GSI Senior Quality Systems Officer and GSI PI; final copies are stored on GSI SharePoint. Any significant deviations will also be discussed in the report, with the recommended course of action ultimately determined by the GSI PI.

GSI/QAQC/QAPP/SB/1 Revision 1: May 13, 2013
Page 53 of 56
© Northeast-Midwest Institute 2013.
15.1.5. PROJECT‐SPECIFIC PERFORMANCE CRITERIA ASSESSMENTS Following completion and verification of a data set associated with a specific BWMS, the GSI Senior QAQC Officer also determines if the performance criteria outlined in the relevant TQAP/QAPP have been successfully met. Findings are summarized in a table detailing the performance criteria and test results. The table is provided in a report to the GSI Senior Quality Systems Officer and GSI PI. Final copies of the report are saved to GSI SharePoint for storage and archiving. Any significant deviations will be discussed in the report, with the recommended course of action ultimately determined by the GSI PI. 15.2. RESPONSE
15.2.1. CORRECTIVE ACTION REPORTS GSI quality management personnel convene to discuss quality system audits and assessment outcomes following completion of tests of a specific BWMS. Outcomes are handled on a case-by-case basis and personnel use the results to develop recommendations and directives for actions to correct work or data that do not conform to GSI quality standards. Personnel then compile a report listing the recommendations and directives. This report is provided to the GSI PI, and then to relevant GSI senior research team personnel and to those individuals involved in the follow-up to ensure visibility and timeliness. Reports are also posted to the GSI SharePoint website for storage and archiving. The GSI PI is ultimately responsible for determining the recommended course of action for significant deviations from GSI quality standards.
16. REFERENCES
American Public Health Association (2012). Standard Method 2540 E. Fixed and Volatile Solids Ignited at 550 °C in Standard Methods for the Examination of Water and Wastewater, 22nd Edition, pp. 2-67 to 2-68. Cangelosi A, Schwerdt T, Mangan T, Mays N & Prihoda K, (2011). A Ballast Discharge Monitoring System for Great Lakes Relevant Ships: A Guidebook for Researchers, Ship Owners, and Agency Officials. Great Ships Initiative, Northeast-Midwest Institute, Washington, D.C., USA. http://www.nemw.org/GSI/BallastDischargeMonitoringGuidebook.pdf Great Ships Initiative (2013). Great Ships Initiative (GSI) Quality Management Plan, Revision 3. Northeast-Midwest Institute, Washington, DC. International Maritime Organization (2004). International Convention for the Control and Management of Ships Ballast Water and Sediments. As adopted by consensus at a Diplomatic Conference at IMO, London, England, February 13 2004. International Maritime Organization (2008a). Guidelines for Approval of Ballast Water Management Systems (G8), Resolution MEPC.174(58). Adopted on 10 October 2008.

GSI/QAQC/QAPP/SB/1 Revision 1: May 13, 2013
Page 54 of 56
© Northeast-Midwest Institute 2013.
International Maritime Organization (2008b). Procedure for Approval of Ballast Water Management Systems that Make use of Active Substances (G9), Resolution MEPC.169(57). Adopted on 04 April 2008. Reavie ED, Cangelosi AA & Allinger LE (2010). Assessing Ballast Water Treatments: Evaluation of Viability Methods for Ambient Microplankton Assemblages. Journal of Great Lakes Research; 36: 540-547. Richard RV, Grant JF &. Lemieux EJ (2008). Analysis of Ballast Water Sampling Port Designs Using Computational Fluid Dynamics. Report No. CG-D-01-08. US Coast Guard Research and Development Center, Groton, CT. United States Environmental Protection Agency (2001). EPA Requirements for Quality Management Plans (QA/R-2). United States Environmental Protection Agency, EPA/240/B-01/002, March 2001. http://www.epa.gov/quality/qs-docs/r2-final.pdf United States Environmental Protection Agency (2002). EPA Guidance for Quality Assurance Plans (EPA QA/G-5). United States Environmental Protection Agency, EPA/240/R-02/009, December 2002. http://www.epa.gov/quality/qs-docs/g5-final.pdf United States Environmental Protection Agency (2002a). Short-term Methods for Estimating the Chronic Toxicity of Effluents and Receiving Waters to Freshwater Organisms. United States Environmental Protection Agency. http://water.epa.gov/scitech/methods/cwa/wet/disk3_index.cfm United States Environmental Protection Agency (2012). Environmental Technology Verification Program (ETV) Draft Generic Protocol for the Verification of Ballast Water Treatment Technology in Shipboard Installations, Version 4.0. U.S. EPA ETV in cooperation with the U.S. Coast Guard Environmental Standards Division (CG-5224) and the U.S. Naval Research Laboratory. National Sanitation Foundation International, Ann Arbor, MI, 80 pp. + appendices.

GSI/QAQC/QAPP/SB/1 Revision 1: May 13, 2013
Page 55 of 56
© Northeast-Midwest Institute 2013.
APPENDIX 1. Matrix of Relevant GSI Standard Operating Procedures (SOPs).
SOP Code SOP Title Scale Category Sub-Category
GSI/SOP/G/A/RK/1 Procedure for Record Keeping General Administration Record Keeping
GSI/SOP/G/A/RK/3 Procedures for Good Documentation Practices General Administration Record Keeping
GSI/SOP/G/RA/DM/1 Procedure for GSI Zooplankton Database Data
Entry, Data Quality Control and Database Management
General Research Activities
Data Management
GSI/SOP/G/RA/DM/2 Procedure for General Data Entry Using Microsoft ®
Excel General
Research Activities
Data Management
GSI/SOP/G/RA/DM/3 Procedure for GSI Protist Database Data Entry, Data
Quality Control, and Database Management General
Research Activities
Data Management
GSI/SOP/G/RA/SC/1 Procedure for Custody of GSI Samples General Research Activities
Sample Custody
GSI/SOP/BS/RA/GL/1 Procedure for Verification of Laboratory Balances Bench-Scale Research Activities
General Laboratory
GSI/SOP/BS/RA/CU/3 Procedure for Culturing the Cladocerans Daphnia
magna and Ceriodaphnia dubia Bench-Scale
Research Activities
Culturing
GSI/SOP/BS/RA/CU/4 Procedure for Culturing Selenastrum Capricornutum Bench-Scale Research Activities
Culturing
GSI/SOP/BS/RA/WET/1 Procedure for Assessing Chronic Residual Toxicity of a Ballast Treatment System to Ceriodaphia dubia
Bench-Scale Research Activities
Residual Toxicity
GSI/SOP/BS/RA/WET/2 Procedure for Assessing Chronic Residual Toxicity
of a Ballast Treatment System to the Fathead Minnow (Pimephales promelas)
Bench-Scale Research Activities
Residual Toxicity
GSI/SOP/BS/RA/WET/3 Procedure for Assessing Chronic Residual Toxicity of a Ballast Treatment System to the Green Alga
(Selenastrum capricornutum) Bench-Scale
Research Activities
Residual Toxicity
GSI/SOP/MS/RA/MA/1 Procedure For Conducting Heterotrophic Plate
Counts (HPCs) Using IDEXX’s SimPlate® for HPC Method
All Research Activities
Microbial Analysis
GSI/SOP/MS/RA/MA/3 Procedure for the Detection and Enumeration of
Enterococcus using Enterolert™ All
Research Activities
Microbial Analysis
GSI/SOP/MS/RA/MA/4 Procedure for the Detection and Enumeration of
Total Coliforms and E. coli Using IDEXX's Colilert® All
Research Activities
Microbial Analysis

GSI/QAQC/QAPP/SB/1 Revision 1: May 13, 2013
Page 56 of 56
© Northeast-Midwest Institute 2013.
GSI/SOP/MS/RA/MA/7 Procedure for Enumerating Heterotrophic Plate Counts (HPC) Using the Spread Plate Method
All Research Activities
Microbial Analysis
GSI/SOP/BS/RA/MP/1 General Microbiology Preparation Procedures Bench-Scale Research Activities
Microbial Procedures
GSI/SOP/MS/RA/C/3 Procedures for Measuring Organic Carbon in
Aqueous Samples All
Research Activities
Chemistry
GSI/SOP/MS/RA/C/4 Procedure for Determining Percent Transmittance
(%T) of Light in Water at 254 nm All
Research Activities
Chemistry
GSI/SOP/MS/RA/C/8 Procedure for Analyzing Total Suspended Solids
(TSS) All
Research Activities
Chemistry
GSI/SOP/MS/RA/C/9 Procedure for pH Meter Calibration and
pH Measurement All
Research Activities
Chemistry
GSI/SOP/MS/G/C/4 Procedure for Calibration, Deployment, and Storage
of YSI Multiparameter Water Quality Sondes All General Calibration
GSI/SOP/MS/RA/SA/1 Procedure for Protist Sample Analysis All Research Activities
Sample Analysis
GSI/SOP/MS/RA/SA/2 Procedure for Zooplankton Sample Analysis All Research Activities
Sample Analysis

GSI/QAQC/SB/TQAP/4 Issue Date: November 5, 2013
Page 1 of 52
Test/QualityAssurancePlan(TQAP)TESTCYCLE4OFTHEGSIEVALUATIONOFTHEETVDRAFTPROTOCOLFORTHEVERIFICATIONOFBALLASTWATERTREATMENTTECHNOLOGYINSHIPBOARDINSTALLATIONS(VERSION5.2)
November5,2013
Principal Investigator:
Allegra Cangelosi, NEMWI
Research Team:
Meagan Aliff, NRRI, UMD Lisa Allinger, NRRI, UMD
Esther Angert, PhD, Cornell University Mary Balcer, PhD, LSRI, UWS Kimberly Beesley, LSRI, UWS Meghana Desai, PhD, NEMWI
Lana Fanberg, LSRI, UWS Steve Hagedorn, LSRI, UWS
Adam Marksteiner, AMI Engineering Travis Mangan, NEMWI Nicole Mays, NEMWI
Christine Polkinghorne, LSRI, UWS Kelsey Prihoda, LSRI, UWS
Euan Reavie, PhD, NRRI, UMD Deanna Regan, LSRI, UWS Heidi Saillard, LSRI, UWS Heidi Schaefer, LSRI, UWS
Tyler Schwerdt, PE, AMI Engineering Matthew TenEyck, LSRI, UWS

GSI/QAQC/SB/TQAP/4 Issue Date: November 5, 2013
Page 2 of 52
Test/QualityAssurancePlan(TQAP)
TestCycle4oftheGSIEvaluationoftheETVDraftProtocolfortheVerificationofBallastWater
TreatmentTechnologyinShipboardInstallations(Version5.2)
November5,2013
Allegra Cangelosi Principal Investigator and Director
Great Ships Initiative Northeast-Midwest Institute
50 F St. NW, Suite 950 Washington, DC 20001 Phone: 202-464-4014
Email: [email protected]
Approved By:
Accepted By:
XAllegra CangelosiGreat Ships Initiative Principal Investigator
XArden C. TurnerUnited States Coast Guard Research and Develop...

GSI/QAQC/SB/TQAP/4 Issue Date: November 5, 2013
Page 3 of 52
RecordofRevisions
RevisionNumber DescriptionofChanges
1
2
3
4
5
6
7

GSI/QAQC/SB/TQAP/4 Issue Date: November 5, 2013
Page 4 of 52
ABBREVIATIONSANDACRONYMS %D: Percent Difference %T: Percent Transmittance µM: Micrometer ANOVA: Analysis of Variance ASC: American Steamship Company BWMS: Ballast Water Management System BWT: Ballast Water Treatment CFD: Computational Fluid Dynamics CFU: Colony Forming Unit CMFDA: 5-chloromethylfluorescein diacetate CO2: Carbon Dioxide COC: Chain of Custody DI: Deionized DO: Dissolved Oxygen DOC: Dissolved Organic Carbon DOM: Dissolved Organic Matter DQO: Data Quality Objective DSP: Draft Shipboard Protocol DST: Defined Substrate Technology EHS: Environmental, Health and Safety EMD: Electro-Motive Diesel ETV: Environmental Technology Verification FDA: Fluorescein Diacetate FH: Filter Housing Ft.: Feet GLRI: Great Lakes Restoration Initiative GSI: Great Ships Initiative HCl: Hydrochloric Acid HDPE: High Density Polyethylene HMI: Human-Machine Interface HPC: Heterotrophic Plate Counts HPCA: Heterotrophic Plate Count Agar ID: Internal Diameter IH: M/V Indiana Harbor IMO: International Maritime Organization LAN: Local Area Network LOQ: Limit of Quantification LSRI: Lake Superior Research Institute M/V: Motor Vessel MARAD: United States Maritime Administration MDL: Method Detection Limit MM: Mineral Matter MPN: Most Probable Number MTSA: Maritime Transportation Security Act

GSI/QAQC/SB/TQAP/4 Issue Date: November 5, 2013
Page 5 of 52 NaOH: Sodium Hydroxide NEMWI: Northeast Midwest Institute NPOC: Non-Purgeable Organic Carbon NRL: Naval Research Laboratory NRRI: Natural Resources Research Institute p3SFS: Prototype Three Skid Filter System PI: Principal Investigator PLC: Programmable Logic Controller POC: Particulate Organic Carbon POM: Particulate Organic Matter PP: Polypropylene PPE: Personal Protective Equipment PSC: Percent Similarity QA: Quality Assurance QAPP: Quality Assurance Project Plan QC: Quality Control QMP: Quality Management Plan RDC: Research and Development Center RDTE: Research, Development, Testing, and Evaluation RPD: Relative Percent Difference SD: Secure Digital SOP: Standard Operating Procedure SOW: Scope of Work TC: Test Cycle TO: Testing Organization TOC: Total Organic Carbon TQAP: Test/Quality Assurance Plan TR: Technical Report TSA: Technical Systems Audit TSS: Total Suspended Solids TWIC™: Transportation Worker Identification Credential UMD: University of Minnesota-Duluth US GPM: United States Gallons per Minute USCG RDC: United States Coast Guard Research and Development Center USCG: United States Coast Guard USEPA: United States Environmental Protection Agency UV: Ultraviolet UWS: University of Wisconsin-Superior VO: Verification Organization WET: Whole Effluent Toxicity WI: Wisconsin WPDES: Wisconsin Pollutant Discharge Elimination System YSI: Yellow Springs Instruments

GSI/QAQC/SB/TQAP/4 Issue Date: November 5, 2013
Page 6 of 52
TABLEOFCONTENTSABBREVIATIONS AND ACRONYMS ................................................................................................................ 4 LIST OF TABLES .............................................................................................................................................. 7 LIST OF FIGURES ............................................................................................................................................ 7 1. INTRODUCTION ..................................................................................................................................... 8 2. ROLES AND RESPONSIBILITIES OF INVOLVED ORGANIZATIONS ......................................................... 10 3. DESCRIPTION OF THE TESTING ORGANIZATION (TO) ......................................................................... 10 4. DESCRIPTION OF THE TEST VESSEL ..................................................................................................... 10 5. TEST OBJECTIVES, EXPERIMENTAL AND SAMPLING DESIGN ............................................................... 10 5.1. Test Objectives ............................................................................................................................ 10 5.2. Experimental and Sampling Design............................................................................................. 10
6. CHALLENGE CONDITIONS ................................................................................................................... 11 7. SAMPLE METHODS AND PROCEDURES .............................................................................................. 12 7.1. Overall Sampling Design ............................................................................................................. 12 7.2. Sample Volumes and Flow Rates ................................................................................................ 13 7.3. Sampling System ......................................................................................................................... 14 7.4. Intake Sampling and Ballast Retention ....................................................................................... 14 7.5. Discharge Sampling ..................................................................................................................... 19 7.6. Sample Collection Methods ........................................................................................................ 24 7.6.1. Collection of Samples from the p3SFS Filter Bags .............................................................. 24 7.6.2. Collection of Biological Samples from the p3SFS Drip Sampler .......................................... 25 7.6.3. Collection of Water Quality and Water Chemistry Samples from the p3SFS Drip Sampler 26
7.7. Sample Handling ......................................................................................................................... 28 8. SAMPLE ANALYSIS METHODS ............................................................................................................. 31 8.1. Water Chemistry ......................................................................................................................... 31 8.2. Biology ......................................................................................................................................... 32 8.2.1. Organisms ≥ 50 µm ............................................................................................................. 32 8.2.2. Organisms ≥ 10 µm to < 50 µm ........................................................................................... 32
9. DATA MANAGEMENT, ANALYSIS AND REPORTING ............................................................................ 34 9.1. Data Processing and Storage ...................................................................................................... 34 9.2. Data Verification and Validation ................................................................................................. 34 9.3. Data Analysis ............................................................................................................................... 35 9.4. Data Reporting ............................................................................................................................ 35
10. Quality Control Requirements ............................................................................................................ 35 11. INSTRUMENT/EQUIPMENT TESTING, INSPECTION, CALIBRATION AND MAINTENANCE ................... 38 12. QUALITY MANAGEMENT .................................................................................................................... 40 12.1. GSI Quality Management System ........................................................................................... 40 12.2. Test Quality Assurance/Quality Control ................................................................................. 40 12.2.1. Validity Criteria.................................................................................................................... 40 12.2.2. Data Quality Indicators ....................................................................................................... 40
13. ENVIRONMENTAL, HEALTH AND SAFETY ............................................................................................ 41 14. REFERENCES AND RELATED DOCUMENTS .......................................................................................... 42 APPENDICES ................................................................................................................................................ 44 APPENDIX 1: GSI SHIPBOARD QUALITY ASSURANCE PROJECT PLAN (QAPP) ............................................ 45 APPENDIX 2: GSI SHIPBOARD EXAMPLE DATASHEETS ............................................................................... 46 APPENDIX 3: GSI CHAIN OF CUSTODY (COC) FORM (GSI/FORM/QAQC/3) ............................................... 52

GSI/QAQC/SB/TQAP/4 Issue Date: November 5, 2013
Page 7 of 52
LISTOFTABLES
Table 1. Planned Calendar of Test Cycle 4 Data Generation, Assessment and Reporting. ....................... 11 Table 2. Target Challenge Water Chemistry, Water Quality and Biological Characteristics Relative to Intake Ballast Water from the Ports of Southern Lake Michigan. .............................................................. 12 Table 3. Target Operational Values for Vessel Ballast Operations during Test Cycle 4 Onboard the M/V Indiana Harbor. ........................................................................................................................................... 13 Table 4. Description of GSI Personnel Roles During Test Cycle 4 Intake. .................................................. 19 Table 5. Description of GSI Personnel Roles During Test Cycle 4 Discharge. ............................................ 24 Table 6. Class, Type and Number of Samples To Be Collected During Test Cycle 4 Ballast Intake. ........... 27 Table 7. Class, Type and Number of Samples To Be Collected During Test Cycle 4 Ballast Discharge. ..... 28 Table 8. Test Cycle 4 Sample Handling and Storage Requirements. ......................................................... 30 Table 9. Quality Control Requirements for Test Cycle 4. ........................................................................... 37 Table 10. Inspection, Calibration and Maintenance of GSI Instruments and Equipment Relevant to Test Cycle 4. Asterisk (*) Denotes Instruments. ................................................................................................. 39
LISTOFFIGURES
Figure 1. Volume Calculator (taken from USCG STEP Application) Showing GSI's Assumptions for Required Volume of Each Sample. Total volume analyzed is based on combining three samples, collected every 75 minutes, over an approximately 6 hour deballasting period. ...................................... 14 Figure 2. Test Cycle 4 Intake Sample Collection Activities. ........................................................................ 18 Figure 3. Test Cycle 4 Discharge Sample Collection Activities. .................................................................. 23 Figure 4. Example Sample Bottle Label for Test Cycle 4 (Test ID: 13‐ETV‐4). ........................................... 29

GSI/QAQC/SB/TQAP/4 Issue Date: November 5, 2013
Page 8 of 52
1. INTRODUCTION This Great Ships Initiative (GSI) Test/Quality Assurance Plan (TQAP) describes GSI’s procedures for Test Cycle 4 (TC4) of the Great Lakes Restoration Initiative (GLRI) Project Ballast Water Treatment (BWT) Shipboard Approval Tests (hereafter referred to as the GLRI Project). The objectives of the GLRI Project are to implement in fresh water and to identify areas of improvement to components of the United States Environmental Protection Agency (USEPA) Environmental Technology Verification (ETV) Program’s Draft Generic Protocol for the Verification of Ballast Water Treatment Technology in Shipboard Installations, version 5.2 (hereafter referred to as ETV DSP; USEPA, 2012), including an optional sampling approach in the ETV DSP known as the prototype 3 Shipboard Filter Skid (p3SFS). In the process of meeting these two objectives, the GLRI Project also will generate limited information about the biological treatment efficacy and environmental soundness of a developing ballast water management system (BWMS) involving sodium hydroxide (NaOH) treatment and carbon dioxide (CO2) neutralization. The ETV DSP provides guidance on the necessary elements of shipboard BWMS verification tests including developer-provided specifications and information, TQAP content, and protocols for assessing BWMS biological treatment efficacy, environmental acceptability, and operational parameters. The GLRI Project is a demonstration of the ETV DSP in the context of individual voyages onboard an operating ship to generate recommendations on how to improve the execution and effectiveness of the ETV DSP, including the p3SFS prototype sampling approach. Specifically, it focuses on biological treatment efficacy and environmental acceptability-related aspects of the ETV DSP. The GLRI Project comprises four test cycles (TCs) during normal vessel operations onboard the Motor Vessel (M/V) Indiana Harbor (IH), a 305 m Great Lakes self-unloading bulk freighter that operates exclusively in the upper four Great Lakes under the auspices of American Steamship Company (ASC). During selected TCs, a partial (i.e., two-tank) and temporary BWMS (involving NaOH treatment and CO2 neutralization) has been active. For TCs 1 - 3, ballast intake occurred in southern Lake Michigan or in the St. Clair River, and ballast discharge occurred in the Port of Duluth-Superior (specifically, the Superior Midwest Energy Terminal in Superior, Wisconsin). There are several factors that differentiate GLRI Project TQAPs from an actual ETV DSP TQAP noted previously (see TQAPs for TC1 – 3)1. Nonetheless, the GLRI Project has resulted in invaluable experience with operational realities of the ETV DSP, and recommendations for improvement.
1 These include: a) The primary objective of GLRI Project TQAPs are to demonstrate the ETV DSP rather than verify BWMS performance; b) each TQAP covers only one TC, rather than a set of replicate TCs; c) The BWMS will not be operative during TC1 or TC4; and d) the technical report (TR) will describe ETV DSP and p3SFS implementation issues.

GSI/QAQC/SB/TQAP/4 Issue Date: November 5, 2013
Page 9 of 52 This TQAP is specific to TC42 of the GLRI Project, scheduled for early to mid November 2013. Ballast intake will take place at the Port of Ashtabula, Ohio, and ballast discharge will take place at the Port of Two Harbors, Minnesota. As for TC1, the BWMS will not be operative3. Additional crucial differences between TC4 and TCs 1 – 3, and the ETV DSP, include:
Tank-Equivalent Volumes: The ETV DSP requires that the testing organization (TO) collect and analyze ballast water intake into, and ballast water discharge from, designated experimental ballast tanks. During TCs 1 - 3, GSI identified and sampled experimental tanks on the port-side of the IH (i.e. tanks 3P, 4P, 2P, and 5P)4 consistent with requirements of the ETV DSP. However, during TC4, the IH will not ballast tank by tank. Therefore, GSI personnel will sample three “tank volume-equivalents” on intake and discharge irrespective of any association with specific ballast tanks.
P3SFS Upgrade and First Intake Sampling: During TC3, GSI personnel found operation of the p3SFS sample collection process for organisms in the largest size class (i.e., organisms ≥ 50 µm) difficult due to frequent clogging of the filter nets by detritus in the uptake. This problem occurred despite the fact that the GSI team waited for at least one tank to be ballasted prior to commencement of sampling to assure that the IH was somewhat higher in the water column than when fully loaded with cargo. Every time the nets clogged, the intake process had to stop while the nets were recommissioned creating hardship for the ship crew and GSI personnel. Prior to TC4, the NRL upgraded the p3SFS to allow sequential use of the two filter canisters to allow sample flow to be continuous under conditions of high total suspended solids (TSS). The system now samples water with canister A and B in a sequential pattern, allowing technicians to recommission individual canisters upon clogging without interrupting sample collection or ballasting processes. To challenge this new configuration, GSI will commence sampling as near to the start of the IH’s ballasting process as possible.
Truncated Sample Analysis: Because the analysis portion of the ETV DSP has not
changed over the course of TCs 1 - 3, and no BWMS will be operative in TC4, many aspects of the analysis portion of the protocol will not be part of TC4. Specifically,
1. There will be no water chemistry sample analysis on discharge 2. There will be no microbial analysis on intake or discharge 3. There will be live/dead analysis of organisms ≥ 50 µm in minimum dimension
on only part of the intake and discharge sample volumes. 4. There will be no whole effluent toxicity (WET) testing on intake or discharge
All other essential aspects of TC4 will closely resemble TCs 1 - 3. This TQAP focusses on the differences in methodology in TC4 from TCs 1 - 3. GSI will provide a draft Technical Report
2 TC1, 2 and 3 took place in July 2012, October 2012 and August 2013, respectively. 3 The BWMS was active in TC2 and TC3. 4 Tanks 3P and 4P were fitted with treatment equipment while tanks 2P and 5P served as “mock‐treatment” (i.e., untreated standing in for treated) tanks.

GSI/QAQC/SB/TQAP/4 Issue Date: November 5, 2013
Page 10 of 52 (TR) from TC4 for comment to the United States Coast Guard Research and Development Center (USCG RDC) and the United States Maritime Administration (MARAD).
2. ROLESANDRESPONSIBILITIESOFINVOLVEDORGANIZATIONS TC4 of the GLRI Project involves most of the same organizations as for TC3, however, with the exception of the BWMS developer, which will not be involved.
3. DESCRIPTIONOFTHETESTINGORGANIZATION(TO)
Please see TCs 1 – 3.
4. DESCRIPTIONOFTHETESTVESSEL
Please see TCs 1 -3.
5.TESTOBJECTIVES,EXPERIMENTALANDSAMPLINGDESIGN
5.1. TestObjectives TC4 of the GLRI Project is a demonstration of the ETV DSP in the context of a single voyage onboard the IH to generate recommendations on how to improve the execution and effectiveness of the ETV DSP, including the p3SFS sampling approach. Testing will be carried out under the constraints and modified conditions detailed in this document and under the specified challenge conditions detailed in section 6. 5.2. ExperimentalandSamplingDesign Testing will begin early to mid November, 2013, during normal IH ballasting operations at the Port of Ashtabula, Ohio, and conclude approximately three days later, following deballasting operations at the Port of Two Harbors, Minnesota. During ballast intake and discharge, GSI personnel will sample water volumes equivalent to that of three ballast tanks, a ballasting period of approximately 75 minutes. GSI personnel will collect a continuous and constant flow ballast intake and discharge sample water using the p3SFS. The team will analyze the samples for water quality, water chemistry and organisms generally ≥ 50 μm in minimum dimension, e.g., zooplankton; and those ≥ 10 μm and < 50 μm, e.g., protists. GSI will collect operational data during the course of the sampling events. On intake, GSI analysts will carry out time-sensitive sample analysis at a hotel room located 15 - 20 minutes (by car) from the berthed vessel. On discharge, GSI analysts will process samples as in past TCs (1 - 3) at the GSI Land-Based Research, Development, Testing, and Evaluation

GSI/QAQC/SB/TQAP/4 Issue Date: November 5, 2013
Page 11 of 52 (RDTE) Facility or at LSRI. Only the middle tank-equivalent volume samples of organisms ≥ 50 μm in minimum dimension will be subject to live/dead analysis. All other methods will be the same as for TCs 1-3. Table 1 summarizes the planned sequence of TC4 testing, evaluation and reporting activities.
Table 1. Planned Calendar of Test Cycle 4 Data Generation, Assessment and Reporting.
Week (Estimated Dates)
Activity Output
Up to 4 November, 2013 Test/Quality Assurance Plan (TQAP) Preparation,
Review and Finalization Finalized TQAP
1a (To Be Determined; early to mid
November, 2013)
Ballast Intake Sampling and Analysis (i.e., data generation)
Mid to late November: Challenge Conditions Assessment and
Validation Matrix
1b (To Be Determined; early to mid
November, 2013)
Ballast Discharge Sampling and Analysis (i.e., data generation)
Mid to late November: Discharge Densities of Live Organisms
2 (Mid to late November, 2013)
Data Assessment, Validation and Quality Assurance Mid to late November: Solid Data
Sets for Analysis
3‐7 (To Be Determined; based on
testing dates) Report Preparation, Refinement and Finalization
Late December: Technical Report and Recommendations
6. CHALLENGECONDITIONSTarget values for challenge water (i.e., intake) water chemistry, water quality and biological parameters are detailed in Table 2. TC4 will be considered valid if:
1. All of the intake water challenge conditions specified in Table 1 are met, 2. The verification organization (VO; i.e., USCG RDC) otherwise deems TC4 valid.
It is impossible to predict conditions in which ballast intake will occur ahead of a proposed sampling event; changes to the IH’s schedule and/or local weather conditions immediately prior to ballast intake may interfere with expected challenge water conditions. If challenge water targets are not met in TC4, GSI will report the deviation pursuant to GSI quality system requirements, and include it in the TR.

GSI/QAQC/SB/TQAP/4 Issue Date: November 5, 2013
Page 12 of 52 Table 2. Target Challenge Water Chemistry, Water Quality and Biological Characteristics Relative
to Intake Ballast Water from the Ports of Southern Lake Michigan.
Type Parameter Target Value
Water Chemistry
Total Suspended Solids (TSS) ≥ 12 mg/L
Dissolved Organic Matter (as DOC) ≥ 2 mg/L
Particulate Organic Matter (POM) ≥ 2 mg/L
Water Quality Salinity < 1 ppt
Temperature 2 – 35 °C
Biology
Organisms ≥ 50 µmin minimum dimension
≥ 1 x 10³ per m3 in “winter months” A
Organisms ≥ 10 µm and < 50 µm in minimum dimension
≥ 5 x 10² per mL**
* Here, “summer months” are May ‐ September and “winter months” are October – January. **Live analysis of protists will not be conducted on intake. Samples collected on intake will be preserved using 1% (v/v) Lugol’s solution and only those cells with intact cell contents will be counted as live at the time of sample collection.
7. SAMPLEMETHODSANDPROCEDURES 7.1. OverallSamplingDesign GSI personnel will meet the IH at the port of ballast intake and at the port of ballast discharge. In both instances two GSI team members (i.e., Mr. Tyler Schwerdt and Mr. Travis Mangan) will load supplies aboard the ship and set up for sample collection. They will also be responsible for operations and sample collection. Sample collection will continue until the equivalent of three ballast tank volumes of water have been sampled, i.e., for three (3) 75 minute periods. Samples will then be transferred to one of the GSI sampling/analytical team members for analysis at a GSI analysis facility5. All sampling will take place as described previously for TC3, except sampling will begin immediately upon intake, after the p3SFS has been flushed. At the cargo loading berth (i.e., point of ballast discharge), the equivalent of three ballast tank volumes of water tanks will be sampled, i.e. 3 x 75 minute periods. Mr. Tyler Schwerdt and Mr. Travis Mangan will remain on board after intake and discharge sampling is complete to restore the engine room to its pre-sampling condition.
5 At the port of intake, GSI analysis facilities are in a nearby hotel room. At the port of discharge, GSI analyses will take place at the GSI Land‐Based RDTE Facility or at LSRI, both in Superior, Wisconsin.

GSI/QAQC/SB/TQAP/4 Issue Date: November 5, 2013
Page 13 of 52 7.2. SampleVolumesandFlowRates Target ballast intake and discharge operational flow rates and volumes for TC4 are detailed in Table 3, as well as acceptable ranges around each target value (where applicable). Unexpected changes to the vessel’s operating conditions may result in failure to meet one or more of the targets detailed in Table 3, however, the ranges provided should account for any vessel operation changes that can be reasonably anticipated. In such instances where a target range is not met, GSI will follow GSI quality system requirements to record and report the deviation in the TR.
Table 3. Target Operational Values for Vessel Ballast Operations during Test Cycle 4 Onboard the M/V Indiana Harbor.
Operational Parameter Targets Intake Discharge
Ballast Tanks to be Sampled N/A – 3 x 75 minute periods N/A – 3 x 75 minute periods
Sampling Duration (minutes) 75 75
Ballast Flow Rate (m3/Hr)* ≥ 1700 ≥ 1700
Maximum Differential Pressure (psi) 5 5
Volume to be Sampled per Tank Equivalent (m3) 1.6 – 10.4 (Target = 5 m3) 1.6 – 10.4 (Target = 5 m3)
Sample Flow Rate per Tank Equivalent (m3/hr) 1 – 7 (Target = 4 m3/hr) 1 – 7 (Target = 4 m3/hr)
Drip Sample Volume per Tank Equivalent (L) 10 – 19 (Target = 15 L) 10 – 19 (Target = 15 L)
Drip Sample Flow Rate per Tank Equivalent (L/hr) 9 – 15 (Target = 12 L/hr) 9 – 15 (Target = 12 L/hr)
* Target based upon M/V Indiana Harbor’s routine ballasting/deballasting operations.
GSI’s target sample volume of water for the collection of organisms ≥ 50 µm is at least 5 m3 collected from each experimental ballast tank volume equivalent given a proposed concentrated sample volume of 300 mL; concentrated volume analyzed of 26.5 mL; and number of samples to be combined in a single run of three (i.e., three experimental tank volume equivalents). The calculator shown in Figure 1, taken from the USCG Shipboard Technology Evaluation Program (STEP) application6, shows GSI’s assumptions and their analytical relationship to the target sample volume. The target total sample volume from the three experimental tank volume equivalents sampled on discharge is 15.00 m3. For intake and discharge, sampling will continue until at least the required sample volume has been collected (Figure 1). If the ballasting/deballasting operation unexpectedly ceases or if a differential pressure of 5 psi is seen on the p3SFS filter bags, sampling will temporarily cease until the deballasting operation recommences and/or the filter bag is cleaned or replaced and the p3SFS reset.
6 Available at: http://www.uscg.mil/hq/cg5/cg522/cg5224/step.asp

GSI/QAQC/SB/TQAP/4 Issue Date: November 5, 2013
Page 14 of 52
A B C D E F
Target # organisms per m^3
Concentrated Volume (ml)
Volume of Concentrated
Sample Analyzed
(ml)
Number of Samples to
be Combined in a Single
Run
Required Volume of Each Sample to be Combined into a Single Run [Col. D] (m^3)
Required Total Volume Collected in a Single Run (m^3)
10 300 26.5 3 5 15.00
Figure 1. Volume Calculator (taken from USCG STEP Application) Showing GSI's Assumptions for Required Volume of Each Sample. Total volume analyzed is based on combining three samples,
collected every 75 minutes, over an approximately 6 hour deballasting period.
7.3. SamplingSystem The p3SFS sampling system is the same as in TCs1 - 3 except prior to TC4, the NRL upgraded the p3SFS to allow sequential use of the two filter canisters. The system now samples water with canister A and B in a sequential pattern, allowing technicians to recommission individual canisters upon clogging without interrupting sample collection or ballasting processes. NRL also provided GSI with a revised protocol for operating the p3SFS. See Drake et al., 2013.
7.4. IntakeSamplingandBallastRetention
Intake sampling will be performed using the p3SFS’ serial method. This allows for continuous sampling by switching back and forth between the filter canisters. During the course of the ballast operation, GSI will divide the sampling process into three equivalent tank volumes. Each tank volume will not relate to an actual ballast tank but be representative of the duration to ballast a single tank (i.e., 75 minutes). Figure 2 shows a step-by-step schedule of TC4 intake sample collection activities including estimated times for sample collection. Table 4 lists the roles and responsibilities of GSI personnel relevant to intake sampling. To summarize, two GSI team members (Mr. Tyler Schwerdt and Mr. Travis Mangan; Table 4) will board the IH once it has docked at its cargo-unloading port in Ashtabula, Ohio. The GSI team members will bring the sample collection equipment onboard and set it up in the vessel’s engine room. The GSI Engineer, Mr. Tyler Schwerdt, will also ensure that the placement of the sample lines and sample pitots are correct. Mr. Tyler Schwerdt will prepare the p3SFS, prime the sampling pump, and flush the sample lines. Flushing of the sample lines is done through the p3SFS with no filter bags installed. After flushing Mr. Schwerdt will prepare the p3SFS according to Drake et al. (2013), except that the

GSI/QAQC/SB/TQAP/4 Issue Date: November 5, 2013
Page 15 of 52 filter bags have been prepared by NRL by gluing the stitched seams and by giving each bag an identification number. Mr. Tyler Schwerdt will undertake this process as follows:
1. Follow the valve configuration described in Drake et al. (2013). 2. Record the identification number of the filter bag to be added to each filter housing (FH)
on the shipboard sample collection datasheet (Appendix 2). 3. Place each filter bag into the empty FHs, with the drain valve of the FHs closed, ensuring
that the bags extend to their full length, that there are no folds in the bags, that the plastic ring snaps into the top of the FH, and that the filter bag ring is nested in the FH.
4. Close the FH lids and seal by hand-tightening the four bolts on top of each FH. 5. Place a clean, empty carboy (19 L volume; used to collect whole water samples from the
drip sampler) on the base of the p3SFS, and direct the flexible hose leading from the drip sampler flow meter into the mouth of the carboy.
6. Cover the mouth of the carboy by stretching a piece of Parafilm™ wax over the mouth of the carboy and around the tube.
7. Initiate the p3SFS control program such that the system undergoes a routine priming procedure that checks the valve positions. If the p3SFS pump has been successfully primed, and the valve positions checked, water will begin to flow into one of the canisters of the p3SFS FHs (from the bottom) and the drip sampler.
8. Manually set the drip sampler to flow water at 12 L/hr (~ 4 US gal./hr). Note: The flow rate is established once the sampling commences by manually adjusting a dial until the ball bearing in the flow meter is at the demarcation of 4 US gal. /hr.
9. Program the sampling parameters into the human-machine interface (HMI) located on the control panel of the p3SFS. Intake sampling will be conducted with the target flow rate of 4 m3/h (17.6 US gpm) and a total sample volume of 15 m3 (3962.55 US gal.) and select operator shutdown.
10. Follow the prompts on the HMI and, when instructed, open the inlet and outlet values and close the bypass valve on the p3SFS. The system will undergo an automated check of the valve positions and commence purging the air from the FHs. This priming process typically lasts 5 – 20 minutes.
During sampling the p3SFS will be operated in serial mode. The following procedure details how GSI personnel will switch the active canister and collect the inactive canister during continuous sampling, and is taken from section 2.1.4 of Drake et al. (2013):
1. Check the non-active FH prime indicator (see Figure 24 of Drake et al., 2013) to ensure
that it is primed. If the indicator is not solid (i.e., not lit), then the FH is not ready for sampling, and the procedure for priming the FH should be followed (See “Priming procedure for the non-active filter housing”, below) prior to moving onto step 2.
2. Close the secondary priming valve (Table 3, Figure 26 of Drake et al., 2013), which is near the outlet of the non-active FH.
3. Close the manual ¼” auto-bleed isolation valve on top of the non-active FH. 4. To switch between FHs without inturrupting flow, two operators are required. Quickly
follow these steps: a. Operator 1 is located on the side of the p3SFS near the non-active FH. Operator 2
is located on the side of the p3SFS near the active FH.

GSI/QAQC/SB/TQAP/4 Issue Date: November 5, 2013
Page 16 of 52 b. Operator 1 opens the outlet valve to the non-active FH. c. Operator 1 opens the inlet valve to the non-active FH and Operator 2
simultaneously closes the inlet valve of the active FH. d. Operator 2 closes the outlet valve to the active FH.
5. Record the time of the switch from the active FH to the non-active FH. 6. Extract the filter bag for analysis, follow the procedure detailed in section 2.1.5 “SFS
System Shutdown for a single filter housing” of Drake et al., 2013. 7. Insert a new filter bag back into the FH and secure around opening by snapping the top
plastic ring of the filter bag into place in the FH (see Figure 17 of Drake et al., 2013). 8. Ensure O-rings are present and seated properly (see Figure 17 of Drake et al., 2013). 9. Close the FH lid and hand tighten the four lid clamps. 10. Follow the procedure below for priming the former active FH, which is now the non-
active housing.
The priming procedure for the non-active FH while the p3SFS is running is as follows:
1. Check to ensure that the non-active FH inlet and outlet valves are closed tightly. 2. Check to ensure that the primary priming valve near the pressure relief valve is open. The
valve should normally be open 3. Check to ensure that the ½” FH drain valve is closed. 4. Open the manual ¼” auto-bleed isolation valve for the non-active FH. 5. Gently open the secondary priming valve near the outlet of the non-active FH. 6. Once the FH has primed, close the auto-bleed isolation valve and the secondary priming
valve. Check the prime using the FH prime indicator (Figure 24 of Drake et al., 2013) or by inspecting the auto bleed valve. When the FH is primed, the ball of the auto bleed valve will seal against its O-ring.
When the active canister is switched the GSI engineer will document the volume on the filter’s flow meter totalizer. This will record the volume collected in each step of the sampling. The canisters will be alternated when the following conditions occur:
The differential pressure exceeds 5 psi There has been > 75 minutes of flow through a single filter canister If there is a prolonged ballasting pause (the p3SFS will be set to the alternate and the
existing canister will be collected.) GSI operations/sample collection team members will record the start time of the ballasting operation on the shipboard sample collection datasheet (Appendix 2). The GSI Engineer will initiate sampling using a prompt on the HMI, and monitor it throughout the sampling period. He will observe and record (every 10-15 minutes) the inlet and outlet pressures of each FH in order to determine if a spike in pressure occurs during sampling. The GSI Engineer will also monitor and adjust (if necessary) the drip sampler so that the flow rate is maintained at 12 L/hr.
Sample collection for the second and third tank volume equivalents will be identical to the first tank volume equivalent. The p3SFS filter bags will be rinsed well in between each ballast tank’s sampling period. Correspondingly, the sample data from each tank’s intake water will be

GSI/QAQC/SB/TQAP/4 Issue Date: November 5, 2013
Page 17 of 52 analyzed separately. This data separation will allow GSI to assess challenge conditions for each experimental ballast tank separately. Mr. Travis Mangan will collect the samples for analysis of organisms ≥ 50 µm (i.e., zooplankton) from the p3SFS FHs. He will then collect the samples from the 19 L carboy for analysis of organisms ≥ 10 and < 50 µm, water chemistry and water quality (Table 4). Biology, water chemistry and water quality sample collection methods, including number of samples to be collected and quality control samples, are described in detail in “Section 7.6 – Sample Collection Methods” of this TQAP. Sample handling methods are also described in “Section 7.7 – Sample Handling”. Ballast water will be retained at least two days in the experimental ballast tanks during the IH’s voyage to the Port of Two Harbors, Minnesota.

GSI/QAQC/SB/TQAP/4 Issue Date: November 5, 2013
Page 18 of 52
Figure 2. Test Cycle 4 Intake Sample Collection Activities.
ETVSHIPBOARDPROTOCOLVERIFICATION:TESTCYCLE4INTAKESAMPLECOLLECTIONACTIVITIES
Ship: M/V Indiana Harbor Intake Port: Ashtabula Date: Boarding Friday 11/8
Cells highlighed in yellow are dependent upon the tank ballasting order, which is unknown until boarding the ship.
Est. Time Personnel Est. Time Required
Pack and ship sampling supplies to Hotel near Cleveland, OH MB, TMM, TS Four days early
Fly to Cleveland, rent car, drive to Ashtabula, check into hotel 8 hours prior to ship arrival MB, TMM, TS 1 day prior to ship
16:00 Ship arrives ‐ ties up, crew heads to ship TS,TMM, 0:30
Board ship, security checks. Begin loading sampling equipment. TS,TMM, 1:00
Check in with Chief Engineer, finalize sampling plan based on ballasting schedule. TS,TMM,
Begin bringing sample collection equipment into Engine Room. TS,TMM,
Unpack and setup equipment TS,TMM,
17:30 Run water through NRL‐p3SFS to flush, commission, and prime pump (minimum of 2 minutes). TS 0:02
17:32 Begin collecting Sample 1 after NRL‐p3SFS commissioned, primed, and flushed. TS 1:30
Collect TSS grab sample at beginning
Monitor NRL‐p3SFS. TS
Communicate start time to rest of team not onboard. TMM
Collect TSS grab each time filter housing is collected (first "tank volume" only)
Record test activities, assist, monitor height of UNTREATED TANK #1. TMM
19:02 Sample #1 complete TS
Collect zooplankton samples. TMM 0:10
Collect phytoplankton sample. TMM 0:05
Collect chemistry samples. TMM 0:05
Sonde measurements. TMM 0:05
Pack and transport samples to runner or analyst. TMM 0:25
19:52 Preserve Phytoplankton, keep chemistry samples on ice MB
19:52 Begin on‐site zooplankton analysis using dead/total method. MB 1:30
21:22 Complete zooplankton analysis and preserve sample. MB
19:02 Begin collecting sample #2 after NRL‐p3SFS reset TS 1:30
Monitor NRL‐p3SFS. TS
Communicate start time to rest of team not onboard. TMM
Record test activities, assist, monitor height of UNTREATED TANK #2. TMM
20:32 Sample #2 complete TS
Collect zooplankton samples TMM 0:10
Reset NRL‐p3SFS. TS and TMM 0:15
Collect phytoplankton sample. TMM 0:05
Collect chemistry samples. TMM 0:05
Sonde measurements. TMM 0:05
Pack and transport samples to runner or analyst. TMM 0:25
21:22 Preserve Phytoplankton, keep chemistry samples on ice MB
21:22 Begin on‐site zooplankton analysis using dead/total method. MB 1:30
22:52 Complete zooplankton analysis and preserve sample. MB
20:32 Begin collecting sample #3 after NRL‐p3SFS reset (need 2 hour between sample start times for analyses) TS 1:30
Monitor NRL‐p3SFS. TS
Communicate start time to rest of team not onboard. TMM
Record test activities, assist, monitor height of UNTREATED TANK #3. TMM
22:02 Sample #3 complete. TS
Collect zooplankton samples TMM 0:10
Begin shut down of NRL‐p3SFS. TS 0:15
Collect phytoplankton sample. TMM 0:05
Collect chemistry samples. TMM 0:05
Sonde measurements. TMM 0:05
22:27 Inform Chief Engineer ship sampling complete and pack up remaining sampling equipment. TS and TMM 0:30
22:57 Depart ship and return to hotel TS and TMM 0:15
23:12 Preserve Phytoplankton, keep chemistry samples on ice MB
23:12 Begin on‐site zooplankton analysis using dead/total method. MB 1:30
0:42 Complete zooplankton analysis and preserve sample, pack zp supplies MB 1:00
1:42 ZP work complete
23:12 Pack and ship water chemistry samples
1:42 Ready to leave
Task
TS=Tyler Schwerdt; TMM=Travis Mangan; MB=Mary Balcer;

GSI/QAQC/SB/TQAP/4 Issue Date: November 5, 2013
Page 19 of 52 Table 4. Description of GSI Personnel Roles During Test Cycle 4 Intake.
Name Title Role in Intake Operation and Sampling
Ms. Allegra Cangelosi GSI Principal Investigator
Responsible for all scheduling and TQAP implementation decisions in consultation with ASC and the GSI testing team.
Mr. Tyler Schwerdt* GSI Engineer
Commissioning (NRL‐p3SFS is already installed on M/V Indiana Harbor).Ensuring sample ports are configured correctly. Operation of the NRL‐
p3SFS; Logging operational data and observations (including any unexpected issues or deviations).
Mr. Travis Mangan* GSI Test Manager Collection of zooplankton samples from NRL‐p3SFS Filter Housings A and B. Communicating with the GSI Principal Investigator. Sample
transport team and sample analysis team member.
Ms. Nicole Mays GSI Senior Quality Systems Officer
Drafting and GSI review of TQAP. Preparation of Validation Matrix.
Ms. Kelsey Prihoda GSI QA/QC Analyst
Raw data review. Summary of data quality objectives and QA/QC parameters measured.
Dr. Mary Balcer GSI Senior Zooplankton Scientist
Analysis of zooplankton intake samples. Logging of sample analysis data and observations. Reporting of live density and taxonomic diversity. Preservation of protist samples using 1% (v/v) Lugol's
solution.
Dr. Euan Reavie GSI Senior Protist
Scientist
Analysis of preserved protist intake samples. Logging of sample analysis data and observations. Reporting of live density and taxonomic
diversity.
Ms. Lisa Allinger GSI Protist Analyst
Analysis of preserved protist intake samples. Logging of sample analysis data and observations.
Ms. Meagan Aliff GSI Protist
Analyst (Backup)
Analysis of preserved protist intake samples (should Euan Reavie and Lisa Allinger be unavailable). Logging of sample analysis data and observations (should Euan Reavie and Lisa Allinger be unavailable).
Ms. Deanna Regan GSI Chemist Analysis of intake samples for water chemistry. Logging of sample
analysis data and observations.
*GSI personnel who will be onboard the M/V Indiana Harbor, working in the Engine Room.
7.5. DischargeSampling Discharge sampling will be performed using the p3SFS’ serial method but will involve pauses. The system will sample the equivalent of three ballast tank volumes of water. Discharge tank volumes will not necessarily relate to intake tank volume equivalents. Figure 3 shows a step-by-step schedule of TC4 discharge sample collection. The respective roles and responsibilities of GSI personnel involved in TC4 discharge activities are outlined in Table 5. In summary, GSI personnel (Mr. Travis Mangan and Mr. Tyler Schwerdt) will board the IH once docked at Two Harbors, Minnesota, and immediately prepare for discharge sampling (Table 5). They will consult with the vessel’s Chief Engineer to determine the tank deballasting order, and load sample collection equipment into the engine room. Mr. Tyler Schwerdt will ensure correct placement of the sample lines and sample pitots. Approximately 30 minutes prior to sampling, Mr. Tyler Schwerdt will prepare the p3SFS according to the setup procedures detailed in Drake et al. (2013), prime the sampling pump, and

GSI/QAQC/SB/TQAP/4 Issue Date: November 5, 2013
Page 20 of 52 flush the sample lines. In coordination with the IH’s crew, he will isolate the p3SFS from the vessel’s ballast system and prepare it for sampling as follows:
1. Record the identification number of the filter bag to be added to each FH on the shipboard sample collection datasheet (Appendix 2).
2. Place filter bags into the empty FHs, with the drain valve of the FHs closed, ensuring that the bags extend to their full length with no folds, are fully seated in the FH, and that the plastic ring snaps into the top of the FH.
3. Close the FH lids and seal by hand-tightening the top four bolts. 4. Place a clean, empty carboy (19 L volume; used to collect whole water samples from the
drip sampler) on the base of the p3SFS, and directing the flexible hose leading from the drip sampler flow meter into the mouth of the carboy.
5. Cover the mouth and around the tube of the carboy with Parafilm™ wax. 6. Initiate the p3SFS control program such that the system undergoes a routine check of
valve positions. If the p3SFS pump has been successfully primed, and the valve positions are correct, water will flow into the p3SFS FHs (from the bottom) and drip sampler.
7. Program the target sampling parameters into the HMI located on the control panel of the p3SFS.
8. Follow the prompts on the HMI and, when instructed, open the inlet and outlet values and close the bypass valve on the p3SFS. The system will undergo an automated check of the valve positions and commence purging the air from the FHs and priming the p3SFS (5-20 minutes long). Priming does require a pressurized ballast main.
9. Manually set the drip sampler to the target flow water and maintain it by manually adjusting a dial until the ball bearing in the flow meter is at the demarcation of 12 US gal/h as needed throughout the sampling operation.
During sampling the p3SFS will be operated in serial mode. This allows for continuous sampling by switching back and forth between the filter canisters. The following procedure will be followed to switch between the active canister and collect the inactive canister during continuous sampling, and is taken from section 2.1.4 of Drake et al. (2013):
1. Check the non-active FH prime indicator (see Figure 24 of Drake et al. 2013) to ensure
that it is primed. If the indicator is not solid (i.e., not lit), then the FH is not ready for sampling, and the procedure for priming the FH should be followed.
2. Close the secondary priming valve (Table 3, Figure 26 of Drake et al. 2013), which is near the outlet of the non-active FH.
3. Close the manual ¼” auto-bleed isolation valve on top of the non-active FH. 4. To switch between FHs without inturrupting flow, two operators are required. Quickly
follow these steps: a. Operator 1 is located on the side of the p3SFS near the non-active FH. Operator 2
is located on the side of the p3SFS near the active FH. b. Operator 1 opens the outlet valve to the non-active FH. c. Operator 1 opens the inlet valve to the non-active FH and Operator 2
simultaneously closes the inlet valve of the active FH. d. Operator 2, closes the outlet valve to the active FH.
5. Record the time of the switch from the active FH to the non-active FH.

GSI/QAQC/SB/TQAP/4 Issue Date: November 5, 2013
Page 21 of 52 6. Extract the filter bag for analysis, follow the procedure detailed Section 2.1.5, “SFS
System Shutdown for a single filter housing” of Drake et al. 2013. 7. Insert a new filter bag back into the FH and secure around opening by snapping the top
plastic ring of the filter bag into place in the FH (Figure 17 of Drake et al. 2013). 8. Ensure O-rings are present and seated properly (Figure 17 of Drake et al. 2013). 9. Close the FH lid and hand tighten the four lid clamps. 10. Follow the procedure detailed below for priming the former active FH, which is now the
non-active FH.
Priming procedure for the non-active FH while system is running:
1. Check to ensure that the non-active FH inlet and outlet valves are closed tightly. 2. Check to ensure that the primary priming valve near the pressure relief valve is open. The
valve should normally be open 3. Check to ensure that the ½” FH drain valve is closed. 4. Open the manual ¼” auto-bleed isolation valve for the non-active FH. 5. Gently open the secondary priming valve near the outlet of the non-active FH. 6. Once the FH has primed, close the auto-bleed isolation valve and the secondary priming
valve. The prime can be checked using the FH prime indicator (Figure 24 of Drake et al. 2013) or by inspecting the auto bleed valve. When the FH is primed, the ball of the auto bleed valve will seal against its O-ring.
When the active canister is switched the GSI Engineer will document the volume on the filter’s flow meter totalizer. This will record the volume collected in each step of the sampling. The canisters will be alternated when the following conditions occur:
The differential pressure exceeds 5 psi The sample duration exceeds 75 minutes.
GSI operations/sample collection team members will record the start time of the deballasting operation on the shipboard sample collection datasheet (Appendix 2). Sampling will be initiated by Mr. Tyler Schwerdt using a prompt on the HMI. He will monitor the p3SFS throughout the 75 minute sampling period for each experimental ballast tank equivalent, and record the time at which a filter canister is switched on and off for recommissioning. Mr. Tyler Schwerdt will also observe and record (every 10-15 minutes) the inlet and outlet pressures of each FH in order to determine if a spike in pressure occurs during sampling. The drip sampler will be monitored and adjusted as needed so that the flow rate is as close to 12 L/hr as possible throughout the sampling exercise. GSI will sample continuously for 75 minutes. Sampling will cease prior to the end of the 75 minute sampling period if:
o The cargo unloading or loading operation ceases (as defined above); or o 5 m3 of sample is concentrated.

GSI/QAQC/SB/TQAP/4 Issue Date: November 5, 2013
Page 22 of 52 Approximately 20 minutes prior to deballasting of the second and third experimental tank volumes (time to be determined), the GSI Engineer will prepare the p3SFS, prime the sampling pump, and begin the sampling operation following Steps 1-3 above. Clean filter bags will be installed in the p3SFS prior to collection of each experimental ballast tank’s discharge water and the sample data from each experimental tank’s discharge water will be analyzed separately. This data and equipment separation will allow GSI to assess conditions associated with each tank’s water separately. Mr. Travis Mangan will collect the samples for analysis of organisms ≥ 50 µm from the p3SFS FHs. He will then collect the samples from the 19 L carboy for analysis of organisms ≥ 10 and < 50 µm and water quality (Table 5). Sample collection, handling, and analysis are the responsibility of GSI personnel (Table 5). Biology and water quality sample collection methods, including number of samples to be collected and quality control samples, are described in detail in “Section 7.6 – Sample Collection Methods” of this TQAP. Sample handling methods are also described in “Section 7.7 – Sample Handling”.

GSI/QAQC/SB/TQAP/4 Issue Date: November 5, 2013
Page 23 of 52
Figure 3. Test Cycle 4 Discharge Sample Collection Activities.
ETVSHIPBOARDPROTOCOLVERIFICATION:TESTCYCLE4INTAKESAMPLECOLLECTIONACTIVITIES
Ship: M/V Indiana Harbor Discharge Port: TwoHarbors Date: arding Monday 11/
Cells highlighed in yellow are dependent upon the tank ballasting order, which is unknown until boarding the ship.
Est. Time Personnel Est. Time Required
23:00 Ship arrives ‐ ties up, crew heads to ship TS,TMM, 0:30
Board ship, security checks. Begin loading sampling equipment. TS,TMM, 1:00
Check in with Chief Engineer, finalize sampling plan based on ballasting schedule. TS,TMM,
Begin bringing sample collection equipment into Engine Room. TS,TMM,
Unpack and setup equipment TS,TMM,
0:30 Run water through NRL‐p3SFS to flush, commission, and prime pump (minimum of 2 minutes). TS 0:02
0:32 Begin collecting Sample 1 after NRL‐p3SFS commissioned, primed, and flushed. TS 1:30
Monitor NRL‐p3SFS. TS
Communicate start time to rest of team not onboard. TMM
Record test activities, assist, monitor height of UNTREATED TANK #1. TMM
2:02 Sample #1 complete TS
Collect zooplankton samples. TMM 0:10
Collect phytoplankton sample. TMM 0:05
Collect water quality samples. TMM 0:05
Sonde measurements. TMM 0:05
Pack and transport samples to runner or analyst. TMM 0:25
2:52 keep water quality samples on ice MB
2:52 Begin on‐site zooplankton analysis using dead/total method. MB 2:00
4:52 Complete zooplankton analysis and preserve sample. MB
2:47 Begin collecting sample #2 after NRL‐p3SFS reset TS 1:30
Monitor NRL‐p3SFS. TS
Communicate start time to rest of team not onboard. TMM
Record test activities, assist, monitor height of UNTREATED TANK #2. TMM
4:17 Sample #2 complete TS
Collect zooplankton samples TMM 0:10
Reset NRL‐p3SFS. TS and TMM 0:15
Collect phytoplankton sample. TMM 0:05
Collect water quality samples. TMM 0:05
Sonde measurements. TMM 0:05
Pack and transport samples to runner or analyst. TMM 0:25
5:07 keep water quality samples on ice MB
5:07 Begin on‐site zooplankton analysis using dead/total method. MB 2:00
7:07 Complete zooplankton analysis and preserve sample. MB
5:02 Begin collecting sample #3 after NRL‐p3SFS reset (need 2 hour between sample start times for analyses) TS 1:30
Monitor NRL‐p3SFS. TS
Communicate start time to rest of team not onboard. TMM
Record test activities, assist, monitor height of UNTREATED TANK #3. TMM
6:32 Sample #3 complete. TS
Collect zooplankton samples TMM 0:10
Begin shut down of NRL‐p3SFS. TS 0:15
Collect phytoplankton sample. TMM 0:05
Collect water quality samples. TMM 0:05
Sonde measurements. TMM 0:05
6:57 Inform Chief Engineer ship sampling complete and pack up remaining sampling equipment. TS and TMM 0:30
7:27 Depart ship and return to ballast site TS and TMM 0:15
7:42 keep water quality samples on ice MB
7:42 Begin on‐site zooplankton analysis using dead/total method. MB 1:30
9:12 Complete zooplankton analysis and preserve sample, pack zp supplies MB 1:00
10:12 ZP work complete
10:12 Ready to leave
TS=Tyler Schwerdt; TMM=Travis Mangan; MB=Mary Balcer;
Task

GSI/QAQC/SB/TQAP/4 Issue Date: November 5, 2013
Page 24 of 52 Table 5. Description of GSI Personnel Roles During Test Cycle 4 Discharge.
Name Title Role in Discharge Operation and Sampling
Ms. Allegra Cangelosi GSI Principal Investigator
Responsible for all scheduling and TQAP implementation decisions in consultation with ASC and the GSI testing team.
Mr. Tyler Schwerdt* GSI Engineer
Commissioning (NRL‐p3SFS is already installed on M/V Indiana Harbor). Ensuring sample ports are configured correctly. Operation of the NRL‐
p3SFS; Logging operational data and observations (including any unexpected issues or deviations).
Mr. Travis Mangan* GSI Test Manager Collection of zooplankton samples from NRL‐p3SFS Filter Housings (FHs) A and B. Communicating with the GSI Principal Investigator. Sample
transport team and sample analysis team member.
Ms. Nicole Mays GSI Senior Quality Systems Officer
Drafting and GSI review of TQAP. Preparation of Validation Matrix.
Ms. Kelsey Prihoda GSI QA/QC Analyst Raw data review. Summary of data quality objectives and QA/QC
parameters measured.
Dr. Mary Balcer GSI Senior Zooplankton
Scientist Analysis of zooplankton discharge samples. Logging of sample analysis
data and observations. Reporting of live density and taxonomic diversity.
Ms. Heidi Schaefer GSI Zooplankton
Analyst Analysis of zooplankton discharge samples. Logging of sample analysis
data and observations.
Dr. Euan Reavie GSI Senior Protist
Scientist Analysis of preserved protist intake samples. Logging of sample analysis data and observations. Reporting of live density and taxonomic diversity.
Ms. Lisa Allinger GSI Protist Analyst Analysis of protist discharge samples. Logging of sample analysis data
and observations.
Ms. Meagan Aliff GSI Protist Analyst
(Backup)
Analysis of protist discharge samples (should Euan Reavie and Lisa Allinger be unavailable). Logging of sample analysis data and
observations (should Euan Reavie and Lisa Allinger be unavailable).
*GSI personnel who will be onboard the M/V Indiana Harbor, working in the Engine Room.
7.6. SampleCollectionMethods Tables 6 and 7 summarize the operational data and water quality, water chemistry and biological samples to be collected during each sampling event relative to TC4 ballast intake and discharge operations. A sampling event is defined as a sample collection process associated with ship intake or discharge. Each sampling event comprises sampling at least three tank volume equivalents, and includes collection of data describing physical/chemical conditions of the water, the quality and quantity of entrained biota, and operational parameters.
7.6.1. CollectionofSamplesfromthep3SFSFilterBags Mr. Travis Mangan will collect samples for analysis of zooplankton (i.e., organisms ≥ 50 µm) immediately after the completion of each sampling event (Tables 6 and 7). Sample collection will be conducted by first isolating the FHs through closing the inlet and outlet valves, and draining the filtrate water from the bottom valve in each FH prior to unsealing the FH lid and collecting the filter bags. Mr. Travis Mangan will collect the filter bags from FH A and B separately. Detailed steps of the sample collection procedure are based on “Section 2.4 – Collection and Processing of p3SFS Samples” of Drake et al. (2013) and include the following:

GSI/QAQC/SB/TQAP/4 Issue Date: November 5, 2013
Page 25 of 52 1. Ensure that the canisters inlet and outlet valves are closed 2. Slowly open the bottom (drain) valve of FH A, allowing approximately 4 L filtrate water
to drain into a pump sprayer, 1 L of filtrate water to drain into a 1 L plastic wash bottle, and collecting 2 L of filtrate in 1 L HDPE sample bottles for processing. Close the drain valve once approximately 6 L has been collected.
3. Open the top (air bleed) valve on one of the FHs. 4. Uncap the FH lid of FH A by loosening the four bolts. Note: The filter bag will be mostly
submerged in water; the top 10 – 15 cm of the bag should be exposed. 5. Slowly open the bottom (drain) valve of FH A, allowing the remainder of the water to
drain from the FH. Spray the filter bag from top to bottom to rinse the mesh using the 4 L pressurized spray canister filled with previously-collected filter water while the water is being drained.
6. Once the majority (~ 80 %) of the filter bag has been rinsed, remove the bag from the FH and invert it over a 3 L pourable plastic collection beaker to collect the concentrate.
7. Carefully spray the filter bag to remove all particulates and deposit rinse water in the collection beaker. Visually examine the rinsed filter bag to verify all debris has been rinsed.
8. Concentrate the contents of the collection beaker, containing between 1 L and 3 L of concentrated sample, to less than 1 L in order to fit it into the 1 L HDPE sample collection bottle.
9. Slowly pour the contents of the collection beaker into a 35 µm mesh filter until the entire volume has been filtered. Note: the collection beaker must be thoroughly rinsed with the filtrate water in 1 L wash bottle.
10. Thoroughly rinse the concentrate on the 35 µm mesh filter into the 1 L HDPE sample collection bottle using the filtrate in the 1 L wash bottle.
11. Record the time of sample collection on the shipboard sample collection datasheet (Appendix 2).
12. Repeating Steps 1-10 for the second FH (i.e., FH B) using a separate, clean 3 L pourable plastic collection beaker. 7.6.2. CollectionofBiologicalSamplesfromthep3SFSDripSampler
Mr. Travis Mangan will collect samples for analysis of protists (i.e., organisms ≥ 10 µm and < 50 µm) immediately after the completion of each sampling event (Tables 6 and 7). This procedure will take place after the drip sampler valve has been closed immediately after completion of the sample collection event. The sample collection procedure is based on “Section 2.5 – Collecting Samples from the Drip Sampler (DS)” of Drake et al. (2013) and includes the following steps:
1. Allow any water remaining in the tube to empty into the carboy, remove the tube from the carboy, discard the Parafilm™ wax covering the lid, and seal the carboy with the screw-on cap.
2. Measure the volume of water collected in the carboy using the 1 L calibrated graduations, and record this number (to the nearest 0.5 L) on the shipboard sample collection datasheet (Appendix 2).
3. Mix the contents of the carboy by inverting it six times.

GSI/QAQC/SB/TQAP/4 Issue Date: November 5, 2013
Page 26 of 52 4. Pour a small amount (~ 250 mL) of sample water into a 1 L HDPE sample collection
bottle (labeled for protist sample collection), cap the bottle, shake to rinse, and pour out rinse water.
5. Pour sample water into the sample collection bottle, leaving approximately 1-2 cm of headspace.
6. Record the time of protist sample collection on the shipboard sample collection datasheet (Appendix 2).
7.6.3. CollectionofWaterQualityandWaterChemistrySamplesfromthep3SFSDrip
Sampler Following the collection of the biological samples, Mr. Mangan will collect the water chemistry (intake only) and water quality (intake and discharge) samples as detailed in Tables 6 and 7. The sample collection procedure is based on “Section 2.6 – Water Quality Sampling” of Drake et al. (2013) and includes the following steps:
1. Mix the contents of the carboy by inverting it six times. 2. Collect triplicate 1 L whole water samples (for analysis of TSS; percent transmittance,
%T; and particulate organic matter, POM), leaving 1-2 cm headspace (intake only). 3. Record the time of whole water sample collection on the shipboard sample collection
datasheet (Appendix 2). 4. On intake, collect triplicate samples for analysis of non-purgeable organic carbon
(NPOC) and dissolved organic carbon (DOC) immediately after TSS/%T/POM sample collection, by conducting the following steps:
a. Mix the contents of the carboy by inverting it six times. b. Pour a small amount (~ 100 mL) of sample water into three, 125 mL prepared
glass sample collection bottles, cap the bottles, shake to rinse, and pour out rinse water.
c. Pour sample water into each of three sample collection bottles, leaving approximately 0.5 cm of headspace.
d. Record the time of NPOC/DOC sample collection on the shipboard sample collection datasheet (Appendix 2).
5. On intake and discharge, measure water quality of the drip sampler sample water using the following steps:
a. Pour approximately 200 mL of sample water into the calibration cup of a YSI Multiparameter Water Quality Sonde (YSI 6600 V2-4 Multiparameter Sondes; YSI Incorporated; Yellow Springs, Ohio).
b. Rinse the cup and discard the rinse water. c. Pour approximately 600 mL – 750 mL of sample water from the drip sampler
carboy into the calibration cup. d. Screw the calibration cup onto the Sonde, and measure water quality parameters:
temperature, dissolved oxygen, pH, turbidity, salinity, specific conductivity, and total chlorophyll.
e. Record measurements on a pre-printed shipboard water quality measurement datasheet (Appendix 2).
f. Discard the remaining water in the drip sampler carboy.

GSI/QAQC/SB/TQAP/4 Issue Date: November 5, 2013
Page 27 of 52 Table 6. Class, Type and Number of Samples To Be Collected During Test Cycle 4 Ballast Intake.
Parameter Category
Parameter Measurement
Class Sample Type
Number of Replicate Samples to be
Collected per Tank
Sample Volume per Replicate
Operational
p3SFS Volume Sampled Core In situ,
continuous N/A ‐ Measurement
N/A ‐Measurement
Ballast System Flow Rate Core Discrete (Tank
Height Recorded)
Tank height recorded < every 10 minutes (i.e., ≥ 5 readings)
N/A ‐ Measurement
p3SFS Flow Rate Core In situ,
Continuous N/A ‐ Measurement
N/A ‐Measurement
Differential Pressure Core In situ,
continuous N/A ‐ Measurement
N/A ‐ Measurement
Water Quality
Temperature Core In situ,
continuous N/A ‐ Measurement N/A
Turbidity Auxiliary In situ,
continuous N/A ‐ Measurement N/A
Temperature, dissolved oxygen/percent saturation, pH,
turbidity, salinity, specific conductivity, and total
chlorophyll
Core Time Integrated from 19 L Carboy
1 600 to 1000 mL
Water Chemistry
Total Suspended Solids (TSS), Particulate Organic Matter
(POM) and Percent Transmittance (%T)
Core Time Integrated from 19 L Carboy
3 900 to 1000 mL
Total Organic Carbon (as Non‐Purgeable Organic Carbon, NPOC) and Dissolved Organic Matter (as Dissolved Organic
Carbon, DOC)
Core Time Integrated from 19 L Carboy
3 100 to 125 mL
Biology Organisms ≥ 50 µm Core
Time integrated from p3SFS
1 ~5 m3 ± 10 %
Organisms ≥ 10 and < 50 µm Core Time Integrated from 19 L Carboy
1 900 to 1000 mL

GSI/QAQC/SB/TQAP/4 Issue Date: November 5, 2013
Page 28 of 52 Table 7. Class, Type and Number of Samples To Be Collected During Test Cycle 4 Ballast
Discharge.
Parameter Category
Parameter Measurement
Class Sample Type
Number of Replicate Samples Collected per
Tank
Sample Volume per Replicate
Operational
p3SFS Volume Sampled Core In situ, continuous N/A ‐ Measurement N/A ‐
Measurement
Ballast System Flow Rate Core Discrete (Tank
Height Recorded)
Tank height recorded at least every 10 minutes (i.e., ≥ 9 readings)
N/A ‐ Measurement
p3SFS Flow Rate Core In situ,
Continuous N/A ‐ Measurement
N/A ‐Measurement
Differential Pressure Core In situ, continuous N/A ‐ Measurement N/A ‐
Measurement
Water Quality
Temperature Core In situ, continuous N/A ‐ Measurement N/A ‐
Measurement
Turbidity Auxiliary In situ, continuous N/A ‐Measurement N/A
Temperature, dissolved oxygen/percent
saturation, pH, turbidity, salinity, specific
conductivity, and total chlorophyll
Core Time Integrated from 19 L Carboy
1 900 to 1000 mL
Biology Organisms ≥ 50 µm Core
Time integrated from p3SFS
1 ~5 m3 ± 10 %
Organisms ≥ 10 and < 50 µm
Core Time Integrated from 19 L Carboy
1 900 to 1000 mL
7.7. SampleHandling
Sample handling and storage requirements, including holding conditions and specific preservatives, for samples collected during TC4 are detailed in Table 8. GSI assigns a unique sample code to each type of sample as follows:
Test ID Code: Year‐BWMS/Project‐Test Cycle (e.g., 13‐ETV‐4)
Intake or Discharge: e.g., Fill (F) or Drain (D)
Tank Volume: e.g., 1, 2 or 3
Pre‐Treatment (PT) or Treatment (T)
Sample Type: e.g., Water Quality (WQ)
Replicate Number: e.g., 1, 2 or 3
Analysis Type: e.g., Total Suspended Solids (TSS) GSI personnel will record sample codes on the sample container labels (see Figure 4 for example intake and discharge labels), field and laboratory datasheets and log books, and corresponding database entries. Sample labels will be prepared and placed onto the sample collection containers

GSI/QAQC/SB/TQAP/4 Issue Date: November 5, 2013
Page 29 of 52 prior to sample collection. All samples will be labeled in a clear and precise manner to ensure proper identification in the field and also tracking in the laboratory.
Water Quality (WQ): TSS Date: _______________ Time:
_______________
13 ETV 4 F2 P PT WQ 3_TSS Tank Volume 2 Pre‐Treatment Fill,
Rep. 3 (End)
Figure 4. Example Sample Bottle Label for Test Cycle 4 (Test ID: 13-ETV-4).
GSI personnel will record sample collection times on pre-printed datasheets (see Appendix 2 for example shipboard sample collection datasheets) using indelible ink. GSI personnel onboard the IH will transfer samples to individuals responsible for sample transport. GSI sample transport personnel are responsible for bringing samples to the analysts. For intake samples, GSI sample transporters will transport zooplankton samples, filtrate water, and protist samples to the GSI zooplankton sample analyst after sampling of each tank concludes. The GSI zooplankton analyst will analyze the zooplankton samples onsite in a nearby hotel room, and is also responsible for preservation of the protist sample by adding 10 mL Lugol’s solution to the 1 L samples, and inverting the sample several times to mix thoroughly. The samples will then be stored for subsequent transport to Superior, Wisconsin, whereby they were relinquished to a GSI Protist Analyst. The water chemistry samples will be shipped overnight via FedEx to LSRI for subsequent analysis. Mr. Travis Mangan is responsible for packing a cooler with ice to house the samples during transport as soon as possible following the completion of the intake sampling event. The samples must be transported to the nearest FedEx pick-up location, no later than 7:00 pm local time Monday to Friday or 9:30 am local time on Saturday (there is no Express Dropoff on Sunday). The samples will be shipped via FedEx Priority Overnight Shipping. If the samples cannot be transported to the shipping location by 7:00 pm local time, then the samples will be transported to the above location at 9:00 am local time and shipped to LSRI via FedEx Same Day Delivery to ensure that the samples arrive at LSRI within the required 24 hour holding time. A MadgeTech HiTemp 102 Data Logger (MadgeTech, Inc.; Warner, New Hampshire) will be placed inside the shipment cooler and will automatically measure and record the temperature in the cooler every 15 minutes during shipment time to ensure that the samples were maintained at ≤ 6 °C. For discharge sample analysis, GSI personnel will transport samples to LSRI in coolers with ice packs after sampling of each individual ballast tank concludes. Each individual responsible for sample collection, transport, handling, and analysis is responsible for completing GSI/FORM/QAQC/3 – GSI Chain of Custody (COC) Form (Appendix 3) each time custody of a specific sample is relinquished. GSI personnel strictly follow COC procedures

GSI/QAQC/SB/TQAP/4 Issue Date: November 5, 2013
Page 30 of 52 for all samples so that the possession of a sample from the time of its collection until the time of its analysis is documented and traceable. GSI personnel also complete GSI/FORM/QAQC/3 – GSI Chain of Custody (COC) Form for each experimental tank’s intake and discharge operation (Appendix 3). The individual responsible for sample collection completes Section 1 and 2 of the COC Form. The sample collector/transporter and the sample analyst relinquish sample custody to the analyst, once they sign and date Section 3 of the COC Form. All relevant GSI senior personnel are responsible for ensuring that the COC forms are correctly filled out at the time of changes to sample custody. They are also responsible for maintaining the forms on file, creating electronic copies, and posting to the GSI SharePoint website (greatshipsinitiative.net) for storage. The GSI Senior QAQC Officer is responsible for determining whether proper custody procedures were followed during the testing and also for determining if additional samples are required due to improper sample handling.
Table 8. Test Cycle 4 Sample Handling and Storage Requirements.
Parameter Container Sample Volume
Processing/Preservation Maximum Holding Time
Electronic Continuous, In‐Line Operational Data
(Volume, Ballast System and p3SFS Flow Rate, Differential
Pressure)
N/A ‐ Measurement
N/A ‐ Measurement
Maintain digital archive. N/A ‐ Measurement
Electronic Continuous, In‐Line Data (Temperature and Turbidity)
N/A ‐ Measurement
N/A ‐Measurement
Maintain digital archive. N/A ‐ Measurement
Total Suspended Solids (TSS), Particulate Organic Matter (POM) and Percent Transmittance (%T)
1 L HDPE 900 to 1000 mL Analyze immediately; or
refrigerate. 7 days (TSS/POM); 24 hours (%T)
Total Organic Carbon (as Non‐Purgeable Organic Carbon, NPOC)
125 mL Borosilicate
Glass 100 to 125 mL
Add HCl to pH < 2 and analyze immediately or refrigerate until
analysis. 28 days
Dissolved Organic Matter (as Dissolved Organic Carbon, DOC)
125 mL Borosilicate
Glass 100 to 125 mL
Filter, add HCl to pH < 2 and analyze immediately or refrigerate until analysis.
28 days
Organisms ≥ 50 µm 1 L Cod End ~ 5.0 m3 to 1 L
Observe with compound and dissecting microscope and probe
organisms to determine live/dead status.
Process and analyze immediately.
Preserve unanalyzed sample using Lugol’s solution.
Maximum hold time of 6 hours from collection.
Samples that are preserved in lieu of
live/dead analysis must be preserved immediately.
Organisms ≥ 10 and < 50 µm 1 L HDPE 900 to 1000 mL Preserve with 10 mL of Lugol’s
solution. N/A – Preserved sample.

GSI/QAQC/SB/TQAP/4 Issue Date: November 5, 2013
Page 31 of 52
8. SAMPLEANALYSISMETHODS Sample analysis locations will be climate-controlled with enough desk and counter space to allow for simultaneous microscopic and analytical analysis of samples. Laboratory space will also have a cooler, power and water source, and sufficient light. Locations will also have fully isolated spaces for analysis of organisms ≥ 10 µm and < 50 µm (which requires a darkened room) and other analyses (which require light).
8.1. WaterChemistry Analysis of TSS will be conducted according to GSI/SOP/BS/RA/C/8 – Procedure for Analyzing Total Suspended Solids (TSS). In this procedure, accurately measured sample volumes (± 1 %) will be vacuum filtered through pre-washed, dried and pre-weighed glass fiber filters (i.e. Whatman 934-AH). After each sample is filtered it will be dried in an oven and brought to constant weight. Concentrations of TSS will be determined based on the weight of particulates collected on the filter and the volume of water filtered. The POM concentration will be determined following Standard Method 2540 E (American Public Health Association, 2012). The residue from the TSS analysis will be ignited to a constant weight at 550 °C in a muffle furnace. The concentration of POM will be determined by the difference of the dry weight of the particulates on the filter before and after ignition (the mass lost to combustion). In these tests, NPOC will be used as an alternative to total organic carbon (TOC), though it may be a slight underestimate of TOC. The analytical instrument used to measure NPOC purges the sample with air to remove inorganic carbon before measuring organic carbon levels in the sample. Thus, the NPOC analysis may not incorporate volatile organic carbon which may be present in the sample. Similarly, DOC will be used as a surrogate measure for DOM. Sample analysis will be conducted according to GSI/SOP/BS/RA/C/3– Procedures for Measuring Organic Carbon in Aqueous Samples. Upon arrival at LSRI, an aliquot of each sample will be filtered through a Whatman GF/F filter and acidified with hydrochloric acid (HCl) for analysis of DOC. The remaining portion of the sample will be acidified with HCl and analyzed for NPOC. A Shimadzu Total Organic Carbon Analyzer (Model TOC-L) will be used for analysis of both NPOC and DOC. Concentrations of NPOC and DOC will be determined based on a calibration curve developed on the analyzer using organic carbon standards prepared from potassium hydrogen phthalate. For the purposes of testing described herein, Mineral Matter (MM) will be defined as the difference between TSS and POM. Therefore, MM concentrations will be calculated following analysis of TSS and the determination of POM. Filtered and unfiltered %T sample analyses will be conducted according to GSI/SOP/BS/RA/C/4 – Procedure for Determining Percent Transmittance (%T) of Light in Water at 254 nm. For analysis of the filtered aliquot, an appropriate volume of sample will be filtered through a glass fiber filter (i.e., Whatman 934-AH). A PerkinElmer Lambda 35 UV-Vis Spectrophotometer will be used to measure %T of the unfiltered and filtered sample aliquots. Deionized water will be used as a reference to adjust the spectrophotometer to 100 %T, and then each unfiltered and filtered sample aliquot will be analyzed in a pre-rinsed sample cuvette with a 1 cm path length.

GSI/QAQC/SB/TQAP/4 Issue Date: November 5, 2013
Page 32 of 52 8.2. Biology
8.2.1. Organisms≥50µm
Live/dead analysis of organisms ≥ 50 µm will be conducted according to GSI/SOP/MS/RA/SA/2 - Procedure for Zooplankton Sample Analysis with the modifications noted below and will take place within two hours of collecting and concentrating the individual samples. Microzooplankton (e.g., rotifers, copepod nauplii, and dreissenid veligers) and macrozooplankton (e.g., copepods, cladocerans, and other macroinvertebrates), all generally greater than 50 µm in minimum dimension, will be analyzed simultaneously. On intake, the first and third samples will be preserved for latter analysis. The second (i.e., middle sample) will be transported to a GSI zooplankton analyst located in a hotel nearby for live/dead analysis. On discharge, all three samples will be analyzed for live/dead. Specifically, a minimum of two aliquots from each sample will be examined in a Sedgwick Rafter counting chamber utilizing a compound microscope at a magnification of 40X to 100X. Macro- and microzooplankton will be enumerated at the same time in the counting chamber rather than using a separate chamber for the macrozooplankton as described in the GSI SOP. Quantification of this size class of organisms in the samples may require analysis of multiple subsamples and extrapolation to the entire sample volume due to high organism density. In this situation, a subsample of the volume-adjusted concentrates from the 5 m3 samples will be removed for analysis using a Henson-Stempel pipette. A minimum of two subsamples will be analyzed for the combined microzooplankton and macrozooplankton analysis. The subsample volumes will be adjusted to provide between 100 and 150 total organisms per counting chamber (i.e., a minimum of 300 total zooplankton will be examined). The dead organisms (i.e., those organisms that do not move or respond to stimuli) will be enumerated, then 50 % (v/v) acetic acid solution will be added to the counting chamber and the total number of organisms enumerated. The number of live organisms will be calculated by subtracting the number of dead organisms in the counting chamber from the total number of organisms. Three to five dominant live taxa will be identified and reported. Organisms will be identified to species when possible, but genus, order, suborder, or class is also acceptable.
8.2.2. Organisms≥10µmto<50µm Preserved intake samples will be analyzed by Dr. Euan Reavie, Ms. Lisa Allinger, and/or Ms. Meagan Aliff as soon as possible following receipt of the samples in Superior, Wisconsin. Only those cells with intact cellular contents will be counted and presumed to have been alive at the time of sample collection. For example, empty diatom frustules will not be counted. Therefore, the total density counted will be reported as the live density on intake. Discharge sample analysis for live organisms ≥ 10 µm to < 50 µm in minimum dimension will occur within 1.5 hours of sample collection, with samples stored in coolers during the interim. Prior to analysis, samples will be concentrated through a 7 µm mesh plankton sieve and stored in a 25 mL sample container. Sample analysis will be conducted according to GSI/SOP/MS/RA/SA/1 - Procedure for Protist Sample Analysis. Briefly, a 2 mL subsample of the concentrated sample will be transferred to a 5 mL sample container, with 5 µL of fluorescein

GSI/QAQC/SB/TQAP/4 Issue Date: November 5, 2013
Page 33 of 52 diacetate (FDA) viability stain stock solution added. The subsample will then be allowed to incubate in the dark for 5 minutes. Then the 2 mL incubated sample will be mixed and 1.1 mL immediately transferred to a Sedgwick-Rafter cell using an adjustable-volume pipette, covered and placed on the stage of a compound microscope that is set for simultaneous observation using brightfield and epifluorescence. At least two horizontal transects will be analyzed (an area known to represent greater than 1.5 mL of original sample water), aiming for at least 100 live entities (i.e., unicellular organism, colony, or filament) counted. If time permits, additional transects will be counted to increase statistical power. Single cell entities and cells comprising colonial and filamentous entities will be characterized as follows: alive = cells showing obvious green fluorescence from cell contents; dead = cells showing no or very little evidence of green fluorescence from cell contents (not counted); and ambiguous = cells or entities that cannot be clearly identified as alive or dead (should be uncommon). Records will be kept of transect lengths and widths so that the total counted area and volume analyzed can be calculated. Counting and measurement of all other entities will follow standard procedures for individuals (length and width), colonies (e.g., number of cells, cell length and width) and filaments (e.g., number of cells, cell length and width or total filament length if cells cannot be discerned). The remaining concentrated sample in the 25 mL bottle will be archived for long-term storage using Lugol’s preservative. Heat-killing assessments will be performed on discharge samples containing a significant number of live protists in order to quantify false positives (i.e., cells that may be falsely identified as alive due to erroneous fluorescein activity). The following additions will be made to GSI/SOP/MS/RA/SA/1 - Procedure for Protist Sample Analysis for the heat-killed assessment.
Following concentration and backwashing of the protist sample into the 25 mL bottle, two 2 mL samples will be taken from the concentrate and added to respective 5 mL sample bottles. One of those bottles (i.e., the primary sample) will be immediately stained with FDA and analyzed as usual.
On completion of the primary sample analysis, the second 2 mL sample in the sealed 5 mL bottle will be placed in a beaker of just-boiled tap water for five minutes. Then, the bottle will be removed and placed in a beaker of cold tap water for five minutes. After cooling the heat-killed sample will be stained with FDA and assessed for live organisms as for the primary sample. If there are no live cells (as anticipated), any observations will be recorded in the bench notebook. If apparent “live” signatures are recognized in the heat-killed sample, quantitative counts and taxonomic identifications will be recorded in the notebook.
If the analysis method shows a low number of false positives in the heat-killed control that slightly elevates the organism number above the developed-designated performance level (i.e., 10 live organisms per mL), then GSI will present the numbers and indicate this occurrence in the TR, but can still score the test as meeting the predetermined target.
If the false positives are several-fold higher than the pre-determined target (i.e., 10 live organisms per mL), this will be reported, but the test will be deemed inconclusive and must be repeated.
Please note that the use of FDA as the primary stain for GSI analyses of the ≥ 10 and < 50 µm size class of organisms varies from the ETV DSP v.5.2 in that 5-chloromethylfluorescein

GSI/QAQC/SB/TQAP/4 Issue Date: November 5, 2013
Page 34 of 52 diacetate (CMFDA) will not simultaneously be used as a vital stain. However, this alternative approach is based on a thorough investigation of several methods (see Reavie et al. 2010), and yields the closest estimate for purposes of the Great Lakes assemblages analyzed. Also, GSI analyses allow for up to 60 minutes for live sample assessment, unlike the ETV DSP which specifies no more than 20 minutes.
9. DATAMANAGEMENT,ANALYSISANDREPORTING 9.1. DataProcessingandStorage
GSI will record sample collection data (e.g., date, time, and location of collected samples), water quality and chemistry analysis data, and biological analysis data by hand (using indelible ink) on pre-printed data collection forms and/or in bound laboratory notebooks that are uniquely-identified and are specific to the test cycle being tested. All documentation will be required to be truthful, accurate, legible, permanent, clear and complete. Documentation will also to be made promptly at the time of the observation and be recorded directly onto the data collection form or laboratory notebook. All complete documentation will include the date, the initials of all personnel directly responsible for the data, and any information needed for reconstruction of the procedure. Any changes made to original data entries will not obscure the entry, and also must be initialed and dated by the analyst. Completed data collection forms will be secured in uniquely-identified three ring binders, specific to the type of data and to TC4. Biological and chemical data that are recorded by hand will be manually entered into either a Microsoft Access Database that was designed, developed, and is maintained by the GSI Database Manager, Mr. Steve Hagedorn, or the data will be entered into a Microsoft Excel Spreadsheet. The electronic data files will be stored on the LSRI’s secured Local Area Network (LAN) which can be accessed only by relevant GSI personnel. The GSI Database Manager is the single point of control for access to the LSRI LAN. The LSRI LAN is automatically backed up every 24 hours. The electronic data files will also be stored on the GSI’s internal SharePoint website (greatshipsinitiative.net), which acts as a secondary data backup/storage mechanism. The GSI Engineer (Mr. Tyler Schwerdt) will record relevant operational/engineering-related information in a bound laboratory notebook that is uniquely-identified (i.e., coded) and specific to TC4. Records will include date and time of observation, and any other information deemed worthy of recording. The GSI Senior QAQC Officer (Ms. Kelsey Prihoda) is responsible for archiving and storing all original raw data relative to TC4 in a climate-controlled, secure archive room at the LSRI for a period seven years following finalization of the TR. 9.2. DataVerificationandValidation A percentage of data that is recorded by hand and entered into Microsoft Access or Excel will be verified against the original raw data by the GSI Senior QAQC Officer (Ms. Kelsey Prihoda).

GSI/QAQC/SB/TQAP/4 Issue Date: November 5, 2013
Page 35 of 52 This procedure will also include verification of the accuracy of computer-generated data through hand-calculation. The percentage of verified raw data will depend on the amount of raw data that is generated, and range from 10 to 100 % of the original raw data. All raw data will also be thoroughly reviewed by the GSI Senior QAQC Officer to verify compliance with this TQAP, as well as the relevant GSI Quality Assurance Project Plan (QAPP; Appendix 1) and SOPs. 9.3. DataAnalysis The statistical method used to analyze data will be dependent on the type of data (i.e., organisms ≥ 50 µm, organisms ≥ 10 and < 50 µm, etc.), and the relationships being analyzed. In all cases appropriate and widely-used statistical software packages will be used to generate and report mean values (± standard deviation or standard error) across groups. In addition, Analysis of Variance (ANOVA) may be used to compare means across groups. A difference between means/groups is significant at p < 0.05.
9.4. DataReporting Following completion of TC4 activities detailed herein, GSI will draft a TR. The TR will generally contain the following information (according to Deliverable 5 of the USCG RDC Scope of Work): conditions of the test; test results; completion of the ETV DSP (and items not completed); GSI’s assessment of the success of the ETV DSP execution; and recommendations to the schedule, ETV DSP, or other variables. The TR will include the following sections:
Executive Summary (describing the experiment, the intake and discharge quality, and conclusions, 2 pages).
Introduction and Background Experimental Design Challenge Conditions Methods and Procedures (summarized only) Results and Discussion (including an assessment of the success of the ETV DSP; GSI
deviations and rationales; and recommendations for changes to GSI procedures, or the ETV DSP).
Verification Testing Operation and Monitoring QA/QC Appendices, including:
o TQAP
10. QualityControlRequirements Table 9 summarizes GSI’s QC requirements relative to the TC4. GSI QC requirements and associated acceptance criteria and corrective actions ensure that data generated is acceptable and credible.

GSI/QAQC/SB/TQAP/4 Issue Date: November 5, 2013
Page 36 of 52 QA activities relative to water chemistry samples will involve analysis of two TSS blanks and two DOC blanks on each analysis date and a TSS reference standard on at least two of the sample analysis dates. The analyses will be performed by GSI Chemist, Ms. Deanna Regan, who will also analyze a TOC reference standard concurrently with samples from each sample collection date to confirm the accuracy of the data being generated. In addition, water chemistry QC measures will involve the collection of a minimum of 10 % of the total number of samples collected for TSS/%T and NPOC/DOC analyses in duplicate. For analysis of NPOC/DOC, Ms. Deanna Regan will spike a minimum of 10 % of the total number of samples collected for determination of spike-recovery. Discharge QC activities for analyses of organisms ≥ 50 μm will include duplicate analysis of a minimum of 10 % of samples collected (note that since only one analyst is present on intake no QC activities can be conducted). In addition, one out of every ten slides analyzed by the primary taxonomist will also be analyzed by a second, suitably-qualified zooplankton taxonomist. The duplicate analysis will be conducted such that the second operator does not know the results of the first operator’s analysis. Discharge QC activities for analyses of organisms ≥ 10 μm and < 50 μm will include duplicate analysis of a minimum of 10 % of samples collected (note that since there are no analysts present on intake no QC activities can be conducted for live organism analysis but QC of preserved samples may be possible). In this situation, for every sample analyzed by the primary taxonomist (Dr. Euan Reavie or Ms. Lisa Allinger) that requires evaluation, a second, suitably qualified taxonomist (Ms. Lisa Allinger or Ms. Meagan Aliff) will simultaneously analyze the same sample using a dual-headed compound microscope. The analysis will be conducted such that the second operator does not know the results of the primary operator’s analysis, and vice versa. In addition, GSI protist analysis will select at least one discharge sample for evaluation of within-sample precision. Precision will be measured by the analysis of at least two subsamples by the same taxonomist.

GSI/QAQC/SB/TQAP/4 Issue Date: November 5, 2013
Page 37 of 52 Table 9. Quality Control Requirements for Test Cycle 4.
Applicability Quality Control Requirement Frequency Acceptance Criteria Corrective Action
Health and Safety
Adequately trained personnel. As required. Qualitative spot‐checks of
documents and data
storage/archiving procedures at
least once per test cycle.
Problems identified by spot‐checks will be documented and included in a corrective action report. Follow‐up communication with
responsible staff to address the problems will be conducted as soon as
possible. Retraining of the responsible staff will be conducted if needed.
Compliance with all relevant ship and facility procedures.
Daily
Sample Collection Ensure correct implementation of SOPs. Periodically N/A ‐ qualitative
Sample Analysis Ensure correct implementation of SOPs. Periodically N/A ‐ qualitative
Documents and Records Proper recording, storage and archiving
of all documents and records. Regularly (i.e., monthly).
Qualitative spot‐checks of documents and records recording, storage and archiving procedures
at least once per test cycle.
Sample Labeling, Handling and Custody
Checking of sample labels by a second individual to ensure that the same
codes are not used for more than one individual sample.
At the time of sample labeling.
Qualitative spot‐checks of sample labeling, handling and custody procedures before the start of
every sampling event.
Completion of Chain‐of‐Custody forms during sample collection, transport, and receipt to provide documentation as to
whether proper sample handling procedures were followed during the
field work.
During each sampling event and upon delivery and receipt of samples.
Examination of Chain‐of‐Custody forms following every sampling
event.
Proper recording, storage and archiving of all Chain‐of‐Custody forms.
Regularly (i.e., monthly).
Qualitative spot‐checks of Chain‐of‐Custody form recording,
storage and archiving procedures at least once per test cycle.
Equipment and Instruments
Calibration or verification of analytical equipment/instrumentation.
Maintenance checks of equipment, and proper documentation and archiving of
maintenance data.
Dependent on the type of equipment; in some cases,
daily.
Qualitative spot‐checks of documents and data
storage/archiving procedures at least once per test cycle.

GSI/QAQC/SB/TQAP/4 Issue Date: November 5, 2013
Page 38 of 52
11. INSTRUMENT/EQUIPMENTTESTING,INSPECTION,CALIBRATIONANDMAINTENANCE
The GSI Senior QAQC Officer (Ms. Kelsey Prihoda) and/or Ms. Christine Polkinghorne (GSI WET Test Analyst) will be responsible for ensuring that all instruments used during TC4 are inspected, calibrated and maintained according to the manufacturer’s manual and/or relevant GSI SOP. She is also responsible for ensuring that all personnel undertaking inspection, calibration and maintenance of specific instruments, as detailed in Table 10, are suitably qualified and that they have read and understood the manual and/or GSI SOP (as applicable) for each device prior to undertaking any inspection and/or maintenance procedures. In addition, Ms. Prihoda and/or Ms. Christine Polkinghorne is responsible for ensuring that all activities related to inspection, calibration and maintenance of instruments to be used in TC4 are correctly documented. They are additionally responsible for maintaining the documents on file, creating electronic copies, and posting copies to the GSI SharePoint website for storage. The GSI Test Manager (Mr. Travis Mangan) will be responsible for ensuring that all equipment used during TC4 are inspected, calibrated and maintained according to the manufacturer’s manual and/or relevant GSI SOP. He is also responsible for ensuring that all personnel undertaking inspection, calibration and maintenance of specific pieces of equipment, as detailed in Table 12, are suitably qualified and that they have read and understood the manual for each device prior to undertaking any inspection and/or maintenance procedures. In addition, Mr. Mangan is responsible for ensuring that all activities related to inspection, calibration and maintenance of equipment to be used in TC4 tests are correctly documented. He is also responsible for maintaining the documents on file, creating electronic copies, and posting copies to the GSI SharePoint website for storage.

GSI/QAQC/SB/TQAP/4 Issue Date: November 5, 2013
Page 39 of 52 Table 10. Inspection, Calibration and Maintenance of GSI Instruments and Equipment Relevant to Test Cycle 4. Asterisk (*) Denotes Instruments.
Instrument Type Manufacturer Description Inspection, Calibration, and Maintenance Schedule
Technician
Balance* Mettler Toledo Analytical Balances (including models AG245,
PB303, XS105DU, and MS303S) Annually; Daily verification of
accuracy
NBS Balances (annually); Technician (Annually; Heidi Saillard, Deanna Regan, Matt
TenEyck, and Christine Polkinghorne on a daily) basis
Data logger* MadgeTech MadgeTech HiTemp102 Data Logger for
checking autoclave performance Annually MadgeTech
Hood‐Biohazard/Chemical
Nuaire Chemical Exhaust Hood Annually Carol Lindberg
Microscopes*
Olympus Equipped with 40X objective lens,
epifluorescence, able to excite samples at 450‐490 nm
Following every assembly and otherwise when needed
Christine Polkinghorne
Olympus Upright microscope with fluorescence for
200X and 400X observation of protist samples Following every assembly and
otherwise when needed Euan Reavie,Lisa Allinger
Nikon Upright dissecting and compound microscope
for analysis of zooplankton samples Following every assembly and
when needed Mary Balcer
Oven VWR Symphony Convection Oven Monthly Deanna Regan
Pipettes*
Multiple including Eppendorf, FinnPipette, and
Fisher Adjustable Volume Pipettes, various volumes Every 3 months
Deanna Regan, Mary Balcer, Euan Reavie
Henson‐Stempel 1, 5, and 10 mL Henson‐Stempel Every 3 months Lana Fanberg, Heidi Schaefer
Reagent Water Milli‐Q Several DI water systems in LSRI laboratories Annually Deanna Regan
Sensor‐multi parameter*
YSI Sonde that measures dissolved oxygen, specific conductivity, temperature, pH,
turbidity and total chlorophyll Prior to each trial/test cycle
Matt TenEyck, Christine Polkinghorne, Deanna Regan,
Kelsey Prihoda
Spectrophotometer Perkin Elmer Lambda 25 UV/Vis Daily Deanna Regan
TOC Analyzer* Shimadzu Total Organic Carbon Analyzer model TOC‐L Prior to each test Deanna Regan
Vacuum pump Gast GAST vacuum pump, 0‐760mmHg Range TBD Euan Reavie

GSI/QAQC/SB/TQAP/4 Issue Date: November 5, 2013
Page 40 of 52
12. QUALITYMANAGEMENT
12.1. GSIQualityManagementSystem GSI has a well-established and effective quality management system. A wide variety of quality management tools and resources are used to implement the system. These include quality system documentation (i.e., the GSI QMP; GSI 2013), project-specific documentation (i.e., QAPPs), and routine procedures documentation (i.e., SOPs), as well as project-specific audits and assessments.
12.2. TestQualityAssurance/QualityControl
12.2.1. ValidityCriteria At the conclusion of TC4, the GSI Senior Quality Systems Officer (Ms. Nicole Mays) will verify that all criteria necessary for the TC to be valid were met. Except for deviations noted in the TR and inconsequential to the measured values related to threshold intake and discharge conditions, the test validity criteria will include confirmation that:
Target values for challenge water quality/chemistry and biological parameters were established and maintained;
Target ranges for p3SFS operational parameters were established and maintained; and Biological sample volumes were met.
Ms. Nicole Mays will complete a test validation matrix summarizing valid ranges and corresponding mean measured values obtained during TC4. Any significant deviations from the mean will be noted and discussed in the TR, with the recommended course of action determined by the GSI PI.
12.2.2. DataQualityIndicators
GSI uses six of the USEPA’s data quality indicators to determine data quality: representativeness, accuracy, precision, bias, comparability and completeness. Data quality objectives and acceptance criteria for each of these indicators varies by analysis type and are described in GSI’s Shipboard QAPP (Appendix 1). In general, only data that meet or exceed these criteria are deemed valid, thereby ensuring that all data generated is of the highest quality.

GSI/QAQC/SB/TQAP/4 Issue Date: November 5, 2013
Page 41 of 52
13. ENVIRONMENTAL,HEALTHANDSAFETY Environmental, Health and Safety (EHS) is an issue that GSI takes extremely seriously. Because testing will take place onboard an operating commercial vessel, GSI personnel will strictly adhere to the EHS plans and policies of the vessel operator, ASC, as well as relevant state and federal regulations, i.e., those of the Occupational Safety and Health Administration. Furthermore, the GSI QMP (GSI, 2013) assures that GSI personnel have the necessary education, qualifications, and experience needed to effectively carry out their specific roles and responsibilities. Specific to this project, only suitably qualified members of GSI personnel will be responsible operating the p3SFS system, i.e., those members of personnel who are well versed in the installation, commissioning, and operation of the p3SFS, and have training and qualifications in the operation and maintenance of electric equipment and systems, electrical circuits and equipment, the proper use and care of personal protective equipment (PPE), and first aid. The GSI personnel involved with the shipboard sampling and operation of the equipment will be required to carry their TWICTM identification with them at all times. All GSI personnel boarding the ship will wear appropriate work clothing, which will cover arms and legs and fit in a manner as to not create a safety hazard. Jewelry (including rings) will not be allowed. The personal protective equipment (PPE) listed below are required for GSI personnel involved with the shipboard ballast sampling and operation of the equipment:
Hardhat; Steel toe boots; Safety glasses; and Hearing protection (ear plugs or muffs, or in some cases both may be advisable).
Where analysis of samples takes place at the GSI Land-Based RDTE Facility located in Superior, Wisconsin, personnel will comply with GSI’s EHS Plan (GSI, 2011). This document describes EHS procedures, activities, environmental concerns and potential hazards associated with the facility (GSI, 2011).

GSI/QAQC/SB/TQAP/4 Issue Date: November 5, 2013
Page 42 of 52
14. REFERENCESANDRELATEDDOCUMENTS American Public Health Association (2012). Standard Method 2540 E. Fixed and Volatile Solids Ignited at 550°C in Standard Methods for the Examination of Water and Wastewater, 22nd Edition, pp. 2-67 to 2-68. Cangelosi A, Schwerdt T, Mangan T, Mays N & Prihoda K, (2011). A Ballast Discharge Monitoring System for Great Lakes Relevant Ships: A Guidebook for Researchers, Ship Owners, and Agency Officials. Great Ships Initiative, Northeast-Midwest Institute, Washington, D.C., USA. http://www.nemw.org/GSI/BallastDischargeMonitoringGuidebook.pdf Drake L, Moser C, Wier T & Grant J (2013). Ship-Specific Protocol for the Use of a Filtration Skid (p3SFS) During Shipboard Approval Tests of Ballast Water Management Systems, Rev. 14. Chemistry Division, Naval Research Laboratory, Washington, D.C., USA. First MR, Moser CS, Wier TP, Grant JF, Robbins-Wamsley SH, Riley SC & Drake LA (2012). Test Plan for the Shipboard Validation of the Shipboard Filter Skid (Third Prototype, p3SFS) for In-Line Sampling of Aquatic Organisms ≥ 50 μm. Naval Research Laboratory, Chemistry Division, Washington, D.C., USA. 32 pp. Great Ships Initiative (2011). GSI/LB/QAQC/EHSP/1 – Great Ships Initiative (GSI) Environmental, Health and Safety (EHS). Northeast-Midwest Institute, Washington, D.C., USA. Great Ships Initiative (2013). Great Ships Initiative (GSI) Quality Management Plan, Revision 2. Northeast-Midwest Institute, Washington, D.C., USA. International Maritime Organization (2004). International Convention for the Control and Management of Ships Ballast Water and Sediments. As adopted by consensus at a Diplomatic Conference at IMO, London, England, February 13 2004. Reavie ED, Cangelosi AA & Allinger LE (2010). Assessing Ballast Water Treatments: Evaluation of Viability Methods for Ambient Microplankton Assemblages. Journal of Great Lakes Research; 36: 540-547. Richard RV, Grant JF &. Lemieux EJ (2008). Analysis of Ballast Water Sampling Port Designs Using Computational Fluid Dynamics. Report No. CG-D-01-08. US Coast Guard Research and Development Center, Groton, Connecticut, USA. United States Environmental Protection Agency (2002). Short-term Methods for Estimating the Chronic Toxicity of Effluents and Receiving Waters to Freshwater Organisms. United States Environmental Protection Agency, Washington, D.C., USA. http://water.epa.gov/scitech/methods/cwa/wet/disk3_index.cfm United States Environmental Protection Agency (2012). Environmental Technology Verification Program (ETV) Draft Generic Protocol for the Verification of Ballast Water Treatment Technology in Shipboard Installations, Version 5.2. U.S. EPA ETV in cooperation with the U.S.

GSI/QAQC/SB/TQAP/4 Issue Date: November 5, 2013
Page 43 of 52 Coast Guard Environmental Standards Division (CG-5224) and the U.S. Naval Research Laboratory. National Sanitation Foundation International, Ann Arbor, Michigan, 80 pp. + appendices.

GSI/QAQC/SB/TQAP/4 Issue Date: November 5, 2013
Page 44 of 52
APPENDICES1. GSI Shipboard QAPP
2. GSI Shipboard Example Datasheets 3. GSI/FORM/QAQC/3 - GSI Chain of Custody (COC) Form

GSI/QAQC/SB/TQAP/4 Issue Date: November 5, 2013
Page 45 of 52
APPENDIX1:GSISHIPBOARDQUALITYASSURANCEPROJECTPLAN(QAPP)
Note: Appendix 1 will be provided to USGC RDC reviewers and all other readers of this TQAP
as a separate (.pdf) file.

GSI/QAQC/SB/TQAP/4 Issue Date: November 5, 2013
Page 46 of 52
APPENDIX2:GSISHIPBOARDEXAMPLEDATASHEETS

GSI/QAQC/SB/TQAP/4 Issue Date: November 5, 2013
Page 47 of 52

GSI/QAQC/SB/TQAP/4 Issue Date: November 5, 2013
Page 48 of 52
ETVShipboard ProtocolTest:12‐ETV‐3
BallastWaterManagementSystemNeutralizationVerification
Ship: M/V Indiana Harbor
Ballast Water Management System (BWMS): 30% (w/v) Sodium Hydroxide Solution
Neutralizing Agent: Carbon Dioxide Gas
Date of Neutralization
Elapsed Time Since Intake:
GSI Representative: BWMS Developer Representative:
Briefly describe the ballast water management system neutralization process:
Was neutralization consistent with the procedures outlined in the TQAP? YES NO If no, are deviations from the TQAP documented and attached? YES NO
Was neutralization successful (i.e., pH of 6.0 to 8.8) YES NO
By signing below the BWMS Developer agrees that: (1) The treated ballast water has been successfully neutralized in accordance with the Test/Quality Assurance Plan (TQAP). (2) The neutralized ballast water is safe for GSI staff to conduct sample collection on discharge.
Developer Representative: X Date:
Full Name (printed):
Title:
By signing below the Great Ships Initiative agrees that: (1) The treated ballast water has been successfully neutralized in accordance with the Test/Quality Assurance Plan (TQAP). (2) The neutralized ballast water is safe for GSI staff to conduct sample collection on discharge.
GSI Representative: X Date:
Full Name (printed):
Title:

GSI/QAQC/SB/TQAP/4 Issue Date: November 5, 2013
Page 49 of 52

GSI/QAQC/SB/TQAP/4 Issue Date: November 5, 2013
Page 50 of 52

GSI/QAQC/SB/TQAP/4 Issue Date: November 5, 2013
Page 51 of 52

GSI/QAQC/SB/TQAP/3 Revision No. 2: August 02, 2013
Page 52 of 52
APPENDIX3:GSICHAINOFCUSTODY(COC)FORM(GSI/FORM/QAQC/3)
Related Documents