Results of Nutrient Tracking & Biological Modeling Using the Regional Ocean Modeling System (ROMS) for Upper Narragansett Bay Our lab has long history of ROMS developments & applications Constantly making improvements: General: ROMS is a community code (organic) Specific to Narragansett Bay: Data & Lab models for comparisons Multiple applications Why improvements necessary? All numerical models give approximate solutions…. Models have shelf life (2004 ROMS not publishable today..)

Welcome message from author
This document is posted to help you gain knowledge. Please leave a comment to let me know what you think about it! Share it to your friends and learn new things together.
Transcript
Results of Nutrient Tracking & Biological Modeling Using the Regional Ocean Modeling
System (ROMS) for Upper Narragansett Bay Our lab has long history of ROMS developments & applications Constantly making improvements: General: ROMS is a community code (organic) Specific to Narragansett Bay: Data & Lab models for comparisons Multiple applications Why improvements necessary? All numerical models give approximate solutions…. Models have shelf life (2004 ROMS not publishable today..)
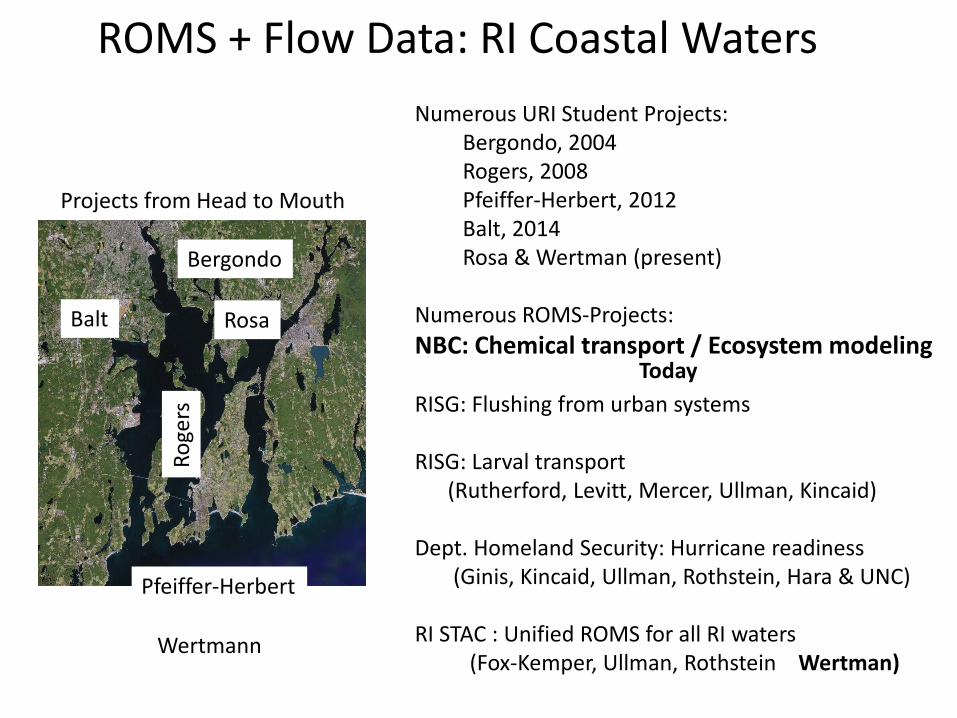
ROMS + Flow Data: RI Coastal Waters Numerous URI Student Projects: Bergondo, 2004 Rogers, 2008 Pfeiffer-Herbert, 2012 Balt, 2014 Rosa & Wertman (present) Numerous ROMS-Projects: NBC: Chemical transport / Ecosystem modeling RISG: Flushing from urban systems RISG: Larval transport (Rutherford, Levitt, Mercer, Ullman, Kincaid) Dept. Homeland Security: Hurricane readiness (Ginis, Kincaid, Ullman, Rothstein, Hara & UNC) RI STAC : Unified ROMS for all RI waters (Fox-Kemper, Ullman, Rothstein Wertman)
Balt
Bergondo
Pfeiffer-Herbert
Roge
rs
Rosa
Wertmann
Today
Projects from Head to Mouth
DHS S&T Coastal Resilience Center of Excellence Work Plan D l W k h
July 28-29, 2015
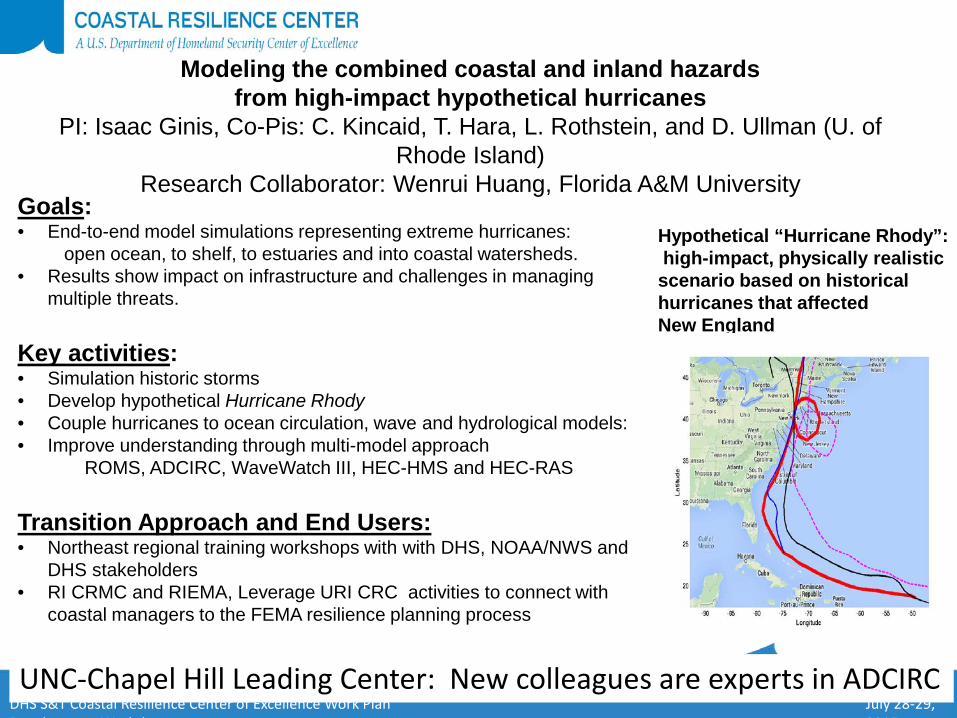
Modeling the combined coastal and inland hazards from high-impact hypothetical hurricanes
PI: Isaac Ginis, Co-Pis: C. Kincaid, T. Hara, L. Rothstein, and D. Ullman (U. of Rhode Island)
Research Collaborator: Wenrui Huang, Florida A&M University
Goals: • End-to-end model simulations representing extreme hurricanes: open ocean, to shelf, to estuaries and into coastal watersheds. • Results show impact on infrastructure and challenges in managing
multiple threats. Key activities: • Simulation historic storms • Develop hypothetical Hurricane Rhody • Couple hurricanes to ocean circulation, wave and hydrological models: • Improve understanding through multi-model approach ROMS, ADCIRC, WaveWatch III, HEC-HMS and HEC-RAS Transition Approach and End Users: • Northeast regional training workshops with with DHS, NOAA/NWS and
DHS stakeholders • RI CRMC and RIEMA, Leverage URI CRC activities to connect with
coastal managers to the FEMA resilience planning process
Hypothetical “Hurricane Rhody”: high-impact, physically realistic scenario based on historical hurricanes that affected New England
UNC-Chapel Hill Leading Center: New colleagues are experts in ADCIRC
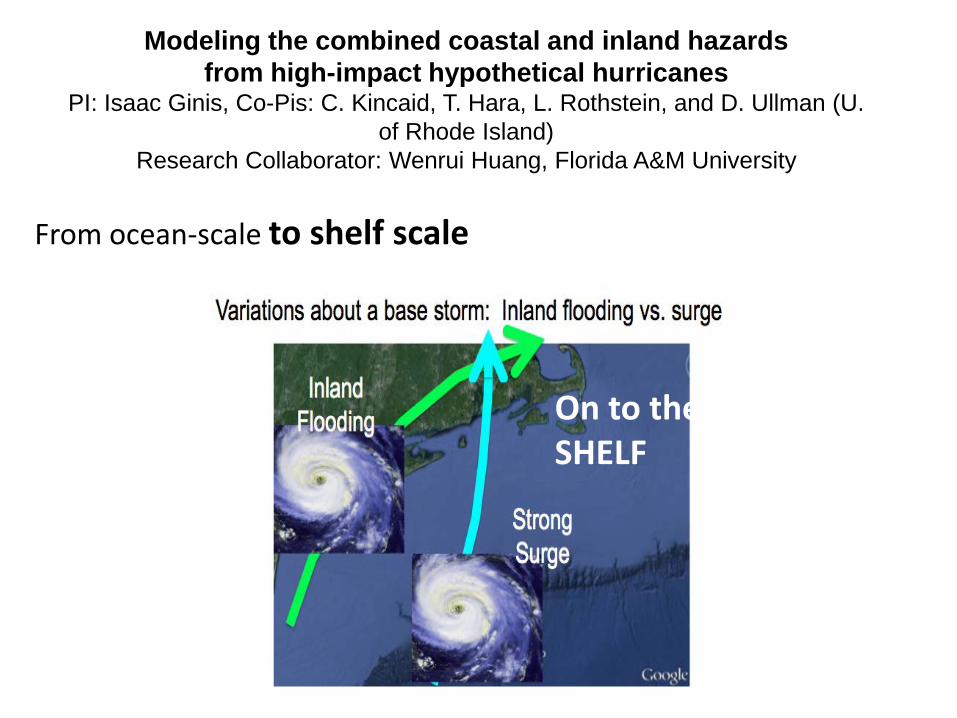
On to the SHELF
Modeling the combined coastal and inland hazards from high-impact hypothetical hurricanes
PI: Isaac Ginis, Co-Pis: C. Kincaid, T. Hara, L. Rothstein, and D. Ullman (U. of Rhode Island)
Research Collaborator: Wenrui Huang, Florida A&M University
From ocean-scale to shelf scale

Modeling the combined coastal and inland hazards from high-impact hypothetical hurricanes
PI: Isaac Ginis, Co-Pis: C. Kincaid, T. Hara, L. Rothstein, and D. Ullman (U. of Rhode Island)
Research Collaborator: Wenrui Huang, Florida A&M University
From ocean-scale to shelf scale to estuarine scale
City/Port of Providence
Narragansett Bay Estuary
Modeling Coastal Ocean Surge

Modeling the combined coastal and inland hazards from high-impact hypothetical hurricanes
PI: Isaac Ginis, Co-Pis: C. Kincaid, T. Hara, L. Rothstein, and D. Ullman (U. of Rhode Island)
Research Collaborator: Wenrui Huang, Florida A&M University
From ocean-scale to shelf scale to estuarine scale to watershed scales
Modeling Watershed Flooding: Narragansett Bay
City/Port of Providence
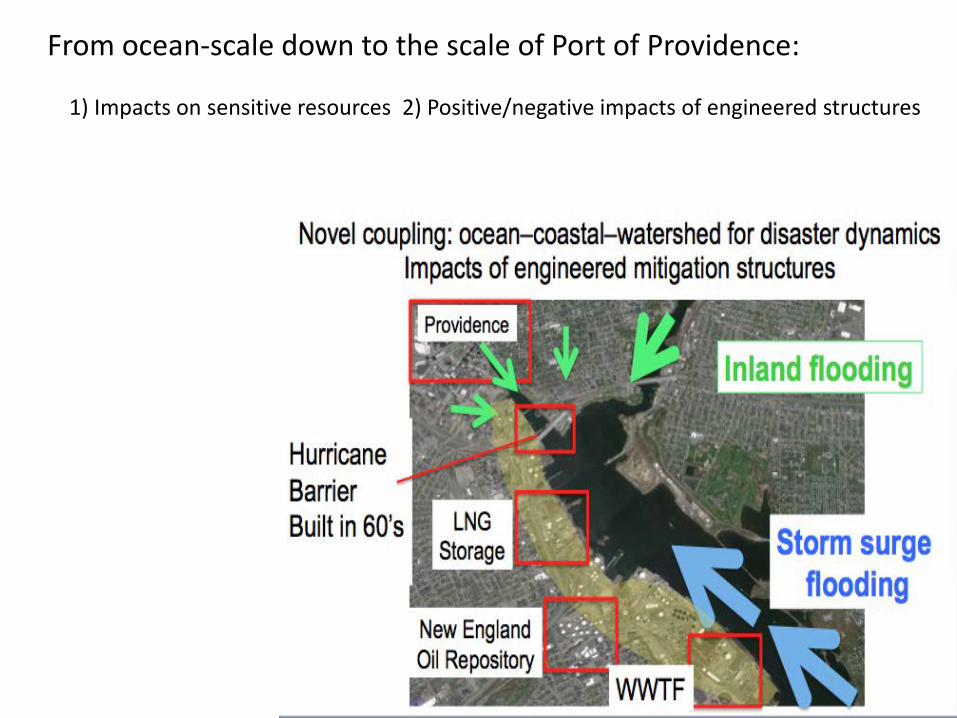
From ocean-scale down to the scale of Port of Providence: 1) Impacts on sensitive resources 2) Positive/negative impacts of engineered structures
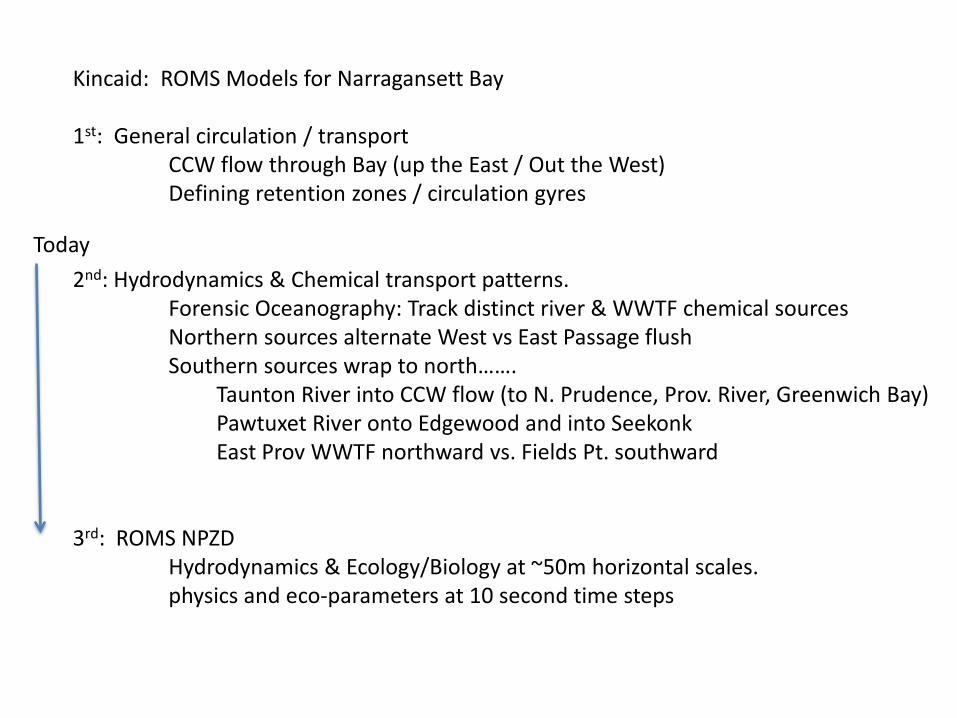
Kincaid: ROMS Models for Narragansett Bay 1st: General circulation / transport CCW flow through Bay (up the East / Out the West) Defining retention zones / circulation gyres 2nd: Hydrodynamics & Chemical transport patterns. Forensic Oceanography: Track distinct river & WWTF chemical sources Northern sources alternate West vs East Passage flush Southern sources wrap to north……. Taunton River into CCW flow (to N. Prudence, Prov. River, Greenwich Bay) Pawtuxet River onto Edgewood and into Seekonk East Prov WWTF northward vs. Fields Pt. southward 3rd: ROMS NPZD Hydrodynamics & Ecology/Biology at ~50m horizontal scales. physics and eco-parameters at 10 second time steps
Today

Quick word about….Why model improvements necessary? All numerical models give approximate solutions…. Best hydrodynamic foundation not just numerical….DATA….
Lab Models
Numerical Models
Circulation Data
The 3 Legged Stool
Ecosystem Models
Narragansett Bay Hydrodynamics

Tide stations
ADCP data
ADCP data
Tide station
a)
b)
Narragansett Bay
20 years of hydrodynamic data RI Coastal Waters:
Red circles: Moored ADCP (3-12 mo) Orange circles: Moored ADCP Red dash line: ADCP underway transects Shaded: Spatial-temporal TCM (2-3 mo). Magenta Triangles: Tide gauge exp. Orange diamonds: Fixed buoy network
TCM data
Southern NE Shelf
ADCP data
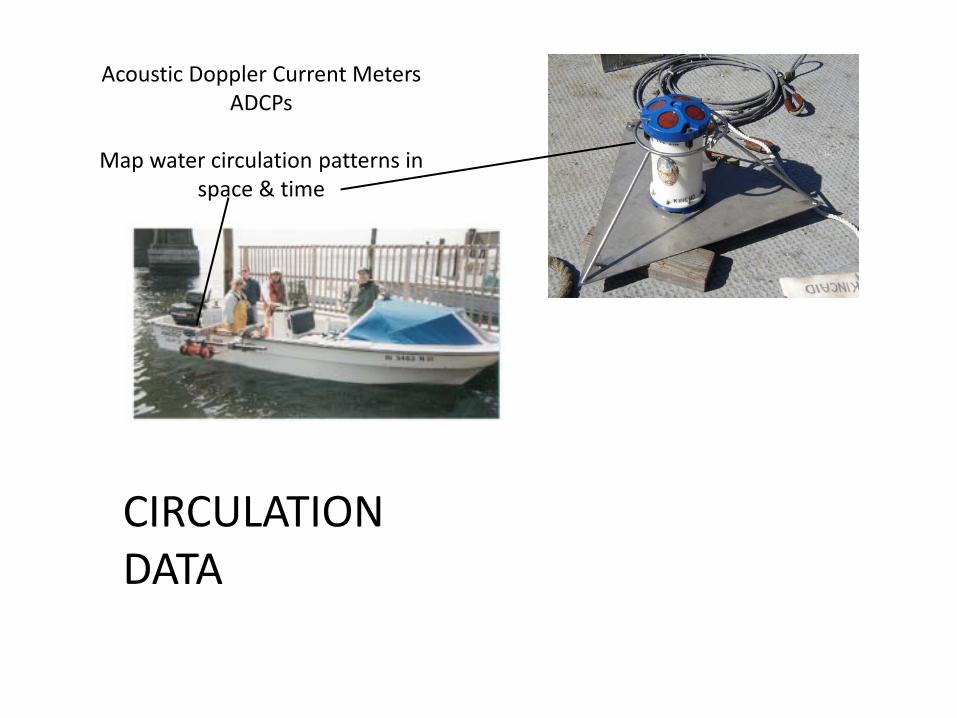
Acoustic Doppler Current Meters ADCPs
Map water circulation patterns in
space & time
CIRCULATION DATA
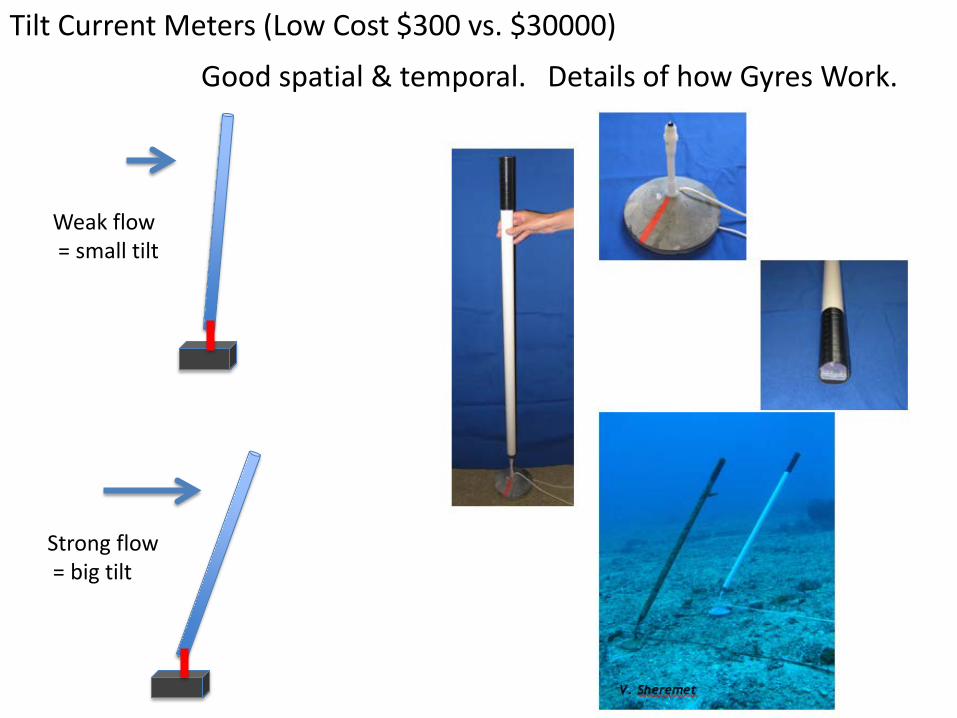
Tilt Current Meters (Low Cost $300 vs. $30000)
Good spatial & temporal. Details of how Gyres Work.
Weak flow = small tilt
Strong flow = big tilt
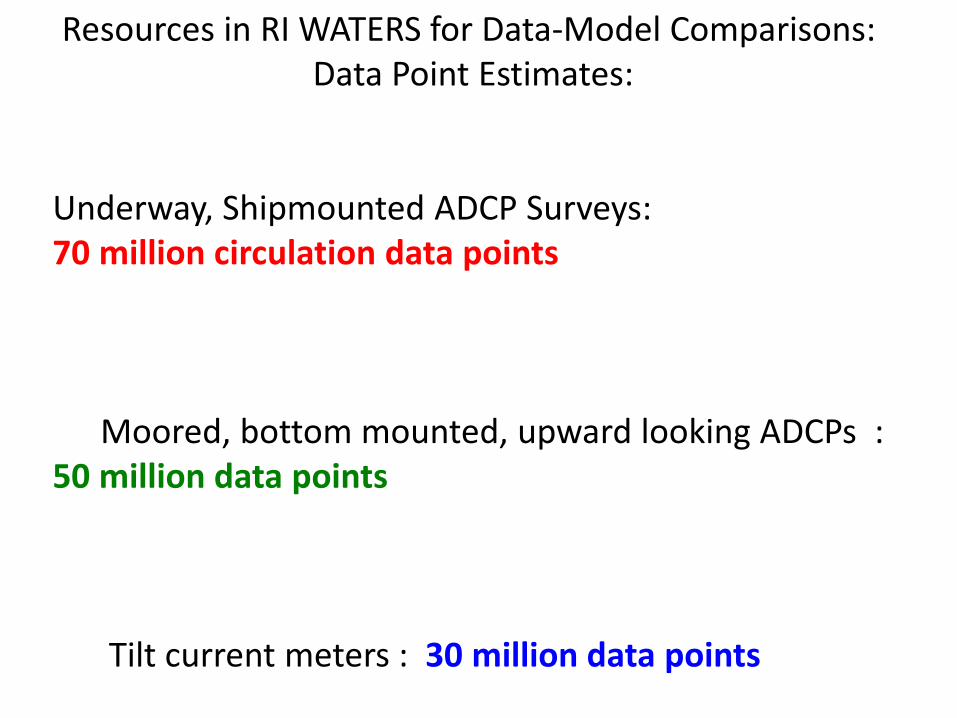
Resources in RI WATERS for Data-Model Comparisons: Data Point Estimates:
Underway, Shipmounted ADCP Surveys: 70 million circulation data points Moored, bottom mounted, upward looking ADCPs : 50 million data points Tilt current meters : 30 million data points
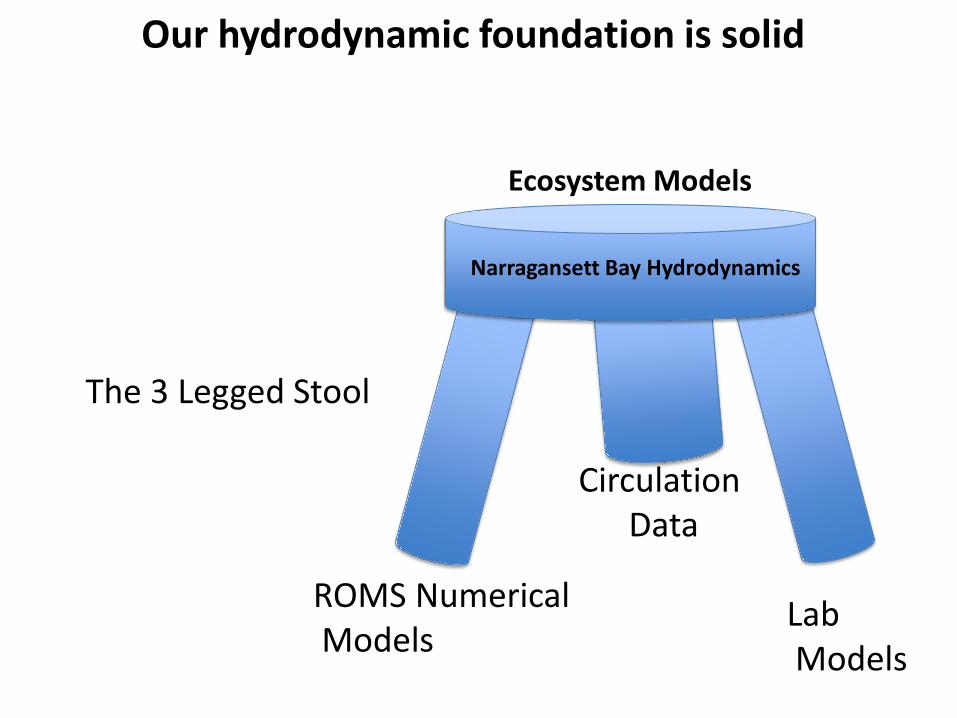
Our hydrodynamic foundation is solid
Lab Models
ROMS Numerical Models
Circulation Data
The 3 Legged Stool
Ecosystem Models
Narragansett Bay Hydrodynamics

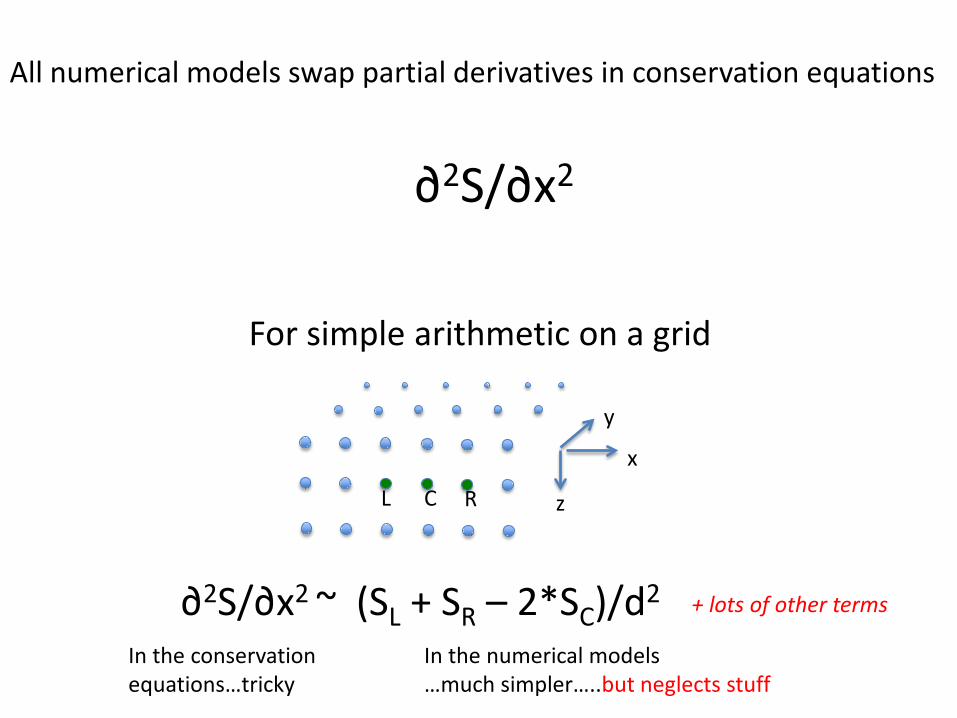
All numerical models swap partial derivatives in conservation equations
∂2S/∂x2
For simple arithmetic on a grid
z
x
y
C R L
∂2S/∂x2 ~ (SL + SR – 2*SC)/d2
Salinity at node L plus salinity at node R minus ………
d
All numerical models swap partial derivatives in conservation equations
∂2S/∂x2
For simple arithmetic on a grid
z
x
y
C R L
∂2S/∂x2 ~ (SL + SR – 2*SC)/d2
In the conservation equations…tricky
In the numerical models …much simpler…..but neglects stuff
+ lots of other terms
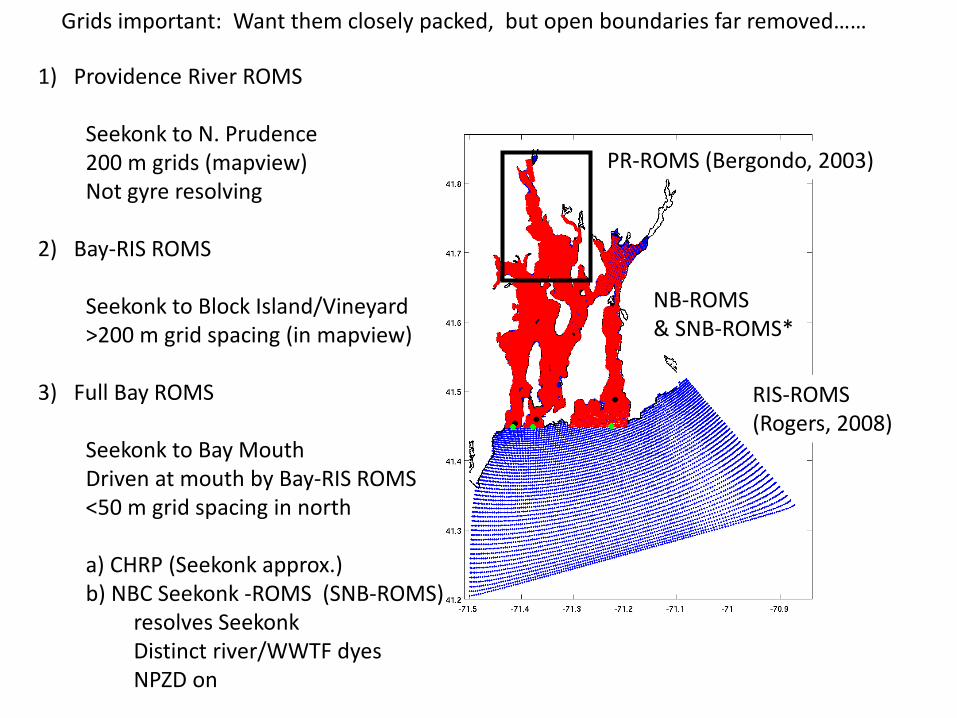
RIS-ROMS (Rogers, 2008)
PR-ROMS (Bergondo, 2003)
NB-ROMS & SNB-ROMS*
1) Providence River ROMS
Seekonk to N. Prudence 200 m grids (mapview) Not gyre resolving 2) Bay-RIS ROMS
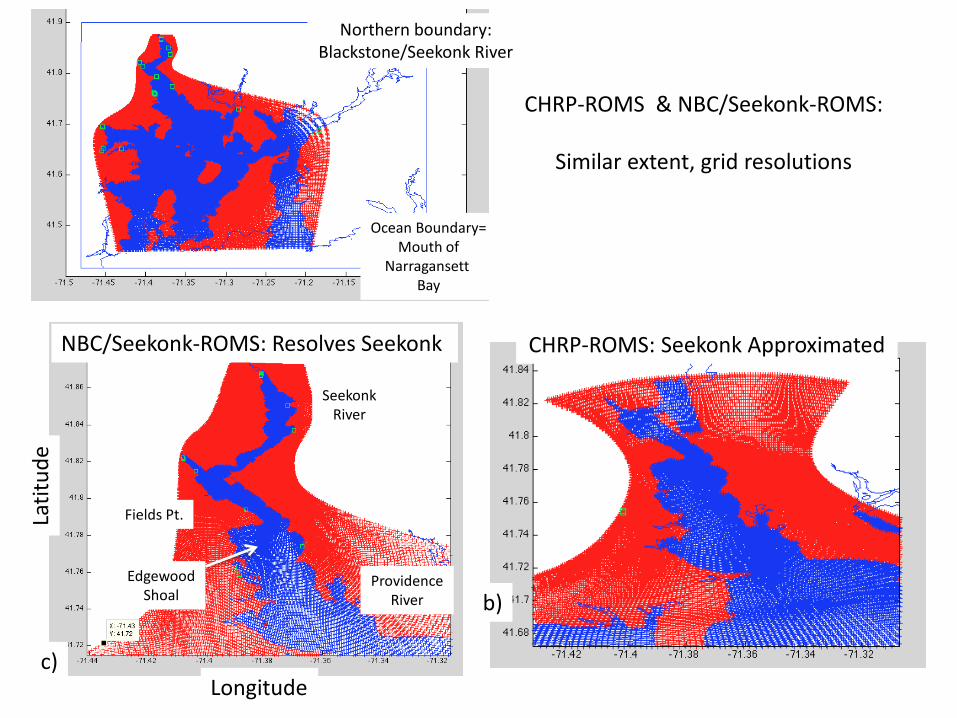
Seekonk to Block Island/Vineyard >200 m grid spacing (in mapview) 3) Full Bay ROMS Seekonk to Bay Mouth Driven at mouth by Bay-RIS ROMS <50 m grid spacing in north a) CHRP (Seekonk approx.) b) NBC Seekonk -ROMS (SNB-ROMS) resolves Seekonk Distinct river/WWTF dyes NPZD on
Grids important: Want them closely packed, but open boundaries far removed……
Longitude
Latit
ude
Northern boundary: Blackstone/Seekonk River
Ocean Boundary= Mouth of
Narragansett Bay
CHRP-ROMS: Seekonk Approximated
Seekonk River
Providence River
Fields Pt.
Edgewood Shoal b)
c)
CHRP-ROMS & NBC/Seekonk-ROMS:
Similar extent, grid resolutions
NBC/Seekonk-ROMS: Resolves Seekonk

Longitude
Latit
ude
138 m, 23 meter spacing
NBC/Seekonk-ROMS: Resolves Seekonk
Umass Blackstone TMDL Model Output: 2010-2011
Separate Nitrogen Fluxes:
UB-WWTF
Non Pt. Sources Other Pt. Sources
Bucklin WWTF
10-Mile
Hurricane Barrier Area
5 nodes
3-D ROMS Computer Models: Brief look under hood


Conservation Equations: Mass
Momentum Energy, Salt

Greenwich Bay: Shallow Day 127
1. Data sets show basic circulation patterns (heard it before, little bit later)
2. ROMS models calibrated versus data (Dave Ullman summarized)
3. ROMS models used to simulate flow & chemical transport,
test management stratgies
1. ROMS NPZD Results
Outline

16 Distinct Dyes for Rivers (9) & Waste Water Treatment Facilities(7): 1) How do dyes from each source move through system? 2) Which dyes accumulate in hot spot areas vs. are flushed efficiently? 3) Independent control: Can reduce any one, holding others fixed
Mosh/Woon Blackstone (Pt. vs. Non Pt.)
Palmer
Taunton
2 Greenwich Bay Rivers
GB WWTF
Fields Pt. WWTF
Bucklin Pt. WWTF
Pawtuxet
WWTF
Fall River WWTF
EP-WWTF 10-Mile
Hunt
Edgewood Shoal
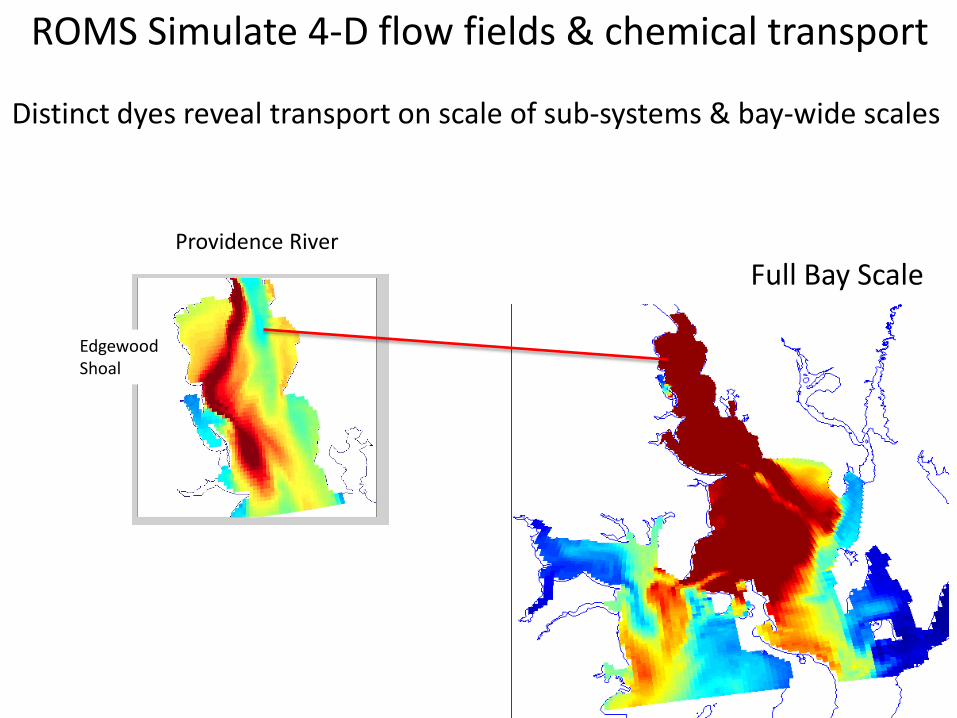
ROMS Simulate 4-D flow fields & chemical transport
Distinct dyes reveal transport on scale of sub-systems & bay-wide scales
Full Bay Scale Providence River
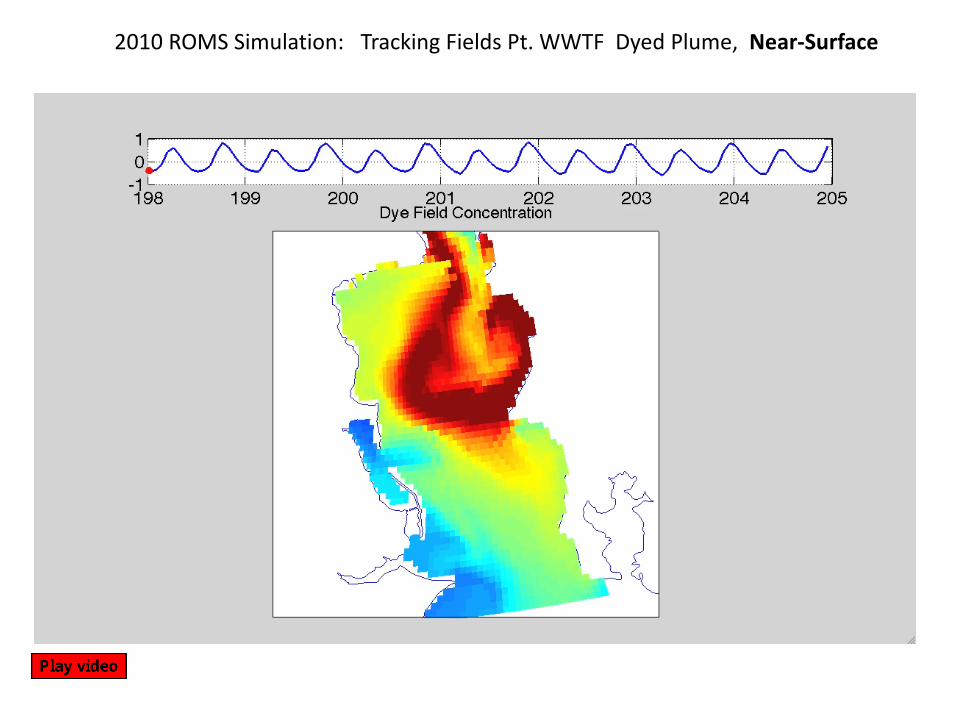
2010 ROMS Simulation: Tracking Fields Pt. WWTF Dyed Plume, Near-Surface
a) b)
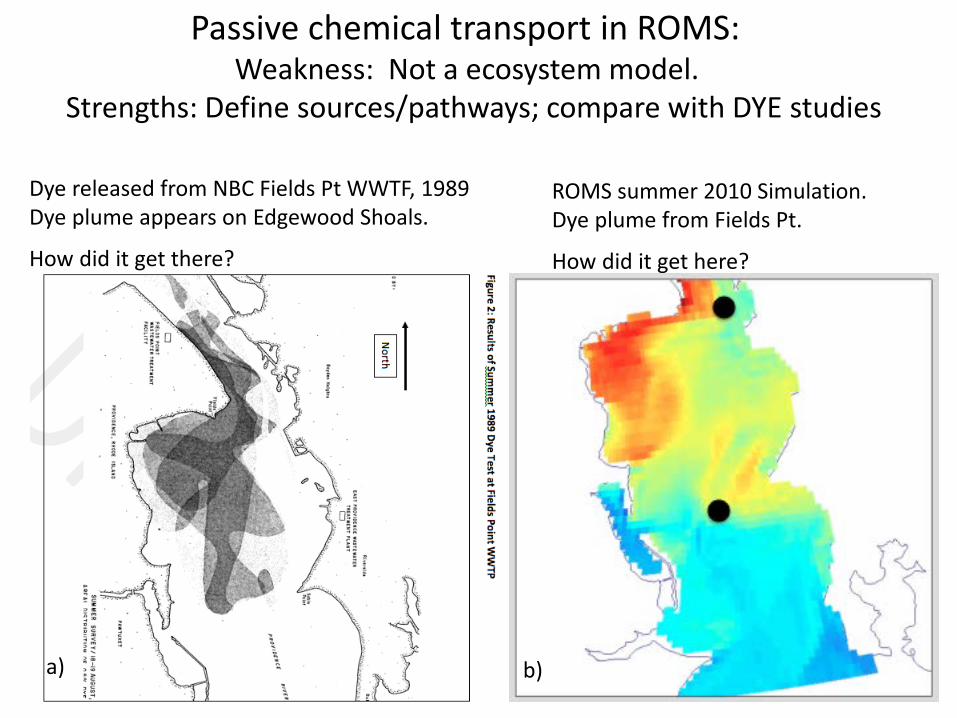
Dye released from NBC Fields Pt WWTF, 1989 Dye plume appears on Edgewood Shoals.
How did it get there?
ROMS summer 2010 Simulation. Dye plume from Fields Pt.
How did it get here?
Passive chemical transport in ROMS: Weakness: Not a ecosystem model.
Strengths: Define sources/pathways; compare with DYE studies

3 hours prior
Oldest: 7 hours prior
5 hours prior
Most Recent 1 hour prior
Summer 2010 ROMS simulation: Time evolution Fields Pt. chemical plume.
1. Outflow jet along channel-shoal interface. 2. Plume raps clockwise in Edgewood Shoals gyre 3. Time frame of sampling frequency of 1989 dye study
Dye wraps in Clockwise gyre

Data + High resolution (30m) ROMS: Velocity vectors in mapview show stable clockwise gyre on Edgewood Shoals (more later)

Take larger scale, down-bay view of chemical transport Blackstone non-point source dye: Variable pathways Fields Pt dye: Smaller plume Taunton River: Wraps into CCW Bay-flow, felt in Ohio Ledge, Greenwich Bay, Prov. River Southern sources go north
*Dye fields are scaled to actual values based on source concentration, but are passive, not active
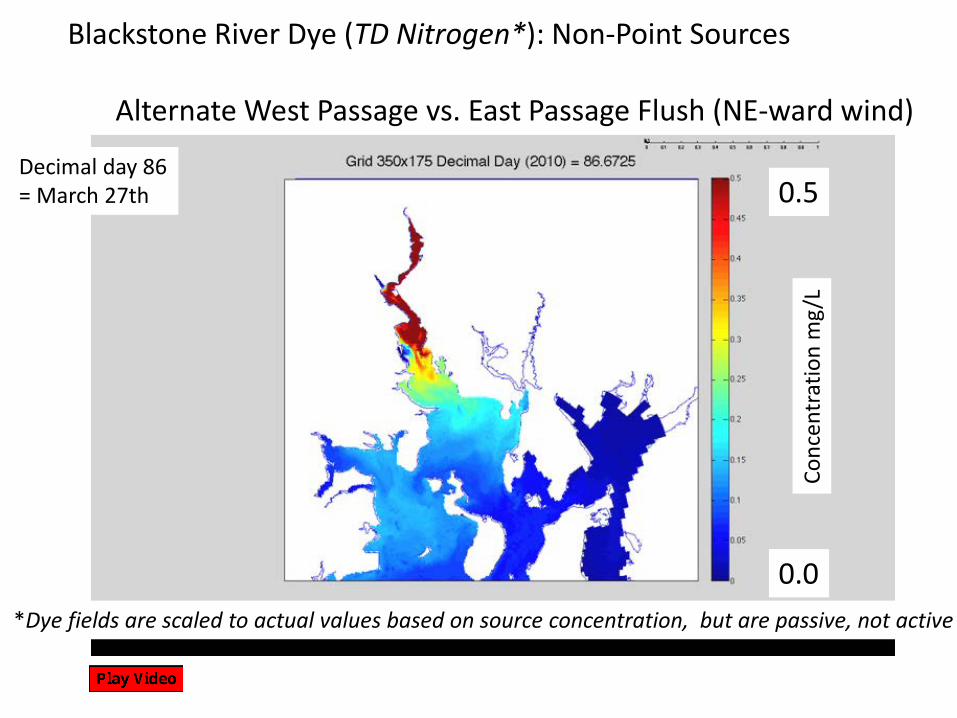
Decimal day 86 = March 27th
Blackstone River Dye (TD Nitrogen*): Non-Point Sources Alternate West Passage vs. East Passage Flush (NE-ward wind)
0.5
0.0
Conc
entr
atio
n m
g/L
*Dye fields are scaled to actual values based on source concentration, but are passive, not active

Decimal day 86 = March 27th
Fields Pt. Dye (Scaled to TD Nitrogen) Similar flush, smaller overall chemical plume
0.5
0.0
Conc
entr
atio
n, m
g/L
(ass
ume
10 m
g/L
rele
ase

Pulses of Southwestward Winds, Draw Taunton River Dye/Nitrogen
from South to North
Mid-level Contours

Taunton River Dye: Close up of deep northward path. Edgewood channel plume Choke value at India Point
Southward winds after day 60 Stronger northward intrusion
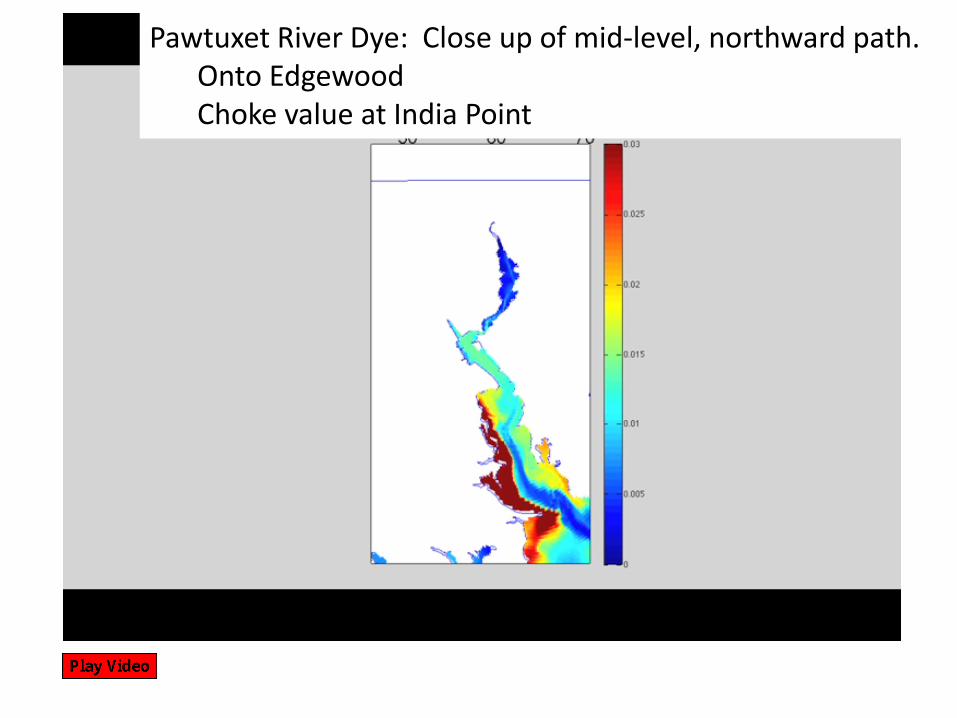
Pawtuxet River Dye: Close up of mid-level, northward path. Onto Edgewood Choke value at India Point
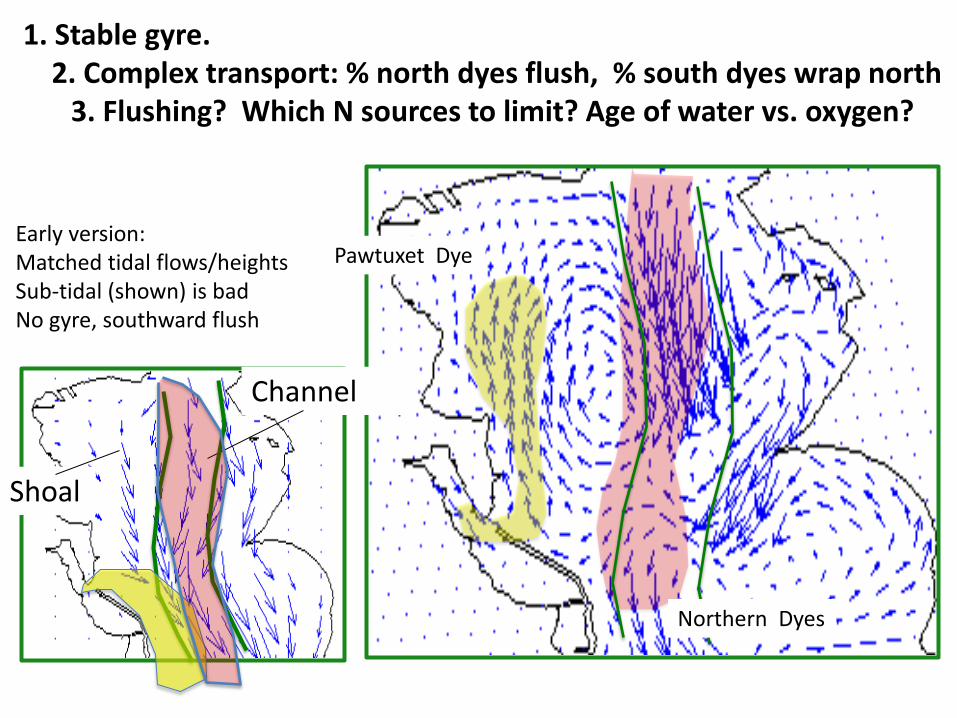
1. Stable gyre. 2. Complex transport: % north dyes flush, % south dyes wrap north 3. Flushing? Which N sources to limit? Age of water vs. oxygen?
FULLBAY ROMS
Shoal
Channel
Early version: Matched tidal flows/heights Sub-tidal (shown) is bad No gyre, southward flush
Northern Dyes
Pawtuxet Dye

TCM10: Mid Edgewood Shoal
Decimal Day, 2010
Nor
thw
ard
Resid
ual V
eloc
ity, c
m/s
Mar
ch 1
2
Mar
ch 2
7
Data-Model Comparisons Show which models accepatable Tidal and sub-tidal Flow Data vs Model Willmott Skills High: 0.8 – 0.9
Captures challenging flood event
ROMS
DATA
Data/ROMS comparison location
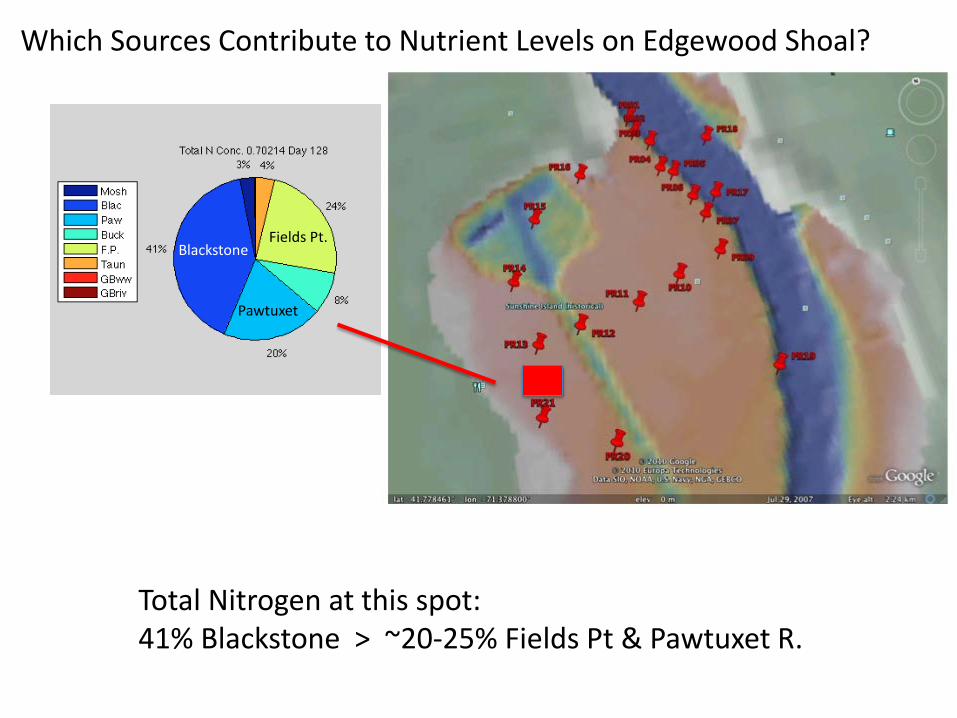
Which Sources Contribute to Nutrient Levels on Edgewood Shoal?
Pawtuxet
Blackstone Fields Pt.
Total Nitrogen at this spot: 41% Blackstone > ~20-25% Fields Pt & Pawtuxet R.
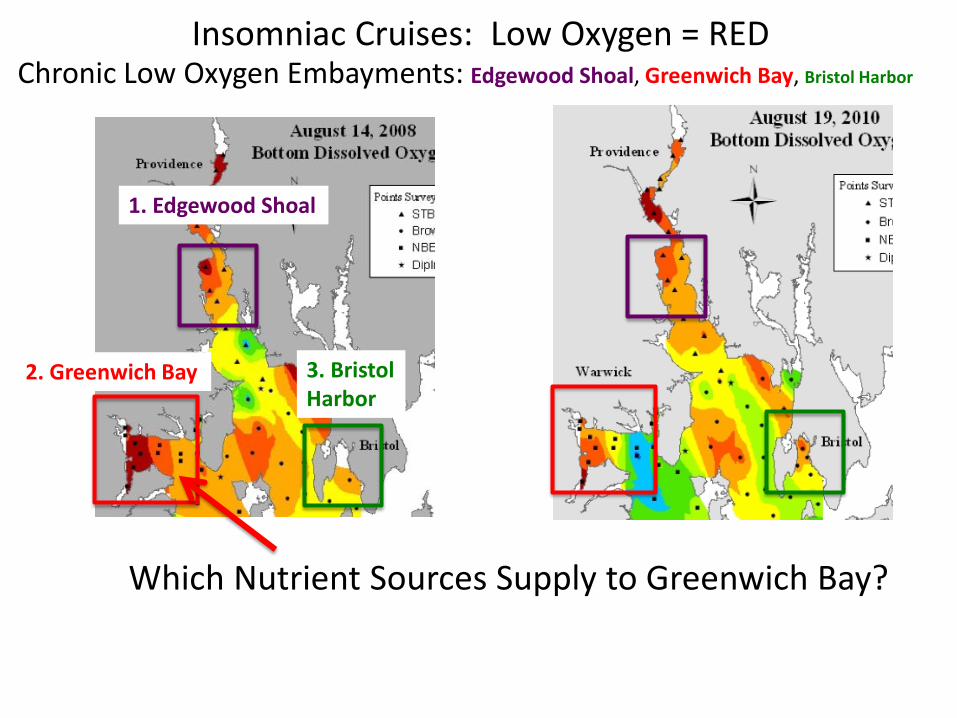
Chronic Low Oxygen Embayments: Edgewood Shoal, Greenwich Bay, Bristol Harbor
1. Edgewood Shoal
2. Greenwich Bay 3. Bristol Harbor
Insomniac Cruises: Low Oxygen = RED
Which Nutrient Sources Supply to Greenwich Bay?
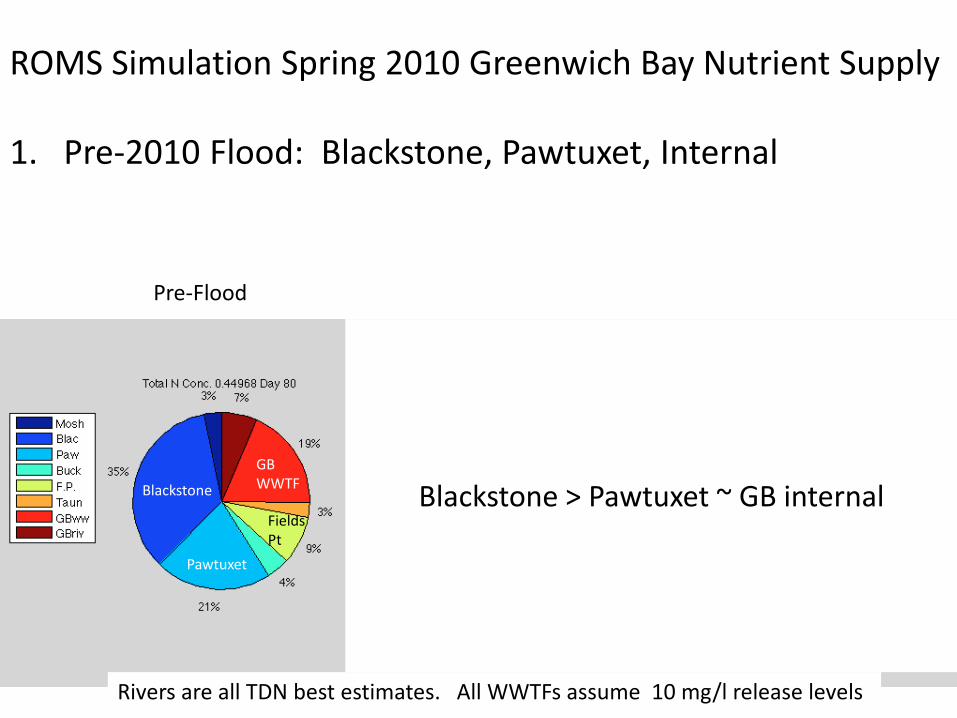
Pre-Flood
ROMS Simulation Spring 2010 Greenwich Bay Nutrient Supply 1. Pre-2010 Flood: Blackstone, Pawtuxet, Internal
Blackstone
Pawtuxet
GB WWTF
Blackstone
Pawtuxet Fields Pt
Fields Pt
Blackstone
Pawtuxet
Rivers are all TDN best estimates. All WWTFs assume 10 mg/l release levels
Blackstone > Pawtuxet ~ GB internal
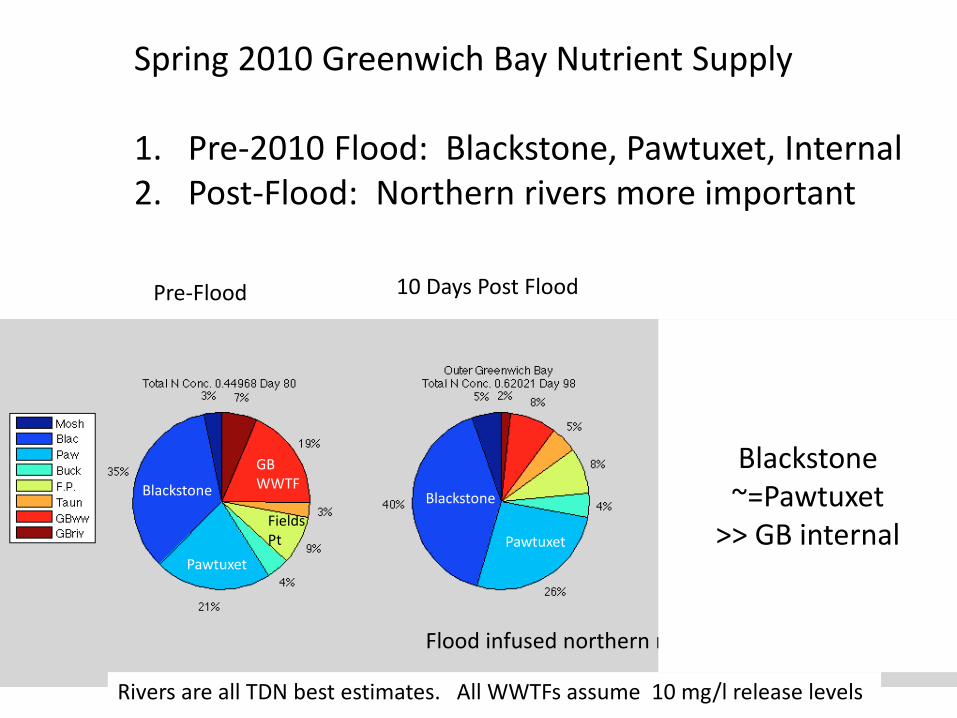
Pre-Flood 10 Days Post Flood
Spring 2010 Greenwich Bay Nutrient Supply 1. Pre-2010 Flood: Blackstone, Pawtuxet, Internal 2. Post-Flood: Northern rivers more important
Blackstone
Pawtuxet
GB WWTF
Flood infused northern nitrogen into GB
Blackstone
Pawtuxet Fields Pt
Fields Pt
Blackstone
Pawtuxet
Rivers are all TDN best estimates. All WWTFs assume 10 mg/l release levels
Blackstone ~=Pawtuxet
>> GB internal

Pre-Flood 10 Days Post Flood 30 Days Post Flood
Spring 2010 Greenwich Bay Nutrient Supply 1. Pre-2010 Flood: Blackstone, Pawtuxet, Internal 2. Post-Flood: Northern rivers more important
Blackstone
Pawtuxet
GB WWTF
Flood has infused northern nitrogen into GB
Blackstone
Pawtuxet Fields Pt
Fields Pt
Blackstone
Pawtuxet
19% 8%
7%
65% 74% 74%
3x pre-flood

a)
Late Spring 2010 Nutrient Supply to GB Dominated by Internal Sources & Northern Rivers
Greenwich Bay
Day 145: May 25, 2010 Day 175:
June 24, 2010
Day 230: August 18, 2010
Blackstone
Pawtuxet
Fields Pt.
Taunton
Blackstone
Pawtuxet Fields Pt.
Greenwich Bay
Rivers are all TDN best estimates. All WWTFs assume 10 mg/l release levels
26%
FP + Bucklin = Pawtuxet = 50% of Blackstone

a)
Late Summer 2010 Nutrient Supply to GB Dominated by Internal Sources
Rivers are all TDN best estimates. All WWTFs assume 10 mg/l release levels
Greenwich Bay
Day 145: May 25, 2010 Day 175:
June 24, 2010
Day 230: August 18, 2010
Blackstone
Pawtuxet
Fields Pt.
Taunton
Blackstone
Pawtuxet Fields Pt.
Greenwich Bay
55% late summer vs. 7% post flood
55%
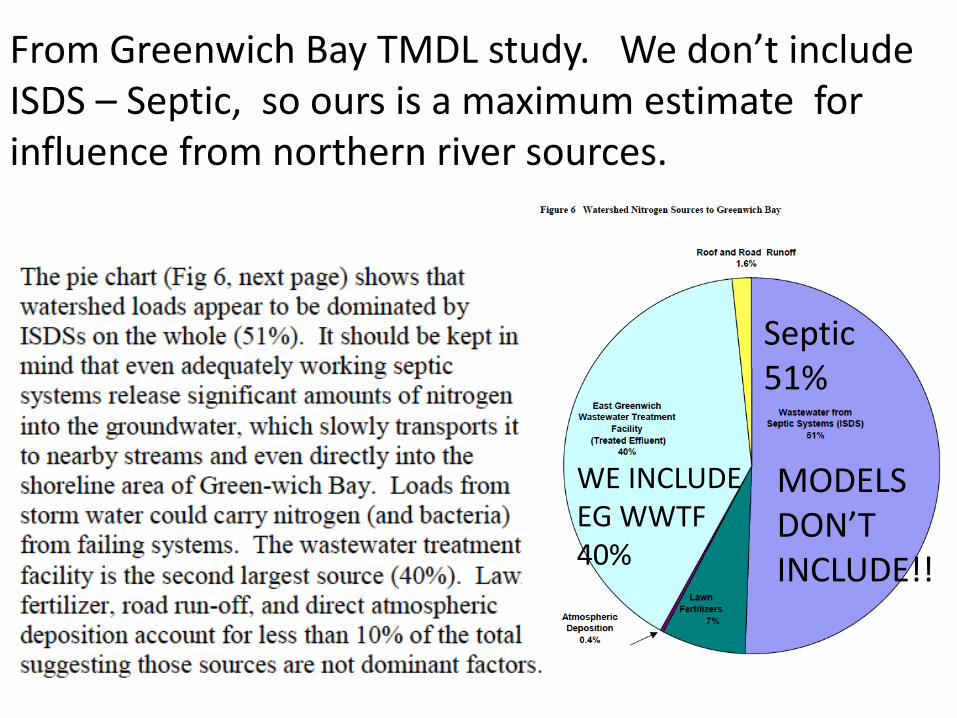
From Greenwich Bay TMDL study. We don’t include ISDS – Septic, so ours is a maximum estimate for influence from northern river sources.
MODELS DON’T INCLUDE!!
WE INCLUDE EG WWTF 40%
Septic 51%

Use ROMS to test range in management strategies
a)
Greenwich Bay: Shallow Day 127
Simulate relative response of Fields Pt. WWTF (only FP)
Nutrient Reduction Strategies
Show modeled nutrient concentrations at 5 locations
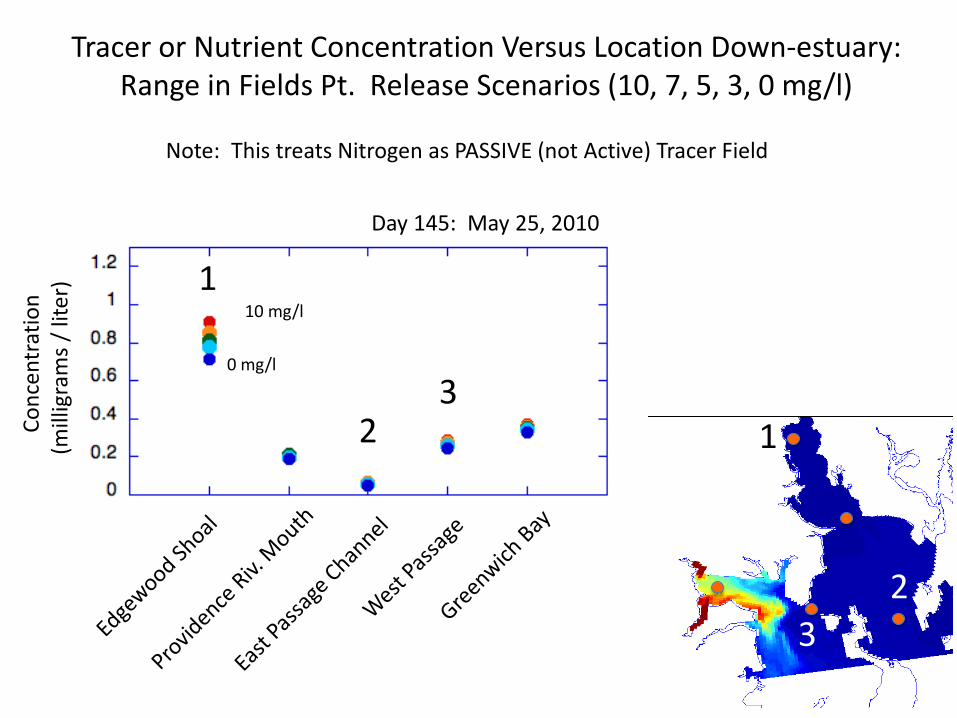
Day 145: May 25, 2010
C
once
ntra
tion
(mill
igra
ms
/ lite
r)
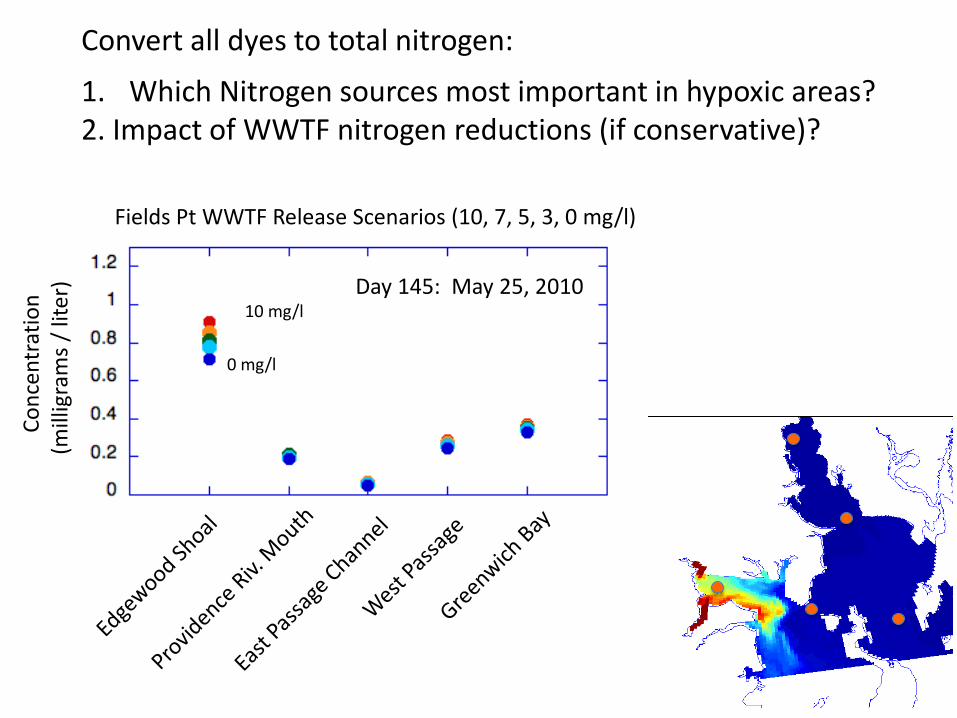
Tracer or Nutrient Concentration Versus Location Down-estuary: Range in Fields Pt. Release Scenarios (10, 7, 5, 3, 0 mg/l)
10 mg/l
0 mg/l
1
2 3
1
2 3
Note: This treats Nitrogen as PASSIVE (not Active) Tracer Field

Greenwich Bay: Shallow Day 127
1. Data sets show basic circulation patterns (heard it before, little bit later)
2. ROMS models calibrated versus data (Dave Ullman summarized)
3. ROMS models used to simulate flow & chemical transport,
test management stratgies
1. ROMS NPZD Results
Outline
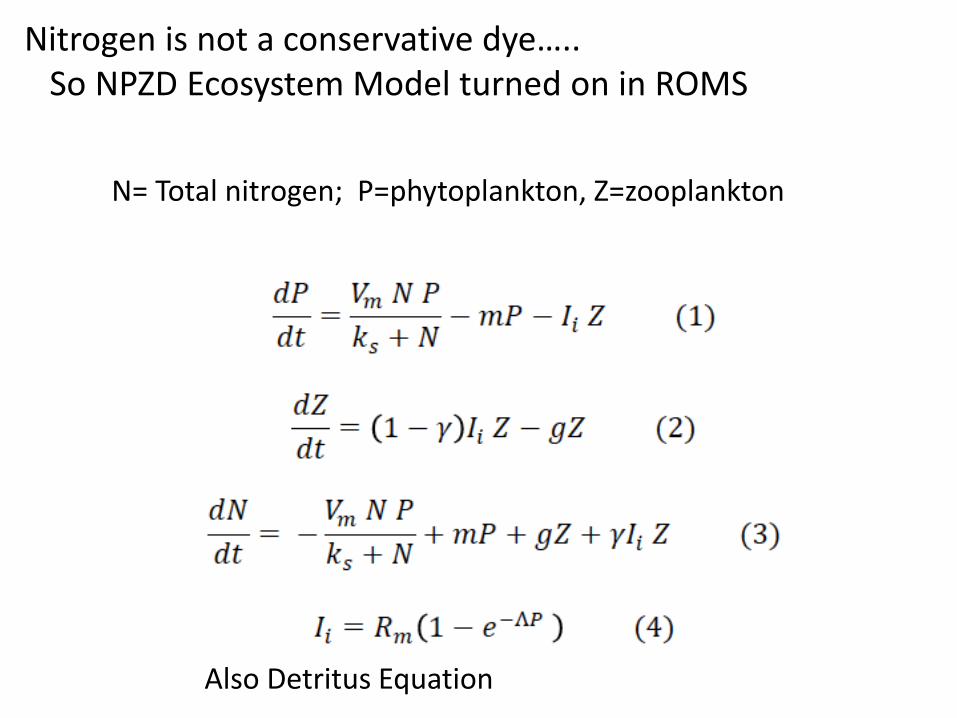
Nitrogen is not a conservative dye….. So NPZD Ecosystem Model turned on in ROMS
N= Total nitrogen; P=phytoplankton, Z=zooplankton
Also Detritus Equation
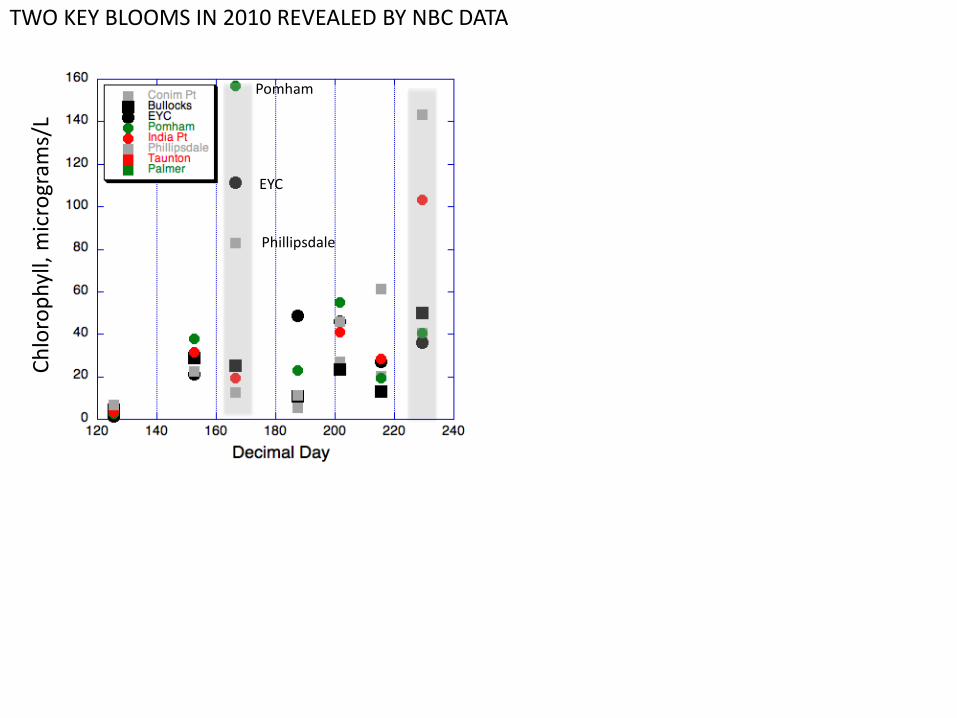
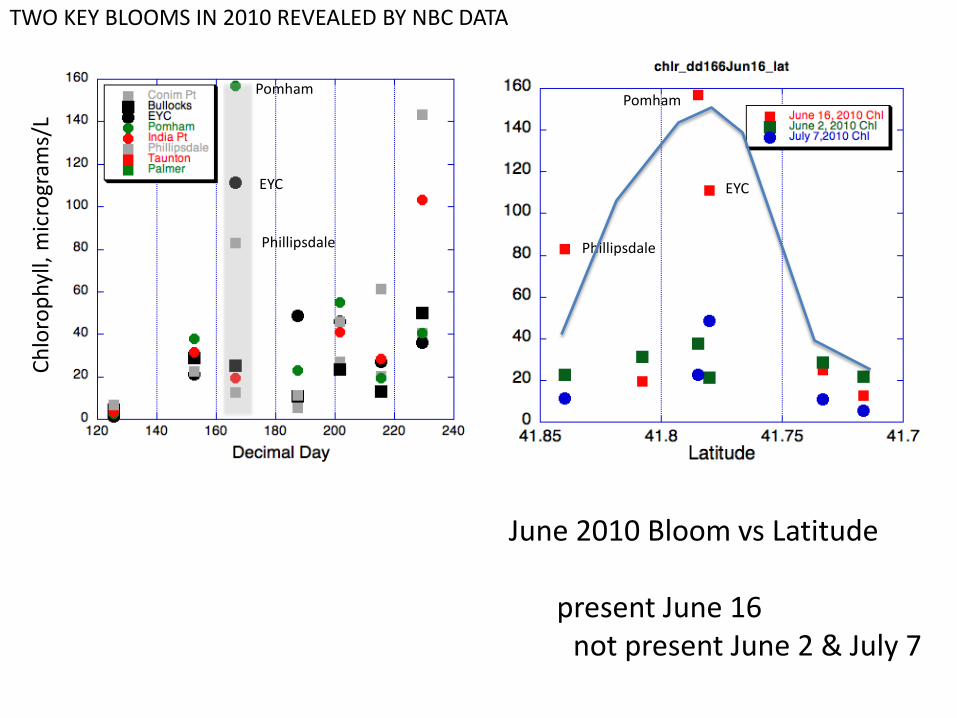
Phillipsdale
EYC
Pomham
Chlo
roph
yll,
mic
rogr
ams/
L TWO KEY BLOOMS IN 2010 REVEALED BY NBC DATA
Phillipsdale
EYC
Pomham
Phillipsdale
EYC
Pomham
Chlo
roph
yll,
mic
rogr
ams/
L TWO KEY BLOOMS IN 2010 REVEALED BY NBC DATA
June 2010 Bloom vs Latitude present June 16 not present June 2 & July 7
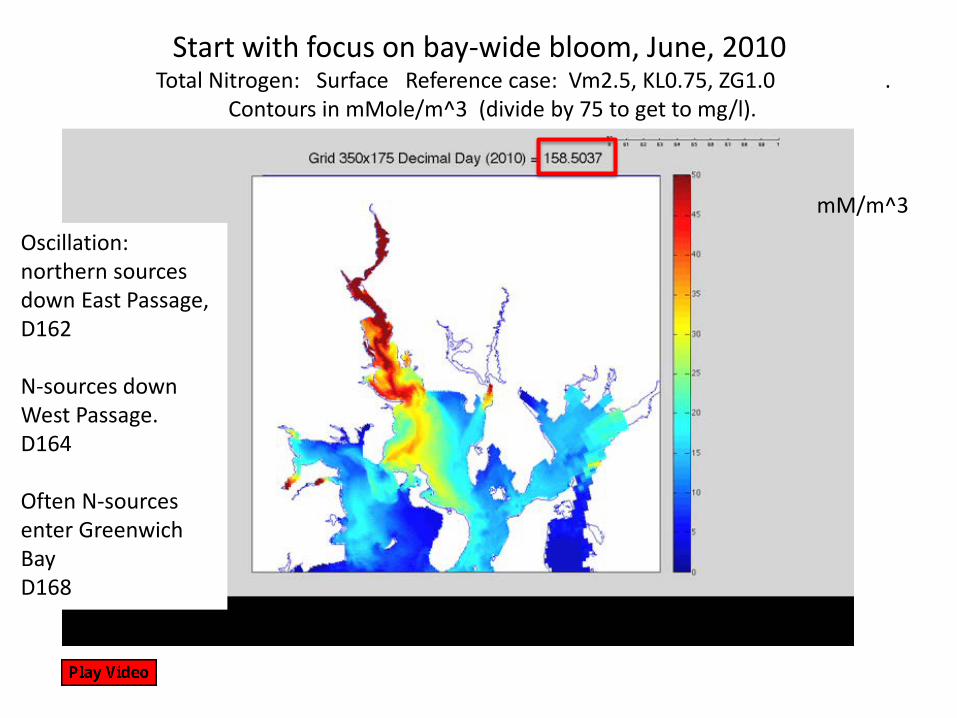
Start with focus on bay-wide bloom, June, 2010 Total Nitrogen: Surface Reference case: Vm2.5, KL0.75, ZG1.0 .
Contours in mMole/m^3 (divide by 75 to get to mg/l).
mM/m^3 Oscillation: northern sources down East Passage, D162 N-sources down West Passage. D164 Often N-sources enter Greenwich Bay D168

Providence River N. Prudence S. Prudence Lower Bay
Fundamental observation in Bay: TN reduction from Seekonk to Mouth of Providence River All runs (pre-bloom) have TN match basic observation: 1. 40% reduction Head of Prov. River to Mouth 2. Seekonk 50% higher than upper Prov. River
Seek
onk
Rive
r
Tota
l Nitr
ogen
Latitude
Multiple runs: Uptake rate, Light extinction, Zoo Grazing, Mortality, WWTF levels

Phytoplankton: Surface Reference case: Vm2.5, KL0.75, ZG1.0. Shows it starts in Greenwich Bay and Mt Hope Bay
Bloom starts: Greenwich Bay Taunton River shallows Shallows in Prov. River Bloom expands to north
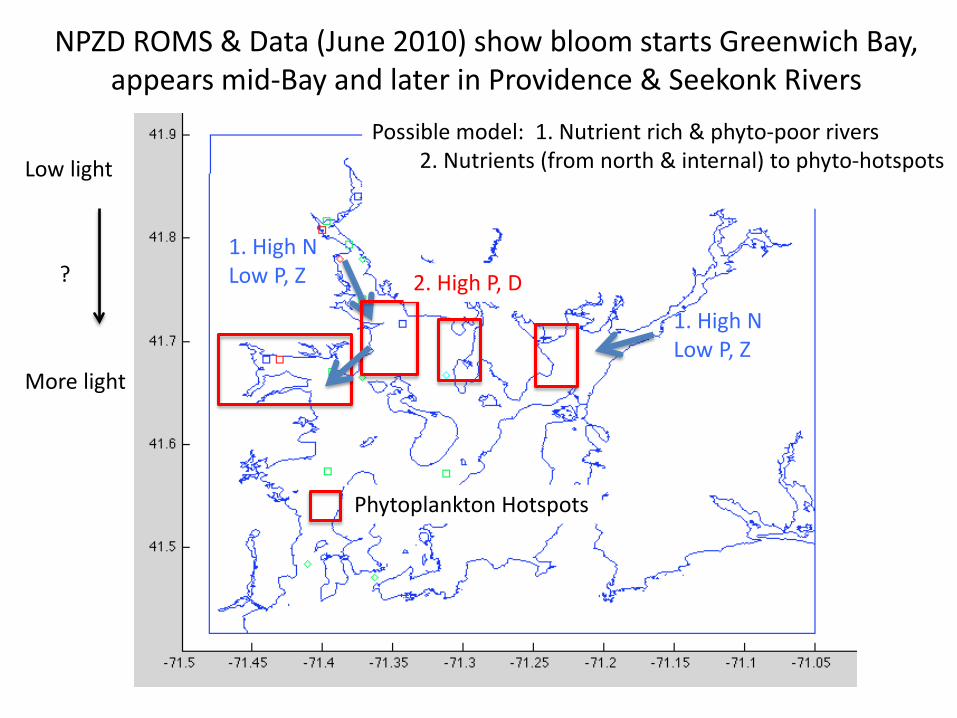
1. High N Low P, Z 2. High P, D
1. High N Low P, Z
Phytoplankton Hotspots
NPZD ROMS & Data (June 2010) show bloom starts Greenwich Bay, appears mid-Bay and later in Providence & Seekonk Rivers
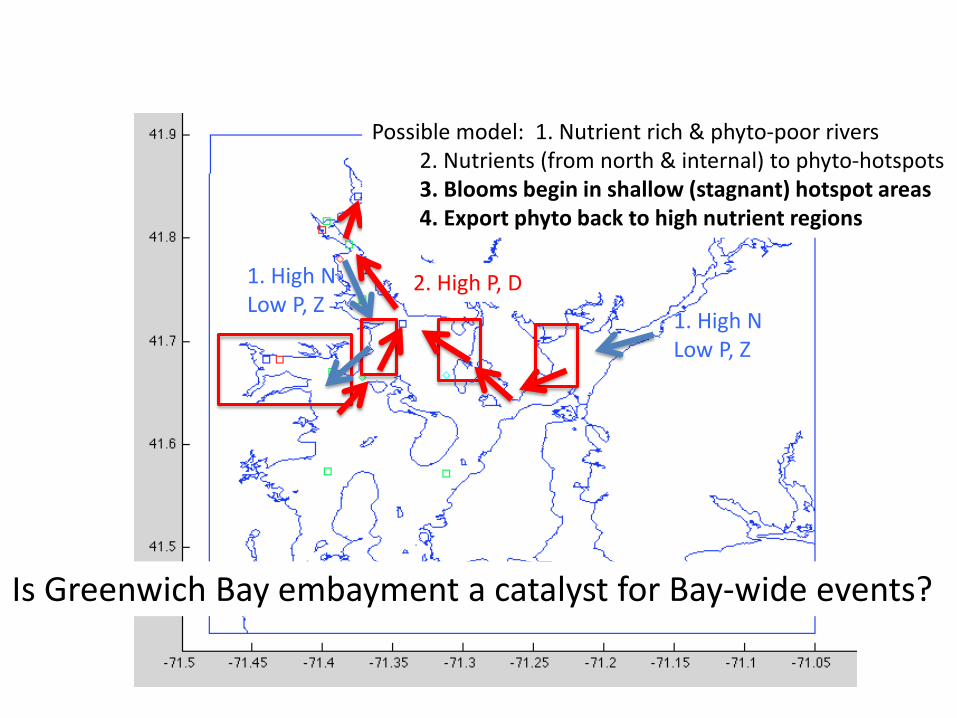
Possible model: 1. Nutrient rich & phyto-poor rivers 2. Nutrients (from north & internal) to phyto-hotspots
Low light
More light
?
1. High N Low P, Z
2. High P, D
1. High N Low P, Z
Is Greenwich Bay embayment a catalyst for Bay-wide events?
Possible model: 1. Nutrient rich & phyto-poor rivers 2. Nutrients (from north & internal) to phyto-hotspots 3. Blooms begin in shallow (stagnant) hotspot areas 4. Export phyto back to high nutrient regions
Day 160 6/9
Day 163 6/12
Day 166 6/15
CP
WP
GB
GB BR
Providence River Mid-Bay Lower-Bay
ES
Vm2.5
Vm2
Vm1.5
Phytoplankton
Phyt
opla
nkto
n Latitude
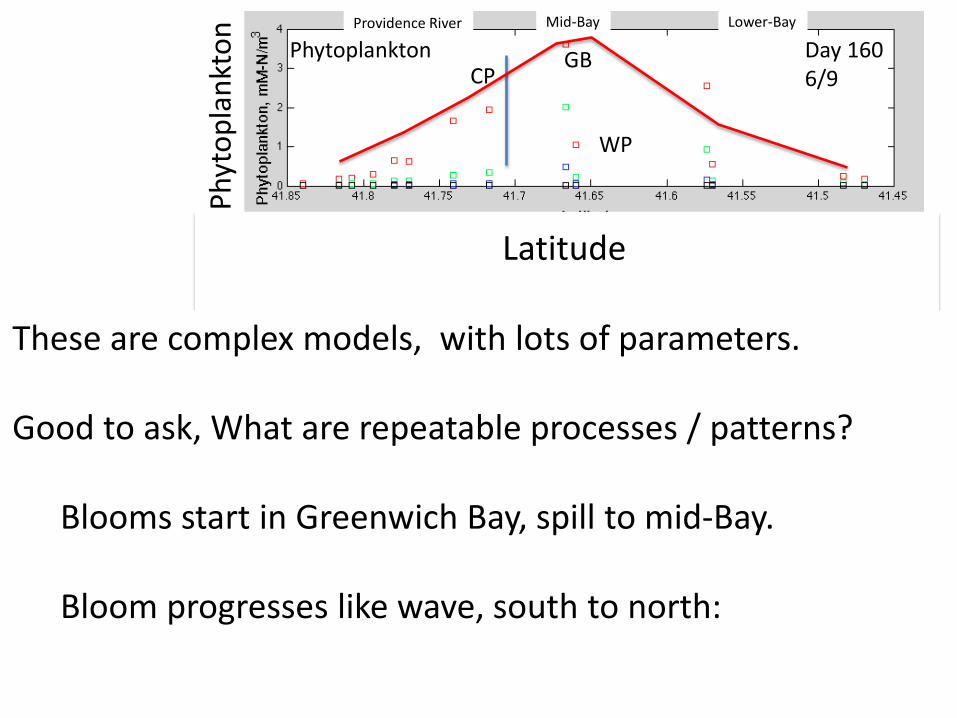
These are complex models, with lots of parameters. Good to ask, What are repeatable processes / patterns? Blooms start in Greenwich Bay, spill to mid-Bay. Bloom progresses like wave, south to north:

Day 160 6/9
Day 163 6/12
Day 166 6/15
CP
WP
GB
GB BR
Providence River Mid-Bay Lower-Bay
ES=Edgewood
Vm2.5
Vm2
Vm1.5
Bloom progresses like wave, south to north
Edgewood higher bloom magnitude Matches data
Phytoplankton
Larger uptake rates match size/progression of bloom
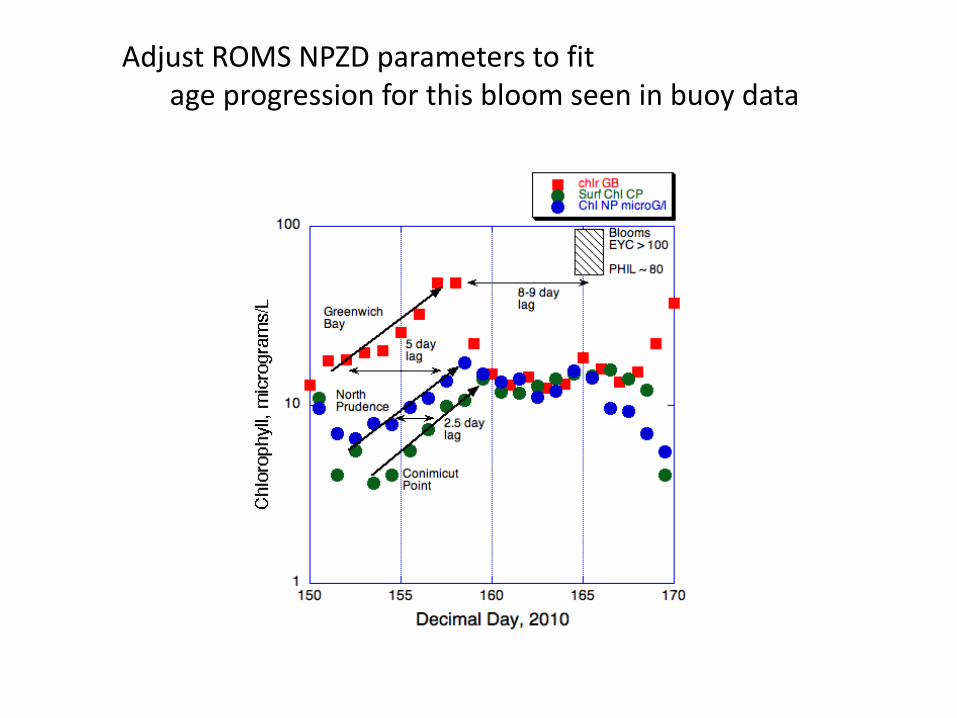
Adjust ROMS NPZD parameters to fit age progression for this bloom seen in buoy data

Greenwich Bay
Phillipsdale
Bloom Occurrence Latitude vs. Time (June 2010). Data vs. Model: Key N uptake rate & Light
DATA
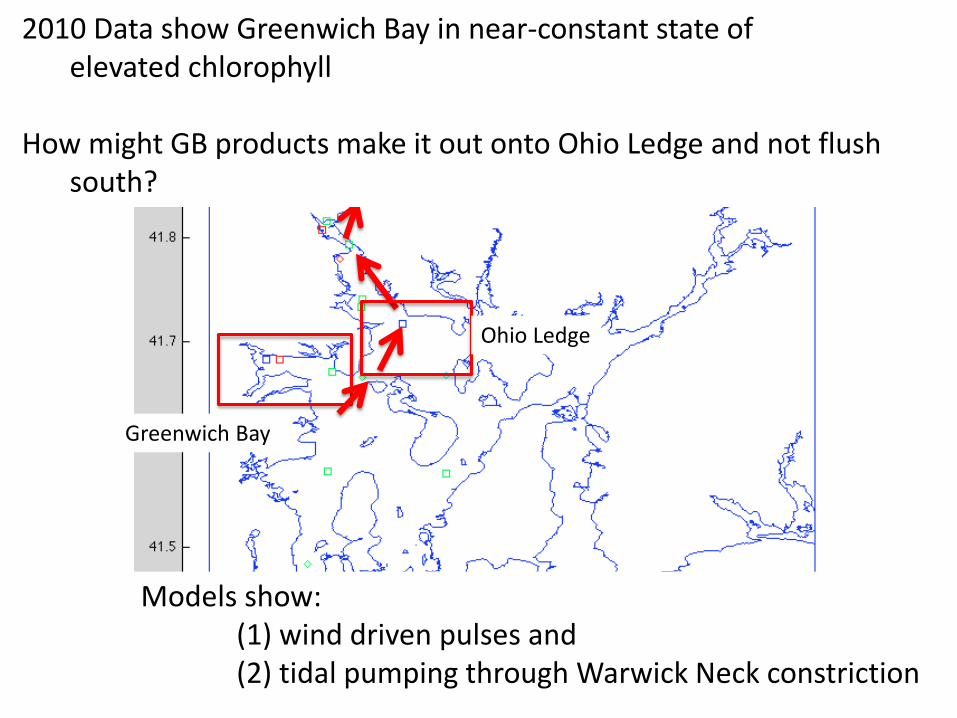
2010 Data show Greenwich Bay in near-constant state of elevated chlorophyll How might GB products make it out onto Ohio Ledge and not flush south?
Ohio Ledge
Greenwich Bay
Models show: (1) wind driven pulses and (2) tidal pumping through Warwick Neck constriction

Day 153 : 6/1/10: Post Northeastward wind
a) Surface b) Mid-water c) Bottom
Decimal Day, 2010
Win
d Sp
eed,
m/s
April
20
June
9
NE-Ward Wind GB fluid onto Ohio Ledge
GB south in WP
Winds pump GB bloom products to Ohio Ledge
Blue=Northward; Red=Eastward
Intrusion to PR
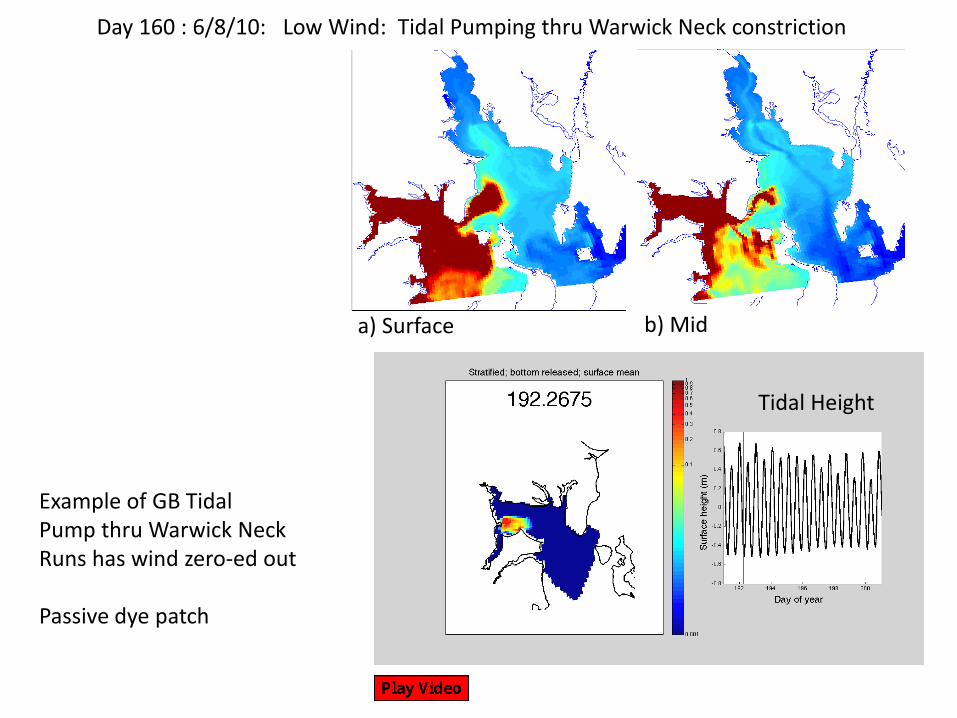
Day 160 : 6/8/10: Low Wind: Tidal Pumping thru Warwick Neck constriction
a) Surface b) Mid
Example of GB Tidal Pump thru Warwick Neck Runs has wind zero-ed out Passive dye patch
Tidal Height

Model Scenario/Process Tests: Two Applications 1) Test impact of different WWTF release levels. 15 mg/l, 8 mg/l, 5 mg/l, 3 mg/l, 0 mg/l 2) Is Greenwich Bay a bad gallbladder, influencing bloom dynamics throughout entire system?

Conimicut Point
East Passage @ N. Prudence
West Passage @ Warwick Neck
15 mg/L
Red=15 mg/L Green: 5 mg/L Blue: 3 mg/L Black: 0 mg/L
a)
b)
c)
Reductions 5-0 mg/L imperceptible
Phytoplankton Levels vs. Time: Compare mid-Bay levels for range of (all) WWTF release levels
Summary Dye (N as conservative tracer) show transport pathways for sources. Southern dyes move north efficiently (Taunton, Pawtuxet, EP-WWTF) Nitrogen to GB? oscillate, northern river sources vs. local sources GB dye pumped periodically to mid-Bay site ROMS NPZD / Data trends suggest Greenwich Bay can be a hotspot for blooms Wind events and tidal pumping produce GB to Ohio Ledge export.

GB nutrients set to 0
Mid-depth Nutrient Contours May 20, 2010
ROMS Eco-process tests: Weighing bloom magnitude vs : 1) nutrient reductions. 2) physical drivers. 3) hotspots
Greenwich Bay bloom products independent of parameter choices If cut it out, does it influence NPZD products baywide?
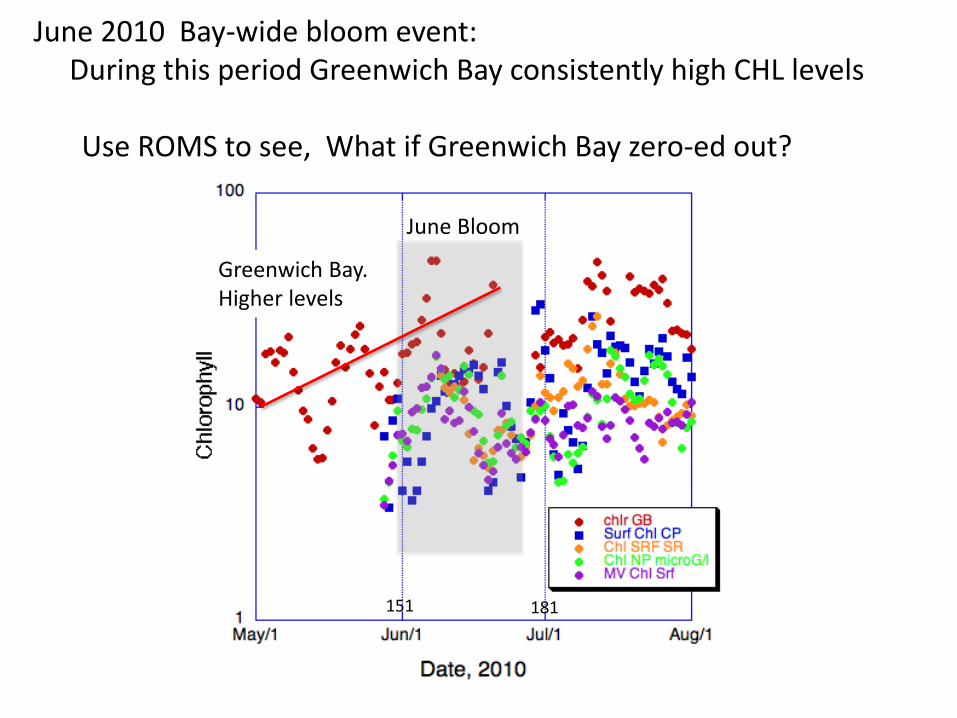
June Bloom
151 181
June 2010 Bay-wide bloom event: During this period Greenwich Bay consistently high CHL levels Use ROMS to see, What if Greenwich Bay zero-ed out?
Greenwich Bay. Higher levels

Greenwich Bay off = Big Effect on Prov./ Seekonk Blooms. Embayments, with chonically poor flush, potentially far-reaching impacts
GB – OFF Wind on
Black: Reference (GB on, Real Wind)
Furthest North SEEKONK Station
Phytoplankton mM/m^3
Detritus (bottom) mM/m^3
Red & black identical, except GB zeroed in Red
Significant Difference
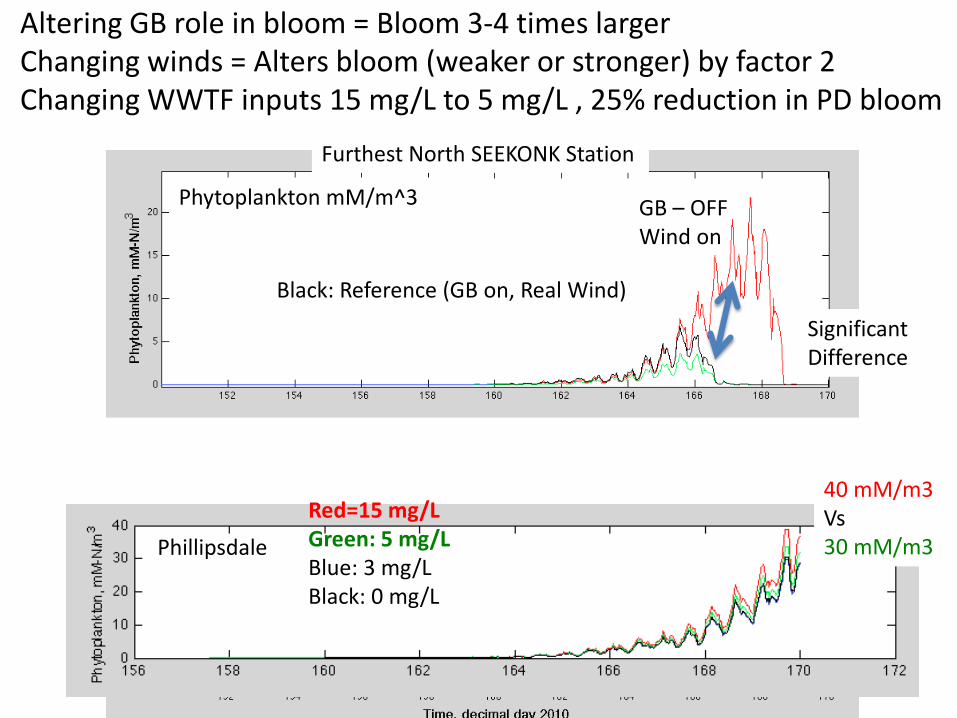
ROMS predicts zero-ing Greenwich Bay produces 3-4 times larger Phytoplankton concentration at Phillipsdale
GB – OFF Wind on
Black: Reference (GB on, Real Wind)
Furthest North SEEKONK Station
Phytoplankton mM/m^3
Detritus (bottom) mM/m^3
Significant Difference
Phillipsdale Red=15 mg/L Green: 5 mg/L Blue: 3 mg/L Black: 0 mg/L
Altering GB role in bloom = Bloom 3-4 times larger Changing winds = Alters bloom (weaker or stronger) by factor 2 Changing WWTF inputs 15 mg/L to 5 mg/L , 25% reduction in PD bloom
40 mM/m3 Vs 30 mM/m3

What’s going on here? Why different? 1st … Surface Zooplankton: without Greenwich Bay zeroed
Zooplankton GB & MHB are producers & exporters to Ohio Ledge

Surface Zooplankton: (GB-OFF – GB-ON)
High P, Low Z water exported to Prov. River. Bigger bloom.
Blue: zooplankton in GB-OFF case less than GB-ON Red: zooplankton in GB-OFF greater than GB-ON

Summary Dye (N as conservative tracer) show transport pathways for sources. Southern dyes move north efficiently (Taunton, Pawtuxet) Nitrogen to GB? oscillate, northern river sources vs. local sources GB dye pumped periodically to mid-Bay site ROMS NPZD / Data trends suggest Greenwich Bay is a hotspot for blooms Wind events and tidal pumping produce GB to Ohio Ledge export. Zooplankton grazing controls length of bloom (Zg=2 best match). But also can lead to very important divergence in solutions. Time scale of P and Z growth paths vs time scale of wind-driven events Timing of Ohio Ledge export to Providence River vs. wind events & zooplankton growth can produce either muted or enhanced PR/SR blooms. Greenwich Bay (other mid-Bay sites) & winds can have big impact on way north
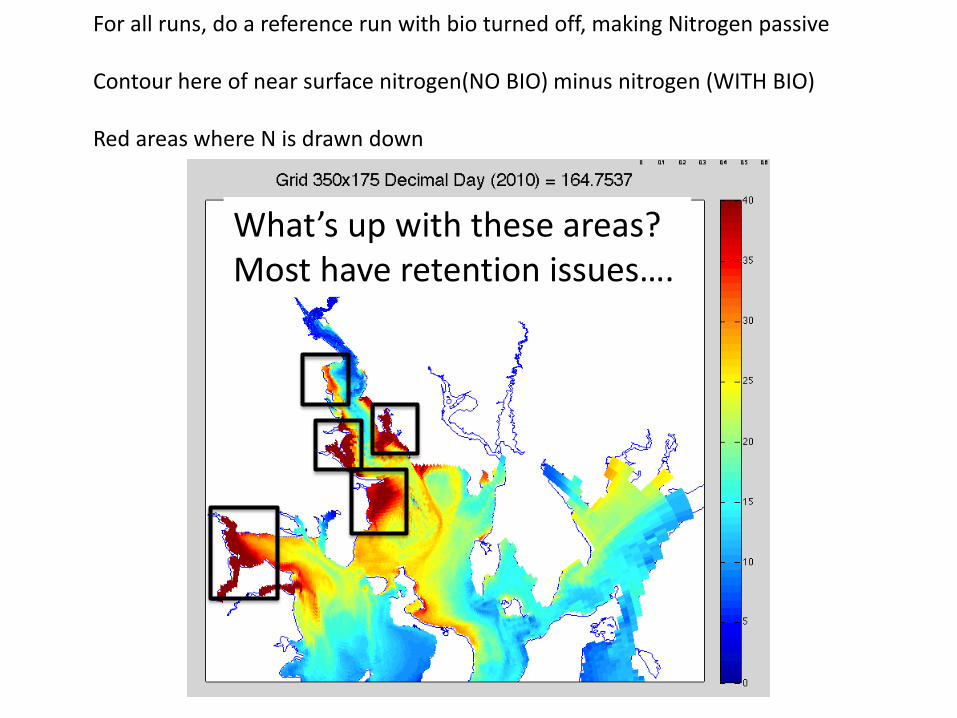
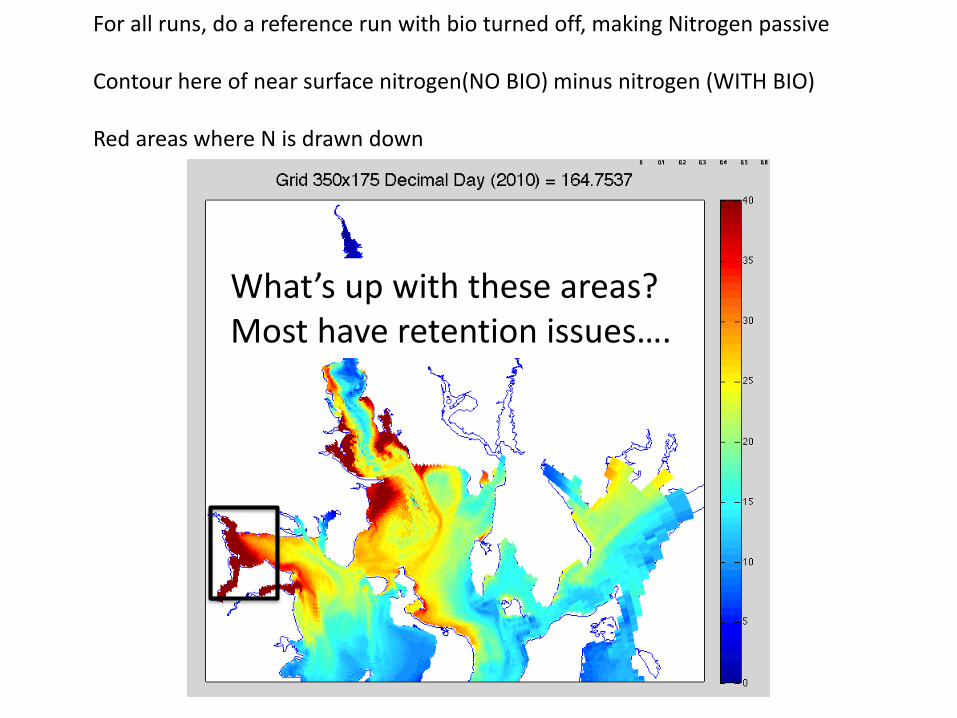
For all runs, do a reference run with bio turned off, making Nitrogen passive Contour here of near surface nitrogen(NO BIO) minus nitrogen (WITH BIO) Red areas where N is drawn down
What’s up with these areas? Most have retention issues….
For all runs, do a reference run with bio turned off, making Nitrogen passive Contour here of near surface nitrogen(NO BIO) minus nitrogen (WITH BIO) Red areas where N is drawn down
What’s up with these areas? Most have retention issues….
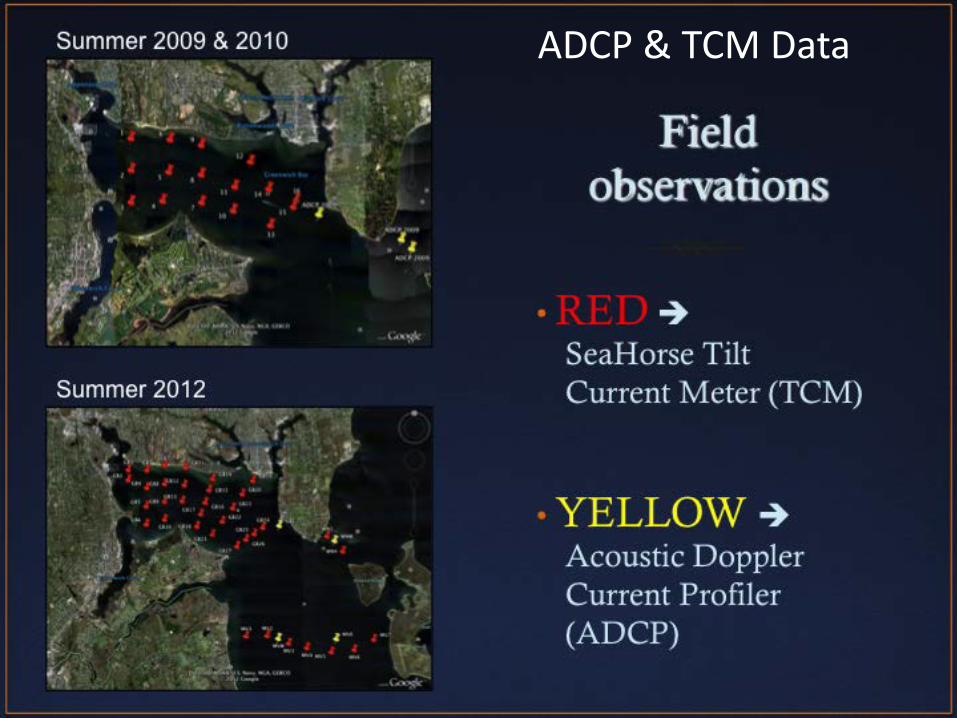
ADCP & TCM Data

Data (and models) show isolation of Greenwich Bay inner basin
N From Bay
N From Rivers & WWTF
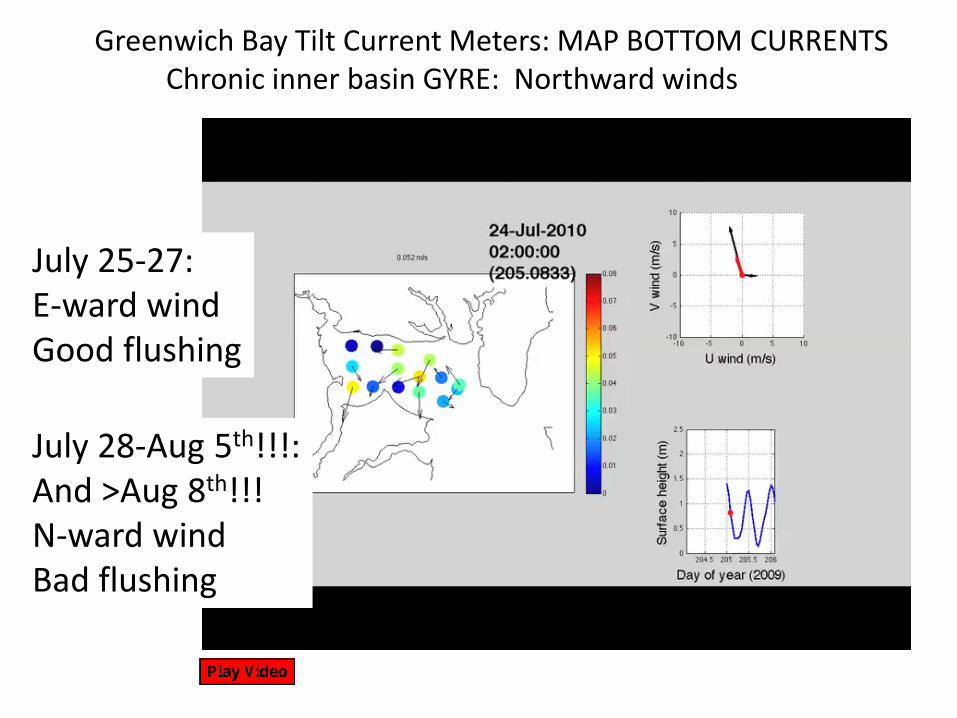
Greenwich Bay Tilt Current Meters: MAP BOTTOM CURRENTS Chronic inner basin GYRE: Northward winds
July 28-Aug 5th!!!: And >Aug 8th!!! N-ward wind Bad flushing
July 25-27: E-ward wind Good flushing

Decimal Day 182 is July 1 FLUSHING FAVORABLE: Southeast-ward Wind Event
Use Passive DYES and Floats to Quantify Circulation & Flushing
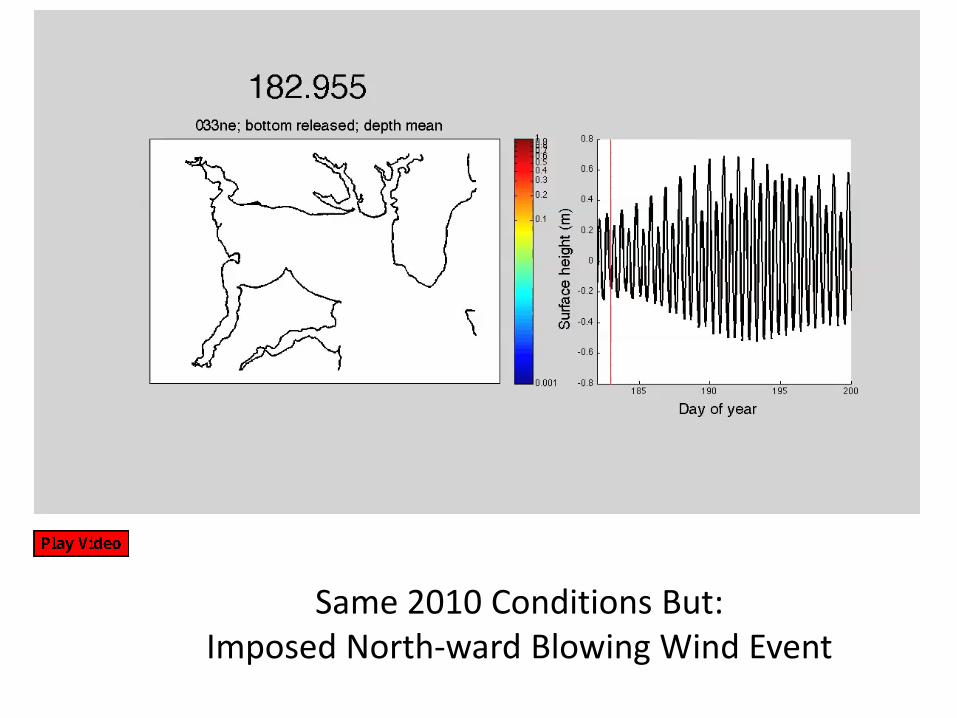
Same 2010 Conditions But: Imposed North-ward Blowing Wind Event
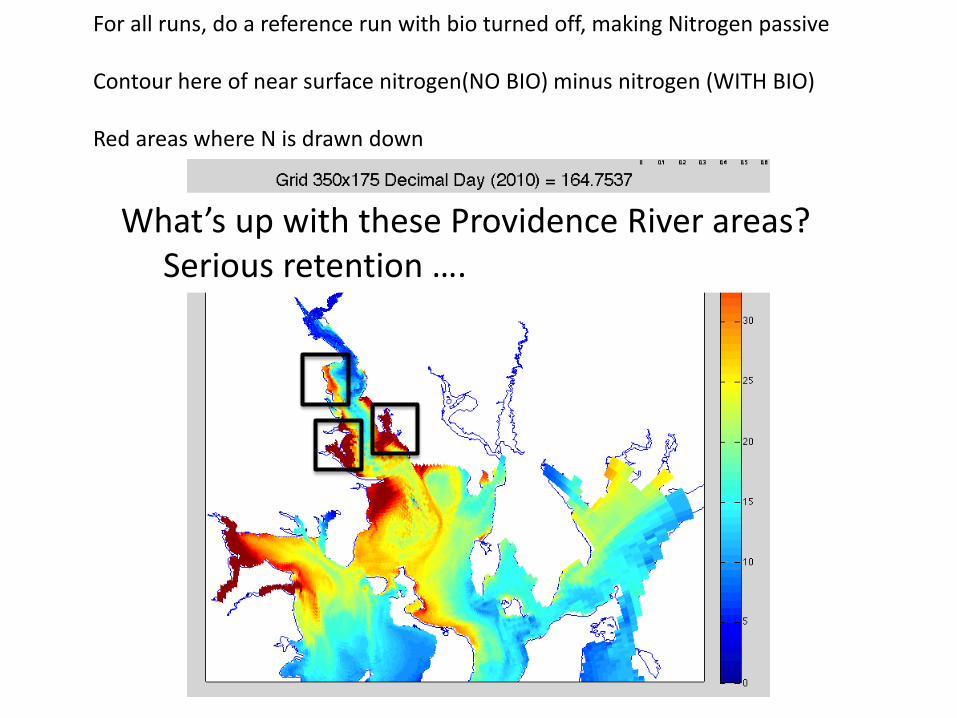
For all runs, do a reference run with bio turned off, making Nitrogen passive Contour here of near surface nitrogen(NO BIO) minus nitrogen (WITH BIO) Red areas where N is drawn down
What’s up with these Providence River areas? Serious retention ….
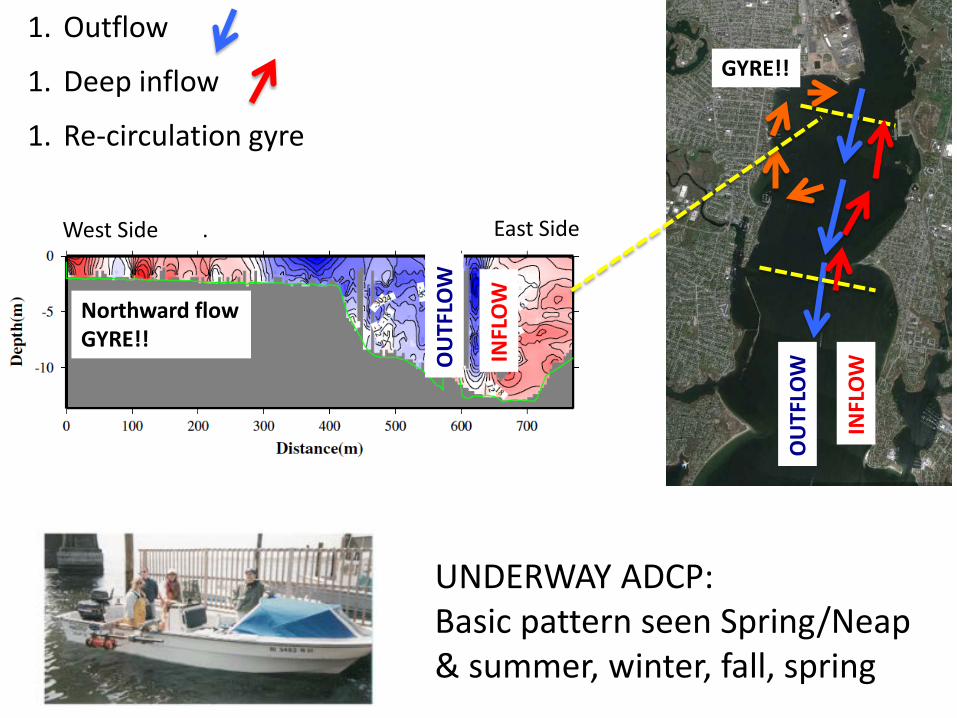
OU
TFLO
W
OU
TFLO
W
INFL
OW
INFL
OW
Northward flow GYRE!!
GYRE!!
1. Outflow
1. Deep inflow
1. Re-circulation gyre
UNDERWAY ADCP: Basic pattern seen Spring/Neap & summer, winter, fall, spring
West Side . East Side
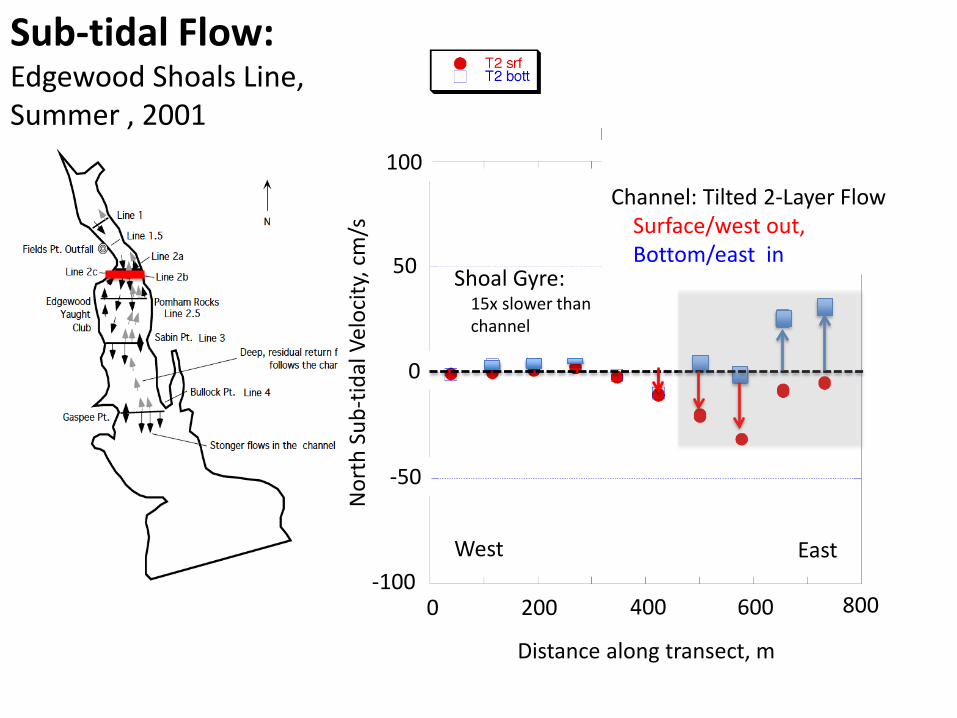
Sub-tidal Flow: Edgewood Shoals Line, Summer , 2001
Shoal Gyre: 15x slower than channel
Channel: Tilted 2-Layer Flow Surface/west out, Bottom/east in
Distance along transect, m
West East
0 200 400 600 800
0
-50
50
100
-100
Nor
th S
ub-t
idal
Vel
ocity
, cm
/s
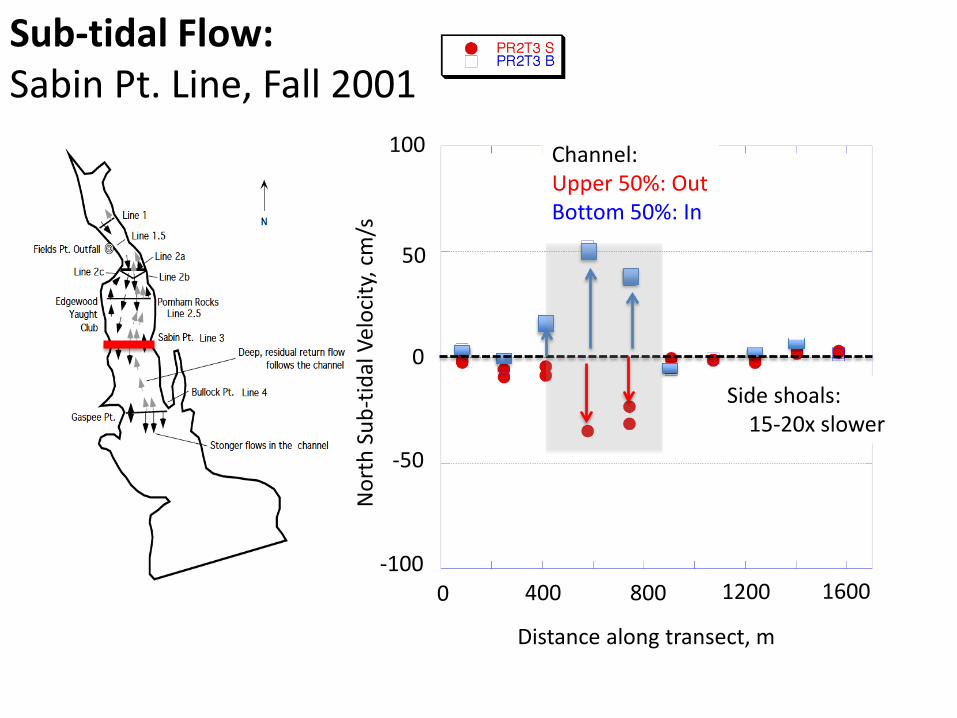
Sub-tidal Flow: Sabin Pt. Line, Fall 2001
Side shoals: 15-20x slower
Channel: Upper 50%: Out Bottom 50%: In
Distance along transect, m
0
-50
50
100
-100
Nor
th S
ub-t
idal
Vel
ocity
, cm
/s
0 400 800 1200 1600

Sub-tidal Flow: Sabin Pt. Line, Fall 2001
Side shoals: 15-20x slower
Channel: Upper 50%: Out Bottom 50%: In
Distance along transect, m
0
-50
50
100
-100
Nor
th S
ub-t
idal
Vel
ocity
, cm
/s
0 400 800 1200 1600
Key Point: Retention=bad water nucleation site Edgewood, Sabin, Gaspee Shoals are stagnant relative to channel
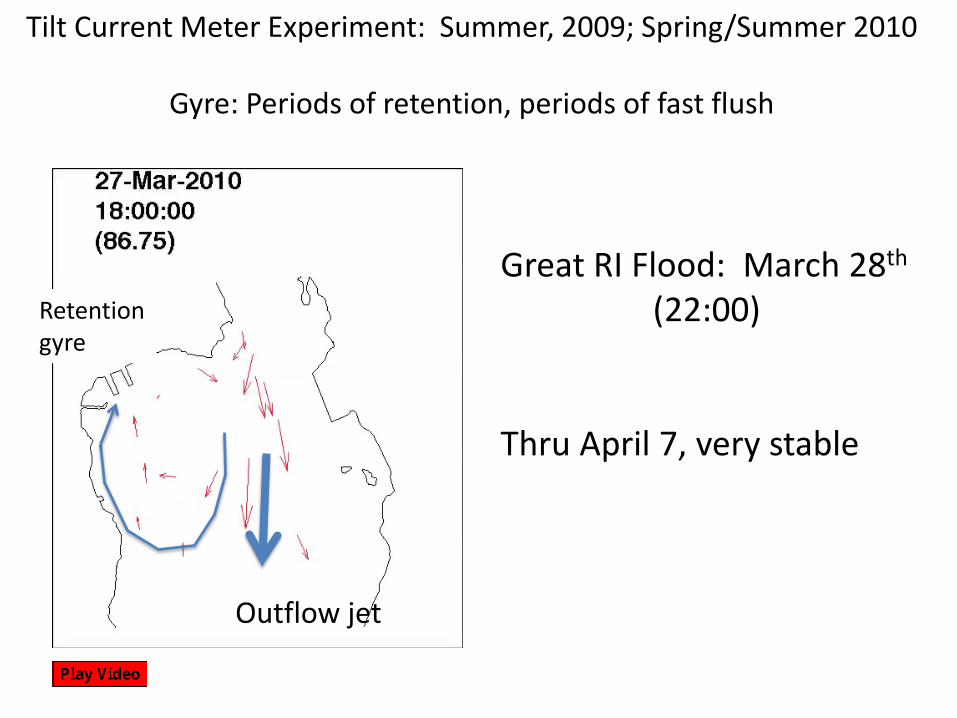
Tilt Current Meter Experiment: Summer, 2009; Spring/Summer 2010
Gyre: Periods of retention, periods of fast flush
Outflow jet
Retention gyre
Great RI Flood: March 28th (22:00) Thru April 7, very stable

Gyre is chronic (summer, winter, spring, fall) Do see a) shape/spin changes, b) periodic flush

Impact of 5-8 day retention, 1-2 day flush?
Box Model, Edgewood Shoals Periodic retention> oxygen drawdown > discharge Edgewood Shoals: 6 million cubic meters ~9% of Providence River volume. Model estimate: 5 day retention time. release in wind event over 2 days. equivalent to constant ~10 CMS low oxygen river
FULLBAY ROMS
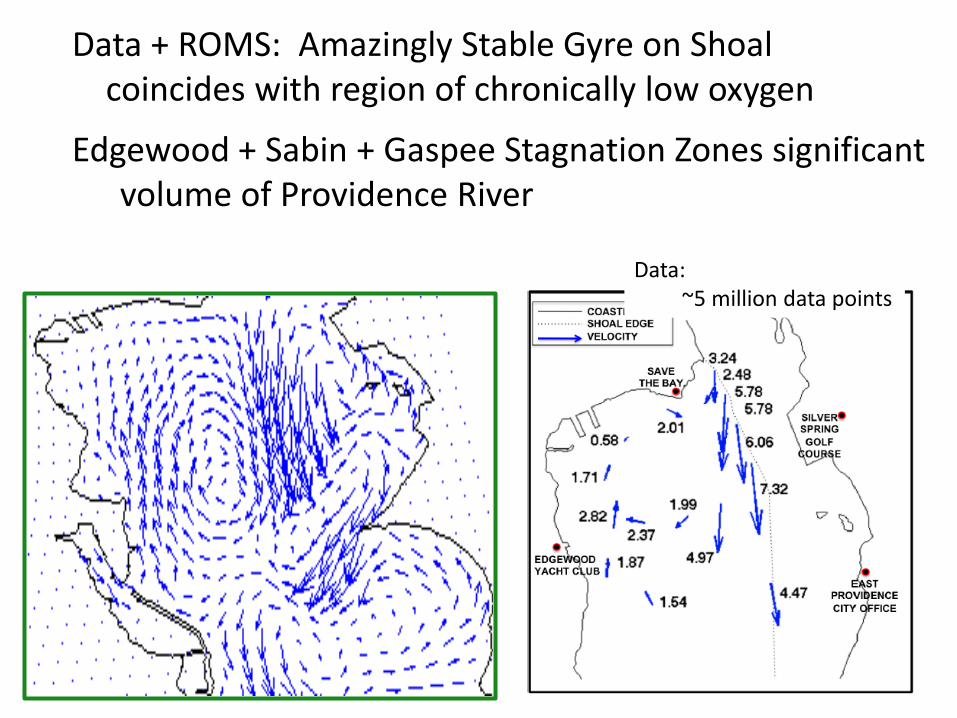
Tilt Current Meters Laboratory Data + ROMS: Amazingly Stable Gyre on Shoal coincides with region of chronically low oxygen
Edgewood + Sabin + Gaspee Stagnation Zones significant volume of Providence River Data:
~5 million data points
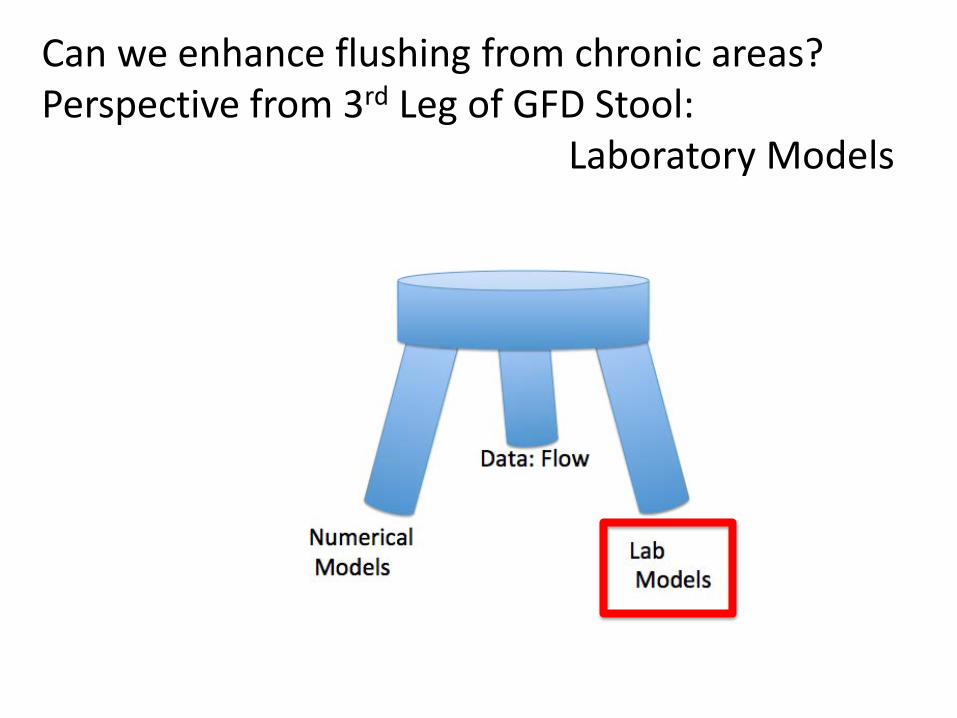
Can we enhance flushing from chronic areas? Perspective from 3rd Leg of GFD Stool: Laboratory Models

3rd Leg of GFD Stool: Laboratory Models
NBC NBC
Port Edgewood
Port Edgewood
Broad Shoal Broad
Shoal
Channel
Channel
66 cm (1000m)
33 cm (400 m)
Zchan / Z shoal = 5 Zchan / Z shoal = 5
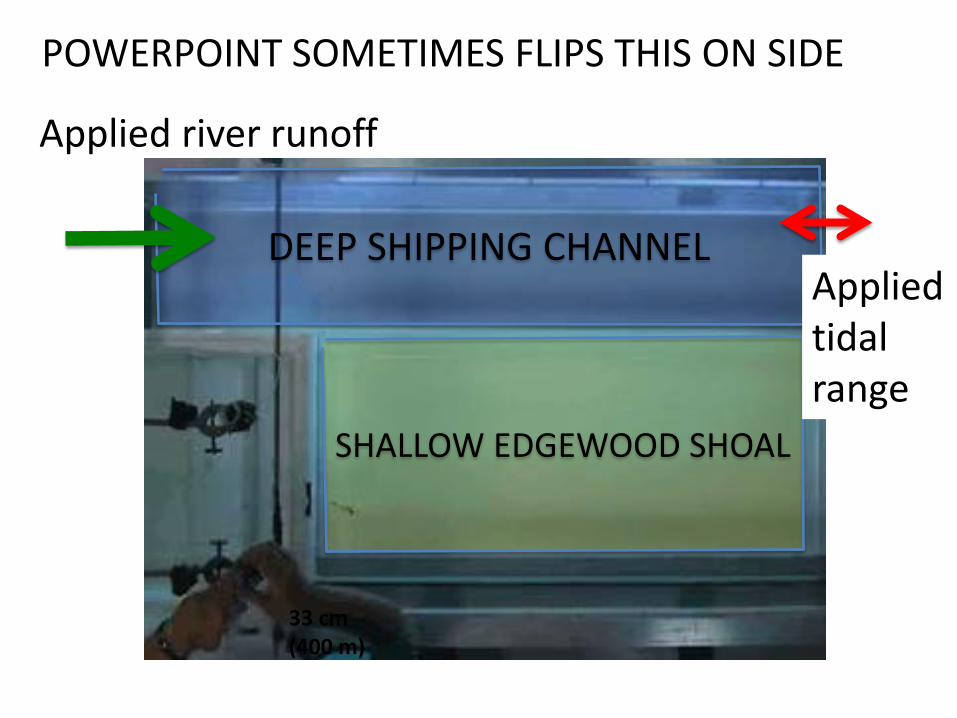
POWERPOINT SOMETIMES FLIPS THIS ON SIDE
33 cm (400 m)
DEEP SHIPPING CHANNEL
SHALLOW EDGEWOOD SHOAL
Applied river runoff
Applied tidal range

Scaled Lab Model: Providence River Channel & Shoal River Runoff Tides - No wind - No density differences + Real Fluid
Shallow Shoal
Deep Channel
River Flow
Tides: Up/down
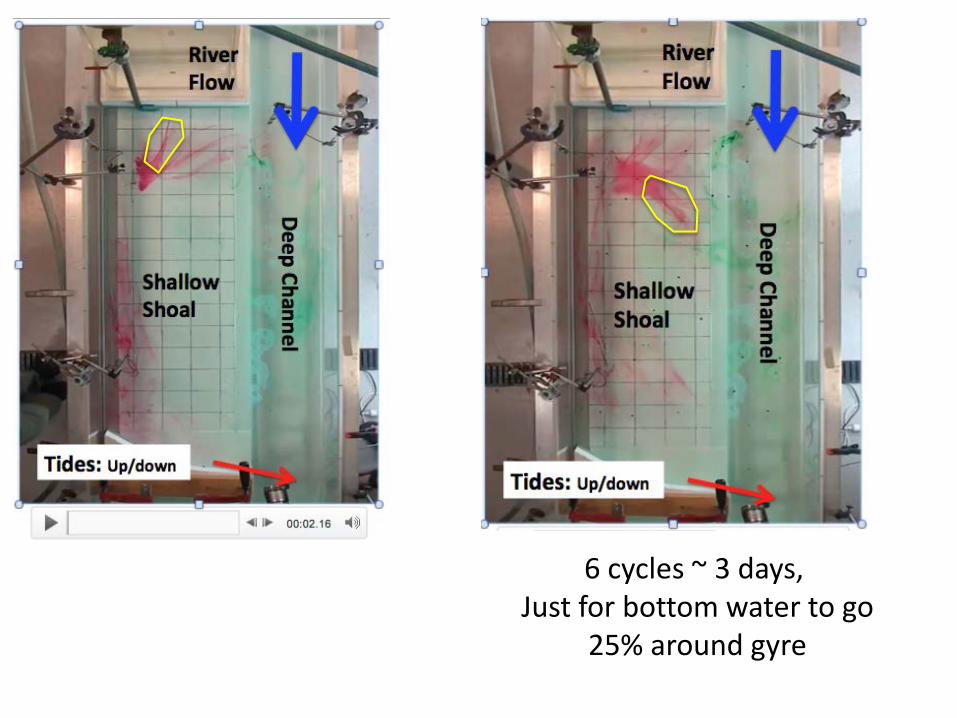
6 cycles ~ 3 days, Just for bottom water to go
25% around gyre
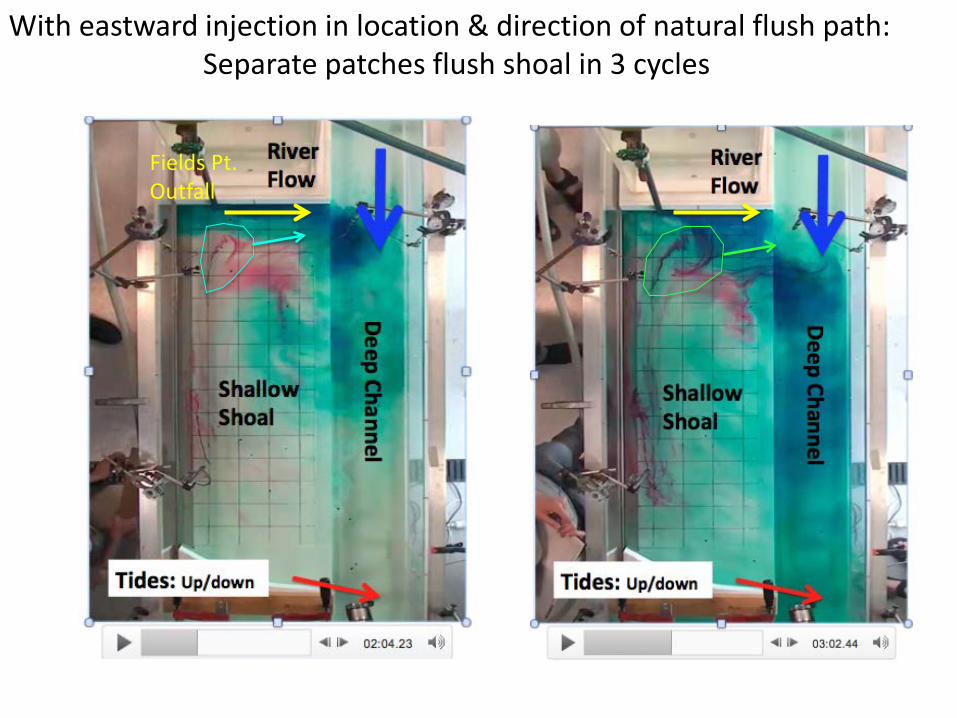
Fields Pt. Outfall
With eastward injection in location & direction of natural flush path: Separate patches flush shoal in 3 cycles

Nutrient Reductions at Waste Water Facilities 100s Millions of $
What about Strategic Engineering Solutions?
Port Edgewood Channel Attempts to Flush Shoal
Would dredged connection to channel enhance flushing?

Passive dye on Edgewood for case with no wind, no runoff (weak gyre)
Port Edgewood Channel acts to flush shoal

a)
Would fixing Pawtuxet entrance limit nutrient inputs as much/more than WWTF reductions?
Northern Dyes
Pawtuxet Dye
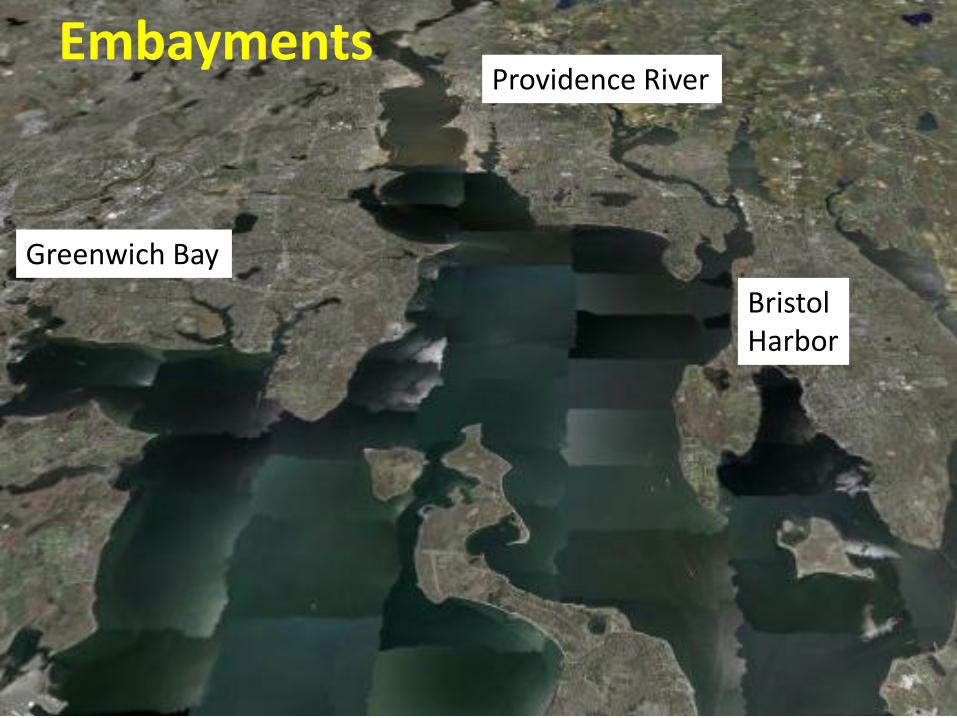
Embayments
Greenwich Bay
Providence River
Bristol Harbor


Intrusion Jet
Weak inflow
Weak outflow
0.1 m/s x 1000 m x 20 m = 4000 CMS 2.5 days x 3600 s/hr x 24 hr/d = 216000 seconds 864 million cubic meters of water per major intrusion Bay Volume: 2.7 billion cubic meters 30% of Bay’s volume per event…..what’s in this water?
COLD, SALTY

Just for events. Steady flow is also carrying RIS DIN Concentrated over short period (days), during summer conditions

1st: Providence River
Models & data from Edgewood Shoals region.

Hydrodynamics: The 3 Legged Stool WHY?
Lab Models. +continuous fluid, - not all processes
Numerical Models - approximations, grid size issues - turbulence parameterized
Data: Sampling gaps…
Data:
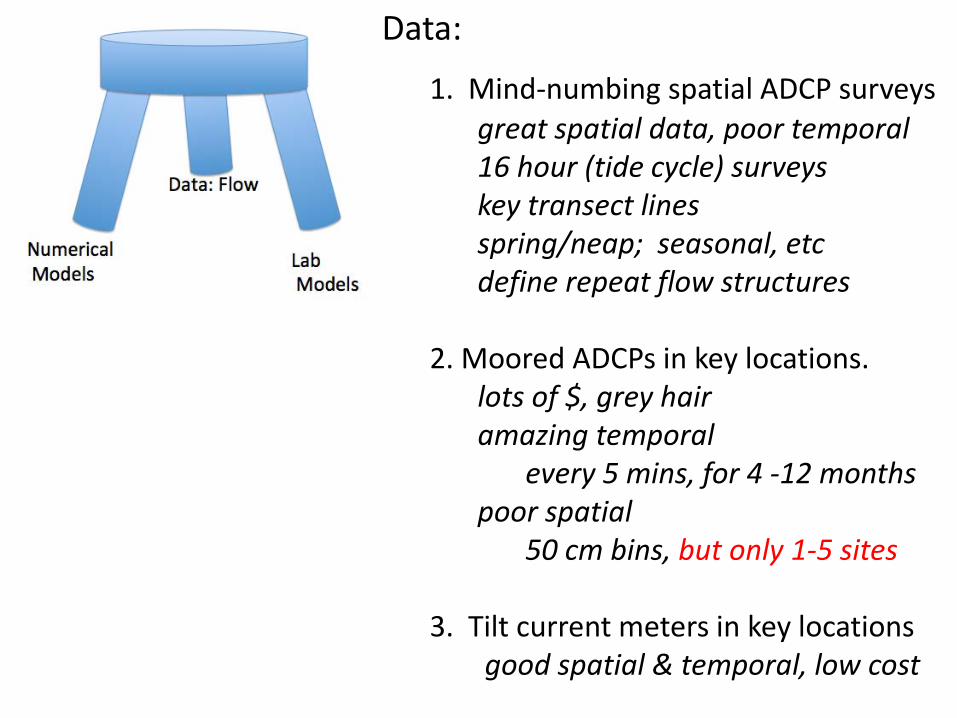
1. Mind-numbing spatial ADCP surveys great spatial data, poor temporal 16 hour (tide cycle) surveys key transect lines spring/neap; seasonal, etc define repeat flow structures 2. Moored ADCPs in key locations. lots of $, grey hair amazing temporal every 5 mins, for 4 -12 months poor spatial 50 cm bins, but only 1-5 sites 3. Tilt current meters in key locations good spatial & temporal, low cost
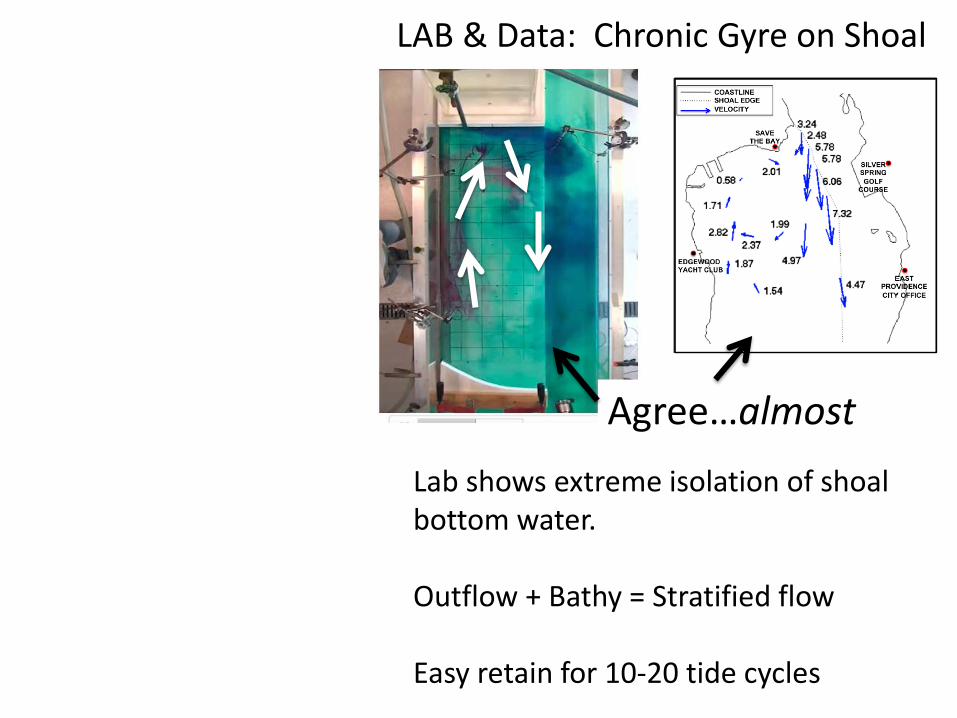
Tilt Current Meters Laboratory LAB & Data: Chronic Gyre on Shoal
Lab shows extreme isolation of shoal bottom water. Outflow + Bathy = Stratified flow Easy retain for 10-20 tide cycles
Agree…almost
RIS-ROMS (Rogers, 2008)
NB-ROMS & SNB-ROMS*
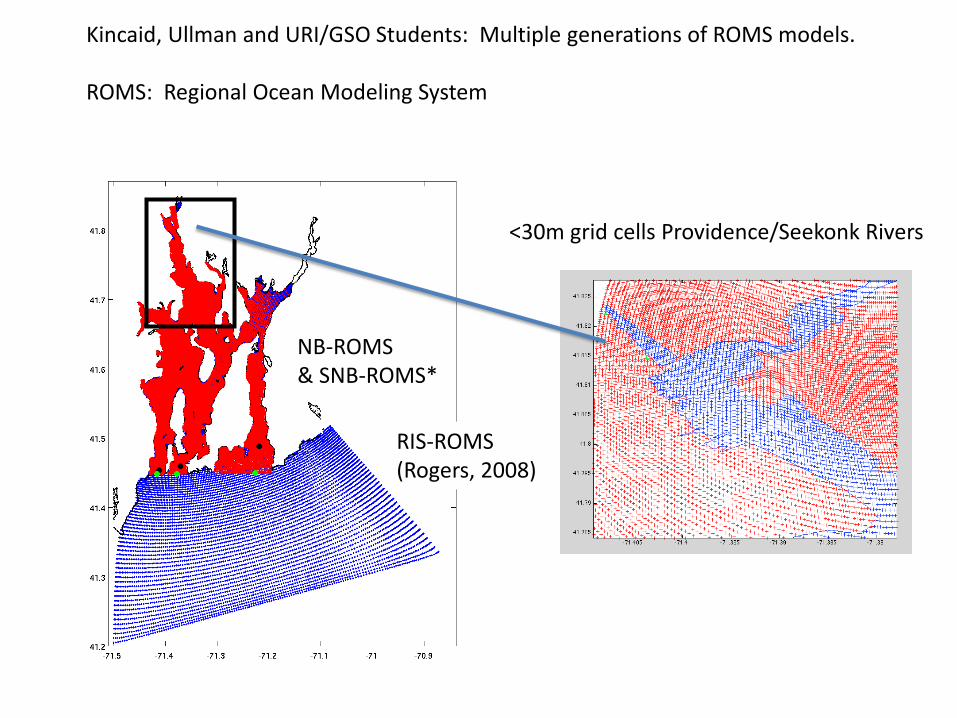
Kincaid, Ullman and URI/GSO Students: Multiple generations of ROMS models. ROMS: Regional Ocean Modeling System
<30m grid cells Providence/Seekonk Rivers

Modeling Embayment Retention: Floats & Passive dyes 2010 Summer ROMS Simulation, flushing of numerical “floats”
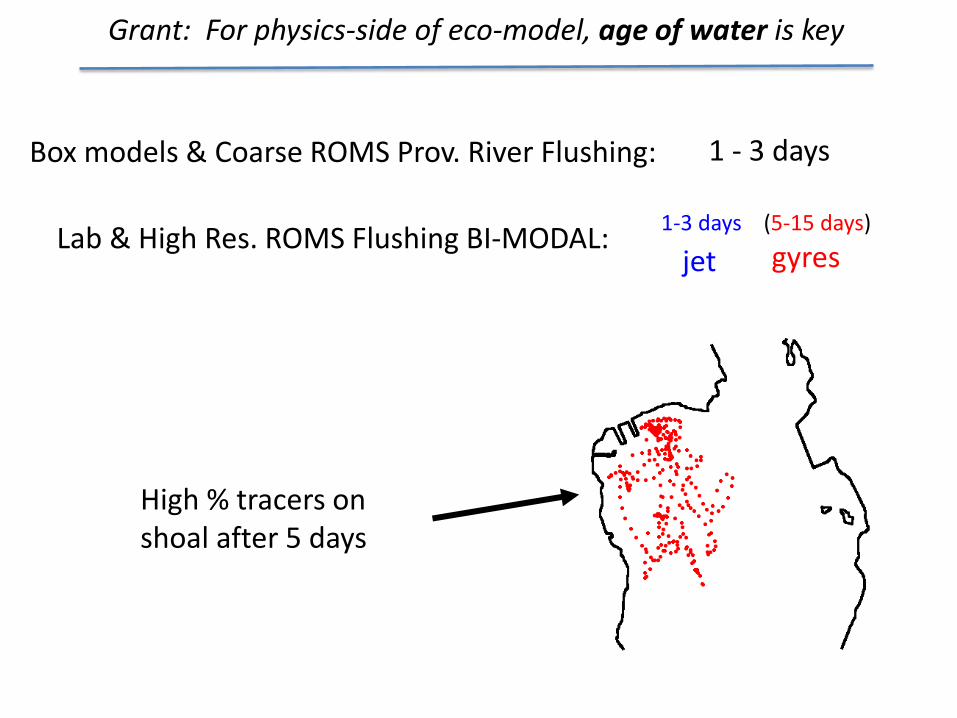
High % tracers on shoal after 5 days
Box models & Coarse ROMS Prov. River Flushing:
Lab & High Res. ROMS Flushing BI-MODAL:
1 - 3 days
1-3 days (5-15 days) gyres
Grant: For physics-side of eco-model, age of water is key
jet
Bristol Harbor
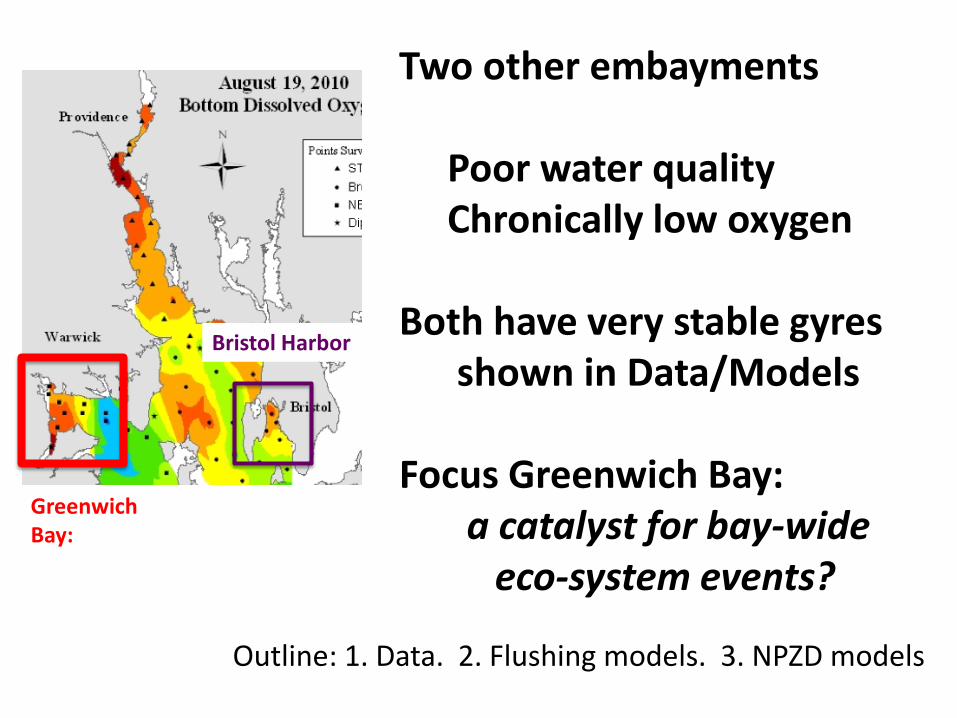
Two other embayments Poor water quality Chronically low oxygen Both have very stable gyres shown in Data/Models Focus Greenwich Bay: a catalyst for bay-wide eco-system events?
Greenwich Bay:
Outline: 1. Data. 2. Flushing models. 3. NPZD models
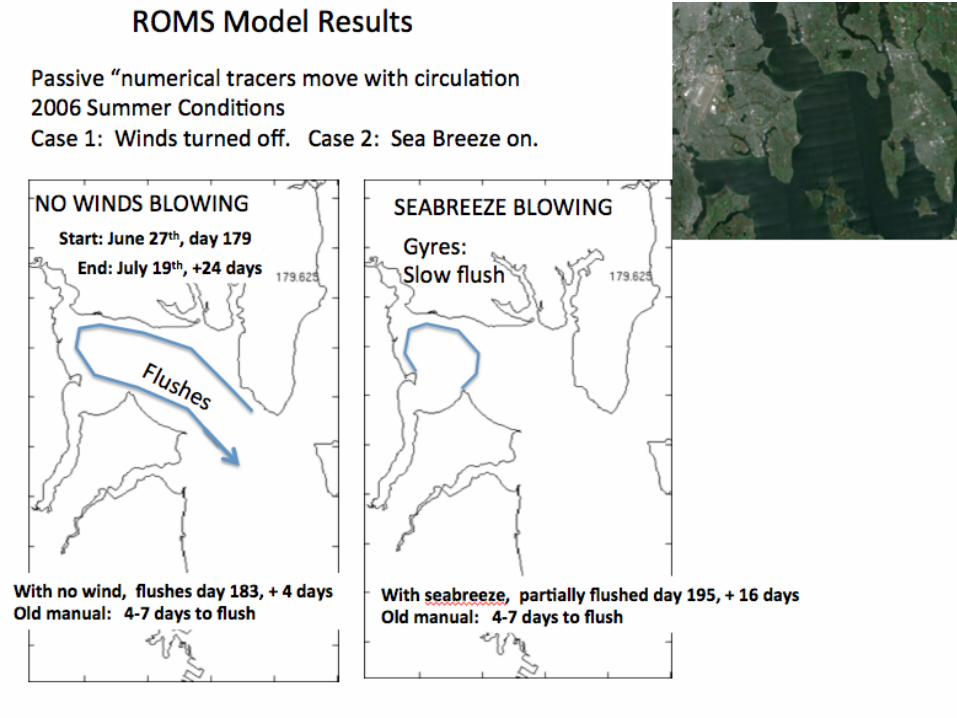
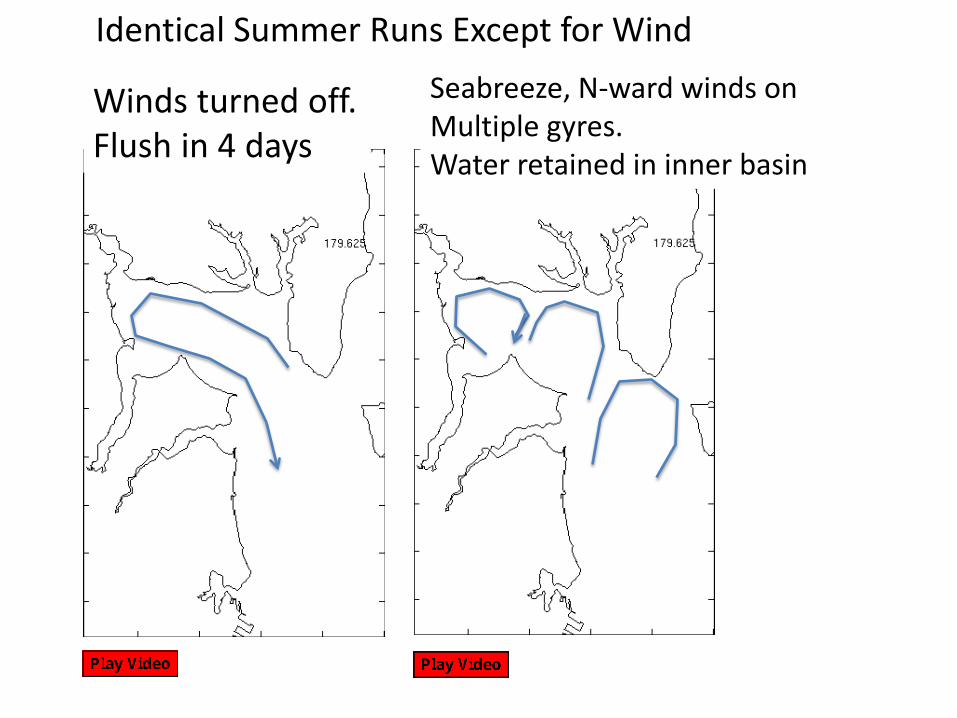
Winds turned off. Flush in 4 days
Seabreeze, N-ward winds on Multiple gyres. Water retained in inner basin
Identical Summer Runs Except for Wind
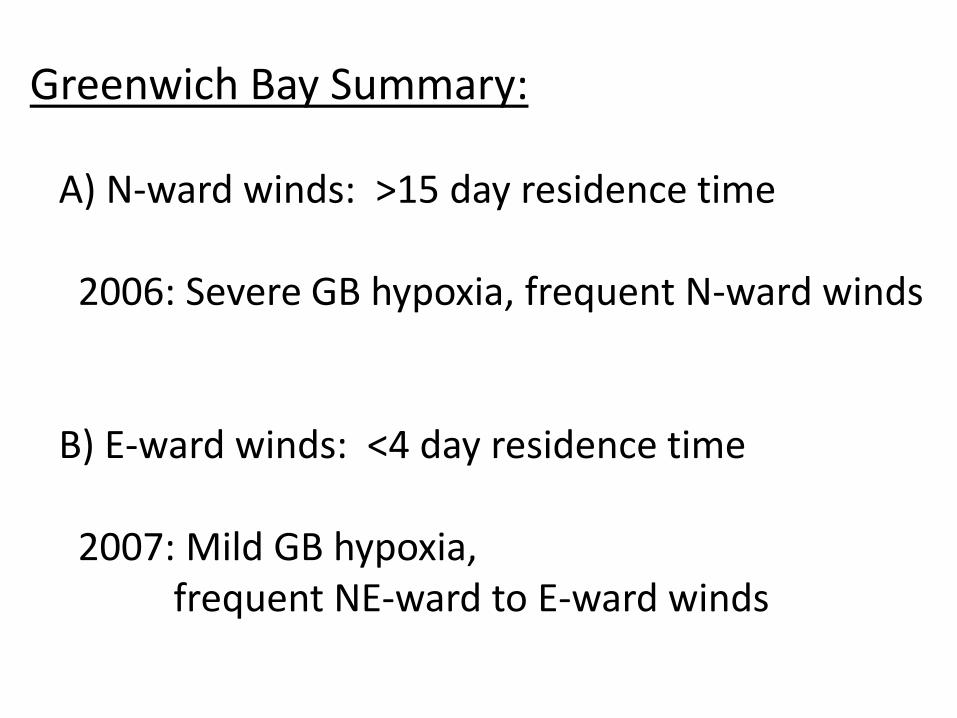
Greenwich Bay Summary: A) N-ward winds: >15 day residence time 2006: Severe GB hypoxia, frequent N-ward winds B) E-ward winds: <4 day residence time 2007: Mild GB hypoxia, frequent NE-ward to E-ward winds

Student K. Rosa: Combining buoy data, flow data & ROMS (w/ NPZD)
Role of embayments in ecosystem processes.
Northward bio-chemical fluxes & bloom dynamics
Available flow data: 4 months Summer 2012
Summer 2012 Chlorophyll Buoy Data

1. Edgewood Shoal
2. Greenwich Bay
3. Bristol Harbor
Prime areas of chronic low oxygen have retention gyres: Based on Data & Models

Stage 1: GB start (spill to mid-Bay) Stage 2: Mid-bay bloom (spill northward) Stage 3: Bloom progresses rapidly northward
Surface Phytoplankton Contours
Day 145: May 25, 2010
C
once
ntra
tion
(mill
igra
ms
/ lite
r)
Convert all dyes to total nitrogen:
1. Which Nitrogen sources most important in hypoxic areas? 2. Impact of WWTF nitrogen reductions (if conservative)?
10 mg/l
0 mg/l
Fields Pt WWTF Release Scenarios (10, 7, 5, 3, 0 mg/l)

Greenwich Bay: Idealized wind: Dye residence times
SE-ward Wind
N-ward Wind

Kincaid: ROMS Models for Narragansett Bay 1st: General circulation / transport CCW flow through Bay (up the East / Out the West) Defining retention zones / circulation gyres 2nd: Hydrodynamics & Chemical transport patterns. Forensic Oceanography: Track distinct river & WWTF chemical sources Northern sources alternate West vs East Passage flush Southern sources wrap to north……. Taunton River into CCW flow (to N. Prudence, Prov. River, Greenwich Bay) Pawtuxet River onto Edgewood and into Seekonk East Prov WWTF northward vs. Fields Pt. southward 3rd: ROMS NPZD Hydrodynamics & Ecology/Biology at ~50m horizontal scales. physics and eco-parameters at 10 second time steps
Today
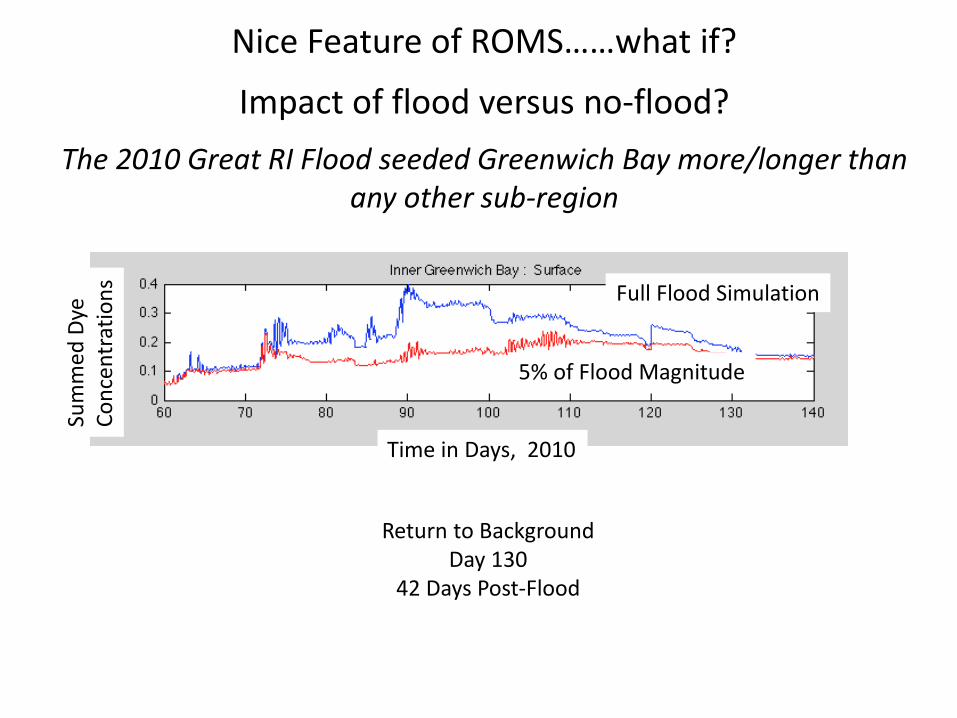
Nice Feature of ROMS……what if?
Impact of flood versus no-flood?
The 2010 Great RI Flood seeded Greenwich Bay more/longer than any other sub-region
Full Flood Simulation
5% of Flood Magnitude
Return to Background Day 130
42 Days Post-Flood
Time in Days, 2010
Sum
med
Dye
Co
ncen
trat
ions
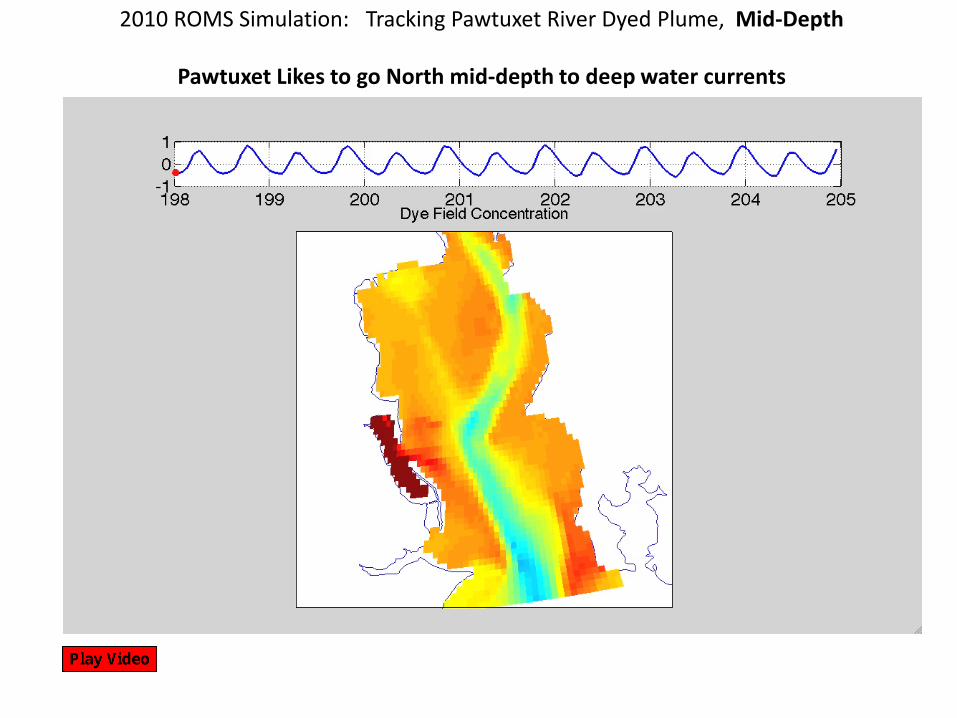
2010 ROMS Simulation: Tracking Pawtuxet River Dyed Plume, Mid-Depth
Pawtuxet Likes to go North mid-depth to deep water currents
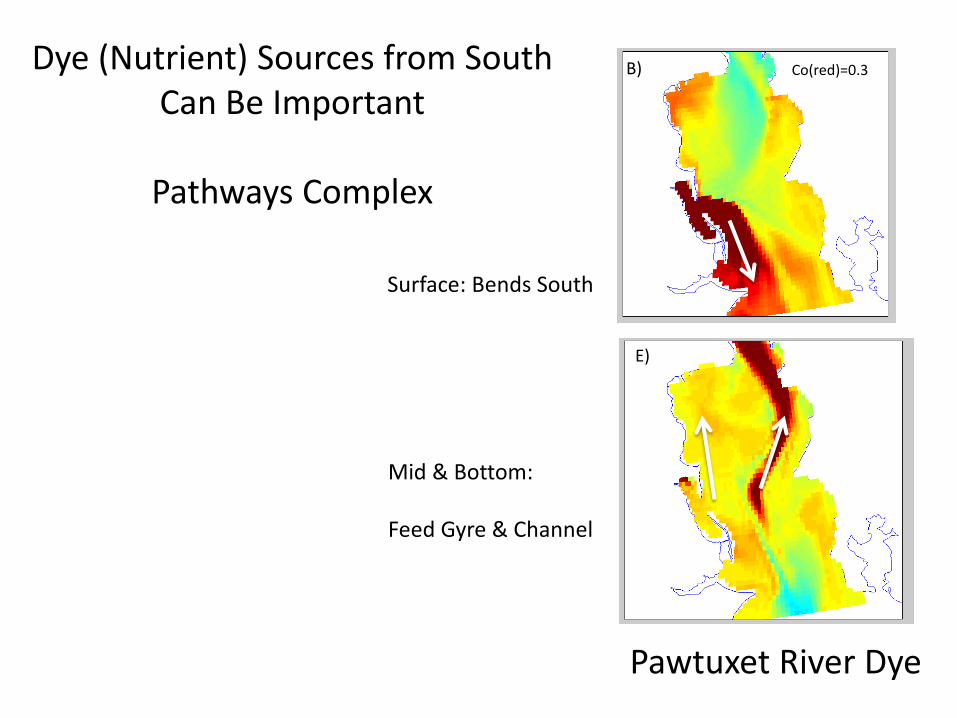
Co(red)=0.3
Pawtuxet River Dye
B)
E)
Surface: Bends South
Mid & Bottom: Feed Gyre & Channel
Dye (Nutrient) Sources from South Can Be Important
Pathways Complex
FULLBAY ROMS
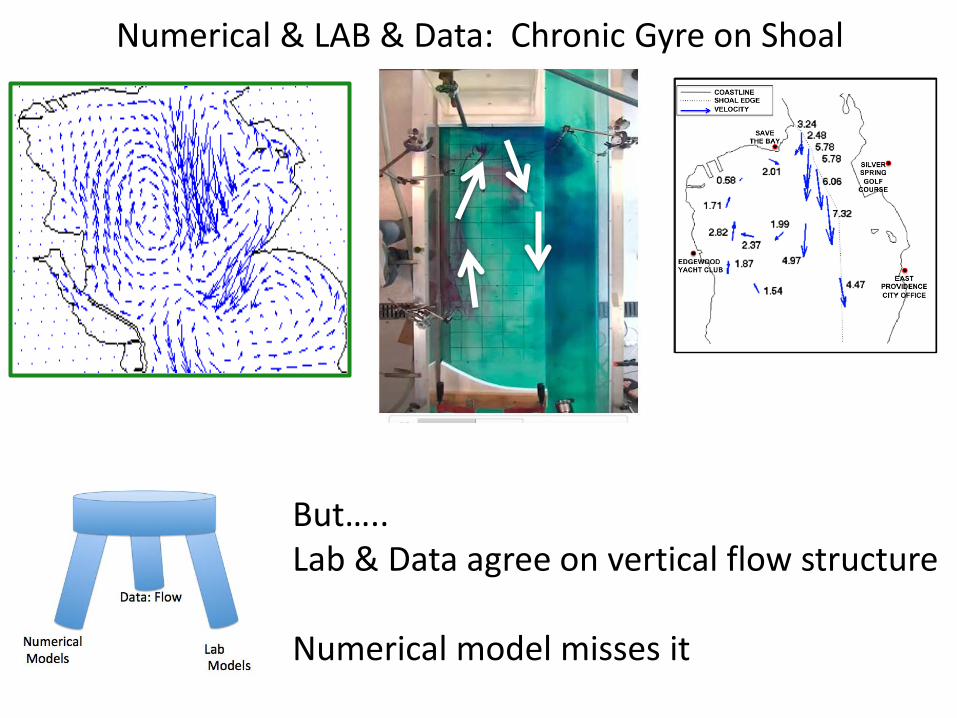
Tilt Current Meters Laboratory Numerical & LAB & Data: Chronic Gyre on Shoal
But….. Lab & Data agree on vertical flow structure Numerical model misses it

AN OUTSIDE-THE-BOX VIEW OF CIRCULATION IN THE NARRAGANSETT BAY SYSTEM: INSPIRATION FROM SCOTT
Chris Kincaid, Dave Ullman & Rob Pockalny (Graduate School of Oceanography, URI) Many Years of Excellent Students: Deanna Bergondo William Deleo Christelle Balt Anna Pfeiffer-Herbert Justin Rogers Kurt Rosenberger
CHARACTERIZING THE INFLUENCE OF THE GREAT 2010 FLOOD ON CIRCULATION, FLUSHING AND CHEMICAL TRANSPORT IN NARRAGANSETT BAY
Great Funding Support
ROMS Developments for Narragansett Bay Numerical models provide approximate solutions (keys to succes: mixing parameterizations, grid size, etc) The 3-legged hydrodynamics stool

Tilt Current Meters Laboratory Data + Lab + ROMS: Amazingly Stable Gyre on Shoal coincides with region of chronically low oxygen
Edgewood + Sabin + Gaspee Stagnation Zones significant volume of Providence River
Data: Gyre persistent ~5 million data points !!!! 3 mo. moored ADCPs 12 full tide cycle ADCP surveys 3 x 3 mo., 18 TCMs/ exp.
Can we break them?
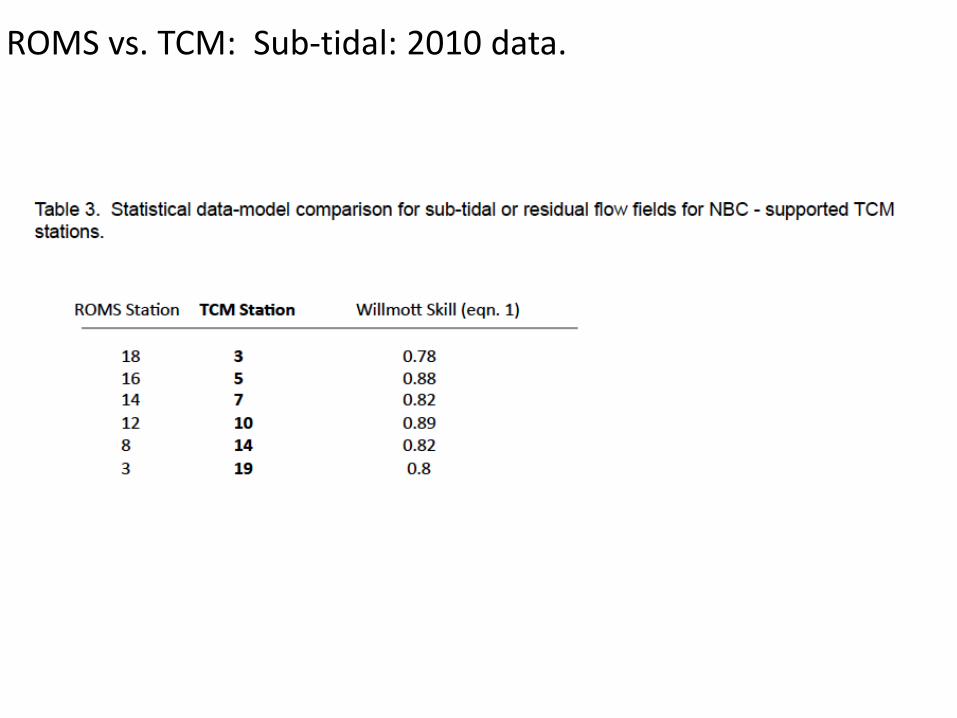
ROMS vs. TCM: Sub-tidal: 2010 data.
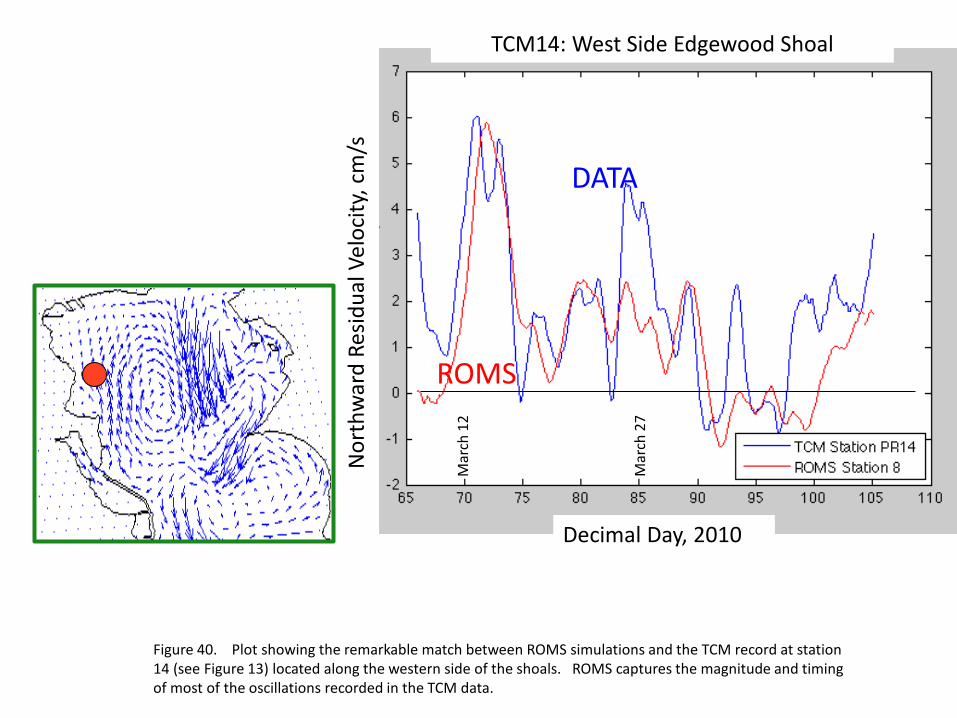
TCM14: West Side Edgewood Shoal
Decimal Day, 2010
Nor
thw
ard
Resid
ual V
eloc
ity, c
m/s
Mar
ch 1
2
Mar
ch 2
7 Figure 40. Plot showing the remarkable match between ROMS simulations and the TCM record at station 14 (see Figure 13) located along the western side of the shoals. ROMS captures the magnitude and timing of most of the oscillations recorded in the TCM data.
ROMS
DATA
Related Documents


![NBC Wastewater Treatment Plant Updates [Read-Only]snapshot.narrabay.com/Services/MossFile.ashx?file...media in IFASzone ... Microsoft PowerPoint - NBC Wastewater Treatment Plant Updates](https://static.cupdf.com/doc/110x72/6017ed603a314e2e145437e8/nbc-wastewater-treatment-plant-updates-read-only-media-in-ifaszone-microsoft.jpg)