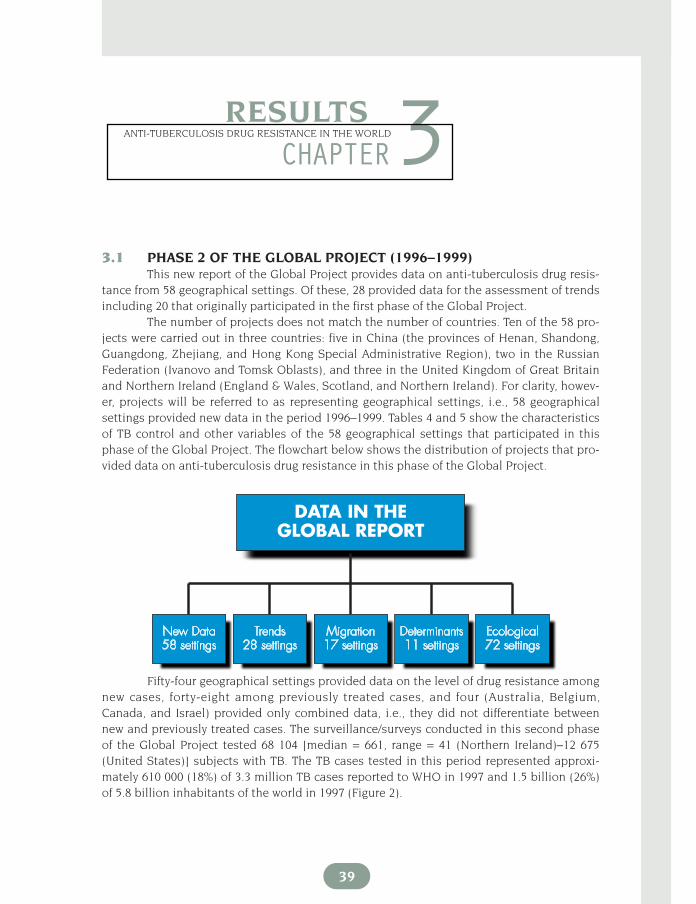
CHAPTER RESULTS ANTI-TUBERCULOSIS DRUG RESISTANCE IN THE WORLD 39 3.1 PHASE 2 OF THE GLOBAL PROJECT (1996–1999) This new report of the Global Project provides data on anti-tuberculosis drug resis- tance from 58 geographical settings. Of these, 28 provided data for the assessment of trends including 20 that originally participated in the first phase of the Global Project. The number of projects does not match the number of countries. Ten of the 58 pro- jects were carried out in three countries: five in China (the provinces of Henan, Shandong, Guangdong, Zhejiang, and Hong Kong Special Administrative Region), two in the Russian Federation (Ivanovo and Tomsk Oblasts), and three in the United Kingdom of Great Britain and Northern Ireland (England & Wales, Scotland, and Northern Ireland). For clarity, howev- er, projects will be referred to as representing geographical settings, i.e., 58 geographical settings provided new data in the period 1996–1999. Tables 4 and 5 show the characteristics of TB control and other variables of the 58 geographical settings that participated in this phase of the Global Project. The flowchart below shows the distribution of projects that pro- vided data on anti-tuberculosis drug resistance in this phase of the Global Project. Fifty-four geographical settings provided data on the level of drug resistance among new cases, forty-eight among previously treated cases, and four (Australia, Belgium, Canada, and Israel) provided only combined data, i.e., they did not differentiate between new and previously treated cases. The surveillance/surveys conducted in this second phase of the Global Project tested 68 104 [median = 661, range = 41 (Northern Ireland)–12 675 (United States)] subjects with TB. The TB cases tested in this period represented approxi- mately 610 000 (18%) of 3.3 million TB cases reported to WHO in 1997 and 1.5 billion (26%) of 5.8 billion inhabitants of the world in 1997 (Figure 2). 3

Welcome message from author
This document is posted to help you gain knowledge. Please leave a comment to let me know what you think about it! Share it to your friends and learn new things together.
Transcript
CHAPTERRESULTS
ANTI-TUBERCULOSIS DRUG RESISTANCE IN THE WORLD
39
3.1 PHASE 2 OF THE GLOBAL PROJECT (1996–1999)This new report of the Global Project provides data on anti-tuberculosis drug resis-
tance from 58 geographical settings. Of these, 28 provided data for the assessment of trendsincluding 20 that originally participated in the first phase of the Global Project.
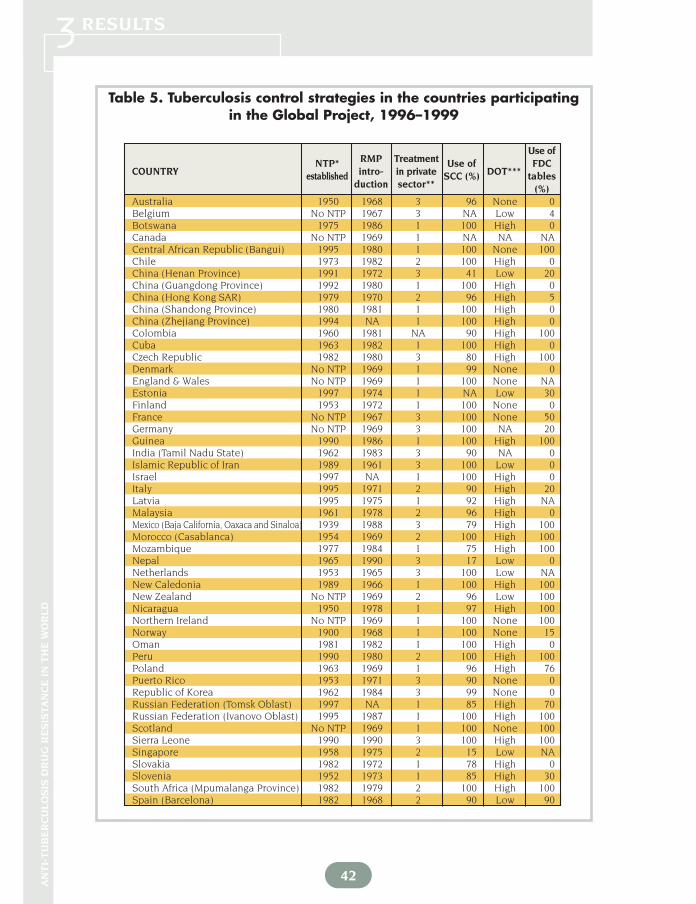
The number of projects does not match the number of countries. Ten of the 58 pro-jects were carried out in three countries: five in China (the provinces of Henan, Shandong,Guangdong, Zhejiang, and Hong Kong Special Administrative Region), two in the RussianFederation (Ivanovo and Tomsk Oblasts), and three in the United Kingdom of Great Britainand Northern Ireland (England & Wales, Scotland, and Northern Ireland). For clarity, howev-er, projects will be referred to as representing geographical settings, i.e., 58 geographicalsettings provided new data in the period 1996–1999. Tables 4 and 5 show the characteristicsof TB control and other variables of the 58 geographical settings that participated in thisphase of the Global Project. The flowchart below shows the distribution of projects that pro-vided data on anti-tuberculosis drug resistance in this phase of the Global Project.
Fifty-four geographical settings provided data on the level of drug resistance amongnew cases, forty-eight among previously treated cases, and four (Australia, Belgium,Canada, and Israel) provided only combined data, i.e., they did not differentiate betweennew and previously treated cases. The surveillance/surveys conducted in this second phaseof the Global Project tested 68 104 [median = 661, range = 41 (Northern Ireland)–12 675(United States)] subjects with TB. The TB cases tested in this period represented approxi-mately 610 000 (18%) of 3.3 million TB cases reported to WHO in 1997 and 1.5 billion (26%)of 5.8 billion inhabitants of the world in 1997 (Figure 2).
3

40
RE
SU
LTS
ANTI-TUBERCULOSIS DRUG RESISTANCE IN THE WORLD 3Table 4. Tuberculosis indicators in countries participating in the Global Project, 1996–1999*
COUNTRY
WHO region Country/region Estimated cases Notification Estimated smear Smear positive WHO TB Estimated TB/HIV co-infection Treatmentpopulation(*’000) on country/region rate all cases positive rate notification rate control rate and % of TB cases HIV+ success (%)
(per 100 000) (per 100 000) (per 100 000) (per 100 000) strategy Co-infection rate TB cases(100 000) HIV+(%)
Australia Western Pacific 18 310 8.0 5.4 3.6 1.1 5 4.0 1 NABelgium Europe 10 170 16.0 12.7 7.2 4.3 1 10.0 4 80.0Botswana Africa 1 487 503.0 455.7 226.4 180.0 4 4781.0 50 70.3Canada the Americas 30 008 7.0 6.6 3.1 1.7 5 10.0 2 NACentral African Rep. (Bangui) Africa 620 237 139.9 91.3 75.7 1 2119.0 48.5 65.0Chile the Americas 14 622 29.0 26.5 13.0 10.2 4 21.0 1 80.0China (Henan Province) Western Pacific 92 000 100.0 34.4 45.0 10.2 2 12.0 0 91.0China (Guangdong Province) Western Pacific 70 137 52.0 52.3 23.5 37.4 4 12.0 0 94.3China (Hong Kong SAR) Western Pacific 6 311 103.0 105.0 41.0 33.6 1 18.0 0 89.0China (Shandong Province) Western Pacific 88 100 90.0 28.7 40.5 14.8 4 12.0 0 94.3China (Zhejiang Province) Western Pacific 44 223 43.0 42.5 19.1 12.3 2 12.0 0 90.0Colombia the Americas 40 773 55.0 21.1 24.5 16.9 2 47.0 2 NACuba the Americas 11 036 18.0 11.1 7.9 6.7 4 1.0 0 91.0Czech Republic Europe 10 295 20.0 17.4 8.9 5.3 4 3.0 1 90.0Denmark Europe 5 295 11.0 10.1 4.9 2.6 1 8.0 1 81.0England & Wales** Europe 52 211 11.3 11.2 7.6 7.6 1 6.0 2 NAEstonia Europe 1 454 50.0 56.4 22.6 20.8 1 1.0 0 62.0Finland Europe 5 100 13.0 11.1 5.5 3.6 1 1.0 0.5 NAFrance Europe 56 000 19.0 11.5 8.2 4.3 1 2.0 13 NAGermany Europe 82 200 15.0 12.7 6.5 3.8 1 6.0 2 NAGuinea Africa 7 165 171.0 56.8 75.4 46.9 4 340.0 10 77.0India (Tamil Nadu State) South East Asia 61 753 400.0 200.0 85.0 43.0 2 188.0 4.4 45.0Islamic Republic of Iran Eastern Mediterranean 60 776 55.0 17.7 24.8 8.6 3 0.0 0 87.0Israel Europe 5 900 8.0 10.8 3.6 4.4 4 4.0 1 91.4Italy Europe 57 241 10.0 8.5 4.4 3.3 3 19.0 8 83.0Latvia Europe 2 458 82.0 88.7 37.1 27.2 4 1.0 0 70.2Malaysia Western Pacific 16 500 112.0 64.4 50.1 46.1 4 108.0 2 83.6Mexico (Baja California, Oaxaca and Sinaloa) the Americas 94 732 40.0 25.0 17.8 17.2 2 31.0 3 76.0Morocco (Casablanca) Eastern Mediterranean 3 297 122.0 152.5 54.7 65.6 4 8.0 2 90.0Mozambique Africa 16 917 254.0 100.0 106.6 71.6 3 2303.0 30 67.0Nepal South East Asia 22 847 211.0 105.6 94.8 49.5 3 51.0 1 79.6Netherlands Europe 15 494 10.0 10.8 4.4 2.3 4 11.0 13 82.0New Caledonia Western Pacific 200 89.0 111.0 40.0 24.5 4 0.0 0 83.0New Zealand Western Pacific 3 618 5.0 9.0 2.0 1.6 5 2.0 0 90.0Nicaragua the Americas 4 421 95.0 64.5 42.7 37.8 4 32.0 1 80.0Northern Ireland Europe 1 663 3.8 3.2 1.7 1.0 1 6.0 2 95.0

COUNTRY
WHO region Country/region Estimated cases Notification Estimated smear Smear positive WHO TB Estimated TB/HIV co-infection Treatmentpopulation(*’000) on country/region rate all cases positive rate notification rate control rate and % of TB cases HIV+ success (%)
(per 100 000) (per 100 000) (per 100 000) (per 100 000) strategy Co-infection rate TB cases(100 000) HIV+(%)
41
ANTI-TUBERCULOSIS DRUG RESISTANCE IN THE WORLD
RE
SU
LTS3
Norway Europe 4 381 6.0 5.0 2.6 2.4 4 4.0 1 84.0Oman Eastern Mediterranean 2 287 13.0 12.6 6.0 4.8 4 3.0 2 89.5Peru the Americas 25 232 265.0 141.5 118.7 97.2 4 131.0 2 93.0Poland Europe 38 649 45.0 36.1 20.2 9.0 1 5.0 0 88.0Puerto Rico the Americas 3 807 10.0 6.8 4.1 3.3 4 76.0 50 70.0Republic of Korea Western Pacific 46 430 87.0 94.0 38.9 22.3 4 2.0 1 82.0Russian Federation (Tomsk Oblast) Europe 955 106.0 75.2 47.7 36.0 3 5.0 1 78.1Russian Federation (Ivanovo Oblast) Europe 1 271 52.0 47.7 23.4 15.2 4 5.0 1 56.7Scotland Europe 5 214 8.3 8.3 6.4 6.4 1 6.0 2 NASierra Leone Africa 4 600 315.0 76.6 138.5 49.9 3 517.0 10 78.0Singapore Western Pacific 3 044 48.0 64.1 21.7 17.0 3 24.0 1 83.0Slovakia Europe 5 383 35.0 24.3 15.6 7.4 4 0.0 0 85.0Slovenia Europe 1 987 30.0 25.0 13.5 7.9 4 1.0 1 89.0South Africa (Mpumalanga Prov.) Africa 3 020 208.0 120.0 158.6 99.0 3 2540.0 45 78.3Spain (Barcelona) Europe 1 509 49.0 48.5 18.5 18.5 3 48.0 20 75.0Sweden Europe 8 844 5.0 5.2 2.2 1.2 5 4.0 0 86.0Switzerland Europe 7 114 11.0 10.5 4.8 2.4 1 21.0 25 79.0Thailand South East Asia 59 460 142.0 51.2 62.6 22.2 2 561.0 10 74.0Uganda (GLRA supported zones)*** Africa 9 920 320.0 87.0 127.8 54.5 4 1532.0 50 61.0United States of America the Americas 267 636 7.0 7.4 2.9 2.6 4 21.0 20 91.2Uruguay the Americas 3 170 31.0 22.0 13.8 13.3 4 32.0 2 86.0Venezuela the Americas 23 242 42.0 26.3 18.9 14.8 4 88.0 3 80.2
... continued
* Estimates shown are those of WHO (JAMA 1999; 282:677–686) available upon request. Estimates for administrative sub-units are based on the assessment of local authorities. For Uganda, Morocco, Mexico, and the Central African Republic estimates are country-wide.
** For England & Wales smear positive notification includes smear+ and smear– ***Geman Leprosy Relief AssociationNA = not available
42
RESULTSA
NT
I-T
UB
ER
CU
LO
SIS
DR
UG
RE
SIS
TA
NC
E I
N T
HE
WO
RLD
3
RMP TreatmentUse of
COUNTRYNTP*
intro- in privateUse of
DOT***FDC
establishedduction sector**
SCC (%) tables(%)
Table 5. Tuberculosis control strategies in the countries participating in the Global Project, 1996–1999
Australia 1950 1968 3 96 None 0Belgium No NTP 1967 3 NA Low 4Botswana 1975 1986 1 100 High 0Canada No NTP 1969 1 NA NA NACentral African Republic (Bangui) 1995 1980 1 100 None 100Chile 1973 1982 2 100 High 0China (Henan Province) 1991 1972 3 41 Low 20China (Guangdong Province) 1992 1980 1 100 High 0China (Hong Kong SAR) 1979 1970 2 96 High 5China (Shandong Province) 1980 1981 1 100 High 0China (Zhejiang Province) 1994 NA 1 100 High 0Colombia 1960 1981 NA 90 High 100Cuba 1963 1982 1 100 High 0Czech Republic 1982 1980 3 80 High 100Denmark No NTP 1969 1 99 None 0England & Wales No NTP 1969 1 100 None NAEstonia 1997 1974 1 NA Low 30Finland 1953 1972 1 100 None 0France No NTP 1967 3 100 None 50Germany No NTP 1969 3 100 NA 20Guinea 1990 1986 1 100 High 100India (Tamil Nadu State) 1962 1983 3 90 NA 0Islamic Republic of Iran 1989 1961 3 100 Low 0Israel 1997 NA 1 100 High 0Italy 1995 1971 2 90 High 20Latvia 1995 1975 1 92 High NAMalaysia 1961 1978 2 96 High 0Mexico (Baja California, Oaxaca and Sinaloa) 1939 1988 3 79 High 100Morocco (Casablanca) 1954 1969 2 100 High 100Mozambique 1977 1984 1 75 High 100Nepal 1965 1990 3 17 Low 0Netherlands 1953 1965 3 100 Low NANew Caledonia 1989 1966 1 100 High 100New Zealand No NTP 1969 2 96 Low 100Nicaragua 1950 1978 1 97 High 100Northern Ireland No NTP 1969 1 100 None 100Norway 1900 1968 1 100 None 15Oman 1981 1982 1 100 High 0Peru 1990 1980 2 100 High 100Poland 1963 1969 1 96 High 76Puerto Rico 1953 1971 3 90 None 0Republic of Korea 1962 1984 3 99 None 0Russian Federation (Tomsk Oblast) 1997 NA 1 85 High 70Russian Federation (Ivanovo Oblast) 1995 1987 1 100 High 100Scotland No NTP 1969 1 100 None 100Sierra Leone 1990 1990 3 100 High 100Singapore 1958 1975 2 15 Low NASlovakia 1982 1972 1 78 High 0Slovenia 1952 1973 1 85 High 30South Africa (Mpumalanga Province) 1982 1979 2 100 High 100Spain (Barcelona) 1982 1968 2 90 Low 90

RMP TreatmentUse of
COUNTRYNTP*
intro- in privateUse of
DOT***FDC
establishedduction sector**
SCC (%) tables(%)
43 AN
TI-
TU
BE
RC
ULO
SIS
DR
UG
RE
SIS
TA
NC
E I
N T
HE
WO
RLD
RESULTS3
Fig. 2. Estimated coverage of the Global Project in its second phase, 1996–1999*
* National Tuberculosis Programme ** TB treated in the private sector: 1, virtually all treated in the public sector; 2, up to 15%
of patients treated in the private sector; 3, more than 15% treated in the private sector *** Directly observed therapy**** German Leprosy Relief AssociationNA = Not available
* Coverage was estimated by using population figures and notified TB incidence in 1997. For administrative units (state, province, oblast) surveyed within large countries, denominators included population and TB incidence of such units
... continued
WORLD COUNTRIES(n=212 countries)
WORLD’S POPULATION(n=5 850 million people)
WORLD’S TB BURDEN(n=3.4 million cases)
76% 82%74%
24% 18%26%
Sweden No NTP 1970 1 NA None 0Switzerland No NTP 1967 3 60 Low 90Thailand 1966 1985 2 100 None 20Uganda (GLRA supported zones)**** 1990 1990 1 100 High 100United States of America 1953 1971 3 95 Low NAUruguay 1980 1970 2 100 High 0Venezuela 1936 1982 2 100 High 100

Botswana 1998 638 93.7 6.3 5.3 .8 .2 .0 .9 .5Central African Rep. (Bangui) 1999 464 83.6 16.4 10.8 3.7 1.7 .2 5.6 1.1Chile 1997 732 90.7 9.0 6.3 2.6 .1 .0 2.7 .4China (Henan Province) 1996 646 65.0 35.0 13.3 10.2 7.3 4.2 21.7 10.8China (Guangdong Province) 1999 461 87.0 13.0 8.0 2.8 1.1 1.1 5.0 2.8China (Hong Kong SAR*) 1996 4 424 87.8 12.2 8.5 2.6 .9 .3 3.8 1.4China (Shandong Province) 1997 1 009 82.4 17.6 9.8 5.3 1.7 .9 7.8 2.9China (Zhejiang Province) 1999 802 85.2 14.8 8.4 3.1 2.2 1.1 6.5 4.5Colombia 1999 201 86.6 13.4 8.0 5.0 .5 .0 5.5 .5Cuba 1998 284 95.4 4.6 4.2 .4 .0 .0 .4 .0Czech Republic 1999 311 96.5 3.5 1.3 .6 .3 1.3 2.3 1.6Denmark 1998 412 86.9 13.1 8.7 3.9 .5 .0 4.4 .5England & Wales 1997 3 053 92.8 7.2 5.0 1.7 .3 .3 2.2 .8Estonia 1998 377 63.1 36.9 13.5 8.2 6.6 8.5 23.3 14.1Finland 1997 410 95.6 4.9 4.4 .5 .0 .0 .5 .0France 1997 787 90.7 9.3 8.0 1.3 .0 .0 1.3 .0Germany 1998 1 455 91.1 8.9 6.1 1.8 .5 .5 2.7 .9
OVERALL RESISTANCE TO:POLY-
RESISTANCECOUNTRY
Year PatientsSuscept. Resist. 1 Drug 2 Drugs 3 Drugs 4 Drugs Any MDRtested
44
RESULTSA
NT
I-T
UB
ER
CU
LO
SIS
DR
UG
RE
SIS
TA
NC
E I
N T
HE
WO
RLD
33.1.1 Drug resistance among new cases of tuberculosis
Of the 58 geographical settings, 54 provided data for new cases of TB (Tables 6 and7, Figure 3). Of these, resistance to any drug was highest in Estonia (36.9%), followed by theprovince of Henan (China) (35%), Ivanovo Oblast (Russian Federation) (32.4%), and Latvia(29.9%). The lowest levels were observed in Uruguay (1.7%), New Caledonia (2.2%), Slovakia(2.7%), and Switzerland (3.1%). The median prevalence in this second phase of the GlobalProject was 10.7% (range: 1.7%–36.9%).*
The median prevalence of MDR-TB was 1% (range: 0%–14.1%).** The highest preva-lence observed (Table 6) was in Estonia (14.1%), followed by Henan Province (China)(10.8%), Latvia (9%), Ivanovo Oblast (9%) and Tomsk Oblast (6.5%) in the RussianFederation, and the Islamic Republic of Iran (5%). No MDR-TB was reported in Cuba,Finland, France, New Caledonia, Northern Ireland, Switzerland, Uruguay, and Venezuela.Nine (17%) geographical settings had levels of MDR-TB among new cases > 3%. Table 6 alsoshows the prevalence of drug resistance according to the number of drugs. Single drug re-sistance ranged from 1.3% in the Czech Republic to 17.9% in Sierra Leone. Resistance to allthe four drugs tested ranged from 0% in 24 geographical settings to 8.5% in Estonia.
Table 7 shows the prevalence of drug resistance according to specific drugs. HenanProvince (China), Estonia, Latvia, Ivanovo Oblast (Russian Federation), Tomsk Oblast (RussianFederation), Tamil Nadu State (India) and Mozambique, all had prevalences > 15% of any INH re-sistance. Prevalences of any RMP resistance > 4% were found in Henan Province (China), Estonia,Latvia, Ivanovo Oblast (Russian Federation), Tomsk Oblast (Russian Federation), the IslamicRepublic of Iran, Zhejiang Province (China), Thailand, Mozambique, and Tamil Nadu State (India).
* Median prevalence for any drug resistance among new cases in the 35 settings surveyed in the first phase of the Global Project was 9.9%** Median prevalence of MDR-TB among new cases in the 35 settings surveyed in the first phase of the Global Project was 1.4%
Table 6. Prevalence of drug resistance among new TB cases, by country/geographical setting, 1996–1999

Guinea 1998 539 85.3 14.7 9.8 4.3 .6 .0 4.8 .6India (Tamil Nadu State) 1997 384 81.3 18.8 10.4 3.6 2.9 1.8 8.3 3.4Islamic Republic of Iran 1998 666 84.1 15.9 8.1 3.9 1.2 2.7 7.8 5.0Italy 1999 683 87.7 12.3 9.5 2.2 .6 .0 2.8 1.2Latvia 1998 789 70.1 29.9 9.0 11.9 5.2 3.8 20.9 9.0Malaysia 1997 1 001 95.2 4.8 4.2 .5 .0 .1 .6 .1Mexico (Baja California, Oaxaca and Sinaloa) 1997 334 85.9 14.1 10.5 1.5 .9 1.2 3.6 2.4Morocco (Casablanca) 1998 510 91.4 8.6 3.5 3.9 1.2 .0 5.1 2.2Mozambique 1999 1 028 79.3 20.8 12.2 5.8 2.3 .5 8.7 3.5Nepal 1999 104 94.2 5.8 4.8 .0 1.0 .0 1.0 1.0Netherlands 1996 1 042 89.7 10.3 6.2 2.7 .2 .1 4.0 .6New Caledonia 1996 93 97.8 2.2 2.2 .0 .0 .0 .0 .0New Zealand 1997 179 88.8 11.2 8.4 2.8 .0 .0 2.8 1.1Nicaragua 1998 564 84.4 15.6 12.1 2.3 1.1 .2 3.5 1.2Northern Ireland 1997 41 95.1 4.9 4.9 .0 .0 .0 .0 .0Norway 1996 138 89.1 10.9 7.2 2.9 .7 .0 3.6 2.2Oman 1999 133 95.5 4.5 3.0 .0 .8 .8 1.5 .8Peru 1999 1 879 82.0 18.0 11.9 3.7 1.6 .8 6.1 3.0Poland 1997 2 976 96.4 3.6 2.4 .7 .5 .0 1.2 .6Puerto Rico 1997 160 88.8 11.3 6.9 2.5 .6 1.3 4.4 2.5Republic of Korea 1999 2 370 89.4 10.6 6.8 2.6 1.0 .2 3.8 2.2Russian Federation (Tomsk Oblast) 1999 417 71.0 29.0 10.6 10.6 4.1 3.8 18.5 6.5Russian Federation (Ivanovo Oblast) 1998 222 67.6 32.4 16.2 9.0 3.2 4.1 16.2 9.0Scotland 1997 299 96.3 3.7 3.0 .7 .0 .0 .7 .3Sierra Leone 1997 117 75.2 24.8 17.9 6.0 .9 .0 6.8 .9Singapore 1996 980 95.2 4.8 4.0 .5 .2 .1 .8 .3Slovakia 1998 589 97.3 2.7 2.0 .5 .2 .0 .7 .3Slovenia 1997 290 97.6 2.4 1.7 .0 .0 .7 .7 .7South Africa (Mpumalanga Province) 1997 661 92.0 8.0 5.9 1.2 .5 .5 2.1 1.5Spain (Barcelona) 1998 315 96.5 3.5 3.2 .0 .0 .3 .3 .3Sweden 1997 356 92.1 7.9 5.3 2.0 .6 .0 2.5 .6Switzerland 1997 322 96.9 3.1 3.1 .0 .0 .0 .0 .0Thailand 1997 1 137 74.5 25.5 16.8 6.3 1.5 .9 8.7 2.1Uganda (GLRA supported zones**) 1997 374 80.2 19.8 12.8 6.7 .3 .0 7.0 .5United States of America 1997 12 063 88.0 12.0 8.3 2.6 .6 .4 3.7 1.2Uruguay 1997 484 98.3 1.7 1.7 .0 .0 .0 .0 .0Venezuela 1998 221 95.9 4.1 2.7 1.4 .0 .0 1.4 .0MEDIAN 474 89.3 10.7 7.0 2.5 .6 .1 3.6 1.0minimum 41 63.1 1.7 1.3 .0 .0 .0 .0 .0maximum 12 063 98.3 36.9 17.9 11.9 7.3 8.5 23.3 14.1WEIGHTED MEAN *** 1 313.5 84.1 15.9 9.4 3.6 1.8 1.1 6.5 2.8
OVERALL RESISTANCE TO:POLY-
RESISTANCECOUNTRY
Year PatientsSuscept. Resist. 1 Drug 2 Drugs 3 Drugs 4 Drugs Any MDRtested
45 AN
TI-
TU
BE
RC
ULO
SIS
DR
UG
RE
SIS
TA
NC
E I
N T
HE
WO
RLD
RESULTS3
* Special administrative region** German Leprosy Relief Association*** Arithmetic mean weighted by no. of TB cases in the country/geographic setting
... continued

INH RMP EMB SMCOUNTRY Year Patients
Mono Any Mono Any Mono Any Mono Anytested
46
RESULTSA
NT
I-T
UB
ER
CU
LO
SIS
DR
UG
RE
SIS
TA
NC
E I
N T
HE
WO
RLD
3Table 7. Prevalence of drug resistance to each drug amongnew TB cases, by country/geographical setting, 1996–1999
Botswana 1999 638 3.6 4.4 .2 .6 .0 .2 1.6 2.2Central African Republic (Bangui) 1998 464 4.1 9.5 .2 1.3 .0 2.4 6.5 11.0Chile 1997 732 1.2 3.8 .1 .7 .0 .0 4.9 7.4China (Henan Province) 1996 646 5.1 24.0 1.4 14.6 .5 7.7 6.3 26.0China (Guangdong Province) 1999 461 4.8 9.3 .4 3.5 .0 2.4 2.8 6.1China (Hong Kong SAR*) 1996 4 424 2.6 6.1 .0 1.6 .5 1.6 5.3 8.2China (Shandong Province) 1997 1 009 3.8 11.3 .6 3.8 .1 1.7 5.4 12.2China (Zhejiang Province) 1999 802 2.7 8.9 1.6 6.5 .2 1.5 3.7 9.0Colombia 1999 201 3.0 8.5 .0 .5 .0 .5 5.0 10.0Cuba 1998 284 .7 .7 .0 .0 .0 .4 3.5 3.9Czech Republic 1999 311 1.0 3.2 .3 1.9 .0 1.3 .0 2.3Denmark 1998 412 1.7 6.1 .0 .5 .0 .0 7.0 11.4England & Wales 1997 3 053 2.9 5.0 .1 .9 .0 .3 3.6 6.6Estonia 1998 377 2.7 26.0 .3 14.3 .3 11.1 10.3 32.4Finland 1997 410 4.1 4.6 .0 .5 .0 .0 .2 .7France 1997 787 2.3 3.6 .3 .3 .1 .1 5.3 6.6Germany 1998 1 455 3.2 5.7 .3 1.4 .2 1.2 2.4 4.7Guinea 1998 539 4.5 9.3 .2 .7 .0 .6 5.2 9.5India (Tamil Nadu State) 1997 384 7.6 15.4 .5 4.4 .5 7.0 1.8 6.8Islamic Republic of Iran 1998 666 2.7 9.8 .9 6.2 .3 4.7 4.2 9.8Italy 1999 683 2.9 5.6 .9 2.2 .4 .9 5.3 7.0Latvia 1998 789 7.2 28.1 .0 9.0 .0 4.6 1.8 21.9Malaysia 1997 1 001 1.0 1.6 .4 .5 .4 .5 2.4 3.0Mexico (Baja California, Oaxaca and Sinaloa) 1997 334 4.2 7.2 .6 3.6 .3 3.0 5.4 7.2Morocco (Casablanca) 1998 510 2.7 7.8 .2 2.4 .0 .2 .6 4.5Mozambique 1999 1 028 7.9 16.5 1.8 5.3 .0 .5 2.5 10.5Nepal 1999 104 1.0 1.9 .0 1.0 .0 .0 3.8 4.8Netherlands 1996 1 042 3.5 6.3 .3 1.1 .4 .5 2.1 4.8New Caledonia 1996 93 .0 .0 .0 .0 .0 .0 2.2 2.2New Zealand 1997 179 6.7 9.5 .0 1.1 .6 .6 1.1 2.8Nicaragua 1998 564 5.9 9.4 .5 1.8 .2 .7 5.5 8.7Northern Ireland 1997 41 2.4 2.4 .0 .0 .0 .0 2.4 2.4Norway 1996 138 4.3 8.0 .0 2.2 .0 .7 2.9 4.3Oman 1999 133 1.5 3.0 .8 1.5 .0 1.5 .8 2.3Peru 1999 1 879 3.6 9.0 .7 4.0 .8 2.6 6.8 11.7Poland 1997 2 976 1.5 2.7 .1 .7 .0 .1 .8 1.8Puerto Rico 1997 160 3.1 6.9 .6 3.1 .6 3.1 2.5 5.6Republic of Korea 1999 2 370 4.9 8.6 .7 3.0 .0 1.1 1.2 3.1Russian Federation (Tomsk Oblast) 1999 417 2.4 19.4 .5 7.9 .2 7.0 7.4 24.9Russian Federation (Ivanovo Oblast) 1998 222 7.2 22.1 .0 15.8 2.7 9.9 6.3 18.0Scotland 1997 299 3.0 3.7 .0 .3 .0 .0 .0 .3Sierra Leone 1997 117 3.4 10.3 .0 .9 .0 .0 14.5 21.4Singapore 1996 980 2.6 3.4 .1 .4 .0 .3 1.3 1.9Slovakia 1998 589 1.4 2.0 .0 .3 .0 .2 .7 1.0Slovenia 1997 290 .3 1.0 .0 .7 .0 .7 1.4 2.1South Africa (Mpumalanga Province) 1997 661 3.5 5.6 .2 1.7 .0 .5 2.3 3.8Spain (Barcelona) 1998 315 1.9 2.2 .0 .3 .0 .3 1.3 1.6Sweden 1997 356 3.1 5.6 .0 .6 .0 .0 2.2 4.8Switzerland** 1997 322 2.8 2.8 .0 .0 .0 .0 .3 .3Thailand 1997 1 137 6.2 12.5 2.0 5.8 3.0 8.0 5.6 11.2Uganda (GLRA supported zones***) 1997 374 3.2 6.7 .3 .8 2.4 6.1 7.0 13.4

INH RMP EMB SMCOUNTRY Year Patients
Mono Any Mono Any Mono Any Mono Anytested
United States of America 1997 12 063 4.4 8.0 .4 1.7 .5 1.6 3.0 5.9Uruguay 1997 484 .4 .4 .4 .4 .0 .0 .8 .8Venezuela 1998 221 1.4 1.8 .0 .5 .0 .5 1.4 2.7Median 474 3.0 6.2 .2 1.2 .0 .6 2.5 5.2minimum 41 .0 .0 .0 .0 .0 .0 .0 .3maximum 12 063.0 7.9 28.1 2.0 15.8 3.0 11.1 14.5 32.4WEIGHTED MEAN **** 1 313.5 4.7 10.6 .6 3.9 .5 3.5 3.6 8.5
AN
TI-
TU
BE
RC
ULO
SIS
DR
UG
RE
SIS
TA
NC
E I
N T
HE
WO
RLD
RESULTS3
47
* Special administrative region** SM value for Switzerland corresponds to pyrazinamide, since SM is no longer tested*** German Leprosy Relief Association**** Arithmetic mean weighted by no. of TB cases in the country/geographic setting
3.1.1.1 Magnitude of the problem in Mainland ChinaDRS have been launched in six provinces of Mainland China: Henan, Guangdong,
Hubei, Liaoning, Shandong, and Zhejiang. Data are not yet available from Hubei andLiaoning. Data from the other four are presented here. Shandong and Guangdong imple-mented the WHO/DOTS strategy in 1992 as part of the Infectious and Endemic DiseaseControl (IEDC) Project sponsored by the World Bank and WHO.26 This project runs in 13provinces of China. Henan and Zhejiang, the other two provinces surveyed, are not part ofthe IEDC project. Up to 1999, 4 067 TB patients, including 2 918 new cases, had been testedfor drug-resistant TB. Data from Guangdong are preliminary, as the required sample sizehad not been achieved at the time this report was written. The four provinces surveyed rep-resent 294 460 262 people (24% of the total population of China) and 112 469 TB cases (27%of the notified TB cases of China).
The prevalences of any drug resistance among new TB cases in Guangdong andShangdong, the two provinces implementing the IEDC project, were 13% and 17.6% respec-tively, while in Henan and Zhejiang the prevalences were 35% and 14.8%. The IEDCprovinces both showed prevalences of MDR-TB below 3% (2.8% in Guangdong and 2.9% inShandong), while in the non-IEDC provinces, prevalences exceeded 3% (4.5% in Zhejiangand 10.8% in Henan). When the IEDC provinces (Guangdong and Shangdong) were com-pared with the non-IEDC (Henan and Zhejiang), the differences were significant (p < 0.0001)for both any drug resistance and MDR-TB. However, such differences were largely due to thehigh prevalence of resistance found in Henan Province.
... continued

48
RESULTSA
NT
I-T
UB
ER
CU
LO
SIS
DR
UG
RE
SIS
TA
NC
E I
N T
HE
WO
RLD
3
ESTONIA 1999
0% 20% 40% 60% 80% 100%
CHINA (Henan Province) 1996
RUSSIAN FEDERATION (Ivanovo Oblast) 1998
LATVIA 1998
RUSSIAN FEDERATION (Tomsk Oblast) 1999
THAILAND 1997
SIERRA LEONE 1997
MOZAMBIQUE 1999
UGANDA (3 zones) 1997
INDIA (Tamil Nadu State) 1997
PERU 1999
CHINA (Shandong Province) 1997
CENTRAL AFRICAN REPUBLIC (Bangui) 1998
ISLAMIC REPUBLIC OF IRAN 1998
NICARAGUA 1998
CHINA (Zhejiang Province) 1999
GUINEA 1998
MEXICO (Baja California, Oaxaca and Sinaloa) 1997
COLOMBIA 1999
DENMARK 1998
CHINA (Guangdong Province) 1999
ITALY 1999
CHINA (Hong Kong SAR) 1996
UNITED STATES OF AMERICA 1997
PUERTO RICO 1997
NEW ZEALAND 1997
NORWAY 1996
REPUBLIC OF KOREA 1999
NETHERLANDS 1996
FRANCE 1997
CHILE 1997
GERMANY 1998
MOROCCO (Casablanca) 1998
SOUTH AFRICA ( Mpumalanga Province) 1997
SWEDEN 1997
ENGLAND AND WALES 1997
BOTSWANA 1999
NEPAL 1999
FINLAND 1997
NORTHERN IRELAND 1997
SINGAPORE 1996
MALAYSIA 1997
CUBA 1998
OMAN 1999
VENEZUELA 1998
SCOTLAND 1997
POLAND 1997
SPAIN (Barcelona) 1998
Susceptible
MDR-TB
Any drug resistance other than MDR
CZECH REPUBLIC 1999
SWITZERLAND 1997
SLOVAKIA 1998
SLOVENIA 1997
NEW CALEDONIA 1996
URUGUAY 1997
Fig. 3. Prevalence of MDR-TB and any other drug resistanceamong new TB cases, 1996–1999
49 AN
TI-
TU
BE
RC
ULO
SIS
DR
UG
RE
SIS
TA
NC
E I
N T
HE
WO
RLD
RESULTS33.1.2 Drug resistance among previously treated cases of tuberculosis
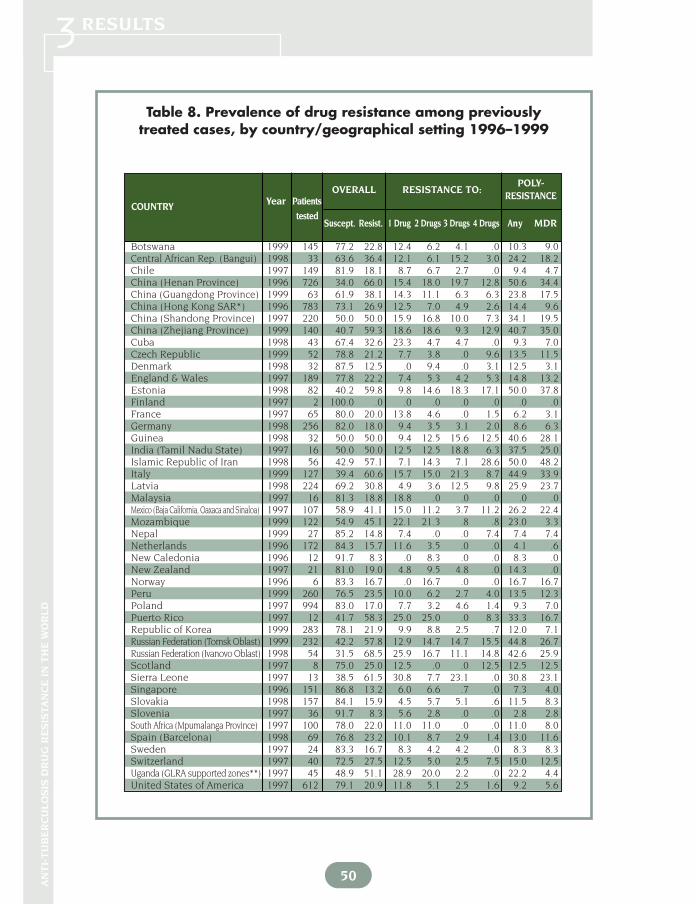
Of the 58 geographical settings participating in this new phase of the Global Project, 48provided data on the prevalence of drug resistance among previously treated cases (Tables 8 and 9,Figure 4). The number of subjects tested ranged from 2 in Finland to 994 in Poland with a median of64 cases. Several reasons accounted for the small denominators (<100 cases) in many of the partici-pant geographical settings. In several settings, the number of previously treated cases has de-creased over the years, and only a small number of previously treated cases were available for test-ing. Also, as the sample sizes for surveys were calculated only for new cases, in other settings previ-ously treated cases were enrolled only until the enrolment of new cases was completed. Finally, inother surveys, enrolment of eligible subjects was still ongoing at the time this report was compiledand the data are preliminary.
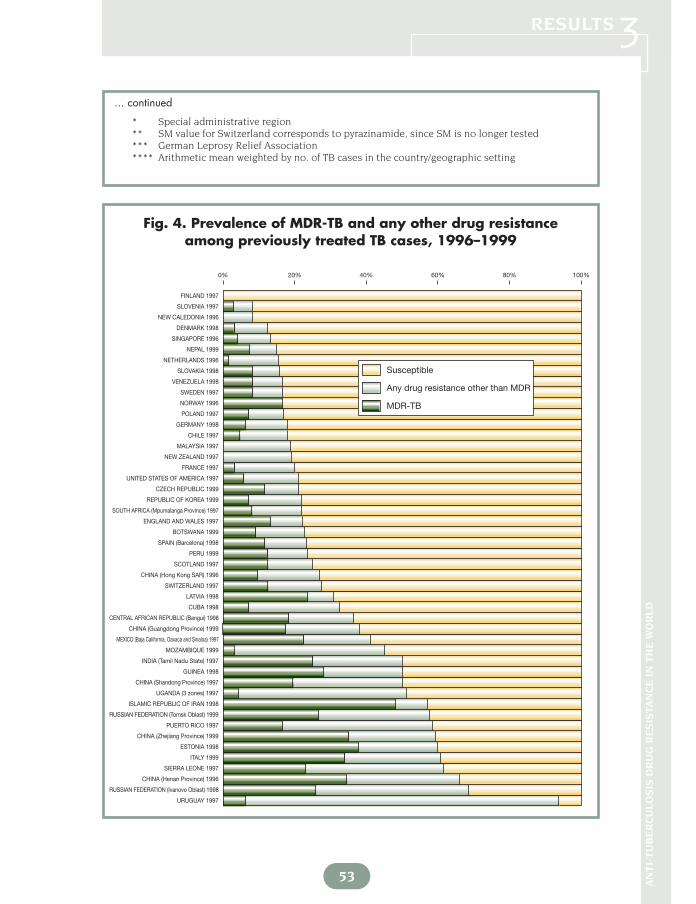
Any drug resistance among previously treated cases ranged from 0% in Finland to 93.8% inUruguay with a median prevalence of 23.3% (Table 8, Figure 4). Denominators for these countries,however, were only 2 and 16 respectively. Of the geographical settings testing more than 100 previ-ously treated cases, high levels were observed in Henan Province (China) (66%), Italy (60.6%), TomskOblast (Russian Federation) (57.8%), Shandong Province (China) (50%), Mozambique (45.1%), andLatvia (30.8%).
MDR-TB among previously treated cases ranged from 0% in 4 geographical settings to48.2% in the Islamic Republic of Iran. The median prevalence was 9.3%. In areas with more than 100previously treated cases tested, the prevalence of MDR-TB ranged from 3.3% in Mozambique to 35%in Zhejiang Province (China). High proportions were observed in Italy (33.9%), Latvia (23.7%),Mexico (22.4%), and Shandong Province (China) (19.5%). On the other hand, Botswana, Chile,Germany, Hong Kong SAR, the Republic of Korea, Mozambique, Mpumalanga Province (SouthAfrica), the Netherlands, Poland, Singapore and the United States showed levels of MDR-TB below10% among previously treated cases.
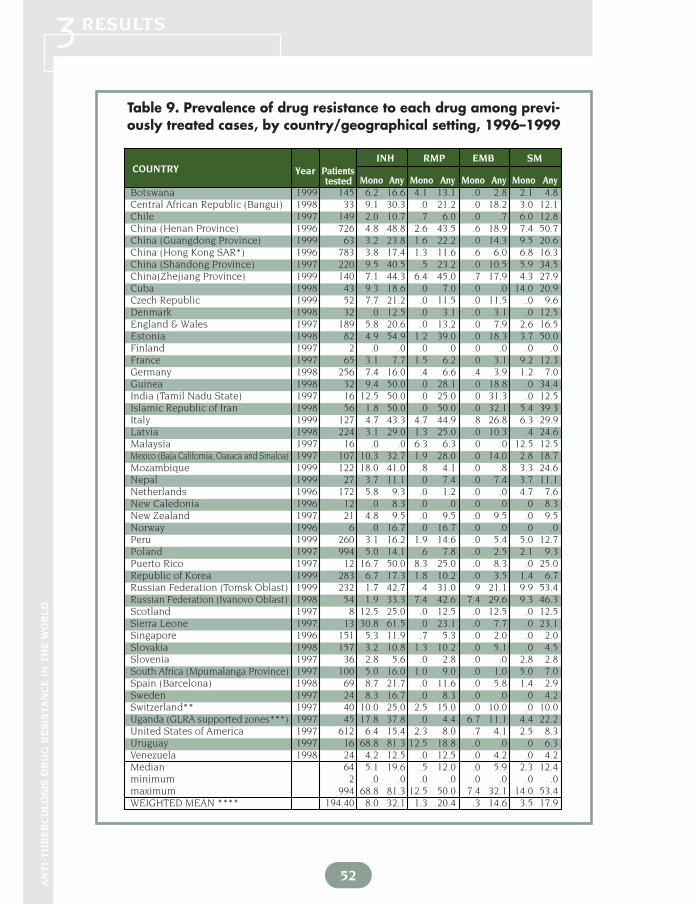
The median prevalence of drug resistance to one drug was 11.3%, while the median preva-lence of resistance to all four drugs was 1.8%. Table 9 shows the prevalence of resistance to specificdrugs, which varied widely between geographical settings. The median prevalence was 19.6% for anyINH resistance, 12% for any RMP resistance, 12.4% for any SM resistance, and 5.9% for any EMB re-sistance.
3.1.3 Combined prevalence of drug resistanceData on the combined prevalence of anti-tuberculosis drug resistance were avail-
able from 52 geographical settings (Tables 10 and 11, Figure 5). Australia, Belgium, Canada,and Israel did not differentiate between new and previously treated cases; thus, they report-ed combined numbers for all cases. The combined prevalence of drug resistance was notcalculated for Casablanca (Morocco), Colombia, Nicaragua, Northern Ireland and Oman,since previously treated cases were not surveyed in these geographical settings. The medianprevalence for any drug resistance was 11.1%. The highest prevalences were observed inEstonia (40.8%), Henan Province (China) (40.5%), Ivanovo Oblast (39.5%) and Tomsk Oblast(39.3%) (Russian Federation) (Table 10, Figure 5). In contrast, low prevalences were ob-served in New Caledonia (2.9%), Slovenia (3.1%), Scotland (4.2%), and Uruguay (4.6%). Themedian prevalence of MDR-TB was 1.8%. The highest prevalences were observed in Estonia(18.1%), Henan Province (China) (15.1%), Tomsk Oblast (Russian Federation) (13.7%), andIvanovo Oblast (Russian Federation) (12.3%). In 12 (23%) geographical settings the preva-lence of MDR-TB was higher than 5%.
50
RESULTSA
NT
I-T
UB
ER
CU
LO
SIS
DR
UG
RE
SIS
TA
NC
E I
N T
HE
WO
RLD
3Table 8. Prevalence of drug resistance among previously
treated cases, by country/geographical setting 1996–1999
OVERALL RESISTANCE TO:POLY-
Year Patients RESISTANCECOUNTRY
testedSuscept. Resist. 1 Drug 2 Drugs 3 Drugs 4 Drugs Any MDR
Botswana 1999 145 77.2 22.8 12.4 6.2 4.1 .0 10.3 9.0Central African Rep. (Bangui) 1998 33 63.6 36.4 12.1 6.1 15.2 3.0 24.2 18.2Chile 1997 149 81.9 18.1 8.7 6.7 2.7 .0 9.4 4.7China (Henan Province) 1996 726 34.0 66.0 15.4 18.0 19.7 12.8 50.6 34.4China (Guangdong Province) 1999 63 61.9 38.1 14.3 11.1 6.3 6.3 23.8 17.5China (Hong Kong SAR*) 1996 783 73.1 26.9 12.5 7.0 4.9 2.6 14.4 9.6China (Shandong Province) 1997 220 50.0 50.0 15.9 16.8 10.0 7.3 34.1 19.5China (Zhejiang Province) 1999 140 40.7 59.3 18.6 18.6 9.3 12.9 40.7 35.0Cuba 1998 43 67.4 32.6 23.3 4.7 4.7 .0 9.3 7.0Czech Republic 1999 52 78.8 21.2 7.7 3.8 .0 9.6 13.5 11.5Denmark 1998 32 87.5 12.5 .0 9.4 .0 3.1 12.5 3.1England & Wales 1997 189 77.8 22.2 7.4 5.3 4.2 5.3 14.8 13.2Estonia 1998 82 40.2 59.8 9.8 14.6 18.3 17.1 50.0 37.8Finland 1997 2 100.0 .0 .0 .0 .0 .0 .0 .0France 1997 65 80.0 20.0 13.8 4.6 .0 1.5 6.2 3.1Germany 1998 256 82.0 18.0 9.4 3.5 3.1 2.0 8.6 6.3Guinea 1998 32 50.0 50.0 9.4 12.5 15.6 12.5 40.6 28.1India (Tamil Nadu State) 1997 16 50.0 50.0 12.5 12.5 18.8 6.3 37.5 25.0Islamic Republic of Iran 1998 56 42.9 57.1 7.1 14.3 7.1 28.6 50.0 48.2Italy 1999 127 39.4 60.6 15.7 15.0 21.3 8.7 44.9 33.9Latvia 1998 224 69.2 30.8 4.9 3.6 12.5 9.8 25.9 23.7Malaysia 1997 16 81.3 18.8 18.8 .0 .0 .0 .0 .0Mexico (Baja California, Oaxaca and Sinaloa) 1997 107 58.9 41.1 15.0 11.2 3.7 11.2 26.2 22.4Mozambique 1999 122 54.9 45.1 22.1 21.3 .8 .8 23.0 3.3Nepal 1999 27 85.2 14.8 7.4 .0 .0 7.4 7.4 7.4Netherlands 1996 172 84.3 15.7 11.6 3.5 .0 .0 4.1 .6New Caledonia 1996 12 91.7 8.3 .0 8.3 .0 .0 8.3 .0New Zealand 1997 21 81.0 19.0 4.8 9.5 4.8 .0 14.3 .0Norway 1996 6 83.3 16.7 .0 16.7 .0 .0 16.7 16.7Peru 1999 260 76.5 23.5 10.0 6.2 2.7 4.0 13.5 12.3Poland 1997 994 83.0 17.0 7.7 3.2 4.6 1.4 9.3 7.0Puerto Rico 1997 12 41.7 58.3 25.0 25.0 .0 8.3 33.3 16.7Republic of Korea 1999 283 78.1 21.9 9.9 8.8 2.5 .7 12.0 7.1Russian Federation (Tomsk Oblast) 1999 232 42.2 57.8 12.9 14.7 14.7 15.5 44.8 26.7Russian Federation (Ivanovo Oblast) 1998 54 31.5 68.5 25.9 16.7 11.1 14.8 42.6 25.9Scotland 1997 8 75.0 25.0 12.5 .0 .0 12.5 12.5 12.5Sierra Leone 1997 13 38.5 61.5 30.8 7.7 23.1 .0 30.8 23.1Singapore 1996 151 86.8 13.2 6.0 6.6 .7 .0 7.3 4.0Slovakia 1998 157 84.1 15.9 4.5 5.7 5.1 .6 11.5 8.3Slovenia 1997 36 91.7 8.3 5.6 2.8 .0 .0 2.8 2.8South Africa (Mpumalanga Province) 1997 100 78.0 22.0 11.0 11.0 .0 .0 11.0 8.0Spain (Barcelona) 1998 69 76.8 23.2 10.1 8.7 2.9 1.4 13.0 11.6Sweden 1997 24 83.3 16.7 8.3 4.2 4.2 .0 8.3 8.3Switzerland 1997 40 72.5 27.5 12.5 5.0 2.5 7.5 15.0 12.5Uganda (GLRA supported zones**) 1997 45 48.9 51.1 28.9 20.0 2.2 .0 22.2 4.4United States of America 1997 612 79.1 20.9 11.8 5.1 2.5 1.6 9.2 5.6

51 AN
TI-
TU
BE
RC
ULO
SIS
DR
UG
RE
SIS
TA
NC
E I
N T
HE
WO
RLD
RESULTS3
* Special administrative region** German Leprosy Relief Association*** Arithmetic mean weighted by no. of TB cases in the country/geographic setting
Resistance to each of the four drugs tested varied widely between settings (Table11). The median prevalence was 8.1% for any INH resistance, 2.2% for any RMP resistance,6% for any SM resistance, and 1.2% for any EMB resistance.
3.2 SUMMARY OF THE TWO PHASES OF THE GLOBAL PROJECT(1994–1999)
As of 1999, 72 surveillance projects on anti-tuberculosis drug resistance have beencompleted within the Global Project in 65 of the world’s countries and territories. Becauseof their size, large countries such as China, India, and the Russian Federation had morethan one surveillance/survey project. Thus, 31% of the 212 countries and territories in theworld have been covered, at least in part, within the Global Project between 1994 and 1999(Map 1). The Global Project has examined drug resistance in geographical settings that ac-count for approximately 33% of the world population and 28% of the reported world TB noti-fied cases in 1997 (Figure 6).
In Table 12, coverage of the Global Project is detailed by WHO region. All WHO re-gions are represented, including for the first time the Eastern Mediterranean Region.According to the number of geographical settings surveyed, the highest coverage has beenin Europe with 25 projects in 22 countries. In terms of population coverage, which is esti-mated on the actual population targeted by the surveillance/surveys, the Global Project hascovered approximately 92% of the population of the Americas, 48% of the population ofEurope, 29% of the population of the Western Pacific, 17% of the population of Africa, and16% of the population of the Eastern Mediterranean Region. While coverage has doubled inSouth-East Asia, from 6% in the first phase of the Global Project to 11% in the secondphase, this region still shows the lowest population coverage.
The Global Project has also doubled coverage with regard to the notified incidenceof TB, from 16% in the first phase to 28%. The Americas (89%) and the Western PacificRegion (47%) are the two regions with the highest coverage. The regions with the lowestcoverage are South-East Asia (17%) and the Eastern Mediterranean Region (12%).
... continued
OVERALL RESISTANCE TO:POLY-
Year Patients RESISTANCECOUNTRY
tested Suscept. Resist. 1 Drug 2 Drugs 3 Drugs 4 Drugs Any MDR
Uruguay 1997 16 6.3 93.8 81.3 12.5 .0 .0 12.5 6.3Venezuela 1998 24 83.3 16.7 4.2 8.3 4.2 .0 12.5 8.3Median 64 76.7 23.3 11.3 8.0 3.4 1.8 13.4 9.3minimum 2 6.3 .0 .0 .0 .0 .0 .0 .0maximum 994 100.0 93.8 81.3 25.0 23.1 28.6 50.6 48.2WEIGHTED MEAN *** 194.40 61.2 38.8 13.2 10.8 8.8 5.9 25.6 17.6
52
RESULTSA
NT
I-T
UB
ER
CU
LO
SIS
DR
UG
RE
SIS
TA
NC
E I
N T
HE
WO
RLD
3Table 9. Prevalence of drug resistance to each drug among previ-ously treated cases, by country/geographical setting, 1996–1999
Botswana 1999 145 6.2 16.6 4.1 13.1 .0 2.8 2.1 4.8Central African Republic (Bangui) 1998 33 9.1 30.3 .0 21.2 .0 18.2 3.0 12.1Chile 1997 149 2.0 10.7 .7 6.0 .0 .7 6.0 12.8China (Henan Province) 1996 726 4.8 48.8 2.6 43.5 .6 18.9 7.4 50.7China (Guangdong Province) 1999 63 3.2 23.8 1.6 22.2 .0 14.3 9.5 20.6China (Hong Kong SAR*) 1996 783 3.8 17.4 1.3 11.6 .6 6.0 6.8 16.3China (Shandong Province) 1997 220 9.5 40.5 .5 23.2 .0 10.5 5.9 34.5China(Zhejiang Province) 1999 140 7.1 44.3 6.4 45.0 .7 17.9 4.3 27.9Cuba 1998 43 9.3 18.6 .0 7.0 .0 .0 14.0 20.9Czech Republic 1999 52 7.7 21.2 .0 11.5 .0 11.5 .0 9.6Denmark 1998 32 .0 12.5 .0 3.1 .0 3.1 .0 12.5England & Wales 1997 189 5.8 20.6 .0 13.2 .0 7.9 2.6 16.5Estonia 1998 82 4.9 54.9 1.2 39.0 .0 18.3 3.7 50.0Finland 1997 2 .0 .0 .0 .0 .0 .0 .0 .0France 1997 65 3.1 7.7 1.5 6.2 .0 3.1 9.2 12.3Germany 1998 256 7.4 16.0 .4 6.6 .4 3.9 1.2 7.0Guinea 1998 32 9.4 50.0 .0 28.1 .0 18.8 .0 34.4India (Tamil Nadu State) 1997 16 12.5 50.0 .0 25.0 .0 31.3 .0 12.5Islamic Republic of Iran 1998 56 1.8 50.0 .0 50.0 .0 32.1 5.4 39.3Italy 1999 127 4.7 43.3 4.7 44.9 .8 26.8 6.3 29.9Latvia 1998 224 3.1 29.0 1.3 25.0 .0 10.3 .4 24.6Malaysia 1997 16 .0 .0 6.3 6.3 .0 .0 12.5 12.5Mexico (Baja California, Oaxaca and Sinaloa) 1997 107 10.3 32.7 1.9 28.0 .0 14.0 2.8 18.7Mozambique 1999 122 18.0 41.0 .8 4.1 .0 .8 3.3 24.6Nepal 1999 27 3.7 11.1 .0 7.4 .0 7.4 3.7 11.1Netherlands 1996 172 5.8 9.3 .0 1.2 .0 .0 4.7 7.6New Caledonia 1996 12 .0 8.3 .0 .0 .0 .0 .0 8.3New Zealand 1997 21 4.8 9.5 .0 9.5 .0 9.5 .0 9.5Norway 1996 6 .0 16.7 .0 16.7 .0 .0 .0 .0Peru 1999 260 3.1 16.2 1.9 14.6 .0 5.4 5.0 12.7Poland 1997 994 5.0 14.1 .6 7.8 .0 2.5 2.1 9.3Puerto Rico 1997 12 16.7 50.0 8.3 25.0 .0 8.3 .0 25.0Republic of Korea 1999 283 6.7 17.3 1.8 10.2 .0 3.5 1.4 6.7Russian Federation (Tomsk Oblast) 1999 232 1.7 42.7 .4 31.0 .9 21.1 9.9 53.4Russian Federation (Ivanovo Oblast) 1998 54 1.9 33.3 7.4 42.6 7.4 29.6 9.3 46.3Scotland 1997 8 12.5 25.0 .0 12.5 .0 12.5 .0 12.5Sierra Leone 1997 13 30.8 61.5 .0 23.1 .0 7.7 .0 23.1Singapore 1996 151 5.3 11.9 .7 5.3 .0 2.0 .0 2.0Slovakia 1998 157 3.2 10.8 1.3 10.2 .0 5.1 .0 4.5Slovenia 1997 36 2.8 5.6 .0 2.8 .0 .0 2.8 2.8South Africa (Mpumalanga Province) 1997 100 5.0 16.0 1.0 9.0 .0 1.0 5.0 7.0Spain (Barcelona) 1998 69 8.7 21.7 .0 11.6 .0 5.8 1.4 2.9Sweden 1997 24 8.3 16.7 .0 8.3 .0 .0 .0 4.2Switzerland** 1997 40 10.0 25.0 2.5 15.0 .0 10.0 .0 10.0Uganda (GLRA supported zones***) 1997 45 17.8 37.8 .0 4.4 6.7 11.1 4.4 22.2United States of America 1997 612 6.4 15.4 2.3 8.0 .7 4.1 2.5 8.3Uruguay 1997 16 68.8 81.3 12.5 18.8 .0 .0 .0 6.3Venezuela 1998 24 4.2 12.5 .0 12.5 .0 4.2 .0 4.2Median 64 5.1 19.6 .5 12.0 .0 5.9 2.3 12.4minimum 2 .0 .0 .0 .0 .0 .0 .0 .0maximum 994 68.8 81.3 12.5 50.0 7.4 32.1 14.0 53.4WEIGHTED MEAN **** 194.40 8.0 32.1 1.3 20.4 .3 14.6 3.5 17.9
INH RMP EMB SMCOUNTRY Year Patients
Mono Any Mono Any Mono Any Mono Anytested
53 AN
TI-
TU
BE
RC
ULO
SIS
DR
UG
RE
SIS
TA
NC
E I
N T
HE
WO
RLD
RESULTS3
* Special administrative region** SM value for Switzerland corresponds to pyrazinamide, since SM is no longer tested *** German Leprosy Relief Association**** Arithmetic mean weighted by no. of TB cases in the country/geographic setting
URUGUAY 1997
0% 20% 40% 60% 80% 100%
RUSSIAN FEDERATION (Ivanovo Oblast) 1998
CHINA (Henan Province) 1996
SIERRA LEONE 1997
ITALY 1999
ESTONIA 1998
CHINA (Zhejiang Province) 1999
PUERTO RICO 1997
RUSSIAN FEDERATION (Tomsk Oblast) 1999
ISLAMIC REPUBLIC OF IRAN 1998
UGANDA (3 zones) 1997
CHINA (Shandong Province) 1997
GUINEA 1998
INDIA (Tamil Nadu State) 1997
MOZAMBIQUE 1999
MEXICO (Baja California, Oaxaca and Sinaloa) 1997
CHINA (Guangdong Province) 1999
CENTRAL AFRICAN REPUBLIC (Bangui) 1998
CUBA 1998
LATVIA 1998
SWITZERLAND 1997
CHINA (Hong Kong SAR) 1996
SCOTLAND 1997
PERU 1999
SPAIN (Barcelona) 1998
BOTSWANA 1999
ENGLAND AND WALES 1997
SOUTH AFRICA (Mpumalanga Province) 1997
REPUBLIC OF KOREA 1999
CZECH REPUBLIC 1999
UNITED STATES OF AMERICA 1997
FRANCE 1997
NEW ZEALAND 1997
MALAYSIA 1997
CHILE 1997
GERMANY 1998
POLAND 1997
NORWAY 1996
SWEDEN 1997
VENEZUELA 1998
SLOVAKIA 1998
NETHERLANDS 1996
NEPAL 1999
SINGAPORE 1996
DENMARK 1998
NEW CALEDONIA 1996
SLOVENIA 1997
FINLAND 1997
Susceptible
MDR-TB
Any drug resistance other than MDR
Fig. 4. Prevalence of MDR-TB and any other drug resistanceamong previously treated TB cases, 1996–1999
... continued

OVERALL RESISTANCE TO:POLY-
RESISTANCECOUNTRY
Year PatientsSuscept. Resist. 1 Drug 2 Drugs 3 Drugs 4 Drugs Any MDRtested
54
RESULTSA
NT
I-T
UB
ER
CU
LO
SIS
DR
UG
RE
SIS
TA
NC
E I
N T
HE
WO
RLD
3Table 10. Prevalence of combined drug resistance by
country/geographical setting, 1996–1999*
Australia 1996 750 89.5 10.5 8.0 1.6 .9 .0 2.5 2.0Belgium** 1997 791 2.0Botswana 1999 92.3 7.7 5.9 1.3 .5 .0 1.8 1.2Canada 1997 1 593 89.5 10.5 6.8 2.8 .8 .2 3.8 1.1Central African Rep. (Bangui) 1998 81.6 18.4 10.9 3.9 3.1 .5 7.4 2.8Chile 1997 89.3 10.5 6.7 3.3 .5 .0 3.8 1.1China (Henan Province) 1996 59.5 40.5 13.7 11.6 9.5 5.7 26.8 15.1China (Guangdong Province) 1999 84.5 15.5 8.7 3.6 1.6 1.6 6.9 4.3China (Hong Kong SAR***) 1996 5 207 85.6 14.4 9.1 3.3 1.5 .7 5.4 2.6China (Shandong Province) 1997 75.5 24.5 11.1 7.7 3.5 2.3 13.4 6.4China (Zhejiang Province) 1999 78.1 21.9 10.0 5.6 3.4 3.0 12.0 9.4Cuba 1998 327 91.7 8.3 6.7 .9 .6 .0 1.5 .9Czech Republic 1999 95.8 4.2 1.5 .8 .3 1.6 2.6 2.0Denmark 1998 444 86.9 13.1 8.1 4.3 .5 .2 5.0 .7England & Wales 1997 3 242 91.9 8.1 5.2 1.9 .5 .5 2.9 1.5Estonia 1998 59.2 40.8 12.9 9.3 8.6 9.9 27.9 18.1Finland 1999 412 95.6 4.9 4.4 .5 .0 .0 .5 .0France 1997 88.9 11.1 9.3 1.4 .1 .2 1.8 .4Germany 1998 1 711 89.8 10.2 6.6 2.0 .9 .7 3.6 1.7Guinea 1998 84.1 15.9 9.8 4.5 1.1 .4 6.0 1.5India (Tamil Nadu State) 1997 75.9 24.1 10.8 5.2 5.6 2.6 13.4 7.1Islamic Republic of Iran 1998 82.4 17.6 8.1 4.3 1.4 3.7 9.5 6.7Israel 1998 307 80.8 19.2 5.2 4.2 6.5 3.3 14.0 8.1Italy 1999 79.5 20.5 10.6 4.4 4.1 1.5 9.9 6.7Latvia 1998 69.9 30.1 8.2 10.2 6.7 5.0 21.9 12.0Malaysia 1997 94.9 5.1 4.5 .5 .0 .1 .6 .1Mexico (Baja California, Oaxaca and Sinaloa) 1997 79.4 20.6 11.6 3.9 1.6 3.6 9.1 7.3Mozambique 1999 77.0 23.1 13.1 7.3 2.2 .5 10.0 3.5Nepal 1999 93.6 6.4 5.0 .0 .9 .5 1.4 1.4Netherlands 1996 1 214 89.0 11.0 7.0 2.8 .2 .1 4.0 .6New Caledonia 1996 105 97.1 2.9 1.9 1.0 .0 .0 1.0 .0New Zealand 1997 200 88.0 12.0 8.0 3.5 .5 .0 4.0 1.0Norway 1996 144 88.9 11.1 6.9 3.5 .7 .0 4.2 2.8Peru 1999 81.2 18.8 11.6 4.0 1.8 1.3 7.1 4.3Poland 1997 94.9 5.1 3.0 1.0 .9 .2 2.1 1.3Puerto Rico 1997 172 85.5 14.5 8.1 4.1 .6 1.7 6.4 3.5Republic of Korea 1999 88.2 11.8 7.1 3.3 1.1 .3 4.7 2.7Russian Federation (Tomsk Oblast) 1999 649 60.7 39.3 11.4 12.0 7.9 8.0 27.9 13.7Russian Federation (Ivanovo Oblast) 1998 276 60.5 39.5 18.1 10.5 4.7 6.2 21.4 12.3Scotland 1997 307 95.8 4.2 3.3 .7 .0 .3 1.0 .7Sierra Leone 1997 72.3 27.7 19.0 6.1 2.6 .0 8.7 2.6Singapore 1996 1 131 94.1 5.9 4.2 1.3 .3 .1 1.7 .8Slovakia 1998 746 94.5 5.5 2.5 1.6 1.2 .1 2.9 2.0Slovenia 1997 326 96.9 3.1 2.1 .3 .0 .6 .9 .9South Africa (Mpumalanga Province) 1997 89.8 10.2 6.7 2.7 .4 .4 3.5 2.5Spain (Barcelona) 1998 94.6 5.4 3.9 .8 .3 .4 1.6 1.4Sweden 1997 380 91.6 8.4 5.5 2.1 .8 .0 2.9 1.1Switzerland 1997 362 94.2 5.8 4.1 .6 .3 .8 1.7 1.4Uganda (GLRA supported zones**** ) 1997 77.9 22.1 14.0 7.7 .4 .0 8.1 .8

INH RMP EMB SMCOUNTRY Year Patients
Mono Any Mono Any Mono Any Mono Anytested
OVERALL RESISTANCE TO:POLY-
RESISTANCECOUNTRY
Year PatientsSuscept. Resist. 1 Drug 2 Drugs 3 Drugs 4 Drugs Any MDRtested
55 AN
TI-
TU
BE
RC
ULO
SIS
DR
UG
RE
SIS
TA
NC
E I
N T
HE
WO
RLD
RESULTS3
* Combined rates were estimated by weighting primary and acquired rates by % retreatment** Belgium reported only MDR*** Special administrative region**** German Leprosy Relief Association***** Arithmetic mean weighted by no. of TB cases in the geographical settingNA = Not available
United States of America 1997 12 675 87.6 12.4 8.5 2.7 .7 .5 3.9 1.4Uruguay 1997 500 95.4 4.6 4.2 .4 .0 .0 .4 .2Venezuela 1998 95.3 4.7 2.8 1.7 .2 .0 1.9 .4Median NA 88.9 11.1 7.1 3.3 .8 .4 4.0 1.8minimum NA 59.2 2.9 1.5 .0 .0 .0 .4 .0maximum NA 97.1 40.8 19.0 12.0 9.5 9.9 27.9 18.1WEIGHTED MEAN***** NA 81.2 18.8 9.5 4.6 3.0 1.8 9.3 5.1
Table 11. Prevalence of combined drug resistance to eachdrug by country/geographical setting, 1996–1999*
... continued
Australia** 1996 750 7.2 9.7 .1 2.1 .1 .3 2.4 7.3Belgium*** 1997 791 8.6 10.6 .4 2.4Botswana 1999 3.8 5.4 .5 1.7 .0 .4 1.6 2.4Canada 1997 1 593 4.1 7.9 .1 1.1 .3 1.3 2.3 5.1Central African Republic (Bangui) 1998 4.6 11.5 .2 3.3 .0 3.9 6.1 11.1Chile 1997 1.4 4.9 .2 1.5 .0 .1 5.1 8.2China (Henan Province) 1996 5.1 28.4 1.6 19.7 .5 9.7 6.5 30.4China (Guangdong Province) 1999 4.6 10.8 .5 5.3 .0 3.6 3.5 7.5China (Hong Kong SAR****) 1996 5 207 2.8 7.8 .2 3.1 .5 2.2 5.5 9.4China (Shandong Province) 1997 5.0 17.5 .6 7.9 .1 3.6 5.5 17.0China (Zhejiang Province) 1999 3.4 14.5 2.4 12.6 .3 4.1 3.8 12.0Cuba 1998 327 1.8 3.1 .0 .9 .0 .3 4.9 6.1Czech Republic 1999 1.2 3.8 .3 2.3 .0 1.6 .0 2.5Denmark 1998 444 1.6 6.5 .0 .7 .0 .2 6.5 11.5England & Wales 1997 3 242 3.1 5.9 .1 1.6 .0 .7 3.5 7.2Estonia 1998 3.0 30.9 .4 18.5 .2 12.4 9.2 35.4Finland 1999 412 4.1 4.6 .0 .5 .0 .0 .2 .7France 1997 2.4 4.0 .3 .8 .1 .4 6.6 8.1Germany 1998 1 711 3.9 7.2 .3 2.2 .2 1.6 2.2 5.1Guinea 1998 4.6 10.7 .2 1.7 .0 1.2 5.0 10.3India (Tamil Nadu State) 1997 8.4 21.3 .4 8.0 .4 11.2 1.5 7.8Islamic Republic of Iran 1998 2.7 11.4 .9 7.9 .3 5.8 4.3 10.9Israel 1998 307 1.6 15.6 .3 8.5 .0 6.2 3.3 16.0Italy 1999 3.2 12.0 1.5 9.5 .5 5.3 5.4 10.9

INH RMP EMB SMCOUNTRY Year Patients
Mono Any Mono Any Mono Any Mono Anytested
56
RESULTSA
NT
I-T
UB
ER
CU
LO
SIS
DR
UG
RE
SIS
TA
NC
E I
N T
HE
WO
RLD
3
* Combined rates were estimated by weighting primary and acquired rates by % retreatment
** Approximately 20% of strains are tested for SM in Australia *** Belgium reported only INH and RMP patterns**** Special administrative region***** SM value for Switzerland corresponds to pyrazinamide, since SM is no longer tested****** German Leprosy Relief Association******* Arithmetic mean weighted by no. of TB cases in the geographical settingNA = Not available
... continued
Latvia 1998 6.4 28.3 .3 12.3 .0 5.7 1.5 22.5Malaysia 1997 1.0 1.6 .5 .6 .4 .5 2.6 3.2Mexico (Baja California, Oaxaca and Sinaloa) 1997 5.7 13.4 .9 9.5 .2 5.7 4.8 10.0Mozambique 1999 8.8 18.8 1.7 5.1 .0 .5 2.6 11.8Nepal 1999 1.2 2.6 .0 1.4 .0 .5 3.8 5.2Netherlands 1996 1 214 3.8 6.8 .2 1.1 .3 .4 2.5 5.2New Caledonia 1996 105 .0 1.0 .0 .0 .0 .0 1.9 2.9New Zealand 1997 200 6.5 9.5 .0 2.0 .5 1.5 1.0 3.5Norway 1996 144 4.2 8.3 .0 2.8 .0 .7 2.8 4.2Peru 1999 3.5 10.0 .9 5.5 .7 3.0 6.5 11.8Poland 1997 1.9 3.9 .1 1.5 .0 .4 1.0 2.6Puerto Rico 1997 172 4.1 9.9 1.2 4.7 .6 3.5 2.3 7.0Republic of Korea 1999 5.1 9.5 .8 3.7 .0 1.4 1.2 3.5Russian Federation (Tomsk Oblast) 1999 649 2.2 27.7 .5 16.2 .5 12.0 8.3 35.1Russian Federation (Ivanovo Oblast) 1998 276 6.2 24.3 1.4 21.0 3.6 13.8 6.9 23.6Scotland 1997 307 3.3 4.2 .0 .7 .0 .3 .0 .7Sierra Leone 1997 5.6 14.3 .0 2.6 .0 .6 13.4 21.5Singapore 1996 1 131 2.9 4.5 .2 1.1 .0 .5 1.1 1.9Slovakia 1998 746 1.7 3.9 .3 2.4 .0 1.2 .5 1.7Slovenia 1997 326 .6 1.5 .0 .9 .0 .6 1.5 2.1South Africa (Mpumalanga Province) 1997 3.7 7.2 .3 2.8 .0 .5 2.7 4.3Spain (Barcelona) 1998 2.6 4.1 .0 1.4 .0 .8 1.3 1.7Sweden 1997 380 3.4 6.3 .0 1.1 .0 .0 2.1 4.7Switzerland***** 1997 362 3.6 5.2 .3 1.7 .0 1.1 .3 1.4Uganda (GLRA supported zones******) 1997 4.3 9.0 .2 1.1 2.7 6.5 6.8 14.0United States of America 1997 12 675 4.5 8.3 .5 2.0 .5 1.7 3.0 6.0Uruguay 1997 500 2.6 3.0 .8 1.0 .0 .0 .8 1.0Venezuela 1998 1.5 2.4 .0 1.1 .0 .6 1.3 2.8Median NA 3.5 8.1 0.3 2.2 .0 1.2 2.6 6.0minimum NA .0 1.0 .0 .0 .0 .0 .0 .7maximum NA 8.8 30.9 2.4 21.0 3.6 13.8 13.4 35.4WEIGHTED MEAN******* NA 5.1 13.7 .7 6.4 .3 5.0 3.4 9.7

57 AN
TI-
TU
BE
RC
ULO
SIS
DR
UG
RE
SIS
TA
NC
E I
N T
HE
WO
RLD
RESULTS3
ESTONIA 1998
0% 20% 40% 60% 80% 100%
CHINA (Henan Province) 1996
RUSSIAN FEDERATION (Ivanovo Oblast) 1998
RUSSIAN FEDERATION (Tomsk Oblast) 1998
LATVIA 1998
SIERRA LEONE 1997
CHINA (Shandong Province) 1997
INDIA (Tamil Nadu State) 1997
MOZAMBIQUE 1999
UGANDA (3 zones) 1997
CHINA (Zhejiang Province) 1999
MEXICO (Baja California, Oaxaca and Sinaloa) 1997
ITALY 1999
ISRAEL 1998
PERU 1999
CENTRAL AFRICAN REPUBLIC (Bangui) 1998
ISLAMIC REPUBLIC OF IRAN 1998
GUINEA 1998
CHINA (Guangdong Province) 1999
PUERTO RICO 1997
CHINA (Hong Kong SAR) 1996
DENMARK 1998
UNITED STATES OF AMERICA 1997
NEW ZEALAND 1997
REPUBLIC OF KOREA 1999
NORWAY 1996
NETHERLANDS 1996
CANADA 1997
AUSTRALIA 1996
CHILE 1997
GERMANY 1998
SOUTH AFRICA (Mpumalanga Province) 1997
SWEDEN 1997
CUBA 1998
ENGLAND AND WALES 1997
BOTSWANA 1999
NEPAL 1999
SINGAPORE 1996
SWITZERLAND 1997
SLOVAKIA 1998
SPAIN (Barcelona) 1998
MALAYSIA 1997
POLAND 1997
FINLAND 1997
Susceptible
MDR-TB
Any drug resistance other than MDR
VENEZUELA 1998
URUGUAY 1997
SCOTLAND 1997
CZECH REPUBLIC 1999
SLOVENIA 1997
NEW CALEDONIA 1996
BELGIUM 1997
FRANCE 1997
Fig. 5. Prevalence of combined MDR-TB and any other drug resistance, 1996–1999

58
RE
SU
LTS
3Map 1. Status of the WHO/IUATLD Global Project on Drug Resistance in Tuberculosis, 1994–1999
The designations employed and the presentation of material on this map do not imply the expression of any opinion whatsoever on the part of the World Health Organization concerning the legal status of any country, territory, city or area or of its authori-ties, or concerning the delimitation of its frontiers or boundaries. Dotted lines represent appoximate border lines for which there may not yet be full agreement.

59 AN
TI-
TU
BE
RC
ULO
SIS
DR
UG
RE
SIS
TA
NC
E I
N T
HE
WO
RLD
RESULTS33.2.1 Drug resistance among new cases of tuberculosis
Figures 7–9 show the prevalence of drug resistance among new cases in 67 geo-graphical settings that have provided the appropriate data since the launching of the GlobalProject in 1994. The median value for any drug resistance is 11% (range: 1.7% to 41%)(Figure 7), and for MDR-TB is 1% (range: 0% to 14.1%). Maps 2 and 3 show levels of drug re-sistance and MDR-TB among new TB cases respectively. Figure 8 shows the median preva-lence of resistance to each of the four drugs tested by the Global Project. The lowest medi-an value was 0.6%, for any EMB resistance, and the highest was 7%, for any INH resistance.The median prevalence of resistance according to the number of drugs (Figure 9) rangedfrom 0.1% for resistance to four drugs to 6.7% for single drug resistance.
3.2.2 Drug resistance among previously treated cases of tuberculosisResults from the 58 geographical settings that provided data between 1994 and
1999 on the prevalence of anti-tuberculosis drug resistance among previously treated casesare shown in Figures 10–12. Median prevalence was 33.4% (range: 0% to 93.8%) for any drugresistance (Figure 10) and 9.1% (range: 0% to 42%) for MDR-TB. Maps 4 and 5 show preva-lence of drug resistance and MDR-TB among previously treated cases. Figure 11 shows themedian prevalence of resistance to each of the four drugs tested by the Global Project. Thelowest median value was 5.5% for any EMB resistance, and the highest was 21.9% for anyINH resistance. According to the number of drugs, the median prevalence ranged from 2%for resistance to four drugs to 12.1% for single drug resistance (Figure 12).
3.2.3 Combined drug resistanceData on the prevalence of combined drug resistance in the period 1994–1999 were
available for 62 geographical settings. The median prevalence for any drug resistance was11.9% (range: 2.9% to 42.4%) (Figure 13) and for MDR-TB was 2% (range: 0% to 18.1%). Maps6 and 7 show levels of combined prevalence of overall drug resistance and of MDR-TB.Figure 14 shows the median values of combined drug resistance according to each of thedrugs tested. The lowest median value was 1.2% for any EMB resistance, and the highestwas 9.1% for any INH resistance. Figure 15 shows the median values of combined drug re-sistance according to the number of drugs tested. The prevalence ranged from 0.4% in caseswith resistance to four drugs to 7.4% in cases with single drug resistance.
3.3 TRENDS IN DRUG RESISTANCE (1994–1999)Twenty-eight geographical settings provided annual data for 2–4 years for the as-
sessment of trends in anti-tuberculosis drug resistance. Of these, 24 provided data on newcases and 20 provided data on previously treated cases. In most cases (20) these are limitedto two data points.
3.3.1 Trends among new cases of tuberculosisTwenty-four geographical settings provided data on the prevalence of drug resis-
tance among new cases by year of the survey/surveillance. Overall drug resistance and MDR-TB are shown in Table 13. A statistically significant upward trend for any drug resistance wasobserved in Estonia, from 28.2% in 1994 to 36.9% in 1998 (p = 0.002) and in Denmark, from9.9% in 1995 to 13.1% in 1998 (p = 0.01). Of the settings providing data for only two years,

60
RESULTSA
NT
I-T
UB
ER
CU
LO
SIS
DR
UG
RE
SIS
TA
NC
E I
N T
HE
WO
RLD
3Fig. 6. Estimated coverage of the Global Project
in its two phases, 1994–1999*
* Denominators included notified TB cases and specific population of the setting surveyed
Table 12 . Coverage of the Global Project by WHO regions, 1994–1999
WHO region ParameterTotal in region
Survey targetsNo. countries
(%)*(1997) represented
Africa No. of countries 47 13 13 28Population 611 610 000 106 107 338 17TB cases notified 498 770 129 742 26
The Americas No. of countries 44 15 15 34Population 792 527 000 732 896 402 92TB cases notified 250 457 223 491 89
The Eastern No. of countries 23 3 3 13Mediterranean Population 475 413 000 77 103 000 16
TB cases notified 126 639 15 827 12
Europe No. of countries 52 25 22 42Population 870 386 000 416 912 644 48TB cases notified 347 550 87 312 25
Sout East Asia No. of countries 10 4 3 30Population 1 458 274 000 153 503 400 11TB cases notified 1 310 880 226 336 17
Western Pacific No. of countries 36 12 9 25Population 1.641 179 000 468 103 078 29TB cases notified 834 583 390 936 47
WORLD No. of countries 212 72 65 31Population 5 849 389 000 1 954 625 862 33TB cases notified 3 368 879 936 059 28
* Coverage was estimated by using population figures and notified TB incidence in 1997. For administrative units (state, province, oblast) surveyed within large countries, denominators included population and TB incidence of such units
WORLD COUNTRIES(n=212 countries)
WORLD’S POPULATION(n=5 850 million people)
WORLD’S TB BURDEN(n=3.4 million cases)
69%
31%
67%
33%
72%
28%

61 AN
TI-
TU
BE
RC
ULO
SIS
DR
UG
RE
SIS
TA
NC
E I
N T
HE
WO
RLD
RESULTS3
Prev
alen
ce (%
)
0Any
Resistance
10
20
30
40
50
MDR-TB
Prev
alen
ce (%
)
0Any RMP
10
20
30
40
Any INH Any SM Any EMB
Fig. 7. Prevalence of any drug resistance and MDR-TB amongnew cases, 1994–1999
Fig. 8. Prevalence of any drug resistance among new TB casesaccording to specific drugs, 1994–1999
Prev
alen
ce (%
)
0Two
10
20
30
One Three All
Fig. 9. Prevalence drug resistance among new TB cases according to the number of drugs tested, 1994–1999
The boxes represent the median value and the 25th and 75thpercentiles. The vertical lines extending up and downfrom each box show the largest observed values that are not outliers. The circles represent outliers.
The boxes represent the median value and the 25th and 75thpercentiles. The vertical lines extending up and downfrom each box show the largest observed values that are not outliers. The circles represent outliers.
The boxes represent the median value and the 25th and 75thpercentiles. The vertical lines extending up and downfrom each box show the largest observed values that are not outliers. The circles represent outliers.

62
RE
SU
LTS
3Map 2. Prevalence of drug resistance among new TB cases to any of the 4 anti-tuberculosis drugs in
countries and regions surveyed, 1994–1999
The designations employed and the presentation of material on this map do not imply the expression of any opinion whatsoever on the part of the World Health Organization concerning the legal status of any country, territory, city or area or of its authori-ties, or concerning the delimitation of its frontiers or boundaries. Dotted lines represent appoximate border lines for which there may not yet be full agreement.

63
RE
SU
LTS3
Map 3. Prevalence of MDR-TB among new TB cases in countries and regions surveyed, 1994–1999
The designations employed and the presentation of material on this map do not imply the expression of any opinion whatsoever on the part of the World Health Organization concerning the legal status of any country, territory, city or area or of its authori-ties, or concerning the delimitation of its frontiers or boundaries. Dotted lines represent appoximate border lines for which there may not yet be full agreement.

64
RESULTSA
NT
I-T
UB
ER
CU
LO
SIS
DR
UG
RE
SIS
TA
NC
E I
N T
HE
WO
RLD
3
Prev
alen
ce (%
)
0Any INH
20
40
60
80
100
Any SMAny RMP Any EMB
Fig. 11. Prevalence of any drug resistance among previouslytreated TB cases according to specific drugs, 1994–1999
Prev
alen
ce (%
)
0One
20
40
60
80
100
ThreeTwo All
Fig. 12. Prevalence of drug resistance among previously treatedTB cases according to the number of drugs tested, 1994–1999
Prev
alen
ce (%
)
0Any
ResistanceMDR-TB
20
40
60
80
100
Fig. 10. Prevalence of any drug resistance and MDR-TBamong previously treated TB cases, 1994–1999
The boxes represent the median value and the 25th and 75thpercentiles. The vertical lines extending up and downfrom each box show the largest observed values that are not outliers. The circles represent outliers.
The boxes represent the median value and the 25th and 75thpercentiles. The vertical lines extending up and downfrom each box show the largest observed values that are not outliers. The circles represent outliers.
The boxes represent the median value and the 25th and 75thpercentiles. The vertical lines extending up and downfrom each box show the largest observed values that are not outliers. The circles represent outliers.

65 AN
TI-
TU
BE
RC
ULO
SIS
DR
UG
RE
SIS
TA
NC
E I
N T
HE
WO
RLD
RESULTS3Germany (p < 0.001), New Zealand (p < 0.001) and Peru (p = 0.01) showed significantlyhigher proportions in the more recent year of surveillance compared with the previous year.In contrast, Barcelona (Spain) (p < 0.001) and Switzerland (p = 0.04) showed significantlylower proportions in the more recent year of surveillance compared with the previous year.
Regarding MDR-TB, only France (p = 0.03) and the United States (p = 0.004) report-ed significant downward trends. A statistically significant increase was only observed inEstonia, from 10.2% in 1994 to 14.1% in 1998 (p = 0.02). While no significant increases wereobserved in Latvia and Ivanovo Oblast (Russian Federation), high levels of MDR-TB (9% inboth settings) were still found in the most recent year of surveillance.
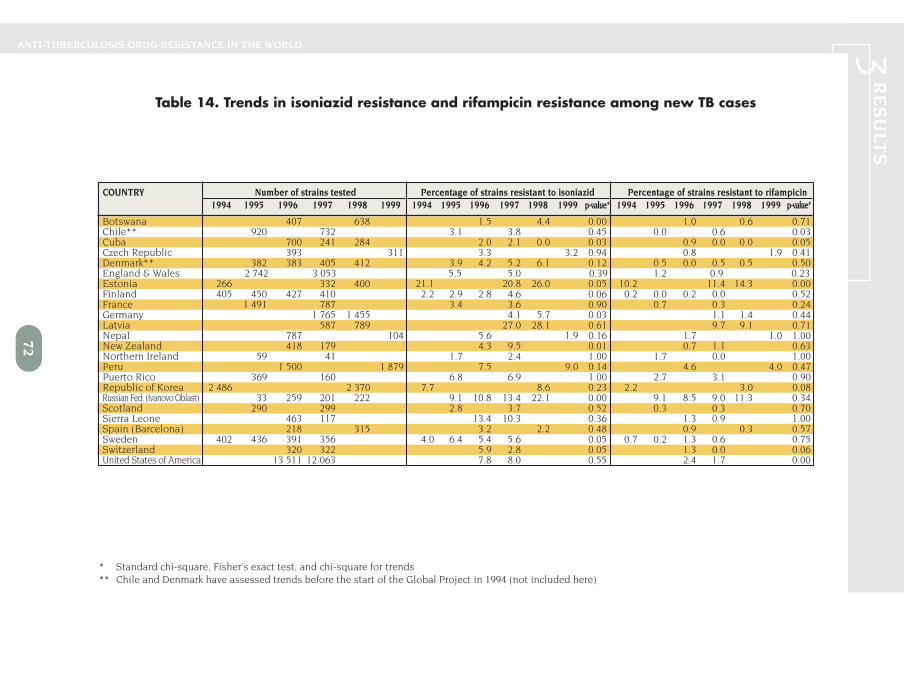
Regarding any INH resistance (Table 14), Switzerland and Cuba showed statisticallysignificant downward trends (p < 0.05). On the other hand, significantly rising trends wereobserved in Estonia and Ivanovo Oblast (Russian Federation) (p < 0.05). Botswana,Germany, and New Zealand, which provided only two data points, also showed significantlyhigher proportions (p < 0.05) in the most recent year of surveillance. Declines in any RMPresistance (Table 14) were observed in Cuba and the United States. Estonia was the onlycountry showing a statistically significant increase. No differences were observed in the oth-er countries.
3.3.2 Trends among previously treated cases of tuberculosisData on trends among previously treated cases were available from 20 geographical
settings. Table 15 shows trends in any drug resistance and MDR-TB. There was no evidenceof increases in any drug resistance among previously treated cases. There was, however, astatistically significant decrease in any drug resistance in Cuba (p < 0.005). Peru alsoshowed a decrease in any drug resistance, from 36% in 1996 to 23.5% in 1999 (p < 0.005), asdid the Republic of Korea, from 52.9% in 1994 to 21.9% in 1998 (p < 0.005), although onlytwo data points were available for these countries. England & Wales also showed decreas-ing proportions from 32.4% in 1995 to 22.2% in 1997 (p=0.03).
Regarding MDR-TB in previously treated cases, Estonia showed a significant in-crease from 19.2% in 1994 to 37.8% in 1998 (p = 0.04). On the other hand, there was a de-crease in the Republic of Korea, from 27.5% in 1994 to 7.1% in 1998 (p < 0.005).
Trends in any INH resistance and any RMP resistance among previously treatedcases are shown in Table 16. Peru, and the Republic of Korea all showed falling trends inany INH resistance. Increasing trends in any RMP resistance were observed only in Estonia.Falling trends were observed in Peru and the Republic of Korea in the last year of surveil-lance compared with the previous one.
3.3.3 Trends in the prevalence of combined drug resistanceTable 17 shows trends in the prevalence of combined drug resistance and MDR-TB.
Because of the lack of a proper denominator, no statistical comparison could be made for geo-graphical settings for which the combined data were weighted by the total number of previous-ly treated cases registered in the setting. There were significant increases, compared with theprevious year, in Germany (p < 0.001) and New Zealand (p < 0.001) in any drug resistance in themost recent year for which surveillance data were available. Only the Netherlands (p = 0.02)showed a significant downward trend in the overall prevalence of any drug resistance. MDR-TBwas significantly lower in the United States in the most recent year for which surveillance data

66
RE
SU
LTS
3Map 4. Prevalence of drug resistance among previously treated TB cases to any of the 4
anti-tuberculosis drugs in countries and regions surveyed, 1994–1999
The designations employed and the presentation of material on this map do not imply the expression of any opinion whatsoever on the part of the World Health Organization concerning the legal status of any country, territory, city or area or of its authori-ties, or concerning the delimitation of its frontiers or boundaries. Dotted lines represent appoximate border lines for which there may not yet be full agreement.

67
RE
SU
LTS3
Map 5. Prevalence of MDR-TB among previously treated TB cases in countries and regions surveyed, 1994–1999
The designations employed and the presentation of material on this map do not imply the expression of any opinion whatsoever on the part of the World Health Organization concerning the legal status of any country, territory, city or area or of its authori-ties, or concerning the delimitation of its frontiers or boundaries. Dotted lines represent appoximate border lines for which there may not yet be full agreement.

68
RE
SU
LTS
3Map 6. Prevalence of combined drug resistance to any of the 4 anti-tuberculosis
drugs in countries and regions surveyed, 1994–1999
The designations employed and the presentation of material on this map do not imply the expression of any opinion whatsoever on the part of the World Health Organization concerning the legal status of any country, territory, city or area or of its authori-ties, or concerning the delimitation of its frontiers or boundaries. Dotted lines represent appoximate border lines for which there may not yet be full agreement.

69
RE
SU
LTS3
Map 7. Prevalence of combined MDR-TB in countries and regions surveyed, 1994–1999
The designations employed and the presentation of material on this map do not imply the expression of any opinion whatsoever on the part of the World Health Organization concerning the legal status of any country, territory, city or area or of its authori-ties, or concerning the delimitation of its frontiers or boundaries. Dotted lines represent appoximate border lines for which there may not yet be full agreement.

70
RESULTSA
NT
I-T
UB
ER
CU
LO
SIS
DR
UG
RE
SIS
TA
NC
E I
N T
HE
WO
RLD
3
Prev
alen
ce (%
)
0Any
Resistance
10
20
30
40
50
MDR-TB
Fig. 13. Combined prevalence of any drug resistance andMDR-TB in TB cases, 1994–1999
Prev
alen
ce (%
)
0Any RMP
10
20
30
40
Any INH Any SM Any EMB
Fig. 14. Combined prevalence of any drug resistance in TB cases according to specific drugs, 1994–1999
Prev
alen
ce (%
)
0Two
10
20
30
One Three All
Fig. 15. Combined prevalence of drug resistance in TB casesaccording to the number of drugs tested, 1994–1999
The boxes represent the median value and the 25th and 75thpercentiles. The vertical lines extending up and downfrom each box show the largest observed values that are not outliers. The circles represent outliers.
The boxes represent the median value and the 25th and 75thpercentiles. The vertical lines extending up and downfrom each box show the largest observed values that are not outliers. The circles represent outliers.
The boxes represent the median value and the 25th and 75thpercentiles. The vertical lines extending up and downfrom each box show the largest observed values that are not outliers. The circles represent outliers.

71
ANTI-TUBERCULOSIS DRUG RESISTANCE IN THE WORLD
RE
SU
LTS3
COUNTRY Number of strains tested Percentage of strains resistant to any drug Percentage of strains MDR1994 1995 1996 1997 1998 1999 1994 1995 1996 1997 1998 1999 p-value* 1994 1995 1996 1997 1998 1999 p-value*
Botswana 407 638 3.7 6.3 0.06 0.2 0.5 0.95Chile** 920 732 10.8 9.3 0.32 0.0 0.4 0.17Cuba 700 241 284 8.3 8.7 4.6 0.77 0.7 0.0 0.0 0.07Czech Republic 393 311 3.3 3.5 0.86 0.8 1.6 0.48Denmark** 382 383 405 412 9.9 8.6 13.8 13.1 0.01 0.3 0.0 0.2 0.5 0.50England & Wales 2 742 3 053 6.9 7.2 0.64 1.1 0.8 0.22Estonia 266 332 400 28.2 29.5 36.9 0.00 10.2 11.1 14.1 0.02Finland 405 450 427 410 3.7 3.5 3.1 5.2 0.40 0.0 0.0 0.0 0.0 1.00France 1 491 787 8.2 9.3 0.37 0.5 0.0 0.03Germany 1 765 1 455 5.9 8.9 0.00 0.7 0.9 0.49Latvia 587 789 29.3 29.9 0.85 9.0 9.0 0.66Nepal 787 104 9.8 5.8 0.18 1.1 1.0 0.50New Zealand 418 179 4.8 11.2 0.00 0.7 1.1 0.60Northern Ireland 59 41 3.4 4.9 1.00 1.7 0.0 1.00Peru 1 500 1879 15.4 18.7 0.01 2.5 3.0 0.43Puerto Rico 369 160 10.0 11.3 0.67 1.9 2.5 0.80Republic of Korea 2 486 2 370 10.4 10.6 0.84 1.6 2.2 0.13Russian Fed. (Ivanovo Oblast) 33 259 201 222 24.2 26.3 21.4 32.4 0.15 6.1 4.6 5.0 9.0 0.08Scotland 290 299 3.4 3.7 0.88 0.3 0.3 1.00Sierra Leone 463 117 28.1 24.8 0.47 1.1 0.9 0.80Spain (Barcelona) 218 315 9.6 3.5 0.00 0.5 0.3 0.30Sweden 402 436 391 356 5.0 8.9 7.2 7.9 0.22 0.5 0.2 1.3 0.6 0.46Switzerland 320 322 6.6 3.1 0.04 0.6 0.0 0.24United States of America 13 511 12 063 12.3 12.0 0.46 1.6 1.2 0.00
* Standard chi-square, Fisher's exact test, and chi-square for trends** Chile and Denmark have assessed trends before the start of the Global Project in 1994 (not included here)
Table 13. Trends in any drug resistance and MDR among new TB cases
72
RE
SU
LTS
ANTI-TUBERCULOSIS DRUG RESISTANCE IN THE WORLD 3
COUNTRY Number of strains tested Percentage of strains resistant to isoniazid Percentage of strains resistant to rifampicin1994 1995 1996 1997 1998 1999 1994 1995 1996 1997 1998 1999 p-value* 1994 1995 1996 1997 1998 1999 p-value*
Botswana 407 638 1.5 4.4 0.00 1.0 0.6 0.71Chile** 920 732 3.1 3.8 0.45 0.0 0.6 0.03Cuba 700 241 284 2.0 2.1 0.0 0.03 0.9 0.0 0.0 0.05Czech Republic 393 311 3.3 3.2 0.94 0.8 1.9 0.41Denmark** 382 383 405 412 3.9 4.2 5.2 6.1 0.12 0.5 0.0 0.5 0.5 0.50England & Wales 2 742 3 053 5.5 5.0 0.39 1.2 0.9 0.23Estonia 266 332 400 21.1 20.8 26.0 0.05 10.2 11.4 14.3 0.00Finland 405 450 427 410 2.2 2.9 2.8 4.6 0.06 0.2 0.0 0.2 0.0 0.52France 1 491 787 3.4 3.6 0.90 0.7 0.3 0.24Germany 1 765 1 455 4.1 5.7 0.03 1.1 1.4 0.44Latvia 587 789 27.0 28.1 0.61 9.7 9.1 0.71Nepal 787 104 5.6 1.9 0.16 1.7 1.0 1.00New Zealand 418 179 4.3 9.5 0.01 0.7 1.1 0.63Northern Ireland 59 41 1.7 2.4 1.00 1.7 0.0 1.00Peru 1 500 1 879 7.5 9.0 0.14 4.6 4.0 0.47Puerto Rico 369 160 6.8 6.9 1.00 2.7 3.1 0.90Republic of Korea 2 486 2 370 7.7 8.6 0.23 2.2 3.0 0.08Russian Fed. (Ivanovo Oblast) 33 259 201 222 9.1 10.8 13.4 22.1 0.00 9.1 8.5 9.0 11.3 0.34Scotland 290 299 2.8 3.7 0.52 0.3 0.3 0.70Sierra Leone 463 117 13.4 10.3 0.36 1.3 0.9 1.00Spain (Barcelona) 218 315 3.2 2.2 0.48 0.9 0.3 0.57Sweden 402 436 391 356 4.0 6.4 5.4 5.6 0.05 0.7 0.2 1.3 0.6 0.75Switzerland 320 322 5.9 2.8 0.05 1.3 0.0 0.06United States of America 13 511 12 063 7.8 8.0 0.55 2.4 1.7 0.00
Table 14. Trends in isoniazid resistance and rifampicin resistance among new TB cases
* Standard chi-square, Fisher's exact test, and chi-square for trends** Chile and Denmark have assessed trends before the start of the Global Project in 1994 (not included here)

73 AN
TI-
TU
BE
RC
ULO
SIS
DR
UG
RE
SIS
TA
NC
E I
N T
HE
WO
RLD
RESULTS3were available compared to the previous year. In Peru and the Republic of Korea, the propor-tion of MDR-TB was lower in the most recent year of surveillance than in the previous one, al-though statistical significance could not be evaluated. In contrast, an increase in MDR-TB wasobserved in Ivanovo Oblast (Russian Federation) (p = 0.02). Australia showed a statistically sig-nificant (p = 0.03) higher proportion of MDR-TB in the most recent year for which surveillancedata were available compared to the previous year.
Table 18 shows trends in any INH resistance and any RMP resistance. Belgium,Germany, New Zealand, and Ivanovo Oblast (Russian Federation) showed increases in any INHresistance. No significant differences were observed in the other settings. Prevalence of anyRMP resistance decreased significantly in the United States in the most recent year for whichsurveillance data were available compared with the previous one. Finland also showed a signif-icantly decreasing trend over time in any RMP.
3.4 IMPACT OF MIGRATION ON DRUG-RESISTANT TUBERCULOSISIn this phase of the Global Project, data on anti-tuberculosis drug resistance were
collected according to place of birth of the TB patients. Seventeen geographical settingsprovided data from new cases and 14 settings provided data from previously treated cases.All these data were collected in the period 1994–1998. The number of years for which datawere available varied from only one year in some settings to four years in others. Any drugresistance and MDR-TB were the only patterns of resistance assessed by the Global Project.
Data on new cases of TB are shown in Table 19 according to the place of birth.Drug-resistant TB was significantly higher (p < 0.05) in the foreign-born TB patients than inindigenous patients in Canada, Denmark, Finland, Germany, the Islamic Republic of Iran,Netherlands, Sweden, England & Wales and the United States (Figure 16). No differenceswere observed in the other geographical settings. In some of these settings, however, thesample size was very small.
Regarding MDR-TB (Table 19, Figure 17), 9 of 17 geographical settings showedMDR-TB below 1% in both indigenous and the foreign-born. Statistically significant differ-ences were observed in the Islamic Republic of Iran and the United States. In the IslamicRepublic of Iran, 13.4% of the foreign-born had MDR-TB compared with 3.6% of indigenous(p < 0.05). In the United States, significantly higher proportions of MDR-TB were observedin the foreign-born compared with indigenous in 1996 (2.1% vs. 1.4%) and 1997 (1.9% vs.1.1%). Israel, and Puerto Rico also reported a higher prevalence of MDR-TB in the foreign-born than in indigenous in the most recent year for which surveillance data were available,although the differences were not statistically significant.
Results of previously treated cases are presented in Table 20. Significantly higherprevalences of any drug resistance in the foreign-born compared with indigenous were onlyobserved in Canada and Germany (Figure 18). MDR-TB prevalence (Figure 19) was signifi-cantly higher in the foreign-born patients in Germany and Switzerland. The numbers in therest of the countries were too small to allow detection of significant differences.

74
RE
SU
LTS
ANTI-TUBERCULOSIS DRUG RESISTANCE IN THE WORLD 3
COUNTRY Number of strains tested Percentage of strains resistant to any drug Percentage of strains MDR1994 1995 1996 1997 1998 1999 1994 1995 1996 1997 1998 1999 p-value* 1994 1995 1996 1997 1998 1999 p-value*
Botswana 114 145 14.9 22.8 0.11 6.1 9.0 0.39Cuba 12 11 25 43 83.3 100.0 36.0 32.6 0.00 16.7 9.1 24.0 7.0 0.37Czech Republic 23 52 17.4 21.2 0.95 8.7 11.5 0.96Denmark 29 36 44 32 13.8 11.1 9.1 12.5 0.81 3.4 5.6 2.3 3.1 0.73England & Wales 148 189 32.4 22.2 0.03 16.9 13.2 0.35Estonia 26 48 82 46.2 41.7 59.8 0.12 19.2 25.0 37.8 0.04Finland 11 7 7 2 27.3 42.8 42.8 0.0 0.51 27.3 14.3 0.0 0.0 0.10France 195 65 21.5 20.0 0.79 4.1 3.1 0.71Germany 310 256 18.1 18.4 0.93 6.8 6.3 0.80Latvia 197 224 33.0 30.8 0.70 17.8 23.7 0.13New Zealand 19 21 5.3 19.0 0.19 0.0 0.0 1.00Peru 458 260 36.0 23.5 0.00 15.7 12.3 0.21Puerto Rico 22 12 27.3 58.3 0.14 13.6 16.7 1.00Republic of Korea 189 283 52.9 21.9 0.00 27.5 7.1 0.00Russian Fed. (Ivanovo Oblast) 33 95 54 100.0 38.9 68.5 0.00 27.3 9.5 25.9 0.01Sierra Leone 172 13 52.9 61.5 0.49 12.8 23.1 0.64Spain (Barcelona) 44 69 29.5 23.2 0.45 20.5 11.6 0.20Sweden 37 24 26 24 8.1 12.5 11.5 16.7 0.35 2.7 0.0 3.8 8.3 0.24Switzerland 46 40 23.9 27.5 0.70 8.7 12.5 0.57United States of America 833 612 23.6 20.9 0.23 7.1 5.6 0.24
Table 15. Trends in any drug resistance and MDR among previously treated TB cases
* Standard chi-square, Fisher's exact test, and chi-square for trends

75
ANTI-TUBERCULOSIS DRUG RESISTANCE IN THE WORLD
RE
SU
LTS3
Table 16. Trends in isoniazid resistance and rifampicin resistance among previously treated TB cases
* Standard chi-square, Fisher's exact test, and chi-square for trends
COUNTRY Number of strains tested Percentage of strains resistant to isoniazid Percentage of strains resistant to rifampicin1994 1995 1996 1997 1998 1999 1994 1995 1996 1997 1998 1999 p-value* 1994 1995 1996 1997 1998 1999 p-value*
Botswana 114 145 10.5 16.6 0.16 7.9 13.1 0.18Cuba 12 11 25 43 41.7 18.2 24.0 18.6 0.17 25.0 9.1 28.0 7.0 0.15Czech Republic 23 52 17.4 21.2 0.95 8.7 11.5 0.96Denmark 29 36 44 32 13.8 11.1 2.3 12.5 0.52 3.4 5.6 4.5 3.1 0.89England & Wales 148 189 29.7 20.6 0.05 17.6 13.2 0.27Estonia 26 48 82 46.2 37.5 54.9 0.25 19.2 27.1 39.0 0.04Finland 11 7 7 2 27.3 42.9 28.6 100.0 0.23 27.3 14.3 0.0 0.0 0.10France 195 65 13.8 7.7 0.19 6.7 6.2 0.84Germany 310 256 13.9 16.0 0.47 7.7 6.6 0.61Latvia 197 224 28.4 29.0 0.89 20.8 25.0 0.30New Zealand 19 21 5.3 9.5 0.61 0.0 9.5 0.17Peru 458 260 23.8 16.2 0.01 20.3 14.6 0.05Puerto Rico 22 12 22.7 50.0 0.14 18.2 25.0 0.68Republic of Korea 189 283 45.5 17.3 0.00 32.3 10.2 0.00Russian Fed. (Ivanovo Oblast) 33 95 54 54.5 17.9 33.3 0.03 54.5 16.8 42.6 0.00Sierra Leone 172 13 43.0 61.5 0.91 14.5 23.1 0.81Spain (Barcelona) 44 69 27.3 21.7 0.50 20.5 11.6 0.10Sweden 37 24 26 24 2.7 12.5 7.7 16.7 0.10 2.7 0.0 3.8 8.3 0.24Switzerland 46 40 23.9 25.0 0.91 8.7 15.0 0.36United States of America 833 612 18.0 15.4 0.18 8.4 8.0 0.79

76
RE
SU
LTS
ANTI-TUBERCULOSIS DRUG RESISTANCE IN THE WORLD 3Table 17. Trends in the combined prevalence of any drug resistance and MDR-TB
* Standard chi-square, Fisher's exact test, and chi-square for trends** No proper denominator available (combined rates were weighted by the total number of retreatment cases in the country)
COUNTRY Number of strains tested Percentage of strains resistant to any drug Percentage of strains MDR1994 1995 1996 1997 1998 1999 1994 1995 1996 1997 1998 1999 p-value* 1994 1995 1996 1997 1998 1999 p-value*
Australia 705 750 9.5 10.5 0.50 0.7 2.0 0.03Belgium 763 750 791 1.2 1.7 2.0 0.19Botswana 4.8 7.7 ** 0.8 1.2 **Canada 1 407 1 599 10.4 10.2 0.80 0.6 1.1 0.45Cuba 702 266 327 8.9 11.3 8.3 0.51 1.0 2.3 0.9 0.85Czech Republic 2.3 4.2 ** 1.2 2.0 **Denmark 411 419 449 444 10.2 8.8 13.4 13.1 0.27 0.5 0.5 0.4 0.7 0.96England & Wales 2 890 3 242 8.2 8.1 0.89 1.9 1.5 0.23Estonia 31.2 31.6 40.8 ** 11.7 13.5 18.1 **Finland 416 457 434 412 ** 0.7 0.4 0.0 0.0 0.30France 9.6 11.1 ** 0.9 0.4 **Germany 2 075 1 711 7.7 10.3 0.00 1.6 1.7 0.90Latvia 34.7 30.5 ** 16.0 14.9 **Netherlands 1 104 1 214 14.1 11.0 0.02 1.1 0.6 0.30New Zealand 437 200 4.8 12.0 0.00 0.7 1.0 0.17Peru 18.5 18.8 ** 4.5 4.3 **Puerto Rico 391 171 11.0 14.5 ** 2.6 3.5 **Republic of Korea 12.9 11.8 0.23 3.1 2.7 0.74Russian Fed. (Ivanovo Oblast) 292 296 276 38.5 27.0 39.5 0.00 7.3 6.4 12.3 0.02Sierra Leone 34.8 27.6 ** 4.2 2.6 **Spain (Barcelona) 12.9 5.4 ** 2.0 1.4 **Sweden 414 418 386 380 5.7 9.1 7.4 8.4 0.27 0.7 0.2 1.4 1.1 0.22Switzerland 366 362 8.7 5.8 0.13 1.6 1.4 0.80United States of America 14 344 12 675 12.9 12.4 0.20 2.0 1.4 0.00

77
ANTI-TUBERCULOSIS DRUG RESISTANCE IN THE WORLD
RE
SU
LTS3
COUNTRY Number of strains tested Percentage of strains resistant to isoniazid Percentage of strains resistant to rifampicin1994 1995 1996 1997 1998 1999 1994 1995 1996 1997 1998 1999 p-value* 1994 1995 1996 1997 1998 1999 p-value*
Australia 705 750 7.5 9.7 0.13 1.1 2.1 0.13Belgium 763 750 791 3.0 4.5 8.6 0.00 0.7 1.1 0.4 0.50Botswana 2.4 5.4 ** 1.7 1.7 **Canada 1 407 1 599 8.7 7.9 0.25 0.6 1.1 0.09Cuba 702 266 327 2.8 4.1 3.1 0.91 0.9 2.6 0.9 0.66Czech Republic 3.8 3.8 ** 1.2 2.3 **Denmark 411 419 449 444 4.6 4.8 4.9 6.5 0.55 0.7 0.5 0.9 0.7 0.91England & Wales 2 890 3 242 6.8 5.9 0.13 2.1 1.6 0.14Estonia 25.3 23.6 30.9 ** 11.7 14.1 18.5 **Finland 416 457 434 412 2.5 3.5 3.2 5.1 0.06 1.0 0.2 0.2 0.0 0.00France 4.5 4.0 ** 1.3 0.8 **Germany 2 075 1 711 5.6 7.2 0.04 2.1 2.2 0.80Latvia 32.4 28.5 ** 17.0 15.6 **Netherlands 1 104 1 214 8.6 6.8 0.11 1.2 1.1 0.90New Zealand 437 200 4.3 9.5 0.01 0.7 2.0 0.15Peru 10.0 10.0 ** 7.0 5.5 **Puerto Rico 391 171 7.7 9.9 ** 3.6 4.7 **Republic of Korea 0.38 0.55Russian Fed. (Ivanovo Oblast) 292 296 276 18.7 14.9 24.3 0.00 12.1 11.5 21.0 0.06Sierra Leone 21.4 14.3 ** 4.9 2.6 **Spain (Barcelona) 8.4 4.1 ** 2.7 1.4 **Sweden 414 418 386 380 3.9 6.7 5.5 6.3 0.26 0.9 0.2 1.4 1.1 0.27Switzerland 366 362 8.2 5.2 0.11 2.2 1.7 0.60United States of America 14 344 12 675 8.4 8.3 0.76 2.7 2.0 0.00
Table 18. Trends in the combined prevalence of any isoniazid resistance and rifampicin resistance
* Standard chi-square, Fisher's exact test, and chi-square for trends** No proper denominator available (combined rates were weighted by the total number of retreatment cases in the country)

78
RESULTSA
NT
I-T
UB
ER
CU
LO
SIS
DR
UG
RE
SIS
TA
NC
E I
N T
HE
WO
RLD
33.5 ECOLOGICAL ANALYSIS OF DRUG RESISTANCE AND
TUBERCULOSIS CONTROLTable 21 presents the median prevalence of any drug resistance and MDR-TB in
new, previously treated, and all TB cases, according to the implementation of theWHO/DOTS strategy.* There were no statistically significant differences between categoriesof DOTS implementation in any of the patterns of drug resistance assessed. The number ofgeographical settings in the five categories varied greatly (e.g., only 4 settings in category 5and 30 settings in category 4). Median prevalence of any drug resistance for new cases in-cluded in this analysis was 11%, ranging from 9.6% (category 5) to 15% (category 3). Settingsin category 4, which have implemented DOTS in more than 90% of the population, showed amedian prevalence of any drug resistance of 10%. MDR-TB in new cases was 1%, rangingfrom 0.9% (category 1 and 5) to 2.4% (category 2).
Table 22 shows the correlation coefficients of TB control indicators with drug resis-tance. GNP per capita income was inversely correlated with any drug resistance in new cas-es, in previously treated cases, and in all cases (combined). The percentage of previouslytreated cases registered in the geographical setting was positively correlated with any drugresistance in new cases (rs = 0.40, p < 0.01) and in all cases (rs = 0.48, p < 0.01). RegardingMDR-TB, GNP per capita income was also inversely correlated with MDR-TB in new casesand previously treated cases. The percentage of previously treated cases registered in thegeographical setting was positively correlated with MDR-TB in new cases (rs = 0.26, p < 0.05)and in all cases (combined) (rs = 0.39, p < 0.01).
In univariate analysis with weighted logistic regression (Table 23), the prevalence ofany drug resistance was positively associated with the proportion of previously treated cas-es registered in the geographical setting (t value = 19.1; p < 0.05), and with the notified TBincidence (t value = 9.72; p < 0.05). The prevalence of any drug resistance was inversely as-sociated with GNP per capita income (t value = –18.9; p < 0.05), and with the proportion oftreatment success (t value = –8.71; p < 0.05). In multivariate analysis with weighted logisticregression (Table 24), any drug resistance in new cases was significantly associated with theproportion of previously treated cases in the geographical setting, and inversely associatedwith use of SCC, use of DOT, and GNP per capita income. MDR-TB in new cases was signifi-cantly associated with the proportion of previously treated cases in the geographical settingand inversely associated with use of DOT, treatment success, proportion of TB cases infect-ed with HIV, and with GNP per capita income. The two models fitted the data well (p > 0.05).However, the predictive power of the models for any drug resistance and MDR-TB was low(R2 = 35% and 29% respectively).
3.6 THE ROLE OF DEMOGRAPHICS, HIV INFECTION, AND PRIOR TREATMENT FOR TUBERCULOSIS A total of 9 615 individual TB patient data from 11 geographical settings were avail-
able for this analysis. These patients were mainly from the Republic of Korea (28%), Peru(20%), Shandong Province in China (12%) and Portugal (9%) (Table 25). Mean age of the par-ticipants was 38 ± 17 years, and 6 402 (67%) were males. Of the participant individuals, 8222 (85.5%) were new cases and 1 393 (14.5%) were previously treated cases. HIV serostatuswas reported for 463 (4.8%) patients from the Dominican Republic, Peru, Portugal, Spain,
* WHO/DOTS control category [i.e., category 0 for countries not reporting to WHO, category 1 for countries not implementingDOTS and TB notification rate >10/100 000, category 2 for countries implementing DOTS in <10% of the population, category 3 for countries implementing DOTS in 10%–90% of the population, category 4 for countries implementing DOTS in >90% of the population, and category 5 for countries not using DOTS and TB notification rates <10/100 000]
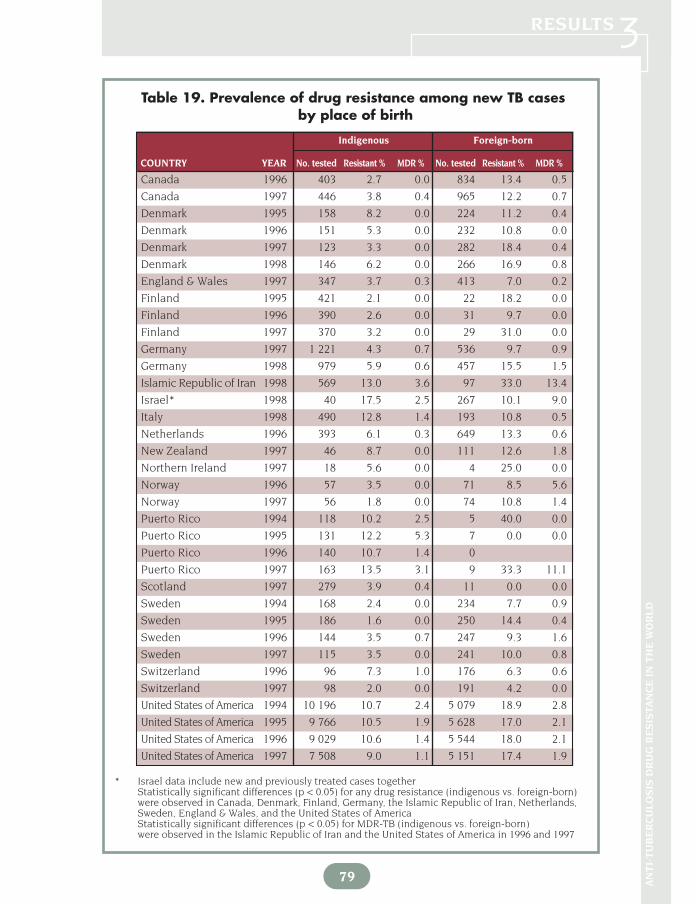
Indigenous Foreign-born
COUNTRY YEAR No. tested Resistant % MDR % No. tested Resistant % MDR %
79 AN
TI-
TU
BE
RC
ULO
SIS
DR
UG
RE
SIS
TA
NC
E I
N T
HE
WO
RLD
RESULTS3
Canada 1996 403 2.7 0.0 834 13.4 0.5
Canada 1997 446 3.8 0.4 965 12.2 0.7
Denmark 1995 158 8.2 0.0 224 11.2 0.4
Denmark 1996 151 5.3 0.0 232 10.8 0.0
Denmark 1997 123 3.3 0.0 282 18.4 0.4
Denmark 1998 146 6.2 0.0 266 16.9 0.8
England & Wales 1997 347 3.7 0.3 413 7.0 0.2
Finland 1995 421 2.1 0.0 22 18.2 0.0
Finland 1996 390 2.6 0.0 31 9.7 0.0
Finland 1997 370 3.2 0.0 29 31.0 0.0
Germany 1997 1 221 4.3 0.7 536 9.7 0.9
Germany 1998 979 5.9 0.6 457 15.5 1.5
Islamic Republic of Iran 1998 569 13.0 3.6 97 33.0 13.4
Israel* 1998 40 17.5 2.5 267 10.1 9.0
Italy 1998 490 12.8 1.4 193 10.8 0.5
Netherlands 1996 393 6.1 0.3 649 13.3 0.6
New Zealand 1997 46 8.7 0.0 111 12.6 1.8
Northern Ireland 1997 18 5.6 0.0 4 25.0 0.0
Norway 1996 57 3.5 0.0 71 8.5 5.6
Norway 1997 56 1.8 0.0 74 10.8 1.4
Puerto Rico 1994 118 10.2 2.5 5 40.0 0.0
Puerto Rico 1995 131 12.2 5.3 7 0.0 0.0
Puerto Rico 1996 140 10.7 1.4 0
Puerto Rico 1997 163 13.5 3.1 9 33.3 11.1
Scotland 1997 279 3.9 0.4 11 0.0 0.0
Sweden 1994 168 2.4 0.0 234 7.7 0.9
Sweden 1995 186 1.6 0.0 250 14.4 0.4
Sweden 1996 144 3.5 0.7 247 9.3 1.6
Sweden 1997 115 3.5 0.0 241 10.0 0.8
Switzerland 1996 96 7.3 1.0 176 6.3 0.6
Switzerland 1997 98 2.0 0.0 191 4.2 0.0
United States of America 1994 10 196 10.7 2.4 5 079 18.9 2.8
United States of America 1995 9 766 10.5 1.9 5 628 17.0 2.1
United States of America 1996 9 029 10.6 1.4 5 544 18.0 2.1
United States of America 1997 7 508 9.0 1.1 5 151 17.4 1.9
Table 19. Prevalence of drug resistance among new TB casesby place of birth
* Israel data include new and previously treated cases togetherStatistically significant differences (p < 0.05) for any drug resistance (indigenous vs. foreign-born)were observed in Canada, Denmark, Finland, Germany, the Islamic Republic of Iran, Netherlands,Sweden, England & Wales, and the United States of AmericaStatistically significant differences (p < 0.05) for MDR-TB (indigenous vs. foreign-born) were observed in the Islamic Republic of Iran and the United States of America in 1996 and 1997

80
RESULTSA
NT
I-T
UB
ER
CU
LO
SIS
DR
UG
RE
SIS
TA
NC
E I
N T
HE
WO
RLD
3Fig. 16. Prevalence of drug resistance among indigenous and
foreign-born new TB cases
* Israel data include new and retreatment cases together
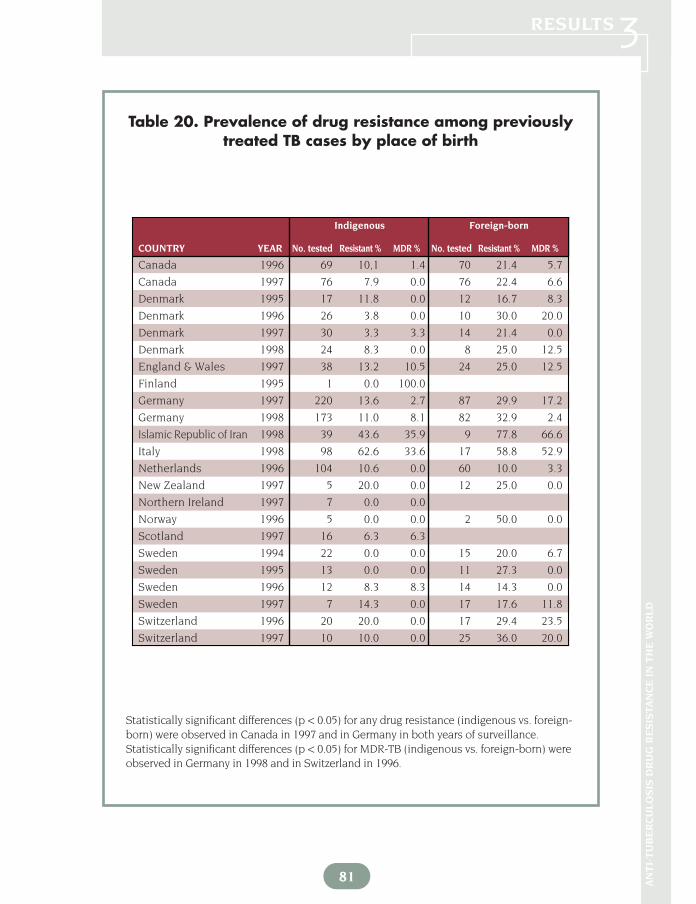
Canada 1996 69 10,1 1.4 70 21.4 5.7
Canada 1997 76 7.9 0.0 76 22.4 6.6
Denmark 1995 17 11.8 0.0 12 16.7 8.3
Denmark 1996 26 3.8 0.0 10 30.0 20.0
Denmark 1997 30 3.3 3.3 14 21.4 0.0
Denmark 1998 24 8.3 0.0 8 25.0 12.5
England & Wales 1997 38 13.2 10.5 24 25.0 12.5
Finland 1995 1 0.0 100.0
Germany 1997 220 13.6 2.7 87 29.9 17.2
Germany 1998 173 11.0 8.1 82 32.9 2.4
Islamic Republic of Iran 1998 39 43.6 35.9 9 77.8 66.6
Italy 1998 98 62.6 33.6 17 58.8 52.9
Netherlands 1996 104 10.6 0.0 60 10.0 3.3
New Zealand 1997 5 20.0 0.0 12 25.0 0.0
Northern Ireland 1997 7 0.0 0.0
Norway 1996 5 0.0 0.0 2 50.0 0.0
Scotland 1997 16 6.3 6.3
Sweden 1994 22 0.0 0.0 15 20.0 6.7
Sweden 1995 13 0.0 0.0 11 27.3 0.0
Sweden 1996 12 8.3 8.3 14 14.3 0.0
Sweden 1997 7 14.3 0.0 17 17.6 11.8
Switzerland 1996 20 20.0 0.0 17 29.4 23.5
Switzerland 1997 10 10.0 0.0 25 36.0 20.0
Indigenous Foreign-born
COUNTRY YEAR No. tested Resistant % MDR % No. tested Resistant % MDR %
Table 20. Prevalence of drug resistance among previouslytreated TB cases by place of birth
81 AN
TI-
TU
BE
RC
ULO
SIS
DR
UG
RE
SIS
TA
NC
E I
N T
HE
WO
RLD
RESULTS3
Statistically significant differences (p < 0.05) for any drug resistance (indigenous vs. foreign-born) were observed in Canada in 1997 and in Germany in both years of surveillance.Statistically significant differences (p < 0.05) for MDR-TB (indigenous vs. foreign-born) wereobserved in Germany in 1998 and in Switzerland in 1996.

82
RE
SU
LTS
ANTI-TUBERCULOSIS DRUG RESISTANCE IN THE WORLD 3Fig. 17. Prevalence of MDR-TB among indigenous and foreign-born new TB cases
* Israel data include new and retreatment cases together

SWEDEN 1994
SWITZERLAND 1997
SWITZERLAND 1996
SWEDEN 1997
SWEDEN 1996
SWEDEN 1995
SCOTLAND 1997
NORWAY 1996
NORTHERN IRELAND 1997
NEW ZEALAND 1997
NETHERLANDS 1996
ITALY 1998
ISLAMIC REPUBLIC OF IRAN 1998
GERMANY 1998
GERMANY 1997
FINLAND 1995
ENGLAND AND WALES 1997
DENMARK 1998
DENMARK 1997
DENMARK 1996
DENMARK 1995
CANADA 1997
CANADA 1996
INDIGENOUS
FOREIGN-BORN
83 AN
TI-
TU
BE
RC
ULO
SIS
DR
UG
RE
SIS
TA
NC
E I
N T
HE
WO
RLD
RESULTS3Fig. 18. Prevalence of drug resistance among
indigenous and foreign-born previously treated TB cases
Drug resistance pattern Category 1 Category 2 Category 3 Category 4 Category 5 Total
n=19 n=7 n=8 n=30 n=4NewAny drug resistance 9.7 14.9 15.0 10.0 9.6 11.1MDR-TB 0.9 2.4 1.3 1.0 0.9 1.1
Previously treatedAny drug resistance 25.0 50.0 47.6 32.6 17.9 33.4MDR-TB 9.6 25.0 17.4 8.3 4.2 9.1
AllCombined drug resistance 10.4 22.8 19.6 11.8 10.6 11.9Combined MDR-TB 1.8 7.2 3.8 1.5 1.1 2.0
Table 21. Median prevalence of drug resistance according to DOTS categories
WHO DOTS Categories [i.e., category 0 for countries not reporting to WHO, category 1 for countries not ac-cepting DOTS and TB notification rate > 10/100 000, category 2 for countries implementing DOTS in <10% ofthe population, category 3 for countries implementing DOTS in 10%–90% of the population, category 4 forcountries implementing DOTS in >90% of the population, and category 5 for countries not using DOTS and TBnotification rates < 10/100 000]

84
RE
SU
LTS
ANTI-TUBERCULOSIS DRUG RESISTANCE IN THE WORLD 3
Fig. 19. Prevalence of MDR-TB among indigenous and foreign-born previously treated TB cases

85
ANTI-TUBERCULOSIS DRUG RESISTANCE IN THE WORLD
RE
SU
LTS3
New cases Previously treated cases Combined
Indicator Any drug resistance MDR Any drug resistance MDR Any drug resistance MDR
% of treatment success –0.23 –0.15 –0.15 –0.05 –0.17 –0.07
% of TB cases under SCC –0.10 –0.13 –0.15 –0.09 –0.14 –0.17
% of previously treated cases 0.40** 0.26* 0.22 0.20 0.48** 0.39**
% of TB cases under DOT 0.05 0.04 0.30* 0.16 0.09 0.09
% of FDC use 0.12 –0.01 –0.03 –0.06 0.07 –0.05
% TB patients infected with HIV –0.11 –0.23 –0.09 –0.23 –0.17 –0.27*
GNP per capita income (US$) –0.42** –0.32* –0.46** –0.26* –0.43** –0.33*
Table 22. Spearman correlation of drug resistance with TB control and development
* Statistically significant at p < 0.05** Statistically significant at p < 0.01
Notified TB incidence (per 100 000) 0.35** 0.28** 0.18 0.07 0.26** 0.21**

86
RESULTSA
NT
I-T
UB
ER
CU
LO
SIS
DR
UG
RE
SIS
TA
NC
E I
N T
HE
WO
RLD
3and Swaziland.
A significantly higher proportion of previously treated cases compared with newcases had resistance to one (OR = 2.5, 95% CI: 2.1, 3.0; p < 0.001), two (OR = 4.6, 95% CI: 3.7,5.6; p < 0.001), three (OR = 11.5, 95% CI: 8.6, 15.3; p < 0.001) and four (OR = 18.5; 95% CI:12.0, 28.5; p < 0.001) drugs. In univariate analysis, patients in all age groups greater than 15years of age were significantly more likely to have drug resistance to at least one drug com-pared to the reference category of 0 to 14 year-olds (Table 26). Patients 35 to 44 years and 55to 64 years were more likely to have MDR-TB compared to the reference category of 0 to 14year-olds. The lowest prevalence of any drug resistance and MDR-TB was observed in thegroups aged 0–14 and > 65 years. Patients > 65 years of age had lower levels of resistance toRMP (1.0%) and EMB (1.3%) than subjects aged 35–44 (3.9% and 2% respectively) and thoseaged 15–24 (3.1% and 1.6% respectively).
Patients with drug-resistant TB were more likely to have had prior TB treatment (OR= 4.2, 95% CI: 3.7, 4.7; p < 0.001). There was no association between any drug resistance andHIV (OR = 0.75, 95% CI: 0.43, 1.3; p = 0.30). On the other hand, prior treatment for TB (OR =10.5, 95% CI: 8.5, 12.9; p < 0.001) and HIV positivity (OR = 2.1, 95% CI: 1.1, 4.0; p = 0.03) were
Table 23. Univariate analysis of drug resistance (new cases)and TB control and development
Any drug resistance* MDR-TB*
Indicator Coefficients Standard t value Coefficients Standard t valueerrors errors
% of previously treated cases 0.04 0.002 19.1** 0.07 0.004 14.4**
GNP per capita income (US$) –0.34 0.01 –18.9** –0.54 0.04 –12.7**
% of TB cases under SCC –0.37 0.037 –9.88** –0.54 0.09 –6.04**
Notified TB incidence 0.10 0.01 9.72** 0.21 0.02 8.17**
% of treatment success –0.01 0.001 –8.71** –0.03 0.003 –9.32**
% of TB cases under DOT 0.75 0.03 2.41 0.24 0.07 3.15
% TB patients infected with HIV –0.002 0.0009 –2.94 -0.01 0.002 –5.00**
% of use of FDC 0.079 0.022 3.51** -0.08 0.05 –1.49
* R square for any drug resistance = 35%, for MDR-TB = 29%** Significant at p < 0.05

87 AN
TI-
TU
BE
RC
ULO
SIS
DR
UG
RE
SIS
TA
NC
E I
N T
HE
WO
RLD
RESULTS3
significantly associated with MDR-TB. Individuals with prior TB treatment of > 3 monthswere more likely to have MDR-TB than those with 1 to 3 months of previous treatment (OR= 2.0, 95% CI: 1.3, 3.2; p = 0.003).
In multivariate analysis (Table 27), subjects ≥ 65 years of age were less likely to have anydrug resistance and MDR-TB. Subjects with a history of prior treatment for TB were more likely tohave any drug resistance (OR = 4.1, 95% CI: 3.7, 4.7; p < 0.001) and MDR-TB (OR = 10.3, 95% CI:8.4, 12.7; p = < 0.001). HIV positivity was associated with MDR-TB only (OR = 2.4, 95% CI: 1.1, 5.0;p = 0.02). Since both HIV and prior treatment for TB were associated with MDR-TB, we exploredwhether HIV-infected individuals had received longer previous treatment and were therefore morelikely to have MDR-TB. The association between HIV and MDR did not hold (OR = 2.4, 95% CI:0.82, 6.9; p = 0.11) when length of prior TB treatment was added to the model. Having received TBdrugs for an overall period of time totaling 6–11 months (OR = 7.6, 95% CI: 2.6, 22.4; p < 0.001) or≥12 months (OR = 13.7, 95% CI: 4.5, 41.6; p < 0.001) was associated with MDR-TB.
3.7 PROFICIENCY TESTING IN THE SUPRANATIONAL REFERENCE LABORATORY NETWORKFive rounds of proficiency testing were carried out between 1994 and 1998.
Susceptibility testing of M. tuberculosis strains was done for INH, RMP, SM, and EMB. Figure20 depicts the accuracy and reproducibility of DST for all 4 anti-tuberculosis drugs evaluat-ed by the network of SRLs in the five rounds. The overall sensitivity throughout five rounds
Any drug resistance* MDR-TB*
IndicatorCoefficients Standard t value Coefficients Standard t value
errors errors
% of previously treated cases 0.021 0.002 8.46** 0.05 0.005 7.71**
GNP per capita income (US$) –0.33 0.02 –13.6** –0.59 0.67 –8.84**
% of TB cases under SCC –0.18 0.03 –4.72**
% of treatment success –0.01 0.004 –3.43**
% of TB cases under DOT –0.44 0.04 –11.2** –0.72 0.09 –7.78**
% TB patients infected with HIV –0.004 0.0009 –4.70** –0.01 0.002 –4.90**
Table 24. Multivariate analysis of drug resistance (new cases) and TB control and development
* R square for any drug resistance = 35%, for MDR-TB = 29%** Significant at p < 0.05

is 95% (Table 28), ranging from 89% in 1994 to 98% in 1998. Overall specificity after fiverounds of testing is 95%, ranging from 86% in 1995 to 96% in 1998. The overall efficiency(the proportion of results in agreement) is 95%, ranging from 91% in 1995 to 97% in 1998.The average intralaboratory reproducibility (consistency of DST results in the two identicalsets of 10 strains tested) is 96%, ranging from 94% in 1994 to 97% in 1998.
Figure 21 and Table 28 show sensitivity for individual drugs. For INH and RMP, sen-sitivity has been consistently high since the beginning of the Global Project. Values forthese two drugs in 1998 were 100%. Sensitivity for EMB has markedly improved from 66% in1994 to 95% in 1998, and for SM from 88% in 1994 to 97% in 1998. Specificity of INH, RMPand EMB have been also consistently high; in 1998, specificity values for these three drugs
88
RESULTSA
NT
I-T
UB
ER
CU
LO
SIS
DR
UG
RE
SIS
TA
NC
E I
N T
HE
WO
RLD
3Table 25. Distribution of the study sample by countries
according to demographics, pattern of resistance, and HIV
* Analysis performed only on patients with confirmed TB, and for whom there was information on age, sex, and prior treatment history
** Barcelona*** Shandong Province
Sample Sample % of sample Age Sample HIV+ (%)Country size analysed (%)* mean ± SD % male
Bolivia 435 417 (95.9) 4.3 36±17 56 no data
Rep. of Korea 2 699 2 671 (99.0) 27.8 42±19 66 no data
Dominican R. 421 420 (99.8) 4.4 33±13 62 166 6 (4)
Sierra Leone 575 365 (63.5) 3.8 31±11 65 no data
Lesotho 428 344 (80.4) 3.6 37±14 71 no data
Peru 2 061 1 942 (93.4) 20.2 31±15 61 98 9 (9)
Portugal 934 883 (94.5) 9.2 38±15 74 133 19 (14)
Spain** 262 234 (89.3) 2.4 40±17 79 62 36 (58)
Swaziland 416 382 (91.8) 4.0 36±13 62 4 2 (50)
Nepal 914 775 (84.8) 8.1 35±15 72 no data
China*** 1 229 1 182 (96.2) 12.3 45±19 70 no data
Nepal 914 775 (84.8) 8.1 35±15 72 no data
Overall 10 374 9 615 (93) 100 38±17 67 463 72 (16)

89 AN
TI-
TU
BE
RC
ULO
SIS
DR
UG
RE
SIS
TA
NC
E I
N T
HE
WO
RLD
RESULTS3Table 26. Univariate predictors of any drug resistance and MDR-TB
Variable No. tested No. resistant % OR p(95% CI)
Any drug resistance Age (years)
0–14 163 13 8.0 REF15–24 2 491 426 17.1 2.4 (1.3–4.2) 0.00325–34 2 372 453 19.1 2.7 (1.5–4.8) 0.00135–44 1 610 329 20.4 3.0 (1.7–5.3) < 0.00145–54 1 143 217 19.0 2.7 (1.5–4.9) 0.00155–64 919 172 18.7 2.7 (1.5–4.8) 0.00165+ 917 129 14.1 1.9 (1.0–3.4) 0.040
SexMale 6 402 1 182 18.5 REFFemale 3 213 557 17.3 0.93 (0.83–1.0) 0.180
Prior TB therapyNo 8 222 1 169 14.2 REFYes 1 393 570 40.9 4.2 (3.7–4.7) < 0.001
HIVNegative 391 139 35.5 REFPositive 72 21 29.2 0.75 (0.43–1.3) 0.300
MDR-TBAge (years)
0–14 163 2 1.2 REF15–24 2 491 89 3.6 3.0 (0.73–12.2) 0.13025–34 2 372 106 4.5 3.8 (0.92–15.4) 0.07035–44 1 610 87 5.4 4.6 (1.1–18.9) 0.03045–54 1 143 49 4.3 3.6 (0.87–15.0) 0.08055–64 919 48 5.2 4.4 (1.1–18.4) 0.04065+ 917 21 2.3 1.9 (0.44–8.1) 0.390
SexMale 6 402 275 4.3 REFFemale 3 213 127 4.0 0.92 (0.74–1.1) 0.430
Previous TB therapyNo 8 222 161 2.0 REFYes 1 393 241 17.3 10.5 (8.5–12.9) < 0.001
HIVNegative 391 44 11.3 REFPositive 72 15 20.8 2.1 (1.1-4.0) 0.030
were 99%, 100%, and 98% respectively. However, specificity for SM in 1998 was 89%. Valuesfor efficiency and reproducibility for all 4 drugs under test have been also very consistentthroughout the years (Table 28).
In the last round of proficiency testing (1998) for which results were available, threeSRLs were below 90% specificity (82%, 68%, and 87% respectively) for all the 4 drugs tested.Sensitivity was, however, above 95% for these SRLs. The geographical settings serviced bythese SRLs had low prevalence of new MDR-TB cases (e.g. between 0.5% and 2.5%).

90
RESULTSA
NT
I-T
UB
ER
CU
LO
SIS
DR
UG
RE
SIS
TA
NC
E I
N T
HE
WO
RLD
3Table 27. Multivariate predictors of any drug resistance and MDR-TB
Variable OR (95% CI) p OR (95% CI) pN=9615 N=463*
Any drug resistance Age (years)
0–24 REF REF25–44 1.1 (0.98–1.3) 0.09 2.1 (1.0–4.2) 0.2145–64 1.0 (0.89–1.2) 0.65 2.7 (1.5–4.9) 0.05≥65 0.78 (0.63–0.97) 0.03 3.6 (0.91–14.4) 0.07
SexMale REF REFFemale 0.97 (0.86–1.1) 0.57 1.0 (0.64–1.6) 1.0
Prior TB therapyNo REF REFYes 4.1 (3.7–4.7) < 0.001 3.6 (2.4–5.5) < 0.001
HIVNegative REFPositive 0.74 (0.41–1.3) 0.31
MDR-TBAge (years)
0–24 REF REF25–44 1.2 (0.90–1.5) 0.24 1.6 (0.75–3.4) 0.2345–64 1.1 (0.80–1.5) 0.60 1.7 (0.58–5.2) 0.32≥65 0.6 (0.36–0.97) 0.04 2.8 (0.44–17.2) 0.28
SexMale REF REFFemale 1.0 (0.80–1.3) 0.96 0.76 (0.38–1.5) 0.45
Previous TB therapyNo REF REFYes 10.3 (8.4–12.7) < 0.001 9.9 (5.1–19.0) < 0.001
HIVNegative REFPositive 2.4 (1.1–5.0) 0.02
* Subjects tested for HIV

Table 28. Results of five rounds of proficiency testing in the SRL net-work, 1994–1998
91 AN
TI-
TU
BE
RC
ULO
SIS
DR
UG
RE
SIS
TA
NC
E I
N T
HE
WO
RLD
RESULTS3
AccuracyINH RMP EMB SM Overall
Cumulativemeasure (%) results 5
roundsSensitivity
1994 99 94 66 88 891995 94 99 75 92 931996 97 98 90 96 961997 100 100 92 91 971998 100 100 95 97 98 95
Specificity
1994 100 96 98 100 981995 86 99 84 82 861996 100 100 96 91 961997 100 99 91 95 951998 99 100 98 89 96 95
Efficiency
1994 99 96 91 92 951995 93 99 81 90 911996 98 99 94 93 961997 100 99 91 93 961998 100 100 97 92 97 95
Reproducibility
1994 98 94 93 89 941995 98 99 90 97 961996 98 98 99 92 971997 100 95 92 91 981998 99 98 97 95 97 96

92
RESULTSA
NT
I-T
UB
ER
CU
LO
SIS
DR
UG
RE
SIS
TA
NC
E I
N T
HE
WO
RLD
3
100
90
80
70
60
0
%
Sensitivity Specificity Efficiency Reproducibility
50
Fig. 20. Accuracy and reliability of DST for all 4 anti-TB drugscombined as performed by the SRLs
100
90
80
70
60
0
%
INH RMP EMB SM
50
Fig. 21. Average sensitivity of DST for each drug by the Global Network of SRLs
Related Documents