<Summary> □ Pressured by the tough environment, the global pharmaceutical industry has been going through a transformation over the last decade. In this report we examine how the industry has evolved and point to some successful strategies for the future. □ First the industry has relentlessly taken the cost out of the system by internal restructuring or through mergers. Pfizer is leading the industry in terms of cost cutting. We believe Pfizer serves as the low-cost benchmark for the industry. Some big pharma still have some way to go to shrink their expenses. □ Another important strategic decision for pharma is how they allocation capital. In recent years, several big pharma have aggressively used free cash flow to repurchase company shares. Such buybacks have boosted share prices of these companies in the short run but its long-term impact is uncertain. Going forward, the amount of buyback is likely to decline. Companies will again shift resources to business development deals. □ Big pharma have also sharpened their R&D and commercial focus. The current landscape calls for companies to have true leadership in innovation and commercial excellence. Many pharma have narrowed their business focuses and pooled assets to create category leaders. By mapping out each company’s therapeutic focuses, we found many pharma are drawn to similar therapeutic. This herd mentality could lead to lower return on investment in hot spaces, and to create better return opportunities in neglected areas. □ Pharma companies should utilize either an innovation leadership strategy whereby the organization is intensely focused on scientific innovation or adopt a specialty pharma mindset by going after neglected diseases. As a part of the new innovation fabric, big pharma have switched to an open innovation system that is built on networks. With its FIPNet model, Lilly is the pioneer in this. Pharma should separate R from D and externalize early research. Pharma should be actively engaged in the creation of new ventures from academia. Pharma should also learn from Celgene for aggressively capturing external innovations early. □ We regard the current biopharma M&A environment as challenging. Valuation for biotech assets is generally expensive. This argues for going after innovations before the PoC inflection point. Big pharma are indeed doing more early-stage deals. However, Good opportunities do exist in some neglected areas. May, 2014 Restructuring the Pharmaceutical Industry Industry Research Division, Mizuho Bank Mizuho Industry Focus Vol. 155 Global Corporate Advisory Americas (1-212-282-3669) Tim Wang, CFA [email protected]

Welcome message from author
This document is posted to help you gain knowledge. Please leave a comment to let me know what you think about it! Share it to your friends and learn new things together.
Transcript

<Summary>
□ Pressured by the tough environment, the global pharmaceutical industry has been going through a
transformation over the last decade. In this report we examine how the industry has evolved and point to
some successful strategies for the future.
□ First the industry has relentlessly taken the cost out of the system by internal restructuring or through
mergers. Pfizer is leading the industry in terms of cost cutting. We believe Pfizer serves as the low-cost
benchmark for the industry. Some big pharma still have some way to go to shrink their expenses.
□ Another important strategic decision for pharma is how they allocation capital. In recent years, several big
pharma have aggressively used free cash flow to repurchase company shares. Such buybacks have boosted
share prices of these companies in the short run but its long-term impact is uncertain. Going forward, the
amount of buyback is likely to decline. Companies will again shift resources to business development deals.
□ Big pharma have also sharpened their R&D and commercial focus. The current landscape calls for
companies to have true leadership in innovation and commercial excellence. Many pharma have narrowed
their business focuses and pooled assets to create category leaders. By mapping out each company’s
therapeutic focuses, we found many pharma are drawn to similar therapeutic. This herd mentality could
lead to lower return on investment in hot spaces, and to create better return opportunities in neglected areas.
□ Pharma companies should utilize either an innovation leadership strategy whereby the organization is
intensely focused on scientific innovation or adopt a specialty pharma mindset by going after neglected
diseases. As a part of the new innovation fabric, big pharma have switched to an open innovation system
that is built on networks. With its FIPNet model, Lilly is the pioneer in this. Pharma should separate R from
D and externalize early research. Pharma should be actively engaged in the creation of new ventures from
academia. Pharma should also learn from Celgene for aggressively capturing external innovations early.
□ We regard the current biopharma M&A environment as challenging. Valuation for biotech assets is
generally expensive. This argues for going after innovations before the PoC inflection point. Big pharma
are indeed doing more early-stage deals. However, Good opportunities do exist in some neglected areas.
May, 2014
Restructuring the Pharmaceutical Industry
Industry Research Division, Mizuho Bank
Mizuho Industry Focus Vol. 155
Global Corporate Advisory Americas
(1-212-282-3669)
Tim Wang, CFA [email protected]
Restructuring the Pharmaceutical Industry
Mizuho Industry Focus
1
EXECUTIVE SUMMARY
The pharmaceutical industry is going through a period of significant changes. We are witnessing significant
M&A deal activity and aggressive tactics. In this report, we review how the pharma industry has evolved to
the current state and where they are headed. We also try to infer some good practices for the industry.
Over the last decade, a significant amount of cost has been taken out of the pharmaceutical industry. Pharma
companies either cut cost on a stand-alone basis or more aggressively through mergers. The pharma industry
has pursued savings through all expense lines – COGS, SG&A and R&D. Pfizer is leading the industry in
terms of downsizing its cost structure. Probably its cost structure can serve as a low-end benchmark of the
industry. In comparison to Pfizer, other big pharma firms have some way to go in terms of cost-cutting
potential. Big pharma has also been shedding non-core, adjacent businesses to concentrate on the main
pharma business. This focused pharma strategy has also played out for conglomerates such as Abbott and
Baxter.
Another important decision for the industry is how it allocates capital. It is a tricky act to balance shareholder
return with reinvestment in the business. With a ratio of around 50%, dividend payout has been relatively
stable for the industry. Over the recent period, some major pharma companies such as Pfizer, BMS and AZ,
have been aggressively buying back shares. But with shares becoming expensive and the increasing need for
reinvesting in the business, some companies are significantly curtailing share buybacks. Going forward, we
will see more free cash flow going to business developments and internal pipelines.
Pharma R&D has also been considerably redesigned. The current environment calls for focused leadership in
narrowly defined diseases. Therefore even big pharma cannot afford to spread its R&D too thin. By looking
at overlaps in prioritized TAs, we found big pharma firms are often drawn to the same areas because of their
similar investment criteria. This crowding will lower the investment return for the participants. We believe
pharma companies should take a hard look at their chosen TAs to see if they have the resources to become a
leader. If the answer is no, they should shift the focus to less crowded areas.
We believe there are several types of successful competitive strategies. For most innovative pharma, they
should adopt an intense innovation-driven business model, in which science is put at the center of
organization. It helps if these companies have visionary scientists at the helm who truly understand science
and are not afraid to make long-term, risky bets. On the other end of the spectrum, the specialty pharma
model based on neglected therapeutic areas such as GI, dermatology, women’s health, etc. will continue to do
well. Big pharma can learn from leading specialty pharma companies such as Valeant and Actavis.
M&A will always serve as a critical lever to achieve strategic goals. One good deal can boost a company
significantly. There were indeed quite a number of very successful deals over recent years. But acquiring
premium biotech asset requires internal expertise as well as luck. In addition, the run-up in biotech valuation
has made attractive assets prohibitively expensive. Therefore, M&A cannot be counted on as an escape route
for pharma companies. We view the current M&A environment as challenging. But there are some good
opportunities in neglected areas. For specialty pharma firms, M&A has been bread-and-butter in their
strategy. Their motivation can be more financial-driven than strategic-driven. Therefore, they have more
leeway to make M&A deals work.
Another hot topic in pharma R&D is the open innovation model adopted by big pharma. Eli Lilly is the
pioneer in adopting its FIPNet model. We believe pharma should separate R and D by allocating resources
for early discovery research from external sources. Pharma can also utilize external capital to develop its
pipeline. Through these endeavors, pharma can spread the risk and cost while tapping into a broader market
for innovation. Pharma should be more engaged in actively creating new innovations from academic labs and
young biotechs. The old game of waiting for PoC before jumping in has become too expensive. Celgene is a
good example of aggressively capturing early innovations.
Overall, we found the pharma industry had successfully weathered the patent cliff. Some companies are
poised for growth. However, pharma business needs to be reconfigured to position for the future. There are a
number of best breed examples for the industry to reference. If the industry can successfully adapt, the next
ten years should be better than the last ten years.

Restructuring the Pharmaceutical Industry
Mizuho Industry Focus
2
TABLE OF CONTENTS
I. Introduction ............................................................................................................... 4 II. Overview of Pharmaceutical Industry Restructuring ........................................... 4
A. The Shallow Restructuring in the Early 1990s .................................................................. 4 B. Pharma Restructuring over the Last Decade ..................................................................... 5 C. Where do Big Pharma Stand Currently on the Cost Curve ............................................... 7
1. Backdrop of Revenue Growth ....................................................................................... 8 2. R&D Expense ................................................................................................................ 9 3. SG&A Expense ............................................................................................................ 12 4. Manufacturing Expense ............................................................................................... 13
III. Capital Allocations by Big Pharma ....................................................................... 14 IV. Pharmaceutical Industry Competitive Strategies ................................................ 18
A. Big Pharma’s Sharpened TA Focus Creates Room for Deals ......................................... 18
1. Current Pharmaceutical Industry Requires A Focused Strategy ................................. 18 2. TA Focus of Big Pharma – A Roadmap for Asset Swapping ..................................... 19 1. Pharma-Pharma Deal Making Created Huge Value in Industry ................................. 20 2. Focus is Also Important for Specialty Pharma Companies ......................................... 21
B. Successful Biopharma Business Strategies ..................................................................... 22 C. Winning M&A Strategies in the Pharmaceutical Industry .............................................. 25
1. Biopharma Firms’ Successful Acquisition of Biotech Companies ............................. 25 2. The Very Successful Specialty Pharma Serial Acquirers ............................................ 26
D. New Innovation Model by Big Pharma ........................................................................... 29
E. Conclusion ....................................................................................................................... 32
Appendix .......................................................................................................................... 33
LIST OF FIGURES
Figure 1 Historical Sales Growth Trend of US-based Big Pharma ......................................... 4 Figure 2 Change of Total Number of NMEs from 2007-2014 .............................................. 11 Figure 3 Changes in Size of Sales Force for Major Pharma Companies ............................... 12 Figure 4 Total Cash Return to Shareholders % Net Income in 2013 ..................................... 14
Figure 5 US/EU Pharma Industry Average Payouts to Shareholders .................................... 15 Figure 6 Trend of Cash Flow Return to Shareholders by Pfizer and Merck ......................... 15 Figure 7 Trend of Cash Flow Return to Shareholders by Roche and Novartis ..................... 16 Figure 8 Trend of Cash Flow Return to Shareholders by BMS and AstraZeneca ................. 16
Figure 9 Innovation Payoff Diagram ..................................................................................... 22 Figure 10 Increase in Valuation since Current CEOs Took Office ....................................... 27 Figure 11 Ranking of World's Largest Pharma Companies By Market Cap ......................... 27
Figure 12 Changes in Innovation Model in Biopharma Industry .......................................... 30

Restructuring the Pharmaceutical Industry
Mizuho Industry Focus
3
LIST OF TABLES
Table 1 Historical Cost Synergies Associated with Big Pharma Mergers ............................... 6 Table 2 Headcount Reduction by Big Pharma ......................................................................... 7 Table 3 Margin Trends for U.S. Pharma Industry Compared to Pfizer ................................... 8
Table 4 Revenue Growth Trend of Major Pharma Companies ............................................... 8 Table 5 R&D Growth Trend of Major Pharma Companies ................................................... 10 Table 6 R&D as % of Sales for Major Pharma Companies ................................................... 10 Table 7 The Number of NMEs in Big Pharma's Pipeline, 2014 ............................................ 11 Table 8 The Number of NMEs in Big Pharma's Pipeline, 2007 ............................................ 11
Table 9 Sales Force Productivity (2013 Rx Sales /Rep) ........................................................ 12
Table 10 Reduction in Manufacturing Sites by Big Pharma ................................................. 13
Table 11 Evolution of Big Pharma Gross Margins ................................................................ 13 Table 12 Summary of Publicly Stated Capital Allocation Policies ....................................... 17 Table 13 Comparison of Diabetes Portfolios of Big Pharma ................................................. 18 Table 14 Comparison of Therapeutic Focus of Big Pharma .................................................. 20 Table 15 Pharma-Pharma Deals ............................................................................................. 21
Table 16 Notable Failed In-licensing Deals in the Recent Past ............................................. 23
Table 17 Pfizer's Biotech Acquisitions and Spin-Offs .......................................................... 24 Table 18 Successful New Ventures by Serial Entrepreneurs ................................................. 24 Table 19 Top Ten Successful M&A Deals for Large Biopharma Companies ...................... 26
Table 20 Differences Between Valeant and Big Pharma ....................................................... 27 Table 21 Acquisitions by Actavis (Previously Watson) Since Mr. Bisaro Took Office ....... 28
Table 22 Celgene's Early-Stage Oncology Deals .................................................................. 31 Table 23 Notable Late-stage Development Failures from Big Pharma (2004-2008) ............ 33
Table 24 Notable Late-stage Development Failures from Big Pharma (2009-2014) ............ 34
Restructuring the Pharmaceutical Industry
Mizuho Industry Focus
4
I. Introduction The global pharmaceutical industry is facing pressure from multiple fronts, including patent expiries, poor R&D
productivity, payer pushbacks, tough regulatory oversight, etc. But pharmaceutical is not a declining industry.
According to IMS Health, the global pharmaceutical market was worth $962bn in 2012 and is expected to grow at
5.3% CAGR to reach $1.25 trillion in 2017. Therefore as a whole the market has decent growth prospects.
Pharmaceutical companies have responded to the business environment by cutting costs, adopting a more flexible and
focused R&D structure, and repositioning their businesses to high growth areas such as specialty drugs and emerging
markets. In this paper, we review how pharma companies have been restructuring their businesses to cope with the
challenges, and identify some promising strategies going forward.
II. Overview of Pharmaceutical Industry Restructuring The pharmaceutical industry is fundamentally driven by top-line growth, which is fueled by product innovation. The
same holds true for any individual pharma company. For a turnaround situation (e.g., the successful turnaround of
Schering-Plough), the priority is to get the topline growing again. A pharma company with a growing topline is in a
very healthy position. Conversely, falling revenues will expose the bloated cost structure and lead to painful belt-
tightening. However, top-line growth is often not within the immediate control of management. The in-line portfolio is
more or less fixed, and it takes years of investment and a lot of luck to get a good pipeline. Therefore, pharma
executives often resort to cost-cutting to alleviate the hit to earnings from a declining topline. If the topline pressure is
too great to be managed with internal cost-cutting alone, big pharma firms sometimes pursue mergers to better absorb
the hit. We have seen this old pharma playbook played out in recent years just as in the early 1990s.
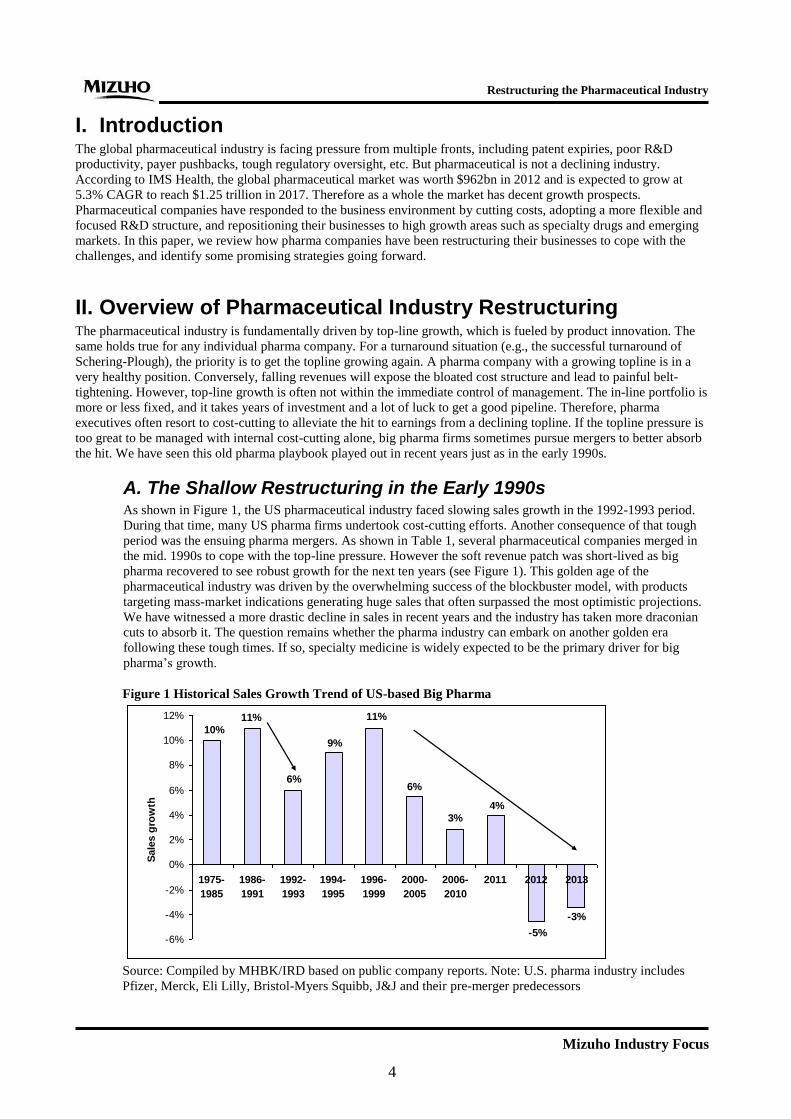
A. The Shallow Restructuring in the Early 1990s As shown in Figure 1, the US pharmaceutical industry faced slowing sales growth in the 1992-1993 period.
During that time, many US pharma firms undertook cost-cutting efforts. Another consequence of that tough
period was the ensuing pharma mergers. As shown in Table 1, several pharmaceutical companies merged in
the mid. 1990s to cope with the top-line pressure. However the soft revenue patch was short-lived as big
pharma recovered to see robust growth for the next ten years (see Figure 1). This golden age of the
pharmaceutical industry was driven by the overwhelming success of the blockbuster model, with products
targeting mass-market indications generating huge sales that often surpassed the most optimistic projections.
We have witnessed a more drastic decline in sales in recent years and the industry has taken more draconian
cuts to absorb it. The question remains whether the pharma industry can embark on another golden era
following these tough times. If so, specialty medicine is widely expected to be the primary driver for big
pharma’s growth.
Figure 1 Historical Sales Growth Trend of US-based Big Pharma
-3%
10%
11%
6%
9%
11%
-5%
6%
3%
4%
-6%
-4%
-2%
0%
2%
4%
6%
8%
10%
12%
1975-
1985
1986-
1991
1992-
1993
1994-
1995
1996-
1999
2000-
2005
2006-
2010
2011 2012 2013
Sale
s g
row
th
Source: Compiled by MHBK/IRD based on public company reports. Note: U.S. pharma industry includes
Pfizer, Merck, Eli Lilly, Bristol-Myers Squibb, J&J and their pre-merger predecessors

Restructuring the Pharmaceutical Industry
Mizuho Industry Focus
5
B. Pharma Restructuring over the Last Decade The hardship in the early 1990s was merely a blip compared to the sales decline and patent cliff over the last
decade. The patent cliff combined with low R&D output has significantly depressed the pharmaceutical
industry’s growth profile. Sales have declined for the leading pharma companies for the last two years and
the decline will persist in 2014.
In anticipation of the slowdown, big pharma started trimming costs in 2003. Initially big pharma firms
approached cost-cutting at a very measured pace. For example, Schering-Plough, which was the worst hit
pharma in 2003 due to the loss of patent exclusivity for Claritin, only trimmed its cost base slightly. As late as
2006, Pfizer was resisting cuts to its massive US sales force for fear of unilateral disarmament when in fact
the old feet-on-the-street sales model was widely recognized as outdated. However, bad R&D news kept
pouring in (see Table 23 and Table 24 in Appendix). The failure of torcetrapib and Exubera from Pfizer in
2006-2007 finally drove home the message that the old model was not justifiable. Subsequently big pharma
started trimming its sales force in earnest. Big pharma also aggressively attacked manufacturing costs by
closing sites and wringing out savings from procurements. However, until recently, big pharma CEOs had
mostly spared R&D from cost-cutting for fear of killing the goose that lays the golden eggs.
In 2008, with the bad R&D news accumulating and the dreaded patent cliff drawing closer, it became clear to
several big pharma CEOs that drastic action was needed. Hence, in early 2009, two mega mergers
(Pfizer/Wyeth, Merck/Schering-Plough) took place that forever changed the industry line-up. Historically on
average big pharma mergers led to ~25% reduction in target company’s expenses (see Table 1). Both Pfizer
and Merck exceeded this average by announcing synergies above 30% of target expense within two years of
the mergers. Subsequently, these two companies have continuously cut the expense from the combined
company.
Overall, big pharma reduced its headcount substantially between 2006 and 2013 (see Table 2). This
headcount reduction is the most drastic for Pfizer and Merck. Basically these two companies eliminated the
total headcounts from their acquired companies.
Big pharma M&As are becoming very active. As this report was being published, Pfizer had approached
AstraZeneca for a takeover. Valeant had just made a hostile take-over bid to acquire Allergan for around
$47bn. In its proposed deal, Valeant indicated its plan to cut 37% of combined expenses (30% of 2014
projected expenses), which amounts to 70% of the target company’s expenses. This level of merger synergy
is almost unprecedented in the pharma industry. The $2.7bn synergy is composed of $1.8bn cut in SG&A
costs and $900mn cut in R&D expense. Allergan spent $2.2bn on SG&A and $977mn on R&D in 2013. So
basically Valeant plans to cut 80-90% of Allergan’s operating expense. Valeant plans to use tax inversion to
lower Allergan’s effective tax rate from 28% currently to a level closer to its own tax rate, which is less than
5%. The combined company is expected to start with a tax rate in the high-single digit range. With such
enormous synergy and huge tax benefits, perhaps no big pharma can compete with a better offer.

Restructuring the Pharmaceutical Industry
Mizuho Industry Focus
6
Table 1 Historical Cost Synergies Associated with Big Pharma Mergers Announce. Close. Savings% Combined % Target% Combined % Target Employee
Acquirer/Target Date Date (US$ in MM) Sales Sales Expenses Expenses Reduction
Pfizer/AstraZeneca (Proposed) Apr-14 TBD
Valeant/Allergan (Proposed) Apr-14 TBD 2,700 24% 48% 37% 70% 20%
Actavis/Forest Labs Feb-14 TBD 1,000 8% 30% 9% 32%
Valeant/Bausch+Lomb May-13 Aug-13 850 26% 33%
Takeda/Nycomed May-11 Sep-11 300
Sanofi-Aventis/Genzyme Feb-11 Apr-11 700 2% 17% 2% 18%
Teva/Cephalon May-11 3Q11 500 3% 17% 4% 25%
Valeant / Biovail Jun-10 Sep-10 350 20% 43% 33% 56%
Merck/Schering-Plough Mar-09 Nov-09 5,000 11% 24% 15% 31% ~30%
Pfizer/Wyeth Jan-09 Oct-09 6,000 8% 26% 13% 36% ~20%
Roche/Genentech Jul-08 Mar-09 750-850 2% 7% 3% 12% na
Schering-Plough / Organon Biosciences Mar-07 End '07 500 3% 11% 4% 13% na
UCB/Schwarz Sep-06 End '06 375 9% 32% 10% 30% na
Merck KGaA/Serono Sep-06 Early '07 125 1% 5% 1% 6% na
Bayer/Schering AG Mar-06 Jun-06 840 2% 13% 2% 15% na
Sanofi-Synthelabo/Aventis Apr-04 Jul-04 2,000 6% 10% 9% 13% na
Pfizer/Pharmacia Jul-02 Apr-03 4,200 8% 28% 13% 39% na
Bristol-Myers Squibb/DuPont Pharma Jun-01 Oct-01 600 3% 38% 4% 41% 70%
Glaxo Wellcome/SmithKline Jan-00 Dec-00 1,700 6% 13% 9% 17% na
Pharmacia/Monsanto Dec-99 Mar-00 600 4% 7% 4% 8% na
Pfizer/Warner-Lambert Nov-99 Jun-00 1,600 6% 12% 7% 15% na
Hoechst/Rhone Poulenc (formed Aventis) Dec-98 Nov-99 1,200 7% 15% 8% 17% na
Astra/Zeneca Dec-98 Apr-99 1,100 7% 15% 9% 20% 13%
Sanofi/Synthelabo Dec-98 May-99 350 6% 17% 7% 21% na
Ciba-Geigy/Sandoz (formed Novartis) Mar-96 Dec-96 1,520 7% na 8% na 12%
Pharmacia/Upjohn Aug-95 Nov-95 500 7% na 9% na 12%
Glaxo/Wellcome Jan-95 May-95 1,250 12% 35% 18% 51% 12%
American Home*/American Cyanamid Aug-94 Dec-94 650 5% 14% 6% 16% 10%
Roche/Syntex May-94 Nov-94 825 5% 39% 6% 49% 11%
Hoechst/Marion Merrell Dow Feb-95 Jul-95 750 9% 25% 11% 30% 18%
Bristol-Myers/Squibb Jul-89 Oct-89 500 6% 19% 7% 25% 10%
SmithKline/Beecham Mar-89 Jul-89 400 6% na na na na
Mean 7% 22% 10% 27% 19%
Median 6% 17% 8% 25% 12% Source: Compiled by MHBK/IRD based on public company reports. Note 1: expense represents the total expense
(COGS, SG&A and R&D). Note 2: The percentage of headcount reduction is based on announcements within two
years of merger. Sometimes companies announce significant further cut in headcounts several years after merger,
which is not captured in the table above.

Restructuring the Pharmaceutical Industry
Mizuho Industry Focus
7
Table 2 Headcount Reduction by Big Pharma
Year End 2005 Year End 2013 Goal % Reduction
Pfizer 98,704 77,700 -49%
Wyeth 53,000
Merck 63,000 76,000 64800 -43%
Schering-Plough ~31500
Organon ~20000
Eli Lilly 44,500 37,925 -15%
Bristol-Myers Squibb 43,000 24,000 -44%
AstraZeneca 64,000 51,500 -20%
GSK 100,019 99,451 -1%
Sanofi 96,400 112,128 16%
Roche 65,000 85,050 31%
Novartis 47,325 135,696 187% Source: Compiled by MHBK/IRD based on public company reports. Note: the substantial increases
in headcounts for Novartis, Roche and Sanofi were due to large acquisitions.
C. Where do Big Pharma Stand Currently on the Cost Curve The structure of pharmaceutical industry’s P&L is a reflection of the industry’s evolution. As the industry’s
fundamentals worsened, the operating margin first declined (Table 3). Gross margins were hit hard by the
patent expiries of high-margin blockbuster drugs. To compensate for the gross margin erosion, big pharma
cut SG&A and R&D expenses. So overtime the operating margin recovered to pre-crisis level.
What is the optimal margin structure for the industry? There shouldn’t be a fixed target for each expense line.
The size of each expense line should be dictated by the condition of the industry and specific situation of each
company. Gross margin is heavily influenced by product mix and is a constant tug-of-war between margin
erosions due to big patent expiries and savings from manufacturing expenses. SG&A expense has declined
substantially in recent years for good reasons. In the developed market, payer’s influenced has been rising
whereas doctors’ influence has been waning, which justifies a smaller sales force. On the R&D side, the
situation is mixed. A company with a large and attractive pipeline should invest a bigger sum in pipeline than
a similar sized company with a poor pipeline. A company with traditionally poor R&D productivity should
cut internal R&D spending and buy innovations from outside. Therefore there are no hard and fast rules on
how much each company should spend on R&D. As shown in Table 3, Pharma industry used to spend much
less on R&D in the 1980s. But with advent of the genomic revolution and high throughput screening, the
R&D expense has grown significantly. However as the R&D productivity fell, the massive spending in R&D
hasn’t proven to be the solution. So big pharma have been focusing their R&D in therapeutic areas where
they give the highest priority. Big pharma’s R&D budget cannot be spread too thin. So this sharpening of
focus has led to some reduction in R&D spending.
We believe of the major pharma companies, Pfizer is the trend-setter in terms of cost-cutting. Pfizer was the
pharma company that has had the most drastic cut to all expense lines. After several rounds of cost cutting,
Pfizer has indicated it is at the late inning of cost cutting, i.e., its cost structure has mostly bottomed.
Therefore, Pfizer’s cost structure probably can be considered low-end benchmark for the industry.
Restructuring the Pharmaceutical Industry
Mizuho Industry Focus
8
Table 3 Margin Trends for U.S. Pharma Industry Compared to Pfizer
Margin Analysis 1975 1985 1990 1995 2000 2005 2006 2007 2008 2009 2010 2011 2012 2013
Gross Margin% 56.1% 60.7% 68.6% 72.0% 77.7% 75.8% 75.8% 75.1% 75.1% 75.1% 72.9% 73.0% 73.0% 72.2%
SG&A% of Sales 33.4% 35.6% 37.5% 36.7% 35.4% 33.4% 33.1% 32.9% 31.6% 30.5% 29.0% 29.5% 29.0% 28.9%
R&D% of Sales 4.7% 7.6% 9.3% 10.7% 13.2% 14.8% 16.0% 16.0% 15.6% 15.8% 15.2% 14.4% 14.9% 15.1%
Operating Margin 18.0% 17.5% 21.9% 24.7% 29.1% 27.7% 26.7% 26.3% 27.8% 28.8% 28.6% 29.1% 29.1% 28.2%
Pfizer Margins
Gross Margin% 78.4% 82.9% 83.8% 85.0% 83.6% 83.8% 83.2% 78.4% 79.7% 81.3% 82.1%
SG&A% of Sales 38.5% 38.2% 32.8% 31.7% 31.4% 29.2% 29.5% 28.8% 28.7% 27.6% 27.5%
R&D% of Sales 14.4% 15.1% 14.4% 15.3% 15.6% 15.6% 15.7% 14.5% 12.9% 12.4% 12.7%
Operating Margin 25.5% 29.6% 36.5% 37.9% 36.6% 39.0% 38.0% 35.2% 38.1% 41.3% 41.9% Source: Compiled by MHBK/IRD based on public company reports. Note: this industry composite includes U.S. based big
pharma companies Pfizer, Merck, J&J, Eli Lilly and J&J (with their pre-merger predecessors).
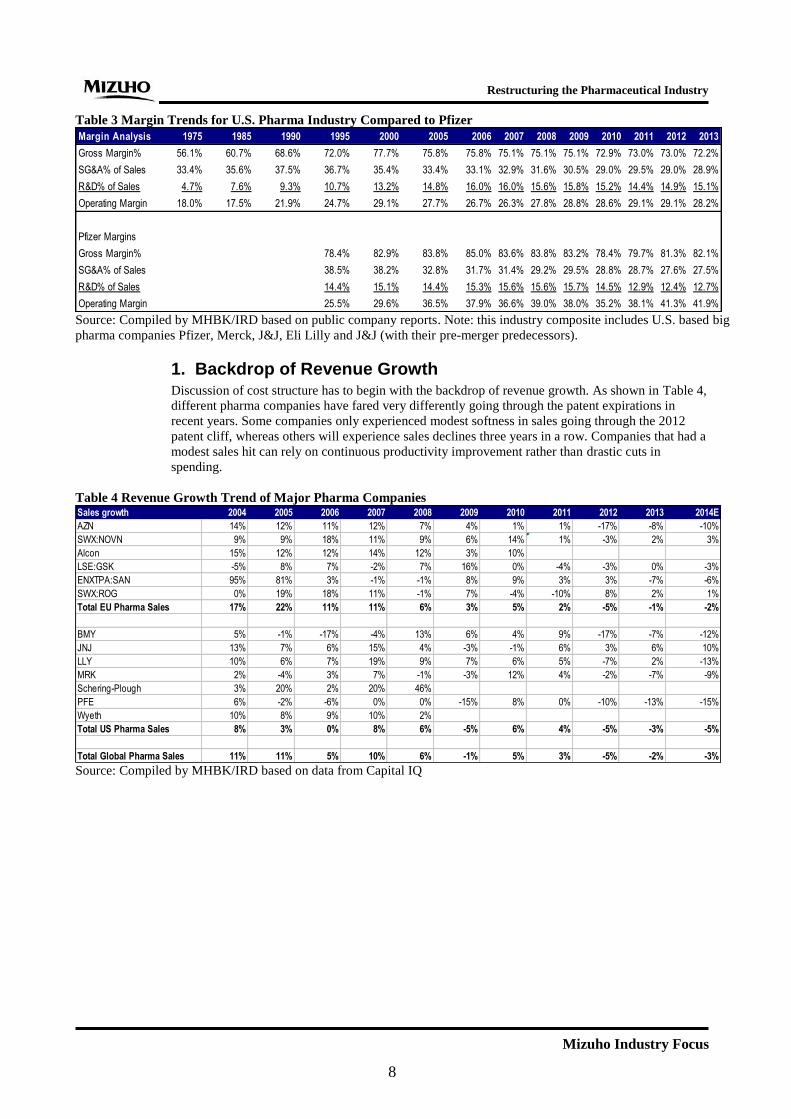
1. Backdrop of Revenue Growth Discussion of cost structure has to begin with the backdrop of revenue growth. As shown in Table 4,
different pharma companies have fared very differently going through the patent expirations in
recent years. Some companies only experienced modest softness in sales going through the 2012
patent cliff, whereas others will experience sales declines three years in a row. Companies that had a
modest sales hit can rely on continuous productivity improvement rather than drastic cuts in
spending.
Table 4 Revenue Growth Trend of Major Pharma Companies Sales growth 2004 2005 2006 2007 2008 2009 2010 2011 2012 2013 2014E
AZN 14% 12% 11% 12% 7% 4% 1% 1% -17% -8% -10%
SWX:NOVN 9% 9% 18% 11% 9% 6% 14% 1% -3% 2% 3%
Alcon 15% 12% 12% 14% 12% 3% 10%
LSE:GSK -5% 8% 7% -2% 7% 16% 0% -4% -3% 0% -3%
ENXTPA:SAN 95% 81% 3% -1% -1% 8% 9% 3% 3% -7% -6%
SWX:ROG 0% 19% 18% 11% -1% 7% -4% -10% 8% 2% 1%
Total EU Pharma Sales 17% 22% 11% 11% 6% 3% 5% 2% -5% -1% -2%
BMY 5% -1% -17% -4% 13% 6% 4% 9% -17% -7% -12%
JNJ 13% 7% 6% 15% 4% -3% -1% 6% 3% 6% 10%
LLY 10% 6% 7% 19% 9% 7% 6% 5% -7% 2% -13%
MRK 2% -4% 3% 7% -1% -3% 12% 4% -2% -7% -9%
Schering-Plough 3% 20% 2% 20% 46%
PFE 6% -2% -6% 0% 0% -15% 8% 0% -10% -13% -15%
Wyeth 10% 8% 9% 10% 2%
Total US Pharma Sales 8% 3% 0% 8% 6% -5% 6% 4% -5% -3% -5%
Total Global Pharma Sales 11% 11% 5% 10% 6% -1% 5% 3% -5% -2% -3% Source: Compiled by MHBK/IRD based on data from Capital IQ

Restructuring the Pharmaceutical Industry
Mizuho Industry Focus
9
2. R&D Expense Big pharma CEOs are often loath to cut R&D expense as they want to invest for the long-term
success of the company. On average, big pharma has kept its R&D spending relatively flat in recent
years (see Table 5).
However, some big pharma firms have significantly cut R&D expenses post big mergers. Following
the big mergers in 2009, as shown in Table5, Merck and Pfizer initially chose different paths in
R&D spending. Pfizer dramatically cut R&D spending from $11bn premerger ($7.6bn from Pfizer
and $3.4bn from Wyeth) to $6.55bn in 2013, which is even lower than Pfizer’s standalone R&D
spending. In contrast, Merck CEO defended the R&D spending after the merger in 2009. However,
after some disappointments in major late-stage compounds, last October Merck announced a cost
cutting program of $2.5bn to be realized before year 2015. Half of the savings will come from R&D.
With this cut, Merck’s R&D/sales ratio will decline from 17-18% of sales to about 15%. Although
Pfizer’s big cut in R&D spending didn’t have a notable impact on its near-term pipeline, it is likely
to have dealt a big blow to the early-mid stage portfolio. Pfizer’s recent bid for AstraZeneca to get
AZ’s attractive pipeline can be considered a form of “catch-up” spending in R&D.
Comparing Table 7 and Table 8 suggests big pharma firms’ new molecular entity (NME) portfolios
have stayed relatively flat over the last seven years. However the NMEs are distributed very
unevenly. We have seen substantially intra-company variability from 2007 to 2014. Mega pharma
companies (Pfizer, GSK, Sanofi, Merck), especially those that have gone through mergers, have
seen their NMEs decline substantially. But mid-sized biopharma companies (e.g., AZ, Lilly, and
BMY) or more innovation-focused biopharma companies (Roche and Novartis) have seen their
NME numbers rise (see Figure 2). So at this time pharma industry’s R&D is feast or famine
depending on which company it is.
The huge drop in NME number is especially pronounced for Pfizer. In 2007 Pfizer combined with
Wyeth had 138 NMEs in various stages of clinical development. Currently, Pfizer only has 63.
Therefore Pfizer has shrunk its pipeline by over half. It is questionable if a big pharma can sustain
long-term on this portfolio without significant downsizing or major acquisitions. The proposed AZ
merger will address this problem. The rationale for this business model is that if mega pharma such
as Pfizer cannot do productive in-house research, it should just buy from outside.
However, mid-cap pharma or more focused pharma companies have seen their NME pipeline
booming. Mid-cap pharma companies have often resisted cutting to R&D expenditures. For example,
Eli Lilly has opted to keep its R&D expense relatively flat through its patent expiries (which the
company calls year YZ). Lilly management pointed to some R&D underinvestment following the
Prozac patent expiry in 2001, which contributed to some weakness later on in its pipeline. Lilly is
spending over 24% of sales on R&D, which is the highest in the peer group (see Table 7). Lilly has
dramatically replenished its mid-late stage pipeline in recent years. Currently Lilly has 33
compounds in phase II/III/registration, which is markedly higher than 16 in 2007 and only 7 in late
2004. Of the big pharma peers, Eli Lilly has dealt with its cost structure most lightly. Its headcount
only declined 15% from 2005-2013 (see Table 2), with substantial numbers shed through
divestitures to CROs and attritions. For 2014, facing the patent expiries of two blockbuster drugs,
Lilly is finally projecting a substantial decrease in R&D spending (down 15-20%).The poor R&D
productivity at some of the bigger pharma companies is sometimes blamed on disruptions from
mergers and layoffs. Lilly has maintained its independence, which has contributed to better R&D
productivity. Besides Lilly, BMS is also a heavy spender on R&D. However this could be a virtuous
cycle as BMS is viewed as having one of the best pipelines in the industry. BMS spent ~23% of
sales on R&D in 2013 (see Table 7).

Restructuring the Pharmaceutical Industry
Mizuho Industry Focus
10
Table 5 R&D Growth Trend of Major Pharma Companies R&D growth 2004 2005 2006 2007 2008 2009 2010 2011 2012 2013 2014E
AZN 15% -3% 15% 28% -2% -13% -3% 10% -5% 0%
NVS 11% 8% 19% 21% 7% 7% 11% 5% -1% 6%
Alcon 12% 8% 21% 10% 10% 6% 13%
GSK 1% 8% 10% -6% 8% 13% -3% 5% -11% -1%
Sanofi 82% 69% 10% 2% 1% 1% -2% 5% 2% -3% Slight increase
Roche 8% 10% 28% 14% 5% 10% -5% -11% 5% 7%
Total EU Pharma R&D Expense 21% 16% 16% 15% 6% 0% 1% 6% -4% 3%
US
BMY 12% 10% 10% 2% 6% 4% 4% 5% 2% 1%
JNJ 14% 18% 13% 8% -1% -8% -2% 10% 2% 7%
LLY 19% 8% 3% 11% 10% 13% 13% 3% 5% 5% (20%) - (15%)
MRK 23% -5% 4% 15% 3% 0% 1% -6% 2% -10% Below 2013
Schering-Plough 4% 14% 26% 34% 21%
PFE -5% -3% 0% 2% -1% -13% 0% -15% -16% -2% (3%) - 5%
Wyeth 11% 18% 13% 5% 3%
Total U.S. Pharma R&D expense 8% 6% 8% 9% 4% -4% 2% -3% -2% 0%
Total Global Pharma R&D expense 14% 10% 12% 12% 5% -2% 1% 2% -3% 1% Source: Compiled by MHBK/IRD based on data from Capital IQ
Table 6 R&D as % of Sales for Major Pharma Companies R&D % Sales 2004 2005 2006 2007 2008 2009 2010 2011 2012 2013
AZN 16.2% 14.1% 14.7% 16.8% 15.4% 12.9% 12.3% 13.4% 15.3% 16.7%
SWX:NOVN 15.2% 15.0% 15.2% 16.5% 16.2% 16.4% 15.8% 15.7% 16.0% 16.5%
Alcon 10.0% 9.7% 10.5% 10.1% 9.8% 10.1% 10.4%
LSE:GSK 14.5% 14.5% 14.9% 14.2% 14.4% 13.9% 13.5% 14.7% 13.6% 13.4%
ENXTPA:SAN 15.2% 14.2% 15.0% 15.5% 15.9% 14.8% 13.4% 13.7% 13.6% 14.3%
SWX:ROG 16.6% 15.3% 16.8% 17.2% 18.2% 18.7% 18.5% 18.3% 17.9% 18.7%
Total EU Pharma R&D % Sales 15.3% 14.5% 15.2% 15.8% 15.9% 15.4% 14.7% 15.3% 15.4% 16.0%
BMY 12.4% 13.7% 18.1% 19.2% 17.9% 17.5% 17.6% 17.0% 20.9% 22.7%
JNJ 11.3% 12.5% 13.4% 12.6% 11.9% 11.3% 11.1% 11.6% 11.4% 11.5%
LLY 20.3% 20.7% 19.9% 18.7% 18.9% 19.8% 21.2% 20.7% 23.4% 23.9%
MRK 17.5% 17.4% 17.5% 18.8% 19.6% 20.5% 17.9% 16.1% 16.7% 16.2%
Schering-Plough 17.7% 16.8% 20.7% 23.1% 19.1% 19.0%
PFE 14.5% 14.4% 15.3% 15.6% 15.6% 15.7% 14.5% 13.1% 12.3% 12.7%
Wyeth 13.3% 14.6% 15.2% 14.5% 14.6% 15.0%
Total US Pharma R&D % Sales 14.3% 14.8% 16.0% 16.0% 15.6% 15.8% 15.2% 14.5% 14.9% 15.1%
Total Global Pharma R&D % Sales 14.7% 14.7% 15.6% 15.9% 15.7% 15.6% 15.0% 14.9% 15.2% 15.6% Source: Compiled by MHBK/IRD based on data from Capital IQ

Restructuring the Pharmaceutical Industry
Mizuho Industry Focus
11
Table 7 The Number of NMEs in Big Pharma's Pipeline, 2014
2014 Phase I Phase II Phase I + II Phase III Filed Total NMEs in clinic Time of Company Update
BMY 15 7 22 6 1 29 2014 company website
PFE + Wyeth 31 19 50 9 4 63 November 2013 update
LLY 24 22 46 8 3 57 2014 company website
MRK + SGP* 30 12 42 14 7 63 2014 company website
Roche 32 28 60 8 1 69 2014 company website
AZN 32 28 60 8 3 71 May 2014 Investor update
NVS 22 23 45 9 1 73 1Q14 result, Nov. 2012 R&D Day
GSK 26 28 54 5 0 59 Feb 2014 update
Sanofi-Aventis 23 14 37 11 1 49 Feb. 2014 update
Sector 416 78 21 515 Source: Compiled by MHBK/IRD based on public company reports. Note 1: Big pharma have different policies in
disclosing their NME portfolios. Sometimes we estimated the number based on either most recent updates or our
estimate. This is most relevant for GSK, Novartis and Merck. Note 2: we only counted novel vaccines as NMEs. Note
*: Merck (MRK) didn’t disclose phase I NME number, we estimated based on industry average adjusted for its size.
Table 8 The Number of NMEs in Big Pharma's Pipeline, 2007
2007 Phase I Phase II Phase I + II Phase III Filed Total NMEs in clinic Time of Company Update
BMY 13 6 0 19 Feb 2007
PFE 51 38 89 6 4 99 Nov 2006
WYE 18 13 31 2 6 39 Oct 2006
LLY 8 11 19 5 0 24 Dec 2006
MRK 28 21 49 5 3 57 Dec 2006
SGP 6 8 14 3 1 18 Feb 2007
Roche 25 18 43 3 2 48 Feb 2007
AZN 22 18 40 5 0 45 Early 2007
NVS 20 20 40 7 3 50 Feb 2006
GSK 38 50 88 13 9 110 Feb 2007
Sanofi-Aventis 24 29 53 14 2 69 Feb 2007
Sector 479 69 30 578 Source: Compiled by MHBK/IRD based on public company reports. Note: we estimated Schering-Plough (SGP) had 6
phase I compounds in 2007.
Figure 2 Change of Total Number of NMEs from 2007-2014
19
138
24
75
48 4550
110
69
29
6357
6369 71 73
5949
0
20
40
60
80
100
120
140
160
BMY Pfizer Lilly Merck Roche AZ Novartis GSK Sanofi
Nu
mb
er
of
NM
Es i
n P
ipeli
ne
Total NMEs 2007 Total NMEs 2014
Source: Compiled by MHBK/IRD based on public company reports. Note: data used in this chart are based on
numbers in the two tables above and therefore are subject to the same limitations.
Restructuring the Pharmaceutical Industry
Mizuho Industry Focus
12
3. SG&A Expense In the U.S. and EU markets, the importance of payers has been steadily on the rise, while the
benefits from influencing physicians via sales reps have been on the decline. Therefore, large
pharma has shifted to a key account management model, which relies on contracting to compete for
market share. At the same time, big pharma has substantially curtailed the size of its sales force. The
sales force targeting the primary care market was especially hit hard in this retrenchment from
primary care to specialty care medicines.
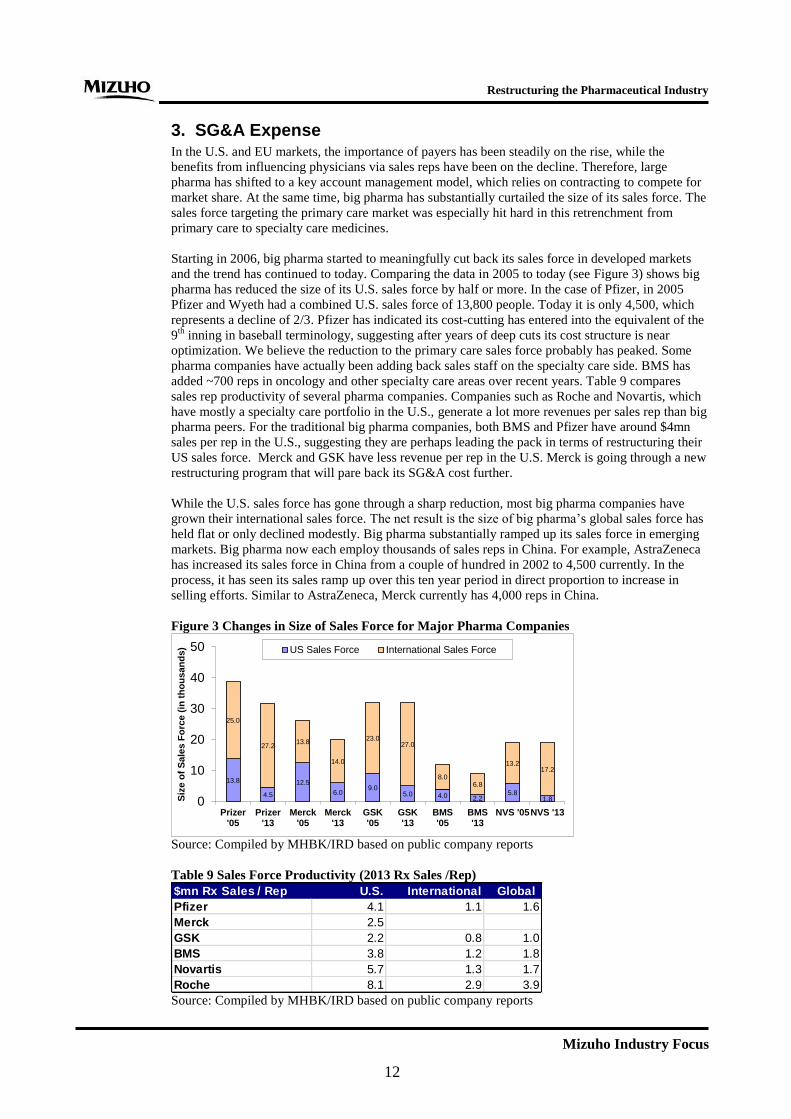
Starting in 2006, big pharma started to meaningfully cut back its sales force in developed markets
and the trend has continued to today. Comparing the data in 2005 to today (see Figure 3) shows big
pharma has reduced the size of its U.S. sales force by half or more. In the case of Pfizer, in 2005
Pfizer and Wyeth had a combined U.S. sales force of 13,800 people. Today it is only 4,500, which
represents a decline of 2/3. Pfizer has indicated its cost-cutting has entered into the equivalent of the
9th
inning in baseball terminology, suggesting after years of deep cuts its cost structure is near
optimization. We believe the reduction to the primary care sales force probably has peaked. Some
pharma companies have actually been adding back sales staff on the specialty care side. BMS has
added ~700 reps in oncology and other specialty care areas over recent years. Table 9 compares
sales rep productivity of several pharma companies. Companies such as Roche and Novartis, which
have mostly a specialty care portfolio in the U.S., generate a lot more revenues per sales rep than big
pharma peers. For the traditional big pharma companies, both BMS and Pfizer have around $4mn
sales per rep in the U.S., suggesting they are perhaps leading the pack in terms of restructuring their
US sales force. Merck and GSK have less revenue per rep in the U.S. Merck is going through a new
restructuring program that will pare back its SG&A cost further.
While the U.S. sales force has gone through a sharp reduction, most big pharma companies have
grown their international sales force. The net result is the size of big pharma’s global sales force has
held flat or only declined modestly. Big pharma substantially ramped up its sales force in emerging
markets. Big pharma now each employ thousands of sales reps in China. For example, AstraZeneca
has increased its sales force in China from a couple of hundred in 2002 to 4,500 currently. In the
process, it has seen its sales ramp up over this ten year period in direct proportion to increase in
selling efforts. Similar to AstraZeneca, Merck currently has 4,000 reps in China.
Figure 3 Changes in Size of Sales Force for Major Pharma Companies
13.8
4.5
12.5
6.09.0
5.0 4.0 2.25.8
1.8
25.0
27.213.8
14.0
23.027.0
8.06.8
13.217.2
0
10
20
30
40
50
Prizer'05
Prizer'13
Merck'05
Merck'13
GSK'05
GSK'13
BMS'05
BMS'13
NVS '05NVS '13
Siz
e o
f S
ale
s F
orc
e (
in t
ho
usan
ds) US Sales Force International Sales Force
Source: Compiled by MHBK/IRD based on public company reports
Table 9 Sales Force Productivity (2013 Rx Sales /Rep)
$mn Rx Sales / Rep U.S. International Global
Pfizer 4.1 1.1 1.6
Merck 2.5
GSK 2.2 0.8 1.0
BMS 3.8 1.2 1.8
Novartis 5.7 1.3 1.7
Roche 8.1 2.9 3.9 Source: Compiled by MHBK/IRD based on public company reports

Restructuring the Pharmaceutical Industry
Mizuho Industry Focus
13
4. Manufacturing Expense Big pharma realized early on that there was significant room to cut manufacturing expense through
consolidation of plants and procurement. Although transferring products across plants and closing
plants require some heavy lifting, manufacturing is actually the low-hanging fruit for cost-cutting as
the impact on the top line is minimal. Therefore pharma companies often cut manufacturing expense
ahead of R&D expense and concurrently with sales and marketing expense. Pfizer is again a trend-
setter in terms of cutting manufacturing expense. It is on track to reduce the number of
manufacturing sites by half from 96 before the Wyeth merger to 50.
Despite the substantial cut in manufacturing expense, the beneficial effect on gross margins is more
than offset by margin erosion from the loss of revenues of high-margin blockbuster drugs. The result
is a declining gross margin trend across big pharma (see Table 11).
Table 10 Reduction in Manufacturing Sites by Big Pharma
Company Number of Manufacturing Sites in 2005 Number of manufacturing sites currently
PFE 96 at merger in 2009 56 (6 more targeted for exit)
MRK 95 at merger in 2009 68
BMY 38 12
LLY 25 22
AZN 30 22
GSK 82 87 Source: Compiled by MHBK/IRD based on public company reports. Note that for Merck, the animal
health business accounts for a large number of manufacturing sites (as many as 30).
Table 11 Evolution of Big Pharma Gross Margins
Gross Margins 2004 2005 2006 2007 2008 2009 2010 2011 2012 2013
AZN 75.9% 78.0% 79.0% 79.7% 80.8% 83.0% 81.6% 81.8% 81.2% 80.0%
NVS 75.4% 75.0% 73.2% 72.8% 73.3% 72.9% 72.6% 68.7% 67.9% 66.8%
Alcon 72.4% 75.3% 75.6% 75.5% 76.6% 75.2% 76.7%
GSK 78.2% 78.0% 78.4% 77.1% 76.3% 75.0% 72.9% 72.3% 71.3% 69.7%
Sanofi 71.8% 74.8% 74.3% 74.1% 74.5% 74.3% 72.8% 70.3% 69.1% 67.0%
Roche 75.2% 74.9% 69.8% 71.6% 71.6% 71.9% 73.4% 73.7% 74.9% 74.6%
Total EU Pharma Gross Margins 76.9% 77.6% 76.4% 77.4% 77.9% 76.8% 76.2% 75.6% 74.4% 73.2%
BMY 70.4% 70.2% 67.6% 69.6% 71.4% 73.3% 73.5% 74.0% 75.5% 70.4%
JNJ 71.5% 72.3% 71.8% 70.9% 71.0% 70.4% 69.5% 68.8% 68.4% 68.7%
LLY 76.6% 76.3% 77.4% 77.2% 78.8% 80.6% 81.1% 79.1% 78.8% 78.8%
MRK 78.4% 77.4% 76.7% 76.6% 77.1% 73.0% 65.3% 66.0% 65.6% 63.7%
Schering-Plough 64.4% 67.8% 66.5% 67.3% 65.3% 65.4%
PFE 85.7% 83.8% 85.0% 83.6% 83.8% 83.2% 78.4% 79.7% 81.3% 82.1%
Wyeth 71.5% 71.8% 73.2% 72.9% 73.7% 74.3%
Total US Pharma Gross Margins 76.4% 75.8% 75.8% 75.1% 75.1% 75.1% 72.9% 73.0% 73.0% 72.2%
Total Global Pharma Gross Margins 76.6% 76.6% 76.1% 76.2% 76.5% 76.0% 74.6% 74.3% 73.7% 72.8% Source: Compiled by MHBK/IRD based on data from Capital IQ

Restructuring the Pharmaceutical Industry
Mizuho Industry Focus
14
III. Capital Allocations by Big Pharma Capital allocation is a very important decision for big pharma. It is the progressive capital allocation
decisions in recent years that propelled some big pharma’s stock price appreciation. The simple corporate
finance tenet indicates if a pharma can find projects with returns above its hurdle rate, it should reinvest in its
business. Otherwise it should return the cash to shareholders. Quality and quantity of pipeline varies greatly
among pharma, thus necessitating various levels of internal investment. In addition, it seems pharma’s ability
to make good acquisitions also various significantly. Although there is huge uncertainty in the drug business,
the outcome of acquisitions in our view cannot be explained simply by luck. Some companies such as Pfizer
have consistently made bad biotech acquisitions in the past. But some other companies have done better
(more on this topic in the next section). To its credit, Pfizer took an honest look at itself in the mirror and
decided it is better to return cash to shareholders than continuing on the path of high-risk acquisitions.
Overall big pharma have adopted aggressive capital allocation policies to return cash to shareholders. Pfizer
is again a poster boy for aggressively returning cash flow to shareholders in recent years. Besides Pfizer,
other companies including Merck, BMS, J&J, Eli Lilly, AZ and GSK have also been aggressive in returning
cash.
1. Dividends payout
Dividend is considered sacrosanct in the pharma industry and no big pharma has cut dividends even if they
face harsh times. Historically, big pharma pays out ~50% of net income as dividends and the variability is
small across pharma (see Figure 4). The payout ratio varies depending on the ebb and flow of profit (see
Figure 5), while the actual dividends are held steady or growing slightly. As the short-term earnings took a hit
from patent expiries, the ratio has gone up for several companies such as BMS and Lilly.
Figure 4 Total Cash Return to Shareholders % Net Income in 2013
0%
20%
40%
60%
80%
100%
120%
140%
160%
PF
E
MR
K
BM
Y
LLY
JN
J
AZ
N
GS
K
SA
N
NV
S
Roche
Avera
ge
Dividends Buyback
Source: Compiled by MHBK/IRD based on public company reports.
2. Share buybacks
Pharma have great flexibility in terms of their share repurchase decisions. In recent years, overall big pharma
have significantly dialed up their share repurchases as a means to return cash to shareholders (see Figure 5).
Big pharma differ widely in how much buybacks they conduct (Figure 4).

Restructuring the Pharmaceutical Industry
Mizuho Industry Focus
15
Figure 5 US/EU Pharma Industry Average Payouts to Shareholders
50%
45%
50%
43%
50%48%
24%
3%
10%
26%
35%
31%
0%
10%
20%
30%
40%
50%
60%
2008 2009 2010 2011 2012 2013
% o
f N
et
Inc
om
eIndustry Average Dividend Payout Ratio
Average Share Buyback as % of Net Income
Source: Compiled by MHBK/IRD based on data from Capital IQ
If a company sees few opportunities to reinvest in its business, it should pursue share buybacks aggressively.
Pfizer is the poster boy for big share buybacks. As shown in Figure 6, Pfizer stepped up share repurchases
over the last three years as it returned almost 90% of net income to shareholders. Pfizer has found the
valuation of biotech companies often excessive and therefore it is challenging to find suitable acquisition
targets. Instead of paying out big acquisition premiums to enrich other companies’ shareholders, Pfizer would
rather buy back its own shares to enrich its own shareholders. Therefore, Pfizer has been pursuing share
buybacks with a vengeance. In contrast, Merck has done much less share repurchasing than Pfizer. However,
in May 2013, in a change of course, Merck announced a new $15bn share repurchase program, half of which
will be completed within 12 months. In over a month (as of June 30, 2013), Merck repurchased $5bn worth
of company stock. We believe much of the step-up could be due to shareholder pressure and peer pressure
from Pfizer. However, after the $7.5bn repurchase in the first year, the remaining $7.5bn is likely to be
completed over a longer period. This is because Merck now recognizes a higher urgency to do business
development deals to support its top-line.
Figure 6 Trend of Cash Flow Return to Shareholders by Pfizer and Merck
52%
39%34% 34%
40%43%
107%
50%49%
6%3% 0%
0%
20%
40%
60%
80%
100%
120%
2008 2009 2010 2011 2012 2013
% N
et
Inc
om
e
Pfizer Div. Pfizer Buyback
45%47%
44%40%
44%
49%
62%
0%
37%
15% 16%
22%
0%
10%
20%
30%
40%
50%
60%
70%
2008 2009 2010 2011 2012 2013
% N
et
Inco
me
Merck Div. Merck Buyback
Source: Compiled by MHBK/IRD based on data from Capital IQ. Note: the spike in Pfizer’s 2013 share buyback was
due to the one-time proceeds from selling ancillary businesses

Restructuring the Pharmaceutical Industry
Mizuho Industry Focus
16
Share buyback is often a trade-off with investment in the internal pipeline or external business development
deals. Companies with rich pipelines such as Roche and Novartis do little share buybacks (see Figure 7). We
believe this is a virtuous cycle and should be the first option if there is indeed a very attractive internal
pipeline.
Figure 7 Trend of Cash Flow Return to Shareholders by Roche and Novartis
45% 44%
50%54%
50% 51%
11%
3%6%8%
3%
7%
0%
10%
20%
30%
40%
50%
60%
2008 2009 2010 2011 2012 2013
% N
et
Inc
om
e
Roche Div. Roche Buyback
36%39% 38% 40%
47% 49%
24%
5%
36%
3%
27%
4%
0%
10%
20%
30%
40%
50%
60%
2008 2009 2010 2011 2012 2013
% N
et
Inco
me
NVS Div. NVS Buyback
Source: Compiled by MHBK/IRD based on data from Capital IQ
For companies pressured by near-term patent expiries, often times they tried to do substantial share
repurchases to boost stock price. Examples include AstraZeneca and BMS (see Figure 8). However, they
cannot dodge the need to boost revenues and therefore they often come around to curtail share buybacks in
favor of M&A. Both AZ and BMS have suspended their share repurchase programs despite aggressive
buybacks over the last two years. When the new CEO joined AZ in the middle of 2012, AZ suspended share
repurchase. Instead of buybacks, it is using the cash to do licensing deals or make acquisitions. In 3Q2013
earnings call, BMS announced suspension of share repurchase. The sharp jump in BMS share over the last
year may be one of the reasons why the company is not buying back more shares at a higher price level.
Figure 8 Trend of Cash Flow Return to Shareholders by BMS and AstraZeneca
71%68%
59% 57%
68%
76%
14%
71%
31%
15%
0% 0%
0%
10%
20%
30%
40%
50%
60%
70%
80%
90%
2008 2009 2010 2011 2012 2013
% N
et
Inc
om
e
BMS Div. BMS Buyback
39%
33%36% 38%
45%
55%
0%0%
9%
28%
61%
33%
0%
10%
20%
30%
40%
50%
60%
70%
2008 2009 2010 2011 2012 2013
% N
et
Inco
me
AZ Div. AZ Buyback
Source: Compiled by MHBK/IRD based on data from Capital IQ
3. Capital Allocation Policies
Big pharma have made various comments on their capital allocation policies (see Table 12). We can divide
the large pharma universe broadly into the three camps as discussed previously. We note this classification is
not so rigid. For example, Merck’s priority is probably transitioning from share buyback to business
development. Also companies can pursue multiple priorities at the same time. For example, BMS is investing
in its rich pipeline and at the same time pursuing external product acquisitions.

Restructuring the Pharmaceutical Industry
Mizuho Industry Focus
17
Table 12 Summary of Publicly Stated Capital Allocation Policies
Company Public Comments on Capital Allocation Policies
Priority is given to returing cash to shareholders
Pfizer Pfizer will maintain its dividends. Share repurchase is the option to beat. Pfizer repurchased $8.2bn in shares
in 2012 and $9bn in 2011. In 2013 with the windfall of cash from selling its nutritional business and the IPO of
Zoetis, Pfizer is expected to do share repurchases in the mid-teen billions range. Pfizer has said that currently
biotech assets are priced for perfection, but that it will keep looking. Returning cash to shareholders is a good
option.
Merck Returning cash to shareholders is high priority in the near term. Merck announced a $15bn share repurchase
program in May 2013, half of which will be completed within 12 months. $5bn had been completed by Q2.
Maintain or grow dividends. Since the new R&D head took office, M&A/licensing has gone up in priority.
Merck can rely on its strong balance sheet for M&A.
GSK The first priority is to increase dividends. The second is to look at buybacks and bolt-on acquisitions. GSK
has a steady £1-2bn per year buyback program. Recently given the abundant internal R&D pipeline, GSK has
said the hurdle for bolt-on acquisition has gone up. Not interested in large M&A.
Priority is to do acquisitions or licensing deals
BMS Progressive dividend policy (maintain or increase dividends each year). Business development is high priority.
In 3Q13 call, BMS announced temporary suspension of share buyback activities.
AZ Reinvest up to 50% of post-tax, pre-R&D on-market cashflows to drive future growth and value. For the other
50%, maintain progressive dividend policy, and use the remainder for acquisitions or share buybacks. AZ
suspended share buyback in October 2012 after new management came in.
Priority is invest in own pipeline
Roche Has not set a target. Increase dividends each year. Limited share buybacks. Invests in pipeline.
Novartis Steady growth in dividends.
Eli Lilly Maintain dividends at current level. Then first priority is to invest in own pipeline. Second is to supplement with
business development deals. And third is to return money to shareholders through share buybacks or other
means. Not interested in big mergers.
Sanofi Maintain or steadily grow dividends. Good level of buybacks. Source: Compiled by MHBK/IRD based on public company reports

Restructuring the Pharmaceutical Industry
Mizuho Industry Focus
18
IV. Pharmaceutical Industry Competitive Strategies
A. Big Pharma’s Sharpened TA Focus Creates Room for Deals
1. Current Pharmaceutical Industry Requires A Focused Strategy
From the R&D standpoint, there is a wide perception that medicines for easily druggable targets have already
been invented. To discover new medicines, pharma companies have to dig deeper into more complex diseases.
Concurrent with the explosion of genomics tools and other enabling technologies, the task of understanding a
disease is also getting more complicated. To succeed competitively, it is important for big pharma to have
innovation leadership in the chosen disease. For example, it is no longer tenable to say you are focused on
cancer. It may not be sufficient to say you focus on hematological cancer or solid tumors. Increasingly,
companies have to choose which type of cancer they are focused on (for example lung cancer or breast
cancer). This increasing fragmentation presents both challenges and opportunities. The opportunity is for a
relatively small company to dominate in a small niche. The challenge is for big pharma to compete and win
in a broad array of fragmented markets.
From the marketing standpoint, it is beneficial to have a portfolio of drugs with different mechanisms of
actions to target a single disease. This way, companies can increase the productivity of sales calls (a single
doctor visit can promote multiple drugs) and pursue FDC (fixed dosed combinations). One prominent
example is in diabetes. As shown in Table 13, big pharma increasingly is amassing a portfolio of oral and
injectable drugs for diabetes. In doing so, pharma companies can be more effective in marketing to
endocrinologists and primary care doctors. Highlighted in Table 15 are the alliances in diabetes forged by big
pharma companies. For example, Merck has achieved great success with just one drug in diabetes. But with
multiple DPP-4 inhibitors entering the market, the growth of the Januvia franchise has screeched to a halt.
Recognizing the benefit of a portfolio approach, Merck recently licensed a SGLT-2 inhibitor Ertugliflozin
from Pfizer and also entered into a JV to develop long-acting insulin with Samsung. Eli Lilly is a primary
beneficiary in its alliance with Boehinger Ingelheim, through which it acquired 2 oral diabetes drugs. AZ and
BMS have pooled their diabetes resources together to create a category leader. The AZ/BMS alliance also
acquired Amylin to fill the hole in the GLP-1 class. Then AZ bought out BMS’s interest in the alliance in late
2013.
Table 13 Comparison of Diabetes Portfolios of Big Pharma
Administration Target Lilly Merck Novo Nordisk AZ Sanofi GSK J&J Takeda
DPP-4 Trajenta Junuvia Onglyza Nesina
SGLT-2 Empagliflozin Ertugliflozin Forxiga Invokana
GLP-1 Dulaglutide Victoza Byetta /
Bydureon
Lyxumia Albiglutide
Insulin √ √ √ √
Injectable
Oral
Source: Compiled by MHBK/IRD based on public company reports. Note: checkmark for insulin indicates the
company either have commercial insulin or have insulin in clinical development.

Restructuring the Pharmaceutical Industry
Mizuho Industry Focus
19
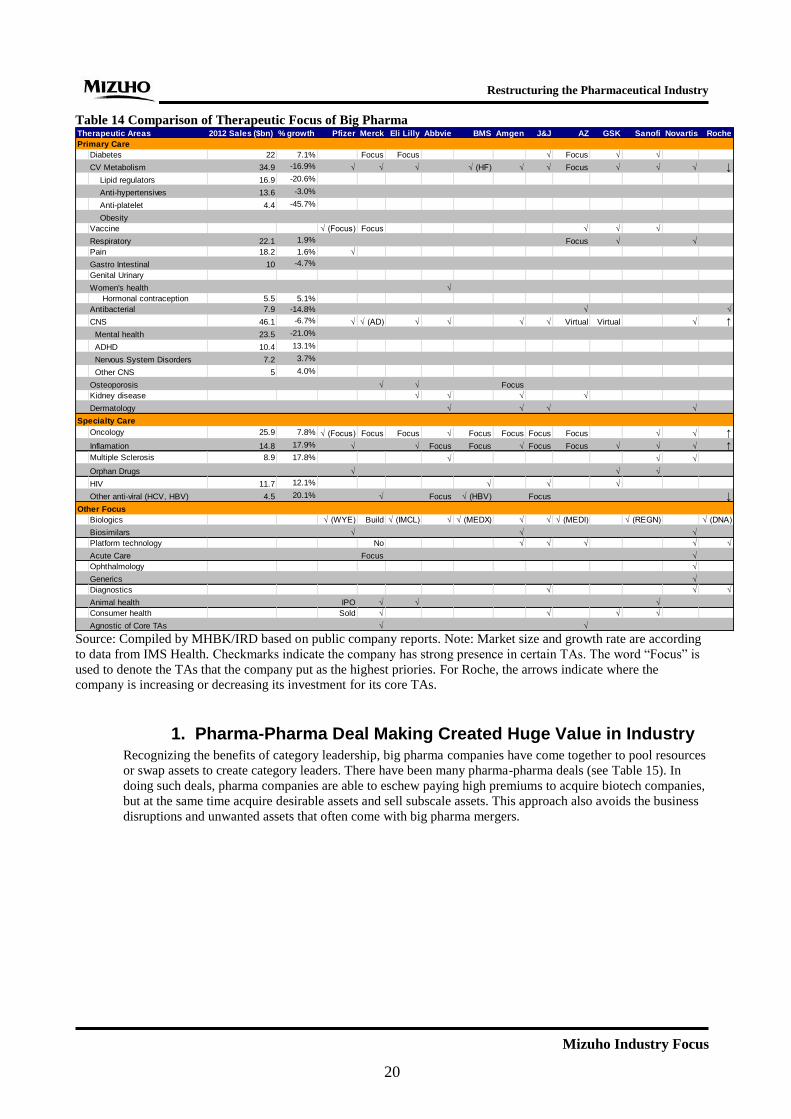
2. TA Focus of Big Pharma – A Roadmap for Asset Swapping As shown in Table 14, although pharma companies have a commercial presence in many areas through
their legacy businesses, for R&D, they are typically focused on just a few TAs. Table 14 also serves as a
roadmap for pharma asset swapping. For example recently Novartis signed a huge deal with GSK, in
which GSK sold its oncology business to Novartis for $14.5bn, acquired Novartis’s vaccine business for
$5.25bn and pooled their consumer healthcare businesses into a JV with Novartis owning a minority
stake. Novartis also sold its animal health business to Eli Lilly for $5.4bn.
Several observations can be drawn from Table 14:
Big pharma has sharply focused its targeted therapeutic areas (TAs). For example, in a
reorganization announced in October 2013, Merck announced it will focus on four TAs –
vaccine, oncology, diabetes and acute care.
Many pharma companies are simultaneously attracted to the high growth areas such as diabetes,
oncology, inflammation and HCV. This makes the field super-competitive and valuation of
biotech assets very expensive. Pharma companies are also attracted to areas where science is on
the cusp of a breakthrough and being translated into medicine. One such example is fibrosis in
the specialty medicine area.
Big pharma companies are shunning TAs that are viewed as being largely satisfied with existing
therapies or very risky to develop new drugs. Examples for each include GI and CNS
respectively. AZ has exited the GI field as it is hard to innovate beyond proton pump inhibitors.
Both AZ and GSK have exited the internal CNS research area.
There is “spatial” as well as “temporal” positioning for TA focus. Spatial focus is simply where
the companies want to place their bets at a given time. Temporal focus means a company may
decide to invest very differently for late-stage assets and discovery research efforts. For
example, mid-late stage HCV pipeline is viewed as full and many companies are operating at
full-throttle to develop them. But industry thinks the current pipeline will largely satisfy the
unmet medical need and there is no need for early R&D efforts in HCV. The reverse is true for
HBV where there are few late-stage assets but a number of companies are pursuing early-stage
programs actively.
For ancillary businesses, following Pfizer’s successful IPO of its animal health business Zoetis,
there is increasing pressure for other pharma companies to consider such divestiture. Some
pharma appreciate the stable ancillary business (e.g., Eli Lilly wants to keep the animal health
business). But that may not be the case for other big pharma companies (e.g., Merck, Novartis,
and GSK). Eli Lilly just acquired Novartis Animal Health for $5.4bn.
Different pharma have different appetite for platform technologies. Most big pharma companies
have by now built biologic capabilities through acquisitions. Different companies have different
appetite for investing in futuristic platform technologies. Companies such as Merck, which was
burned by prior platform deals such as Sirna, have decided to eschew platform acquisitions. In
contrast, AstraZeneca has inked multiple platform deals recently for ADC technology (Spirogen
and ADC Therapeutics), cancer immunotherapy technology (Amplimmune) and mRNA
therapeutics (with Moderna).
Restructuring the Pharmaceutical Industry
Mizuho Industry Focus
20
Table 14 Comparison of Therapeutic Focus of Big Pharma Therapeutic Areas 2012 Sales ($bn) % growth Pfizer Merck Eli Lilly Abbvie BMS Amgen J&J AZ GSK Sanofi Novartis Roche
Primary Care
Diabetes 22 7.1% Focus Focus √ Focus √ √
CV Metabolism 34.9 -16.9% √ √ √ √ (HF) √ √ Focus √ √ √ ↓
Lipid regulators 16.9 -20.6%
Anti-hypertensives 13.6 -3.0%
Anti-platelet 4.4 -45.7%
Obesity
Vaccine √ (Focus) Focus √ √ √
Respiratory 22.1 1.9% Focus √ √
Pain 18.2 1.6% √
Gastro Intestinal 10 -4.7%
Genital Urinary
Women's health √
Hormonal contraception 5.5 5.1%
Antibacterial 7.9 -14.8% √ √
CNS 46.1 -6.7% √ √ (AD) √ √ √ √ Virtual Virtual √ ↑
Mental health 23.5 -21.0%
ADHD 10.4 13.1%
Nervous System Disorders 7.2 3.7%
Other CNS 5 4.0%
Osteoporosis √ √ Focus
Kidney disease √ √ √ √
Dermatology √ √ √ √
Specialty Care
Oncology 25.9 7.8% √ (Focus) Focus Focus √ Focus Focus Focus Focus √ √ ↑
Inflamation 14.8 17.9% √ √ Focus Focus √ Focus Focus √ √ √ ↑Multiple Sclerosis 8.9 17.8% √ √ √
Orphan Drugs √ √ √
HIV 11.7 12.1% √ √ √
Other anti-viral (HCV, HBV) 4.5 20.1% √ Focus √ (HBV) Focus ↓
Other Focus
Biologics √ (WYE) Build √ (IMCL) √ √ (MEDX) √ √ √ (MEDI) √ (REGN) √ (DNA)
Biosimilars √ √ √
Platform technology No √ √ √ √ √
Acute Care Focus √
Ophthalmology √
Generics √
Diagnostics √ √ √
Animal health IPO √ √ √
Consumer health Sold √ √ √ √
Agnostic of Core TAs √ √ Source: Compiled by MHBK/IRD based on public company reports. Note: Market size and growth rate are according
to data from IMS Health. Checkmarks indicate the company has strong presence in certain TAs. The word “Focus” is
used to denote the TAs that the company put as the highest priories. For Roche, the arrows indicate where the
company is increasing or decreasing its investment for its core TAs.
1. Pharma-Pharma Deal Making Created Huge Value in Industry Recognizing the benefits of category leadership, big pharma companies have come together to pool resources
or swap assets to create category leaders. There have been many pharma-pharma deals (see Table 15). In
doing such deals, pharma companies are able to eschew paying high premiums to acquire biotech companies,
but at the same time acquire desirable assets and sell subscale assets. This approach also avoids the business
disruptions and unwanted assets that often come with big pharma mergers.

Restructuring the Pharmaceutical Industry
Mizuho Industry Focus
21
Table 15 Pharma-Pharma Deals Partner I Partner II Upfront payments ($mn) Deal Year
Bayer Merck $14,200 for Consumer;
$1,000 for sGC
Bayer acquired Merck Consumer Care for $14.2bn. Entered into
collaboration of sGC modulators for $1bn upfront payment.
2014
Novartis Eli Lil ly $5,400 Sold animal health business to Eli Lil ly Elanco. 2014
Novartis GSK $14.5bn for oncology;
$5.25bn for vaccine.
Acquired GSK oncology business, sold Vaccine business to GSK. Pooled
consumer healthcare business with GSK's to create a category leader,
retaining a minority stake in the JV with a put option to exit.
2014
Eli Lil ly Pfizer $200 Collaborate to develop anti-nerve growth factor pain drug tanezumab 2013
AstraZeneca BMS $2,700 AZ acquired BMS's stake in the diabetes all iance 2013
Servier Amgen $50 Amgen gains U.S. rights to heart failure drug ivabradine and a phase II
compound also for CHF. Servier gains EU rights to omecamtiv mecarbil for
heart failure.
2013
Merck Pfizer $60 Merck and Pfizer will collaborate on SGLT2 inhibitor Ertugliflozin and fixed
dose combos with Januvia. Ertugliflozin will enter into phase III in 2013.
Profit split 60-40.
2013
Lundbeck Otsuka $150 Otsuka further expanded alliance with Lundbeck by co-developing Lu
AE58054 for Alzheimer's disease.
2013
Otsuka Lundbeck $200 Global collaboration including injectable Abilify and OPC-34712 from
Otsuka and three compounds from Lundbeck.
2011
Otsuka Kyowa Hakko
Kirin
¥3.0 bill ion; ¥8.2 bill ion
at approval
Otsuka sub-licensed Saxagliptin to KHK. Strategic all iance to develop KHK's
oncology portfolio in Japan and Asia.
2012
BMS Astra Zeneca $100 Entered into an all iance to co-develop BMS's DPPIV inhibitor and SGLT-2
inhibitor; jointly acquired Amylin; merged their U.S. commercial operation
in diabetes in January 2013.
2007
2012
Amgen Astra Zeneca $50 Jointly develop and commercialize five inflammatory disease treatments in
Amgen's portfolio.
2012
Boehringer
Ingelheim
Eli Lil ly € 300 Entered into an all iance to co-develop and market four mid-late stage
diabetes assets, including BI's DPPIV and SGLT2 inhibitors, and two insulin
products from Lilly (dropped later on)
2011
GSK Pfizer /
Shionogi
Pooled HIV franchise under ViiV Healthcare. GSK owns 76.5%, Pfizer owns
13.5% and Shinogi owns 10%.
2009
Amgen Takeda $300 Licensed rights of 13 clinical candidates in Japan, global co-development
right to TKI motesanib
2008
Lundbeck Takeda $40 Alliance to develop several compounds in Lundbeck's pipeline for
depression and anxiety
2007
BMS Pfizer $250 Co-development and marketing of Factor Xa inhibitor Eliquis 2007
Bayer J&J $290 upfront & milestone Co-development and marketing of Factor Xa inhibitor Xarelto 2005 Source: Compiled by MHBK/IRD based on public company reports
2. Focus is Also Important for Specialty Pharma Companies Focusing on a specific therapeutic area is also important for specialty pharma companies. It is equally
desirable to have a portfolio of products targeting the same disease for a specialty pharma company as
for a big pharma. However, the focus needs to be relaxed given the shortage of products in the specialty
pharma industry. A good example is Forest Labs’ line call strategy. In lieu of having sales reps detailing
1-2 big products, Forest Labs has its reps detail 3-5 mid-sized products in a given therapeutic category.
Specifically, instead of detailing the blockbuster Lexapro in the past, Forest Labs has its psychiatric sales
force detailing Viibryd, FETZIMA, Saphris and the to-be-approved Caprazine. Each product may have
sales potential of $200-500mn, but they collectively add up to the scale of a blockbuster like Lexapro
(peak sales of >$2bn in the U.S.). This approach preserves the economics of the blockbuster model,
minimizes the impact of one particular patent expiry, optimizes the efficiency of reps and increases their
relevance for the targeted physicians.

Restructuring the Pharmaceutical Industry
Mizuho Industry Focus
22
B. Successful Biopharma Business Strategies How should pharma companies position themselves in today’s ultra-competitive environment? Perhaps it
is helpful to look at the following diagram (see Figure 9), in which we graphed the perceived
attractiveness (defined as market potential if we can view this in isolation) of the market vs. the required
investment and accompanied risk. For investment projects, the more attractive the end market is, the
more investment is likely required. And oftentimes, not always, such large investment is accompanied by
high risk. In recent years, perhaps the curve has moved two ways. Firstly, the curve shifted downwardly.
For the same attractive projects, pharma companies have to invest in a lot more than before. There are
many examples ranging from ever larger clinical trials to satisfy the FDA to the ever increasing price of
biotech assets. Secondly, perhaps the curve has rotated clock-wise. As the investment for top projects
increases, pharma companies have to move aggressively up the curve. One example is the industry’s mad
rush to develop checkpoint inhibitors for cancer. Speed is critical for such hotly pursued projects. To
compete, companies are forced to make aggressive investment often in a parallel fashion rather than in a
sequential fashion. In doing so, they have to curtail investment in projects with a lower level of
attractiveness. For example, because pharma companies want to focus on areas such as diabetes,
oncology, and specialty drugs, they have cut their investment in areas such as GI, CNS, etc. If the
industry as a whole allocates capital this way, it could lower the return on hotly contested areas but raise
return in the less attractive markets. Some specialty pharma companies have emerged as the beneficiary
by focusing on these neglected therapeutic areas. Valeant is a prime example for its focus on
Dermatology, Ophthalmology, etc. (more on Valeant’s successful strategy in the following section).
Figure 9 Innovation Payoff Diagram
Note: Illustrated by MHBK/IRD
How can companies compete in such an environment?
1. The model applicable for most biopharma firms is to be the innovative leader in the attractive
therapeutic areas. Companies need to move faster and invest more aggressively than competitors to
capture the emerging breakthroughs in innovation. Examples include the ongoing race in cancer
immunotherapy and the almost finished race in HCV.
Pros of this strategy include:
Biopharma is fundamentally an innovation driven business. Payers will pay for true medical
innovation, not incremental benefits.
Attractive therapeutic areas are poorly served by existing therapies and could have huge
potential.

Restructuring the Pharmaceutical Industry
Mizuho Industry Focus
23
Cons of this strategy:
Most biopharma companies are attracted to the same areas for the same reasons (fast-growing
categories, large unmet medical needs, diseases where biology is on the cusp of breakthroughs,
etc.). Therefore, competition is fierce. These days, first movers only enjoy a few months of lead
time instead of a few years as in the past. And valuation for acquisitions is very high (think of
Gilead’s $11bn acquisition of Pharmasset in 2011).
Sometimes drug development for attractive diseases with large unmet medical needs entails
high risk (think of Alzheimer’s Disease or the failed deals in the past as illustrated in Table 16).
Table 16 Notable Failed In-licensing Deals in the Recent Past Acquirer / licenser Target / licensee Ann. Deal Details Upfront Equity
invest
Stage
Date ($mm) ($mm) ($mm)
Bristol-Myers Squibb Inhibitex Jan-12 $2,500mn acquisition $2,500 Phase II
Abbott Reata Dec-11 $400mn licensing fee for second-generation oral
antioxidant inflammation modulators (AIMs).
$400 II
Abbott Reata Sep-10 $450mn near-term payments for OUS licensing rights
to bardoxolone and a minority investment in the
company , $350 in dev. and reg. MS, plus royalties.
$450 II
J&J* Elan Jul-09 Acquired all Elan's AD immunotherapy program
including half of Elan's share in Bapineuzumab.
$1,000 III
Source: Compiled by MHBK/IRD based on public company reports. *Note: Despite the failure of Bapineuzumab,
J&J’s loss is offset as its investment in Elan was made at a low valuation ($9.32 per share)
For a company to succeed in this approach, it helps if it has an intensely R&D-driven culture. Historically,
many successful R&D organizations had this science-focused mindset. Often these companies were led by
visionary scientists rather than commercial or finance people. In these organizations, commercial people
work for the scientists, rather than the other way around. Following are some prominent examples of scientist
CEOs that have had a huge impact on pharmaceutical innovation1:
Janssen Pharma was responsible for developing 70 drugs between 1955 and 1993, including fentanyl
for pain, haloperidol for schizophrenia and many other drugs for CNS. Although the company was
acquired by Johnson & Johnson in 1961, founder Paul Janssen was granted full autonomy for
running its business.
Merck under CEO Roy Vagelos from 1985-1994 produced many breakthrough therapies including
Timoptic for glaucoma, Vasotec and Prinivil for hypertension and heart failure, Mevacor and Zocor
for hypercholesterolemia and Proscar for benign prostate hyperplasia. These drugs became the
mainstay revenue generators for Merck for more than a decade.
Before its acquisition by Roche in 2009, Genentech under the leadership of Art Levinson invented
many of the most important drugs in cancer, including Herceptin, Avastin, Rituxan, etc. Genentech
almost single-handedly ushered in the era of antibody-based drugs for cancer.
Regeneron under the leadership of Leonard Schleifer and George Yancopoulos has invented
breakthrough technologies in antibody engineering. Regeneron has also invented important
commercial drugs such as Eylea and compounds in development such as PCSK9 inhibitors. It is a
mini-Genentech with its culture intensely focused on innovation.
Currently, most big pharma CEOs have commercial, legal or finance backgrounds. Thus it is very important
for these organizations to have strong heads of R&D. Unfortunately, due to the recent disappointments in
R&D, the R&D function may not be highly regarded within certain pharma companies. R&D organization
has become a source for cost-cutting. In addition, R&D has also endured distractions from pharma mergers.
However, the risk to the industry may be a narrower, more “near-term gratification” pipeline portfolio that
doesn’t have enough breadth and depth.
1 Discussion on this section was partly referenced from “What Can Biopharma Learn From Apple” by Markus
Thunecke, Ph.D. published in In Vivo in January 2014

Restructuring the Pharmaceutical Industry
Mizuho Industry Focus
24
2. Strategy #2 is to avoid the high-stake, high reward game in inventing cutting-edge medicines by
focusing on neglected areas. This is essentially a specialty pharma model. Many specialty pharma
companies have benefited from this strategy. Valeant is a prime example for its focus on neglected
disease areas such as Dermatology, Ophthalmology, etc. Valeant has declared its goal of reaching
$150bn in market cap. Combining this strategy with savvy deal making (more on this in the
following section) and an aggressive tax-reduction strategy, specialty pharma companies have
delivered much higher shareholder returns than big pharma in recent years. Salix is another example
of focusing on an unpopular disease – Gastrointestinal disease - and it has carved out a nice niche
for itself.
3. Another way to benefit from the industry dynamics is to acquire assets deprioritized by big pharma.
There is a lot of churning in big pharma firms’ pipeline. Often big pharma invests a lot of money in
a project, only for it to be jettisoned at a later date. Assets from big pharma have the advantage of
going through more rigorous development than assets from cash-strapped small biotech. Venture
capitalists have seized the opportunity to establish companies with assets spun off from big pharma
companies. For example, a number of Pfizer’s acquisitions were later spun off to form venture-
backed companies, and several such companies went public (see Table 17). A number of serial
entrepreneurs have successfully created enormous wealth by licensing and developing compounds
from big pharma or smaller companies (see Table 18). Finally, as we noted earlier (see Table 15),
pharma-pharma deal-making has created a lot of value in the industry. Instead of competing with
each other, big pharma with complementary strengths can join forces to create category leaders.
Table 17 Pfizer's Biotech Acquisitions and Spin-Offs
Company Acquired Acquisition
Date
Acquisition
price ($mn)
Company
Spun off
Spun-off
time
Current valuation
if public ($mn)
Disease Area
Esperion 2003 $1,300 Esperion* 2008 $230 Atherosclerosis
Idun Pharma 2005 $300 Conatus 2010 $87 Liver fibrosis
Vicuron 2005 $1,900 Durata
Therapeutics
2010 $417 Antibiotics
Source: Compiled by MHBK/IRD based on public company reports and Capital IQ. Note: * One program of the
original Esperion (ApoA1 Milano) was licensed by The Medicines Company
Table 18 Successful New Ventures by Serial Entrepreneurs 5/15/2014 Year Market Price % 52-wk Source of the CEO founder CEO's former
Company name Ticker Founded Cap $mn ($USD) 52-wk
Hi
52-wk
Low
High compounds company
Clovis Oncology, Inc. CLVS 2009 $1,733 58.52 93.33 32.32 63% Avila, Pfizer Patrick J. Mahaffy Pharmion
Tesaro, Inc. TSRO 2010 $976 26.53 51.95 22.15 51% Schering-Plough, Merck,
Amgen
Lonnie Moulder MGI Pharma
Puma Biotechnology, Inc. PBYI 2010 $2,031 63.22 143.65 31.73 44% Pfizer Alan Auerbach Cougar
TG Therapeutics, Inc. TGTX 2012 $170 4.58 8.02 2.97 57% GTC Biotherapeutics;
Rhizen Pharmaceuticals
Michael S. Weiss Keryx
Kadmon 2009 Exelixis, Surface Logix Sam Waksal ImClone
Blueprint Meidinces 2011 Alexis Borisy CombinatoRx Source: Compiled by MHBK/IRD based on public company reports and Capital IQ

Restructuring the Pharmaceutical Industry
Mizuho Industry Focus
25
C. Winning M&A Strategies in the Pharmaceutical Industry Today’s business environment is characterized by:
Innovation has become much more competitive and requires significant expertise, large investment
and fast speed.
Return on R&D investment has been dropping.
Greater payer say in reimbursement. Demand for value and payers’ bargaining power will become
ever more intense.
Big pharma companies have taken many actions to streamline their business and position for the future.
However these internal actions alone may not be enough to transform the industry into a model best
positioned for the future. Thus M&A may be the key to effect transformation for the industry. In this section,
we review the experience of some successful acquirers in the past.
1. Biopharma Firms’ Successful Acquisition of Biotech Companies Successful acquisitions can go a long way in curing big pharma’s pipeline woes. Table 17 lists the
ten most successful M&A deals (for the acquirer) in recent years by our assessment. We can
perhaps learn a number of lessons from this list.
Some deals helped the acquirer tremendously. Without the deal, the alternative would have been
much worse. For example, BMS’s acquisition of Medarex can be considered perhaps the most
successful deal in recent industry history as it gave BMS a portfolio of cancer immunotherapy drugs
such as Yervoy, PD-1 etc. Without the Medarex deal, it would have been hard for BMS to survive,
let alone thrive as an independent company. Pfizer’s acquisition of Wyeth was a huge boost for
Pfizer as it helped stabilize Pfizer’s topline with Wyeth’s vaccine business and gave it the ability to
dramatically cut costs in the combined company.
Some deals were transformative as they gave the acquirers key technologies such as antibodies or
exposure to attractive therapeutic areas. Eli Lilly’s acquisition of ImClone helped it transition from
small molecules to biologics. Sanofi’s acquisition of Genzyme made Sanofi a leader in the coveted
orphan disease area.
The asset’s price is only secondary as long as the acquired asset proves to have stellar clinical data.
Examples include Pharmasset, Cougar Biotech, Proteolix and Calistoga. In each case, the acquisition
occurred before the phase3 data became available. Although the valuation seemed high at the time of
the deal announcement, clinical data turned out to be excellent. Therefore acquirers earned high
returns on their investments. In the biopharma business, clinical data is paramount while price is
secondary.
While picking up good clinical assets is always beneficial, additional optionality is important. One
good example is Abraxis. At the time of the acquisition Abraxane was only approved for breast
cancer. Following the acquisition, Abraxane demonstrated efficacies in phase 3 trials in lung cancer,
melanoma and pancreatic cancer, thus greatly expanding its market potential. Celgene is likely to
reap multifold return on its initial investment.
Never avoid purely financial-driven deals. Companies should be more agnostic in what they are
focused on. Sometimes, the strategic intent may be simply to get bigger. Companies shouldn’t shun
deals that only offer good financial rather than strategic value. One example is Warner Chilcott’s
acquisition of Procter & Gamble’s pharmaceutical business. Many pharma companies didn’t show
interest in P&G’s pharma business due to the lack of synergy and short life cycle of its main
products. But the specialty pharma company Warner Chilcott didn’t refrain from these shortcomings.
Warner Chilcott received significant financial return on this acquisition.
Biotech seems to be better than big pharma in making acquisitions. Perhaps this is due to having
similar mentality to the biotech target.
How easy is it to make smart acquisitions? We think it is certainly getting harder. Making smart
deals requires good internal scientific expertise, streamlined decision making and a deal-savvy
management team. In addition, there have to be good opportunities in the environment for the

Restructuring the Pharmaceutical Industry
Mizuho Industry Focus
26
picking. It is often said that in today’s environment, there are very few companies with decent phase
II data and novel technology that are still independent. Also the sheer jump in valuation has priced
many target companies out of the market. The robust IPO and secondary offering markets have
provided biotech an attractive alternative to seeking deals with big pharma. So it will be exceedingly
hard to replicate the success of BMS and others. Just like the R&D process, making good
acquisitions requires scientific insight and some luck. We believe future deals are more likely to be
done at full price with lower upside for the acquirer.
Table 19 Top Ten Successful M&A Deals for Large Biopharma Companies Aquirer Target Ann. Value Premium Premium Target Sales EV/Sales
Date ($mm) 1 Day 1 Month ($mm)
Gilead Pharmasset 21-Nov-2011 $11,000 89% 74%Sanofi Aventis Genzyme 16-Feb-2011 $20,100 48% 4,049 5.0
Gilead Calistoga 22-Feb-2011 $375+$225Celgene Abraxis 30-Jun-2010 $2,900 17% 62% 359 8.1
Onyx Proteolix 12-Oct-2009 $276+$535Warner Chilcott P&G Pharma Business 24-Aug-2009 $3,100 2,300 1.3
Bristol-Myers Squibb Medarex 22-Jul-2009 $2,100 90% 93% 52
Johnson & Johnson Cougar Biotech 21-May-2009 $1,000 16% 19%
Pfizer Wyeth 26-Jan-2009 $67,900 29% 33% 22,800 3.0
Eli Lilly ImClone 31-Jul-2008 $6,585 51% 73% 591 11.1 Source: Compiled by MHBK/IRD based on public company reports and Capital IQ. Note: we compiled the top-ten
list based on our assessments of biopharma acquisitions with value over $500mn since 2008.
2. The Very Successful Specialty Pharma Serial Acquirers Another group of companies that have done tremendously well are specialty pharma companies that
have adopted aggressive M&A strategies. Both Valeant and Actavis have been deal machines that
continuously gobble up smaller rivals. They have been very successful (see Figure 9) and can
probably serve as textbook examples of how to build big, profitable corporations through
acquisitions. The two companies have some similarities in that both are run by strong, visionary
CEOs and have superior execution as the foundation of their business. Michael Pearson was
appointed CEO of Valeant in February 2008. A former star at McKinsey, Mr. Pearson went on a
non-stop shopping spree to make over 100 licensing and acquisition deals worth $19bn in total.
Since his appointment, Valeant’s stock price has risen more than 25 times (with dividends
reinvested) and its market cap has gone from $2bn in 2008 to over $45bn currently. It has
announced a goal of becoming a top 5 pharma company in value terms by the end of 2016. To
achieve that goal, Valeant has to leapfrog Merck which had 2013 sales of $44bn (in comparison,
Valeant is expected to have sales of $8.2-8.6bn in 2014). Valeant needs to acquire large rivals with
market cap in the tens of billions range. There aren’t so many such companies around (see Figure
11). Recently Valeant teamed up with activist investor Pershing Square Capital to make a hostile
takeover bid to acquire Allergan. Its proposed $2.7bn synergy for the deal would equate stripping
out 85% of Allergan’s operating expense. Such a drastic cut promised at the outset is perhaps
unprecedented.
As shown in Table 20, Valeant has a unique configuration compared to big pharma/ big biotech. Its
operation bears no resemblance to any other pharma company. No innovative brand company can
survive by investing only 2-3% of sales in R&D. No big pharma enjoys the <5% tax rate like
Valeant. In recent years, specialty pharma companies have aggressively used tax inversion to
dramatically lower their tax rate. The low tax rate gave specialty pharma companies such as Valeant
an advantage in competing with U.S.-domiciled pharma companies.
We believe although it is generally impossible for big pharma to adopt Valeant’s approach, it can
nonetheless learn from it. Certain parts of Valeant’s approach such as decentralized decision making,
nimble and flexible business practices, and low cost are useful for reference purposes to other big
pharma companies. But it would be detrimental to innovation if all pharma companies adopt such an
approach. Mainstream pharma companies have to innovate in order to survive. The industry cannot
only rely on outside to buy innovation, as eventually someone has to innovate. The industry cannot
just be traders and marketers.

Restructuring the Pharmaceutical Industry
Mizuho Industry Focus
27
Figure 10 Increase in Valuation since Current CEOs Took Office
$0
$5,000
$10,000
$15,000
$20,000
$25,000
$30,000
$35,000
$40,000
$45,000
$0
$50
$100
$150
$200
$250
9/2
8/2
007
2/2
9/2
008
7/3
1/2
008
12
/31
/200
8
5/2
9/2
009
10
/30
/200
9
3/3
1/2
010
8/3
1/2
010
1/3
1/2
011
6/3
0/2
011
11
/30
/201
1
4/3
0/2
012
9/2
8/2
012
2/2
8/2
013
7/3
1/2
013
12
/31
/201
3
Ma
rket
Ca
p (
$m
n)
Sto
ck p
ric
e
Actavis (Historical Price - Market Cap)
Stock Price Forward Year PE
0
10,000
20,000
30,000
40,000
50,000
60,000
$0
$20
$40
$60
$80
$100
$120
$140
$160
3/3
1/2
008
8/2
9/2
008
1/3
0/2
009
6/3
0/2
009
11
/30
/200
9
4/3
0/2
010
9/3
0/2
010
2/2
8/2
011
7/2
9/2
011
12
/30
/201
1
5/3
1/2
012
10
/31
/201
2
3/2
8/2
013
8/3
0/2
013
1/3
1/2
014
Ma
rke
t C
ap
($
mn
)
Sto
ck P
ric
e
Valeant (Historical Price - Market Cap)
Stock Price Market Cap
Source: Compiled by MHBK/IRD based on data from Capital IQ
Figure 11 Ranking of World's Largest Pharma Companies By Market Cap
$287
$244
$208$205
$166
$141$135$114$114$113
$99$84 $83 $81
$67 $63 $58 $50 $45 $42 $35 $34 $33 $25 $24 $19 $16 $15 $12 $11
$0
$50
$100
$150
$200
$250
$300
J&
J
Ro
ch
e
No
va
rtis
Pfize
r
Me
rck
Sa
no
fi
GS
K
No
vo
No
rdis
k
Gile
ad
Ba
ye
r
Astr
aZ
ene
ca
Am
ge
n
BM
S
Ab
bV
ie
Bio
ge
n Id
ec
Eli
Lill
y
Ce
lge
ne
Alle
rgan
Va
lea
nt
Te
va
Ta
ke
da
Acta
vis
Sh
ire
Aste
llas
Fo
rest L
ab
Myla
n
Ots
uka
Ve
rtex
Da
iichi…
Eis
ai
Mark
et
Cap
($b
n)
Source: Compiled by MHBK/IRD based on data from Capital IQ. Note: Actavis’s valuation appears low in this
ranking because its merger with Forest Labs hasn’t been completed
Table 20 Differences Between Valeant and Big Pharma
Strategy Valeant Big Pharma
R&D Not enamored by science, more
focused on D instead of R.
Focused on science / innovation.
Organization Decentralized Centralized
Cost structure Lean organization. Downsized, but still substantial
organization overhead. But with it,
pharma have full-fledged
capabilities.
Therapeutic Focus Niche areas neglected by big
pharma. Stay away from
primary care.
High growth areas with potential
breakthroughs. Legacy strengths
of the company.
Geographic Focus Markets neglected by big
pharma.
High growth, big markets (e.g.,
BRIC countries).
People's career
progression
Perform or out. Not afraid of
high turnover.
Long-term, steady career
progression.
Deal mentality Financial-driven. Sensitive to
price. Opportunistic. Fast
decision-making.
Strategically driven. Less sensitive
to price if the strategic fit is great.
Slow decision-making.
Financial metrics
R&D % Sales 2-3% 15%
Tax rate <5% 20-30% Source: Compiled by MHBK/IRD based on data from Capital IQ

Restructuring the Pharmaceutical Industry
Mizuho Industry Focus
28
In a similar fashion to Valeant, Paul Bisaro took over the CEO position at Actavis’ predecessor
company Watson in August 2007. During his tenure, the company’s share price has jumped seven
times. The market cap has gone from $3bn to $55bn. Through a number of deals, he has transformed
a domestic, also-run generic drug company into a global pharma company with strong presence in
both generics and brand pharma (see Table 21). Among the series of deals, the acquisition of
Actavis was the most significant as it cemented the company’s global position in generics and added
key executives to the company. The recent acquisition of Forest Labs has again transformed the
company into a top-tier generic/brand hybrid pharma company. With the acquisition of Forest Labs,
Actavis has forever changed from being viewed as a potential prey in the overall industry
consolidation to a predator. With this deal, pressure will be on other specialty pharma companies
such as Mylan and Endo Pharma to further increase in scale or to sell out to bigger companies.
Table 21 Acquisitions by Actavis (Previously Watson) Since Mr. Bisaro Took Office
Acquirer Target Announce
Date
Deal Value
(mn)
Revenues
prior yr ($mm)
EV /
Sales
EV/EBITDA
prior year
Country
Actavis Silom Medical 31-Mar-2014 Tailand
Actavis Forest Labs 18-Feb-2014 $25,000 $3,371 7.4 U.S.
Actavis Warner Chilcott 20-May-2013 $8,500 $2,400 3.5 IrelandWatson Actavis 25-Apr-2012 € 4,500 € 1,900 2.4 14.6 EuropeWatson Ascent 24-Jan-2012 AU$375 AU150 2.5 AustraliaWatson Specifar 24-May-2011 € 400 € 85 4.7 GreeceWatson Arrow 17-Jun-2009 $1,750 $647 2.7 11.1 U.K. Source: Compiled by MHBK/IRD based on public data reports
Recently, the U.S. economy has improved, firms’ business foundation has strengthened, and CEOs
have become more confident about their businesses. So companies are more ready to do transactions.
This is in stark contrast with the environment during the financial crisis when most companies were
hunkering down for survival. However, with the improving stock market, biotech valuation has sky-
rocketed. Now may be a bad time to attempt M&A in the pharma industry. Acquirers may have to
make rosier forecasts and higher assumption for the clinical success rate of pipeline candidates to
justify such a price. Inundated with cash infusions from the public market, sellers are sitting pretty to
wait for their clinical data to come in, rather than rushing to the exit before the critical clinical
inflection point. So we believe the M&A environment for big biopharma is challenging. But some
good opportunities still exist, especially in neglected disease areas.

Restructuring the Pharmaceutical Industry
Mizuho Industry Focus
29
D. New Innovation Model by Big Pharma Big pharma companies recognize that with the explosion of information, solutions for diseases are getting
ever more complex. It is impossible to generate all the innovations in-house. Therefore, they have changed
their R&D model from a closed, linear model to a networked model (see Figure 12).
The goal of the new network-based innovation model is to capture innovation early and spread out cost
and risk. Such an approach makes good sense because:
1. With the fast-moving scientific developments and increasing complexity in understanding diseases,
it is unlikely for innovation to occur only within the confines of one company’s R&D centers.
Pharma more often play a facilitator role in shepherding drugs to market than inventing drugs de
novo.
2. As discussed earlier, assets post the PoC stage are very expensive. At that stage, the assets are
typically sold via auctions and it is a contest of who has a deeper pocketbook and the resolve to win.
In a bull market, public investors often drive up stock price of biotech companies with good data to
stratospheric levels, and thus price many assets out of the market. If pharma can access innovation in
its infancy, it won’t be subject to the vicissitude of public or VC investors.
3. Pharma’s early discovery has not been productive. Pharma should separate discovery research from
development (i.e., R from D). Pharma should outsource research by tapping into external expertise.
Meanwhile, pharma should retain the development and commercialization functions in-house. We
believe shrinking spending on in-house research is a better solution for reducing R&D spending than
an across-the-board cut to R&D.
4. Clinical development has become increasingly costly. Pharma companies need P&L sparing capital
to support their clinical programs. Therefore, venture capital and private equity firms have
frequently joined forces with big pharma. Big pharma companies have gained through these
relationships. For example, Lilly’s decision to partner its phase III Alzheirmer’s programs with
private equity firms and CROs has saved the company hundreds of millions of dollars with no cost
as the programs ultimately failed.
To carry out this network-based innovation model, pharma companies have taken the following
measures:
1. Establish innovation hubs in hotspots such as Boston, San Francisco, New York, San Diego and
London. Many big pharma companies have also established Asian innovation centers, often in
Shanghai, China.
2. Forged collaboration with leading academic centers. Pfizer is a prominent example. Launched in
2010, Pfizer’s Centers for Therapeutic Innovation (CTI) allows Pfizer researchers to work side by
side with scientists from leading academic labs to discover new targets and do translational research.
Pfizer provides access to Pfizer compound libraries, proprietary screening methods, antibody
development technologies, and other resources. Pfizer also offer equity interest to academic
researchers and their institutions. CTI now has more than 23 academic institutions in its network,
with a portfolio of 25 projects across a variety of disease areas.
3. Big pharma companies often have their own in-house venture funds to help them scout for
innovation. It is also important to have access to external venture funds. Big pharma often partners
with external venture funds. In April 2013, GSK entered into a $495mn alliance with San Diego-
based Avalon Ventures. Avalon will invest $30 million and GSK will invest $465 million to launch
10 or so startups over the next three years. We believe partnership with external venture funds is
especially important for small biopharma companies as innovations don’t proactively go to their
door step.
4. Pharma companies have found innovative ways to engage with bioventures. It is no longer a one-
way street whereby pharma licenses from bioventure companies. Pharma companies also actively
spin off assets to form bioventures. In addition to outright acquisitions, pharma companies have also
been active in signing option-based deals with venture companies.

Restructuring the Pharmaceutical Industry
Mizuho Industry Focus
30
Figure 12 Changes in Innovation Model in Biopharma Industry
Note: Illustrated by MHBK/IRD
Traditional Innovation Model
Academia (universities, NIH, etc.)
Technology, IP
BioVenturesVCs,
Angel investors,
Philanthropists
$$$
Big Biopharma
Innovative
projects
Market
Innovative
products
Internal
innovative
projects
Public and Private Funding
Traditional Innovation Model
Academia (universities, NIH, etc.)
Technology, IP
BioVenturesVCs,
Angel investors,
Philanthropists
$$$
Big Biopharma
Innovative
projects
Market
Innovative
products
Internal
innovative
projects
Public and Private Funding
Open Innovation Model
Academia (universities, NIH, etc.)
BioVenturesVCs,
Angel investors,
Philanthropists
Big Biopharma
Innovative
projects
Market
Innovative
products;
Internal innovative
projects
$$$ for
translational
Research
$$$
Corp. VC,
Spin offs,
License-outPartnershipPartnership
Innovative
delivery
Technology, IP
Public and Private Funding
$$$ for basic research
$$$
Partner among
peers

Restructuring the Pharmaceutical Industry
Mizuho Industry Focus
31
Eli Lilly is the pioneer in this open innovation model and its approach can almost serve as a textbook for its
peers. Eli Lilly first articulated its strategy of transitioning from a FIPCo (fully integrated pharmaceutical
company) to a FIPNet (fully integrated pharmaceutical network) in 2008. Since then, Eli Lilly has fully put
this concept to work through creating various structures2 such as its deals with CRO, the Chorus program,
and having outside capital to participate in the development of its clinical programs. The result is Lilly was
able to spread the risk and cost of its R&D and at the same time effectively tap into external innovation.
Especially noteworthy, the Chorus program was set up as an independent organization at Lilly that uses a
fully outsourced model to advance compounds from phase I to the PoC data. The program is considered very
successful3.
For biopharma companies, Celgene is a good example for tapping into innovation early. In good times, a
smart company should aggressively sow the seeds for future success. This is indeed what Celgene has been
doing. There are a finite number of cutting-edge innovations at a certain point. Celgene has signed deals with
many truly cutting-edge companies in oncology (see Table 22), and thereby removing competitors’ access to
them. Although the financial outlay may seem steep given the early-stage nature of the assets, true medical
innovation is almost priceless. As we discussed in the M&A section, what is critical for biopharma deals is
not the price but the innovation itself (as demonstrated by the ultimate clinical data). With the right strategy,
it is hard for us not to envision Celgene continuing its upward trajectory.
Table 22 Celgene's Early-Stage Oncology Deals
Date Partner Technology Upfront ($mn) Deal Description
4/1/2014 Forma Therapeutics Protein-protein interaction $225 For 3.5 years Celgene will have an exclusive
option to license international rights to Forma
programs after Phase I testing. Two extensions
with two years each. Option to acquire Forma.
12/2/2013 OncoMed Cancer stem cell $177 Celgene invests in OncoMed's Demcizumab
and up to five additional preclinical programs;
OncoMed leads early clinical trials and retains
co-development, co-commercialization and
profit-sharing rights.
7/29/2013 Acetylon Cancer epigenetics
(HDAC inhibitors)
$100 Option to acquire Acetylon. Main asset is
HDAC6 inhibitor for multiple myeloma.
3/21/2013 Bluebird Bio CAR-T adoptive T cell
therapy / Gene therapy
Not disclosed Licensed ex vivo lentivirus gene delivery
technology for CAR-T therapy from Bluebird.
Potential payment up to $225mn per program.
4/26/2012 Epizyme Cancer epigenetics (HMT
inhibitors)
$90 Celgene received an exclusive license outside
the U.S. to some of Epizyme’s programs for
three years.
4/15/2010 Agios Cancer metabolism $130 including
an equity
investment
Agios will lead discovery and early translational
development. Celgene has an exclusive option
to license any resulting clinical candidates at
the end of Phase I. Source: Compiled by MHBK/IRD based on public data reports
2 http://fnih.org/sites/all/files/documents/Andrew_Dahlem.pdf
3 http://www.choruspharma.com/pharma.focus.pdf

Restructuring the Pharmaceutical Industry
Mizuho Industry Focus
32
E. Conclusion In the section above, we discussed various aspects of competitive strategies in the pharma industry. The
current environment demands companies have a focused strategy. Many big pharma companies have taken
this to heart by pooling resources to form category leaders, which makes good sense.
By looking at overlaps of focus in therapeutic areas, we found many big pharma companies are drawn to
similar TAs for similar reasons. This crowding will lower investment returns in these hotly pursued areas.
Meanwhile the neglected diseases will have higher prospective returns as big pharma companies shift their
resources to higher-priority areas. In our view, companies need to take a hard look at the market and decide
whether they have the wherewithal to become a leader in a competitive area (e.g., oncology). It not, they
should shift focus to less competitive areas.
We looked at some companies successful in the past and found several models for success. Applicable to
most biopharma companies is the innovation leadership model. Biopharma companies are ultimately in the
innovation business. It is an innovate-or-die business. The bar to becoming the innovation leader in a given
TA has become ever higher. To succeed, we believe companies need to put R&D as the forefront of their
enterprise. Historically, successful pharma companies have been often run by visionary scientists rather than
by executives with a commercial, legal, or other background. Absent a change at the top, big pharma
companies should have a strong head of R&D who enjoys autonomy in decision-making. Unfortunately in
recent years, for good or for bad, R&D has become a source of cost-cutting. In addition, the impact on R&D
organizations from pharma mergers has been immeasurable. Although the short-term impact has been
minimal and the financial logic was often overwhelming, the long-term impact of big cuts to R&D is hard to
quantify. We note it is companies that haven’t gone through mergers or big cuts in R&D that have the best
pipelines in the industry (e.g., Novartis, BMS, Roche, Eli Lilly, etc.). Meanwhile the current size of Pfizer’s
pipeline is lower than its pre-merger level. The risk to the industry is having pipelines built for the purpose of
short-term gratification but lacking breadth and depth.
Another successful strategy adopted by specialty pharma companies is to focus on niche areas that are
neglected by big pharma. Combined with an aggressive M&A strategy, specialty pharma companies such as
Valeant and Actavis have achieved unparalleled returns in the industry. Although there is inherent
incompatibility between the specialty pharma model and the innovative pharma model, we believe biopharma
can still learn a lot by assimilating some practices of aggressive specialty pharma leaders.
M&A is a critical element of big pharma’s success. Depending on the company, 25-50% of big pharma’s
portfolio can come from external sources. Looking at the deals over the last six years, indeed there have been
many favorable deals for the acquirers. But the current environment is rich in valuation. After years of
picking by big pharma and a sharp run-up in biotech valuations, worthwhile M&A has become a very
expensive endeavor. We believe it is unlikely for acquirers to walk away with investments that have a big
upside as in some past deals. Maybe that is why biopharma companies are shifting to early-stage deals.
However, some good opportunities do exist in some neglected areas.
Mindful of the high cost of catching innovation late, big pharma companies are competing aggressively to tap
into innovation at an earlier stage. As an extension of the R&D strategy, biopharma companies have formed
innovation hubs in the hotspots of biomedical research. They have formed alliances with VCs, academia and
among themselves to actively create innovation. So pharma innovation has changed from the linear model in
the past to a network-based model at present. Eli Lilly is leading the industry for its FIPNet model, which we
believe serves as a good template for its peers. In our view, pharma companies should separate R from D and
rely extensively on external sources for discovery research. Pharma firms’ involvement in venture creation is
good for the ecosystem. Given their tremendous in-house expertise, they could help select and catalyze the
best innovation coming out of academic labs and young biotechs. They should be flexible in deal terms and
not afraid to step in at an early stage. Big pharma can regard this as an extension of its in-house early R&D
organization. For biopharma companies, Celgene is a good example of tapping into innovation early.

Restructuring the Pharmaceutical Industry
Mizuho Industry Focus
33
Appendix
Table 23 Notable Late-stage Development Failures from Big Pharma (2004-2008) 2004 2005 2006 2007 2008
Pfizer Daxas (roflumilast, COPD)
Oporia (lasofoxifene,
osteoporosis)
Bextra (Arthritis)
Endotecarin (cancer)
Capravirine (HIV)
Torcetrapib
(Atherosclerosis)
Indiplon (Insomnia)
Asenapine
(Shizophrenia)
Exubera (Inhaled insulin) Tremelimumab (melanoma),
CP-945598 (obesity)
Merck Vioxx (Arthritis) Pargluva(Diabetes) Gaboxadol (Insomnia)
Arcoxia (Arthritis)
Taranabant (obesity)
Bristol-Myers
Squibb
Pargluva(Diabetes)
E2F decoy (vein graft
failure)
Eli Lilly Arxxant (diabetes
complications)
AIR Inhaled Insulin
Astra Zeneca Exanta (oral
anti-coagulant)
Iressa (Cancer)
NXY-059 (Stroke)
Galida (Diabetes)
AG-1067
(Atherosclerosis)
Recentin/AZ 2171 (NSCLC)
Novartis PTK 787 (Cancer) Zelnorm (IBS)
Galvus (diabetes, U.S.)
Roche
Sanofi-
Aventis
Acomplia (obesity), Amibegron (depression)
GlaxoSmithK
line
gepirone ER
(depression)
Source: Compiled by MHBK/IRD based on public company reports
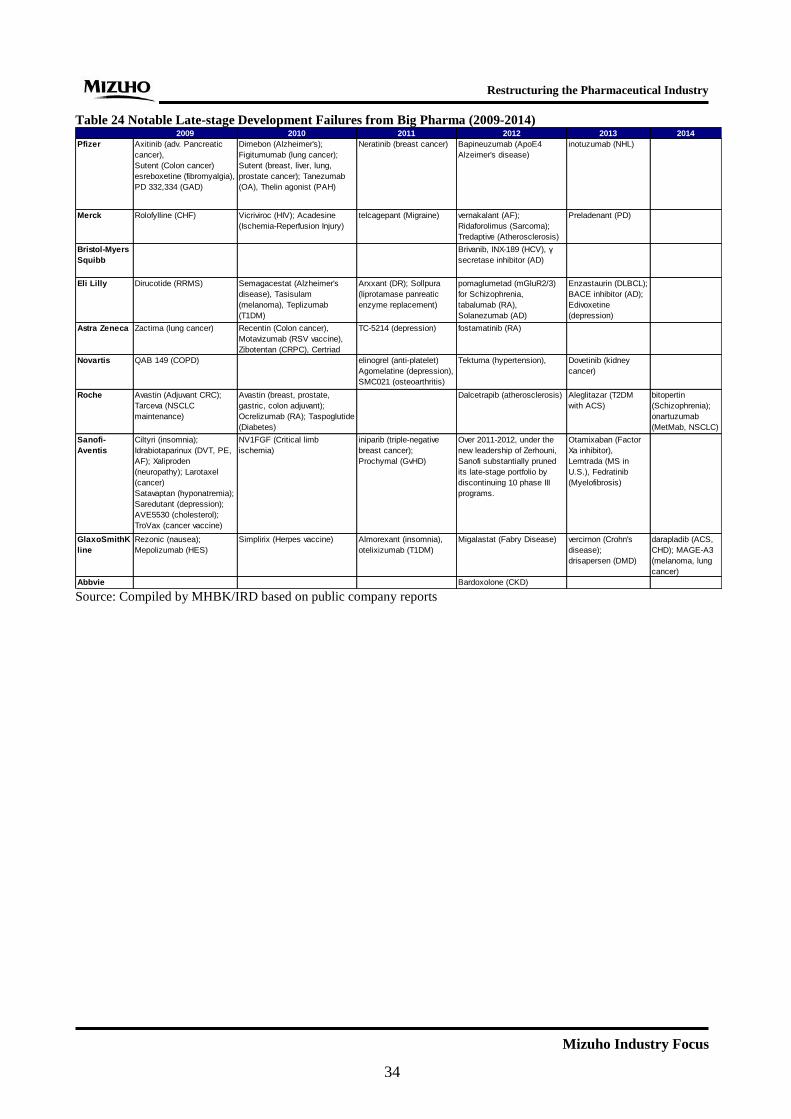
Restructuring the Pharmaceutical Industry
Mizuho Industry Focus
34
Table 24 Notable Late-stage Development Failures from Big Pharma (2009-2014) 2009 2010 2011 2012 2013 2014
Pfizer Axitinib (adv. Pancreatic
cancer),
Sutent (Colon cancer)
esreboxetine (fibromyalgia),
PD 332,334 (GAD)
Dimebon (Alzheimer's);
Figitumumab (lung cancer);
Sutent (breast, liver, lung,
prostate cancer); Tanezumab
(OA), Thelin agonist (PAH)
Neratinib (breast cancer) Bapineuzumab (ApoE4
Alzeimer's disease)
inotuzumab (NHL)
Merck Rolofylline (CHF) Vicriviroc (HIV); Acadesine
(Ischemia-Reperfusion Injury)
telcagepant (Migraine) vernakalant (AF);
Ridaforolimus (Sarcoma);
Tredaptive (Atherosclerosis)
Preladenant (PD)
Bristol-Myers
Squibb
Brivanib, INX-189 (HCV), γ
secretase inhibitor (AD)
Eli Lilly Dirucotide (RRMS) Semagacestat (Alzheimer's
disease), Tasisulam
(melanoma), Teplizumab
(T1DM)
Arxxant (DR); Sollpura
(liprotamase panreatic
enzyme replacement)
pomaglumetad (mGluR2/3)
for Schizophrenia,
tabalumab (RA),
Solanezumab (AD)
Enzastaurin (DLBCL);
BACE inhibitor (AD);
Edivoxetine
(depression)
Astra Zeneca Zactima (lung cancer) Recentin (Colon cancer),
Motavizumab (RSV vaccine),
Zibotentan (CRPC), Certriad
TC-5214 (depression) fostamatinib (RA)
Novartis QAB 149 (COPD) elinogrel (anti-platelet)
Agomelatine (depression),
SMC021 (osteoarthritis)
Tekturna (hypertension), Dovetinib (kidney
cancer)
Roche Avastin (Adjuvant CRC);
Tarceva (NSCLC
maintenance)
Avastin (breast, prostate,
gastric, colon adjuvant);
Ocrelizumab (RA); Taspoglutide
(Diabetes)
Dalcetrapib (atherosclerosis) Aleglitazar (T2DM
with ACS)
bitopertin
(Schizophrenia);
onartuzumab
(MetMab, NSCLC)
Sanofi-
Aventis
Ciltyri (insomnia);
Idrabiotaparinux (DVT, PE,
AF); Xaliproden
(neuropathy); Larotaxel
(cancer)
Satavaptan (hyponatremia);
Saredutant (depression);
AVE5530 (cholesterol);
TroVax (cancer vaccine)
NV1FGF (Critical limb
ischemia)
iniparib (triple-negative
breast cancer);
Prochymal (GvHD)
Over 2011-2012, under the
new leadership of Zerhouni,
Sanofi substantially pruned
its late-stage portfolio by
discontinuing 10 phase III
programs.
Otamixaban (Factor
Xa inhibitor),
Lemtrada (MS in
U.S.), Fedratinib
(Myelofibrosis)
GlaxoSmithK
line
Rezonic (nausea);
Mepolizumab (HES)
Simplirix (Herpes vaccine) Almorexant (insomnia),
otelixizumab (T1DM)
Migalastat (Fabry Disease) vercirnon (Crohn's
disease);
drisapersen (DMD)
darapladib (ACS,
CHD); MAGE-A3
(melanoma, lung
cancer)
Abbvie Bardoxolone (CKD) Source: Compiled by MHBK/IRD based on public company reports

Restructuring the Pharmaceutical Industry
Mizuho Industry Focus
35
Abbreviations
ABT Abbott
AMGN Amgen
AZN/AZ Astra-Zeneca
BLA Biologic License Application
BMY/BMS Bristol-Myers Squibb
CMS Centers for Medicare & Medicaid Services
CNS Central nervous system disease
COGS Cost of goods sold
CRO Contract Research Organization
FOB / Biosimilars Follow-on Biologics. Generic copy of branded biologic drugs.
GI Gastrointestinal disease
GILD Gilead Sciences
GSK GlaxoSmithKline
IPO Initial Public Offering
JNJ Johnson & Johnson
LLY Eli Lilly
M&A Merger and Acquisition
MRK Merck
NDA New Drug Applications
NME/NCE New Molecular/Chemical Entities
NVS / NOVN Novartis
P&L Profit and loss statement
PFE Pfizer
PoC Proof of Concept
R&D Research (discovery research) and Development
ROG Roche
SAN Sanofi-Aventis
SG&A Selling, General and Administrative Expenses
SGP Schering-Plough
Specialty Medicine Drugs that treat diseases which are not suffered by the general public and are prescribed by specialty doctors rather than by primary care physicians (PCPs). Disease conditions include inflammation, Multiple Sclerosis, Cancer, Blood cell deficiency, Growth deficiency, Hepatitis C and others.
TAs Therapeutic Areas
WYE Wyeth
CONTACTS
Global Corporate Advisory (Americas)
Industry Research Division
Mizuho Bank, Ltd.
1251 Avenue of the Americas
New York, NY 10020
Team Head
Ryohei Oikawa
Deputy General Manager
(212) 282-3298
Pharmaceutical, Biotechnology & Healthcare
Tim Wang, CFA
Senior Vice President
(212) 282-3669
Mizuho Industry Focus Vol. 155 2014 No.11 May 2014
Edited / issued by Industry Research Division Mizuho Bank, Ltd.
Address: 1-5-5 Otemachi Chiyoda-ku Tokyo
Tel: (03)5222-5075
© 2014 Mizuho Bank, Ltd.
This document has been prepared solely for the purpose of providing financial solution information. This
document is not a recommendation or solicitation for sales. Nor does it constitute an agreement to enter into
transactions with any Mizuho Financial Group company.
This document has been prepared based on information believed to be reliable and accurate. The Bank accepts no
responsibility for the accuracy or appropriateness of such information. Upon using this document, if considered
appropriate, or if necessary, please consult with lawyers, CPAs and tax accountants.
© Mizuho Bank, Ltd. All Rights Reserved. This document may not be altered, reproduced or redistributed, or
passed on to any other party, in whole or in part, without the prior written consent of Mizuho Bank, Ltd

Related Documents