RESTORATION OF SAMS CREEK AND AN ASSESSMENT OF BROOK TROUT RESTORATION METHODS GREAT SMOKY MOUNTAINS NATIONAL PARK Stephen E. Moore, Matt A. Kulp, John Hammonds, and Bruce Rosenlund National Park Service U.S. Department of the Interior Water Resources Division Natural Resource Program Center Technical Report NPS/NRWRD/NRTR-2005/342

Welcome message from author
This document is posted to help you gain knowledge. Please leave a comment to let me know what you think about it! Share it to your friends and learn new things together.
Transcript

RESTORATION OF SAMS CREEK AND
AN ASSESSMENT OF BROOK TROUT RESTORATION METHODS
GREAT SMOKY MOUNTAINS NATIONAL PARK
Stephen E. Moore, Matt A. Kulp, John Hammonds, and Bruce Rosenlund
National Park Service U.S. Department of the Interior Water Resources Division Natural Resource Program Center Technical Report NPS/NRWRD/NRTR-2005/342

The National Park Service Water Resource Division is responsible for providing water resources management policy and guidelines, planning, technical assistance, training, and operational support to units of the national park system. Program areas include water rights, water resources planning, regulatory guidance and review, hydrology, water quality, watershed management, watershed studies and aquatic ecology. Technical Reports The National Park service disseminates the results of biological, physical and social research through the Natural Resource Technical Report Series. Natural resources inventories and monitoring activities, scientific literature reviews, bibliographies, and proceedings of technical workshops and conferences are also disseminated through this series. Mention of trade names or commercial products does not constitute endorsement or recommendation for use by the National Park Service Copies of this report are available from the following:
National Park Service Water Resource Division (970) 225-3500 1201 Oak Ridge Drive, Suite 250 Fort Collins, CO 80525 National Park Service Technical Information Center (303) 969-2130 Denver Service Center P.O. Box 25287 Denver, CO 80225-0287
Cover Photo: Southern Appalachian strain of Eastern Brook Trout (Salvelinus fontinalis) by Bob Dellinger
i
Restoration of Sams Creek and an Assessment of Brook Trout Restoration Methods Great Smoky Mountains National Park ________________________
Stephen E. Moore, Matt A. Kulp National Park Service
Great Smoky Mountains National Park 107 Park Headquarters Road
Gatlinburg, TN 37738
John Hammonds Tennessee Wildlife Resources Agency
3030 Wildlife Way Morristown, TN 37814
Bruce Rosenlund
US Fish and Wildlife Service 755 Parfet, Room 496 Lakewood, CO 80215
September 2005
Technical Report/NPS/NRWRD/NRTR-2005/342
This report constitutes the completion report for PMIS project #27832 funded by the NPS Natural Resources
Preservation Program component of the Natural Resource Challenge
United States Department of the Interior ● National Park Service

ii
iii
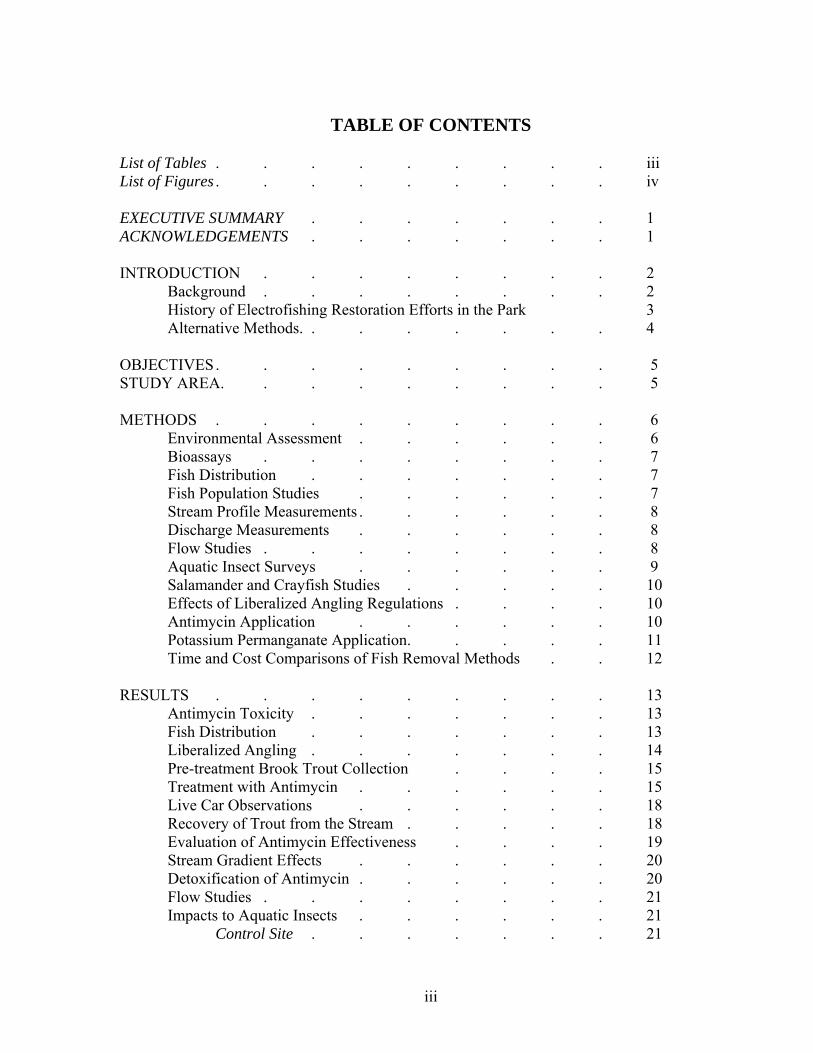
TABLE OF CONTENTS List of Tables . . . . . . . . . iii List of Figures . . . . . . . . . iv EXECUTIVE SUMMARY . . . . . . . 1 ACKNOWLEDGEMENTS . . . . . . . 1 INTRODUCTION . . . . . . . . 2 Background . . . . . . . . 2
History of Electrofishing Restoration Efforts in the Park 3 Alternative Methods. . . . . . . . 4 OBJECTIVES . . . . . . . . . 5 STUDY AREA. . . . . . . . . 5 METHODS . . . . . . . . . 6 Environmental Assessment . . . . . . 6 Bioassays . . . . . . . . 7 Fish Distribution . . . . . . . 7 Fish Population Studies . . . . . . 7 Stream Profile Measurements . . . . . . 8 Discharge Measurements . . . . . . 8 Flow Studies . . . . . . . . 8 Aquatic Insect Surveys . . . . . . 9 Salamander and Crayfish Studies . . . . . 10 Effects of Liberalized Angling Regulations . . . . 10 Antimycin Application . . . . . . 10 Potassium Permanganate Application. . . . . 11 Time and Cost Comparisons of Fish Removal Methods . . 12 RESULTS . . . . . . . . . 13 Antimycin Toxicity . . . . . . . 13 Fish Distribution . . . . . . . 13 Liberalized Angling . . . . . . . 14 Pre-treatment Brook Trout Collection . . . . 15 Treatment with Antimycin . . . . . . 15 Live Car Observations . . . . . . 18 Recovery of Trout from the Stream . . . . . 18 Evaluation of Antimycin Effectiveness . . . . 19 Stream Gradient Effects . . . . . . 20 Detoxification of Antimycin . . . . . . 20 Flow Studies . . . . . . . . 21 Impacts to Aquatic Insects . . . . . . 21
Control Site . . . . . . . 21
iv
TABLE OF CONTENTS (continued)
RESULTS (continued)
Immediate Post-Treatment . . . . . 22 Long-Term Effects . . . . . . 23
Potassium Permanganate Impacts to Fish . . . . 24 Impacts to Salamanders and Crayfish . . . . . 26
Three-Pass Population Model Validation/Improvement . . 26 Brook Trout Recolonization . . . . . . 26 2002 Reintroduction of Brook Trout . . . . . 27 Evaluation of Fish Population Recovery . . . . 27 Time and Cost Comparisons . . . . . . 27 CONCLUSIONS . . . . . . . . 28 Effects of Liberalized Angling . . . . . 28 Brook Trout Recolonization . . . . . . 29 Antimycin Effectiveness . . . . . . 30 Non-Target Organisms . . . . . . 30 Selection of Restoration Techniques . . . . . 31 MANAGEMENT RECOMMENDATION . . . . . 31 LITERATURE CITED . . . . . . . 32 List of Tables:
Table Page
1. Results of antimycin toxicity test conducted on juvenile rainbow trout (75 – 95 mm) at Western Carolina University in 2000……………………… 13
2. Amount of potassium permanganate (KmnO4) applied daily to neutralize
antimycin in Sams Creek September and October 2001…………………….. 21
3. Time and cost comparisons of native fish restoration techniques used in Great Smoky Mountains National Park since 1986………………………….. 28

v
List of Figures: Figure Page
1. Sams Creek treatment area and location of aquatic insect monitoring
and fish control sites…………………………………………………………. 6
2. Antimycin treatment station, showing typical setup for treatment on Sams Creek, GRSM ……………………………………………………………….. 11
3. Sams Creek Potassium Permanganate station in operation, GRSM…………. 12
4. Size distribution of rainbow trout that were harvested compared to size
distribution of the rainbow trout that were electrofished during the Sams Creek fishing project ………………………………………………………… 15
5. A ghost fish holding in an area with no current in Sams Creek during
treatment, October 2001……………………………………………………… 19
6. Stream gradient profile of Sams Creek, GRSM ……………………………... 20
7. Diagram of molecular structure of the antimycin (A1) molecule…………….. 20
8. Total taxa collected at control sites and treatment sites before (September 2001) and after (October 2001) treatment……………………………………. 22
9. EPT taxa collected at control sites and treatment sites before (September
2001) and after (October 2001) treatment……………………………………. 23
10. Total taxa collected at control sites and treatment sites in the fall of 1996 and 2000-2002……………………………………………………………….... 24
11. Density of rainbow trout (RBT) and longnose dace (LND) in Sams Creek
fish control sites before and after treatment in September, 2001……............... 25
12. Length frequency distribution of rainbow trout collected in all three Sams Creek control sites before (2001) and after treatment (2002)…………………. 25
1
EXECUTIVE SUMMARY The primary mission of the National Park Service is to protect and preserve native species where feasible. Historic land management practices and stocking of non-native rainbow trout resulted in native brook trout loosing approximately 75% of their historic range. In an effort to reverse this trend, in 1976, Great Smoky Mountains National Park initiated a program to evaluate the effectiveness of electrofishing for the eradication of non-native rainbow trout upstream of waterfalls or cascades in six small streams. This method proved successful and to date segments of six streams have been successfully restored. Several studies completed during this period indicated that streams with complex habitat coupled with large deep pools rendered non-native fish removal using backpack electrofishing gear unattainable. To date, the majority of streams in which electrofishing can be used have been completed and alternative methods must be evaluated if larger stream segments are to be restored for brook trout. Based upon these results, an environmental assessment was completed in 2001 to evaluate the use of the fish toxicant Fintrol® (antimycin) for the removal of non-native rainbow trout from selected segments of eight GRSM streams. The first stream evaluated was Sams Creek, a stream in which electrofishing had failed due to complex habitat with large deep pools. Restoration was initially attempted in September 2000; however, a combination of peak leaf fall and steep stream gradient (factors not encountered in previous projects) rendered the antimycin ineffective. A second treatment began in September 2002 and was completed within nine days. Aquatic macroinvertebrate monitoring before and within four months of treatment indicated select species were reduced by up to 50%, but no species were eliminated. After one year, all aquatic macroinvertebrate species were at or above pre-treatment levels. Comparisons of cost and time requirements for each method clearly demonstrate that projects involving the use of Fintrol® are much cheaper and require considerably less time than electrofishing. ACKNOWLEDGEMENTS A project of this scale could not have been completed without the support of many public, private, and state and federal agencies. Thanks to the following people who served on the Sams Creek EA Advisory team: Jim Borawa, Jim Habera, David A. Etnier, Squeak Smith and Kirk Otey. We would like to thank the following groups for their generous financial and volunteer support throughout the Sams Creek project: Little River Chapter of Trout Unlimited, Great Smoky Mountains Chapter of Trout Unlimited, Tuckasiegee Chapter of Trout Unlimited, NC and TN Council’s of Trout Unlimited, Trout Unlimited National Office, Federation of Flyfisher’s, the Tennessee Brookies, Student Conservation Association, National Fish and Wildlife Foundation and Little River Outfitters. Additionally, thanks are extended to the following agencies and personnel for their support during the Sams Creek project: US Fish and Wildlife Service, National Park Service - Mark Buktenica and Brian Mahoney (Crater Lake NP), Neal Darby, Gretchen Baker and Fred Gender (Great Basin NP); Rick Bivens, Bart Carter, Jim Habera, and Carl Williams (Tennessee Wildlife Resources Agency). Jim Tilmant (NPS Water Resources Division) provided WASO programmatic oversight and helpful editorial comments.
2
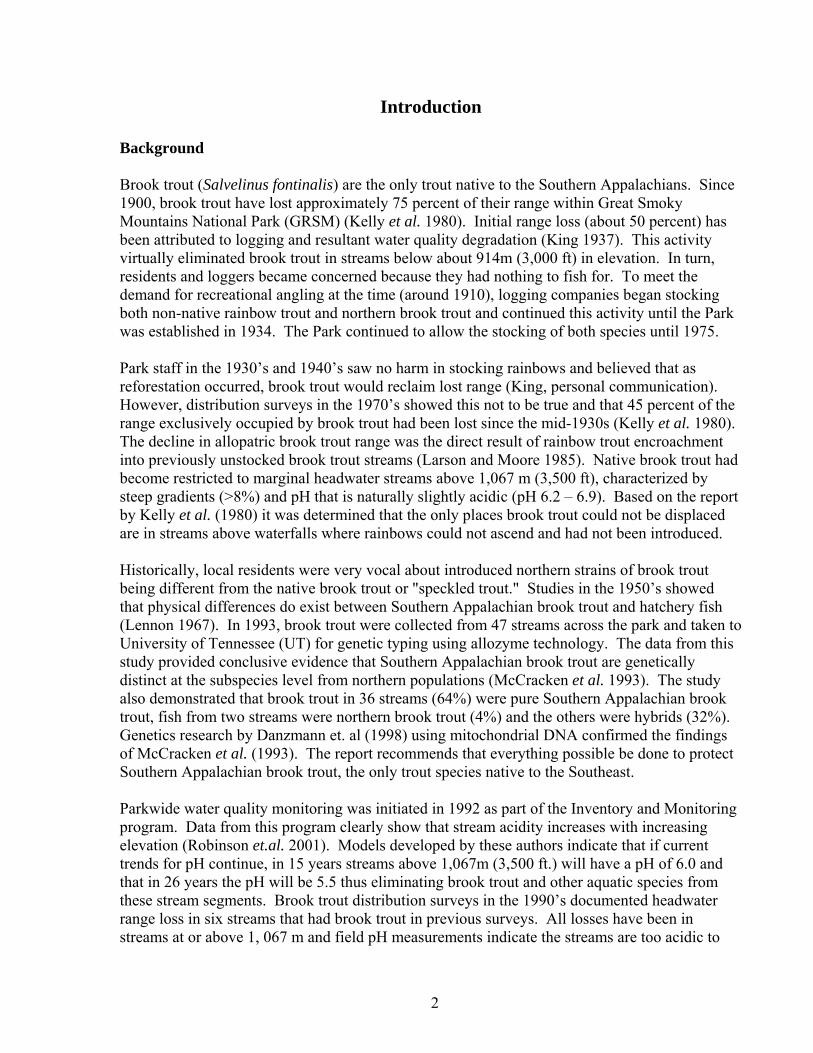
Introduction
Background Brook trout (Salvelinus fontinalis) are the only trout native to the Southern Appalachians. Since 1900, brook trout have lost approximately 75 percent of their range within Great Smoky Mountains National Park (GRSM) (Kelly et al. 1980). Initial range loss (about 50 percent) has been attributed to logging and resultant water quality degradation (King 1937). This activity virtually eliminated brook trout in streams below about 914m (3,000 ft) in elevation. In turn, residents and loggers became concerned because they had nothing to fish for. To meet the demand for recreational angling at the time (around 1910), logging companies began stocking both non-native rainbow trout and northern brook trout and continued this activity until the Park was established in 1934. The Park continued to allow the stocking of both species until 1975. Park staff in the 1930’s and 1940’s saw no harm in stocking rainbows and believed that as reforestation occurred, brook trout would reclaim lost range (King, personal communication). However, distribution surveys in the 1970’s showed this not to be true and that 45 percent of the range exclusively occupied by brook trout had been lost since the mid-1930s (Kelly et al. 1980). The decline in allopatric brook trout range was the direct result of rainbow trout encroachment into previously unstocked brook trout streams (Larson and Moore 1985). Native brook trout had become restricted to marginal headwater streams above 1,067 m (3,500 ft), characterized by steep gradients (>8%) and pH that is naturally slightly acidic (pH 6.2 – 6.9). Based on the report by Kelly et al. (1980) it was determined that the only places brook trout could not be displaced are in streams above waterfalls where rainbows could not ascend and had not been introduced. Historically, local residents were very vocal about introduced northern strains of brook trout being different from the native brook trout or "speckled trout." Studies in the 1950’s showed that physical differences do exist between Southern Appalachian brook trout and hatchery fish (Lennon 1967). In 1993, brook trout were collected from 47 streams across the park and taken to University of Tennessee (UT) for genetic typing using allozyme technology. The data from this study provided conclusive evidence that Southern Appalachian brook trout are genetically distinct at the subspecies level from northern populations (McCracken et al. 1993). The study also demonstrated that brook trout in 36 streams (64%) were pure Southern Appalachian brook trout, fish from two streams were northern brook trout (4%) and the others were hybrids (32%). Genetics research by Danzmann et. al (1998) using mitochondrial DNA confirmed the findings of McCracken et al. (1993). The report recommends that everything possible be done to protect Southern Appalachian brook trout, the only trout species native to the Southeast. Parkwide water quality monitoring was initiated in 1992 as part of the Inventory and Monitoring program. Data from this program clearly show that stream acidity increases with increasing elevation (Robinson et.al. 2001). Models developed by these authors indicate that if current trends for pH continue, in 15 years streams above 1,067m (3,500 ft.) will have a pH of 6.0 and that in 26 years the pH will be 5.5 thus eliminating brook trout and other aquatic species from these stream segments. Brook trout distribution surveys in the 1990’s documented headwater range loss in six streams that had brook trout in previous surveys. All losses have been in streams at or above 1, 067 m and field pH measurements indicate the streams are too acidic to

3
support fish life. These data increase the urgency of restoring mid to low elevation stream segments identified in the GRSM Fishery Management Plan (Moore 1993) for this native trout as rapidly as possible to provide a long-term refuge for native brook trout.
History of Electrofishing Restoration Efforts in the Park In 1976, GRSM funded a study to evaluate the effectiveness of electrofishing as a tool for eliminating non-native rainbow trout (Oncorhynchus mykiss) from six small headwater streams (Sams Creek, Starkey Creek, Beetree Creek, Silers Creek, Taywa Creek and Mouse Creek). Non-native rainbow trout were removed from the streams annually using one backpack electrofishing unit and a crew of one or two assistants. Moore et al. (1981) indicated that the annual efforts slowly reduced the rainbow trout population in each stream and that after four years of removal the populations had been significantly reduced (≥ 95%) but not eliminated from any stream. A review of the data from this study clearly shows that the annual removals collected a significant portion (60-70%) of the adult rainbow trout and a small segment (≤ 30%) of the young of the year (YOY) fish each year. The adults that remained spawned the next spring and thus the population was perpetuated, making eradication difficult goal to achieve in two to three years. Based on the early results of Moore et al. (1981), the U.S. Fish and Wildlife Service’s (USFWS) acquired funding for a large crew (> 10 people) and attempted two removals in a year and four to six electrofishing passes per removal in (Desolation Creek, Lynn Camp Prong, Road Prong and Sams Creek). Their assumption was that a larger crew and multiple removals would increase the efficiency of rainbow trout removal resulting in eradication of non-native rainbow trout in one to two years. They attempted to eliminate rainbow trout from approximately 4.8km (3.0 miles) Sams Creek in 1978 and 1979. Whitworth (1979) evaluated this effort and determined that the use of larger crews and multiple removals did remove significantly more fish than a single removal. His data also demonstrated that the fall and early spring removal effort failed to eliminate rainbow trout from the stream and that removal efficiency varied with channel complexity. The density of non-native rainbow trout in the downstream most 1.6 km, which has numerous deep pools (>1.0 m deep), had been reduced approximately 78.7% and that rainbow trout recruitment was limited to this stream reach. In the middle and upper sections, where channel complexity decreased and pool depth rarely exceeded 0.6 m, the reductions were 92.7% and 98.2% respectively. Whitworth (1979) concluded that due to the complexity of the habitat in lower Sams Creek the complete removal of non-native rainbow trout with electrofishing was impossible. In 1986 and 1987, Moore and Larson (1989) and West et al. (1990) evaluated seven of the ten streams in which brook trout restoration had been attempted in GRSM. This evaluation demonstrated that two streams (Silers Creek and Taywa Creek) had been successfully restored for native brook trout. Apparently the last removal in 1981 eliminated rainbow trout or had reduced the density to the point where they could not successfully reproduce. Additionally, each stream had a barrier and the mean stream width was ≤ 4.0 m making them ideal for restoration with one backpack electrofishing unit. These authors stated that the variation in success with one backpack electrofishing unit was due to stream width, stream channel complexity, presence or absence of a barrier and the amount of effort expended. West et al. (1990) indicated that as stream width, depth, percent pools, percent boulders and pool width ratings increased that the
4
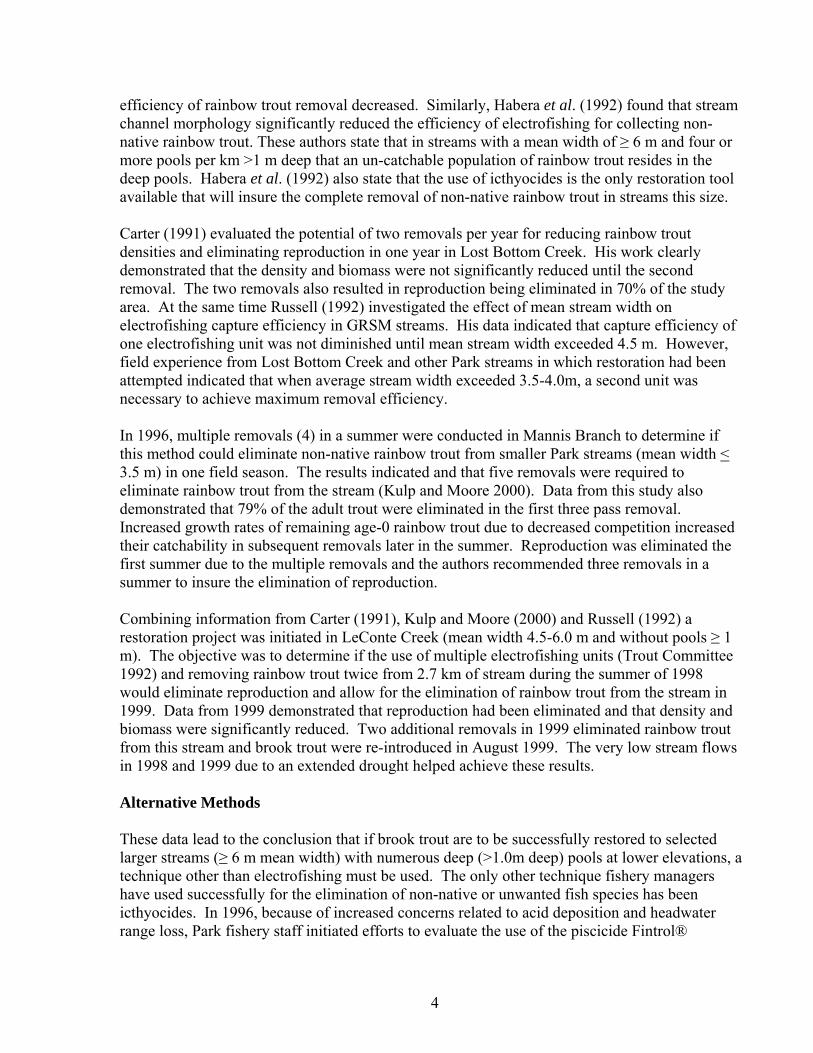
efficiency of rainbow trout removal decreased. Similarly, Habera et al. (1992) found that stream channel morphology significantly reduced the efficiency of electrofishing for collecting non-native rainbow trout. These authors state that in streams with a mean width of ≥ 6 m and four or more pools per km >1 m deep that an un-catchable population of rainbow trout resides in the deep pools. Habera et al. (1992) also state that the use of icthyocides is the only restoration tool available that will insure the complete removal of non-native rainbow trout in streams this size. Carter (1991) evaluated the potential of two removals per year for reducing rainbow trout densities and eliminating reproduction in one year in Lost Bottom Creek. His work clearly demonstrated that the density and biomass were not significantly reduced until the second removal. The two removals also resulted in reproduction being eliminated in 70% of the study area. At the same time Russell (1992) investigated the effect of mean stream width on electrofishing capture efficiency in GRSM streams. His data indicated that capture efficiency of one electrofishing unit was not diminished until mean stream width exceeded 4.5 m. However, field experience from Lost Bottom Creek and other Park streams in which restoration had been attempted indicated that when average stream width exceeded 3.5-4.0m, a second unit was necessary to achieve maximum removal efficiency. In 1996, multiple removals (4) in a summer were conducted in Mannis Branch to determine if this method could eliminate non-native rainbow trout from smaller Park streams (mean width < 3.5 m) in one field season. The results indicated and that five removals were required to eliminate rainbow trout from the stream (Kulp and Moore 2000). Data from this study also demonstrated that 79% of the adult trout were eliminated in the first three pass removal. Increased growth rates of remaining age-0 rainbow trout due to decreased competition increased their catchability in subsequent removals later in the summer. Reproduction was eliminated the first summer due to the multiple removals and the authors recommended three removals in a summer to insure the elimination of reproduction. Combining information from Carter (1991), Kulp and Moore (2000) and Russell (1992) a restoration project was initiated in LeConte Creek (mean width 4.5-6.0 m and without pools ≥ 1 m). The objective was to determine if the use of multiple electrofishing units (Trout Committee 1992) and removing rainbow trout twice from 2.7 km of stream during the summer of 1998 would eliminate reproduction and allow for the elimination of rainbow trout from the stream in 1999. Data from 1999 demonstrated that reproduction had been eliminated and that density and biomass were significantly reduced. Two additional removals in 1999 eliminated rainbow trout from this stream and brook trout were re-introduced in August 1999. The very low stream flows in 1998 and 1999 due to an extended drought helped achieve these results. Alternative Methods These data lead to the conclusion that if brook trout are to be successfully restored to selected larger streams (≥ 6 m mean width) with numerous deep (>1.0m deep) pools at lower elevations, a technique other than electrofishing must be used. The only other technique fishery managers have used successfully for the elimination of non-native or unwanted fish species has been icthyocides. In 1996, because of increased concerns related to acid deposition and headwater range loss, Park fishery staff initiated efforts to evaluate the use of the piscicide Fintrol®
5
(antimycin) for brook trout restoration in larger streams. Initial planning efforts clearly indicated that the process set forth in the National Environmental Policy Act (NEPA) would need to be adhered to. Based on this information, an Environmental Assessment (EA) had to be completed before the project could move forward. Park staff conducted literature surveys, formed an EA advisory team and received training in the use of antimycin from a project in Crater Lake National Park. The EA for the experimental use of antimycin in Sams Creek was approved in May 2000. If the project was successful then antimycin could be used in the five additional streams listed in the EA.
Objectives The objectives of this project were: 1. To eliminate non-native rainbow trout from 4.8 km (3.0 miles) of Sams Creek (upstream of
a waterfall at 646 m [2120 ft.]); 2. Determine the short-term and long-term impacts of antimycin application to non-target
aquatic fauna (aquatic macro-invertebrates, salamanders and crayfish); 3. To document the recovery process of the aquatic community following antimycin treatment
(including brook trout, aquatic macro-invertebrates, salamanders and crayfish); 4. Validate or improve the three-pass depletion approach to population estimates currently
being used; and 5. To determine the effects of liberal angling regulations on an unfished population of rainbow
trout and evaluate changes in population size structure, density and biomass as a result of angling.
6. Evaluate the cost-effectiveness of Antimycin use in comparison to electrofishing approaches
to native fish restoration in small streams.
Study Area Sams Creek, a third order tributary to the Middle Prong of Little River (Figure 1), is located in Sevier County, Tennessee. The treatment area began at a waterfall at 646m (2120 ft.) elevation and extended upstream 4,200m to a waterfall at 1,051m (3,450 ft.) altitude. The stream in the treatment reach is characterized by a steep gradient (4 – 25%); and the substrate is dominated by boulder, rubble and cobble. Pools, complex units, riffles and cascades dominate stream habitat. Low conductivity (10 – 15 µS/cm) and an average pH of 6.3 characterize the water quality. Summer and fall stream discharge ranges from 0.02 – 0.16 m3 /sec. The major forest canopy in the watershed consists of second-growth yellow birch (Betula allegheniensis), sweet birch (Betula lenta), maples (Acer spp.), hemlock (Tusga canadensis), yellow buckeye (Aecculus octandra) and tulip poplar (Liriodendron tulipifera). The major

6
understory vegetation consists of Rhododendron spp., Hydrangea arborescens, and dog hobble (Leucothoe fontenosa).
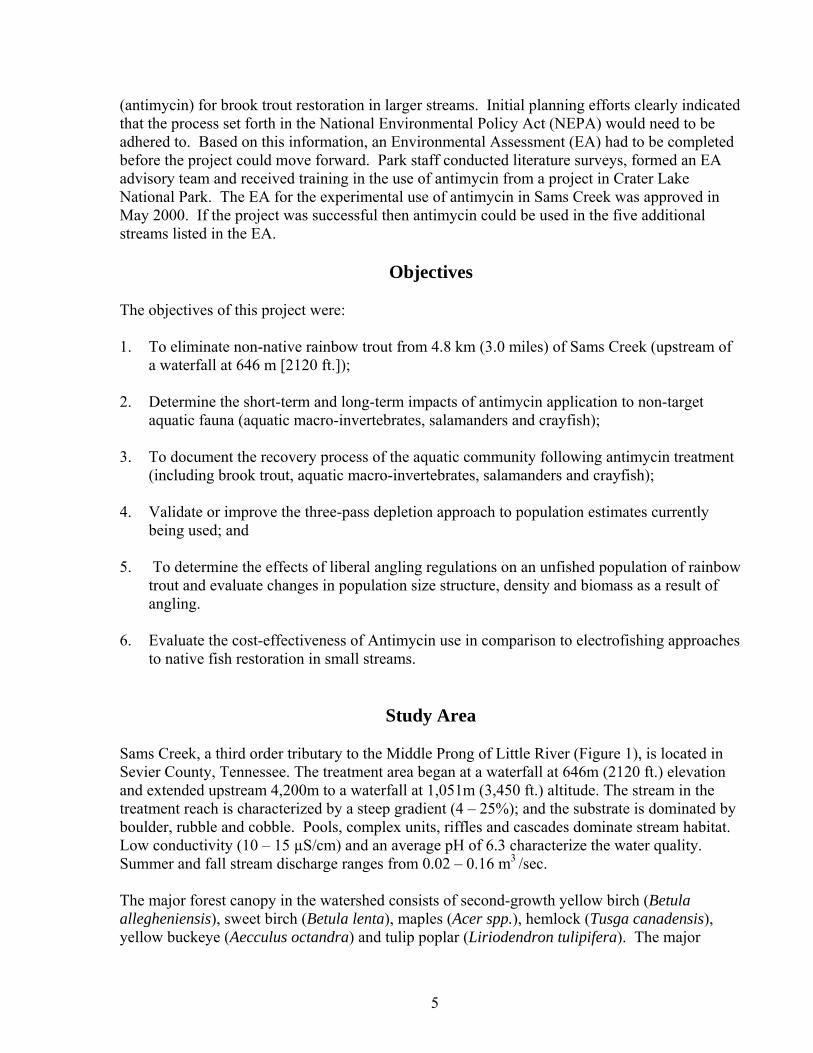
Figure 1. Sams Creek treatment area and location of aquatic insect monitoring and fish control sites.
Methods
Because of our past experience with the use of electrofishing to remove non-native fish discussed above, and in order to provide for a comparison of available methods, the use of Fintrol®
(Antimycin) was selected as the method of fish removal in this project. Fintrol® has been used since 1973 to restore native trout to segments of their historic range in several National Parks. During this time much has been learned about applying Fintrol® (antimycin) to streams to insure the complete removal of non-native salmonids. The lessons learned from native fish restoration projects in five western national parks have resulted in the development of treatment protocols that are currently being used in National Park units. These procedures were used during the Sams Creek project and are as follows. Environmental Assessment The National Environmental Policy Act (NEPA) requires federal agencies to write an Environmental Impact Statement (EIS) or an Environmental Assessment (EA) for major actions on their lands. The decision to evaluate the use of antimycin to restore larger mid-elevation streams for brook trout precipitated the need to write an EA for brook trout restoration in GRSM. Once completed the EA was released for public comment. At the end of the 30 day comment period and based on the comment received, a Finding of No Significant Impact (FONSI) was
C1
C2
C3
C1
I9
I7
I4I2
I1
Stream SegmentTreatment AreaBrook Trout RefugeInsect Monitoring SiteFish Monitoring Site (Sams Creek)Control Site (Thunderhead Prong)
Legend
7
prepared and signed by the Regional Director for the Southeast Region of the National Park Service. This document followed the format recommended by Freeman and Jenson (1999). Bioassays Bioassays for Sams Creek were conducted stream side in May and October 1998. This set up allowed for the use of water directly from the stream. Electrofishing was used to collect adult rainbow trout (152 – 230 mm) for the toxicity test. Three experiments were conducted for each bioassay. First, five rainbow trout were placed in a five gallon bucket that contained 0, 2, 4, or 8 ppb antimycin. Each bucket was observed for eight hours and mortalities recorded for each concentration. Next, four buckets were prepared with 8 ppb antimycin each. Then 1, 2, 3 or 4 ppm potassium permanganate (KMnO4) was added to a bucket. Thirty minutes later, five rainbow trout were added to each bucket and observed for eight hours. Trout mortality was recorded for each bucket at 1, 4, 8 and 24 hours. The purpose of this experiment was to determine the concentration KMnO4
necessary to neutralize the antimycin. In the last experiment, 1, 2, 3, or 4 ppm KMnO4
was added to a bucket. Five rainbow trout were then added to each bucket and the fish observed for eight hours and the mortalities recorded. The purpose of this experiment was to determine which concentration of KMnO4
was the most toxic to rainbow trout. In addition, bioassays were also conducted using juvenile rainbow trout (75 – 90 mm) by the staff of Dr. Peter Galbreath in a laboratory at Western Carolina University (WCU) using tanks set up to mimic the water quality parameters of Sams Creek. The WCU bioassays were set up using the same study design as those conducted in GRSM and used to verify the results of the GRSM field bioassays. Regardless of where the bioassays were conducted, all surviving trout were transferred to untreated water after eight hours of exposure. During the Sams Creek bioassay, surviving trout were placed in holding cages in the stream and at WCU they were transferred to holding tanks with fresh water in the laboratory. The purpose of this effort was to determine delayed mortality 24 and 48 hours after eight hours of exposure. Fish Distribution Prior to treatment, backpack electrofishing techniques were used to map the distribution of rainbow and brook trout in Sams and Starkey Creeks. Allopatric and sympatric population segments were delineated and the downstream and upstream elevation of rainbow and brook trout recorded for each stream segment. All tributaries were surveyed (regardless of size) to determine if fish inhabited any portion of the tributary. If none were found, the tributary was labeled “no fish”on the project map. These data were used to delineate the treatment area. Fish Population Studies Backpack electrofishing techniques were also used to collect the fish for population estimates in 13 sample sites within the project area. Each sample site was approximately 100 m in length. Five sites had been monitored since 1989 to evaluate annual variation in allopatric and sympatric
8
rainbow and brook trout populations. Four were added to help assess the impact of liberalized angling regulations in the 2.4 km of stream open to fishing. Three additional sites were established downstream of the detoxification station to evaluate the effects (if any) of potassium permanganate (KMnO4) on fish and aquatic insect populations. One site was established in Thunderhead Prong to serve as the control for the sites downstream of the detoxification station. All sites were sampled prior to the initiation of the liberalized angling and the six sites in the 2.4 km open for fishing were sampled again immediately after the closure of the liberalized angling study. Sampling protocols followed those recommended by the American Fisheries Society, Southern Division Trout Committee for three pass depletion population sampling (Trout Committee, Southern Division, American Fisheries Society, 1992). Backpack electrofishing units similar to those described by Habera et al. (1996) were used during this project. Electrofishing passes were conducted upstream between the block nets for each site. Electrofishing crews consisted of four to twelve people depending on stream size. All fish captured during each electrofishing pass were measured for total length (nearest mm) and weighed (± 0.1 gram). The data were used to calculate biomass (kg/hectare) and density (number of fish/100m2). All fish were returned to the site once sampling was completed. Stream Profile Measurements Prior to treatment, the stream was divided into 100m sections and the gradient (%) was taken every 10 m with a Sunnto clinometer and the mean stream gradient (%) calculated for each section. These data were used to construct a gradient profile for the treatment area and to help determine the location of antimycin treatment stations. Discharge Measurements Stream discharge (ft3/sec) was calculated daily at pre-determined sites. These sites were flagged to insure consistency throughout the project. As a general rule, discharge was taken downstream of each tributary that entered Sams Creek. We attempted to find areas with as smooth a bottom as possible and relatively uniform depth. Areas with turbulence, eddies and backwater were avoided. At each discharge measurement site, a cross-sectional transect was established and this transect was divided into a minimum of ten cells, the depth and velocity was taken for each cell, the discharge for each cell calculated and these values summed to determine the overall discharge using the following formula: Q = ∑ w1 d1 v1 + w2d2v2 + …. + wndnvn (Mcmahon, T.E. et al. 1996) Flow Studies Time of travel flow studies were completed for the project area when fish distribution studies were completed. To collect this data, 100ml of fluorescine dye was injected into the stream at a known location (e.g. upstream end of rainbow trout, numbered stream section, etc) and the time of injection and the elevation recorded. The time of travel (flow time) from the injection point to each downstream section or known point (i.e. tributary confluence, stream crossing, etc.) was recorded. The flow time for all stream sections was summed to provide the total flow time from
9
the upstream end of the treatment area to the downstream barrier or the time required for Fintrol to reach the barrier/potassium permanganate station from a known upstream point. These data are also necessary to determine when the Fintrol (antimycin) would reach the next downstream treatment station so that station could be started at the correct time to insure continuous treatment throughout the day. Flow times to the potassium permanganate station are also critical to insure initiation of detoxification procedures. Aquatic Insect Studies Aquatic insect monitoring studies were conducted by Dr. David Etnier and his staff from the University of Tennessee. Pre-treatment aquatic macroinvertebrate collections were initially made at nine sample sites (4 treatment and 5 control) in September/October1996 and February and June 1997 to establish species diversity and relative density by species for each season. These sites were sampled again prior to treatment in September 2001 and the results compared to the 1996 and 1997 data. Post-treatment collections were conducted in all nine sites again in early October 2001 to determine immediate effects of treatment on the aquatic insect community (Walker 2003). Follow-up collections were conducted at all 9 sites in February, June, and September/October 2002 to insure that aquatic insects found only in one season were sampled and to evaluate recovery. Teams of experienced collectors used a multi-habitat approach to conduct aquatic macroinvertebrate sampling for each sample collected (Walker 2003). Each collector sampled as many habitats (preferably all) as possible in a predetermined amount of time instead of sampling a fixed amount of area. Collectors expended approximately 1.5 hours sampling each site. Two to three collectors were assigned to smaller sites and five to seven people sampled the larger sites (Etnier and Hulsey 2005). Collecting methods included kick screening of small riffles, dip-netting larger riffles, undercut banks and root wads, rock picking, picking leaf packs, and searching specialized habitats, such as coarse sand and submerged woody debris. This method insured that the majority of the taxa inhabiting each site were collected. Equipment consisted of kick screens approximately 0.12 m2 in area constructed from nylon window screen with a mesh size of 1.25 mm, standard rectangular nylon dip nets with a mesh size of 6.35 mm, and nylon D-nets with a mesh size of 500 microns (Etnier and Hulsey 2005).
Collected material was emptied into a white metal pan with a ceramic surface or a white plastic pan (Walker 2003). Aquatic insects were picked using watchmakers’ forceps and put in glass or plastic jars containing 70% isopropanol. Field collection numbers were placed inside each jar. In the laboratory, aquatic insects were identified to the lowest taxonomic level possible. Some taxa were denoted with "sp." meaning they could not be or were not identified below a certain taxonomic level, usually genus, but sometimes family or order (Walker 2003). Data from the pre-treatment samples were compared with each post-treatment sample to assess short and long term effects.
10
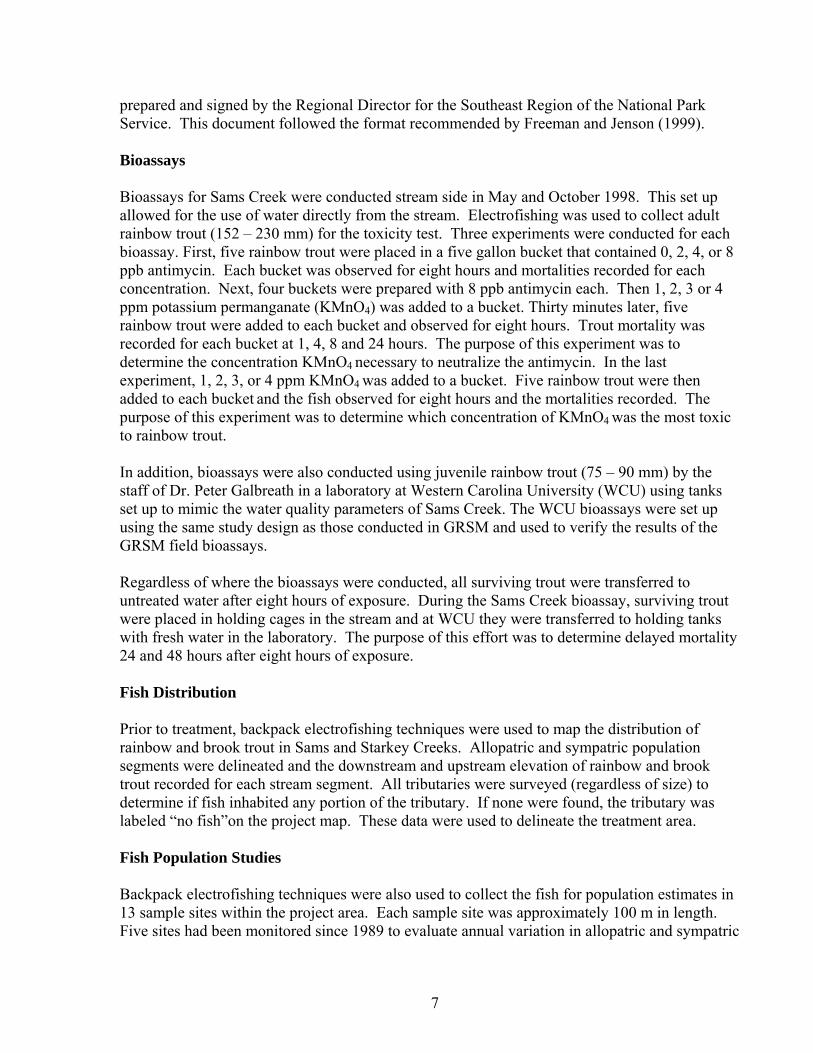
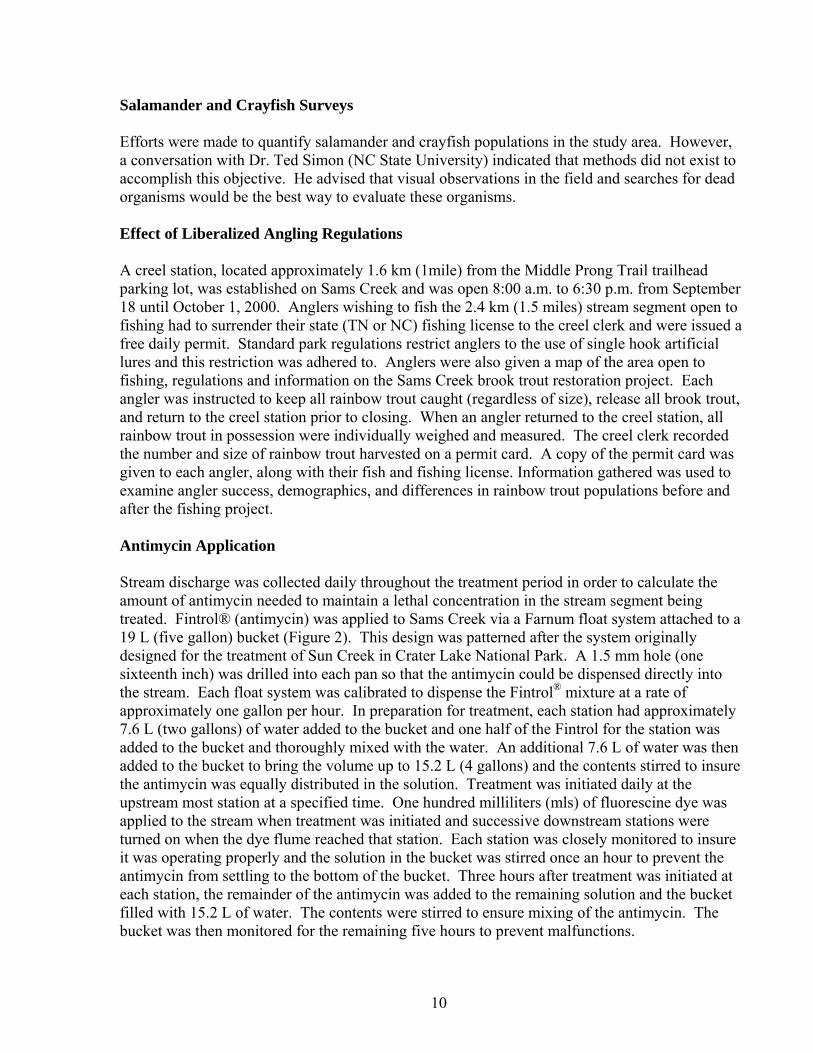
Salamander and Crayfish Surveys Efforts were made to quantify salamander and crayfish populations in the study area. However, a conversation with Dr. Ted Simon (NC State University) indicated that methods did not exist to accomplish this objective. He advised that visual observations in the field and searches for dead organisms would be the best way to evaluate these organisms. Effect of Liberalized Angling Regulations A creel station, located approximately 1.6 km (1mile) from the Middle Prong Trail trailhead parking lot, was established on Sams Creek and was open 8:00 a.m. to 6:30 p.m. from September 18 until October 1, 2000. Anglers wishing to fish the 2.4 km (1.5 miles) stream segment open to fishing had to surrender their state (TN or NC) fishing license to the creel clerk and were issued a free daily permit. Standard park regulations restrict anglers to the use of single hook artificial lures and this restriction was adhered to. Anglers were also given a map of the area open to fishing, regulations and information on the Sams Creek brook trout restoration project. Each angler was instructed to keep all rainbow trout caught (regardless of size), release all brook trout, and return to the creel station prior to closing. When an angler returned to the creel station, all rainbow trout in possession were individually weighed and measured. The creel clerk recorded the number and size of rainbow trout harvested on a permit card. A copy of the permit card was given to each angler, along with their fish and fishing license. Information gathered was used to examine angler success, demographics, and differences in rainbow trout populations before and after the fishing project. Antimycin Application Stream discharge was collected daily throughout the treatment period in order to calculate the amount of antimycin needed to maintain a lethal concentration in the stream segment being treated. Fintrol® (antimycin) was applied to Sams Creek via a Farnum float system attached to a 19 L (five gallon) bucket (Figure 2). This design was patterned after the system originally designed for the treatment of Sun Creek in Crater Lake National Park. A 1.5 mm hole (one sixteenth inch) was drilled into each pan so that the antimycin could be dispensed directly into the stream. Each float system was calibrated to dispense the Fintrol® mixture at a rate of approximately one gallon per hour. In preparation for treatment, each station had approximately 7.6 L (two gallons) of water added to the bucket and one half of the Fintrol for the station was added to the bucket and thoroughly mixed with the water. An additional 7.6 L of water was then added to the bucket to bring the volume up to 15.2 L (4 gallons) and the contents stirred to insure the antimycin was equally distributed in the solution. Treatment was initiated daily at the upstream most station at a specified time. One hundred milliliters (mls) of fluorescine dye was applied to the stream when treatment was initiated and successive downstream stations were turned on when the dye flume reached that station. Each station was closely monitored to insure it was operating properly and the solution in the bucket was stirred once an hour to prevent the antimycin from settling to the bottom of the bucket. Three hours after treatment was initiated at each station, the remainder of the antimycin was added to the remaining solution and the bucket filled with 15.2 L of water. The contents were stirred to ensure mixing of the antimycin. The bucket was then monitored for the remaining five hours to prevent malfunctions.
11
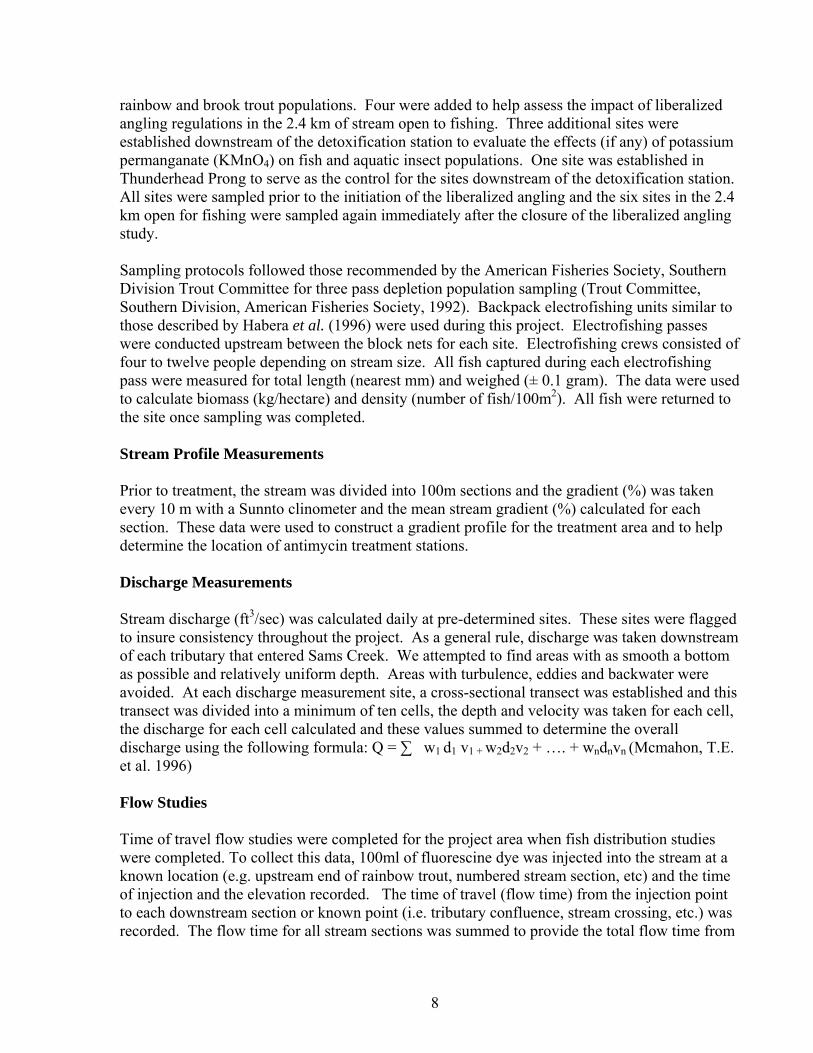
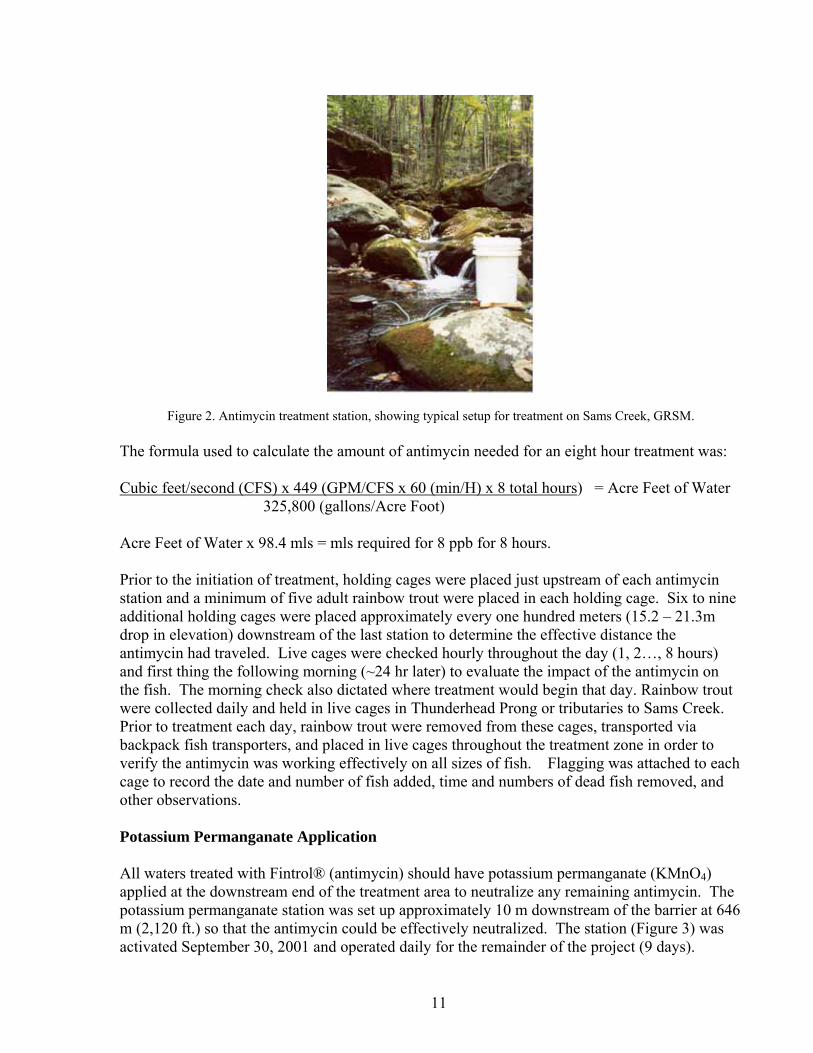
Figure 2. Antimycin treatment station, showing typical setup for treatment on Sams Creek, GRSM. The formula used to calculate the amount of antimycin needed for an eight hour treatment was: Cubic feet/second (CFS) x 449 (GPM/CFS x 60 (min/H) x 8 total hours) = Acre Feet of Water 325,800 (gallons/Acre Foot) Acre Feet of Water x 98.4 mls = mls required for 8 ppb for 8 hours. Prior to the initiation of treatment, holding cages were placed just upstream of each antimycin station and a minimum of five adult rainbow trout were placed in each holding cage. Six to nine additional holding cages were placed approximately every one hundred meters (15.2 – 21.3m drop in elevation) downstream of the last station to determine the effective distance the antimycin had traveled. Live cages were checked hourly throughout the day (1, 2…, 8 hours) and first thing the following morning (~24 hr later) to evaluate the impact of the antimycin on the fish. The morning check also dictated where treatment would begin that day. Rainbow trout were collected daily and held in live cages in Thunderhead Prong or tributaries to Sams Creek. Prior to treatment each day, rainbow trout were removed from these cages, transported via backpack fish transporters, and placed in live cages throughout the treatment zone in order to verify the antimycin was working effectively on all sizes of fish. Flagging was attached to each cage to record the date and number of fish added, time and numbers of dead fish removed, and other observations. Potassium Permanganate Application All waters treated with Fintrol® (antimycin) should have potassium permanganate (KMnO4) applied at the downstream end of the treatment area to neutralize any remaining antimycin. The potassium permanganate station was set up approximately 10 m downstream of the barrier at 646 m (2,120 ft.) so that the antimycin could be effectively neutralized. The station (Figure 3) was activated September 30, 2001 and operated daily for the remainder of the project (9 days).
12
Stream discharge at the station was calculated daily to determine the amount of KMnO4 to apply to the stream.
Figure 3. Sams Creek Potassium Permanganate station in operation, GRSM.
The formula used to calculate the grams of KMnO4 required per hour of treatment for 1 cubic foot/sec was: 1 CFS x 449 (GPM/CFS) x 60 (min/hr) = 26,940 gallons/hr Gallons/hr x 3785 (mls/gal) = 101,967,900 mls/hr = 101.97 (grams for 1 ppm) 1,000,000 To calculate the amount required for 1 cubic foot/sec at 4 ppm: 101.97 x 4 = 407.9 g. Time and Cost Comparison of Fish Removal Methods From 1976 to 1999, GRSM biologists have used a number of variations of electrofishing to remove non-native fish and to restore brook trout in selected stream segments. Each variation has had varying time and cost associated with the project, which has been documented. These past projects were compared to the costs and time requirements documented during this Sams Creek restoration project to provide a comparison of the cost and efficiencies of using Antimycin versus electrofishing for fish removal projects. A comparison of the number of stream miles treated, hours of field work required, years required to attain complete restoration, and total project costs for each of the treatment methods that have been used on small streams within the park is shown in Table 5. The time and cost comparisons in Table 5 are personnel cost only and are based on a crew of 10 people (seven GS 5 technicians, one GS 7 lead technician, one GS 11 biologist and one GS 12 supervisory biologist). Additional cost that must be considered are the cost of backpack electrofishing units, the cost of antimycin, waders, block nets and equipment necessary to apply the antimycin to the stream.
13
Results
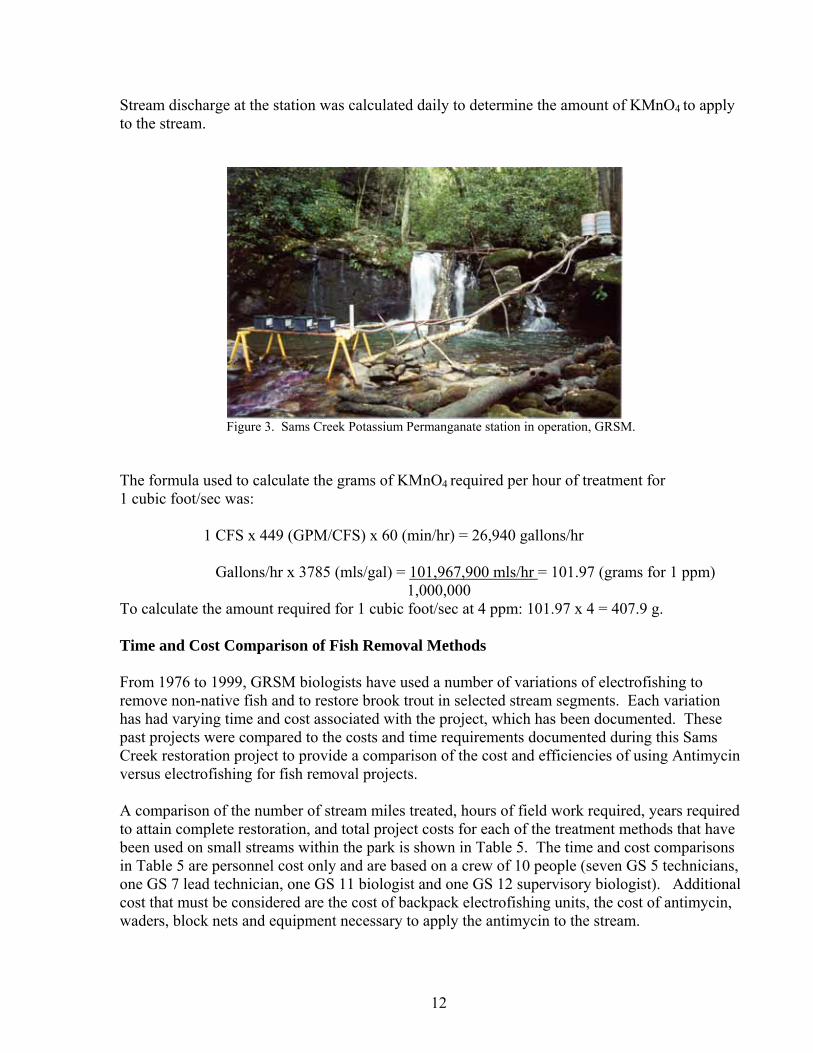
Antimycin Toxicity The results of laboratory bioassays conducted WCU staff using juvenile rainbow trout (75 – 95 mm) demonstrated that exposure to 4 ppb Fintrol® for four hours would result in 100% mortality in 24 hours (Hallyburton 1999). Hallyburton (1999) also provided data that demonstrated 55% and 94% mortality after four hours of exposure at a pH of 6.7 and 6.2 respectively. Additionally his results indicated that exposure to 8 ppb resulted in 100% mortality in two to three hours depending on pH (Table 1). The results of on-stream bioassays conducted by GRSM staff in 1998 and 1999 using wild rainbow trout from 152 – 230 mm total length gave a slightly different result. In this study, exposure to 2 or 4 ppb of antimycin for eight hours resulted in 100% mortality of these larger fish. However, mortality after eight hours of exposure was only 10 – 20%. Rainbow trout that were exposed to 8 ppb antimycin experienced 90% and 100% mortality in 8 and 24 hours respectively. This bioassay also indicated that 4ppm of KMnO4 was effective in neutralizing 8ppb of antimycin with 24-hour mortality rates <40% in all tests. Based upon the results of all the bioassays, 8ppb antimycin was deemed appropriate to ensure 100% mortality in a 24 hour period given the size structure of the rainbow trout population in Sams Creek. Table 1. — Results of antimycin toxicity test conducted on juvenile rainbow trout (75 – 95 mm) at Western Carolina University in 2000.
Antimycin Concentration 4 ppb Antimycin Concentration 8 ppb pH 6.2 6.7 7.0 6.2 6.7 7.0
1 Hour 2% 0% 0% 73% 0% 0% 2 Hours 12% 0% 0% 100% 77% 0% 3 Hours 62% 24% 6% 100% 7% 4 Hours 94% 55% 12% 36% 24 Hours 100% 100% 100% 100%
Fish Distribution Rainbow and brook trout were the only fish found in the area proposed for treatment. Rainbow trout were the only fish found in the 2.7 km of Sams Creek (646 – 914 m). A sympatric population of brook and rainbow trout was found from 914 m to 994 m in Sams Creek (1.1 km) and in 0.63 km of Starkey Creek (969-1,036 m). In the last 0.9 km of Sams Creek (994-1119 m) and Starkey Creek (1,036-1158 m) occupied by trout, only brook trout were collected. No trout were found in any of the tributary streams to Sams and Starkey Creeks.
14
Liberalized Angling Population surveys 2000 Population surveys conducted prior to the initiation of the liberalized angling experiment estimated 840 trout were located in the 2.4 km (1.5 mile) fishing zone. By comparison, twelve years of previous fish population monitoring data indicates that normally 1,500 – 2,000 rainbow trout inhabited the same section of Sams Creek. The low numbers of rainbow trout in 2000 are the result of three years of drought and the collection of fish for bioassay studies. Monitoring work from other streams in the GRSM, indicate a direct relationship between stream flow (i.e. floods and droughts) and trout population density. Size structure data indicates that 61% of the fish collected were less than 150 mm (6 inches) in total length that 36% ranged from 151 – 229 mm (6 - 9 inches) and 3% exceeded 229 mm (9 inches) in total length (Figure 3). Population data collected after the experimental fishery closed indicated that the population size structure had not been altered. The population size structure observed in both samples was almost identical to that observed in the previous 12 years of monitoring. Angler Success Two hundred twenty eight anglers, from nine states, participated in the Sams Creek fishing project with ninety percent of the anglers being from either TN or NC. During the first week of the experiment, an average of 25 people per day fished the 2,400 m of stream, but during week two, the average was seven people per day. Catch rates averaged 1.2 fish per angler in week one and 0.9 fish per angler in week two. One hundred sixty seven (73%) of the anglers who participated in the Sams Creek fishing project did not catch any fish. Harvest data shows that 165 (66%) of the 250 rainbow trout harvested were caught by 17 (7.5 %) of the anglers who participated. Additionally, 82% of the trout harvested were caught during the first week of the study. However, only four anglers caught more than 10 fish in one trip and most successful anglers caught only one fish per trip. The 250 trout harvested was approximately 30% of the number estimated to live in the 2.4 km of stream.
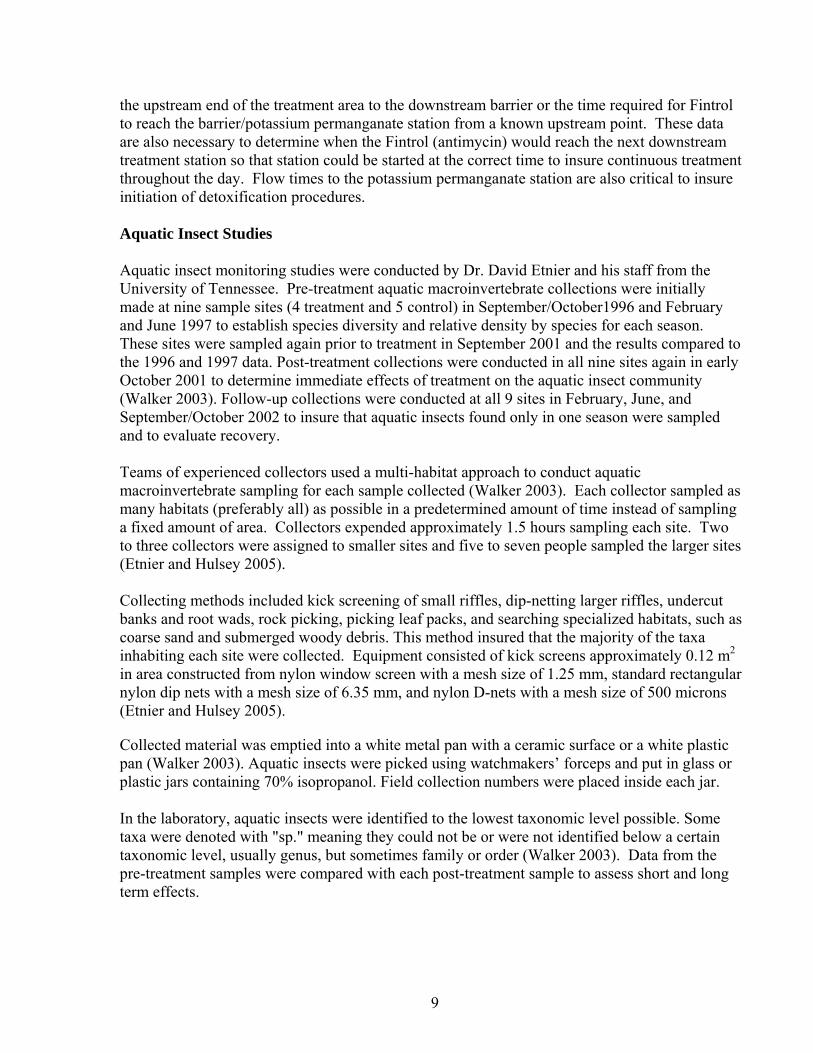
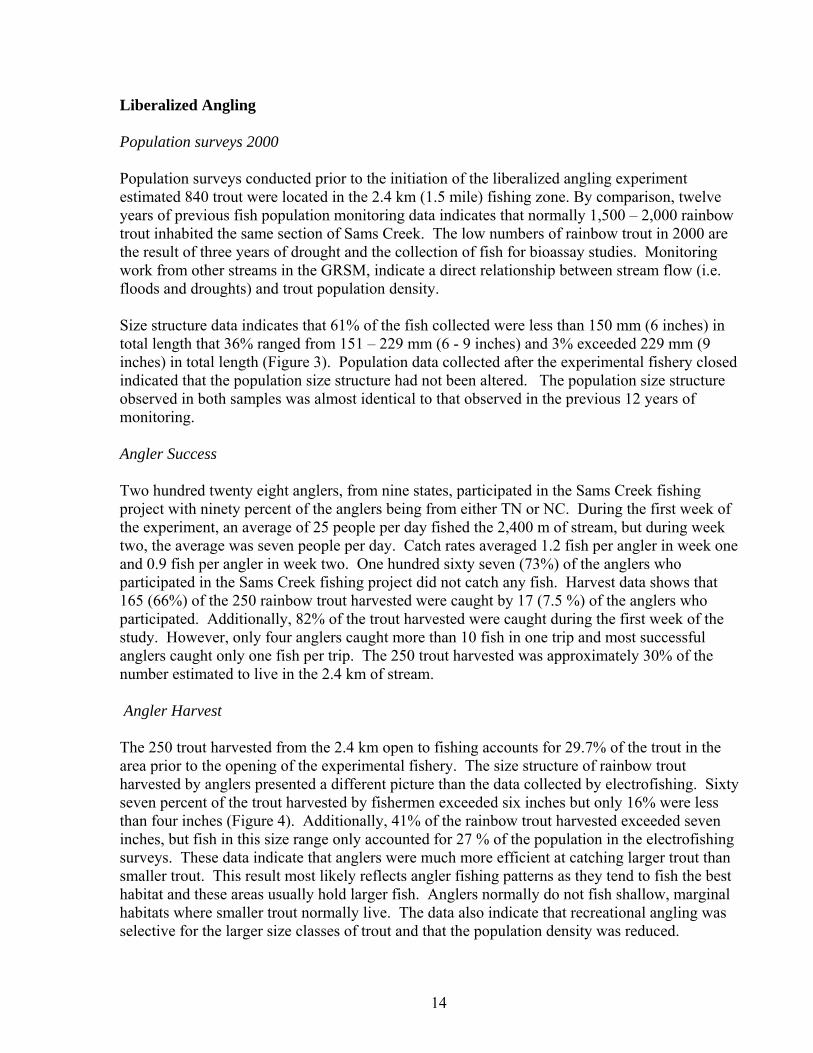
Angler Harvest The 250 trout harvested from the 2.4 km open to fishing accounts for 29.7% of the trout in the area prior to the opening of the experimental fishery. The size structure of rainbow trout harvested by anglers presented a different picture than the data collected by electrofishing. Sixty seven percent of the trout harvested by fishermen exceeded six inches but only 16% were less than four inches (Figure 4). Additionally, 41% of the rainbow trout harvested exceeded seven inches, but fish in this size range only accounted for 27 % of the population in the electrofishing surveys. These data indicate that anglers were much more efficient at catching larger trout than smaller trout. This result most likely reflects angler fishing patterns as they tend to fish the best habitat and these areas usually hold larger fish. Anglers normally do not fish shallow, marginal habitats where smaller trout normally live. The data also indicate that recreational angling was selective for the larger size classes of trout and that the population density was reduced.

15
Figure 4. Size distribution of rainbow trout that were harvested compared to size distribution of the rainbow trout that were electrofished during the Sams Creek fishing project, Great Smoky Mountains National Park.
Pre-Treatment Brook Trout Collection During the week of October 20, the 1,500 m sympatric zone of Sams Creek was electrofished and 307 brook trout were collected and transported upstream of the treatment area and released. Additionally, 130 brook trout were collected from the 600 m of Starkey Creek to be treated. Unfortunately, due to miscommunication these fish were also transported to the Sams Creek refuge area and released. All fish were adipose clipped at the time of capture. The purpose of the clip was to determine if any marked fish returned to the area from which they were moved. This process was repeated in September 2001 with 77 and 35 brook trout being transported upstream to refuge areas in Sams Creek and Starkey Creek respectively. Treatment with Antimycin October 2000 Experience with antimycin in western streams with neutral pH and cold water temperatures (≤ 10° C), suggested that an application of 8 parts per billion (ppb) for eight hours (64 exposures) was sufficient to eradicate trout from streams up to 60m (200 feet) of elevation loss before being neutralized by tumbling and hydrolysis (Rosenlund and Stevens, 1992). However, based on experiences in steep, stair step, heavily oxygenated stream segments in Rocky Mountain National Park and Crater Lake National Park, the effective distance for antimycin was shown to be as little as 30 minutes of stream flow and less than 30m loss in elevation. Based on this information, and the lower pH (6.2) and warmer water temperatures of Sams Creek, it was thought that the antimycin could be more toxic than observed in western parks and that one treatment station would effectively eliminate trout in a 400 to 600 m reach of Sams Creek (an elevation drop of about 61 m). Stream flows were less than half of normal fall flow when treatment was initiated October 23, 2000. As treatment was initiated during peak leaf fall, stream flow in the upper reaches of Sams and Starkey Creek was restricted and the outlets of many pools were clogged with leaves. One
49%
16%12% 14%
<1% 2%
11%
26%
18%
26%
7%11%
2% 1% <1% 2% 0% <1% 0% 1%
0%
10%
20%
30%
40%
50%
60%
0-4" 4-5" 5-6" 6-7" 7-8" 8-9" 9-10" 10-11" 11-12" 12" & up
Inch Group
Size Distribution Percentages of Angler Harvested and Electrofished Rainbow Trout
ElectrofishedAngler Harvest

16
treatment station located at the upstream end of rainbow trout distribution in Sams and Starkey Creeks operated that day. The intent was to treat each stream segment at 10 ppb for three hours (30 exposures). Unfortunately, the bottle containing the correct amount of antimycin for Sams Creek was inadvertently switched with the bottle for Starkey Creek. Therefore, the application rate for Sams and Starkey Creek’s was 3.8 and 31 ppb respectively for three hours. Observations of fish in the live car 200m (1 hour of flow, 42.7m and 24.4m vertical drop respectively) downstream of each treatment station that afternoon and the next morning indicated no impacts or stress at either location. Due to the low application rate for Sams Creek this was not considered unusual, but for Starkey Creek the results were surprising. Based on experiences in western streams, all trout in Starkey Creek down to the confluence (600 m) with Sams Creek (a 57.9m [190 ft] drop in elevation) should have died due to the accidental overdose. These results provided quantifiable information that a significantly higher concentration of Fintrol® would not travel further than the normal treatment dosage of 8 ppb in the steep turbulent streams of GRSM. During greenback cutthroat trout restoration projects in Rocky Mountain National Park, Rosenlund (personal communication) has had similar observations. Treatment was resumed at the Sams and Starkey Creek stations the morning of October 24 with antimycin being applied at 10 ppb for six hours (60 exposures). Additionally, a third station was set up at the confluence of Sams and Starkey Creeks and a six-hour application at 10 ppb initiated. Observations of fish in the live cars downstream of all stations three and four hours later revealed that the fish were showing no signs of stress. This information raised concerns that the antimycin being used was a bad unit and thus not affecting the trout. With this in mind, a “new” unit of antimycin was mixed and three hours of additional treatment at 10 ppb (30 exposures) was added to each station. Approximately fifteen minutes later observations of trout in the live car 100 m downstream of the station at the confluence indicated heavy impact from the antimycin. This observation was made prior to the arrival of the “new” antimycin and was the first indication that the chemical was working perfectly at this station but not carrying the distance expected. A meeting with Park staff was held the morning of October 25, 2000 to brief them on progress and uncertainty as to why the antimycin was only effective in short segments of stream. During this meeting additional concerns related to Neophylax kolodskii (a caddisfly thought to exist only in the treatment area) were raised as was the issue of not completing the project within allotted time frames and before seasonal staff were to terminate. Given these issues, a decision was made to terminate the project, evaluate the effort, and determine what future actions were to be taken. Field observations later that day verified observations for the previous day for the two upstream stations. Trout in the live car one-hour of flow (200m) downstream (42.7 m [140 ft.] drop in elevation) of the upper Sams Creek drip station exhibited classic signs of stress from the antimycin (total exposure 102) but no fish were dead. This live car was pulled and dumped the morning of October 25, 2000. Observations of the live car in Starkey Creek (24m [80 ft] drop in elevation) revealed all trout were impacted by the antimycin and that one was dead (183 exposures). This live car was left in the stream to determine if additional fish would die in the next 24 hours. Observations the next day revealed that no additional fish had died and it appeared that their condition was improving. Trout in the live car two hours of flow (400m)

17
downstream of these drip stations exhibited no impacts from the treatment. However observations of the live cars downstream of the drip station at the confluence provided evidence that the chemical was behaving as anticipated in this section. All trout in the live car 100-m downstream were dead and in the live car 400m (21m elevation loss) downstream 3 of 15 trout were dead and the remainder were heavily impacted. Nine additional trout had died by the next morning at this station and the remaining fish had died by the morning of October 27. The reason for the increased effectiveness of the antimycin in this stream reach is not clear but appears to be related to the main channel not being clogged with leaves and the lower stream gradient (≤ 8%) in this section. Upstream sections have a much steeper gradient (≥ 10%) and much of the stair step stream channel was completely blocked with leaves. This was not the case downstream of the confluence. In this area, the sides of the pools and back eddies were blocked but the channel was open and free flowing. The manufacturer was contacted and provided information related to the project and the apparent lack of effectiveness of the antimycin. He could not provide any insights at that moment but said he would attempt to determine the problem if possible. Approximately two weeks later, Nick Romeo, Aquabiotics Corporation phoned and stated that his investigations indicated that the antimycin was “being absorbed by the leaves in the stream” and thus not surviving the 61-76 m (200-250 ft.) drop in elevation and traveling the predicted 400 – 600 m of stream. Based on his research, it appears that the antimycin was being absorbed by the cellulose (a fatty acid) in the leaves and thus being neutralized. As this was the first project to attempt to use antimycin in an eastern deciduous forest, the information provided previously undocumented information related to the use of antimycin for native fish restoration in this area. The observations of October 25, 26 and 27, 2000, provided evidence that the antimycin was eliminating rainbow trout but that it was only effective over a much shorter vertical distance than observed in western projects. Information provided by Nick Romeo clearly indicated that any treatment in the east must take place prior to leaf fall. September and October 2001 Treatment was initiated September 30, 2001 at the upstream end of rainbow trout distribution in Sams and Starkey Creeks. The intent was to treat each stream segment at 8 ppb for 8 hours and to eliminate all fish in the section being treated in 24 hours. Observations the morning of October 1, 2001 revealed that the trout in the first live car in Sams (42.7 m [140 ft.] drop in elevation) downstream of the treatment station were impacted but none were dead. In Starkey Creek, the first live car was about 200 m downstream (24 m [80 ft] drop in elevation) of the treatment station. One of five fish in the live car was dead and the other four were heavily impacted. Based on this information and evaluating the data from October 2000, we concluded that the leaves had some effect on the antimycin in 2000 but that the steep stair step nature of the streams was probably breaking the antimycin molecules apart much faster than lower gradient western streams thus significantly reducing the vertical distance over which the antimycin was effective. To test this assumption, the upper treatment station for Sams was moved downstream approximately 30.5 m (100 ft.) in elevation and the upper Starkey Creek station was moved downstream about 18.3m (60 ft.) and live cars were placed at 100-m intervals (~15.2 m [50 ft.]

18
drop in elevation) downstream of each treatment station. Antimycin was then applied at 8 ppb for eight hours. Field observations the morning of October 2, 2001 revealed that in Sams Creek all fish in the live car approximately 100 m downstream, a 15.2 m (50-ft) drop in elevation, were dead. Approximately 200 m, downstream (a 36.5-m [120-ft]) drop in elevation, one fish was dead and the remainder heavily impacted. Fish downstream of this point did not appear to be affected by the treatment. Observations in Starkey Creek revealed that four of five fish were dead and the other fish was moribund approximately 100 m downstream (a 15.2m [50-ft.] drop in elevation]. One hundred meters downstream of this point, (a 30.5-m [100-ft.] drop in elevation), 2 trout were dead and the others impacted. The third live car downstream was 42.7 m [140 ft.] lower elevation than the treatment station and 2 fish had died and the remainder was impacted by the antimycin. These data provided the first quantifiable evidence that the effective LD24100 for the treatment was about 15.2 m (50 ft) to 21.3 m (70 ft.) of elevation loss, with impacts up to 30.5 m (100 ft.) of elevation loss. Based on this information, two treatment stations were set about every 15.2-m of elevation loss on Sams Creek and Starkey Creek the morning of October 2, 2001. Observations the morning of October 3 revealed that this strategy was successful in the area treated as all the trout in the live cars in Sams Creek were dead. However, in Starkey Creek some fish in the downstream most live cars, though heavily impacted had not died. This area was retreated the next day and three stations were placed in Sams Creek downstream of the confluence. The strategy of placing treatment stations every 15.2- 21.3m (50 – 70ft.) drop in elevation to insure complete removal of non-native rainbow trout was adhered to for the remainder of the project. Live Car Observations During treatment each day, fish in live cars were observed to evaluate the effectiveness of the antimycin. Approximately four hours after treatment was initiated, the coloration of rainbow trout in the live cars within a 15.2 – 22.9m (50 – 75 ft) drop in elevation would start to become lighter on top of the head and along the back. Two to four hours later, these fish had lost color over the entire body and as well as most of their fright response. During this latter time frame, very pale trout (ghost fish, could be observed in the stream in areas with little to no current). The next morning, all of these fish had died. Recovery of Trout from the Stream Attempts were made to recover as many “wild” fish as possible from the 4,800m of stream treated. An intense effort was made at the end of each day to collect the numerous “ghost fish” (Figure 5) observed holding in eddies, but most were too lively to be collected at that time. Very few of these fish could be located the next morning and it is believed that these fish had washed under rocks and could not be seen or they had washed out of the area being searched. Additionally, crayfish were observed actively feeding on dead and dying trout. Crayfish were also observed dragging dead fish under rocks to feed and we believe this is another reason dead fish could not be located in the stream. Sixty-six trout were recovered during the project of which 64 were rainbow trout and 2 were brook trout. The length range for rainbow trout was 96 – 266 mm and 80 – 93 mm for brook trout.
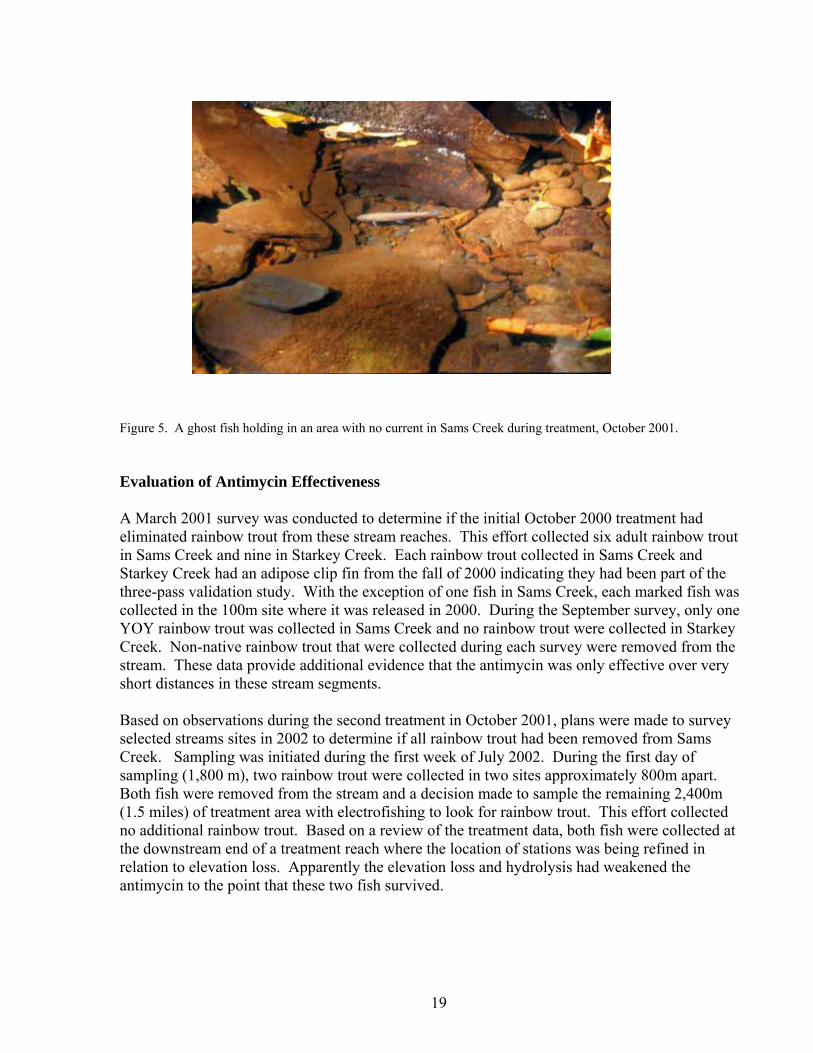
19
Figure 5. A ghost fish holding in an area with no current in Sams Creek during treatment, October 2001. Evaluation of Antimycin Effectiveness A March 2001 survey was conducted to determine if the initial October 2000 treatment had eliminated rainbow trout from these stream reaches. This effort collected six adult rainbow trout in Sams Creek and nine in Starkey Creek. Each rainbow trout collected in Sams Creek and Starkey Creek had an adipose clip fin from the fall of 2000 indicating they had been part of the three-pass validation study. With the exception of one fish in Sams Creek, each marked fish was collected in the 100m site where it was released in 2000. During the September survey, only one YOY rainbow trout was collected in Sams Creek and no rainbow trout were collected in Starkey Creek. Non-native rainbow trout that were collected during each survey were removed from the stream. These data provide additional evidence that the antimycin was only effective over very short distances in these stream segments. Based on observations during the second treatment in October 2001, plans were made to survey selected streams sites in 2002 to determine if all rainbow trout had been removed from Sams Creek. Sampling was initiated during the first week of July 2002. During the first day of sampling (1,800 m), two rainbow trout were collected in two sites approximately 800m apart. Both fish were removed from the stream and a decision made to sample the remaining 2,400m (1.5 miles) of treatment area with electrofishing to look for rainbow trout. This effort collected no additional rainbow trout. Based on a review of the treatment data, both fish were collected at the downstream end of a treatment reach where the location of stations was being refined in relation to elevation loss. Apparently the elevation loss and hydrolysis had weakened the antimycin to the point that these two fish survived.

20
Stream Gradient Effects Stream gradient played a key role in the effective vertical distance antimycin traveled during treatment. In most stream segments, the effective vertical range of antimycin was roughly 24.4m (80ft), however, in areas with stream gradients >8%, the effective vertical range of antimycin was only 15.2m (50ft) (Figure 6). In most cases, the areas where the effective vertical range of antimycin dropped to 15.2m were highly correlated with stream segments >8% on the stream
Figure 6. Stream gradient profile of Sams Creek, GRSM. Site 42 is the upper most treatment site (1,055 m) and site 0 is located at the lower barrier (646 m). gradient profile. The higher gradients and associated tumbling action of the large antimycin molecule (Figure 7) over these steep areas apparently breaks apart the molecule much quicker, thus neutralizing its effects. Note that the molecule is still effective within this 15.2 m vertical range, only the effective distance is much shorter.
O
OO CH3
O
OH3C
OOHNH
O
H
O
Figure 7. Diagram of molecular structure of the antimycin (A1) molecule (C28H40N2O9). Detoxification of Antimycin The potassium permanganate (KMnO4) station was set up approximately 10 m downstream of the barrier at 646-m (2,120 ft.) so that the antimycin could be effectively neutralized. Based on flow times, the station was activated September 30, 2001 and operated daily for the remainder of the project. In total, just over 110 kg (242.6 lb.) of KMnO4 was applied to Sams Creek over 64
0
2
4
6
8
10
12
14
16
18
42 40 38 36 34 32 30 28 26 24 22 20 18 16 14 12 10 8 6 4 2Site Number
% G
radi
ent

21
hours (Table 4). This equates to approximately 208 exposures (ppm x hours) to the fish and benthos downstream of the potassium permanganate station. Table 2. Amount of potassium permanganate (KmnO4) applied daily in to neutralize antimycin in Sams Creek September and October 2001. * indicates that potassium permanganate was not applied these days.
Date Stream Flow (cfs)
Hours Treated Dosage (ppm) KMnO4 Applied (g/hr)
Total KMnO4 Applied (kg)
9/30/01 4.5 6 2 918 5.51 10/1/01 6.1 6 2 1,224 7.34 10/2/01 5.7 8 2 1,122 8.98 10/3/01 5.2 8 3 1,530 8.98 10/4/01 4.5 9 4 1,735 15.62 10/5/01 3.5 9 4 1,428 12.85 10/6/01 4.8 9 4 1,937 17.43 10/7/01 4.8 9 4 1,937 17.43 10/8/01 * 10/9/01 *
10/10/01 3.5 9 4 1,428 12.85 Total 64 110.25
Flow Studies Dye travel times varied slightly depending upon stream gradient and the number of large pools per site, but generally averaged 30 minutes per 100m site. Total travel time from the top of the Sams Creek treatment area (3,450’) to the barrier falls (2,150’) was 12 hours 27 minutes. Stream discharge measurements ranged from 0.3 ft3/sec at the upper treatment station on Sams Creek to 3.5 ft3/sec at the barrier falls. A minor rain event one evening during treatment increased the stream discharge at the barrier 74% (6.1 ft3/sec), however, the stream was back to normal discharge within 3 days. Antimycin and potassium permanganate application rates were adjusted daily given the daily stream discharge measurements at respective sites. Impacts to Aquatic Insects Control sites Data for the control stations indicates considerable variation between the September 2001 and the October 2001 samples and throughout the study (Figures 8 and 9). Variation between samples occurred because: 1) the same collectors were not available for each sample, 2) each collector did not have the same field identification expertise for a particular taxon, or 3) were uncertain of how many potential taxa might be represented by what appeared to be a single taxon in the field. The effects of drought and flood and annual variation in the aquatic insect community probably play a role in the variation as well.

22
Immediate post-treatment effects A. Antimycin
Only data from the 2001 treatment are discussed here because less than 200 m of Sams and Starkey Creeks were treated in October 2000 and because no immediate follow-up surveys were conducted in 2000. Figures 8 and 9 show the results for total taxa and EPT taxa respectively, collected in sites 1-9 in September 2001 prior to treatment and in October 2001 after treatment.
Figure 8. Total taxa collected at control sites (1, 3, 5, 6, 8) and treatment sites (2, 4, 7, 9) before (September 2001) and after (October 2001) treatment (Walker 2003). As expected the values for both metrics declined after treatment with the exception of Site 2, but the declines were not as dramatic as expected. Total taxa declined by 18-25% in two of the three sites treated with antimycin. As a general rule, the taxa most affected by the treatment were Ephemeroptera (mayflies), Plecoptera (stoneflies) and Trichoptera (caddis flies), also depicted as EPT’s. Aquatic insects in these groups are generally sensitive to environmental disturbances. The loss in these groups also explains the declines observed in the number of EPT taxa in Figure 9. However, the data presented by Walker (2003) also demonstrates that the composition of the aquatic insect community was not significantly altered by the treatment.
54
41 41
26
55
44
52
6058
52
44
49
27
52
44
39
49
46
0
10
20
30
40
50
60
70
1 3 5 6 8 2 4 7 9
Control sites Treatment sites
Num
ber o
f tax
a
Sep-01
Oct-01
23
39
32
26
18
42
33
40
45
41
3534 34
20
38
32 32 32
29
0
5
10
15
20
25
30
35
40
45
50
1 3 5 6 8 2 4 7 9 Control sites Treatment sites
Num
ber o
f EPT
taxa
Sep-01
Oct-01
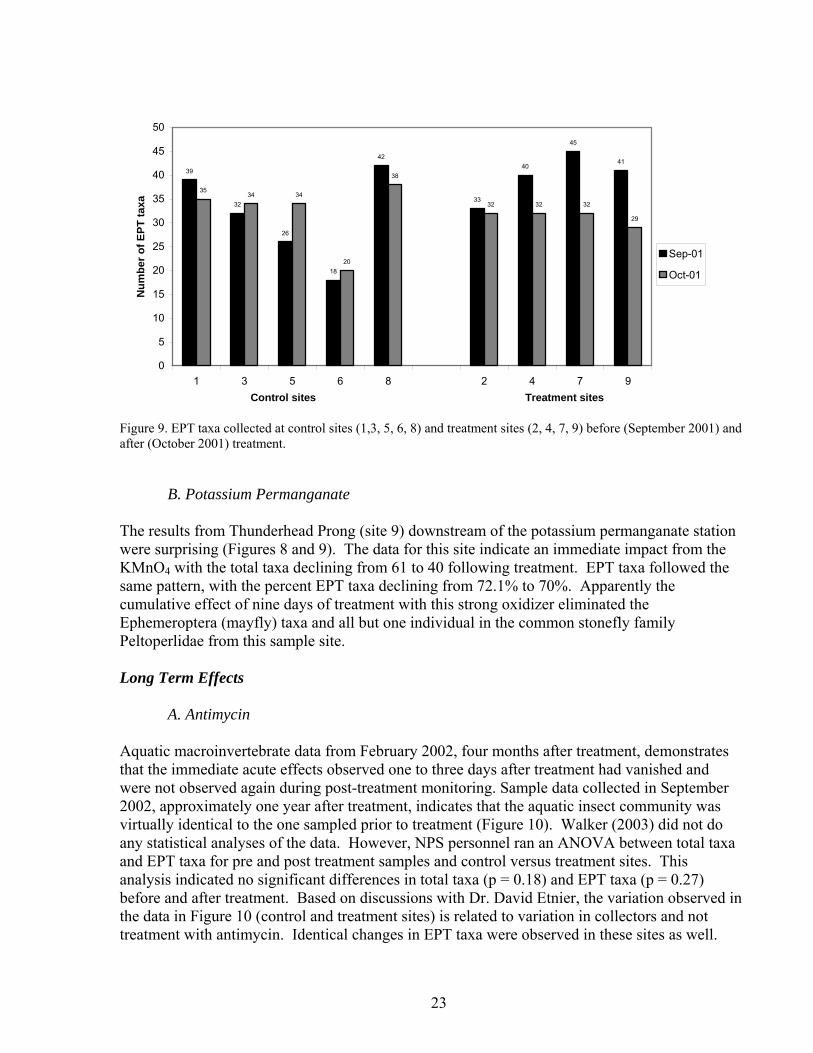
Figure 9. EPT taxa collected at control sites (1,3, 5, 6, 8) and treatment sites (2, 4, 7, 9) before (September 2001) and after (October 2001) treatment.
B. Potassium Permanganate The results from Thunderhead Prong (site 9) downstream of the potassium permanganate station were surprising (Figures 8 and 9). The data for this site indicate an immediate impact from the KMnO4 with the total taxa declining from 61 to 40 following treatment. EPT taxa followed the same pattern, with the percent EPT taxa declining from 72.1% to 70%. Apparently the cumulative effect of nine days of treatment with this strong oxidizer eliminated the Ephemeroptera (mayfly) taxa and all but one individual in the common stonefly family Peltoperlidae from this sample site. Long Term Effects
A. Antimycin
Aquatic macroinvertebrate data from February 2002, four months after treatment, demonstrates that the immediate acute effects observed one to three days after treatment had vanished and were not observed again during post-treatment monitoring. Sample data collected in September 2002, approximately one year after treatment, indicates that the aquatic insect community was virtually identical to the one sampled prior to treatment (Figure 10). Walker (2003) did not do any statistical analyses of the data. However, NPS personnel ran an ANOVA between total taxa and EPT taxa for pre and post treatment samples and control versus treatment sites. This analysis indicated no significant differences in total taxa (p = 0.18) and EPT taxa (p = 0.27) before and after treatment. Based on discussions with Dr. David Etnier, the variation observed in the data in Figure 10 (control and treatment sites) is related to variation in collectors and not treatment with antimycin. Identical changes in EPT taxa were observed in these sites as well.

24
These data provide clear evidence that the use of antimycin in Sams Creek had no long term effect on the aquatic insect community.
0
10
20
30
40
50
60
70
80
1 3 5 6 8 2 4 7 9C o n t r o l s i t e s T r e a t m e n t s i t e s
Num
ber o
f tax
a co
llect
ed Sep ‘96Sep/Oct ‘00Nov '00 Sep ’01Oct ‘01 Sep/Oct ‘02
Figure 10. Total taxa collected at control sites (1, 3, 5, 6 and 8) and treatment sites (2, 4, 7 and 9)
in the fall of 1996, 2000-2002. Only sites 1, 2, and 7 were sampled in November 2000.
B. Potassium Permanganate
Sample data from February 2002 (4 months after treatment) indicate that the numbers and diversity of aquatic insects in this site had returned to pre-treatment levels and this pattern continued through out the remainder of the study. Identical to the data for the sites treated with antimycin, a short term impact does occur but there are no long term effects. Potassium Permanganate Impacts to Fish Fish population surveys were conducted at three sites downstream of the potassium permanganate station to evaluate the potential impact of this chemical on the fish community. A site in Thunderhead Prong (TH 1) upstream of its confluence with Sams Creek served as a control for the Sams Creek potassium permanganate evaluation sites (C1, C2,& C3; Figure 1). Based on the data shown in Figure 11, the only area where fish were impacted by potassium permanganate was the 180m section of Sams Creek from the potassium permanganate station to the confluence with Thunderhead Prong, which includes site “Sams C3”. This 180m section received nine days of treatment to neutralize antimycin; therefore impacts in this area were not totally unexpected. In-stream toxicity tests indicated that 4ppm of potassium permanganate was

25
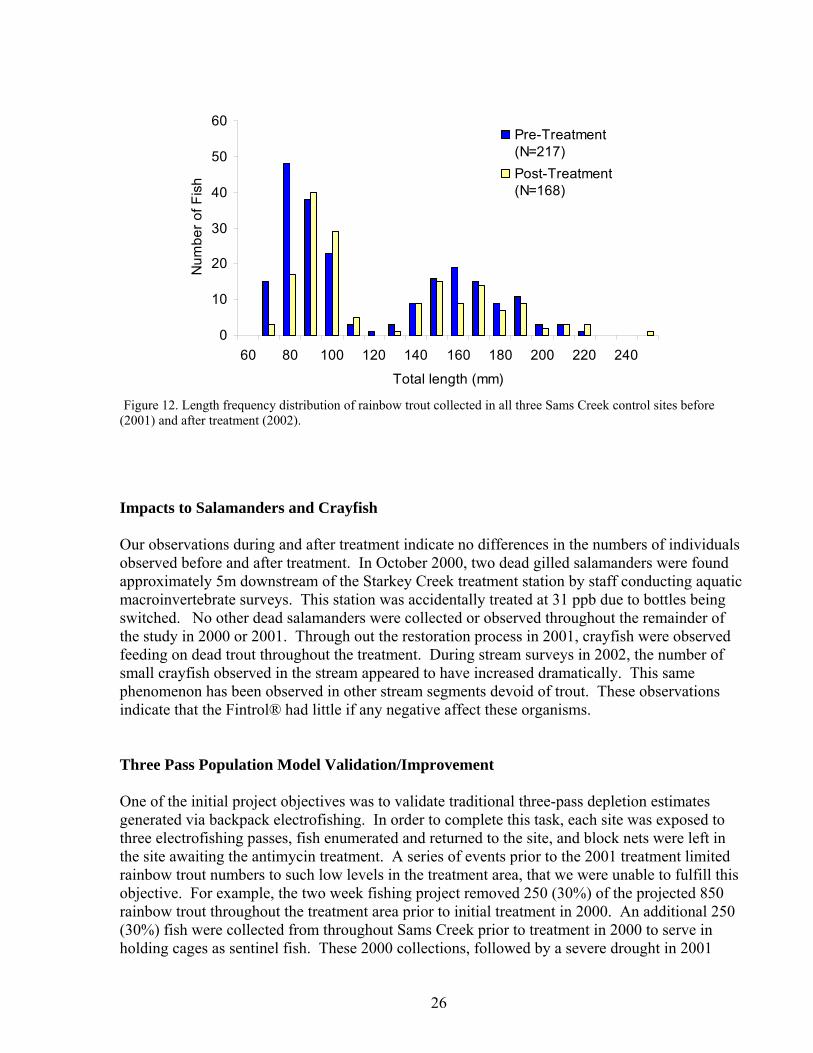
lethal to 40% of the trout in the test, but fish were not affected at lower concentrations. Given the discharge of Thunderhead Prong which is similar to that of Sams Creek, the 50% dilution of Sams Creek downstream of their confluence most likely limited the impacts of potassium permanganate to sites further downstream (Sams C1 & C2). Length frequency data collected before and after treatment indicates there was no size specific mortality associated with the potassium permanganate application within the area impacted (Figure 12). Data from the two sites further downstream (C1 & C2) indicate that population density after treatment was higher than prior to treatment (Figure 11). The primary reason for this apparent increase is that water levels during the post treatment sample were lower than during the initial sampling period. The lower water levels during post treatment sampling increased the efficiency of the electrofishing effort as fish were easier to see and collect.
Figure 11.— Density of rainbow trout (RBT) and longnose (LND) dace in Sams Creek fish control sites before and after antimycin treatment in September of 2001. Note that the Thunderhead site (Thun C1) was upstream of Sams Creek and not affected in any means by the treatment.
Sams Creek Control Data2001-2003
0
5
10
15
20
25
30
35
Sam C1RBT
Sam C2RBT
Sam C3RBT
Sam C1LND
Sam C2LND
Sam C3LND
Thun C1RBT
Thun C1LND
Den
sity
(# fi
sh/1
00m
2 )
Pre 2001Post 2001Post 2002Post 2003
26
Figure 12. Length frequency distribution of rainbow trout collected in all three Sams Creek control sites before (2001) and after treatment (2002). Impacts to Salamanders and Crayfish Our observations during and after treatment indicate no differences in the numbers of individuals observed before and after treatment. In October 2000, two dead gilled salamanders were found approximately 5m downstream of the Starkey Creek treatment station by staff conducting aquatic macroinvertebrate surveys. This station was accidentally treated at 31 ppb due to bottles being switched. No other dead salamanders were collected or observed throughout the remainder of the study in 2000 or 2001. Through out the restoration process in 2001, crayfish were observed feeding on dead trout throughout the treatment. During stream surveys in 2002, the number of small crayfish observed in the stream appeared to have increased dramatically. This same phenomenon has been observed in other stream segments devoid of trout. These observations indicate that the Fintrol® had little if any negative affect these organisms. Three Pass Population Model Validation/Improvement One of the initial project objectives was to validate traditional three-pass depletion estimates generated via backpack electrofishing. In order to complete this task, each site was exposed to three electrofishing passes, fish enumerated and returned to the site, and block nets were left in the site awaiting the antimycin treatment. A series of events prior to the 2001 treatment limited rainbow trout numbers to such low levels in the treatment area, that we were unable to fulfill this objective. For example, the two week fishing project removed 250 (30%) of the projected 850 rainbow trout throughout the treatment area prior to initial treatment in 2000. An additional 250 (30%) fish were collected from throughout Sams Creek prior to treatment in 2000 to serve in holding cages as sentinel fish. These 2000 collections, followed by a severe drought in 2001
0
10
20
30
40
50
60
60 80 100 120 140 160 180 200 220 240
Total length (mm)
Num
ber o
f Fis
h
Pre-Treatment (N=217)Post-Treatment (N=168)
27
reduced the population size to less than 20 trout in any 100m section. Given these low densities (i.e. sample size), we were unable to feasibly evaluate the population estimation objective and it was dropped from the project. Brook Trout Re-Colonization 2001 Following initial attempts to restore these streams in the fall of 2000, field surveys were conducted in March and September 2001 to evaluate brook trout re-colonization from upstream refuge areas and to remove rainbow trout from Sams and Starkey Creeks. In March, 800 m of Sams Creek and 600m of Starkey Creek were electrofished to evaluate the number and size of brook trout that re-colonized the upstream reaches of the treatment area. In this sample, ten brook trout were collected in the 800m of Sams Creek surveyed. Nine of these fish were age I+ and had a mean length of less than 90 mm. The other fish was an adult with a length of 148 mm. In Starkey Creek, 20 brook trout were collected. Five fish were adults with a mean length of 155 mm and 15 were age I+ fish with a mean length of less than 90mm. In September 2001, only 600m of Sams Creek was electrofished and 63 young of the year (YOY) and 12 adult brook trout were collected. In Starkey Creek, 31 YOY and 6 adult brook trout were collected. Brook trout were non-existent downstream of the Sams/Starkey Creek confluence. None of these fish had a adipose clip from the previous year and all were transported upstream to a refuge area in each stream because of the planned antimycin treatment the next week. 2002 Electrofishing surveys of the 600m of Starkey Creek and 4,200 of Sams Creek in July 2002 revealed that brook trout had only re-colonized the upstream most 300m of each stream. Sampling efforts collected 21 young of the year (YOY) and two adult brook trout in Sams Creek. None of these fish had an adipose clip from the previous year. Nineteen brook trout (17 adults and 2 YOY) were collected in Starkey Creek. Thirteen of the 17 adults captured had an adipose clip from the previous year. The between year differences are most likely related to depressed densities of brook trout and low reproductive success related to four years of extreme drought conditions. 2002 Reintroduction of Brook Trout In July 2002, roughly 150 brook trout were collected from upper Little River and transported 8 km (5 miles) via backpack transporters to a TWRA hatchery truck for transport to the Lynn Camp Prong trailhead. At the trailhead, the fish were transferred back into the backpack transporters and hiked 3.2 km (2 miles) in to Sams Creek. One hundred forty three of the fish survived the trip and were released at three areas in the lower 1,700m of Sams Creek. Evaluation of Fish Population Recovery Rainbow and brook trout population have been monitored for 12 years (1989 – 2001) at five sites distributed along the length of Sams Creek as part of a long term monitoring program. Data

28
from these sites were used to estimate the density (# fish/100m2) and biomass (kg/ha) of rainbow trout and brook trout in each site for each year. The density and biomass exhibited considerable variation during the 12 years of study due to droughts and floods but represent the variation in carrying capacity for Sams Creek. Follow-up population data will be compared to these data to evaluate percent recovery as the brook trout repopulate Sams Creek. Time and Cost Comparisons Without doubt, restoring brook trout to a stream that was fishless but had a history of being occupied by brook trout was the simplest and cheapest of all projects to complete. Projects that involved annual rainbow trout removals were the most labor intensive and costly of the methods used and took the longest to complete because of the number of annual trips required to achieve the goal (Table 5). The number of person hours required to complete a project ranged from 768 – 1,872 hours and was dependent on mean stream width and length of stream to be electrofished. The number of years required to eliminate non-native rainbow trout was dependent on stream length, habitat complexity and drought and flood events regardless of the length of stream to be restored. Multiple electrofishing removals can accomplish complete removal of non-native trout within one summer if the stream section is relatively short (≤ 2.5 km), and the crew is of adequate size and work load factors permit. For example, in the case of Mannis Branch, four removals were conducted in one summer and only an additional survey was needed the next summer to verify eradication prior to reintroduction of native brook trout (Kulp and Moore 2000). However, the restoration of LeConte Creek is perhaps a more typical example of restoration using multiple removals. The initial two removals were conducted in 1998. Two additional removals the next summer completed the removal of rainbow trout and brook trout were then reintroduced that fall. However, as with annual removals, the number of hours (1,264 – 1,536) and years required to eliminate non-native trout with the multiple removal electrofishing approach was dependent on the same combination of factors listed for annual removals. However, antimycin projects are much cheaper and take considerably less time per km to complete than multiple removals (Table 5). Table 3. Time and cost comparisons of native fish restoration techniques used in Great Smoky Mountains National Park since 1986. Project completion herein is defined as eradication of non-natives followed by introduction of native species. Note that all dollar amounts are represented in 2003 dollars.
Type Years to Completion
Total km
Cost per km Average Hours per
km Annual
Removals 5-7 5.8 $31,055 1,498
Multiple Removals
2 6.0 $12,416-$15,089
1,400
No Fish 1 1.2 $ 2,058 160 Antimycin 2 4.8 $ 3,930 400
Conclusions
29
Effects of Liberalized Angling The experimental fishing project was initiated on a weekend, so it is not surprising that 38.6 % of the anglers who fished the area did so during the first two days of the project. Daily angler visits during the remainder of the project averaged less than 12 anglers per day. This pattern is similar to the results of other creel studies in the park (Larson et al. 1986, King and Currier 1950 and Lennon 1954). One hundred fifty one of the 228 anglers who fished during the project were from Tennessee. This result is also consistent with the results of Larson et al. (1986) and King and Currier (1950). Anglers from North Carolina accounted for 24 % of the 228 people who fished the during the two week study. While it is possible that the project was not well advertised in North Carolina, it appears that the distance anglers would have to travel to fish was the primary reason for limited participation from North Carolina. Studies in N. C. (Ratledge 1963, 1964 and Ratledge and Louder (1967) demonstrated that 70.5% of anglers traveled less than 82 km (51 miles) to fish streams in N. C. The closest N.C. city to the creel station was approximately 82 km from the creel station. In comparison, heavily populated TN cities were less than 42 km away. Larson et al. (1986) reported that the majority of anglers in that study came from towns very close to the Park and that pattern was repeated in this study. Discussions with anglers at the creel station provided evidence that they had a wide range of fishing experience for trout. This was also evidenced by the fact that 167 (73.2%) of them failed to catch a fish. By comparison, Larson et al. (1986) stated that 40.9% of anglers in that study failed to catch a fish. In that study, the mean catch for all anglers was 8.14 fish/trip compared to1.1 fish/trip in this study. Anglers who lived closest to the park and who fished regularly were the most successful and harvested the majority of the fish. Larson et al. (1986) observed the same pattern. Larson et al. (1986) observed that anglers from states other than Tennessee or North Carolina had very limited success and attributed this to the lack of experience. Results from Sams Creek indicate that anglers from other states failed to catch any fish. Observations by creel clerks indicate these anglers were unaware of techniques used to fish streams in GRSM. The differences in success rates between the Larson et al. (1986) study and this one is attributed to the very low water levels (< 50% of normal flow) during the project and that the Sams Creek project was conducted in the fall rather that the spring. Creel data collected by law enforcement staff indicate that angler catch rates (# fish/hr) are higher during spring. Discussions with local fly shop owners also indicate that catch rates (# fish/hr) are higher during spring months than during fall months because the trout are more actively feeding due to spring hatches. Anglers harvested 250 trout (29.7%) of the 840 trout estimated to live in the 2.4 km of stream open to fishing. Trout from all size classes were harvested by anglers. However, based on post season electrofishing data, the number of trout less than 100 mm (4 inches) was under represented in the harvest and the number of trout in the 152 – 203 mm (6 – 8 inches) was over represented. These results for trout less than 100 mm are very similar to the harvest statistics reported for Lynn Camp Prong by Larson et al. (1986). These authors also reported that angling removed the largest size classes of rainbow trout from the fishery. This result was not observed in Sams Creek and the post season electrofishing surveys indicated that population size structure

30
had not been changed by angler harvest. In both cases, the data show that angling is selective for larger size classes and that population numbers are reduced but not eliminated. Brook trout re-colonization Brook trout collected from the treatment area and transported to upstream refuges were expected to return to the areas from which they were displaced. Previous work in park streams has provided evidence that displaced will return to the areas from which they were moved if possible. Marked brook trout were not collected in these stream reaches in 2001 or 2002. Re-colonization of the upstream reaches of Sams Creek was dominated by age 0 fish in 2001 and 2002. In Starkey Creek, age 0 trout dominated in 2001 but adult fish dominated in 2002. Phinney (1975) indicated that age 0 brook trout were responsible for the re-population of a restored stream section in Montana. In Wisconsin, Hunt (1965, 1974) found that age 0 brook trout movement was predominately downstream. McFadden (1961), Shetter (1961) and Flick and Webster (1975) also found that the amount of movement varied with time of year, water level and water temperature. Between 1998 and 2002, the Park experienced a severe drought and water levels were less than half of normal flow based on USGS flow records. Monitoring data from Sams Creek and other Park streams indicates that this period of extended low flow significantly reduced the density of trout populations in all streams. As a result, we believe that re-colonization during drought years is limited and is most likely related to the inability to move downstream due to very low water levels, reduced densities of adult fish and limited reproduction. This information also indicates that re-colonization from upstream areas alone will not be sufficient to repopulate large stream sections in four to five years. Therefore it is imperative that native “Southern Appalachian” brook trout be collected from nearby streams for reintroduction into downstream segments of Sams Creek. Antimycin Effectiveness Based on the initial experiences with leaf fall in 2001 the project was rescheduled for 2001 and was initiated three weeks earlier to avoid the leaf fall. Work during the first day of the project in the upper reaches of Sams and Starkey Creeks indicated that the chemical was not effectively removing trout throughout a 60 m drop in elevation. Apparently the steep stair step nature of the stream (i.e. gradient ≥8%), increased aeration and continually splashed the antimycin molecules on rocks and this increased the rate at which the molecules were fractionalized and this reduced the amount of stream that could be effectively treated to less than half of what had been observed in western projects. This information indicates that stream gradient ≥8%, was the main factor that limits the effective treatment range. The low flows and leaf clogged stream channels encountered 2000 apparently further reduced the effective treatment distance but the amount of additive reduction is not known. Based on the information learned from this experiment, the protocol of setting stations at elevation drops of 15.2 – 22.9 m was adhered to for the remainder of the project. This resulted in the complete removal of rainbow trout from the 4.2 km of stream treated. Non-Target Organisms
31
Aquatic insect data collected one day after treatment in October 2001 demonstrated that that total taxa had been reduced up to 25 % in some sites and that densities had also declined. However, data collected four months and one year after treatment conclusively demonstrate that the communities were identical to the pre-treatment community (Walker 2003). Without doubt, it would be desirable to eliminate short term impacts, given the nature of the project, this is unrealistic. Additionally, even though salamander and crayfish populations were not quantified, field observations indicated that these populations were not affected by the treatment. Aquatic insect populations downstream of the potassium permanganate were more severely impacted by this chemical than by the antimycin. This type of impact had not been previously documented. However, like antimycin, data collected four months and one year after the project was completed indicated that the aquatic insect community was identical to the pre-treatment community. These data also demonstrate the resiliency of the aquatic insect community in spite of the impacts due to nine days of treatment. The data from this project indicates that the use of Fintrol® (antimycin) is a viable tool for native fish restoration in National Park units. The lack of long term impacts to non-target organisms makes the use of this chemical even more desirable as it insures compliance with NPS policies and mandates that management actions will not alter populations of other organisms. Information from a project in Crater Lake National Park (Buktenica personal communication) indicates no long term impacts to aquatic insect populations. Observations from antimycin projects in Rocky Mountain National Park also indicate no impact to aquatic insect populations as the density and biomass of re-established greenback cutthroat populations equaled or exceeded that of non-native trout populations prior to removal. This same result has not been observed with rotenone. Studies by Binns (1967), Cook and Moore (1969) and Mangum and Madrigal (1999) demonstrate that long-term changes occurred in aquatic insect assemblage following the use of rotenone to restore sections of stream and rivers for native fish. Selection of Restoration Technique Native trout restoration projects are by nature expensive in terms of time and financial cost. As a general rule, managers must seek the quickest and least expensive technique for accomplishing agency goals related to native fish restoration. The information listed in Table 5 provides some guidance on minimum personnel cost for a project using Fintrol®. However, additional cost include planning and coordination, purchasing of supplies and equipment, assistance by staff from cooperating agencies, the purchase of Fintrol®, post treatment surveys to insure complete removal of the non-native trout and aquatic insect surveys. Given that many of these cost would also be incurred with the use of electrofishing techniques, the time and cost comparisons still indicate that Fintrol® is the most cost efficient and time effective tool for the restoration of native brook trout populations in GRSM. However, the decision related to which technique to use may be tempered by public opinion, the presence of non-target fish species, water supply issues, etc. In either case, the time required to complete an environmental assessment must be taken into account. Regardless of method, the agency may need to purchase additional waders, backpacks, camping gear, block nets and
32
holding cages. If electrofishing is selected then the purchase of additional backpack electrofishing units and appropriate safety gear must be taken into consideration. If the chemical restoration option is selected, initially all of the equipment needed to construct treatment stations must be factored into the initial project or the equipment may be borrowed from another agency. In some cases, the native trout may need to be moved to a refuge area prior to proceeding with restoration with a chemical such as antimycin and this can add considerable time and cost to a project. If a refuge area cannot be established, then restoration using electrofishing techniques may be the only option. The methods described in this report have worked in GRSM but may need to be adapted to fit situations encountered in other areas of the nation. For instance, electrofishing may not be an option in western streams that have deep undercut banks and thick vegetative overhang. However, Fintrol projects have worked well in situations of this type.
Management Recommendation Given the NPS mandate to protect and preserve natural resources “unimpaired’, it is recommended that antimycin should be considered the piscicide of preference for native fish restoration in GRSM and in similar situations in other National Park units.
Literature Cited
Binns, N.A. 1967. Effects of rotenone treatment on the insect fauna of the Green River,
Wyoming. Wyoming Game and Fish Commission. Fisheries Research Bulletin !:1 – 108. Carter, B.D. 1991. Implications of biannual removal of rainbow trout on brook trout
management in Great Smoky Mountains National Park. Master’s thesis. Tennessee Technological University, Cookeville.
Cook,S.F. and R.L. Moore. 1969. The effects of rotenone on the insect fauna of a California
stream. Transactions of the American Fisheries Society. 98:539 – 544. Courtenay, W. R. and J. R. Stauffer. 1984. Distribution, biology and management of exotic
fishes. Johns Hopkins University Press. Baltimore, Maryland. Danzmann, R. G., R. P. Morgan II, M.W. Jones, L. Bernatchez and P.E. Ihssen. 1998. A major
sextet of mitochondrial DNA phylogenetic assemblages extant in North American brook trout (Salvelinus fontanilis): distribution and postglacial dispersal patterns. Canadian Journal of Zoology 76:1300-1318.
Dill, W.A. and A.J. Cordone 1997. History and status of introduced fishes in California, 1871 –
1996. Fisheries 22(10): 15-18.

33
Etnier, D.A. 1997. A survey of benthic macroinvertebrates, Sams Creek, Great Smoky Mountains National Park Internal Report.
Etnier, D. A. and C.D. Hulsey. 2005. Effects of antimycin A treatment on benthic
macroinvertebrates in Bear Creek, a tributary to Forney Creek, Great Smoky \Mountains National Park, Swain County, North Carolina. Final report, Prepared under cooperative agreement CA-5460-A1-005. 11 pp. plus appendices.
Flick, W.A. and D.A. Webster. 1975. Movement , growth, and survival of wild brook trout
(Salvelinus fontinalis) during a period of removal of non-trout species. Journal of the Fisheries Research Board of Canada. 32(8):1359 – 1367.
Franke, M.A. 1996. A grand experiment, 100 years of fisheries management in Yellowstone:
part I. Yellowstone Science 4(4): 2-7. Freeman, L.H. and S. L. Jenson. 1999. How to write quality EIS’s and EA’s. The Shipley
Group, Inc. 101 pp. Habera, J.W., R.J. Strange, B.D. Carter and S.E. Moore. 1996. Short-term mortality and injury of
rainbow trout caused by three-pass electrofishing in a southern Appalachian stream. North American Journal of Fisheries Management 16:192-200.
Habera, J.W., R.J. Strange, and S.E. Moore. 1992. Stream morphology affects capture
efficiency of an AC backpack electrofisher. Journal of the Tennessee Academy of Science 67(3): 55-58.
Hallyburton, C. L. 1999. Toxicity of antimycin to juvenile rainbow trout (Oncorhyncus mykiss)
at pH 6.2, 6.7 and 7.0. Great Smoky Mountains National Park internal report. 11pp. Hunt, R.L. 1965. Dispersal of wild brook trout during their first summer of life. Transactions of
the American Fisheries Society. 94(2):186 – 195. Hunt, R.L. 1974. Annual production of brook trout in Lawrence Creek during eleven successive
years. Wisconsin Department of Natural Resources Technical Bulletin Number 82. Kelly, G.A., J.S. Griffith, and R.D. Jones. 1980. Changes in the distribution of trout in Great
Smoky Mountains National Park, 1900-1977. U.S. Fish and Wildlife Service. Technical Paper 102. 10 pp.
King, W. 1937. Notes on the distribution of native, speckled, and rainbow trout in the streams at Great Smoky Mountains National Park. Journal of the Tennessee Academy of Science 12:351-356.
King, W. and W. Currier. 1950. Angling returns from Little Pigeon River, Great Smoky Mountains National Park, 1950. Tennessee Game and Fish Commission, Nashville.

34
Kulp, M.A. and S.E. Moore. 2000. Multiple electrofishing removals for eliminating rainbow trout in a small Southern Appalachian stream. North American Journal of Fisheries Management 20 (1): 259-266.
Larson, G.L., and S.E. Moore. 1985. Encroachment of rainbow trout in the Southern
Appalachian Mountains. Transactions of the American Fisheries Society 114:195-203 Larson, G. L., S.E. Moore and D.C. Lee. 1986. Angling and electrofishing for removing
nonnative rainbow trout from a stream in a national park. North American Journal of Fisheries Management 6 (4): 580 – 585.
Lennon, R.E. 1954. Angling on Little Pigeon River, Great Smoky Mountains National Park,
1953. U.S. Fish and Wildlife Service Special Scientific Report Fisheries 121. Lennon, R.E. 1967. Brook trout of Great Smoky Mountains National Park. U.S. Fish and
Wildlife Service. Technical Paper 15. 18 pp. Li, H. W. and P. B. Moyle. 1981. Ecological analysis of species introductions into aquatic
systems. Transactions of the American Fisheries Society. 110:772-782. Mangum, F.A. and J.L. Madrigal. 1999. Rotenone effects on aquatic macroinvertebrates of the
Strawberry River, Utah: a five year study. Journal of Freshwater Ecology. 14:125–135. McFadden, J.T. 1961. A population study of brook trout, (Salvelinus fontinalis). Wildlife
Monographs 7. 73 pp. Mcmahon, T.E., A.V. Zale and D.J. Orth. 1996. Aquatic Habitat Measurements. Pages 83-120.
in B.R. Murphy and D. W. Willis, editors. Fisheries techniques, 2nd edition. American Fisheries Society, Bethesda, Maryland.
McCracken, G.F., C.R. Parker and S.Z. Guffey. 1993. Genetic differentiation and hybridization
between stocked hatchery and native brook trout in Great Smoky Mountains National Park. Transactions of the American Fisheries Society 122:533-542.
Moore, S.E. 1993. Fishery management plan, Great Smoky Mountains National Park. 48 pp. Moore, S.E. and G.L. Larson. 1989. Native brook trout restoration program in Great Smoky
Mountains National Park. Proceedings of Wild Trout IV Symposium, F. Richardson and R.H. Hamre, editors.
Moore, S.E., B.L. Ridley and G.L. Larson. 1981. Changes in standing crop of brook trout
concurrent with removal of exotic trout species, Great Smoky Mountains National Park. U.S. Department of Interior, National Park Service, NPS-SER Research/Resources Management Report No. 37.

35
Moyle, P. B., H.W. Li, and B. A. Barton.1986. The Frankenstein effect: impact of introduced fishes on native fishes in North America. Proceedings of a symposium on the role of fish culture in fisheries management. R.H. Stroud, editor. American Fisheries Society, Bethesda, Maryland.
Phinney, D.E. 1975. Repopulation of an eradicated stream section by brook trout. Transactions
of the American Fisheries Society. 104(4): 685 – 687. Rahel, F. J. 1997. From Johnny Appleseed to Dr. Frankenstein: changing values and the legacy
of fisheries management. Fisheries 22(8): 8–9. Ratledge, H.M. 1963. Cold-water stream studies, North Carolina Wildlife Resources
Commission, Federal Aid in Fish Restoration, progress report, work plan V, Raleigh. Ratledge, H.M. 1964. Cold-water stream studies, North Carolina Wildlife Resources Commission, Federal Aid in Fish Restoration, progress report, work plan V, Raleigh. Ratledge, H.M. and D.E. Louder. 1967. Cold-water stream studies, North Carolina Wildlife
Resources Commission, Federal Aid in Fish Restoration, final report, Raleigh. Robinson, R.B., J. Smoot, G. Harwell and J. Shubdza. 2001. Water quality characteristics,
temporal trends, and influencing factors for selected streams in Great Smoky Mountains National Park. Report prepared under cooperative agreement no. 1443-CA-5460-98-006 (amendment 6). 247 pp.
Rosenlund, B.D. and D. R. Stevens. 1992. Application of Antimycin (Fintrol) to alpine lakes
and streams in Rocky Mountain National Park and the headwaters of Leadville National Fish Hatchery to establish populations of Greenback and Colorado river cutthroat trout. Accepted for symposium publication (Chemical Rehabilitation Projects: Procedures and Issues, AFS 1991). Symposium not published.
Russell, G.D. 1992. The effect of habitat and stream size on the removal of rainbow trout from
a rainbow and brook trout population. Master’s thesis. Tennessee Technological University, Cookeville.
Shetter, G.S. 1961. Survival of brook trout from egg to fingerling stage in two Michigan trout
streams. Transactions of the American Fisheries Society. 90(3): 252 – 258. Trout Committee, Southern Division, American Fisheries Society. 1992. Standardized sampling
guidelines for wadeable trout streams. 12 pp. Walker, C.A. 2003. Effects of antimycin treatment on benthic macroinvertebrates in Sams Creek
and Starkey Creek, Great Smoky Mountains National Park, Blount/Sevier Counties, Tennessee. Master’s thesis. The University of Tennessee, Knoxville.
West, J.L., S.E. Moore and M.R. Turner. 1990. Evaluation of electrofishing as a management
technique fir restoring brook trout in Great Smoky Mountains National Park. U.S.

36
Department of Interior, National Park Service, Research/Resources Management Report SER-90/01. Southeast Regional Office, Atlanta, GA. 52pp.
Whitworth, W.E. 1979. Evaluation of rainbow trout (Salmo gairdineri) removal project, Sams
Creek, Great Smoky Mountains National Park, Gatlinburg, Tennessee. Internal Project Report.

37

As the nation’s principal conservation agency, the Department of the Interior has responsibility for most of our nationally owned public lands and natural resources. This includes fostering sound use of our land and water resources; protecting our fish, wildlife, and biological diversity; preserving the environmental and cultural values of our national parks and historical places; and providing for the enjoyment of life through outdoor recreation. The department assesses our energy and mineral resources and works to ensure that their development is in the best interests of all our people by encouraging stewardship and citizen participation in their care. The department also has a major responsibility for American Indian reservation communities and for people who live in island territories under U.S. administration. GRSM D-594, September 2005
Related Documents