PSYCHIATR Y ORIGINAL RESEARCH ARTICLE published: 11 January 2012 doi: 10.3389/fpsyt.2011.00083 Resting state functional connectivity correlates of inhibitory control in children with attention-deficit/hyperactivity disorder Maarten Mennes 1† , NatanVega Potler 1† , Clare Kelly 1 , Adriana Di Martino 1 , F. Xavier Castellanos 1,2 and Michael P. Milham 2,3 * 1 Phyllis Green and Randolph Cowen Institute for Pediatric Neuroscience, NYU Langone School of Medicine, NYU Child Study Center, NewYork, NY, USA 2 Nathan Kline Institute for Psychiatric Research, Orangeburg, NY, USA 3 Center for the Developing Brain, Child Mind Institute, NewYork, NY, USA Edited by: Alex Fornito, University of Melbourne, Australia Reviewed by: Damien Fair, Oregon Health and Science University, USA Jessica A. Church, Washington University School of Medicine, USA *Correspondence: Michael P. Milham, Child Mind Institute, 445 Park Avenue, NewYork, NY 10022, USA. e-mail: michael.milham@ childmind.org † Maarten Mennes and Natan Vega Potler have contributed equally to this work. Motor inhibition is among the most commonly studied executive functions in attention- deficit/hyperactivity disorder (ADHD). Imaging studies using probes of motor inhibition such as the stop signal task (SST) consistently demonstrate ADHD-related dysfunction within a right-hemisphere fronto-striatal network that includes inferior frontal gyrus and pre-supplementary motor area. Beyond findings of focal hypo- or hyper-function, emerging models of ADHD psychopathology highlight disease-related changes in functional inter- actions between network components. Resting state fMRI (R-fMRI) approaches have emerged as powerful tools for mapping such interactions (i.e., resting state functional connectivity, RSFC), and for relating behavioral and diagnostic variables to network prop- erties. We used R-fMRI data collected from 17 typically developing controls (TDC) and 17 age-matched children with ADHD (aged 8–13years) to identify neural correlates of SST performance measured outside the scanner. We examined two related inhibition indices: stop signal reaction time (SSRT), indexing inhibitory speed, and stop signal delay (SSD), indexing inhibitory success. Using 11 fronto-striatal seed regions-of-interest, we queried the brain for relationships between RSFC and each performance index, as well as for interactions with diagnostic status. Both SSRT and SSD exhibited connectivity– behavior relationships independent of diagnosis. At the same time, we found differential connectivity–behavior relationships in children with ADHD relative to TDC. Our results demonstrate the utility of RSFC approaches for assessing brain/behavior relationships, and for identifying pathology-related differences in the contributions of neural circuits to cognition and behavior. Keywords:ADHD, connectivity, intrinsic architecture, transition zones, rest, fMRI, interaction INTRODUCTION Emerging models of attention-deficit/hyperactivity disorder (ADHD) pathophysiology highlight disease-related alterations in functional interactions among multiple brain regions, extending the traditional focus on frontal–striatal dysfunction (Dickstein et al., 2006). Using resting state functional connectivity (RSFC) as an index of functional interactions, studies have demonstrated ADHD-related abnormalities in the interactions among brain regions supporting the implementation and maintenance of atten- tional control [e.g., dorsal anterior cingulate cortex (dACC) and insula; Tian et al., 2006]. ADHD-related constraints in the segrega- tion of processing between attentional control regions and those implicated in internal mentation (i.e., the default network) have been demonstrated (Castellanos et al., 2008), as well as ADHD- related differences in functional connectivity within the default network itself (Fair et al., 2010; Chabernaud et al., in press). Rem- iniscent of developmental immaturity (Fair et al., 2008), these findings have intrigued researchers and invigorated new avenues of inquiry. Yet, little has been done experimentally to bridge emerging dysconnectivity models with existent neuropsychological models of ADHD. Here, we take a first step toward linking neuropsychological and dysconnectivity models of ADHD. In particular, we focus on impaired inhibitory control, commonly considered a hallmark of ADHD (Nigg, 2001). Previously, task-based imaging studies using common behavioral probes of inhibitory control such as the Go– No Go and stop signal task (SST) have implicated fronto-striatal circuitry in ADHD (Nigg, 1999; Konrad et al., 2000; Aron and Poldrack, 2005). Specifically, they revealed hypoactivation in a predominantly right-hemispheric network encompassing the infe- rior frontal gyrus/anterior insula, pre-supplementary motor area (pre-SMA), dACC, thalamus, and caudate nucleus (Rubia et al., 1999; Aron and Poldrack, 2005; for a review see Dickstein et al., 2006; Cubillo et al., 2010). In the present work, we related inter- individual differences in SST performance to differences in con- nectivity observed for fronto-striatal regions-of-interest (ROI). In addition, we assessed the modulatory effect of the presence or absence of an ADHD diagnosis on such relationships. www.frontiersin.org January 2012 |Volume 2 | Article 83 | 1

Welcome message from author
This document is posted to help you gain knowledge. Please leave a comment to let me know what you think about it! Share it to your friends and learn new things together.
Transcript
PSYCHIATRYORIGINAL RESEARCH ARTICLE
published: 11 January 2012doi: 10.3389/fpsyt.2011.00083
Resting state functional connectivity correlates ofinhibitory control in children withattention-deficit/hyperactivity disorder
Maarten Mennes1†, Natan Vega Potler 1†, Clare Kelly 1, Adriana Di Martino1, F. Xavier Castellanos1,2 and
Michael P. Milham2,3*
1 Phyllis Green and Randolph Cowen Institute for Pediatric Neuroscience, NYU Langone School of Medicine, NYU Child Study Center, New York, NY, USA2 Nathan Kline Institute for Psychiatric Research, Orangeburg, NY, USA3 Center for the Developing Brain, Child Mind Institute, New York, NY, USA
Edited by:
Alex Fornito, University of Melbourne,Australia
Reviewed by:
Damien Fair, Oregon Health andScience University, USAJessica A. Church, WashingtonUniversity School of Medicine, USA
*Correspondence:
Michael P. Milham, Child MindInstitute, 445 Park Avenue, New York,NY 10022, USA.e-mail: [email protected]†Maarten Mennes and Natan VegaPotler have contributed equally to thiswork.
Motor inhibition is among the most commonly studied executive functions in attention-deficit/hyperactivity disorder (ADHD). Imaging studies using probes of motor inhibitionsuch as the stop signal task (SST) consistently demonstrate ADHD-related dysfunctionwithin a right-hemisphere fronto-striatal network that includes inferior frontal gyrus andpre-supplementary motor area. Beyond findings of focal hypo- or hyper-function, emergingmodels of ADHD psychopathology highlight disease-related changes in functional inter-actions between network components. Resting state fMRI (R-fMRI) approaches haveemerged as powerful tools for mapping such interactions (i.e., resting state functionalconnectivity, RSFC), and for relating behavioral and diagnostic variables to network prop-erties. We used R-fMRI data collected from 17 typically developing controls (TDC) and17 age-matched children with ADHD (aged 8–13 years) to identify neural correlates ofSST performance measured outside the scanner. We examined two related inhibitionindices: stop signal reaction time (SSRT), indexing inhibitory speed, and stop signal delay(SSD), indexing inhibitory success. Using 11 fronto-striatal seed regions-of-interest, wequeried the brain for relationships between RSFC and each performance index, as wellas for interactions with diagnostic status. Both SSRT and SSD exhibited connectivity–behavior relationships independent of diagnosis. At the same time, we found differentialconnectivity–behavior relationships in children with ADHD relative to TDC. Our resultsdemonstrate the utility of RSFC approaches for assessing brain/behavior relationships,and for identifying pathology-related differences in the contributions of neural circuits tocognition and behavior.
Keywords: ADHD, connectivity, intrinsic architecture, transition zones, rest, fMRI, interaction
INTRODUCTIONEmerging models of attention-deficit/hyperactivity disorder(ADHD) pathophysiology highlight disease-related alterations infunctional interactions among multiple brain regions, extendingthe traditional focus on frontal–striatal dysfunction (Dicksteinet al., 2006). Using resting state functional connectivity (RSFC)as an index of functional interactions, studies have demonstratedADHD-related abnormalities in the interactions among brainregions supporting the implementation and maintenance of atten-tional control [e.g., dorsal anterior cingulate cortex (dACC) andinsula; Tian et al., 2006]. ADHD-related constraints in the segrega-tion of processing between attentional control regions and thoseimplicated in internal mentation (i.e., the default network) havebeen demonstrated (Castellanos et al., 2008), as well as ADHD-related differences in functional connectivity within the defaultnetwork itself (Fair et al., 2010; Chabernaud et al., in press). Rem-iniscent of developmental immaturity (Fair et al., 2008), thesefindings have intrigued researchers and invigorated new avenues ofinquiry. Yet, little has been done experimentally to bridge emerging
dysconnectivity models with existent neuropsychological modelsof ADHD.
Here, we take a first step toward linking neuropsychologicaland dysconnectivity models of ADHD. In particular, we focus onimpaired inhibitory control, commonly considered a hallmark ofADHD (Nigg, 2001). Previously, task-based imaging studies usingcommon behavioral probes of inhibitory control such as the Go–No Go and stop signal task (SST) have implicated fronto-striatalcircuitry in ADHD (Nigg, 1999; Konrad et al., 2000; Aron andPoldrack, 2005). Specifically, they revealed hypoactivation in apredominantly right-hemispheric network encompassing the infe-rior frontal gyrus/anterior insula, pre-supplementary motor area(pre-SMA), dACC, thalamus, and caudate nucleus (Rubia et al.,1999; Aron and Poldrack, 2005; for a review see Dickstein et al.,2006; Cubillo et al., 2010). In the present work, we related inter-individual differences in SST performance to differences in con-nectivity observed for fronto-striatal regions-of-interest (ROI). Inaddition, we assessed the modulatory effect of the presence orabsence of an ADHD diagnosis on such relationships.
www.frontiersin.org January 2012 | Volume 2 | Article 83 | 1
Mennes et al. RSFC correlates of inhibitory control in ADHD
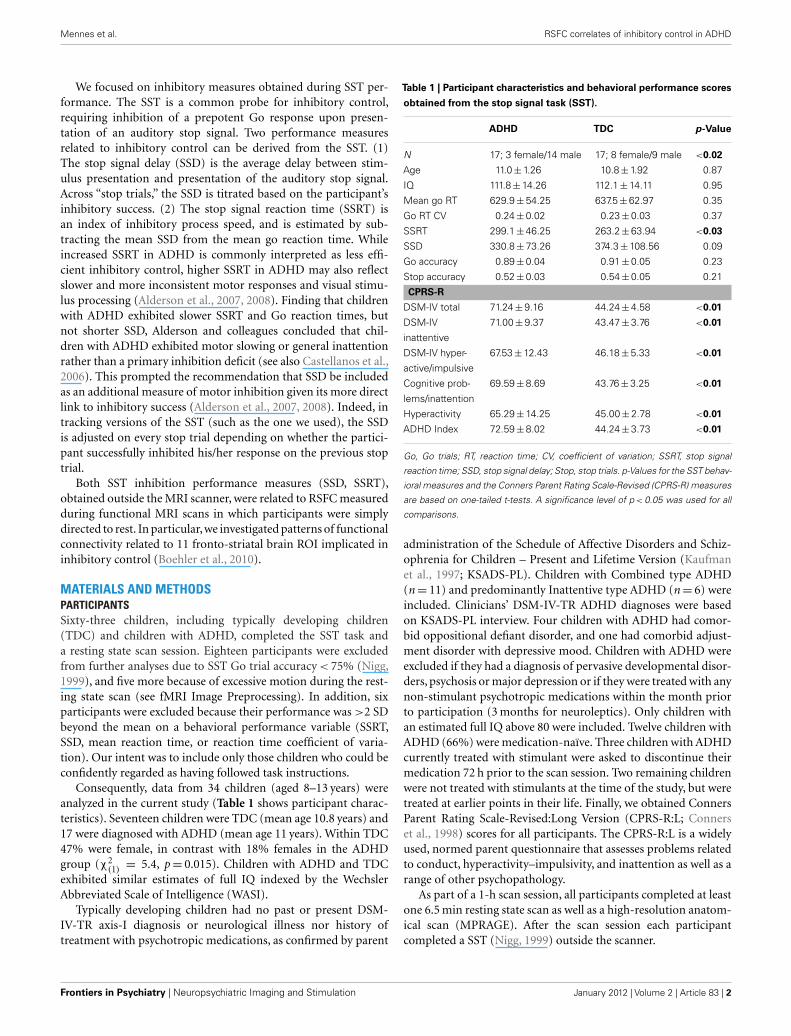
We focused on inhibitory measures obtained during SST per-formance. The SST is a common probe for inhibitory control,requiring inhibition of a prepotent Go response upon presen-tation of an auditory stop signal. Two performance measuresrelated to inhibitory control can be derived from the SST. (1)The stop signal delay (SSD) is the average delay between stim-ulus presentation and presentation of the auditory stop signal.Across “stop trials,” the SSD is titrated based on the participant’sinhibitory success. (2) The stop signal reaction time (SSRT) isan index of inhibitory process speed, and is estimated by sub-tracting the mean SSD from the mean go reaction time. Whileincreased SSRT in ADHD is commonly interpreted as less effi-cient inhibitory control, higher SSRT in ADHD may also reflectslower and more inconsistent motor responses and visual stimu-lus processing (Alderson et al., 2007, 2008). Finding that childrenwith ADHD exhibited slower SSRT and Go reaction times, butnot shorter SSD, Alderson and colleagues concluded that chil-dren with ADHD exhibited motor slowing or general inattentionrather than a primary inhibition deficit (see also Castellanos et al.,2006). This prompted the recommendation that SSD be includedas an additional measure of motor inhibition given its more directlink to inhibitory success (Alderson et al., 2007, 2008). Indeed, intracking versions of the SST (such as the one we used), the SSDis adjusted on every stop trial depending on whether the partici-pant successfully inhibited his/her response on the previous stoptrial.
Both SST inhibition performance measures (SSD, SSRT),obtained outside the MRI scanner, were related to RSFC measuredduring functional MRI scans in which participants were simplydirected to rest. In particular,we investigated patterns of functionalconnectivity related to 11 fronto-striatal brain ROI implicated ininhibitory control (Boehler et al., 2010).
MATERIALS AND METHODSPARTICIPANTSSixty-three children, including typically developing children(TDC) and children with ADHD, completed the SST task anda resting state scan session. Eighteen participants were excludedfrom further analyses due to SST Go trial accuracy < 75% (Nigg,1999), and five more because of excessive motion during the rest-ing state scan (see fMRI Image Preprocessing). In addition, sixparticipants were excluded because their performance was >2 SDbeyond the mean on a behavioral performance variable (SSRT,SSD, mean reaction time, or reaction time coefficient of varia-tion). Our intent was to include only those children who could beconfidently regarded as having followed task instructions.
Consequently, data from 34 children (aged 8–13 years) wereanalyzed in the current study (Table 1 shows participant charac-teristics). Seventeen children were TDC (mean age 10.8 years) and17 were diagnosed with ADHD (mean age 11 years). Within TDC47% were female, in contrast with 18% females in the ADHDgroup (χ2
(1) = 5.4, p = 0.015). Children with ADHD and TDCexhibited similar estimates of full IQ indexed by the WechslerAbbreviated Scale of Intelligence (WASI).
Typically developing children had no past or present DSM-IV-TR axis-I diagnosis or neurological illness nor history oftreatment with psychotropic medications, as confirmed by parent
Table 1 | Participant characteristics and behavioral performance scores
obtained from the stop signal task (SST).
ADHD TDC p-Value
N 17; 3 female/14 male 17; 8 female/9 male <0.02
Age 11.0 ± 1.26 10.8 ± 1.92 0.87
IQ 111.8 ± 14.26 112.1 ± 14.11 0.95
Mean go RT 629.9 ± 54.25 637.5 ± 62.97 0.35
Go RT CV 0.24 ± 0.02 0.23 ± 0.03 0.37
SSRT 299.1 ± 46.25 263.2 ± 63.94 <0.03
SSD 330.8 ± 73.26 374.3 ± 108.56 0.09
Go accuracy 0.89 ± 0.04 0.91 ± 0.05 0.23
Stop accuracy 0.52 ± 0.03 0.54 ± 0.05 0.21
CPRS-R
DSM-IV total 71.24 ± 9.16 44.24 ± 4.58 <0.01
DSM-IV
inattentive
71.00 ± 9.37 43.47 ± 3.76 <0.01
DSM-IV hyper-
active/impulsive
67.53 ± 12.43 46.18 ± 5.33 <0.01
Cognitive prob-
lems/inattention
69.59 ± 8.69 43.76 ± 3.25 <0.01
Hyperactivity 65.29 ± 14.25 45.00 ± 2.78 <0.01
ADHD Index 72.59 ± 8.02 44.24 ± 3.73 <0.01
Go, Go trials; RT, reaction time; CV, coefficient of variation; SSRT, stop signal
reaction time; SSD, stop signal delay; Stop, stop trials. p-Values for the SST behav-
ioral measures and the Conners Parent Rating Scale-Revised (CPRS-R) measures
are based on one-tailed t-tests. A significance level of p < 0.05 was used for all
comparisons.
administration of the Schedule of Affective Disorders and Schiz-ophrenia for Children – Present and Lifetime Version (Kaufmanet al., 1997; KSADS-PL). Children with Combined type ADHD(n = 11) and predominantly Inattentive type ADHD (n = 6) wereincluded. Clinicians’ DSM-IV-TR ADHD diagnoses were basedon KSADS-PL interview. Four children with ADHD had comor-bid oppositional defiant disorder, and one had comorbid adjust-ment disorder with depressive mood. Children with ADHD wereexcluded if they had a diagnosis of pervasive developmental disor-ders, psychosis or major depression or if they were treated with anynon-stimulant psychotropic medications within the month priorto participation (3 months for neuroleptics). Only children withan estimated full IQ above 80 were included. Twelve children withADHD (66%) were medication-naïve. Three children with ADHDcurrently treated with stimulant were asked to discontinue theirmedication 72 h prior to the scan session. Two remaining childrenwere not treated with stimulants at the time of the study, but weretreated at earlier points in their life. Finally, we obtained ConnersParent Rating Scale-Revised:Long Version (CPRS-R:L; Connerset al., 1998) scores for all participants. The CPRS-R:L is a widelyused, normed parent questionnaire that assesses problems relatedto conduct, hyperactivity–impulsivity, and inattention as well as arange of other psychopathology.
As part of a 1-h scan session, all participants completed at leastone 6.5 min resting state scan as well as a high-resolution anatom-ical scan (MPRAGE). After the scan session each participantcompleted a SST (Nigg, 1999) outside the scanner.
Frontiers in Psychiatry | Neuropsychiatric Imaging and Stimulation January 2012 | Volume 2 | Article 83 | 2
Mennes et al. RSFC correlates of inhibitory control in ADHD
fMRI DATA ACQUISITIONData were collected on a Siemens Allegra 3.0 Tesla scanner. Allparticipants completed at least one 6.5 min long resting state fMRI(R-fMRI) scan (180 EPI volumes, TR = 2000 ms, TE = 25 ms, flipangle = 90˚, 33 slices, voxels = 3 mm × 3 mm × 4 mm). All par-ticipants were instructed to rest with their eyes open duringthe scan. For spatial normalization and localization purposes wealso acquired a high-resolution T1-weighted anatomical image(MPRAGE, TR = 2530 ms; TE = 3.25 ms; TI = 1100 ms; flip angle= 7˚; 128 slices; FOV = 256 mm; voxel-size = 1 mm × 1.3 mm ×1.3 mm). Finally, a field map and short-TE EPI scan were alsoacquired to improve functional-to-anatomical co-registration.
STOP SIGNAL TASKThe SST is a computerized visual choice reaction time task aimedat examining inhibitory control (Logan et al., 1997; Nigg, 1999).On each trial an “X” or “O” was visually presented. Participantswere required to respond as quickly and accurately as possible tothe “X” or “O” by pressing “Enter” or “O,” respectively. Each visualstimulus was displayed on the screen for 1000 ms. Trials were sep-arated by a 500-ms display of a fixation cross and a 1000-ms blankscreen. The SST comprised 80% Go trials and 20% Stop trials.On Go trials, participants were required to respond to the visualstimulus. In contrast, on Stop trials, an auditory stop stimuluswas presented after the visual stimulus, indicating that partici-pants had to inhibit their response. The delay between the visualstimulus and auditory stop stimulus (SSD) started at 250 ms. Ifparticipants successfully inhibited the prepotent Go response, theSSD on the next stop trial was increased by 50 ms, making inhibi-tion more difficult on the next stop trial. If the participant failed toinhibit, the SSD on the next stop trial was decreased by 50 ms, i.e.,the auditory tone was presented sooner, making inhibition easier.This procedure was implemented to attain a SSD at which par-ticipants were able to successfully inhibit 50% of the Stop trials.Based on the horse-race model (Logan et al., 1984), which positsa race between the go and inhibition processes, the process thatfinishes first gets executed. In successful stop trials the inhibitionprocess is able to catch up and override the go process, while inunsuccessful stop trials the go response is executed before the inhi-bition process finishes. Based on this theory, titrating the SSD toobtain a 50% inhibition success rate makes it possible to obtainan estimate of the length of the inhibition process (SSRT) by sub-tracting the mean SSD from the mean Go reaction time. A smallerSSRT indicates a faster inhibition process. A smaller SSD indicatesless successful inhibition, as participants require a shorter delaybetween the go stimulus and the stop signal to achieve successfulinhibition. The SSRT and SSD thus form two related inhibitoryindices of interest. After two practice blocks, all participants com-pleted six task blocks. Each block comprised 32 trials: 24 go trialsand 8 stop trials.
fMRI IMAGE PREPROCESSINGData processing was performed using Analysis of Functional Neu-roImaging1 (AFNI) and FMRIB Software Library2 (FSL). Image
1http://afni.nimh.nih.gov/afni2www.fmrib.ox.ac.uk
preprocessing consisted of discarding the first 4 EPI volumes fromeach resting state scan to allow for signal equilibration; slice timecorrection for interleaved acquisitions; 3-D motion correctionwith Fourier interpolation; despiking (detection and removal ofextreme time series outliers); spatial smoothing using a 6-mmFWHM Gaussian kernel; mean-based intensity normalization ofall volumes by the same factor; temporal bandpass filtering (0.009–0.1 Hz); and linear and quadratic detrending. FSL FLIRT was usedfor linear registration of the high-resolution structural imagesto the MNI152 template (Jenkinson and Smith, 2001; Jenkin-son et al., 2002). This transformation was then refined usingFNIRT non-linear registration (Andersson et al., 2007). Linearregistration of each participant’s functional time series to thehigh-resolution structural image was performed using FLIRT.This functional-to-anatomical co-registration was improved byintermediate registration to a low-resolution image and b0unwarping.
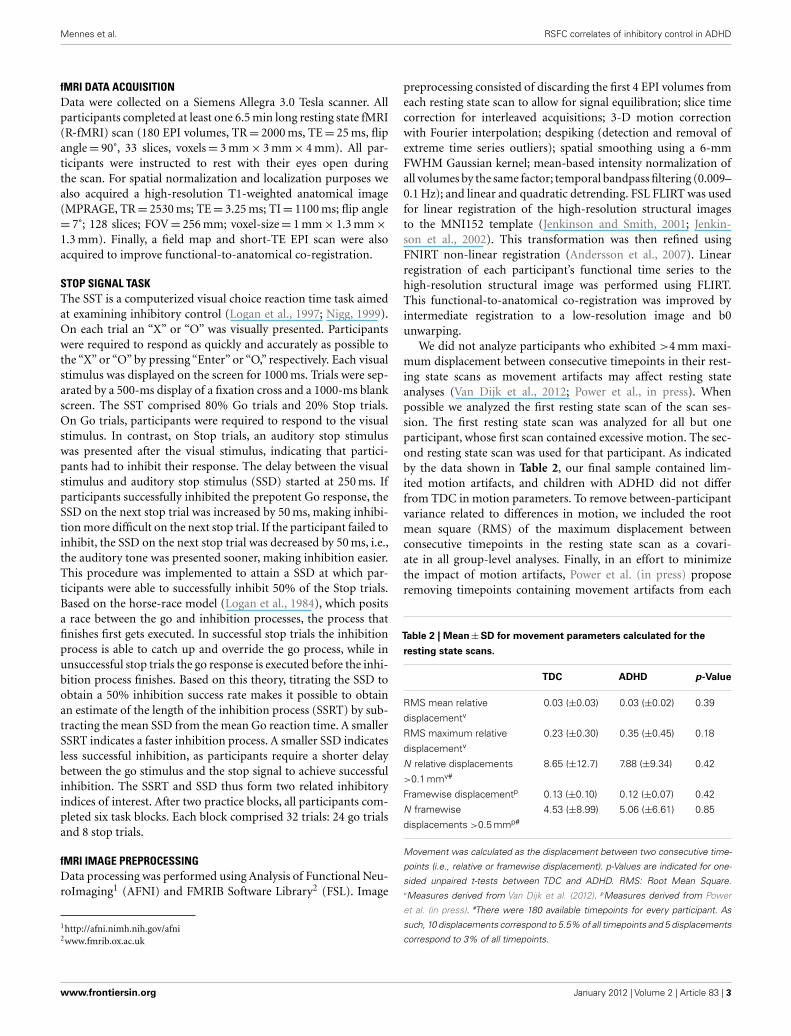
We did not analyze participants who exhibited >4 mm maxi-mum displacement between consecutive timepoints in their rest-ing state scans as movement artifacts may affect resting stateanalyses (Van Dijk et al., 2012; Power et al., in press). Whenpossible we analyzed the first resting state scan of the scan ses-sion. The first resting state scan was analyzed for all but oneparticipant, whose first scan contained excessive motion. The sec-ond resting state scan was used for that participant. As indicatedby the data shown in Table 2, our final sample contained lim-ited motion artifacts, and children with ADHD did not differfrom TDC in motion parameters. To remove between-participantvariance related to differences in motion, we included the rootmean square (RMS) of the maximum displacement betweenconsecutive timepoints in the resting state scan as a covari-ate in all group-level analyses. Finally, in an effort to minimizethe impact of motion artifacts, Power et al. (in press) proposeremoving timepoints containing movement artifacts from each
Table 2 | Mean ± SD for movement parameters calculated for the
resting state scans.
TDC ADHD p-Value
RMS mean relative
displacementv0.03 (±0.03) 0.03 (±0.02) 0.39
RMS maximum relative
displacementv0.23 (±0.30) 0.35 (±0.45) 0.18
N relative displacements
>0.1 mmv#
8.65 (±12.7) 7.88 (±9.34) 0.42
Framewise displacementp 0.13 (±0.10) 0.12 (±0.07) 0.42
N framewise
displacements >0.5 mmp#
4.53 (±8.99) 5.06 (±6.61) 0.85
Movement was calculated as the displacement between two consecutive time-
points (i.e., relative or framewise displacement). p-Values are indicated for one-
sided unpaired t-tests between TDC and ADHD. RMS: Root Mean Square.vMeasures derived from Van Dijk et al. (2012). pMeasures derived from Power
et al. (in press). #There were 180 available timepoints for every participant. As
such, 10 displacements correspond to 5.5% of all timepoints and 5 displacements
correspond to 3% of all timepoints.
www.frontiersin.org January 2012 | Volume 2 | Article 83 | 3
Mennes et al. RSFC correlates of inhibitory control in ADHD
participant’s time series. Accordingly, we also repeated our analysesremoving timepoints that exhibited micromovements exceeding0.5 mm. As described in the supplementary material accompa-nying this paper, removing these timepoints did not alter ourresults.
NUISANCE SIGNAL REGRESSIONTo control for the effects of motion and physiological processes(i.e., cardiac and respiratory fluctuations) at each timepoint,each participant’s 4-D preprocessed volume was regressed withnine predictors that modeled white matter, cerebrospinal fluid,the global signal, and six motion parameters. The resultant 4-Dresiduals volumes were used in all subsequent analyses.
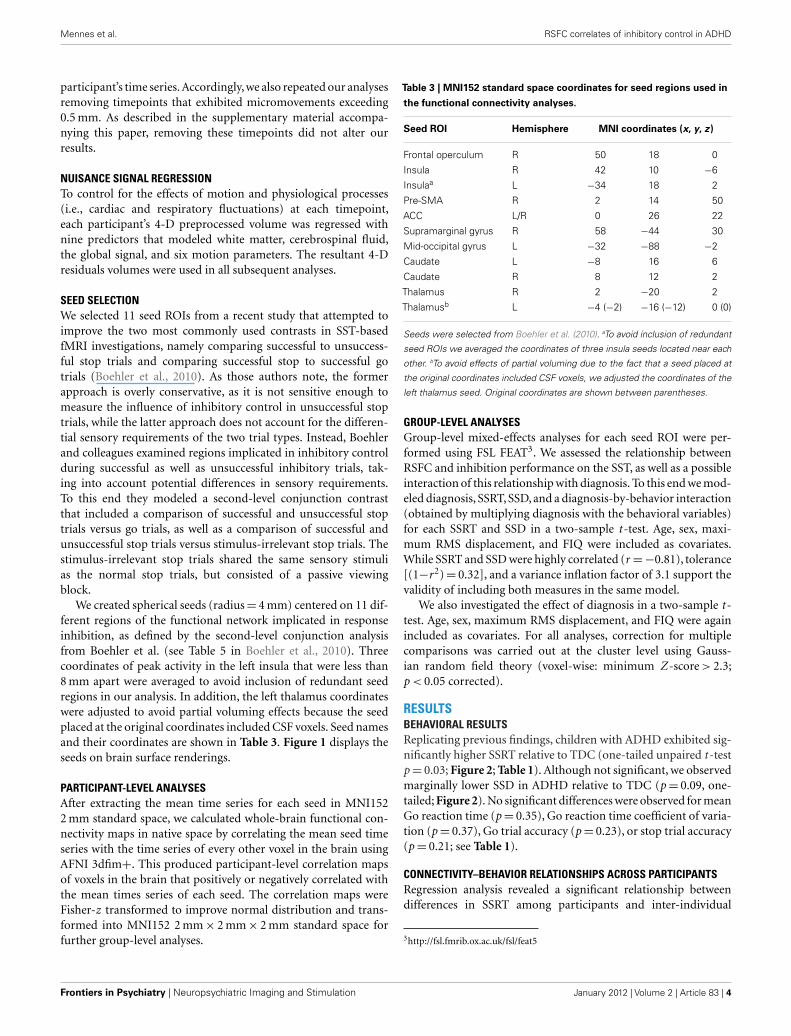
SEED SELECTIONWe selected 11 seed ROIs from a recent study that attempted toimprove the two most commonly used contrasts in SST-basedfMRI investigations, namely comparing successful to unsuccess-ful stop trials and comparing successful stop to successful gotrials (Boehler et al., 2010). As those authors note, the formerapproach is overly conservative, as it is not sensitive enough tomeasure the influence of inhibitory control in unsuccessful stoptrials, while the latter approach does not account for the differen-tial sensory requirements of the two trial types. Instead, Boehlerand colleagues examined regions implicated in inhibitory controlduring successful as well as unsuccessful inhibitory trials, tak-ing into account potential differences in sensory requirements.To this end they modeled a second-level conjunction contrastthat included a comparison of successful and unsuccessful stoptrials versus go trials, as well as a comparison of successful andunsuccessful stop trials versus stimulus-irrelevant stop trials. Thestimulus-irrelevant stop trials shared the same sensory stimulias the normal stop trials, but consisted of a passive viewingblock.
We created spherical seeds (radius = 4 mm) centered on 11 dif-ferent regions of the functional network implicated in responseinhibition, as defined by the second-level conjunction analysisfrom Boehler et al. (see Table 5 in Boehler et al., 2010). Threecoordinates of peak activity in the left insula that were less than8 mm apart were averaged to avoid inclusion of redundant seedregions in our analysis. In addition, the left thalamus coordinateswere adjusted to avoid partial voluming effects because the seedplaced at the original coordinates included CSF voxels. Seed namesand their coordinates are shown in Table 3. Figure 1 displays theseeds on brain surface renderings.
PARTICIPANT-LEVEL ANALYSESAfter extracting the mean time series for each seed in MNI1522 mm standard space, we calculated whole-brain functional con-nectivity maps in native space by correlating the mean seed timeseries with the time series of every other voxel in the brain usingAFNI 3dfim+. This produced participant-level correlation mapsof voxels in the brain that positively or negatively correlated withthe mean times series of each seed. The correlation maps wereFisher-z transformed to improve normal distribution and trans-formed into MNI152 2 mm × 2 mm × 2 mm standard space forfurther group-level analyses.
Table 3 | MNI152 standard space coordinates for seed regions used in
the functional connectivity analyses.
Seed ROI Hemisphere MNI coordinates (x, y, z)
Frontal operculum R 50 18 0
Insula R 42 10 −6
Insulaa L −34 18 2
Pre-SMA R 2 14 50
ACC L/R 0 26 22
Supramarginal gyrus R 58 −44 30
Mid-occipital gyrus L −32 −88 −2
Caudate L −8 16 6
Caudate R 8 12 2
Thalamus R 2 −20 2
Thalamusb L −4 (−2) −16 (−12) 0 (0)
Seeds were selected from Boehler et al. (2010). aTo avoid inclusion of redundant
seed ROIs we averaged the coordinates of three insula seeds located near each
other. bTo avoid effects of partial voluming due to the fact that a seed placed at
the original coordinates included CSF voxels, we adjusted the coordinates of the
left thalamus seed. Original coordinates are shown between parentheses.
GROUP-LEVEL ANALYSESGroup-level mixed-effects analyses for each seed ROI were per-formed using FSL FEAT3. We assessed the relationship betweenRSFC and inhibition performance on the SST, as well as a possibleinteraction of this relationship with diagnosis. To this end we mod-eled diagnosis, SSRT, SSD, and a diagnosis-by-behavior interaction(obtained by multiplying diagnosis with the behavioral variables)for each SSRT and SSD in a two-sample t -test. Age, sex, maxi-mum RMS displacement, and FIQ were included as covariates.While SSRT and SSD were highly correlated (r = −0.81), tolerance[(1−r2) = 0.32], and a variance inflation factor of 3.1 support thevalidity of including both measures in the same model.
We also investigated the effect of diagnosis in a two-sample t -test. Age, sex, maximum RMS displacement, and FIQ were againincluded as covariates. For all analyses, correction for multiplecomparisons was carried out at the cluster level using Gauss-ian random field theory (voxel-wise: minimum Z -score > 2.3;p < 0.05 corrected).
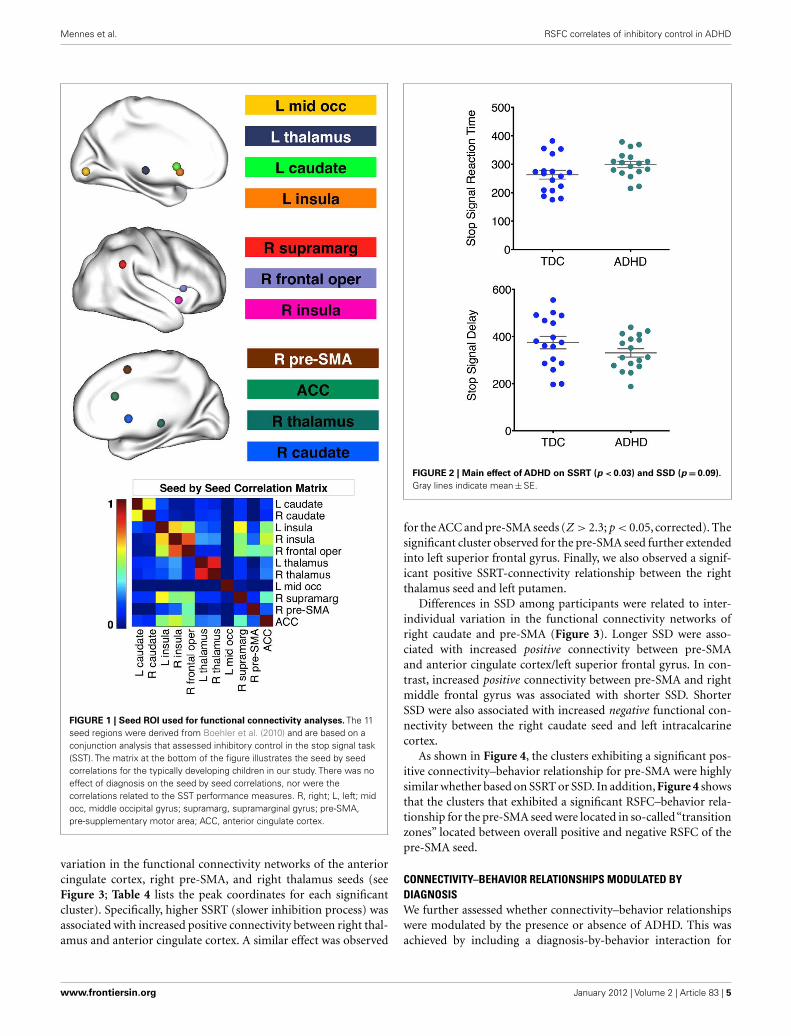
RESULTSBEHAVIORAL RESULTSReplicating previous findings, children with ADHD exhibited sig-nificantly higher SSRT relative to TDC (one-tailed unpaired t -testp = 0.03; Figure 2; Table 1). Although not significant, we observedmarginally lower SSD in ADHD relative to TDC (p = 0.09, one-tailed; Figure 2). No significant differences were observed for meanGo reaction time (p = 0.35), Go reaction time coefficient of varia-tion (p = 0.37), Go trial accuracy (p = 0.23), or stop trial accuracy(p = 0.21; see Table 1).
CONNECTIVITY–BEHAVIOR RELATIONSHIPS ACROSS PARTICIPANTSRegression analysis revealed a significant relationship betweendifferences in SSRT among participants and inter-individual
3http://fsl.fmrib.ox.ac.uk/fsl/feat5
Frontiers in Psychiatry | Neuropsychiatric Imaging and Stimulation January 2012 | Volume 2 | Article 83 | 4
Mennes et al. RSFC correlates of inhibitory control in ADHD
FIGURE 1 | Seed ROI used for functional connectivity analyses. The 11seed regions were derived from Boehler et al. (2010) and are based on aconjunction analysis that assessed inhibitory control in the stop signal task(SST). The matrix at the bottom of the figure illustrates the seed by seedcorrelations for the typically developing children in our study. There was noeffect of diagnosis on the seed by seed correlations, nor were thecorrelations related to the SST performance measures. R, right; L, left; midocc, middle occipital gyrus; supramarg, supramarginal gyrus; pre-SMA,pre-supplementary motor area; ACC, anterior cingulate cortex.
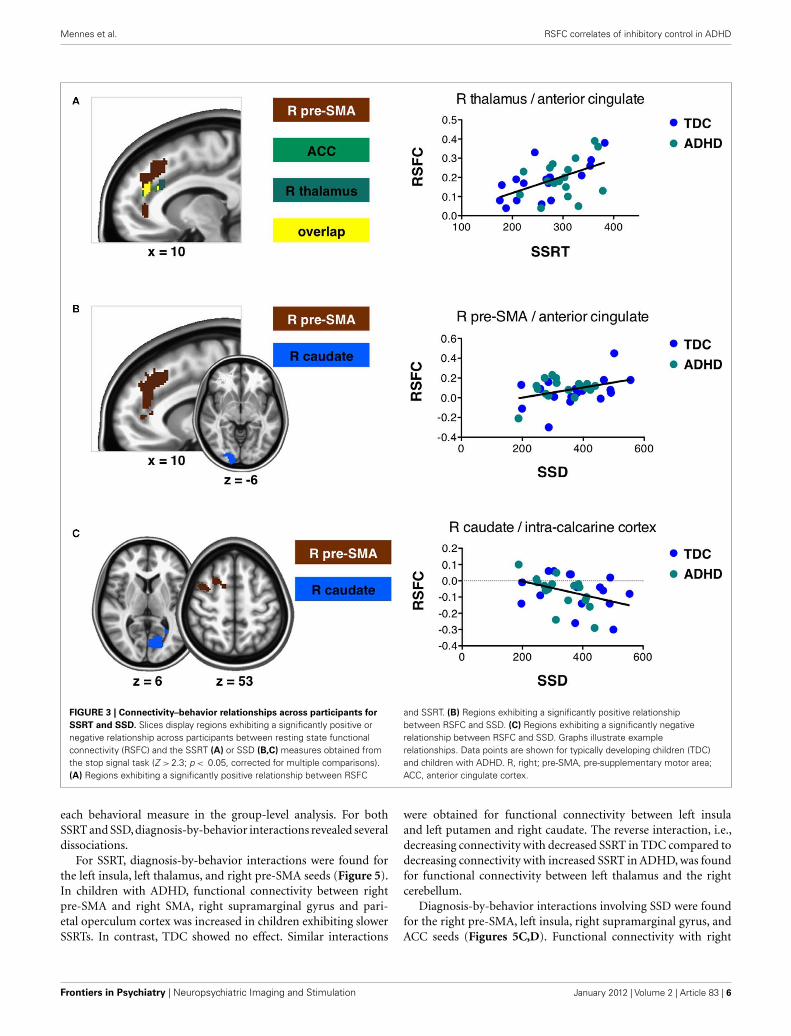
variation in the functional connectivity networks of the anteriorcingulate cortex, right pre-SMA, and right thalamus seeds (seeFigure 3; Table 4 lists the peak coordinates for each significantcluster). Specifically, higher SSRT (slower inhibition process) wasassociated with increased positive connectivity between right thal-amus and anterior cingulate cortex. A similar effect was observed
FIGURE 2 | Main effect of ADHD on SSRT (p < 0.03) and SSD (p = 0.09).
Gray lines indicate mean ± SE.
for the ACC and pre-SMA seeds (Z > 2.3; p < 0.05, corrected). Thesignificant cluster observed for the pre-SMA seed further extendedinto left superior frontal gyrus. Finally, we also observed a signif-icant positive SSRT-connectivity relationship between the rightthalamus seed and left putamen.
Differences in SSD among participants were related to inter-individual variation in the functional connectivity networks ofright caudate and pre-SMA (Figure 3). Longer SSD were asso-ciated with increased positive connectivity between pre-SMAand anterior cingulate cortex/left superior frontal gyrus. In con-trast, increased positive connectivity between pre-SMA and rightmiddle frontal gyrus was associated with shorter SSD. ShorterSSD were also associated with increased negative functional con-nectivity between the right caudate seed and left intracalcarinecortex.
As shown in Figure 4, the clusters exhibiting a significant pos-itive connectivity–behavior relationship for pre-SMA were highlysimilar whether based on SSRT or SSD. In addition, Figure 4 showsthat the clusters that exhibited a significant RSFC–behavior rela-tionship for the pre-SMA seed were located in so-called“transitionzones” located between overall positive and negative RSFC of thepre-SMA seed.
CONNECTIVITY–BEHAVIOR RELATIONSHIPS MODULATED BYDIAGNOSISWe further assessed whether connectivity–behavior relationshipswere modulated by the presence or absence of ADHD. This wasachieved by including a diagnosis-by-behavior interaction for
www.frontiersin.org January 2012 | Volume 2 | Article 83 | 5
Mennes et al. RSFC correlates of inhibitory control in ADHD
FIGURE 3 | Connectivity–behavior relationships across participants for
SSRT and SSD. Slices display regions exhibiting a significantly positive ornegative relationship across participants between resting state functionalconnectivity (RSFC) and the SSRT (A) or SSD (B,C) measures obtained fromthe stop signal task (Z > 2.3; p < 0.05, corrected for multiple comparisons).(A) Regions exhibiting a significantly positive relationship between RSFC
and SSRT. (B) Regions exhibiting a significantly positive relationshipbetween RSFC and SSD. (C) Regions exhibiting a significantly negativerelationship between RSFC and SSD. Graphs illustrate examplerelationships. Data points are shown for typically developing children (TDC)and children with ADHD. R, right; pre-SMA, pre-supplementary motor area;ACC, anterior cingulate cortex.
each behavioral measure in the group-level analysis. For bothSSRT and SSD, diagnosis-by-behavior interactions revealed severaldissociations.
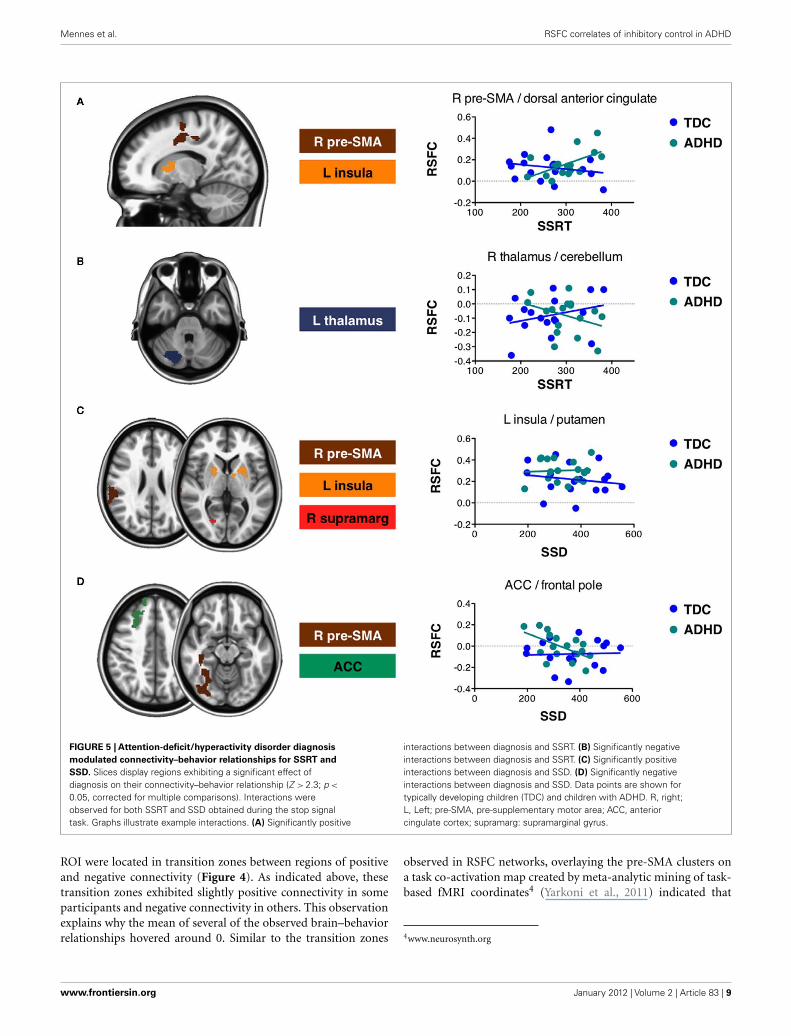
For SSRT, diagnosis-by-behavior interactions were found forthe left insula, left thalamus, and right pre-SMA seeds (Figure 5).In children with ADHD, functional connectivity between rightpre-SMA and right SMA, right supramarginal gyrus and pari-etal operculum cortex was increased in children exhibiting slowerSSRTs. In contrast, TDC showed no effect. Similar interactions
were obtained for functional connectivity between left insulaand left putamen and right caudate. The reverse interaction, i.e.,decreasing connectivity with decreased SSRT in TDC compared todecreasing connectivity with increased SSRT in ADHD, was foundfor functional connectivity between left thalamus and the rightcerebellum.
Diagnosis-by-behavior interactions involving SSD were foundfor the right pre-SMA, left insula, right supramarginal gyrus, andACC seeds (Figures 5C,D). Functional connectivity with right
Frontiers in Psychiatry | Neuropsychiatric Imaging and Stimulation January 2012 | Volume 2 | Article 83 | 6
Mennes et al. RSFC correlates of inhibitory control in ADHD
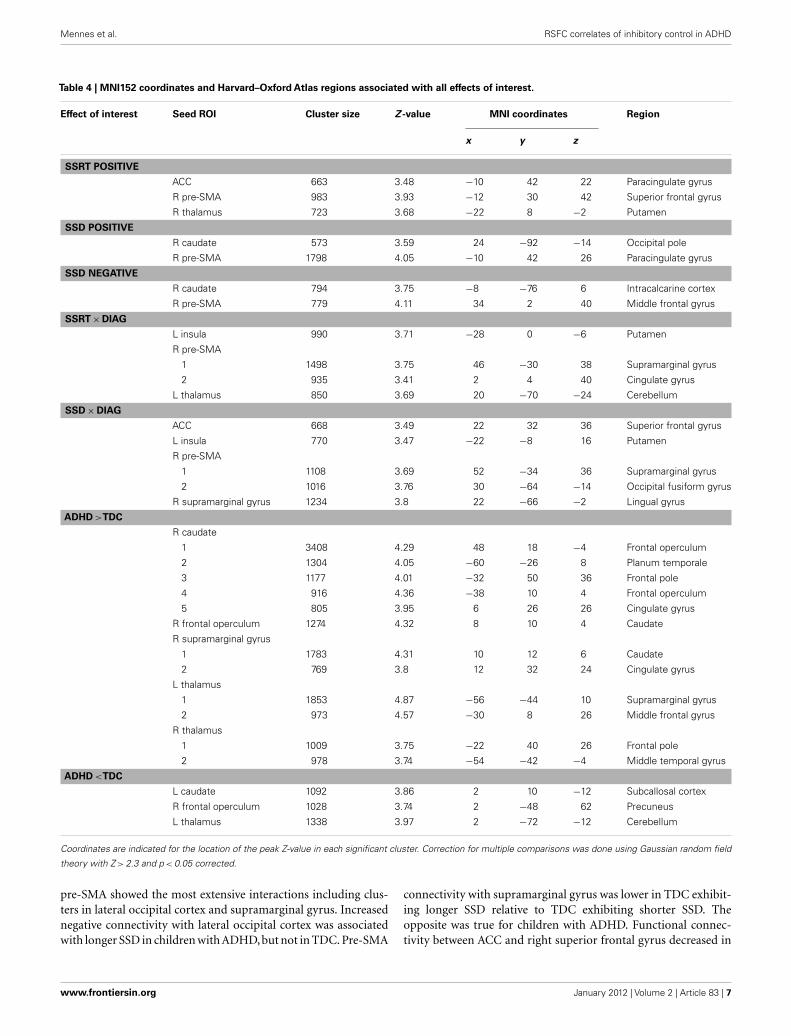
Table 4 | MNI152 coordinates and Harvard–Oxford Atlas regions associated with all effects of interest.
Effect of interest Seed ROI Cluster size Z -value MNI coordinates Region
x y z
SSRT POSITIVE
ACC 663 3.48 −10 42 22 Paracingulate gyrus
R pre-SMA 983 3.93 −12 30 42 Superior frontal gyrus
R thalamus 723 3.68 −22 8 −2 Putamen
SSD POSITIVE
R caudate 573 3.59 24 −92 −14 Occipital pole
R pre-SMA 1798 4.05 −10 42 26 Paracingulate gyrus
SSD NEGATIVE
R caudate 794 3.75 −8 −76 6 Intracalcarine cortex
R pre-SMA 779 4.11 34 2 40 Middle frontal gyrus
SSRT × DIAG
L insula 990 3.71 −28 0 −6 Putamen
R pre-SMA
1 1498 3.75 46 −30 38 Supramarginal gyrus
2 935 3.41 2 4 40 Cingulate gyrus
L thalamus 850 3.69 20 −70 −24 Cerebellum
SSD × DIAG
ACC 668 3.49 22 32 36 Superior frontal gyrus
L insula 770 3.47 −22 −8 16 Putamen
R pre-SMA
1 1108 3.69 52 −34 36 Supramarginal gyrus
2 1016 3.76 30 −64 −14 Occipital fusiform gyrus
R supramarginal gyrus 1234 3.8 22 −66 −2 Lingual gyrus
ADHD >TDC
R caudate
1 3408 4.29 48 18 −4 Frontal operculum
2 1304 4.05 −60 −26 8 Planum temporale
3 1177 4.01 −32 50 36 Frontal pole
4 916 4.36 −38 10 4 Frontal operculum
5 805 3.95 6 26 26 Cingulate gyrus
R frontal operculum 1274 4.32 8 10 4 Caudate
R supramarginal gyrus
1 1783 4.31 10 12 6 Caudate
2 769 3.8 12 32 24 Cingulate gyrus
L thalamus
1 1853 4.87 −56 −44 10 Supramarginal gyrus
2 973 4.57 −30 8 26 Middle frontal gyrus
R thalamus
1 1009 3.75 −22 40 26 Frontal pole
2 978 3.74 −54 −42 −4 Middle temporal gyrus
ADHD <TDC
L caudate 1092 3.86 2 10 −12 Subcallosal cortex
R frontal operculum 1028 3.74 2 −48 62 Precuneus
L thalamus 1338 3.97 2 −72 −12 Cerebellum
Coordinates are indicated for the location of the peak Z-value in each significant cluster. Correction for multiple comparisons was done using Gaussian random field
theory with Z > 2.3 and p < 0.05 corrected.
pre-SMA showed the most extensive interactions including clus-ters in lateral occipital cortex and supramarginal gyrus. Increasednegative connectivity with lateral occipital cortex was associatedwith longer SSD in children with ADHD, but not in TDC. Pre-SMA
connectivity with supramarginal gyrus was lower in TDC exhibit-ing longer SSD relative to TDC exhibiting shorter SSD. Theopposite was true for children with ADHD. Functional connec-tivity between ACC and right superior frontal gyrus decreased in
www.frontiersin.org January 2012 | Volume 2 | Article 83 | 7
Mennes et al. RSFC correlates of inhibitory control in ADHD
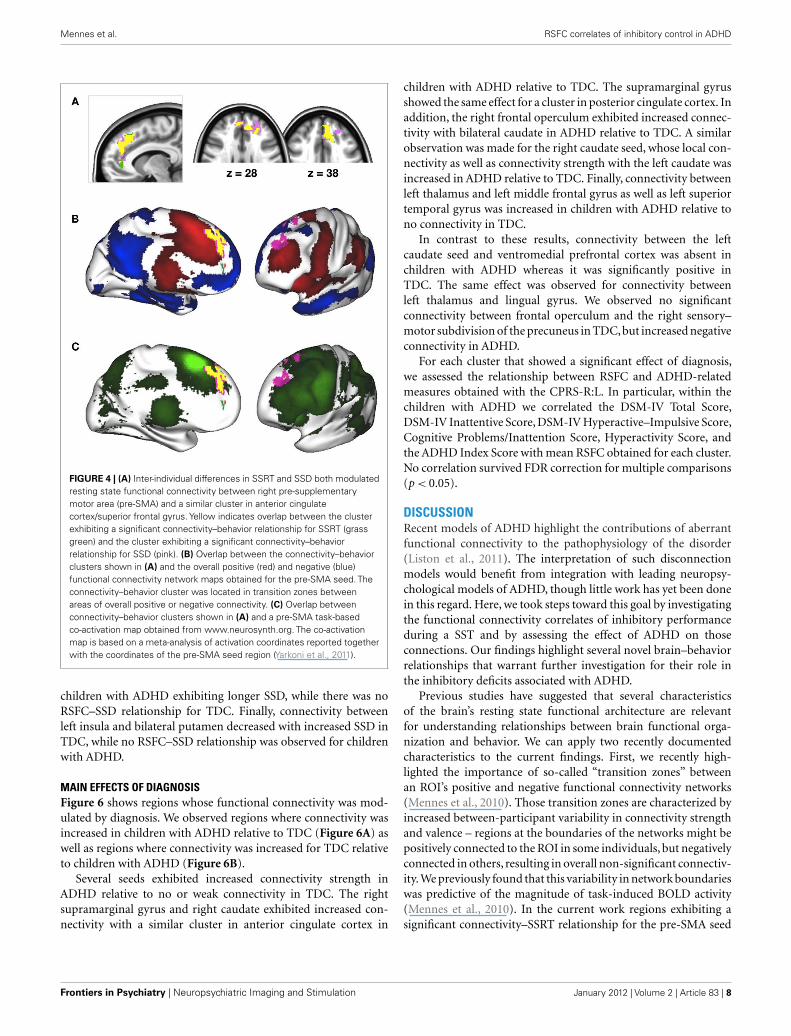
FIGURE 4 | (A) Inter-individual differences in SSRT and SSD both modulatedresting state functional connectivity between right pre-supplementarymotor area (pre-SMA) and a similar cluster in anterior cingulatecortex/superior frontal gyrus. Yellow indicates overlap between the clusterexhibiting a significant connectivity–behavior relationship for SSRT (grassgreen) and the cluster exhibiting a significant connectivity–behaviorrelationship for SSD (pink). (B) Overlap between the connectivity–behaviorclusters shown in (A) and the overall positive (red) and negative (blue)functional connectivity network maps obtained for the pre-SMA seed. Theconnectivity–behavior cluster was located in transition zones betweenareas of overall positive or negative connectivity. (C) Overlap betweenconnectivity–behavior clusters shown in (A) and a pre-SMA task-basedco-activation map obtained from www.neurosynth.org. The co-activationmap is based on a meta-analysis of activation coordinates reported togetherwith the coordinates of the pre-SMA seed region (Yarkoni et al., 2011).
children with ADHD exhibiting longer SSD, while there was noRSFC–SSD relationship for TDC. Finally, connectivity betweenleft insula and bilateral putamen decreased with increased SSD inTDC, while no RSFC–SSD relationship was observed for childrenwith ADHD.
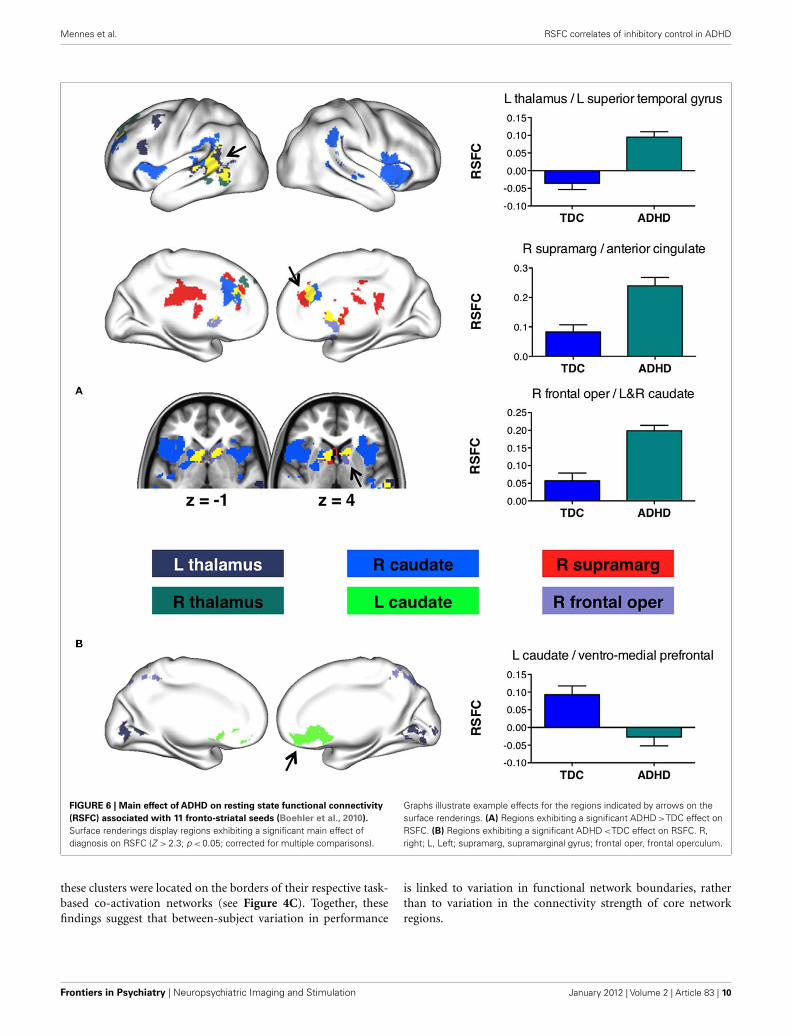
MAIN EFFECTS OF DIAGNOSISFigure 6 shows regions whose functional connectivity was mod-ulated by diagnosis. We observed regions where connectivity wasincreased in children with ADHD relative to TDC (Figure 6A) aswell as regions where connectivity was increased for TDC relativeto children with ADHD (Figure 6B).
Several seeds exhibited increased connectivity strength inADHD relative to no or weak connectivity in TDC. The rightsupramarginal gyrus and right caudate exhibited increased con-nectivity with a similar cluster in anterior cingulate cortex in
children with ADHD relative to TDC. The supramarginal gyrusshowed the same effect for a cluster in posterior cingulate cortex. Inaddition, the right frontal operculum exhibited increased connec-tivity with bilateral caudate in ADHD relative to TDC. A similarobservation was made for the right caudate seed, whose local con-nectivity as well as connectivity strength with the left caudate wasincreased in ADHD relative to TDC. Finally, connectivity betweenleft thalamus and left middle frontal gyrus as well as left superiortemporal gyrus was increased in children with ADHD relative tono connectivity in TDC.
In contrast to these results, connectivity between the leftcaudate seed and ventromedial prefrontal cortex was absent inchildren with ADHD whereas it was significantly positive inTDC. The same effect was observed for connectivity betweenleft thalamus and lingual gyrus. We observed no significantconnectivity between frontal operculum and the right sensory–motor subdivision of the precuneus in TDC,but increased negativeconnectivity in ADHD.
For each cluster that showed a significant effect of diagnosis,we assessed the relationship between RSFC and ADHD-relatedmeasures obtained with the CPRS-R:L. In particular, within thechildren with ADHD we correlated the DSM-IV Total Score,DSM-IV Inattentive Score, DSM-IV Hyperactive–Impulsive Score,Cognitive Problems/Inattention Score, Hyperactivity Score, andthe ADHD Index Score with mean RSFC obtained for each cluster.No correlation survived FDR correction for multiple comparisons(p < 0.05).
DISCUSSIONRecent models of ADHD highlight the contributions of aberrantfunctional connectivity to the pathophysiology of the disorder(Liston et al., 2011). The interpretation of such disconnectionmodels would benefit from integration with leading neuropsy-chological models of ADHD, though little work has yet been donein this regard. Here, we took steps toward this goal by investigatingthe functional connectivity correlates of inhibitory performanceduring a SST and by assessing the effect of ADHD on thoseconnections. Our findings highlight several novel brain–behaviorrelationships that warrant further investigation for their role inthe inhibitory deficits associated with ADHD.
Previous studies have suggested that several characteristicsof the brain’s resting state functional architecture are relevantfor understanding relationships between brain functional orga-nization and behavior. We can apply two recently documentedcharacteristics to the current findings. First, we recently high-lighted the importance of so-called “transition zones” betweenan ROI’s positive and negative functional connectivity networks(Mennes et al., 2010). Those transition zones are characterized byincreased between-participant variability in connectivity strengthand valence – regions at the boundaries of the networks might bepositively connected to the ROI in some individuals, but negativelyconnected in others, resulting in overall non-significant connectiv-ity. We previously found that this variability in network boundarieswas predictive of the magnitude of task-induced BOLD activity(Mennes et al., 2010). In the current work regions exhibiting asignificant connectivity–SSRT relationship for the pre-SMA seed
Frontiers in Psychiatry | Neuropsychiatric Imaging and Stimulation January 2012 | Volume 2 | Article 83 | 8
Mennes et al. RSFC correlates of inhibitory control in ADHD
FIGURE 5 | Attention-deficit/hyperactivity disorder diagnosis
modulated connectivity–behavior relationships for SSRT and
SSD. Slices display regions exhibiting a significant effect ofdiagnosis on their connectivity–behavior relationship (Z > 2.3; p <
0.05, corrected for multiple comparisons). Interactions wereobserved for both SSRT and SSD obtained during the stop signaltask. Graphs illustrate example interactions. (A) Significantly positive
interactions between diagnosis and SSRT. (B) Significantly negativeinteractions between diagnosis and SSRT. (C) Significantly positiveinteractions between diagnosis and SSD. (D) Significantly negativeinteractions between diagnosis and SSD. Data points are shown fortypically developing children (TDC) and children with ADHD. R, right;L, Left; pre-SMA, pre-supplementary motor area; ACC, anteriorcingulate cortex; supramarg: supramarginal gyrus.
ROI were located in transition zones between regions of positiveand negative connectivity (Figure 4). As indicated above, thesetransition zones exhibited slightly positive connectivity in someparticipants and negative connectivity in others. This observationexplains why the mean of several of the observed brain–behaviorrelationships hovered around 0. Similar to the transition zones
observed in RSFC networks, overlaying the pre-SMA clusters ona task co-activation map created by meta-analytic mining of task-based fMRI coordinates4 (Yarkoni et al., 2011) indicated that
4www.neurosynth.org
www.frontiersin.org January 2012 | Volume 2 | Article 83 | 9
Mennes et al. RSFC correlates of inhibitory control in ADHD
FIGURE 6 | Main effect of ADHD on resting state functional connectivity
(RSFC) associated with 11 fronto-striatal seeds (Boehler et al., 2010).
Surface renderings display regions exhibiting a significant main effect ofdiagnosis on RSFC (Z > 2.3; p < 0.05; corrected for multiple comparisons).
Graphs illustrate example effects for the regions indicated by arrows on thesurface renderings. (A) Regions exhibiting a significant ADHD >TDC effect onRSFC. (B) Regions exhibiting a significant ADHD <TDC effect on RSFC. R,right; L, Left; supramarg, supramarginal gyrus; frontal oper, frontal operculum.
these clusters were located on the borders of their respective task-based co-activation networks (see Figure 4C). Together, thesefindings suggest that between-subject variation in performance
is linked to variation in functional network boundaries, ratherthan to variation in the connectivity strength of core networkregions.
Frontiers in Psychiatry | Neuropsychiatric Imaging and Stimulation January 2012 | Volume 2 | Article 83 | 10
Mennes et al. RSFC correlates of inhibitory control in ADHD
A second characteristic that may represent an important featureof relationships between behavior and functional brain architec-ture is network differentiation (Fox et al., 2005). Networks orregions are thought to be functionally differentiated if there areno correlations between them or if they are negatively correlated.This is based on the hypothesis that functional brain networks (attimes) benefit from preventing cross talk between each other. Forinstance, participants whose brains exhibited stronger functionaldifferentiation performed more optimally compared to partic-ipants exhibiting weaker or aberrant functional differentiation(Kelly et al., 2008; Chabernaud et al., in press). Accordingly, weobserved that better differentiation between right caudate andleft intracalcarine sulcus (i.e., increased negative connectivity)was associated with better inhibitory success (i.e., longer SSD;Figure 3). In addition, children with ADHD exhibited functionalconnections not observed for TDC (Figure 6) suggesting a lessdifferentiated and less efficient connectivity profile (Di Martinoet al., 2011).
The notion that SSRT provides the most specific index ofinhibitory function has been central to most prior analyses ofthe SST. However, SSRT is not directly measured, but derivedby subtracting SSD from the mean Go reaction time. As Alder-son et al. (2007) point out, SSD should be considered wheninterpreting group differences in SSRT as SSD is more tightlyrelated to inhibitory success. In the present work, we includedboth SSD and SSRT in the same regression model to partial outcommon variance associated with these two highly correlated mea-sures. As described above, we found evidence for neural circuitrythat was specifically related to either SSRT or SSD. In addition,we found neural circuitry related to SSD as well as SSRT. Inparticular, inter-individual differences in SSRT as well as SSDwere associated with inter-individual differences in functionalconnectivity strength between pre-SMA and anterior cingulatecortex/superior frontal gyrus (Figure 4). Although SSRT andSSD are inversely related (r = −0.81), both RSFC/behavior rela-tionships were positive. Therefore, rather than capturing specificaspects of the inhibition process, these results are in accordancewith the observation that anterior cingulate cortex and supe-rior frontal gyrus are activated by a variety of cognitive tasksthat measure aspects of more general endogenous cognitive con-trol (see meta-analysis Figure 1 in Mennes et al., 2006), whilepre-SMA is sensitive to aspects of task difficulty and motor prepa-ration (Milham and Banich, 2005; Stiers et al., 2010). In addition,increased pre-SMA activation has been reported in ADHD partici-pants exhibiting higher intra-individual response speed variability,while increased superior frontal gyrus activity was observed forADHD participants exhibiting lower intra-individual responsespeed variability (Suskauer et al., 2008). Further research includinglarger sample sizes is needed to disentangle the precise interactionbetween SSRT and SSD, and their relationship with RSFC. Forexample, short SSRT but long SSD indicate optimal inhibitoryperformance, yet the overlapping connectivity-behavior relation-ships observed for pre-SMA were positive for both SSRT andSSD.
The presence or absence of ADHD modulated connectivity–behavior relationships for both SSRT and SSD in several regionsincluding putamen, post-central gyrus, posterior cingulate, and
intracalcarine cortex. Similarly, the presence of ADHD modulatedconnectivity–behavior relationships for internalizing and exter-nalizing scores obtained from the Child Behavior Checklist ques-tionnaire (Chabernaud et al., in press). Further research is neededto unravel mechanisms underlying such differential relationships.As ADHD effects on connectivity are often interpreted in light ofdysmaturational processes (Fair et al., 2010), future work shouldinvestigate age-related modulations of connectivity–behavior rela-tionships. In the meantime, the current results suggest that ADHDshould not be considered a simple extreme of brain function,since various aspects of brain function show qualitative differ-ences depending on the presence or absence of psychopathology(Rubia et al., 2007; Chabernaud et al., in press).
Behavioral studies using the SST commonly report slowermean Go reaction times and increased reaction time variability inADHD (see Alderson et al., 2007 and Lijffijt et al., 2005 for meta-analyses). In particular, reaction time variability has recently beenput forward as an alternative phenotype for ADHD as behavioralstudies have consistently demonstrated significantly higher intra-individual variability in ADHD versus neurotypical populations(Kuntsi et al., 2001; Castellanos et al., 2005; Alderson et al., 2007;Rubia et al., 2007). We did not observe a significant effect of ADHDon mean Go reaction time or reaction time variability (neither forthe coefficient of variation or SD). The factors contributing to thislack of replication remain unclear and further studies are war-ranted. One possible reason for the absence of such effects mightbe the strict performance criteria used here. Yet, Nigg (1999) usedthe same criteria and observed an ADHD effect on reaction timevariability. A second reason for the absence of such effects mightbe that our sample of ADHD children represents a specific neu-ropsychological ADHD phenotype. Accordingly, comparing ourbehavioral data to those reported in Nigg (1999) suggests that theADHD children included here outperformed the ADHD childrenincluded in Nigg (1999), with faster reaction times (629 versus713 ms) and SSRT (299 versus 405 ms). These observations areconsistent with the notion that several ADHD phenotypes exist,each with their own behavioral and cognitive profile (Nigg et al.,2005).
With regard to the effects of diagnosis on functional con-nectivity, we replicated previous findings of ADHD-related dif-ferences in functional connectivity in ventromedial prefrontalcortex (Fair et al., 2010), and frontal operculum (Tian et al.,2006). Such findings of aberrant functional connectivity can beinterpreted in terms of disrupted maturational processes (Fairet al., 2010), an interpretation that was also made in the con-text of functional connectivity differences in children with autism(Di Martino et al., 2011) or Tourette syndrome (Church et al.,2009). The developmental interpretation is based on observa-tions that with maturation local connectivity (i.e., close to theseed region) decreases while long-range connectivity increases(Fair et al., 2008, 2009; Kelly et al., 2009). Similarly, we observedincreased local frontal operculum connectivity and decreasedlong-range connectivity (e.g., left thalamus – lingual gyrus con-nectivity was absent in children with ADHD relative to TDC).In addition, as shown in Figure 6, we also observed significanteffects of diagnosis in inferior frontal gyrus, anterior cingu-late cortex, left dorsolateral prefrontal cortex, and insula. These
www.frontiersin.org January 2012 | Volume 2 | Article 83 | 11
Mennes et al. RSFC correlates of inhibitory control in ADHD
regions are known to be actively involved in higher order cogni-tive control operations (Koechlin et al., 2003; Brass et al., 2005;Badre and D’Esposito, 2007) and have been suggested to showdifferential activity in the context of ADHD (Burgess et al.,2010; Shaw et al., 2011; Spinelli et al., 2011). Interestingly, weobserved these regions while assessing functional connectivity ofseed ROI that were found to be related to inhibitory process-ing, which is in turn deemed an important aspect of cognitivecontrol.
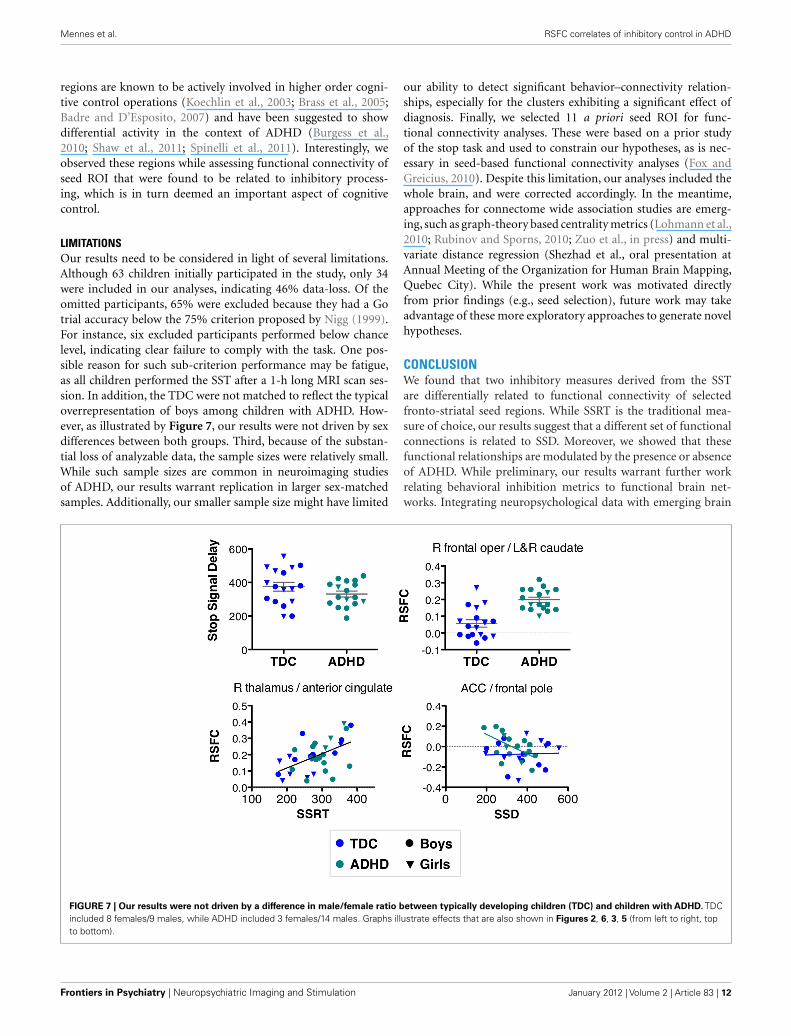
LIMITATIONSOur results need to be considered in light of several limitations.Although 63 children initially participated in the study, only 34were included in our analyses, indicating 46% data-loss. Of theomitted participants, 65% were excluded because they had a Gotrial accuracy below the 75% criterion proposed by Nigg (1999).For instance, six excluded participants performed below chancelevel, indicating clear failure to comply with the task. One pos-sible reason for such sub-criterion performance may be fatigue,as all children performed the SST after a 1-h long MRI scan ses-sion. In addition, the TDC were not matched to reflect the typicaloverrepresentation of boys among children with ADHD. How-ever, as illustrated by Figure 7, our results were not driven by sexdifferences between both groups. Third, because of the substan-tial loss of analyzable data, the sample sizes were relatively small.While such sample sizes are common in neuroimaging studiesof ADHD, our results warrant replication in larger sex-matchedsamples. Additionally, our smaller sample size might have limited
our ability to detect significant behavior–connectivity relation-ships, especially for the clusters exhibiting a significant effect ofdiagnosis. Finally, we selected 11 a priori seed ROI for func-tional connectivity analyses. These were based on a prior studyof the stop task and used to constrain our hypotheses, as is nec-essary in seed-based functional connectivity analyses (Fox andGreicius, 2010). Despite this limitation, our analyses included thewhole brain, and were corrected accordingly. In the meantime,approaches for connectome wide association studies are emerg-ing, such as graph-theory based centrality metrics (Lohmann et al.,2010; Rubinov and Sporns, 2010; Zuo et al., in press) and multi-variate distance regression (Shezhad et al., oral presentation atAnnual Meeting of the Organization for Human Brain Mapping,Quebec City). While the present work was motivated directlyfrom prior findings (e.g., seed selection), future work may takeadvantage of these more exploratory approaches to generate novelhypotheses.
CONCLUSIONWe found that two inhibitory measures derived from the SSTare differentially related to functional connectivity of selectedfronto-striatal seed regions. While SSRT is the traditional mea-sure of choice, our results suggest that a different set of functionalconnections is related to SSD. Moreover, we showed that thesefunctional relationships are modulated by the presence or absenceof ADHD. While preliminary, our results warrant further workrelating behavioral inhibition metrics to functional brain net-works. Integrating neuropsychological data with emerging brain
FIGURE 7 | Our results were not driven by a difference in male/female ratio between typically developing children (TDC) and children with ADHD. TDCincluded 8 females/9 males, while ADHD included 3 females/14 males. Graphs illustrate effects that are also shown in Figures 2, 6, 3, 5 (from left to right, topto bottom).
Frontiers in Psychiatry | Neuropsychiatric Imaging and Stimulation January 2012 | Volume 2 | Article 83 | 12
Mennes et al. RSFC correlates of inhibitory control in ADHD
dysconnectivity models of ADHD will ultimately advance ourunderstanding of the pathophysiology of this complex disorder.
ACKNOWLEDGMENTSThe authors thank all children and their parents for participat-ing in this study. We also thank Joel Nigg for providing the stopsignal task and Camille Chabernaud and Samuele Cortese forhelpful comments on earlier versions of this manuscript. Thisresearch was partially supported by Grants from National Institute
of Mental Health (R01MH083246 and K23MH087770), AutismSpeaks, the Stavros Niarchos Foundation, the Leon Levy Founda-tion, and the endowment provided by Phyllis Green and RandolphCowen. The funders had no role in study design, data collectionand analysis, decision to publish, or preparation of the manuscript.Dr. Castellanos serves on the DSM-5 Workgroup on Attention-Deficit Hyperactivity and Disruptive Behavior Disorders; the viewsexpressed in this paper are his own and do not represent those ofthe Workgroup or of the DSM-5 Task Force.
REFERENCESAlderson, R. M., Rapport, M. D., and
Kofler, M. J. (2007). Attention-deficit/hyperactivity disorder andbehavioral inhibition: a meta-analytic review of the stop-signalparadigm. J. Abnorm. Child. Psychol.35, 745–758.
Alderson, R. M., Rapport, M. D., Sarver,D. E., and Kofler, M. J. (2008).ADHD and behavioral inhibition:a re-examination of the stop-signaltask. J. Abnorm. Child. Psychol. 36,989–998.
Andersson, J. L. R., Jenkinson, M.,and Smith, S. M. (2007). TR07JA2:Non-linear Registration, AKA SpatialNormalisation. FMRIB AnalysisGroup Technical Reports. Avail-able at: http://www.fmrib.ox.ac.uk/analysis/techrep/
Aron, A. R., and Poldrack, R. A.(2005). The cognitive neuroscienceof response inhibition: relevancefor genetic research in attention-deficit/hyperactivity disorder. Biol.Psychiatry 57, 1285–1292.
Badre, D., and D’Esposito, M. (2007).Functional magnetic resonanceimaging evidence for a hierarchicalorganization of the prefrontalcortex. J. Cogn. Neurosci. 19,2082–2099.
Boehler, C. N., Appelbaum, L. G.,Krebs, R. M., Hopf, J. M., andWoldorff, M. G. (2010). Pinningdown response inhibition in thebrain – conjunction analyses ofthe stop-signal task. Neuroimage 52,1621–1632.
Brass, M., Derrfuss, J., Forstmann, B.,and Von Cramon, D. Y. (2005). Therole of the inferior frontal junc-tion area in cognitive control. TrendsCogn. Sci. (Regul. Ed.) 9, 314–316.
Burgess, G. C., Depue, B. E., Ruzic,L., Willcutt, E. G., Du, Y. P.,and Banich, M. T. (2010). Atten-tional control activation relatesto working memory in attention-deficit/hyperactivity disorder. Biol.Psychiatry 67, 632–640.
Castellanos, F. X., Margulies, D. S.,Kelly, C., Uddin, L. Q., Ghaffari, M.,Kirsch, A., Shaw, D., Shehzad, Z.,
Di Martino, A., Biswal, B., Sonuga-Barke, E. J., Rotrosen, J., Adler,L. A., and Milham, M. P. (2008).Cingulate-precuneus interactions: anew locus of dysfunction in adultattention-deficit/hyperactivity dis-order. Biol. Psychiatry 63, 332–337.
Castellanos, F. X., Sonuga-Barke, E. J.,Scheres, A., Di Martino, A., Hyde, C.,and Walters, J. R. (2005). Varietiesof attention-deficit/hyperactivitydisorder-related intra-individualvariability. Biol. Psychiatry 57,1416–1423.
Castellanos, F. X., Sonuga-Barke, E. J.S., Milham, M. P., and Tannock, R.(2006). Characterizing cognition inADHD: beyond executive dysfunc-tion. Trends Cogn. Sci. 10, 117–123.
Chabernaud, C., Mennes, M., Kelly,C., Nooner, K., Di Martino, A.,Castellanos, F. X., and Milham,M. P. (in press). Integration ofdimensional and categorical analy-ses of brain-behavior relation-ships in children with attention-deficit/hyperactivity disorder andhealthy controls. Biol. Psychiatry.doi: 10.1016/j.biopsych.2011.08.013
Church, J. A., Fair, D. A., Dosenbach,N. U., Cohen, A. L., Miezin, F.M., Petersen, S. E., and Schlaggar,B. L. (2009). Control networks inpaediatric Tourette syndrome showimmature and anomalous patternsof functional connectivity. Brain132, 225–238.
Conners, C. K., Sitarenios, G., Parker,J. D., and Epstein, J. N. (1998). Therevised Conners’ Parent Rating Scale(CPRS-R): factor structure, reliabil-ity, and criterion validity. J. Abnorm.Child. Psychol. 26, 257–268.
Cubillo, A., Halari, R., Ecker, C.,Giampietro, V., Taylor, E., andRubia, K. (2010). Reduced acti-vation and inter-regional func-tional connectivity of fronto-striatalnetworks in adults with child-hood attention-deficit hyperactiv-ity disorder (ADHD) and per-sisting symptoms during tasks ofmotor inhibition and cognitiveswitching. J. Psychiatr. Res. 44,629–639.
Di Martino, A., Kelly, C., Grzadzinski,R., Zuo, X. N., Mennes, M., Mairena,M. A., Lord, C., Castellanos, F. X.,and Milham, M. P. (2011). Aber-rant striatal functional connectiv-ity in children with autism. Biol.Psychiatry 69, 847–856.
Dickstein, S. G., Bannon, K., Castel-lanos, F. X., and Milham, M. P.(2006). The neural correlates ofattention deficit hyperactivity disor-der: an ALE meta-analysis. J. Child.Psychol. Psychiatry 47, 1051–1062.
Fair, D. A., Cohen, A. L., Dosenbach,N. U., Church, J. A., Miezin, F.M., Barch, D. M., Raichle, M. E.,Petersen, S. E., and Schlaggar, B.L. (2008). The maturing architec-ture of the brain’s default network.Proc. Natl. Acad. Sci. U.S.A. 105,4028–4032.
Fair, D. A., Cohen, A. L., Power, J.D., Dosenbach, N. U., Church, J.A., Miezin, F. M., Schlaggar, B. L.,and Petersen, S. E. (2009). Func-tional brain networks develop froma “local to distributed” organization.PLoS Comput. Biol. 5, e1000381.doi:10.1371/journal.pcbi.1000381
Fair, D. A., Posner, J., Nagel, B. J.,Bathula, D., Dias, T. G., Mills, K.L., Blythe, M. S., Giwa, A., Schmitt,C. F., and Nigg, J. T. (2010).Atypical default network connec-tivity in youth with attention-deficit/hyperactivity disorder. Biol.Psychiatry 68, 1084–1091.
Fox, M. D., and Greicius, M. (2010).Clinical applications of restingstate functional connectiv-ity. Front. Syst. Neurosci. 4:19.doi:10.3389/fnsys.2010.00019
Fox, M. D., Snyder, A. Z., Vincent, J. L.,Corbetta, M., Van Essen, D. C., andRaichle, M. E. (2005). The humanbrain is intrinsically organized intodynamic, anticorrelated functionalnetworks. Proc. Natl. Acad. Sci.U.S.A. 102, 9673–9678.
Jenkinson, M., Bannister, P. R., Brady,J. M., and Smith, S. M. (2002).Improved optimisation for therobust and accurate linear registra-tion and motion correction of brainimages. Neuroimage 17, 825–841.
Jenkinson, M., and Smith, S. M. (2001).A global optimisation methodfor robust affine registration ofbrain images. Med. Image Anal. 5,143–156.
Kaufman, J., Birmaher, B., Brent,D., Rao, U., Flynn, C., Moreci,P., Williamson, D., and Ryan, N.(1997). Schedule for affective disor-ders and schizophrenia for school-age children present and lifetimeversion (K-SADS-PL): initial reli-ability and validity data. J. Am.Acad. Child Adolesc. Psychiatry 36,980–988.
Kelly, A. M., Di Martino, A., Uddin, L.Q., Shehzad, Z., Gee, D. G., Reiss, P.T., Margulies, D. S., Castellanos, F.X., and Milham, M. P. (2009). Devel-opment of anterior cingulate func-tional connectivity from late child-hood to early adulthood. Cereb. Cor-tex 19, 640–657.
Kelly, A. M., Uddin, L. Q., Biswal, B.B., Castellanos, F. X., and Milham,M. P. (2008). Competition betweenfunctional brain networks mediatesbehavioral variability. Neuroimage39, 527–537.
Koechlin, E., Ody, C., and Kouneiher,F. (2003). The architecture of cogni-tive control in the human prefrontalcortex. Science 302, 1181–1185.
Konrad, K., Gauggel, S., Manz, A.,and Scholl, M. (2000). Inhibitorycontrol in children with traumaticbrain injury (TBI) and childrenwith attention deficit/hyperactivitydisorder (ADHD). Brain Inj. 14,859–875.
Kuntsi, J., Oosterlaan, J., and Steven-son, J. (2001). Psychologicalmechanisms in hyperactivity:I. Response inhibition deficit,working memory impairment,delay aversion, or something else?J. Child. Psychol. Psychiatry 42,199–210.
Lijffijt, M., Kenemans, J. L., Verbaten,M. N., and Van Engeland, H.(2005). A meta-analytic review ofstopping performance in attention-deficit/hyperactivity disorder: defi-cient inhibitory motor control? J.Abnorm. Psychol. 114, 216–222.
www.frontiersin.org January 2012 | Volume 2 | Article 83 | 13
Mennes et al. RSFC correlates of inhibitory control in ADHD
Liston, C., Cohen, M. M., Teslovich, T.,Levenson, D., and Casey, B. J. (2011).Atypical prefrontal connectivity inattention-deficit/hyperactivity dis-order: pathway to disease or patho-logical end point? Biol. Psychiatry 69,1168–1177.
Logan, G. D., Cowan, W. B., and Davis,K. A. (1984). On the ability to inhibitsimple and choice reaction timeresponses: a model and a method. J.Exp. Psychol. Hum. Percept. Perform.10, 276–291.
Logan, G. D., Schachar, R. J., and Tan-nock, R. (1997). Impulsivity andinhibitory control. Psychol. Sci. 8,60–64.
Lohmann, G., Margulies, D. S.,Horstmann, A., Pleger, B., Lep-sien, J., Goldhahn, D., Schloegl,H., Stumvoll, M., Villringer, A.,and Turner, R. (2010). Eigen-vector centrality mapping foranalyzing connectivity patternsin fMRI data of the humanbrain. PLoS ONE 5, e10232.doi:10.1371/journal.pone.0010232
Mennes, M., Kelly, C., Zuo, X. N.,Di Martino, A., Biswal, B., XavierCastellanos, F., and Milham, M.P. (2010). Inter-individual differ-ences in resting state functionalconnectivity predict task-inducedBOLD activity. Neuroimage 50,1690–1701.
Mennes, M., Stiers, P., Lagae, L., andVan Den Bergh, B. (2006). Long-term cognitive sequelae of antena-tal maternal anxiety: involvement ofthe orbitofrontal cortex. Neurosci.Biobehav. Rev. 30, 1078–1086.
Milham, M. P., and Banich, M.T. (2005). Anterior cingulate cor-tex: an fMRI analysis of conflictspecificity and functional differ-entiation. Hum. Brain Mapp. 25,328–335.
Nigg, J. T. (1999). The ADHD response-inhibition deficit as measured by thestop task: replication with DSM-IVcombined type, extension, and qual-ification. J. Abnorm. Child. Psychol.27, 393–402.
Nigg, J. T. (2001). Is ADHD a disin-hibitory disorder? Psychol. Bull. 127,571–598.
Nigg, J. T., Willcutt, E. G., Doyle,A. E., and Sonuga-Barke, E. J.(2005). Causal heterogeneity inattention-deficit/hyperactivity dis-order: do we need neuropsycholog-ically impaired subtypes? Biol. Psy-chiatry 57, 1224–1230.
Power, J. D., Barnes, K. A., Snyder, A. Z.,Schlaggar, B. L., and Petersen, S. E.(in press). Spurious but systematiccorrelations in functional connectiv-ity MRI networks arise from subjectmotion. Neuroimage. http://dx.doi.org/10.1016/j.neuroimage.2011.10.018
Rubia, K., Overmeyer, S., Taylor, E.,Brammer, M., Williams, S. C., Sim-mons, A., and Bullmore, E. T.(1999). Hypofrontality in attentiondeficit hyperactivity disorder dur-ing higher-order motor control: astudy with functional MRI. Am. J.Psychiatry 156, 891–896.
Rubia, K., Smith, A. B., Brammer, M.J., and Taylor, E. (2007). Tempo-ral lobe dysfunction in medication-naive boys with attention-deficit/hyperactivity disorder during atten-tion allocation and its relation toresponse variability. Biol. Psychiatry62, 999–1006.
Rubinov, M., and Sporns, O. (2010).Complex network measures ofbrain connectivity: uses andinterpretations. Neuroimage 52,1059–1069.
Shaw, P., Gilliam, M., Liverpool, M.,Weddle, C., Malek, M., Sharp, W.,
Greenstein, D., Evans, A., Rapoport,J., and Giedd, J. (2011). Corticaldevelopment in typically developingchildren with symptoms of hyperac-tivity and impulsivity: support for adimensional view of attention deficithyperactivity disorder. Am. J. Psychi-atry 168, 143–151.
Spinelli, S., Joel, S., Nelson, T. E., Vasa,R. A., Pekar, J. J., and Mostof-sky, S. H. (2011). Different neuralpatterns are associated with trialspreceding inhibitory errors in chil-dren with and without attention-deficit/hyperactivity disorder. J. Am.Acad. Child Adolesc. Psychiatry 50,705.e3–715.e3.
Stiers, P., Mennes, M., and Sunaert,S. (2010). Distributed task codingthroughout the multiple demandnetwork of the human frontal-insular cortex. Neuroimage 52,252–262.
Suskauer, S. J., Simmonds, D. J.,Fotedar, S., Blankner, J. G., Pekar,J. J., Denckla, M. B., and Mostof-sky, S. H. (2008). Functional mag-netic resonance imaging evidencefor abnormalities in response selec-tion in attention deficit hyperac-tivity disorder: differences in acti-vation associated with responseinhibition but not habitual motorresponse. J. Cogn. Neurosci. 20,478–493.
Tian, L., Jiang, T., Wang, Y., Zang, Y.,He, Y., Liang, M., Sui, M., Cao,Q., Hu, S., Peng, M., and Zhuo, Y.(2006). Altered resting-state func-tional connectivity patterns of ante-rior cingulate cortex in adolescentswith attention deficit hyperactiv-ity disorder. Neurosci. Lett. 400,39–43.
Van Dijk, K. R., Sabuncu, M. R., andBuckner, R. L. (2012). The influ-ence of head motion on intrinsic
functional connectivity MRI. Neu-roimage 59, 431–438.
Yarkoni, T., Poldrack, R. A., Nichols,T. E., Van Essen, D. C., and Wager,T. D. (2011). Large-scale automatedsynthesis of human functional neu-roimaging data. Nat. Methods 8,665–670.
Zuo, X., Ehmke, R., Mennes, M.,Imperati, D., Castellanos, F. X.,Sporns, O., and Milham, M. P.(in press). Network centrality andinformation flow in the humanbrain functional connectome. Cereb.Cortex. doi: 10.1093/cercor/bhr269
Conflict of Interest Statement: Theauthors declare that the research wasconducted in the absence of any com-mercial or financial relationships thatcould be construed as a potential con-flict of interest.
Received: 30 September 2011; accepted:28 December 2011; published online: 11January 2012.Citation: Mennes M, Vega Potler N,Kelly C, Di Martino A, CastellanosFX and Milham MP (2012) Rest-ing state functional connectivity cor-relates of inhibitory control in chil-dren with attention-deficit/hyperactivitydisorder. Front. Psychiatry 2:83. doi:10.3389/fpsyt.2011.00083This article was submitted to Frontiers inNeuropsychiatric Imaging and Stimula-tion, a specialty of Frontiers in Psychiatry.Copyright © 2012 Mennes, Vega Potler,Kelly, Di Martino, Castellanos and Mil-ham. This is an open-access article dis-tributed under the terms of the Cre-ative Commons Attribution Non Com-mercial License, which permits non-commercial use, distribution, and repro-duction in other forums, provided theoriginal authors and source are credited.
Frontiers in Psychiatry | Neuropsychiatric Imaging and Stimulation January 2012 | Volume 2 | Article 83 | 14
Mennes et al. RSFC correlates of inhibitory control in ADHD
APPENDIXAs described in Van Dijk et al. (2012) and Power et al. (in press),micromovements that occur during a resting state fMRI scan, cansignificantly influence measures and results derived from this scan.One suggestion to deal with such movements involves removingtimepoints that exceed a threshold for excessive movement fromthe resting state time series before calculating any derived mea-sures, this procedure is referred to as “scrubbing” (Power et al.,in press). While easily adoptable for task-based fMRI scans, moreresearch is needed to assess the effect of removing timepoints fromanalyses that investigate frequency measures or that focus on a cer-tain frequency in the BOLD signal, as is the case for resting statefunctional connectivity.
The participants included in our manuscript exhibited limitedmovement during their resting state scan. Yet, here we presentour main results while comparing analyses based on the originaldata versus analyses based on data after scrubbing timepoints con-taminated with micromovements exceeding 0.5 mm framewisedisplacement (see Power et al., in press, for details).
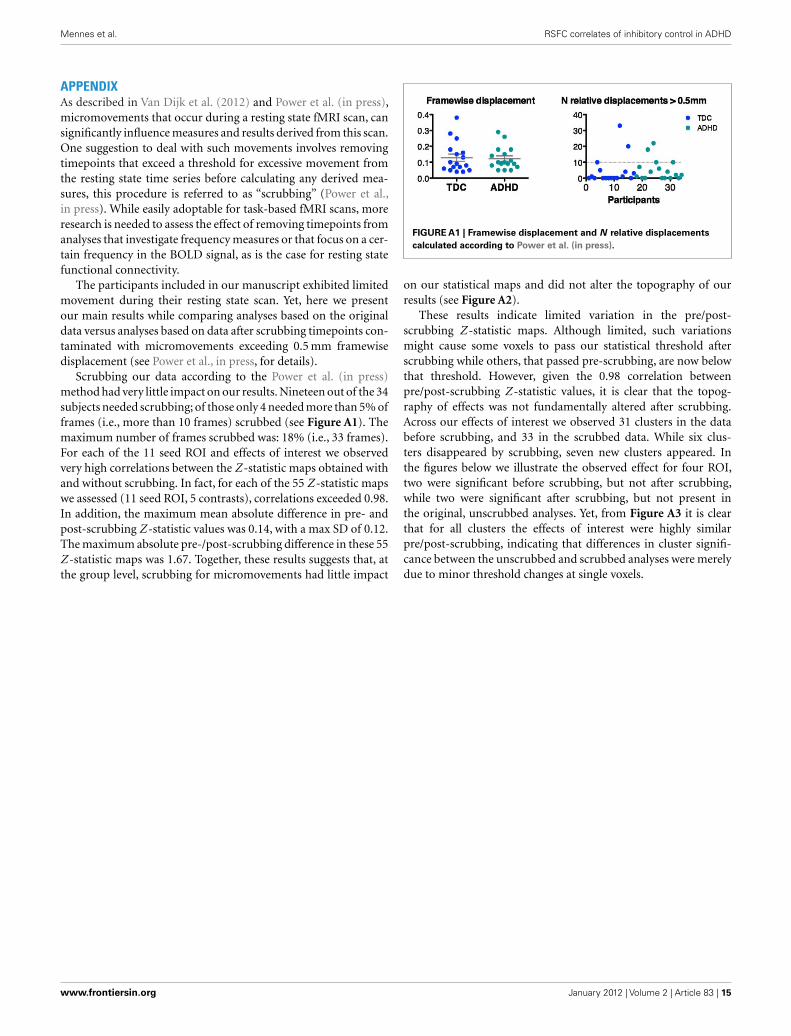
Scrubbing our data according to the Power et al. (in press)method had very little impact on our results. Nineteen out of the 34subjects needed scrubbing; of those only 4 needed more than 5% offrames (i.e., more than 10 frames) scrubbed (see Figure A1). Themaximum number of frames scrubbed was: 18% (i.e., 33 frames).For each of the 11 seed ROI and effects of interest we observedvery high correlations between the Z -statistic maps obtained withand without scrubbing. In fact, for each of the 55 Z -statistic mapswe assessed (11 seed ROI, 5 contrasts), correlations exceeded 0.98.In addition, the maximum mean absolute difference in pre- andpost-scrubbing Z -statistic values was 0.14, with a max SD of 0.12.The maximum absolute pre-/post-scrubbing difference in these 55Z -statistic maps was 1.67. Together, these results suggests that, atthe group level, scrubbing for micromovements had little impact
FIGURE A1 | Framewise displacement and N relative displacements
calculated according to Power et al. (in press).
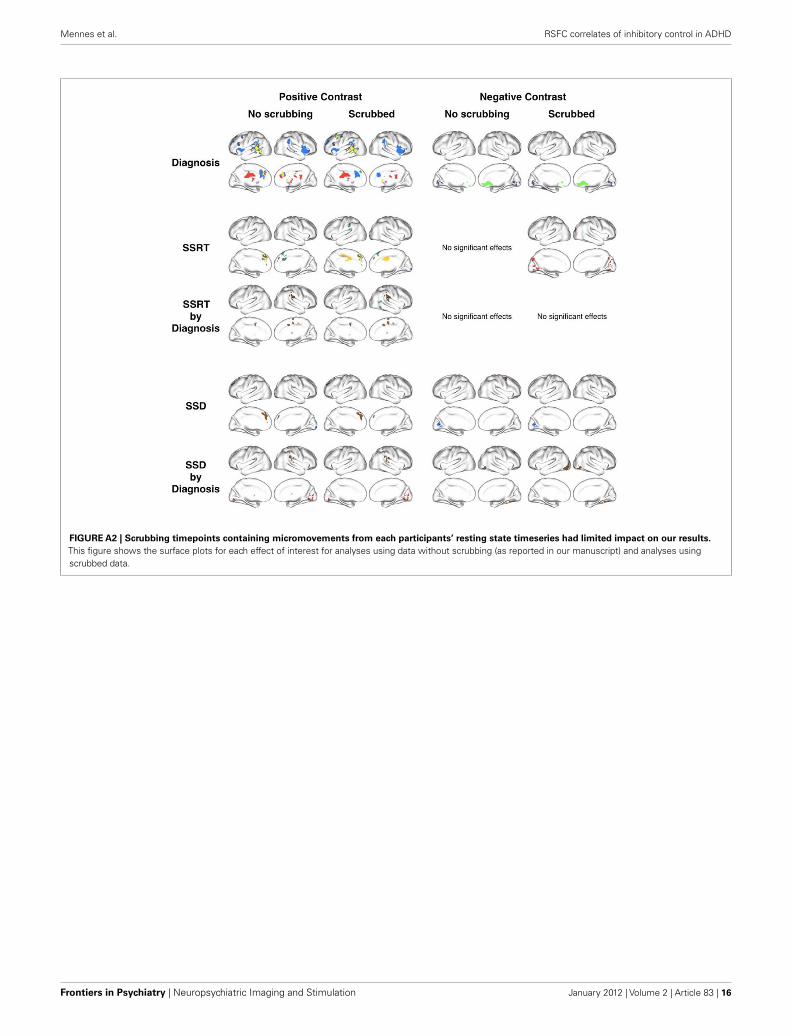
on our statistical maps and did not alter the topography of ourresults (see Figure A2).
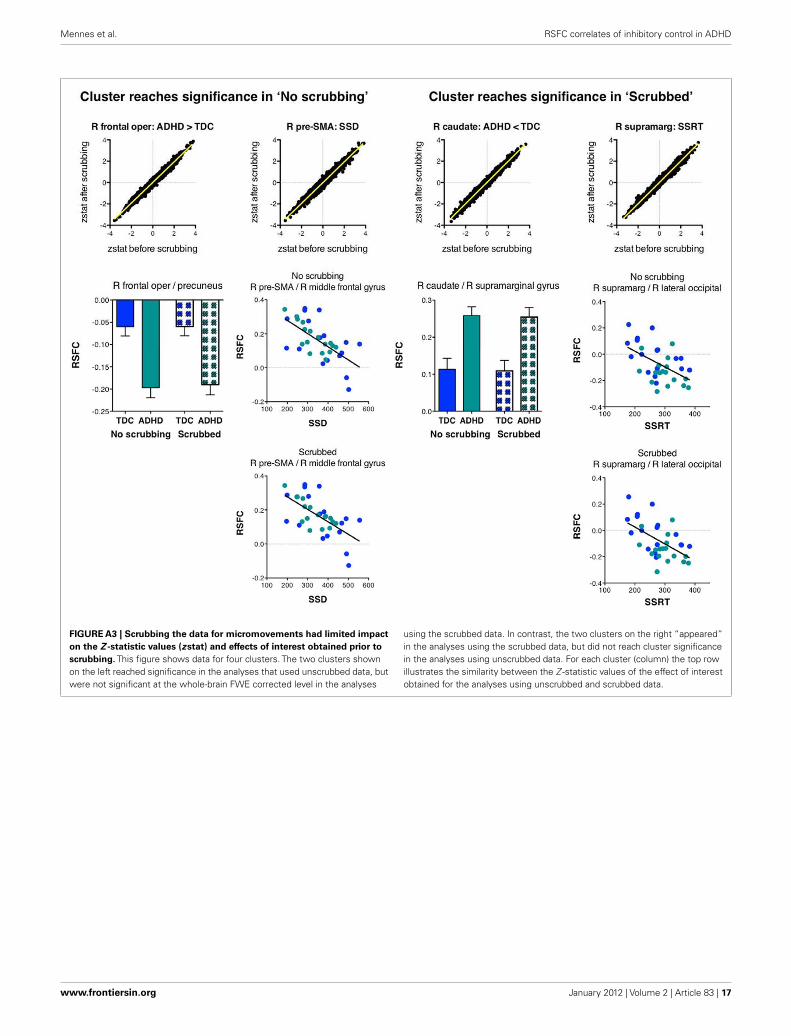
These results indicate limited variation in the pre/post-scrubbing Z -statistic maps. Although limited, such variationsmight cause some voxels to pass our statistical threshold afterscrubbing while others, that passed pre-scrubbing, are now belowthat threshold. However, given the 0.98 correlation betweenpre/post-scrubbing Z -statistic values, it is clear that the topog-raphy of effects was not fundamentally altered after scrubbing.Across our effects of interest we observed 31 clusters in the databefore scrubbing, and 33 in the scrubbed data. While six clus-ters disappeared by scrubbing, seven new clusters appeared. Inthe figures below we illustrate the observed effect for four ROI,two were significant before scrubbing, but not after scrubbing,while two were significant after scrubbing, but not present inthe original, unscrubbed analyses. Yet, from Figure A3 it is clearthat for all clusters the effects of interest were highly similarpre/post-scrubbing, indicating that differences in cluster signifi-cance between the unscrubbed and scrubbed analyses were merelydue to minor threshold changes at single voxels.
www.frontiersin.org January 2012 | Volume 2 | Article 83 | 15
Mennes et al. RSFC correlates of inhibitory control in ADHD
FIGURE A2 | Scrubbing timepoints containing micromovements from each participants’ resting state timeseries had limited impact on our results.
This figure shows the surface plots for each effect of interest for analyses using data without scrubbing (as reported in our manuscript) and analyses usingscrubbed data.
Frontiers in Psychiatry | Neuropsychiatric Imaging and Stimulation January 2012 | Volume 2 | Article 83 | 16
Mennes et al. RSFC correlates of inhibitory control in ADHD
FIGURE A3 | Scrubbing the data for micromovements had limited impact
on the Z -statistic values (zstat) and effects of interest obtained prior to
scrubbing. This figure shows data for four clusters. The two clusters shownon the left reached significance in the analyses that used unscrubbed data, butwere not significant at the whole-brain FWE corrected level in the analyses
using the scrubbed data. In contrast, the two clusters on the right “appeared”in the analyses using the scrubbed data, but did not reach cluster significancein the analyses using unscrubbed data. For each cluster (column) the top rowillustrates the similarity between the Z -statistic values of the effect of interestobtained for the analyses using unscrubbed and scrubbed data.
www.frontiersin.org January 2012 | Volume 2 | Article 83 | 17
Related Documents