Low resting metabolic rate is associated with greater lifespan because of a confounding effect of body fatness Luiza C. Duarte & John R. Speakman Received: 11 August 2014 /Accepted: 5 November 2014 # The Author(s) 2014. This article is published with open access at Springerlink.com Abstract A negative association between resting meta- bolic rate (RMR) and lifespan is the cornerstone of the rate of living and free-radical damage theories of aging. Em- pirical studies supporting a negative association of RMR to lifespan may arise from the correlation between RMR and both daily energy expenditure (DEE) and thermoregulato- ry activity energy expenditure (TAEE). We screened 540 female mice for higher and lower DEE and measured RMR in the resulting 324 (60 %). We then selected 92 mice in which there was no link between residual from the regression of RMR against body mass (BM) and residual of DEE against BM to separate the effects of these traits. Lifespan was not significantly related to body mass, DEE and TAEE, but significantly negatively related to RMR. Fat-free mass (FFM) and fat mass (FM) were both signif- icantly positively related to RMR. After removing the effect of FFM on RMR, the association between RMR and lifespan remained significantly negative; however, after statistically removing the effect of FM on RMR, the significant association between RMR and lifespan disap- peared. We conclude that the negative association between RMR and lifespan is primarily due to the effect of FM, with FM positively related to both RMR and mortality and hence RMR negatively to lifespan. In 40 additional screened mice, greater FM was also associated with greater oxidative damage to DNA. Keywords Metabolic rate . Lifespan . Body composition . Fat mass . Oxidative damage . Mice Introduction The idea that there is a negative relationship between the resting metabolic rate (RMR) and lifespan is at least 100 years old and probably originated with Rubner who observed in 1908 that larger, longer lived animals had lower metabolic rates—and in particular that the product of their metabolism (per gram) and lifespan was essentially constant (Rubner 1908). These data formed a cornerstone of the rate of living theory (Pearl 1928) and later the free- radical damage theory (Beckman and Ames 1998) of aging, both of which proposed that high rates of metabo- lism are detrimental to longevity. The free-radical damage theory suggests that this is because high metabolic rates lead to greater oxidative stress. Among ectotherms, the association receives strong support. Reducing body tem- perature, which lowers metabolism, increases lifespan (Van Voorhies and Ward 1999). Among endotherms, how- ever, the data are more confusing. For example, it was AGE (2014) 36:9731 DOI 10.1007/s11357-014-9731-3 Electronic supplementary material The online version of this article (doi:10.1007/s11357-014-9731-3) contains supplementary material, which is available to authorized users. L. C. Duarte (*) : J. R. Speakman (*) Institute of Biological and Environmental Sciences, University of Aberdeen, Aberdeen, Scotland AB24 2TZ, UK e-mail: [email protected] e-mail: [email protected] J. R. Speakman Institute of Genetics and Developmental Biology, Chinese Academy of Sciences, 1 West Beichen Road, Chaoyang, Beijing, People’ s Republic of China

Welcome message from author
This document is posted to help you gain knowledge. Please leave a comment to let me know what you think about it! Share it to your friends and learn new things together.
Transcript
Low resting metabolic rate is associated with greater lifespanbecause of a confounding effect of body fatness
Luiza C. Duarte & John R. Speakman
Received: 11 August 2014 /Accepted: 5 November 2014# The Author(s) 2014. This article is published with open access at Springerlink.com
Abstract A negative association between resting meta-bolic rate (RMR) and lifespan is the cornerstone of the rateof living and free-radical damage theories of aging. Em-pirical studies supporting a negative association of RMR tolifespan may arise from the correlation between RMR andboth daily energy expenditure (DEE) and thermoregulato-ry activity energy expenditure (TAEE). We screened 540female mice for higher and lower DEE and measuredRMR in the resulting 324 (60 %). We then selected 92mice in which there was no link between residual from theregression of RMR against body mass (BM) and residualof DEE against BM to separate the effects of these traits.Lifespan was not significantly related to body mass, DEEand TAEE, but significantly negatively related to RMR.Fat-free mass (FFM) and fat mass (FM) were both signif-icantly positively related to RMR. After removing theeffect of FFM on RMR, the association between RMRand lifespan remained significantly negative; however,
after statistically removing the effect of FM on RMR, thesignificant association between RMR and lifespan disap-peared. We conclude that the negative association betweenRMR and lifespan is primarily due to the effect of FM,with FM positively related to both RMR andmortality andhence RMR negatively to lifespan. In 40 additionalscreenedmice, greater FMwas also associatedwith greateroxidative damage to DNA.
Keywords Metabolic rate . Lifespan . Bodycomposition . Fat mass . Oxidative damage .Mice
Introduction
The idea that there is a negative relationship between theresting metabolic rate (RMR) and lifespan is at least100 years old and probably originated with Rubner whoobserved in 1908 that larger, longer lived animals hadlower metabolic rates—and in particular that the productof their metabolism (per gram) and lifespanwas essentiallyconstant (Rubner 1908). These data formed a cornerstoneof the rate of living theory (Pearl 1928) and later the free-radical damage theory (Beckman and Ames 1998) ofaging, both of which proposed that high rates of metabo-lism are detrimental to longevity. The free-radical damagetheory suggests that this is because high metabolic rateslead to greater oxidative stress. Among ectotherms, theassociation receives strong support. Reducing body tem-perature, which lowers metabolism, increases lifespan(Van Voorhies andWard 1999). Among endotherms, how-ever, the data are more confusing. For example, it was
AGE (2014) 36:9731DOI 10.1007/s11357-014-9731-3
Electronic supplementary material The online version of thisarticle (doi:10.1007/s11357-014-9731-3) contains supplementarymaterial, which is available to authorized users.
L. C. Duarte (*) : J. R. Speakman (*)Institute of Biological and Environmental Sciences,University of Aberdeen,Aberdeen, Scotland AB24 2TZ, UKe-mail: [email protected]: [email protected]
J. R. SpeakmanInstitute of Genetics and Developmental Biology,Chinese Academy of Sciences,1 West Beichen Road, Chaoyang, Beijing, People’s Republicof China
widely believed that the effect of caloric restriction (CR) onlifespan might be traced to lowering of mass-adjustedmetabolic rate. However, after a transient initial response,CR does not necessarily lead to reduced metabolic rate(Mccarter et al. 1985; Ramsey andHagopian 2006; Ramanet al. 2007; Selman et al. 2005; Speakman and Mitchell2011). More recent analyses of the inter-specific relation-ship of mass-adjusted RMR to lifespan, based on substan-tially more data thanwere available to Rubner, suggest thatthere is no association of lifespan to resting metabolismonce the confounding effects of body size are taken intoaccount (Speakman 2005). Moreover, comparisons acrossmajor classes reveal a positive association. Birds, for ex-ample, combine exceptional longevity relative to mam-mals with elevated resting metabolic rates (Holmes andAustad 1994; Holmes et al. 2001; Furness and Speakman2008) and exceptional resistance to oxidative stress (Barjaet al. 1994; Ogburn et al. 2001); bats also combine highmetabolic rates with long lifespans, while marsupialswhich have generally lower resting metabolic rates thanthe eutherian mammals also generally live shorter lives(Austad and Fischer 1991). Within species, it has beenshown in mice (strain MF1) that those with higher meta-bolic rates live longer (Speakman et al. 2004). In addition,experimental elevations of metabolism in rodents by forc-ing them to exercise, or exposing them to cold, do notproduce the anticipated reductions in lifespan (Selmanet al. 2008; Holloszy 1993; Vaanholt et al. 2010). Despitethis weight of evidence against the link between restingmetabolic rate and lifespan, there are observations thatsupport such an association. In particular, it was recentlyobserved that high basal metabolic rate in the Baltimorelongitudinal study of aging based on over 3000 individualswas a risk factor for increased mortality (Ruggiero et al.2008; Schrack et al. 2014). Similar results were observedin Pima Indians (Jumpertz et al. 2011), and responses toCR in humans appear to include sustained reductions inRMR (Redman et al. 2009;Weyer et al. 2000;Martin et al.2007). Finally, elevated RMR has been linked to greateroxidative DNA damage across rat strains that differ inlongevity (Greenberg et al. 2000).
One problem with diagnosing the effects of RMR onlifespan is that RMR is typically associated with otherfeatures of energy balance. For example, in our previousstudy of the effects of metabolism on lifespan in mice(Speakman et al. 2004), themice that lived longest not onlyhad elevated resting metabolism but also increased totalmetabolism and increased expenditure on physical activity.While we also observed increased levels of mitochondrial
proton leak linked to activation of UCP3 and ANT consis-tent with the “uncoupling to survive” hypothesis (Brand2000), it remains possible that the longer lifespan of thesemice was a consequence of their elevated expenditure onphysical activity. Moreover, in free-living humans, the po-tential links between metabolism and personality (Careauet al. 2008) may mean individuals with greater RMRengage in more risky health-related behaviours (for exam-ple, most individuals in the study of Pima Indians died fromalcohol-related incidents; Jumpertz et al. 2011).
Evaluating the independent effects of RMR onlifespan is difficult because RMR cannot be experimen-tally manipulated independent of the other componentsof energy expenditure. For example, giving animalsthyroxine experimentally elevates RMR, but it alsoleads to greater food intake and physical activity. Toevaluate the effects of RMR on lifespan independent ofthese other factors, we used a different approach. Thisapproach involved measuring a large number of animalsfor the relevant parameters and then choosing a subset ofthese animals where the correlations between the traitsin question are not significant. We chose the outbredMF1 strain because of the known prior associationbetween metabolism and lifespan in this strain(Speakman et al. 2004) and our extensive prior knowl-edge of the features of its energy balance. By examiningthe relationship between RMR and longevity in thisspecial subset of animals, we could be certain that anyeffect of RMR had not come about because of correlatedeffects of the other metabolic components.
The selection procedure was as follows (more detailsare available on the electronic supplementary materials).We screened an initial population of 540 individuallyhoused MF1 mice aged 10 weeks for daily food intakeas a proxy for daily energy expenditure (DEE) (see“Materials and methods”) and retained 60 % (n=324)of these for further screening of RMR. This initialscreening involved plotting DEE against body massand fitting a linear regression to the data using the leastsquares fit procedure.We then calculated the residuals tothe fitted regression line and selected for inclusion thoseindividuals with the highest and lowest residuals (topand bottom 30 %). Both variables were tested for nor-mality using the Kolmogorov–Smirnov test prior tofitting the regression model, and the generated residualsand the plotted data were examined for any indication ofnon-linearity that might invalidate making a linear fit.Because a fitted regression is most strongly influencedby the data that are in close proximity to the regression
9731, Page 2 of 11 AGE (2014) 36:9731
line, eliminating 40% of data that sat closest to the fittedregression line reduced the significance of the relation-ship between DEE and body mass. This proceduretherefore reduced the covariance due to body massdifferences between the individuals, which is a majorfactor influencingmetabolic rates and food intake. In theselected 324 individuals, we measured the RMR basedon measurements of oxygen consumption in thethermoneutral zone using indirect calorimetry (for de-tails, see Supplementary material and methods). Forthese individuals, we used the same procedure describedabove for food intake to remove the effect of body masson RMR by plotting RMR against body mass (BM). Wefitted a least squares regression to these data and thencalculated the residual RMRs, retaining the 25 %highest and 25% lowest residual RMRs. For this sample(n=162), we plotted the residual RMR (to body mass)against the residual DEE (to body mass) and fitted aregression to the data. We sequentially eliminated 30more individuals from this regression until it was nolonger anywhere near to significance (P>0.1). In total,we eliminated 192 individuals in this process. Weretained a total of 132 individuals in which there wasno association between residual RMR and the residualDEE estimated from the food intake. In this manner, wecould then explore the association between RMR andlifespan uncontaminated by the covariance effects ofRMR with both DEE and BM. We calculated the differ-ence between RMR and DEE and called this the ther-moregulatory and activity energy expenditure (TAEE).In 40 of these animals, we sought associations betweenenergetic measures and measures of oxidative stress,while the remaining 92 were used in lifespan studies.There was a significant repeatability of body mass,RMR and residual RMR when comparisons were madebetween measurements at the screening age of 10 weeksand when they were 9–11 months old (Duarte et al.2010). Association analyses were performed using datafor animals at the older age for both longevity andassays of damage/protection experiments.
Materials and methods
All experiments were authorised by a local ethical re-view committee and carried out under UK Home Officeregulations. All animals were maintained in specificpathogen-free facilities monitored using sentinel ani-mals analysed at regular intervals. During the study,
we had sporadic records of mouse parvovirus and Kleb-siella sp. in the sentinels, but not from the rooms wherethese animals were kept.
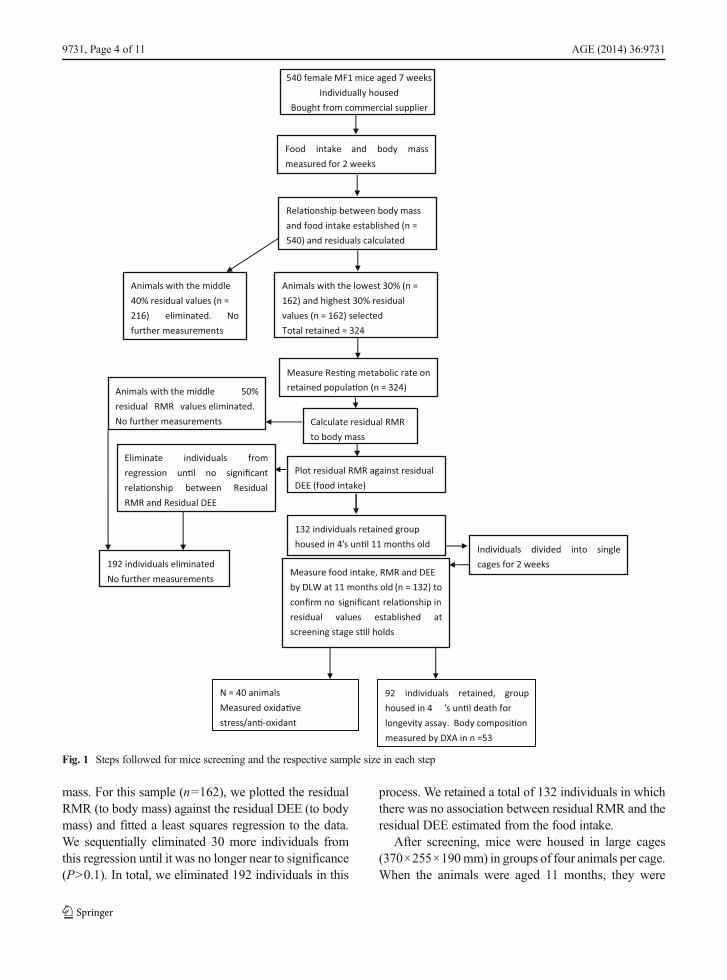
Our aim in this workwas to screen a large population ofmice for aspects of their energy balance and then selectfrom this population a subset where the covariances be-tween components of balance were not significant. Theoverall selection process is summarised by the flow dia-gram in Fig. 1 (detailed material and methods available aselectronic supplementary material—ESM).
A total of 540 virgin female mice (Mus musculus L.:outbred strain MF1) were purchased from Harlan UKLtd., Oxon, UK, at 7 weeks of age, in six separatebatches. After 1 week of acclimation, they were housedindividually in shoebox cages (440×120×130 mm)with sawdust and paper bedding. The lights were main-tained on a 12:12-L/D photoperiod (lights on at0700 hours), and the ambient temperature was regulatedat 21±1 °C. Animals received pellet rodent food [CRM(P), Special Diet Services, BP Nutrition, UK] and waterad libitum. After the acclimation period, we estimatedthe total DEE by measuring food intake over a 2-weekperiod at 8–10 weeks of age. DEE and BM (per batch)were tested for normality using Kolmogorov–Smirnovtests and were both found to be normally distributed.Estimated DEE from food intake was positively relatedto bodymass for each batch. Analysis of the distributionof residuals in relation to BM and visual inspection ofthe plot did not indicate the relationship to be non-linear.To minimise the influence of body mass effects, weselected 60 % of the individuals (n=324) that had thehighest 30 % and lowest 30 % residual intakes relativeto the regression of intake on body mass. We eliminatedthe animals with the central 40 % residual values (n=216). In the selected 324 individuals, we measured theRMR based on measurements of oxygen consumptionin the thermoneutral zone using indirect calorimetry (fordetails, see Supplementary material and methods). Forthese individuals, we used the same procedure describedabove for food intake to remove the effect of body masson RMR. That is, we tested both variables for normalityusing Kolmogorov–Smirnov tests, plotted the variablesagainst each other and fitted a least squares linear re-gression. Visual inspection of the plot and analysis ofthe residuals in relation to BM revealed no indication ofnon-linearity in the data. We then eliminated the middle50 % of the data with the smallest residual values, i.e.retaining the 25 % highest and 25 % lowest residualRMRs from the relationship between RMR and body
AGE (2014) 36:9731 Page 3 of 11, 9731
mass. For this sample (n=162), we plotted the residualRMR (to body mass) against the residual DEE (to bodymass) and fitted a least squares regression to the data.We sequentially eliminated 30 more individuals fromthis regression until it was no longer near to significance(P>0.1). In total, we eliminated 192 individuals in this
process. We retained a total of 132 individuals in whichthere was no association between residual RMR and theresidual DEE estimated from the food intake.
After screening, mice were housed in large cages(370×255×190mm) in groups of four animals per cage.When the animals were aged 11 months, they were
540 female MF1 mice aged 7 weeksIndividually housed
Bought from commercial supplier
F boand intake ood mass dy measured for 2 weeks
Rela�onship between body mass and food intake established (n =
and residuals calculated540)
Animals with the lowest 30% (n = 162) and highest 30% residual values (n = 162) selectedTotal retained = 324
Animals with the middle % residual values (n = 40
216) eliminated. No further measurements
Measure Res�ng metabolic rate on retained popula�on (n = 324)
Calculate residual RMRto body mass
Plot residual RMR against residual DEE (food intake)
132 individuals retained group housed in 4’s un�l 11 months old
Eliminate from individuals significant un�l regression no
rela�onship between Residual RMR and Residual DEE
192 individuals eliminatedNo further measurements
Individuals single into divided cages for 2 weeks
Measure food intake, RMR and DEE by DLW at 11 months old (n = 132) to confirm no significant rela�onship in residual values established at screening stage s�ll holds
N = 40 animalsMeasured oxida�ve stress/an�-oxidant
group retained, individuals 92housed in 4 ’s un�l death for longevity assay. Body composi�on measured by DXA in n =53
Animals with the middle 50% residual RMR values eliminated. No further measurements
Fig. 1 Steps followed for mice screening and the respective sample size in each step
9731, Page 4 of 11 AGE (2014) 36:9731
transferred to individual cages (440×120×130mm) andkept for 2 weeks for acclimation. They then had theirindividual food intake, RMR and DEE measured usingthe doubly labelled water technique. We performedthese measurements to confirm that there was still norelationship between the traits that had been used toselect them when they had been aged around 4 months.In addition, we used an independent measure of dailyenergy expenditure (doubly labelled water) because ofthe known potential problems with equating food intakeand total daily energy expenditure. Food intake andrespirometry measurements were performed in the sameway as described for the screening stage. Ninety two ofthese individuals were subsequently involved in a lon-gevity screen and were kept in groups of four animalsper large cage. When animals died, the groups werejoined to form new groups of four to ensure that lifespanwas not correlated with group size. The remaining 40animals were used in laboratory assays for measure-ments of oxidative stress and antioxidant protection.
This process of selection generates a subset of ani-mals where there was no relationship between the resid-ual RMR and the residual DEE at the age of about4 months, which was confirmed when the animals were11 months old using an independent method to measurethe DEE. There was similarly no relationship at this agebetween RMR and TAEE. This selection process wasthe major strength of the current study because ituniquely allowed us to diagnose the effect of RMR onlongevity uncontaminated by the covariance of RMRwith either total DEE or TAEE.
Body composition measurements
All animals used for laboratory assays on aging markers(n=40) and a subsample of 53 animals kept for longev-ity had their body composition measured using dual-energy X-ray absorptiometry DXA instruments GE(previously Lunar) PIXImus2 Series Densitometersinstalled with software version 1.46.007 (GE MedicalSystems Ultrasound and BMD, Bedford, UK). DXAscans and analyses were carried out as instructed bythe manufacturer. Mice were weighed and thenanaesthetised by 3.5 % isoflurane (NetTech, UK) inha-lation for the duration of the X-ray scanning (~3 min).Lunar PIXIMUS 2.10 software was used to calculatetotal lean mass, total fat mass, total bone mineral densityand total bone mineral content in the region of interest(defined as the subcranial body, as recommended by the
manufacturer) using a previously described protocol(Johnston et al. 2005). DXA measures the fat mass(FM) component. Fat-free mass (FFM) was obtainedby subtracting FM from body mass. We called fatnessthe residual obtained by the regression of FM againstbody mass.
Statistical analysis
For statistical analysis, we usedMinitab 15 and SPSS 19software. Avalue of P<0.05 was considered statisticallysignificant. We tested all the variables for normalitybefore performing parametric tests using the Kolmogo-rov–Smirnov test. We detected associations betweenvariables using least squares linear regression analyses.Linearity was confirmed in the relationships by plottingthe residuals against the predictor variables and by vi-sual inspection of the plots. We also analysed the datafor significant outliers using Cook’s distance but did notdetect any data with undue influence that might warrantelimination. We tested differences in lifespan betweengroups using t tests, and Kaplan–Meier mortality curveswere constructed to evaluate differences in mortality,determined using the log-rank test. Associations be-tween measures of oxidative stress, body compositionand energy expenditure parameters were evaluatedusing correlation. The significance level for these testswas adjusted to account for multiple testing using theBonferroni procedure.
Results
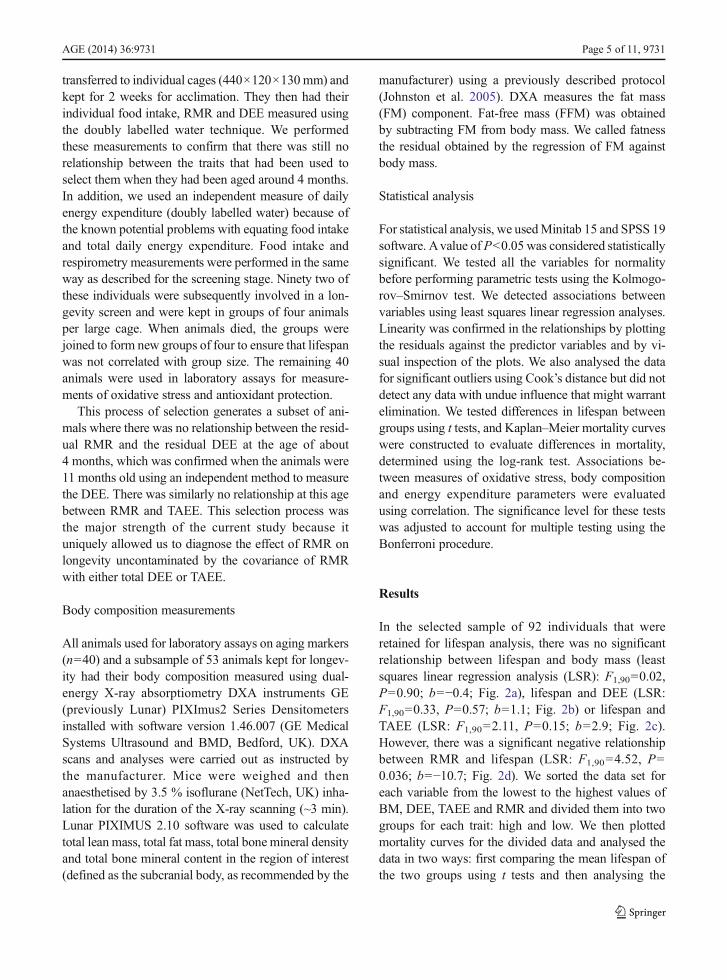
In the selected sample of 92 individuals that wereretained for lifespan analysis, there was no significantrelationship between lifespan and body mass (leastsquares linear regression analysis (LSR): F1,90=0.02,P=0.90; b=−0.4; Fig. 2a), lifespan and DEE (LSR:F1,90=0.33, P=0.57; b=1.1; Fig. 2b) or lifespan andTAEE (LSR: F1,90=2.11, P=0.15; b=2.9; Fig. 2c).However, there was a significant negative relationshipbetween RMR and lifespan (LSR: F1,90=4.52, P=0.036; b=−10.7; Fig. 2d). We sorted the data set foreach variable from the lowest to the highest values ofBM, DEE, TAEE and RMR and divided them into twogroups for each trait: high and low. We then plottedmortality curves for the divided data and analysed thedata in two ways: first comparing the mean lifespan ofthe two groups using t tests and then analysing the
AGE (2014) 36:9731 Page 5 of 11, 9731
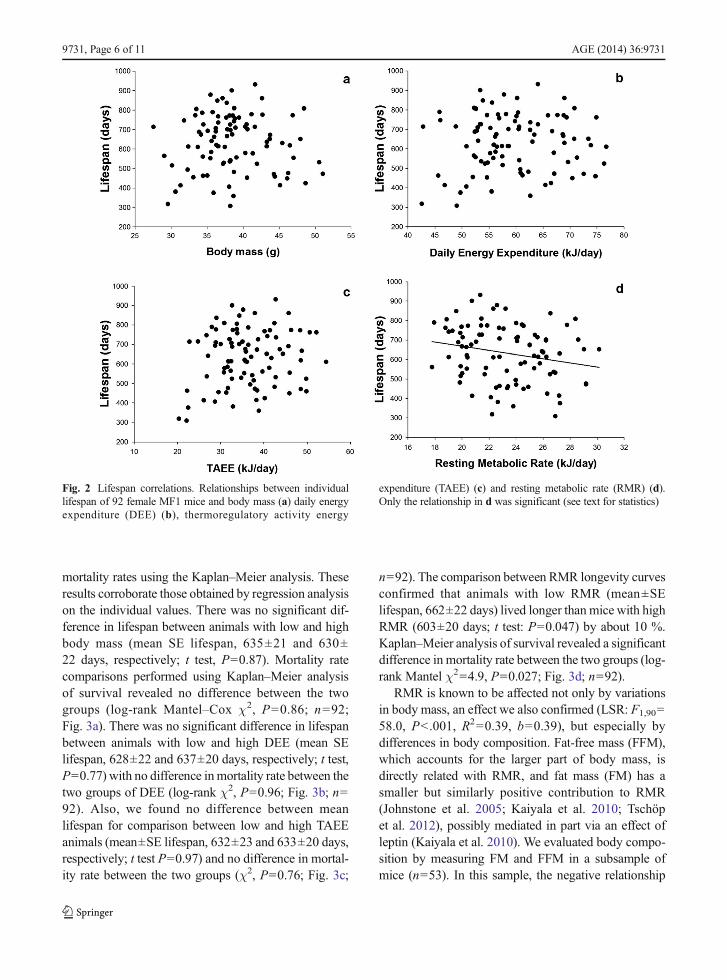
mortality rates using the Kaplan–Meier analysis. Theseresults corroborate those obtained by regression analysison the individual values. There was no significant dif-ference in lifespan between animals with low and highbody mass (mean SE lifespan, 635±21 and 630±22 days, respectively; t test, P=0.87). Mortality ratecomparisons performed using Kaplan–Meier analysisof survival revealed no difference between the twogroups (log-rank Mantel–Cox χ2, P=0.86; n=92;Fig. 3a). There was no significant difference in lifespanbetween animals with low and high DEE (mean SElifespan, 628±22 and 637±20 days, respectively; t test,P=0.77) with no difference inmortality rate between thetwo groups of DEE (log-rank χ2, P=0.96; Fig. 3b; n=92). Also, we found no difference between meanlifespan for comparison between low and high TAEEanimals (mean±SE lifespan, 632±23 and 633±20 days,respectively; t test P=0.97) and no difference in mortal-ity rate between the two groups (χ2, P=0.76; Fig. 3c;
n=92). The comparison between RMR longevity curvesconfirmed that animals with low RMR (mean±SElifespan, 662±22 days) lived longer than mice with highRMR (603±20 days; t test: P=0.047) by about 10 %.Kaplan–Meier analysis of survival revealed a significantdifference in mortality rate between the two groups (log-rank Mantel χ2=4.9, P=0.027; Fig. 3d; n=92).
RMR is known to be affected not only by variationsin body mass, an effect we also confirmed (LSR: F1,90=58.0, P<.001, R2=0.39, b=0.39), but especially bydifferences in body composition. Fat-free mass (FFM),which accounts for the larger part of body mass, isdirectly related with RMR, and fat mass (FM) has asmaller but similarly positive contribution to RMR(Johnstone et al. 2005; Kaiyala et al. 2010; Tschöpet al. 2012), possibly mediated in part via an effect ofleptin (Kaiyala et al. 2010). We evaluated body compo-sition by measuring FM and FFM in a subsample ofmice (n=53). In this sample, the negative relationship
Fig. 2 Lifespan correlations. Relationships between individuallifespan of 92 female MF1 mice and body mass (a) daily energyexpenditure (DEE) (b), thermoregulatory activity energy
expenditure (TAEE) (c) and resting metabolic rate (RMR) (d).Only the relationship in d was significant (see text for statistics)
9731, Page 6 of 11 AGE (2014) 36:9731
between lifespan and RMR was confirmed (LSR:F1,51=6.3, P=0.015; R
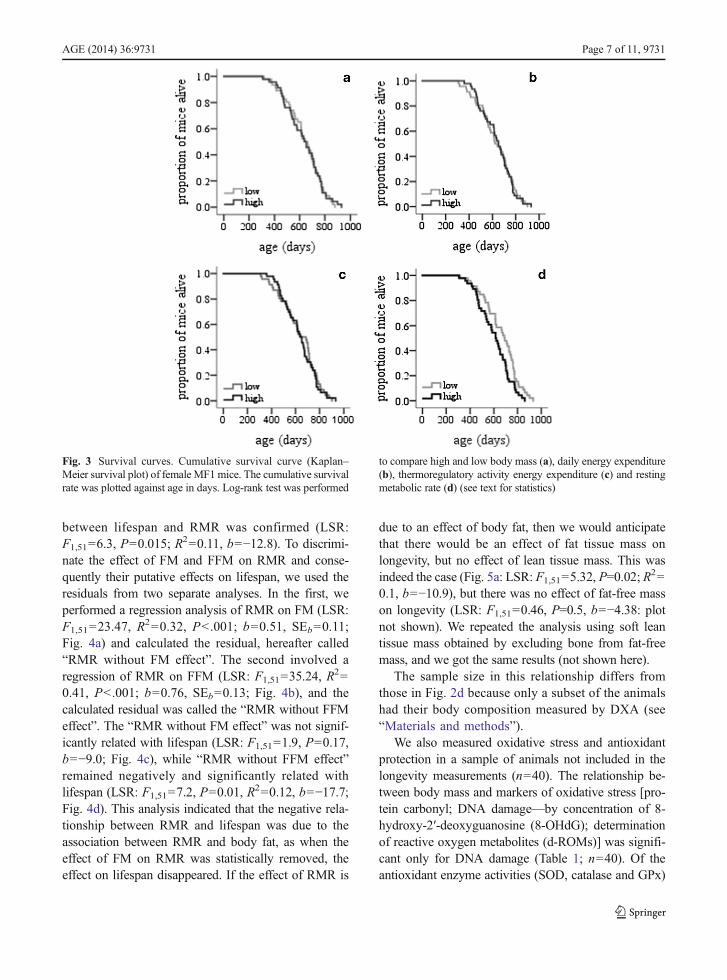
2=0.11, b=−12.8). To discrimi-nate the effect of FM and FFM on RMR and conse-quently their putative effects on lifespan, we used theresiduals from two separate analyses. In the first, weperformed a regression analysis of RMR on FM (LSR:F1,51=23.47, R
2=0.32, P<.001; b=0.51, SEb=0.11;Fig. 4a) and calculated the residual, hereafter called“RMR without FM effect”. The second involved aregression of RMR on FFM (LSR: F1,51=35.24, R
2=0.41, P<.001; b=0.76, SEb=0.13; Fig. 4b), and thecalculated residual was called the “RMR without FFMeffect”. The “RMR without FM effect” was not signif-icantly related with lifespan (LSR: F1,51=1.9, P=0.17,b=−9.0; Fig. 4c), while “RMR without FFM effect”remained negatively and significantly related withlifespan (LSR: F1,51=7.2, P=0.01, R
2=0.12, b=−17.7;Fig. 4d). This analysis indicated that the negative rela-tionship between RMR and lifespan was due to theassociation between RMR and body fat, as when theeffect of FM on RMR was statistically removed, theeffect on lifespan disappeared. If the effect of RMR is
due to an effect of body fat, then we would anticipatethat there would be an effect of fat tissue mass onlongevity, but no effect of lean tissue mass. This wasindeed the case (Fig. 5a: LSR: F1,51=5.32, P=0.02; R
2=0.1, b=−10.9), but there was no effect of fat-free masson longevity (LSR: F1,51=0.46, P=0.5, b=−4.38: plotnot shown). We repeated the analysis using soft leantissue mass obtained by excluding bone from fat-freemass, and we got the same results (not shown here).
The sample size in this relationship differs fromthose in Fig. 2d because only a subset of the animalshad their body composition measured by DXA (see“Materials and methods”).
We also measured oxidative stress and antioxidantprotection in a sample of animals not included in thelongevity measurements (n=40). The relationship be-tween body mass and markers of oxidative stress [pro-tein carbonyl; DNA damage—by concentration of 8-hydroxy-2′-deoxyguanosine (8-OHdG); determinationof reactive oxygen metabolites (d-ROMs)] was signifi-cant only for DNA damage (Table 1; n=40). Of theantioxidant enzyme activities (SOD, catalase and GPx)
Fig. 3 Survival curves. Cumulative survival curve (Kaplan–Meier survival plot) of female MF1mice. The cumulative survivalrate was plotted against age in days. Log-rank test was performed
to compare high and low body mass (a), daily energy expenditure(b), thermoregulatory activity energy expenditure (c) and restingmetabolic rate (d) (see text for statistics)
AGE (2014) 36:9731 Page 7 of 11, 9731
Fig. 4 Effect of fat mass and fat-free mass on resting metabolicrate (RMR) and lifespan. Relationships between resting metabolicrate and FM (a) and FFM (b) were both significant. The respectiveresiduals from these regression analyses resulted in the residual
resting metabolic rate with no fat mass effect, which was notcorrelated with lifespan (c) and the residual resting metabolic ratewith no fat-free mass effect which was significantly correlatedwith lifespan (d) (see text for details (n=53))
Table 1 Pearson correlation and P values for anti-oxidant barriers and oxidative stress. Glutathione peroxidase (GPx); superoxide dismutase(SOD); protein carbonyls (p.carbonyls); determination of Reactive Oxygen Metabolites (d-ROMs); OXYAdsorbent Test (OXY)
Body mass P Residual RMR P Residual DEE P Residual fat P
GPxa –0.33 0.039* 0.08 0.63 0.03 0.86 0.25 0.11
SODa –0.26 0.10 –0.03 0.85 –0.08 0.63 0.10 0.52
Catalasea –0.01 0.97 –0.01 0.96 –0.04 0.82 –0.15 0.33
OXYa –0.09 0.57 0.06 0.72 –0.14 0.40 0.08 0.59
d-ROMSb 0.41 0.009** –0.06 0.69 –0.02 0.9 –0.04 0.79
p. carbonylb –0.27 0.08 0.04 0.82 –0.02 0.9 0.12 0.45
DNA damageb –0.51 0.001** 0.04 0.80 0.17 0.31 0.37 0.02*
a Antioxidant barriersb Oxidative stress*P<0.05
**P<0.01
9731, Page 8 of 11 AGE (2014) 36:9731
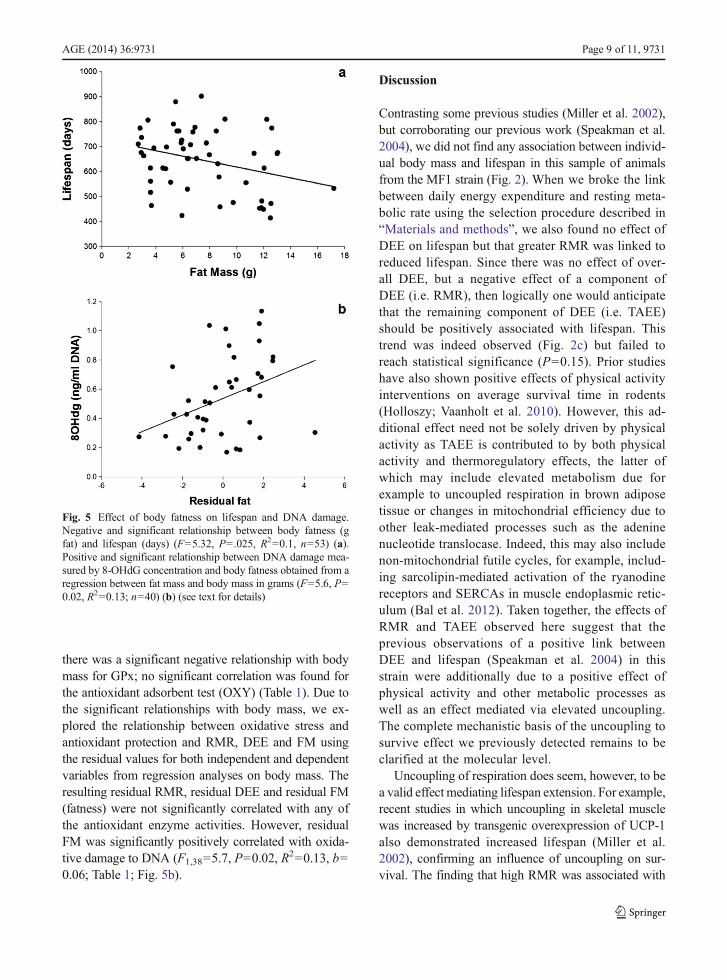
there was a significant negative relationship with bodymass for GPx; no significant correlation was found forthe antioxidant adsorbent test (OXY) (Table 1). Due tothe significant relationships with body mass, we ex-plored the relationship between oxidative stress andantioxidant protection and RMR, DEE and FM usingthe residual values for both independent and dependentvariables from regression analyses on body mass. Theresulting residual RMR, residual DEE and residual FM(fatness) were not significantly correlated with any ofthe antioxidant enzyme activities. However, residualFM was significantly positively correlated with oxida-tive damage to DNA (F1,38=5.7, P=0.02, R
2=0.13, b=0.06; Table 1; Fig. 5b).
Discussion
Contrasting some previous studies (Miller et al. 2002),but corroborating our previous work (Speakman et al.2004), we did not find any association between individ-ual body mass and lifespan in this sample of animalsfrom the MF1 strain (Fig. 2). When we broke the linkbetween daily energy expenditure and resting meta-bolic rate using the selection procedure described in“Materials and methods”, we also found no effect ofDEE on lifespan but that greater RMR was linked toreduced lifespan. Since there was no effect of over-all DEE, but a negative effect of a component ofDEE (i.e. RMR), then logically one would anticipatethat the remaining component of DEE (i.e. TAEE)should be positively associated with lifespan. Thistrend was indeed observed (Fig. 2c) but failed toreach statistical significance (P=0.15). Prior studieshave also shown positive effects of physical activityinterventions on average survival time in rodents(Holloszy; Vaanholt et al. 2010). However, this ad-ditional effect need not be solely driven by physicalactivity as TAEE is contributed to by both physicalactivity and thermoregulatory effects, the latter ofwhich may include elevated metabolism due forexample to uncoupled respiration in brown adiposetissue or changes in mitochondrial efficiency due toother leak-mediated processes such as the adeninenucleotide translocase. Indeed, this may also includenon-mitochondrial futile cycles, for example, includ-ing sarcolipin-mediated activation of the ryanodinereceptors and SERCAs in muscle endoplasmic retic-ulum (Bal et al. 2012). Taken together, the effects ofRMR and TAEE observed here suggest that theprevious observations of a positive link betweenDEE and lifespan (Speakman et al. 2004) in thisstrain were additionally due to a positive effect ofphysical activity and other metabolic processes aswell as an effect mediated via elevated uncoupling.The complete mechanistic basis of the uncoupling tosurvive effect we previously detected remains to beclarified at the molecular level.
Uncoupling of respiration does seem, however, to bea valid effect mediating lifespan extension. For example,recent studies in which uncoupling in skeletal musclewas increased by transgenic overexpression of UCP-1also demonstrated increased lifespan (Miller et al.2002), confirming an influence of uncoupling on sur-vival. The finding that high RMR was associated with
Fig. 5 Effect of body fatness on lifespan and DNA damage.Negative and significant relationship between body fatness (gfat) and lifespan (days) (F=5.32, P=.025, R2=0.1, n=53) (a).Positive and significant relationship between DNA damage mea-sured by 8-OHdG concentration and body fatness obtained from aregression between fat mass and body mass in grams (F=5.6, P=0.02, R2=0.13; n=40) (b) (see text for details)
AGE (2014) 36:9731 Page 9 of 11, 9731
shortened lifespan is consistent with the suggestion fromboth the rate of living and free-radical theories of agingthat higher metabolism is detrimental (Pearl 1928;Beckman and Ames 1998) and consistent with recentstudies in humans that linked low RMR to greaterlifespan (Ruggiero et al. 2008; Schrack et al. 2014;Jumpertz et al. 2011). Measures of body fat, however,were unavailable in one of the studies of humans(Ruggiero et al. 2008); the method for normalisingmetabolic rate that was employed (using predicted sur-face areas) may poorly correct for body compositioneffects for the other study (Jumpertz et al. 2011), andfor the third one, body composition was weakly estimat-ed as it was assessed by measurement from one leg(Schrack et al. 2014). When normalising for the effectsof FFM and FM removed the significance of the asso-ciation between mortality risk and 24 h EE (Jumpertzet al. 2011), a marginally significant effect of RMR stillremained. That the variation in lifespan explained by“RMR without FFM effect” was only 12 % is notsurprising, considering a multi-factorial variable likelifespan, which is dependent on the complex biologicalphenomenon of aging. Although our data point thefinger at fat mass as causing the relationship betweenRMR and lifespan, it is important to recognise that thisinference was based on the correlation analyses illustrat-ed in Fig. 4 and that FM and FFM are correlated. Usingcorrelations in this context can be difficult because theassumption that the predictor variables are independentis violated. Nevertheless, our data clearly implicate FMmore than they do FFM. Studies breaking the linkbetween FM and FFM like what we have done to breakthe link of RMR to DEE would be ideally performed toconfirm this inference.
The positive association of RMR to body fat is wellestablished in both humans (Johnstone et al. 2005,Wouters-Adriaens et al. 2007; Wouters-Adriaens andWesterterp 2008) and mice (Kaiyala, et al. 2010). More-over, the negative effects of fatness on health are simi-larly well known, particularly in humans (Yusuf et al.2005), and appear to act via multiple mechanisms in-cluding disrupted insulin signalling (Gabriely et al.2002) and glucose homeostasis and potentially linkedto modulations of oxidative stress which were alsoconfirmed in our study, consistent with previous dataassociating RMR with elevated oxidative damage(Greenberg et al. 2000). The exact molecular mecha-nisms mediating these effects remain uncertain, butadipose tissue is well established to produce a range of
hormones (adipokines including leptin, adiponectin andinterleukins) that may mediate negative (or positive)impacts elsewhere in the body. Both enhanced insulinresistance and alterations in oxidative stress would pro-vide tangible mechanistic links to aging and lifespanbased on our existing knowledge. Moreover, reducedbody fatness has been implicated as a major contributo-ry factor to the benefits of CR (Speakman and Mitchell2011; Liao et al. 2011). Thus, a negative link betweenRMR and lifespan mediated via effects of fatness isconsistent with a wide range of previous data and sup-ports the suggestions that variations in metabolism perse are not causally linked with the process of aging—contradicting both the rate of living theory and the free-radical theory of aging.
Acknowledgments This work was funded by the Biotechnolo-gy and Biological Sciences Research Council (BBSRC) grant BB/C516228/1 to J.R.S. We thank Jackie Duncan and Sarah Johnstonfor helping with DNA protocol assays and Lobke Vaanholt forhelping with antioxidant enzyme protocols. We are grateful to thestaff of the animal house for the care of our animals and to PaulaRedman and Peter Thomson who provided technical support forthe DLW assays.
Open Access This article is distributed under the terms of theCreative Commons Attribution License which permits any use,distribution, and reproduction in any medium, provided the orig-inal author(s) and the source are credited.
References
Austad SN, Fischer KE (1991) Mammalian aging, metabolism,and ecology: evidence from the bats and marsupials. JGerontol 46:B47–B55
Bal NC et al (2012) Sarcolipin is a newly identified regulator ofmuscle-based thermogenesis in mammals. Nature Med18(10):1575–1579
Barja G, Cadenas S, Rojas C, Perez-Campo R, Lopez-Torres M(1994) Low mitochondrial free radical production per unit O2
consumption can explain the simultaneous presence of highlongevity and aerobic metabolic rate in birds. Free Radic Res21(5):317–328
Beckman KB, Ames BN (1998) The free radical theory of agingmatures. Physio Rev 78(2):547–581
Martin CK et al (2007) Effect of calorie restriction on restingmetabolic rate and spontaneous physical activity. Obesity15(12):2964–2973
Brand MD (2000) Uncoupling to survive? The role of mitochon-drial inefficiency in ageing. Exp Gerontol 35:811–820
Careau V, Thomas D, Humphries MM, Réale D (2008) Energymetabolism and animal personality. Oikos 117:641–653
9731, Page 10 of 11 AGE (2014) 36:9731
Duarte LC, Vaanholt LM, Gamo Y, Sinclair RE, Speakman JR(2010) Limits to sustained energy intake XII: is the poorrelation between resting metabolic rate and reproductiveperformance because resting metabolism is not a repeatabletrait? J Exp Biol 213:278–287
Furness LJ, Speakman JR (2008) Energetics and longevity inbirds. Age 30:75–87
Gabriely I et al (2002) Removal of visceral fat prevents insulinresistance and glucose intolerance of aging. Diabetes 51:2951–2958
Greenberg JA, Wei HC, Ward K, Boozer CN (2000) Whole-bodymetabolic rate appears to determine the rate of DNA oxida-tive damage and glycation involved in aging. Mech AgeingDev 115:107–117
Holmes DJ, Austad SN (1994) Fly now die later correlates ofgliding and flying mammals. J Mammal 75:224–226
Holloszy JO (1993) Exercise increases average longevity of fe-male rats despite increased food intake and no growth retar-dation. J Gerontol 48(3):B97–B100
Holmes J, Fluckiger R, Austad SN (2001) Comparative biology ofaging in birds: an update. Exp Geront 36:869–883
Johnston SL, PeacockWL, Bell LM, LonchamptM, Speakman JR(2005) PIXImus DXAwith different software needs individ-ual calibration to accurately predict fat mass. Obes Res 13:1558–1565
Johnstone AM, Murison SD, Duncan JS, Rance KA, SpeakmanJR (2005) Factors influencing variation in basal metabolicrate include fat-free mass, fat mass, age, and circulatingthyroxine but not sex, circulating leptin, or triiodothyronine.Am J Clin Nutr 82:941–948
Jumpertz R et al (2011) Higher energy expenditure in humanspredicts natural mortality. J Clin Endo Metab 96:E972–E976
Kaiyala KJ et al (2010) Identification of body fat mass as a majordeterminant of metabolic rate in mice. Diabetes 59:1657–1666
Liao CY et al (2011) Fat maintenance is a predictor of themurine lifespan response to dietary restriction. Aging Cell10:629–639
Mccarter R,Masoro E J, Yu BP (1985) Does food restriction retardaging by reducing the metabolic rate? Am. J Physiol 248:E488–490. Rubner, M (1908) Das Problem der Lebensdaurund seiner beziehunger zum Wachstum und Ernarnhung.Oldenberg, Munich
Miller RA, Harper JM, Galecki A, Burke DT (2002) Big mice dieyoung: early life body weight predicts longevity in genetical-ly heterogeneous mice. Aging Cell 1:22–29
Ogburn CE et al (2001) Exceptional cellular resistance to oxidativedamage in long-lived birds requires active gene expression. JGerontol A Biol Sci Med Sci 56A(11):B468–B474
Pearl R (1928) The rate of living. University of London Press,London
Raman A et al (2007) Influences of calorie restriction and age onenergy expenditure in the rhesus monkey. Am J PhysiolEndocrinol Metab 292:E101–E106
Ramsey JJ, Hagopian K (2006) Energy expenditure and restrictionof energy intake: could energy restriction alter energy expen-diture in companion animals? J Nutr 136:1958S–1966S
Redman LM et al (2009) Metabolic and behavioral compensationsin response to caloric restriction: implications for the main-tenance of weight loss. Plos One 4(2):e4377
Ruggiero C et al (2008) High basal metabolic rate is a risk factorfor mortality: the Baltimore Longitudinal Study of Ageing. JGerontol (A Med Sci) 63A(7):698–706
Schrack JA, Knuth ND, Simonsick EM, Ferrucci L (2014)“IDEAL” aging is associated with lower resting metabolicrate: the Baltimore Longitudinal Study of Aging. J AmGeriatr Soc 62:667–672
Selman C, McLaren JS, Collins AR, Duthie GG, Speakman JR(2008) The impact of experimentally elevated energy expen-diture on oxidative stress and lifespan in the short-tailed fieldvole Microtus agrestis. Proc R Soc B 275:1907–1916
Selman C et al (2005) Energy expenditure of calorically restrictedrats is higher than predicted from their altered body compo-sition. Mech Ageing Dev 126:783–793
Speakman JR et al (2004) Uncoupled and surviving: individualmice with high metabolism have greater mitochondrialuncoupling and live longer. Aging Cell 3:87–95
Speakman JR (2005) Body size, energymetabolism and lifespan. JExp Biol 208:1717–1730
Speakman JR,Mitchell SE (2011) Caloric restriction.Mol AspectsMed 32:159–221
Tschöp MH et al (2012) A guide to analysis of mouse energymetabolism. Nat Methods 9(1):57–63
Vaanholt LM, Daan S, Garland T, Visser GH (2010) Metabolism,body composition and longevity in mice exercising at differ-ent intensities. Physiol Biochem Zool 83(2):239–251
Van Voorhies WA, Ward S (1999) Genetic and environmentalconditions that increase longevity in Caenorhabditis elegansdecrease metabolic rate papers in C. elegans. Elegans ProcNatl Acad Sci USA 96:11399–11403
Weyer C et al (2000) Energy metabolism after 2 y of energy restric-tion: the Biosphere 2 Experiment. Am J Clin Nutr 72:946–953
Wouters-Adriaens MPE, Huey FO, Westerterp KR (2007) Racedifferences in basal metabolic rate among Asians andCaucasians can be attributed by differences in body compo-sition. Int J Obes 31:S83
Wouters-Adriaens MPE, Westerterp KR (2008) Low resting ener-gy expenditure in Asians can be attributed to body composi-tion. Obesity 16(10):2212–2216
Yusuf S et al (2005) Obesity and the risk of myocardial infarctionin 27 000 participants from 52 countries: a case-control study.Lancet 366:1640–1649
AGE (2014) 36:9731 Page 11 of 11, 9731
Related Documents