
Welcome message from author
This document is posted to help you gain knowledge. Please leave a comment to let me know what you think about it! Share it to your friends and learn new things together.
Transcript

NSFG Survey Methodology Working Papers
Responsive Survey Design, Demographic Data Collection, and Models of Demographic Behavior
William G. Axinn University of Michigan
Cynthia F. Link
University of Michigan
Robert M. Groves University of Michigan
NSFG Survey Methodology Working Papers, No. 09-005
October 2009 Direct correspondence to William G. Axinn, Institute for Social Research, 426 Thompson St., Ann Arbor, Michigan, 48016, email: [email protected]. An earlier version of this paper was presented at the annual meetings of the Population Association of America, April 30, 2009.

Responsive Survey Design, Demographic Data Collection, and Models of Demographic Behavior 2
ABSTRACT
Declining response rates have led survey methodologists to explore innovative ways to
use process data (“paradata”) to address nonresponse by altering the survey design.
We introduce and explain the concept of responsive design – the suite of tools created
to use paradata to improve the representative qualities of surveys. By improving
representation of reluctant respondents, responsive design can also change our
understanding of substantive issues studied by demographers. Using the National
Survey of Family Growth Cycle 6 we illustrate how responsive survey design can
improve both demographic estimates and models of demographic behaviors based on
survey data. By juxtaposing measures from regular and responsive data collection
phases, we document characteristics of the general population that are systematically
under-represented in surveys not taking special effort to interview reluctant
respondents. Using multivariate models already established in the literature and based
on NSFG data, we demonstrate how respondents recruited through responsive survey
design produce different model estimates than those recruited during regular data
collection. Results demonstrate the wide potential of responsive survey design to
improve the quality of science in demographic research based on survey data.
Methodologically, the results also provide one of the first evaluations of substantive
consequences of implementing responsive design.

Responsive Survey Design, Demographic Data Collection, and Models of Demographic Behavior 3
INTRODUCTION
The sample survey has been a fundamental building block of demographic
research throughout the history of the discipline. Many of the field’s key advances in
both empirical evidence and theoretical reasoning are founded on information from
surveys. But even as sophistication of both survey measurement and survey analysis
dramatically advances, the general population’s growing reluctance to participate in
surveys poses an enormous threat to the field. This problem is greatest in relatively
rich countries of Europe and North America, but it is growing across the world. The
problem has been documented in detail (Groves and Couper 1998), but demographers’
standards for acceptable survey response rates continue to drop, and social scientists
devote increasing effort to the study of the consequences of nonresponse for the
substantive issues they investigate. In the midst of growing awareness of a looming
scientific crisis, data collection methodologists have pioneered innovative approaches
for using newly available data collection technologies to address the nonresponse
problem. Together these approaches are termed “responsive survey design” and they
can be used to simultaneously improve survey representation of reluctant respondents
and control costs of data collection. Here we describe the application of responsive
survey design to a key demographic survey in the United States – the National Survey
of Family Growth. Using the NSFG example, we demonstrate how responsive survey
design can be used to improve both demographic estimates and models of
demographic behaviors based on survey data.
Computerization of the survey data collection process was the essential
technological shift that allows responsive design to be used. Though “paper and pencil”
data collection continues to be used in some rural parts of the world, “computer-
assisted personal interviewing” or CAPI is now used by the majority of the world’s
demographic survey data collections. Use of computer software for questionnaires
promoted data collection instruments that could be more easily tailored to
respondents’ unique circumstances or previous responses and also allowed for
dynamic error detection during field work and more rapid release of data in electronic
form. All of these are desirable in the creation of new demographic data. But

Responsive Survey Design, Demographic Data Collection, and Models of Demographic Behavior 4
computerization also provided the means for the creation of survey “paradata”, or data
about the data collection process itself (Couper 1998). Now, paradata from CAPI data
collection, combined with internet technologies that allow paradata to flow from
decentralized data collection staff to centralized management, provide the means to
centrally manage responsive survey designs in large scale demographic surveys.
The National Survey of Family Growth (NSFG) Cycle 6 (2002-03) featured CAPI
interviewing, collection and analysis of paradata, and responsive design on a large
scale. The study involved more than 12,500 personal interviews collected nationwide
by a staff of more than 300 interviewers. Specifically, the study was designed in
multiple phases – a main phase, designed following protocols established before data
collection began, and a responsive phase, designed explicitly to use analyses of
paradata to direct changes of protocol targeted to improve representation of reluctant
respondents (Groves et al. 2005). By juxtaposing measures from these two data
collection phases, we are able to document characteristics of the general population
that are systematically under-represented in surveys that do not take special effort to
interview reluctant respondents. Then, using models established in previous research
based on NSFG data, we are able to demonstrate how respondents recruited during the
responsive phase produce different results, indicating that the addition of reluctant
respondents through responsive survey design may change what we learn from
demographic models based on survey data. Together this body of evidence shows how
responsive survey design provides a new methodological tool to improve the quality of
science in demographic research based on survey data. The evidence also provides one
of the first wide ranging evaluations of the substantive consequences of implementing
responsive design methods. We close by describing the recent evolution of responsive
survey design and discussing the wide potential of these techniques to improve
demographic data collection.

Responsive Survey Design, Demographic Data Collection, and Models of Demographic Behavior 5
KEY BUILDING BLOCKS OF RESPONSIVE DESIGN
The dynamic nature of modern societies presents survey researchers with
increased uncertainty about the performance of their survey design, increased effort
required to obtain interviews, and thus increased costs of data collection (de Leeuw
and de Heer 2002; Groves and Couper 1998). The development of computer-assisted
methods of data collection has provided survey researchers with tools to capture a
variety of process data or “paradata” about the data collection process (Couper 1998;
Hapuarachchi et al. 1997; Scheuren 2001). Paradata can be used to change the design
during the course of data collection, in efforts to achieve response rate targets or lower
survey errors and costs. The responsive use of paradata to modify the design during
the field period has been labeled “responsive design” (Groves and Heeringa 2006).
Of course clear evidence that data collection outcomes can be altered through
intervention is an important prerequisite for the implementation of responsive design.
There is a consensus from decades of survey methodological research that survey
participation is enhanced by repeated calls on sample households (Goyder 1985),
lengthened data collection periods and interviewer workloads permitting those calls
(Botman and Thornberry 1992), prenotification of the survey request through advance
letters (Traugott, Groves and Lepkowski 1987), use of incentives (Singer 2002),
reduced interview burden (Goyder 1985), interviewer behavior customized to the
concerns of the householder (Groves and Couper 1998), and alternative modes of data
collection. These, among others, are the tools that a survey researcher can employ to
intervene into survey data collection to achieve more desirable distributions of
respondent attributes. Therefore these tools form a key building block of responsive
design – the parameter researchers can change in response to analyses of paradata.
Because each of these tools is also directly associated with a cost, paradata
driven responsive design can be used to maximize the effectiveness of these tools
while controlling costs. Fundamentally all survey design options involve cost-error
tradeoffs (Groves 1989). Without cost limitation we might use the maximum level of
each of the tools described above in every data collection. In fact, were resources
limitless and cost no longer a constraint, social scientists might take a census

Responsive Survey Design, Demographic Data Collection, and Models of Demographic Behavior 6
(interview everyone rather than a sample survey of people) regardless of the topic they
wish to study. There are many different forms of potential survey error, including
sampling error, non-response error, or measurement error (Groves 1987). Once cost
constraints are introduced, researchers are faced with tradeoffs between costs of data
collection and control of these sources of error (Groves 1989). Responsive design uses
paradata to systematically intervene to maximize these tradeoffs in ways that can be
both documented and replicated (Groves and Heeringa 2006). The systematic
application of responsive design is an important advance over the ad hoc application of
these tools during data collection.
THEORY AND PROCESS OF RESPONSIVE DESIGN
Responsive designs are organized around “design phases” (Groves and Heeringa
2006). The first phases often involve collecting paradata that inform the cost and error
properties of alternative design features (e.g., number of calls made to sample cases,
nature of incentives). By allowing these features to change during the data collection,
the researcher can improve the quality of estimates given fixed data collection budgets.
By way of definition, responsive survey designs:
a. pre-identify a set of design features potentially affecting costs and errors of
survey statistics;
b. identify a set of indicators of the cost and error properties of those features;
c. monitor those indicators in initial phases of data collection;
d. alter the active features of the survey in subsequent phases based on cost/error
tradeoff decision rules; and
e. combine data from the separate design phases into a single estimator.
Figure 1 illustrates the key components of a three phase responsive design, in
which the first phase is mounted with N design options applied simultaneously
(possibly on different replicate subsamples). Examples of these design options might
include whether an incentive is offered, the number of follow-up calls to
nonrespondent households, the use of a short or long version of a questionnaire, or
alternatives for the number of sample persons to select per household. During Phase 1

Responsive Survey Design, Demographic Data Collection, and Models of Demographic Behavior 7
(as displayed at the bottom of Figure 1) paradata are collected to inform the researcher
of the interviewer hours spent calling on sample households, driving to sample areas,
conversing with household members, and interviewing sample persons. The paradata
may include observations about the characteristics of housing units (e.g., whether they
have some access impediments) or comments by contacted sample persons predictive
of later actions. Supplementing the paradata are key statistics from the survey
analyzed as functions of interviewer effort, computed on intermediate data sets as
interviews are completed.
Figure 1. An Illustration of a Three Phase Responsive Design
Design Option 1
Design Option 2
Design Option n
.
.
.
Phase 1(subsample)
Phase 2(full sample)
Para Data Assessment
Design Option S
Real-Time Estimation of Key Survey Statistics
Design Option T
Phase 3(subsample)
DecisionDecision
At the end of Phase 1, the researcher makes a decision about the Phase 2 design
options that appear to be prudent (the middle portion of Figure 1). This decision will
be guided by the paradata information on costs and sensitivity of values and standard
errors of key statistics. Phase 3 is often a phase introduced to control the costs of the
final stages of data collection while attaining desirable nonresponse error features for

Responsive Survey Design, Demographic Data Collection, and Models of Demographic Behavior 8
key statistics. This might involve a second phase sampling of remaining
nonrespondents, the use of different modes of data collection, or the use of larger
incentives. After the third phase is complete, the survey data collected in all three
phases are combined to produce the final survey estimates.
THE PRACTICE OF RESPONSIVE DESIGN
Modern computer-assisted interviewing software offers a needed infrastructure
for responsive design. The software system used in the NSFG permits daily uploading
from the field interviewer of all call records and travel documentation for her day’s
activities. These administrative data contain some paradata deliberately introduced
into the NSFG field design – observations about whether the household may contain
children, observations on the likelihood of non-English speakers, observations about
concerns raised by a household toward the survey request. In addition, the software
uploads all completed interview records. These data are used in background analytic
processes to estimate the propensity that the next call on a case will yield an interview,
whether the interviewer’s effort on her workload might be redirected to improve the
balance of the respondent data set on key auxiliary variables, and whether the level of
calling on some cases has reached an unproductive level. Based on these statistical
analyses of paradata, the survey researcher can choose to flag some active cases for
greater attention by interviewers. The downloaded information to the interviewer’s
laptop on the nightly transmission provides flags on certain cases that direct the
interviewer to call on these cases first at the next work shift.
Applying Responsive Design Approaches in the NSFG
The field work for Cycle 6 of the NSFG was organized in two distinct phases of
operation. The main data collection phase occurred during an 11-month period from
March 2002 through January 2003. During this initial phase paradata were collected
to monitor information about the data collection. Paradata included items of data such
as interviewer performance, observations on neighborhoods and housing units, day
and time of call attempts, and observations on contact with household members (e.g.

Responsive Survey Design, Demographic Data Collection, and Models of Demographic Behavior 9
whether they asked a question about the survey or responded with a negative
statement about the survey). These paradata were used to build predictive response
propensity models – logistic models predicting the odds that the next call on a sample
case would produce an interview, given a set of prior experiences with the sample case
(for a full description of the paradata collected and their use in propensity models see
Groves and Heeringa 2006). Expected propensities were summed over all cases and
used to group cases into quartiles, which formed strata for the responsive design phase
sample. Thus on the basis of these propensity models, a Phase 2 sample with high
probability to be interviewed was selected.
The second responsive design phase occurred during the last month of
fieldwork—February 2003. For this phase the recruitment protocol was altered in
attempt to attract sample people on whom the earlier phase protocols were not
effective. The responsive phase recruitment protocol entailed use of the most
productive interviewers on staff, increased use of proxy informants for the screening
interview to lower the burden of obtaining screener information, a small prepaid token
incentive (one-eighth of the main interview incentive as compared to no prepaid
incentive in the main phase) for completing the screening interview, and promise of
additional incentive (double the main incentive) for completing the main interview. The
responsive phase was successful in increasing the overall response rate, by recruiting a
large number of respondents who failed to participate in initial phases.
Evaluating Responsive Design in the NSFG
The second phase of data collection in responsive design adds cases to the data
base, necessarily improving the overall response rate in the study. The American
Association for Public Opinion Research has published a standardized set of guidelines
for determining the overall response rate of a study that includes a phase of responsive
design, weighting those cases to provide a precisely appropriate response rate
calculation (to learn more about those calculations for the NSFG, see Groves et al.
2005).
Responsive Survey Design, Demographic Data Collection, and Models of Demographic Behavior 10
But a key question remains: exactly how different are the cases added to the
study through responsive design? Responsive design brings more respondents into the
study, but those additional respondents only change what we know if they are different
from respondents in the main study in some important ways. Moreover, if they are
different in ways that are closely related to key substantive topics being studied adding
the cases is more important than if they are different, but those differences are
essentially orthogonal to the topic being studied. So evaluation of the substantive
consequences of responsive design depends greatly on assessing the substantive
differences between respondents in the main study and respondents in the responsive
design phase.
One way to assess these differences is to simply compare the characteristics of
main study respondents to characteristics of responsive design phase respondents.
One might wish to compare their basic demographic characteristics, such as age, race,
employment status or education. In general, theories of nonresponse emphasize that
busy people are less likely to participate in surveys and are harder to locate (Groves
and Couper 1998). This principle yields predictions regarding the expected difference
in characteristics for the two phases of data collection – in general the responsive
design phase respondents should be characterized by life circumstances that make
them busier than main study respondents. So, for example, with regard to employment,
we would expect responsive design phase respondents to be somewhat more likely to
be employed full time than main study respondents. Other characteristics that create
time pressure in individuals’ live should similarly be more prevalent among responsive
design phase respondents.
The main substantive objectives of the NSFG are the study of partnering (sexual,
cohabiting, and marital relationships) and parenting (childbearing, family planning,
contraceptive use, and childrearing). The literatures on both entry into sexual
partnerships (Thornton, Axinn and Xie 2007) and entry into parenthood (Rindfuss,
Morgan and Swicegood 1988) emphasize how both of these types of important life
transitions have the potential to significantly increase role conflict with other social
activities. Albeit, the theories of role conflict are usually invoked to inform our

Responsive Survey Design, Demographic Data Collection, and Models of Demographic Behavior 11
understanding of the complex interplay between family transitions like marriage and
childbearing on the one hand and non-family activities like work and school on the
other hand. But these ideas apply equally well to taking an hour or two out of a busy
schedule to complete a survey interview. Thus we have strong theoretical reasons to
expect both intimate sexual partnerships and parenthood will produce reluctance to
participate in surveys, and the more partnership transitions or more parenting
transitions a person experiences, the greater we my expect the reluctance to be. Again,
those situations are expected to be somewhat more prevalent in the responsive design
phase. Thus the specific topics at the focus of the NSFG measurement effort may be
topics highly likely to be associated with the likelihood of participation in surveys.
So, overall we expect respondents in the responsive design phase to be
disproportionately those most reluctant to participate in surveys. Theory predicts life
circumstances that create time pressure and role conflict, such as full time
employment, relationship transitions, and parenthood, should be the most likely to be
highly represented in the responsive design phase of a survey. Of course other factors
may also produce reluctance to participate in surveys. High representation in the
responsive design phase of a survey provides a window into what some of those other
factors may be. Empirical evidence for such differences can be assessed by simply
comparing respondents from the responsive phase to respondents from the main
phase of the NSFG.
Another way to assess these differences is to compare models of demographic
behavior estimated separately among cases selected across differing design phases.
This approach is more complex than a simple comparison. It implies a full multivariate
model of an important demographic outcome, built as closely as possible to the
specifications produced by previous research, with known expectations for values of
key parameters. By estimating such a model once with data from the main study and
second time with data from the responsive phase, one can capture a heuristic sense of
the differences in substantive conclusions likely to result from adding reluctant
respondents to the study by using responsive design. Differences in parameters across
these models fit to these two different data sources provide an informative view of

Responsive Survey Design, Demographic Data Collection, and Models of Demographic Behavior 12
likely consequences of implementing responsive design for substantive interpretations
of demographic models. This is a key test of the consequences of responsive design
because it goes beyond the simple identification of differences to assess the extent to
which such difference across groups of respondents are likely to alter our substantive
conclusions based on analyses of survey data.
In the paragraphs below we evaluate responsive design using both approaches.
First we compare the characteristics of respondents from the main study with
characteristics of respondents from the responsive phase. Second, we estimate
multivariate models of key NSFG outcomes twice – once using data from the main
study and then using data from the responsive phase. Our objective in this second
approach is not innovative modeling, so we draw simple models as directly as possible
from established modeling strategies or previously published research based on the
NSFG.
DATA AND METHODS
Data for this study were taken from the National Survey of Family Growth
(NSFG), Cycle 6. Fieldwork for the NSFG, conducted between March 2002 and
February 2003, was done by professional female interviewers who questioned 12,571
men and women ages 15 to 44 in their homes. The NSFG obtained detailed information
on factors affecting childbearing, marriage and parenthood.
For these analyses, we focus on two groups among the respondents: those
interviewed during the main data collection phase and those interviewed during the
responsive design phase. Furthermore, we subdivide these groups by gender, so that
our sample contains men interviewed during the main phase (n = 4,601), women
interviewed during the main phase (n = 7,146), men interviewed during the responsive
phase (n = 327), and women interviewed during the responsive phase (n = 497). Of
course the responsive phase of the study is, by design, a small proportion of the total
interviews collected. One consequence is limited statistical power for testing
differences between the main and responsive phases. This limitation prevents us from
detecting small differences and focuses instead on large differences across phases.

Responsive Survey Design, Demographic Data Collection, and Models of Demographic Behavior 13
COMPARING RESPONDENT CHARACTERISTICS FROM NSFG RESPONSIVE DESIGN PHASE
To compare characteristics of respondents from the responsive design phase in the
NSFG we examine three different empirical dimensions of the NSFG Cycle 6 data. The
first dimension compares basic demographic characteristics of those respondents
interviewed in the main study to those interviewed in the responsive design phase. The
second dimension compares behaviors across substantive domains of greatest
importance to the NSFG, partnering behaviors and parenting behaviors. Because the
NSFG also invests significant effort into the measurement of attitudes and related
subjective phenomena, the third dimension compares responses to questions about
attitudes across the main and responsive phases of the NSFG. Because attitudes and
related subjective phenomena are known to have different measurement properties
than behaviors (Tourangeau, Rips and Rasinski 2000), this dimension may reveal
additional insight into the nature of reluctant respondents added through responsive
design.
Comparing Demographic Characteristics
In Table 1 we present the percentage of respondents in various age, race,
genealogical, labor force and educational categories by interview phase and gender.
We test whether the percentages in each category in the main phase are different from
the same percentages in the responsive phase. The overall pattern of age differences is
that the responsive phase sample is older than the main phase sample. For both men
and women, the responsive phase sample is significantly less likely to be under age 20
and more likely to be age 30 or older. There is also a strong difference in labor force
participation, manifested more among women. Women in the responsive phase are
much more likely to be employed full time compared to women in the main phase. The
proportion of Hispanics in each interview phase is significantly different for both
genders (20% of women in the responsive phase compared to 13% of women in the
main phase, and 24% of men in the responsive phase compared to 15% of men in the
main phase). Among both genders the responsive design phase contains fewer Blacks
and Whites, although the differences in percentage White are not statistically

Responsive Survey Design, Demographic Data Collection, and Models of Demographic Behavior 14
significant. Being foreign born is also significantly more likely among those in the
responsive design phase for both men and women. Finally, we also see some
potentially important difference in educational attainment, with those in the responsive
design phase being characterized by somewhat higher educational attainments than
those in the main phase.
Table 1. Descriptive Statistics: Demographic Measures (weighted percentages)
Men Women
Main Study
Responsive Phase
Main Study
Responsive Phase
(N=4601) (N=327) (N=7146) (N=497) Age
Under age 20 17.46 11.06*** 16.55 11.88** Age 20-29 31.02 32.97 31.19 29.69 Age 30 or older 51.52 55.97** 52.26 58.43**
Labor Force Status Working full time 60.95 64.20 42.04 53.80*** Working part time 14.18 15.84 19.04 17.28
* p<.05; ** p<.01; *** p<.001 (one-tailed tests) Race
White 66.53 61.67 66.80 63.72 Hispanic 14.83 23.93*** 13.47 19.56*** Non-Hispanic Black 12.27 10.61* 14.53 11.95** Other 6.40 3.80 5.24 4.77
Foreign Born 14.27 23.35*** 13.84 17.94** Education
No high school degree 23.58 20.76* 21.96 19.12 High school diploma/GED 25.23 29.38 22.14 23.78 Some college 25.70 19.60 26.84 26.19 College degree or higher 25.48 30.27 29.06 30.91
* p<.05; ** p<.01; *** p<.001 (two-tailed tests)

Responsive Survey Design, Demographic Data Collection, and Models of Demographic Behavior 15
Our initial comparison is consistent with the conclusion that the addition of a
responsive design phase can add significantly different people to those represented in
a survey. Not only are these differences statistically significant, but they are so in spite
of the relatively small case base for the responsive phase of the survey. Americans in
general and academics in particular are fond of arguing over who is the busiest, and
adjudication of this issue lies far beyond the scope of the present paper. Nevertheless
the specific pattern of results we document appears consistent with the hypothesis
that responsive design may draw those with the most survey participation role conflict
into the respondent pool. Full time work and older age may be the clearest evidence of
this. Being foreign born or having higher education may also create more role conflict
for extra activities like a survey interview. We cannot assess the role conflict implied
by racial group membership, but this difference may serve as an indication that other
factors are also at work.
Comparing Partnering and Parenting Behaviors
We continue comparing samples from the different interview phases in Table 2.
As the results show, the samples display some important differences in patterns of
both partnering and parenting. First, in terms of many lifetime sexual partners,
responsive phase men have had significantly more opposite sex sexual partners than
main phase men. Second, strong differences in marital status pertain only to women:
Women in the responsive phase are significantly more likely to be currently married
(54% compared to 45% in the main phase) and ever married (64% compared to 57% in
the main phase). Men are only somewhat more likely to be currently married and ever
married. Third, responsive phase women are more likely to have ever cohabited than
main phase women, but responsive phase men are less likely to have ever cohabited
than main phase men. Neither of these differences is statically significant, however.
Finally, in terms of childbearing, there is clear evidence that responsive phase men are
more likely to have biologically fathered a child than main phase men. Women in the
responsive phase appear somewhat more likely to have had a live birth, and responsive
Responsive Survey Design, Demographic Data Collection, and Models of Demographic Behavior 16
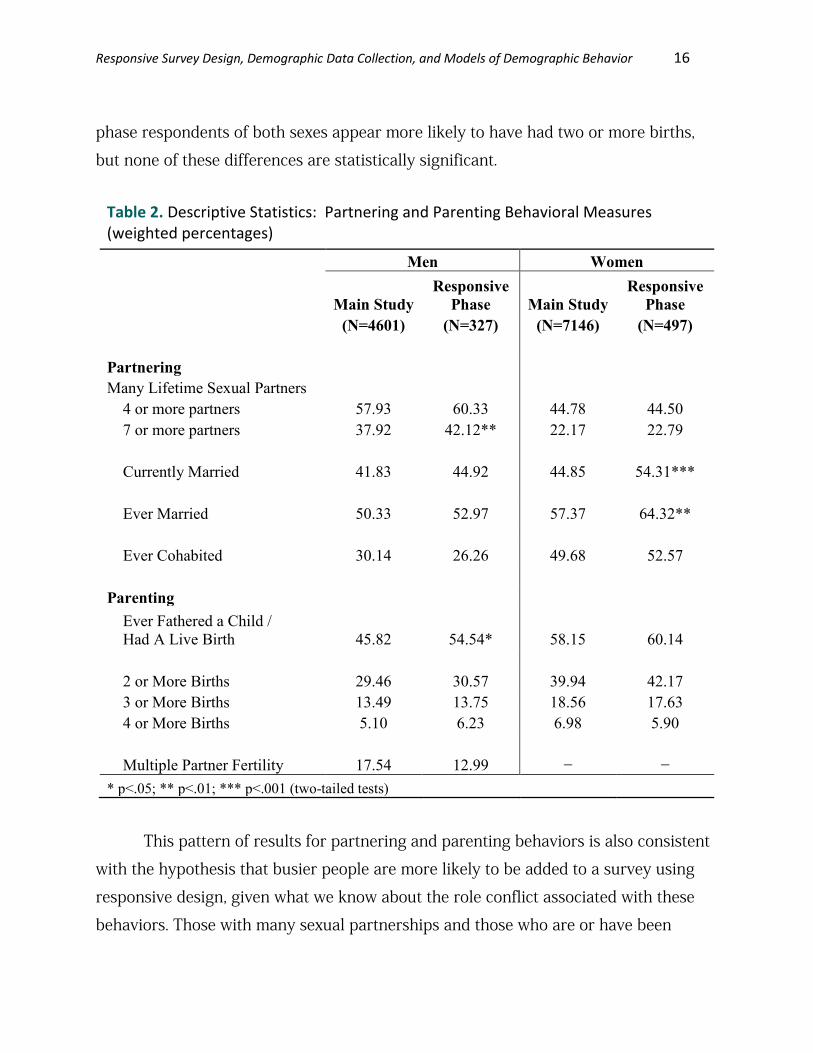
phase respondents of both sexes appear more likely to have had two or more births,
but none of these differences are statistically significant.
Table 2. Descriptive Statistics: Partnering and Parenting Behavioral Measures (weighted percentages)
Men Women
Main Study Responsive
Phase Main Study Responsive
Phase (N=4601) (N=327) (N=7146) (N=497)
Partnering Many Lifetime Sexual Partners
4 or more partners 57.93 60.33 44.78 44.50 7 or more partners 37.92 42.12** 22.17 22.79 Currently Married 41.83 44.92 44.85 54.31*** Ever Married 50.33 52.97 57.37 64.32** Ever Cohabited 30.14 26.26 49.68 52.57
Parenting Ever Fathered a Child /
Had A Live Birth 45.82 54.54* 58.15 60.14 2 or More Births 29.46 30.57 39.94 42.17 3 or More Births 13.49 13.75 18.56 17.63 4 or More Births 5.10 6.23 6.98 5.90 Multiple Partner Fertility 17.54 12.99 − −
* p<.05; ** p<.01; *** p<.001 (two-tailed tests)
This pattern of results for partnering and parenting behaviors is also consistent
with the hypothesis that busier people are more likely to be added to a survey using
responsive design, given what we know about the role conflict associated with these
behaviors. Those with many sexual partnerships and those who are or have been

Responsive Survey Design, Demographic Data Collection, and Models of Demographic Behavior 17
married are more likely to be added in responsive design. Consistent with other
evidence that less role conflict is associated with non-marital cohabitation (Thornton,
Axinn and Xie 2007), we find here that responsive design does not produce as large a
gap in measurement of cohabiting experience as it does in marital experience. Our
evidence is also consistent with the expectation that parents are likely to be added in
the responsive phase of a survey, though the evidence we present indicates that is
more so for fathers than mothers. Of course more detailed measures of statuses
producing the greatest potential role conflict, such as the ages of the children, would
likely demonstrate these differences more strongly than the gross categories shown
here. The same is likely true for partnering, in which recency or relationship transitions
may produce stronger observed differences than the gross categories used here.
Comparing Partnering and Parenting Attitudes
In Table 3 we present differences in attitudinal measures between the samples.
For each of the statements listed, respondents were given answer choices of “Strongly
Agree,” “Agree,” “Disagree,” and “Strongly Disagree.” Although the "Neither Agree or
Disagree" response was not offered, it was accepted as a response if the respondent
insisted. For parsimony, we compare the samples on agreement (a response of either
“Strongly Agree” or “Agree”) with each statement.
The results in Table 3 show that the samples display differences in responses to
some key attitudinal measures. First consider the partnering domain. Although there is
no significant difference between the male samples in response to “It is better for a
person to get married than to go through life being single,” there is a substantial and
significant difference between the female samples: responsive phase women are more
likely to agree than main phase women. This is not surprising given women added in
the responsive phase are also more likely to have been married (Thornton, Axinn and
Xie 2007). Less directly obvious, in response to the statement “Sexual relations between
two adults of the same sex is always wrong,” men added through the responsive phase
are more likely to agree while women added through the responsive phase are less
likely to agree. This interesting result points toward a pernicious characteristic of

Responsive Survey Design, Demographic Data Collection, and Models of Demographic Behavior 18
responsive survey design: Not only may factors other than role conflict with
completing an interview be at work, but it may be extremely difficult to predict the
consequences of adding these reluctant respondents across substantive domains.
Table 3. Descriptive Statistics: Agreement with Partnering and Parenting Attitudinal Measures (weighted percentages)
Men Women
Main Study
Responsive Phase
Main Study
Responsive Phase
(N=4601) (N=327) (N=7146) (N=497) Partnering
Better to get married than go through life being single 65.57 68.28 49.87 55.27**
Sexual relations between two
adults of the same sex is always wrong 51.36 56.69 42.96 36.32** Parenting
Rewards of being a parent are worth it despite the cost 93.10 95.11 94.80 88.51
A working mother can establish just as warm and secure a relationship with her children as a mother who does not work 72.94 69.36 82.78 85.14 * p<.05; ** p<.01; *** p<.001 (two-tailed tests)
Next consider the parenting domain. Sample differences in response to “The rewards of being a parent are worth it, despite the cost and the work it takes” are stronger among women than men. Responsive phase women are less likely to agree than main phase women, although significance in this difference is not found in a two-tailed t-test. In response to the statement “A working mother can establish just as warm and secure a relationship with her children as a mother who does not work”, on the other hand, the differences by phase appear slightly stronger for men. So, as one might expect given the more subjective nature of attitudes, we find some significant
Responsive Survey Design, Demographic Data Collection, and Models of Demographic Behavior 19
differences in attitude measurement in the responsive phase of the survey, but these differences follow a less clear pattern, making interpretation of them more difficult. Nonetheless, it is clear the observed differences span both the partnering and the parenting domains, and are strongest in the partnering domain among women. COMPARING OF MODELS OF DEMOGRAPHIC OUTCOMES
Our next step will be to estimate models that are common in social demographic literature, first on the main phase sample only, then on the responsive phase sample. The models estimated on the main phase sample provide parameter estimates that would be calculated with no special responsive phase effort to add nonrespondents to the study. Comparison to parameters estimated on the responsive phase sample can provide a heuristic sense of the differences in substantive conclusions likely to result from adding reluctant respondents to the study by using responsive design. This test of the consequences of responsive design documents the extent to which difference across groups of respondents documented above are likely to alter our substantive conclusions based on analyses of survey data.
For these multivariate analyses we use logistic regression to model the odds of the demographic outcome in question, and present model coefficients in tables as odds ratios. All analyses are weighted to control for the complex sampling design of the NSFG. Because our objective here is methodological, not substantive, we do not interpret the model coefficients themselves, but instead focus on statistically significant differences in coefficients estimated on the different samples. In keeping with this methodological focus, we draw the models themselves from the previous literature on each topic and do not construct any theoretical frameworks for these topics here. The specific model parameters, variable construction, and coding in the models was derived from recently published papers on these topics based on NSFG data (Bloom and Bennett 1990; Darroch, Landry and Oslak 1999; Finer and Henshaw 2006; Guzzo and Furstenberg Jr. 2007; Hayford and Morgan 2008; Manlove et al. 2008; Manlove, Terry-Humen and Ikramullah 2006; Zhang 2008). Likewise, because our methodological objective is to learn the extent to which responsive design may alter our substantive conclusions based on survey data across multiple subject matters,
Responsive Survey Design, Demographic Data Collection, and Models of Demographic Behavior 20
we investigate five different types of models spanning two dimensions of partnering and three dimensions of parenting. The specific subjects were chosen based on an analysis of highly cited recent scholarly works using NSFG data in order to represent the most common uses of these data. Finally, because our methodological objective is in the evaluation of the responsive design data collection strategy, not advances in modeling or analytic strategies, we replicate the modeling strategies used in previous highly cited work with NSFG data. In some cases these modeling strategies do not reflect the most sophisticated possible analysis techniques applied to the specific subject. In such cases we comment on our investigation of more sophisticated modeling strategies to supplement the results.
Responsive Design and Multivariate Models of Partnering
We investigate multivariate models of two dimensions of partnering behavior often analyzed using NSFG data – numbers of sexual partners and marriage. We estimate models of the likelihood of lifetime experience with a large number of sexual partners first and models of the likelihood of marriage second.
Many Sexual Partners. In Table 4 we present multivariate models of the likelihood of experiencing many lifetime sexual partners. Because men tend to report more lifetime sexual partners than women in the United States (Laumann et al. 1994; Smith 1992), we code “many” as seven or more partners for men and four or more partners for women. As described above, our analysis focuses on differences between model coefficients for models estimated on the main phase sample versus models estimated on the responsive phase sample, not on the coefficient values themselves. Table 4 presents a pair of models for men and a pair of models for women to simplify visual inspection of differences in estimated coefficients across the two different samples of men and women. Statistical significance of differences between coefficients is determined in pooled models, not shown in the tables, that add interaction terms between the variable of interest and a dichotomous indicator of the sample phase during which the respondent was added to the study. The statistical significance of these coefficient differences is indicated in a third separate column with a # sign.

Responsive Survey Design, Demographic Data Collection, and Models of Demographic Behavior 21
Table 4. Many Sexual Partners: Logistic regression predicting lifetime sexual partners (weighted)
Men (7 or more partners) Women (4 or more partners)
Main Phase
Responsive Phase
Significant Difference
Main Phase
Responsive Phase
Significant Difference
(N=4451) (N=321) (N=6799) (N=476) Age 1.09*** 1.13*** 1.07*** 1.16*** # (16.28) (6.12) (15.13) (7.55) Race (ref=Non-Hispanic white)
Hispanic 1.15 0.47* # 0.51*** 0.61 (1.29) (2.15) (7.51) (1.55) Non-Hispanic Black 2.11*** 1.62 1.95*** 1.50
(6.85) (1.14) (8.21) (1.19) Other 0.69* 0.05** # 0.54*** 0.34
(2.45) (2.64) (4.79) (1.93) Education (ref=no high school degree)
High school diploma/GED 2.01*** 0.62 # 1.89*** 2.92** #
(6.32) (1.19) (7.21) (2.73) Some college 2.02*** 1.13 1.90*** 1.79 (6.30) (0.28) (7.58) (1.54) College degree or higher 1.71*** 0.62 1.58*** 1.30
(4.60) (1.11) (5.10) (0.66)
Frequency of attendance at religious services 0.69*** 0.83 # 0.64*** 0.64*** # (13.17) (1.93) (20.49) (4.76) Ever married 0.91 0.84 0.96 0.54* (1.07) (0.57) (0.63) (2.14) Mother's education 1.04 1.08 1.08* 1.19 (0.98) (0.49) (2.44) (1.35)
Mother worked full time when R was age 5-15 1.31*** 1.14 1.25*** 2.03** (3.78) (0.46) (4.11) (3.05) -2 Log-Likelihood 5099.97 367.08 8159.34 515.48 Note: Numbers in parentheses are t-ratios * p<.05; ** p<.01; *** p<.001 (two-tailed tests) # significant interaction between variable and phase (not shown)

Responsive Survey Design, Demographic Data Collection, and Models of Demographic Behavior 22
Examining the results displayed in Table 4, among men the coefficients for being Hispanic, being another race besides White, Black and Hispanic, having a high school diploma, and frequency of attendance at religious services are each significantly different between the main phase sample and the responsive phase sample. Religious service attendance reduces the likelihood of experiencing a large number of sexual partners in both models, but the magnitude of this effect is estimated as significantly larger among the main phase respondents than among the responsive phase respondents.1
Of course it is common in social demography that we place greater theoretical emphasis on the direction of such coefficient estimates than on the magnitude. So one might argue that even though these are statistically significant differences, they are substantively similar and would lead to similar substantive conclusions, at least at a gross theoretical level. As we will see below, this is not always the case, and responsive design sometimes produces coefficient estimates in the opposite direction. In the meantime, however, it remains clear that in the domain of models of sexual partnerships responsive survey design adds cases that lead to significantly different estimates of the magnitude of model coefficients. Again, note that we document these significant differences in spite of the relatively small size of the responsive phase sample, which greatly limits the statistical power of such tests.
Effects of being Hispanic and being another race, on the other hand, appear to be more significant among responsive phase respondents than main phase respondents. Among women, the coefficients for age, having a high school diploma, and frequency of religious service attendance are each significantly different in the responsive design phase than in the main phase. In each case the two different coefficients are in the same direction and the difference in each pair is in the magnitude of the estimate.
1 Note that more sophisticated approaches to estimation of the relationship between religious service attendance and sexual partnerships use longitudinal data, not cross-sectional data as in the NSFG. This is because there is known reciprocal causation between religious service attendance and sexual partnerships, in which religious service attendance affects subsequent sexual partnering behaviors, but sexual partnering behaviors also affect subsequent religious service attendance (Thornton, Axinn and Hill 1992). We do not use such an approach here because our aim is to evaluate the way responsive survey design may affect model estimates in typical uses of NSFG data and NSFG data are used by some analysts for this purpose.

Responsive Survey Design, Demographic Data Collection, and Models of Demographic Behavior 23
Marriage. In Table 5 we present multivariate models of the likelihood of ever being married.2
Among men, the results in Table 5 demonstrate that responsive survey design adds respondents producing significantly different coefficient estimates for four different parameters in the models. Coefficients for age, having attended some college, having achieved a college degree or higher, and an intact family background are all significantly different in the responsive phase sample than they were in the main phase sample. Two of the four coefficients remain in the same substantive direction, but change significantly in magnitude. But the signs of the coefficients for both having attended some college and having an intact family background change in the responsive phase sample. Among women even though only two coefficients are significantly different in the two samples – Catholic and an income between the poverty level and twice the poverty level – they also have the same character. Among the main phase respondents being Catholic significantly reduces the likelihood of being ever married, whereas among the responsive phase respondents being Catholic appears to increase the likelihood of being married. Income in the middle category increases the likelihood of marriage among the main phase respondents, but appears to decrease the likelihood among responsive phase respondents. Because of the smaller size of the responsive phase sample, however, these effects do not quite attain statistical significance with two-tailed tests. The busier women drawn into the study via the responsive design protocols in NSFG are characterized by significant and substantively meaningful differences in the relationships between being Catholic and marrying, and being in the middle income category and marrying. Thus the analyses
Just as presented above, our analysis focuses on differences between model coefficients for models estimated on the main phase sample versus models estimated on the responsive phase sample. The statistical significance of these coefficient differences is indicated with a # sign.
2 A more sophisticated approach to analysis of marriage would focus on the hazard of becoming married rather than the likelihood of ever being married (Thornton, Axinn and Xie 2007). We re-estimated the models presented in Table 5 reformulating the dependent variable as the hazard of marriage. Though of course coefficients change, the pattern of differences in these coefficients between main phase and responsive phase samples (not shown in tables) is the same as the pattern displayed in Table 5.
Responsive Survey Design, Demographic Data Collection, and Models of Demographic Behavior 24
presented in Table 5 demonstrate that differences between main phase respondents and responsive phase respondents can produce both statistically significant difference in our substantive models, but also theoretically meaningful and substantively important differences in these models.
Responsive Design and Multivariate Models of Parenting
We now investigate multivariate models of dimensions of parenting behavior often analyzed using NSFG data. We estimate models of the likelihood of ever becoming a father/mother and having fathered/mothered two or more children. We then investigate models of a newly emerging topic in the literature – multiple partner fertility.
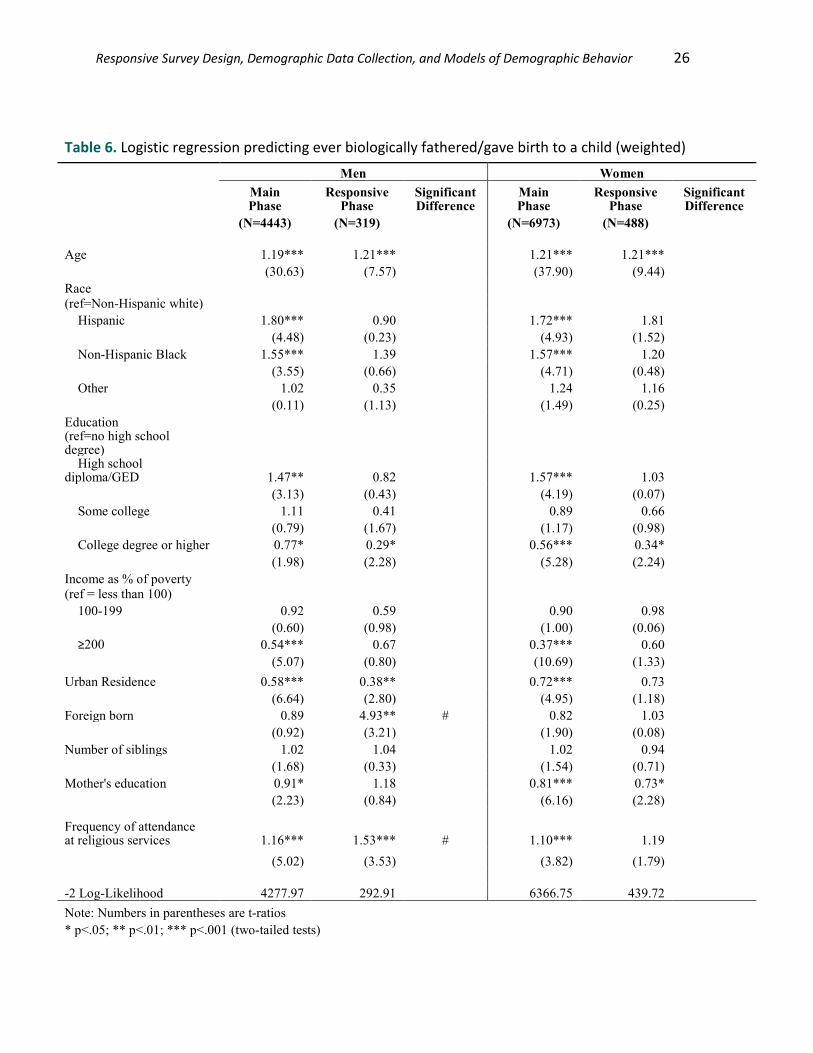
Ever Becoming a Father or Mother. In Table 6 we present models of ever biologically fathering a child or giving birth to a child.3
This is the only case where, at least among women, there are no significant differences in coefficient estimates between the main phase sample and the responsive phase sample. Thus for the two female samples all of the predictors in the model appear to work similarly for predicting giving birth. Among men, coefficients for being born outside the United States and frequency of attendance at religious services are each significantly different between the main phase sample and the responsive phase sample. The effect of being foreign born is markedly stronger among the responsive phase sample of men than among the main phase sample of men (an odds ratio of 4.93 among the responsive phase sample compared to an insignificant effect among the main phase sample). Further exploration of exactly why the relationship between being foreign born and fathering a child is so different for men recruited during the responsive phase of the survey is beyond the scope of this study. In this analysis it serves as further evidence that adding different types of respondents through a responsive design phase may produce different substantive interpretations of multivariate models.
3 We also re-estimated the models presented in Table 6, modeling the dependent variable as the hazard of first birth (analysis not shown). The pattern of differences in these coefficients between main phase and responsive phase samples is the same as the pattern displayed in Table 6.

Responsive Survey Design, Demographic Data Collection, and Models of Demographic Behavior 25
Table 5. Logistic regression predicting ever married (weighted)
Men Women
Main Phase
Responsive Phase
Significant Difference
Main Phase
Responsive Phase
Significant Difference
(N=4461) (N=321) (N=6995) (N=490) Age 1.21*** 1.13*** # 1.22*** 1.20*** (31.24) (5.91) (39.07) (9.36) Race (ref=Non-Hispanic white)
Hispanic 1.47** 0.88 1.21 0.82 (2.96) (0.31) (1.75) (0.51) Non-Hispanic Black 0.54*** 0.68 0.28*** 0.32**
(4.86) (0.80) (12.86) (2.94) Other 0.70* 0.43 0.84 1.27 (2.21) (0.98) (1.20) (0.43)
Catholic 0.71*** 0.53 0.75*** 1.60 # (3.65) (1.87) (3.83) (1.63) Education (ref=no high school degree)
High school diploma/GED 1.86*** 1.54 1.78*** 1.39 (4.85) (1.05) (5.36) (0.78) Some college 1.58*** 0.67 # 1.66*** 1.46 (3.49) (0.82) (4.84) (0.90) College degree or higher 2.13*** 4.05** # 1.75*** 0.96
(5.38) (2.84) (5.00) (0.10) Income as % of poverty (ref = less than 100)
100-199 1.45** 0.64 1.38** 0.48 # (2.61) (0.96) (3.18) (1.85) ≥200 1.31* 0.56 1.26* 1.37
(2.11) (1.38) (2.54) (0.84) Urban Residence 0.58*** 0.47* 0.79*** 0.59 (6.37) (2.41) (3.37) (1.94) Number of siblings 1.04* 1.29* 1.02 1.03 (2.32) (2.28) (1.57) (0.36) Mother's education 0.88** 0.85 0.90** 0.84 (3.03) (0.89) (2.98) (1.22) Lived in intact family at age 14 0.76** 1.46 # 1.04 0.97 (3.07) (1.09) (0.52) (0.12) -2 Log-Likelihood 4010.68 329.43 6015.22 413.22 Note: Numbers in parentheses are t-ratios * p<.05; ** p<.01; *** p<.001 (two-tailed tests) # significant interaction between variable and phase (not shown)
Responsive Survey Design, Demographic Data Collection, and Models of Demographic Behavior 26
Table 6. Logistic regression predicting ever biologically fathered/gave birth to a child (weighted)
Men Women
Main Phase
Responsive Phase
Significant Difference
Main Phase
Responsive Phase
Significant Difference
(N=4443) (N=319) (N=6973) (N=488) Age 1.19*** 1.21*** 1.21*** 1.21*** (30.63) (7.57) (37.90) (9.44) Race (ref=Non-Hispanic white)
Hispanic 1.80*** 0.90 1.72*** 1.81 (4.48) (0.23) (4.93) (1.52) Non-Hispanic Black 1.55*** 1.39 1.57*** 1.20
(3.55) (0.66) (4.71) (0.48) Other 1.02 0.35 1.24 1.16
(0.11) (1.13) (1.49) (0.25) Education (ref=no high school degree)
High school diploma/GED 1.47** 0.82 1.57*** 1.03
(3.13) (0.43) (4.19) (0.07) Some college 1.11 0.41 0.89 0.66 (0.79) (1.67) (1.17) (0.98) College degree or higher 0.77* 0.29* 0.56*** 0.34*
(1.98) (2.28) (5.28) (2.24) Income as % of poverty (ref = less than 100)
100-199 0.92 0.59 0.90 0.98 (0.60) (0.98) (1.00) (0.06) ≥200 0.54*** 0.67 0.37*** 0.60
(5.07) (0.80) (10.69) (1.33) Urban Residence 0.58*** 0.38** 0.72*** 0.73 (6.64) (2.80) (4.95) (1.18) Foreign born 0.89 4.93** # 0.82 1.03 (0.92) (3.21) (1.90) (0.08) Number of siblings 1.02 1.04 1.02 0.94 (1.68) (0.33) (1.54) (0.71) Mother's education 0.91* 1.18 0.81*** 0.73* (2.23) (0.84) (6.16) (2.28)
Frequency of attendance at religious services 1.16*** 1.53*** # 1.10*** 1.19 (5.02) (3.53) (3.82) (1.79) -2 Log-Likelihood 4277.97 292.91 6366.75 439.72 Note: Numbers in parentheses are t-ratios * p<.05; ** p<.01; *** p<.001 (two-tailed tests)

Responsive Survey Design, Demographic Data Collection, and Models of Demographic Behavior 27
High Fertility. In Table 7 we present models of having fathered/mothered two or more children. Among men, the coefficient of being Hispanic for the responsive phase sample is significant in the opposite direction than for the main phase sample. The effect of being foreign born again follows a pattern of being insignificant among the main phase sample of men and strongly positive among the responsive phase sample of men. So, for both of these coefficients the responsive phase sample produces cases for whom estimated effects are quite a bit different than among the cases in the main study design. For this particular model we also display the consequences of adding males recruited during the responsive phase together with those from the main phase into one overall total sample. In the fourth column we present a model of having fathered two or more children which pools together the main phase sample of men and responsive phase sample of men. Of course the responsive phase sample is such a small proportion of the pooled sample that most coefficient estimates for the pooled sample look very similar to those produced by the main phase sample. But despite its small case base, the responsive phase sample produces coefficient estimates for Hispanic and foreign born that differ enough from those produced by the main phase sample that they change how coefficient estimates appear in the pooled model. For the pooled sample the coefficient of being Hispanic is only about half the size of this same coefficient for the main phase sample. For being foreign born, the coefficient of this parameter is not significantly different from zero for the main phase sample or the pooled sample. However because this coefficient is so overwhelmingly large for the responsive phase sample, it appears to become positive in the pooled model to the unsophisticated eye.
Among women, the results in Table 7 demonstrate the largest number of differences in coefficient estimates between the main phase sample and the responsive phase sample. The responsive phase incorporates respondents who produce significantly different coefficient estimates for eight different model parameters – age, other racial group, income between the poverty level and twice the poverty level, income at least twice the poverty level, living in an urban area, number of siblings, mother’s education, and frequency of attendance at religious services. In some cases (other racial group, living in an urban area) effects appear stronger among the
Responsive Survey Design, Demographic Data Collection, and Models of Demographic Behavior 28
responsive phase sample, whereas in other cases (age, both income categories, number of siblings, mother’s education, and frequency of attendance at religious services) effects seem to be reduced among the responsive phase sample. Unfortunately we cannot fully explain why so many model parameters work differently for predicting high fertility among respondents recruited during the responsive design phase. However, our results clearly imply that responsive phase samples have the potential for altering substantive conclusions. Furthermore, Tables 4 through 7 have shown that many model parameters (e.g. age, racial groups, being born outside the United States, frequency of attendance at religious services) consistently produce different coefficient estimates between main phase samples and responsive phase samples across models predicting a variety of demographic outcomes.
Multiple Partner Fertility. In our final analysis section we explore the recently emerging topic of multiple partner fertility – that is having fathered children with more than one woman. Research is beginning to document both the prevalence of multiple partner fertility and factors associated with it (Guzzo and Furstenberg 2007; Manlove et al. 2008). Because we have thus far found differences in models of other parenting behaviors such as becoming a father or fathering two or more children for the responsive versus main phase samples, we expect differences in models of multiple partner fertility as well. Multivariate models of this particular demographic outcome stratified by sample phase, however, are the most limited in statistical power due to the very small number of men in the responsive phase sample who have fathered two or more children (n = 76) and are therefore at risk of multiple partner fertility. Nevertheless in Table 8 we present models predicting the likelihood of multiple partner fertility as an exploratory exercise. Results demonstrate one significant difference in the coefficient estimates for an intact family background between the main phase sample and the responsive phase sample, although this result must be interpreted with caution. However, the significant differences between samples in coefficient estimates for models predicting other parenting behaviors suggest that examining patterns of difference in models of multiple partner fertility will be a fruitful avenue for future research as more respondents are recruited through responsive design phases.

Responsive Survey Design, Demographic Data Collection, and Models of Demographic Behavior 29
Table 7. Logistic regression predicting fathered/mothered two or more children (weighted)
Men Women
Main Phase
Responsive Phase
Significant Difference
Both Phases Pooled
Main Phase
Responsive Phase
Significant Difference
(N=4443) (N=319)
(N=4762) (N=6973) (N=488)
Age 1.18*** 1.21***
1.18*** 1.19*** 1.16*** #
(27.09) (6.91)
(27.89) (37.50) (8.62)
Race
(ref=Non-Hispanic white)
Hispanic 1.85*** 0.32* # 1.39* 1.43*** 2.19*
(4.43) (2.26)
(2.48) (3.31) (2.11)
Non-Hispanic Black 1.24 1.24
1.18 1.10 0.88
(1.64) (0.41)
(1.34) (0.98) (0.33)
Other 1.04 0.64
0.94 0.84 3.76* #
(0.23) (0.44)
(0.33) (1.12) (2.27)
Education
(ref=no high school degree)
High school diploma/GED 1.10 1.21
1.11 0.95 0.62
(0.70) (0.40)
(0.87) (0.48) (1.22) Some college 0.94 1.05
0.94 0.71** 0.37*
(0.48) (0.09)
(0.47) (3.28) (2.50) College degree or higher 0.88 0.65
0.85 0.56*** 0.23***
(0.91) (0.77)
(1.17) (5.33) (3.39) Income as % of poverty
(ref = less than 100)
100-199 0.99 0.31*
0.86 0.70*** 0.48* #
(0.08) (2.27)
(1.17) (3.63) (1.97)
≥200 0.35*** 0.16***
0.31*** 0.28*** 0.51 #
(8.35) (3.71)
(9.67) (14.04) (1.95)
Urban Residence 0.67*** 0.64
0.67*** 0.82** 0.37*** #
(4.62) (1.22)
(4.72) (2.91) (3.89)
Foreign born 0.85 7.73*** # 1.14 0.77* 0.76
(1.20) (4.02)
(1.05) (2.56) (0.77)
Number of siblings 1.01 0.90
1.01 1.02* 0.86 #
(1.00) (0.87)
(0.91) (2.03) (1.90)
Mother's education 0.91* 0.80
0.90* 0.84*** 0.94 #
(2.16) (1.04)
(2.42) (5.17) (0.46)
Frequency of attendance at religious services 1.14*** 1.29*
1.15*** 1.17*** 1.09 #
(4.21) (2.17)
(4.78) (6.77) (0.97)
-2 Log-Likelihood 3940.47 264.15 4242.67 6631.86 501.87
Note: Numbers in parentheses are t-ratios * p<.05; ** p<.01; *** p<.001 (two-tailed tests)
# significant interaction between variable and phase (not shown)

Responsive Survey Design, Demographic Data Collection, and Models of Demographic Behavior 30
Table 8. Multiple Partner Fertility: Logistic regression predicting whether men who have fathered two or more children fathered them with more than one woman (weighted)
Main Phase
Responsive Phase
Significant Difference
(N=943) (N=76) Age 1.06*** 0.98 (4.03) (0.29) Race (ref=Non-Hispanic white)
Hispanic 1.33 3.27 (1.07) (1.38) Non-Hispanic Black 3.19*** 4.63
(5.26) (1.70) Other 1.49 − −
(1.12) Education (ref=no high school degree)
High school diploma/GED 0.76 1.22 (1.22) (0.28) Some college 0.90 1.78 (0.45) (0.64) College degree or higher 0.38*** − −
(3.78) Foreign Born 0.52* 0.56 (2.29) (0.70) Lived in intact family at age 14 0.47*** 1.17 # (4.32) (0.20) Mother was a teen at first birth 1.60** 1.88 (2.87) (0.96) -2 Log-Likelihood 1001.55 53.46 Note: Numbers in parentheses are t-ratios Measures of other race group and college degree omitted due to sample size * p<.05; ** p<.01; *** p<.001 (two-tailed tests) # significant interaction between variable and phase (not shown)
Responsive Survey Design, Demographic Data Collection, and Models of Demographic Behavior 31
Before leaving the results, note the pattern across the various multivariate
models presented here. Though we chose models of only five different outcomes, those
outcomes span the important dimensions of partnering and parenting at the core of
NSFG measurement – sexual partners, marriage, childbearing, having many children,
and bearing children with multiple partners. There are many other topics represented
in the NSFG as well. It is now well-documented that nonresponse bias of respondent-
based estimates varies greatly over different estimates in the same survey (Groves and
Peytcheva 2008). However, across the five different dimensions of NSFG measurement
we repeatedly see that responsive design draws reluctant respondents into the study
who are not only different from main study respondents (Tables 1-3), but also change
our understanding of the factors associated with each of the five outcomes (Tables 4-
8). Each multivariate model is based on previously published work on the topic using
the NSFG and each model is relatively parsimonious. We also estimate the five models
separately among men and women, for a total of ten different models. In all but one of
the models we find that some coefficients are significantly different among the
responsive phase respondents than among the main phase respondents. The majority
of the coefficients we estimate are either unchanged among these respondents, or not
significantly changed. Most of the significant changes are still in the same direction as
among the main phase respondents; this means that adding responsive phase
respondents may change estimates of the magnitudes of effects but will not change the
substantive interpretation of hypothesis tests that only rely on the direction of the
estimated association.
However, in some cases, the coefficients estimated among responsive phase
respondents are not only significantly different, but also in the opposite direction than
among main phase respondents. These cases would lead to opposite conclusions about
the direction of association. Moreover, the pattern of these differences does not appear
obvious or easily predicted. Models of men and women often produce different results
for the consequences of the responsive phase additions. Sometimes the additions
produce greater change in models of men’s outcomes and sometimes they produce
greater change in models of women’s outcomes. Together this body of results
Responsive Survey Design, Demographic Data Collection, and Models of Demographic Behavior 32
demonstrates that responsive design has the potential to substantially alter the
substantive conclusions we reach from analyses of survey data on demographic topics
across a range of topics. The results also suggest our understanding of these
consequences of adding cases through responsive design will require investigation of
each specific topic we study, even within the same survey.
The findings are consistent with the growing body of evidence from survey
methodological research, which shows that for some estimates in a survey
nonresponse bias can be fatal; for others, it remains a minor issue (Groves 2006;
Keeter et al. 2000). In fact, this same evidence demonstrates that nonresponse bias
varies greatly across measures within the same survey. This means that at any one
level of overall survey nonresponse, different measures will suffer from different levels
of nonresponse bias. A key implication of this finding is that the overall survey
response rate actually tells us very little about the level of nonresponse bias in any
particular measure (Groves 2006). The value of the responsive design phase sample in
the NSFG is that the researcher is alerted to the variation in nonresponse bias
sensitivity across key estimates of interest. Knowing this, the researcher can then use
paradata to guide interventions to target efforts that increase response rates in specific
subgroups to reduce nonresponse bias in those key measures of interest. This process
does not eliminate nonresponse bias, but uses the information to reduce nonresponse
bias.
RECENT ADVANCES IN RESPONSIVE DESIGN AND PROSPECTS FOR DEMOGRAPHIC DATA COLLECTION
Greater reluctance to participate in surveys appears here to stay. Reluctance has
been growing among all types of surveys, including both phone surveys and face-to-
face surveys, which are the mainstay of demographic research (de Leeuw and de Heer
2002). We have no reason to expect that reluctance to participate in surveys will begin
to decline. This growing reluctance substantially increases the costs of creating survey
data with the same basic nonresponse properties. Survey data collection is always
characterized by fundamental cost-error tradeoffs (Groves and Couper 1998).

Responsive Survey Design, Demographic Data Collection, and Models of Demographic Behavior 33
Methodological decisions in survey design and execution are fundamentally efforts to
either reduce costs at a given level of quality or improve quality at a given level of
costs. In the face of increasing nonresponse and the potential for increasing
nonresponse bias in survey results, responsive design is an essential tool for balancing
control of survey data collection costs with control of potential nonresponse error and
bias.
Responsive design clearly has the potential to improve the representation
qualities of surveys by bringing other people into a study, people who are different
from those who participate in response to the main study protocol. Using analyses of
NSFG Cycle 6 data that compare main phase respondents to responsive design phase
respondents, we demonstrate that responsive design adds respondents who are more
likely to be older, working full time, foreign born, highly educated and from specific
racial groups. In reference to the core topics of NSFG measurement, these responsive
design phase respondents are also likely to have had large numbers of sexual partners,
to have been married, and to have had children. Respondents added during the
responsive design phase even have significantly different attitudes, at least with
respect to some attitude domains. Many of these differences among those added in the
responsive design phase fit theories of nonresponse that hypothesize those people
facing the most time pressure in their daily lives will be the least likely to accept
requests for survey interviews (Groves and Couper 1998). But other factors may also
be keeping people from agreeing to participate. Responsive design, however, is an
essential tool for adding significantly different groups of people into a survey.
Not only are these new additions to the survey different, but adding these cases
to our multivariate models of demographic behaviors has the potential to alter the
substantive conclusions we reach from analyzing those models. Estimating a series of
different multivariate models using data from the NSFG Cycle 6, we find numerous
statistically significant differences among coefficients estimated on respondents added
to the study during the responsive design phase. Sometimes these differences are big
enough to produce sign changes in the estimated coefficients that would dramatically
alter substantive conclusions based on these multivariate analyses. Because our

Responsive Survey Design, Demographic Data Collection, and Models of Demographic Behavior 34
investigation was constrained by the relatively small size of the NSFG Cycle 6
responsive design phase sample, we are only able to detect the very largest of these
differences. As efforts to use responsive design to control nonresponse bias increase,
the numbers of respondents added in responsive phases are likely to grow, and as
responsive design protocols become more effective, the differences between the
responsive phase respondents and main phase respondents may also grow. Thus we
have every reason to expect the consequences of responsive design for estimates of
substantive models of demographic behavior will only grow in the future.
In fact the NSFG is both using and improving responsive design in Cycle 7. Cycle
7 of the NSFG reflects a substantial design change relative to all previous cycles of the
NSFG, called continuous interviewing. Like the Census’s American Community Survey,
the continuous interviewing NSFG is always in the field collecting data that can be
cumulated over time into large data sets that continuously span historical time. The
NSFG Cycle 7 rotates across primary sampling units (PSUs) on an annual basis to
provide lower sampling error when aggregated across larger units of time. Within each
annual set of PSUs the sample is worked in four replicates that provide quarterly
sampling units and a fresh work flow four times a year. Within each quarter the study
is conducted in two phases, a main phase and a responsive design phase. The replicate
study design allows lessons learned from previous replicates to be applied in each new
replicate, so that responsive design based interventions can be continuously adapted to
changing social conditions and can provide continually improving responsive design
effects. As a result responsive design has been extraordinarily effective at maintaining
high response rates and highly balanced samples across key sub-groups in the NSFG
sample design (Groves et al. 2005).
At the same time, the tools to implement responsive designs continue to
improve. The computerization of survey data collection continues to improve through
the creation of newer and more capable automated systems for the centralized
management of large scale, geographically dispersed survey data collection operations
(Cheung 2007). These improvements continue to fuel the creation of more and more
paradata, giving survey methodologists more and more information to use in building

Responsive Survey Design, Demographic Data Collection, and Models of Demographic Behavior 35
management models for responsive design that draw on paradata to improve the
efficiency of data collection (Couper and Lyberg 2005). Greater applications of these
tools across the internet allows paradata to flow to centralized managers continuously,
greatly improving the speed of analysis and the speed of adjustments to data collection
protocols. All indications are that these technical breakthroughs will continue to occur
at a fast clip. From this we expect greater use of paradata to design more effective
responsive design strategies, greater use of responsive design in large scale data
collections, and more effective implementations of responsive design so that the
resulting survey data are more and more shaped by these approaches.
Finally, although the technologies and methods needed for responsive design
are most prevalent in the United States, Canada, and few rich countries of Western
Europe, we have every reason to expect this approach to survey data collection will
quickly spread worldwide. The technology for using responsive design, including both
computerized data collection and internet based management of geographically
dispersed data collection staff, are spreading worldwide quickly. In fact, in some poor
countries with large populations in rural areas, electronic data collection is frequently
being proposed to overcome other logistical barriers. For example, China is currently
launching its first large scale national survey data collection using CAPI technologies
and electronic tools for centralized management of a national field staff. As
computerization and internet access spreads, not only will it be possible for other
countries to implement responsive designs in survey data collection, but it will also be
possible to engage in centralized management and coordination of international data
collections across many different countries. Technical and sometimes legal barriers
may impede free flow of survey management data across national borders, but
eventually the efficiency gains and improved scientific quality of such coordination is
likely to produce this outcome.
Thus we introduce responsive design here fully expecting it to be a central
aspect of demographic data collection for decades to come. Based on our analysis of
NSFG Cycle 6 data we argue that responsive design has enormous potential to improve
the representative qualities of demographic data while at the same time controlling the

Responsive Survey Design, Demographic Data Collection, and Models of Demographic Behavior 36
costs of producing the most scientifically advanced data possible. However we also
caution that consequences of responsive design include the possibility of
fundamentally altering the substantive conclusions we reach from analyses of complex
multivariate models. In fact, these consequences are not only likely to differ across
studies, but they are likely to differ across topics, models, and even coefficients within
the same study. So, careful attention to the consequences of these responsive design
advances will also likely become a fundamental component of demographic analyses of
survey data.

Responsive Survey Design, Demographic Data Collection, and Models of Demographic Behavior 37
REFERENCES Bloom, D.E. and N.G. Bennett. 1990. "Modeling American Marriage Patterns." Journal of the American
Statistical Association 85(412):1009-1017.
Botman, S.L. and O.T. Thornberry. 1992. "Survey Design Features Correlates of Nonresponse." Pp. 309-314 in Proceedings of the Section on Survey Research Methods. Alexandria, VA: American Statistical Association.
Cheung, G.-Q. 2007. "Mixed-Mode Sample Management System: An Early Glance." Presented at International Blaise Users’ Conference, Annapolis, MD.
Couper, M.P. 1998. "Measuring Survey Quality in a CASIC Environment." Presented at the Survey Research Methods Section of the American Statistical Association.
Couper, M.P. and L.E. Lyberg. 2005. "The Use of Paradata in Survey Research." Presented at Proceedings of the 55th Session of the International Statistical Institute, Sydney, Australia.
Darroch, J.E., D.J. Landry, and S. Oslak. 1999. "Age Differences Between Sexual Partners in the United States." Family Planning Perspectives 31(4):160-167.
de Leeuw, E. and W. de Heer. 2002. "Trends in Household Survey Nonresponse: A Longitudinal and International Comparison." Pp. 41-54 in Survey Nonresponse, edited by R.M. Groves, D.A. Dillman, J.L. Eltinge, and R.J.A. Little. New York: Wiley.
Finer, L.B. and S.K. Henshaw. 2006. "Disparities in Rates of Unintended Pregnancy in the United States, 1994 and 2001." Perspectives on Sexual and Reproductive Health 38(2):90-96.
Goyder, J. 1985. "Face-to-Face Interviews and Mailed Questionnaires: The Net Difference in Response Rate." Public Opinion Quarterly 49(2):234-252.
Groves, R.M. 1987. "Research on Survey Data Quality." Public Opinion Quarterly 51(2: 50th Anniversary Supplement):S156-S172.
Groves, R.M. 1989. Survey Errors and Survey Costs. New York: Wiley.
Groves, R.M. 2006. "Nonresponse Rates and Nonresponse Bias in Household Surveys." Public Opinion Quarterly 70(5):646-675.
Groves, R.M., G. Benson, W. Mosher, J. Rosenbaum, P. Granda, W.G. Axinn, J. Lepkowski, and A. Chandra. 2005. "Plan and Operation of Cycle 6 of the National Survey of Family Growth." in Vital Health Statistics. Hyattsville, MD: National Center for Health Statistics.
Groves, R.M. and M.P. Couper. 1998. Nonresponse in Household Interview Surveys. New York: Wiley.
Groves, R.M. and S.G. Heeringa. 2006. "Responsive Design for Household Surveys: Tools for Actively Controlling Survey Errors and Costs." Journal of the Royal Statistical Society: Series A (Statistics in Society) 169(3):439-457.
Groves, R.M. and E. Peytcheva. 2008. "The Impact of Nonresponse Rates on Nonresponse Bias: A Meta-Analysis." Public Opinion Quarterly 72(2):167-189.

Responsive Survey Design, Demographic Data Collection, and Models of Demographic Behavior 38
Guzzo, K.B. and F.F. Furstenberg Jr. 2007. "Multipartnered Fertility Among American Men." Demography 44(3):583-601.
Hapuarachchi, P., M. March, and A. Wronski. 1997. "Using Statistical Methods Applicable to Autocorrelated Processes to Analyze Survey Process Quality Data." Pp. 589-600 in Survey Measurement and Process Quality, edited by L. Lyberg, P. Biemer, M. Collins, E. de Leeuw, C. Dippo, N. Schwarz, and D. Trewin. New York: Wiley.
Hayford, S.R. and S.P. Morgan. 2008. "Religiosity and Fertility in the United States: The Role of Fertility Intentions." Social Forces 86(3):1163-1188.
Keeter, S., C. Miller, A. Kohut, R.M. Groves, and S. Presser. 2000. "Consequences of Reducing Nonresponse in a National Telephone Survey." Public Opinion Quarterly 64(2):125-148.
Laumann, E.O., J.H. Gagnon, R.T. Michael, and S. Michaels. 1994. The Social Organization of Sexuality: Sexual Practices in the United States. Chicago: University of Chicago Press.
Manlove, J., C. Logan, E. Ikramullah, and E. Holcombe. 2008. "Factors Associated With Multiple-Partner Fertility Among Fathers." Journal of Marriage and Family 70(2):536-548.
Manlove, J., E. Terry-Humen, and E. Ikramullah. 2006. "Young Teenagers and Older Sexual Partners: Correlates and Consequences for Males and Females." Perspectives on Sexual and Reproductive Health 38(4):197-207.
Rindfuss, R.R., S.P. Morgan, and C.G. Swicegood. 1988. First Births in America: Changes in the Timing of Parenthood. Berkeley: University of California Press.
Scheuren, F. 2001. "Macro and Micro Paradata for Survey Assessment." Presented at the United Nations Work Session on Statistical Metadata, Washington, D.C.
Singer, E. 2002. "The Use of Incentives to Reduce Nonresponse in Household Surveys." Pp. 163-178 in Survey Nonresponse, edited by R.M. Groves, D.A. Dillman, J.L. Eltinge, and R.J.A. Little. New York: Wiley.
Smith, T.W. 1992. "Discrepancies Between Men and Women in Reporting Number of Sexual Partners: A Summary from Four Countries." Social Biology 39(3-4):203-211.
Thornton, A., W.G. Axinn, and D.H. Hill. 1992. "Reciprocal Effects of Religiosity, Cohabitation, and Marriage." The American Journal of Sociology 98(3):628-651.
Thornton, A., W.G. Axinn, and Y. Xie. 2007. Marriage and Cohabitation. Chicago: University of Chicago Press.
Tourangeau, R., L.J. Rips, and K.A. Rasinski. 2000. The Psychology of Survey Response. Cambridge: Cambridge University Press.
Traugott, M.W., R.M. Groves, and J.M. Lepkowski. 1987. "Using Dual Frame Designs to Reduce Nonresponse in Telephone Surveys." Public Opinion Quarterly 51(4):522-539.
Zhang, L. 2008. "Religious Affiliation, Religiosity, and Male and Female Fertility." Demographic Research 18:233-262.

Related Documents


![Nigeria Demographic and Health Survey 2018 [FR359]](https://static.cupdf.com/doc/110x72/63133c5ac72bc2f2dd03f3a8/nigeria-demographic-and-health-survey-2018-fr359.jpg)

![Zimbabwe Demographic and Health Survey 1988 [FR43]](https://static.cupdf.com/doc/110x72/631ece0a5ff22fc74506de46/zimbabwe-demographic-and-health-survey-1988-fr43.jpg)


![Pakistan Demographic and Health Survey 2012-13 [FR290]](https://static.cupdf.com/doc/110x72/631f305f13819e2fbb0f9fbf/pakistan-demographic-and-health-survey-2012-13-fr290.jpg)