Plant Ecology 155: 147–156, 2001. © 2001 Kluwer Academic Publishers. Printed in the Netherlands. 147 Responses of fen plant species to groundwater level and light intensity Wiktor Kotowski 1,2,∗ , Jelte van Andel 1 , Rudy van Diggelen 1 & Jacob Hogendorf 1 1 Laboratory of Plant Ecology, University of Groningen, P.O. Box 14, 9750 AA Haren, The Netherlands 2 Current address: Department of Nature Protection in Rural Areas, Institute of Land Reclamation and Grassland Farming at Falenty, 05-090 Raszyn, Poland ∗ Author for correspondence (e-mail: [email protected]) Received 11 March 1999; accepted in revised form 29 February 2000 Key words: Fen species, Groundwater level, Light intensity, Response analysis, Vegetation zonation Abstract Characteristic species of sedge-moss fen communities occur in constantly wet, nutrient-poor sites with a high penetration of light through the vegetation canopy. We studied the effects of water table depth and differences in light intensity on the performance of fen species. Three fen species (Carex curta, Viola palustris, Hydrocotyle vulgaris) and one species with a wide range of occurrence (Poa trivialis) were grown for 10 weeks in a sedge-moss peat substrate at 4 different water levels and 3 light intensities. In all species differences in light availability had a larger effect on biomass production than differences in water level. Under a light availability reduced to only 10% the root weight ratio of all the species decreased while leaf weight ratio increased. The biomass allocation ratios were hardly affected by differences in water level. For Viola and Hydrocotyle an interaction between the two factors was observed. Poa did not show particular differences compared to the other species. We discuss the results in the context of the establishment of fen species in riparian vegetation. It is suggested that the occurrence of fen species in the landscape is directly related to the availability of light, whereas the relationship between fen species occurrence and hydrological conditions seems to be an indirect one. Introduction Lowland riverside-wetlands are appreciated both by ecologists and nature conservation bodies because of the recognition of their natural value (e.g., Wheeler 1988). A significant part of this value is represented by sedge-moss fens, communities that are characterised by a high cover of brown mosses, several species of small sedges, and the occurrence of characteristic di- cotyledonous plants with a small stature. Sedge-moss fens (further referred to as ‘fens’) are low productive and occur in permanently wet sites with little water level fluctuation (Succow 1988). Normally fens occur in a relatively narrow zone along the margins of the valley and are usually bor- dered on both sites by more productive vegetation types. In the direction of the river, floodplains oc- cur with highly productive large sedge communities, which form dense canopies. At the valley margin, where the average groundwater level is lower and fluctuations are larger, the fen vegetation usually bor- ders with alder woods. These woods are often con- verted into meadows occupied by various herbaceous plant communities. The biomass production at these sites is much higher than in the fens and the vege- tation consists of many perennial plants with broad shade-casting leaves. The water level is usually accepted as a mas- ter environmental factor controlling the fen habitat- conditions (e.g., Succow (1988); Okruszko (1995)). The direct influence, i.e., controlling the water avail- ability, is generally not regarded as significant in fens and fen-related communities because of the high wa- ter capillary rise in peat soils (Schweikle 1990). It is believed to act mostly in an indirect way. Firstly, it controls the nutrient availability by affecting peat mineralisation rate (Godshalk & Wetzel 1978; Swift et al. 1979; Okruszko 1995). After a drop of the groundwater level the decomposition becomes largely accelerated (Grootjans 1985) and large amounts of

Welcome message from author
This document is posted to help you gain knowledge. Please leave a comment to let me know what you think about it! Share it to your friends and learn new things together.
Transcript
Plant Ecology 155: 147–156, 2001.© 2001 Kluwer Academic Publishers. Printed in the Netherlands.
147
Responses of fen plant species to groundwater level and light intensity
Wiktor Kotowski1,2,∗, Jelte van Andel1, Rudy van Diggelen1 & Jacob Hogendorf1
1Laboratory of Plant Ecology, University of Groningen, P.O. Box 14, 9750 AA Haren, The Netherlands 2Currentaddress: Department of Nature Protection in Rural Areas, Institute of Land Reclamation and Grassland Farmingat Falenty, 05-090 Raszyn, Poland ∗Author for correspondence (e-mail: [email protected])
Received 11 March 1999; accepted in revised form 29 February 2000
Key words: Fen species, Groundwater level, Light intensity, Response analysis, Vegetation zonation
Abstract
Characteristic species of sedge-moss fen communities occur in constantly wet, nutrient-poor sites with a highpenetration of light through the vegetation canopy. We studied the effects of water table depth and differences inlight intensity on the performance of fen species. Three fen species (Carex curta, Viola palustris, Hydrocotylevulgaris) and one species with a wide range of occurrence (Poa trivialis) were grown for 10 weeks in a sedge-mosspeat substrate at 4 different water levels and 3 light intensities. In all species differences in light availability hada larger effect on biomass production than differences in water level. Under a light availability reduced to only10% the root weight ratio of all the species decreased while leaf weight ratio increased. The biomass allocationratios were hardly affected by differences in water level. For Viola and Hydrocotyle an interaction between the twofactors was observed. Poa did not show particular differences compared to the other species. We discuss the resultsin the context of the establishment of fen species in riparian vegetation. It is suggested that the occurrence of fenspecies in the landscape is directly related to the availability of light, whereas the relationship between fen speciesoccurrence and hydrological conditions seems to be an indirect one.
Introduction
Lowland riverside-wetlands are appreciated both byecologists and nature conservation bodies because ofthe recognition of their natural value (e.g., Wheeler1988). A significant part of this value is represented bysedge-moss fens, communities that are characterisedby a high cover of brown mosses, several species ofsmall sedges, and the occurrence of characteristic di-cotyledonous plants with a small stature. Sedge-mossfens (further referred to as ‘fens’) are low productiveand occur in permanently wet sites with little waterlevel fluctuation (Succow 1988).
Normally fens occur in a relatively narrow zonealong the margins of the valley and are usually bor-dered on both sites by more productive vegetationtypes. In the direction of the river, floodplains oc-cur with highly productive large sedge communities,which form dense canopies. At the valley margin,where the average groundwater level is lower and
fluctuations are larger, the fen vegetation usually bor-ders with alder woods. These woods are often con-verted into meadows occupied by various herbaceousplant communities. The biomass production at thesesites is much higher than in the fens and the vege-tation consists of many perennial plants with broadshade-casting leaves.
The water level is usually accepted as a mas-ter environmental factor controlling the fen habitat-conditions (e.g., Succow (1988); Okruszko (1995)).The direct influence, i.e., controlling the water avail-ability, is generally not regarded as significant in fensand fen-related communities because of the high wa-ter capillary rise in peat soils (Schweikle 1990). Itis believed to act mostly in an indirect way. Firstly,it controls the nutrient availability by affecting peatmineralisation rate (Godshalk & Wetzel 1978; Swiftet al. 1979; Okruszko 1995). After a drop of thegroundwater level the decomposition becomes largelyaccelerated (Grootjans 1985) and large amounts of
148
nutrients are released (Verhoeven 1986). Secondly,high groundwater level creates anaerobic conditionsand thus changes soil redox potential (Gambrell &Patrick 1978; De Mars & Wassen 1999); the responseto such conditions differs among species (Armstrong1978). The effect of water regime on environmentalconditions in wetlands is usually accompanied by theinfluence of chemical composition of water, in partic-ular the effect of pH on nutrient availability. E.g., theavailability of phosphorous is reduced under alkalineconditions, while nitrogen occurs in different formsat different pH levels (Verhoeven 1986; Koerselmanet al. 1993; De Graaf et al. 1998). In fens, these factorsare related to the source of water, which may havehigh or low content of minerals, depending on theirabundance in the subsoil and on the importance ofrainwater feeding (Van Wirdum 1993; Van Diggelenet al. 1996). On this basis fens are further differenti-ated into poor and rich ones. Irrespective of this dif-ferentiation however, the high and stable groundwaterlevel remains a necessary condition for the occurrenceof a group of sedge-moss fen communities. Manyauthors use the hydrological conditions that controlthe nutrient availability in wetlands to explain theafore-described vegetation zonation (e.g., Kulczyñski(1949); Pałczyñski (1984); Grootjans (1985); Succow(1988); Wassen (1990); Wassen et al. (1990); VanDiggelen et al. (1991a)). Those explanations present,in fact, complex ecological responses of vegetationtypes or plant species, but they do not consider the ac-tual physiological requirements of species. Such dataare used also for predictive modelling in nature man-agement and restoration ecology (Van Diggelen et al.1991b; Barendregt et al. 1993; Alkemade et al. 1998).However, when descriptive data on species’ responsesto hydrological conditions are being compared be-tween distinct areas, differences are found (Kotowskiet al. 1998). Such differences of realized habitats(cf., Looijen 1995; 1999) between different areas mayresult from differences in competitive interactions.
It has been long recognised that differences in lightavailability directly influence plant growth through anumber of constituent processes of photosynthesis,affecting the structure of chloroplasts and changingthe plant’s biomass allocation pattern (e.g., Boardman(1977); Wilson (1988); Stitt & Schulze (1994)). Otherstudies proved that light availability, defined also asphoton flux density, varies greatly between differentcommunities (Fliervoet 1984) as well as verticallywithin a vegetation stand (Fliervoet 1984; Hirose &Werger 1995; Anten & Hirose 1999). Dependence
of species distribution patterns on light availabilityhas been shown by, amongst others, Pierson et al.(1990) for forest grass Bromus tectorum, by Lentz& Chippollini (1998) for an emergent sedge Scir-pus ancistrochaetus and by Kooiman (1993) for fenbryophyte Scorpidium scorpioides. Light availabilitywas also found to explain a large part of the varia-tion in floristic composition of coastal wetlands (Grace& Pugesek 1997), savannas (Pivello et al. 1999) andwooded meadows (Einarsson & Milberg 1999). In thepresent contribution we analyse the relevance of lightintensity in controlling the performance of a group ofphanerogam species characteristic of sedge-moss fens.Since most fen species can be classified as weak com-petitors for light (cf. Boutin & Keddy (1993)), onemay expect that a significant part of their potentialhabitats be restricted through competition from otherspecies. This implies that their association with wetand nutrient-poor sites does not have to be a directrelationship, but may result from a displacement frommore fertile sites through competition for light. To ex-plore this hypothesis, we compare the effect of lightintensity with the effect of water level depth on thegrowth of low-competitive fen species. In particularwe aim at answering the question, whether the fenspecies could tolerate low water-level conditions typ-ical of more productive sites if light was sufficientlyavailable.
Material and methods
Species
Species to be used in the experiment had to meet thefollowing conditions: (1) occur frequently in fens onminerotrophic sites and infrequently in eutrophic sites,(2) be typical examples of low-competitive species (cf.Boutin & Keddy (1993)), (3) belong to different fam-ilies. We compared them with a species of differentbehaviour. This species should have: (1) a wide eco-logical range, occurring both in fen and in other typesof wetlands, (2) the ability to grow in the shade ofvegetation canopy.
Three fen species were chosen: Viola palustris,Carex curta and Hydrocotyle vulgaris, which are allcharacteristic of poor fen communities. As a specieswith wider ecological range, we used Poa trivialis.This grass species grows in nutrient-poor fens as wellas in meadows and highly productive large sedgecommunities.
149
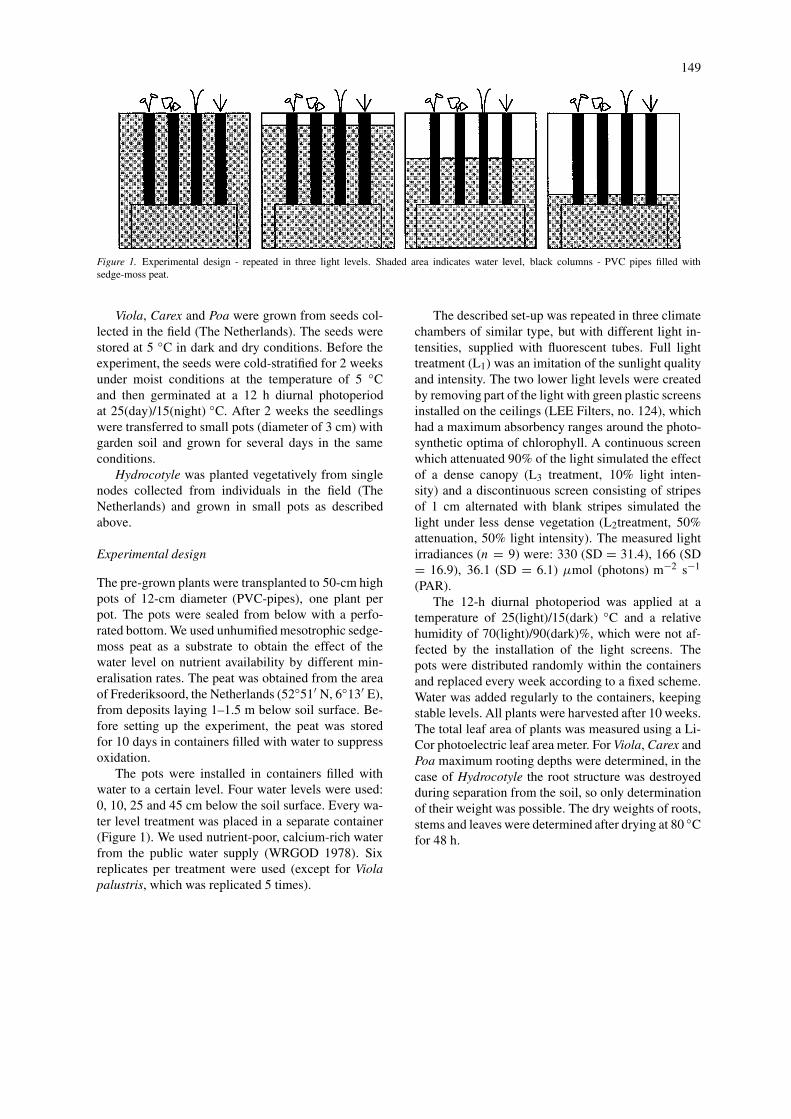
Figure 1. Experimental design - repeated in three light levels. Shaded area indicates water level, black columns - PVC pipes filled withsedge-moss peat.
Viola, Carex and Poa were grown from seeds col-lected in the field (The Netherlands). The seeds werestored at 5 ◦C in dark and dry conditions. Before theexperiment, the seeds were cold-stratified for 2 weeksunder moist conditions at the temperature of 5 ◦Cand then germinated at a 12 h diurnal photoperiodat 25(day)/15(night) ◦C. After 2 weeks the seedlingswere transferred to small pots (diameter of 3 cm) withgarden soil and grown for several days in the sameconditions.
Hydrocotyle was planted vegetatively from singlenodes collected from individuals in the field (TheNetherlands) and grown in small pots as describedabove.
Experimental design
The pre-grown plants were transplanted to 50-cm highpots of 12-cm diameter (PVC-pipes), one plant perpot. The pots were sealed from below with a perfo-rated bottom. We used unhumified mesotrophic sedge-moss peat as a substrate to obtain the effect of thewater level on nutrient availability by different min-eralisation rates. The peat was obtained from the areaof Frederiksoord, the Netherlands (52◦51′ N, 6◦13′ E),from deposits laying 1–1.5 m below soil surface. Be-fore setting up the experiment, the peat was storedfor 10 days in containers filled with water to suppressoxidation.
The pots were installed in containers filled withwater to a certain level. Four water levels were used:0, 10, 25 and 45 cm below the soil surface. Every wa-ter level treatment was placed in a separate container(Figure 1). We used nutrient-poor, calcium-rich waterfrom the public water supply (WRGOD 1978). Sixreplicates per treatment were used (except for Violapalustris, which was replicated 5 times).
The described set-up was repeated in three climatechambers of similar type, but with different light in-tensities, supplied with fluorescent tubes. Full lighttreatment (L1) was an imitation of the sunlight qualityand intensity. The two lower light levels were createdby removing part of the light with green plastic screensinstalled on the ceilings (LEE Filters, no. 124), whichhad a maximum absorbency ranges around the photo-synthetic optima of chlorophyll. A continuous screenwhich attenuated 90% of the light simulated the effectof a dense canopy (L3 treatment, 10% light inten-sity) and a discontinuous screen consisting of stripesof 1 cm alternated with blank stripes simulated thelight under less dense vegetation (L2treatment, 50%attenuation, 50% light intensity). The measured lightirradiances (n = 9) were: 330 (SD = 31.4), 166 (SD= 16.9), 36.1 (SD = 6.1) µmol (photons) m−2 s−1
(PAR).The 12-h diurnal photoperiod was applied at a
temperature of 25(light)/15(dark) ◦C and a relativehumidity of 70(light)/90(dark)%, which were not af-fected by the installation of the light screens. Thepots were distributed randomly within the containersand replaced every week according to a fixed scheme.Water was added regularly to the containers, keepingstable levels. All plants were harvested after 10 weeks.The total leaf area of plants was measured using a Li-Cor photoelectric leaf area meter. For Viola, Carex andPoa maximum rooting depths were determined, in thecase of Hydrocotyle the root structure was destroyedduring separation from the soil, so only determinationof their weight was possible. The dry weights of roots,stems and leaves were determined after drying at 80 ◦Cfor 48 h.
150
Data analysis
The following response parameters were calculated:biomass (total and specific of roots, stems and leaves),root weight ratio (RWR = root weight/ total biomass),leaf weight ratio (LWR = leaf weight/total biomass),leaf area ratio (LAR = leaf area/total biomass) androoting depth. Preliminary analysis by Levene’s testrevealed highly heteroscedastic distributions of mostvariables. Therefore, to test the significance of the ef-fects of light intensity and water level on the responsevariables, we used a non-parametric factorial ANOVA,i.e., the two-way Kruskal–Wallis test by ranks. A post-hoc Tukey’s honestly significant difference test wasused to find particular differences between treatments(Zar 1984).
Results
Light supply effect
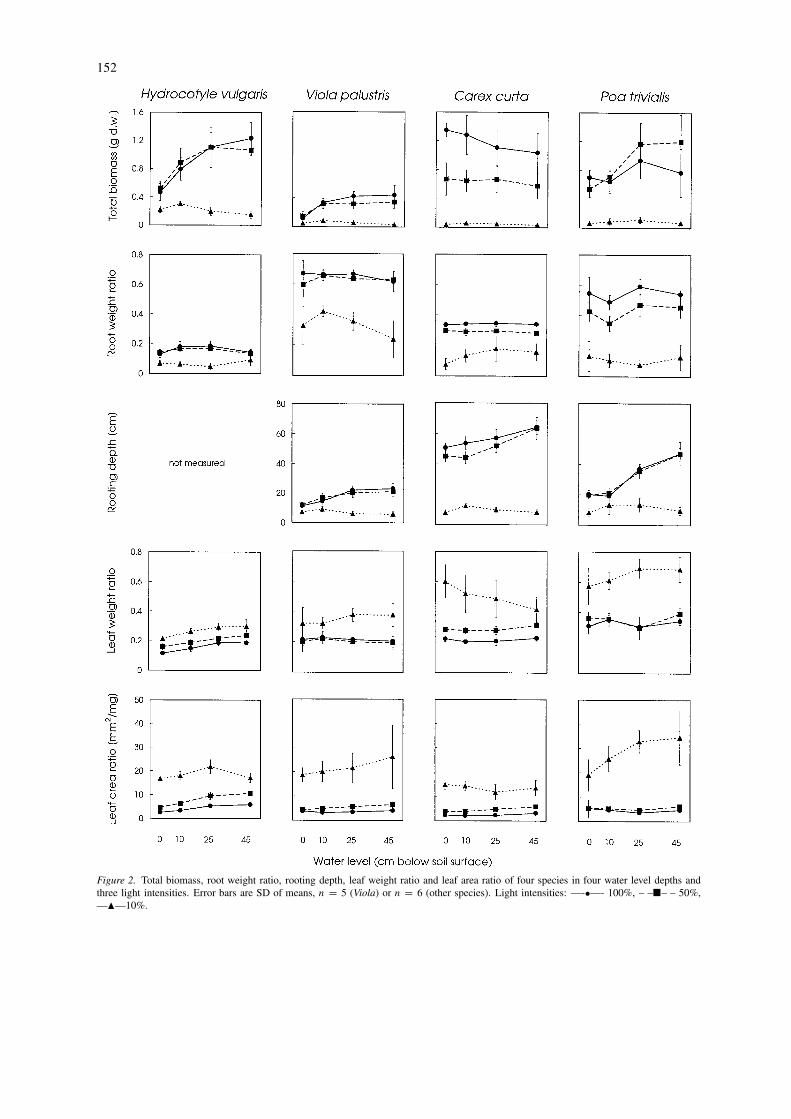
There was a highly significant effect of light level(P < 0.001) for all the species and all variables (Ta-ble 1). The post-hoc Tukey’s test revealed that themain effect was caused by the L3 treatment (10%). Inall cases the effect of light intensity was much largerthan the effect of water level. For Hydrocotyle, Violaand Poa the biomass in the L3 treatment was signif-icantly lower than the biomass of treatments L1 andL2, which did not differ significantly (Figure 2). Inthe case of Carex, the biomass at all three light leveltreatments differed significantly from each other. Theeffect of light reduction on biomass production washighest for Carex and lowest for Viola. The biomassof roots, stems and leaves showed similar responses asthe total biomass values (Table 1).
For all the species the root weight ratio (RWR)was much lower in the lowest light treatment (L3)than at two higher irradiances. For Poa and CarexRWR differed significantly between all three treat-ments. Rooting depth was negatively affected by lightlevel for three species (not measured for Hydrocotyle).In the lowest light treatment (L3) the plants produceda much more shallow root system than in two higherlight levels; Carex showed also an effect of intermedi-ate light treatment, however much lower than in thelowest light. The leaf weight ratio (LWR), revealeda reverse response patterns as RWR, it was howeversignificantly different between all three treatments forthe three species (in case of Viola only the L3 dif-fered). Leaf area ratio (LAR) differed between three
light levels for all species, being highest in the lowestlight level.
Water level effect
The water level differences had an effect on the bio-mass production of Viola (P < 0.001), Hydrocotyle(P < 0.001) and Poa (P < 0.01) and on Carex.The highest water level (0 cm) resulted in the lowestbiomass production. When the effect of water levelis analysed independently from light level, the bio-mass production at the three higher water levels didnot differ (Hydrocotyle, Viola) or differed only slightly(Poa). However when analysed separately for eachlight level clear differences occurred (see paragraph‘interaction’). Biomass values of roots, leaves andstems revealed similar response as the total biomass(Table 1).
The biomass allocation ratios and leaf area ratiowere significantly affected by water level only for Hy-drocotyle (P < 0.01 for RWR, P < 0.001 for LWRand LAR). In this case RWR was lowest in two inter-mediate water levels. Leaf weight ratio and leaf arearatio increased with lowering the water level. The root-ing depth was positively affected by the increase ofwater table depth for three species where it was mea-sured (P < 0.001 for Carex and Poa, P < 0.01 forViola). This effect differed within light treatments.
Interaction
There was a significant interaction between water leveland light level for Viola concerning biomass parame-ters (P < 0.05) and for Hydrocotyle concerning bothbiomass (P < 0.01) and root weight ratio (P < 0.01);the rooting depth showed an effect of interaction forall three species analysed (Viola and Carex P < 0.05,Poa P < 0.01). The interaction effect on biomass wasvery similar for Hydrocotyle and Viola (Figure 2). Inthe two higher light levels there was a clear increaseof biomass production with lowered water tables; theintermediate light level caused slightly lower produc-tion at the water level of −45 cm (both species) and−25 cm (Viola only). When the light intensity wasreduced to 10% the shape of the response curve to-wards water level was very different (Figure 2): thebiomass of both species was highest at the water levelof −10 cm and decreased at lower water tables.
A similar response pattern was observed concern-ing rooting depths of the three species analysed. Attwo higher light levels the rooting depth increased withlowered water levels. For Viola it varied from 10 to

151
Tabl
e1.
Non
para
met
ric
two-
way
AN
OV
Aby
rank
sfo
rth
eef
fect
ofw
ater
leve
lan
dlig
htin
tens
ityon
four
spec
ies
and
all
depe
nden
tva
riab
les.
Post
-hoc
show
sth
ere
sults
ofT
ukey
’sho
nest
lysi
gnifi
cant
diff
eren
ces
test
atα
=0.0
5.T
B=
tota
lbio
mas
s,R
B=
root
biom
ass,
SB=
stem
biom
ass,
LB
=le
afbi
omas
s,SH
B=
shoo
tbio
mas
s,R
WR
=ro
otw
eigh
trat
io,R
D=
root
ing
dept
h,LW
R=
leaf
wei
ghtr
atio
,LA
R=
leaf
area
ratio
.In
post
-hoc
:w
ater
leve
ls,1
=0
cm,2
=10
cm,3
=20
cm,4
=45
cmbe
low
soil
surf
ace;
light
leve
ls,1
=10
0%,2
=50
%,3
=10
%.S
igni
fican
ceva
lues
:∗ =
0.05
>P
>0.
01,∗
∗ =0.
01>
P>
0.00
1,∗∗
∗=
P<
0.00
1,ns
=no
tsig
nific
ant.
Var
iabl
eSo
urce
dfH
ydro
coty
levu
lgar
isVi
ola
palu
stri
sC
arex
curt
aPo
atr
ivia
lis
χ2
Post
-hoc
χ2
Post
-hoc
χ2
Post
-hoc
χ2
Post
-hoc
12
34
12
34
12
34
12
34
TB
Wat
erle
vel
317
.56∗
∗∗a
bb
b19
.84∗
∗∗a
bb
b2.
52ns
12.4
0∗∗
aab
cbc
Lig
htle
vel
210
6.20
∗∗∗
bb
a76
.21∗
∗∗b
ba
136.
71∗∗
∗c
ba
106.
13∗∗
∗b
ba
Inte
ract
ion
619
.77∗
∗14
.44∗
2.03
ns8.
37ns
RB
Wat
erle
vel
317
.65∗
∗∗a
bb
b17
.10∗
∗∗a
bb
b2.
35ns
12.5
6∗∗
aa
bb
Lig
htle
vel
210
7.26
∗∗∗
bb
a83
.97∗
∗∗b
ba
139.
14∗∗
∗c
ba
106.
50∗∗
∗b
ba
Inte
ract
ion
616
.42∗
11.2
5ns
2.77
ns10
.35
ns
SBW
ater
leve
l3
14.7
1∗∗
ab
bb
21.7
9∗∗∗
ab
bb
3.49
ns3.
39ns
Lig
htle
vel
210
6.43
∗∗∗
bb
a47
.27∗
∗∗b
ba
123.
56∗∗
∗c
ba
116.
47∗∗
∗b
ca
Inte
ract
ion
619
.97∗
∗29
.78∗
∗∗3.
10ns
4.38
ns
LB
Wat
erle
vel
339
.67∗
∗∗a
bbc
c26
.62∗
∗∗a
bb
b2.
40ns
9.72
∗a
abb
b
Lig
htle
vel
279
.14∗
∗∗b
ca
61.4
4∗∗∗
bb
a12
2.31
∗∗∗
cb
a10
4.02
∗∗∗
bb
a
Inte
ract
ion
626
.02∗
∗∗13
.94∗
4.11
ns5.
61ns
SHB
Wat
erle
vel
317
.41∗
∗∗a
bb
b24
.59∗
∗∗a
bb
b3.
12ns
8.26
∗a
abb
b
Lig
htle
vel
210
6.27
∗∗∗
bb
a57
.75∗
∗∗b
ba
124.
24∗∗
∗c
ba
110.
95∗∗
∗b
ca
Inte
ract
ion
621
.07∗
∗20
.61∗
∗3.
32ns
5.78
ns
RW
RW
ater
leve
l3
12.3
4∗∗
ab
bab
5.11
ns1.
62ns
5.09
ns
Lig
htle
vel
297
.91∗
∗∗b
ba
86.1
6∗∗∗
bb
a13
7.09
∗∗∗
cb
a12
3.68
∗∗∗
cb
a
Inte
ract
ion
618
.84∗
∗1.
35ns
2.97
ns4.
33ns
LWR
Wat
erle
vel
339
.85∗
∗∗a
bc
c2.
46ns
2.60
ns6.
54ns
Lig
htle
vel
210
4.49
∗∗∗
ab
c67
.04∗
∗∗a
ab
132.
38∗∗
∗a
bc
108.
66∗∗
∗a
bc
Inte
ract
ion
63.
32ns
3.70
ns5.
39ns
8.21
ns
LA
RW
ater
leve
l3
18.1
8∗∗∗
ab
cc
4.00
ns5.
58ns
5.52
ns
Lig
htle
vel
212
8.44
∗∗∗
ab
c10
6.82
∗∗∗
ab
c13
5.99
∗∗∗
ab
c11
6.17
∗∗∗
ab
c
Inte
ract
ion
66.
74ns
4.95
ns6.
10ns
7.04
ns
RD
Wat
erle
vel
3–
14.8
9∗∗
ab
bcc
16.5
2∗∗∗
ab
bc
26.6
5∗∗∗
aa
bb
Lig
htle
vel
2–
82.8
1∗∗∗
bb
a11
3.33
∗∗∗
cb
a92
.20∗
∗∗b
ba
Inte
ract
ion
6–
16.3
4∗16
.21∗
18.0
5∗∗
152
Figure 2. Total biomass, root weight ratio, rooting depth, leaf weight ratio and leaf area ratio of four species in four water level depths andthree light intensities. Error bars are SD of means, n = 5 (Viola) or n = 6 (other species). Light intensities: —-•—- 100%, – –�– – 50%,—�—10%.

153
20 cm and for Poa between 20 and 50 cm. Carex de-veloped deeper roots and in the full light treatment itreached 50 cm (the bottom of pots) at all water leveldepths, however in the lower water level treatmentsit produced longer roots (up to 70 cm), which werecurled at the pot bottom. In the low light treatment,where the root system was much shallower, its depthdid not increase with lowered water tables.
Discussion
The experiment
Our paper reports the short-term effects of water leveland light availability on the growth of seedlings. Weinterpret the results as relevant to the establishmentprocesses in fen and meadow vegetation. A regu-lar (re-) establishment of species is crucial for themaintenance of vegetation.
Both investigated factors were applied at levelswhich fen species are confronted with in the field.The lowest experimental light level (10%) is typical ofthe situation below the canopy of productive meadowvegetation, which develops after draining a fen (Flier-voet 1984). The lowest applied water level (−45 cm)is typical of stands of such meadow communities.Consistent with the introduction, we interpret the ap-plied water level gradient as a complex factor thatcomprises, firstly – a fertility gradient caused by var-ious mineralisation rates, secondly – a gradient fromanaerobic to aerobic conditions and thirdly – a wateravailability gradient.
Realized vs. potential habitats
It was found that differences in light intensity af-fected plant growth much more than differences ofwater level. Light reduction to 10% suppressed thebiomass production dramatically and largely increasedthe proportion of biomass allocated to leaves, causingthe development of a very weak and shallow rootingsystem. Generally, the effects of light reduction aresimilar to those reported in the literature (e.g., Grime(1979); Wilson (1988)) and can be interpreted as a ten-dency to invest a greater proportion of assimilates inphotosynthetically active organs when light is in shortsupply.
Lowering the water table resulted in a higher bio-mass production of Viola and Hydrocotyle. This effectmay be attributed to higher mineralisation rates in less
water-saturated peat and/or to higher oxygen avail-ability in the soil. Based on these results we wouldlocate the physiological preferences of Viola and Hy-drocotyle at rather eutrophic sites with low waterlevels. This effect, however, was found at higher lightintensities only, while the maximum biomass was pro-duced at the water level of −10 cm under the lowestlight level. This interaction between water level andlight intensity suggests that the reduction of avail-able light was especially severe for plants at lowerwater levels. We suppose that this effect is due to alimited availability of water and/or nutrients. In lowlight plants allocate a much higher proportion of thebiomass to leaves and develop a very weak rootingsystem. They are therefore less efficient in absorptionand transport of water and dissolved substances thanthe plants grown in full light. Moreover, the water useefficiency (ratio between the rate of assimilation andthe rate of transpiration) decreases further in loweredlight conditions due to a decrease of Rubisco activity(enzyme responsible for CO2 fixation in the Calvincycle) (Stitt & Schulze 1994). This implies that un-der dark conditions plants are more sensitive to waterstress than in full light. Such a trade-off in the simul-taneous use of light and water (or other resources) wasproposed by Smith & Huston (1989) as a selectiveforce distinguishing plant functional types and hencestructuring communities in terms of succession andzonation pattern. Although water deficiency is gener-ally not expected in fens, the interaction between lightand water level effects that was found in our experi-ment suggests that this mechanism may be relevant toexplain the absence of some fen species from heavilyshaded sites with dense canopies.
The lack of any response of Carex curta towardsdifferences in water level seems to point to anatomi-cal and physiological adaptations in the roots of thisspecies to water logged soils. Many Carex species areknown for their ability to oxidise the root zone, whichmakes them less sensitive to anaerobic circumstances(Moog 1998; Moog & Brugemann 1998).
No particular difference was found for Poa trivialisas compared to the three typical fen species. This sug-gests that a strong light reduction was critical for thisspecies as well. The fact that, unlike the fen species,Poa trivialis occurs also in very dense meadow veg-etation can be due to some other adaptations, e.g.,phenological ones.
Our results did not reveal any preference of theexamined fen species towards high water levels andfor two species an opposite preference was found.
154
Yet, according to the field data (e.g., Wierda et al.1997) the fen species occur in stands with stable highgroundwater levels, thus in nutrient-poor conditions.Consequently, these sites are ‘rich’ in light availability– which was found in our experiment to have a ma-jor effect on species establishment. The results are inagreement with our hypothesis about light conditionsas the main factor controlling fen species distribu-tion. Thus, in concert with the concept of centrifugalcommunity organisation (Rosenzweig & Abramsky1986; Keddy 1989), we see fen plant species as be-ing excluded from nutrient-rich wetlands due to thecompetition for light.
Implications
The ecological responses of species are tradition-ally the focus of bioindicative phytosociology (e.g.,Jeglum (1971); Ellenberg (1974); Everts et al. (1988);Kłosowski et al. (1995)). Extensive hydro-ecologicalscreenings of fen ecosystems resulted in attributingmany fen species and communities to sites with par-ticular moisture, pH and trophic status (e.g., Jeglum(1971); Succow (1988)). Hence, terms ‘mesotrophic’vs. ‘eutrophic’ are now commonly used when address-ing various wetland species. Although applicable toenvironmental indication, this terminology does nothave to denote actual preferences of species. Wheeler& Shaw (1995b) reported that many fen species per-formed well when cultivated in normal garden soil(thus highly eutrophic) without the need to maintain ahigh water level. In fact, it might be more appropriateto classify many of the fen plants as ‘light demandingspecies’ instead of using the above-mentioned terms.We want to stress that the relationship between theoccurrence of fen species and the hydrological con-ditions may be an indirect one. Perhaps it could besplit into three separate mechanisms: (1) the influenceof hydrological (and hydro-chemical) conditions onnutrient availability, (2) the negative relationship be-tween site fertility and the amount of light under thevegetation canopy and (3) the relationship between theoccurrence of fen species and light conditions. Thefirst relationship is likely to be quite constant on alarger geographical scale and was confirmed by com-parisons between the Netherlands and eastern-Poland(Wassen 1990; Wassen et al. 1996). Yet, the secondcorrelation, i.e., dependence of light conditions underthe canopy on site fertility, may be less constant, be-cause it depends on the community species pool (cf.,Zobel et al. 1998) which is involved in competition.
Furthermore, the effect of light intensity on species’performance, which is responsible for the third part ofthe model, seems to interact significantly with water-uptake for some fen species. An implication of theforegoing would be that the applicability of fen speciesas bio-indicators of hydrological conditions is lim-ited to the vegetation types and geographical locationswhere relevant data were sampled. The same holds forpredictions and predictive modelling based on descrip-tive studies. Complex approaches to describe realisedniches of wetland plants for predictive applications arementioned by Gignac (1994), but at the same time heconsiders such predictions of limited use because theydisregard the importance of competition or succession.
Fens are currently receiving growing attentionfrom restoration ecologists (Wheeler & Shaw 1995a;Grootjans & Van Diggelen 1995; Van Diggelen 1998)due to on-going degradation of this type of ecosys-tems on a large scale (Goodwillie 1980). Raising waterlevels, sod-cutting and extensive mowing or grazingmanagement have become standard restoration mea-sures in fens (Bakker 1989; Koerselman & Verhoeven1995; Van Diggelen 1998). We hypothesise that forsome, perhaps many, species, the actual effect of theseactions lies in the enlargement of available light dueto lowering the canopy density and/or elimination ofstrong competitors.
Acknowledgements
This work was partly supported by a grant of the DutchOrganisation for Scientific Research NWO (grant 805-35.853). We would like to thank Ab Grootjans andtwo anonymous reviewers for valuable comments onthe earlier version of this paper, Latzi Fresco for ad-vice concerning the statistical analyses and MichaelMcDonnell-Alexander for improving the English. Weappreciate the technical assistance of Bert Venema andMarleen Stoutjesdijk.
References
Alkemade, J. R. M., van Grinsven, J. J. M., Wiertz, J. & Kros,J. 1998. Towards integrated national modelling with particularreference to the environmental effects of nutrients. Environ. Poll.102: 101–105.
Anten, N. P. R. & Hirose, T. 1999. Interspecific differences in above-ground growth patterns result in spatial and temporal partitioningof light among species in a tall-grass meadow. J. Ecol. 87: 583–597.
155
Armstrong, W. 1978. Root aeration in the wetland condition. Pp:269–299. In: Hook, D. D. & Crawford R. M. M. (eds), Plant inAnaerobic Environment. Ann Arbor, Mich.
Bakker, J. 1989. Nature management by grazing and cutting.Kluwer, Academic Publishers, Dordrecht.
Barendregt, A., Wassen, M. J. & de Smidt, J. T. 1993. Hydro-ecological modelling in a polder landscape: a tool for wetlandmanagement. Pp. 79–99. In: Vos, C. C. & Opdam, P. (eds), Land-sape ecology of a stressed environment. Chapman and Chall,London.
Boardman, N. K. 1977. Comparative photosynthesis of sun andshade plants. Ann. Rev. Plant Physiol. 28: 355–377.
Boutin, C. & Keddy, P. A. 1993. A functional classification ofwetland plants. J. Veg. Sci. 4: 591–600.
De Graaf, M. C. C., Bobbink, R., Roelofs, J. G. M. & Verbeek,P. J. M. 1998. Differential effects of ammonium and nitrate onthree heathland species. Plant Ecol. 135: 185–196.
De Mars, H. & Wassen, J. M. 1999. Redox potentials in relationto water levels in different mire types in the Netherlands and inPoland. Plant Ecol. 140: 41–51.
Einarsson, A. & Milberg, P. 1999. Species richness and distributionin relation to light in wooded meadows and pastures in southernSweden. Ann. Bot. Fenn. 36: 99–107.
Ellenberg, H. 1974. Zeigewerte der Gefässpfanzen Mitteleuropas.Scripta Geobotanica Band 9. Göttingen.
Everts, F. H., Grootjans, A. P. & de Vries, N. J. P. 1988. Distri-bution of marshplants as guidelines for hydrological research.Colloques Phytosociologiques 16: 271–292.
Fliervoet, L. 1984. Canopy structures of Dutch grassland. Thesis.Stichting Studentenpers, Nijmegen.
Gambrell, R. P. & Patrick, W. H., Jr. 1978. Chemical and morpho-logical properties of anaerobic soils and sediments. Pp. 375–423.In: Hook, D. D. & Crawford R. M. M. (eds), Plant in anaerobicenvironment. Ann Arbor, Mich.
Gignac, L. D. 1994. Peatland species preferences: an overview ofour current knowledge base. Wetlands 14: 216–222.
Godshalk, G. L. & Wetzel, R. G. 1978. Decomposition of aquaticangiosperms I. Dissolved components. Aquat. Bot. 5: 281–300.
Goodwillie, R. 1980. European peatlands. Council of Europe,Nature and Environment Series, No. 19, Strasbourg.
Grace, J. B. & Pugesek B. H. 1997. A structural equation model ofplant richness and its application to a coastal wetland. Am. Nat.149: 436–460.
Grime J. P. 1979. Plant strategies and vegetation processes. JohnWiley, New York.
Grootjans, A. P. 1985. Changes of groundwater regime in wetmeadows. Thesis. University of Groningen, Groningen, TheNetherlands.
Grootjans, A. P. & Van Diggelen, R. 1995. Assesing the restora-tion prospects of degraded fens. Pp. 73–90. In: Wheeler B. D.,Shaw S. C., Fojt W. J. & Robertson R. A. (eds), Restoration oftemperate wetlands. Willey, Chichester.
Hirose, T. & Werger M. J. A. 1995. Canopy structure and photonflux partitioning among species in a herbaceous plant commu-nity. Ecology 76: 466–474.
Jeglum, J. K. 1971. Plant indicators of pH and water level in peat-lands at Candle Lake, Saskatchewan. Can J. Bot. 49: 1661–1676.
Keddy, P. A. 1989. Competition. Champan and Hall Ltd., London.Kłosowski, S., Tomaszewicz, H. & Tomaszewicz, G. 1995. Habi-
tat conditions of Calletum palustris, Menyantetum trifoliataeand Potentilletum palustris in north-eastern Poland. Tuexenia 15:205–219.
Koerselman, W., Van Kerkhoeven, M. B. & Verhoeven, J. T. A.1993. Release of inorganic nitrogen, phosphorus and potassium
in peat soils: Effect of temperature, water chemistry and waterlevel. Biogeochemistry 20 (2): 63–81.
Koerselman, W. & Verhoeven, J. T. A. 1995. Eutrophication of FenEcosystems: External and Internal Nutrient Sources and Restora-tion Strategies. Pp. 91-112. In: Wheeler, B. D., Shaw, S. C.,Fojt, W. J. & Robertson, R.A. (eds), Restoration of temperatewetlands. Willey, Chichester.
Kooiman, A. M. 1993. Causes of the replacement of Scorpidiumscorpioides by Caliergonella cuspidata in eutrophicated rich fens.1. Field studies. Lindbergia 18: 78–84.
Kotowski, W., Van Diggelen, R. & Kleinke, J. 1998. Behav-iour of wetland plant species along a moisture gradient in twogeographically distant areas. Acta Bot. Neerl. 47: 337–349.
Kulczyñski, S. 1949. Peatbogs of Polesie. Mem. Acad. Pol. Sci.Lett. Cl. Math. Sci. Nat. Ser. B15, Cracow, 365 pp.
Lentz, K. A. & Cipollini D. F., Jr. 1998. Effect of light and simulatedherbivory on growth of endangered northeastern bulrush, Scirpusancistrochaetus Schuyler. Plant Ecol. 139: 125–131.
Looijen, R. C. 1995. On the distinction between habitat and niche,and some implications for species’ differentiation. Poznan Stud.Phil. Sci. Hum. 45: 87–108.
Looien, R. C. 1999. Holism and reductionism in biology and ecol-ogy. The mutual dependence of higher and lower level researchprogrammes. Kluwer Academic Publishers, Dordrecht, 372 pp.
Moog, P. R. 1998. Flooding tolerance of Carex species. I. Rootstructure. Planta 207: 189–198.
Moog, P. R. & Bruggemann, W. 1998. Flooding tolerance of Carexspecies. II. Root gas exchange capacity. Planta 207: 199–206.
Okruszko, H. 1995. Influence of Hydrological differentiation offens on their transformation after dehydration and on possibil-ities for restoration. In: Wheeler, B.D., Shaw, S.C., Fojt, W.J.& Robertson, R.A. (eds), Restoration of Temperate Wetlands.Wiley, Chichester, pp. 113–119.
Pałczyñski, A. 1984. Natural differentiation of plant communitiesin relation to hydrological conditions of the Biebrza valley. Pol.Ecol. Stud. 10: 347–358.
Pierson, E. A., Mack, R. N. & Black R. A. 1990. The effectof shading on photosynthesis, growth, and regrowth followingdefoliation for Bromus tectorum. Oecologia 84: 534–543.
Pivello, V. R., Nagako., S. C. & Tadeu, M. S. 1999. Alien grasses inBrazilian savannas: A threat to the biodiversity. Biodiv. Conserv.8: 1281–1294.
Rosenzweig, M. L. & Abramsky, Z. 1986. Centrifugal communityorganisation. Oikos 46: 339–348.
Schweikle, V. 1990. Physik des Torfes und der Moorböden.Pp. 272–283. In: Göttlich, K. (eds), Moor- und Torfkunde.Schweizerbart’sche Verlagsbuchhandlung (Nägele u. Ober-miller), Stuttgart.
Smith, T. & Huston, M. 1989. A theory of the spatial and temporaldynamics of plant communities. Vegetatio 83: 49–69.
Stitt, M. & Schulze D. 1994. Does Rubisco control the rate ofphotosynthesis and plant growth? An exercise in molecularecophysiology. Plant, Cell Environ. 17: 465–487.
Succow, M. 1988. Landschaftsökologische Moorkunde. GustawFisher Verlag, Jena.
Swift, M. J., Heal, O. W. & Anderson, J. M. 1979. Decompositionin terrestrial ecosystems. Blackwell, London, 372 pp.
Van Diggelen, R. 1998. Moving gradients. Assessing restorationprospects of degraded brook valleys. Thesis. University Gronin-gen, Groningen, The Netherlands.
Van Diggelen, R., Grootjans, A. P., Kemmers, R. H., Kooijman,A. M., Succow, M., De Vries, N. P. J. & Van Virdum, G.1991a. Hydro-ecological analysis of the fen system Lieper Posse,Eastern Germany. J. Veg. Sci. 2: 465–476.

156
Van Diggelen, R., Grootjans, A. P., Wierda, A., Burkunk, R. &Hoogendoorn, J. 1991b. Prediction of vegetation changes underdifferent hydrological scenarios. Pp. 71–80. In: Nachtnebel, H. P.& Kovar, K. (eds), Hydrological basis of ecologically soundmanagement of soil and groundwater. IHAS Publ. 202.
Van Diggelen, R., Molenaar, W. J. & Kooijman, A. M. 1996. Veg-etation succession in a floating mire in relation to managementand hydrology. J. Veg. Sci. 7: 809–820.
Van Wirdum, G. 1993. An ecosystems approach to base-rich fresh-water wetlands, with special reference to fenlands. Hydrobiolo-gia 265: 129–153.
Verhoeven, J. T. A. 1986. Nutrient dynamics in minerotrophic peatmires. Aqua. Bot. 25: 117–137.
Wassen, M. J. 1990. Water flow as a Major Landscape EcologicalFactor in Fen Development. Thesis, University of Utrecht.
Wassen, M. J., Barendregt, A., Pałczyñski, A., de Smidt, J. T. & deMars, H. 1990. The relationship between fen vegetation gradi-ents, groundwater flow and flooding in an undrained valley mireat Biebrza, Poland. J. Ecol. 78: 1106–1122.
Wassen, M. J., Van Diggelen, R., Wołejko, L., Verhoeven, J. T. A.1996. A comparison of fens in natural and artificial landscapes.Vegetatio 126: 5–26.
Wheeler, B. D. 1988. Species richness, species rarity and conser-vation of rich-fen vegetation in lowland England and Wales. J.Ecol. 25: 331–353.
Wheeler, B. D., Shaw, S. C. 1995a. A focus on fens. Pp. 49–72. In:Wheeler, B. D., Shaw, S. C., Fojt, W. J. & Robertson, R. A. (eds),Restoration of temperate wetlands. Willey, Chichester.
Wheeler, B. D. & Shaw, S. C. 1995b. Plants as hydrologists? Anassessment of the value of plants as indicators of water condi-tions in fens. Pp. 63–82. In: Hughes, R. M. J. & Heathwaite,S. L. (eds), Hydrology and hydrochemistry of British wetlands,Willey, New York.
Wierda, A., Fresco, L. F. M., Grootjans, A. P. & van Diggelen,R. 1997. Numerical assessment of plant species as indicators ofgroundwater regime. J. Veg. Sci. 8: 707–716.
Wilson, J. B. 1988. A review of the evidence on the control ofshoot:root ratio in relation to models. Ann. Bot. 61: 443–449.
WRGOD. 1978. Regionaal geohydrologisch onderzoek in deprovincie Drenthe. Report of Werkgroep regionaal geohydrolo-gisch onderzoek in de provincie Drenthe (in Dutch).
Zar, J. H. 1984. Biostatistical analysis, 2nd ed. Prentice-Hall,Englewood Cliffs, NJ.
Zobel, M., Van Der Maarel, E. & Dupré, C. 1998. Species pool:the concept, its determination and significance for communityrestoration. J. Appl. Veg. Sci. 1: 55–66.
Related Documents