Journal of Plankton Research Vol.20 no.10 pp.1889-1914, 1998 Responses of epilimnetic phytoplankton to experimental nutrient enrichment in three small seepage lakes Kathryn L.Cottingham 1 - 3 , Stephen R.Carpenter 1 and Ann L.St. Amand 2 Center for Limnology, University ofWisconsin, 680 N. Park Street, Madison, WI 53706 and 2 PhycoTech, 520 Pleasant Street, Suite 210, St Joseph, MI 49085, USA 3 Present address: Department of Biological Sciences, Dartmouth College, 6044 Gilman Laboratory, Hanover, NH 03755-3576, USA Abstract. This paper describes the responses of three epilimnetic phytoplankton communities to experimental nitrogen and phosphorus enrichment as compared to the phytoplankton community in a fourth, unmanipulated, lake. Increased nutrient inputs increased total phytoplankton biomass, primary productivity, chlorophytes, cryptomonads and species turnover rates in all three enriched lakes; cyanobacteria increased in two of the three enriched lakes. However, nutrient addition also led to declines in previously dominant dinoflagellates and chrysophytes, and in species diversity. At the species level, there were large changes in community composition from year to year in both enriched and reference lakes, suggesting that phytoplankton community composition is highly dynamic even in the absence of enrichment. Overall, changes in total biomass, productivity and species diversity were consistent among the enriched lakes, while changes in species composition differed due to variation in the physical, chemical and biotic environment of each lake. This suggests that aggregated variates are more useful for quantitative prediction of nutrient effects, while species responses can be used to signal qualitative differences in environmental conditions among lakes. Introduction Eutrophication of lake ecosystems is of great concern, in part because humans rely heavily on clean water for fish, drinking, irrigation and industry. Research on eutrophication is extensive and ranges from comparative studies (Vollenweider, 1976) to deliberate whole-lake experiments to assess the impacts on lake physics, chemistry and biology (Schindler, 1977; Stockner, 1981; Holmgren, 1984; Johan- nessen et al., 1984; Perrin et al., 1984; Welch et al., 1989). Phytoplankton are the focal point for biological studies of eutrophication for several reasons. First, growth of primary producers is tied directly to nutrients, making phytoplankton the most likely group of organisms to respond to increased nutrient availability. Second, phytoplankton community composition can have strong influences on water quality. For example, toxin-producing cyanobacteria can make water unsafe for drinking (Repavich et al., 1990). Furthermore, the transfer of primary production to higher trophic levels depends on the effective utilization of the phytoplankton community as a food source. When zooplankton cannot effectively graze phytoplankton, the energy and nutrients contained within phytoplankton are lost from the pelagic food web. A predictive under- standing of the effects of increased nutrients on phytoplankton biomass, produc- tivity and community composition is therefore important. In this paper, we describe the responses of epilimnetic phytoplankton communities to identical and simultaneous nutrient additions in three experi- mental lakes. We describe changes in total biomass, primary productivity, major © Oxford University Press 1889 by guest on November 4, 2015 http://plankt.oxfordjournals.org/ Downloaded from

Welcome message from author
This document is posted to help you gain knowledge. Please leave a comment to let me know what you think about it! Share it to your friends and learn new things together.
Transcript

Journal of Plankton Research Vol.20 no.10 pp.1889-1914, 1998
Responses of epilimnetic phytoplankton to experimental nutrientenrichment in three small seepage lakes
Kathryn L.Cottingham1-3, Stephen R.Carpenter1 and Ann L.St. Amand2
Center for Limnology, University ofWisconsin, 680 N. Park Street, Madison, WI53706 and 2PhycoTech, 520 Pleasant Street, Suite 210, St Joseph, MI 49085, USA3Present address: Department of Biological Sciences, Dartmouth College, 6044Gilman Laboratory, Hanover, NH 03755-3576, USA
Abstract. This paper describes the responses of three epilimnetic phytoplankton communities toexperimental nitrogen and phosphorus enrichment as compared to the phytoplankton community ina fourth, unmanipulated, lake. Increased nutrient inputs increased total phytoplankton biomass,primary productivity, chlorophytes, cryptomonads and species turnover rates in all three enrichedlakes; cyanobacteria increased in two of the three enriched lakes. However, nutrient addition also ledto declines in previously dominant dinoflagellates and chrysophytes, and in species diversity. At thespecies level, there were large changes in community composition from year to year in both enrichedand reference lakes, suggesting that phytoplankton community composition is highly dynamic evenin the absence of enrichment. Overall, changes in total biomass, productivity and species diversitywere consistent among the enriched lakes, while changes in species composition differed due tovariation in the physical, chemical and biotic environment of each lake. This suggests that aggregatedvariates are more useful for quantitative prediction of nutrient effects, while species responses can beused to signal qualitative differences in environmental conditions among lakes.
Introduction
Eutrophication of lake ecosystems is of great concern, in part because humansrely heavily on clean water for fish, drinking, irrigation and industry. Research oneutrophication is extensive and ranges from comparative studies (Vollenweider,1976) to deliberate whole-lake experiments to assess the impacts on lake physics,chemistry and biology (Schindler, 1977; Stockner, 1981; Holmgren, 1984; Johan-nessen et al., 1984; Perrin et al., 1984; Welch et al., 1989).
Phytoplankton are the focal point for biological studies of eutrophication forseveral reasons. First, growth of primary producers is tied directly to nutrients,making phytoplankton the most likely group of organisms to respond to increasednutrient availability. Second, phytoplankton community composition can havestrong influences on water quality. For example, toxin-producing cyanobacteriacan make water unsafe for drinking (Repavich et al., 1990). Furthermore, thetransfer of primary production to higher trophic levels depends on the effectiveutilization of the phytoplankton community as a food source. When zooplanktoncannot effectively graze phytoplankton, the energy and nutrients containedwithin phytoplankton are lost from the pelagic food web. A predictive under-standing of the effects of increased nutrients on phytoplankton biomass, produc-tivity and community composition is therefore important.
In this paper, we describe the responses of epilimnetic phytoplanktoncommunities to identical and simultaneous nutrient additions in three experi-mental lakes. We describe changes in total biomass, primary productivity, major
© Oxford University Press 1889
by guest on Novem
ber 4, 2015http://plankt.oxfordjournals.org/
Dow
nloaded from

K.L-Cottinghani et al.
taxonomic groups (divisions), species diversity, species turnover rates and domin-ant species, and compare these patterns to those observed in an unmanipulatedreference lake during the same period. We also evaluate the extent to whichchanges in different phytoplankton variates vary among lakes subjected to thesame nutrient treatment.
Method
Study lakes and experimental manipulations
This paper focuses on epilimnetic phytoplankton communities in one reference(Paul) and three experimental (Peter, West Long and East Long) lake basins.All four basins are small (<4 ha), deep (maximum depths of 9-19 m), steep-sided,meromictic seepage lakes located within 5 km of one another at the Universityof Notre Dame Environmental Research Center near Land O'Lakes, WI, USA.The lakes are located within infertile glacial outwash soils and are surroundedby extensive Sphagnum mats; as a result, all four lakes have high dissolvedorganic carbon concentrations and relatively low pH (Carpenter and Kitchell,1993). Paul and Peter lakes were divided by an earthen dike in 1951; since then,Peter has been the focus of both liming and food web manipulations, while Paulhas been the unmanipulated reference basin (Carpenter and Kitchell, 1993).Long Lake was first manipulated in May 1991, when it was divided into threeseparate basins (East, West and Central) by plastic curtains (Christensen et al.,1996). For simplicity, we refer to the separated lake basins of the formerlycontiguous Paul-Peter and Long lakes as 'lakes', rather than 'lake basins',throughout this paper.
Each lake was monitored from mid-May to mid-September in each year.During 1991 and 1992, lakes were monitored under baseline nutrient conditions(phosphorus loading rates of -0.1-0.2 ug I"1 epilimnion day1)- From late Maythrough early September 1993 and 1994, nitrogen (N) and phosphorus (P) (asphosphate) were added daily to Peter, West Long and East Long lakes at a 25:1ratio by atoms (Carpenter etai, 1996). Nitrogen was added as both ammonia andnitrate at a ratio of -2.5:1 by weight. All nutrient additions occurred from acentral floating station within each lake; experiments with dye tracers confirmedthat all nutrients added in the center of the lake would be mixed throughout theepilimnion within 24 h (Schindler, 1995). In each year, approximately two-thirdsof the nutrients were added in the first half of the summer, which may mimicspring run-off events (Carpenter et al., 1996). The average daily P loading ratesin 1993 were 1.2 ug I"1 epilimnion day1 in Peter Lake, 1.4 ug H day1 in WestLong Lake and 1.3 ug I"1 day1 in East Long Lake. In 1994, P loading rates wereslightly lower, averaging 0.7 ug I"1 day1 in Peter Lake and 0.9 ug I"1 day1 in Westand East Long lakes (Carpenter et al., 1996, unpublished data).
Paul Lake was maintained as an unmanipulated reference system throughout1991-94. The fish community was dominated by adult largemouth bass(Micropterus salmoides), while the zooplankton were dominated by zooplanktiv-orous larvae of Chaoborus spp. and a mixed herbivore assemblage of large clado-cerans (especially Daphnia spp. and Holopedium gibberum Zaddach) and
1890
by guest on Novem
ber 4, 2015http://plankt.oxfordjournals.org/
Dow
nloaded from

Phytoplankton responses to experimental nutrient enrichment
moderately sized copepods (especially Cyclops varicans rubellus, Orthocyclopsmodestus Herrick and Skistodiaptomus sp.)- In 1993, there was a brief naturalperturbation in the form of a large cohort of young-of-year largemouth bass (Postetal., 1997). Planktivory by these fish eliminated the large cladocerans in late July,and small cladocerans (especially Bosmina longirostris Muller) dominated thezooplankton in August and September. Large cladoceran grazers recovered byMay 1994.
Peter Lake had high zooplanktivory for most of this study (Schindler et al.,1997; Carpenter et al., 1996). Stocked golden shiners (Notemigonus crysoleucas)dominated the fish community from 1991 through mid-summer 1994, when fishabundance declined precipitously (Carpenter et al., 1996; Schindler et al., 1997).The zooplankton community was dominated by rotifers and cyclopoid copepods(mostly Cvaricans rubellus) until the planktivory decline, when Daphnia spp.increased greatly.
Communities in West and East Long lakes were set up to mimic those in Pauland Peter, respectively. In West Long Lake, largemouth and smallmouth bass(M.salmoides and Micropterus dolomieu) dominated the fish community, whilelarge cladocerans (especially Daphnia pulex Leydig and Daphnia rosea Sars)dominated the zooplankton. Like Peter Lake, East Long Lake was stocked withzooplanktivorous golden shiners (N.crysoleucas) in May 1991, creating azooplankton community dominated by rotifers in 1991 and early 1992. However,the stocked fish did not survive (presumably due to pH: Christensen et al., 1996).Beginning in mid-1992, the zooplankton community was dominated by largeDaphnia.
Limnological analyses
During summer stratification (approximately mid-May to mid-September), wesampled each lake weekly at a central station (Carpenter and Kitchell, 1993;Voichick and LeBouton, 1994). We recorded temperature, oxygen and lightprofiles; sampled for zooplankton by taking two vertical hauls of the entire watercolumn with a calibrated 80-um-mesh net; and took van Dorn samples at 25, 50and 100% of surface irradiance for analysis of epilimnetic nutrient concentra-tions, primary productivity and phytoplankton community composition.
Zooplankton samples were chilled, preserved with cold sugared formalin, andenumerated and measured by species. Dry masses were calculated from lengthsusing taxon-specific regressions (Downing and Rigler, 1984). Soluble (orthophos-phate, ammonia and nitrate/nitrate) and total (phosphorus, nitrogen) nutrientconcentrations were determined with a Lachat autoanalyzer (Voichick andLeBouton, 1994) for each of the van Dorn samples, then averaged. Total phos-phorus was determined after persulfate digestion, and total Kjeldahl nitrogen wasdetermined after mercuric sulfate digestion.
Primary productivity (PPR) was measured monthly in 1991-92 and biweeklyin 1993-94 using in situ measurements of 14C fixation (Vollenweider, 1974) foreach van Dorn sample. Two 125 ml light bottles and a dichlorophenol dimethyl-urea (DCMU) control bottle were incubated with 185 kBq of NaH14CO3 at each
1891
by guest on Novem
ber 4, 2015http://plankt.oxfordjournals.org/
Dow
nloaded from

K.L.Cottingfaam et al.
depth from approximately 09:30 to 15:30 h. After incubation, phytoplankton werecollected on glass-fiber filters, rinsed with 1 N HC1 and dried overnight beforeliquid scintillation counting (Voichick and LeBouton, 1994).
Samples for phytoplankton identification were pooled from the three vanDorn samples, preserved in glutaraldehyde, filtered onto mixer ester nitrocellu-lose filters (0.45 um), and mounted in methacrylic resin (St. Amand, 1990). Threeslides were prepared and enumerated to species for each sample, with thevolume filtered for each slide scaled to cell density; volumes ranged from 5 to 30ml per slide. Each slide was then examined using an Olympus BHT compoundmicroscope equipped with Nomarski optics (X100, X200, X400 and X1000),phase optics (X400) and epifluorescence. Because phytoplankton in these lakescan vary in size by several orders of magnitude, counts were peformed atmultiple magnifications for all samples. Two different protocols were used,depending on the size and type of the dominant taxa. Protocol A was used whensamples were dominated by soft phytoplankton >10-20 um greatest axial lineardimension (GALD), and protocol B was used when samples were dominated bysoft phytoplankton that were fragile, difficult to identify, or <10-20 um in size.In both cases, we counted based on 'natural units', or the form in which eachtaxon appears. Specifically, when a taxon is a filament with multiple cells, thenatural unit is the filament; when a taxon appears as a spherical colony, thenatural unit is the colony and we measured cells per colony; and when a taxonappears as a single cell, the natural unit is a cell. In protocol A, a minimum of300 natural units and 15 fields were counted at X200 (maximum of 100 fields),then fragile, difficult to identify, and taxa <10 um GALD were counted at X400(minimum of 100 natural units and 10 fields). In protocol B, a minimum of 400natural units and 15 fields were counted at X400 (maximum of 100 fields), thentaxa above 20-30 um GALD were counted at X200 (minimum of 15 fields). Inboth protocols, the number of fields counted at X200 and X400 was distributedevenly among the three slides made for each sample, except for very large taxa(>200 um), which were counted at X100 on one entire slide only. In all cases, aminimum of 400 natural units per sample were identified. Counting for eachsample was completed when the standard error of the mean of the total numberof natural units per field was <10%.
During identification and enumeration, the GALD, width and depth weredetermined for up to 30 individuals of each taxon. We then estimated averageindividual biovolume (the protoplasm exclusive of loricae and sheaths) for eachtaxon using these measurements and standard geometric formulae (St. Amand,1990). Biovolume (um3 ml"1) was converted to fresh biomass (mg I"1) assuming1 um3 = 1 X 10"6 ug (Elser and Carpenter, 1988).
Evaluation of community responses
Phytoplankton community structure was evaluated at both weekly and seasonaltime scales. Total biomass, species diversity and the distribution of biomassamong taxonomic groups were examined weekly. Total phytoplankton biomasswas determined by summing the biomass of all taxa present in each lake on each
1892
by guest on Novem
ber 4, 2015http://plankt.oxfordjournals.org/
Dow
nloaded from

Phytoplankton responses to experimental nutrient enrichment
sampling date. Species diversity was calculated using Shannon-Wiener's index(Pielou, 1977). To assess shifts among different kinds of taxa, we aggregated allspecies into one of six major taxonomic groups (cyanobacteria, chlorophytes,cryptomonads, dinoflagellates, chrysophytes and others). In this study, 'others'includes diatoms and euglenoids (both of which were rare in all four lakes) as wellas cysts and unidentified taxa. We refer to these taxonomic groups as 'divisions'throughout this paper, as most of the groups correspond to strict taxonomicdivisions or phyla. The exception is the chrysophytes, for which the taxonomicplacement (class versus division) is still under debate.
Because the species richness was high (up to 180 species per year in each lake),species information was examined at a seasonal scale using species turnover rates(number of species 'exchanged' per year), community similarity (percentoverlap) and species ranks. Species turnover from year to year was assessed withthe index used by Magnuson et al. (1994):
^ gT _ ^gained
In equation (1), Tjk is the turnover rate from year/ to year k, Ngained is the numberof species present in year it but not in year/, Niost is the number of species presentin year/ but not in year k, N, is the total number of species in year/ and Nk is thetotal number of species in year k. Year-to-year similarity in each lake was assessedusing the seasonally averaged relative biomass from each year and theBray-Curtis similarity coefficient (Bray and Curtis, 1957). Seasonally averagedrelative biomass (bik) was calculated for each species i in year k as:
(2)
where m is the number of samples in year k, BtJ is the biomass of species i in sample/ and p is the number of species present in that year. Finally, species rankings(where one is the most dominant species) were determined separately for seasonalaverages of total and relative biomass (including zeros when a species was absent),then averaged as described by Elser and Carpenter (1988). In this paper, all specieswith an average ranking <10 were considered community dominants; the top fivespecies in each year, including ties, are included in Table I.
Results
Paul Lake
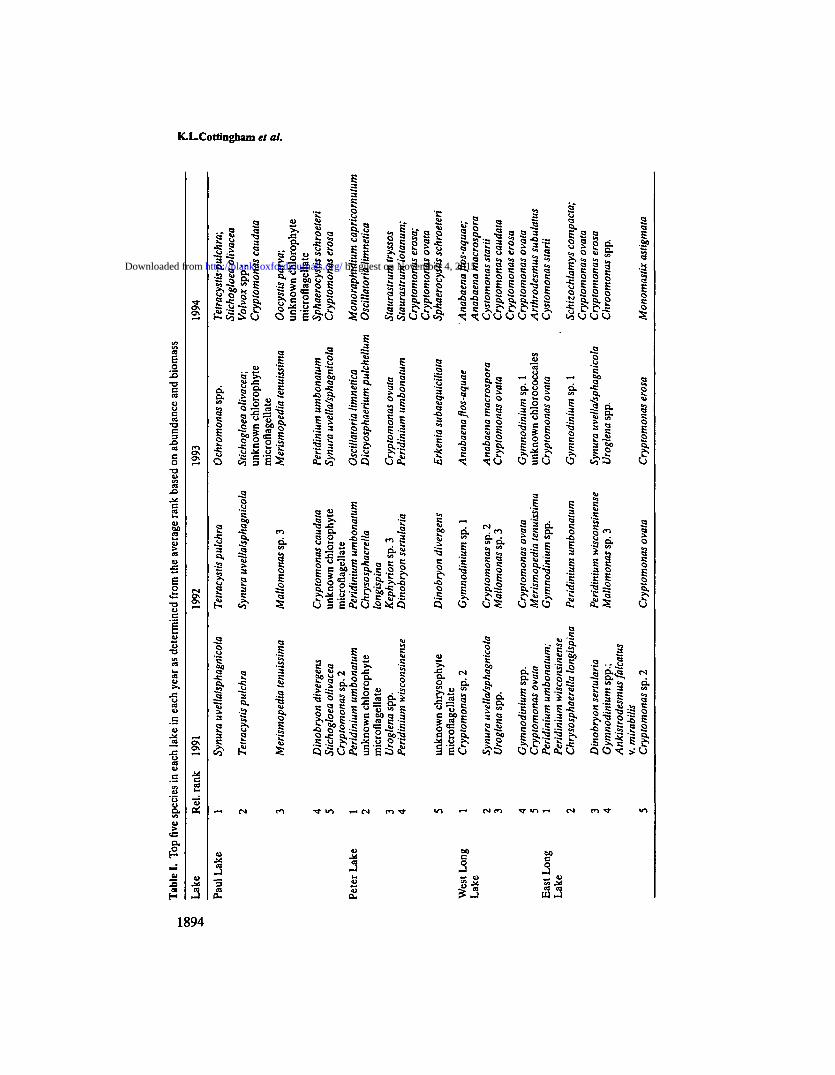
In unmanipulated Paul Lake, total phytoplankton biomass fluctuated slightlyfrom 1991 to 1994, but showed no sustained trend (Figure 1A). On average, totalbiomass was somewhat higher in 1992 and 1994 than in 1991 and 1993 (Figure
1893
by guest on Novem
ber 4, 2015http://plankt.oxfordjournals.org/
Dow
nloaded from
Tab
le I
. T
op f
ive
spec
ies
in e
ach
lake
in
each
yea
r as
det
erm
ined
fro
m t
he a
vera
ge r
ank
base
d on
abu
ndan
ce a
nd b
iom
ass
ooL
ake
Pau
l L
ake
Pet
er L
ake
Wes
t L
ong
Lak
e
Eas
t L
ong
Lak
e
Rel
. ra
nk
1 2 3 4 5 1 2 3 4 5 1 2 3 4 5 1 2 3 4 5
1991
Synu
ra
uvel
lals
phag
nico
la
Tet
racy
stis
pul
chra
Mer
ism
oped
ia
tenu
issi
ma
Din
obry
on
dive
rgen
sSt
icho
gloe
a ol
ivac
eaC
rypt
omon
as
sp. 2
Per
idin
ium
um
bona
tum
unkn
own
chlo
roph
yte
mic
rofl
agel
late
Uro
glen
a sp
p.P
erid
iniu
m w
isco
nsin
ense
unkn
own
chry
soph
yte
mic
rofl
agel
late
Cry
ptom
onas
sp
. 2
Synu
ra u
vella
/sph
agni
cola
Uro
glen
a sp
p.
Gym
nodi
nium
sp
p.C
rypt
omon
as
ovat
aP
erid
iniu
m
umbo
natu
m;
Per
idin
ium
wis
cons
inen
seC
hrys
osph
aere
lla
long
ispi
na
Din
obry
on
sert
ular
iaG
ymno
dini
um
spp.
;A
nkis
trod
esm
us
falc
atus
v. m
irab
ilis
Cry
ptom
onas
sp
. 2
1992
Tet
racy
stis
pul
chra
Synu
ra u
vella
lsph
agni
cola
Mal
lom
onas
sp.
3
Cry
ptom
onas
ca
udat
aun
know
n ch
loro
phyt
em
icro
flag
ella
teP
erid
iniu
m
umbo
natu
mC
hrys
osph
aere
llalo
ngis
pina
Kep
hyri
on s
p. 3
Din
obry
on s
ertu
lari
a
Din
obry
on
dive
rgen
s
Gym
nodi
nium
sp
. 1
Cry
ptom
onas
sp.
2M
allo
mon
as s
p. 3
Cry
ptom
onas
ov
ata
Mer
ism
oped
ia t
enui
ssim
aG
ymno
dini
um s
pp.
Per
idin
ium
um
bona
tum
Per
idin
ium
wis
cons
inen
seM
allo
mon
as s
p. 3
Cry
ptom
onas
ov
ata
1993
Och
rom
onas
spp
.
Stic
hogl
oea
oliv
acea
;un
know
n ch
loro
phyt
em
icro
flag
ella
teM
eris
mop
edia
te
nuis
sim
a
Per
idin
ium
um
bona
tum
Synu
ra u
vella
/sph
agni
cola
Osc
illat
oria
lim
netic
aD
icty
osph
aeri
um
pulc
hellu
m
Cry
ptom
onas
ov
ata
Per
idin
ium
um
bona
tum
Erk
enia
sub
aequ
icili
ata
Ana
baen
a fl
os-a
quae
Ana
baen
a m
acro
spor
aC
rypt
omon
as
ovat
a
Gym
nodi
nium
sp
. 1un
know
n ch
loro
cocc
ales
Cry
ptom
onas
ov
ata
Gym
nodi
nium
sp
. 1
Synu
ra u
vella
/sph
agni
cola
Uro
glen
a sp
p.
Cry
ptom
onas
er
osa
1994
Tet
racy
stis
pul
chra
;St
icho
gloe
a ol
ivac
eaV
olvo
x sp
p.;
Cry
ptom
onas
ca
udat
a
Ooc
ystis
par
va;
unkn
own
chlo
roph
yte
mic
rofl
agel
late
Spha
eroc
ystis
sc
hroe
teri
Cry
ptom
onas
er
osa
Mon
orap
hidi
um
capr
icor
nutu
mO
scill
ator
ia
limne
tica
Stau
rast
rum
tr
ysso
sSt
aura
stru
m i
otan
um;
Cry
ptom
onas
er
osa;
Cry
ptom
onas
ov
ata
Spha
eroc
ystis
sc
hroe
teri
Ana
baen
a fl
os-a
quae
;A
naba
ena
mac
rosp
ora
Cys
tom
onas
st
arii
Cry
ptom
onas
ca
udat
aC
rypt
omon
as
eros
aC
rypt
omon
as
ovat
aA
rthr
odes
mus
su
bula
tus
Cys
tom
onas
st
arii
Schi
zoch
lam
ys
com
pact
a;C
rypt
omon
as
ovat
aC
rypt
omon
as
eros
aC
hroo
mon
as
spp.
Mon
omas
tix
astig
mat
a
by guest on November 4, 2015http://plankt.oxfordjournals.org/Downloaded from
Phytoplankton responses to experimental nutrient enrichment
log10 (Total Biomass)A. Paul Lake
B. Peter Lake Plus N & P Plus N & P
E C. West Long Lake Plus N & P Plus N & P
10
1
0.1
0.
•
if/
East Long Lake
\
Plus N & P PIUS N & P
A •
•
1991 1992 1993 1994
Fig. 1. Total phytoplankton biomass (wet mass, mg H, on a log,q scale) in each lake from 1991 to1994. Dotted lines indicate the mean of all observations taken during that year in that lake.
1A). Primary productivity averaged 2-6 mg carbon (C) fixed irr3 h"1 with littleintra- or inter-annual variability (Figure 2A).
In 1991, Paul Lake was dominated by spring and fall blooms of chrysophytes(especially Synura uvella/sphagnicola Ehrenberg) with midsummer blooms ofchlorophytes (mainly Tetracystis pulchra Brown et Bold) and cryptomonads(Figure 3A). Dinoflagellates and cyanobacteria were at low levels throughout thesummer and never contributed >20% to the total biomass.
1895
by guest on Novem
ber 4, 2015http://plankt.oxfordjournals.org/
Dow
nloaded from

K-L.Cottingham el al.
Primary Productivity
65
52
39
26
13
0
A. Paul Lake
B. Peter Lake Plus N & P Plus N & P
D. East Long Lake Plus N & P Plus N & P
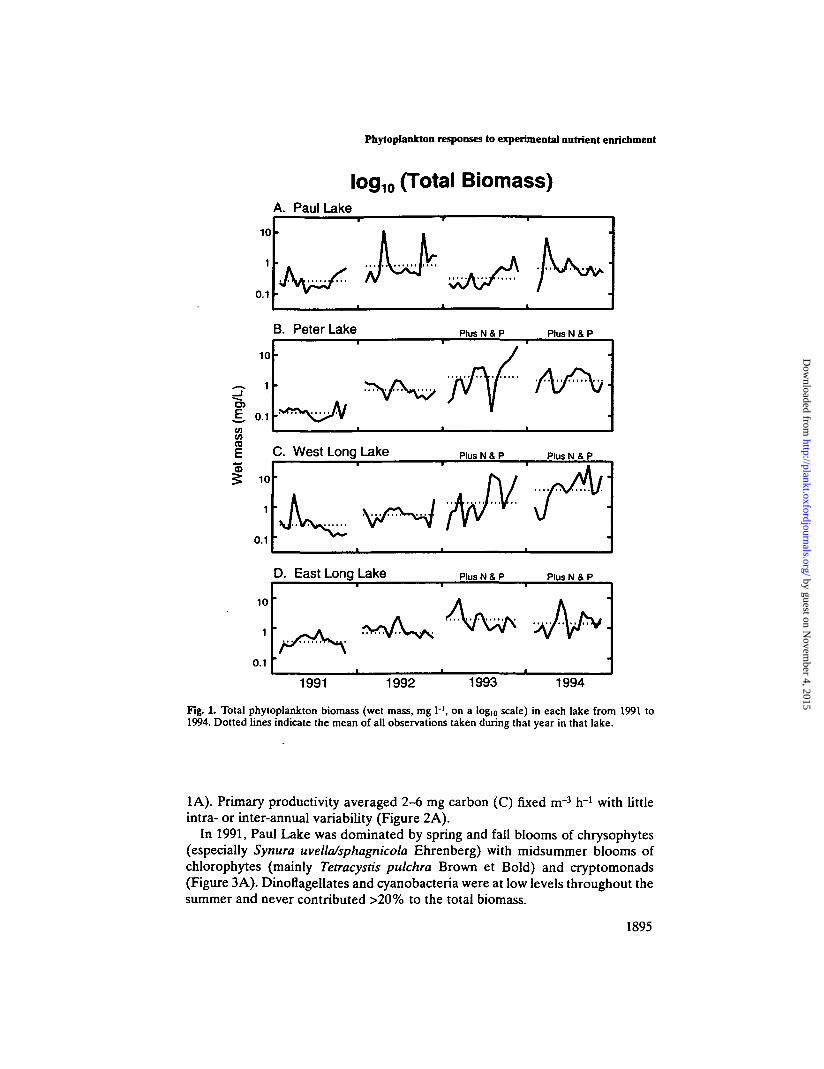
1991 1992 1993 1994Fig. 2. Primary productivity (mg C nr1 fr1) in each lake from 1991 to 1994. Dotted lines indicate themean of all observations taken during that year in that lake.
Similar patterns were observed in 1992, except that the fall bloom wascomposed of both chrysophytes and chlorophytes, not just chrysophytes. Domin-ant taxa again included T.pulchra and S.uvella/sphagnicola, as well asMallomonas sp. 3. [The numbering of species is used to indicate unique taxa thatwere seen repeatedly but could not be positively classified to a particular species;species were numbered chronologically as encountered by A.S.A.] Cryptomon-ads (especially C.caudata Schiller and C.ovata Ehrenberg) and cyanobacteria
1896
by guest on Novem
ber 4, 2015http://plankt.oxfordjournals.org/
Dow
nloaded from

Phytoplankton responses to experimental nutrient enrichment
A. Paul Lake
g Cyanobacteria• Cryptomonads
Chrysophytes
ChlorophytesDinoflagellatesOther
_ C. West Long LakeiS 100100
CD
Ia.
100D. East Long Lake
0 * * " -1991 1992 1993 1994
Fig. 3. Community composition (as a percent of total biomass) for phytoplankton divisions(cyanobacteria, chlorophytes, cryptomonads, dinoflagellates, chrysophytes, others) present in theselakes from 1991 to 1994.
1897
by guest on Novem
ber 4, 2015http://plankt.oxfordjournals.org/
Dow
nloaded from

K.L.Cottingham et at.
were somewhat more abundant than in 1991, but were still <30% of the totalbiomass at all times.
Phytoplankton community composition shifted in 1993 and 1994 (Figure 3A)following a fish recruitment event which temporarily reduced the abundanceof large zooplankton in late summer 1993 (Post et ah, 1997). Chrysophytesdominated through the summer (S.uvella/sphagnicola and Ochromonas spp.Wyssotzki). Midsummer increases in chrysophytes (mainly Ochromonas) andcyanobacteria (mainly Oscillatoria limnetica Lemmermann) were much larger in1993 than in 1991 or 1992 (Figure 3A). Chrysophyte biomass was unusually highin May 1994 due to a bloom of Stichogloea olivacea Chodat. During this chryso-phyte bloom, there was a 1 week bloom of the green alga Volvox spp. Linneaus.
In contrast to previous years, 1994 was characterized by high week-to-weekvariability (Figure 3A) and continuing shifts in dominance among chrysophytes,cryptomonads, dinoflagellates and chlorophytes. Even after the collapse of theVolvox bloom, chlorophytes continued to be a dominant feature in the phyto-plankton community (Table I). Key taxa included Botryococcus braunii Kutzing,Oocystis parva West and West, Sphaerocystis schroeteri Chodat, T.pulchra andunidentified microflagellates. Previously, only T.pulchra and the microflagellateshad been among the dominant species.
Overall, there were few sustained trends in community composition at thedivision level in Paul Lake during the study period (Figure 3A). All divisions werepresent in all years, and no one division dominated to the exclusion of the others.Chrysophytes and chlorophytes tended to be the key components of thecommunity, while cyanobacteria, cryptomonads and dinoflagellates were at rela-tively low levels throughout 1991-1994. The only major trend was in variability:relative community composition appeared to be more seasonally dynamic in 1993and 1994 (Figure 3A).
At the species level, there were clear shifts in community composition fromyear to year even in this unmanipulated system. Different species dominated indifferent years, and few of the identified taxa were consistently dominant (TableI). Community similarity in successive years tended to be quite low (20-43%;Figure 4A), which is consistent with annual turnover rates of 25-45% of thespecies changing from one year to the next (Figure 4B). Despite the high rates ofcommunity change, species diversity remained relatively constant over time(Figure 5A).
Peter Lake
There were definite shifts in the Peter Lake phytoplankton community from 1991to 1994, especially following the onset of experimental enrichment in late May1993 (panel B in Figures 1-5). Total phytoplankton biomass increased by a factorof five from 1991 to 1992 and again from 1992 to 1993 (Figure IB), peaking at 20mg I"1 in early September 1993. In 1994, biomass was higher than in 1991-92, butconsiderably lower than in 1993 (Figure IB), probably due to a combination ofslightly reduced nutrient loading and increased grazing by zooplankton
1898
by guest on Novem
ber 4, 2015http://plankt.oxfordjournals.org/
Dow
nloaded from

Phytoplankton responses to experimental nutrient enrichment
A. Similarity
1991 to 1992 1992 to 1993 1993 to 1994
B. Turnover Rate
o.H
1991 to 1992 1992 to 1993 1993 to 1994
Fig. 4. Community similarity (%) and turnover (no. of species per year) in each of the four lakes. (A)Similarity between years for the phytoplankton of each lake, based on the Bray-Curtis similaritycoefficient and seasonal mean biomass of each species. (B) Phytoplankton species turnover from oneyear to the next within each lake.
(Cottingham, 1996). Like total biomass, primary productivity increased 10-foldin 1993; however, unlike biomass, these increases persisted in 1994 (Figure 2B).
In 1991, the phytoplankton community was dominated by chrysophytes {Dino-bryon bavaricum Imhof and Uroglena spp. Ehrenberg), dinoflagellates (Peri-dinium umbonatum and P.wisconsinense Eddy) and chlorophytes (unidentifiedmicroflagellates) (Figure 3B). In the fall, chrysophytes and dinoflagellates
1899
by guest on Novem
ber 4, 2015http://plankt.oxfordjournals.org/
Dow
nloaded from

KJUCottingham el al.
xCD
• o
2
03
O
O
CD
CO
Species DiversityPaul Lake
Plus N & P Plus N & P
1991 1992 1993 1994
Fig. 5. Phytoplankton species diversity (Shannon-Wiener's H') in each lake from 1991 to 1994.Dotted lines indicate the mean of all observations taken during that year in that lake.
continued to dominate. Cyanobacteria and cryptomonads were at extremely lowlevels through the summer, rarely contributing >5% of the total biomass.
In 1992, the community shifted somewhat as the relative biomass of dino-flagellates (P.umbonatum) and chrysophytes (Chrysosphaerella longispinaLauterborn, Kephyrion sp. 6 and Dinobryon sertularia Ehrenberg) increased,while cryptomonads, cyanobacteria and chlorophytes remained at levels at orbelow those of 1991 (Figure 3B). The relative biomasses of both dinoflagellatesand chrysophytes reached their 1991-94 maxima during 1992.
Responses to enrichment were evident quite early in 1993 (Figure 3B). As in
1900
by guest on Novem
ber 4, 2015http://plankt.oxfordjournals.org/
Dow
nloaded from

Phyfoplankton responses to experimental nutrient enrichment
1992, dinoflagellates (mostly P.umbonatum) and chrysophytes (mostly Erkeniasubaequiciliata Skuja) increased in late May and early June; however, in 1993,cryptomonads (especially Rhodomonas minuta Skuja) also increased during thisperiod. Additional blooms followed: chlorophytes (Dictyosphaerium pulchellumWood and an unidentified chlorococcalean alga), then cyanobacteria (Oscillatorialimnetica and Anabaena macrospora Klebahn), then a synchronous outbreak ofdinoflagellates, cryptomonads and chrysophytes. From mid-August through mid-September, the phytoplankton community was dominated by a near monocultureof O.limnetica. The first year of enrichment therefore produced a major increasein cyanobacteria, together with modest increases in cryptomonads and chloro-phytes, at the expense of chrysophytes and dinoflagellates.
Responses to the second year of enrichment (1994) were somewhat different(Figure 3B). As in 1993, dinoflagellates, cryptomonads and chrysophytes weremost abundant in late spring and early fall. However, absolute biomasses of bothdinoflagellates and chrysophytes were more comparable to 1991 than to 1993, andrelative biomasses declined dramatically compared to the pre-enrichment period.Only cryptomonads (mainly Cryptomonas erosa Ehrenberg and C.ovata)continued to show a positive response to enrichment. Oscillatoria limnetica andseveral chlorophytes [especially Monoraphidium capricornum (Printz) Nygaard]were abundant earlier in the season than in 1993, occurring nearly simultaneouslywith the spring cryptomonad bloom. Oscillatoria limnetica, which was -60% ofthe total biomass in late May, collapsed in mid-June and remained at or belowpre-enrichment levels throughout the rest of 1994. Unicellular chlorophytes(especially M.capricomum, Staurastrum iotanum Wolle, Staurastrum tryssos Scott& Groenblad) were the most abundant group through the rest of the summer,representing nearly 100% of the total phytoplankton biomass in July and earlyAugust. Thus, the second year of enrichment produced increases in chlorophytes,cryptomonads and cyanobacteria, but not chrysophytes or dinoflagellates (Figure3B).
There were clear shifts in community composition from year to year at thespecies level in Peter Lake. Average species diversity declined slightly from 1991to 1992, then decreased by nearly 50% in 1993 and 1994 (Figure 5B). Diversitywas lowest during bloom events, with minima reaching 0.1-0.5 during 1993 and1994. Species shifts accompanied the reductions in diversity: for example, in 1991and 1992, most dominant species were either chrysophytes or dinoflagellates,while in 1993 and 1994, most dominant species were either cyanobacteria orchlorophytes (Table I). Community similarity in successive years was generallylower than in Paul Lake, with a 56% turnover rate contributing to a 5% similarityindex for 1992 versus 1993 (Figure 4B).
In summary, Peter Lake showed striking responses to enrichment in both 1993and 1994, with substantial differences between years. Cyanobacteria (Anabaenamacrospora and O.limnetica) increased from <5% to nearly 100% of the totalbiomass for much of August 1993 (Figure 3B). However, cyanobacterial domin-ance did not persist in 1994. Chlorophytes increased dramatically with enrichmentin both 1993 and 1994 (Figure 3B), but with different taxa in each year (Table I).Cryptomonads also increased with enrichment, primarily during spring and fall
1901
by guest on Novem
ber 4, 2015http://plankt.oxfordjournals.org/
Dow
nloaded from

K.L»Cottingham et at.
blooms. The relative biomass of dinoflagellates and chrysophytes, the pre-enrich-ment dominants, decreased with enrichment, and former dominants Peridiniumwisconsinense and P.umbonatum both declined during 1993 and 1994. By 1994, notone chrysophyte or dinoflagellate taxon was listed as a community dominant.
West Long Lake
Changes in West Long Lake from 1991 to 1994 were comparable in magnitude tothose in Peter Lake. Mean total biomass increased each year, but particularlyafter the onset of enrichment in 1993 (Figure 1C). Peak biomass was even higherthan in Peter Lake, reaching 25 mg I"1 in late August 1994. However, increases inprimary productivity in West Long Lake were much smaller than those observedin Peter Lake (Figure 2B and C). These changes were accompanied by substan-tial and sustained changes in community composition (Figure 3C).
In 1991, the phytoplankton community was dominated by colonial chryso-phytes {S.uvella/sphagnicola, Uroglena spp.) in early summer and chlorophytes(Sphaerocystis schroeteri, T.pulchra) and cryptomonads {Cryptomonas spp.)during midsummer. Cyanobacteria and dinoflagellates rarely accounted for>20% of the total biomass.
Community composition shifted somewhat in 1992 as dinoflagellates replacedchlorophytes and cryptomonads as the co-dominant with chrysophytes (Figure3C). Dinoflagellates averaged 40% of the total biomass, up from -10% in 1991,primarily due to increases in Gymnodinium spp. Stein (Figure 3C). As in 1991,chrysophytes, dominated by Mallomonas caudata Iwanoff and Mallomonas sp. 3,represented 30% of the total biomass. Chrysophytes and dinoflagellates were co-dominant throughout the season, with no trends in seasonality; this was differentfrom 1991 where the chrysophytes dominated only during the early part of thesummer. Relative biomasses of cryptomonads, chlorophytes and cyanobacteriawere similar to those in 1991, although cryptomonads showed a pronounced peakin early September.
Dramatic shifts in community composition were evident immediately follow-ing experimental enrichment in 1993. As in Peter Lake, chrysophytes {Uroglena),cryptomonads {Cryptomonas) and dinoflagellates {Gymnodinium) peaked in thespring, at times exceeding previous maxima. The responses of chrysophytes anddinoflagellates were relatively short lived: both returned with fall blooms in 1993,but were at or below 1991 levels throughout 1994. Cryptomonads fared better,sustaining spring and fall blooms in 1993, and maintaining a consistent presencethroughout summer 1994. Chlorophytes increased only somewhat following thecollapse of these spring blooms.
The primary responders to enrichment in West Long Lake were two hetero-cystous (nitrogen-fixing) species of cyanobacteria of the genus Anabaena[A.macrospora and A.flos-aquae (Lyngbye) de Brebisson], which took over thephytoplankton community in mid-July and continued to dominate through therest of the summer. Although neither had previously been documented in thelake, their combined biomass quickly reached 15 mg I"1, >10 times the pre-enrichment total biomass.
1902
by guest on Novem
ber 4, 2015http://plankt.oxfordjournals.org/
Dow
nloaded from

Phytoplankton responses to experimental nutrient enrichment
Responses to enrichment were quite similar in 1994 (Figure 3C). The dominantphytoplankton genus continued to be Anabaena, which had nearly 10 times thebiomass of the next most abundant taxon (Table I). Although chlorophytes[primarily Cystomonas starii (Trainor et Verses) Ettl et Gartner, but alsoArthrodesmus subulatus Kutzing, Scenedesmus denticulatus Lagerheim andDictyosphaerium pulchellum] increased during the latter part of June, Anabaenaagain represented >60% of total biomass by late July. Total biomass of cyanobac-teria was even higher than in 1993 (Figure 3C), despite the decrease in nutrientloading rate.
Chrysophytes and dinoflagellates were strongly affected by enrichment andsubsequent dominance of Anabaena. Dinoflagellates declined from dominance in1992 to a very minor part of the community by 1994 (Figure 3C). Individual taxaalso declined, including previous dominants Gymnodinium sp. 1 Stein andGymnodinium spp. Similarly, chrysophyte contributions to total biomass fell to<10% in June 1993 and never recovered (Figure 3C). As in Peter Lake, fewchrysophyte taxa were dominant during enrichment (Table I).
Changes in community composition were also prevalent at the species level.Diversity decreased from 1991 to 1993 before recovering slightly in 1994 (Figure5C). Extremely low diversities (<0.5) were recorded during the Anabaena bloomsin 1993 and 1994. Inter-year similarity declined in the first year of enrichment, butthen increased to the highest recorded level, 79%, between 1993 and 1994 due tothe continuing dominance of Anabaena (Figure 4A). In contrast, species turnoverremained at rates comparable to those in Paul and Peter lakes due to ongoingchanges in rare species (Figure 4B).
Summarizing community responses in West Long Lake, the relative biomass ofcyanobacteria increased from <10% to nearly 100% for much of August in both1993 and 1994 (Figure 3C). Chlorophytes increased somewhat with enrichment,although most of these increases occurred in 1994. Cryptomonads increased in1993, but their contribution to total biomass changed little beyond the first monthof enrichment due to the overwhelming dominance of cyanobacteria. As in PeterLake, chrysophytes and dinoflagellates increased with enrichment only in theshort term; by 1994, the relative abundance of both divisions had declined greatly.
East Long Lake
Responses to nutrient enrichment in East Long Lake were distinct from thoseobserved in West Long and Peter lakes. Total biomass in East Long Lakefollowed the same pattern as in Peter Lake (increase from 1991 to 1993, followedby small declines in 1994), but peak biomasses were less than half those in WestLong and Peter lakes (Figure 1). Primary productivity in East Long Lake wascomparable to that of Peter Lake in 1993 and West Long Lake in 1994 (Figure2). However, unlike West Long and Peter lakes, maximum biomass and primaryproductivity in East Long Lake occurred in early to mid-summer, rather than inSeptember (Figures 1 and 2). These differences are coincident with one majordifference in community composition: cyanobacteria did not increase in responseto enrichment.
1903
by guest on Novem
ber 4, 2015http://plankt.oxfordjournals.org/
Dow
nloaded from

Tab
le I
I. S
umm
ary
stat
isti
cs f
or s
elec
ted
envi
ronm
enta
l va
riab
les
for
each
lak
e du
ring
eac
h ye
ar o
f th
e ex
peri
men
t. T
he
firs
t li
ne f
or e
ach
lak
e-y
ear
show
s th
em
ean
± 1
SE
, and
the
sec
ond
line
indi
cate
s th
e ra
nge
(min
imum
-max
imum
)
Lak
e Y
ear
Paul
19
91
1992
1993
1994
Pet
er
1991
1992
1993
1994
Tot
alP
(mg
l-')
(n =
16-
17)
11.1
±0.
67.
0-17
.7
11.5
*1.0
1.0-
18.5
9.6
± 0.
54.
6-13
.3
12.3
* 0
.94.
3-18
.3
10.1
± 0
.95.
7-18
.0
9.0
* 0.
62.
8-13
.5
25.9
± 1
.915
.0-4
8.0
18.9
±1.
311
.7-2
8.9
Tot
alN
(mg
H)
(n =
15-
17)
422.
5*11
.837
0.3-
523.
0
373.
9 *
19.0
236.
4-51
8.3
272.
4 ±
14.
616
3.1-
345.
7
425.
3 *
12.7
342.
1-55
7.8
343.
9 *
14.2
282.
7-46
7.7
368.
0 *
19.7
235.
0-54
4.0
506.
6 *
29.3
346.
2-77
0.6
630.
7 *
36.3
354.
9-S3
3.7
N:P
(n =
15-
17)
39.9
± 2
.323
.1-6
1.6
59.8
* 2
7.7
15.2
-501
.6
29.9
± 2
.817
.0-6
5.5
39.3
* 4
.322
.2-9
3.3
38.0
± 3
.819
.9-7
7.9
46.1
± 5
.826
.2-1
11.8
20.3
± 1
.014
.0-2
7.5
34.2
* 1
.826
.8-5
5.0
Ort
hoph
osph
ate
(mg
H)
(n =
7-1
7)
3.8
± 0.
70.
3-9.
0
4.5
* 1.
31.
3-11
.0
1.0*
0.2
0.0-
3.0
1.5
± 0.
20.
5-2.
7
4.1
* 0.
71.
0-8.
3
5.7
* 0.
91.
0-8.
3
2.3
* 0.
40.
3-6.
0
2.0
* 0.
30.
5-5.
5
Am
mon
ia(m
gl-1)
(n =
7-1
6)
16.0
*1.5
7.1-
23.3
10.7
*1.0
7.5-
14.8
8.1
* 2.
20.
6-33
.9
10.1
* 1
.43.
0-23
.3
12.8
* 2
.44.
8-33
.8
12.0
*1.6
7.2-
19.6
15.0
* 5
.30.
1-75
.3
41.3
* 1
0.1
3.1-
112.
7
Nitr
ite a
nd n
itrat
e(m
gH
)(n
= 7
-16)
4.3
* 1.
00.
5-11
.4
4.2
* 2.
50.
0-18
.6
2.2*
0.4
0.0-
5.0
2.9
* 0.
31.
6-5.
7
2.8
* 0.
60.
2-7.
1
1.7
± 0.
60.
0-5.
1
17.9
* 5
.21.
6-73
.7
29.0
*8.1
0.9-
98.7
Epi
limne
tic p
H(«
= :
M)
6.18
*0.0
46.
10-6
.22
5.60
* 0
.09
5.44
-5.8
5
5.77
* 0
.10
5.60
-5.9
5
6.66
* 0
.09
6.49
-6.7
8
6.58
* 0
.07
6.44
-6.6
7
6.16
* 0
.09
6.04
-6.4
3
6.56
* 0
.53
5.95
-8.1
5
7.22
*0.1
27.
00-7
.41
The
rm oc
line
dept
h (m
)(n
o 1
6-17
)
3.1*
0.2
2.0-
4.0
3.9
± 0.
22.
5-5.
0
3.6
* 0.
22.
5-5.
0
3.6
* 0.
22.
5-5.
0
3.7
* 0.
22.
5-5.
0
3.9
± 0.
23.
0-5.
0
3.3
* 0.
12.
5-4.
5
3.9*
0.2
2.0-
5.0
Dep
th o
f1%
ligh
t (m
)(n
= 1
6-17
)
5.6*
0.1
5.2-
6.0
5.6
*0
.05.
3-5.
9
5.6
* 0.
05.
2-5.
9
5.3
* 0.
14.
9-5.
7
7.4
* 0.
16.
5-S.
4
6.4
* 0.
23.
6-7.
1
5.2
* 0.
24.
1-42
5.9
* 0.
24.
4-6.
7
f 3 by guest on November 4, 2015http://plankt.oxfordjournals.org/Downloaded from

Tab
le I
I. C
onti
nued
Lak
e Y
ear
Tot
al P
(mgl
-1)(n
= 1
6-17
)
Tot
al N
(mgl
-')
(n =
15-
17)
N:P
(n =
15-
17)
Ort
hoph
osph
ate
(mgl
-1)(n
= 7
-17)
Am
mon
ia(m
gl-'
)(n
= 7
-16)
Nitr
ite a
nd n
itrat
e E
pilim
netic
pH
T
herm
oclin
e D
epth
of
(mgl
-')
(n =
3-4
) de
pth(
m)
1% li
ght
(m)
(n =
7-1
6)
(n =
16-
17)
(n =
16-
17)
Wes
t
Eas
t
1991
1992
1993
1994
1991
1992
1993
1994
11.9
*0.7
5.3-
16.7
8.5
* 0.
85.
4-17
.5
24.2
± 2
.08.
5-35
.0
21.4
±1.
513
.2-3
8.3
13.9
* 0
.79.
7-18
.3
15.5
*1.1
8.1-
24.6
29.2
* 1
.919
.0-4
6.7
23.7
*1.3
17.4
-34.
4
473.
7 ±
8.3
426.
7-52
8.7
425.
0 ±
15.1
279.
8-52
4.3
674.
9 ±
47.7
350.
8-10
66.0
904.
3 ±
88.8
436.
9-15
00.0
526.
2 ±
31.5
414.
0-95
9.3
520.
2 ±
25.7
325.
2-69
0.1
716.
1 ±2
5.1
549.
7-91
5.3
824.
2 ±
43.4
556.
2-11
33.3
43.0
± 3
.826
.6 ±
86.
3
53.8
±3.
128
.9 ±
71.
6
29.7
± 2
.118
.9 ±
47.
9
44.3
± 3
.524
.3 ±
63.
6
39.0
± 2
.425
.9-5
4.3
36.3
± 3
.519
.9-8
1.6
26.0
±1.
815
.7-4
1.2
35.6
± 2
.021
.5-4
9.1
4.7
± 1.1
0.0-
13.0
4.9
± 1.
21.
0-10
.7
2.9
± 0.
30.
7-6.
3
2.0
± 0.
20.
6-3.
6
4.6
± 1.
00.
7-13
.7
5.9
±1.1
1.0-
10.0
4.2
± 0.
51.
0-8.
0
2.8
± 0.
21.
5-4.
6
18.1
±2.
65.
3-41
.3
13.0
± 2
.04.
5-20
.6
129.
2 ±
27.4
5.3-
282.
4
164.
8 ±
39.1
11.2
^*47
.5
15.8
± 2
.06.
4-32
.3
16.0
±1.
111
.7-2
0.3
102.
2 ±
23.9
3.2-
255.
3
95.0
±18
.112
.9-2
53.7
3.2
± 0.
60.
9-8.
4
1.9
±0.4
0.0-
3.2
117.
0 ±2
3.3
1.5-
244.
0
102.
3 ±
17.4
2.6-
211.
5
3.3
± 0.
60.
9-9.
5
3.9
± 0.
32.
9-4.
7
68.6
±14
.72.
1-14
1.9
137.
7 ±
22.1
4.1-
255.
8
5.88
± 0
.10
5.75
-6.0
7
5.21
± 0
.10
5.05
-5.5
0
5.12
±0.
075.
00-5
.25
6.25
± 0
.09
6.05
-6.4
1
5.61
± 0
.07
5.53
-5.7
4
4.99
± 0
.05
4.85
-5.0
8
4.90
±0.
154.
65-5
.17
5.88
±0.
105.
73-6
.16
2.8
± 0.
12.
0-3.
5
3.9
± 0.
23.
0-5.
0
3.5
± 0.
12.
5-4.
5
3.6
± 0.
22.
0-5.
0
2.5
± 0.
11.
5-3.
0
2.6
± 0.
12.
0-3.
5
2.3
±0.
11.
5-3.
0
2.5
± 0.
11.
5-3.
5
3.3
± 0.
12.
9^.0
4.9
±0.
14.
2-5.
3
4.8
± 0.
22.
3-5.
6
4.8
± 0.
13.
7-6.
0
3.0
±0.1
2.5-
3.8
2.6
± 0.
02.
3-2.
9
1.9
±0.1
1.5-
2.4
2.3
± 0.
01.
9-2.
6
by guest on November 4, 2015http://plankt.oxfordjournals.org/Downloaded from

K.L.Cottingham el al.
In 1991 and 1992, East Long Lake was dominated by dinoflagellates (Peri-dinium umbonatum and P.wisconsinense) and chrysophytes (mainly Chryso-sphaerella longispina and Dinobryon sertularia) (Figure 3D). In 1991,chrysophytes dominated in the early part of the summer, while dinoflagellatesdominated during midsummer (Figure 3D). In 1992, this order was reversed:dinoflagellates dominated early and chrysophytes later. In both years, crypto-monads and chlorophytes were present with low biomass throughout the season,while cyanobacteria were extremely rare.
Following the onset of enrichment in 1993, chrysophytes (S.uvella/sphagni-cola), cryptomonads (Cryptomonas ovata) and dinoflagellates (Gymnodinium sp.1) all showed a pronounced spring peak (as in Peter and West Long lakes; Figure3). However, in East Long Lake, these peaks represented the maximal biomassfor that year (Figure ID). Following the collapse of this spring bloom, dino-flagellates [Gymnodinium sp. and Glenodinium quadridens (Stein) Schiller]dominated for several weeks, then cryptomonads (Covata) dominated into thefall. Neither cyanobacteria nor chlorophytes increased during the first year ofenrichment in this lake (Figure 3D).
Community composition was very different in 1994 (Figure 3D, Table I). Springabundance of dinoflagellates and chrysophytes was extremely low, more like 1991than 1993. However, two chrysophyte taxa (Synura spp. Ehrenberg andOchromonas spp.) were still listed among the dominant species (Table I). Therewere more cryptomonads than in 1991, but less than 1993. After several weeks ofextremely low total biomass, chlorophytes began to increase, especiallyCystomonas starii and Schizochlamys compacta Prescott, which combined for>80% of total biomass for much of the summer. This was the first year that chloro-phytes dominated the phytoplankton community in East Long Lake (Table I).Cryptomonads {Chroomonas spp. Hansgirg, Cryptomonas ovata, Cryptomonaserosa) dominated at the end of August. Thus, in 1994, cryptomonads and chloro-phytes increased with enrichment, while the relative biomasses of cyanobacteria,dinoflagellates and chrysophytes declined.
There were also clear shifts in species composition during this period. Averagespecies diversity declined with enrichment (Figure 5D), particularly during bloomevents. Community similarity was higher than in Paul Lake from 1991 to 1992,but much lower than in Paul Lake during subsequent years (Figure 4A). Simi-larity was lowest between the years of experimental enrichment, not at the begin-ning of enrichment as in Peter and West Long lakes (Figure 4A). Species turnoverrates were comparable to those in the other enriched lakes (Figure 4B).
To summarize responses in East Long Lake, cyanobacteria were a minorcomponent of the phytoplankton community in 1991-92 and remained that wayin 1993-94, unlike West Long and Peter lakes (Figure 3). Chlorophytes increasedstrongly with enrichment in 1994, primarily due to two new taxa. Cryptomonadsalso increased strongly with enrichment, especially during the fall. Dinoflagellatesand chrysophytes increased somewhat immediately following enrichment in 1993,but declined to a very low biomass in 1994.
1906
by guest on Novem
ber 4, 2015http://plankt.oxfordjournals.org/
Dow
nloaded from

Phytoplankton responses to experimental nutrient enrichment
Discussion
Nutrient enrichment had large and rapid effects on the epilimnetic phytoplanktoncommunities of Peter, West Long and East Long lakes. Total biomass and primaryproductivity increased, while species diversity declined. There were enormousshifts in the relative abundance of major taxonomic groups: by the end of thesecond year of experimental enrichment, cyanobacteria, chlorophytes andcryptomonads had increased, while chrysophytes and dinoflagellates declined.Species turnover rates increased with enrichment, although turnover rates werealso high in the unenriched reference system. Most of these changes werecomparable in magnitude to those occurring over a much longer time period dueto cultural eutrophication (Willen, 1972).
Our study is one of very few whole-lake experiments involving synchronousand identical nutrient additions to multiple lakes in the same area. As such, weare uniquely placed to evaluate the extent to which responses to the same nutri-ent treatment diverge in different systems, including systems with different foodwebs. Our results indicate that the consistency of responses to enrichment wasrelatively high for aggregate properties such as total biomass and primary produc-tivity, somewhat lower for low-level taxonomic identifications (divisions), andvery low for individual species. This pattern supports the hypothesis that theeffects of perturbation on biotic communities may be more easily detected forhigher taxa such as families or phyla, because the relative abundance of thesegroups shifts only in response to significant stressors; in contrast, species respondto fine-scale differences in environmental conditions, and thus may not reliablydistinguish responses to a particular stressor (Warwick, 1988a,b). For phyto-plankton, aggregate properties appear to be useful for quantitative prediction ofnutrient effects, while species responses can be used to detect subtle differencesin environmental conditions (e.g. light, nutrients, pH, zooplankton grazing)among lakes.
Total biomass, primary productivity and species diversity
Total phytoplankton biomass, primary productivity and phytoplankton speciesdiversity responded to nutrient enrichment in similar ways in Peter, West Longand East Long lakes. Changes in each of these variates are consistent with expect-ations from the literature. For example, phytoplankton biomass and productivitynearly always increase when nutrient levels increase (Thompson and Rhee, 1994),while summer phytoplankton species diversity tends to be much lower ineutrophic lakes than in oligotrophic lakes (Schindler, 1988). The consistency ofresponses in these and other lakes suggests that the direction of enrichment-induced changes in total biomass, productivity and species diversity is fairlypredictable across lakes. Many lake management strategies (Cooke et al., 1993)exploit this predictability by using quantitative regression models that relateaggregate phytoplankton properties to nutrient loading (Dillon and Rigler, 1974;Vollenweider, 1976; Schindler et al., 1978).
1907
by guest on Novem
ber 4, 2015http://plankt.oxfordjournals.org/
Dow
nloaded from

K.L.Cottmgham et al.
Divisions
Phytoplankton responses to enrichment in Peter, West Long and East Long lakeswere also broadly similar for the major phytoplankton groups we called divisions.Our results generally support the expectation that as a lake becomes moreeutrophic, cyanobacteria and chlorophytes replace chrysophytes and dinoflagel-lates as the dominants of the summer phytoplankton community (Reynolds, 1984;Harper, 1992). However, there was one exception.
Cyanobacteria are expected to increase when nutrients are added to oligo-trophic or mesotrophic lakes, particularly when C:N:P ratios are favorable fortheir development (Thompson and Rhee, 1994). Cyanobacteria increasedstrongly with enrichment in Peter and West Long lakes, but not in East LongLake. In West Long and Peter lakes, increases in cyanobacteria were due toAnabaena and Oscillatoria, both of which contribute to nuisance algal bloomsworldwide. Anabaena is heterocystous and thus capable of nitrogen fixation,while Oscillatoria is not; interestingly, though, N:P ratios in both Peter and WestLong lakes were relatively high (>20 by weight; Table II) throughout the entireexperiment, suggesting that nitrogen-fixing cyanobacteria did not have a competi-tive advantage in these lakes.
The lack of increase in cyanobacteria in East Long Lake was unexpected, butnot uncommon: cyanobacteria have not increased with deliberate enrichment inseveral other whole-lake experiments (Schindler, 1975; Stockner, 1981; Johan-nessen et al, 1984; Perrin et al., 1984; Welch et al., 1989), particularly when nutri-ents were added at high N:P ratios (Holmgren, 1984). In our experiment, thereare a number of plausible reasons why responses in East and West Long lakes, inparticular, were so different—after all, these two basins should have shared thesame pool of propagules for recruitment. Hypothesized factors favoringcyanobacteria over other taxa include high temperature (McQueen and Lean,1987), high pH (Shapiro, 1973; Findlay et al., 1994) and low N:P ratios (Smith,1983; McQueen and Lean, 1987). However, epilimnetic temperature was similarin all four lakes (S.R.Carpenter et al., unpublished data), and the average N:Pratio was lower in East Long than in West Long (Table II), suggesting thattemperature or N:P ratios are unlikely to have prevented the growth of cyanobac-teria in East Long as compared to West Long Lake. However, the lower pH andhigher dissolved organic carbon (DOC) of East Long as compared to West Longduring 1993 and 1994 suggest that pH and DOC could have been involved in thedifferential phytoplankton responses in these two basins (Christensen et al.,1996). In particular, the higher loading of humic acids into East Long Lake mayhave suppressed cyanobacteria (Prakash, 1971), perhaps by reducing light avail-ability. Although the depth of 1% of surface irradiance usually exceeds the ther-mocline depth in these lakes, the thermocline depth in East Long Lake generallyexceeded the depth of 1% light during 1993 (Table II). This suggests that phyto-plankton were regularly being mixed below the compensation depth in East LongLake during enrichment; light limitation can be a stressor for cyanobacteria(Paerl, 1988). The non-response of cyanobacteria in East Long Lake therefore
1908
by guest on Novem
ber 4, 2015http://plankt.oxfordjournals.org/
Dow
nloaded from

Phytoplankton responses to experimental nutrient enrichment
appears to be due to changes in lake physics and chemistry following curtainingin 1991 (Christensen et al, 1996).
Unlike cyanobacteria, chlorophytes increased with increased P loading rate inall three enriched lakes, especially during the second year of enrichment.Increases were larger in East Long and Peter lakes than in West Long Lake,presumably because there was less competition with cyanobacteria. Although thisincrease corroborates literature suggesting that chlorophytes increase withenrichment (Schindler, 1975; Olrik, 1981; Holmgren, 1984), it is notable thatchlorophytes also increased in the unenriched reference lake during 1994.However, different kinds of chlorophytes increased in enriched versus unen-riched lakes. In the enriched lakes, increases were due primarily to unicellulartaxa (Monoraphidium capricornutum in Peter and Cystomonas starii in WestLong and East Long lakes), while in Paul Lake increases were due to gelatinouscolonies (T.pulchra, Sphaerocystis schroeteri, Botryococcus braunii). Thissuggests that enrichment may have driven the chlorophyte increases in Peter,West Long and East Long lakes, while other factors may have caused the increasein Paul Lake. As with the cyanobacteria, species-specific responses to subtleenvironmental differences among systems were an important outcome of thesewhole-lake experiments.
Cryptomonads also increased with enrichment in all three enriched lakes. Theliterature suggests that cryptomonad responses to enrichment vary amongsystems, sometimes increasing (Holmgren, 1984) and sometimes decreasing(Schindler et al., 1974; Skogheim and Rognerud, 1978). However, cryptomonadsconsistently increased with enrichment in our study. Because cryptomonads tendto have a relatively high demand for nutrients (Klaveness, 1988), the increasescould be due to direct stimulation by increased nutrient availability. However,increases could also be due to upward migration from metalimnetic populations(Klaveness, 1988; St. Amand and Carpenter, 1993; Christensen et al., 1995).
In contrast, increased P loading caused only short-lived increases in dino-flagellates. By the end of the first year of enrichment, dinoflagellates had declinedin all three enriched lakes. Declines in dinoflagellates with enrichment have alsobeen reported in other systems (Olrik, 1981; Holmgren, 1984; Pollingher, 1988),although increases have also been described (Schindler et al., 1974; Spodniewska,1978; Reinertsen, 1982; Reynolds, 1984). To compensate for their size (whichmight make it difficult to obtain nutrients at low nutrient concentrations), manydinoflagellate species have adaptations that allow them to be competitive at lownutrient concentrations, including lower sinking rates, fewer losses to grazing,facultative heterotrophy, and the ability to migrate vertically and obtain nutrientsthroughout the water column (Pollingher, 1988). Post-enrichment declines indinoflagellates could therefore be due in part to the loss of the competitive advan-tage of these adaptations as high nutrient availability makes rapid growth moreimportant than efficient nutrient acquisition (Pollingher, 1988).
In Peter, West Long and East Long lakes, chrysophytes increased stronglyimmediately after the beginning of enrichment, but then declined as enrichmentcontinued. This pattern of short-term increase followed by longer-term declinehas also been reported in a number of other studies (Schindler and Fee, 1974;
1909
by guest on Novem
ber 4, 2015http://plankt.oxfordjournals.org/
Dow
nloaded from

K.L.Cottingham et al.
Persson, 1978; Skogheim and Rognerud, 1978; Trifonova, 1989). As with the dino-flagellates, declines in chrysophytes with enrichment could be due to the loss ofa competitive advantage of the chrysophyte 'strategy', possibly through indirecteffects of enrichment such as elevated pH, decreased free CO2, increased grazing,or an inability to keep up with the high maximum growth rates of other taxa(Sandgren, 1988).
Species turnover, year-to-year similarity and dominant taxa
Changes in species composition were frequent in all four lakes throughout thisexperiment. Minimum rates of species turnover from year to year were 25 %, evenin the unmanipulated reference system. Although these rates are high comparedto other pelagic organisms [annual turnover rates are -10-20% for zooplankton(Arnott et al., 1995) and 1-16% for fish (Magnuson et al., 1994)], they are prob-ably not unusual for phytoplankton communities. In 1993, species turnover ratesincreased sharply in the enriched lakes, such that more than half of the specieswere turning over from one year to the next. This suggests that the onset ofexperimental enrichment promoted major changes in the presence and absenceof particular members of the phytoplankton community.
High species turnover rates contributed to large changes in species ranksbetween years and low similarity in average species composition from one yearto the next. Year-to-year similarities ranged from 39 to 55% in the pre-enrichment period, and from 5 to 79% during enrichment. Pre-enrichment valueswere slightly lower than those previously reported for unmanipulated Paul Lake(Elser and Carpenter, 1988). The low similarities observed during the years oflarge shifts in community composition (Peter Lake from 1992 to 1993 and EastLong from 1993 to 1994) are comparable to values reported during food webmanipulations (Elser and Carpenter, 1988). However, the high similarityobserved between the enriched years for West Long Lake is far greater than simi-larities reported for either manipulated or unmanipulated lakes by Elser andCarpenter (1988), apparently because of the persistent dominance of a few taxa,especially Anabaena.
Overall, phytoplankton community composition changed a great deal from yearto year, regardless of experimental manipulation. These changes may be due tothe fundamentally chaotic nature of phytoplankton dynamics at the level of indi-vidual species (Scheffer, 1991). However, there are a number of other explanationsfor the high variability in community composition in Paul, Peter, West Long andEast Long lakes. For example, it may be that we considered a relatively short timeperiod (4 years, with 2 years of enrichment). Had we enriched the lakes for longerperiods, we might have observed more convergence in species responses, possiblyin response to dispersal among adjacent lakes. Alternatively, since there are well-known examples of predictable sequences of phytoplankton succession in theliterature (reviewed by Reynolds, 1984), there may be something unique aboutthese lakes that may be related to their meromictic or dystrophic status. There-fore, the high variability in species composition within a lake may reflect truedifferences in environmental conditions from one year to the next.
1910
by guest on Novem
ber 4, 2015http://plankt.oxfordjournals.org/
Dow
nloaded from

Phytoplankton responses to experimental nutrient enrichment
Individual species and genera
High variability in species composition in all four lakes made it difficult toattribute changes in species composition in the enriched lakes to the manipu-lation. Evidence that enrichment caused the observed changes in Peter, WestLong and East Long lakes is primarily correlative: several taxa which respondedto our experiments have also responded to whole-lake nutrient additions in otherlakes. However, none of these taxa increased in all three enriched lakes. Forexample, the cyanobacterium Anabaena macrospora increased with enrichmentin West Long Lake and at the Experimental Lakes Area (ELA) (Schindler, 1975)and Lake Langvatn (Reinertsen, 1982). Oscillatoria limnetica, which respondedin Peter Lake, also increased at ELA (Schindler, 1975). Similar patterns wereobserved for the colonial chlorophyte Dictyosphaerium pulchellum (Findlay,1978; Reinertsen, 1982; Holmgren, 1984).
We also noted parallel responses between our lakes and others at the genuslevel: increases in the unicellular chlorophytes Monoraphidium (Schindler et al.,1974; Findlay, 1978; Holmgren, 1984) and Staurastrum (Schindler and Fee, 1974;Reinertsen and Langeland, 1982) and the cryptomonads Cryptomonas (Findlay,1978; Reinertsen, 1982; Holmgren, 1984) and Rhodomonas (Reinertsen, 1982;Holmgren, 1984), and decreases in the chrysophytes Ochromonas (Holmgren,1984) and Uroglena (Findlay, 1978; Holmgren, 1984).
These similar responses of some species and genera to enrichment in lakes invery different geographical regions suggest that there may be some ubiquity inhow phytoplankton taxa respond to enrichment. However, this optimism forgenerality must be tempered by the observation that, in this experiment, very fewspecies responded to enrichment in the same way even in neighboring lakes suchas Peter, West Long and East Long. Lake-specific factors appear to play a keyrole in species responses to enrichment. D.W.Schindler (1975) put it this way:'While one can say with considerable certainty that a lake will respond toincreased inputs of P and N by increased algal biomass and production,... thereis no way of making reliable predictions of what species will respond' (p. 3228).Species data are valuable for distinguishing among lakes, but may be less likelyto signal enrichment effects reliably than more aggregated properties, especiallyover short time scales.
Acknowledgements
We thank Dave Christensen, Susan Knight, Joe LeBouton, Nick Voichick, GeoffSteinhart, Mark Scheuerell, Amy Wagner and John Morrice for help with the fieldand laboratory work, and Jim Kitchell, Daniel Schindler, Brian Herwig, JeremieJohnson, David Post, Xi He and Rusty Wright for performing the fish manipu-lations. Dave Findlay, Jim Kitchell, Tim Allen, Dave Armstrong, Tony Ives,David Post and Dick Lathrop provided feedback on previous drafts of this paper.Our research was funded through the National Science Foundation, including agraduate research fellowship to K.L.C. K.L.C. is also grateful for the financial andlogistical support of the National Center for Ecological Analysis and Synthesis (a
1911
by guest on Novem
ber 4, 2015http://plankt.oxfordjournals.org/
Dow
nloaded from

K.L.Cottinghan el al.
center funded jointly by NSF, the State of California and the University of Cali-fornia at Santa Barbara) while preparing this manuscript for publication.
ReferencesAmott.S.E., Magnuson JJ . , Frost.T.M. and Yan,N.D. (1995) Regional and local patterns of common-
ness and rarity in lakes. Bull. EcoL Soc. Am., 76,7.BrayJ.R. and CurtisJ.T. (1957) An ordination of the upland forest communities of southern
Wisconsin. EcoL Monogr, 27,325-349.Carpenter,S.R. and KitchelU.F. (1993) The Trophic Cascade in Lakes. Cambridge University Press,
New York.Carpenter,S.R., KitchelU.F., Cottingham,K.L., Schindler,D.E., Christensen.D.L., Post,D.M. and
Voichick,N. (1996) Chlorophyll variability, nutrient input and grazing: evidence from whole-lakeexperiments. Ecology, Tf, 725-735.
ChristensenJD.L., Carpenter,S.R. and Cottingham,K.L. (1995) Predicting chlorophyll vertical distri-bution in response to epilimnetic nutrient enrichment in small stratified lakes. /. Plankton Res., 17,1461-1477.
Christensen,D.L., Carpenter,S.R., Cottingham,K.L., Knight.S.E., LeBoutonJ.P., Schindler,D.E.,Voichick,N., ColeJ.J. and Pace.M.L. (1996) Pelagic responses to changes in dissolved organiccarbon following division of a seepage lake. LimnoL Oceanogr., 41, 553-559.
Cooke.G.D., Welch,E.B., Peterson.S.A. and Newroth,P.R. (1993) Restoration and Management ofLakes and Reservoirs. Lewis Publishers, Boca Raton, FL.
Cottingham.K.L. (1996) Phytoplankton responses to whole-lake manipulations of nutrients and foodwebs. Dissertation, University of Wisconsin-Madison, Madison, WI.
DillonJ'.J. and Rigler.R.H. (1974) The phosphorus-chlorophyll relationship in lakes. Limnol.Oceanogr., 19,767-773.
DowningJ.A. and Rigler,F.H. (eds) (1984) A Manual on Methods for the Assessment of SecondaryProductivity in Fresh 'Waters. Blackwell Scientific, Oxford.
ElserJfJ. and Carpenter.S.R. (1988) Predation-driven dynamics of zooplankton and phytoplanktoncommunities in a whole-lake experiment. Oecologia (Berlin), 76,148-154.
FindlayJD.L. (1978) Seasonal successions in phytoplankton in seven lake basins in the ExperimentalLakes Area, northwestern Ontario following artificial eutrophication. Data from 1974 to 1976. Can.Data Rep. Fish. Aquat. Sci., 449.
FindlayJJ.L., Hecky,R.E., Hendzel,L.L., Stainton,M.P. and Regehr.G.W. (1994) Relationshipbetween N-2-fixation and heterocyst abundance and its relevance to the nitrogen budget of Lake227. Can. J. Fish. Aquat. Sci., 51,2254-2266.
HarperJD. (1992) Eutrophication of Freshwaters. Chapman & Hall, New York.Holmgren.S.K. (1984) Experimental lake fertilization in the Kuokkel area, northern Sweden. Phyto-
plankton biomass and algal composition in natural and fertilized subarctic lakes. Int. Rev. Co.HydrobioL, 69,781-817.
Johannessen.M., Lande.A. and Rognerad.S. (1984) Fertilization of 6 small mountain lakes inTelemark, southern Norway. Verh. Int. Ver. LimnoL, 22,673-678.
KlavenessJD. (1988) Ecology of the Cryptomonadida: a first review. In Sandgren.C.D. (ed.), Growthand Reproductive Strategies of Freshwater Phytoplankton. Cambridge University Press, New York,pp. 105-133.
MagnusonJJ., Benson3-J- and McLain,A.S. (1994) Insights on species richness and turnover fromlong-term ecological research: fishes in north temperate lakes. Am. ZooL, 34, 437-451.
McQueenJ3J. and LeanJD.R.S. (1987) Influence of water temperature and nitrogen to phosphorusratios on the dominance of blue-green algae in Lake St. George, Ontario. Can. J. Fish. Aquat. ScL,44, 598-604.
Olrik.K. (1981) Succession of phytoplankton in response to environmental factors in Lake Arreso,New Zealand, Denmark. Schweiz. Z. HydroL, 43,6-19.
Paerl,H.W. (1988) Growth and reproductive strategies of freshwater blue-green algae (cyanobac-teria). In Sandgren.C.D. (ed.). Growth and Reproductive Strategies of Freshwater Phytoplankton.Cambridge University Press, New York, pp. 261-315.
Perrin.CJ., ShortreedJCS. and StocknerJ.G. (1984) An integration of forest and lake fertilization:transport and transformations of fertilizer elements. Can. J. Fish. Aquat. ScL, 41, 253-262.
Persson,G. (1978) Experimental lake fertilization in the Kuokkel area, northern Sweden: the responseby the planktonic rotifer community. Verh. Int. Ver. LimnoL, 20,875-880.
1912
by guest on Novem
ber 4, 2015http://plankt.oxfordjournals.org/
Dow
nloaded from

Phytoplankton responses to experimental nutrient enrichment
Pielou,E.C. (1977) Mathematical Ecology. John Wiley & Sons, New York.Pollingher.U. (1988) Freshwater armored dinoflagellates: growth, reproduction strategies and popu-
lation dynamics. In Sandgren.C.D. (ed.). Growth and Reproductive Strategies of Freshwater Phyto-plankton. Cambridge University Press, New York, pp. 134-174.
PostJXM., Carpenter,S.R., Christensen,D.L., CottinghamJC.L., HodgsonJ.R., KitchellJ.F. andSchindler,D.E. (1997) Seasonal effects of variable recruitment of a dominant piscivore on pelagicfood web structure. LimnoL Oceanogr., 42,722-729.
Prakash,A. (1971) Terrigenous organic matter and coastal phytoplankton fertility. In CostlowJ.D.(ed.). Fertility of the Sea. Gordon and Breach, London, pp. 351-358.
Reinertsen.H. (1982) The effect of nutrient addition on the phytoplankton community of an oligo-trophic lake. Holarctic EcoL, 5,225-252.
Reinertsentf. and LangelandA- (1982) The effect of a lake fertilization on the stability and materialutilization of a limnetic ecosystem. Holarctic EcoL, 5, 311-324.
Repavich,W.M., Sonzogni.W.C, StanridgeJ.H., Wedepohl.R.E. and MeisnerJLF. (1990) Cyanobac-teria (blue-green algae) in Wisconsin [USA] waters: acute and chronic toxicity. Water Res., 24,225-232.
Reynolds.CS. (1984) The Ecology of Freshwater Phytoplankton. Cambridge University Press, NewYork.
Sandgren.C.D. (1988) The ecology of chrysophyte flagellates: their growth and perennation strategiesas freshwater phytoplankton. In Sandgren.C.D. (ed.), Growth and Reproductive Strategies of Fresh-water Phytoplankton. Cambridge University Press, New York, pp. 9-104.
Scheffer,M. (1991) Should we expect strange attractors behind plankton dynamics—and if so, shouldwe bother? / Plankton Res., 13,1291-1305.
Schindler,D.E. (1995) The role of fishes in littoral-pelagic coupling in lakes. Dissertation, Universityof Wisconsin-Madison, Madison, WI.
Schindler,D.E., Carpenter,S.R., ColeJJ., KitchelU.F. and Pace,M.L. (1997) Influence of food webstructure on carbon exchange between lakes and the atmosphere. Science, 277,248-251.
Schindler J).W. (1975) Whole-lake experiments with phosphorus, nitrogen and carbon. Verh. Int. Ver.LimnoL, 19, 3221-3231.
Schindler.D.W. (1977) Evolution of phosphorus limitation in lakes. Science, 195,260-262.SchindlerJD.W. (1988) Experimental studies of chemical stressors on whole lake ecosystems. Verh.
Int. Ver. LimnoL, 23,11-41.Schindler,D.W. and FeeJEJ. (1974) Experimental Lakes Area: whole-lake experiments in eutrophi-
cation. J. Fish. Res. Board Can., 31, 937-953.SchindlerJJ.W., KalffJ., Welch.H.E., Brunskill.GJ., Kling,H. and Kritsch,N. (1974) Eutrophication
in the high arctic—Meretta Lake, Cornwallis Island (75° N Lat). / Fish. Res. Board Can., 31,647-662.
SchindlerJJ.W., FeeJEJ. and Ruszczynski.T. (1978) Phosphorus input and its consequences for phyto-plankton standing crop and production in the Experimental Lakes Area and in similar lakes. / Fish.Res. Board Can., 35,190-196.
Shapiro J. (1973) Blue-green algae: why they become dominant. Science, 179, 382-384.Skogheim.O.K. and Rognerud.S. (1978) Recent changes in plankton communities and present trophic
state of Lake Steinsfjord. Arch. HydrobioL, 83, 179-199.Smith,V.H. (1983) Low nitrogen to phosphorus ratios favor dominance by blue-green algae in lake
phytoplankton. Science, 221,669-671.Spodniewska,I. (1978) Phytoplankton as the indicator of lake eutrophication. I. Summer situation in
34 Masurian lakes in 1973. Ekol. Pol., 26, 53-70.St. Amand^A.L. (1990) Mechanisms controlling metalimnetic communities and the importance of
metalimnetic phytoplankton to whole lake primary productivity. Dissertation, University of NotreDame, Notre Dame, IN.
St. Amand,A.L. and Carpenter,S.R. (1993) Metalimnetic phytoplankton dynamics. In Carpenter.S.R.and KitchelU.F. (eds). The Trophic Cascade in Lakes. Cambridge University Press, New York, pp.210-224.
StocknerJ.G. (1981) Whole-lake fertilization for the enhancement of sockeye salmon (Oncorhynchusnerka) in British Columbia, Canada. Verh. Int. Ver. LimnoL, 21,293-299.
Thompson,P.-A. and Rhee,G.-Y. (1994) Phytoplankton responses to eutrophication. Arch.HydrobioL Beih. Ergebn. LimnoL, 42,125-166.
Trifonova.I.S. (1989) Changes in community structure and productivity of phytoplankton as indicatorsof lake and reservoir eutrophication. Arch. HydrobioL Beih. Ergebn. LimnoL, 33, 363-371.
Voichick,N. arid LeBoutonJ.P. (eds) (1994) Methods of the Cascading Trophic Interactions Project,4th edn. Center for Limnology, Madison, WI.
1913
by guest on Novem
ber 4, 2015http://plankt.oxfordjournals.org/
Dow
nloaded from

K.L.Cottingham et al.
VollenweiderJR.A. (ed.) (1974) A Manual on Methods for Measuring Primary Production in AquaticEnvironments. Blackwell Scientific, London.
VolIenweider.R. A. (1976) Advances in defining critical loading levels for phosphorus in lake eutrophi-cation. Mem. 1st. Hal Idrobiol, 33,55-83.
Warwick.R.M. (1988a) Effects on community structure of a pollutant gradient—summary. Mar. EcoLProg. Sen, 46,207-211.
Warwick.R.M. (1988b) The level of taxonomic discrimination required to detect pollution effects onmarine benthic communities. Mar. Pollut. Bull, 19,259-268.
WelchJH.E., LegaultJf.A. and KlingJHJ. (1989) Phytoplankton, nutrients and primary production infertilized and natural lakes at Saqvaqjuac, N.W.T. Can. I Fish. Aquat. ScL, 46, 90-107.
Willen.T. (1972) The gradual destruction of Sweden's lakes. Ambio, 1, 6-14.
Received on January 28,1998; accepted on April 27,1998
1914
by guest on Novem
ber 4, 2015http://plankt.oxfordjournals.org/
Dow
nloaded from
Related Documents