International journal of Agronomy and Plant Production. Vol., 4 (5), 915-927, 2013 Available online at http:// www.ijappjournal.com ISSN 2051-1914 ©2013 VictorQuest Publications Response of Wheat (Triticum aestivum L.) to Phosphorus Application in Different Soils Series Having Diverse Lime Content Manzoor Ahmad 1 , Mohammad Jamal Khan 1 , Dost Muhammad 1 , Amanullah Jr 2 1- Department of Soil & Environmental Sciences 2- Department of Agronomy, Faculty of Crop Production Sciences, University of Agriculture Peshawar- 25130-PAKISTAN *Corresponding Author: Amanullah Jr Abstract A field experiment was conducted to investigate the effect of various levels of phosphorus on wheat (Triticum aestivum L., cv. Pirsabaq-2004) in Peshawar and Guliana soil series having different lime contents. The site in Peshawar was silty clay loam with 19 % lime situated at New Developmental Agricultural Research Farm (NDF) of the University of Agriculture, Peshawar-Pakistan, while Guliana soil (a farmer’s field located at Gulabad, Charsadda district ) was also silty clay loam having 4 % lime. The experiment was laid out in randomized complete block design (RCBD) at both sites and was supplied with 0, 45, 90, 135 and 180 kg P 2 O 5 ha -1 applied as triple super phosphate (TSP) along with basal doses of nitrogen (N) as urea and potassium (K) as sulphate of potash (SOP) at the rate of 120 and 60 kg ha -1 , respectively. The results showed that plant height, spike length and biomass significantly (p < 0.05) increased with increasing level of P up to 90 kg P 2 O 5 ha -1 in Peshawar soil series, whereas in Guliana soil, though these parameters were significantly higher than control but the differences among treatments were non-significant. Similarly, the grain yield in Peshawar soil series increased by 29.6, 68.8 and 76.5 % over control with application of 45, 90, 135 kg P 2 O 5 ha - 1 while in Guliana, significant increase was observed only up to 90 kg P 2 O 5 ha -1 with value of 54.8% over control. Comparing the two sites, it was noted that wheat yield was significantly higher in Guliana than Peshawar soil series. The results of P concentration ([P]) in tissue at boot stage showed that crops at Guliana accumulated lower P compared to anthesis stage and the over all [P] was higher in Guliana soil series compared to Peshawar soil. The water soluble and AB-DTPA extractable P was higher at boot stage of the crop in Guliana soil series but at anthesis and post-harvest stage, the reverse trend was observed. These results suggested that the requirement of P in high limed Peshawar soil series was comparatively more (90-135 P 2 O 5 ha -1 ) than 45 to 90 kg P 2 O 5 ha -1 in low limed Guliana soil series. Keywords: Phosphorus, Peshawar soil, Guliana soil, wheat, yield, P concentration. Introduction Wheat (Triticum aestivum L.) is one of the important staple food and widely cultivated leading cereals crop both in acreage and in production among the grain crops of the world. More than one-third of the world population is feed by wheat. Pakistan occupies supreme position in food grains and is one of the important wheat producing countries in the world. In Pakistan wheat covers more than 66 % of the total area under food grains and contributes 74 % of the total food grain production. According to the Agricultural statistics of Pakistan 2004, wheat occupied more than 36.3 of the total cropped area of Pakistan. Enormous gap have been observed between the yield harvested from the farmer’s field in Khyber Pakhtunkhwa i.e. in the average is 1832 kg ha -1 compared to 2500 kg ha -1 in Punjab whereas the potential yield of Pakistani wheat cultivars above 6000 kg ha -1 . There are many reasons attributed to the gap between the actual and potential yield including proper time of sowing, weed infestation, water shortage, low quality seeds, and imbalance uses of fertilizers. The most important factor according to Fageria et al. (1997) is the supply of adequate

Welcome message from author
This document is posted to help you gain knowledge. Please leave a comment to let me know what you think about it! Share it to your friends and learn new things together.
Transcript
International journal of Agronomy and Plant Production. Vol., 4 (5), 915-927, 2013Available online at http:// www.ijappjournal.comISSN 2051-1914 ©2013 VictorQuest Publications
Response of Wheat (Triticum aestivum L.) to Phosphorus Application inDifferent Soils Series Having Diverse Lime Content
Manzoor Ahmad1, Mohammad Jamal Khan1, Dost Muhammad1, Amanullah Jr2
1- Department of Soil & Environmental Sciences2- Department of Agronomy, Faculty of Crop Production Sciences, University of Agriculture Peshawar-
25130-PAKISTAN
*Corresponding Author: Amanullah Jr
Abstract
A field experiment was conducted to investigate the effect of various levels ofphosphorus on wheat (Triticum aestivum L., cv. Pirsabaq-2004) in Peshawar and Gulianasoil series having different lime contents. The site in Peshawar was silty clay loam with19 % lime situated at New Developmental Agricultural Research Farm (NDF) of theUniversity of Agriculture, Peshawar-Pakistan, while Guliana soil (a farmer’s field locatedat Gulabad, Charsadda district ) was also silty clay loam having 4 % lime. Theexperiment was laid out in randomized complete block design (RCBD) at both sites andwas supplied with 0, 45, 90, 135 and 180 kg P2O5 ha-1 applied as triple super phosphate(TSP) along with basal doses of nitrogen (N) as urea and potassium (K) as sulphate ofpotash (SOP) at the rate of 120 and 60 kg ha-1, respectively. The results showed thatplant height, spike length and biomass significantly (p < 0.05) increased with increasinglevel of P up to 90 kg P2O5 ha-1 in Peshawar soil series, whereas in Guliana soil, thoughthese parameters were significantly higher than control but the differences amongtreatments were non-significant. Similarly, the grain yield in Peshawar soil seriesincreased by 29.6, 68.8 and 76.5 % over control with application of 45, 90, 135 kg P2O5 ha-
1 while in Guliana, significant increase was observed only up to 90 kg P2O5 ha-1 withvalue of 54.8% over control. Comparing the two sites, it was noted that wheat yield wassignificantly higher in Guliana than Peshawar soil series. The results of P concentration([P]) in tissue at boot stage showed that crops at Guliana accumulated lower Pcompared to anthesis stage and the over all [P] was higher in Guliana soil seriescompared to Peshawar soil. The water soluble and AB-DTPA extractable P was higher atboot stage of the crop in Guliana soil series but at anthesis and post-harvest stage, thereverse trend was observed. These results suggested that the requirement of P in highlimed Peshawar soil series was comparatively more (90-135 P2O5 ha-1) than 45 to 90 kgP2O5 ha-1 in low limed Guliana soil series.
Keywords: Phosphorus, Peshawar soil, Guliana soil, wheat, yield, P concentration.
Introduction
Wheat (Triticum aestivum L.) is one of the important staple food and widely cultivated leading cerealscrop both in acreage and in production among the grain crops of the world. More than one-third of the worldpopulation is feed by wheat. Pakistan occupies supreme position in food grains and is one of the importantwheat producing countries in the world. In Pakistan wheat covers more than 66 % of the total area underfood grains and contributes 74 % of the total food grain production. According to the Agricultural statistics ofPakistan 2004, wheat occupied more than 36.3 of the total cropped area of Pakistan. Enormous gap havebeen observed between the yield harvested from the farmer’s field in Khyber Pakhtunkhwa i.e. in theaverage is 1832 kg ha-1 compared to 2500 kg ha-1 in Punjab whereas the potential yield of Pakistani wheatcultivars above 6000 kg ha-1. There are many reasons attributed to the gap between the actual and potentialyield including proper time of sowing, weed infestation, water shortage, low quality seeds, and imbalanceuses of fertilizers. The most important factor according to Fageria et al. (1997) is the supply of adequate
Intl. J. Agron. Plant. Prod. Vol., 4 (5), 915-927, 2013
916
amount of nutrients to the wheat for increase crop production. For bumper crop production, the balanced andproper amount of fertilizer application is considered a key factor (Tariq et al., 2007). Wheat yield responsesto balance application of N: P has been recorded by the David et al. (2003). Nisar (1988) and Ahmad et al.(1992) reported significant yield increases with the application of P in all the five majors crops grown inPakistan i.e. wheat, rice, maize cotton and sugarcane. More than 1200 to 1800 kg ha-1 extra grains overnitrogen alone have been observed with the addition of 60 kg ha-1 P2O5 (Tandon, 1992). Inadequate andunbalance use of phosphatic fertilizers is considered the most important among several constraints toincrease yield per unit area in Pakistan.
At present, approximately 22 million hectares of land area in Pakistan is under agriculture, most of whichare calcareous in nature. More than 93 % of the soils are deficient in the required level of P (NDFC, 2003).Moreover, the utilization and uptake of P in alkaline and calcareous soils of Pakistan is quite low (Zia et al.,1991). In calcareous soils, precipitation of insoluble Ca-P formation is considered to be the major factor for Punavailability (Bramley et al., 1992). Nisar, (1985) observed low efficiency of P and the recovery ranges from15-25%. Ahmad et al. (1992) reported that when super phosphate is applied to alkaline calcareous soils,about 49-59 % and 14-19 % is converted into insoluble calcium phosphate and aluminum phosphate,respectively, while water soluble fractions ranges from 5-9 % only. World Bank, (1992) reported that thenutrient application level in Pakistan is quite low and the P consumption is hardly exceeds 21.6 %. Fixationof P is a serious problem in alkaline and calcareous soils (Sharif et al 2000) and the recovery of the appliedphosphate by the plant tissues is only 11 to 19 % (Sharif, 1985).
There is also a dire need that P fertilizer recommendations should be made on site as well as crop-specific basis (Nisar et al., 1992). In particular term, the information should be needed about the required Pquantities in order to adjust the soil solution P at a level optimal for targeted crop yield (Samadi, 2003). Thepresent study aims to recommend critical levels of P for wheat crops grown in high lime calcareous soils ofPeshawar and low lime soils of Guliana soil series in order to obtained maximum production.
Materials and Methods
A field experiments was conducted in 2009-10 on wheat (Triticum aestivum L., cv. Pirsabaq-2004) to studythe response of various levels of P on diverse lime content soils. Crops was grown on two sites one onfarmer field i.e. Guliana soil series located at Gulabad, Charsadda district, whereas the other site wasPeshawar Soil series located at New Developmental Farm (NDF), Agricultural University Peshawar. TheGuliana soil series is slightly calcareous with 4 % lime and is alkaline in reaction with pH value of 7.90 (Table1). The soils are mostly irrigated, nearly slope (0-1% slope) with silty clay loam texture belonging to Class 1soil based on land capability classification. The selected site was a farmer’s field situated at east side ofGulabad road along Khan Mahi branch about 200 m away from main Gulabad Chowk on Mardan road inCharsadda district. The Peshawar soil series is strongly calcareous (lime 19 %), having alkaline reaction (pH7.92), nearly slope with 0-2 %. The soil in this series is piedmont alluvium with silt clay loam and like Gulianasoil series belong to Class 1 based on land capability classification.
Four levels of phosphorus i.e. 45, 90, 135 and 180 kg P2O5 ha-1 and a control (No P) were applied in theform of triple super phosphate (TSP) along with the basal doses of 120 kg N and 60 kg K2O ha-1in the form ofurea and SOP, respectively. After the seed bed preparation, all P and K and half of N were applied throughbroadcast followed by thorough mixing. The remaining N was applied with 2nd irrigation. The plot size inGulabad was 5 x 6 m while the size in NDF field was 5 x 5 m and the experiments were laid out inrandomized complete block (RCB) design with three replications at both sites. Wheat variety “Pirsabaq-2004”with seed rate of 120 kg ha-1 was sown in lines 30 cm apart on November 17th in Peshawar and onNovember 18th, 2009 at Guliana. Other cultural practices were kept the same for both sites. The crop washarvested on 26 and 27th April at both sites after the crop maturity and data on plant height, spike length,number of grain spike-1, 1000-grain weight, grain yield and biomass yield were recorded.
Soil and leaf samples were collected periodically from sites at pre-treatment (pre-sowing soil sample),boot, anthesis and post-harvest stages of the crop. The soil samples were collected from 0-15 cm depthexcept at boot stage where the crop at both sites received heavy rains and thus soil samples from twodepths i.e. 0-15 and 15-30 cm were collected to visualize any leaching. For leaf sampling, the maturedleaves in each treatment were collected at boot and anthesis stages from both sites. The soils samples wereanalyzed both for water soluble and AB-DTPA extractable [P] (Soltanpour and Schwab, 1977) to correlate itwith plant [P] and growth as suggested by Adam (1974). The tissue P in wheat leaves was determined afterdigesting the sample with mixture of nitric and per-chloric acid (Benton et al., 1991).
Statistical analysisCombined analysis of the data of both sites were performed according to two soils x five phosphorus
levels in factorial randomized complete block (RCB) design using the Statistix 8.1 computer software. The
Intl. J. Agron. Plant. Prod. Vol., 4 (5), 915-927, 2013
917
means were compared using the least significant difference (LSD) test after establishing significance levelthrough ANOVA technique (Steel et al., 1997).
Results and Discussion
Plant height, spike length and total dry biomassWheat plant height, spike length and total dry biomass significantly (p < 0.001) responded to applied P
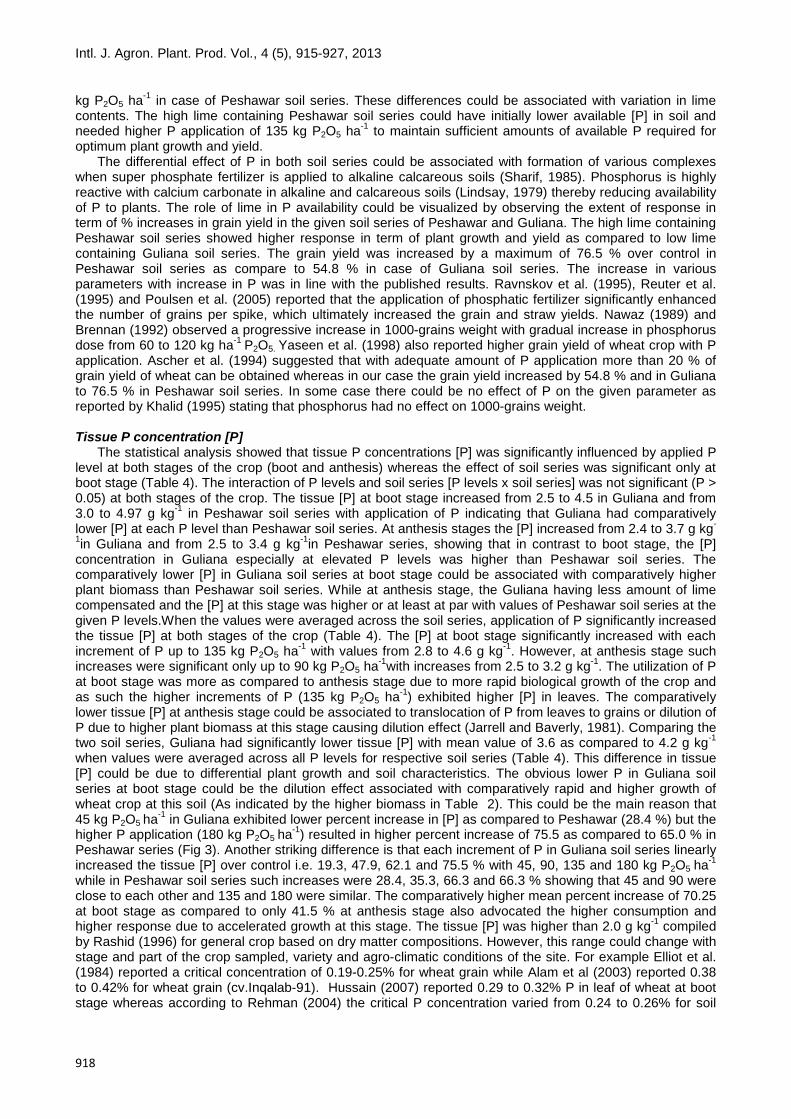
levels exhibiting significantly different values for both soils except plant height, whereas the interaction of Plevels x soils remained non-significant (p > 0.05) for all the given parameters. Application of P increasedplant height, spike length and biomass at both sites when compared with control. However, in Guliana Soilseries having 4 % lime, the plant height, spike length and biomass did not significantly vary among differentP levels, whereas in Peshawar soil series (with 19 % lime), these parameters showed increases up to 90 kgP2O5 ha-1 and then remained statistically unchanged with further increase in P levels. In Guliana soil series,with application of 45 kg P2O5 ha-1, the plant height increased from 70.33 to 75.20 cm, spike length from 8.0to 8.63 cm and biomass from 8.34 to 10.71 t ha-1 showing 6.9, 7.9 and 28.4 % increases over control,respectively (Fig 1). In Peshawar soil series, plant height, spike length and biomass yield increased by 7.8,7.8 and 18.6 % with 45 kg P2O5 ha-1 and by 11.4, 10.8 and 33.5 % with 90 kg P2O5 ha-1, respectively (Table2). These values suggested that the Peshawar soil series having higher lime responded more to Papplication as compared to low lime Guliana soil series and that application of 45 kg P2O5 ha-1 seemedoptimum in Guliana and 90 kg P2O5 ha-1 in Peshawar soil series. When the values were averaged across soilseries, the plant height and biomass yield increased up to 90 kg P2O5 ha-1, and spike length up to 45 kg P2O5ha-1. The P levels beyond these did not induce significant increases in the given parameters (Table 2).Comparing the soil series, it was observed that Guliana soil series produced significantly high spike lengthand biomass of wheat as compared to Peshawar soil series. However, the percent increases over respectivecontrols were higher in Peshawar soil series as compared to Guliana soil series. When the values wereaveraged across P levels, it was observed that P application increased plant height, spike length andbiomass yield by 11.1, 9.8 and 33.6 % over control in Peshawar as compared to 8.5, 8.8 and 34.6 %respectively in Guliana soil series (Fig 1).
The optimum levels of P for maximum yield depend upon the type of soil and specie of crop. Theavailability of P could be closely associated with the content of lime present in the soils (Delgado et al.,2002). Azad et al. (1993) reported that wheat responded significantly up to 80 kg P2O5 ha-1at differentlocation in a soil low in available P and suggested that in order to obtained maximum yield, the application of69 kg P2O5 ha-1must be achieved. Similarly, Khalid et al. (1995) and Hussain et al. (2004) reported thatsignificant increase in biomass yield can be obtained in wheat crop with the application of P at 75 to 100 kgha-1. Similarly, Tandon (1992) reported critical ranges for wheat from 15-69 kg P2O5 ha-1.
Number of grains spike-1, 1000 grains weight and grain yieldThe combined analysis showed that both P levels and soil series significantly influenced the number of
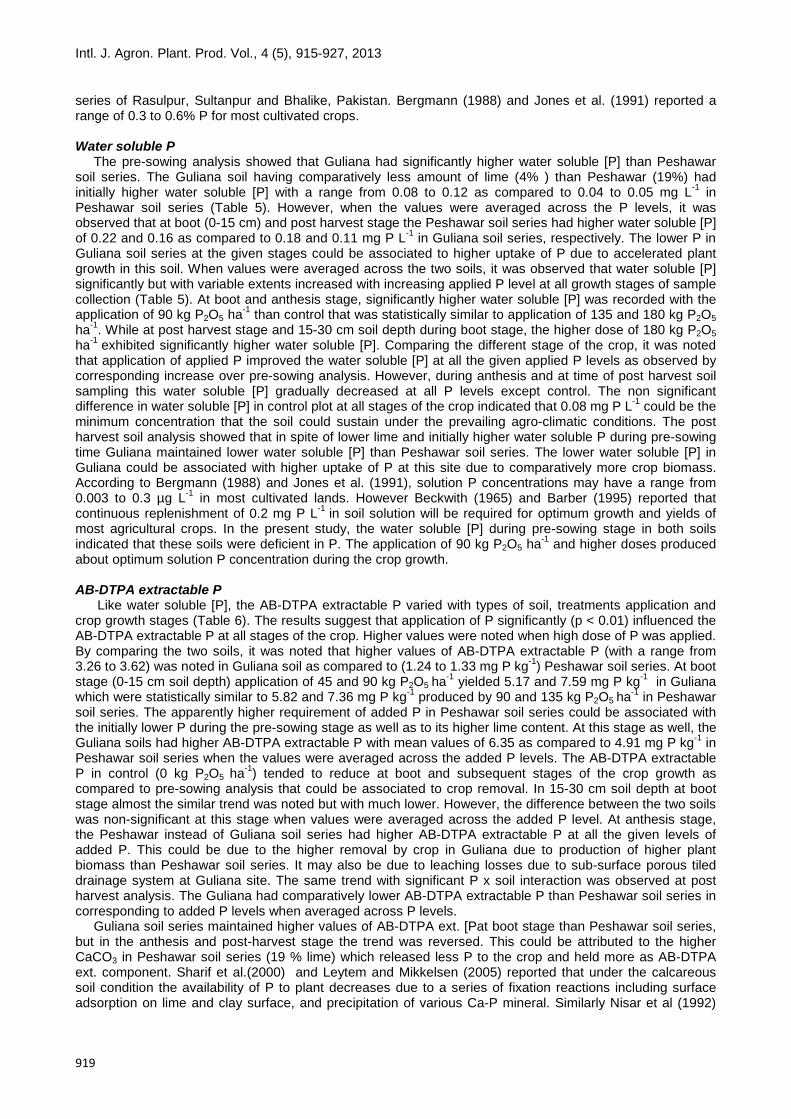
wheat grains spike-1, 1000-grains weight and grain yield. However the interaction of P x soil series wassignificant in case of grain yield only (Table 3). When values were averaged across the soil series, thenumber of wheat grains spike-1, 1000-grains weight and grain yield increased with increase in P levels up to90 kg P2O5 ha-1 and then remained statistically unchanged with further increase in P levels. Bhatti et al.(1986) and Rahmatullah et al. (1994) also reported 90 kg P2O5ha-1 as optimum level for wheat crop.However, the separate data (individual soil) data on these parameters showed that the extent of response interms of % increases over control and the level of applied P at which the maximum value of the givenparameter was recorded significantly varied with soil series. The number of grains spike-1 increased from56.0 in control to 62.33 with application of 135 kg P2O5 ha-1 in Guliana soil series and from 54.67 to 60 withsame levels of P in Peshawar soil series (Table 3). In Guliana soil series the 1000-grains weight increasedfrom 39.60 in control to 41.23 g (4.1%) with application of 45 kg P2O5 ha-1 which further increased to only41.63 g (5.1%) with 90 kg P2O5 ha-1 and up to 41.73 g (5.4 %) with 135 kg P2O5 ha-1(Fig 2) Whereas inPeshawar soil series, this 1000-grains weight increased from 38.37 to 39.17 (2.1 %) with 45 kg P2O5 ha-1
and then to 40.37 g with 90 kg P2O5 ha-1 (5.2% ) which further increased to 40.93 g (6.7 %) meaning thatincrease in P was still showing noticeable increases over control in Peshawar than Guliana soil series.(Table 3 & Fig. 2).
Likewise, in Guliana soil series, having only 4 % lime, the grain yield increased from 2.81 t ha-1 in controlto 4.35 t ha-1 with 90 kg P2O5 ha-1 showing 54.8 % increase over control, while in Peshawar soil series whichhad higher lime content (19% lime) the grain yield increased from 2.47 in control to 4.36 t ha-1 withapplication of 135 kg P2O5 ha-1 (Table 3 & Fig 2)These data suggested that the high lime containingPeshawar soil series had initially lower wheat grain yield (2.47 t ha-1) as compared to low lime containingGuliana soil series (2.81 t ha-1) and that the optimum P level in Guliana was 90 kg P2O5 ha-1 instead of 135
Intl. J. Agron. Plant. Prod. Vol., 4 (5), 915-927, 2013
918
kg P2O5 ha-1 in case of Peshawar soil series. These differences could be associated with variation in limecontents. The high lime containing Peshawar soil series could have initially lower available [P] in soil andneeded higher P application of 135 kg P2O5 ha-1 to maintain sufficient amounts of available P required foroptimum plant growth and yield.
The differential effect of P in both soil series could be associated with formation of various complexeswhen super phosphate fertilizer is applied to alkaline calcareous soils (Sharif, 1985). Phosphorus is highlyreactive with calcium carbonate in alkaline and calcareous soils (Lindsay, 1979) thereby reducing availabilityof P to plants. The role of lime in P availability could be visualized by observing the extent of response interm of % increases in grain yield in the given soil series of Peshawar and Guliana. The high lime containingPeshawar soil series showed higher response in term of plant growth and yield as compared to low limecontaining Guliana soil series. The grain yield was increased by a maximum of 76.5 % over control inPeshawar soil series as compare to 54.8 % in case of Guliana soil series. The increase in variousparameters with increase in P was in line with the published results. Ravnskov et al. (1995), Reuter et al.(1995) and Poulsen et al. (2005) reported that the application of phosphatic fertilizer significantly enhancedthe number of grains per spike, which ultimately increased the grain and straw yields. Nawaz (1989) andBrennan (1992) observed a progressive increase in 1000-grains weight with gradual increase in phosphorusdose from 60 to 120 kg ha-1 P2O5. Yaseen et al. (1998) also reported higher grain yield of wheat crop with Papplication. Ascher et al. (1994) suggested that with adequate amount of P application more than 20 % ofgrain yield of wheat can be obtained whereas in our case the grain yield increased by 54.8 % and in Gulianato 76.5 % in Peshawar soil series. In some case there could be no effect of P on the given parameter asreported by Khalid (1995) stating that phosphorus had no effect on 1000-grains weight.
Tissue P concentration [P]The statistical analysis showed that tissue P concentrations [P] was significantly influenced by applied P
level at both stages of the crop (boot and anthesis) whereas the effect of soil series was significant only atboot stage (Table 4). The interaction of P levels and soil series [P levels x soil series] was not significant (P >0.05) at both stages of the crop. The tissue [P] at boot stage increased from 2.5 to 4.5 in Guliana and from3.0 to 4.97 g kg-1 in Peshawar soil series with application of P indicating that Guliana had comparativelylower [P] at each P level than Peshawar soil series. At anthesis stages the [P] increased from 2.4 to 3.7 g kg-
1in Guliana and from 2.5 to 3.4 g kg-1in Peshawar series, showing that in contrast to boot stage, the [P]concentration in Guliana especially at elevated P levels was higher than Peshawar soil series. Thecomparatively lower [P] in Guliana soil series at boot stage could be associated with comparatively higherplant biomass than Peshawar soil series. While at anthesis stage, the Guliana having less amount of limecompensated and the [P] at this stage was higher or at least at par with values of Peshawar soil series at thegiven P levels.When the values were averaged across the soil series, application of P significantly increasedthe tissue [P] at both stages of the crop (Table 4). The [P] at boot stage significantly increased with eachincrement of P up to 135 kg P2O5 ha-1 with values from 2.8 to 4.6 g kg-1. However, at anthesis stage suchincreases were significant only up to 90 kg P2O5 ha-1with increases from 2.5 to 3.2 g kg-1. The utilization of Pat boot stage was more as compared to anthesis stage due to more rapid biological growth of the crop andas such the higher increments of P (135 kg P2O5 ha-1) exhibited higher [P] in leaves. The comparativelylower tissue [P] at anthesis stage could be associated to translocation of P from leaves to grains or dilution ofP due to higher plant biomass at this stage causing dilution effect (Jarrell and Baverly, 1981). Comparing thetwo soil series, Guliana had significantly lower tissue [P] with mean value of 3.6 as compared to 4.2 g kg-1
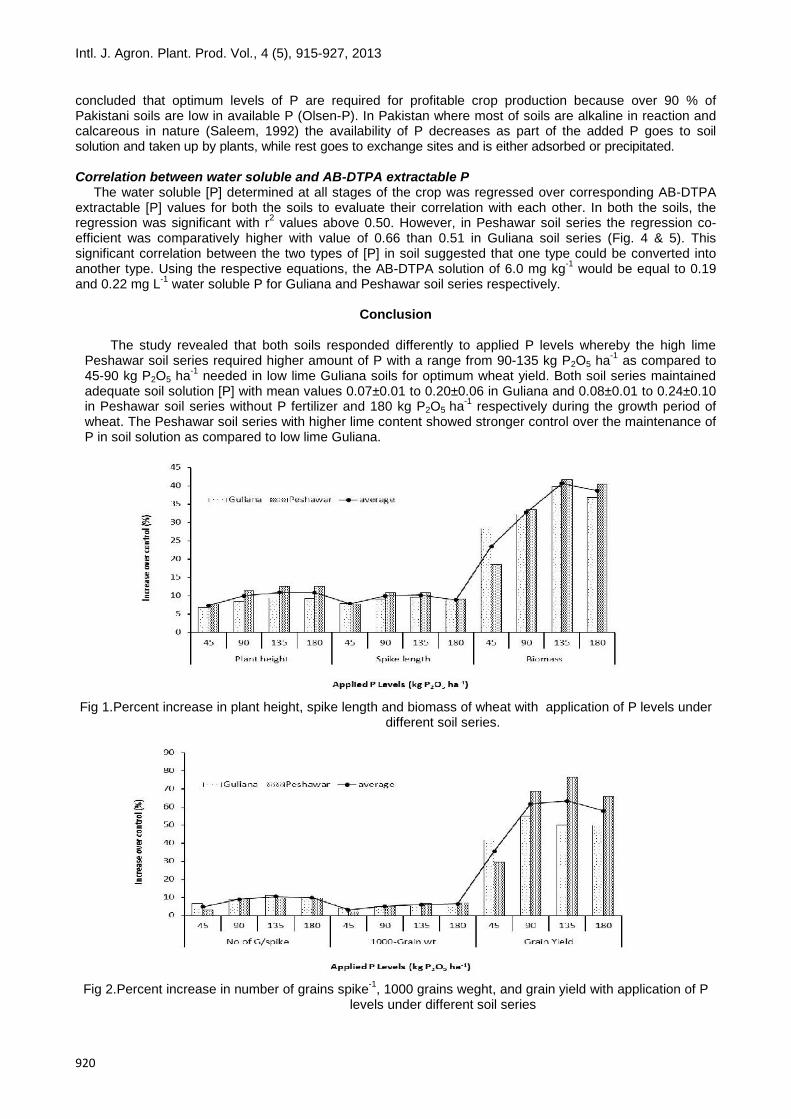
when values were averaged across all P levels for respective soil series (Table 4). This difference in tissue[P] could be due to differential plant growth and soil characteristics. The obvious lower P in Guliana soilseries at boot stage could be the dilution effect associated with comparatively rapid and higher growth ofwheat crop at this soil (As indicated by the higher biomass in Table 2). This could be the main reason that45 kg P2O5 ha-1 in Guliana exhibited lower percent increase in [P] as compared to Peshawar (28.4 %) but thehigher P application (180 kg P2O5 ha-1) resulted in higher percent increase of 75.5 as compared to 65.0 % inPeshawar series (Fig 3). Another striking difference is that each increment of P in Guliana soil series linearlyincreased the tissue [P] over control i.e. 19.3, 47.9, 62.1 and 75.5 % with 45, 90, 135 and 180 kg P2O5 ha-1
while in Peshawar soil series such increases were 28.4, 35.3, 66.3 and 66.3 % showing that 45 and 90 wereclose to each other and 135 and 180 were similar. The comparatively higher mean percent increase of 70.25at boot stage as compared to only 41.5 % at anthesis stage also advocated the higher consumption andhigher response due to accelerated growth at this stage. The tissue [P] was higher than 2.0 g kg-1 compiledby Rashid (1996) for general crop based on dry matter compositions. However, this range could change withstage and part of the crop sampled, variety and agro-climatic conditions of the site. For example Elliot et al.(1984) reported a critical concentration of 0.19-0.25% for wheat grain while Alam et al (2003) reported 0.38to 0.42% for wheat grain (cv.Inqalab-91). Hussain (2007) reported 0.29 to 0.32% P in leaf of wheat at bootstage whereas according to Rehman (2004) the critical P concentration varied from 0.24 to 0.26% for soil
Intl. J. Agron. Plant. Prod. Vol., 4 (5), 915-927, 2013
919
series of Rasulpur, Sultanpur and Bhalike, Pakistan. Bergmann (1988) and Jones et al. (1991) reported arange of 0.3 to 0.6% P for most cultivated crops.
Water soluble PThe pre-sowing analysis showed that Guliana had significantly higher water soluble [P] than Peshawar
soil series. The Guliana soil having comparatively less amount of lime (4% ) than Peshawar (19%) hadinitially higher water soluble [P] with a range from 0.08 to 0.12 as compared to 0.04 to 0.05 mg L-1 inPeshawar soil series (Table 5). However, when the values were averaged across the P levels, it wasobserved that at boot (0-15 cm) and post harvest stage the Peshawar soil series had higher water soluble [P]of 0.22 and 0.16 as compared to 0.18 and 0.11 mg P L-1 in Guliana soil series, respectively. The lower P inGuliana soil series at the given stages could be associated to higher uptake of P due to accelerated plantgrowth in this soil. When values were averaged across the two soils, it was observed that water soluble [P]significantly but with variable extents increased with increasing applied P level at all growth stages of samplecollection (Table 5). At boot and anthesis stage, significantly higher water soluble [P] was recorded with theapplication of 90 kg P2O5 ha-1 than control that was statistically similar to application of 135 and 180 kg P2O5ha-1. While at post harvest stage and 15-30 cm soil depth during boot stage, the higher dose of 180 kg P2O5ha-1 exhibited significantly higher water soluble [P]. Comparing the different stage of the crop, it was notedthat application of applied P improved the water soluble [P] at all the given applied P levels as observed bycorresponding increase over pre-sowing analysis. However, during anthesis and at time of post harvest soilsampling this water soluble [P] gradually decreased at all P levels except control. The non significantdifference in water soluble [P] in control plot at all stages of the crop indicated that 0.08 mg P L-1 could be theminimum concentration that the soil could sustain under the prevailing agro-climatic conditions. The postharvest soil analysis showed that in spite of lower lime and initially higher water soluble P during pre-sowingtime Guliana maintained lower water soluble [P] than Peshawar soil series. The lower water soluble [P] inGuliana could be associated with higher uptake of P at this site due to comparatively more crop biomass.According to Bergmann (1988) and Jones et al. (1991), solution P concentrations may have a range from0.003 to 0.3 µg L-1 in most cultivated lands. However Beckwith (1965) and Barber (1995) reported thatcontinuous replenishment of 0.2 mg P L-1 in soil solution will be required for optimum growth and yields ofmost agricultural crops. In the present study, the water soluble [P] during pre-sowing stage in both soilsindicated that these soils were deficient in P. The application of 90 kg P2O5 ha-1 and higher doses producedabout optimum solution P concentration during the crop growth.
AB-DTPA extractable PLike water soluble [P], the AB-DTPA extractable P varied with types of soil, treatments application and
crop growth stages (Table 6). The results suggest that application of P significantly (p < 0.01) influenced theAB-DTPA extractable P at all stages of the crop. Higher values were noted when high dose of P was applied.By comparing the two soils, it was noted that higher values of AB-DTPA extractable P (with a range from3.26 to 3.62) was noted in Guliana soil as compared to (1.24 to 1.33 mg P kg-1) Peshawar soil series. At bootstage (0-15 cm soil depth) application of 45 and 90 kg P2O5 ha-1 yielded 5.17 and 7.59 mg P kg-1 in Gulianawhich were statistically similar to 5.82 and 7.36 mg P kg-1 produced by 90 and 135 kg P2O5 ha-1 in Peshawarsoil series. The apparently higher requirement of added P in Peshawar soil series could be associated withthe initially lower P during the pre-sowing stage as well as to its higher lime content. At this stage as well, theGuliana soils had higher AB-DTPA extractable P with mean values of 6.35 as compared to 4.91 mg P kg-1 inPeshawar soil series when the values were averaged across the added P levels. The AB-DTPA extractableP in control (0 kg P2O5 ha-1) tended to reduce at boot and subsequent stages of the crop growth ascompared to pre-sowing analysis that could be associated to crop removal. In 15-30 cm soil depth at bootstage almost the similar trend was noted but with much lower. However, the difference between the two soilswas non-significant at this stage when values were averaged across the added P level. At anthesis stage,the Peshawar instead of Guliana soil series had higher AB-DTPA extractable P at all the given levels ofadded P. This could be due to the higher removal by crop in Guliana due to production of higher plantbiomass than Peshawar soil series. It may also be due to leaching losses due to sub-surface porous tileddrainage system at Guliana site. The same trend with significant P x soil interaction was observed at postharvest analysis. The Guliana had comparatively lower AB-DTPA extractable P than Peshawar soil series incorresponding to added P levels when averaged across P levels.
Guliana soil series maintained higher values of AB-DTPA ext. [Pat boot stage than Peshawar soil series,but in the anthesis and post-harvest stage the trend was reversed. This could be attributed to the higherCaCO3 in Peshawar soil series (19 % lime) which released less P to the crop and held more as AB-DTPAext. component. Sharif et al.(2000) and Leytem and Mikkelsen (2005) reported that under the calcareoussoil condition the availability of P to plant decreases due to a series of fixation reactions including surfaceadsorption on lime and clay surface, and precipitation of various Ca-P mineral. Similarly Nisar et al (1992)
Intl. J. Agron. Plant. Prod. Vol., 4 (5), 915-927, 2013
920
concluded that optimum levels of P are required for profitable crop production because over 90 % ofPakistani soils are low in available P (Olsen-P). In Pakistan where most of soils are alkaline in reaction andcalcareous in nature (Saleem, 1992) the availability of P decreases as part of the added P goes to soilsolution and taken up by plants, while rest goes to exchange sites and is either adsorbed or precipitated.
Correlation between water soluble and AB-DTPA extractable PThe water soluble [P] determined at all stages of the crop was regressed over corresponding AB-DTPA
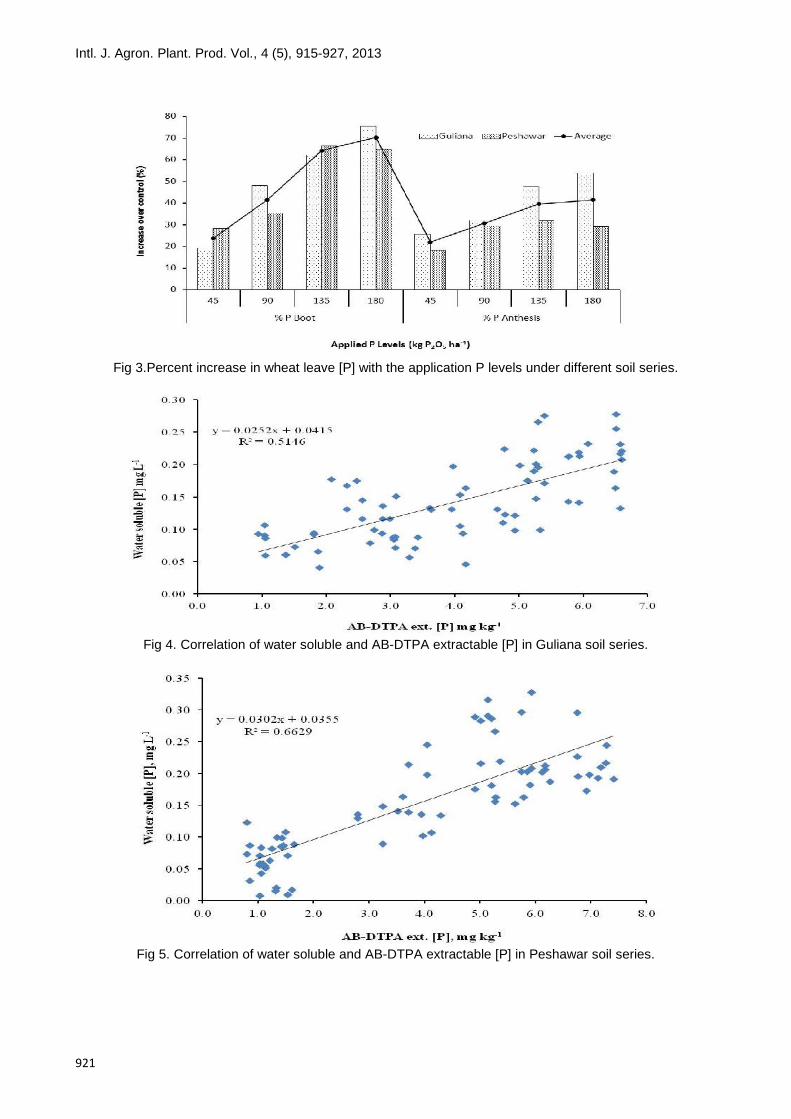
extractable [P] values for both the soils to evaluate their correlation with each other. In both the soils, theregression was significant with r2 values above 0.50. However, in Peshawar soil series the regression co-efficient was comparatively higher with value of 0.66 than 0.51 in Guliana soil series (Fig. 4 & 5). Thissignificant correlation between the two types of [P] in soil suggested that one type could be converted intoanother type. Using the respective equations, the AB-DTPA solution of 6.0 mg kg-1 would be equal to 0.19and 0.22 mg L-1 water soluble P for Guliana and Peshawar soil series respectively.
Conclusion
The study revealed that both soils responded differently to applied P levels whereby the high limePeshawar soil series required higher amount of P with a range from 90-135 kg P2O5 ha-1 as compared to45-90 kg P2O5 ha-1 needed in low lime Guliana soils for optimum wheat yield. Both soil series maintainedadequate soil solution [P] with mean values 0.07±0.01 to 0.20±0.06 in Guliana and 0.08±0.01 to 0.24±0.10in Peshawar soil series without P fertilizer and 180 kg P2O5 ha-1 respectively during the growth period ofwheat. The Peshawar soil series with higher lime content showed stronger control over the maintenance ofP in soil solution as compared to low lime Guliana.
Fig 1.Percent increase in plant height, spike length and biomass of wheat with application of P levels underdifferent soil series.
Fig 2.Percent increase in number of grains spike-1, 1000 grains weght, and grain yield with application of Plevels under different soil series
Intl. J. Agron. Plant. Prod. Vol., 4 (5), 915-927, 2013
921
Fig 3.Percent increase in wheat leave [P] with the application P levels under different soil series.
Fig 4. Correlation of water soluble and AB-DTPA extractable [P] in Guliana soil series.
Fig 5. Correlation of water soluble and AB-DTPA extractable [P] in Peshawar soil series.
Intl. J. Agron. Plant. Prod. Vol., 4 (5), 915-927, 2013
922
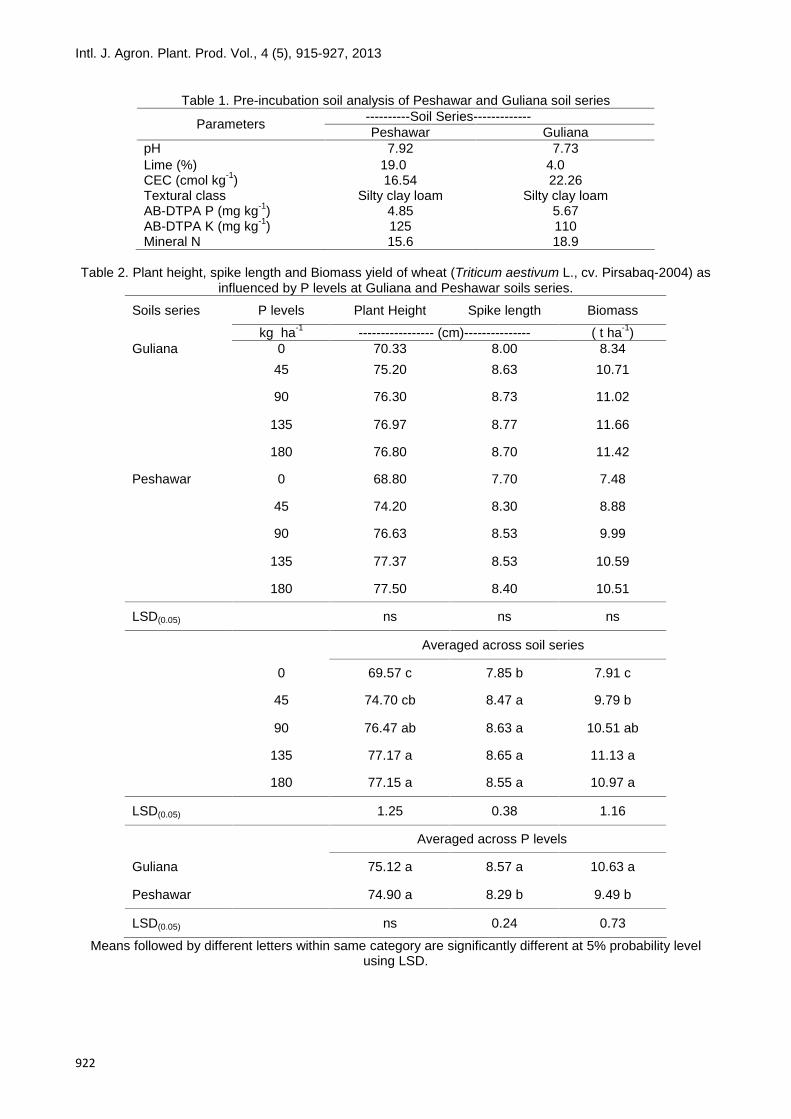
Table 1. Pre-incubation soil analysis of Peshawar and Guliana soil series----------Soil Series-------------Parameters Peshawar Guliana
pH 7.92 7.73Lime (%) 19.0 4.0CEC (cmol kg-1) 16.54 22.26Textural class Silty clay loam Silty clay loamAB-DTPA P (mg kg-1) 4.85 5.67AB-DTPA K (mg kg-1) 125 110Mineral N 15.6 18.9
Table 2. Plant height, spike length and Biomass yield of wheat (Triticum aestivum L., cv. Pirsabaq-2004) asinfluenced by P levels at Guliana and Peshawar soils series.
Soils series P levels Plant Height Spike length Biomass
kg ha-1 ----------------- (cm)--------------- ( t ha-1)Guliana 0 70.33 8.00 8.34
45 75.20 8.63 10.71
90 76.30 8.73 11.02
135 76.97 8.77 11.66
180 76.80 8.70 11.42
Peshawar 0 68.80 7.70 7.48
45 74.20 8.30 8.88
90 76.63 8.53 9.99
135 77.37 8.53 10.59
180 77.50 8.40 10.51
LSD(0.05) ns ns ns
Averaged across soil series
0 69.57 c 7.85 b 7.91 c
45 74.70 cb 8.47 a 9.79 b
90 76.47 ab 8.63 a 10.51 ab
135 77.17 a 8.65 a 11.13 a
180 77.15 a 8.55 a 10.97 a
LSD(0.05) 1.25 0.38 1.16
Averaged across P levels
Guliana 75.12 a 8.57 a 10.63 a
Peshawar 74.90 a 8.29 b 9.49 b
LSD(0.05) ns 0.24 0.73
Means followed by different letters within same category are significantly different at 5% probability levelusing LSD.
Intl. J. Agron. Plant. Prod. Vol., 4 (5), 915-927, 2013
923
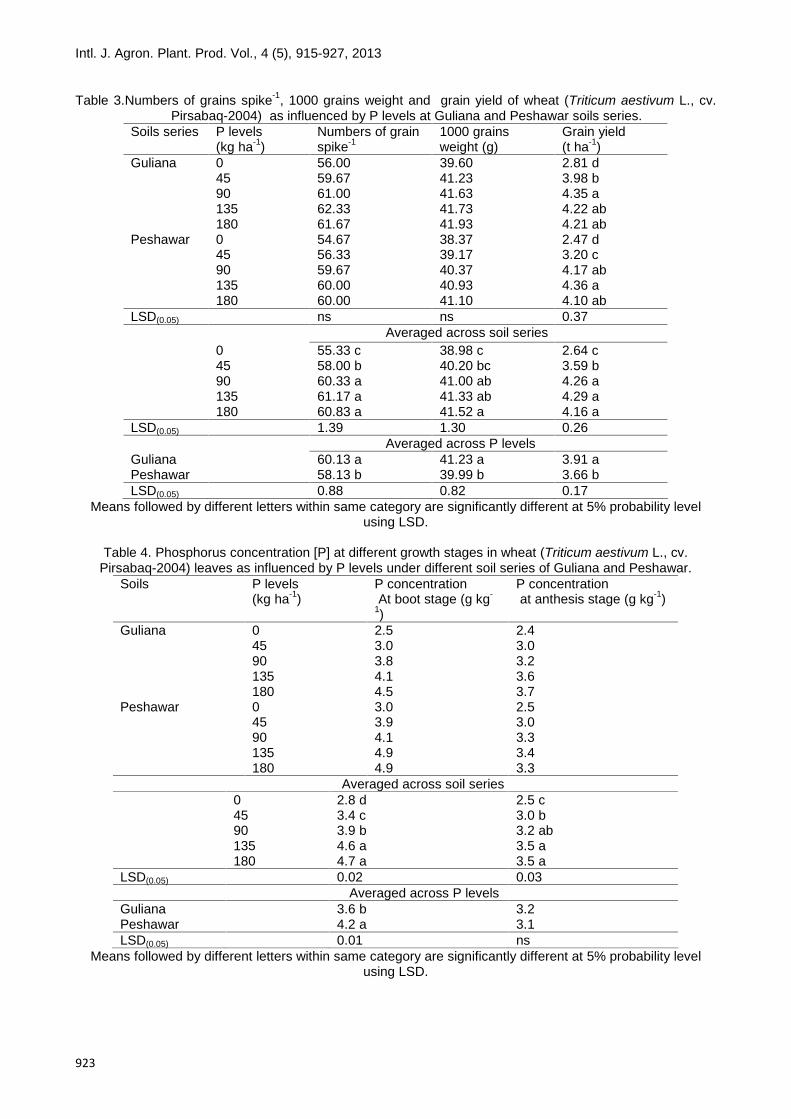
Table 3.Numbers of grains spike-1, 1000 grains weight and grain yield of wheat (Triticum aestivum L., cv.Pirsabaq-2004) as influenced by P levels at Guliana and Peshawar soils series.
Soils series P levels(kg ha-1)
Numbers of grainspike-1
1000 grainsweight (g)
Grain yield(t ha-1)
Guliana 0 56.00 39.60 2.81 d45 59.67 41.23 3.98 b90 61.00 41.63 4.35 a135 62.33 41.73 4.22 ab180 61.67 41.93 4.21 ab
Peshawar 0 54.67 38.37 2.47 d45 56.33 39.17 3.20 c90 59.67 40.37 4.17 ab135 60.00 40.93 4.36 a180 60.00 41.10 4.10 ab
LSD(0.05) ns ns 0.37 Averaged across soil series
0 55.33 c 38.98 c 2.64 c45 58.00 b 40.20 bc 3.59 b90 60.33 a 41.00 ab 4.26 a135 61.17 a 41.33 ab 4.29 a180 60.83 a 41.52 a 4.16 a
LSD(0.05) 1.39 1.30 0.26 Averaged across P levelsGuliana 60.13 a 41.23 a 3.91 aPeshawar 58.13 b 39.99 b 3.66 bLSD(0.05) 0.88 0.82 0.17
Means followed by different letters within same category are significantly different at 5% probability levelusing LSD.
Table 4. Phosphorus concentration [P] at different growth stages in wheat (Triticum aestivum L., cv.Pirsabaq-2004) leaves as influenced by P levels under different soil series of Guliana and Peshawar.
Soils P levels(kg ha-1)
P concentration At boot stage (g kg-
1)
P concentration at anthesis stage (g kg-1)
Guliana 0 2.5 2.445 3.0 3.090 3.8 3.2135 4.1 3.6180 4.5 3.7
Peshawar 0 3.0 2.545 3.9 3.090 4.1 3.3135 4.9 3.4180 4.9 3.3
Averaged across soil series0 2.8 d 2.5 c45 3.4 c 3.0 b90 3.9 b 3.2 ab135 4.6 a 3.5 a180 4.7 a 3.5 a
LSD(0.05) 0.02 0.03 Averaged across P levelsGuliana 3.6 b 3.2Peshawar 4.2 a 3.1LSD(0.05) 0.01 ns
Means followed by different letters within same category are significantly different at 5% probability levelusing LSD.
Intl. J. Agron. Plant. Prod. Vol., 4 (5), 915-927, 2013
924
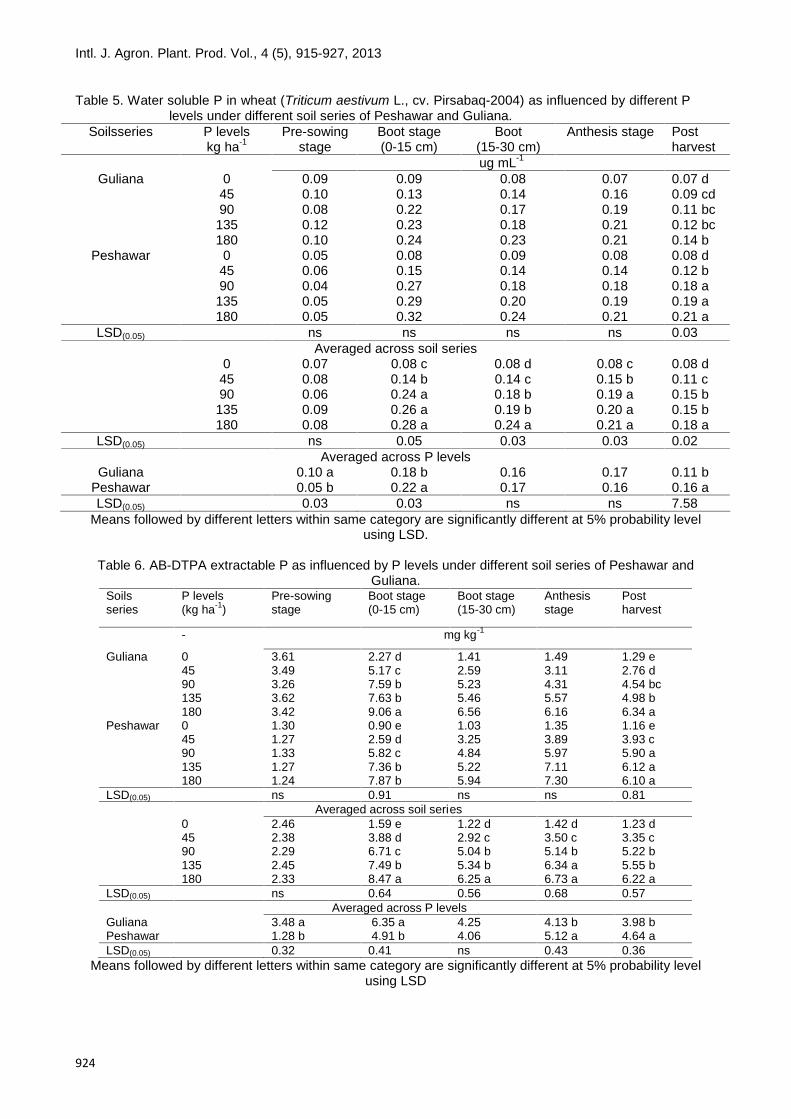
Table 5. Water soluble P in wheat (Triticum aestivum L., cv. Pirsabaq-2004) as influenced by different Plevels under different soil series of Peshawar and Guliana.
Soilsseries P levelskg ha-1
Pre-sowingstage
Boot stage(0-15 cm)
Boot(15-30 cm)
Anthesis stage Postharvest
ug mL-1
Guliana 0 0.09 0.09 0.08 0.07 0.07 d45 0.10 0.13 0.14 0.16 0.09 cd90 0.08 0.22 0.17 0.19 0.11 bc
135 0.12 0.23 0.18 0.21 0.12 bc180 0.10 0.24 0.23 0.21 0.14 b
Peshawar 0 0.05 0.08 0.09 0.08 0.08 d45 0.06 0.15 0.14 0.14 0.12 b90 0.04 0.27 0.18 0.18 0.18 a
135 0.05 0.29 0.20 0.19 0.19 a180 0.05 0.32 0.24 0.21 0.21 a
LSD(0.05) ns ns ns ns 0.03Averaged across soil series
0 0.07 0.08 c 0.08 d 0.08 c 0.08 d45 0.08 0.14 b 0.14 c 0.15 b 0.11 c90 0.06 0.24 a 0.18 b 0.19 a 0.15 b
135 0.09 0.26 a 0.19 b 0.20 a 0.15 b180 0.08 0.28 a 0.24 a 0.21 a 0.18 a
LSD(0.05) ns 0.05 0.03 0.03 0.02Averaged across P levels
Guliana 0.10 a 0.18 b 0.16 0.17 0.11 bPeshawar 0.05 b 0.22 a 0.17 0.16 0.16 aLSD(0.05) 0.03 0.03 ns ns 7.58
Means followed by different letters within same category are significantly different at 5% probability levelusing LSD.
Table 6. AB-DTPA extractable P as influenced by P levels under different soil series of Peshawar andGuliana.
Soilsseries
P levels(kg ha-1)
Pre-sowingstage
Boot stage(0-15 cm)
Boot stage(15-30 cm)
Anthesisstage
Postharvest
- mg kg-1
Guliana 0 3.61 2.27 d 1.41 1.49 1.29 e45 3.49 5.17 c 2.59 3.11 2.76 d90 3.26 7.59 b 5.23 4.31 4.54 bc135 3.62 7.63 b 5.46 5.57 4.98 b180 3.42 9.06 a 6.56 6.16 6.34 a
Peshawar 0 1.30 0.90 e 1.03 1.35 1.16 e45 1.27 2.59 d 3.25 3.89 3.93 c90 1.33 5.82 c 4.84 5.97 5.90 a135 1.27 7.36 b 5.22 7.11 6.12 a180 1.24 7.87 b 5.94 7.30 6.10 a
LSD(0.05) ns 0.91 ns ns 0.81 Averaged across soil series
0 2.46 1.59 e 1.22 d 1.42 d 1.23 d45 2.38 3.88 d 2.92 c 3.50 c 3.35 c90 2.29 6.71 c 5.04 b 5.14 b 5.22 b135 2.45 7.49 b 5.34 b 6.34 a 5.55 b180 2.33 8.47 a 6.25 a 6.73 a 6.22 a
LSD(0.05) ns 0.64 0.56 0.68 0.57 Averaged across P levels
Guliana 3.48 a 6.35 a 4.25 4.13 b 3.98 bPeshawar 1.28 b 4.91 b 4.06 5.12 a 4.64 aLSD(0.05) 0.32 0.41 ns 0.43 0.36
Means followed by different letters within same category are significantly different at 5% probability levelusing LSD
Intl. J. Agron. Plant. Prod. Vol., 4 (5), 915-927, 2013
925
References
Agricultural Statistics of Pakistan, 2004. Ministry of Food Agriculture and Livestock, Government of Pakistan.Pakistan Agricultural Research Council, Islamabad, Pakistan.
Ahmad N, 1998. Plant nutrition management for sustainable agricultural growth in Pakistan. Proc.Ofsymposium on “Plant Nutrition Management for Sustainable Agricultural growth December 1998,Islamabad. pp. 11-21.
Ahmad N, Abid M, Hussain K, Akram M, Yousaf M, 2003. Evaluation of nutrient status in rice growing areasof the Punjab. Asian J Plant Sci. 2: 449-453.
Ahmad N, Saleem MT, Twyford IT, 1992. Phosphorus research in Pakistan a review. Symposium on the roleof phosphorus in crop production.Govt of Pak. Planning and Development Division.NDFC., Islamabad.59-92.
Alam SM, Shah SA, Akhter M, 2003. Varietals differences in wheat yield and phosphorus use efficiencyas influenced by method of phosphorus application. Songklanakarian J Sci Tec 25: 175-181.
Anonymous. 1971. Production year Book, FAO, Rome. 25: 37-41Ascher JS, Graham RD, Elliott DE, Scott JM, Jessop RS, 1994. Agronomic value of seed with high nutrient
content. In D.A Saunders & G.P. Hettel, eds. Wheat in heat-stressed environments irrigated, dry areaand rice-wheat farming systems. CIMMYT, Mexico.
Azad AS, Singh B, Singh Y, 1993. Response of wheat to graded doses of N, P and K in soils testing low,medium and high with respect to P and K in Gurdaspur District of Punjab. J Potash Res. 9: 266-270.
Barbers SA, 1995. Soil Nutrient Bioavailability: a mechanistic approach. John Wiley and Sons. New York.Beckwith RS, 1965. Sorbed phosphate at standard supernatant concentration as an estimate of the
phosphate needs of soils. Aust J Exp Agri Anl Hus. 5: 52-58.Benton J Jr, Wolf B, Mills HA, 1991. Plant Analysis Hand book. A practical sampling, preparation,
analysis and Interpretation guide. Micro-Macro publishing Inc. USA.Bergmann W, 1988. ErnahrungstorungenbeiKulturpflanzen, Gustav Fischer Verlag- Stutgart-New
York.Bhatti AU, Qureshi AA, Rehani S, 1986. Effect of N alone and in combination with P and K on the yield
of wheat. Pak J Agri Res. 6: 89-92.Blaga GV, Micalus, Lechintan T, 1989. Investigations on the effect of organic and minerals fertilizers
on the yield and oats grown at sterile waste dumps. Buletiunul Institutului Agronomic Cluj NapocaSeria Agric. Romania, 43: 5-9 (Field Crop Absts, 43: 7715-1990).
Bramley RGV, Barrow NJ, Shaw IC, 1992. The reaction between phosphate and dry soil: The effect oftime, temperature and dryness. J Soil Sci. 43: 749-758.
Brennan RF, 1992. Effect of super phosphate and nitrogen on yield and take all of wheat. Fert Res.31(1): 43-49.
David H, Speirs A, Flavel P, Motley K, Dyson C, 2003. Phosphorus yield in wheat,canola and fieldpeas grown at different soil P and levels. Aust J Agron. 20: 1-6.
Delgado A, Uceda I, Andreu L, Kaseem S, 2002. Fertilizer phosphorus recovery from gypsum-amendedreclaimed calcareous marsh soils. Arid land Res Manage.16: 319- 334.
Elliot DE, Reuter DJ, Reddy GR, 1984. Development of a plant test for diagnosing phosphorusdeficiency in wheat. Treatment report (Project DASA 23) for the wheat industry research council,Australia.
Fageria NK, Baligara VC, Jones CA, 1997. Growth and mineral nutrition of field crops (2nded.). MarcelDekker. Inc., New York, USA pp. 243-288.
Grant C, Bittman S, Montreal M, Plenchette C, Morel C, 2005. Soil and fertilizer phosphorus: Effect on plantP supply and mycorrhizal development. Can J Plant Sci. 85: 3-14.
Halvin JL, Beaton JD, Tisdale SL, Nelson WL, 1999. Soil Fertility and Fertilizers. An Introduction to NutrientManagement 6th ed. Pearson Education, Singapore. pp:154-196.
Hedley MJ, Mortvedt JJ, Bolan NS, Syers JK, 1995. Phosphorus fertility management in agro-ecosystem. p.59-92. In: Tiessen, H. (ed.) Phosphorus in the global environment, transfers, cycles and themanagement. Wiley, Chichester, UK.
Holford I, 1989. Phosphorous behavior in soils. Agri Sci. 12: 15-20.Hussain N, Hyder N, Ahmad N, 2004. Influence of phosphorus application on growth and yield components
of wheat cultivar Punjab-96. Indus J. Plant Sci. 3(3): 276-279.Hussain.A, 2007. Phosphorus fertilizer requirement of wheat (Triticum aestivum L.)And Lentil (Lens
culinaris Medic.) on three alluvial calcareous soils. Ph.D Dissertation Institute of Soil andEnvironmental Sci.Univ. of Agric. Faisalabad.
Jarrell WM, Beverly R, 1981. The dilution effect in plant nutrition studies. Adv Agron. 34: 197-224.Jones JR, Wolf B, Mills HA, 1991. Plant analysis handbook. Micro-Macro publishing Inc., Athens, GA.
Intl. J. Agron. Plant. Prod. Vol., 4 (5), 915-927, 2013
926
Khalid M, 1995. Effect of different levels of P on growth and yield of wheat sown from mid Nov. to mid Dec.M.Sc. (Hons) Agric. Thesis.Dept. of Agron.Unvi, Agric.Faisalabad, Pakistan.
Khalid S, Shafi M, Anwar S, Bakht J, Khan AD, 2004. Effect of nitrogen and phosphorus application onthe yield and yield components of wheat. Plant Nut Fert Sci. 12(5): 628- 634.
Leytem AB, Mikkelsen RL, 2005. The nature of phosphorus in calcareous soils. Better Crops 89: 11-13.
Lindsay WL, 1979. Chemical Equilibria in Soils.John Wiley and Sons.Inc, New York.Malik DM, Chaudhary RA, Sherazi SJA, 1992. Management of phosphorus for wheat production in Punjab.
p. 175-195. In: Nisar et al (ed) Proc. Symp. on the role of phosphorus in crop production. July 15-171990. NFDC, Islamabad, Pakistan.
Nawaz M, 1989. Study on maximum potential of two newly evolved wheat varieties (Faisalabad-85).M.Sc. Agr. Thesis, Agron. Deptt.Unvi. Agri. Faisalabad.
NFDC, 1991. Database and records of national fertilizer development centre. Planning andDevelopment Division, Government of Pakistan, Islamabad, Pakistan.
Nisar A, 1985. Phosphorus requirements of wheat crop in different cropping systems. Fert News30(7): 38-42.
Nisar A, 1988. Phosphorus use efficiency and soil test crop response correlation. Ph.D. Thesis.Department of Soil Science, University of Agriculture, Faisalabad, Pakistan.
Nisar A, 1996. Annual Fertilizer Review.NFDC Publication No. 11/96.Islamabad.31.Nisar A, Saleem MT, Twyford IT, 1992. Phosphorus Research in Pakistan: A Review. p. 5992. In: A. Nisar et
al. (ed.) Proc. Symp. On the role of phosphorus in crop production. July 15-17, 1990. NFDC,Islamabad, Pakistan.
Poulsem KH, Nagy R, Gao L L, Smith SE, Bucher M, Smith FA, Jakobsen I, 2005. Physiological andmolecular evidence for Pi uptake via the symbiotic pathway in a reduced mycorrhizal colonizationmutant in tomato associated with a compatible fungus. New Phytol. 168, 445-453.
Principles Steel RGD, Torrie JH, 1980. Principles and procedures of statistics. McGraw Hill Book Co. Inc.New York.
Rahmatullah MA, Gill MA, Sheikh BZ, Zia MS, 1994. Inorganic phosphorus fractions and their availability forplant uptake in several calcareous soils. In: Proc. 4th national cong. Soil Sci. May, 24-26, 1992.Islamabad, Pakistan.
Ravnskov S, Jakobsen I, 1995. Functional compatibility in arbuscular mycorrhizas measured as hypal Ptransport to the plant. New Phytol. 129: 611-618.
Rehman OU, 2004. Plant availability of native, residual and fertilizer phosphorus in alluvial soils of rice tract.PhD. Diss. Dept. Soil Sci., Unvi. Agric., Faisalabad, Pakistan.
Reuter J, Dyson CB, Elliott DE, Lewis DC, Rudd CL, 1995.An appraisal of soil phosphorus testing data forcrops and pastures in South Australia. Aust J Exp Agric. 35: 979-995.
Ryan I, 2002. Efficient use of phosphate fertilizers for sustainable crop production in WANA. IMPHOS:Phosphate Newsletter: 2-5.
Saleem MT, 1992. An overview of phosphatic fertilizer in Pakistan. p. 9-38. In: A Nisar et al (ed) Proc.Symp. on the role of phosphorus in crop production. July 15-17, 1990. NFDC,Islamabad, Pakistan
Samadi A, 2003. Predicting phosphate fertilizer requirement using sorption isotherms in selectedcalcareous soils of Western Azarbaijan province, Iran Commun Soil Sci Plant Anal. 34:2885-2899.
Sharif M, 1885. Improvement of P fertilizer efficiency. Proc. Inter. Seminar on fertilizer use efficiency.No., 4-6, 1985, Lahore, 106-116.
Sharif M, Chaudhry TM, 1995. Effect of time and methods of fertilizer application with special referenced totheir treatment with FYM on fertilizer use efficiency. In Int. Seminar on “Ferti. Use Efficiency,” 63-82.FFC limited, Lahore.
Sharif M, Sarir MS, Rabi F, 2000. Biological and chemical transformation of phosphorus in some importantsoil series of NWFP. Sarhad J Agric. 16(6): 587-592.
Soltonpour P N, Schawab AP, 1977. A new soil test for simultaneous extraction of soil macro andmicronutrients in alkaline soil. Comm. Soil Sci. Plant Anal. 8: 195-207.
Steel R G D, Torrie JH, Dickey D, 1997. Principles and Procedures of Statistics: A Biometrical Approach,Third Edition, New York: McGraw-Hill, Inc.
Tandon HLS, 1992. Phosphorus research in India.Symposium on the role of phosphorus in cropproduction.Govt of Pak. Planning and Development Division, Islamabad. 93- 130.
Tariq J M T, Arif M, Akbar H, Ali S, 2007. Response of wheat to source, type and timeof nitrogen application.Sarhad J Agric. 23(4): 871-879.
World Bank, 1992. World Development Report, Development and Environment. World Bank, Washington,DC.

Intl. J. Agron. Plant. Prod. Vol., 4 (5), 915-927, 2013
927
Yaseen M, Gill MA, Siddique M, Ahmed Z, Mahood T, Hamud-ur-Rehman, 1998. Phosphorus deficiencystress tolerance and phosphorus utilization efficiency in wheat genotypes. In: proceeding ofsymposium on plant nutrition management for sustainable agric. Growth. Govt. of Pakistan, Planningand Development Division NFDC, Islamabad.
Yaseen M, Sohail M, Mahmood R, Hussain SA, Rahim A, Ahmad W, Saif-ur-Rehman Kashif, 2004.Phosphorus use efficiency in wheat genotypes: II Chemical composition. Pak. J Life Soc Sci.292: 159-162.
Zia MS, Gill MA, Aslam M, Hussain MF, 1991. Fertilizer use efficiency in Pakistan. Progressive Farming.11:35-38.
Related Documents