RESPONSE OF TRANSMISSION TOWERS SUBJECTED TO TORNADO LOADS Shakeel Ahmad 1 and Md. Ehtesham Ansari 2 1 Professor, Department of Civil Engineering, Aligarh Muslim University, Aligarh, [email protected] Ex P.G. Student, Department of Civil Engineering, Aligarh Muslim University, Aligarh, [email protected] ABSTRACT Many transmission lines and tower failures worldwide are attributed to High Intensity Winds (HIW) associated with tornadoes and microbursts. In the present study, a 35m high transmission tower under tornadic loads has been analysed under STAAD pro environment. The results show that the response of the transmission line tower is extremely high due to the tornadic wind load. The maximum displacement at the top of the transmission line tower is 190mm and 60mm in X and Y directions respectively whereas the maximum nodal displacement increases rapidly from 12m height to the top of the tower in both X and Y directions. On visualizing the mode shapes, it may be concluded that the tower section at 27m height may be affected adversely if the tower meets the resonance in modes higher than sixth mode. Keywords: TORNADO LOADS, TRANSMISSION TOWER, DYNAMIC RESPONSE Introduction Tornado is known to be the most violent storm on the earth’s surface. A severe tornado brings extremely high winds accompanied by a sudden pressure change causing death and serious damage or collapse of structures along its path. Although tornado is a worldwide phenomenon [Fujita (1973)], severe ones occur most often in the midwestern United States and have been one of the major natural hazards in this region [Wen (1975a]. When designing transmission towers with conventional geometrics and conductor arrangements the engineer has many design codes and guides available [ESDU part I & II, 1988 and IEC, 1979 and 1991]. These design procedures consider the mean wind loads acting on the conductors and tower members and also take into account the quasi-steady dynamic loads induced by the conductors on the tower, as well as the effects of localized ‘patch’ loads. Despite the availability of such codes our standing of the behaviour of transmission lines remains incomplete [Loredo- Suza and Davenport, (1996)]. In many cases the main cause of the transmission tower failures is the loading arising under off-design conditions due to the actions of High Intensity Winds (HIW) [Dempsey, (1996)]. Indeed, transmission towers failure due to action of HIW is a major and costly problem in the Americas, Australia and South Africa with many of the utility organizations reporting that 80-100% of all weather related failures are the results of HIW. These meteorological phenomena are localized and unpredictable, such that their structure, scale and

Welcome message from author
This document is posted to help you gain knowledge. Please leave a comment to let me know what you think about it! Share it to your friends and learn new things together.
Transcript

RESPONSE OF TRANSMISSION TOWERS SUBJECTED TO TORNADO LOADS
Shakeel Ahmad1 and Md. Ehtesham Ansari2
1Professor, Department of Civil Engineering, Aligarh Muslim University, Aligarh, [email protected]
Ex P.G. Student, Department of Civil Engineering, Aligarh Muslim University, Aligarh, [email protected]
ABSTRACT Many transmission lines and tower failures worldwide are attributed to High Intensity Winds (HIW) associated with tornadoes and microbursts. In the present study, a 35m high transmission tower under tornadic loads has been analysed under STAAD pro environment. The results show that the response of the transmission line tower is extremely high due to the tornadic wind load. The maximum displacement at the top of the transmission line tower is 190mm and 60mm in X and Y directions respectively whereas the maximum nodal displacement increases rapidly from 12m height to the top of the tower in both X and Y directions. On visualizing the mode shapes, it may be concluded that the tower section at 27m height may be affected adversely if the tower meets the resonance in modes higher than sixth mode. Keywords: TORNADO LOADS, TRANSMISSION TOWER, DYNAMIC RESPONSE Introduction Tornado is known to be the most violent storm on the earth’s surface. A severe tornado brings extremely high winds accompanied by a sudden pressure change causing death and serious damage or collapse of structures along its path. Although tornado is a worldwide phenomenon [Fujita (1973)], severe ones occur most often in the midwestern United States and have been one of the major natural hazards in this region [Wen (1975a]. When designing transmission towers with conventional geometrics and conductor arrangements the engineer has many design codes and guides available [ESDU part I & II, 1988 and IEC, 1979 and 1991]. These design procedures consider the mean wind loads acting on the conductors and tower members and also take into account the quasi-steady dynamic loads induced by the conductors on the tower, as well as the effects of localized ‘patch’ loads. Despite the availability of such codes our standing of the behaviour of transmission lines remains incomplete [Loredo-Suza and Davenport, (1996)]. In many cases the main cause of the transmission tower failures is the loading arising under off-design conditions due to the actions of High Intensity Winds (HIW) [Dempsey, (1996)]. Indeed, transmission towers failure due to action of HIW is a major and costly problem in the Americas, Australia and South Africa with many of the utility organizations reporting that 80-100% of all weather related failures are the results of HIW. These meteorological phenomena are localized and unpredictable, such that their structure, scale and
溫素嵐
印章
intensity cannot readily be measured in the field by conventional recording stations. It is not always the high wind speed which causes tower failure but, rather, the fact that the localized wind structure may impose loads which are not normally taken into account in the design. Such HIW may be associated with various downbursts and microbursts, as well as mature tornadoes [Savory et al. (2001)]. In a conventional design the engineer takes into account both the wind load on the tower and, more importantly, the weight of the transmission conductors and the wind load on them. From these load sources, the line of action of the resultant transverse forces may be determined allowing the tower to be designed such that the internal force members act to brace the structure but do not take significant loads themselves. For normal wind conditions, even at high wind speeds, this arrangement is adequate. However, in the case of HIW in the form of tornadoes the wind structure may be so localized that only the tower is significantly affected and not the conductors. In addition, for all types of HIW the shape of the gust may further act to change the line of action of the wind loads, normally moving it closer to the ground level [Dempsey, (1996)]. In this radically off-design condition tower failure may occur, sometimes initiated by collapse of the members in the windward faces of the tower. Since such behaviour is not accounted for within current conventional design processes it is imperative that new methodologies are adopted, both for remedial action on existing towers and for HIW-resistant design of new lines [Savory et al. (2001)]. Hence, a more rational design of transmission line systems in those parts of the world where HIW are a common occurrence needs to include assessment of tower or conductor failure due to the effects of those winds. Models are being developed, based upon evidence of HIW occurrence and damage, in which statistical analysis of the data are used to assess the probability of a HIW of a particular intensity and scale intercepting a specified length of line. In the case of tornadoes, general risk assessment models have been developed [Wen et al. (1975) and Twisdale et al. (1983)], whilst others have been formulated for specific countries such as South Africa [Milford et al. (1997)] and Argentina [Lezoala et al. (1997)].Risk assessment models for downburst have been proposed by a number of workers [Krishnaswamy, (1985), MacMohan, (1995) and Elever at el. (1996)], the latter focusing upon Australia. However it has recently been noted [Holmes, (1999)] that the actual physical characteristics of HIW events, together with our ability to model them, have been a largely neglected area of wind engineering research. The flow field associated with a tornado is very different from that associated with a microburst. Hence, even though the two events may be similar in intensity and may have the potential to cause failure of a transmission tower the actual failure modes would probably be different. Tornadoes that extend to the ground are characterized by strong vertical motion in the horizontal plane, perhaps with secondary suction vortices, and these motions are convected laterally by the local environmental wind field [Fujita, (1981)]. In contrast, downburst of different scales including microbursts, are characterized by a “wall jet” which rapidly spreads radially outwards after touchdown and may, again be converted by the ambient wind field. The basic form of microbursts have been described [Fujita, (1990)], from observational evidence, as being a rapid and intense downburst of air, forming a vortex ring with a horizontal extent of less than 4 kms, which makes contact with the ground and spreads quickly outwards. In tornadoes, the wind changes speed and direction rapidly. The large pressure gradient and the high acceleration in such unsteady flows will undoubtedly produce a very large inertia force. For this reason the conventional wind force formula based on the quasi-steady assumption (inertia
The Seventh Asia-Pacific Conference on Wind Engineering, November 8-12, 2009, Taipei, Taiwan
force do not considered) may not be applicable; the effect of inertia force, therefore, needs to be examined. A typical damaging tornado has a core width of several hundred feet and an average translation speed of about 40mph (18m/s), thus the duration of the intense wind action on a structure is very brief (a matter of seconds) [Wen, (1975b)]. A tornado generally takes the shape of a core or a cylinder or of a funnel. The maximum velocity of wind in a tornado ranges between 250 and 800km/h (70 and 225m/s) [Ying et al. (1970)]. However, such intense tornadoes as with a velocity of 800km/h, are not quite frequent. The frequency of occurrence is inversely proportional to the maximum velocity of wind [Fujita, (1976)]. Comparatively speaking, ordinary wind force generally maintains a constant level (with fluctuation due to turbulence) for a relatively long period of time, whereas tornadic wind force is of extremely high intensity and short duration, essentially an impact-type load. Laboratory models of tornado-like vortex have been developed by Ying and Chang [1970], Haan FL et al. [2008] and others and field observations by Hoecker [1960] and Fujita [1960]. Kuo [1966] presented a theoretical model of a tornado like vortex and obtained velocity profiles as function of redial distance and height. The Tornado Model
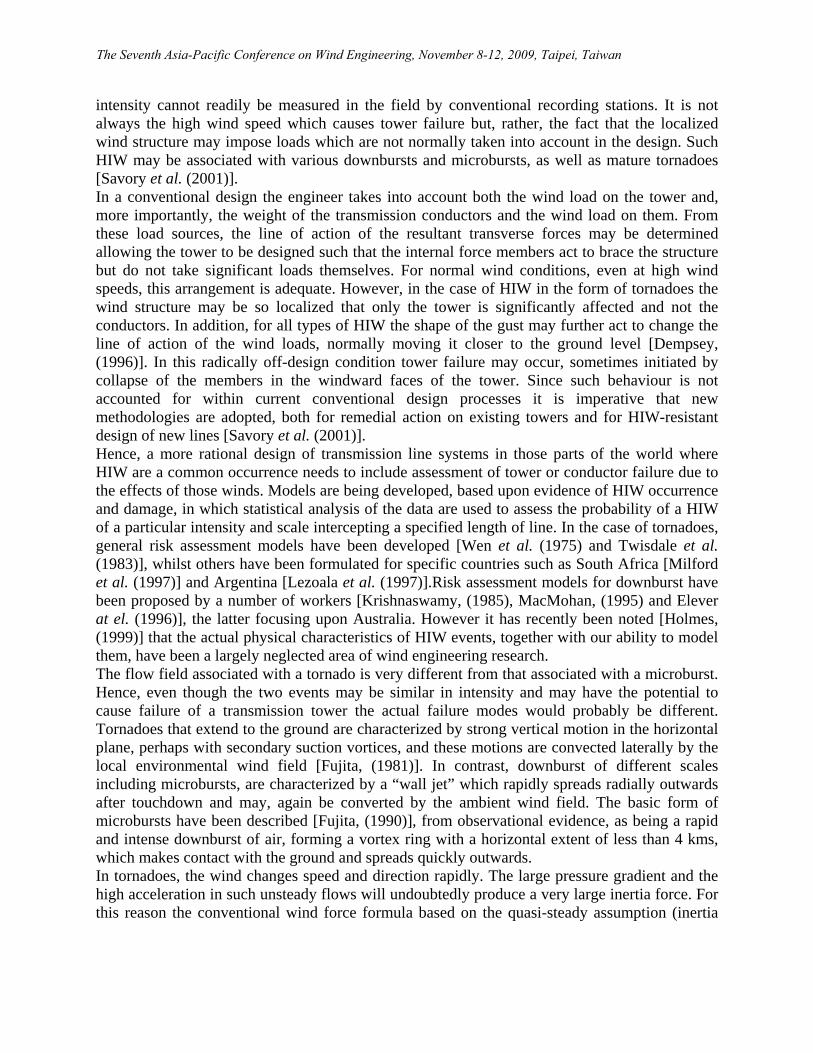
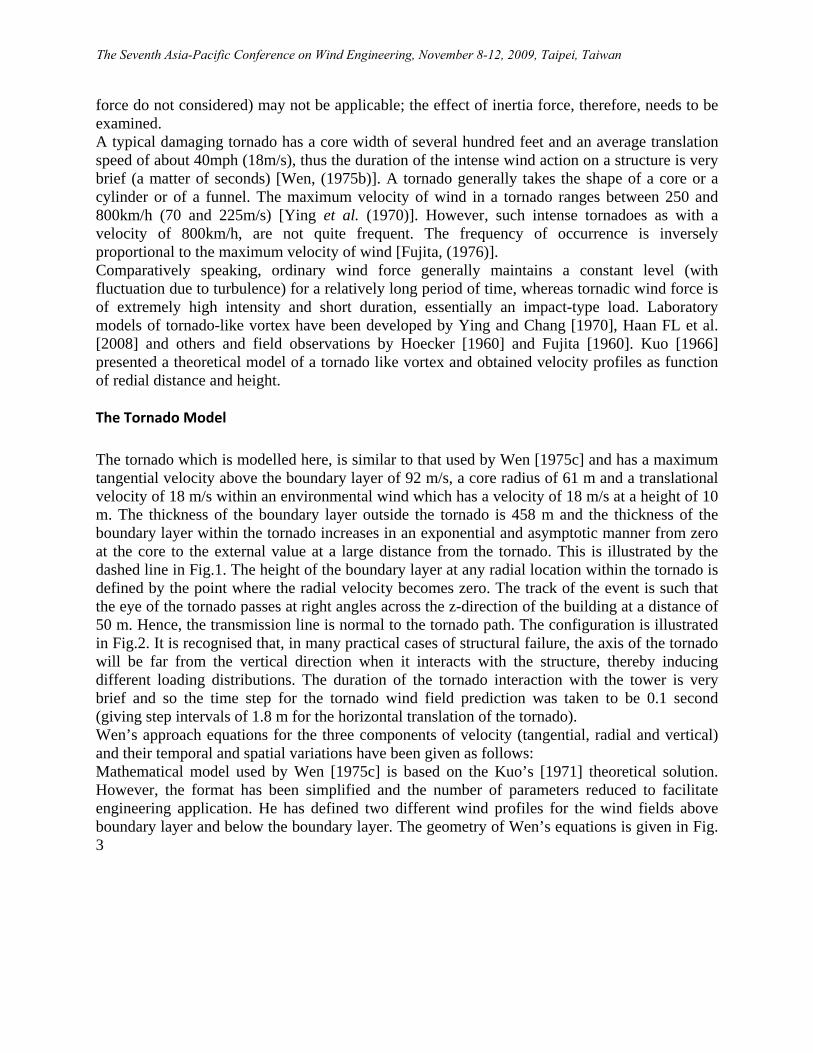
The tornado which is modelled here, is similar to that used by Wen [1975c] and has a maximum tangential velocity above the boundary layer of 92 m/s, a core radius of 61 m and a translational velocity of 18 m/s within an environmental wind which has a velocity of 18 m/s at a height of 10 m. The thickness of the boundary layer outside the tornado is 458 m and the thickness of the boundary layer within the tornado increases in an exponential and asymptotic manner from zero at the core to the external value at a large distance from the tornado. This is illustrated by the dashed line in Fig.1. The height of the boundary layer at any radial location within the tornado is defined by the point where the radial velocity becomes zero. The track of the event is such that the eye of the tornado passes at right angles across the z-direction of the building at a distance of 50 m. Hence, the transmission line is normal to the tornado path. The configuration is illustrated in Fig.2. It is recognised that, in many practical cases of structural failure, the axis of the tornado will be far from the vertical direction when it interacts with the structure, thereby inducing different loading distributions. The duration of the tornado interaction with the tower is very brief and so the time step for the tornado wind field prediction was taken to be 0.1 second (giving step intervals of 1.8 m for the horizontal translation of the tornado). Wen’s approach equations for the three components of velocity (tangential, radial and vertical) and their temporal and spatial variations have been given as follows: Mathematical model used by Wen [1975c] is based on the Kuo’s [1971] theoretical solution. However, the format has been simplified and the number of parameters reduced to facilitate engineering application. He has defined two different wind profiles for the wind fields above boundary layer and below the boundary layer. The geometry of Wen’s equations is given in Fig. 3
The Seventh Asia-Pacific Conference on Wind Engineering, November 8-12, 2009, Taipei, Taiwan
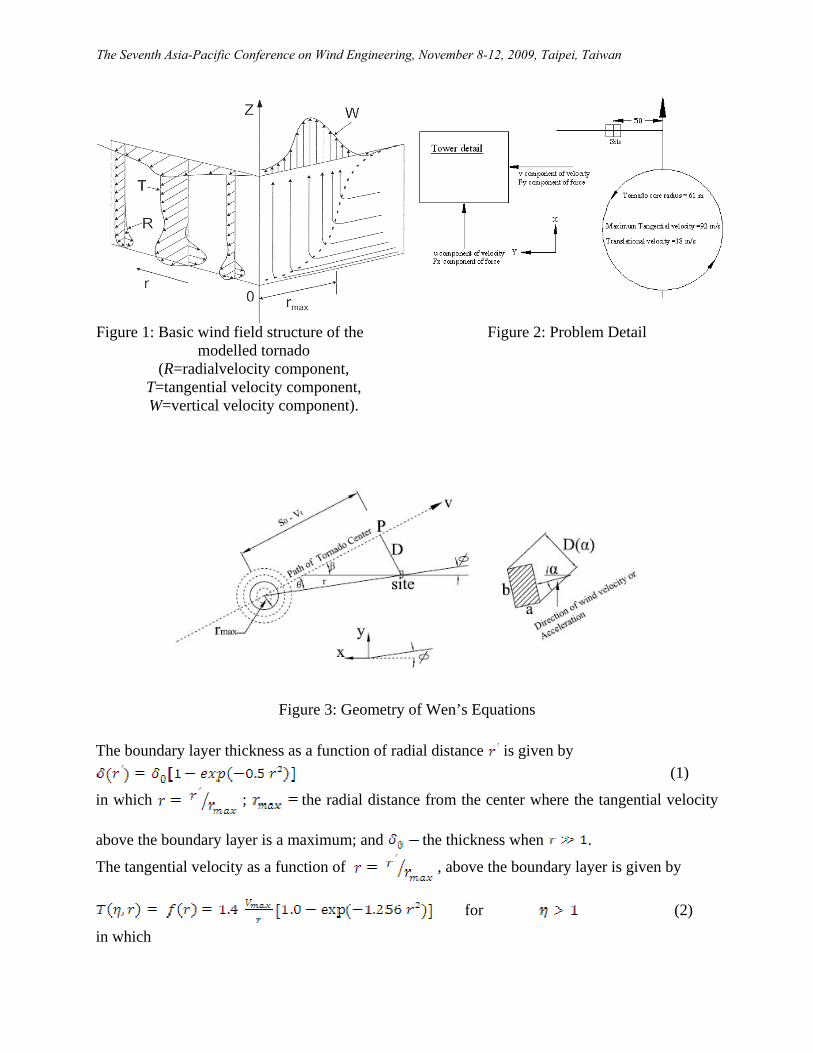
Figure 1: Basic wind field structure of the modelled tornado
(R=radialvelocity component, T=tangential velocity component, W=vertical velocity component).
Figure 2: Problem Detail
Figure 3: Geometry of Wen’s Equations
The boundary layer thickness as a function of radial distance is given by (1)
in which ; the radial distance from the center where the tangential velocity
above the boundary layer is a maximum; and the thickness when .
The tangential velocity as a function of , above the boundary layer is given by
for (2)
in which
The Seventh Asia-Pacific Conference on Wind Engineering, November 8-12, 2009, Taipei, Taiwan

the maximum tangential velocity above the boundary layer; ; and
the height above ground level. According to Kuo, the vertical component has a very weak descending motion in the region outside the core and a much stronger ascending motion in the core and has a maximum at the vicinity of 0.6 to 1.0. The vertical component in Kuo’s solution is fitted by
for (3) The radial component is zero above the boundary layer The velocity profiles within the boundary layer are of the following forms which are essentially modifications of Eqs. 2 and 3 using Ekman-layer type profile:
for (4)
Therefore, Eqs. 1-4 specify the wind field completely with only three free parameters, ,
and , which can be chosen properly according to the basic characteristics of a tornado such as its size, intensity, etc. Translational velocity at different height, (5)
The velocity components acting on the tower in Cartesian coordinates are given as:
(6) Where, = angle between the tornado path and the line joining the structure and the tornado core,
Tornadic Wind Forces The fluid mechanics involved in a flow past a bluff body is extremely complex. Except for a few simple, idealized cases, forces exerted by the fluid on the obstacle are mostly determined by experiments. The force-velocity relationship for a slender bluff body can be approximated by the following semi-empirical equation [51]
(7)
in which the total resistance force per unit length. It is the sum of two components, the drag and the inertia force being proportional to the square of the velocity and the acceleration, respectively. Terms and are the drag and inertia coefficients; and are the density of the fluid and the projection width of the bluff body. The values of and are determined experimentally. The forces per meter height in the x and y directions on a Tower at a height z are
(8)
(9)
The Seventh Asia-Pacific Conference on Wind Engineering, November 8-12, 2009, Taipei, Taiwan
Forces in x and y directions acting at a node on windward side at height z are (10)
(11) where, = solidity ratio Forces in x and y directions acting at a node on leeward side at height z are,
(12)
(13) Each front node receives 1/3rd of the load acting at that level and each back node 1/6th of the load. For these narrow-fronted HIW only the wind loading on the tower is included since typical HIW-induced damage of transmission lines indicates [9] that the contribution to the tower loads from the conductors is secondary under these conditions. Analysis, Results and Discussions The analysis was done in STAAD Pro environment. The time history of velocities (u,v and w) and force (Qx and Qy) generated from the equations mentioned above, at different level of the tower has been shown in Fig.5 and 6 respectively. The data used for the generation of velocities and forces are shown in Table whereas, the geometrical parameters of the tower are shown in Table-2. The Time history of force (Fig. 6) was used in the STAAD Pro for the analysis. First twelve mode shapes of the modeled tower (Fig. 4) have been shown in Fig. 7. Frequencies in all the twelve modes have been given in Table 3. Nodal displacements at various heights and all the corner of the tower are shown in Fig.8 (a-d). The response of the transmission line tower is extremely high due to the tornadic wind load. The displacement at the top of the tower is 190 mm and 60 mm in X and Y-directions respectively. The maximum vertical displacement is near the mid height of the tower. Also the maximum displacement rapidly increases from 12 m height to the top of the tower in both X and Y-directions (Fig.8). The trend shows that the failure occurs at 12m height, Approx. 1/3rd height from bottom level of the tower. Also the section at 27 m height may be affected adversely if the tower meets the resonance in modes higher than sixth mode (Fig.7). The extremely high response of structure (Fig.8) suggests that elastic limit of material will exceed, as indicated by the permanent damage found in damaged transmission line towers [Savory et al, (2001)]. To include the aspects of yielding and plastic deformation into consideration, a nonlinear analysis would be required.
Table 1: Data Related to Generation of Tornado Time History Thickness of boundary layer outside the tornado,
Tornado core radius, Maximum tangential velocity above boundary layer, Angle between path of the tornado and direction of Fx, Translational velocity at 10m height, Distance between the path of tornado eye and the C.G. of the building, Time step for the tornado wind field prediction, = 0.1 s
The Seventh Asia-Pacific Conference on Wind Engineering, November 8-12, 2009, Taipei, Taiwan
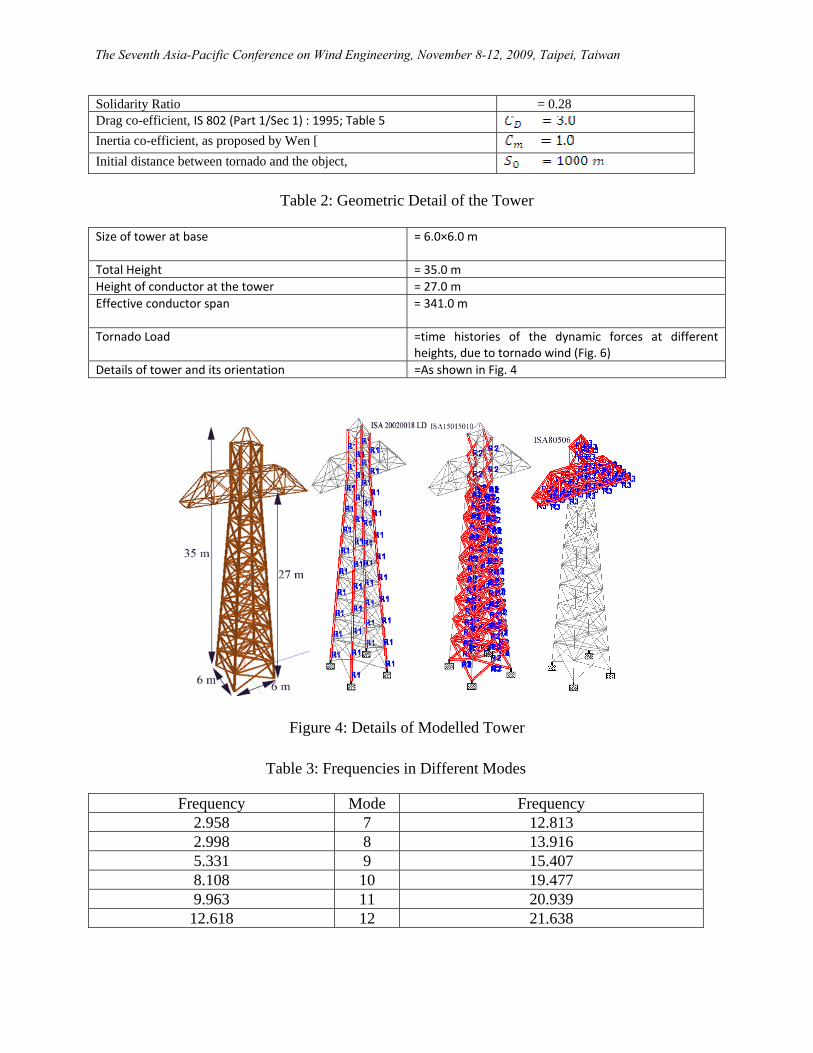
Solidarity Ratio = 0.28 Drag co-efficient, IS 802 (Part 1/Sec 1) : 1995; Table 5 Inertia co-efficient, as proposed by Wen [ Initial distance between tornado and the object,
Table 2: Geometric Detail of the Tower Size of tower at base = 6.0×6.0 m
Total Height = 35.0 mHeight of conductor at the tower = 27.0 mEffective conductor span = 341.0 m
Tornado Load =time histories of the dynamic forces at different
heights, due to tornado wind (Fig. 6) Details of tower and its orientation =As shown in Fig. 4
Figure 4: Details of Modelled Tower
Table 3: Frequencies in Different Modes
Frequency Mode Frequency 2.958 7 12.813 2.998 8 13.916 5.331 9 15.407 8.108 10 19.477 9.963 11 20.939 12.618 12 21.638
The Seventh Asia-Pacific Conference on Wind Engineering, November 8-12, 2009, Taipei, Taiwan
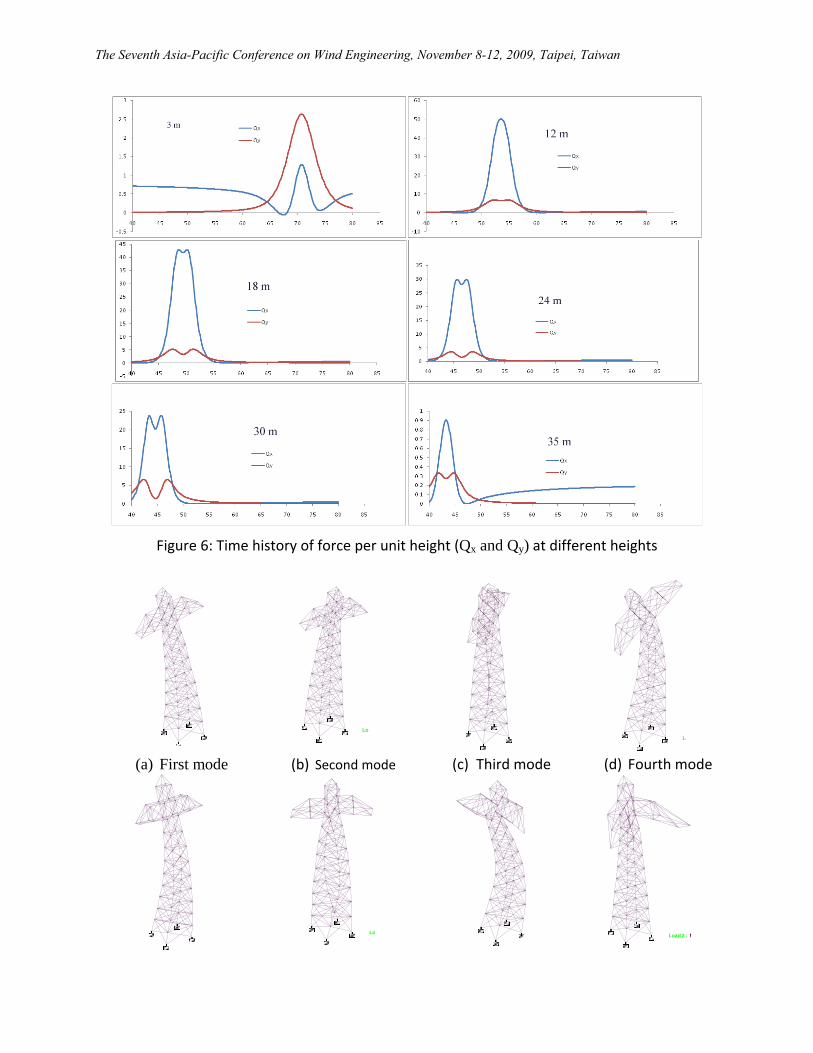
Figure 6: Time history of force per unit height (Qx and Qy) at different heights
Loa
Lo
(a) First mode (b) Second mode (c) Third mode (d) Fourth mode
Lo
MLoad 2 :
The Seventh Asia-Pacific Conference on Wind Engineering, November 8-12, 2009, Taipei, Taiwan

(e) Fifth mode (f) Sixth mode (g) Seventh mode (h) Eighth mode
Lo
L
Loa
(i) Ninth mode (j) Tenth mode (k) Eleventh mode (l) Twelfth mode Figure 7: First Twelve mode shapes of the Tower
(a) X and Y both leeward Nodes (b) X windward Y leeward Nodes
(c) X leeward Y windward Nodes (d) X Y both wind ward Nodes
Figure 8: Maximum Displacement at Different Heights Due to Tornadic Wind Load
The Seventh Asia-Pacific Conference on Wind Engineering, November 8-12, 2009, Taipei, Taiwan

Conclusions The maximum displacement at the top of the transmission line tower is 190mm and 60mm in X and Y directions respectively. The maximum nodal displacement increases rapidly from 12m height to the top of the tower in both X and Y directions. On visualizing the mode shapes, it may be concluded that the tower section at 27m height may be affected adversely if the tower meets the resonance in modes higher than sixth mode. References Fujita T. T. (1960), “A Detailed Analysis of the Fargo Tornadoes: Research Paper No. 42”, U.S. Department of
Commerce, Weather Bureau, Washington, D.C. Fujita T. T. (1976), “Recent Concept of Tornado Winds, In Hatsuo Ishizaki, Arthur n. C. Chiu Eds”, Procedding of
the Second Usa-Japan Research Seminar on Wind Effects on Structures, University of Tokyo, Tokyo, Japan, 1-14. Fujita T. T. (1981), “Tornadoes and Downbursts in the Context of Generalized Planetary Scales”, J. Atmospheric
Science, 38, 1511-33. Fujita T. T. (1990), “Downbursts: meteorological features and wind field characteristics, J. Wind Engineering and
Industrial Aerodynamics, 36, 75-86. Fujita, T. T. (1973), “Tornado Around the World, Weatherwise”, 26(2), 56-83. Haan F. L., Sarkar, P. P., Gallus, W. A. (2008) (In print), “Design, Construction and Performance of a Large
Tornado Simulator for Wind Engineering Applications, J. Engineering Structures, (www. Sciencedirect.com). Hoecker W. H. (1960), “Wind Speed and Air Flow Pattern in the Dallas Tornado of April 1957”, Mon. Weather
Rev, 88, 167-180. Holmes J. D. (1999), “Modeling of Extreme Thunderstorm Winds for Wind Loading of Structures and Risk
Assessment”, In: Larsen a Larose GL, Livesey FM, Editors, Wind Engineering Into the 21th Century, Rotterdam, Bulkema, 1409-15.
Krishnaswamy, S. G. (1985), ‘Assessment of Weather Induced Transmission Line Loads on a Probabilistic Basis.
IEEE Trans Power App and Syst. 104, 510-16. Kuo H. L. (1966), “On the Dynamics of Convective Atmospheric Vertices”, J. Atmospheric Science, 23, 25-42. Kuo, H. L. (1971), “Asisymetric Flow in the Boundary Layer of a Maintained Vortex”, J. of Atmospheric Sciences,
28(1), 20-41. Lezaola J., de Schwarzkopf A. L. A., Rosso L. C., Carstairs D. (1997), “The Influence of Severe Meteorological
Events on EHV Conductor Selection. Paper at University of Western Ontario Workshop on Control Of Damage to Transmission Lines Due to HIW, Ontario, Canada, October.
MacMohan B. (1995),”Reliability and Maintainance Practices for Australian and New Zealand Hv Transmission
Lines”, In: Proc. 2nd Int. Conf. on Reliability of Transmission and Distribution Equipment Coventry, U.K. March, 198-203.
Milford R. V.,Goliger A. M. (1997), “Tornado Risk Model for Transmission Line Design”, J. Wing Engg.
Industrial Aero Dynamics 72, 469-478.
The Seventh Asia-Pacific Conference on Wind Engineering, November 8-12, 2009, Taipei, Taiwan
Oliver S. E., Monarty W. W. and Holmes J. D. (1996), “A Severe Thunderstorm Risk Model for Transmission Line Design: Queensland and New South Wales”, Australian Bureau of Meteorology Special Service Unit, ESAA Report No.4.
Savory E., Gerard A. R., Zeinoddini M, Toy N and Disney P. (2001), “Modeling of Tornado and Microburst-
Induced Wind Loading and Failure of a Lattice Transmission Tower”, Engineering Structures, 23, 365-375. Twisdale L. A, Dunn W. L. (1983), “Wind Loading Risk from Multivortex Tornadoes”, J. Structural Engineering,
ASCE, 109, 2016-22. Wen Y. K. (1975c), “Dynamic Tornadic Wind Loads on Tall Buildings, J. ASCE, Structural Div, 169-185. Wen, Y. K. (1975a),”Tornadic Risk and Wind Effect on Structures In: J.E. Kein, Editor, Proceedings of the Fouth
International Conference on Wind Effects on Buildings, Heathrow, Cambridge University Press, London pp 63-74.
Wen, Y. K. (1975b), “Tornadic Risk And Wind Effect on Structures In: J.E. Kein, Editor, Proceedings of the Fourth International Conference on Wind Effects on Buildings, Heathrow, Cambridge University Press, London, 63-74.
Ying S. J. and Chang C. C. (1970), “Exploratory Model Study of Tornado-Like Vortex Dynamics, J. Atmospheric
Science, 27, 3-14. Engineering Science Data Unit (ESDU) 1988, “Lattice Structures Part I: Mean Fluid Forces on Single and Multiple
Plane Frames, Wind Engineering Sub-Series Data Item 81027”, London. Engineering Science Data Unit (ESDU) 1988, “Lattice Structures Part Ii: Mean Fluid Forces On Tower-Like Space
Frames, Wind Engineering Sub-Series, Data Item 81028”, London. International Electrotechnical Commission (IEC) 1979, “Loading Tests on Overhead Line towers. Report 60652”,
Ist Ed, Technical Committee 11: Overhead Lines. International Electrotechnical Commission (IEC) 1991, Loading and Strength of Overhead Transmission Lines”,
Report 60826 Tro 2nd Ed, Technical Committee 11: Overhead Lines. American society of civil engineers (ASCE) 1991, Guigelines for Electrical Transmission Line Structural Loading,
ASCE Manuals and Reports on Engineering Practice, No. 74, New York. Loredo-Souza, A. M., Davenport, A. G. (1996), “Wind Tunnel Modeling of Transmission Lines”, In: Proc. 3rd Int.
Coll. on Bluff Body Aerodynamics and Application, Virginia, USA, Blacksburg, B XI 9-B XI 12. Dempsey D. (1996), “White HB, Winds Wreak Havoc on Lines”, Transmission and Distribution World, June, 32-
42.
The Seventh Asia-Pacific Conference on Wind Engineering, November 8-12, 2009, Taipei, Taiwan
Related Documents