Response of fixed offshore platforms to wave and current loading including soil – structure interaction Yasser E. Mostafa a , M. Hesham El Naggar b, * a Geotechnical Engineer, Golder Associates, Burmnaby, B.C., Canada b Associate Professor and Research Director, Geotechnical Research Centre, Faculty of Engineering, The University of Western Ontario, London, Ontario, Canada N6A 5B9 Accepted 17 November 2003 Abstract Fixed offshore platforms supported by pile foundations are required to resist dynamic lateral loading due to wave forces. The response of a jacket offshore tower is affected by the flexibility and nonlinear behaviour of the supporting piles. For offshore towers supported by clusters of piles, the response to environmental loads is strongly affected by the pile –soil – pile interaction. In the present study, the response of fixed offshore platforms supported by clusters of piles is investigated. The soil resistance to the pile movement is modelled using dynamic p–y curves and t–z curves to account for soil nonlinearity and energy dissipation through radiation damping. The load transfer curves for a single pile have been modified to account for the group effect. The wave forces on the tower members and the tower response are calculated in the time domain using a finite element package (ASAS). Several parameters affecting the dynamic characteristics of the platform and the platform response have been investigated. q 2004 Elsevier Ltd. All rights reserved. 1. Introduction Foundation piles have a significant effect on the response of fixed offshore structures. Bea [1] performed a series of static push-over analyses on a fixed offshore platform and found that the first nine nonlinear events were concentrated in the foundation piles. Mitwally and Novak [2] used a linear analysis to account for the effect of foundation flexibility including pile–soil–pile interaction on the response of offshore structures to random wave loading. El Naggar and Novak [3] considered foundation nonlinear- ity using an equivalent linear approach. This paper describes an efficient approach to model the response of pile groups supporting a jacket structure to transient loading. The method employs the concepts of dynamic p–y curves and dynamic p-multipliers, t–z curves and q–z curves to model the soil reactions to pile movement. Mostafa and El Naggar [4] have established dynamic p-multipliers to relate the dynamic load transfer curves of a pile in a group to the dynamic load transfer curves for a single pile. The dynamic p-multipliers were found to vary with the spacing between piles, soil type, peak amplitude of loading and the angle between the line connecting any two piles and the direction of loading [4]. Several parameters such as the foundation flexibility, dynamic soil resistance, pile – soil – pile interaction, soil stiffness, and platform deck mass that affect the dynamic characteristics of the platform and the platform response to wave and current loading have been investigated. 2. Platform description The platform considered in this study is the ‘Kvitebjørn’ platform shown in Fig. 1. It is currently under construction in the Norwegian section of the North Sea. Water depth at the site is 190 m and the substructure is a piled steel jacket. The Kvitebjørn substructure has four legs supported by vertical steel piles grouped symmetrically around each corner leg. Due to weight limitations for the offshore lift, the jacket is fabricated, towed to the site and lift-installed as two separate structural units. The upper part of the structure is connected to the lower part through a traditional grouted 0267-7261/$ - see front matter q 2004 Elsevier Ltd. All rights reserved. doi:10.1016/j.soildyn.2003.11.008 Soil Dynamics and Earthquake Engineering 24 (2004) 357–368 www.elsevier.com/locate/soildyn * Corresponding author. Tel.: þ 1-519-661-4219; fax: þ1-519-661-. E-mail addresses: [email protected] (M.H. El Naggar); ymostafa@uwo. ca (Y.E. Mostafa).

Welcome message from author
This document is posted to help you gain knowledge. Please leave a comment to let me know what you think about it! Share it to your friends and learn new things together.
Transcript
Response of fixed offshore platforms to wave and current loading
including soil–structure interaction
Yasser E. Mostafaa, M. Hesham El Naggarb,*
aGeotechnical Engineer, Golder Associates, Burmnaby, B.C., CanadabAssociate Professor and Research Director, Geotechnical Research Centre, Faculty of Engineering,
The University of Western Ontario, London, Ontario, Canada N6A 5B9
Accepted 17 November 2003
Abstract
Fixed offshore platforms supported by pile foundations are required to resist dynamic lateral loading due to wave forces. The response of a
jacket offshore tower is affected by the flexibility and nonlinear behaviour of the supporting piles. For offshore towers supported by clusters
of piles, the response to environmental loads is strongly affected by the pile–soil–pile interaction. In the present study, the response of fixed
offshore platforms supported by clusters of piles is investigated. The soil resistance to the pile movement is modelled using dynamic p–y
curves and t –z curves to account for soil nonlinearity and energy dissipation through radiation damping. The load transfer curves for a single
pile have been modified to account for the group effect. The wave forces on the tower members and the tower response are calculated in the
time domain using a finite element package (ASAS). Several parameters affecting the dynamic characteristics of the platform and the
platform response have been investigated.
q 2004 Elsevier Ltd. All rights reserved.
1. Introduction
Foundation piles have a significant effect on the response
of fixed offshore structures. Bea [1] performed a series of
static push-over analyses on a fixed offshore platform and
found that the first nine nonlinear events were concentrated
in the foundation piles. Mitwally and Novak [2] used a
linear analysis to account for the effect of foundation
flexibility including pile–soil–pile interaction on the
response of offshore structures to random wave loading.
El Naggar and Novak [3] considered foundation nonlinear-
ity using an equivalent linear approach. This paper describes
an efficient approach to model the response of pile groups
supporting a jacket structure to transient loading. The
method employs the concepts of dynamic p–y curves and
dynamic p-multipliers, t –z curves and q–z curves to model
the soil reactions to pile movement. Mostafa and El Naggar
[4] have established dynamic p-multipliers to relate the
dynamic load transfer curves of a pile in a group to the
dynamic load transfer curves for a single pile. The dynamic
p-multipliers were found to vary with the spacing between
piles, soil type, peak amplitude of loading and the
angle between the line connecting any two piles and
the direction of loading [4]. Several parameters such as the
foundation flexibility, dynamic soil resistance, pile–soil–
pile interaction, soil stiffness, and platform deck mass that
affect the dynamic characteristics of the platform and the
platform response to wave and current loading have been
investigated.
2. Platform description
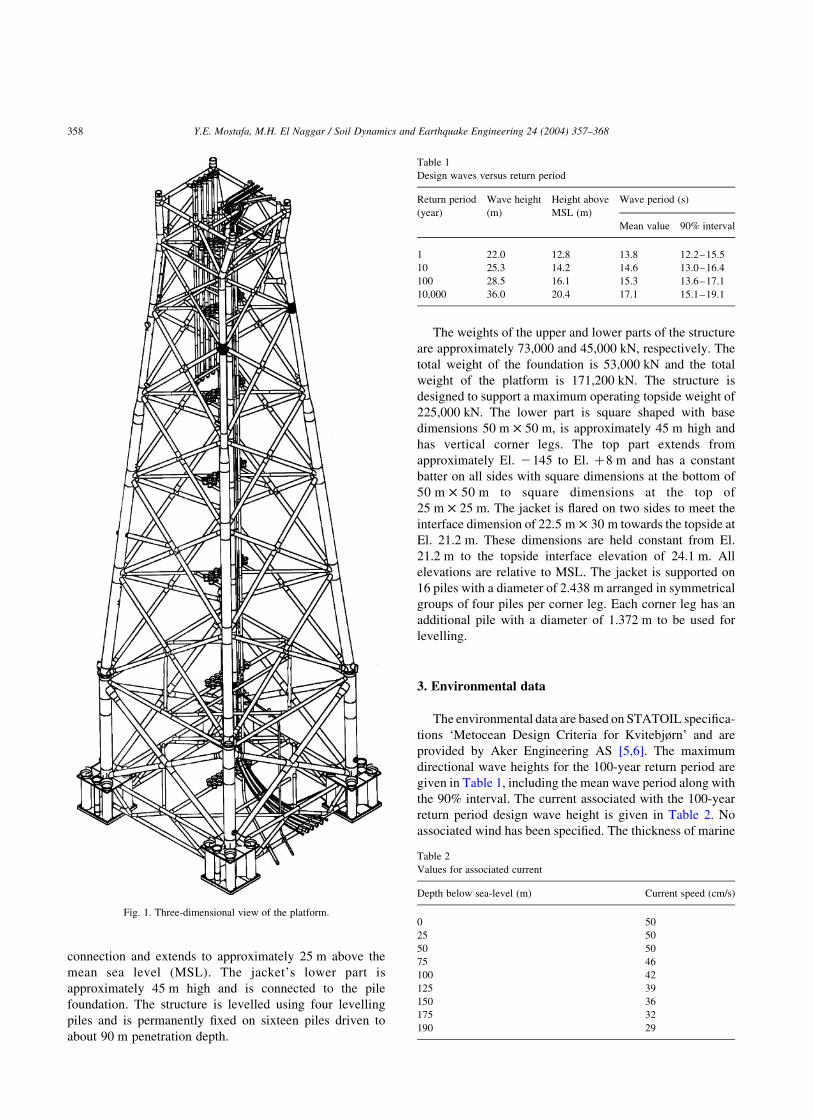
The platform considered in this study is the ‘Kvitebjørn’
platform shown in Fig. 1. It is currently under construction
in the Norwegian section of the North Sea. Water depth at
the site is 190 m and the substructure is a piled steel jacket.
The Kvitebjørn substructure has four legs supported by
vertical steel piles grouped symmetrically around each
corner leg. Due to weight limitations for the offshore lift, the
jacket is fabricated, towed to the site and lift-installed as two
separate structural units. The upper part of the structure is
connected to the lower part through a traditional grouted
0267-7261/$ - see front matter q 2004 Elsevier Ltd. All rights reserved.
doi:10.1016/j.soildyn.2003.11.008
Soil Dynamics and Earthquake Engineering 24 (2004) 357–368
www.elsevier.com/locate/soildyn
* Corresponding author. Tel.: þ1-519-661-4219; fax: þ1-519-661-.
E-mail addresses: [email protected] (M.H. El Naggar); ymostafa@uwo.
ca (Y.E. Mostafa).
connection and extends to approximately 25 m above the
mean sea level (MSL). The jacket’s lower part is
approximately 45 m high and is connected to the pile
foundation. The structure is levelled using four levelling
piles and is permanently fixed on sixteen piles driven to
about 90 m penetration depth.
The weights of the upper and lower parts of the structure
are approximately 73,000 and 45,000 kN, respectively. The
total weight of the foundation is 53,000 kN and the total
weight of the platform is 171,200 kN. The structure is
designed to support a maximum operating topside weight of
225,000 kN. The lower part is square shaped with base
dimensions 50 m £ 50 m, is approximately 45 m high and
has vertical corner legs. The top part extends from
approximately El. 2145 to El. þ8 m and has a constant
batter on all sides with square dimensions at the bottom of
50 m £ 50 m to square dimensions at the top of
25 m £ 25 m. The jacket is flared on two sides to meet the
interface dimension of 22.5 m £ 30 m towards the topside at
El. 21.2 m. These dimensions are held constant from El.
21.2 m to the topside interface elevation of 24.1 m. All
elevations are relative to MSL. The jacket is supported on
16 piles with a diameter of 2.438 m arranged in symmetrical
groups of four piles per corner leg. Each corner leg has an
additional pile with a diameter of 1.372 m to be used for
levelling.
3. Environmental data
The environmental data are based on STATOIL specifica-
tions ‘Metocean Design Criteria for Kvitebjørn’ and are
provided by Aker Engineering AS [5,6]. The maximum
directional wave heights for the 100-year return period are
given in Table 1, including the mean wave period along with
the 90% interval. The current associated with the 100-year
return period design wave height is given in Table 2. No
associated wind has been specified. The thickness of marine
Fig. 1. Three-dimensional view of the platform.
Table 1
Design waves versus return period
Return period
(year)
Wave height
(m)
Height above
MSL (m)
Wave period (s)
Mean value 90% interval
1 22.0 12.8 13.8 12.2–15.5
10 25.3 14.2 14.6 13.0–16.4
100 28.5 16.1 15.3 13.6–17.1
10,000 36.0 20.4 17.1 15.1–19.1
Table 2
Values for associated current
Depth below sea-level (m) Current speed (cm/s)
0 50
25 50
50 50
75 46
100 42
125 39
150 36
175 32
190 29
Y.E. Mostafa, M.H. El Naggar / Soil Dynamics and Earthquake Engineering 24 (2004) 357–368358

growth is considered to be 20 mm below El. þ2 m. The
roughness due to marine growth is taken into consideration
when determining the coefficients in Morison’s equation for
wave forces. The average dry density of the marine growth
material is considered to be 1300 kg/m3. Morison’s equation
[7] is used together with the API wave force guidelines [8] to
generate the hydrodynamic forces. Drag and inertia coeffi-
cients are assumed to be 0.7 and 2.0, respectively, and the
wave kinematics are calculated using the Stokes fifth-order
wave theory.
Table 3
General soil layering
Soil unit Depth (m) Soil description
A 0–7.5 Very soft to soft silty, sandy clay
B 7.5–32 Sandy, clayey silt
C 32–47 Very stiff to hard silty clay
D 47–52 Very dense fine sand
E 52–125.5 Very stiff to hard clay
F .125.5 Very hard clay
Fig. 2. (a) Plan showing the pile arrangement in platform leg A-1. (b) Cross-section of the main piles and levelling piles.
Y.E. Mostafa, M.H. El Naggar / Soil Dynamics and Earthquake Engineering 24 (2004) 357–368 359
4. Geotechnical information
4.1. Soil profile
The soil profile at the tower site consists of a layer of very
soft to soft silty clay 7.5 m thick underlain by a layer of
sandy, clayey silt that extends to a depth of 32 m below the
seabed level. This layer is underlain by a number of layers
of very stiff to hard clay that extend to the end of the
borehole at a level of 85 m below the seabed level. The
foundation design is based on the soil data shown in Table 3
[6]. The results from the cone penetration tests (CPTs) show
that a thin sand layer exists at the surface of the seabed in
some of the borings. Therefore, local scour of 0.5 m is
adopted. No global scour is included in the design. The basis
for the assumption is the water depth at the Kvitebjørn
jacket location [5,6].
4.2. Foundation design
The jacket is supported on 16 main piles arranged in
symmetrical groups of four piles per corner leg. The pile
diameter ðdÞ is 2.438 m and its penetration depth is about
85 m. The pile spacing ðSÞ centre to centre is 8.4 m (i.e.
S=d ¼ 3:44). Four levelling piles also support the jacket, one
in each corner leg. The levelling piles have a diameter of
1.372 m and a penetration depth of about 49 m. The piles in
each group are fixed to a rigid cap. Fig. 2a shows a plan of
the piles arrangement and Fig. 2b shows longitudinal
sections for the main piles and the levelling piles illustrating
the variation of the piles’ thicknesses along their length.
5. Modelling soil reactions
The soil resistance to the pile movement is modelled
using p–y curves and t –z curves for lateral and axial
loading, respectively.
5.1. p–y curves for a single pile
The soil response to lateral loading is nonlinear. To
model this nonlinearity, pile deformation can be related to
soil resistance through nonlinear transfer curves (p–y
curves). Static p–y curves for a single pile can be
established using the API guidelines [8].
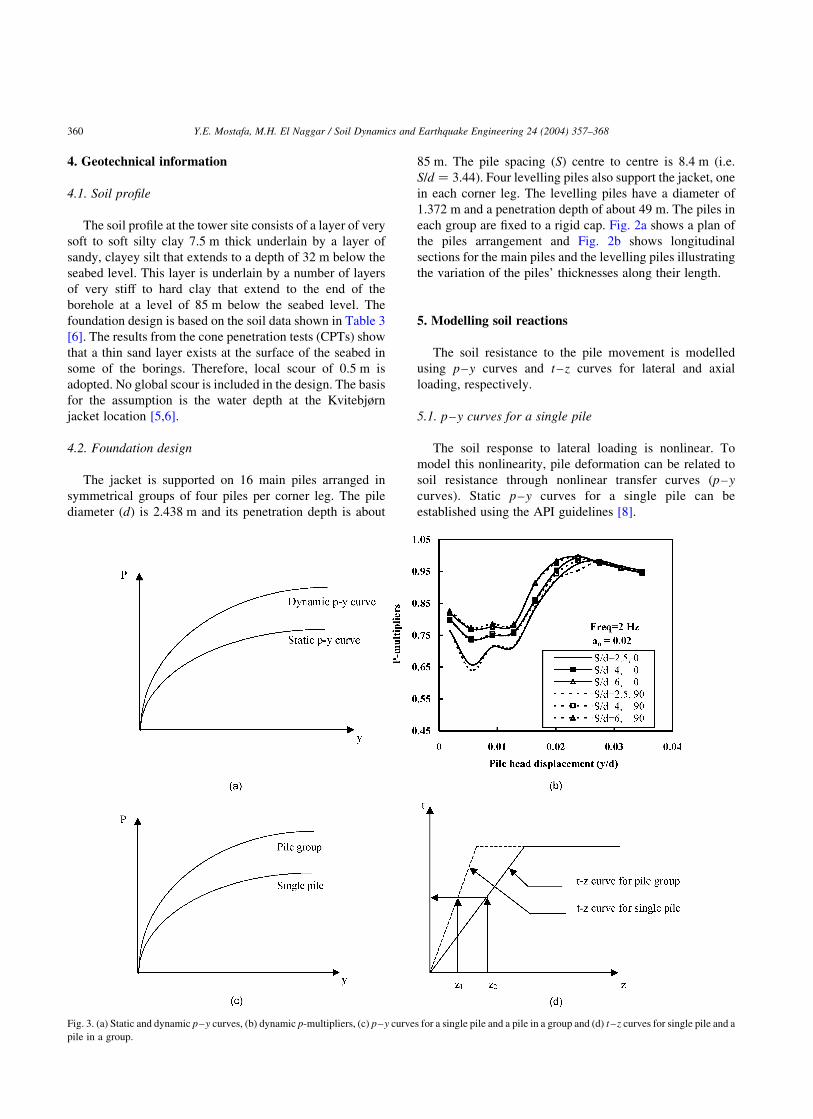
Fig. 3. (a) Static and dynamic p–y curves, (b) dynamic p-multipliers, (c) p–y curves for a single pile and a pile in a group and (d) t –z curves for single pile and a
pile in a group.
Y.E. Mostafa, M.H. El Naggar / Soil Dynamics and Earthquake Engineering 24 (2004) 357–368360
The dynamic p–y curves for a single isolated pile are
calculated using the equation proposed by El Naggar and
Bentley [9] as
Pd ¼Psa
yþ i
Ps ba20 þ ka0
vy
d
� �n� �
y
0BB@
1CCAy ð1Þ
where Pd is the dynamic soil reaction at depth x (N/m), Ps is
the static soil reaction obtained from the static p–y curve at
depth x (N/m), a0 is the dimensionless frequency ¼ vd=Vs;
v is the frequency of loading (rad/s), d is the pile diameter
(m), y is the lateral pile deflection at depth x (m), and a
(a ¼ 1 in this analysis), b; k; and n are constants that
depend on the soil type [9]. Fig. 3a shows typical static and
dynamic p–y curves. The dynamic soil resistance is
modelled using a series of springs and dashpots whose
nonlinear stiffness and nonlinear damping constants are
established using Eq. (1), and are given by
knl ¼Psa
yand cnl ¼
Ps ba20 þka0
vy
d
� �n� �
vyð2Þ
5.2. p–y curves for pile groups
Mostafa and El Naggar [4] present a method for
calculating dynamic p–y curves for a pile in a group. In
this method, the dynamic p–y curves for a single isolated
pile are modified using an appropriate p-multiplier ðPmÞ to
calculate the dynamic p–y curves for a pile in a group. The
p-multiplier depends mainly on the pile spacing to diameter
ratio ðS=dÞ and the pile head displacement to diameter ratio
ðy=dÞ: Using the p-multipliers, the soil model will include
only the dynamic p–y curves for individual piles, but it also
accounts for the group effect. The dynamic soil reaction at a
certain depth for a pile in a group, Pg; is given by
Pg ¼ PmPd ð3Þ
where Pm is the p-multiplier and Pd is the dynamic soil
reaction at the same depth for an isolated single pile. Fig. 3b
shows a chart for p-multipliers for piles installed in clay and
Fig. 3c shows dynamic p–y curves for a single pile and a
pile in a group.
The ratio S=d for the main piles of the Kvitebjørn Platform
is 3.44. The levelling pile (pile 5 in Fig. 2a) is closer to pile 3,
with a spacing S=d ¼ 2.35 m. The value of Pm ¼ 0:7 for piles
1, 2, and 4, and the value of Pm ¼ 0:55 for piles 3 and 5 are
established from charts presented in Ref. [4].
5.3. t –z curves and q–z curves for a single pile
The vertical soil resistance along the pile shaft and at the
pile toe is a function of the level and rate of loading. The soil
resistance to the vertical movement of the pile is modelled
using axial shear transfer functions that depend on local pile
deflection (t –z curves). The soil resistance at the pile toe is
modelled using q–z curves.
Various empirical and theoretical methods are available
for developing t –z curves. Coyle and Reese [10] present
empirical t –z curves that are based on the results of model
and full-scale pile load tests. Additional t –z curves for clays
and sands are provided by Vijayvergiya [11] and Reese and
O’Neill [12]. Theoretical curves described by Kraft et al.
[13] may also be used. In this paper, t –z curves are
constructed using the recommendations given by API [8].
Bea [14] stated that the dynamic axial soil resistance to
pile movement due to wave loading and earthquakes (rate
effect) is in the range of 1.2–1.8. Briaud and Garland [15]
propose a method to predict the behaviour of single piles in
cohesive soil subjected to vertical loads applied at various
rates. They state that the gain in pile capacity can be given
by the following equation:
Qu1
Qu2
¼t2t1
� �n
ð4Þ
in which Qu1 and Qu2 are the ultimate pile capacities
reached in times to failure t1 and t2, respectively, and n is
a viscous exponent that varies from 0.02 for stiff clay to 0.10
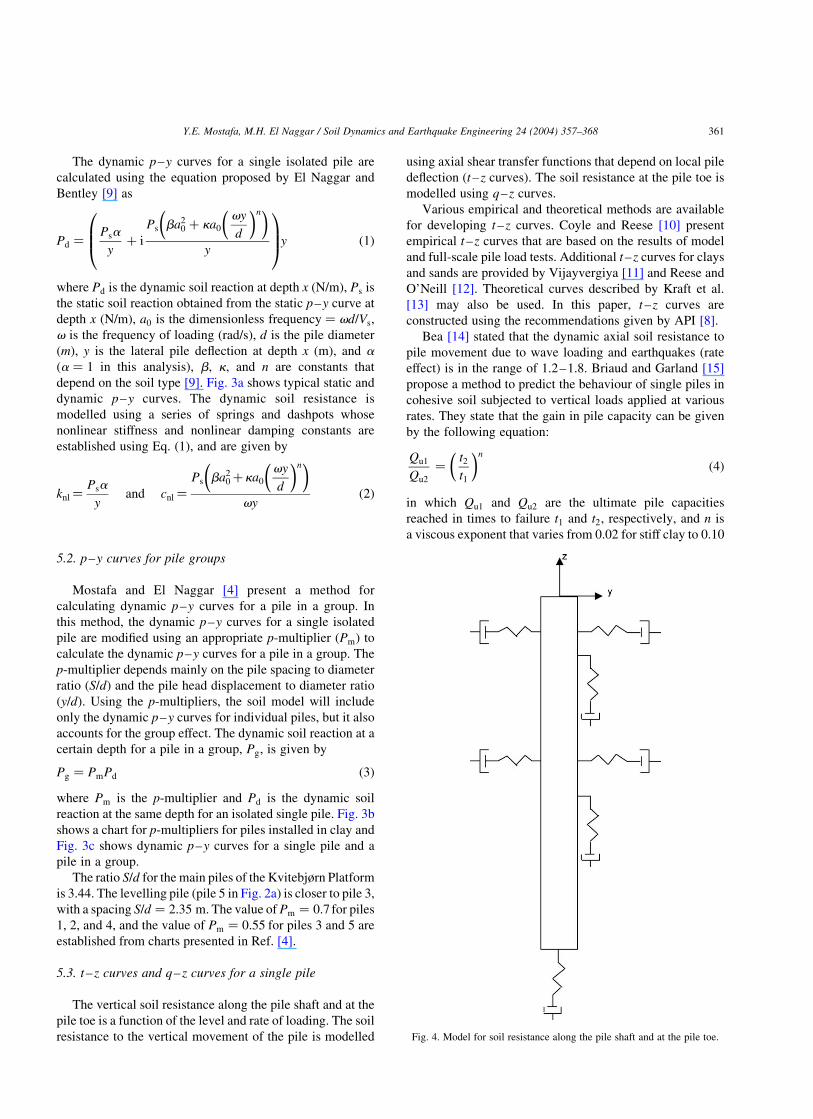
Fig. 4. Model for soil resistance along the pile shaft and at the pile toe.
Y.E. Mostafa, M.H. El Naggar / Soil Dynamics and Earthquake Engineering 24 (2004) 357–368 361
for soft clay. Briaud and Garland [15] state that for values of
n within the mentioned range, the pile capacity will be
1.21–2.60 times the static capacity. In this paper, the t
values in the dynamic t –z curves are taken to be 1.6 times
the t values in static t –z curves.
5.4. t –z curves and q–z curves for pile groups
Pile–soil–pile interaction causes an increase in the
settlement of the pile group, redistribution of pile stresses
and loads [16,17]. Poulos and Davis [17] present charts for
the interaction factors for piles under axial static loading.
Kaynia and Kausel [18] extend the static interaction factors
approach to dynamic loading. They present dynamic
interaction factors in the form of charts as a function of
the dimensionless frequency a0 ¼ vd=Vs: For S=d ¼ 3:44
and a0 < 0:01; the interaction factor is evaluated from Ref.
[18] and is found to be 0.5, meaning that the interaction
increases the vertical displacement of a pile in the group to
twice that of a single isolated pile subjected to the same
average load per pile in the group. Therefore, the t –z curves
along the pile shaft are adjusted using a z-multiplier, zm; to
account for the interaction effect. The displacement zg for
a pile in a group is then calculated as follows:
zg ¼ zmz ð5Þ
Fig. 3d shows a sketch for the t –z curve for single piles and
a pile group.
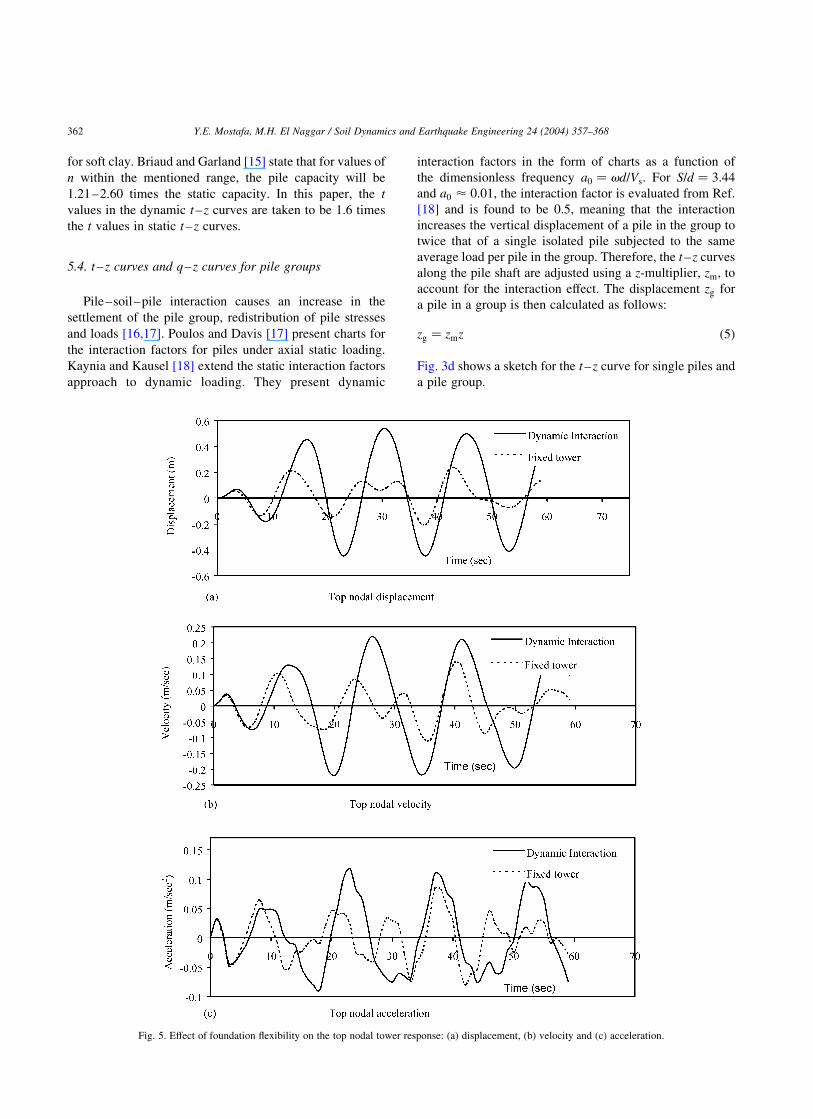
Fig. 5. Effect of foundation flexibility on the top nodal tower response: (a) displacement, (b) velocity and (c) acceleration.
Y.E. Mostafa, M.H. El Naggar / Soil Dynamics and Earthquake Engineering 24 (2004) 357–368362
6. Finite element analysis
The structural members of the Kvitebjørn Platform and
the foundation piles are modelled using space frame elements
in the commercial software ASAS-NL. The space frame
element has two nodes, one at each end and each with six
degrees of freedom, three translations and three rotations.
This paper considers the response of the platform to
transient loading due to waves and currents. The loads
considered are due to the extreme wave case with a wave
height of 28.5 m and a wave period of 15.3 s and the
associated current. The direction of the waves is assumed to
be 1808 (i.e. the direction of the Z-axis of the platform).
The soil resistance along the pile shaft is modelled using
sets of lateral and vertical springs whose constants are
evaluated using p–y curves and t –z curves as described
above. The soil is discretized into 34 layers, each layer
2.5 m thick (about one pile diameter). A pair of lateral
springs (one on each side of the pile) and a vertical spring
represent the horizontal and vertical soil resistance in each
layer as shown in Fig. 4. A q–z curve is used to model the
pile tip resistance.
7. Dynamic characteristics of the tower
The deck mass is assumed to be 23,000,000 kg and the
structural damping ratio is assumed to be 2% for all the
results presented in this section. The hydrodynamic damping
derived from the motion of the tower in the water is taken into
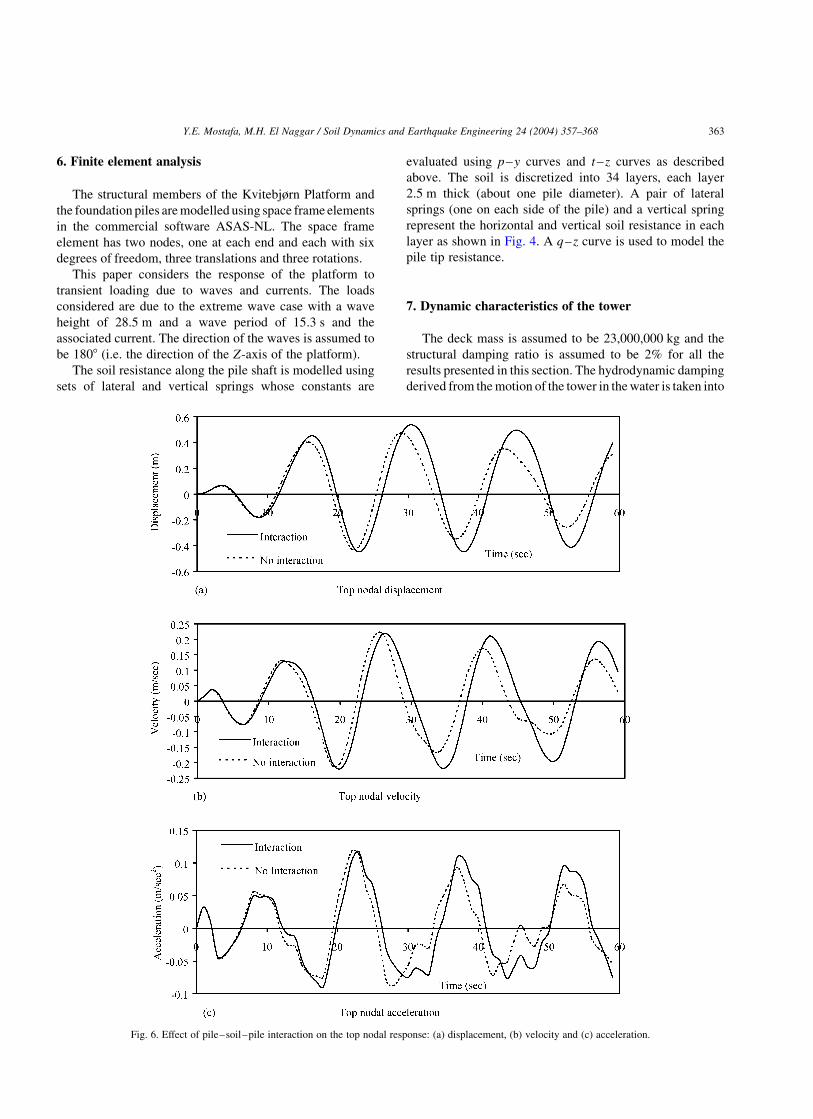
Fig. 6. Effect of pile–soil–pile interaction on the top nodal response: (a) displacement, (b) velocity and (c) acceleration.
Y.E. Mostafa, M.H. El Naggar / Soil Dynamics and Earthquake Engineering 24 (2004) 357–368 363
consideration when applying the Morison equation. Free
vibration analysis is performed to evaluate the natural
periods and the mode shapes of the tower.
The first two modes are the most important modes. The
first mode is the lateral translation along the X-direction and
the second mode is lateral translation along the Z-direction.
The first four natural periods are 3.8, 3.7, 2 and 1.23 s.
The free vibration analysis shows that the foundation
flexibility increases the first natural period of the platform
slightly (4.12 s), shifting it closer to the period of wave
loading.
8. Platform response to wave and current loading
As in Section 7, the maximum operating topside mass of
23,000,000 kg is considered for all the results presented.
Dynamic soil resistance and pile–soil–pile interaction are
considered unless otherwise stated.
8.1. Effect of foundation flexibility
The flexibility of the foundation affects the response of
the tower to wave loading. To investigate the effect of
foundation flexibility on the response of the tower, two
cases were considered: a fixed base and a flexible
foundation with soil resistance modelled using dynamic
p–y curves, t –z curves, and q–z curves. The results are
shown in Fig. 5. Fig. 5a shows that the top nodal
displacement for the case of a fixed tower is about one
half that of the top nodal displacement for the case of
a flexible foundation. Fig. 5b and c shows that the
foundation flexibility increases the top nodal velocity and
acceleration.
8.2. Effect of pile–soil–pile interaction
Pile – soil– pile interaction significantly affects the
response of pile groups and the overall response of the
platform. The dynamic soil resistance is modelled using
dynamic p–y curves, t –z curves and q–z curves for single
piles when ignoring group effect. To account for pile–soil–
pile interaction, p-multipliers are used to adjust the dynamic
p–y curves for a single isolated pile as mentioned above. A
value of 0.7 is used for piles 1, 2, and 4 and a value of 0.55 is
used for piles 3 and 5. An average z-multiplier of two is used
to adjust the t –z curves to account for the pile–soil–pile
interaction in the vertical direction.
Fig. 6 shows the time histories of the top nodal displace-
ment, velocity and acceleration. It shows that the pile–soil–
pile interaction increases the top nodal displacement, velocity,
and acceleration by about 15% in comparison with the case of
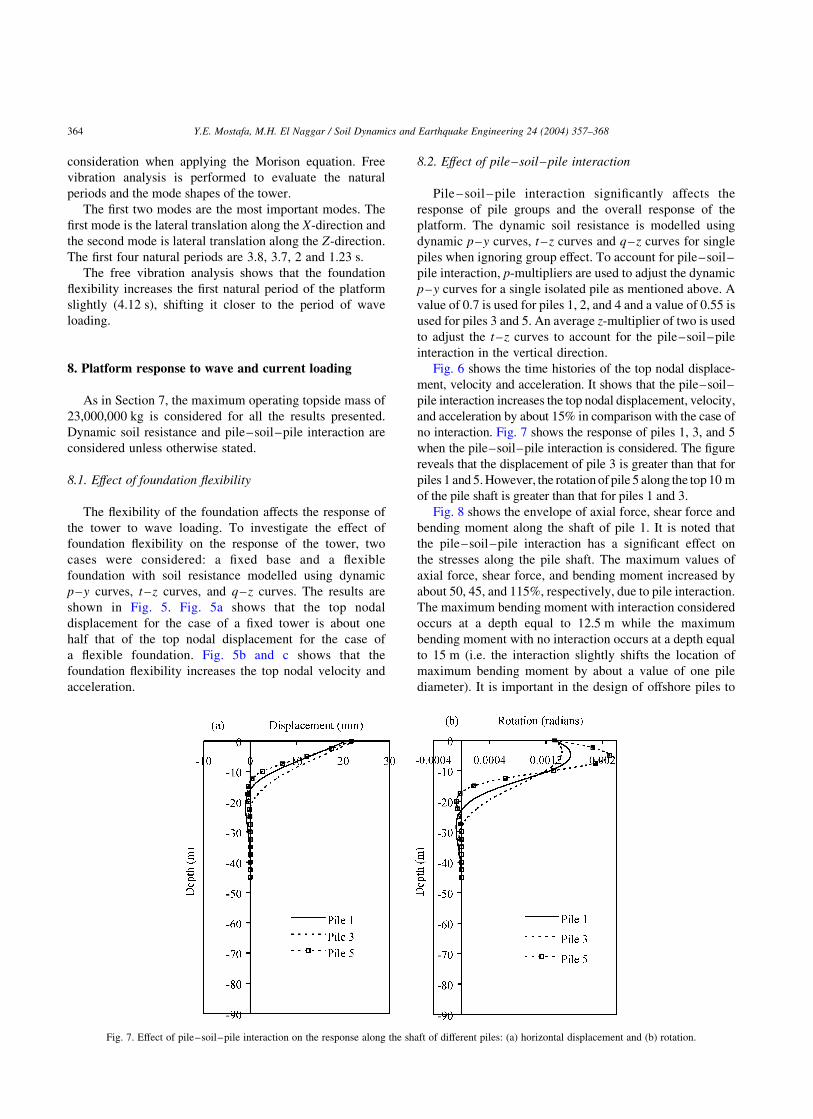
no interaction. Fig. 7 shows the response of piles 1, 3, and 5
when the pile–soil–pile interaction is considered. The figure
reveals that the displacement of pile 3 is greater than that for
piles 1 and 5. However, the rotation of pile 5 along the top 10 m
of the pile shaft is greater than that for piles 1 and 3.
Fig. 8 shows the envelope of axial force, shear force and
bending moment along the shaft of pile 1. It is noted that
the pile–soil–pile interaction has a significant effect on
the stresses along the pile shaft. The maximum values of
axial force, shear force, and bending moment increased by
about 50, 45, and 115%, respectively, due to pile interaction.
The maximum bending moment with interaction considered
occurs at a depth equal to 12.5 m while the maximum
bending moment with no interaction occurs at a depth equal
to 15 m (i.e. the interaction slightly shifts the location of
maximum bending moment by about a value of one pile
diameter). It is important in the design of offshore piles to
Fig. 7. Effect of pile–soil–pile interaction on the response along the shaft of different piles: (a) horizontal displacement and (b) rotation.
Y.E. Mostafa, M.H. El Naggar / Soil Dynamics and Earthquake Engineering 24 (2004) 357–368364
determine the location of maximum bending moment
because the pile diameter or the pile wall thickness can be
reduced below locations of maximum stresses.
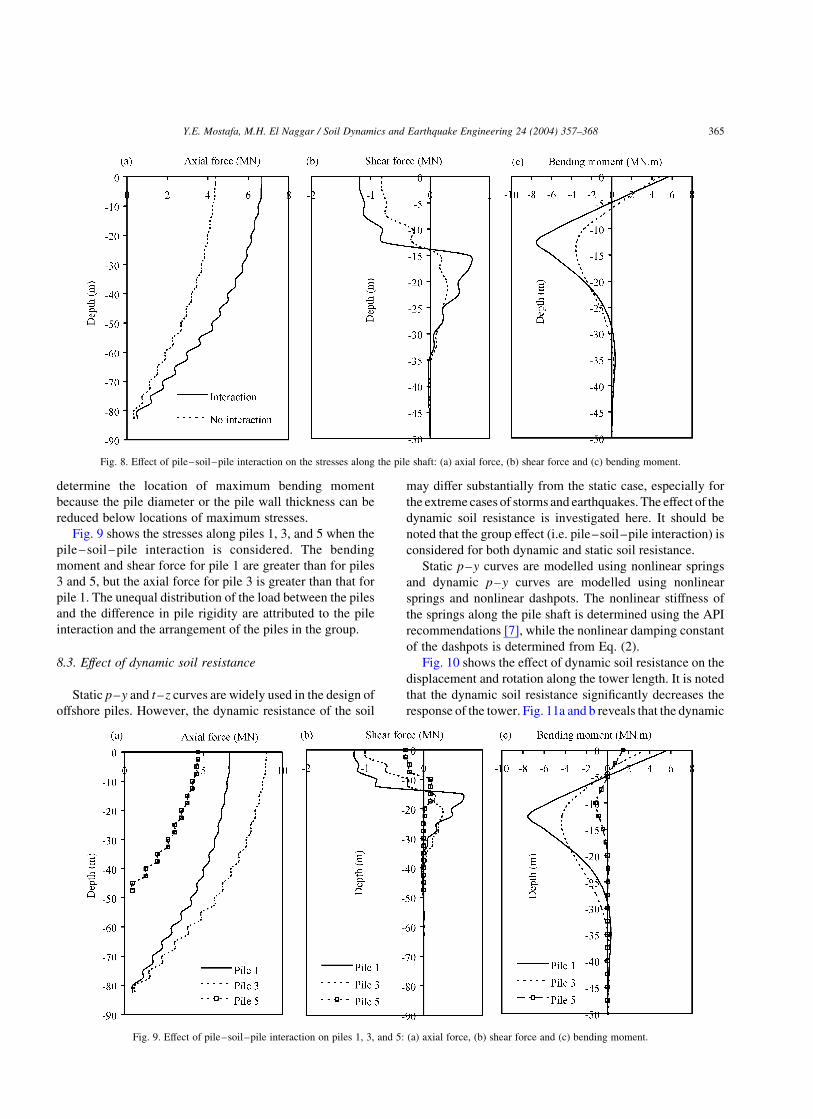
Fig. 9 shows the stresses along piles 1, 3, and 5 when the
pile–soil–pile interaction is considered. The bending
moment and shear force for pile 1 are greater than for piles
3 and 5, but the axial force for pile 3 is greater than that for
pile 1. The unequal distribution of the load between the piles
and the difference in pile rigidity are attributed to the pile
interaction and the arrangement of the piles in the group.
8.3. Effect of dynamic soil resistance
Static p–y and t –z curves are widely used in the design of
offshore piles. However, the dynamic resistance of the soil
may differ substantially from the static case, especially for
the extreme cases of storms and earthquakes. The effect of the
dynamic soil resistance is investigated here. It should be
noted that the group effect (i.e. pile–soil–pile interaction) is
considered for both dynamic and static soil resistance.
Static p–y curves are modelled using nonlinear springs
and dynamic p–y curves are modelled using nonlinear
springs and nonlinear dashpots. The nonlinear stiffness of
the springs along the pile shaft is determined using the API
recommendations [7], while the nonlinear damping constant
of the dashpots is determined from Eq. (2).
Fig. 10 shows the effect of dynamic soil resistance on the
displacement and rotation along the tower length. It is noted
that the dynamic soil resistance significantly decreases the
response of the tower. Fig. 11a and b reveals that the dynamic
Fig. 8. Effect of pile–soil–pile interaction on the stresses along the pile shaft: (a) axial force, (b) shear force and (c) bending moment.
Fig. 9. Effect of pile–soil–pile interaction on piles 1, 3, and 5: (a) axial force, (b) shear force and (c) bending moment.
Y.E. Mostafa, M.H. El Naggar / Soil Dynamics and Earthquake Engineering 24 (2004) 357–368 365
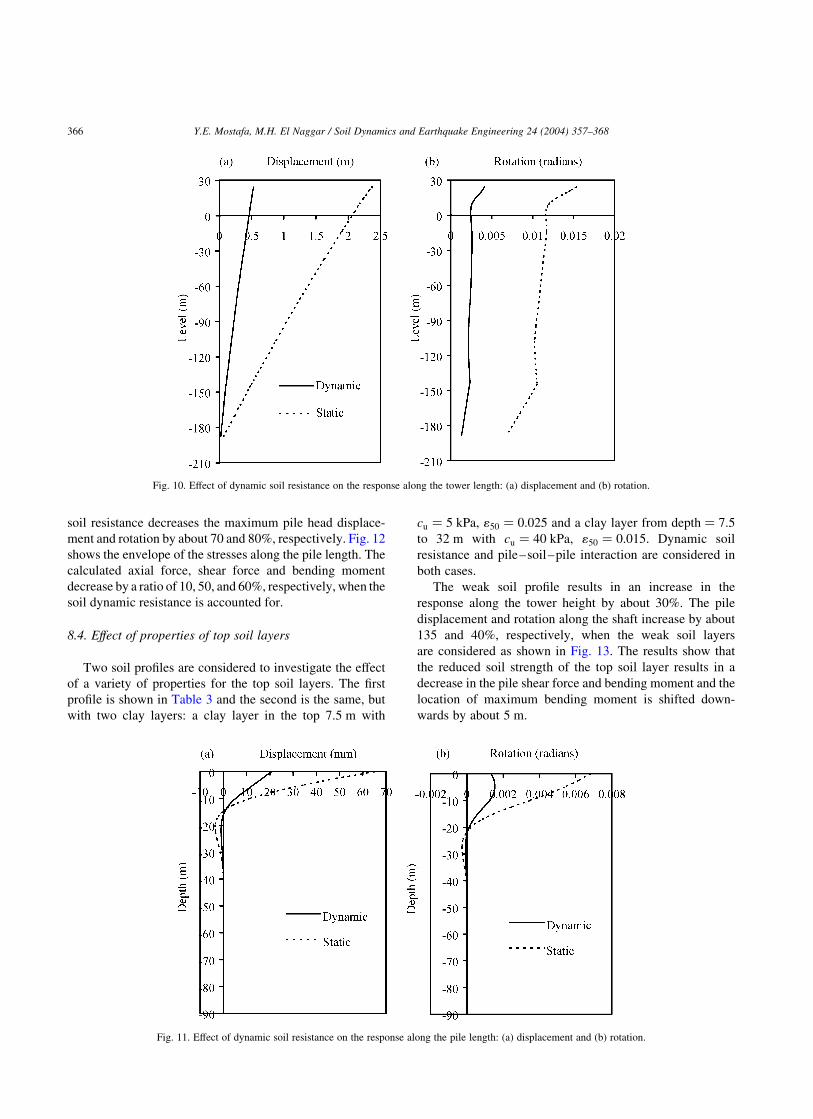
soil resistance decreases the maximum pile head displace-
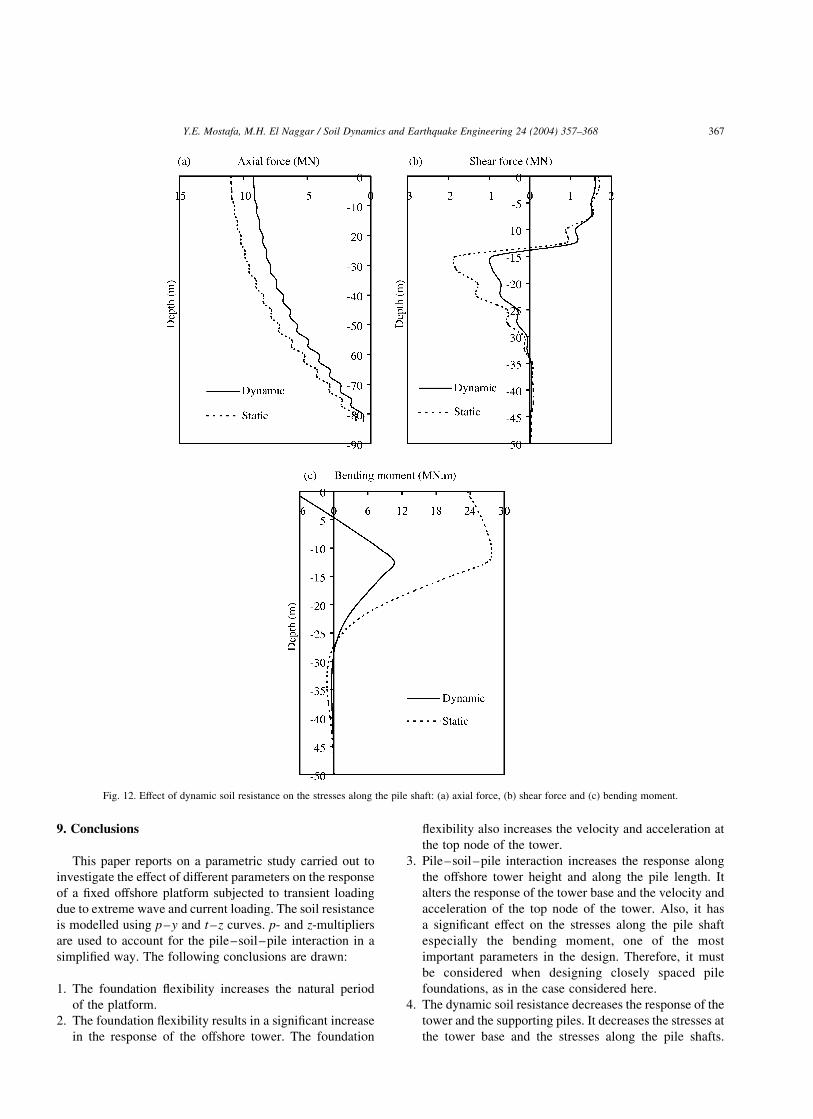
ment and rotation by about 70 and 80%, respectively. Fig. 12
shows the envelope of the stresses along the pile length. The
calculated axial force, shear force and bending moment
decrease by a ratio of 10, 50, and 60%, respectively, when the
soil dynamic resistance is accounted for.
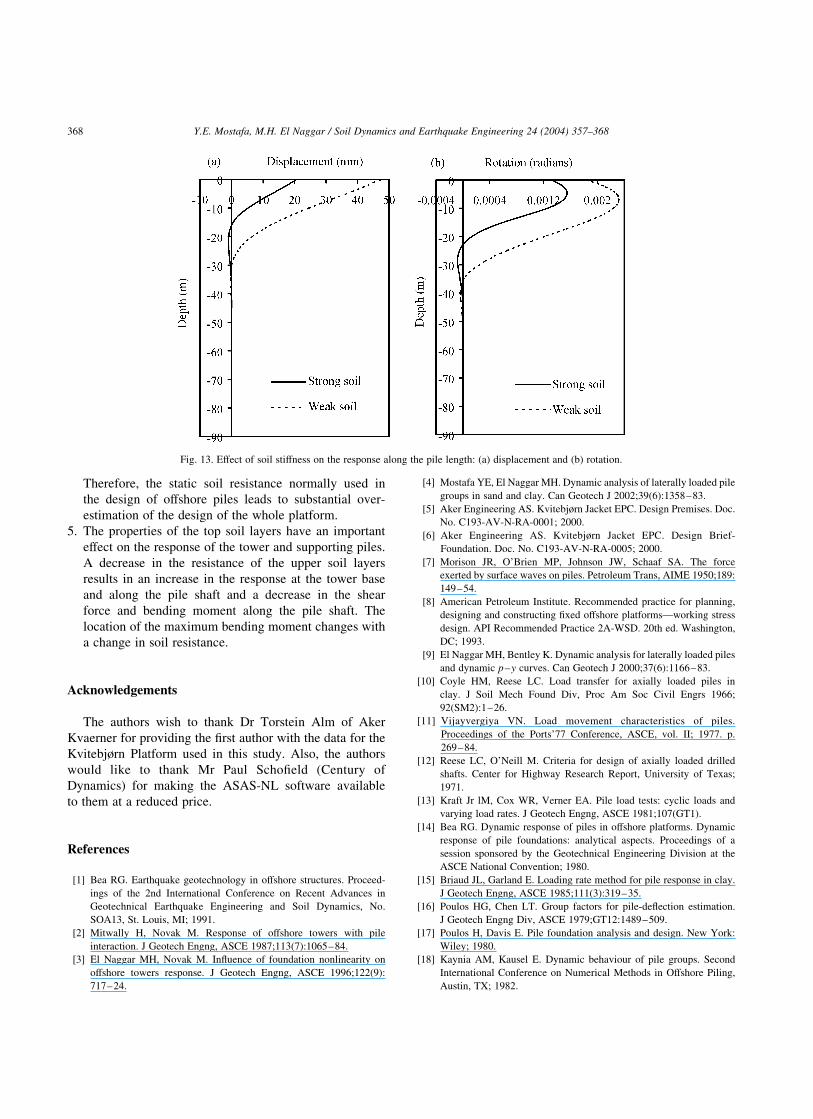
8.4. Effect of properties of top soil layers
Two soil profiles are considered to investigate the effect
of a variety of properties for the top soil layers. The first
profile is shown in Table 3 and the second is the same, but
with two clay layers: a clay layer in the top 7.5 m with
cu ¼ 5 kPa, 150 ¼ 0:025 and a clay layer from depth ¼ 7.5
to 32 m with cu ¼ 40 kPa, 150 ¼ 0:015: Dynamic soil
resistance and pile–soil–pile interaction are considered in
both cases.
The weak soil profile results in an increase in the
response along the tower height by about 30%. The pile
displacement and rotation along the shaft increase by about
135 and 40%, respectively, when the weak soil layers
are considered as shown in Fig. 13. The results show that
the reduced soil strength of the top soil layer results in a
decrease in the pile shear force and bending moment and the
location of maximum bending moment is shifted down-
wards by about 5 m.
Fig. 10. Effect of dynamic soil resistance on the response along the tower length: (a) displacement and (b) rotation.
Fig. 11. Effect of dynamic soil resistance on the response along the pile length: (a) displacement and (b) rotation.
Y.E. Mostafa, M.H. El Naggar / Soil Dynamics and Earthquake Engineering 24 (2004) 357–368366
9. Conclusions
This paper reports on a parametric study carried out to
investigate the effect of different parameters on the response
of a fixed offshore platform subjected to transient loading
due to extreme wave and current loading. The soil resistance
is modelled using p–y and t –z curves. p- and z-multipliers
are used to account for the pile–soil–pile interaction in a
simplified way. The following conclusions are drawn:
1. The foundation flexibility increases the natural period
of the platform.
2. The foundation flexibility results in a significant increase
in the response of the offshore tower. The foundation
flexibility also increases the velocity and acceleration at
the top node of the tower.
3. Pile–soil–pile interaction increases the response along
the offshore tower height and along the pile length. It
alters the response of the tower base and the velocity and
acceleration of the top node of the tower. Also, it has
a significant effect on the stresses along the pile shaft
especially the bending moment, one of the most
important parameters in the design. Therefore, it must
be considered when designing closely spaced pile
foundations, as in the case considered here.
4. The dynamic soil resistance decreases the response of the
tower and the supporting piles. It decreases the stresses at
the tower base and the stresses along the pile shafts.
Fig. 12. Effect of dynamic soil resistance on the stresses along the pile shaft: (a) axial force, (b) shear force and (c) bending moment.
Y.E. Mostafa, M.H. El Naggar / Soil Dynamics and Earthquake Engineering 24 (2004) 357–368 367
Therefore, the static soil resistance normally used in
the design of offshore piles leads to substantial over-
estimation of the design of the whole platform.
5. The properties of the top soil layers have an important
effect on the response of the tower and supporting piles.
A decrease in the resistance of the upper soil layers
results in an increase in the response at the tower base
and along the pile shaft and a decrease in the shear
force and bending moment along the pile shaft. The
location of the maximum bending moment changes with
a change in soil resistance.
Acknowledgements
The authors wish to thank Dr Torstein Alm of Aker
Kvaerner for providing the first author with the data for the
Kvitebjørn Platform used in this study. Also, the authors
would like to thank Mr Paul Schofield (Century of
Dynamics) for making the ASAS-NL software available
to them at a reduced price.
References
[1] Bea RG. Earthquake geotechnology in offshore structures. Proceed-
ings of the 2nd International Conference on Recent Advances in
Geotechnical Earthquake Engineering and Soil Dynamics, No.
SOA13, St. Louis, MI; 1991.
[2] Mitwally H, Novak M. Response of offshore towers with pile
interaction. J Geotech Engng, ASCE 1987;113(7):1065–84.
[3] El Naggar MH, Novak M. Influence of foundation nonlinearity on
offshore towers response. J Geotech Engng, ASCE 1996;122(9):
717–24.
[4] Mostafa YE, El Naggar MH. Dynamic analysis of laterally loaded pile
groups in sand and clay. Can Geotech J 2002;39(6):1358–83.
[5] Aker Engineering AS. Kvitebjørn Jacket EPC. Design Premises. Doc.
No. C193-AV-N-RA-0001; 2000.
[6] Aker Engineering AS. Kvitebjørn Jacket EPC. Design Brief-
Foundation. Doc. No. C193-AV-N-RA-0005; 2000.
[7] Morison JR, O’Brien MP, Johnson JW, Schaaf SA. The force
exerted by surface waves on piles. Petroleum Trans, AIME 1950;189:
149–54.
[8] American Petroleum Institute. Recommended practice for planning,
designing and constructing fixed offshore platforms—working stress
design. API Recommended Practice 2A-WSD. 20th ed. Washington,
DC; 1993.
[9] El Naggar MH, Bentley K. Dynamic analysis for laterally loaded piles
and dynamic p–y curves. Can Geotech J 2000;37(6):1166–83.
[10] Coyle HM, Reese LC. Load transfer for axially loaded piles in
clay. J Soil Mech Found Div, Proc Am Soc Civil Engrs 1966;
92(SM2):1–26.
[11] Vijayvergiya VN. Load movement characteristics of piles.
Proceedings of the Ports’77 Conference, ASCE, vol. II; 1977. p.
269–84.
[12] Reese LC, O’Neill M. Criteria for design of axially loaded drilled
shafts. Center for Highway Research Report, University of Texas;
1971.
[13] Kraft Jr lM, Cox WR, Verner EA. Pile load tests: cyclic loads and
varying load rates. J Geotech Engng, ASCE 1981;107(GT1).
[14] Bea RG. Dynamic response of piles in offshore platforms. Dynamic
response of pile foundations: analytical aspects. Proceedings of a
session sponsored by the Geotechnical Engineering Division at the
ASCE National Convention; 1980.
[15] Briaud JL, Garland E. Loading rate method for pile response in clay.
J Geotech Engng, ASCE 1985;111(3):319–35.
[16] Poulos HG, Chen LT. Group factors for pile-deflection estimation.
J Geotech Engng Div, ASCE 1979;GT12:1489–509.
[17] Poulos H, Davis E. Pile foundation analysis and design. New York:
Wiley; 1980.
[18] Kaynia AM, Kausel E. Dynamic behaviour of pile groups. Second
International Conference on Numerical Methods in Offshore Piling,
Austin, TX; 1982.
Fig. 13. Effect of soil stiffness on the response along the pile length: (a) displacement and (b) rotation.
Y.E. Mostafa, M.H. El Naggar / Soil Dynamics and Earthquake Engineering 24 (2004) 357–368368
Related Documents