Deep-Sea Research II 52 (2005) 3024–3040 Response of East Mediterranean surface water to Saharan dust: On-board microcosm experiment and field observations Barak Herut a, , Tamar Zohary b , M.D. Krom c , R. Fauzi C. Mantoura d , Paraskevi Pitta e , Stella Psarra e , Ferreidoun Rassoulzadegan f , Tsuneo Tanaka f , T. Frede Thingstad g a Israel Oceanographic and Limnological Research (IOLR), National Institute of Oceanography, Tel Shikmona, Haifa, Israel b IOLR, Kinneret Limnological Laboratory, Tiberias, Israel c School of Earth Sciences and Earth and Biosphere Institute, Leeds University, Leeds, UK d Marine Ecology Laboratory, International Atomic Energy Authority, Monaco e Institute of Marine Biology of Crete, Heraklion, Crete, Greece f Station Zoologique, Villefranche-sur-mer, France g Department of Microbiology, University of Bergen, Bergen, Norway Accepted 20 August 2005 Abstract An on-board microcosm experiment was performed during the CYCLOPS May 2002 cruise to track the biogeochemical response of Eastern Mediterranean surface seawater to a gradient addition of fresh and pre-leached Saharan dust, mimicking the potential fertilization effect as opposed to the impact of adding particles alone. Response parameters examined were P- turnover time, bacterial production and abundance, chlorophyll a, other phytopigments, abundance of different pico and nanophytoplankton groups, primary production rates, abundance of heterotrophic nanoflagellates and ciliates. The addition of fresh Saharan dust (range: 0.2–4:9 mg l 1 ) and the subsequent nutrient release triggered an increase in phytopigments and primary production, while no response was detected for pre-leached dust particles. Most responses were linearly related to the amount of fresh dust added. Synechococcus and prymnesiophytes increased in abundance along with cellular pigment content while Prochlorococcus disappeared, heterotrophic bacteria increased production rates, and ciliates showed a small increase in cell density. A less clear response was recorded by in situ measurements following a Saharan dust storm during a cruise in the Levantine Basin in May 2001. The calculated amount of nutrients and dust particles delivered by such an event to a 15-m thick mixed surface layer is low ð0:3 nmol P l 1 , 9 nmol N l 1 and 0:06 mg dust l 1 Þ, falling close to the lowest dust addition in our microcosm experiment. Even so, an enhancement of phosphate turnover time, a sharp decline of Prochlorococcus abundance, and slight increases in chlorophyll a and bacterial activity were observed in response to the dust storm. Considering the linear effect of fresh dust concentrations on the bacterial activity, primary production and pigment concentration (total and per cell), and the likely stimulation of grazing, it is not surprising that changes due to moderate strength dust storms are mostly close to detection limit of either field or remote sensing measurements. r 2005 Elsevier Ltd. All rights reserved. Keywords: Dust; Sahara; Synechococcus; Prochlorococcus; Nutrients; Mediterranean ARTICLE IN PRESS www.elsevier.com/locate/dsr2 0967-0645/$ - see front matter r 2005 Elsevier Ltd. All rights reserved. doi:10.1016/j.dsr2.2005.09.003 Corresponding author. Tel.: +972 4 8565255; fax: +972 4 8511911. E-mail address: [email protected] (B. Herut).

Welcome message from author
This document is posted to help you gain knowledge. Please leave a comment to let me know what you think about it! Share it to your friends and learn new things together.
Transcript
ARTICLE IN PRESS
0967-0645/$ - se
doi:10.1016/j.ds
�CorrespondiE-mail addre
Deep-Sea Research II 52 (2005) 3024–3040
www.elsevier.com/locate/dsr2
Response of East Mediterranean surface water to Saharan dust:On-board microcosm experiment and field observations
Barak Heruta,�, Tamar Zoharyb, M.D. Kromc, R. Fauzi C. Mantourad,Paraskevi Pittae, Stella Psarrae, Ferreidoun Rassoulzadeganf, Tsuneo Tanakaf,
T. Frede Thingstadg
aIsrael Oceanographic and Limnological Research (IOLR), National Institute of Oceanography, Tel Shikmona, Haifa, IsraelbIOLR, Kinneret Limnological Laboratory, Tiberias, Israel
cSchool of Earth Sciences and Earth and Biosphere Institute, Leeds University, Leeds, UKdMarine Ecology Laboratory, International Atomic Energy Authority, Monaco
eInstitute of Marine Biology of Crete, Heraklion, Crete, GreecefStation Zoologique, Villefranche-sur-mer, France
gDepartment of Microbiology, University of Bergen, Bergen, Norway
Accepted 20 August 2005
Abstract
An on-board microcosm experiment was performed during the CYCLOPS May 2002 cruise to track the biogeochemical
response of Eastern Mediterranean surface seawater to a gradient addition of fresh and pre-leached Saharan dust, mimicking
the potential fertilization effect as opposed to the impact of adding particles alone. Response parameters examined were P-
turnover time, bacterial production and abundance, chlorophyll a, other phytopigments, abundance of different pico and
nanophytoplankton groups, primary production rates, abundance of heterotrophic nanoflagellates and ciliates. The addition
of fresh Saharan dust (range: 0.2–4:9mg l�1) and the subsequent nutrient release triggered an increase in phytopigments and
primary production, while no response was detected for pre-leached dust particles. Most responses were linearly related to the
amount of fresh dust added. Synechococcus and prymnesiophytes increased in abundance along with cellular pigment content
while Prochlorococcus disappeared, heterotrophic bacteria increased production rates, and ciliates showed a small increase in
cell density. A less clear response was recorded by in situ measurements following a Saharan dust storm during a cruise in the
Levantine Basin in May 2001. The calculated amount of nutrients and dust particles delivered by such an event to a 15-m
thick mixed surface layer is low ð�0:3 nmol P l�1, �9nmolN l�1 and 0:06mgdust l�1Þ, falling close to the lowest dust
addition in our microcosm experiment. Even so, an enhancement of phosphate turnover time, a sharp decline of
Prochlorococcus abundance, and slight increases in chlorophyll a and bacterial activity were observed in response to the dust
storm. Considering the linear effect of fresh dust concentrations on the bacterial activity, primary production and pigment
concentration (total and per cell), and the likely stimulation of grazing, it is not surprising that changes due to moderate
strength dust storms are mostly close to detection limit of either field or remote sensing measurements.
r 2005 Elsevier Ltd. All rights reserved.
Keywords: Dust; Sahara; Synechococcus; Prochlorococcus; Nutrients; Mediterranean
e front matter r 2005 Elsevier Ltd. All rights reserved.
r2.2005.09.003
ng author. Tel.: +972 4 8565255; fax: +972 4 8511911.
ss: [email protected] (B. Herut).
ARTICLE IN PRESSB. Herut et al. / Deep-Sea Research II 52 (2005) 3024–3040 3025
1. Introduction
The Eastern Mediterranean Basin is ultra-oligo-trophic, nutrient depleted even in deep water wherenitrate is �20% and phosphate �10% of the valuesmeasured at similar depths in N. Atlantic (Kressand Herut, 2001). Long-term (annual scale) mea-surements have been carried out to determine theimportance of dry and wet atmospheric input as asource of new nitrogen and phosphorus to this basin(Herut et al., 1999a, 2002; Kouvarakis et al., 2001;Markaki et al., 2003; Krom et al., 2004). Althoughrainfall is moderate over the basin, it receivesrelatively high dust fluxes particularly from theadjacent Sahara Desert (Guerzoni et al., 1999). Thisdust has a relatively high content of bioavailable P(Herut et al., 2002). It also interacts with pollutedair masses from Europe and scavenges NOx andNH3 resulting in an atmospheric input of highbioavailable N:P ratio (�100 : 1, Herut et al., 1999a,2002; Markaki et al., 2003). These and other studiesfrom the western basin (e.g., Bergametti et al., 1992;Guieu et al., 2002a,b; Migon and Sandroni, 1999;Migon et al., 2001; Ridame and Guieu, 2002)emphasize the unique importance of Sahara/deserttype aerosols as suppliers of soluble nutrients to thesystem.
The Eastern Mediterranean basin is also uniquein that it is depleted in phosphate relative tonitrogen. It has long been known that its deepwater has unusually high NO�3 : PO
3�4 ratios ð�27Þ,
significantly higher than the ‘normal’ oceanic Red-field ratio of 16:1 (Krom et al., 1991). The cause ofthis phenomenon is still unknown, and severalprocesses have been hypothesized as potentialcontributors: (1) nitrogen fixation (Bethoux et al.,1998, 2002; Pantoja et al., 2002); (2) selectiveadsorption of phosphate and its removal from thewater column by descending atmospheric particles(Krom et al., 1991); (3) input of atmosphericprecipitates with relatively high NO�3 : PO
3�4 ratios
ð�100Þ (Herut et al., 1999a,b, 2002; Markaki et al.,2003); (4) relative enrichment of NO�3 at areas ofdeep East Mediterranean water formation (Civitar-ese et al., 1998); (5) no significant denitrification ineither the coastal sediments or intermediate waterretaining a high NO�3 : PO
3�4 ratio, mainly from
atmospheric sources (Krom et al., 2004). Several ofthe above hypotheses emphasize the possibleimportant role of atmospheric inputs in this basin.
Atmospheric deposition of desert dust suppliessoluble or bioavailable macro and trace nutrients,
which may influence ocean biogeochemistry. Recentstudies attempt to assess the dust impact throughmicrocosm experiments. On-board experimentalstudies at the northeast Atlantic Ocean (in the coreof a cyclonic eddy) has suggested that the supply ofiron by Saharan dust (using Saharan soils as proxy)stimulates phytoplankton growth (Blain et al.,2004). Similar study in the Eastern tropical NorthAtlantic suggests that the supply of both iron andphosphorus together with Saharan dust promotesnitrogen fixation (Mills et al., 2004). A possible fieldimplication was a Trichodesmium bloom observedon the West Florida shelf following a Saharan dustevent (Lenes et al., 2001). Stimulation of photo-trophic nanoflagellates was observed in an experi-mental study in which rainwater affected bypolluted and Saharan sources was added to NWMediterranean coastal waters (Klein et al., 1997).
While previous studies suggested that atmo-spheric input of nutrients make a significantcontribution to export production (Krom et al.,2004), almost no studies have investigated the short-term response of live East Mediterranean surfaceseawater (SSW) to the addition of Saharan dust. Ithas been hypothesized that Saharan dust pulses cancause phytoplankton blooms in summer when thereis no nutrient supply by water column mixing(Ridame and Guieu, 2002) or in events of daytimedust deposition in wet conditions (Saydam andSenyuva, 2002). In a series of radiolabel on-boardmicrocosm experiments (using 32PO�34 ), in whichloess particles (as dust proxy) were added to livesurface seawater, it was found that P was initiallyreleased and then biological activity and inorganicparticles removed approximately similar amounts ofthe tracer (30–40%) (Herut et al., 1999b). It hasbeen hypothesized that in actual surface waters (insitu), it would be likely for biological uptake to out-compete inorganic uptake because both the muchlower concentrations of particles found undernatural conditions than those used in the experi-ment and the known ability of the microbialcommunity to extract available nutrients fromsurface waters.
Here we present new results from an on-boarddust gradient microcosm experiment performedduring a CYCLOPS cruise in May 2002. It aimedto track the biogeochemical responses of EastMediterranean SSW to a gradient addition of freshand pre-leached Saharan dust, mimicking thepotential fertilization effect of nutrients and possi-bly other constituents released from particles
ARTICLE IN PRESSB. Herut et al. / Deep-Sea Research II 52 (2005) 3024–30403026
compared with the impact of the particles alone.The response to dust additions is compared toresults of a microcosm nutrient addition experimentconducted subsequently on-board (Zohary et al.,2005). We also present the chemical and biologicalobservations made before, during and immediatelyafter a dust storm event in the S.E. Levantine basinin May 2001.
2. Methods
Work presented here was conducted aboard theR.V. Aegaeo during two different cruises to theCyprus Eddy, Eastern Mediterranean: the first inMay 2001, during which a dust storm took place;the second in May 2002, when the on-deckmicrocosm experiment was conducted.
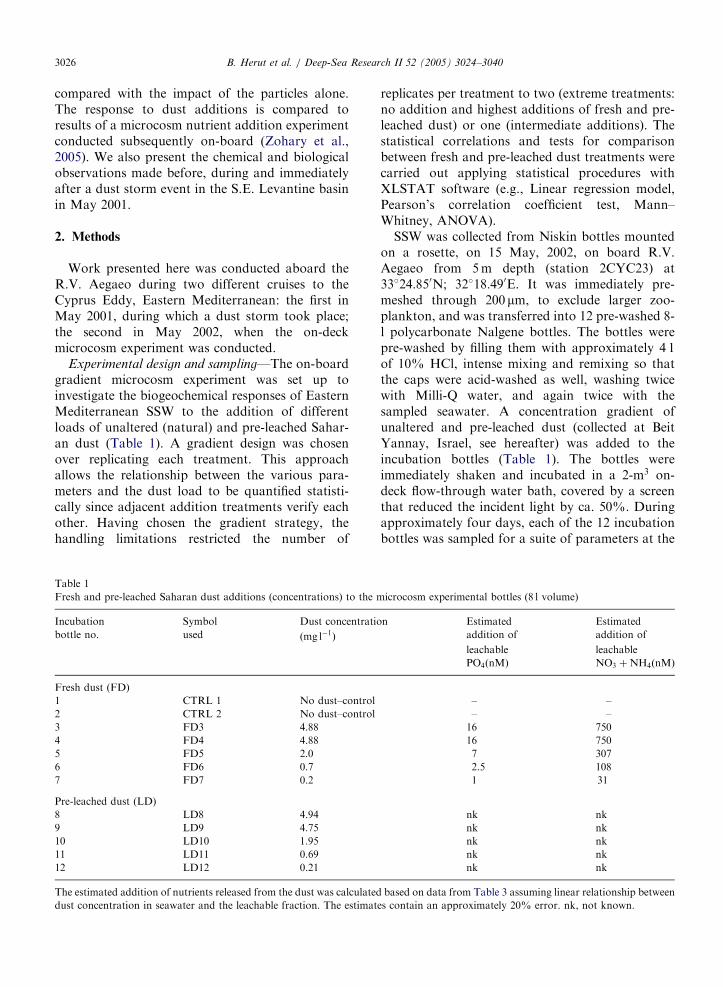
Experimental design and sampling—The on-boardgradient microcosm experiment was set up toinvestigate the biogeochemical responses of EasternMediterranean SSW to the addition of differentloads of unaltered (natural) and pre-leached Sahar-an dust (Table 1). A gradient design was chosenover replicating each treatment. This approachallows the relationship between the various para-meters and the dust load to be quantified statisti-cally since adjacent addition treatments verify eachother. Having chosen the gradient strategy, thehandling limitations restricted the number of
Table 1
Fresh and pre-leached Saharan dust additions (concentrations) to the m
Incubation Symbol Dust concentratio
bottle no. used ðmg l�1Þ
Fresh dust (FD)
1 CTRL 1 No dust–control
2 CTRL 2 No dust–control
3 FD3 4.88
4 FD4 4.88
5 FD5 2.0
6 FD6 0.7
7 FD7 0.2
Pre-leached dust (LD)
8 LD8 4.94
9 LD9 4.75
10 LD10 1.95
11 LD11 0.69
12 LD12 0.21
The estimated addition of nutrients released from the dust was calculated
dust concentration in seawater and the leachable fraction. The estimat
replicates per treatment to two (extreme treatments:no addition and highest additions of fresh and pre-leached dust) or one (intermediate additions). Thestatistical correlations and tests for comparisonbetween fresh and pre-leached dust treatments werecarried out applying statistical procedures withXLSTAT software (e.g., Linear regression model,Pearson’s correlation coefficient test, Mann–Whitney, ANOVA).
SSW was collected from Niskin bottles mountedon a rosette, on 15 May, 2002, on board R.V.Aegaeo from 5m depth (station 2CYC23) at33�24:850N; 32�18:490E. It was immediately pre-meshed through 200mm, to exclude larger zoo-plankton, and was transferred into 12 pre-washed 8-l polycarbonate Nalgene bottles. The bottles werepre-washed by filling them with approximately 4 1of 10% HCl, intense mixing and remixing so thatthe caps were acid-washed as well, washing twicewith Milli-Q water, and again twice with thesampled seawater. A concentration gradient ofunaltered and pre-leached dust (collected at BeitYannay, Israel, see hereafter) was added to theincubation bottles (Table 1). The bottles wereimmediately shaken and incubated in a 2-m3 on-deck flow-through water bath, covered by a screenthat reduced the incident light by ca. 50%. Duringapproximately four days, each of the 12 incubationbottles was sampled for a suite of parameters at the
icrocosm experimental bottles (8 l volume)
n Estimated Estimated
addition of addition of
leachable leachable
PO4ðnMÞ NO3 þNH4ðnMÞ
– –
– –
16 750
16 750
7 307
2.5 108
1 31
nk nk
nk nk
nk nk
nk nk
nk nk
based on data from Table 3 assuming linear relationship between
es contain an approximately 20% error. nk, not known.
ARTICLE IN PRESS
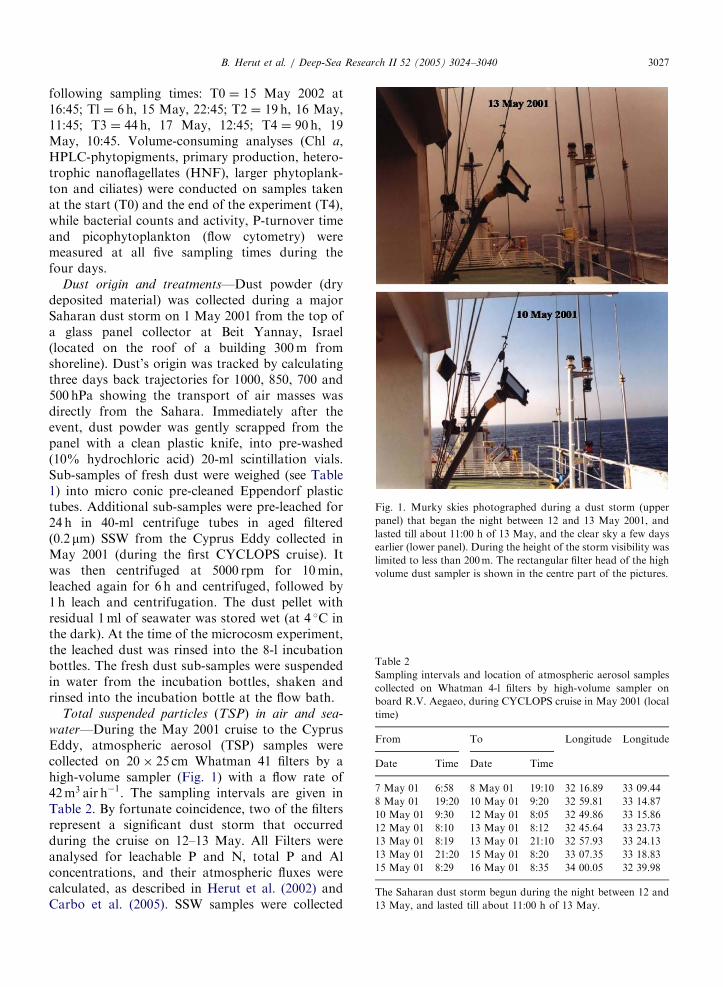
Fig. 1. Murky skies photographed during a dust storm (upper
panel) that began the night between 12 and 13 May 2001, and
lasted till about 11:00 h of 13 May, and the clear sky a few days
earlier (lower panel). During the height of the storm visibility was
limited to less than 200m. The rectangular filter head of the high
volume dust sampler is shown in the centre part of the pictures.
Table 2
Sampling intervals and location of atmospheric aerosol samples
collected on Whatman 4-l filters by high-volume sampler on
board R.V. Aegaeo, during CYCLOPS cruise in May 2001 (local
time)
From To Longitude Longitude
Date Time Date Time
7 May 01 6:58 8 May 01 19:10 32 16.89 33 09.44
8 May 01 19:20 10 May 01 9:20 32 59.81 33 14.87
10 May 01 9:30 12 May 01 8:05 32 49.86 33 15.86
12 May 01 8:10 13 May 01 8:12 32 45.64 33 23.73
13 May 01 8:19 13 May 01 21:10 32 57.93 33 24.13
13 May 01 21:20 15 May 01 8:20 33 07.35 33 18.83
15 May 01 8:29 16 May 01 8:35 34 00.05 32 39.98
The Saharan dust storm begun during the night between 12 and
13 May, and lasted till about 11:00 h of 13 May.
B. Herut et al. / Deep-Sea Research II 52 (2005) 3024–3040 3027
following sampling times: T0 ¼ 15 May 2002 at16:45; Tl ¼ 6 h, 15 May, 22:45; T2 ¼ 19 h, 16 May,11:45; T3 ¼ 44 h, 17 May, 12:45; T4 ¼ 90 h, 19May, 10:45. Volume-consuming analyses (Chl a,HPLC-phytopigments, primary production, hetero-trophic nanoflagellates (HNF), larger phytoplank-ton and ciliates) were conducted on samples takenat the start (T0) and the end of the experiment (T4),while bacterial counts and activity, P-turnover timeand picophytoplankton (flow cytometry) weremeasured at all five sampling times during thefour days.
Dust origin and treatments—Dust powder (drydeposited material) was collected during a majorSaharan dust storm on 1 May 2001 from the top ofa glass panel collector at Beit Yannay, Israel(located on the roof of a building 300m fromshoreline). Dust’s origin was tracked by calculatingthree days back trajectories for 1000, 850, 700 and500 hPa showing the transport of air masses wasdirectly from the Sahara. Immediately after theevent, dust powder was gently scrapped from thepanel with a clean plastic knife, into pre-washed(10% hydrochloric acid) 20-ml scintillation vials.Sub-samples of fresh dust were weighed (see Table1) into micro conic pre-cleaned Eppendorf plastictubes. Additional sub-samples were pre-leached for24 h in 40-ml centrifuge tubes in aged filteredð0:2mmÞ SSW from the Cyprus Eddy collected inMay 2001 (during the first CYCLOPS cruise). Itwas then centrifuged at 5000 rpm for 10min,leached again for 6 h and centrifuged, followed by1 h leach and centrifugation. The dust pellet withresidual 1ml of seawater was stored wet (at 4 �C inthe dark). At the time of the microcosm experiment,the leached dust was rinsed into the 8-l incubationbottles. The fresh dust sub-samples were suspendedin water from the incubation bottles, shaken andrinsed into the incubation bottle at the flow bath.
Total suspended particles (TSP) in air and sea-
water—During the May 2001 cruise to the CyprusEddy, atmospheric aerosol (TSP) samples werecollected on 20� 25 cm Whatman 41 filters by ahigh-volume sampler (Fig. 1) with a flow rate of42m3 air h�1. The sampling intervals are given inTable 2. By fortunate coincidence, two of the filtersrepresent a significant dust storm that occurredduring the cruise on 12–13 May. All Filters wereanalysed for leachable P and N, total P and Alconcentrations, and their atmospheric fluxes werecalculated, as described in Herut et al. (2002) andCarbo et al. (2005). SSW samples were collected
ARTICLE IN PRESSB. Herut et al. / Deep-Sea Research II 52 (2005) 3024–30403028
during and after the dust storm by Niskin bottlesfor P-turnover time, Chl a, bacterial counts,bacterial activity and picophytoplankton abun-dance.
Dust chemical composition—Experiments wereperformed to evaluate the amount of phosphate,nitrate+nitrite and ammonium leached from thedust collected at Beit Yannay by pre-filteredð0:2mmÞ 30ml SSW poisoned with 50ml chloroform.Different amounts of sub-samples were shaken inpre-cleaned 50-ml centrifuge tubes for 30 h in darkconditions. After leaching, samples were centrifugedand sub-sampled into 15-ml pre-cleaned (10% HCl)plastic vials and stored frozen for subsequentnutrient analysis. Total Al, Fe and Mn in the dustwere determined as detailed in Herut et al. (2001).
Nutrients—In the ambient water used for fillingthe experimental bottles, PO4, NO3, NO2 (nanomo-lar technology), UV-labile dissolved organic phos-phorus (DOP) and dissolved organic carbon (DOC)were determined as detailed in Krom et al. (2005).At the additional sampling times, nutrients in themicrocosm were measured by conventional micro-molar technology (using a segmented flow SkalarSANplus System) and were below the effectivedetection limits at all times. The leachable nutrientsfrom the dust were determined by the methodsdescribed in Herut et al. (1999a). Total inorganic Pwas determined by adding 2ml 1N H2SO4 and 3ml1N HCl to the weighed dust sample or by 3-ml 1NHCl alone. The precision for nitrate+nitrite,phosphate and ammonium was 0.02, 0.003 and0:007mM, respectively. The bottle blanks werecorrected and accounted for o5%, �20% and�30% of the nitrate+nitrite, phosphate andammonium, respectively.
P-turnover time—Carrier free H333PO4 was added
to 12-ml samples in 15-ml Falcons tubes to give afinal radioactive concentration of ca. 106 DPMml�1.Amersham BF1003 33PO4 in dilute HCl solution wasused. This has a specific activity of 92.5–129:5TBqmmol�1. With the additions used, thisgives an addition of the order of �0:1 nM phosphate.The samples were incubated at 24� 1 �C undersubdued (laboratory) illumination for an incubationtime of 0.5 h (except T4, 0.25 h) according to expectedturnover time. Samples for subtraction of back-ground and abiotic adsorption were fixed with 50ml25% glutaraldehyde per 12-ml sample before additionof the isotope. Incubations were stopped by a coldchase addition of 100mmolKH2PO4 l
�1 and within1h, 3-ml aliquots filtered in parallel on 25-mm
polycarbonate ðPoreticssÞ filters of 0.2-mm pore-size.Using a Millipore 12-place filter manifold, thepolycarbonate filters where mounted on GF/Csupport filters pre-soaked in 10mmol l�1 KH2PO4.The needle valve of the suction pump was kept ato0:2 bar until all water had passed the filters, thenclosed to increase the suction to 40:6 bar to removeany water remaining in the filters. No washing wasperformed. The 33P on the filters was measured byscintillation counting and turnover time calculatedfrom the formulae Tt ¼ �t= lnðl� f Þ, where f is thefraction of added isotope recovered on the 0.2-mmfilter (corrected for background), and t is theincubation time. Replicate samplings were made sixtimes. The average deviation was 2.5% of the mean.
Bacterial activity and production—Bacterial pro-tein synthesis was determined in triplicates for eachsample by the 14C-leucine incorporation using amodified micro-tube technique (Smith and Azam,1993) and as detailed in Zohary et al. (2005).Leucine uptake was converted to carbon uptakeaccording to Simon and Azam (1989) with anisotope dilution factor of 1, which gives a minimalestimate of bacterial production.
Bacterial counts—The 30-ml samples were fixedwith 4.2ml of filtered 5% Formalin and keptrefrigerated until analysis. DAPI-stained bacteriawere counted with a fluorescent microscope (Porterand Feig, 1980). Bacterial counts were converted toC biomass assuming cellular C content of 20 fg Cper bacterial cell (Lee and Fuhrman, 1987).
Chlorophyll a—Sample of 0.5–1 l was filtered inparallel through 0.2-mm polycarbonate filters (Pore-tics, +47mm). Filters were placed in �20 �Cimmediately after filtration and kept frozen for sixweeks until laboratory analyses were performed.Chlorophyll a and phaeopigment concentrationswere determined fluorometrically according toYentsch and Menzel (1963) with the use of aTURNER 112 fluorometer. Filters were extractedin 90% acetone and phaeopigments were estimatedby acidification with 0.1N HCl.
Phytopigments by HPLC—GFF-filtered 2-1 sam-ples were immediately frozen at �70 �C for highperformance liquid chromatographic (HPLC) ana-lyses of chlorophylls and carotenoids. Pigmentanalyses involved reversed phase RP-HPLC asdescribed by Mantoura and Llewellyn (1983) andadapted by Barlow et al. (1999).
Primary production—Photosynthetic carbon fixa-tion rates at T4 were estimated by means of the 14Ctechnique of Steemann-Nielsen (1952), as modified
ARTICLE IN PRESSB. Herut et al. / Deep-Sea Research II 52 (2005) 3024–3040 3029
for the ultra-oligotrophic water of the EasternMediterranean by Psarra et al. (2000) and Igna-tiades et al. (2002). The 250-ml sub-samples fromeach experimental bottle were placed in transparentpolyethylene bottles, inoculated with 5mCi ofNaH14CO3 tracer and incubated for ca. 2.5 haround midday, when the incident irradiance ismaximum yielding maximum primary productionrates. Dark bottles also were used with controlsamples and served as background that wassubtracted from the light bottles’ yield. At the endof the incubation samples were immediately storedin the dark until filtration. Samples were filteredonto 0.2-mm pore-size polycarbonate filters (Pore-tics) at o100mm Hg vacuum pressure. Deionizedwater and pre-filtered (through 0:2mm) seawaterwere also processed and used as blanks. Killing ofsamples and rinsing of the filters at the end of thefiltration were avoided in order to minimize exuda-tion losses of organic matter. All materials wereacid-cleaned prior to use. To remove excess 14C-bicarbonate, filters were soaked in 1ml 0.5N HCland allowed to stand in uncapped polycarbonate 5-ml vials (Packard) overnight. Activity was measuredusing a Packard Tri-Card 4000 Liquid ScintillationCounter after the addition of 4ml of BSF scintilla-tion cocktail (Packard).
Picophytoplankton (flow cytometry)—Samples(1.8ml) were preserved with 140 ml of 25% glutar-aldehyde (Sigma G-5882), deep-frozen in liquid N2,shipped on dry ice, kept at �80 �C until analysisabout two months later using a FACScan (BectonDickinson) flow cytometer. The samples werethawed for 1min at 37 �C and analysed at roomtemperature ð23� 2 �C), by excitation with Argonlaser at 488 nm. The forward light scatter (FSC),side scatter (SSC), red (chlorophyll) fluorescenceabove 630 nm (FL3) and orange fluorescence at585� 15 nm (FL2) were measured. Before runningthe sample, 0:93mm beads (produced by Poly-Sciences) were added as an internal standard. Thephytoplankton assemblages were composed of threegroups, mainly Synechococcus sp., Prochlorococcus
sp., and diverse picoeukaryotes, each characterizedby its unique light scatter (size and granularity) andautofluorescence features.
Nanoflagellates (epifluorescent microscope
counts)—Water samples were fixed with glutaralde-hyde (final conc. 1%). Sub-samples (50–100ml)were concentrated to ca. 10ml on a 25-mm, 0.8-mmpore-size polycarbonate black filter, DAPI-stainedfor 10min (final conc. 0:5mgml�1), and filtered
(Porter and Feig, 1980). HNF of 2–10mm cell lengthwere counted by epifluorescence microscopy.
Larger phytoplankton—Water samples of 100-mlpreserved with acid Lugol’s solution (final conc.2%), stored at 4 �C were sedimented in settlingchambers for 24 h and examined with an invertedmicroscope. All the dinoflagellates, coccolitho-phores and diatoms 47mm were counted. Forfurther details, see Psarra et al. (2005).
Ciliates—The 500-ml samples were preservedwith borax-buffered formalin (final concentration2% formaldehyde) and stored at 4 �C in the darkand counted with an inverted microscope asdescribed by Pitta et al. (2005). Cell sizes weremeasured with an ocular micrometer and convertedinto cell volumes using appropriate geometricformulae.
3. Results
3.1. Microcosm
The nutrient concentrations in the surface water(5m depth) used in the experiment as determined bynanomolar technology were extremely low (Kromet al., 2005) (PO�34 o2 nM, NO�3 o1 nM, NO�2 o0:5 nM). The ammonium concentration was ap-proximately 80 nM and the UV-labile DOP con-centration was 50–70 nM. Measurements onambient SSW in the region of the sampling sitewere for dissolved organic nitrogen 5–7mM andDOC 60–70mM (Krom et al., 2005). Silicate wasnearly 1:4 mM.
The dust analysis showed 9.3% Al, 3.5% Fe and590 ppm Mn, which is within the upper character-istic range of dust of Saharan origin (Guieu et al.,2002a). The amount of leachable phosphate fromthe dust was 3:2� 0:4 mmol P per g dust (Table 3),corresponding to 15:6� 1:8 nmol P l�1 in bottles 3and 4, and lower amounts, respectively, in the otherfresh dust treatments. The dust also containedsignificant amounts of seawater leachable nitrogenas presented in Table 3. The amount of dissolvedinorganic N was in average 155mmolN per g dust(Table 3), corresponding to 0:75mmolN l�1 inbottles 3 and 4. The leachable N/P ratio isapproximately 50, higher than Redfield ratio.
The P-turnover time prior to addition of dust was3 h, a value typical of P deficiency in EastMediterranean water (Zohary and Robarts, 1998;Moutin et al., 2002; Flaten et al., 2005). Immedi-ately after the highest addition of fresh dust the
ARTICLE IN PRESS
Table 3
Seawater leachable phosphate ðLPO4Þ, nitrate ðLNO3Þ and
ammonium ðLNH4Þ, and total inorganic P (total IP) in dust
powder collected on 1 May 2001 at the northern Israeli
Mediterranean coast (see Methods for details)
mmol g�1 dust LPO4 Total IP LNO3 LNH4
Average 3.2 31.7 114 41.2
Standard deviation 0.4 3.3 33.8 5.7
n 3 3 4 3
Fresh dust concentrations were 40–90mg l�1 per tube of leaching
experiment.
100
10
1
0
0 20 40 60 8033P
turn
over
tim
e (h
)33
P tu
rnov
er ti
me
(h)
Time from T0 (h)
35
30
25
20
15
10
5
00 1 2 3 4 5 6
Dust concentration (mg I-1)
T1 = 6h sampling time
y = 3.8056x + 10.768R2 = 0.9584
FDLD
CTRL
CTRL1+2
FD3+FD4
FD5
FD6
FD7
LD8+LD9
LD10
LD12
LD11
(A)
(B)
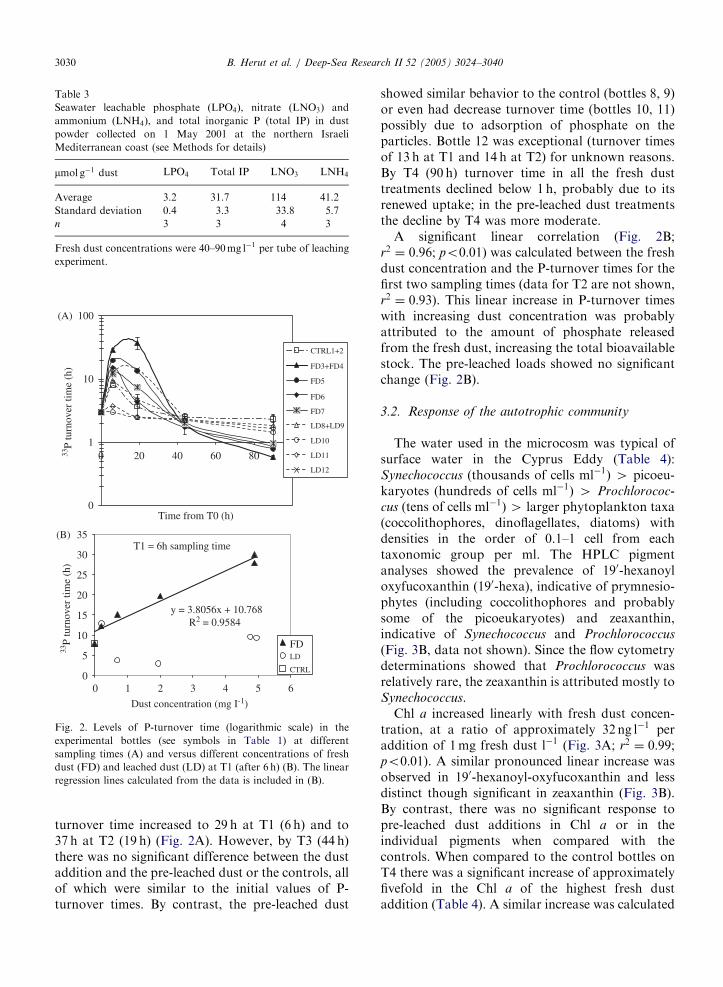
Fig. 2. Levels of P-turnover time (logarithmic scale) in the
experimental bottles (see symbols in Table 1) at different
sampling times (A) and versus different concentrations of fresh
dust (FD) and leached dust (LD) at T1 (after 6 h) (B). The linear
regression lines calculated from the data is included in (B).
B. Herut et al. / Deep-Sea Research II 52 (2005) 3024–30403030
turnover time increased to 29 h at T1 (6 h) and to37 h at T2 (19 h) (Fig. 2A). However, by T3 (44 h)there was no significant difference between the dustaddition and the pre-leached dust or the controls, allof which were similar to the initial values of P-turnover times. By contrast, the pre-leached dust
showed similar behavior to the control (bottles 8, 9)or even had decrease turnover time (bottles 10, 11)possibly due to adsorption of phosphate on theparticles. Bottle 12 was exceptional (turnover timesof 13 h at T1 and 14 h at T2) for unknown reasons.By T4 (90 h) turnover time in all the fresh dusttreatments declined below 1 h, probably due to itsrenewed uptake; in the pre-leached dust treatmentsthe decline by T4 was more moderate.
A significant linear correlation (Fig. 2B;r2 ¼ 0:96; po0:01) was calculated between the freshdust concentration and the P-turnover times for thefirst two sampling times (data for T2 are not shown,r2 ¼ 0:93). This linear increase in P-turnover timeswith increasing dust concentration was probablyattributed to the amount of phosphate releasedfrom the fresh dust, increasing the total bioavailablestock. The pre-leached loads showed no significantchange (Fig. 2B).
3.2. Response of the autotrophic community
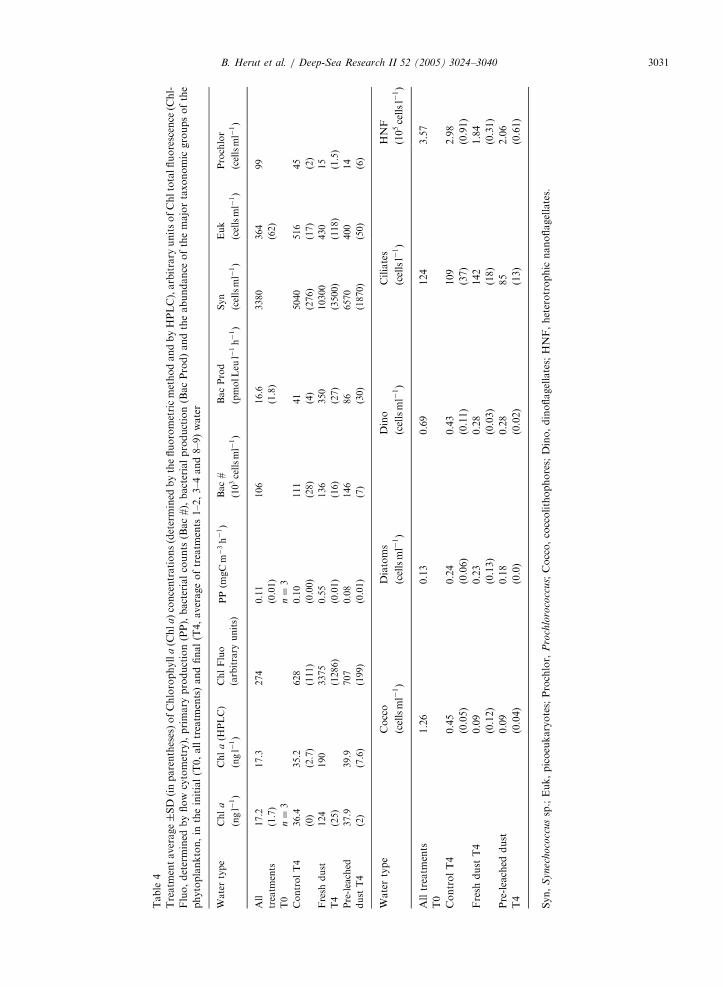
The water used in the microcosm was typical ofsurface water in the Cyprus Eddy (Table 4):Synechococcus (thousands of cells ml�1) 4 picoeu-karyotes (hundreds of cells ml�1) 4 Prochlorococ-
cus (tens of cells ml�1) 4 larger phytoplankton taxa(coccolithophores, dinoflagellates, diatoms) withdensities in the order of 0.1–1 cell from eachtaxonomic group per ml. The HPLC pigmentanalyses showed the prevalence of 190-hexanoyloxyfucoxanthin (190-hexa), indicative of prymnesio-phytes (including coccolithophores and probablysome of the picoeukaryotes) and zeaxanthin,indicative of Synechococcus and Prochlorococcus
(Fig. 3B, data not shown). Since the flow cytometrydeterminations showed that Prochlorococcus wasrelatively rare, the zeaxanthin is attributed mostly toSynechococcus.
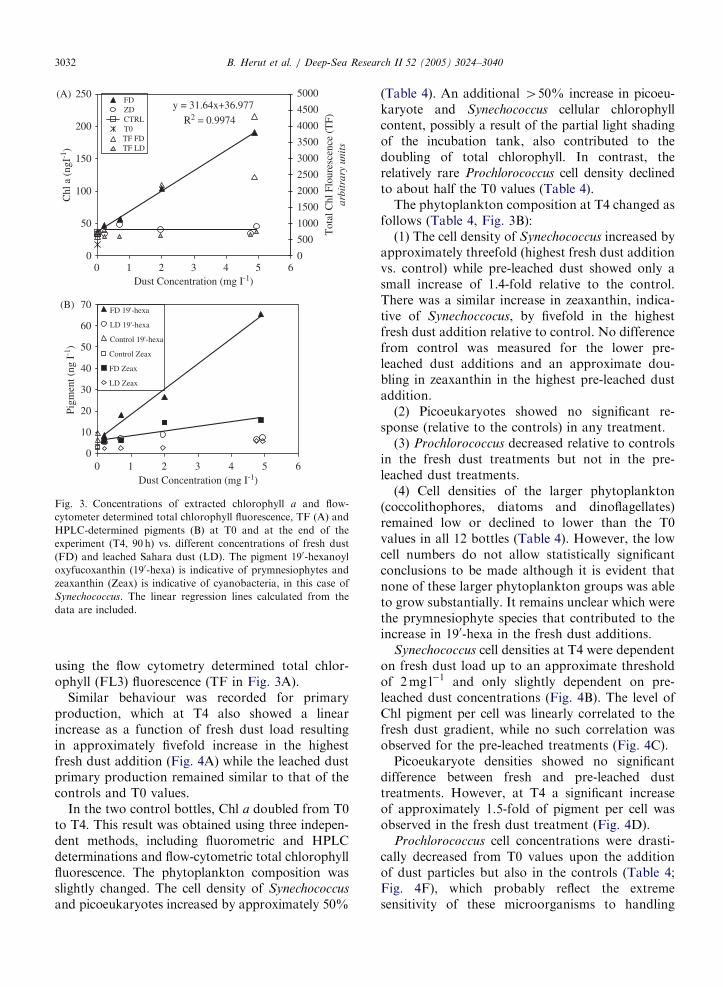
Chl a increased linearly with fresh dust concen-tration, at a ratio of approximately 32 ng l�1 peraddition of 1mg fresh dust l�1 (Fig. 3A; r2 ¼ 0:99;po0:01). A similar pronounced linear increase wasobserved in 190-hexanoyl-oxyfucoxanthin and lessdistinct though significant in zeaxanthin (Fig. 3B).By contrast, there was no significant response topre-leached dust additions in Chl a or in theindividual pigments when compared with thecontrols. When compared to the control bottles onT4 there was a significant increase of approximatelyfivefold in the Chl a of the highest fresh dustaddition (Table 4). A similar increase was calculated
ARTICLE IN PRESS
Table
4
Treatm
entaverage�SD
(inparentheses)ofChlorophyll
a(C
hl
a)concentrations(determined
bythefluorometricmethodandbyHPLC),arbitrary
unitsofChltotalfluorescence
(Chl-
Fluo,determined
byflow
cytometry),primary
production(PP),bacterialcounts
(Bac#),bacterialproduction(BacProd)andtheabundance
ofthemajortaxonomic
groupsofthe
phytoplankton,in
theinitial(T0,alltreatm
ents)andfinal(T4,averageoftreatm
ents
1–2,3–4and8–9)water
Watertype
Chl
a
ðngl�
1Þ
Chl
a(H
PLC)
ðngl�
1Þ
ChlFluo
(arbitrary
units)
PPðm
gCm�3h�1Þ
Bac#
ð103cellsml�
1Þ
BacProd
ðpmolL
eul�
1h�1Þ
Syn
ðcellsml�
1Þ
Euk
ðcellsml�
1Þ
Prochlor
ðcellsml�
1Þ
All
17.2
17.3
274
0.11
106
16.6
3380
364
99
treatm
ents
(1.7)
(0.01)
(1.8)
(62)
T0
n¼
3n¼
3
ControlT4
36.4
35.2
628
0.10
111
41
5040
516
45
(0)
(2.7)
(111)
(0.00)
(28)
(4)
(276)
(17)
(2)
Fresh
dust
124
190
3375
0.55
136
350
10300
430
15
T4
(25)
(1286)
(0.01)
(16)
(27)
(3500)
(118)
(1.5)
Pre-leached
37.9
39.9
707
0.08
146
86
6570
400
14
dust
T4
(2)
(7.6)
(199)
(0.01)
(7)
(30)
(1870)
(50)
(6)
Watertype
Cocco
Diatoms
Dino
Ciliates
HNF
ðcellsml�
1Þ
ðcellsml�
1Þ
ðcellsml�
1Þ
ðcellsl�
1Þ
ð105cellsl�
1Þ
Alltreatm
ents
1.26
0.13
0.69
124
3.57
T0
ControlT4
0.45
0.24
0.43
109
2.98
(0.05)
(0.06)
(0.11)
(37)
(0.91)
Fresh
dust
T4
0.09
0.23
0.28
142
1.84
(0.12)
(0.13)
(0.03)
(18)
(0.31)
Pre-leached
dust
0.09
0.18
0.28
85
2.06
T4
(0.04)
(0.0)
(0.02)
(13)
(0.61)
Syn,
Sy
nec
hoco
ccussp.;Euk,picoeukaryotes;Prochlor,
Pro
chlo
roco
ccu
s;Cocco,coccolithophores;Dino,dinoflagellates;HNF,heterotrophic
nanoflagellates.
B. Herut et al. / Deep-Sea Research II 52 (2005) 3024–3040 3031
ARTICLE IN PRESS
250
200
150
100
50
00 1 2 3 4 5 6
5000
4500
4000
3500
3000
2500
2000
1500
1000
500
0
Tot
al C
hl F
lour
esce
nce
(TF)
arbi
trar
y un
its
Chl
a (
ngI-1
)
Dust Concentration (mg I-1)
70
60
50
40
30
20
10
00 1 2 3 4 5 6
Dust Concentration (mg I-1)
FD 19'-hexa
LD 19'-hexa
Control 19'-hexa
Control Zeax
FD Zeax
LD Zeax
FDZDCTRLT0TF FDTF LD
Pigm
ent (
ng I
-1)
(A)
(B)
y = 31.64x+36.977
R2 = 0.9974
Fig. 3. Concentrations of extracted chlorophyll a and flow-
cytometer determined total chlorophyll fluorescence, TF (A) and
HPLC-determined pigments (B) at T0 and at the end of the
experiment (T4, 90 h) vs. different concentrations of fresh dust
(FD) and leached Sahara dust (LD). The pigment 190-hexanoyl
oxyfucoxanthin (190-hexa) is indicative of prymnesiophytes and
zeaxanthin (Zeax) is indicative of cyanobacteria, in this case of
Synechococcus. The linear regression lines calculated from the
data are included.
B. Herut et al. / Deep-Sea Research II 52 (2005) 3024–30403032
using the flow cytometry determined total chlor-ophyll (FL3) fluorescence (TF in Fig. 3A).
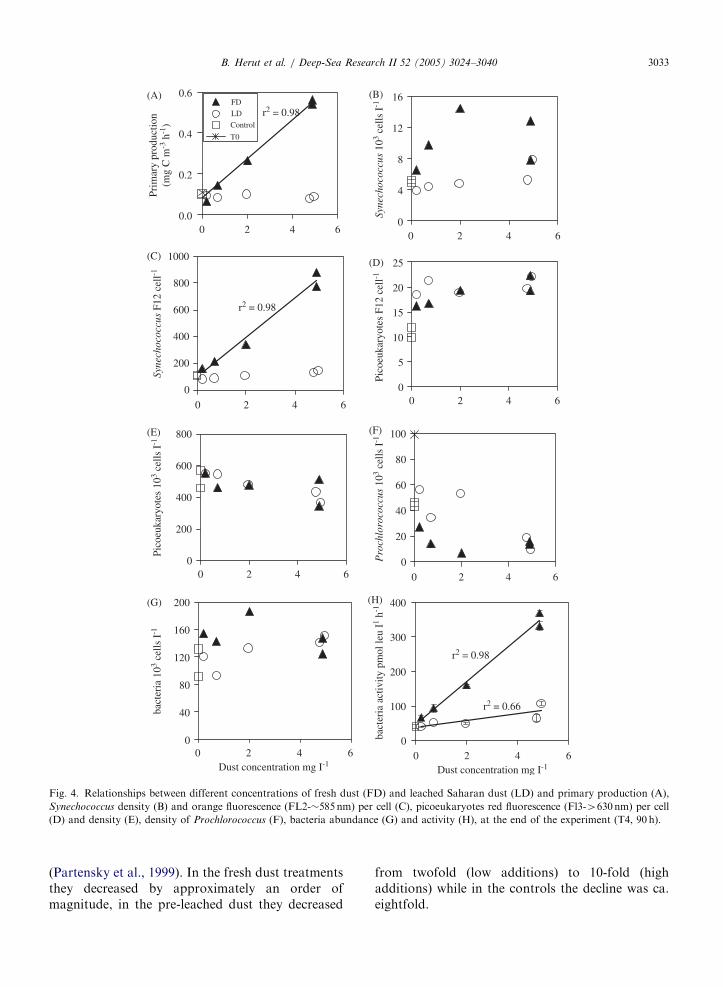
Similar behaviour was recorded for primaryproduction, which at T4 also showed a linearincrease as a function of fresh dust load resultingin approximately fivefold increase in the highestfresh dust addition (Fig. 4A) while the leached dustprimary production remained similar to that of thecontrols and T0 values.
In the two control bottles, Chl a doubled from T0to T4. This result was obtained using three indepen-dent methods, including fluorometric and HPLCdeterminations and flow-cytometric total chlorophyllfluorescence. The phytoplankton composition wasslightly changed. The cell density of Synechococcus
and picoeukaryotes increased by approximately 50%
(Table 4). An additional 450% increase in picoeu-karyote and Synechococcus cellular chlorophyllcontent, possibly a result of the partial light shadingof the incubation tank, also contributed to thedoubling of total chlorophyll. In contrast, therelatively rare Prochlorococcus cell density declinedto about half the T0 values (Table 4).
The phytoplankton composition at T4 changed asfollows (Table 4, Fig. 3B):
(1) The cell density of Synechococcus increased byapproximately threefold (highest fresh dust additionvs. control) while pre-leached dust showed only asmall increase of 1.4-fold relative to the control.There was a similar increase in zeaxanthin, indica-tive of Synechoccocus, by fivefold in the highestfresh dust addition relative to control. No differencefrom control was measured for the lower pre-leached dust additions and an approximate dou-bling in zeaxanthin in the highest pre-leached dustaddition.
(2) Picoeukaryotes showed no significant re-sponse (relative to the controls) in any treatment.
(3) Prochlorococcus decreased relative to controlsin the fresh dust treatments but not in the pre-leached dust treatments.
(4) Cell densities of the larger phytoplankton(coccolithophores, diatoms and dinoflagellates)remained low or declined to lower than the T0values in all 12 bottles (Table 4). However, the lowcell numbers do not allow statistically significantconclusions to be made although it is evident thatnone of these larger phytoplankton groups was ableto grow substantially. It remains unclear which werethe prymnesiophyte species that contributed to theincrease in 190-hexa in the fresh dust additions.
Synechococcus cell densities at T4 were dependenton fresh dust load up to an approximate thresholdof 2mg l�1 and only slightly dependent on pre-leached dust concentrations (Fig. 4B). The level ofChl pigment per cell was linearly correlated to thefresh dust gradient, while no such correlation wasobserved for the pre-leached treatments (Fig. 4C).
Picoeukaryote densities showed no significantdifference between fresh and pre-leached dusttreatments. However, at T4 a significant increaseof approximately 1.5-fold of pigment per cell wasobserved in the fresh dust treatment (Fig. 4D).
Prochlorococcus cell concentrations were drasti-cally decreased from T0 values upon the additionof dust particles but also in the controls (Table 4;Fig. 4F), which probably reflect the extremesensitivity of these microorganisms to handling
ARTICLE IN PRESS
0.6
0.4
0.2
0.0
16
12
8
4
00 2 4 6
0 2 4 6
0 2 4 6
0 2 4 6 0 2 4 6
0 2 4 6
0 2 4 6
0 2 4 6
800
600
400
200
0
800
600
400
200
0
100025
20
15
10
5
0
100
80
60
40
20
0
200
160
120
80
40
0
400
300
200
100
0
Prim
ary
prod
uctio
n(m
g C
m-3
h-1
)
Syne
choc
occu
s 10
3 cel
ls I
-1
Syne
choc
occu
s F1
2 ce
ll-1Pi
coeu
kary
otes
103 c
ells
I-1
Pico
euka
ryot
es F
12 c
ell-1
Pro
chlo
roco
ccus
103 c
ells
I-1
bact
eria
103 c
ells
I-1
bact
eria
act
ivity
pm
ol le
u I1 h
-1
Dust concentration mg I-1Dust concentration mg I-1
FD
LD
Control
T0
r2 = 0.98
r2 = 0.98
r2 = 0.98
r2 = 0.66
(A) (B)
(C)(D)
(E) (F)
(G) (H)
Fig. 4. Relationships between different concentrations of fresh dust (FD) and leached Saharan dust (LD) and primary production (A),
Synechococcus density (B) and orange fluorescence (FL2-�585nm) per cell (C), picoeukaryotes red fluorescence (Fl3-4630nm) per cell
(D) and density (E), density of Prochlorococcus (F), bacteria abundance (G) and activity (H), at the end of the experiment (T4, 90 h).
B. Herut et al. / Deep-Sea Research II 52 (2005) 3024–3040 3033
(Partensky et al., 1999). In the fresh dust treatmentsthey decreased by approximately an order ofmagnitude, in the pre-leached dust they decreased
from twofold (low additions) to 10-fold (highadditions) while in the controls the decline was ca.eightfold.
ARTICLE IN PRESSB. Herut et al. / Deep-Sea Research II 52 (2005) 3024–30403034
3.3. Response of the heterotrophic community
At T4 bacterial activity was higher than that at T0by � eightfold in the highest load of fresh dust andby twofold in the highest pre-leached dust. Theactivity increased with dust load (Fig. 4H) andfluctuated with time (not shown). The effectincreased with time from T0 to T3 and then declinedsomewhat to T4. This increase was due to thedynamics in the bottles: as bacteria grow and aregrazed, nutrients are recycled and can induce afurther increase in bacterial activity. This also isindicated by the oscillation over time of the turn-over time of available o-phosphate (Fig. 2A). At T3when bacterial activity was at its maximum in allexperimental bottles, turnover time was low (¼ lowP availability) followed by a decrease in bacterialactivity at T4 with the further decline in turnovertime on T4. The magnitude of oscillations ofbacterial activity depended on the initial amountof fresh dust added. For the dust concentrationrange between 0.2 and 5mg l�1 this effect was linearat T4. Bacterial cell concentrations show minorchanges between T0 and T4 (Table 4) and across thedust load gradient (Fig. 4G). Cell numbers at T0were ca. 1:0� 105 ml�1 increasing up to ca. 1:6�105 ml�1 on T4 in different dust treatments(Fig. 4G). It is probable that bacterial speciescomposition changed during the experiment andthat their mean cell size increased but theseparameters were not quantified.
The bacterivores, the HNF and ciliates, re-sponded differently to the dust additions. FromT0 to T4, a certain increase of ciliate abundance wasmeasured in most fresh dust additions and a declinein most leached dust additions; however, due tolarge variability these changes could not be shownas significant (Table 4, partial data). Over the wholedust gradient the ciliate density was enhanced by thefresh dust additions as compared to the pre-leachedones. HNF declined from T0 to T4 in both dusttreatments. The magnitude of decrease variedamong the dust concentrations (Table 4, partialdata).
By T4, the ciliate community structure changed inall treatments (fresh and pre-leached dust) as well asin the control bottles in a similar way (Table 4). Thepercentage of large aloricates contribution decreasedand the one of tintinnids increased, whereas smallaloricates did not show any change (data not shown).This change was more or less similar in the controlbottles and in the fresh dust addition ones (on
average, large aloricates decreased from 73% on T0to 46% on T4) and it was more pronounced in thebottles with the pre-leached addition (large aloricatesdecreased from 73% on T0 to 31% on T4).
3.4. Nutrient fluxes and biological response to
Saharan dust storm during May 2001 (CYCLOPS
cruise)
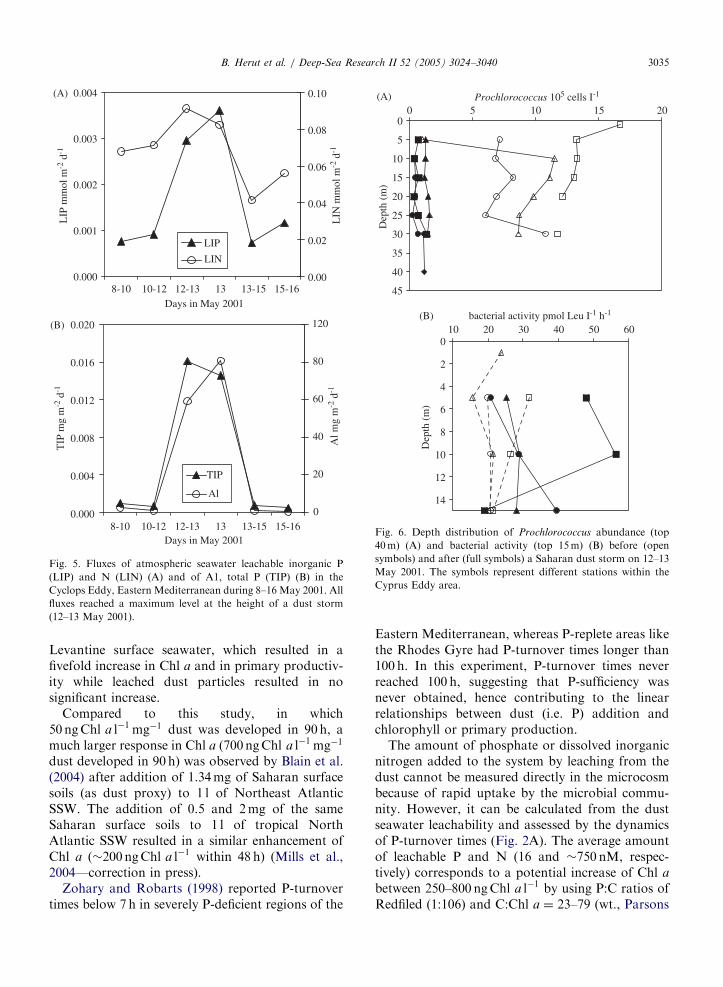
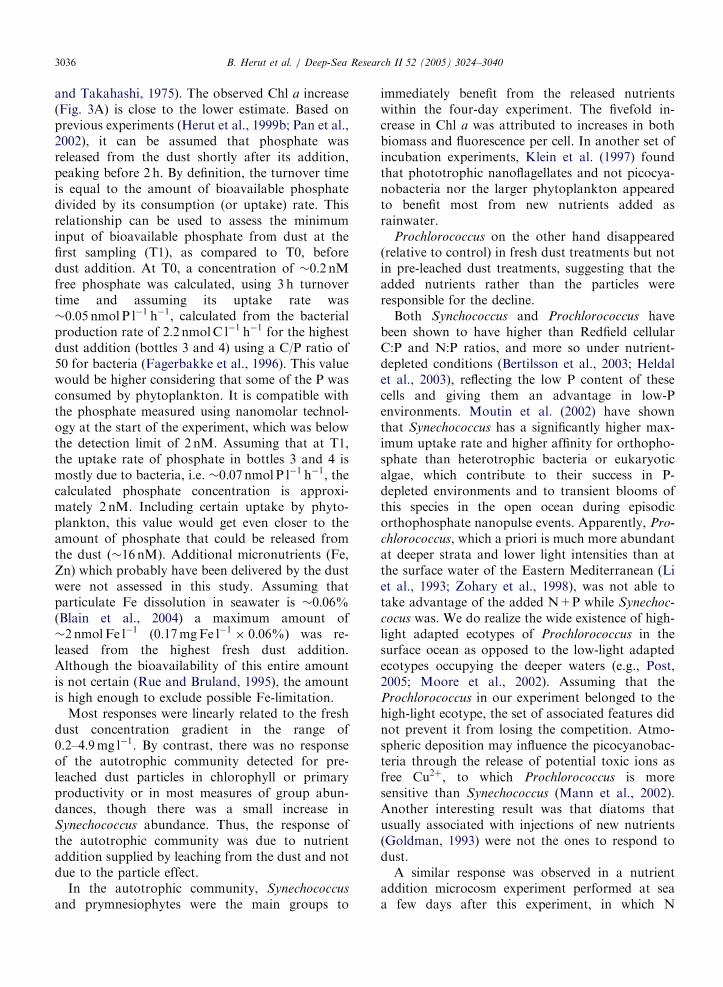
A dust storm reached the Cyclops Eddy region(ca. 33�N and 33�E) where the R.V. Aegaeo wassampling during the night between 12 and 13 May2001, and lasted till about 11:00 h of 13 May. At theheight of the storm, in the early morning hours, thewind was strong, visibility was limited to less than200m, and the sky was brown (Fig. 1). At that timefluxes of Al, total P (Fig. 5B) and seawater leachableinorganic P (LIP) and N (LIN) reached maximumlevels (Fig. 5A). Compared to the background dailyfluxes for LIP and LIN there was a three- tofourfold increase in LIP input, and a smallerincrease in LIN, during the storm. In spite of thelower LIN input, LIN:LIP contributed by atmo-spheric deposition was present at greater ratios thanRedfield throughout the cruise (�30 during the duststorm and �100 in background conditions).
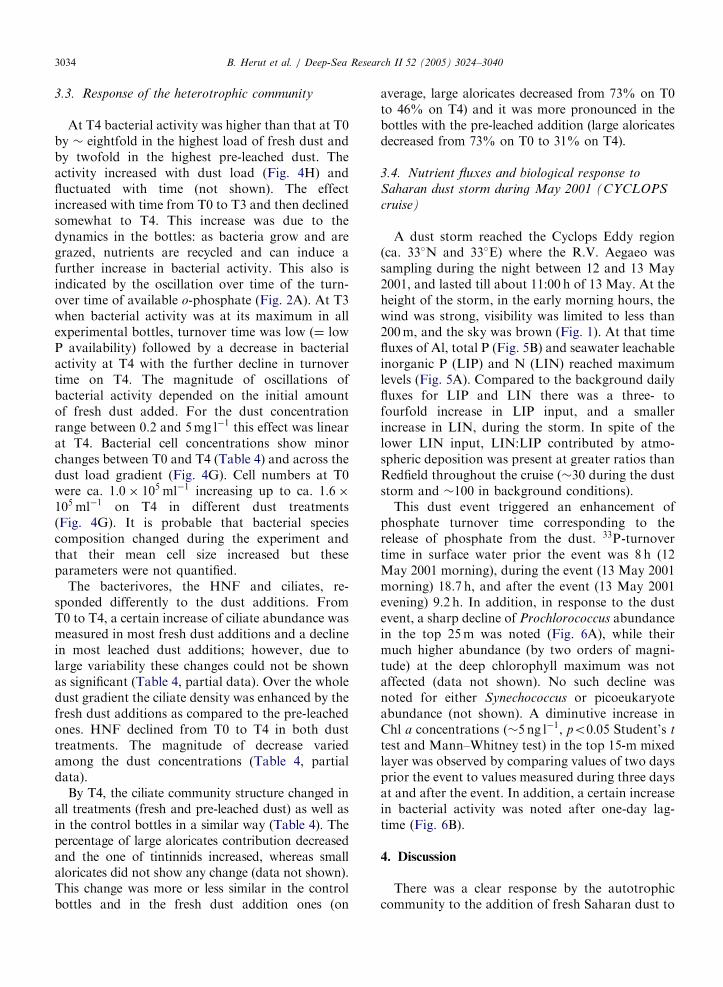
This dust event triggered an enhancement ofphosphate turnover time corresponding to therelease of phosphate from the dust. 33P-turnovertime in surface water prior the event was 8 h (12May 2001 morning), during the event (13 May 2001morning) 18.7 h, and after the event (13 May 2001evening) 9.2 h. In addition, in response to the dustevent, a sharp decline of Prochlorococcus abundancein the top 25m was noted (Fig. 6A), while theirmuch higher abundance (by two orders of magni-tude) at the deep chlorophyll maximum was notaffected (data not shown). No such decline wasnoted for either Synechococcus or picoeukaryoteabundance (not shown). A diminutive increase inChl a concentrations (�5 ng l�1, po0:05 Student’s t
test and Mann–Whitney test) in the top 15-m mixedlayer was observed by comparing values of two daysprior the event to values measured during three daysat and after the event. In addition, a certain increasein bacterial activity was noted after one-day lag-time (Fig. 6B).
4. Discussion
There was a clear response by the autotrophiccommunity to the addition of fresh Saharan dust to
ARTICLE IN PRESS
0
5
10
15
20
25
30
35
40
45
0 5 10 15 20Prochlorococcus 105 cells I-1
0
2
4
6
8
10
12
14
10 20 30 40 50 60bacterial activity pmol Leu I-1 h-1
Dep
th (
m)
Dep
th (
m)
(A)
(B)
Fig. 6. Depth distribution of Prochlorococcus abundance (top
40m) (A) and bacterial activity (top 15m) (B) before (open
symbols) and after (full symbols) a Saharan dust storm on 12–13
May 2001. The symbols represent different stations within the
Cyprus Eddy area.
0.004
0.003
0.002
0.001
0.0008-10 10-12 12-13 13 13-15 15-16
8-10 10-12 12-13 13 13-15 15-16
0.00
0.02
0.04
0.06
0.08
0.10
0.020
0.016
0.012
0.008
0.004
0.000
Days in May 2001
Days in May 2001
LIN
mm
ol m
-2 d
-1
LIP
mm
ol m
-2 d
-1
0
20
40
60
80
120A
l mg
m-2
d-1
TIP
mg
m-2
d-1
TIP
Al
LIP
LIN
(A)
(B)
Fig. 5. Fluxes of atmospheric seawater leachable inorganic P
(LIP) and N (LIN) (A) and of A1, total P (TIP) (B) in the
Cyclops Eddy, Eastern Mediterranean during 8–16 May 2001. All
fluxes reached a maximum level at the height of a dust storm
(12–13 May 2001).
B. Herut et al. / Deep-Sea Research II 52 (2005) 3024–3040 3035
Levantine surface seawater, which resulted in afivefold increase in Chl a and in primary productiv-ity while leached dust particles resulted in nosignificant increase.
Compared to this study, in which50ngChl a l�1 mg�1 dust was developed in 90h, amuch larger response in Chl a (700ngChl a l�1 mg�1
dust developed in 90 h) was observed by Blain et al.(2004) after addition of 1.34mg of Saharan surfacesoils (as dust proxy) to 1 l of Northeast AtlanticSSW. The addition of 0.5 and 2mg of the sameSaharan surface soils to 1 l of tropical NorthAtlantic SSW resulted in a similar enhancement ofChl a (�200ngChl a l�1 within 48 h) (Mills et al.,2004—correction in press).
Zohary and Robarts (1998) reported P-turnovertimes below 7 h in severely P-deficient regions of the
Eastern Mediterranean, whereas P-replete areas likethe Rhodes Gyre had P-turnover times longer than100 h. In this experiment, P-turnover times neverreached 100 h, suggesting that P-sufficiency wasnever obtained, hence contributing to the linearrelationships between dust (i.e. P) addition andchlorophyll or primary production.
The amount of phosphate or dissolved inorganicnitrogen added to the system by leaching from thedust cannot be measured directly in the microcosmbecause of rapid uptake by the microbial commu-nity. However, it can be calculated from the dustseawater leachability and assessed by the dynamicsof P-turnover times (Fig. 2A). The average amountof leachable P and N (16 and �750 nM, respec-tively) corresponds to a potential increase of Chl a
between 250–800 ngChl a l�1 by using P:C ratios ofRedfiled (1:106) and C:Chl a ¼ 23–79 (wt., Parsons
ARTICLE IN PRESSB. Herut et al. / Deep-Sea Research II 52 (2005) 3024–30403036
and Takahashi, 1975). The observed Chl a increase(Fig. 3A) is close to the lower estimate. Based onprevious experiments (Herut et al., 1999b; Pan et al.,2002), it can be assumed that phosphate wasreleased from the dust shortly after its addition,peaking before 2 h. By definition, the turnover timeis equal to the amount of bioavailable phosphatedivided by its consumption (or uptake) rate. Thisrelationship can be used to assess the minimuminput of bioavailable phosphate from dust at thefirst sampling (T1), as compared to T0, beforedust addition. At T0, a concentration of �0:2 nMfree phosphate was calculated, using 3 h turnovertime and assuming its uptake rate was�0:05 nmol P l�1 h�1, calculated from the bacterialproduction rate of 2:2 nmolC l�1 h�1 for the highestdust addition (bottles 3 and 4) using a C/P ratio of50 for bacteria (Fagerbakke et al., 1996). This valuewould be higher considering that some of the P wasconsumed by phytoplankton. It is compatible withthe phosphate measured using nanomolar technol-ogy at the start of the experiment, which was belowthe detection limit of 2 nM. Assuming that at T1,the uptake rate of phosphate in bottles 3 and 4 ismostly due to bacteria, i.e. �0:07 nmol P l�1 h�1, thecalculated phosphate concentration is approxi-mately 2 nM. Including certain uptake by phyto-plankton, this value would get even closer to theamount of phosphate that could be released fromthe dust ð�16 nMÞ. Additional micronutrients (Fe,Zn) which probably have been delivered by the dustwere not assessed in this study. Assuming thatparticulate Fe dissolution in seawater is �0:06%(Blain et al., 2004) a maximum amount of�2 nmolFe l�1 (0:17mgFe l�1 � 0:06%Þ was re-leased from the highest fresh dust addition.Although the bioavailability of this entire amountis not certain (Rue and Bruland, 1995), the amountis high enough to exclude possible Fe-limitation.
Most responses were linearly related to the freshdust concentration gradient in the range of0.2–4:9mg l�1. By contrast, there was no responseof the autotrophic community detected for pre-leached dust particles in chlorophyll or primaryproductivity or in most measures of group abun-dances, though there was a small increase inSynechococcus abundance. Thus, the response ofthe autotrophic community was due to nutrientaddition supplied by leaching from the dust and notdue to the particle effect.
In the autotrophic community, Synechococcus
and prymnesiophytes were the main groups to
immediately benefit from the released nutrientswithin the four-day experiment. The fivefold in-crease in Chl a was attributed to increases in bothbiomass and fluorescence per cell. In another set ofincubation experiments, Klein et al. (1997) foundthat phototrophic nanoflagellates and not picocya-nobacteria nor the larger phytoplankton appearedto benefit most from new nutrients added asrainwater.
Prochlorococcus on the other hand disappeared(relative to control) in fresh dust treatments but notin pre-leached dust treatments, suggesting that theadded nutrients rather than the particles wereresponsible for the decline.
Both Synchococcus and Prochlorococcus havebeen shown to have higher than Redfield cellularC:P and N:P ratios, and more so under nutrient-depleted conditions (Bertilsson et al., 2003; Heldalet al., 2003), reflecting the low P content of thesecells and giving them an advantage in low-Penvironments. Moutin et al. (2002) have shownthat Synechococcus has a significantly higher max-imum uptake rate and higher affinity for orthopho-sphate than heterotrophic bacteria or eukaryoticalgae, which contribute to their success in P-depleted environments and to transient blooms ofthis species in the open ocean during episodicorthophosphate nanopulse events. Apparently, Pro-
chlorococcus, which a priori is much more abundantat deeper strata and lower light intensities than atthe surface water of the Eastern Mediterranean (Liet al., 1993; Zohary et al., 1998), was not able totake advantage of the added N+P while Synechoc-
cocus was. We do realize the wide existence of high-light adapted ecotypes of Prochlorococcus in thesurface ocean as opposed to the low-light adaptedecotypes occupying the deeper waters (e.g., Post,2005; Moore et al., 2002). Assuming that theProchlorococcus in our experiment belonged to thehigh-light ecotype, the set of associated features didnot prevent it from losing the competition. Atmo-spheric deposition may influence the picocyanobac-teria through the release of potential toxic ions asfree Cu2þ, to which Prochlorococcus is moresensitive than Synechococcus (Mann et al., 2002).Another interesting result was that diatoms thatusually associated with injections of new nutrients(Goldman, 1993) were not the ones to respond todust.
A similar response was observed in a nutrientaddition microcosm experiment performed at seaa few days after this experiment, in which N
ARTICLE IN PRESS
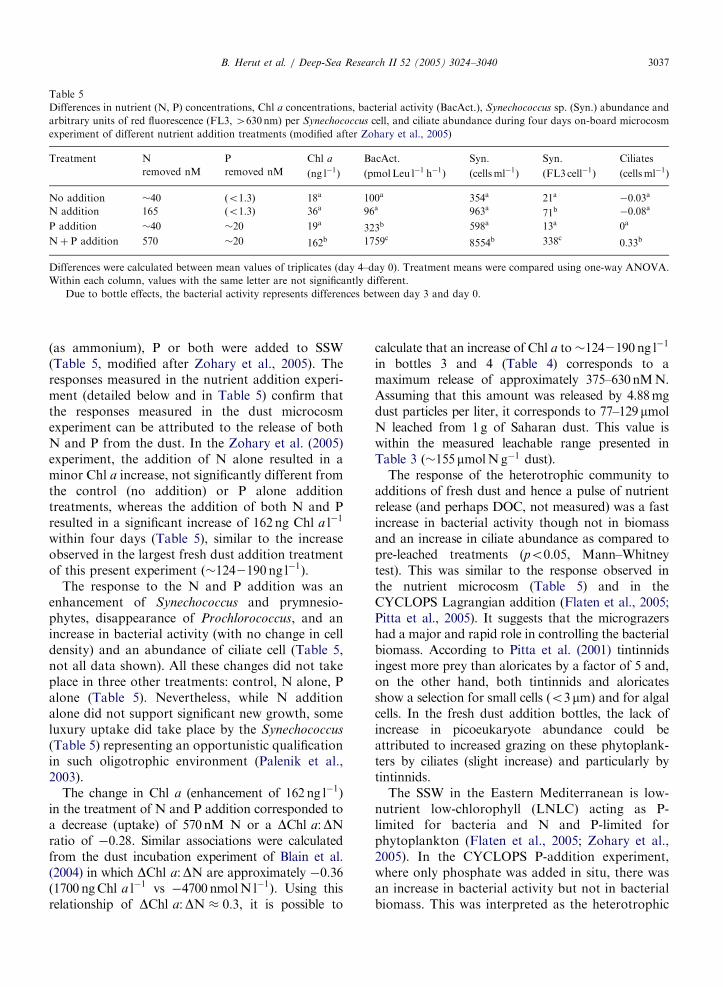
Table 5
Differences in nutrient (N, P) concentrations, Chl a concentrations, bacterial activity (BacAct.), Synechococcus sp. (Syn.) abundance and
arbitrary units of red fluorescence (FL3, 4630nm) per Synechococcus cell, and ciliate abundance during four days on-board microcosm
experiment of different nutrient addition treatments (modified after Zohary et al., 2005)
Treatment N P Chl a BacAct.� Syn. Syn. Ciliates
removed nM removed nM ðng l�1Þ ðpmolLeu l�1 h�1Þ ðcellsml�1Þ ðFL3cell�1Þ ðcellsml�1Þ
No addition �40 ðo1:3Þ 18a 100a 354a 21a �0:03a
N addition 165 ðo1:3Þ 36a 96a 963a 71b �0:08a
P addition �40 �20 19a 323b 598a 13a 0a
Nþ P addition 570 �20 162b 1759c 8554b 338c 0:33b
Differences were calculated between mean values of triplicates (day 4–day 0). Treatment means were compared using one-way ANOVA.
Within each column, values with the same letter are not significantly different.�Due to bottle effects, the bacterial activity represents differences between day 3 and day 0.
B. Herut et al. / Deep-Sea Research II 52 (2005) 3024–3040 3037
(as ammonium), P or both were added to SSW(Table 5, modified after Zohary et al., 2005). Theresponses measured in the nutrient addition experi-ment (detailed below and in Table 5) confirm thatthe responses measured in the dust microcosmexperiment can be attributed to the release of bothN and P from the dust. In the Zohary et al. (2005)experiment, the addition of N alone resulted in aminor Chl a increase, not significantly different fromthe control (no addition) or P alone additiontreatments, whereas the addition of both N and Presulted in a significant increase of 162ng Chl a l�1
within four days (Table 5), similar to the increaseobserved in the largest fresh dust addition treatmentof this present experiment ð�1242190ng l�1Þ.
The response to the N and P addition was anenhancement of Synechococcus and prymnesio-phytes, disappearance of Prochlorococcus, and anincrease in bacterial activity (with no change in celldensity) and an abundance of ciliate cell (Table 5,not all data shown). All these changes did not takeplace in three other treatments: control, N alone, Palone (Table 5). Nevertheless, while N additionalone did not support significant new growth, someluxury uptake did take place by the Synechococcus
(Table 5) representing an opportunistic qualificationin such oligotrophic environment (Palenik et al.,2003).
The change in Chl a (enhancement of 162 ng l�1)in the treatment of N and P addition corresponded toa decrease (uptake) of 570nM N or a DChl a:DNratio of �0:28. Similar associations were calculatedfrom the dust incubation experiment of Blain et al.(2004) in which DChl a:DN are approximately �0:36ð1700 ngChl a l�1 vs �4700 nmolN l�1Þ. Using thisrelationship of DChl a:DN � 0:3, it is possible to
calculate that an increase of Chl a to�1242190 ng l�1
in bottles 3 and 4 (Table 4) corresponds to amaximum release of approximately 375–630nMN.Assuming that this amount was released by 4.88mgdust particles per liter, it corresponds to 77–129mmolN leached from 1g of Saharan dust. This value iswithin the measured leachable range presented inTable 3 ð�155mmolNg�1 dust).
The response of the heterotrophic community toadditions of fresh dust and hence a pulse of nutrientrelease (and perhaps DOC, not measured) was a fastincrease in bacterial activity though not in biomassand an increase in ciliate abundance as compared topre-leached treatments (po0:05, Mann–Whitneytest). This was similar to the response observed inthe nutrient microcosm (Table 5) and in theCYCLOPS Lagrangian addition (Flaten et al., 2005;Pitta et al., 2005). It suggests that the micrograzershad a major and rapid role in controlling the bacterialbiomass. According to Pitta et al. (2001) tintinnidsingest more prey than aloricates by a factor of 5 and,on the other hand, both tintinnids and aloricatesshow a selection for small cells ðo3mmÞ and for algalcells. In the fresh dust addition bottles, the lack ofincrease in picoeukaryote abundance could beattributed to increased grazing on these phytoplank-ters by ciliates (slight increase) and particularly bytintinnids.
The SSW in the Eastern Mediterranean is low-nutrient low-chlorophyll (LNLC) acting as P-limited for bacteria and N and P-limited forphytoplankton (Flaten et al., 2005; Zohary et al.,2005). In the CYCLOPS P-addition experiment,where only phosphate was added in situ, there wasan increase in bacterial activity but not in bacterialbiomass. This was interpreted as the heterotrophic
ARTICLE IN PRESSB. Herut et al. / Deep-Sea Research II 52 (2005) 3024–30403038
bacterial community being able to access DON orrecycled N more efficiently than phytoplankton andincreased activity, which was immediately grazed bymicrograzers, thus keeping the biomass constant. Itwas similar to the response of the bacteria observedin this study though it is unknown here whether theN used by the bacterial community came fromDON or DIN leached from the dust.
In the CYCLOPS P-addition experiment we alsofound an unexpected no change in Chl a. This wasinterpreted as the phytoplankton did not have rapidaccess to N and yet was subject to increased grazingpressure (Psarra et al., 2005). The response waschannelled up the food web reaching the mesozoo-plankton in the form of increased gut content andegg numbers. By contrast, in this study chlorophyllincreased. This was due to both N and P beingsupplied by the dust and to the reduced grazingpressure because the mesozooplankton communitywas removed.
In May 2001, we were able to sample the effectsof a dust storm in situ. Air mass back trajectoriesand crustal element composition indicated that theSahara was the source area of this dust event. Thedust storm is reflected by the changes in thecalculated atmospheric fluxes of Al, total phos-phorus, leachable phosphate and inorganic nitrogen(Fig. 5A,B). This dust storm delivered bioavailablenutrients that correspond to addition of approxi-mately 0:3 nmol P l�1 and �9 nmolN l�1 to a 15-msurface mixed layer. Even such a small nutrient(both N and P) injection triggered an enhancementof phosphate turnover time corresponding to therelease of phosphate from the dust, a sharp declineof Prochlorococcus abundance in the top 25m(Fig. 6A), a small increase in bacterial activity afterone-day lag-time (Fig. 6B) and a minute increase of�5 ng l�1 Chl a in the top 15-m mixed layer. Thisminute increase in Chl a is similar to a calculated�7 ngChl a l�1 increase from the calculated addi-tion of bioavailable �0:3 nmol P l�1 by the dustevent, using P:C ratios of Redfiled (1:106) and C :Chl a ¼ �50 (wt., Parsons and Takahashi, 1975).No detectable change was measured either inbacterial abundance.
This less obvious response recorded by the in situmeasurements following the Saharan dust storm isnot surprising considering the relatively low (thoughimportant) amount of nutrients released per eventand the relatively low dust particle input. Givenan average Al flux of 70mgm�2 per 36-h event(Fig. 5B) and a concentration of 9% (dry wt.) of Al
in Saharan dust, the event enriched a 15-m surfacemixed layer by approximately 0:06mgdust l�1. Thisdust concentration falls at the lower tail of the dustconcentration gradient used in this study. Thus, anaddition of approximately 0:06mgdust l�1 wouldcorrespond to a change of few ng Chl a l�1, whichwould be close, anyway, to detection limits for achange in chlorophyll using remote sensing obser-vations.
The Levantine basin is characterized by low-nutrient surface waters and a high N:P ratio ð�27Þin the deep water. It is noted here that the principalsupply of nutrients to the system is atmospheric(dust and rainfall), which has a bioavailable N:Pratio above Redfield (70, Herut et al., 2002; Krom etal., 2004). The surface waters are also dominated bySynechococcus and Prochlorococcus probably con-taining bio-elemental N:P stoichiometry in excess ofthe Redfield ratios (20–30, Bertilsson et al., 2003;Heldal et al., 2003) especially under P-limitedconditions (460, Bertilsson et al., 2003). Thisrelationship may be an important component inthe unusual nutrient ratios and recycling observedin the East Mediterranean.
Acknowledgements
The research was supported by EC Grant EVK3-CT-1999-000009 with additional partial assistanceof MED POL Phase III and project 18.635. Theauthors wish to thank the chief scientist A.Tselepides, the captain and the crew of the RV‘Aegaeo’. We thank S. Chava for the bacterialcounts, N. Stambler for flow cytometry analysesand E. M. S. Woodward and L. Izraelov for theirassistance in the nutrient analyses.
References
Barlow, R.G., Mantoura, R.F.C., Cummings, D.G., 1999.
Monsoonal influence on the distribution of phytoplankton
pigments in the Arabian Sea. Deep Sea Research II 46,
677–699.
Bergametti, G., Remoudaki, E., Losno, R., Steiner, E., Chatenet,
B., 1992. Source, transport and deposition of atmospheric
phosphorus over the northwestern Mediterranean. Journal of
Atmospheric Chemistry 14, 501–513.
Bertilsson, S., Berglund, O., Karl, D.M., Chisholm, S.W., 2003.
Elemental composition of marine Prochlorococcus and
Synechococcus: implications for the ecological stoichiometry
of the sea. Limnology and Oceanography 48, 1721–1731.
Bethoux, J.P., Morin, P., Chaumery, C., Connan, O., Gentili, B.,
Ruiz-Pino, D., 1998. Nutrients in the Mediterranean Sea,
mass balance and statistical analysis of concentrations
ARTICLE IN PRESSB. Herut et al. / Deep-Sea Research II 52 (2005) 3024–3040 3039
with respect to environmental change. Marine Chemistry 63,
155–169.
Bethoux, J.P., Morin, P., Ruiz-Pino, D., 2002. Temporal trends
in nutrient ratios, chemical evidence of Mediterranean
ecosystem changes driven by human activity. Deep-Sea
Research II 49, 2007–2016.
Blain, S., Guieu, C., Claustre, H., Leblanc, K., Moutin, T.,
Queguiner, B., Ras, J., Sarthou, G., 2004. Availability of iron
and major nutrients for phytoplankton in the northeast
Atlantic Ocean. Limnology and Oceanography 49,
2095–2104.
Carbo, P., Krom, M.D., Homoky, W.B., Benning, L.G., Herut,
B., 2005. Impact of atmospheric deposition on N and P
geochemistry in the southeastern Levantine basin, this issue
[doi:10.1016/j.dsr2.2005.08.014].
Civitarese, G., Gacic, M., Vetrano, A., Boldrin, A., Bregant, D.,
Rabitti, S., Souvermezoglou, E., 1998. Biochemical fluxes
through the Strait of Otranto (Eastern Mediterranean).
Continental Shelf Research 18, 773–789.
Fagerbakke, K.M., Heldal, M., Norland, S., 1996. Content of
carbon, nitrogen, oxygen, sulfur and phosphorus in native
aquatic and cultured bacteria. Aquatic Microbial Ecology 10,
15–27.
Flaten, G.A.F., Skjoldal, E.F., Krom, M.D., Law, C.S.,
Mantoura, R.F.C., Pitta, P., Psarra, S., Tanaka, T.,
Tselepides, A., Woodward, E.M.S., Zohary, T., Thingstad,
T.F., 2005. Studies of the microbial P-cycle during a
Lagrangian phosphate-addition experiment in the Eastern
Mediterranean, this issue [doi:10.1016/j.dsr2.2005.08.010].
Goldman, J.C., 1993. Potential role of large oceanic diatoms in
new primary production. Deep-Sea Research 40, 159–168.
Guerzoni, S., Chester, R., Dulac, F., Moulin, C., Herut, B., Loye-
Pilot, M.D., Measures, C., Migon, C., Rossini, P., Saydam,
C., Soudine, A., Ziveri, P., 1999. The role of atmospheric
deposition in the biogeochemistry of the Mediterranean Sea.
Progress in Oceanography 44, 147–190.
Guieu, C., Loye-Pilot, M.D., Ridame, C., Thomas, C., 2002a.
Chemical characterization of the Saharan dust end-member:
some biogeochemical implications for the western Mediterra-
nean Sea. Journal of Geophysical Research—Atmospheres
107, 4250–4258.
Guieu, C., Bozec, Y., Blain, S., Ridame, C., Sarthou, G.,
Leblond, N., 2002b. Impact of high Saharan dust inputs on
dissolved iron concentrations in the Mediterranean Sea.
Geophysical Research Letters 29 (19), 1911 doi. 10.1029/
2001GL014454.
Heldal, M., Scanlan, D.J., Norland, S., Thingstad, F., Mann, N.H.,
2003. Elemental composition of single cells of various strains of
marine Prochlorococcus and Synechococcus using X-ray micro-
analysis. Limnology and Oceanography 48, 1732–1743.
Herut, B., Krom, M.D., Pan, M.D., Mortimer, R., 1999a.
Atmospheric input of nitrogen and phosphorus to the SE
Mediterranean, sources, fluxes and possible impact. Limnol-
ogy and Oceanography 44, 1683–1692.
Herut, B., Zohary, T., Robarts, R.D., Kress, N., 1999b.
Adsorption of dissolved phosphate onto Loess particles in
surface and deep Eastern Mediterranean waters. Marine
Chemistry 64, 253–265.
Herut, B., Nimmo, M., Medway, A., Chester, R., Krom, M.,
2001. Dry deposition of trace metals at the Mediterranean
coast of Israel (SE Mediterranean): sources and fluxes.
Atmospheric Environment 35, 803–813.
Herut, B., Collier, R., Krom, M.D., 2002. The role of dust in
supplying nitrogen and phosphorus to the South East
Mediterranean. Limnology and Oceanography 47, 870–878.
Ignatiades, L., Psarra, S., Zervakis, V., Pagou, K., Souverme-
zoglou, E., Assimakopoulou, G., Gotsis-Skretas, O., 2002.
Phytoplankton size-based dynamics in the Aegean Sea (East-
ern Mediterranean). Journal of Marine Systems 36, 11–28.
Klein, C., Dolan, J.R., Rassoulzadegan, F., 1997. Experimental
examination of the effects of rainwater on microbial commu-
nities in the surface layer of the NW Mediterranean Sea.
Marine Ecology Progress Series 158, 41–50.
Kouvarakis, G., Mihalopoulos, N., Tselipides, A., Stavrakakis, S.,
2001. On the importance of atmospheric inputs of inorganic
nitrogen species on the productivity of the Eastern Mediterra-
nean Sea. Global Biogeochemical Cycles 15, 805–817.
Kress, N., Herut, B., 2001. Spatial and seasonal evolution of
dissolved oxygen and nutrients in the Southern Levantine
Basin (Eastern Mediterranean Sea). Chemical characteriza-
tion of the water masses and inferences on the N:P ratios.
Deep-Sea Research I 48, 2347–2372.
Krom, M.D., Brenner, S., Kress, N., Gordon, L.I., 1991.
Phosphorus limitation of primary productivity in the E.
Mediterranean Sea. Limnology and Oceanography 36, 424–432.
Krom, M.D., Herut, B., Mantoura, F., 2004. Nutrient budget for
the Eastern Mediterranean, implications for P limitation.
Limnology and Oceanography 49, 1582–1592.
Krom, M.D., Woodward, E.M.S., Herut, B., Kress, N., Carbo,
P., Mantoura, R.F.C., Spyres, G., Thingstad, T.F., Wass-
mann, P., Wexels Riser, C., Kitidis, V., Law, C.S., Zodiatis,
G., 2005. Nutrient cycling in the south east Levantine basin of
the eastern Mediterranean: results from a phosphorus starved
system, this issue [doi:10.1016/j.dsr2.2005.08.009].
Lee, S., Fuhrman, J.A., 1987. Relationships between biovolume
and biomass of naturally derived marine bacterioplankton.
Applied and Environmental Microbiology 53, 1298–1303.
Lenes, J.M., Darrow, B.P., Cattrall, C., Heil, C.A., Callahan, M.,
Vargo, G.A., Byrne, R.H., Prospero, J.M., Bates, D.E.,
Fanning, K.A., Walsh, J.J., 2001. Iron fertilization and the
Trichodesmium response on the West Florida shelf. Limnol-
ogy and Oceanography 46, 1261–1277.
Li, W.K.W., Zohary, T., Yacobi, Y.Z., Wood, A.M., 1993.
Ultraphytoplankton in the Eastern Mediterranean Sea:
towards deriving phytoplankton biomass from flow cyto-
metric measurements of abundance, fluorescence and light
scatter. Marine Ecology Progress Series 102, 79–97.
Mann, E.L., Ahlgren, N., Moffett, J.W., Chisholm, S.W., 2002.
Copper toxicity and cyanobacteria ecology in the Sargasso
Sea. Limnology and Oceanography 47, 976–988.
Mantoura, R.F.C., Llewellyn, C.A., 1983. The rapid determina-
tion of algal chlorophyll and carotenoid pigments and their
breakdown products in natural waters by reversephase high
performance liquid chromatography. Analytical Chimica
Acta 151, 297–314.
Markaki, Z., Oikonomou, K., Kocak, M., Kouvarakis, G.,
Chaniotaki, A., Kubilay, N., Mihalopoulos, N., 2003.
Atmospheric deposition of inorganic phosphorus in the
Levantine basin, Eastern Mediterranean: spatial and temporal
variability and its role in seawater productivity. Limnology
and Oceanography 48, 1557–1568.
Migon, C., Sandroni, V., 1999. Phosphorus in rainwater:
partitioning, inputs and impact on the surface coastal ocean.
Limnology and Oceanography 44, 1160–1165.
ARTICLE IN PRESSB. Herut et al. / Deep-Sea Research II 52 (2005) 3024–30403040
Migon, C., Sadroni, V., Bethoux, J.-P., 2001. Atmospheric input
of anthropogenic phosphorus to the northwest Mediterranean
under oligotrophic conditions. Marine Environmental Re-
search 52, 413–426.
Mills, M.M., Ridame, C., Davey, M., LaRoche, J., Geider, R.J.,
2004. Iron and phosphorous co-limit nitrogen fixation in the
eastern tropical North Atlantic. Nature 429, 292–294.
Moore, L., Post, A., Rocap, G., Chisholm, S., 2002. Utilization
of different nitrogen sources the marine cyanobacteria
Prochlorococcus and Synechococcus. Limnology and Oceano-
graphy 47, 976–988.
Moutin, T., Thingstad, T., Van Wambeke, F., Marie, D., Slawyk,
G., Raimbault, P., Claustre, H., 2002. Does competition for
nanomolar phosphate supply explain the predominance of the
cyanobacterium Synechococcus? Limnology and Oceanogra-
phy 47, 1562–1567.
Palenik, B., Brahamsha, B., Larimer, F.W., Land, M., Hauser,
L., Chain, P., Lamerdin, J., Regala, W., Allen, E.E.,
McCarren, J., Paulsen, I., Dufresne, A., Partensky, F., Webb,
E.A., Waterbury, J., 2003. The genome of a motile marine
Synechococcus. Nature 424, 1037–1042.
Pan, G., Krom, D.M.D., Herut, B., 2002. Adsorption–desorption
of phosphate onto/from airborne dust and riverborne
particulates in East Mediterranean seawater. Environmental
Science and Technology 36, 3519–3524.
Pantoja, S., Repeta, D.J., Sachs, J.P., Sigman, D.M., 2002. Stable
isotope constraints on the nitrogen cycle of the Mediterranean
Sea water column. Deep-Sea Research I 49, 1609–1621.
Parsons, T., Takahashi, M., 1975. Biological Oceanographic
Processes. Pergamon Press, Oxford, 186pp.
Partensky, F., Hess, W.R., Vaulot, D., 1999. Prochlorococcus, a
marine photosynthetic prokaryote of global significance.
Microbial Molecular Biology Reviews 63, 106–127.
Pitta, P., Giannakourou, A., Christaki, U., 2001. Planktonic
ciliates in the oligotrophic Mediterranean Sea, longitudinal
trends of standing stocks, distributions and analysis of food
vacuole contents. Aquatic Microbial Ecology 24, 297–311.
Pitta, P., Stambler, N., Tanaka, T., Zohary, T., Tselepides, A.,
Rassoulzadegan, F., 2005. Biological response to P addition
in the Eastern Mediterranean Sea: the microbial race against
time, this issue [doi:10.1016/j.dsr2.2005.08.012].
Porter, K.G., Feig, Y.S., 1980. The use of DAPI for identifying
and counting aquatic microflora. Limnology and Oceanogra-
phy 25, 943–948.
Post, A., 2005. The genus Prochlorococcus. In: Dvorkin, M.,
Falko, S., Rosenberg, E., Schleifer, K.H., Stackebrandt, E.
(Eds.), The Prokaryotes. Springer, New York, NY.
Psarra, S., Tselepides, A., Ignatiades, L., 2000. Primary
productivity in the oligotrophic Cretan Sea (NE Mediterra-
nean): seasonal and interannual variability. Progress in
Oceanography 46, 187–204.
Psarra, S., Zohary, T., Krom, M.D., Mantoura, R.F.C.,
Polychronaki, T., Stambler, N., Tanaka, T., Tselepides,
A., Thingstad, T.F., 2005. Phytoplankton response to
a Lagrangian phosphate addition in the Levantine Sea
(Eastern Mediterranean), this issue [doi:10.1016/j.dsr
2.2005.08.015].
Ridame, C., Guieu, C., 2002. Saharan input of phosphate to the
oligotrophic water of the open western Mediterranean Sea.
Limnology and Oceanography 47, 856–869.
Rue, E., Bruland, K., 1995. Complexation of Fe(III) by natural
ligands in the central north Pacific as determined by a new
competitive ligand equilibrium/adsorptive cathodic voltam-
metry method. Marine Chemistry 50, 117–138.
Saydam, A.C., Senyuva, H.Z., 2002. Deserts: can they be the
potential suppliers of bioavailable iron? Geophysical Re-
search Letters 29 (11), 1524.
Simon, M., Azam, F., 1989. Protein content and protein synthesis
rates of planktonic marine bacteria. Marine Ecology Progress
Series 51, 201–213.
Smith, S., Azam, F., 1993. A simple economical method for
measuring bacterial protein synthesis rates using 3H leucine.
Marine Microbial Food Webs 6, 107–114.
Steemann-Nielsen, E., 1952. The use of radioactive carbon (14C)
for measuring organic production in the sea. Journal du
Conseil. Conseil International pour l’Exploration de la Mer.
18, 117–140.
Yentsch, C.S., Menzel, D.W., 1963. A method for the determina-
tion of phytoplankton chlorophyll and phaeophytin by
fluorescence. Deep-Sea Research 10, 221–231.
Zohary, T., Robarts, R.D., 1998. Experimental study of
microbial P-limitation in the Eastern Mediterranean. Limnol-
ogy and Oceanography 43, 387–395.
Zohary, T., Brenner, S., Krom, M.D., Angel, D., Kress, N., Li,
W.K.W., Neori, A., Yacobi, Y.Z., 1998. Buildup of
microbial biomass during deep winter mixing in a Mediterra-
nean warm-core eddy. Marine Ecology Progress Series 167,
47–57.
Zohary, T., Herut, B., Krom, M.D., Mantoura, R.F.C., Pitta, P.,
Psarra, S., Rassoulzadegan, F., Stambler, N., Tanaka, T.,
Thingstad, T.F., Woodward, E.M.S., 2005. P-limited bacteria
but N and P co-limited phytoplankton in the Eastern
Mediterranean—a microcosm experiment, this issue
[doi:10.1016/j.dsr2.2005.08.011].
Related Documents