Response of climate-growth relationships and water use efficiency to thinning in a Pinus nigra afforestation Darı ´o Martı ´n-Benito a,1, *, Miren Del Rı ´o a , Ingo Heinrich b,2 , Gerhard Helle b,2 , Isabel Can ˜ ellas a a Dpto. Sistemas y Recursos Forestales CIFOR-INIA, Ctra. La Corun ˜a, Km. 7.5, E-28040 Madrid, Spain b Helmholtz Centre Potsdam, GFZ German Research Centre for Geosciences Climate Dynamics and Landscape Evolution Section 5.2, Telegrafenberg C323, 14473 Potsdam, Germany 1. Introduction Radial growth of trees within forest stands greatly depends on the interactions between competition and environmental condi- tions (e.g. Piutti and Cescatti, 1997). Crown competition affects the space available for growth as well as the amount of light (energy) that a tree receives whereas root competition determines the amount of water and soil nutrients available for each tree. If water is a limiting resource, and it is predicted to become scarcer, one of the more important measure that forest managers have to modulate the influence of climate on tree growth within stands is by means of more or less intense thinning (e.g. Cescatti and Piutti, 1998) which would make more water available for the remaining trees. It has been generally considered that a reduction of density decreases global transpiration of the stand although individual tree transpiration might increase (Bre ´ da et al., 1995). Moreover, water availability usually increases as a result of thinning because of the reduction of crown interception or root competition (Sucoff and Hong, 1974; Bre ´ da et al., 1995; Misson et al., 2003). Density reductions also affect positively the amount of incident light, nutrients available (Blanco et al., 2005) as well as the temperature inside the stand (e.g. Tang et al., 2005). Positive effects of thinning on tree growth are therefore caused by the reduction of crown and belowground competition and to the concentration of potential growth in only a reduced number of selected individuals. Whether this growth acceleration is caused by an improvement of the hydric state of trees, an increase in energy (light) in the canopy or both depends on the interplay between the factors most limiting growth. In dry climates such as the Mediterranean, water availability is considered to be the main limiting factor (Specht, 1981). Although growth increases were reported after thinning without an increase in the water status of trees (Waring and Pitman, 1985), a reduction of water stress improves the general condition of trees (e.g. Kolb et al., 1998) and Forest Ecology and Management 259 (2010) 967–975 ARTICLE INFO Article history: Received 19 October 2009 Received in revised form 30 November 2009 Accepted 2 December 2009 Keywords: Tree-rings Stem growth Forest management Carbon and oxygen isotopes Black pine Competition ABSTRACT Thinning is the main forestry measure to increase tree growth by reducing stand tree density and competition for resources. A thinning experiment was established in 1993 on a 32-year-old Pinus nigra Arn. stand in central Spain. The response of growth, climate-growth relationships and intrinsic water use efficiency (WUEi) to a stand density reduction were compared between moderate thinned plots and a control plot by a combined analysis of basal area increments (BAI), and C and O stable isotope ratios (d 13 C c and d 18 O c ). BAI in the control plot showed a decreasing trend that was avoided by thinning in the thinned plot. Thinning also partially buffered tree-ring response to climate and trees were less sensitive to precipitation although more sensitive to temperature. D 13 C c in the thinned plot was not modified indicating that stomatal conductance (g) and photosynthetic capacity (A) did not change or change in the same direction. However, d 18 O c decreased in the control plot (unrelated to d 18 O of precipitation) but not in the thinned plot, suggesting a relative increase of temperature and irradiance and/or a decrease of air humidity after reducing the density consistent with an increase in A, g and BAI. As WUEi did not increase in the thinned plot, faster growth in this plot was caused by higher abundance of resources per tree. The trend of WUEi in both plots indicated low-moderate CO 2 -induced improvements. Thinning might be a useful adaptation measure against climate change in these plantations reducing their vulnerability to droughts. However, because WUEi was not affected, the positive growth response might be limited if droughts and warming continue and certain thresholds are exceeded. ß 2009 Elsevier B.V. All rights reserved. * Corresponding author. Tel.: +34 91 347 1461; fax: +34 91 347 6767. E-mail addresses: [email protected], [email protected] (D. Martı ´n-Benito). 1 Tel.: +34 91 347 1461. 2 Tel.: +49 0331 288 1915. Contents lists available at ScienceDirect Forest Ecology and Management journal homepage: www.elsevier.com/locate/foreco 0378-1127/$ – see front matter ß 2009 Elsevier B.V. All rights reserved. doi:10.1016/j.foreco.2009.12.001

Welcome message from author
This document is posted to help you gain knowledge. Please leave a comment to let me know what you think about it! Share it to your friends and learn new things together.
Transcript

Response of climate-growth relationships and water use efficiency to thinningin a Pinus nigra afforestation
Darıo Martın-Benito a,1,*, Miren Del Rıo a, Ingo Heinrich b,2, Gerhard Helle b,2, Isabel Canellas a
a Dpto. Sistemas y Recursos Forestales CIFOR-INIA, Ctra. La Coruna, Km. 7.5, E-28040 Madrid, Spainb Helmholtz Centre Potsdam, GFZ German Research Centre for Geosciences Climate Dynamics and Landscape Evolution Section 5.2, Telegrafenberg C323, 14473 Potsdam, Germany
Forest Ecology and Management 259 (2010) 967–975
A R T I C L E I N F O
Article history:
Received 19 October 2009
Received in revised form 30 November 2009
Accepted 2 December 2009
Keywords:
Tree-rings
Stem growth
Forest management
Carbon and oxygen isotopes
Black pine
Competition
A B S T R A C T
Thinning is the main forestry measure to increase tree growth by reducing stand tree density and
competition for resources. A thinning experiment was established in 1993 on a 32-year-old Pinus nigra
Arn. stand in central Spain. The response of growth, climate-growth relationships and intrinsic water use
efficiency (WUEi) to a stand density reduction were compared between moderate thinned plots and a
control plot by a combined analysis of basal area increments (BAI), and C and O stable isotope ratios
(d13Cc and d18Oc). BAI in the control plot showed a decreasing trend that was avoided by thinning in the
thinned plot. Thinning also partially buffered tree-ring response to climate and trees were less sensitive
to precipitation although more sensitive to temperature. D13Cc in the thinned plot was not modified
indicating that stomatal conductance (g) and photosynthetic capacity (A) did not change or change in the
same direction. However, d18Oc decreased in the control plot (unrelated to d18O of precipitation) but not
in the thinned plot, suggesting a relative increase of temperature and irradiance and/or a decrease of air
humidity after reducing the density consistent with an increase in A, g and BAI. As WUEi did not increase
in the thinned plot, faster growth in this plot was caused by higher abundance of resources per tree. The
trend of WUEi in both plots indicated low-moderate CO2-induced improvements. Thinning might be a
useful adaptation measure against climate change in these plantations reducing their vulnerability to
droughts. However, because WUEi was not affected, the positive growth response might be limited if
droughts and warming continue and certain thresholds are exceeded.
� 2009 Elsevier B.V. All rights reserved.
Contents lists available at ScienceDirect
Forest Ecology and Management
journa l homepage: www.e lsevier .com/ locate / foreco
1. Introduction
Radial growth of trees within forest stands greatly depends onthe interactions between competition and environmental condi-tions (e.g. Piutti and Cescatti, 1997). Crown competition affects thespace available for growth as well as the amount of light (energy)that a tree receives whereas root competition determines theamount of water and soil nutrients available for each tree. If wateris a limiting resource, and it is predicted to become scarcer, one ofthe more important measure that forest managers have tomodulate the influence of climate on tree growth within standsis by means of more or less intense thinning (e.g. Cescatti andPiutti, 1998) which would make more water available for theremaining trees.
* Corresponding author. Tel.: +34 91 347 1461; fax: +34 91 347 6767.
E-mail addresses: [email protected], [email protected]
(D. Martın-Benito).1 Tel.: +34 91 347 1461.2 Tel.: +49 0331 288 1915.
0378-1127/$ – see front matter � 2009 Elsevier B.V. All rights reserved.
doi:10.1016/j.foreco.2009.12.001
It has been generally considered that a reduction of densitydecreases global transpiration of the stand although individual treetranspiration might increase (Breda et al., 1995). Moreover, wateravailability usually increases as a result of thinning because of thereduction of crown interception or root competition (Sucoff andHong, 1974; Breda et al., 1995; Misson et al., 2003). Densityreductions also affect positively the amount of incident light,nutrients available (Blanco et al., 2005) as well as the temperatureinside the stand (e.g. Tang et al., 2005).
Positive effects of thinning on tree growth are therefore causedby the reduction of crown and belowground competition and tothe concentration of potential growth in only a reduced number ofselected individuals. Whether this growth acceleration is causedby an improvement of the hydric state of trees, an increase inenergy (light) in the canopy or both depends on the interplaybetween the factors most limiting growth. In dry climates such asthe Mediterranean, water availability is considered to be the mainlimiting factor (Specht, 1981). Although growth increases werereported after thinning without an increase in the water status oftrees (Waring and Pitman, 1985), a reduction of water stressimproves the general condition of trees (e.g. Kolb et al., 1998) and

D. Martın-Benito et al. / Forest Ecology and Management 259 (2010) 967–975968
increases growth rates of the remaining trees (Sucoff and Hong,1974; Donner and Running, 1986; Aussenac and Granier, 1988). Ifthis is the case, it could be recorded in tree-rings as a reduction(values becoming more negative) of the ratio between 13C and 12Cstable isotopes of carbon fixed in wood cellulose (d13C) (e.g.McDowell et al., 2003). Water stress causes stomata closure(Farquhar et al., 1989), reduces stomatal conductance for CO2 (g)and leads to higher proportion of 13C. However, in dense stands,such as those usually originating from afforestation, light mightalso be a limiting factor for growth even in high irradiance regions.Therefore in these cases, growth of thinned stands could beenhanced by increasing light availability which could ultimatelyenhance net assimilation (Warren et al., 2001).
According to the model of Farquhar et al. (1989) carbondiscrimination depends on stomatal conductance for CO2 (g) andon the photosynthetic carbon assimilation (A) as they both regulatethe partial pressure of CO2 in the leaf intercellular spaces (ci)calculated as
ci ¼ ca �A
g(1)
They both affect discrimination (D) expressed as
D ¼ aþ ðb� aÞ � ci
ca(2)
where a is the diffusion of carbon in air (4.4%) and b is the netfractionation in carboxylation by the enzyme ribulose bispho-sphate carboxylase/oxygenase (Rubisco; 27%), and ca the partialpressure of CO2 of the atmospheric air (Farquhar et al., 1982).The balance between g and A determines the changes in D13C(and in opposite direction of d13C). In general, A/g are inverselycorrelated with soil water availability, because g increases morethan A (e.g. Dupouey et al., 1993) but this process is also affectedby the higher irradiance and possible nutrient availability causedby thinning (e.g. Warren et al., 2001). Thus, a decrease of d13C(increase in D13C) can be caused by an increase of g or a decreaseof A relative to the other variable (Farquhar et al., 1989). In orderto distinguish between these two possible causes, Scheidegger etal. (2000) suggested the combined use of d13C and oxygenisotope ratio of organic matter (d18O). Variations in ci are inferredfrom d13C whereas changes in relative humidity are derived fromd18O because it depends on soil water isotope composition,temperature, and relative humidity (for a review see Yakir,1992).
The main objective of our study was to assess the growthreactions to thinning of trees in afforested stands of Pinus nigra Arn.using a combination of dendrochronological and stable isotopemethods. With this study we aim to evaluate whether the effect ofreducing the stand density (if any) is caused by an increase onwater availability as compared to the pre-thinning period and to acontrol plot or if water use efficiency is modified by lowercompetition.
Table 1Stand description values of the four plots during the four inventories analyzed. For the
Plot Stand density (trees ha�1) Basal area (m2 ha
1993 b.th.b 1993 a.th.b 1998 2003 2007 1993 b.th. 199
C1 Control 1600 – 1600 1580 1580 30.3 –
T1 Thinned 1590 1020 1020 1020 1020 31.9 22.5
C2 Control 1600 – 1590 1320 1310 31.4 –
T2 Thinned 1570 1150 1150 1150 1120 28.3 22.8
a DBH, diameter measured at breast height (1.30 m).b b.th. = before thinning; a.th. = after thinning.
2. Materials and methods
2.1. Study area and field sampling
Our study area was located in central Spain (latitude 418020N,longitude 038040W) at an altitude of 1050 masl. Trees were in apure even-aged P. nigra subs. Salzmanii var. hispanica standoriginating from afforestation at an initial stand density of1600 trees ha�1. The thinning experiment was composed of twocontrol plots (C1 and C2) with no thinning and two thinned plots(T1 and T2) where a moderate thinning from below (removing thetrees with smaller diameters) was applied in winter 1993–1994(trees were 31 years old) removing 28.5% of initial basal area in T1and 20.5% in T2 (Table 1). All plots have been inventoried fourtimes between 1993 and 2007 (Table 1).
In winter 2006–2007, we sampled 15 trees in three of the fourplots (T1, T2, and C1). Control plot C2 was left out of the studybecause of high natural mortality between 1998 and 2003 (Table1). Sampled trees were those which had a circumference (ki) withinthe range of average plot circumference (Ki) plus one standarddeviation (ki ¼ Ki þ SDi) (Misson et al., 2003). Two cores wereextracted from each tree with an increment borer, later mountedon wood boards and sanded. Total ring width (TRW) was measuredto the nearest 0.01 mm and registered in a computer using thesoftware TSAP (Rinn, 2003). Raw TRW series were visually andstatistically crossdated with TSAP by the Gleichlaufigkeit (sum ofequal slopes intervals in per cent), t-values and the cross-dateindex (CDI) which is a combination of both.
2.2. Dendrochronological approach
We derived series of yearly basal area increments (BAI) fromraw ring width assuming concentrically distributed tree-rings. BAIwere used instead of ring-width directly, because BAI is lessdependent on age and thus avoids the need of detrending (Biondi,1999) which could also remove low frequency variability, more sogiven the short time span of our series (1960–2006), such as thesudden reduction of stand density. However, we carried out a veryconservative detrending with a straight line equal the mean BAI ineach series. Basal area increment indices (IBAI) were obtained bydividing yearly BAI values by the mean value of BAI of each tree,IBAIi j ¼ BAIi j=BAI j, where BAIi is the basal area increment of year i
(i = 1970, 1994,. . ., 2007) of tree j, and BAI j is the mean yearly basalarea increment for tree j in the period 1993–2007.
2.3. Stable isotope and intrinsic water use efficiency analysis
Stable carbon and oxygen isotope analysis was performed on asubsample of five trees per plot whose tree-ring series mostresembled the plot tree-ring chronology from plots C1 and T1 inwhich the thinning was heavier. We analyzed rings for the period1986–2005 which corresponded to 8 years before and 12 yearsafter the thinning in order to explore the effect of thinning for alonger period of time. Complete dated rings (including both early-
first inventory, data before and after the thinning are presented.
�1) Mean DBHa (cm)
3 a.th. 1998 2003 2007 1993 b.th. 1993 a.th. 1998 2003 2007
34.4 38.5 39.0 15.4 – 16.4 17.4 17.5
26.4 30.2 32.6 15.8 16.6 18.0 19.3 20.0
35.1 33.8 35.3 15.6 – 16.5 17.8 18.3
26.4 30.0 31.7 14.9 15.7 17.0 18.1 18.8
D. Martın-Benito et al. / Forest Ecology and Management 259 (2010) 967–975 969
and latewood) were cut and detached with a sharp blade fromcores under a stereomicroscope to ensure no contamination fromadjacent rings. Wood was finely cut and holocellulose extractedfrom each separate ring following a standard procedure (Sohn andReiff, 1942).
From each sample (tree-ring) 250 � 25 mg of cellulose wereweighted in tin cups for carbon isotopes and silver cups for oxygen.These cups were combusted to CO2 for the determination of 13C/12C inan element analyzer (model NA 1500; Carlo Erba, Milan, Italia) andpyrolysed to CO for oxygen analysis using an elemental analyzerinterfaced to a continuous flow isotope ratio mass spectrometer(Micromass Optima). The 13C/12C and 18O/16O ratio of the resultingCO2 and CO were analyzed in an isotope ratio mass spectrometer(Thermoquest GmbH, Bremen, Germany) at the Institute of Chemistryand Dynamics of the Geosphere (ICG) Forschungszentrum Julich
(Julich, Germany). Carbon isotopic values were referred as d13Cc
relative to VPCB (Vienna Pee Dee belemnite) and later converted tocarbon isotope discrimination as
D ¼ d13Ca � d13Cc
� �= 1þ d13Cc=1000� �
(3)
where d13Cc is the isotopic ratio in wood cellulose and d13Ca theratio in atmospheric air (Farquhar et al., 1989). Oxygen valueswere expressed as d18Oc and referred to VSMOW (Vienna StandardMean Ocean Water).
Intrinsic water use efficiency (WUEi), the ratio between netcarbon assimilation in photosynthesis (A) and stomatal conduc-tance for water gw, (related to stomatal conductance for CO2 asgw = 1.6 g) is given by
WUEi ¼ A
gw
¼ ðca � ciÞ1:6
(4)
and is therefore proportional to (ca � ci). WUEi was estimated forthe control plot C1 and thinned plot T1. From Eqs. (2) and (4) itfollows that
WUEi ¼ ca � ðb�DÞ1:6 � ðb� aÞ (5)
from discrimination values (D) in our trees and the partialpressure of CO2 of the atmospheric air ca taken from McCarroll andLoader (2004). In order to investigate the temporal trend of WUEiand analyze the possible driving factors (CO2 rising concentra-tions and/or the effect of thinning) we also estimated theoreticalWUEi from the three scenarios in Saurer et al. (2004) whoconsidered:
1. c
i is kept constant and thus ci/ca and D must decrease so d13Ccand WUEi would strongly increase.
2. c i/ca and thus D remain constant because d13Cc decreasesparallel to d13Ca. WUEi increases but not as strongly as inscenario 1.
3. c
a � ci is constant because ci increases exactly as much as ca andWUEi does not increase. This would be reflected by a strongerdecrease of d13Cc than d13Ca.For all three scenarios, the initial ci value for the calculation ofWUEi was estimated from Eqs. (4) and (5) and D at year 1986which was the first tree-ring analyzed (e.g. Saurer et al., 2004).This initial value affects the initial level of WUEi but not its trendand thus allows for the analysis of the evolution of WUEi.
2.4. Climate data
Monthly values of precipitation and temperature from twometeorological stations within 4 km of the sample site wereprovided by the Spanish National Meteorological Agency (AEMET)
for the period 1970–2006. Missing data from the closest station(‘‘Embalse de Alcorlo’’; 418000N, 038010W, 880 masl) were com-pleted by simple linear regression with the farthest station(‘‘Embalse del Vado’’; 418000N, 038170W, 980 masl). Mean annualprecipitation and temperature for the period 1970–2006 were663 mm and 11.3 8C, respectively, and the annual dry season lastedfrom July to September. Seasonal values of climate variables werecalculated from monthly data: winter (win, previous December toFebruary), spring (spr, March to May), summer (sum, June toAugust), autumn (aut, September to November), year (y, January toDecember), and hydrological year (9–6, previous September toJune). In addition, we estimated monthly and seasonal values ofd18O of rain with the model
d18
Orain ¼ 0:42T � 0:007T2 � 26:8P
1000
� �þ 112
P
1000
� �2
� 0:046
� Z0:5 � 8:26
developed for the Mediterranean region of Spain by Ferrio andVoltas (2005) where T (in 8C) and P (in mm) are mean monthlytemperature and precipitation respectively, and Z (in m) is thealtitude of the site.
2.5. Climate model
In order to separate the effects of climate from those of reducingstand density, we used the tree-ring chronology from the controlplot C1 where the studied factor (i.e. thinning) is not present butthat has the same climate signal (e.g. Knapp et al., 2001; Misson etal., 2003). We developed a multiple linear regression model for BAIwith a forward selection of climate variables (mean temperaturesand total precipitation for individual months and differentperiods). Multicolinearity between independent variables waschecked on the final model and no significant (p < 0.05) correla-tions were observed. By estimating residuals from this model(BAIobserved � BAIpredicted) the climatic signal recorded in the BAIseries can be removed but keeping the rest of the informationrecorded in the rings such as the effect of thinning.
2.6. Statistical analyses
The responses of BAI to thinning and residuals from the climatemodel were analyzed using a repeated measures analysis ofvariance with a first order autocorrelation structure and hetero-geneous variances in the variance–covariance matrix in whichplots were considered as groups and periods before (1982–1993)and after thinning (1994–2005) were used as repeated measures.Carbon and oxygen isotopes were similarly tested but periodsbefore and after thinning were different (1986–1993 and 1994–2005, respectively). These periods were also used to calculate therelationship between IBAI or isotopes and climate data. Allstatistical analyses were carried out in R (R Development CoreTeam, 2008).
3. Results
Stand basal area before thinning was higher in the thinned plotT1 (31.9 m2 ha�1) than in the other plots whereas that of thinnedplot T2 was lowest (28.3 m2 ha�1) (Table 1). After thinning standbasal area was reduced by 28% and 20% in T1 and T2 respectively sosimilar basal area after thinning were left in both plots (22.5 and22.8 m2 ha�1, respectively) (Table 1). By the end of the periodanalyzed (2007) both thinned plots exceeded their initial basalarea but were lower than that of the control plot C1 used forcomparison. Mean diameter was however higher in T1 followed byT2 as a consequence of thinning.

Table 2Correlation coefficients among and between basal area increment indices (IBAI) in
control plot (C1) and thinned plots (T1 and T2) before and after thinning.
Before thinning 1980–1993 After thinning 1994–2006
C1–C1a 0.78 0.72
T1–T1a 0.86 0.67
T2–T2a 0.72 0.61
C1–T1 0.81 0.68
C1–T2 0.76 0.67
T1–T2 0.77 0.63
a Denotes mean correlation coefficient among all individual series within the
same plot.
Table 3Mean (standard error) of basal area increments (BAI), carbon discrimination
(D13Cc), and oxygen isotope ratio (d18Oc). Note that the length of the period before
thinning varies between BAI and isotope discrimination variables. In all cases n = 5.
Columns and rows within the same variable with different letters are significantly
different in a repeated measures ANOVA Tukey’s test (p<0.05).
Plot Basal area increments (mm2 year�1)
Before (1982–1993) After (1994–2005)
C1 414.77 (13.48) b 333.62 (15.01) a
T1 575.60 (14.16) c 587.47 (19.43) c
T2 421.52 (14.50) b 379.48 (13.32) ab
Plot Basal area increments (mm2 year�1)
Before (1986–1993) After (1994–2005)
D13Cc (%)
C1 16.11 (0.10) a 16.06 (0.05) a
T1 15.11 (0.16) b 15.11 (0.08) b
d18Oc (%)
C1 33.72 (0.17) a 33.17 (0.14) b
T1 34.34 (0.11) c 34.29 (0.13) c
D. Martın-Benito et al. / Forest Ecology and Management 259 (2010) 967–975970
3.1. Basal area increments
In general, BAI and IBAI in all plots crossdated well butcorrelations between IBAI of plots were higher for the periodbefore thinning (1980–1993) than after thinning (1994–2006) inall cases (Table 2; Fig. 1). At plot T1 (higher reduction of basalarea), mean BAI of trees increased for some years after thinning.However, BAI of trees in T1 for the entire periods before and afterthinning (11 years in both cases) showed no significant differences,whereas trees in plot C1 experienced a significant decrease in theirBAI for the same periods. Therefore, differences between BAI inboth plots were higher after 1993 (Table 3). The greater differencebetween both plots was reached in 1995 and 1996 when growth oftrees in T1 was more than 100% higher than those in the controlplot. However, growth at plot T2 was slightly but not significantlyhigher after 1993 than in plot C1 (Fig. 1 and Table 3) and it alsodecreased compared to the period before thinning.
3.2. C and O stable isotopes
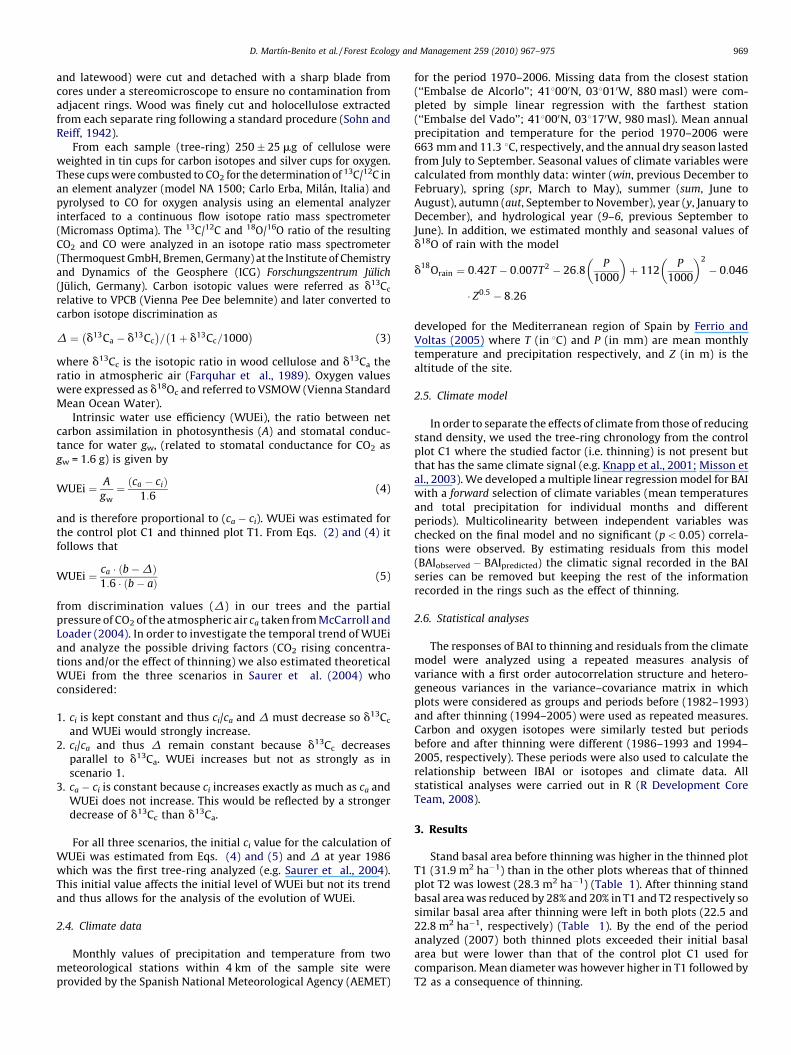
Time series of carbon isotopic discrimination D13Cc weresynchronous between plots C1 and T1 and differences betweenplots remained constant from 1986 to 2005 (Fig. 2) although plot C1showed significant higher D values than plot T1 for all years studied(Table 3). However, we observed no significant modification ofD13Cc associated with increased BAI in T1 during the 12 yearsanalyzed after thinning (Table 3). d13Cc ranged between �23.1%and �21.6% in C1 and between �22.3% and �20.7% in T1.
For oxygen isotope composition, thinned plot T1 showed highervalues of d18Oc than C1 when the 20 years analyzed were takentogether (Fig. 2). These differences increased after thinningbecause d18Oc of control trees decreased more rapidly(r = �0.43; p < 0.001; Fig. 2) than that of trees in T1 (r = �0.25;p = 0.01; Fig. 2). In fact, in the control plot C1 d18Oc values after
Fig. 1. Annual basal area increment (BAI; mean with standard errors) per tree for
control plot (C1), and thinned plots (T1 and T2). The dashed line indicates the date of
thinning. Bars represent standard errors.
1993 were significantly lower than before while those in T1 werenot significantly different (Table 3). d18Orain showed no trendduring these same periods (Fig. 2).
Correlation between yearly values of carbon and oxygen isotoperatios was not significant in any of the plots (results not shown).However, a strong negative d13Cc–d18Oc correlation was found forboth plots considering 4-year mean values (Fig. 3). The same wasevidenced for basal area increment index (IBAI) and d13Cc whereasd18Oc positively correlated with IBAI (Fig. 3). Results of these threeanalyses for the period before 1993 and after 1993 showed thesame relationships.
3.3. Climate model and relationships with climate
Since 1970, warming temperature was evident in the area.Spring and summer temperature increased by 0.073 8C year�1
Fig. 2. Carbon isotope discrimination D13C (top) and oxygen isotope ratio d18O
(bottom) in the control plot and thinned plot T1. Mean yearly value of estimated
d18O of rain is also shown in the bottom graph (see text for calculation). Each point
represents the mean value of 5 trees. Bars represent standard errors. The vertical
dashed line indicates the date of thinning (1993).
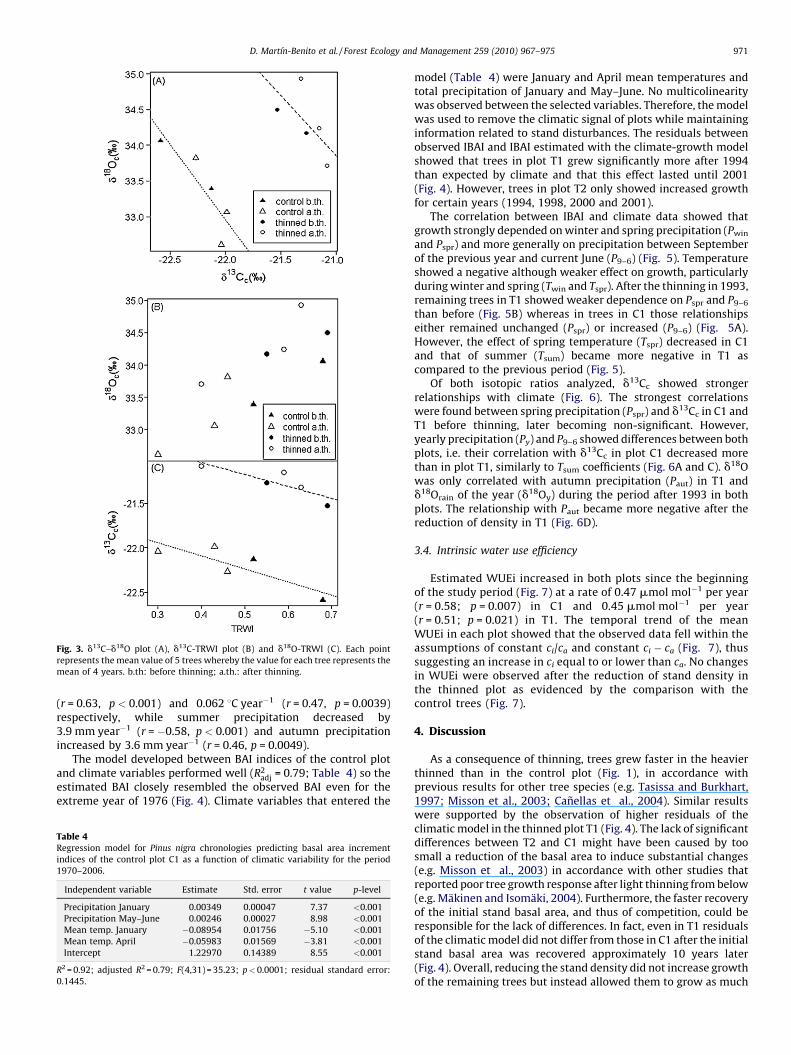
Fig. 3. d13C–d18O plot (A), d13C-TRWI plot (B) and d18O-TRWI (C). Each point
represents the mean value of 5 trees whereby the value for each tree represents the
mean of 4 years. b.th: before thinning; a.th.: after thinning.
D. Martın-Benito et al. / Forest Ecology and Management 259 (2010) 967–975 971
(r = 0.63, p < 0.001) and 0.062 8C year�1 (r = 0.47, p = 0.0039)respectively, while summer precipitation decreased by3.9 mm year�1 (r = �0.58, p < 0.001) and autumn precipitationincreased by 3.6 mm year�1 (r = 0.46, p = 0.0049).
The model developed between BAI indices of the control plotand climate variables performed well (R2
adj = 0.79; Table 4) so theestimated BAI closely resembled the observed BAI even for theextreme year of 1976 (Fig. 4). Climate variables that entered the
Table 4Regression model for Pinus nigra chronologies predicting basal area increment
indices of the control plot C1 as a function of climatic variability for the period
1970–2006.
Independent variable Estimate Std. error t value p-level
Precipitation January 0.00349 0.00047 7.37 <0.001
Precipitation May–June 0.00246 0.00027 8.98 <0.001
Mean temp. January �0.08954 0.01756 �5.10 <0.001
Mean temp. April �0.05983 0.01569 �3.81 <0.001
Intercept 1.22970 0.14389 8.55 <0.001
R2 = 0.92; adjusted R2 = 0.79; F(4,31) = 35.23; p<0.0001; residual standard error:
0.1445.
model (Table 4) were January and April mean temperatures andtotal precipitation of January and May–June. No multicolinearitywas observed between the selected variables. Therefore, the modelwas used to remove the climatic signal of plots while maintaininginformation related to stand disturbances. The residuals betweenobserved IBAI and IBAI estimated with the climate-growth modelshowed that trees in plot T1 grew significantly more after 1994than expected by climate and that this effect lasted until 2001(Fig. 4). However, trees in plot T2 only showed increased growthfor certain years (1994, 1998, 2000 and 2001).
The correlation between IBAI and climate data showed thatgrowth strongly depended on winter and spring precipitation (Pwin
and Pspr) and more generally on precipitation between Septemberof the previous year and current June (P9–6) (Fig. 5). Temperatureshowed a negative although weaker effect on growth, particularlyduring winter and spring (Twin and Tspr). After the thinning in 1993,remaining trees in T1 showed weaker dependence on Pspr and P9–6
than before (Fig. 5B) whereas in trees in C1 those relationshipseither remained unchanged (Pspr) or increased (P9–6) (Fig. 5A).However, the effect of spring temperature (Tspr) decreased in C1and that of summer (Tsum) became more negative in T1 ascompared to the previous period (Fig. 5).
Of both isotopic ratios analyzed, d13Cc showed strongerrelationships with climate (Fig. 6). The strongest correlationswere found between spring precipitation (Pspr) and d13Cc in C1 andT1 before thinning, later becoming non-significant. However,yearly precipitation (Py) and P9–6 showed differences between bothplots, i.e. their correlation with d13Cc in plot C1 decreased morethan in plot T1, similarly to Tsum coefficients (Fig. 6A and C). d18Owas only correlated with autumn precipitation (Paut) in T1 andd18Orain of the year (d18Oy) during the period after 1993 in bothplots. The relationship with Paut became more negative after thereduction of density in T1 (Fig. 6D).
3.4. Intrinsic water use efficiency
Estimated WUEi increased in both plots since the beginningof the study period (Fig. 7) at a rate of 0.47 mmol mol�1 per year(r = 0.58; p = 0.007) in C1 and 0.45 mmol mol�1 per year(r = 0.51; p = 0.021) in T1. The temporal trend of the meanWUEi in each plot showed that the observed data fell within theassumptions of constant ci/ca and constant ci � ca (Fig. 7), thussuggesting an increase in ci equal to or lower than ca. No changesin WUEi were observed after the reduction of stand density inthe thinned plot as evidenced by the comparison with thecontrol trees (Fig. 7).
4. Discussion
As a consequence of thinning, trees grew faster in the heavierthinned than in the control plot (Fig. 1), in accordance withprevious results for other tree species (e.g. Tasissa and Burkhart,1997; Misson et al., 2003; Canellas et al., 2004). Similar resultswere supported by the observation of higher residuals of theclimatic model in the thinned plot T1 (Fig. 4). The lack of significantdifferences between T2 and C1 might have been caused by toosmall a reduction of the basal area to induce substantial changes(e.g. Misson et al., 2003) in accordance with other studies thatreported poor tree growth response after light thinning from below(e.g. Makinen and Isomaki, 2004). Furthermore, the faster recoveryof the initial stand basal area, and thus of competition, could beresponsible for the lack of differences. In fact, even in T1 residualsof the climatic model did not differ from those in C1 after the initialstand basal area was recovered approximately 10 years later(Fig. 4). Overall, reducing the stand density did not increase growthof the remaining trees but instead allowed them to grow as much

Fig. 4. Basal area increment index (IBAI) observed and predicted with the climate model developed (Table 4) for control plot C1 (A; R2 = 0.79, p < 0.001). Predicted IBAI
compared to observed IBAI in thinned plots T1 (B) and T2 (D), and residuals (C) and (E), respectively. The vertical dashed line indicates the date of thinning. Note that x-scale
varies in figures C and E to show detail.
D. Martın-Benito et al. / Forest Ecology and Management 259 (2010) 967–975972
as before thinning whereas maintaining the original densitycaused trees to grow less (Figs. 1 and 4; Table 3).
In the Mediterranean climate, water stress is considered to bethe most limiting resource for plant growth (Specht, 1981) but athigh stand densities, or in understory plants, shade addsadditional stress (e.g. Valladares and Pearcy, 2002). Our resultssupport in part the hypothesis that reducing the density reducesthe stress in trees in a stand where both light and water might belimiting factors. After the thinning, trees in the thinned plotshowed lower correlations with precipitation than before thethinning while in trees of the control plot it increased or remainedconstant (Fig. 5) as shown for other species (Cescatti and Piutti,1998). However, correlation with summer temperature was morenegative after thinning in T1 (Fig. 5), probably as a consequence ofhigher irradiance reaching the crowns of remaining trees andhigher summer temperatures inside the stand. This was alsoevidenced by the decoupling of residuals in the most stronglythinned plot as compared to either the control or the lowestthinned plot (Fig. 4).
The relationship between d13Cc and precipitation showed a lessclear trend (Fig. 6A and C). Correlation decreased more in C1 than
in T1 during the period 1994–2005 as compared to 1985–1993,suggesting that water stress changed little in T1 after thinning. Thislower response in T1 was most likely caused by higher growthrates and temperatures and thus greater evaporative demandcoupled with higher water availability. Tree-ring width and d13Cc
are known to be controlled by different climate variables or by thesame variables but at different times and therefore to containdifferent climatic information (McCarroll and Loader, 2004) whichcould explain these differing results between d13Cc and tree-ringwidth. The climatic signal was less clear in d18Oc which was mostlyaffected by d18Oy indicating that the isotopic signal of rain waterwas mainly maintained. However, d18Oc in T1 showed a morenegative correlation with autumn precipitation after thinning thanbefore, while in C1 did not change; in accordance with resultssuggesting that relative humidity in C1 was higher because of acloser canopy (see below).
We found a negative relationship between d13Cc and d18Oc aftertaking a 4-year mean (Fig. 3) in opposition to results for Picea abies
L., Pinus sylvestris L. (Saurer et al., 1997a) and three other conifers(Marshall and Monserud, 2006) and could point towards a limitedoperational range of stomata (Scheidegger et al., 2000) in the
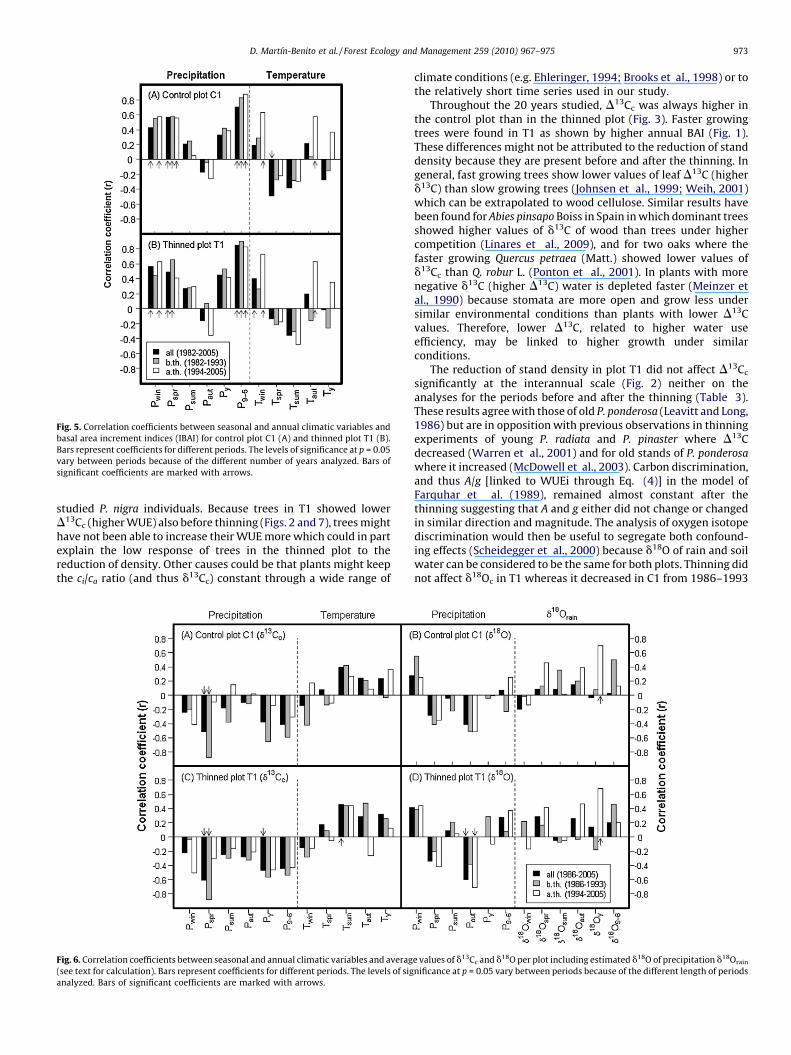
Fig. 5. Correlation coefficients between seasonal and annual climatic variables and
basal area increment indices (IBAI) for control plot C1 (A) and thinned plot T1 (B).
Bars represent coefficients for different periods. The levels of significance at p = 0.05
vary between periods because of the different number of years analyzed. Bars of
significant coefficients are marked with arrows.
D. Martın-Benito et al. / Forest Ecology and Management 259 (2010) 967–975 973
studied P. nigra individuals. Because trees in T1 showed lowerD13Cc (higher WUE) also before thinning (Figs. 2 and 7), trees mighthave not been able to increase their WUE more which could in partexplain the low response of trees in the thinned plot to thereduction of density. Other causes could be that plants might keepthe ci/ca ratio (and thus d13Cc) constant through a wide range of
Fig. 6. Correlation coefficients between seasonal and annual climatic variables and averag
(see text for calculation). Bars represent coefficients for different periods. The levels of sig
analyzed. Bars of significant coefficients are marked with arrows.
climate conditions (e.g. Ehleringer, 1994; Brooks et al., 1998) or tothe relatively short time series used in our study.
Throughout the 20 years studied, D13Cc was always higher inthe control plot than in the thinned plot (Fig. 3). Faster growingtrees were found in T1 as shown by higher annual BAI (Fig. 1).These differences might not be attributed to the reduction of standdensity because they are present before and after the thinning. Ingeneral, fast growing trees show lower values of leaf D13C (higherd13C) than slow growing trees (Johnsen et al., 1999; Weih, 2001)which can be extrapolated to wood cellulose. Similar results havebeen found for Abies pinsapo Boiss in Spain in which dominant treesshowed higher values of d13C of wood than trees under highercompetition (Linares et al., 2009), and for two oaks where thefaster growing Quercus petraea (Matt.) showed lower values ofd13Cc than Q. robur L. (Ponton et al., 2001). In plants with morenegative d13C (higher D13C) water is depleted faster (Meinzer etal., 1990) because stomata are more open and grow less undersimilar environmental conditions than plants with lower D13Cvalues. Therefore, lower D13C, related to higher water useefficiency, may be linked to higher growth under similarconditions.
The reduction of stand density in plot T1 did not affect D13Cc
significantly at the interannual scale (Fig. 2) neither on theanalyses for the periods before and after the thinning (Table 3).These results agree with those of old P. ponderosa (Leavitt and Long,1986) but are in opposition with previous observations in thinningexperiments of young P. radiata and P. pinaster where D13Cdecreased (Warren et al., 2001) and for old stands of P. ponderosa
where it increased (McDowell et al., 2003). Carbon discrimination,and thus A/g [linked to WUEi through Eq. (4)] in the model ofFarquhar et al. (1989), remained almost constant after thethinning suggesting that A and g either did not change or changedin similar direction and magnitude. The analysis of oxygen isotopediscrimination would then be useful to segregate both confound-ing effects (Scheidegger et al., 2000) because d18O of rain and soilwater can be considered to be the same for both plots. Thinning didnot affect d18Oc in T1 whereas it decreased in C1 from 1986–1993
e values of d13Cc and d18O per plot including estimated d18O of precipitation d18Orain
nificance at p = 0.05 vary between periods because of the different length of periods

Fig. 7. Intrinsic water use efficiency (WUEi) for the control plot C1 (top) and thinned plot T1 (bottom) (bold lines). WUEi was estimated using Eq. (4). For the three scenarios
considered [constant ci, constant ci/ca, and constant ca � ci] (Saurer et al., 2004), it was estimated with Eq. (4) and the initial ci value for year 1986 (see text) and ca taken from
McCarroll and Loader (2004).
D. Martın-Benito et al. / Forest Ecology and Management 259 (2010) 967–975974
to 1994–2005 (Fig. 2 and Table 3) which was unrelated toprecipitation d18O (Fig. 6B). Therefore, maintaining the originaldensity as the trees aged and crowns expanded would reducetemperatures and/or increase the relative humidity within thecontrol stand because d18O increases in leaves with highertemperature and lower relative humidity (Dongmann et al.,1974; Yakir, 1992) which is reflected in wood cellulose (Gray andThompson, 1976). However, the effect of crown closing on theisotopic ratio of soil water, because of differential enrichment ascompared to rain water, cannot be ruled out and its role remainsunclear.
These results would suggest that (i) the temperature and relativehumidity would have also changed in T1 had it not been thinned and(ii) that although the soil water content, and consequently tree waterstatus, might have increased as a consequence of thinning in T1,crowns of remaining trees in the stand would be more exposed tolight, warmer temperatures and/or dryer air. This new conditionswould have a positive impact on A (photosynthetic carbonassimilation) in a young pine stand (Ehleringer et al., 1986;McDowell et al., 2003; Skov et al., 2004). In order to keep A/gconstant, g would have to increase in a similar way in T1 after thethinning (Skov et al., 2004) thus indicating higher water availability.Similar results of increased growth with unchanged d13Cc werereported by Saurer et al. (1997b) and explained as the balancebetween increased light (which would increase d13Cc) simulta-neously with increased water availability (which would decreased13Cc) which have non-independent effects on carbon discrimina-tion (Retuerto et al., 2000). This would be accompanied by a nearlyconstant ci in relation to ca (constant ci/ca) thus keeping D13Cc
unchanged. Therefore, water use efficiency (directly related to A/g)would have not increased in T1 as a consequence of thinning(Warren et al., 2001). Thus, it seems probable that the avoidance of
BAI decline in T1 after thinning (contrary to the observed decline inC1) was not the result of an increase in the WUEi caused by thinningbut a consequence of more resources (water, light, and nutrients)being available for each individual.
Furthermore, our results of WUEi (Fig. 7) corresponded to thosebetween scenarios where ci/ca and ca � ci were held constant(Saurer et al., 2004) and thus were similar to those obtained for A/gcomparison, similar to results reported for P. nigra in SoutheasternSpain (Andreu, 2007). The situation of constant ci/ca seems to bethe most common response in many trees of boreal forests (Saureret al., 2004) and other tree species (Linares et al., 2009) whichwould imply a general weak increase in WUEi induced by CO2
increments or no change in WUEi (constant ca � ci) as found inconifers in the USA (Marshall and Monserud, 1996). Therefore ourresults suggest that the response in WUEi to increasing CO2
concentration in these forests is weak to moderate and thatreducing the density of the stands has no effect on WUEi of treesand probably of the entire plantation as shown for young stands ofponderosa pine (e.g. Misson et al., 2005).
5. Conclusions
Response of growth to climate in black pine was affected byintraspecific competition. Our moderate-low thinning from belowproduced higher tree growth compared to a control plot (wheretree growth declined) although not higher than during previousyears in the same plot. An increase of resources per individual treeappeared as the most probable cause of the observed reaction tothinning rather than an optimization on the use of these resources.Using a combination of tree-ring width and isotopic ratios ofcarbon and oxygen showed that WUEi was not increased in thethinned plot although sensitivity to climate was buffered.

D. Martın-Benito et al. / Forest Ecology and Management 259 (2010) 967–975 975
Modification of water and light availability was recorded in D13Cc
and d18Oc which showed that maintaining the original standdensity might increase plot relative humidity and decrease inside-stand air temperature. Therefore, forest managers should considerthinning as an adaptation measure to reduce stand vulnerability toclimate change in these plantations. However, the positive growthresponse to thinning can be limited if droughts and warmingexceed certain thresholds because WUEi was not improved.
Acknowledgments
We would like to thank Angel Bachiller, Concepcion Ortega, andEstrella Viscasillas for their field assistance and to Miguel SanchezSanchez (CIEMAT, Spain) and Carmen Burger (GFZ Potsdam,Germany). This study was partially funded by the research projectsOT-03-002 and SUM2008-00002-00-00. Instituto Nacional deInvestigaciones Agrarias y Alimentarias (INIA) provided a doctoralgrant to D. Martin-Benito. We also thank two anonymousreviewers whose comments greatly improved the manuscript.
References
Andreu, L., 2007. Climate and Atmospheric CO2 Effects on Iberian Pine ForestsAssessed by Tree-Ring Chronologies and their Potential for Climatic Reconstruc-tions/Efectes del clima i del CO2 atmosferic en pinedes iberiques avaluatsmitjancant cronologies d’anells dels arbres i el seu potencial per reconstruir elclima. Deparatment d’Ecologia, Universitat de Barcelona, Barcelona, pp. 37–57.
Aussenac, G., Granier, A., 1988. Effects of thinning on water stress and growth inDouglas-fir. Can. J. For. Res. 18, 100–105.
Biondi, F., 1999. Comparing tree-ring chronologies and repeated timber inventoriesas forest monitoring tools. Ecol. Appl. 9 (1), 216–227.
Blanco, J.A., Zavala, M.A., Imbert, J.B., Castillo, F.J., 2005. Sustainability of forestmanagement practices: evaluation through a simulation model of nutrientcycling. For. Ecol. Manage. 213 (1–3), 209–228.
Breda, N., Granier, A., Aussenac, G., 1995. Effects of thinning on soil and tree waterrelations, transpiration and growth in an oak forest (Quercus petraea (Matt.)Liebl.). Tree Physiol. 15, 295–306.
Brooks, J.R., Flanagan, L.B., Ehleringer, J.R., 1998. Responses of boreal conifers toclimate fluctuations: indications from tree-ring widths and carbon isotopeanalyses. Can. J. For. Res. 28, 524–533.
Canellas, I., Rıo, M.D., Roig, S., Montero, G., 2004. Growth response to thinning inQuercus pyrenaica Willd. coppice stands in Spanish central mountain. Ann. For.Sci. 61 (3), 243–250.
Cescatti, A., Piutti, E., 1998. Silvicultural alternatives, competition regime andsensitivity to climate in a European beech forest. For. Ecol. Manage. 102 (2),213–223.
Dongmann, G., Nurnberg, H.W., Forstel, H., Wagener, K., 1974. On the enrichment ofH2
18O in the leaves of transpiring plants. Radiat. Environ. Biophys. 11, 41–52.Donner, B.L., Running, S.W., 1986. Water stress response after thinning Pinus
contorta stands in Montana. For. Sci. 32 (3), 614–625.Dupouey, J.L., Leavitt, S.W., Choisnel, E., Jourdain, S., 1993. Modelling carbon isotope
fractionation in tree rings based on effective evapotranspiration and soil waterstatus. Plant Cell Environ. 16, 939–947.
Ehleringer, J.R., 1994. Variation in gas exchange characteristics among desert plants.In: Schulze, E.-D., Caldwell, M.M. (Eds.), Ecophysiology of Photosynthesis.Springer, Berlin, Heidelberg, New York, pp. 361–392.
Ehleringer, J.R., Field, C.B., Lin, Z.-f., Kuo, C.-y., 1986. Leaf carbon isotope and mineralcomposition in subtropical plants along an irradiance cline. Oecologia 70 (4),520–526.
Farquhar, G.D., Ehleringer, J.R., Hubick, K.T., 1989. Carbon isotope discriminationand photosynthesis. Annu. Rev. Plant Physiol. Plant Mol. Biol. 40, 503–537.
Farquhar, G.D., O’Leary, M.H., Berry, J.A., 1982. On the relationship between carbonisotope discrimination and the intercellular carbon dioxide concentration inleaves. Aust. J. Plant Physiol. 9, 121–137.
Ferrio, J.P., Voltas, J., 2005. Carbon and oxygen isotope ratios in wood constituents ofPinus halepensis as indicators of precipitation, temperature and vapour pressuredeficit. Tellus B 57 (2), 164–173.
Gray, J., Thompson, P., 1976. Climatic information from 18O/16O ratios of cellulose intree rings. Nature 262, 481–482.
Johnsen, K.H., Flanagan, L.B., Huber, D.A., Major, J.E., 1999. Genetic variation ingrowth, carbon isotope discrimination, and foliar N concentration in Piceamariana: analyses from a half-diallel mating design using field-grown trees.Can. J. For. Res. 29, 1727–1735.
Knapp, P.A., Soule, P.T., Grissino-Mayer, H.D., 2001. Detecting potential regionaleffects of increased atmospheric CO2 on growth rates of western juniper. GlobalChange Biol. 7 (8), 903–917.
Kolb, T.E., Holmberg, K.M., Wagner, M.R., Stome, J.E., 1998. Regulation of ponderosapine foliar physiology and insect resistance mechanisms by basal area treat-ments. Tree Physiol. 18, 375–381.
Leavitt, S.W., Long, A., 1986. Influence of site disturbance on d13C isotopic timeseries from tree rings. In: Proceedings of the International Symposium ofEcological Aspects of Tree-Ring Analysis, Tarrytown, NY, pp. 119–129.
Linares, J.-C., Delgado-Huertas, A., Camarero, J.J., Merino, J., Carreira, J.A., 2009.Competition and drought limit the response of water-use efficiency to risingatmospheric carbon dioxide in the Mediterranean fir Abies pinsapo. Oecologia161 (3), 611–624.
Makinen, H., Isomaki, A., 2004. Thinning intensity and growth of Scots pine stands inFinland. For. Ecol. Manage. 201 (2–3), 311–325.
Marshall, J.D., Monserud, R.A., 1996. Homeostatic gas-exchange parameters in-ferred from 13C/12C in tree rings of conifers. Oecologia 105, 13–21.
Marshall, J.D., Monserud, R.A., 2006. Co-occurring species differ in tree-ring d18Otrends. Tree Physiol. 26, 1055–1066.
McCarroll, D., Loader, N.J., 2004. Stable isotopes in tree rings. Isotopes in QuaternaryPaleoenvironmental Reconstruction 23 (7–8), 771–801.
McDowell, N., Brooks, J.R., Fitzgerald, S.A., Bond, B.J., 2003. Carbon isotope discrim-ination and growth response of old Pinus ponderosa trees to stand densityreductions. Plant Cell Environ. 26, 631–644.
Meinzer, F.C., Goldstein, G., Grantz, D.A., 1990. Carbon isotope discrimination incoffee genotypes grown under limited water supply. Plant Physiol. 92, 130–135.
Misson, L., Antoine, N., Guiot, J., 2003. Effects of thinning intensities on droughtresponse in Norway spruce (Picea abies (L.) Karst.). For. Ecol. Manage. 183, 47–60.
Misson, L., Tang, J., Xu, M., McKay, M., Goldstein, A., 2005. Influences of recoveryfrom clear-cut, climate variability, and thinning on the carbon balance of ayoung ponderosa pine plantation. Agric. For. Meteorol. 130, 207–222.
Piutti, E., Cescatti, A., 1997. A quantitative analysis of the interactions betweenclimatic response and intraspecific competition in European beech. Can. J. For.Res. 27, 277–284.
Ponton, S., Dupouey, J.-L., Breda, N., Feuillat, F., Bodenes, C., Dreyer, E., 2001. Carbonisotope discrimination and wood anatomy variations in mixed stands of Quer-cus robur and Quercus petraea. Plant Cell Environ. 24, 861–868.
R Development Core Team, 2008. R: A Language and Environment for StatisticalComputing. R Foundation for Statistical Computing, Vienna, Austria. , http://www.R-project.org.
Retuerto, R., Lema, B.F., Roiloa, S.R., Obeso, J.R., 2000. Gender, light and water effectsin carbon isotope discrimination, and growth rates in the dioecious tree Ilexaquifolium. Funct. Ecol. 14 (5), 529–537.
Rinn, F., 2003. TSAP-Win Professional, Time Series Analysis and Presentation forDendrochronology and Related Applications. Version 0.3, Quick Reference.Frank Rinn, Heidelberg, Germany, 20 pp.
Saurer, M., Aellen, K., Siegwolf, R.T.W., 1997. Correlating d13C and d18O in celluloseof trees. Plant Cell Environ. 20, 1543–1550.
Saurer, M., Borella, S., Schweingruber, F., Siegwolf, R., 1997. Stable carbon isotopesin tree rings of beech: climatic versus site-related influences. Trees-Struct.Funct. 11 (5), 291–297.
Saurer, M., Siegwolf, R.T.W., Schweingruber, F.H., 2004. Carbon isotope discrimina-tion indicates improving water-use efficiency of trees in northern Eurasia overthe last 100 years. Global Change Biol. 10, 2109–2120.
Scheidegger, Y., Saurer, M., Bahn, M., Siegwolf, R., 2000. Linking stable oxygen andcarbon isotopes with stomatal conductance and photosynthetic capacity: aconceptual model. Oecologia 125, 350–357.
Skov, K.R., Kolb, T.E., Wallin, K.F., 2004. Tree size and drought affect ponderosa pinephysiological response to thinning and burning treatments. For. Sci. 50 (1), 81–91.
Sohn, A.W., Reiff, F., 1942. Natriumchlorit als Aufschlussmittel. Der Papierfabrikant1/2, 5–7.
Specht, R.L., 1981. Primary production in Mediterranean climate ecosystems regen-erating after fire. In: Di Castri, F., Goodall, D.W., Specht, R.L. (Eds.), Mediter-ranean-type Shrublands. Elsevier, Amsterdam.
Sucoff, E., Hong, S.G., 1974. Effects of thinning on needle water potential in red pine.For. Sci. 10 (1), 25–29.
Tang, J., Qi, Y., Xu, M., Misson, L., Goldstein, A.H., 2005. Forest thinning and soilrespiration in a ponderosa pine plantation in the Sierra Nevada. Tree Physiol. 25(1), 57–66.
Tasissa, G., Burkhart, H.E., 1997. Modeling thinning effects on ring width distribu-tion in loblolly pine (Pinus taeda). Can. J. For. Res. 27, 1291–1301.
Valladares, F., Pearcy, R.W., 2002. Drought can be more critical in the shade than inthe sun: a field study of carbon gain and photo-inhibition in a Californian shrubduring a dry El Nino year. Plant Cell Environ. 25, 749–759.
Waring, R.H., Pitman, G.B., 1985. Modifying lodgepole pine stands to changesusceptibility to mountain pine beetle attack. Ecology 66 (3), 889–897.
Warren, C.R., McGrath, J.F., Adams, M.A., 2001. Water availability and carbonisotope discrimination in conifers. Oecologia 127, 476–486.
Weih, M., 2001. Evidence for increased sensitivity to nutrient and water stress in afast-growing hybrid willow compared with a natural willow clone. Tree Physiol.21, 1141–1148.
Yakir, D., 1992. Variations in the natural abundance of oxygen-18 and deuterium inplant carbohydrates. Plant Cell Environ. 15, 1005–1020.
Related Documents


