Response of Alum Rock springs to the October 30, 2007 Alum Rock earthquake and implications for the origin of increased discharge after earthquakes MICHAEL MANGA 1 AND JOEL C. ROWLAND 2 1 Earth and Planetary Science, University of California, Berkeley, Berkeley, CA, USA; 2 Los Alamos National Laboratory, Los Alamos, NM, USA ABSTRACT The origins of increased stream flow and spring discharge following earthquakes have been the subject of contro- versy, in large part because there are many models to explain observations and few measurements suitable for distinguishing between hypotheses. On October 30, 2007 a magnitude 5.5 earthquake occurred near the Alum Rock springs, California, USA. Within a day we documented a several-fold increase in discharge. Over the follow- ing year, we have monitored a gradual return towards pre-earthquake properties, but for the largest springs there appears to be a permanent increase in discharge. The Alum Rock springs discharge waters that are a mixture between modern (shallow) meteoric water and old (deep) connate waters expelled by regional transpression. After the earthquake, there was a small and temporary decrease in the fraction of connate water in the largest springs. Accompanying this geochemical change was a small (1–2°C) temperature decrease. Combined with the rapid response, this implies that the increased discharge has a shallow origin. Increased discharge at these springs occurs both for earthquakes that cause static volumetric expansion and for those that cause contraction, support- ing models in which dynamic strains are responsible for the subsurface changes that cause flow to increase. We make a quantitative comparison between the observed changes and model predictions for three types of models: (i) a permanent increase in permeability; (ii) an increase in permeability followed by a gradual decrease to its pre- earthquake value; and (iii) an increase of hydraulic head in the groundwater system discharging at the springs. We show that models in which the permeability of the fracture system feeding the springs increases after the earthquake are in general consistent with the changes in discharge. The postseismic decrease in discharge could either reflect the groundwater system adjusting to the new, higher permeability or a gradual return of permeabil- ity to pre-earthquake values; the available data do not allow us to distinguish between these two scenarios. How- ever, the response of these springs to another earthquake will provide critical constraints on the changes that occur in the subsurface and should permit a test of all three types of models. Key words: connate, earthquake triggering, liquefaction, permeability change, springs, transpression Received 28 February 2009; accepted 12 May 2009 Corresponding author: Michael Manga, Earth and Planetary Science, University of California, Berkeley, CA, USA. Email: [email protected]. Tel: 1-510-643-8532. Fax: 1-510-643-9980. Geofluids (2009) 9, 237–250 INTRODUCTION Increased discharge at springs following regional earth- quakes is among the more interesting hydrological responses to earthquakes because the changes are often persistent, can be observed directly, and in some cases are large enough to be visually compelling. Despite a long his- tory of documented changes, the origin of changes in dis- charge remains uncertain, and has been the subject of some scientific debate (Montgomery & Manga 2003). There are four general classes of explanations for increased discharge. First, coseismic static strain increases pore pressure in the deformation quadrant that experiences compression (e.g. Wakita 1975; Jonsson et al. 2003), lead- ing to increased discharge at the surface (Muir-Wood & King 1993). These static strains may also open or close fractures and hence change permeability. Second, dynamic strains created by the earthquake increase permeability per- mitting more rapid flow and hence increased discharge (e.g. Briggs 1991; Rojstaczer & Wolf 1992; Curry et al. Geofluids (2009) 9, 237–250 doi: 10.1111/j.1468-8123.2009.00250.x Ó 2009 Blackwell Publishing Ltd

Welcome message from author
This document is posted to help you gain knowledge. Please leave a comment to let me know what you think about it! Share it to your friends and learn new things together.
Transcript

Response of Alum Rock springs to the October 30, 2007Alum Rock earthquake and implications for the origin ofincreased discharge after earthquakesMICHAEL MANGA1 AND JOEL C. ROWLAND2
1Earth and Planetary Science, University of California, Berkeley, Berkeley, CA, USA; 2Los Alamos National Laboratory, LosAlamos, NM, USA
ABSTRACT
The origins of increased stream flow and spring discharge following earthquakes have been the subject of contro-
versy, in large part because there are many models to explain observations and few measurements suitable for
distinguishing between hypotheses. On October 30, 2007 a magnitude 5.5 earthquake occurred near the Alum
Rock springs, California, USA. Within a day we documented a several-fold increase in discharge. Over the follow-
ing year, we have monitored a gradual return towards pre-earthquake properties, but for the largest springs there
appears to be a permanent increase in discharge. The Alum Rock springs discharge waters that are a mixture
between modern (shallow) meteoric water and old (deep) connate waters expelled by regional transpression.
After the earthquake, there was a small and temporary decrease in the fraction of connate water in the largest
springs. Accompanying this geochemical change was a small (1–2!C) temperature decrease. Combined with the
rapid response, this implies that the increased discharge has a shallow origin. Increased discharge at these springs
occurs both for earthquakes that cause static volumetric expansion and for those that cause contraction, support-
ing models in which dynamic strains are responsible for the subsurface changes that cause flow to increase. We
make a quantitative comparison between the observed changes and model predictions for three types of models:
(i) a permanent increase in permeability; (ii) an increase in permeability followed by a gradual decrease to its pre-
earthquake value; and (iii) an increase of hydraulic head in the groundwater system discharging at the springs.
We show that models in which the permeability of the fracture system feeding the springs increases after the
earthquake are in general consistent with the changes in discharge. The postseismic decrease in discharge could
either reflect the groundwater system adjusting to the new, higher permeability or a gradual return of permeabil-
ity to pre-earthquake values; the available data do not allow us to distinguish between these two scenarios. How-
ever, the response of these springs to another earthquake will provide critical constraints on the changes that
occur in the subsurface and should permit a test of all three types of models.
Key words: connate, earthquake triggering, liquefaction, permeability change, springs, transpression
Received 28 February 2009; accepted 12 May 2009
Corresponding author: Michael Manga, Earth and Planetary Science, University of California, Berkeley, CA, USA.
Email: [email protected]. Tel: 1-510-643-8532. Fax: 1-510-643-9980.
Geofluids (2009) 9, 237–250
INTRODUCTION
Increased discharge at springs following regional earth-
quakes is among the more interesting hydrological
responses to earthquakes because the changes are often
persistent, can be observed directly, and in some cases are
large enough to be visually compelling. Despite a long his-
tory of documented changes, the origin of changes in dis-
charge remains uncertain, and has been the subject of
some scientific debate (Montgomery & Manga 2003).
There are four general classes of explanations for
increased discharge. First, coseismic static strain increases
pore pressure in the deformation quadrant that experiences
compression (e.g. Wakita 1975; Jonsson et al. 2003), lead-ing to increased discharge at the surface (Muir-Wood &
King 1993). These static strains may also open or close
fractures and hence change permeability. Second, dynamic
strains created by the earthquake increase permeability per-
mitting more rapid flow and hence increased discharge
(e.g. Briggs 1991; Rojstaczer & Wolf 1992; Curry et al.
Geofluids (2009) 9, 237–250 doi: 10.1111/j.1468-8123.2009.00250.x
" 2009 Blackwell Publishing Ltd

1994; Rojstaczer et al. 1995; Tokunaga 1999; Sato et al.2000; Wang et al. 2004a; Charmoille et al. 2005). The
dynamic strain from distant earthquakes has been shown to
at least temporarily increase permeability (e.g. Elkhoury
et al. 2006). Third, the breaching of hydraulic barriers or
seals (e.g. Sibson 1994; Brodsky et al. 2003; Wang et al.2004b) is similar to the enhanced permeability model, and
the addition of a new water source should be reflected in
changes in the composition or temperature of discharged
fluids. Fourth, the origin of the excess water discharged
after the earthquake lies in the shallowest subsurface where
water is liberated by the consolidation or even liquefaction
of near-surface unconsolidated materials (e.g. Manga 2001;
Manga et al. 2003; Montgomery et al. 2003).Here we document the increased discharge and subse-
quent recovery of a set of thermal springs in San Jose, Cal-
ifornia, USA in response to the magnitude 5.5 October
30, 2007 Alum Rock earthquake. King et al. (1994) have
previously reported the response of two of these springs to
several regional earthquakes. Our monitoring extends this
previous study to one more earthquake. More significantly,
we sample water and measure discharge more frequently
and consider the response of a greater number of springs.
We characterize some of the attributes of earthquakes that
have caused responses at the springs. We rule out mecha-
nisms that appeal to coseismic volumetric strain and favor
models in which the permeability of the fracture network
feeding the springs increases after the earthquake. We test
proposed hypotheses and compare mathematical represen-
tations of conceptual models of hydraulic head and perme-
ability increases with the observed changes. Finally, we
contrast the response of the stream into which the springs
discharge with the observed changes at the springs.
SETTING AND PROPERTIES OF THE SPRINGS
The Alum Rock complex of springs consists of a set of
thermal springs that discharge from a fracture zone located
updip of one strand of the Hayward fault. The springs lie
along both sides of the topographic low created by the
Penitencia Creek. Figure 1 shows the location of the
springs with respect to regional faults.
In a previous study of the hydrogeological and hydrog-
eochemical features of these springs, Rowland et al. (2008)noted significant compositional differences in the water
from different springs. The spring water was inferred to be
Calaveras fault
Fremont
San Jose
SF Bay
Alum Rock
Mission peak
Hayward fault Mission fault
Warm
springs fault
10 km
37° 30!
20!
40!
122° 50!
California
Area of detail
Fig. 1. Location of Alum Rock springs (circle),
the 30 October 2007 magnitude 5.5 Alum Rock
earthquake (star), and regional faults (black
lines). Background is the US Geological Survey
10 m DEM. Fault locations are from Andrews
et al. (1993).
238 M. MANGA & J. C. ROWLAND
" 2009 Blackwell Publishing Ltd, Geofluids, 9, 237–250

a mixture of locally derived (but tritium free for at least
spring AR 4) meteoric water and high chloride water with
a pronounced oxygen isotope shift away from meteoric
water. The high chloride water was interpreted to be old
seawater (a connate water). Given the large variation over
small spatial distances, Rowland et al. (2008) concluded
that the flow paths feeding individual springs remain rela-
tively isolated from each other. Figure 2 illustrates this
conceptual model. Because the hydrogeochemistry at the
spring outlets depends on the relative contribution of
meteoric and connate water (hereafter also called ‘shallow’
and ‘deep’, respectively), any earthquake-induced changes
in fault-zone permeability or aquifer head should produce
changes not only in discharge but potentially also in
hydrogeochemistry.
In the 1980s, King et al. (1994) documented flow and
temperature changes at springs AR 4 and 11 (Fig. 3) fol-
lowing five regional earthquakes. In all cases flow
increased, and for a couple of the earthquakes, a small
decrease in temperature was recorded. No clear changes in
electrical conductivity were recorded, implying that there
were no significant hydrogeochemical changes.
On October 30, 2007 at 8:05 PM local time, a magni-
tude 5.5 earthquake occurred along the Calaveras fault
(http://www.earthquake.usgs.gov/). The following morn-
ing, we collected water samples and made discharge mea-
surements. We made subsequent measurements over the
following year with a sampling frequency that decreased as
the earthquake-induced changes decreased. Compared with
King et al. (1994), we significantly increased the sampling
frequency in order to document the evolution of the
response; King et al. (1994) typically obtained only a
single measurement of increased discharge after each earth-
quake. We documented the responses of 12 springs and
Penitencia Creek. Figure 3 shows the locations of these
springs relative to each other and Penitencia Creek into
which they discharge.
Springs discharge from outlets that range from seeps
(AR 2, 5), to small pipes (AR 1, 6, 7, 8, 9, 10 and 13) to
large tunnels (springs 4, 11 and 12). Figure 4 shows some
of these outlets. Discharge was measured by molding an
oil-based modeling clay onto the rocks in order to capture
all the spring water and focus it into a bucket for weighing
or a graduated cylinder for volume measurement. Uncer-
tainties in discharge are estimated to be about 10%. Mean-
ingful discharge measurements could only be made
regularly at springs 4, 6, 11, 12 and 13. At other springs,
there were multiple outlets or not enough head to accu-
rately gauge the flow. At some of the springs, water occa-
sionally backed up to form pools which prevented
discharge from being measured.
Temperature was measured with a thermocouple with
accuracy of 0.2!C until February 2008 and thereafter with a
thermistor with accuracy of 0.1!C. O and H isotopes were
measured with a GV IsoPrime gas source mass spectrometer,
MultiPrep and elemental analyzer (GV Instruments,
Wythenshawe, Manchester, UK); analytical precision is
approximately 0.1& and 1& for d18O and dD, respectively.
Chloride was measured in the laboratory with an ion-specific
electrode; uncertainties are estimated to be 10% and are
dominated by uncertainty in the calibration and instrument
drift between calibration measurements.
From 2003 until the time of the earthquake, we periodi-
cally measured discharge and temperature, and collected
9.2 km 600 000
605 000
300
900
4138 000
4145 000
Calaveras f
ault
Hayward
fault sys
tem
Connate waters
AR springs
N
Meteoric recharge
Fig. 2. Conceptual model showing the relationship between faults, flow
paths and the sources of deep connate waters and shallow groundwater
that has a modern meteoric origin. Location of the Alum Rock earthquake
is shown with the star.
Fig. 3. Location of springs along Penitencia Creek. Numbers correspond to
spring numbers. DEM source: GeoEarthScope, Northern California LiDAR
funded by NSF.
Response of springs to earthquakes 239
" 2009 Blackwell Publishing Ltd, Geofluids, 9, 237–250

samples for stable-isotope and major ion measurements.
Up to eight stable-isotope samples were analysed at the
high-discharge springs (4 and 11) while several of the seeps
were only analysed twice. The total number of pre-earth-
quake flow and temperature measurements varied similarly
between springs. Rowland et al. (2008) present the results
of this monitoring program and discuss the implications of
geochemical variations between springs on the connectivity
of the fracture network feeding the springs.
RESPONSES
At all spring outlets where we could measure flow, dis-
charge increased following the earthquake. At some of
other springs (AR 1, 2), new seeps and outlets formed. At
the rest, water backed up in pools because of the increased
discharge. Figure 5 shows the flow, temperature and oxy-
gen-isotope response of the two largest springs, AR 4 and
11. These two springs are characterized by a nearly con-
stant temperature (±0.7 and ±1.5!C, respectively). Flow
increased by a factor of 3 and 3.5, respectively, within a
day of the earthquake. Discharge declined gradually over
the subsequent year, but more than 400 days after the
earthquake is still above the pre-earthquake discharge: by
about 35% for AR 4 and 20% for AR 11. For AR 11, the
new steady discharge is similar to the steady discharge in
the early 1980s (King et al. 1994), whereas pre-earthquakedischarge was similar to that measured by King et al.(1994) in the early 1990s. At both springs there was a
modest decrease in d18O, 0.2–0.3&, that occured soon
after the earthquake (AR 4) or peaked a few months after
the earthquake (AR 11), with a subsequent return to
12 11
Penitencia Creek
Travertinemounds
Fig. 4. Photographs of AR 12 and AR 11, which
emerge from tunnels, Penitencia Creek and trav-
ertine mounds which form at the spring outlets.
Date (month day–1)
Fig. 5. Discharge, d18O, and temperature
responses at the two largest springs, AR 4 and
11, as a function of time in days since the Octo-
ber 30, 2007 Alum Rock earthquake. Histogram
at the top shows precipitation in mm day)1. Hor-
izontal lines are pre-earthquake values and the
boxes the standard deviations of pre-earthquake
measurements from Rowland et al. (2008).
240 M. MANGA & J. C. ROWLAND
" 2009 Blackwell Publishing Ltd, Geofluids, 9, 237–250

pre-earthquake values. We use d18O here to identify
changes in water composition, rather than chloride,
because we have more pre-earthquake measurements of
the former and hence can more reliably compare responses
with pre-earthquake values. The decrease in d18O appears
to be correlated with a small, less than 1–2!C, decrease in
temperature.
Measurements at the remaining three springs, AR 6, 12
and 13, for which reliable gauging measurements were
made are shown in Fig. 6. These springs differ from AR 4
and 11 in that they showed modest (a few degree) seasonal
variations in temperature, presumably because their smaller
discharge allows for more heat exchange with the shallow
subsurface. The discharge responses at AR 12 and 13 are
similar to those at the two largest springs, in that the larg-
est discharges occured within the first few days after
the earthquake, but differ in that discharge returned to the
pre-earthquake values within a year. AR 6 is different. The
first noticeable discharge at what was originally a minor
seep appeared 3 days after the earthquake. Subsequently,
discharge decreased and the spring returned to a seep
within a few months. Measureable discharge returned dur-
ing late spring 2008 – the rainy season – and again in
December 2008. There is no clear change in d18O follow-
ing the earthquake, but we emphasize that for AR 6 we
have no pre-earthquake values and for AR 12 and 13 we
have only two and five pre-earthquake values, respectively.
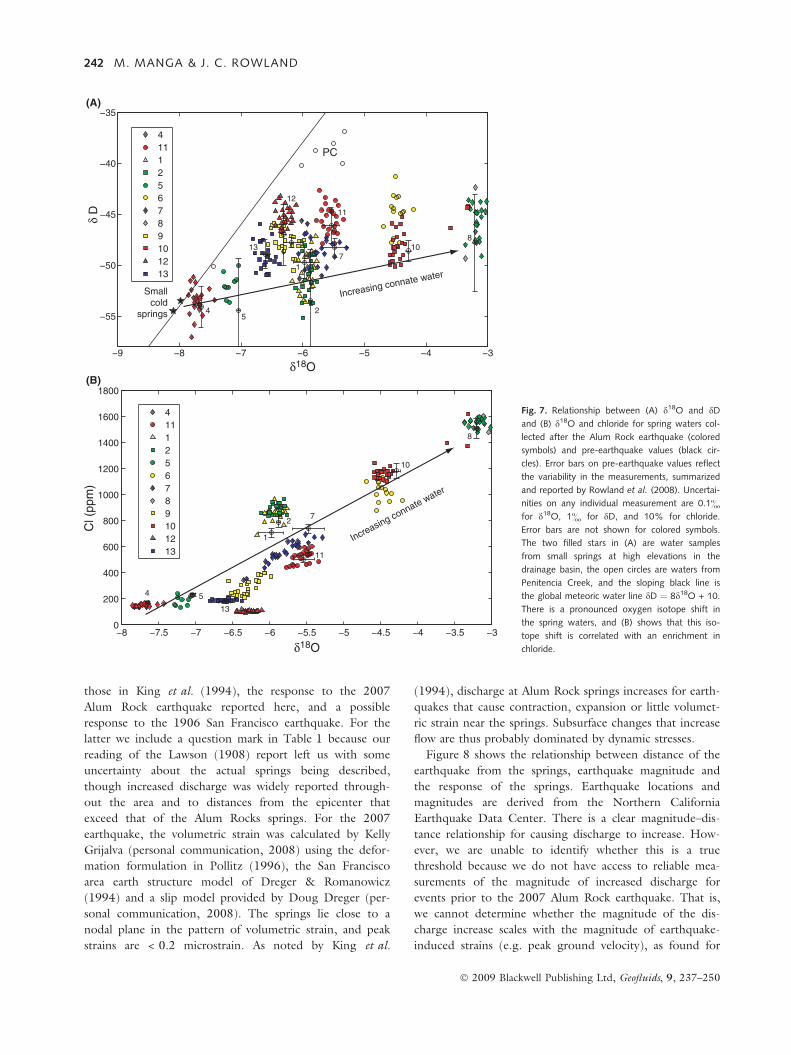
Figure 7 shows the relationship between O and H iso-
tope measurements and O isotopes and chloride concentra-
tion for all measurements and for all springs. Figure 7
confirms that the water being discharged at the springs
resembles a mixture of meteoric waters (low chloride with
O and H isotopes close to the meteoric water line) and a
high chloride, O isotope shifted water that Rowland et al.(2008) inferred to be connate water. The large variations
in d18O and chloride at springs AR 5, 7 and 9 probably
reflect enhanced discharge of shallow groundwater associ-
ated with seasonal precipitation.
All springs show small variations over time, possibly
related to changes in mixing proportions, but these
changes are small compared with the range shown by the
entire group of springs. Even springs that showed a com-
positional response to the earthquake (AR 4 and 11) show
no more variation than other springs. Thus, the sudden
increase in discharge cannot be attributed to a huge
increase in the proportion of any one end-member or some
new fluid component not normally present.
FEATURES OF THE EARTHQUAKES THATCAUSE FLOW TO INCREASE
Table 1 lists the sign of the volumetric strain in the Peni-
tencia Creek drainage basin generated by earthquakes that
caused discharge to increase. The list of responses include
Fig. 6. Discharge, d18O, and temperature
responses at springs AR 6, 12, and 13 as a func-
tion of time in days since the October 30, 2007
Alum Rock earthquake. Hyetograph at the top
shows precipitation in mm day)1. Horizontal lines
are pre-earthquake values and the boxes the
standard deviations of pre-earthquake measure-
ments from Rowland et al. (2008). Pre-earth-
quake oxygen isotope values are not known for
AR 6 which was a minor seep prior to the earth-
quake.
Response of springs to earthquakes 241
" 2009 Blackwell Publishing Ltd, Geofluids, 9, 237–250
those in King et al. (1994), the response to the 2007
Alum Rock earthquake reported here, and a possible
response to the 1906 San Francisco earthquake. For the
latter we include a question mark in Table 1 because our
reading of the Lawson (1908) report left us with some
uncertainty about the actual springs being described,
though increased discharge was widely reported through-
out the area and to distances from the epicenter that
exceed that of the Alum Rocks springs. For the 2007
earthquake, the volumetric strain was calculated by Kelly
Grijalva (personal communication, 2008) using the defor-
mation formulation in Pollitz (1996), the San Francisco
area earth structure model of Dreger & Romanowicz
(1994) and a slip model provided by Doug Dreger (per-
sonal communication, 2008). The springs lie close to a
nodal plane in the pattern of volumetric strain, and peak
strains are < 0.2 microstrain. As noted by King et al.
(1994), discharge at Alum Rock springs increases for earth-
quakes that cause contraction, expansion or little volumet-
ric strain near the springs. Subsurface changes that increase
flow are thus probably dominated by dynamic stresses.
Figure 8 shows the relationship between distance of the
earthquake from the springs, earthquake magnitude and
the response of the springs. Earthquake locations and
magnitudes are derived from the Northern California
Earthquake Data Center. There is a clear magnitude–dis-
tance relationship for causing discharge to increase. How-
ever, we are unable to identify whether this is a true
threshold because we do not have access to reliable mea-
surements of the magnitude of increased discharge for
events prior to the 2007 Alum Rock earthquake. That is,
we cannot determine whether the magnitude of the dis-
charge increase scales with the magnitude of earthquake-
induced strains (e.g. peak ground velocity), as found for
Fig. 7. Relationship between (A) d18O and dDand (B) d18O and chloride for spring waters col-
lected after the Alum Rock earthquake (colored
symbols) and pre-earthquake values (black cir-
cles). Error bars on pre-earthquake values reflect
the variability in the measurements, summarized
and reported by Rowland et al. (2008). Uncertai-
nities on any individual measurement are 0.1&for d18O, 1& for dD, and 10% for chloride.
Error bars are not shown for colored symbols.
The two filled stars in (A) are water samples
from small springs at high elevations in the
drainage basin, the open circles are waters from
Penitencia Creek, and the sloping black line is
the global meteoric water line dD ! 8d18O + 10.
There is a pronounced oxygen isotope shift in
the spring waters, and (B) shows that this iso-
tope shift is correlated with an enrichment in
chloride.
242 M. MANGA & J. C. ROWLAND
" 2009 Blackwell Publishing Ltd, Geofluids, 9, 237–250

permeability changes in wells (Elkhoury et al. 2006). Nev-
ertheless, we draw an empirical threshold separating earth-
quakes that have caused flow to increase from those that
did not. Over the cumulative period that was monitored,
1977–1991 and 2003–2008, there are no events clearly
beyond this threshold line for which flow did not increase.
Two earthquakes lie very close to the threshold (magnitude
4.8 events on January 15, 1981 and November 10, 1988);
both caused contraction in the Alum Rock region. The
interval between earthquakes that caused a response is as
short as 6.5 months so that if there is a repose or recovery
time required for an earthquake-induced response it is less
than half a year. A repose time of a couple of years was
identified for other earthquake-triggered phenomena,
including mud volcanoes in Azerbaijan (Mellors et al.2007), Japan (Manga et al. 2009) and Italy (Bonini 2009).
DISCUSSION
We begin by listing features of the observations reported
in the previous two sections that have a bearing on the ori-
gins and implications of the spring response.
(1) Discharge increased at all springs.
(2) Peak discharge occurred soon after the earthquake,
within a few days.
(3) Discharge does not always return to pre-earthquake
values, most notably at the two largest springs where
we also have the best constraints on pre-earthquake
discharges.
(4) While discharge increased by factors exceeding 3, the
isotopic composition and chloride concentration chan-
ged modestly, if at all. For the two largest springs
there was a small deviation towards the meteoric end-
member composition. The observation of small if any
change is consistent with the absence of any electrical
conductivity changes reported by King et al. (1994)
following previous earthquakes. Changes in d18O and
chloride plot along a mixing line between meteoric
and connate water end-members (Fig. 7), supporting
the conceptual model (Fig. 2) in which these sources
of water mix to varying degrees.
(5) There is a clear magnitude–distance relationship for
earthquakes that induce responses (Fig. 8).
(6) For the largest springs there was a small decrease in
temperature (<1–2!C) that occurs at the same time as
changes in d18O. We did not observe the immediate
and small (approximately 1!C) temperature decrease
reported by King et al. (1994).(7) The response is dominated by dynamic rather than sta-
tic stress changes (Table 1).
Table 2 summarizes some of the predictions of proposed
models for the increase in discharge after earthquakes.
Observations 1 and 4 support models in which permeability
increases at shallow depths or within the fracture system
feeding the springs; changes at depth would result in a
delayed response. Observation 4 shows that we do not need
to appeal to a new source of fluid or chemistry from a brea-
ched reservoir (e.g. Sibson 1994; Wang et al. 2004b), a cose-ismic and postseismic feature that has been documented at
springs elsewhere (e.g. Yechieli & Bein 2002; Stejskal et al.2008). Given the small decrease in temperature at the largest
Table 1. Earthquakes followed by flow increases.
Date Event Magnitude
Epicentral
distance
Volumetric
strain* Reference
4/18/1906? San Francisco 7.8 70 km D Lawson
(1908)?
4/24/1984 Morgan Hill 6.2 18 km C King et al.
(1994)
3/31/1986 Mount Lewis 5.7 15 km C King et al.
(1994)
6/13/1988 Alum Rock 5.3 8 km C King et al.
(1994)
4/3/1989 Alum Rock 4.5 5 km – King et al.
(1994)
10/18/1989 Loma Prieta 7.0 40 km D King et al.
(1994)
10/30/2007 Alum Rock 5.5 4 km – This study
*C, D and ‘–’ indicate contraction, dilatation, or that the basin is close to anodal plane in the strain, respectively.
3 3.5 4 4.5 5 5.5 6 6.5 7
10–1
10–2
Magnitude
Dis
tanc
e be
twee
n ea
rthq
uake
and
spr
ings
(km
)
Discharge increase
No response
Fig. 8. Magnitude and distance from the springs of earthquakes that
occurred during the period monitored: 1977–1991 by King et al. (1994),
and 2003–December 31, 2008 (Rowland et al. 2008 and present study).
Red stars indicate earthquakes for which discharge increased; the filled-in
star is the October 30, 2007 Alum Rock earthquake. Open blue circles are
earthquakes for which there is no (documented) change in discharge. The
sloping dotted line is an empirical magnitude–distance threshold for
changes in streamflow based on a global compilation (Wang et al. 2006);
while empirical this line corresponds to a line of approximately constant
seismic energy density (Wang 2007). The solid line is an empirically drawn
line that separates earthquakes that caused discharge changes from those
that did not and has a similar slope to that for the global compilation.
Response of springs to earthquakes 243
" 2009 Blackwell Publishing Ltd, Geofluids, 9, 237–250

springs (AR 4 and 11) and that the discharged water at AR 4
contains no 3H (Rowland et al. 2008), a vadose zone sourcefor all the excess water (e.g. Manga et al. 2003) is highly
unlikely (but see the section about the response of Penitencia
Creek). Because of observation 4, we will next consider mod-
els only for changes in discharge, and address the changes of
hydrogeochemistry qualitatively. Observation 7 is counter to
predictions of the coseismic elastic strain model.
Figure 9 illustrates three conceptual models to explain
the discharge change. We first consider the model in
Fig. 9A which appeals to an increase in permeability of the
fracture systems feeding the springs. Second, we consider
the model in Fig. 9B in which permeability of the fracture
system increases after the earthquake and then gradually
reduces over time scales similar to those over which dis-
charge changes. Third, we consider the model in Fig. 9C
in which an influx of fluid increases the head in the fracture
system. We treat the fracture zone that delivers water to
the spring as a homogenous one-dimensional aquifer.
While clearly a great oversimplification of what must be a
much more complex subsurface, similar (one-dimensional)
models are commonly used to interpret postseismic
responses to earthquakes (e.g. Rojstaczer et al. 1995; Roel-offs 1998; Tokunaga 1999; Sato et al. 2000; Manga 2001;
Manga et al. 2003; Montgomery et al. 2003; Wang et al.2004a,b) as well as to interpret discharge variations at
springs (e.g. Manga 1996). We will see that, while simple,
the models fit the observed changes in discharge extremely
well.
Enhanced permeability model
Discharge Q from the fracture zone is governed by Darcy’s
equation
Q ! "KvAohoz
at z ! 0; #1$
where Kv is the vertical hydraulic conductivity of the frac-
ture zone, A is the cross-sectional area across which fluid is
being discharged, z is the depth and h the hydraulic head.
Equation (1) implies that the coseismic change in hydraulic
conductivity is proportional to the coseismic change in dis-
charge. We refer to a model in which hydraulic conductiv-
ity increases as the ‘enhanced permeability’ model.
Subsequently, the increased discharge leads to a reduc-
tion of the head in the fracture system and a greater
recharge from the surroundings. Approximating this latter
flux as being proportional to the head difference between
the far-field h0 and that in the fracture system, the evolu-
tion of head in the fracture system can be approximated by
the standard groundwater flow equation with an additional
term that accounts for recharge to the fracture zone,
Ssohot
! Kvo2hoz2
% Kh
wD#h0 " h$ #2$
with boundary conditions
h ! h0 at x ! D and oh=oz ! 0 at z ! L: #3$
Here Ss is the specific storage of the fracture zone, the
width and depth of the fracture zone arew and L, respectively,and Kh is the horizontal conductivity of the region adja-
cent to the fracture zone. The horizontal aquifer extends
to a distance x ! D where the head is fixed to h0. The last
term in equation (2) that describes recharge is a first-order
approximation. In this model we assume that storage prop-
erties, Ss, do not change, though both hydraulic conductiv-
ity and storage properties can be influenced by earthquakes
(e.g. Jang et al. 2008).
Table 2. Model and expected changes at the springs.
Model
Prediction for
the springs
Coseismic
elastic strain
Temperature increase; larger fraction of ‘deep’
water; correlation with sign of volumetric strain
Enhanced
permeability
Temperature and composition changes will
depend on where the changes occur; potential
for permanent changes in flow and composition
Ruptured subsurface
reservoirs and
fault valves
Increased temperature; semi-permanent to
permanent change in discharge and composition,
with more ‘deep’ water or new water component
Consolidation/l
iquefaction
Decreased temperature; larger fraction of shallow
water; eventual return to pre-earthquake properties
Spring
(A) (B) (C)
Spring
No flow
Spring
No flow
Faul
t zon
e
Faul
t zon
e
Faul
t zon
e
Spe
cifie
d he
ad h
o
Specified head ho
A
L L L
D
A A
z = 0 z = 0
z = L’
z = Lz = L
KhKv(t)
Kv
F0
w
Fig. 9. Schematic illustration of conceptual mod-
els. (A) Enhanced permeability model in which
the vertical hydraulic conductivity of the fracture
zone, Kv, changes after the earthquake. (B) Tran-
sient permeability model in which the vertical
hydraulic conductivity of the fracture zone, Kv,
increases co-seismically and then decreases. (C)
Increased head model in which an influx of fluid
F0 causes the head in the fracture zone to
increase and hence discharge to increase.
244 M. MANGA & J. C. ROWLAND
" 2009 Blackwell Publishing Ltd, Geofluids, 9, 237–250

The steady-state head distribution in the fracture zone is
h ! h0 1" sinh#lz$ % sinh&l#2L " z$'sinh#2lL$
! "#4$
where l !######################Kh=KvDw
p. The corresponding steady-state
discharge is
Q 0 ! KvAlh01" cosh#2lL$sinh#2lL$
$ %: #5$
Following the earthquake, we assume that Kv increases
by an amount linearly proportional to the increase in dis-
charge. The subsequent evolution of discharge can be
obtained by solving the time-dependent diffusion equation
(2) with a new hydraulic conductivity Kvf and an initial
condition equal to the difference between the steady-state
solution with the initial conductivity (now denoted Kvi)
and final conductivity Kvf. The solution can be obtained by
adapting that for an analogous problem in section 4.14 of
Carslaw & Jaeger (1959). The evolution of head is then
given by
h#z; t$ ! h0 1" sinh#lf z$ % sinh&lf #2L " z$'sinh#2lfL$
$ %
" 16h0L2
pe"Kht=DwS s
X1
n!1
l2i#2n " 1$2p2 % 4L2l2i
"l2f
#2n " 1$2p2 % 4L2l2f
" #
( 1
#2n " 1$sin
#2n " 1$pz2L
$ %e"#2n"1$2p2Kvf t=4SsL2
#6$
where the subscripts ‘i’ and ‘f’ indicate values before (ini-
tial) and after (final) the earthquake. The corresponding
discharge can be obtained by evaluating Darcy’s equation
(1) at z ! 0,
Q #t$ ! "KvfAlf h01" cosh#2lfL$& 'sinh#2lfL$
% 8KvfAh0Le"Kht=DwS s
X1
n!1
l2i#2n " 1$2p2 % 4L2l2i
"l2f
#2n " 1$2p2 % 4L2l2f
" #
e"#2n"1$2p2Kvf t=4S sL2
#7$
This model is similar to that used by Rojstaczer et al.(1995) and later invoked by Sato et al. (2000) and Toku-
naga (1999) to explain changes in discharge. It differs in
that it accounts for the increased recharge to the fracture
system following its reduction in head, the last term in
equation (2).
This enhanced permeability model is characterized by
four parameters
a ! KvfAh0L
; R ! Kvf
Kvi; m ! Kh
DwSs; T !
############mL2SsKvf
s
#8$
The first, a, is a scaling parameter for the magnitude of
discharge. The second, R, is the ratio of fracture-zone con-
ductivity after and before the earthquake. R can be deter-
mining directly from the measured increased in discharge.
The third, m, is an inverse hydraulic diffusion time scale.
The fourth, T, is the ratio of vertical to horizontal flow time
scales. With these parameters, equation (7) can be written
Q #t$ ! "aT&1" cosh 2T '
sinh 2T% 8ae"mt
X1
n!1
RT 2
#2n " 1$2p2 % 4RT 2" T 2
#2n " 1$2p2 % 4T 2
" #
e"#2n"1$2p2mt=4T 2 #9$
The ratio of final postearthquake steady-state discharge
Q f to the pre-earthquake discharge Q0 is
Q f
Q 0!
####R
p sinh#2####R
pT $
sinh#2T $1" cosh 2T
1" cosh 2####R
pT
! "#10$
From equation (10) we can see that for small T, Q f/
Q 0 fi 1, whereas for large T, Q f =Q 0 !####R
p. Thus, the
initial response to a conductivity increase is an increase in
discharge by a factor of R, and the final steady discharge is
increased by a factor )####R
p.
Transient permeability model
The increase in permeability potentially created by the earth-
quake may not be permanent as biogeochemical processes
will act to decrease the permeability over time (Elkhoury
et al. 2006). Gradual changes in flow, hydrogeochemistry,
or fluid pressure following earthquakes have been attributed
to a gradual reduction of earthquake-enhanced permeability
(e.g. Gratier et al. 2003; Claesson et al. 2004, 2007). Thismodel differs from the enhanced permeability model in that
Kv is assumed to change on time scales comparable with
those over which flow changes. Hereafter we refer to this
model as the ‘transient permeability model’.
We will assume that hydraulic conductivity increases
coseismically fromKvi toKvf, as in the enhanced permeability
model. Subsequently, we assume Kvf decreases exponen-
tially in time with decay constant k, i.e.
Kv#t$ ! Kvi % #Kvf "Kvi$e"!t
The choice of an exponential dependence for Kv(t), whilearbitrary and unknown a priori, is inspired by the exponen-
tial time dependence of many geochemical and mechanical
processes.
Response of springs to earthquakes 245
" 2009 Blackwell Publishing Ltd, Geofluids, 9, 237–250

With the boundary condition h ! h0 at z ! L, dischargeis then given by equation (1),
Q #t$ ! KviAh0l
&1% #R " 1$e"!t ' #11$
This model is characterized by three parameters
Q 0 ! KviAh0l
; R ! Kvf
Kvi; !: #12$
Q0 is measured and R is known from the magnitude of the
increase in discharge leaving us with a single parameter to fit.
Increased head model
If Kv remains unchanged by the earthquake, and assuming
A does not change, Darcy’s law (1) requires that head gra-
dients, and hence head, changed. Increased stream dis-
charge owing to increased hydraulic heads have been
proposed to result from consolidation (e.g. Manga et al.2003), breaching barriers to release pressurized water
(Wang et al. 2004b) or by increasing permeability perpen-
dicular to the fracture system so that the fracture zone is
rapidly recharged (Wang et al. 2004a).Here we follow the formulation in Wang et al. (2004a)
and allow a pulse of recharge to the fracture system over
the depth interval z ! L¢ to z ! L. The groundwater flow
equation for this problem can be written as
Ssohot
! Kvo2hoz2
% F #13$
where F is the rate of recharge to the fracture zone per
unit volume. At the time of the earthquake we let F ! F0dover the depth interval L¢ < z < L, where d ! 1 at t ! 0
and d ! 0 for t > 0. The solution for discharge is given by
(e.g. Wang et al. 2004a,b)
Q #t$ ! Q 0%2KvAF0
SsL
X1
n!1
#"1$n"1 sin#2n " 1$2p2#L " L 0$
2L
" #
( e"#2n"1$2p2Kvt=4SsL2 #14$
This model is characterized by four parameters
Q 0; b ! 2KvAF0
SsL; K ! Kv
SsL2; #L " L 0$=L: #15$
Of these, the discharge Q 0 prior to the earthquake is
known. We will fix (L ) L¢)/L to 1 in order to reduce the
number of parameters. This choice is consistent with the
very rapid increase in discharge – as (L ) L¢)/L decreases,
the time between the earthquake and the peak postseismic
discharge increases. Previous studies that documented peak
responses within days inferred (L ) L¢)/L close to 1
(Manga et al. 2003; Wang et al. 2004a) and these studies
guide our simplification.
Application of models to the flow observations
We determined model parameters and their uncertainties
by fitting equations (9), (11) and (14) to the discharge
measurements using the nonlinear least-squares Marqu-
ardt-Levenberg algorithm (see chapter 15.5 in Press et al.1992). The misfit between the best-fit model and data is
characterized with the root mean squared deviation
E ! 1
N
XN
i!1
#Q measured "Q model$2" #1=2
where N is the number of discharge measurements.
Figure 10 compares data for AR 4, 6, 11, 12 and 13
with best-fit models. Tables 3, 4 and 5 list the model
parameters. The larger uncertainties in the parameters of
the enhanced permeability model (Table 3) compared with
the increased head model (Table 5) reflect the larger num-
ber of fitted parameters (3 compared with 2) and the
trade-offs between their values.
In general, the enhanced permeability model, equation
(9), captures the recovery of the discharge after the earth-
quake. Importantly, this model can also explain the perma-
nent change in discharge measured at springs AR 4 and 11.
The magnitude of the long-term change in discharge
depends on the conductivity change R and ratio of time
scales T (equation 10). If the evolution of discharge is dom-
inated by a time evolution of permeability, then the final
permeability in the transient permeability model must be
different from its pre-earthquake value for springs 4 and 11
(observation 3 in the list at the beginning of this section).
The transient permeability model, if the correct model,
implies permeability reduction times of between about 10
and 30 days (1/k). The increased head model also captures
the postseismic increase and subsequent decrease of dis-
charge, but requires a return to pre-earthquake discharge
Q 0. The values of m and T for the enhanced permeability
model, or K in the increased head model, correspond to
reasonable hydraulic diffusivities of O(10)1) m2 s)1 (e.g.
Roeloffs 1996) if we assume a length scale L of 1 km.
We do not attempt to use the misfit between model and
data, represented by E in Tables 3–5, to make a quantita-
tive decision about which model best explains the
postseismic changes. For the largest springs, AR 4 and 11,
the enhanced permeability model clearly fits the data bet-
ter, the larger number of model parameters notwithstand-
ing. However, as we do not know the functional form for
possible sealing of fractures and permeability reduction, we
cannot dismiss the transient permeability model.
Given the small changes in water hydrogeochemistry at
the largest springs we do not quantitatively apply the mod-
els in Fig. 9 to the hydrogeochemistry data. We note,
however, that the essentially constant water composition
246 M. MANGA & J. C. ROWLAND
" 2009 Blackwell Publishing Ltd, Geofluids, 9, 237–250

may imply a long residence time of water in the fracture
system compared to the period over which discharge
changes. Otherwise the water entering the fracture system
should be evident as a dilution of the chloride concentra-
tion and decrease in d18O. Whereas discharge increased by
a factor of 3–7 for the springs shown in Figs 5 and 6, the
water is diluted by at most a few percent by the shallow
meteoric end-member. For the enhanced permeability
model (Fig. 9A), springs AR 4 and 11 have the largest
value of T – that is, they are the springs for which hori-
zontal flow times are shortest relative to vertical flow times
– and also show the most pronounced dilution of dis-
charged water, as expected. Finally, if the fracture system
was draining water from two distinct regions, an increase
in fracture zone permeability would increase the propor-
tion of water being recharged from the deeper region, pre-
sumably our chloride-rich end-member. If the enhanced
permeability model is in fact a good description of the sub-
surface, then the shallow and deep water must mix upgra-
dient and before the mixture is drawn into the fracture
system where the permeability increased.
RESPONSE OF PENITENCIA CREEK
Penitencia Creek also responded to the earthquake by
increasing its discharge. The Santa Clara Valley Water Dis-
trict maintains a gauge 4 km downstream of the springs,
formerly USGS station 11172100. Measurements 8 and
16 h after the earthquake show an approximate doubling
Fig. 10. Comparison of discharge measurements
(symbols) with best fit models for the 5 springs
for which reliable discharge measurements could
be made. Black, red and blue curves are the
enhanced permeability, increased head, and tran-
sient permeability models, respectively, with
model parameters listed in Tables 3–5.
Table 3 Model parameters for enhanced permeability model.
Spring R* a (l s)1) T m (day)1) E (l s)1)
AR 4 3.0 0.14 ± 0.02 1.7 ± 0.2 0.0093 ± 0.0030 0.017
AR 11 3.5 0.66 ± 0.18 0.70 ± 0.14 0.0039 ± 0.0018 0.057
AR 13 3.6 0.19 ± 0.05 0.42 ± 0.06 0.0025 ± 0.0007 0.0032
AR 12 6.5 0.076 ± 0.047 0.37 ± 0.15 0.0018 ± 0.0016 0.0037
AR 6 10 0.012 ± 0.01 0.1* 0.00056 ± 0.00007 0.0047
*Fixed to this value.
Table 4 Model parameters for transient permeability model.
Spring Q0* R* k (day)1) E (l s)1)
AR 4 0.153 3.0 0.034 ± 0.007 0.071
AR 11 0.233 3.5 0.041 ± 0.007 0.093
AR 13 0.026 3.6 0.042 ± 0.004 0.0040
AR 12 0.007 6.5 0.033 ± 0.003 0.011
AR 6 0.003 10 0.11 ± 0.02 0.0031
*Fixed to this value.
Table 5 Model parameters for increased head model.
Spring Q0* (l s)1) b (l s)1) K (day)1) E (l s)1)
AR 4 0.153 0.072 ± 0.007 0.0050 ± 0.0010 0.050
AR 11 0.233 0.14 ± 0.01 0.0044 ± 0.0007 0.073
AR 13 0.026 0.0205 ± 0.0007 0.0081 ± 0.0007 0.0046
AR 12 0.007 0.0127 ± 0.0006 0.062 ± 0.0007 0.0043
AR 6 0 0.035 ± 0.004 0.115 ± 0.020 0.0017
*Fixed to this value.
Response of springs to earthquakes 247
" 2009 Blackwell Publishing Ltd, Geofluids, 9, 237–250

of the discharge from about 4 to 8 l s)1. Figure 11 shows
that the increased discharge persists for at least 12 days
until rainfall on November 11 adds ambiguity to interpret-
ing subsequent discharge measurements. Uncertainity in
discharge, based on the accuracy of the water level gauge,
is about 10%. The increase in discharge is much greater
than the total discharge at the Alum Rock springs (less
than 2 l s)1 on October 31, 2007) implying a source for
some of the excess discharge other than the springs. As
with the springs, the peak increased discharge occurred
within a couple of days of the earthquake.
We did not collect water from Penitencia Creek until
November 5, 2007. Water samples from the creek were
collected upstream of all the springs. The samples from
November 5 and 7 are unusual compared with all the
other creek samples collected both before and since in two
respects, as shown in Fig. 12. First, their O and H isotopic
composition fall off the trend defined by the other water
samples. Second, the chloride concentrations are the high-
est of any creek samples.
We suggest two possible explanations for the chloride
enrichment and isotope shift. First, deep groundwater was
released from unidentified springs and seeps upstream of
the Alum Rocks springs. This would impart both an oxy-
gen and chloride shift similar to that seen at the Alum
Rock springs.
Second, we appeal to a source of water in the shallowest
subsurface, where water can experience significant evapora-
tion and transpiration in the vadose zone prior to entering
the stream. A chloride enrichment of about 50% over typi-
cal values for stream water would imply that one-third of
the original water was lost relative to typical streamwater.
In an atmosphere with 20% humidity, evaporation of 10%
of the water would have imparted a shift in O and H that
would bring the original water close to a line described by
other streamflow samples (we use the fractionation factors
of Cappa et al. (2003) at 20!C at 20.4% humidity in this
representative calculation). The remaining water loss to
account for the 50% enrichment in chloride could be lost
by transpiration, as water uptake by roots imparts no frac-
tionation (Gat 1996). November 5, 2007 was near the
beginning of the wet season and before any significant
rainfall (only one significant storm, on October 13,
occurred prior to the earthquake) so soil water should have
experienced significant evapotranspiration. In fact, most of
the water samples from the dry season lie on a trend that
deviates from the meteoric water line by having a more
Fig. 11. Discharge in Penitencia Creek and pre-
cipitation before and after the October 30, 2007
Alum Rock earthquake. Discharge approximately
doubled after the earthquake and remained ele-
vated until precipitation on November 11
obscures any earthquake induced changes.
Fig. 12. (A) Oxygen and hydrogen isotope composition of water collected
from Penitencia Creek upstream of the springs and after the earthquake
(green symbols). The black line is a best-fit to the measurements and has a
slope of 6.3, lower than that of the global meteoric water line. The two
outliers were the first samples collected after the earthquake, on November
5 and 7, 2007. The blue symbol shows an estimate of water composition
from which the November 5 sample could be derived by assuming 10%
evaporation at 20!C and 20% humidity. (B) Chloride time series showing
that the highest chloride concentration measured in creek water to date
were in the first 2 weeks after the earthquake.
248 M. MANGA & J. C. ROWLAND
" 2009 Blackwell Publishing Ltd, Geofluids, 9, 237–250

shallow slope, but none deviate as much as the Novemer 5
and 7, 2007 samples. We suggest that shaking by the
earthquake liberated this water, perhaps by consolidating
loose materials (Manga et al. 2003), and that this water
entered the stream. Unfortunately, as no water samples
from the creek were collected during the first 5 days after
the earthquake, we must view this hydrogeochemically
based inference as highly speculative as it is based on two
water samples.
The recession of stream discharge after the earthquake
offers an additional opportunity to distinguish between
explanations for the increased discharge. During periods
without significant precipitation, discharge Q will decrease
approximately exponentially with time t,
Q #t$ / e"at : #16$
The recession constant a is proportional to the perme-
ability of the aquifers providing baseflow. For the recession
from October 14–19 following the storm on October 13,
a ! 0.105 ± 0.005 day)1; for the period after the earth-
quake, November 1–5, a ! 0.078 ± 0.026 day)1; follow-
ing the storm on November 11, a ! 0.077 ± 0.022 day)1
for the period November 12–15. These time intervals are
selected because there is no precipitation to confound the
analysis. There is no clear change in recession characteris-
tics, consistent with models in which the earthquake
increases head in the aquifers providing baseflow (e.g.
Manga 2001; Manga et al. 2003; Wang et al. 2004a).
However, we once again emphasize the limited time inter-
val over which the effect of the earthquake can be seen
before precipitation obscures the response. In addition, a
small reservoir (1.2 · 105 m3 capacity) in the upper
reaches of the Penitencia Creek drainage has an unknown,
but likely very small, effect on the discharge at the gauge.
CONCLUSIONS
The Alum Rock springs all showed a rapid postseismic
increase in discharge followed by a gradual recovery. The
large change in discharge was accompanied by either small
or no significant changes in water composition. The small
shift towards a composition more similar to meteoric water
and the rapid response imply that the excess water origi-
nates from shallow depths and that changes occur close to
the surface. This does not mean that deep changes do not
occur, simply that deep changes do not dominate the
observed responses. The lack of correlation between
increased discharge and the sign of volumetric strain favors
a response induced by dynamic strain.
We briefly considered three different models to explain
the flow changes. We favor the model in which permeabil-
ity increased in the fracture zone feeding the springs over a
model in which fluid pressures increased because of the
permanent (over a 1-year time window) change in the
steady discharge – a feature that requires a permanent
change in properties or boundary conditions. Nevertheless,
the increased head model and transient permeability mod-
els also fit the data quite well.
We should ultimately be able to distinguish between the
three models for the evolution of discharge by document-
ing the response to yet another earthquake. In particular,
the recession characteristics of discharge depend on the per-
meability change for the enhanced permeability model in
Fig. 9A. Recession will be identical for all earthquakes for
the head-change model in Fig. 9B (Manga 2001), that is,
K will be the same. If the response to a subsequent earth-
quake shows a different recession parameter (different K),and a recession that does not scale with the permeability
increase as described in equation (9), we would favor reces-
sion being dominated by time-evolving reduction of perme-
ability. Unfortunately, the long interval between discharge
measurements made by King et al. (1994) prevents us fromperforming these tests retrospectively. Furthermore, unlike
streams where we can use baseflow recession before and
after earthquakes to identify changes (e.g. Manga 2001;
Montgomery et al. 2003), the normal state of the springs is
a steady discharge so that we have (so far) only a single
recession event to probe the subsurface changes.
ACKNOWLEDGEMENTS
We thank Alum Rock Park for providing sampling permits;
NSF EAR 0909701 for support to respond to the earth-
quake, NASA for support in making measurements prior
to the earthquake, and the Miller Institute for Basic
Research in Science for supporting the analysis presented
here; the many colleagues, students and in particular family
members who assisted with sampling; Tim Rose for ideas
and geochemical analyses; Wenbo Yang for the O and H
isotope measurements; Linda Kalnejas for help with ion
chromatography measurements; Kelly Grivalja for calculat-
ing strain; the Santa Clara water district and staff for main-
taining the Penitencia Creek gauge and making corrected
data available; Chi Wang, Steve Ingebritsen, Bill Evans,
Stuart Rojstaczer and an anonymous reviewer for useful
suggestions. Model fitting was performed using gnuplot
(http://www.gnuplot.info/).
REFERENCES
Andrews DJ, Oppenheimer DH, Lienkamper JJ (1993) The miss-ing link between the Hayward and Calaveras faults. Journal ofGeophysical Research, 98, 12,083–95.
Bonini M (2009) Mud volcano eruptions and earthquakes in theApennines, Italy. Tectonophysics. (in press).
Briggs RO (1991) Effects of Loma Prieta earthquake on sur-face water in Waddell Valley. Water Resources Bulletin, 27,991–9.
Response of springs to earthquakes 249
" 2009 Blackwell Publishing Ltd, Geofluids, 9, 237–250

Brodsky EE, Roeloffs E, Woodcock D, Gall I, Manga M (2003) Amechanism for sustained ground water pressure changes inducedby distant earthquakes. Journal of Geophysical Research, 108 doi:10.1029/2002JB002321.
Cappa CD, Hendricks MB, DePaolo, DJ, Cohen RC (2003)Isotopic fractionation of water during evaporation. Journalof Geophysical Research, 108, 4525, doi: 10.1029/2003JD003597.
Carslaw HS, Jaeger JC (1959) Conduction of Heat in Solids, 2ndedn, Oxford University Press, New York.
Charmoille A, Fabbri O, Mudry J, Guglielmi Y, Bertrand C(2005) Post-seismic permeability change in a shallow fracturedaquifer following a M-L 5.1 earthquake (Fourbanne karst aqui-fer, Jura outermost thrust unit, eastern France). GeophysicalResearch Letters, 32, L18406, doi: 10.1029/2005GL023859.
Claesson L, Skelton A, Graham C, Dietl C, Morth M, TorssanderP, Kockum I (2004) Hydrogeochemical changes before andafter a major earthquake. Geology, 32, 641–4.
Claesson L, Skelton A, Graham C, Morth CM (2007) The time-scale and mechanisms of fault sealing and water-rock interactionafter an earthquake. Geofluids, 7, 427–40.
Curry RR, Emery BA, Kidwell TG (1994) Sources and magnitudesof increased streamflow in the Santa Cruz Mountains for the1990 water year after the earthquake. US Geological Survey Pro-fessional Paper, 1551E, 31–50.
Dreger D, Romanowicz B (1994), Source characteristics of eventsin the San Francisco Bay Region. US Geological Survey Open FileReport, 94-176, 301–9.
Elkhoury JE, Brodsky EE, Agnew DC (2006) Seismic wavesincrease permeability. Nature, 441, 1135–8.
Gat JR (1996) Oxygen and hydrogen isotopes in the hydrologiccycle. Annual Reviews of Earth and Planetary Science, 24, 225–62.
Gratier JP, Favreau P, Renard F (2003) Modeling fluid transferalong California faults when integrating pressure solution cracksealing and compaction processes. Journal of GeophysicalResearch, 108, 2104.
Jang CS, Liu CW, Chia Y, Cheng LH, Chen YC (2008) Changesin hydrogeological properties of the River Choushui allunvialfan aquifer due to the 1999 Chi-Chi earthquake, Taiwan.Hydrogeology Journal, 16, 389–97.
Jonsson S, Segall P, Pedersen R, Bjornsson G (2003) Post-earth-quake ground movements correlated to pore-pressure transients.Nature, 424, 179–83.
King C-Y, Basler D, Presser TS, Evans WC, White LD, MinissaleA (1994) In search of earthquake-related hydrologic and chemi-cal changes along Hayward Fault. Applied Geochemistry, 9, 83–91.
Lawson AC (1908) The California Earthquake of April 18,1906, vol. 1. Report of the State Earthquake InvestigationCommission, Carnegie Institution of Washington, Washington,D.C.
Manga M (1996) Hydrology of spring-dominated streams in theOregon Cascades. Water Resources Research, 32, 2435–9.
Manga M (2001) Origin of postseismic streamflow changesinferred from baseflow recession and magnitude-distance rela-tions. Geophysical Research Letters, 28, 2133–6.
Manga M, Brodsky EE, Boone M (2003) Response of streamflowto multiple earthquakes and implications for the origin ofpostseismic discharge changes. Geophysical Research Letters,30.doi: 10.1029/2002GL016618.
Manga M, Brumm M, Rudolph ML (2009) Earthquake triggeringof mud volcanos: a review. Marine and Petroleum Geology, inpress. doi: 10.1016/j.marpetgeo.2009.01.019.
Mellors R, Kilb D, Aliyev A, Gasanov A, Yetirmishli G (2007)Correlations between earthquakes and large mud volcano erup-tions. Journal of Geophysical Research, 112, B034304, doi:101029/2006JB004489.
Montgomery DR, Manga M (2003) Streamflow and water wellresponses to earthquakes. Science, 300, 2047–49.
Montgomery DR, Greenberg HM, Smith DT (2003) Streamflowresponse to the Nisqually earthquake. Earth and PlanetaryScience Letters, 209, 19–28.
Muir-Wood R, King GCP (1993) Hydrological signatures of earth-quake strain. Journal of Geophysical Research, 98, 22,035–68.
Pollitz FF (1996) Coseismic deformation from earthquake faultingon a layered spherical earth. Geophysical Journal International,125, 1–14.
Press WH, Teukolsky SA, Vetterling WT, Flannery BP (1992)Numerical Recipes: The Art of Scientific Computing, 2nd edn.Cambridge University Press, New York.
Roeloffs EA (1996) Poroelastic techniques in the study of earth-quake-related hydrologic phenomena. Advances in Geophysics,37, 135–95.
Roeloffs EA (1998) Persistent water level changes in a well nearParkfield, California, due to local and distant earthquakes. Jour-nal of Geophysical Research, 103, 869–89.
Rojstaczer S, Wolf S (1992) Permeability changes associated withlarge earthquakes: an example from Loma Prieta, California.Geology, 20, 211–14.
Rojstaczer S, Wolf S, Michel R (1995) Permeability enhancementin the shallow crust as a cause of earthquake-induced hydrologi-cal changes. Nature, 373, 237–9.
Rowland JC, Manga M, Rose TP (2008) The influence of poorlyinterconnected fault zone flow paths on spring geochemistry.Geofluids, 8, 93–101.
Sato T, Sakai R, Furuya K, Kodama T (2000) Coseismic springflow changes associated with the 1995 Kobe earthquake. Geo-physical Research Letters, 27, 1219–22.
Sibson RH (1994) Crustal stress, faulting and fluid flow. Geologi-cal Society of London, Special Publication, 78, 69–84.
Stejskal V, Malek J, Novotny O (2008) Variations in dischargeand temperature of mineral springs at the Frantiskovy LazneSpa, Czech Republic, duing a nearby earthquake swarm. StudiaGeophysica eet Geodaetica, 52, 589–606.
Tokunaga T (1999) Modeling of earthquake-induced hydrologicalchanges and possible permeability enhancement due to 17 Janu-ary 1995 Kobe earthquake Japan. Journal of Hydrology, 223,221–9.
Wakita H (1975) Water wells as possible indicators of tectonicstrain. Science, 189, 553–55.
Wang C-Y (2007) Liquefaction beyond the near field. Seismologi-cal Research Letters, 78, 512–7.
Wang C-Y, Wang C-H, Manga M (2004a) Coseismic release ofwater from mountains: evidence from the 1999 (Mw ! 7.5)Chi-Chi, Taiwan, earthquake. Geology, 32, 769–72.
Wang C-Y, Dreger D, Manga D, Wong A (2004b) Streamflowincrease due to rupturing of hydrothermal reservoirs: evidencefrom the 2003 San Simeon, California, earthquake. GeophysicalResearch Letters, 31, L10502, doi: 10.1029/2004GL020124.
Wang C-Y, Wong A, Dreger DS, Manga M (2006) Liquefactionlimit during earthquakes and underground explosions: implica-tions on ground-motion attenuation. Bulletin Seismological Soci-ety America, 96, 355–63.
Yechieli Y, Bein A (2002) Response of groundwater systems in theDead Sea Rift Valley to the Nuweiba earthquake: changes in head,water chemistry, and near-surface effects. Journal of GeophysicalResearch, 107, 2332, doi: 10.1029/2001JB001100.
250 M. MANGA & J. C. ROWLAND
" 2009 Blackwell Publishing Ltd, Geofluids, 9, 237–250
Related Documents