RESOURCES

RESOURCES. Resources A. Natural Resources B. Human Resources C. Infrastructure D. Technology.
Dec 26, 2015
Welcome message from author
This document is posted to help you gain knowledge. Please leave a comment to let me know what you think about it! Share it to your friends and learn new things together.
Transcript

RESOURCES

Resources
A. Natural Resources
B. Human Resources
C. Infrastructure
D. Technology

A. Natural Resources
Income from resource extraction can technically lead to higher GDP per hour…..
GNI per capita, Atlas method (current US$) 2012
Bermuda 104610
Norway 98880
Switzerland 80950
Qatar 78060
Luxembourg 71810
Macao SAR, China 64050
Denmark 59860
Australia 59790
Sweden 56120

Oil ReservesLink to BP Statistical Review of World Energy 2012

Resource Curse• Some scholars argue that countries “blessed” with
large endowment of mineral resources suffer slow growth.• Creates social conflict over control of natural resources.• Leads to unaccountable government.
• Ex 1. Conflict Diamonds Link
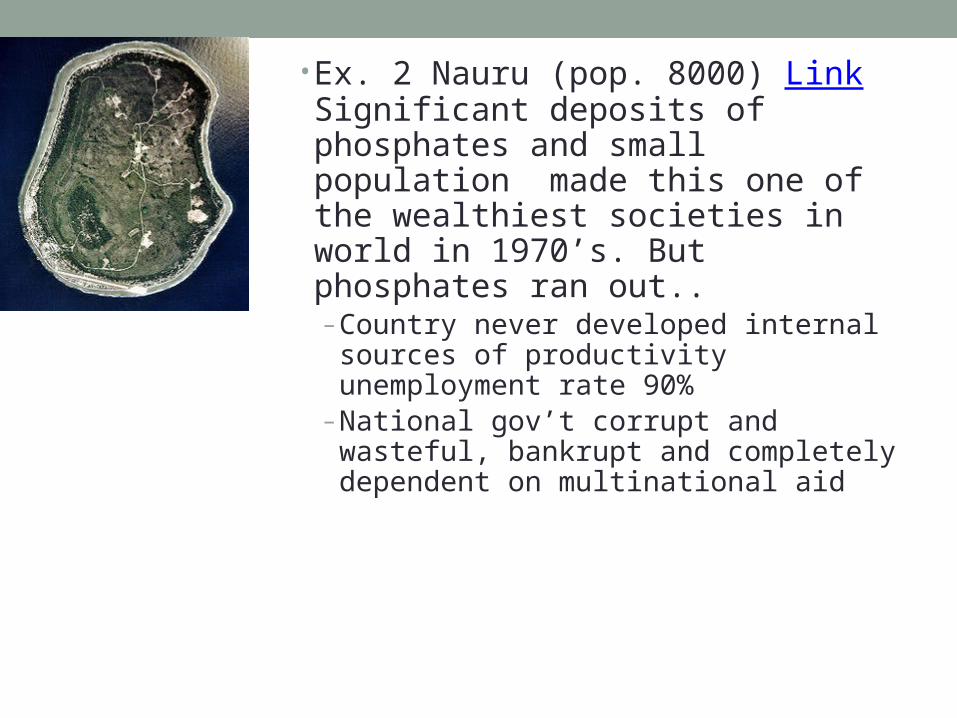
• Ex. 2 Nauru (pop. 8000) Link Significant deposits of phosphates and small population made this one of the wealthiest societies in world in 1970’s. But phosphates ran out.. – Country never developed internal sources
of productivity unemployment rate 90%– National gov’t corrupt and wasteful,
bankrupt and completely dependent on multinational aid

Is the resource curse true?
• Recent studies question these results, but findings suggest that positive productivity spillovers to non-resource industries are questionable. (Link Requires registration)
• Chad –Doba Basin

Chad and Resource Development
1970
1972
1974
1976
1978
1980
1982
1984
1986
1988
1990
1992
1994
1996
1998
2000
2002
2004
2006
2008
2010
2012
0
100
200
300
400
500
600
700
800
GDP per Capita US$ 2005
GDP per Capita (Non Resource) GDP per Capita

NFI Across Countries
NFI/GDP 2009UN Main AggregatesChad -42.68%Russian Federation -3.23%China: Hong Kong SAR3.12%Liberia -20.14%China, People's Republic of -2.04%Switzerland 4.15%Ireland -16.94%Brazil -2.04%Haiti 9.62%Cambodia -15.64%India -0.13%Bangladesh 11.00%Angola -13.95%United States 0.28%Philippines 14.73%Chile -9.69% Bermuda 23.62%Panama -8.97% Lesotho 35.17%China: Macao SAR-6.03%Australia -4.65%
Source: United Nations Main Aggregates Database

TROPICAL COUNTRIES AND DEVELOPMENTDavid Bloom and Jeffrey D.Sachs, 1999, “Geography, Demography, and Economic Growth in Africa,” Brookings Papers on Economic Activity Link
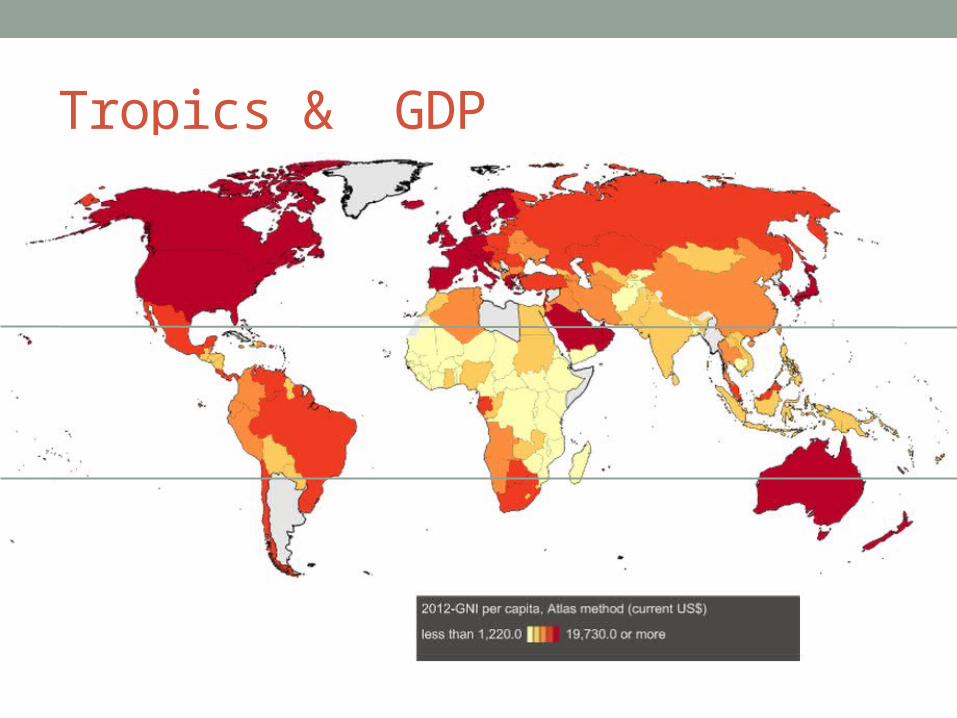
Tropics & GDP

Tropics and Development• Health risks worse in tropical areas.• Soil quality lower.• Agricultural technology does not translate from rich
temperate zones to tropics.• Relative lack of navigable rivers.

Malaria

Agriculture Productivity


Scale Economies & Poverty Traps
LandProductivity
Scale
Subsistence
Development occurs through stages but African conditions prevent the most basic stage from generating enough returns to move to the next stage.

Millennium Villages• Millennium Project – Intensive intervention in health, education,
knowledge and infrastructure at the village level to get citizens out of the trap.
Link

Poverty Indicators DecreasingSub-saharan Africa
1990
[YR19
90]
1991
[YR19
91]
1992
[YR19
92]
1993
[YR19
93]
1994
[YR19
94]
1995
[YR19
95]
1996
[YR19
96]
1997
[YR19
97]
1998
[YR19
98]
1999
[YR19
99]
2000
[YR20
00]
2001
[YR20
01]
2002
[YR20
02]
2003
[YR20
03]
2004
[YR20
04]
2005
[YR20
05]
2006
[YR20
06]
2007
[YR20
07]
2008
[YR20
08]
2009
[YR20
09]
2010
[YR20
10]
2011
[YR20
11]
2012
[YR20
12]
0
10
20
30
40
50
60
70
80
Millenium Development Goals
Poverty gap at $1.25 a day (PPP) (%) Primary completion rate, total (% of relevant age group)

Growth Acceleration

1982
1983
1984
1985
1986
1987
1988
1989
1990
1991
1992
1993
1994
1995
1996
1997
1998
1999
2000
2001
2002
2003
2004
2005
2006
2007
2008
2009
2010
2011
0.00%
20.00%
40.00%
60.00%
80.00%
100.00%
120.00%
140.00%
160.00%
Agricultural Productivity in Africa
Relative to World Relative to SSA in 2000

B. Human Capital• Measures skill, education level of the work force.• General (broad primary & secondary education & health) or
specific skills (technical skills obtained at tertiary level).
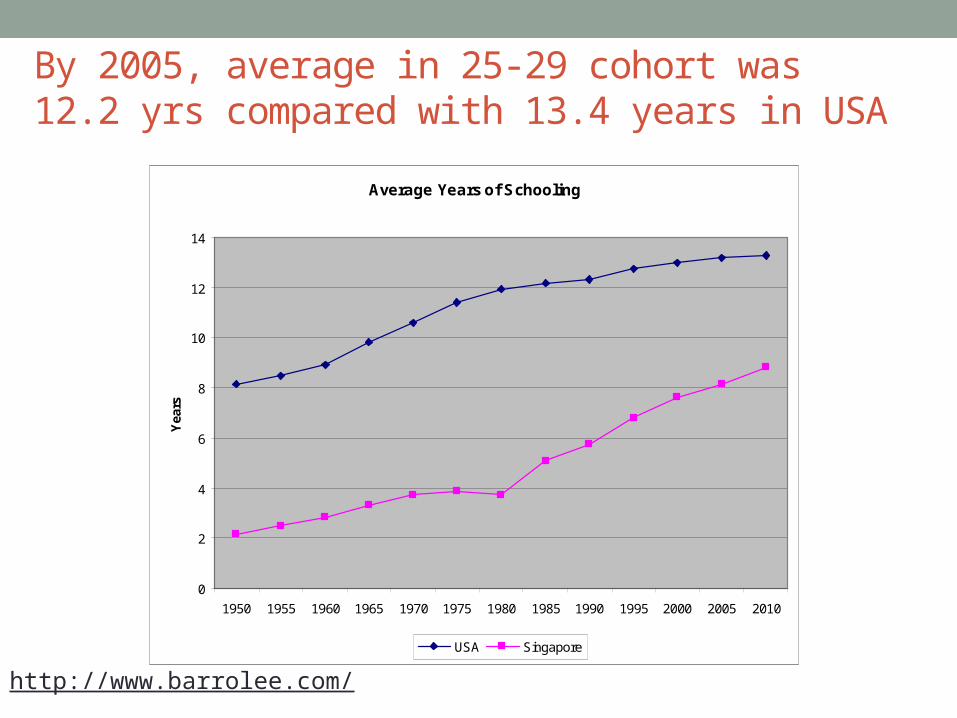
By 2005, average in 25-29 cohort was 12.2 yrs compared with 13.4 years in USA
Average Years of Schooling
0
2
4
6
8
10
12
14
1950 1955 1960 1965 1970 1975 1980 1985 1990 1995 2000 2005 2010
Yea
rs
USA Singapore
http://www.barrolee.com/

Education• Literacy Rates: WDI• Years of Education Barro-Lee Dataset Link • Quality of Education: OECD Programme for International
Student Assessment (PISA) Summary Data Education Data
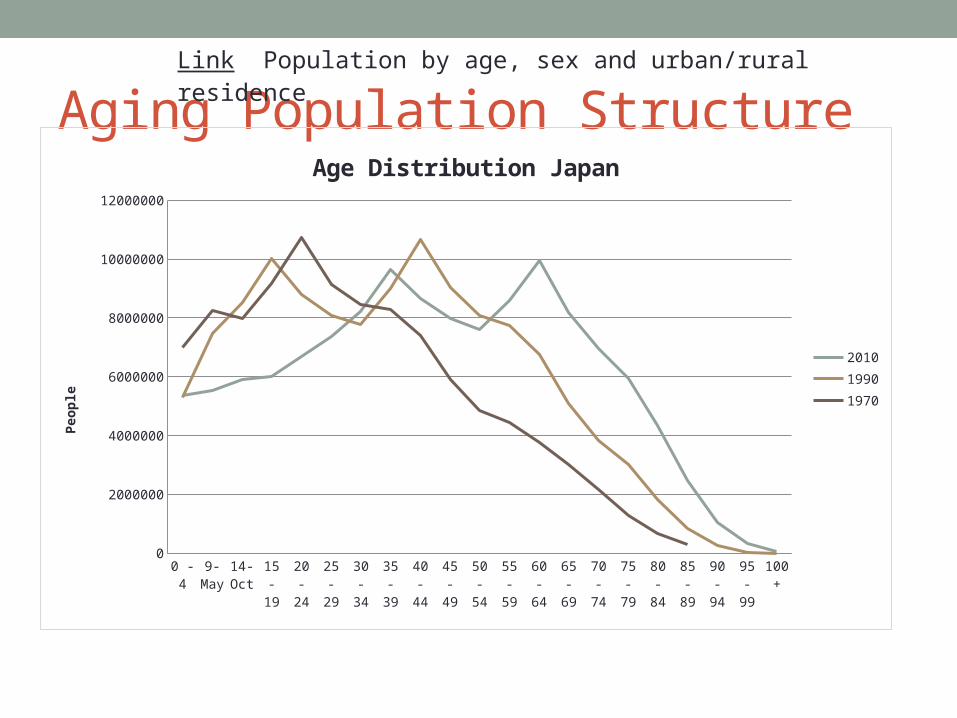
Aging Population Structure
0 - 4 9-May
14-Oct
15 - 19
20 - 24
25 - 29
30 - 34
35 - 39
40 - 44
45 - 49
50 - 54
55 - 59
60 - 64
65 - 69
70 - 74
75 - 79
80 - 84
85 - 89
90 - 94
95 - 99
100 +
0
2000000
4000000
6000000
8000000
10000000
12000000
Age Distribution Japan
2010
1990
1970
Peo
ple
Link Population by age, sex and urban/rural residence
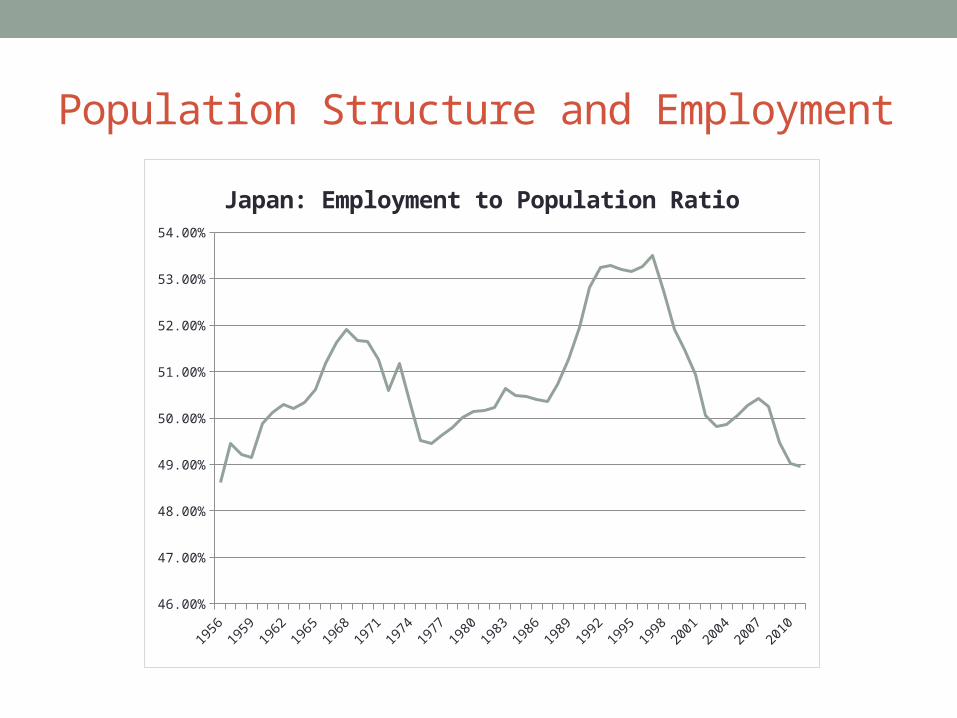
Population Structure and Employment
1956
1958
1960
1962
1964
1966
1968
1970
1972
1974
1976
1978
1980
1982
1984
1986
1988
1990
1992
1994
1996
1998
2000
2002
2004
2006
2008
2010
46.00%
47.00%
48.00%
49.00%
50.00%
51.00%
52.00%
53.00%
54.00%
Japan: Employment to Population Ratio

The Classic Demographic TransitionModel
Stage 1 Stage 2 Stage 3 Stage 4
Time
Naturalincrease
Birth rate
Death rate
Note: Natural increase is produced from the excess of births over deaths.
Link

Stages of Demographic Transition
1. Low Population Growth. High Birth Rates, High Death Rates
2. Population Growth Explosion. Medical Advances slow mortality rates, high population growth.
3. Slowing Population Growth. Educational Advances slow birth rates.
4. Low Population Growth. Low Birth Rates, Low Death Rates
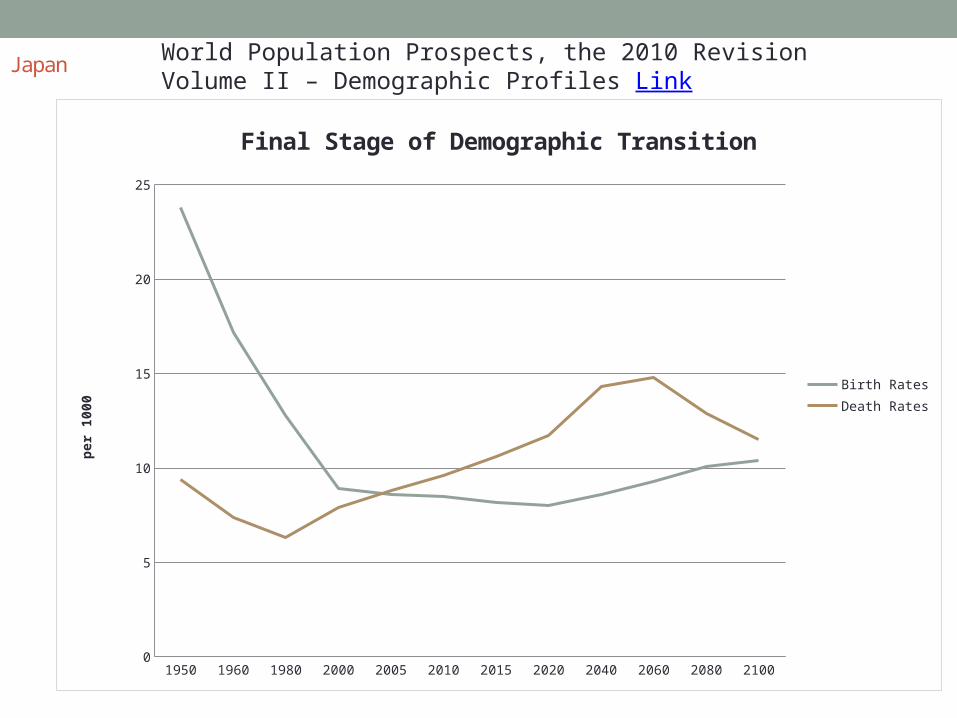
Japan
1950 1960 1980 2000 2005 2010 2015 2020 2040 2060 2080 21000
5
10
15
20
25
Final Stage of Demographic Transition
Birth Rates
Death Rates
per
100
0
World Population Prospects, the 2010 RevisionVolume II – Demographic Profiles Link
1950
1955
1960
1965
1970
1975
1980
1985
1990
1995
2000
2005
2010
2015
2020
2025
2030
2035
2040
2045
2050
2055
2060
2065
2070
2075
2080
2085
2090
2095
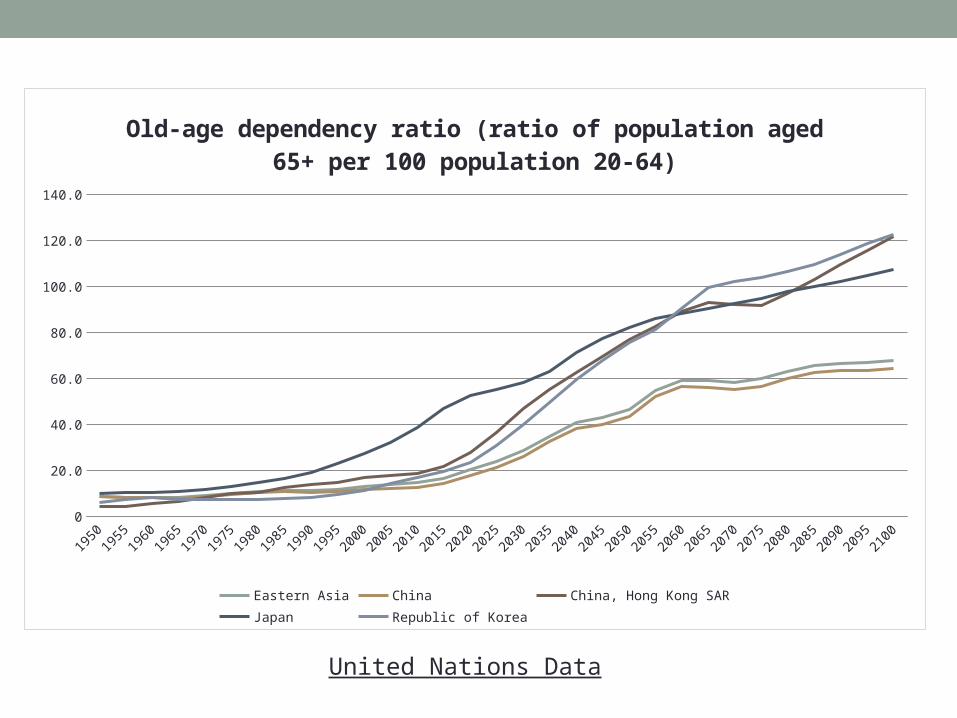
2100
0
20.0
40.0
60.0
80.0
100.0
120.0
140.0
Old-age dependency ratio (ratio of population aged 65+ per 100 population 20-64)
Eastern Asia China China, Hong Kong SAR Japan Republic of Korea
United Nations Data
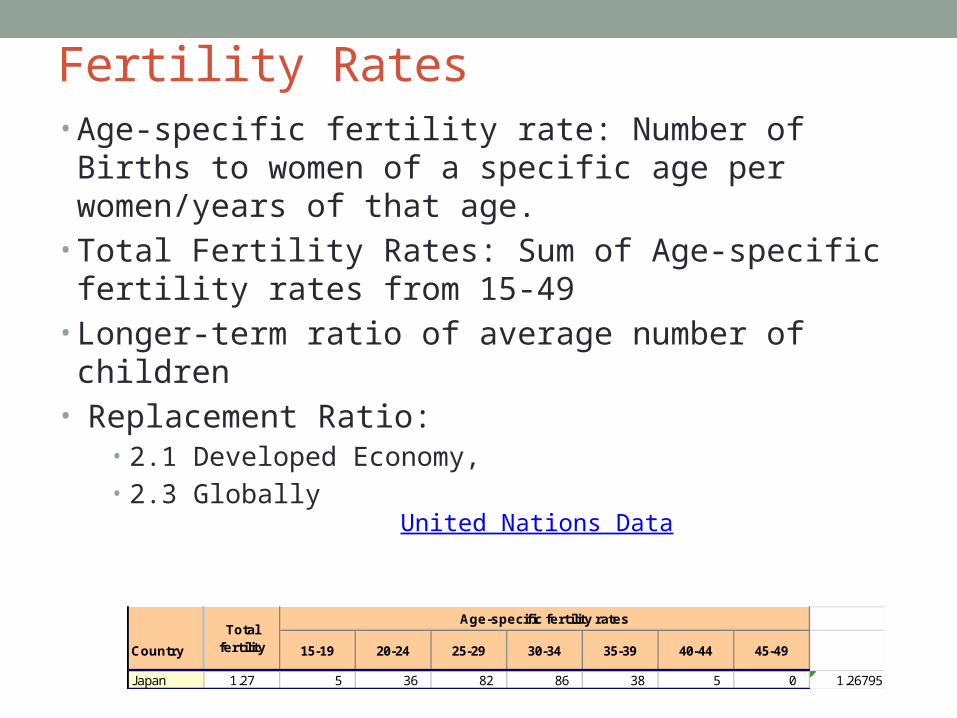
Fertility Rates• Age-specific fertility rate: Number of Births to women of a
specific age per women/years of that age.• Total Fertility Rates: Sum of Age-specific fertility rates
from 15-49• Longer-term ratio of average number of children• Replacement Ratio:
• 2.1 Developed Economy, • 2.3 Globally
Country 15-19 20-24 25-29 30-34 35-39 40-44 45-49
Japan 1.27 5 36 82 86 38 5 0 1.26795
Total fertility
Age-specific fertility rates
United Nations Data

High Income OECD

C. Infrastructure
Air transport, freight
4000
5000
6000
7000
8000
9000
10000
11000
12000
13000
14000
2000 2001 2002 2003 2004 2005 2006 2007 2008 2009
(mill
ion
to
n-k
m)
Singapore Hong Kong SAR, China
http://data.worldbank.org/data-catalog/world-development-indicators

Secure Internet servers
0
100
200
300
400
500
600
2003 2004 2005 2006 2007 2008 2009 2010
(per
1 m
illio
n p
eop
le)
Singapore Hong Kong SAR, China
http://data.worldbank.org/data-catalog/world-development-indicators


D. Technology Capacity• Capacity for scientific advance measurable along a number of
dimensions. UNESCO Data
1998 1999 2000 2001 2002 2003 2004 2005 2006 2007 2008 2009 20100
0.5
1
1.5
2
2.5
3
Expenditure on R&D as % of GDP
Hong Kong Singapore
Link

Technical Workforce
1998 1999 2000 2001 2002 2003 2004 2005 2006 2007 2008 2009 20100
0.2
0.4
0.6
0.8
1
1.2
Technicians per 1000
Hong Kong Singapore
Link

http://www.uspto.gov/web/offices/ac/ido/oeip/taf/reports.htm
Utility Patents by Year
0
100
200
300
400
500
600
700
1963
1965
1967
1969
1971
1973
1975
1977
1979
1981
1983
1985
1987
1989
1991
1993
1995
1997
1999
2001
2003
2005
2007
2009
SINGAPORE CHINA,HONG KONG S.A.R.
Related Documents