Wind Energy – Chapter 13 Resources and Technologies Energy Systems Engineering

Welcome message from author
This document is posted to help you gain knowledge. Please leave a comment to let me know what you think about it! Share it to your friends and learn new things together.
Transcript

Wind Energy – Chapter 13Resources and Technologies
Energy Systems Engineering
Source: F Vanek, L Albright, and L Angenent. (2012) Energy Systems Engineering: Evaluation and Implementation, 2nd Ed., McGraw-Hill.
This slide may be distributed as long as this attribution is maintained with the slide.
Further Readings
David Spera, Ed., “Wind Turbine Technology: Fundamental Concepts of Wind Turbine Engineering”, ASME Press, New York, 1994.
Manwell, J et al (2002) “Wind Energy Explained.” Wiley, West Sussex, 2003.
Source: F Vanek, L Albright, and L Angenent. (2012) Energy Systems Engineering: Evaluation and Implementation, 2nd Ed., McGraw-Hill.
This slide may be distributed as long as this attribution is maintained with the slide.
Learning Objectives Understanding wind data
Estimating available wind using statistics
Overview of turbine function
Actuator disc model
Blade element theory
Economics of wind energy
Other design issues and consideration of local impacts
Future of turbine design
Integrating wind and other intermittent sources into the grid

Source: F Vanek, L Albright, and L Angenent. (2012) Energy Systems Engineering: Evaluation and Implementation, 2nd Ed., McGraw-Hill.
This slide may be distributed as long as this attribution is maintained with the slide.
Key Concepts Energy source
Wind = solar energy converted to kinetic energy
Terminology
Distinction between “mill” and “turbine”
Two basic types:
Horizontal Axis Wind Turbine (HAWT)
Vertical Axis Wind Turbine (VAWT)
Modern turbine depends on
Aerospace technology
Modern materials engineering
Sophisticated fluid mechanics
Precise electronic controls
Source: F Vanek, L Albright, and L Angenent. (2012) Energy Systems Engineering: Evaluation and Implementation, 2nd Ed., McGraw-Hill.
This slide may be distributed as long as this attribution is maintained with the slide.
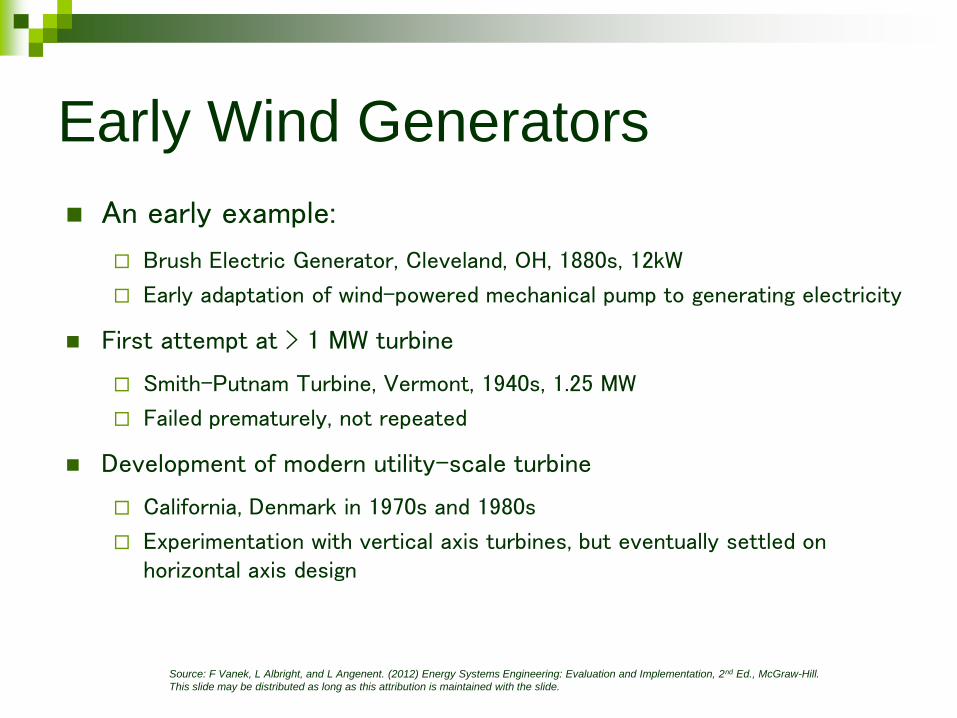
Early Wind Generators
An early example:
Brush Electric Generator, Cleveland, OH, 1880s, 12kW
Early adaptation of wind-powered mechanical pump to generating electricity
First attempt at > 1 MW turbine
Smith-Putnam Turbine, Vermont, 1940s, 1.25 MW
Failed prematurely, not repeated
Development of modern utility-scale turbine
California, Denmark in 1970s and 1980s
Experimentation with vertical axis turbines, but eventually settled on horizontal axis design

Source: F Vanek, L Albright, and L Angenent. (2012) Energy Systems Engineering: Evaluation and Implementation, 2nd Ed., McGraw-Hill.
This slide may be distributed as long as this attribution is maintained with the slide.
Madison Wind Farm, Madison, NYSource: www.photosfromonhigh.com
Source: F Vanek, L Albright, and L Angenent. (2012) Energy Systems Engineering: Evaluation and Implementation, 2nd Ed., McGraw-Hill.
This slide may be distributed as long as this attribution is maintained with the slide.
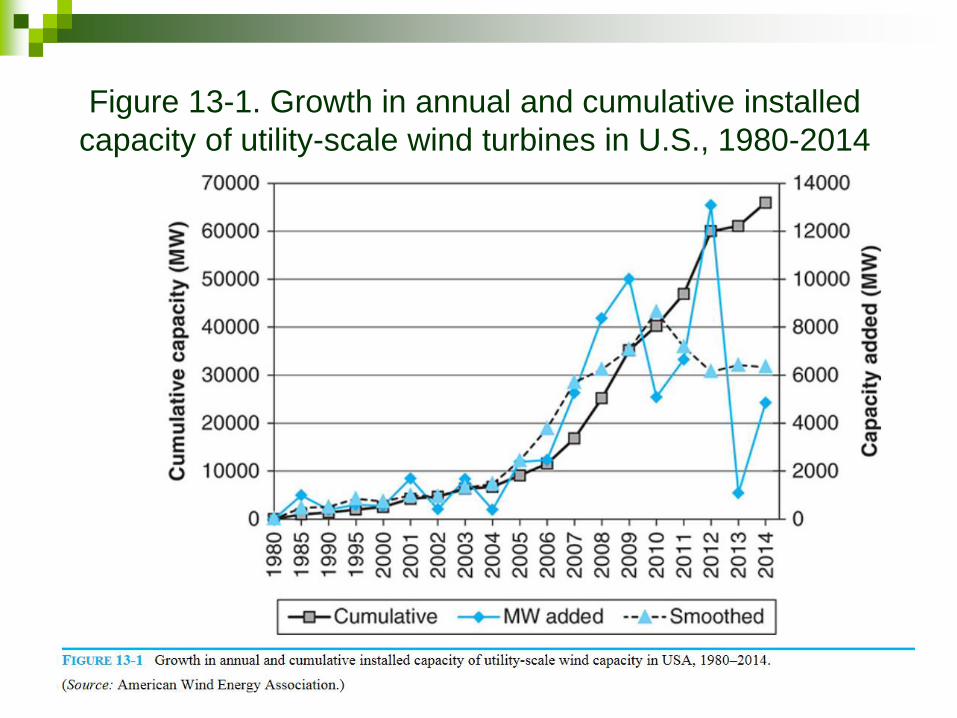
Figure 13-1. Growth in annual and cumulative installed
capacity of utility-scale wind turbines in U.S., 1980-2014
Source: American Wind Energy Association

Source: F Vanek, L Albright, and L Angenent. (2012) Energy Systems Engineering: Evaluation and Implementation, 2nd Ed., McGraw-Hill.
This slide may be distributed as long as this attribution is maintained with the slide.
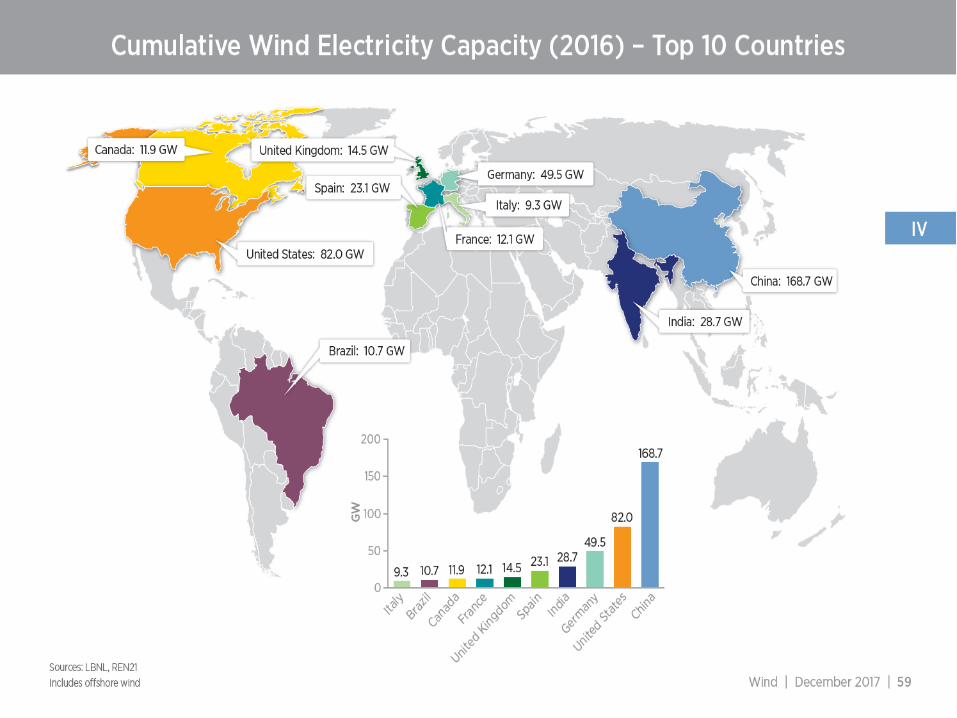
Figure 13-2. Total installed capacity, 2005 and 2010
Source: Global Wind Energy Consortium
Total = 59.1 GW Total = 195.0 GW

Source: F Vanek, L Albright, and L Angenent. (2012) Energy Systems Engineering: Evaluation and Implementation, 2nd Ed., McGraw-Hill.
This slide may be distributed as long as this attribution is maintained with the slide.
Figure 13-5. Main parts of a utility-scale wind turbine
Not to scale
Fluid dynamics
Material advances
•Lighter, stronger and more efficient
assemblies
•Increased swept areas
•Slower blade speeds
•Taller towers
Blades rotate along the ‘roll’ axis
Nacelle rotates along the ‘yaw’ axis
Most utility scale towers have 3 blades
•Trade off between energy extraction
efficiency, cost and weight.

Source: F Vanek, L Albright, and L Angenent. (2012) Energy Systems Engineering: Evaluation and Implementation, 2nd Ed., McGraw-Hill.
This slide may be distributed as long as this attribution is maintained with the slide.
Operating Requirements for HAWTs
Start, stop, and control output during operation
Assisted startup: use turbine as motor
Change pitch during operation to modulate power
Stopping function: “loss of load” emergency
Winds above design speed
Can also shed wind at high wind speeds
“Solidity” of blades: area of blades relative to total swept area

Source: F Vanek, L Albright, and L Angenent. (2012) Energy Systems Engineering: Evaluation and Implementation, 2nd Ed., McGraw-Hill.
This slide may be distributed as long as this attribution is maintained with the slide.
Vertical Axis Wind Turbine (VAWT)
No need for ‘yaw’ rotation Responds to wind from any directions
No utility scale VAWTs
Some 500 to 20KW units
Study continues
Source: F Vanek, L Albright, and L Angenent. (2012) Energy Systems Engineering: Evaluation and Implementation, 2nd Ed., McGraw-Hill.
This slide may be distributed as long as this attribution is maintained with the slide.
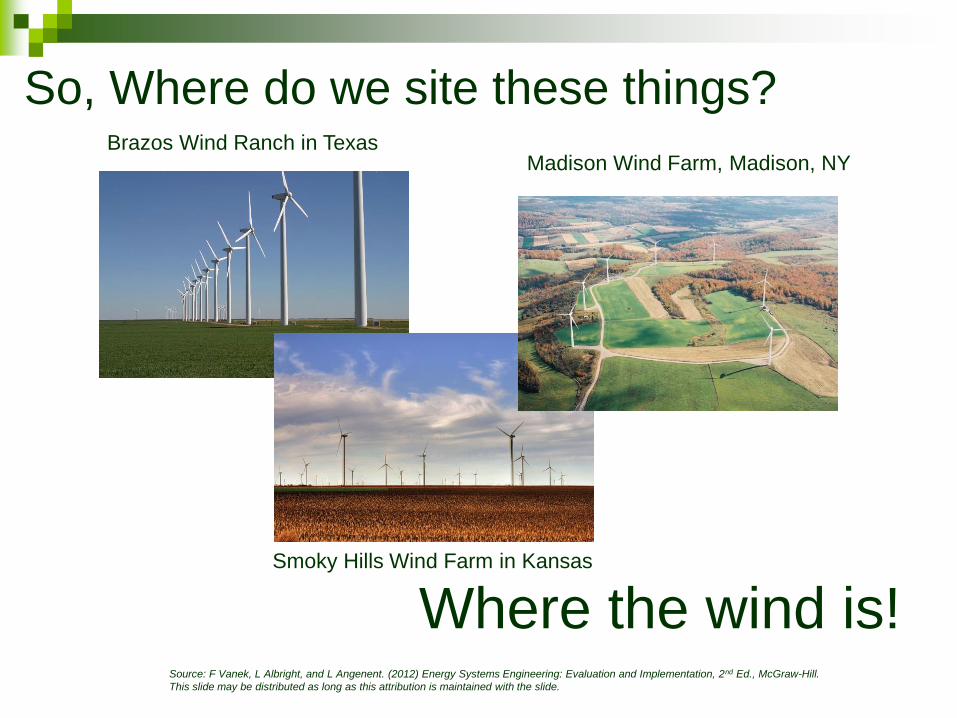
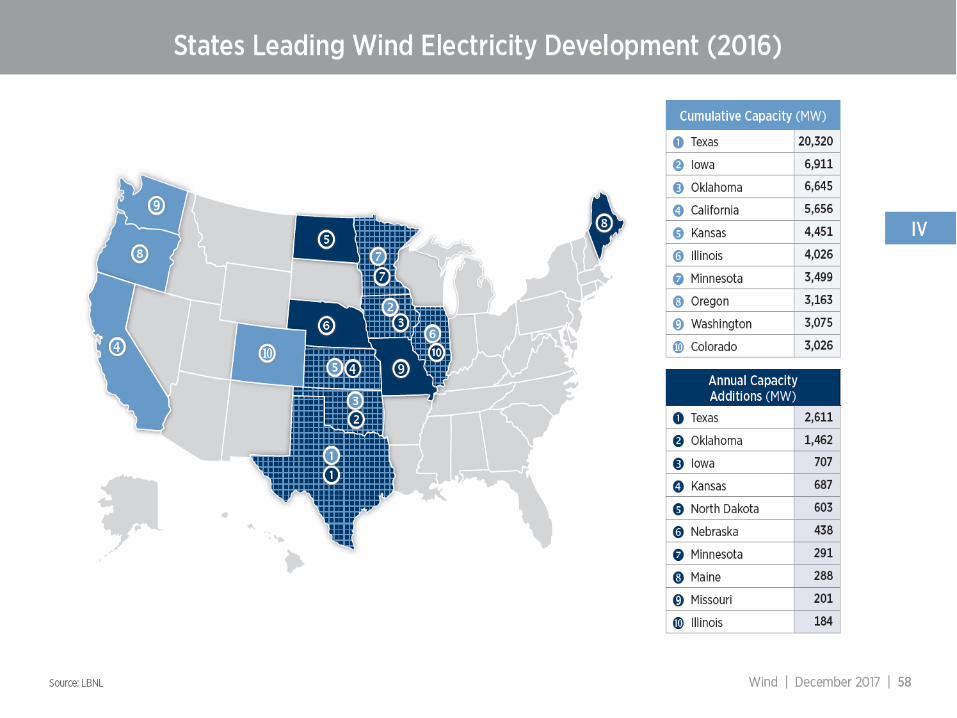
So, Where do we site these things?Brazos Wind Ranch in Texas
Where the wind is!
Madison Wind Farm, Madison, NY
Smoky Hills Wind Farm in Kansas

Source: F Vanek, L Albright, and L Angenent. (2012) Energy Systems Engineering: Evaluation and Implementation, 2nd Ed., McGraw-Hill.
This slide may be distributed as long as this attribution is maintained with the slide.

Source: F Vanek, L Albright, and L Angenent. (2012) Energy Systems Engineering: Evaluation and Implementation, 2nd Ed., McGraw-Hill.
This slide may be distributed as long as this attribution is maintained with the slide.

Source: F Vanek, L Albright, and L Angenent. (2012) Energy Systems Engineering: Evaluation and Implementation, 2nd Ed., McGraw-Hill.
This slide may be distributed as long as this attribution is maintained with the slide.

Source: F Vanek, L Albright, and L Angenent. (2012) Energy Systems Engineering: Evaluation and Implementation, 2nd Ed., McGraw-Hill.
This slide may be distributed as long as this attribution is maintained with the slide.
Source: F Vanek, L Albright, and L Angenent. (2012) Energy Systems Engineering: Evaluation and Implementation, 2nd Ed., McGraw-Hill.
This slide may be distributed as long as this attribution is maintained with the slide.

Source: F Vanek, L Albright, and L Angenent. (2012) Energy Systems Engineering: Evaluation and Implementation, 2nd Ed., McGraw-Hill.
This slide may be distributed as long as this attribution is maintained with the slide.
Source: F Vanek, L Albright, and L Angenent. (2012) Energy Systems Engineering: Evaluation and Implementation, 2nd Ed., McGraw-Hill.
This slide may be distributed as long as this attribution is maintained with the slide.
Source: F Vanek, L Albright, and L Angenent. (2012) Energy Systems Engineering: Evaluation and Implementation, 2nd Ed., McGraw-Hill.
This slide may be distributed as long as this attribution is maintained with the slide.
Source: F Vanek, L Albright, and L Angenent. (2012) Energy Systems Engineering: Evaluation and Implementation, 2nd Ed., McGraw-Hill.
This slide may be distributed as long as this attribution is maintained with the slide.

Source: F Vanek, L Albright, and L Angenent. (2012) Energy Systems Engineering: Evaluation and Implementation, 2nd Ed., McGraw-Hill.
This slide may be distributed as long as this attribution is maintained with the slide.
We need to …
Understand wind data
Estimate available wind using statistics

Source: F Vanek, L Albright, and L Angenent. (2012) Energy Systems Engineering: Evaluation and Implementation, 2nd Ed., McGraw-Hill.
This slide may be distributed as long as this attribution is maintained with the slide.
Data Gathering for Wind Sites
For most sites, 1 year record predicts mean wind speed to
within accuracy of 10%
Importance of data from all seasons of year
E.g., summer versus winter usually different
Estimation of interannual variability nearly as important as
estimating mean annual wind
E.g., data gathering at Fenner wind farm, NY state
Average 7.7 m/s @ 65 meters, or 17.3 MPH
Gathered data for several years prior to installation at site
Resulting output from site in kWh of electricity varies + 5% from
predicted average from year to year

Source: F Vanek, L Albright, and L Angenent. (2012) Energy Systems Engineering: Evaluation and Implementation, 2nd Ed., McGraw-Hill.
This slide may be distributed as long as this attribution is maintained with the slide.
Table 13-2. Classification of wind resource by wind speed
range in m/s and mph at hub height of turbine
Source: F Vanek, L Albright, and L Angenent. (2012) Energy Systems Engineering: Evaluation and Implementation, 2nd Ed., McGraw-Hill.
This slide may be distributed as long as this attribution is maintained with the slide.
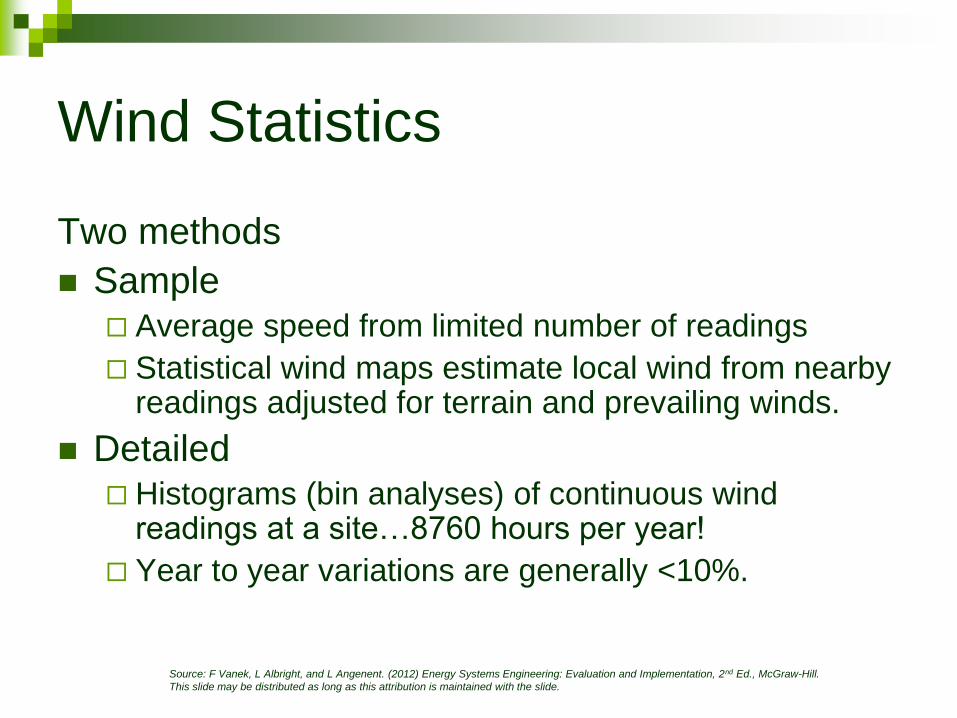
Wind Statistics
Two methods
Sample Average speed from limited number of readings
Statistical wind maps estimate local wind from nearby readings adjusted for terrain and prevailing winds.
Detailed Histograms (bin analyses) of continuous wind
readings at a site…8760 hours per year!
Year to year variations are generally <10%.

Source: F Vanek, L Albright, and L Angenent. (2012) Energy Systems Engineering: Evaluation and Implementation, 2nd Ed., McGraw-Hill.
This slide may be distributed as long as this attribution is maintained with the slide.
Hypothetical Year
About 40% of year is good to outstanding plus range (blue)
If we are OK up to 25 mph, then we have about 50% useful wind
We should expect about 220,000 kWh/year from our 50 kW turbine
Bin Min Max Hr/Year % Avg m/s
1 0 0 80 0.9 0
2 0 1 204 2.3 0.5
3 1 2 496 5.7 1.5
4 2 3 806 9.2 2.5
5 3 4 1211 13.8 3.5
6 4 5 1254 14.3 4.5
7 5 6 1246 14.2 5.5
8 6 7 1027 11.7 6.5
9 7 8 709 8.1 7.5
10 8 9 549 6.3 8.5
11 9 10 443 5.1 9.5
12 10 11 328 3.7 10.5
13 11 12 221 2.5 11.5
14 12 13 124 1.4 12.5
15 13 14 60 0.7 13.5
16 14No limit 2 0.02no record
8760
0
200
400
600
800
1000
1200
1400
1 2 3 4 5 6 7 8 9 10111213141516
Hr/Year
Hr/Year

Source: F Vanek, L Albright, and L Angenent. (2012) Energy Systems Engineering: Evaluation and Implementation, 2nd Ed., McGraw-Hill.
This slide may be distributed as long as this attribution is maintained with the slide.
No Detail Data, what then?
Rayleigh Distribution (special case of Wiebull Distribution) can be applied if average wind speed is known.
Calculates approximate bins based on Uavg, and the shape of the Rayleigh statistical curve
Accuracy depends on site conditions
Source: F Vanek, L Albright, and L Angenent. (2012) Energy Systems Engineering: Evaluation and Implementation, 2nd Ed., McGraw-Hill.
This slide may be distributed as long as this attribution is maintained with the slide.
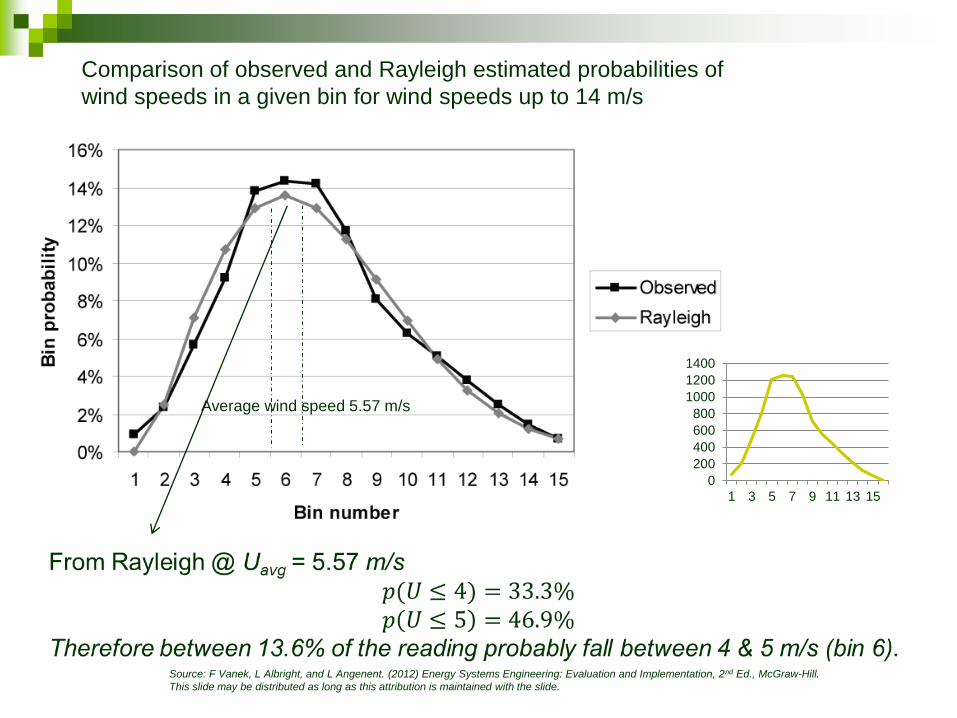
Comparison of observed and Rayleigh estimated probabilities of
wind speeds in a given bin for wind speeds up to 14 m/s
Average wind speed 5.57 m/s
0
200
400
600
800
1000
1200
1400
1 3 5 7 9 11 13 15

Source: F Vanek, L Albright, and L Angenent. (2012) Energy Systems Engineering: Evaluation and Implementation, 2nd Ed., McGraw-Hill.
This slide may be distributed as long as this attribution is maintained with the slide.
Statistical Wind Mapping
Uses statistical approach to predict wind at sites
without exhaustive measuring
Data inputs required
Prevailing winds
Elevation
Terrain
Calibrate & verify accuracy of mapping by comparing
to sites with known, measured wind data
Is the wind map’s prediction for these sites sufficiently
accurate?
Companies like AWS Truewind specialize in wind
mapping.

Source: F Vanek, L Albright, and L Angenent. (2012) Energy Systems Engineering: Evaluation and Implementation, 2nd Ed., McGraw-Hill.
This slide may be distributed as long as this attribution is maintained with the slide.
Wind Data Cautions
A Raleigh approximation might fit one set of
measured data very well, but may not accurately
predict another.
Small differences between predicted and actual are
important because available power varies with the
cube of wind speed!
Power per unit swept area, P = 0.5ρU3
ρ = air density, on the order of 1 kg/m3
Varies with elevation and climate
Example Pavg = 0.5(1.15)(5.57)3 = 99 W/m3
P14 = 0.5(1.15)(14)3 = 1578 W/m3
Big Difference

Source: F Vanek, L Albright, and L Angenent. (2012) Energy Systems Engineering: Evaluation and Implementation, 2nd Ed., McGraw-Hill.
This slide may be distributed as long as this attribution is maintained with the slide.
Figure 13-9. Comparison of observed and Rayleigh estimated
probabilities of wind speeds in a given bin for wind speeds up to 14 m/s

Source: F Vanek, L Albright, and L Angenent. (2012) Energy Systems Engineering: Evaluation and Implementation, 2nd Ed., McGraw-Hill.
This slide may be distributed as long as this attribution is maintained with the slide.
Observed vs. Estimated Power
Observed Raleigh for Uavg = 5.57 m/s Annual Power Output
Bin Min Max Bin % Min Cum Bin % Observed Estimated
1 0 0 0.9 0.00% 0.00% 0.0 0.0
2 0 1 2.3 0.00% 2.50% 0.0 0.0
3 1 2 5.7 2.50% 7.13% 1.0 1.2
4 2 3 9.2 9.63% 10.74% 7.2 8.5
5 3 4 13.8 20.37% 12.93% 29.8 27.9
6 4 5 14.3 33.31% 13.59% 65.6 62.4
7 5 6 14.2 46.89% 12.91% 119.0 108.2
8 6 7 11.7 59.80% 11.27% 161.8 155.9
9 7 8 8.1 71.07% 9.14% 172.1 194.2
10 8 9 6.3 80.21% 6.92% 194.9 214.1
11 9 10 5.1 87.13% 4.91% 220.2 212.2
12 10 11 3.7 92.05% 3.28% 215.7 191.2
13 11 12 2.5 95.33% 2.06% 191.5 158.0
14 12 13 1.4 97.39% 1.22% 137.7 120.5
15 13 14 0.7 98.61% 0.69% 86.8 85.1
16 14 No limit 0.02 99.30%
1603.5 1539.3
From Table 13-1
2)/)(4/(1 avgbin
binwindspeed eP
35.0 UP
• Very good agreement in this case
• But that is what we expected from the good curve fit
Another Approach
Multiply the average by (6/π)1/3 (the limit
of the average of the cube over the cube of
the averages)
(5.57)(2.66134) = 6.91m/s
P = 0.5(1.15)(6.91)3 = 18.97 W/m2
Annual output = 18.97)(8760) = 1662 kWh/m2
Using the straight average wind speed of 5.57 m/s
would have resulted in a low estimate of only 870
kWh/m2. This highlights the importance of the
higher wind speeds because of the ‘cubed effect’.
Source: F Vanek, L Albright, and L Angenent. (2012) Energy Systems Engineering: Evaluation and Implementation, 2nd Ed., McGraw-Hill.
This slide may be distributed as long as this attribution is maintained with the slide.
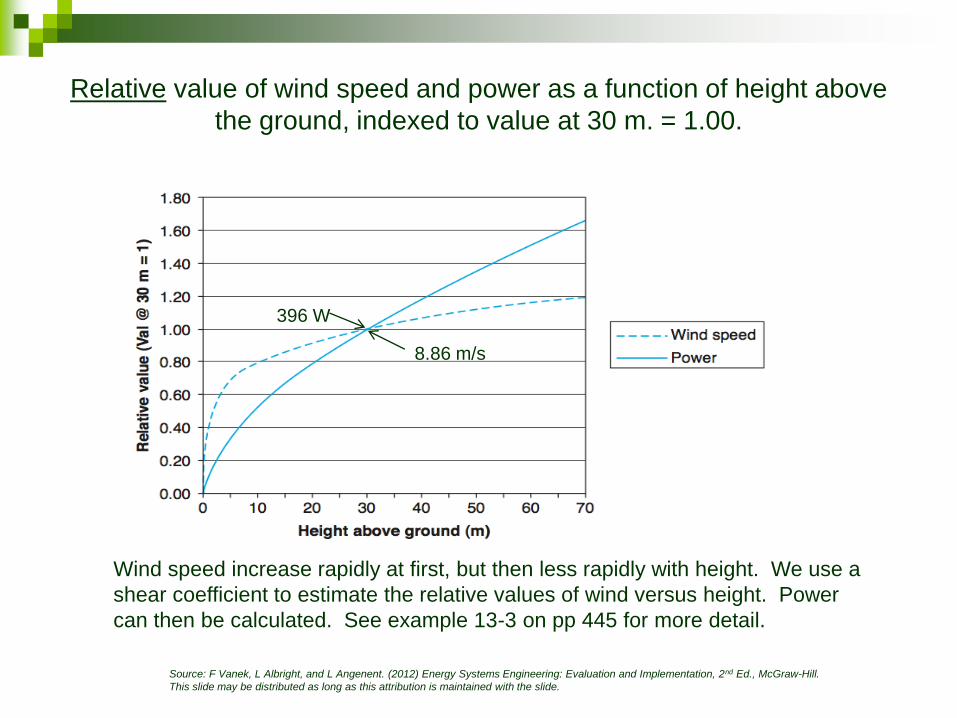
Relative value of wind speed and power as a function of height above
the ground, indexed to value at 30 m. = 1.00.
396 W
8.86 m/s
Wind speed increase rapidly at first, but then less rapidly with height. We use a
shear coefficient to estimate the relative values of wind versus height. Power
can then be calculated. See example 13-3 on pp 445 for more detail.

Source: F Vanek, L Albright, and L Angenent. (2012) Energy Systems Engineering: Evaluation and Implementation, 2nd Ed., McGraw-Hill.
This slide may be distributed as long as this attribution is maintained with the slide.
Figure 13-11. Seasonal distribution of wind speed in m/s by month of
year at proposed Enfield, New York, wind farm site (height =58m)
Source: F Vanek, L Albright, and L Angenent. (2012) Energy Systems Engineering: Evaluation and Implementation, 2nd Ed., McGraw-Hill.
This slide may be distributed as long as this attribution is maintained with the slide.
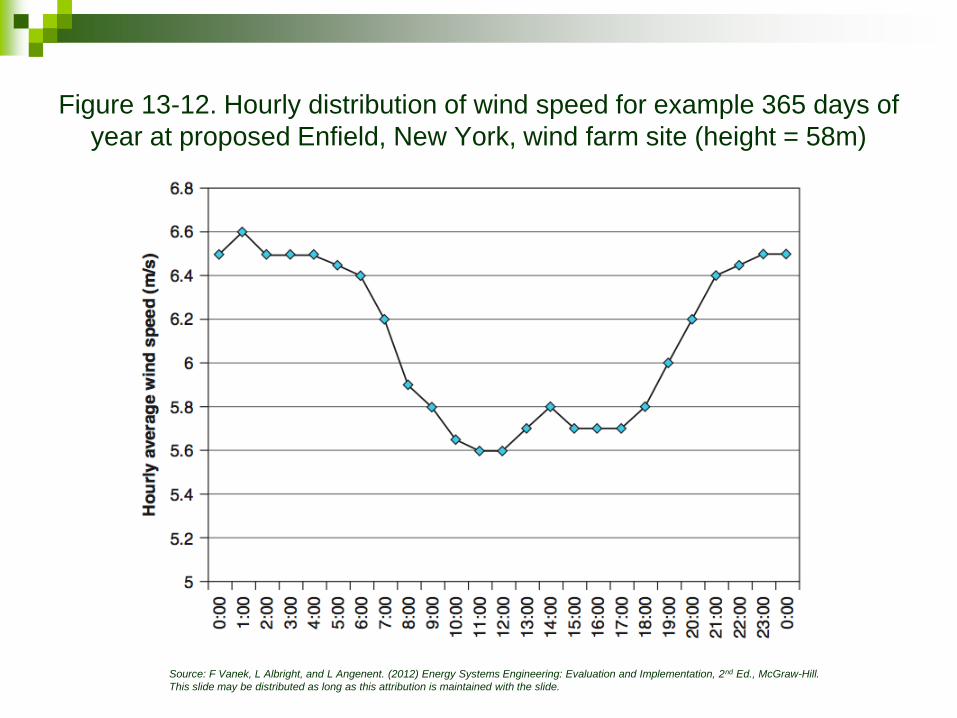
Figure 13-12. Hourly distribution of wind speed for example 365 days of
year at proposed Enfield, New York, wind farm site (height = 58m)
Source: F Vanek, L Albright, and L Angenent. (2012) Energy Systems Engineering: Evaluation and Implementation, 2nd Ed., McGraw-Hill.
This slide may be distributed as long as this attribution is maintained with the slide.
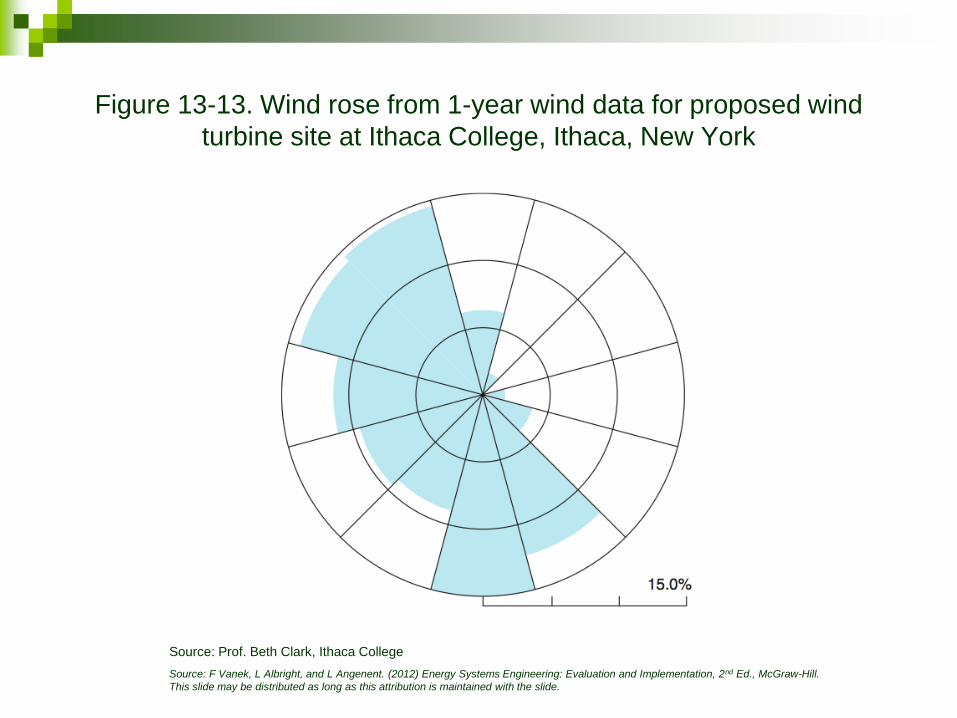
Figure 13-13. Wind rose from 1-year wind data for proposed wind
turbine site at Ithaca College, Ithaca, New York
Source: Prof. Beth Clark, Ithaca College

Source: F Vanek, L Albright, and L Angenent. (2012) Energy Systems Engineering: Evaluation and Implementation, 2nd Ed., McGraw-Hill.
This slide may be distributed as long as this attribution is maintained with the slide.
Turbine Operating Modes
Cut-in Speed – below which blades do not spin
Operating Range – Output increases rapidly with speed
High Operating Range – Output increases slow and at a point
load must be reduced
Fixed pitch blades are allowed to stall
Variable pitch blades reduce their pitch
Rated Wind Speed – speed of maximum output, will either hold
steady or decline with increases wind speed
Cut Out Speed – put on the brakes

Source: F Vanek, L Albright, and L Angenent. (2012) Energy Systems Engineering: Evaluation and Implementation, 2nd Ed., McGraw-Hill.
This slide may be distributed as long as this attribution is maintained with the slide.
Figure 13-14. Power curve for 1.5-MW turbine for wind
speeds from 0 to 21 m/s, with extraction efficiency

Source: F Vanek, L Albright, and L Angenent. (2012) Energy Systems Engineering: Evaluation and Implementation, 2nd Ed., McGraw-Hill.
This slide may be distributed as long as this attribution is maintained with the slide.
Table 13-3. Calculation of annual output for turbine with
power curve from Fig 13-14 and empirically measured
distribution at hypothetical site with Uavg= 8.4 m/s
Source: F Vanek, L Albright, and L Angenent. (2012) Energy Systems Engineering: Evaluation and Implementation, 2nd Ed., McGraw-Hill.
This slide may be distributed as long as this attribution is maintained with the slide.
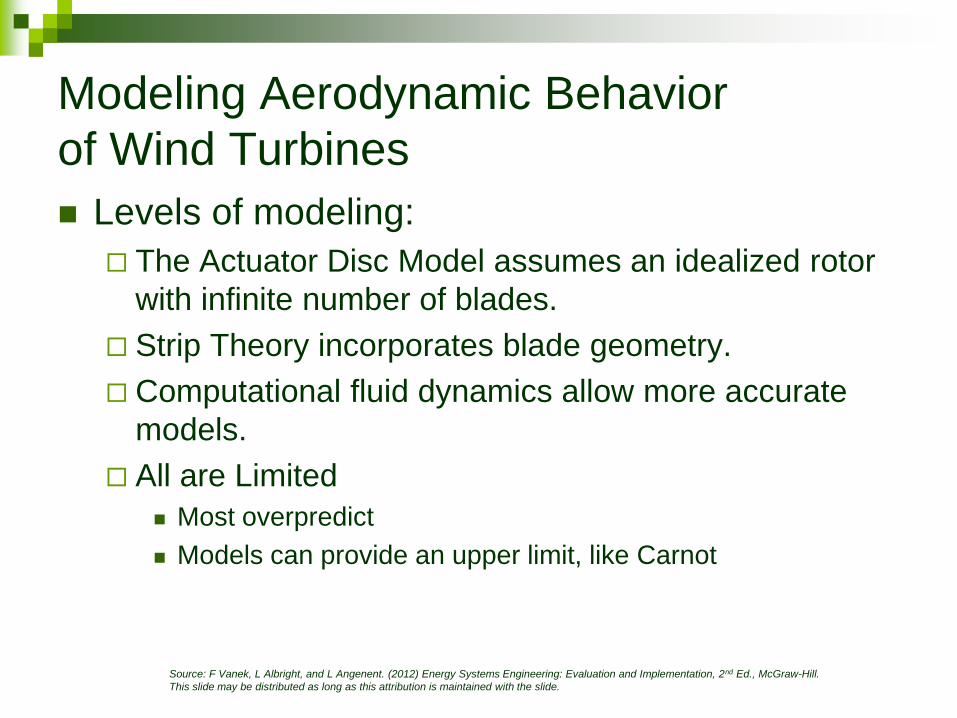
Modeling Aerodynamic Behavior
of Wind Turbines
Levels of modeling:
The Actuator Disc Model assumes an idealized rotor
with infinite number of blades.
Strip Theory incorporates blade geometry.
Computational fluid dynamics allow more accurate
models.
All are Limited
Most overpredict
Models can provide an upper limit, like Carnot

Source: F Vanek, L Albright, and L Angenent. (2012) Energy Systems Engineering: Evaluation and Implementation, 2nd Ed., McGraw-Hill.
This slide may be distributed as long as this attribution is maintained with the slide.
Actuator Disk Analysis
Rotates in plane perpendicular to wind
Composed of infinite number of blades
Translate wind energy into rotation
Like a Carnot engine
Cannot be built in practice
Useful to estimate theoretical limits
Assumptions
Incompressible fluid flow
No drag or friction
Uniform thrust over disk surface
No wake rotation
Steady state
Source: F Vanek, L Albright, and L Angenent. (2012) Energy Systems Engineering: Evaluation and Implementation, 2nd Ed., McGraw-Hill.
This slide may be distributed as long as this attribution is maintained with the slide.
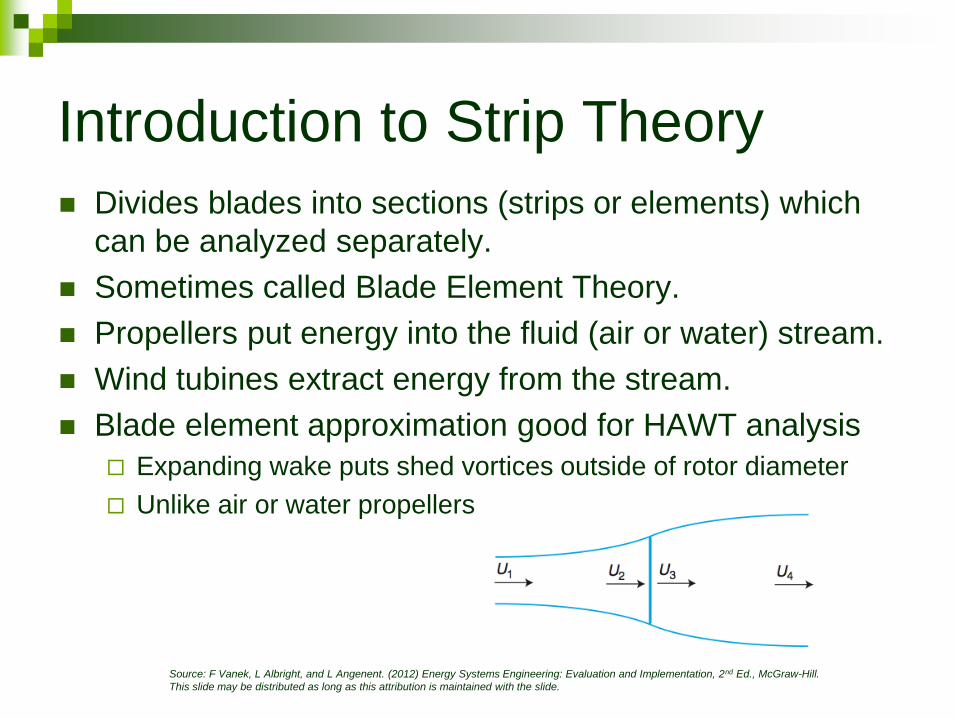
Introduction to Strip Theory
Divides blades into sections (strips or elements) which
can be analyzed separately.
Sometimes called Blade Element Theory.
Propellers put energy into the fluid (air or water) stream.
Wind tubines extract energy from the stream.
Blade element approximation good for HAWT analysis
Expanding wake puts shed vortices outside of rotor diameter
Unlike air or water propellers
Source: F Vanek, L Albright, and L Angenent. (2012) Energy Systems Engineering: Evaluation and Implementation, 2nd Ed., McGraw-Hill.
This slide may be distributed as long as this attribution is maintained with the slide.
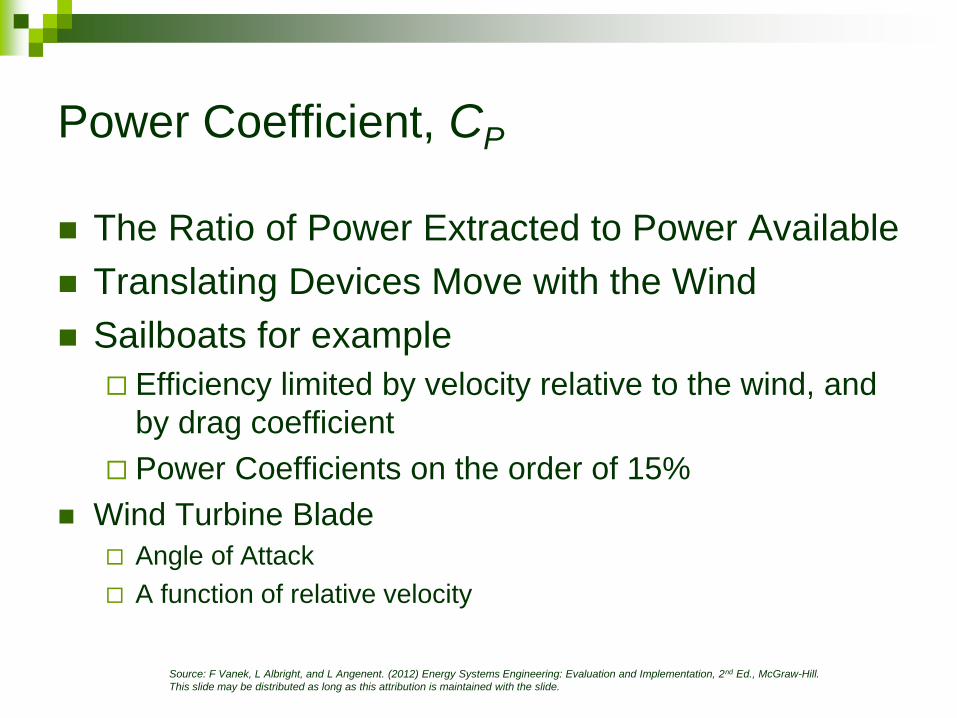
Power Coefficient, CP
The Ratio of Power Extracted to Power Available
Translating Devices Move with the Wind
Sailboats for example
Efficiency limited by velocity relative to the wind, and
by drag coefficient
Power Coefficients on the order of 15%
Wind Turbine Blade
Angle of Attack
A function of relative velocity

Source: F Vanek, L Albright, and L Angenent. (2012) Energy Systems Engineering: Evaluation and Implementation, 2nd Ed., McGraw-Hill.
This slide may be distributed as long as this attribution is maintained with the slide.
Figure 13-16. Winds and forces acting on a cross section of
a turbine blade, showing angle of attack between midline
of cross section and relative wind velocity Vr
Note that the blade is rotating up the page
Source: F Vanek, L Albright, and L Angenent. (2012) Energy Systems Engineering: Evaluation and Implementation, 2nd Ed., McGraw-Hill.
This slide may be distributed as long as this attribution is maintained with the slide.
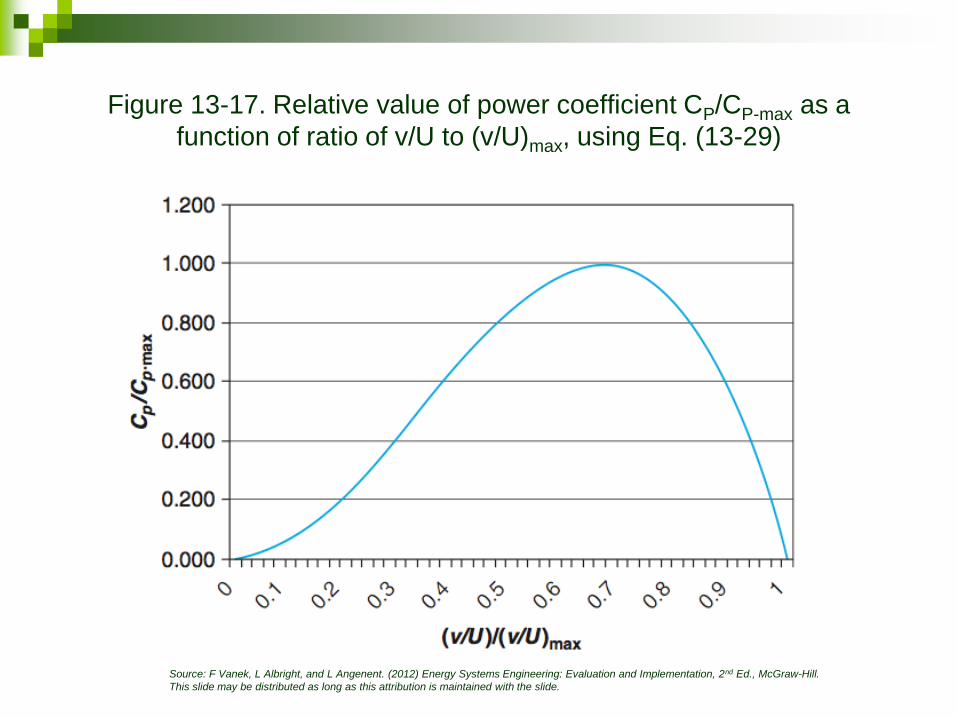
Figure 13-17. Relative value of power coefficient CP/CP-max as a
function of ratio of v/U to (v/U)max, using Eq. (13-29)

Source: F Vanek, L Albright, and L Angenent. (2012) Energy Systems Engineering: Evaluation and Implementation, 2nd Ed., McGraw-Hill.
This slide may be distributed as long as this attribution is maintained with the slide.
Tip Speed Ratio and Advance Ratio
TSR “λ”: λ = ΩR/U where
Ω is rotation speed in rad/s
R is swept area radius (length of blade) in m
U is free wind speed in m/s
Advance Ratio J: J = 1 / λ

Source: F Vanek, L Albright, and L Angenent. (2012) Energy Systems Engineering: Evaluation and Implementation, 2nd Ed., McGraw-Hill.
This slide may be distributed as long as this attribution is maintained with the slide.
Figure 13-18. Rotor power coefficient CPr as function of tip
speed ratio
Source: F Vanek, L Albright, and L Angenent. (2012) Energy Systems Engineering: Evaluation and Implementation, 2nd Ed., McGraw-Hill.
This slide may be distributed as long as this attribution is maintained with the slide.
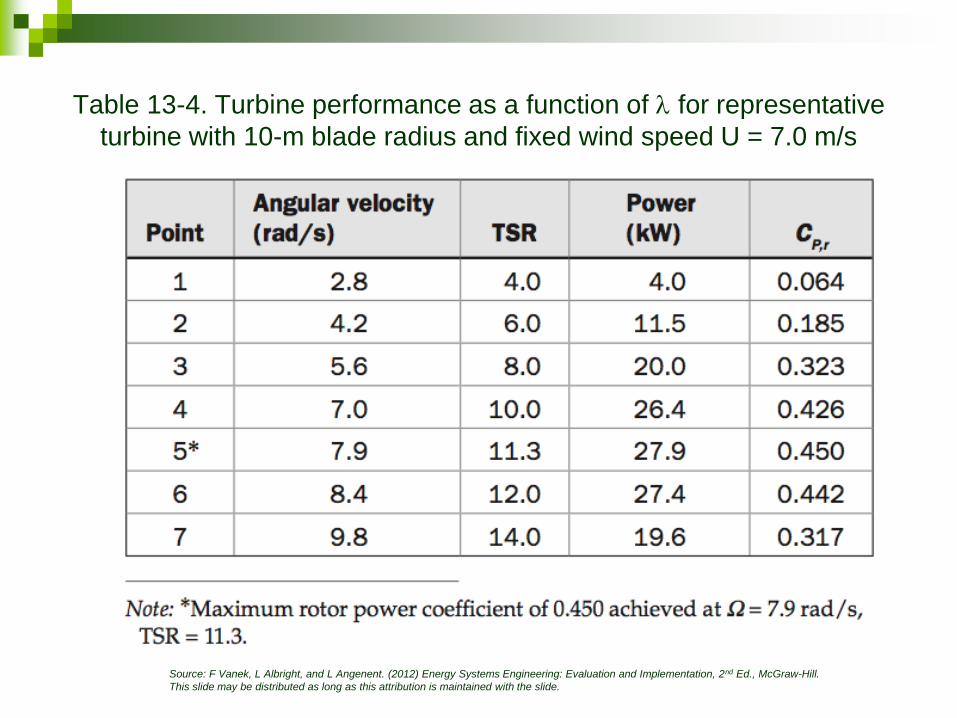
Table 13-4. Turbine performance as a function of for representative
turbine with 10-m blade radius and fixed wind speed U = 7.0 m/s

Source: F Vanek, L Albright, and L Angenent. (2012) Energy Systems Engineering: Evaluation and Implementation, 2nd Ed., McGraw-Hill.
This slide may be distributed as long as this attribution is maintained with the slide.
Economics of Wind
Choice of site using wind data
Land requirements
Cost elements: Installed capital cost: turbines + balance of system: roads,
cables, substations, etc
Operation & maintenance (~2% of cap charge)
Insurance, royalties, land rentals (~ 0.5%)
Balance of system costs ~ 20% of total capital costs for on-shore systems
Other factors e.g. Volatility of natural gas price gives wind a market advantage
Proximity to transmission line
Air quality permitting not required (advantage over fossil fuels)

Source: F Vanek, L Albright, and L Angenent. (2012) Energy Systems Engineering: Evaluation and Implementation, 2nd Ed., McGraw-Hill.
This slide may be distributed as long as this attribution is maintained with the slide.
Land Requirements for
Large-Scale Wind Production
Suppose we replace 500 average coal plants = 1 trillion kwhr/yr (100 million US avg. homes)
Take Fenner site as standard:
$1.5 M per turbine
7 turbines per sq mi
4.4 M kwhr per turbine per year
Number of turbines required: 230,000
Compare: goal of 230,000 MW installed in Europe by 2020
Area required: 33,000 sq mi (21% of North & South Dakota combined)
Cost: approx $350 billion
Source: F Vanek, L Albright, and L Angenent. (2012) Energy Systems Engineering: Evaluation and Implementation, 2nd Ed., McGraw-Hill.
This slide may be distributed as long as this attribution is maintained with the slide.
Effect of technological
advance on cost
Optimal size tradeoff: Energy increases with square of radius, turbine cost increases
with cube of radius
In functional form:
Net Benefit from increasing size = a*R2 - b*R3
Coefficients “a” and “b” depend on the technology
Technological improvement reduces value of coefficient “b” >> larger turbines
Advantage of slow speed: Less noise, fewer bird kills
Only possible with large turbines (~500 kW+), since they can better absorb gearing losses
Source: F Vanek, L Albright, and L Angenent. (2012) Energy Systems Engineering: Evaluation and Implementation, 2nd Ed., McGraw-Hill.
This slide may be distributed as long as this attribution is maintained with the slide.
Design Issues and Adverse Local
Environmental Impacts
Placement: given upwind obstacle w/ height H
Turbine should be min 2xH above and 20xH
downwind from obstacle
Visual effect on surroundings
Use photomontage to show visual effect of turbines
Noise: must meet local zoning requirements for
not exceeding noise limits
Source: F Vanek, L Albright, and L Angenent. (2012) Energy Systems Engineering: Evaluation and Implementation, 2nd Ed., McGraw-Hill.
This slide may be distributed as long as this attribution is maintained with the slide.
Layout Considerations for Wind Parks
Each turbine must have enough space around the post to rotate in any direction
Turbines in a line perpendicular to prevailing wind must have 2x rotor radius space to avoid collisions
Turbines along line of prevailing wind must have 5x to 10x rotor radius to avoid negative effects of turbulence

Source: F Vanek, L Albright, and L Angenent. (2012) Energy Systems Engineering: Evaluation and Implementation, 2nd Ed., McGraw-Hill.
This slide may be distributed as long as this attribution is maintained with the slide.
Impact on birds
Relative quantity of bird fatalities from collisions with turbines
Some number of birds killed each year due to striking turbines
However, the number is small compared to fatalities from cars, windows, cats, etc.
Changing turbine technology has helped birds
Slower rotation speed
Compare 100 kW turbine in California in 1980s vs 1.5 MW turbine today
Change from lattice-work to solid tower
Turbine tower does not encourage nesting
Wind energy helps birds over long term since it slows climate change

Source: F Vanek, L Albright, and L Angenent. (2012) Energy Systems Engineering: Evaluation and Implementation, 2nd Ed., McGraw-Hill.
This slide may be distributed as long as this attribution is maintained with the slide.
Future Objectives for Wind Power
Maximize turbine blade size (150 – 200 m diameter)
Offshore turbines on floating platforms, moored to bottom
Dynamic feathering of blades in real time to respond to changes in wind, maximize output
Urban wind turbine concepts for building tops Possibly large HAWTs atop buildings
Large or small VAWTs also envisioned

Source: F Vanek, L Albright, and L Angenent. (2012) Energy Systems Engineering: Evaluation and Implementation, 2nd Ed., McGraw-Hill.
This slide may be distributed as long as this attribution is maintained with the slide.
Using Software to Optimize
Wind Farm Layout
Data requirements
Topographical data
Wind data
Technology characteristics of turbines
Given number of devices, terrain, wind, optimizes location to maximize output

Source: F Vanek, L Albright, and L Angenent. (2012) Energy Systems Engineering: Evaluation and Implementation, 2nd Ed., McGraw-Hill.
This slide may be distributed as long as this attribution is maintained with the slide.
Integrating Wind into the Grid
Conventional (“dispatchable”) supply:
Baseline
Load following
Peaking
Goal: use up capacity with lowest variable cost first
If wind energy is available, use first
Load-following plants adjust in real time to changing demand, changing availability of wind
This works up to a point
With sufficient presence of wind in the energy mix, may need additional infrastructure to offset
Related Documents