Welcome message from author
This document is posted to help you gain knowledge. Please leave a comment to let me know what you think about it! Share it to your friends and learn new things together.
Transcript


4.1 Summary Iron ore prices have fallen to an 18-month low (around US$90 per tonne)
as of early December, reflecting forced cuts to Chinese steel productionand weaker demand for steel in that nation in the second half of 2021.
Australian export volumes are expected to grow steadily over theoutlook, from 867 million tonnes in 2020–21 to 920 million tonnes by2022–23. This reflects the commencement of several new mines inWestern Australia.
Iron ore prices are projected to decline further over the outlook period.This is likely to see Australia's iron ore export earnings fall (from$153 billion in 2020–21) to $118 billion in 2021–22, and $85 billion by2022–23.
4.2 Prices Cuts to China’s steel output in Q3 led to big fall in iron ore prices Following record highs during the first half of 2021, iron ore prices have fallen substantially in recent months, hitting a low of US$85 a tonne by mid-November. The average spot price for 62% Fe iron ore fines at Chinese ports in November was about US$92 per tonne, 60% lower than the peak reached in May 2021, and about 40% lower than at end 2020.
The fall in prices reflects the decline in China’s monthly steel production from June 2021 (Figure 4.1). Crude steel output in China for the September quarter 2021 was 16% lower quarter-on-quarter, and 14% lower year-on-year. China’s stated goal of no growth in steel output in 2021 now appears on track to be met. Total steel output in the 10 months to October 2021 was 876 million tonnes, 0.9% lower than the same period in 2020. This marks a substantial change from the first half of 2021, when steel output in six months to June was running 11% higher year-on-year.
Lower steel output follows a significant broadening of emissions-related production cuts by China’s central government in the second half of 2021 (see Steel chapter). This has required all of China’s provinces to scale back production to 2020 levels by the end of November — with most on track to meet this goal by the end of the September quarter.
Figure 4.1: Iron ore price and monthly China steel production
0
40
80
120
160
200
240
-24
-16
-8
0
8
16
24
2016 2017 2018 2019 2020 2021
US$
a to
nne
Year
on
year
per
cen
t cha
nge
China steel production Iron ore price (rhs)Notes: China import Iron ore fines 62% Fe spot (CFR Tianjin port) Source: Bloomberg (2021) China import prices; World Steel Association (2021)
Steel output has also been adversely impacted by recent power shortages experienced in China (see Thermal coal chapter). More than half of China’s 31 provinces were required to implement power rationing from September. While direct cuts to steel production were limited, a significant reduction in manufacturing and industrial output saw reduced demand for steel products, particularly flat steel types such as hot-rolled coil.
The combination of emissions-related curbs and elevated coal prices (see Metallurgical Coal chapter) has seen the premium for higher grades of iron ore (65% Fe content and above) reach multi year highs (See Figure 4.2). Higher grades typically require less metallurgical coal to be used in the steelmaking process, allowing mills to adjust their input mix to cope with the historically high coal prices seen in recent months. Lower levels of metallurgical coal and fewer ore impurities also lead to reduced emission levels (for a given level of output), allowing mills to maximise output while still adhering to steel production curbs. With China’s winter season starting — which typically sees a rise in pollution levels particularly in the north —
Resources and Energy Quarterly December 2021 38

emission-related production curbs have been placed on as many as 64 cities place through to March 2022. This may see a persistence of a higher 66% premium through to the March quarter 2022.
China’s weaker demand for steel also weighing on iron ore prices The major drivers of China’s elevated demand for steel in the first half of this year — infrastructure and residential property construction, and manufacturing — have all seen weakening activity in recent months. This has created headwinds for steel and iron ore demand in China in the second half of 2021.
New investment in infrastructure was 5.3% lower (3-month-moving-average) in October compared with the same period in 2020. And new residential property starts in the year to October 2021 were down 6.8% compared with the same period in 2020. The combined impact of these policies weakened the demand for steel from the construction sector in recent months, with this industry typically accounting for 50-60% of domestic steel consumption. This contraction has led to substantial falls in mills’ demand for iron ore inputs, particularly from August this year.
China’s recent power crunch has also severely impacted its manufacturing sector. Growth in industrial production was 3.5% year-on-year in October, down from a high of 14% in March this year. China’s steel manufacturing production index (produced by S&P Global Platts) — measuring production data for 17 steel-related manufactured goods — also remained well below levels seen earlier in 2021.
The falls in steel prices in China over recent months has seen a significant contraction in steel mill profit margins, back to near breakeven levels by the end of the November. Along with government-mandated cuts, this is likely to dampen any incentive for mills to substantially raise steel production levels for the rest of 2021, with many continuing to undertake plant maintenance throughout the second half of 2021.
Chinese portside iron ore inventories reached 150 million tonnes at the end of November, well above the five year average and nearing multi year highs (Figure 4.3). This follows the significant drop off in steel production
Figure 4.2: Iron ore price spread between grades
0
20
40
60
80
100
120
-60
-40
-20
0
20
40
60
2017 2018 2019 2020 2021
US$
per
tonn
e
Per c
ent d
iffer
ence
*
Iron ore 58% Premium 66% fine ores Spread (rhs)
Notes: *Difference to benchmark of 62% iron fines CFR Source: Bloomberg (2021); China import prices
Figure 4.3: China’s weekly iron ore port stocks
0
20
40
60
80
100
120
140
160
180
2016 2017 2018 2019 2020 2021
Mill
ion
tonn
es
Notes: Benchmark used is 62% iron fines CFR Source: Bloomberg (2021)
Resources and Energy Quarterly December 2021 39
from June, leading to lower portside sales in recent months. The abundance of portside stockpiles provides a significant buffer for steel mills to restock iron ore supply during the December quarter 2021, without causing a significant tightening in the seaborne iron ore market.
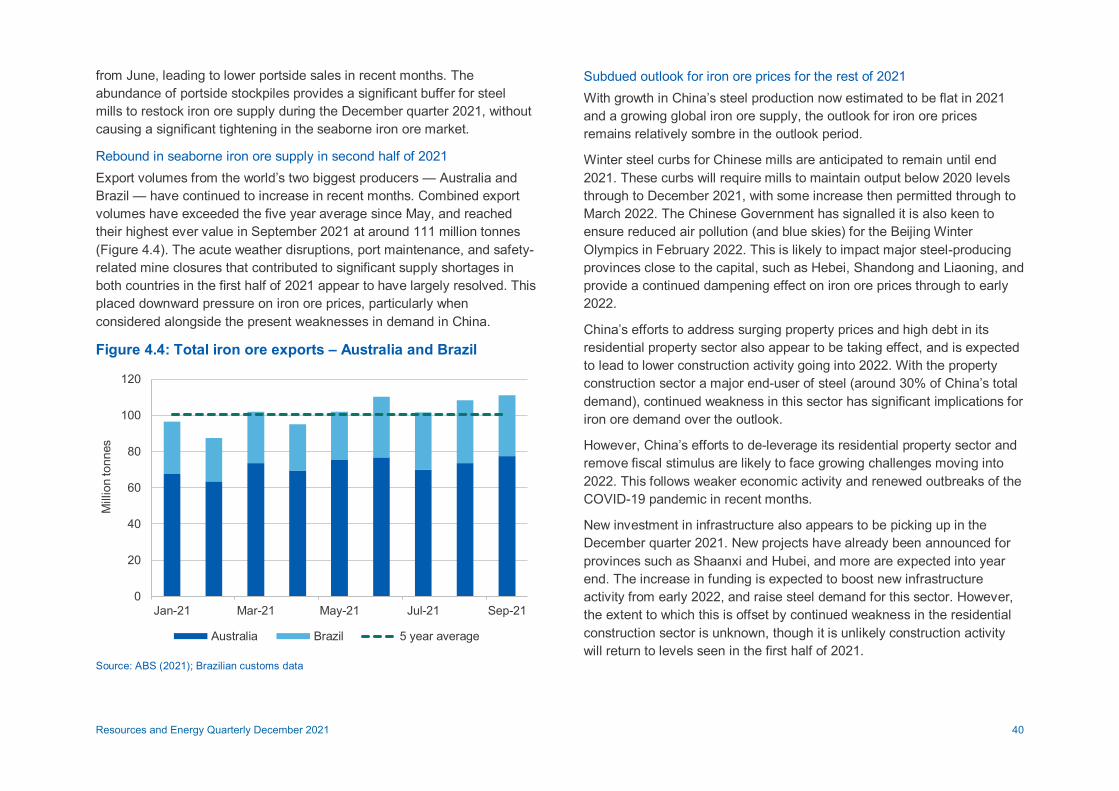
Rebound in seaborne iron ore supply in second half of 2021 Export volumes from the world’s two biggest producers — Australia and Brazil — have continued to increase in recent months. Combined export volumes have exceeded the five year average since May, and reached their highest ever value in September 2021 at around 111 million tonnes (Figure 4.4). The acute weather disruptions, port maintenance, and safety-related mine closures that contributed to significant supply shortages in both countries in the first half of 2021 appear to have largely resolved. This placed downward pressure on iron ore prices, particularly when considered alongside the present weaknesses in demand in China.
Figure 4.4: Total iron ore exports – Australia and Brazil
0
20
40
60
80
100
120
Jan-21 Mar-21 May-21 Jul-21 Sep-21
Mill
ion
tonn
es
Australia Brazil 5 year average
Source: ABS (2021); Brazilian customs data
Subdued outlook for iron ore prices for the rest of 2021 With growth in China’s steel production now estimated to be flat in 2021 and a growing global iron ore supply, the outlook for iron ore prices remains relatively sombre in the outlook period.
Winter steel curbs for Chinese mills are anticipated to remain until end 2021. These curbs will require mills to maintain output below 2020 levels through to December 2021, with some increase then permitted through to March 2022. The Chinese Government has signalled it is also keen to ensure reduced air pollution (and blue skies) for the Beijing Winter Olympics in February 2022. This is likely to impact major steel-producing provinces close to the capital, such as Hebei, Shandong and Liaoning, and provide a continued dampening effect on iron ore prices through to early 2022.
China’s efforts to address surging property prices and high debt in its residential property sector also appear to be taking effect, and is expected to lead to lower construction activity going into 2022. With the property construction sector a major end-user of steel (around 30% of China’s total demand), continued weakness in this sector has significant implications for iron ore demand over the outlook.
However, China’s efforts to de-leverage its residential property sector and remove fiscal stimulus are likely to face growing challenges moving into 2022. This follows weaker economic activity and renewed outbreaks of the COVID-19 pandemic in recent months.
New investment in infrastructure also appears to be picking up in the December quarter 2021. New projects have already been announced for provinces such as Shaanxi and Hubei, and more are expected into year end. The increase in funding is expected to boost new infrastructure activity from early 2022, and raise steel demand for this sector. However, the extent to which this is offset by continued weakness in the residential construction sector is unknown, though it is unlikely construction activity will return to levels seen in the first half of 2021.
Resources and Energy Quarterly December 2021 40
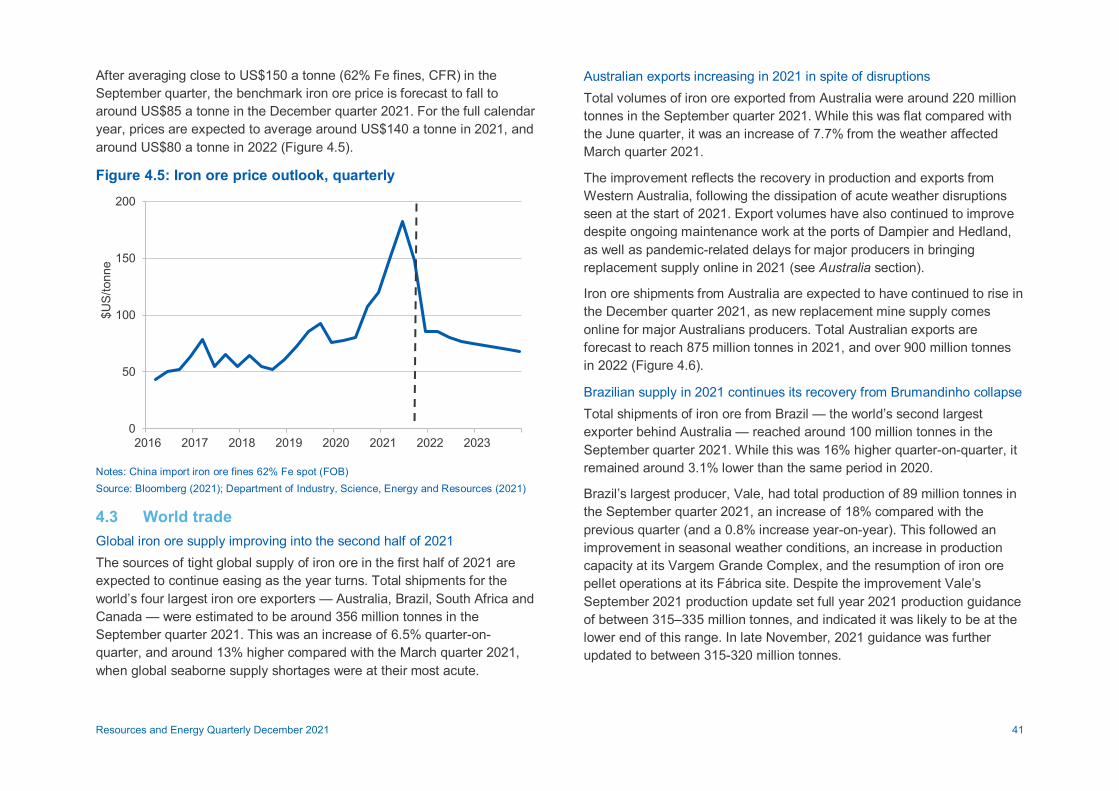
After averaging close to US$150 a tonne (62% Fe fines, CFR) in the September quarter, the benchmark iron ore price is forecast to fall to around US$85 a tonne in the December quarter 2021. For the full calendar year, prices are expected to average around US$140 a tonne in 2021, and around US$80 a tonne in 2022 (Figure 4.5).
Figure 4.5: Iron ore price outlook, quarterly
0
50
100
150
200
2016 2017 2018 2019 2020 2021 2022 2023
$US/
tonn
e
Notes: China import iron ore fines 62% Fe spot (FOB) Source: Bloomberg (2021); Department of Industry, Science, Energy and Resources (2021)
4.3 World trade Global iron ore supply improving into the second half of 2021 The sources of tight global supply of iron ore in the first half of 2021 are expected to continue easing as the year turns. Total shipments for the world’s four largest iron ore exporters — Australia, Brazil, South Africa and Canada — were estimated to be around 356 million tonnes in the September quarter 2021. This was an increase of 6.5% quarter-on-quarter, and around 13% higher compared with the March quarter 2021, when global seaborne supply shortages were at their most acute.
Australian exports increasing in 2021 in spite of disruptions Total volumes of iron ore exported from Australia were around 220 million tonnes in the September quarter 2021. While this was flat compared with the June quarter, it was an increase of 7.7% from the weather affected March quarter 2021.
The improvement reflects the recovery in production and exports from Western Australia, following the dissipation of acute weather disruptions seen at the start of 2021. Export volumes have also continued to improve despite ongoing maintenance work at the ports of Dampier and Hedland, as well as pandemic-related delays for major producers in bringing replacement supply online in 2021 (see Australia section).
Iron ore shipments from Australia are expected to have continued to rise in the December quarter 2021, as new replacement mine supply comes online for major Australians producers. Total Australian exports are forecast to reach 875 million tonnes in 2021, and over 900 million tonnes in 2022 (Figure 4.6).
Brazilian supply in 2021 continues its recovery from Brumandinho collapse Total shipments of iron ore from Brazil — the world’s second largest exporter behind Australia — reached around 100 million tonnes in the September quarter 2021. While this was 16% higher quarter-on-quarter, it remained around 3.1% lower than the same period in 2020.
Brazil’s largest producer, Vale, had total production of 89 million tonnes in the September quarter 2021, an increase of 18% compared with the previous quarter (and a 0.8% increase year-on-year). This followed an improvement in seasonal weather conditions, an increase in production capacity at its Vargem Grande Complex, and the resumption of iron ore pellet operations at its Fábrica site. Despite the improvement Vale’s September 2021 production update set full year 2021 production guidance of between 315–335 million tonnes, and indicated it was likely to be at the lower end of this range. In late November, 2021 guidance was further updated to between 315-320 million tonnes.
Resources and Energy Quarterly December 2021 41

The company also outlined a new strategy aimed at prioritising value over volume, and lowering supply of some of its high-silica, low margin product. This is expected to lead to lower production of around 4 million tonnes in 2021 and 12-15 million tonnes in 2022.
In September 2021, Vale cut its targeted production capacity for 2022 (from 400) to 370 million tonnes, primarily due to delays in permitting at its Serra Norte complex in the Northern System. The planned growth in capacity in 2022 remains contingent on recommissioning and expansion of its Southeastern and Northern systems, with output capacity from its Serra Sul mine rising from 83 million tonnes in 2020 to 100 million tonnes from the second half of 2022.
Total Brazilian exports are forecast to reach 362 million tonnes in 2021, over 390 million tonnes in 2022 and 412 million tonnes in 2023 (Figure 4.6).
Figure 4.6: Outlook for global iron ore exports
0
500
1,000
1,500
2,000
2016 2017 2018 2019 2020 2021 2022 2023
Mill
ion
tonn
es
Australia Brazil ROW
Source: World Steel Association (2021); Department of Industry, Science, Energy and Resources (2021)
China’s iron ore imports higher in Q3, but reflecting weaker demand China’s total imports of iron ore in the September quarter 2021 were around 281 million tonnes. While this was an increase of around 1.4% quarter-on-quarter, the result was around 12% lower than the same period in 2020, reflecting the weakened demand for iron ore in China so far in the second half of 2021.
The severe congestion at Chinese ports in the September quarter 2021 — due to renewed outbreaks of the pandemic and stricter COVID-19 protocols — appears to have receded in more recent months. However, the number of bulk carriers waiting to unload remains elevated, particularly in northern ports. While this does not appear to have materially impacted iron ore prices in the period, port congestion remains a risk.
The seaborne iron ore market is expected to remain relatively tight over the outlook period, and remains susceptible to supply disruptions.
Longer term iron ore projects in Africa continuing to be developed In May 2021, the Chinese Government announced an aim to diversify its current iron ore supply. Australia currently accounts for more than 60% of the nation’s iron ore imports. The Chinese Government’s new plan included a target of 45% self-sufficiency in steelmaking raw materials by 2025; increased domestic exploration and output of iron ore; and securing more overseas reserves.
As part of this, China is investigating a number of possible iron ore mines in Africa, including large deposits in Gabon and Madagascar. The most notable prospect in Africa is the proposed Simandou iron ore mine, located in Guinea. The project has been increasingly emphasised as a key element in China’s future supply chains, although production remains a number of years away. With potential full production capacity of 200 million tonnes per year, this is around 15-20% of output currently produced in the Pilbara region of Western Australia.
However, there are significant risks for this project to be brought into development. The project requires long term and significant investment in mining-related and transport infrastructure to get minerals to market,
Resources and Energy Quarterly December 2021 42

including development of a new port and 650 kilometres of new railway. And in September, a coup against President Alpha Condé demonstrated how exposed the project is to political instability in the country.
Elsewhere in Africa, the Ikongwe mine in Botswana achieved its maiden export of iron ore, with output reaching China in September. The mine is owned by Vision Ridge Investments — a unit of India’s Yashomann Industries — and has an order to provide 50,000 tonnes per month (0.6Mt a year) to a state-owned steel producer in China. The project is aiming to produce one million tonnes of iron ore per year.
Global iron ore markets are expected to remain tight, with slow growth in both supply and demand over the next few years. Market structure is not expected to alter significantly, with Australia’s market share expected to hold up. A recovery in Brazilian supply is likely in the short-term, but a number of high-cost mines in Brazil and China are also expected to face closure or depletion over the next 10 years.
4.4 Australia Iron ore export earnings moderate from record set in June quarter 2021 Australia’s total iron ore export value reached $43 billion in the September quarter 2021. This was about $6.0 billion (or 12%) lower quarter-on-quarter, reflecting the significant fall in iron ore prices from August 2021. However, the result remains around $13 billion (or 45%) higher than the same period in 2020.
Total volumes of iron ore exported from Australia in the September quarter 2021 (about 220 million tonnes) were flat compared with previous quarter and about 1.1% higher than the same period in 2020. This follows recent maintenance work undertaken at Port Hedland, and pandemic-related delays in bringing replacement supply online in 2021 by major producers.
Iron ore exports to China totalled around $35 billion in the September quarter 2021, representing around 82% of total Australian iron ore export value. Total export value to China fell close to 13% quarter-on-quarter, however remained 49% higher than the same period in 2020. The outcome reflects the significant tailwind elevated iron ore prices provided
for Australian exporters through to August this year, with export volumes to China in the September quarter 2021 only about 6.9% higher year-on-year.
Despite modest falls in export volumes for a number of Australia's major producers in the March quarter 2021, domestic operations continued to perform strongly in 2021. Total export volumes of iron ore are projected to reach 874 million tonnes in 2021, up 0.8% year-on-year.
Rio Tinto shipped 83 million tonnes in the September quarter 2021, a 9% rise quarter-on-quarter and 2% higher than the same period in 2020. However, shipments for nine months to September 2021 remained 2% below where they were for the same period in 2020, reflecting the severity of seasonal weather disruptions experienced through the first half of 2021, and some difficulties in bringing its significantly-sized replacement capacity online. Rio Tinto has now revised 2021 output guidance down (from 325– 340 million tonnes to 320–325 million tonnes), following modest delays in completing development of its Gudai Darri and Robe Valley projects.
Rio Tinto is aiming to bring around 90 million tonnes of replacement mine capacity online in 2021. Rio Tinto’s brownfield mine replacement project at West Angelas (30 million tonnes per annum capacity) has now been commissioned, while first ore was achieved at its Robe Valley project (25 million tonnes per annum) in August. The company’s third brownfield replacement project, Western Turner Syncline Phase 2 (32 million tonnes per annum) is still expected to produce its first ore in 2021, while its new Gudai Darri project (43 million tonnes per annum) is projected to start producing from the March quarter 2022.
BHP’s total iron ore production was 63 million tonnes in the September quarter 2021. This was a fall of 3% quarter-on-quarter and 4% lower year-on-year. This reflected major maintenance during the quarter at Port Hedland, as well as temporary rail labour shortages related to COVID-19 border restrictions. BHP has retained 2021–22 guidance at 249–259 million tonnes, and this will include a ramp up of its South Flank project, which achieved first ore in May 2021, and is expected to reach full production of 80 million tonnes per year over the next few years. In
Resources and Energy Quarterly December 2021 43

September 2021, BHP also received regulatory approval to lift capacity at its Port Hedland operations (from 290 million tonnes per annum) to 330 million tonnes per annum. This development will follow debottlenecking work planned for the December quarter 2021.
Fortescue's total iron ore exports were around 46 million tonnes in the September quarter 2021. While this was a fall of 8% on shipments made in the June quarter 2021, it remained 3% higher compared with the same period in 2020 and a new record for the September quarter. This has come as Fortescue’s newly developed Eliwana project ramps up, with output expected to reach almost 30 million tonnes per year. Fortescue is continuing to develop its 22 million tonne per annum Iron Bridge Magnetite Project, with first output scheduled for December 2022. This new project will deliver high grade 67% Fe magnetite concentrate.
With steady production volumes and record prices, Australia’s iron ore export earnings reached a new record of $153 billion in 2020–21. Prices for iron ore are expected to continue to ease from the second half of 2021, leading to some moderation in earnings over the subsequent two years. Total export value for iron ore is forecast to be $118 billion in 2021–22 and $85 billion in 2022–23 (Figure 4.7).
Iron ore exploration expenditure is growing as prices lift A total of $175 million was spent on iron ore exploration in the September quarter 2021. This is 16% higher than exploration in the June quarter 2021, and 57% higher than the same quarter in 2020. Exploration has been elevated in recent quarters as iron ore prices have reached historical highs in the first half of 2021 (Figure 4.8).
Revisions Forecast export earnings for 2021–22 have been revised downwards from $132 billion in the September 2021 Resources and Energy Quarterly (in nominal terms) to $118 billion in this edition. This reflects the substantial fall in prices from August 2021. Forecast Australian export earnings have been revised down (by around $14 billion) for 2022–23 to $85 billion, reflecting falling prices from the second half of 2021.
Figure 4.7: Australia’s iron ore export volumes and values
0
40
80
120
160
0
250
500
750
1000
2011–12 2014–15 2017–18 2020–21
A$ b
illio
n
Mill
ion
tonn
es
Volume Value (rhs)
Source: ABS (2021) International Trade, Australia, 5368.0; Department of Industry, Science, Energy and Resources (2021)
Figure 4.8: Australian iron ore exploration expenditure, $m
0
20
40
60
80
100
120
140
160
180
200
2015 2016 2017 2018 2019 2020 2021
$ m
illio
ns
Source: ABS (2021) Mineral and Petroleum Exploration, Catalogue 8412
Resources and Energy Quarterly December 2021 44

Table 4.1: World trade in iron ore Million tonnes Annual percentage change
2020 2021s 2022f 2023f 2021s 2022f 2023f
Total world trade 1,626 1,581 1,619 1,652 -2.8 2.4 2.0
Iron ore imports
China 1,170 1,131 1,161 1,175 -3.4 2.7 1.2
Japan 99 119 122 125 19.6 2.8 2.6
South Korea 70 73 77 78 4.2 5.6 1.2
European Union 63 78 78 78 23.6 0.0 0.0
Iron ore exports
Australia 867 874 923 948 0.8 5.5 2.8
Brazil 342 362 394 412 5.9 8.9 4.6
South Africa 66 69 69 73 5.1 0.7 5.1
Canada 55 54 55 57 -2.6 2.4 3.7
India 52 37 38 37 -29.4 3.9 -3.6
Notes: f forecast; s estimate Source: World Steel Association (2021); International Trade Centre (2021); Department of Industry, Science, Energy and Resources (2021)
Resources and Energy Quarterly December 2021 45

Table 4.2: Iron ore outlook Annual percentage change
World Unit 2020 2021s 2022f 2023f 2021s 2022f 2023f bcPrices
– nominal US$/t 96 142 79 70 47.0 -44.0 -11.4
d– real US$/t 100 142 77 66 41.8 -45.9 -13.7
Australia Unit 2019–20 2020–21s 2021–22f 2022–23f 2020–21s 2021–22f 2022–23f
Production h– Steel Mt 5.48 5.67 5.94 5.97 3.5 4.9 0.5
– Iron ore Mt 911 921 949 954 1.1 3.0 0.5
Exports hSteel Mt 0.88 0.78 0.92 1.03 -11.6 18.0 12.1
– nominal value A$m 1,011 772 892 931 -23.6 15.5 4.4
i– real value A$m 1,052 791 885 908 -24.8 11.9 2.6
Iron ore Mt 858 867 911 920 1.1 5.0 1.0
– nominal value A$m 102,861 152,970 117,700 85,318 48.7 -23.1 -27.5
i– real value A$m 107,131 156,460 117,806 83,533 46.0 -24.7 -29.1
Notes: b fob Australian basis; c Spot price, 62% iron content basis; d In 2021 US dollars; e In 2021–22 Australian dollars; f forecast; h Crude steel equivalent; Crude steel is defined as the first
solid state of production after melting. In ABS Australian Harmonized Export Commodity Classification, crude steel equivalent includes most items from 7206 to 7307, excluding ferrous waste and scrap and ferroalloys; s estimate. Source: ABS (2021) International Trade in Goods and Services, Australia, 5368.0; Bloomberg (2021) Metal Bulletin; World Steel Association (2021); AME Group (2021); Company Reports; Department of Industry, Science, Energy and Resources (2021)
Resources and Energy Quarterly December 2021 46
Related Documents