Volume 40 Number 4 December 2015 Volume 40 Number 4 December 2015 BANGLADESH JOURNAL OF AGRICULTURAL RESEARCH ISSN 0258 - 7122 Please visit our website : www.bari.gov.bd

Welcome message from author
This document is posted to help you gain knowledge. Please leave a comment to let me know what you think about it! Share it to your friends and learn new things together.
Transcript

Volume 40 Number 4December 2015
Volum
e 40 Num
ber 4D
ecember 2015
BANGLADESH JO
URNAL OF AG
RICULTURAL RESEARCH
ISSN 0258 - 7122
Please visit our website : www.bari.gov.bd


Bangladesh
Journal of
AGRICULTURAL
RESEARCH Volume 40 Number 4
December 2015

Editorial Board
Editor-in Chief
M. Rafiqul Islam Mondal, Ph. D
Associate Editors
Mohammod Jalal Uddin, Ph. D
Bhagya Rani Banik, Ph. D
Md.Shoeb Hassan
M. Zinnatul Alam, Ph. D
M. Mofazzal Hossain, Ph. D
Hamizuddin Ahmed, Ph. D
M. Matiur Rahman, Ph. D
B. A. A. Mustafi, Ph. D
M. A. Quayyum, Ph.D
A. J. M. Sirajul Karim, Ph.D
M. Shahjahan, Ph. D
Editor (Technical)
Md. Hasan Hafizur Rahman
B. S. S. (Hons.), M. S. S. (Mass Com.)
Address for Correspondence
Editor (Technical)
Editorial and Publication Section
Bangladesh Agricultural Research Institute
Joydebpur, Gazipur 1701
Bangladesh
Phone : 88-02-9294046
E-mail : [email protected]
Rate of Subscription
Taka 100.00 per copy (home)
US $ 10.00 per copy (abroad)
Cheque, Money Orders, Drafts or Coupons,
etc. should be issued in favour of the
Director General, Bangladesh Agricultural
Research Institute
Contributors To Note Bangladesh Journal of Agricultural Research (BJAR) is a quarterly journal highlighting original contributions on all disciplines of agricultural research (crop agriculture) conducted in any part of the globe. The 1st issue of a volume comes out in March, the 2nd one in June, the 3rd one in September, and the 4th one in December. The full text of the journal is visible in www.banglajol.info. Contributors, while preparing papers for the journal, are requested to note the following: 0 Paper(s) submitted for publication must
contain original unpublished material. 0 Papers in the journal are published on the
entire responsibility of the contributors. 0 Paper must be in English and typewritten
with double space. 0 Manuscript should be submitted in
duplicate. 0 The style of presentation must conform to
that followed by the journal. 0 The same data must not be presented in
both tables and graphs. 0 Drawing should be in Chinese ink. The scale
of figure, where required, may be indicated by a scale line on the drawing itself.
0 Photographs must be on glossy papers. 0 References should be alphabetically arranged
conforming to the style of the journal. 0 A full paper exceeding 12 typed pages and a
short communication exceeding eight typed pages will not be entertained.
0 Principal author should take consent of the co-author(s) while including the name(s) in the article.
0 The article prepared on M.S/Ph.D. thesis should be mentioned in the foot note of the article.
0 Authors get no complimentary copy of the journal. Twenty copies of reprints are supplied free of cost to the author(s).
Bangladesh Agricultural Research Institute (BARI) Joydebpur, Gazipur 1701
Bangladesh

BANGLADESH JOURNAL OF AGRICULTURAL RESEARCH
Vol. 40 December 2015 No. 4
C O N T E N T S
M. Ataur Rahman, M. Mohabbatullah, C. K. Das, U. K. Sarker and S. M.
M. Alam Sowing time and varietal performance of wheat at higher
elevation in hill environment at Khagrachari
521
M. M. Rohman, B. R. Banik, A. Biswas and M. S. Rahman Genetic
diversity of maize (Zea mays L.) Inbreds under salinity stress
529
J. A. Chowdhury, M. A. Karim, Q. A. Khaliq, A. R. M. Solaiman and J.
U. Ahmed Genotypic variations in growth, yield and yield components
of soybean genotypes under drought stress conditions
537
M. A. Monayem Miah, Moniruzzaman, S. Hossain, J. M. Duxbury, J. G.
Lauren Adoption of raised bed technology in some selected locations of
Rajshahi District of Bangladesh
551
M. Moniruzzaman, R. Khatoon, M. F. B. Hossain, M. T. Rahman and S.
N. Alam Influence of ethephon on ripening and quality of winter tomato
fruit harvested at different maturity stages
567
K. S. Rahman, S. K. Paul and M. A. R. Sarkar Performance of
separated tillers of transplant Aman rice at different levels of urea super
granules
581
M. K. Jamil, M. Mizanur Rahman, M. Mofazzal Hossain, M. Tofazzal
hossain, and A. J. M. Sirajul Karim Effect of plant growth regulators on
flower and bulb production of hippeastrum (Hippeastrum hybridum Hort.)
591
M. K. R. Bhuiyan, S. M. Sharifuzzaman and M. J. Hossain Effect of
bap and sucrose on the development of cormel in mukhi kachu
601
M. H. Khan, S. R. Bhuiyan, K. C. Saha, M. R. Bhuyin and A. S. M. Y.
Ali Variability, correlation and path co-efficient analysis of bitter gourd
(Momordica charantia L.)
607
M. A. Razzaque, M. M. Haque, M. A. Karim, A. R. M. Solaiman and M.
M. Rahman Effect of nitrogen on different genotypes of mungbean as
affected by nitrogen level in low fertile soil
619

M. N. Islam, M. S. Rahman, M. S. Alom and M. Akhteruzzaman
performance of different crops productivity enhancement through
adaptation of crop varieties at charland in Bangladesh
629
Md. Rayhan Shaheb, Md. Nazmul Islam, Ashratun Nessa, Md. Altab
Hossain and Ayesha Sarker impact of harvest stage on seed yield
quality and storability of french bean
641
Md. Altaf Hossain Efficacy of some insecticides against insect pests of
mungbean (Vigna radiata L.)
657
M. A. Monayem Miah and M. Enamul Haque Farm level impact study
of power tiller operated seeder on service providers’ livelihood in some
selected sites of Bangladesh
669
S. Sultana, M. A. Kawochar, S. Naznin, H. Raihan and F. Mahmud
Genetic divergence in pumpkin (Cucurbita moschata L.) Genotypes
683
M. A. Uddin, K. S. Rahman, M. M. Rahman, N. Mohammad and A. F.
M. Tariqul Islam Development of union level digital databases and
maps of maize growing areas at pirgonj in Thakurgaon District
693
N. Mohammad, M. S. Islam, K. S. Rahman, M. M. Rahman and S. Nasrin
Determination of optimum sample size for measuring the contributing
characters of bottle gourd
703
Short communication
Md. Shahiduzzaman Efficacy of fungicides and botanicals in
controlling foot and root rot of lentil
711

ISSN 0258-7122
Bangladesh J. Agril. Res. 40(4): 521-528, December 2015
SOWING TIME AND VARIETAL PERFORMANCE OF WHEAT AT
HIGHER ELEVATION IN HILL ENVIRONMENT AT KHAGRACHARI
M. ATAUR RAHMAN1, M. MOHABBATULLAH2, C. K. DAS3
U. K. SARKER4 AND S. M. M. ALAM5
Abstract
The field experiment was conducted at the Hill Agricultural Research Station, BARI, Khagrachari for the two consecutive years (2009-10 and 2010-11) to find out the wheat variety suitable for hilly environment and investigate the interaction of sowing dates and varieties to recommend the promising variety with proper sowing time. The experiment was laid out in split-plot design with three replications where three dates of sowing (Nov. 20, Nov. 30 and Dec. 10) were assigned in the main plots and five modern wheat varieties (Shatabdi, Sufi, Sourav, Bijoy and Prodip) were tested in the sub-plots. The yield responses of wheat varieties during the two years showed that there were significant varietal differences under the experimental soil and environmental conditions. The variety Bijoy gave maximum grain yield closely followed by Sourav in both years. Shatabdi produced higher yield under early sowing (Nov. 20) but yield was decreased due to late sowing (Dec. 10). Initially the plant population and finally spikes/m2 were affected by late sowing that caused less yield in Shatabdi. The mean yield of all varieties pulled over the sowing time indicated that wheat yield was not affected due to delay sowing up to 10th December. The experimental result demonstrated that Shatabdi could be recommended only for early sowing whereas Bijoy and Sourav could be recommended both for early and late sowing under the experimental soil and environmental conditions at hilly region of Khagrachari.
Keywords: Wheat variety, Sowing time, Adaptation, Higher elevation.
Introduction
Commercial farming of high value crops in traditional wheat growing regions and high crop competition in limited arable land caused gradual reduction of wheat areas in Bangladesh for the last decade. Wheat area and production were 0.77 million ha and 1.67 million tons, respectively, in 2000-01 whereas the area and production declined to 0.36 million ha and 0.98 million tons in 2011-12 (BBS, 2012). At present the national consumption of wheat is about four fold higher than annual domestic production and thus to meet the national demand a lion share is being imported at the cost of valuable foreign currencies and this food dependence is vulnerable for our national food security. Therefore, due attention is needed to increase the domestic production of wheat by expanding its
1Principal Scientific Officer, Regional Wheat Research Centre, Bangladesh Agricultural
Research Institute (BARI), Gazipur, 2Chief Scientific Officer, Hill Agricultural Research
Centre, BARI, Khagrachari, 3Assistant Professor, Sylhet Agricultural University, Sylhet, 4Assistant Professor, Bangladesh Agricultural University (BAU), Mymensing, 5Scientific
Officer, Wheat Research Centre, BARI, Dinajpur, Bangladesh.

522 RAHMAN et al.
cultivation in the non-traditional areas of the country where cropping intensity is low and there are scopes of wheat expansion. The Hill Tract regions comprises about one tenth of the country consisting 75% upland (hill), 20% undulating bumpy land and 5% valley plain land. A huge undulating bumpy land and the valleys remain fallow in the winter due to lack of irrigation water required for boro rice cultivation. Water requirement of wheat is less than one-fourth of that of rice, thus most of the areas can be brought under wheat cultivation with the limited water resource available in those regions. The physical and environmental conditions of the hill regions are different from that of conventional wheat growing areas of the country. Much works have been done to improve wheat yield through manipulating sowing time (Hossain et al., 2009) and introducing new varieties (Rahman et al., 2013, Barma et al., 1994). The sowing date of wheat is considered as most important factor limiting the wheat yield and it is reported that wheat yield decreased at the rate of 1.3% per day delay sowing after 30th November under the short spell of winter in Bangladesh (Ahmed et al., 1998). The pattern and spell of winter at the hill is different and, therefore, sowing time of wheat may be adjusted to explore the environmental benefit. Also there may have differences in relation to varietal adoption in hill regions that need to be explored for promoting the promising varieties in hill region. Several reports suggested that the yield performance of wheat varieties varied with soil type (Rahman et al., 2013, Tang et al., 2003), air temperatures (Rahman et al., 2005), and management conditions (Rahman et al., 2002; Timsina and Cornor, 2001). There may have varietal difference in response to change in elevation and environmental condition at the hill region. The wheat varieties which produce higher yield at the higher elevation of Khagrachuri might be considered as adaptable in hill regions. Therefore, the present experiment was aimed at investigating the varietal differences in response to higher elevation and to identify the appropriate sowing time preferable for that location with the final goal of wheat expansion in non-traditional hill valleys in Bangladesh.
Materials and Method
The field experiment was conducted in the valley land of Hill Agricultural Research Station, Khagrachari for the two consecutive years of 2009-10 and 2010-11. The experimental field is about 520 meters above the sea level and night temperature is cooler and the spell of winter is wider than the central part of Bangladesh. The annual temperature varies from 11.5° to 34.0° C with a mean of 17.5° to 24.0° C during the wheat growing period of December to March. Weekly mean of minimum and maximum temperature, relative humidity and rainfall for the wheat growing period in 2010-11 are presented in Fig. 1. The soils of experimental field was strongly acidic (pH 4.8-5.1) with higher levels of Fe, Al and Mn in surface soil (0-15 cm depth) and deficit in several essential plant nutrients including nitrogen (Total N = 0.08-0.09%), phosphorus (Olsen P = 5.5-6.5 ppm) and potassium (K = 0.17-0.21 meq/100g). The soil was rich in sulfur and zinc content but available boron content was critical to low. The physical and

SOWING TIME AND VARIETAL PERFORMANCE OF WHEAT 523
chemical properties of the soil prior to conducting the experiment are presented in Table 1. The experiment was laid-out in such a soil in split-plot design with three replications where three sowing dates (November 20, November 30 and December 10) were assigned in the main plots and five wheat varieties namely Shatabdi, Sufi, Sourav, Bijoy and Prodip were tested in the sub plots. The size of each subplot was 5 m X 2 m. Fertilizers at the rates of 100 kg N, 30 kg P, 50 kg K, 20 kg S ha-1 and 2 kg B ha-1 were applied as urea, triple super phosphate, muriate of potash, gypsum and boric acid, respectively. All fertilizers including two-thirds of urea were uniformly applied in the field during final land preparation. The rest of urea was top dressed at the crown root initiation (CRI) stage at 21 days after sowing (DAS). The crop was irrigated thrice to bring the soil moisture near to field capacity during CRI, booting and grain-filling stages. Weeds were controlled once at 35 DAS manually by hand weeding. After maturity crops were harvested duly, sun-dried and threshed on sub-plot basis. Then the grains were dried in the atmosphere and grain moisture content was measured to convert the grain yield to t ha-1 at 12% moisture content. Before harvest ten plants were sampled from each plot to calculate plant height, spikelet/spike, grains/spike and 1000-grains weight. Initial plant population and spikes/m2 were also counted at 20 DAS and at maturity following standard method. All the data were statistically analyzed and the mean value was tested by the least significant difference (LSD) at 5% level of significance.
0
5
10
15
20
25
30
35
0
10
20
30
40
50
60
70
80
90
100
1st w
eek
2nd
wee
k
3rd
wee
k
4th
wee
k
1st w
eek
2nd
wee
k
3rd
wee
k
4th
wee
k
1st w
eek
2nd
wee
k
3rd
wee
k
4th
wee
k
1st w
eek
2nd
wee
k
3rd
wee
k
4th
wee
k
1st w
eek
2nd
wee
k
3rd
wee
k
4th
wee
k
Air
tem
ptu
re (
oC
)
R H
(%
) an
d R
ain
fall
(m
m)
Relative humidity (%) Rainfall (mm) Min.temp.0C Max.temp.0C
Nov. 2010 Dec. 2010 Jan. 2011 Feb. 2011 March 2011
Fig. 1. Weekly average maximum and minimum air temperature, rainfall and
relative humidity (RH) during the cropping period of 2010-11 at
Khagrachuri.
Results and Discussion
a) Effect of sowing time
Different sowing dates had statistically similar effect on grain yield and all the yield components of wheat including plant height in both the experimental years

524 RAHMAN et al.
(Tables 2 and 3) with the exception of initial plant population (IPP) at 20 DAS in 2009-10. IPP was the maximum in the sowing date of Nov 20, followed by Nov 30 and Dec 10 in the years of 2009-10 but this advantage of higher plant population finally failed to contribute higher spikes/m2 or grain yield. Thousand grain weight (TGW) is considered as most important yield component affected by late sowing induced heat stress. TGW was declined from 47.0 to 46.1 g and from 47.7 to 46.5 g due to 20 days delay sowing from November 20 to December 10, during the years of 2009-10 and 2010-11, respectively, which resulted in statistically similar wheat yield. The yield response of wheat to sowing dates had been studied intensively in Bangladesh conditions and several reports suggested that late sowing caused significant yield loss by reducing grain size expressed as TGW and thus yield drastically declines under late sowing. Late sowing caused the significant reduction in TGW (Rahman et al., 2005); reduced number of spikes/m2 (Rahman et al., 2009) thus resulted drastic yield reduction in wheat. Ahmed and Meisner (1996) reported that under Bangladesh condition wheat yield decreased at the rate of 1.3% per day delay after 30th November that was due to decreasing TGW. In present study, such an adverse effect of late sowing was not noticed. Our experimental plants were also exposed to relatively higher day temperature from the end of February but yet the night temperature was cooler as indicated by average of minimum temperature (Fig. 1). Thus grain size measured by TGW was similar for different sowing dates. Spikes/m2 was also statistically similar thus different sowing dates contributed to statistically similar yield. The result indicated that wheat sowing until 10th December could be recommended for the experimental soil and environmental conditions without yield loss. Jhum cultivation is the common practice in the hills that are usually planted at the beginning of rainy season. At the base of the hills, in the valleys the major cropping system are T. aman-Fallow-Fallow and T. aman-Boro-Fallow. Most of the T. aman rice varieties are long duration local varieties which are harvested in early December. Under such a condition, the experimental results are encouraging that wheat can be sown until 10th December without significant yield loss.
b) Response of variety
All the varieties tested in the present experiment were spring type semi-dwarf and its height and number of spikelet/spike were statistically similar in both the years but there were significant variations in several other traits like initial plant population, spikes/m2, grains/spike, thousand grain weight and grain yield (Tables 2 and 3). IPP at 20 DAS and number of spikes/m2 during harvest was the maximum in Bijoy followed by Sourav in 2009-10 (Table 2). During 2010-11 the same variety (Bijoy) produced highest IPP and spikes/m2 which were statistically similar to other varieties but higher than Prodip (Table 3). Bijoy also scored second highest number of grains/spike next to Sufi and higher TGW similar to Prodip in both the years. All those facts ultimately resulted in the maximum grain yield of Bijoy similar to Sourav but higher than other varieties. Both variety Bijoy and Sourav were released earlier compared to Shatabdi and Prodip, and the yield

SOWING TIME AND VARIETAL PERFORMANCE OF WHEAT 525
performance of latter two varieties was relatively higher (but not significant) than the former two varieties under the other areas in Bangladesh (WRC Annual report 2011). But in present experimental condition at Khagrachari, Bijoy and Saurav resulted in higher yield compared to other varieties. Prodip produced the least number of spikes/m2 whereas other four varieties produced statistically similar number of spikes/m2 for both the years. Initial plant population at 20 DAS was the minimum in Prodip which indicated that germination and stand establishment was seriously affected in Prodip resulting comparatively less number of spikes/m2 which finally contributed to poor grain yield of the variety compared to other varieties. Number of grains/spike was the highest in Sufi followed by Bijoy and Saurav. However, this advantage of higher grains/spike of Sufi could not result in higher yield due to its smaller grain size as indicated by the least TGW. Thousand grain weight was the maximum in Prodip which was statistically similar to all other varieties except Sufi. Varietal difference in response to location x genotype interaction and drought had been reported by Barma et al. (1994) and Fisher and Maurer (1978). Rahman et al. (2013) reported that Bijoy gave higher yield and more adaptable under acidic soil condition in Sylhet. Present experimental result demonstrated that Bijoy and Sourav are preferable under higher elevation hilly environment at Khagrachari.
Table 1a. Physical and chemical properties of initial soil collected from surface layer
(0-15 cm).
Physical
Properties
Bulk
density
(g cm-3 )
Particle
density
(g cm-3 )
Porosity
(%)
Soil moisture
at sowing
(%)
Soil moisture at
field capacity
(%)
Textural
class
1.42 2.48 42.74 21.04 28.12 Clay
Loam
Table 1b. Chemical properties of initial soil collected from surface layer (0-15 cm).
Chemical
properties pH
OM
(%)
Total
N (%)
P S B Zn Cu Fe Mn K Ca Mg
µg g-1 meq 100 g-1
2009-10 4.8 1.12 0.09 5.1 36 0.18 3.8 3.1 104 16 0.17 4.7 2.1
2010-11 5.1 0.98 0.08 6.5 41 0.16 4.1 3.1 97 16 0.21 5.1 2.0
Critical level - - - 7 14 0.20 2.0 1.0 10.0 5.0 0.20 2.0 0.8
c) Interaction effect of sowing time and variety
Initial plant population, spikes/m2 and grain yield of wheat were significantly
influenced by the interaction of sowing time and variety (Table 2 and 3).
Shatabdi gave the highest yield under the first sowing date and the yield was
statistically similar to Bijoy and Sourav in both the years. The yield of Shatabdi
was significantly declined due to late sowing on December 10 as compared to
sowing on November 20. Similar trend of higher yield reduction with sowing

526 RAHMAN et al.
Table 2. Yield component and agronomic characters of wheat as influenced by dates
of sowing and variety at Khagrachuri in 2009-10.
Treatment IPP at
20 DAS
Plant
ht.
(cm)
Spikes
m-2
Spikelet
spike-1
Grains
spike-1
TGW
(g)
Grain yield
(t/ha) Sowing date Variety
Nov. 20 Shatabdi 218.6 96.2 335.7 17.7 44.2 48.7 3.85
Sufi 197.2 93.5 302.7 17.5 47.7 37.5 3.04
Sourav 198.6 93.8 346.8 17.7 47.9 46.8 3.55
Bijoy 222.3 96.8 360.1 18.5 48.7 49.8 3.80
Prodip 205.7 88.9 248.7 16.5 39.2 52.1 3.32
Nov. 30 Shatabdi 178.0 95.7 298.5 17.1 45.8 46.8 3.25
Sufi 181.3 93.2 312.8 16.9 49.5 36.8 3.05
Sourav 214.8 94.5 325.5 17.3 47.8 45.8 3.82
Bijoy 213.5 98.4 364.5 18.3 50.2 50.2 4.05
Prodip 180.2 87.1 258.7 16.7 41.2 51.2 3.20
Dec. 10 Shatabdi 167.5 93.1 265.0 16.9 41.5 46.7 3.05
Sufi 188.4 90.8 321.8 17.4 47.7 36.5 2.88
Sourav 196.2 92.8 316.5 17.5 45.9 46.7 3.74
Bijoy 215.6 95.8 355.8 18.1 47.5 49.8 3.88
Prodip 166.6 88.9 247.8 16.8 38.7 49.5 3.02
Mean of Sowing dates
Nov. 20 208.4 93.8 318.8 17.6 45.5 47.0 3.51
Nov. 30 193.5 93.8 312.0 17.3 46.9 46.2 3.46
Dec. 10 186.9 92.3 301.4 17.3 44.8 45.8 3.32
Mean of variety
Shatabdi 188.0 95.0 299.7 17.2 43.8 47.4 3.38
Sufi 189.0 93.2 314.4 17.3 48.3 36.9 2.98
Sourav 203.2 93.5 331.0 17.6 46.6 46.8 3.70
Bijoy 217.1 97.0 360.1 18.3 48.7 49.9 3.91
Prodip 184.2 88.3 251.7 16.7 39.7 50.9 3.18
LSD (0.05)
Sowing
dates 18.4 NS NS NS NS NS NS
Variety 21.0 7.5 32.4 NS 4.0 4.3 0.36
Interaction 20.1 NS 28.5 NS NS NS 0.33
CV (%) 8.4 7.5 8.8 6.4 10.6 5.8 10.1
date was found in Shatabdi followed by Prodip in both the years. The yield reduction of Shatabdi and and Prodip in response to sowing date was mainly associated with initial plant population and spikes/m2 as both the parameters were significantly affected by the interaction of variety and sowing dates. On the contrary, Bijoy produced statistically similar yield like Shatabdi under first sowing date and under 2nd and 3rd sowing dates the yield of Bijoy was higher

SOWING TIME AND VARIETAL PERFORMANCE OF WHEAT 527
than Shatabdi. However, Sourav performed second highest yield similar to Bijoy on 2nd and 3rd sowing in both the years. The yield variation due to sowing dates was the least in Bijoy following Saurav. The result indicated that both Bijoy and Sourav had the potentials to produce higher and stable yield over the sowing dates whereas Shatabdi was preferable only for early sowing under the experimental soil and environmental conditions.
Table 3. Yield component and agronomic characters of wheat as influenced by dates
of sowing and variety at Khagrachuri in 2010-11.
Treatment IPP at
20 DAS
Plant
ht.
(cm)
Spikes
m-2
Spikelet
spike-1
Grains
spike-1
TGW
(g)
Grain
yield
(t/ha) Sowing date Variety
Nov. 20 Shatabdi 212.5 97.8 320.5 17.7 44.2 49.8 4.18
Sufi 206.0 97.3 308.7 17.3 49.7 40.1 3.21
Sourav 195.8 97.7 312.0 17.9 44.8 47.4 3.88
Bijoy 202.8 101.8 338.4 18.3 47.5 48.9 4.10
Prodip 168.5 96.8 285.5 17.3 38.8 52.5 3.64
Nov. 30 Shatabdi 193.4 98.5 312.5 17.4 41.6 49.3 3.81
Sufi 186.3 97.3 317.8 17.3 49.8 38.9 3.18
Sourav 185.7 97.8 302.0 17.5 42.4 46.6 4.02
Bijoy 212.7 101.2 338.4 17.9 45.5 48.7 4.28
Prodip 156.0 97.6 278.3 16.7 37.8 51.8 3.52
Dec. 10 Shatabdi 172.0 96.8 278.5 17.1 40.1 47.5 3.46
Sufi 197.8 96.4 308.2 17.3 48.9 37.3 3.08
Sourav 192.6 97.8 312.5 17.5 44.2 48.1 3.94
Bijoy 198.5 99.8 318.5 18.1 46.1 49.4 4.20
Prodip 161.2 95.8 266.2 17.0 36.7 50.2 3.38
Mean of Sowing dates
Nov. 20 197.1 98.3 313.0 17.7 45.0 47.7 3.80
Nov. 30 186.4 98.5 309.8 17.4 43.4 47.1 3.77
Dec. 10 184.8 97.3 296.8 17.4 43.2 46.5 3.61
Mean of variety
Shatabdi 192.1 97.7 303.8 17.4 42.0 48.9 3.78
Sufi 197.0 97.0 311.6 17.3 49.5 38.8 3.16
Sourav 191.5 97.8 308.8 17.6 43.8 47.4 3.95
Bijoy 204.7 101.0 331.8 18.1 46.4 49.0 4.19
Prodip 161.8 96.7 276.7 17.0 37.7 51.5 3.51
LSD (0.05)
Sowing
dates NS NS NS NS NS 3.9 NS
Variety 16.1 7.1 28.4 NS 3.9 4.2 0.37
Interaction 18.2 NS 26.2 NS NS NS 0.34
CV (%) 8.9 6.2 7.4 5.8 9.1 6.1 7.6

528 RAHMAN et al.
Conclusion
The national average yield of wheat was 2.38 t/ha and 2.45 t/ha during the experimental year of 2009-10 and 2010-11, respectively. Under such a low national average yield, the yield performance of wheat varieties under experimental non-traditional hilly environment was found very encouraging. The wheat variety Bijoy and Sourav could be sown until 10th December without yield loss. The farmers in those areas prefer to cultivate long duration local rice which ripen lately in early December and boro rice is not suitable due to lack of irrigation water. Under such a condition the wheat variety Bijoy and Sourav could be recommended to promote in hill regions to improve the productivity.
Referecce
Anonymous. 2011. Annual Research Report for 20010-11. Wheat Research Centre, Bangladesh Agricultural Researtch Institute,Nashipur, Dinajpur, 211 P.
Ahmed, S. M. and C. A. Meisner. 1996. Wheat Research and Development in Bangladesh. Bangladesh- Australia wheat improvement project and CIMMYT- Bangladesh., Dkaka, 167 Pp.
Barma, N. C. D., A. B. Siddique, Z. I. Sarker, M. A. Samad & M. A. Razzaque. 1994. Genotype × Location interaction and stability analysis in wheat. Bangladesh J. of Plant Breed. & Genet. 7(1): 31-35.
BBS, 2012. Bangladesh Bureau of Statistics, Statistical Yearbook of Bangladesh, Statistics Division, Ministry of Planning, Government of Bangladesh.
Fisher, R. A. and R. Maurer, 1978. Drought resistance in spring wheat cultivars. I. Grain yield responses. Aust. J. Agric. Res. 29: 897-907.
Rahman, M. A., M. A. Sufian, M. Saifuzzaman, and J. Chikushi. 2002. Nitrogen management in rice-wheat alternating cropping system and wheat genotype identification preferable for surface seeding condition. Journal Fac. Agr. Kyushu Univ. 46 (2): 295-300.
Rahman, M. A., J. Chikushi, S. Yoshida, H. Yahata, and E. Yasunsga. 2005. Effect of high air temperature on grain growth and yields of wheat genotypes differing in heat tolerance. J. Agric Meteor. 60(5): 605-608.
Rahman, M. A., J. Chikushi, J. G. Lauren, J. M. Duxbury, C. A. Meisner, and E. Yasunaga. 2005. Chemical control of soil environment by lime and nutrients to improve the productivity of acidic alluvial soils under rice-wheat cropping system. Environ. Control in Biology 43(4): 259-266.
Rahman, M. A., J. Chikushi, S. Yoshida and A. J. M. S. Karim. 2009. Growth and yield components of wheat genotypes exposed to high temperature stress under control environment. Bangladesh J. Agri. Res. 34(3): 361-372.
Rahman, M. A., N. C. D. Barma, M. H. Sarker, M. M. R. Sarker and M. I. Nazrul. 2013. Adaptability of wheat varieties in strongly acidic soils of Sylhet. Bangladesh J. Agric. Res. 38(1): 97-104.
Rahman, M. M., A. Hossain, M. A. Hakim, M. R. Kabir and M. M. R. Shah. 2009. Performance of wheat genotypes under optimum and late sowing conditions. Int. J. Sustain. Crop Prod. 4(6): 34-39.
Tang, C., Z. Rengel, E. Diatloff and C. Gazey. 2003. Response wheat and barley to liming on sandy soil with subsoil acidity. Field Crops Res. 80: 235-244.
Timsina, J. and D. J. Cornor. 2001. Productivity and management of rice-wheat cropping systems: Issues and challenges. Field Crops Res. 69: 93-132.

ISSN 0258-7122
Bangladesh J. Agril. Res. 40(4): 529-536, December 2015
GENETIC DIVERSITY OF MAIZE (Zea mays L.) INBREDS UNDER
SALINITY STRESS
M. M. ROHMAN1, B. R. BANIK2, A. BISWAS3 AND M. S. RAHMAN4
Abstract
The study was conducted to investigate the genetic diversity of some maize
inbreds under salinity stress condition using Mahalanobis’s statistic (D2) and
principal component analysis. Analysis of variance showed significant
difference for all the characters. Results of multivariate analysis revealed that
twenty five inbred lines formed five clusters at 8 dS level of salinity. The
highest intra-cluster distance was recorded in cluster III containing eight
genotypes and the lowest was in cluster II having one genotype. The highest
inter cluster distance was observed between clusters II & V and lowest was
between I & III. Cluster II had the highest cluster means for plant height, cob
height, above ground dry mass, cob per plant, cob length, and grain yield per
plant. Considering cluster distance, inter-genotypic distance and other
agronomic performances the genotypes CZ12, CZ19, CZ26, CZ29, CZ31,
CZ32, CZ33 & CML470 from cluster III and CZ27, CZ37, CML251 and
CML456 from cluster V may be considered as better parents for future
hybridization programs to obtain desirable segregate in respect of different yield
and yield contributing characters under salinity stress.
Keywords: Maize (Zea mays L.), inbred lines, genetic divergence, salinity stress,
cluster analysis, grain yield.
Introduction
Maize (Zea mays L.) plays a significant role in human and livestock nutrition worldwide. It is the world’s most widely grown cereal and is the primary staple food in many developing countries (Morris et al. 1999). Maize is becoming an important crop in the rice based cropping system in Bangladesh. It is the third leading important cereal crop after rice and wheat. In recent years, maize is gaining popularity among the farmers mainly due to its high yield, more
economic return and versatile uses. The area and production of maize is increasing day by day in Bangladesh and it continues to expand rapidly at an average rate of 20% per year (Anonymous, 2008). Plants in saline areas are often exposed to multiple abiotic stresses. High salinity is one of the most important abiotic stress factors limiting plant growth and productivity of a wide variety of crops (Flowers, 2004; Athar et al., 2008). Thus, increased soil salinity has
become an increasingly important topic (Flowers, 2004). Over 400 Mha across
1Senior scientific officer, Plant Breeding Division, Bangladesh Agricultural Research
Institute (BARI), Gazipur, 2Director, Training and Communication, BARI, 3Scientific
officer, Plant Breeding Division, Regional Agricultural Research Station, BARI, Jessore, 4Senior scientific officer, Irrigation Division, BARI, Gazipur, Bangladesh.

530 ROHMAN et al.
the world is affected by salinity that is about 25 % of the world’s total area (including Bangladesh) (Ghassemi et al., 1995). The response of plants to excess
salinity is complex and involves changes in their morphology, physiology and metabolism. Morphologically the most typical symptom of saline injury to plant is reduction of growth (Azooz et al., 2004), which is a consequence of several physiological reasons. Therefore, management and use of morphological variation under salinity condition might give a possibility in selecting inbred lines to develop salinity resistant maize. The genotype of extra polar salinity
might offer good genetic combination of better homeostasis.
In southern belt of Bangladesh about 1.2 million hectare (Anonymous, 2010) of land remains fallow every year due to salinity hazard. To use this fallow land it needs to develop variety with high adaptability under salinity stress. This study will not only offer suitable parent for breeding program but also provide opportunity of developing base population for molecular study.
Materials and Method
Twenty five genotypes of maize, locally developed through recycling by plant breeding division, BARI, Gazipur were grown in a completely randomized design (CRD) with 3 replications at the research farm of Irrigation Division, coordinated by Plant Breeding Division of BARI, Gazipur, during rabi season of 2011-2012. Seeds of each inbred were sown uniformly into the soil of plastic pots by hand. The
plastic pots were placed according to the FAO standard irrigation system for supplying the saline water. The soil was made wet by normal saline water. The seedlings emerged six to eight days after sowing. The seedlings were thinned to one per pot after ten days of emergence. Irrigation was given at two leaves stage with 8 dS concentration of saline water and repeated at 15 days interval. Fertilizers were applied @ 120, 80, 80, 20, 5 and 1 kg/ha of N, P, K, S, Zn and B respectively.
Standard agronomic practices were followed (Quayyum, 1993) and plant protection measures were taken when required. Data were collected on grain yield/plant, plant height, above ground dry mass, cob per plant, cob height, cob length and cob diameter. Genetic diversity was estimated using Mahalanabis generalized distance (D2) extended by Rao (1952). Tocher’s method was followed to determine the group constellation. Canonical variate analysis was performed as
per Rao (1964) to confirm the results of cluster D2 analysis. Mean data for each character was subjected to both univariate and multivariate analysis. Univariate analysis of the individual character (analysis of variance) was done by computer using MSTAT-C software. Genetic diversity of twenty five genotypes at 8 dS level of salinity was analyzed using GENSTAT 5.13 software program (copyright 1987, Lawes Agricultural Trust, Rothamasted Experimental Station, UK).
Results and Discussion
The maize inbred lines showed significant variation for all the morphological characters. Eigen values of nine principal component axes and percentage of

GENETIC DIVERSITY OF MAIZE (Zea mays L.) INBREDS UNDER SALINITY STRESS 531
variation of total variation accounting for them obtained from the principal component analysis are presented in table 1. The results revealed that the first axes accounted for 36.51% of the total variation among the genotypes, while seven of these with eigen values accounted for 100%. The first three axes of seven eigen values above the unity accounted for 76.86% of the total variation. Azam (2012) evaluated that days to 50% tasseling, days to 50% silking and plant height together accounted for 71.96% of the total genetic divergence in maize.
Table 1. Eigen values and percentage of variation for corresponding 7 component
characters in 25 maize inbred lines.
Principal component axis Eigen
values
Percentage (%) of total
variation
Cumulative percent
of variation
Plant height (cm) 2.556 36.51 36.51
Cob height (cm) 1.545 22.08 58.59
Above ground dry biomass (g) 1.279 18.27 76.86
Cob /plant 0.602 8.60 85.46
Cob length (cm) 0.422 6.03 91.49
Cob diameter (cm) 0.321 4.58 96.07
Grain yield /plant (g) 0.275 3.93 100.00
Based on the principal component scores I and II obtained from the principal
component analysis, a two-dimensional scatter diagram (Z1-Z2) was constructed
using component score I (Z1) as X-axis and II (Z2) as Y-axis (Figure 1). The
positions of the genotypes in the scatter diagram were apparently distributed into
five groups, which indicated that considerable diversity exists among the
genotypes.
Fig. 1. Scatter distribution of 25 maize inbred lines based on their principal
component scores superimposed with clusters.
The inter genotypic distances were used in computation of intra-cluster distances from distance matrix of PCO according to Singh and Choudhary (2001). The intra-cluster distances were not always proportional to the number of the

532 ROHMAN et al.
genotypes in the cluster (Table 2). In the present study, the clusters IV composed of the largest number of genotypes (10), but their intra-cluster distances were not the highest. The statistical distances represent the index of genetic diversity among the clusters. The intra-cluster distances ranged from 0.000 to 5.345. Intra-cluster distances in all the clusters were more or less low which indicated that the genotypes within the same cluster were closely related.
The highest intra-cluster distance was recorded in cluster III (5.345) containing eight genotypes followed by cluster V (5.125) containing four genotypes. The lowest intra-cluster distance was observed in cluster II (0.000) having one genotype. The intra-cluster distances of cluster I and IV were 4.440 and 3.560 consisting of 2 and 10 genotypes, respectively. These findings of the present study are in conformity with the findings of Datta and Mukherjee (2004), Singh et al. (2005) and Marker and Krupakar (2009).
Table 2. Average inter-cluster and intra-cluster (bold) distance (D2) for 25 maize
inbred lines obtained by canonical variate analysis.
Cluster I II III IV V
I 4.440
II 17.075 0.000
III 3.724 14.837 5.345
IV 4.884 15.648 4.703 3.560
V 4.370 18.392 4.298 4.874 5.125
Canonical variate analysis was done to compute the inter-cluster Mahalanobis’s D2 values. The intra and inter-cluster distance (D2) values are presented in table 2. Results indicated that the highest inter-cluster distance was between clusters II and V (18.392) followed by I and II (17.075) and II and IV (15.648). The higher inter-cluster distances between these clusters indicated to the wide spectrum of variability in the population. The lowest inter-cluster distance was observed between the clusters I and III (3.724) suggesting a close relationship among the genotypes within these clusters.
Statistical distances represent the index of genetic diversity among the clusters. The inter-cluster distances were larger than the intra-cluster distances which indicated wider genetic diversity among the genotypes of different groups. Debnath (1987) obtained larger inter-cluster distance than the intra-cluster distance in a genetic variability in maize. Similar results were also obtained by Abedin and Hossain (1990) in maize.
With the application of co-variance matrix for non-hierarchical clustering, 25 maize genotypes were grouped into five clusters. Gupta et al. (1991) found five clusters; Azam (2012) reported five clusters from 49 maize genotypes. The distribution pattern indicated that maximum 10 inbred lines were included in cluster IV followed by 8 in cluster III. The remainders have been distributed in three clusters. The least number 1 was included in cluster II (Table 3).

GENETIC DIVERSITY OF MAIZE (Zea mays L.) INBREDS UNDER SALINITY STRESS 533
These results confirmed the clustering pattern of the genotype according to the principal component analysis. Composition of different clusters with their corresponding genotypes included in each cluster are presented in table 3. Results of the different multivariate techniques were super imposed with the clusters (Fig 1). The clustering pattern obtained was coincided with the apparent grouping patterns performed by PCA. For that reason it can be said that the results obtained through PCA were established by non-hierarchical clustering.
Table 3. Distribution of 25 maize inbred lines in different clusters.
Cluster Total no. of
genotypes in the
cluster
Genotypes included in different clusters
I 2 CZ36, CML376-1
II 1 CZ35
III 8 CZ12, CZ19, CZ26, CZ29, CZ31, CZ32, CZ33, CML470
IV 10 CZ3, CZ10, CZ24, CZ28, CZ30, CML159, CML206-1,
CML216, CML395, CML496
V 4 CZ27, CZ37, CML251, CML456
An attempt was made to characterize the individual genotypes in respect of their mean values for different characters with a view to getting the idea whether the genotypes having similar characteristics could be disseminated. The Intra-cluster mean values for all the 7 characters along with the marking of the highest (H) and the lowest (L) for each of the clusters is presented in table 4. The data revealed that different clusters exhibited different mean values for almost all the characters. Plant height had the highest intra-cluster means in cluster II followed by those in cluster I and cluster IV. The lowest intra-cluster mean for this trait was observed in cluster V. Cob height had the highest group means in cluster II followed by those in cluster I and cluster IV. It had the lowest mean in cluster V. The intra-cluster mean for above ground dry mass was the highest in cluster II followed by those in cluster IV. The lowest intra-cluster mean for this trait was observed in cluster I. Intra-cluster mean for cob per plant were the highest in cluster II (2.00) and the lowest in cluster I (1.00). Cob length had the highest group mean in cluster II (15.00) followed by those in cluster III (12.13) and cluster I (12.00). The lowest intra-cluster mean for this trait was observed in cluster V (8.06).
The lowest value for cob diameter was found in cluster V (3.17) followed by cluster IV (3.45) and cluster II (3.60), the highest was in cluster I (4.15). Grain yield per plant was the highest in cluster II (163.38) followed by cluster III (70.12) and cluster I (49.52) and the lowest was in cluster V (35.96).
The inter-cluster distance of cluster II with other clusters was higher than the inter-cluster distances between the remaining cluster combinations (Table 2). The

534 ROHMAN et al.
cluster means of this cluster for plant height, cob height, above ground dry mass, cob per plant, cob length and grain yield per plant was also divergent. These indicated that the genotype included in cluster II were very important to contribute to the total divergence among the inbreds for these characters. Cluster I provided the highest cluster means for cob diameter which indicated that the inbred lines within this cluster could be used for increasing cob diameter in maize. Based on cluster means Singh and Chaudhari (2003) also reported wide range of variation for grain yield and it’s components in maize. Marker and Krupakar (2009), also have assessed the range of variability of 16 genotypes for 14 traits in maize. The present results are in agreement with those of Tang et al. (2002) and Alom et al. (2003) who also identified the above mentioned characters as the principal components contributing maximum to the total variation in maize.
Table 4. Cluster means for seven different characters of 25 maize inbred lines.
Characters Clusters
I II III IV V
Plant height (cm) 114.00 135.00 H 95.75 108.05 87.03 L
Cob height (cm) 48.00 65.00 H 40.06 45.65 34.00 L
Above ground dry biomass (g) 45.31 L 86.91 H 56.55 76.83 56.25
Cob /plant 1.00 L 2.00 H 1.19 1.15 1.25
Cob length (cm) 12.00 15.00 H 12.13 11.50 8.06 L
Cob diameter (cm) 4.15 H 3.60 3.99 3.45 3.17 L
Grain yield /plant (g) 49.52 163.38 H 70.12 37.77 35.96 L
Note: H= High, L= Low
Generally genetic diversity is associated with geographical diversity but the
former is not necessarily directly related with geographical distribution. In the
present study, pattern of clustering revealed that genotypes originating from
recycling of different high yielding hybrids were grouped in the same cluster and
hybrids were collected from different countries. This indicates that geographic
diversity was not related to genetic diversity, which might be due to continuous
exchange of genetic materials among the countries of the world. Verma and
Sachan (2000) observed no parallelism between geographic and genetic diversity.
Chatterjee and Khare (1991) studied a negative relationship between geographic
and genetic diversity. Gupta et al. (1991) showed no correlation between
geographic and genetic diversity.
Contribution of characters towards the divergence obtained from canonical
variate analysis is presented in table 5. In this method, vectors were calculated to
represent the varieties in the graphical form (Rao et al., 1952). This is helpful in
cluster analysis as it facilitates the study of group constellations and also serves
as a pictorial representation of the configuration of various groups.

GENETIC DIVERSITY OF MAIZE (Zea mays L.) INBREDS UNDER SALINITY STRESS 535
Table 5. Latent vectors for seven principal component characters of 25 maize inbred lines.
Characters Vector I Vector II
Plant height (cm) -0.4484 -0.2755
Cob height (cm) -0.5076 -0.1601
Above ground dry biomass (g) -0.2299 -0.5423
Cob /plant -0.1383 -0.3056
Cob length (cm) -0.4654 0.3105
Cob diameter (cm) -0.2635 0.6275
Grain yield /plant (g) -0.4281 0.1445
In vector I (Z1) obtained from PCA, no characters had positive values. In vector II (Z2), the second axis of differentiation, cob length (0.3105), cob diameter (0.6275) and grain yield/plant (0.1445) were important because all these characters had positive values.
Plant height, cob height, above ground dry biomass and cob per plant had negative value in both the vectors, which indicated that they were the less important component characters having lower contribution to the genetic divergence among the materials studied. Among the characters, cob length, cob diameter and grain yield/plant contributed maximum towards the genetic divergence under salinity stress conditions. The current consequences are in concurrence with those of Tang et al. (2002), Alom et al. (2003) , Marker and Krupakar (2009) who also identified above mentioned characters as the principal components contributing maximum to the total variation in maize.
Conclusion
The results indicated that the cob length, cob diameter and grain yield per plant had maximum contribution to the genetic divergence among the genotypes. The cluster means of cluster II for plant height, cob height, above ground dry mass, cob per plant, cob length and grain yield per plant was also divergent. These indicated that the genotype included in cluster II were very important to contribute to the total divergence among the inbreds for these characters. Cluster I provided the highest cluster means for cob diameter which indicated that the inbred lines within this cluster could be used for increasing cob diameter in maize. Inbreds of cluster II and I may be selected for hybridization for obtaining desirable segregants for these traits under salinity stress.
References
Abedin. J and M. A. Hossain, 1990. Variability in maize composites. Bangladesh . Agric. J. Res. 15(1): 24-31.
Alom A. K., M. M. Masum, A. S. M. H. Nahar, M. A. Matin and A. K. M. J. Pasha 2003.Genetic divergence in maize (Zea mays L.) Pakistan J. Biol Sci. 6(22): 1910-1911.
Anonymous. 2008. Achievements of The Bangladesh CIMMYT partnership for agricultural research and development CIMMYT. Bangladesh, Banani, Dhaka. Pp.1-9
Anonymous.2010. Annual Report, Plant Breeding Division, BARI
Athar, H., A. Khan and M. Ashraf, 2008. Exogenously applied ascorbic acid alleviates salt-induced oxidative stress in wheat. Environ. Exp. Bot., 63:224-231

536 ROHMAN et al.
Azam, M.G. 2012. Morphological and molecular diversity analysis in maize inbreds. MS. Thesis, Department of Genetics and Plant Breeding, BSMRAU, Salna, Gazipur : 58-59.
Azooz, M.M., M.A. Shaddad and A.A. Abdel-Llatef, 2004. Leaf growth and K+/Na+ ratio as an indication of the salt tolerance of three sorghum cultivars grown under salinity stress and IAA treatment. Acta Agron. Hungaica 52: 287-296
Chatterjee, A. and D. Khare 1991. Multivariate analysis in niger (Guizotia abyssinica). Research and Development Reporter 8(2): 111-114.
Datta D. and B. K. Mukherjee. 2004. Genetic divergence among maize (Zea mays L.) inbreds and restricting traits for group constellation. Indian J. Genet. 64(3): 201-207.
Debnath, S. C. 1987. Genetic variability in maize (Zea mays L.) Bangladesh J. Agric. 12(4): 217-221.
Flowers, T. J., 2004. Improving crop salt tolerance. J. Exp. Bot. 55: 307-319
Ghassemi, F., A.J. Jakeman, H.A. Nik, 1995. Salinisation of land and water resources. Human causes, extent, management and case studies, University of New South Wales Press, Sydney, Pp 526
Gupta, V. P., M. S. Sekhon and D. R. Satiya. 1991. Studies on genetic diversity, heterosis and combining ability in Indian mustard [Brassica juncea L. (Czern and Coss)]. Indian J. Genet. PI. Breed. 51(4): 448-453.
Mahalanobis, P.C.1936. On the generalized distance. Proc. Nat. Inst. Sci. India 11(1): 49-55.
Marker, S. and A. Krupakar. 2009. Genetic Divergence in Exotic Maize Germplasm (Zea mays L.) ARPN J. Agrl. Biol. Sci. 4: 44-47.
Morris, M. L., J. Risopoulos and D. Beck. 1999. Genetic change infarmer-recycled maize (Zea mays L.) seed; a review of the evidence. CIMMYT Economic Working paper No. 99-07.Mexico, D.F., CMMYT, 1p.
Quayyum, M. A. 1993. Bhuttar Chash Paddhati (in Bengali). In: Chowdhury, M. K and M. A. Islam (ed.). Bhuttar Utpadan O Babohar. Bangladesh Agricultural Research Institute, Gazipur. Pp 43-48.
Rao, C. R. 1952. Advanced statistics methods in Biometric Research, Ed. John Wiley and Sons Inc. New York. P. 390.
Rao, C. R. 1964. Statistical genetic consideration for maintaining germplasm collection. Theor Appl. Genet. 86: 673-678.
Singh P. K. and Chaudhari L. B. 2003. Genetic divergence in maize (Zea mays L). J. Res. Birsa Agric.Univ. 13(2):193-195.
Singh, P. K. and L. B. Choudhary. 2001. Genetic divergence in maize (Zea mays L.) J. of Res. Birsa Agricultural University 13(2): 193-195.
Singh, P., S. Dass, V. K. Dwivedi, Y. Kumar and O. Sangwan. 2005. Genetic divergence studies in maize (Zea mays L.). Annals of Agric Bio-Res. 10(1): 43-46.
Smith, M. F. 1990. A multivariate approach to specific problem of grouping maize cultivars. South African J. Plant and Soil. 7(3): 167-171.
Tang, D. F., Yang A. G., Pan G. T. and Rang T. Z. 2002. Study on combining ability and clustering analysis of CIMMYT maize population and local population in China. J. Siehuan Agric. Univ. 20(4): 317-320.
Verma, S. K. and J. N, Sachan., 2000. Genetic divergence in Indian mustard [(Brassica juncea. L.) Czern and Coss.]. Crop Res. Hisar. 19(2): 271-276.

ISSN 0258-7122
Bangladesh J. Agril. Res. 40(4): 537-550, December 2015
GENOTYPIC VARIATIONS IN GROWTH, YIELD AND YIELD
COMPONENTS OF SOYBEAN GENOTYPES UNDER DROUGHT
STRESS CONDITIONS
J. A. CHOWDHURY1, M. A. KARIM2, Q. A. KHALIQ2
A. R. M. SOLAIMAN3 AND J. U. AHMED 4
Abstract
A pot experiment was carried out in a venylhouse at Bangabandhu Sheikh
Mujibur Rahman University during 2012 to investigate the growth, yield and
yield contributing characters of ten selected soybean genotypes viz. Shohag,
BARI Soybean-6, BARI Soybean-5, BD2331, BD2329, BD2336, BD 2340,
BGM2093, G00015 and BGM2026 under drought stress and control conditions.
Plant height, number of leaves, leaf area, shoot and root dry weight of all the
genotypes were significantly affected by the stress. Among the genotypes
Shohag, BARI Soybean-6 and BD2331 were found tolerant in relation to the
growth under water stress conditions. The reduction in RGR values was more in
the susceptible genotypes at the later stages of growth than in the tolerant
genotypes. Seed yield of the genotypes was reduced from 42 to 68% due to
drought (water) over non-stress. Susceptible genotypes showed greater reduction
in seed yield than the tolerant genotypes.
Introduction
Soybean, a grain legume, is one of the most important oilseed crops of the world.
It is the world’s leading economic oilseed crop (Manavalan et al., 2009). It is
also an important source of plant protein of the people in semi-arid and tropical
regions. It has a great value as food, feed and fuel. The production of the crop is
often limited by the erratic nature of rainfall. It is reported that water stress
affects soybean production worldwide. Among the crops, soybean has the
highest sensitivity to drought (Maleki et al., 2013). Drought may reduce yield of
soybean by about 40% (Specht et al., 1999).
In Bangladesh, soybean is planted during post-monsoon when stored soil
moisture rapidly declines and the crop encounters drought at the reproductive
stage. Plant growth is affected by moisture stress including leaf expansion which
is reduced due to sensitivity of cell growth to water stress. Reduction in leaf area
reduces crop growth and thus affects biomass production (Brown et al., 1985).
Shoot biomass accumulation is considered an important trait to attain high seed
1Senior Scientific Officer, Agronomy Division, Bangladesh Agricultural Research
Institute (BARI), Gazipur-1701, 2Professor, Department of Agronomy, Bangabandhu
Sheikh Mujibur Rahman Agricultural University (BSMRAU), Gazipur-1706, 3Professor,
Department of Soil Science, BSMRAU, Gazipur-1706, 4Professor, Department of Crop
Botany, BSMRAU, Gazipur-1706.

538 CHOWDHURY et al.
yield in grain legumes (Saxena et al., 1990). Significant differences have been
observed for shoot and root biomass accumulation among soybean cultivars
grown under severe drought stress. Root have an essential role in tolerating
drought as they are the main organs responsible for sourcing valuable water
(Eureka et al., 2000). Yordanov et al., (1997) claimed that water stress reduces
the biomass, seed yield, number of pods in main stem, pod and seed number per
plant.
The objective of this study was to assess the morphological growth parameters of
ten soybean genotypes subjected to drought stress at different growth stages and
to identify the genotype that is most sensitive and most tolerant to water stress.
Materials and Methods
The experiment was conducted in a venylhouse constructed at the Environmental
Stress Research Site in Agronomy farm of Bangabandhu Sheikh Mujibur
Rahman Agricultural University, Gazipur during February to May 2012. Six
relatively tolerant soybean genotypes viz., Shohag, BARI Soybean-6, BARI
Soybean-5, BD2331, BD2329 and BD2336 and four susceptible viz, BD2340,
BGM2093, G00015 and BGM2026 altogether selected from the previous
experiment which were grown in plastic pots. The soil of the pot was filled with
mixture of soil and cow dung at a ratio of 4:1. Pot contained 12.0 kg of soil
which was equivalent to 9 kg oven dry soil and holds about 28% moisture at field
capacity (FC). Soil use in the plastic pot was sandy loam and was fertilized
uniformly with 0.15, 0.18, 0.36 and 0.1 g urea, triple super phosphate, muriate of
potash and gypsum corresponding to 24-30-60-15 kg NPK and S hectare-1,
respectively. Total amount of all fertilizers were mixed with soil before the
sowing of seeds.
Six seeds of each genotype were sown in each pot on 2 February 2012 and later
thinned to three healthy seedlings per pot. Most of the seedlings emerged within
7 days after sowing. Plants of each pot received adequate watering regularly to
maintain optimal soil moisture until the water stress treatment was imposed.
Adequate plant protection measures were taken to keep the plants free from
diseases, insects and weeds through the growing season.
Plants of all the genotype were subjected to two levels of water regime viz., S0 =
Non-stress (Control); water was applied as and when it is required and Sw =
Drought stress (Water stress) throughout the growing period; pots were irrigated
with water at 50% field capacity at appearance of wilting symptom. The
experiment was laid out in a Completely Randomized Design with four
replications. Three plants pot-1 considered as one replication. After 21 days after
emergence (DAE), water stress treatments were applied.

GENOTYPIC VARIATIONS IN GROWTH, YIELD AND YIELD 539
Total dry matter of shoot and root was measured at different growth stages
(vegetative, flowering and pod filling stages) by oven drying at 700C to a constant
weight. For each and every sampling of all treatments four times number of
replicated pots were maintained. Roots were washed thoroughly in tap water and
blotted dry before drying. The leaf area plant-1 was measured with an automatic
area meter (Model AAM-8, Hayashi denko, Japan) at vegetative, flowering and
pod development stages. Yield and yield components were also determine at
harvest. Relative growth rate (RGR) was calculated by using the following
formula (Gardner et al., 1985):
RGR = 12
12
T - T
Ln W - LnW gg-1day-1
Where, W1 = dry weight of plant at time T1
W2 = dry weight of plant at time T2
Ln = natural logarithm
Yield contributing characters viz. number of pods plant-1, seeds pod-1, 100 seed
weight and seed yield were measured at harvest. The recorded data were
analyzed by ‘MSTAT-C’ statistical package. The difference between the
treatments means were compared by Least Significant Difference (LSD) test
(Gomez and Gomez, 1983).
Results and Discussion
Plant height
Drought significantly decreases the plant height of soybean genotypes. Plant
height of ten soybean genotypes showed significant differences under both non-
stress (NS) and water stress environments at all the growth stages (Table 1.).
Under NS environment, BGM2026 produced the maximum plant height (50.42
cm) at vegetative stage which was followed by BARI Soybean-5 and G00015 but
under water stress environment, BD 2331 obtained the maximum plant height
(41.63 cm) which was identical with BGM2026. The shortest plant was recorded
from BGM2093 (32.84 cm) under water stress condition. But from flowering
stage to maturity, all the genotypes under non-stress environment produced
significantly taller plants than that under water stress environment. The genotype
BGM2026 attained the maximum height at non-stress environment but under
water stress environment, BARI Soybean-6 produced the tallest plant followed
by Shohag. Under water stress environment, BGM2026 was affected severely
which produced the shortest plant. It was also observed that irrespective of
genotype, plant height changed with the advancement of growth stages in both
the environments. Plant height `increased sharply from vegetative to pod

540 CHOWDHURY et al.
development stage and thereafter slowly up to maturity stage. Reduction in plant
height was more at maturity stage irrespective of genotypes.
Table 1. Plant height at different growth stages in soybean genotypes under non-
stress and water stress conditions.
Genotypes
Plant height (cm)
at vegetative
stage
at flowering
stage
at pod
development
stage
at maturity stage
Non-
stress
Water
stress
Non-
stress
Water
stress
Non-
stress
Water
stress
Non-
stress
Water
stress
Shohag 43.76 35.06 63.28 53.2 68.83 55.4 75.97 60.87
BD2329 42.35 33.03 62.1 51.97 70.12 55.31 74.22 57.2
BARI
Soybean-5
49.39 35.77 64.56 50.59 69.75 54.17 77.31 59.27
BARI
Soybean-6
45.57 40.35 67.6 55.11 74.67 59.22 78.74 64.51
BD2340 41.42 38.8 57.43 47.94 72.95 52.97 75.55 54.8
BD2336 44.74 39.57 58.18 45.44 73.54 52.04 76.68 58.63
BGM2093 39.27 32.84 54.58 46.67 71.85 53.5 78.38 57.32
BD2331 45.85 41.63 68.03 52.1 75.8 55.94 77.33 58.75
G00015 48.21 39.62 68.5 50.2 72.71 56.71 75.72 57.21
BGM2026 50.42 40.7 74.06 44.5 86.67 47.67 92.45 49.8
LSD(0.05) SxG NS NS 9.917 6.136
CV% 9.58 9.86 9.38 5.46
S=Stress, G=Genotypes, NS=Not significant
At maturity stage extent of plant height reduction under two moisture regimes are
presented in Fig. 1. The reduction percent in plant height was found minimum in
BARI Soybean-6 (18.07% reduction) and maximum in the genotype BGM2026
(46.13%) due to water stress. The differences in plant height reduction among the
genotypes mainly due to genotypic differences. Water stress induced reduction in
plant height was also observed by Khan et al. (2014) in soybean. The decrease in
plant height could be resulted from a reduction in plant photosynthetic efficiency
as reported by Hamid et al. (1990). It also might be due to decrease in relative
turgidity and dehydration of protoplasm which is associated with a loss of turgor
and reduced expansion of cell and cell division (Arnon, 1972).

GENOTYPIC VARIATIONS IN GROWTH, YIELD AND YIELD 541
Fig 1. Extent of plant height reduction at maturity under non-stress and water stress
environments of 10 selected soybean genotypes. (Vertical bar represent LSD
value at 5% level of significant.)
Table 2. Leaf number at flowering and pod development stages in soybean
genotypes under non-stress and water stress conditions.
Genotype
Total leaf number
Flowering stage Pod development stage
Non-
stress
Water
stress
%
reduction
Non-
stress
Water
stress
%
reduction
Shohag 25 20 20 30 22 26
BD2329 24 18 25 29 20 31
BARI Soybean-5 26 18 30 34 22 35
BARI Soybean-6 26 22 15 28 23 17
BD2340 24 17 29 30 21 30
BD2336 23 14 39 28 16 42
BGM2093 22 14 36 29 17 41
BD2331 24 17 29 28 18 35
G00015 19 13 31 26 17 34
BGM2026 29 14 51 37 15 59
LSD(0.05) S×G NS 5.513
CV% 15.23 13.44
S= Stress, G= Genotype, NS=Not significant
Leaf number plant-1
Decrease in leaf number was observed at two growth stages under water stress
environments (Table 2.). Genotypic variations in number of leaves were also
found under both non-stress and water stress environment. In all the genotypes

542 CHOWDHURY et al.
decrease in leaf number was higher at pod development stage, than that at
flowering stage. Water stress condition reduces the leaf number because drought
stress reduces leaf initiation and accelerates leaf senescence. At flowering stage,
reduction percent varied from 15 to 51%, whereas it was 17 to 59 % at pod
development stage. Razakou et al. (2013) observed 5 to 64% reduction in leaf
number in cowpea. Under water stress condition, lowest number of leaf was
found in BGM2026 genotype but at non-stress condition, it produced the highest
number of leaf. Due to water stress the less affected varieties were BARI
Soybean-6 and Shohag. Reduction in leaf number occurred may be due to less
number of leaf initiation (Thrikawela, and Bandara, 1992)
Leaf area
Reduction in leaf area is convenient morphological parameters for measuring
drought stress experienced by the plant (Ku et al., 2013). Water stress
significantly reduced the total leaf area. Under stress, drought tolerant soybean
cultivars exhibited a larger leaf area when compared with less tolerant cultivars
(Moreira et al., 2010). Leaf area of ten soybean genotypes at different growth
stages under non-stress and water stress environments showed significant
differences (Table 3.). At vegetative stage, the reduction of leaf area varied from
8.04 to 22.63% and reduction percent does not show any trend among tolerant
and susceptible genotypes. But at the later stages of growth these situations were
changed. With the advancement of growth the susceptible genotype showed the
higher reduction than tolerant genotypes. Under non-stress condition highest leaf
area was found in BGM2026 at both flowering and pod development stages but
not under stress condition. Under stress condition Shohag produced the highest
leaf area. In case of reduction percent BGM2026 showed the highest reduction
and BARI Soybean-6 showed the lowest reduction in leaf area at both flowering
and pod development stages. Less leaf expansion, leaf growth reduction and leaf
senescence acceleration might be responsible for lower leaf area. Khan et al.
(2014) in soybean and Samson and Helmut (2007) in cowpea reported earlier that
water deficit stress reduced significantly the total leaf area. Krishnamoorthy
(1993) reported that water stress causes a reduction in the size of leaves as
because cell division in the leaf primordial ceases due to water stress. According
to Ludlow and Muchow (1990) reduced leaf growth and accelerated leaf
senescence is common responses to water deficits and the parameters both reduce
leaf area.

GENOTYPIC VARIATIONS IN GROWTH, YIELD AND YIELD 543
Table 3. Leaf area at different growth stages in soybean genotypes under non-stress
and water stress conditions
Genotypes
Leaf area (cm2 plant-1)
Vegetative stage Flowering stage Pod development
stage
Non-stress Water
stress
Non-
stress
Water
stress
Non-
stress
Water
stress
Shohag 728.78 650.54
(10.73)
1043.0 823.97
(21.0)
1204.7 875.69
(27.31)
BD2329 669.21 530.01
(20.8)
936.12 655.67
(29.95)
1164.02 737.66
(36.62)
BARI Soybean-5 674.24 598.91
(11.17)
1027.79 793.96
(22.75)
1212.22 842.37
(30.51)
BARI Soybean-6 616.45 566.86
(8.04)
879.96 747.09
(15.09)
1159.4 862.25
(25.62)
BD2340 638.59 581.11
(9.0)
904.73
653.91
(27.72)
1200.3 733.98
(38.85)
BD2336 665.66 515.02
(22.63)
928.77
606.82
(34.66)
1035.28 630.11
(39.13)
BGM2093 551.96 502.15
(9.02)
902.9 565.58
(37.35)
1179.27 636.64
(46.01)
BD2331 641.32 561.67
(14.18)
895.79 688.06
(23.18)
1081.37 730.79
(32.41)
G00015 582.0 497.09
(14.58)
710.97 527.82
(25.76)
897.4 593.89
(33.82)
BGM2026 735.78 539.61
(26.66)
1066.19 560.57
(52.48)
1311.13 577.98
(55.91)
LSD(0.05) SxG 47.81 64.07 78.78
CV% 4.74 4.87 5.11
S=Stress, G= Genotypes
Value in the parentheses represents the percent reduction of the parameters under
water stress over non-stress.
Shoot and root dry weight
Due to water stress the reduction in shoot dry weight was not significant at
vegetative stage in any genotype. But numerically, reduction was higher in
G00015 followed by BGM2026 at vegetative stage (Figs. 2). At this stage
BD2336 produced more shoot dry weight under stress condition than non-stress

544 CHOWDHURY et al.
condition (Fig: 2). At flowering or pod development stage the reductions were
conspicuous in all the genotypes due to water stress. A large reduction in
shoot dry weight was found in the genotype BGM2026 which was 33.65% at
flowering, 48.29% at pod development and 58.98% at maturity stage. On the
contrary, the shoot dry weight of tolerant genotypes Shohag, BARI Soybean-6,
BARI Soybean-5 and BD2331 were affected the least by the stress. A similar
finding was observed by Khan et al. (2014) in soybean, Eureka et al. (2000) and
OO et al. (2008) in mungbean. Leaf area has been frequently reported to have a
close relationship with crop growth (OO et al., 2008; Anyia and Herzog, 2004).
The decrease in leaf area (Table 3) by the WS condition was closely related to
the shoot dry weight (Figs. 2). This means that tolerant genotypes having a better
sustainability in producing more leaf area to keeping a high shoot dry weight
under WS condition.
Fig. 2. Dry weight and reduction percent of shoot of 10 selected soybean genotypes
at different growth stages under non-stress and water stress conditions.

GENOTYPIC VARIATIONS IN GROWTH, YIELD AND YIELD 545
Fig. 3. Root dry weight of 10 selected soybean genotypes at different
growth stages under non-stress and water stress conditions
At vegetative stage a remarkable increase in root dry weight was observed in all
the genotypes under stress and non-stress conditions (Fig. 3). But root dry weight
decreased under WS environment in BGM2026, BD2336, BD2340, BGM2093
and G00015 at pod development stage and onwards. At all the growth stages the
genotypes Shohag and BARI Soybean-6 maintained higher root dry weight under
water stress environment over non-stress. Islam et al. (2004) reported that root
dry weight of bushbean measured at harvest remarkably increased with the
decrease in the moisture level. Eureka et al. (2000) observed that reduction in
root dry matter occurred in susceptible genotypes but tolerant genotype were able
to maintain their root dry weight under drought at the level of the respective
control values. The water uptake was limited by the amount of roots, and the
enhancement of root growth could increase drought resistance (Klepper and

546 CHOWDHURY et al.
Rickman, 1990). Increase in root biomass of water stressed genotypes may be
due to ability to divert assimilates to enhance the growth of the roots so as to
exploit deeper parts of the soil water (Razakou et al., 2013). Maintenance of root
growth during water deficit is an obvious benefit to maintain an adequate plant
water supply, and is under genetic control (Sponchiado et al., 1989). The higher
value of root dry weight and less suppressed in shoot dry weight were shown in
Shohag and BARI Soybean-6 that might be related to drought resistance (Fig. 3).
Relative growth rate (RGR)
Relative growth rate of all genotypes decreased with the advancement of growth
stages at both the moisture regimes (Fig. 4). The RGR recorded in soybean
genotypes were always higher in control than under water stress condition. Under
water stress condition genotypes BD2336, BGM2093, G00015, BD2340 and
BD2329 maintained relatively higher RGR at the early growth stages but at later
stage higher RGR was maintained in Shohag, BARI Soybean-5,
BARI Soybean-6 and BD2331. At the later stage of the growth, the value of RGR
of BGM2026
was more inhibited compared to other genotypes under water stress environment.
The highest value of RGR in Shohag, BARI Soybean-5, BARI Soybean-6 and
BD2331 under water stress
was an indication of their drought tolerance, while the lowest value of RGR in
the genotype BGM2026 and BD2336 indicated their drought susceptibility. A
similar finding was reported by Lizana et al. (2006) and Costa-Franca et al.
(2000) in common bean.
Fig 4. Relative growth rate of ten soybean genotypes at different growth stages
under non-stress and water stress conditions

GENOTYPIC VARIATIONS IN GROWTH, YIELD AND YIELD 547
Seed yield and yield contributing characters
Water stress caused significant differences in pods plant-1, seeds pod-1 and seed
size of soybean genotypes (Table 4 and 5). The highest number of pod plant-1
was found in BGM2026 (59.25) which significantly differed from all other
genotypes under non-stress environment. Under water stress condition, the
maximum number of pod plant-1 (30.65) was obtained from BARI Soybean-6,
which was statistically identical with Shohag, and BD2331. The rate of reduction
was ranges from 31.37 to 55.88% the lowest where was in BARI Soybean-6
followed by BD2331 and Shohag (Table 4). The reduction in pod number plant-1
due to WS was reported earlier in french bean (Omae et al., 2005), in soybean
(Kokubun et al., 2001; Liu et al., 2004) and in mungbean (Islam, 2008). The
highest number of seeds pod-1 was observed in the genotype BGM2093 and the
lowest from BARI Soybean-5 in both the environment. The genotype BGM2026
also produced the least number of seed pod-1 under water stress condition but not
in non-stress condition. The rate of reduction varied from 2.65 to 20.43% under
water stress over non-stress environment across the genotypes. The maximum
reduction of seeds pods-1 (Table 4) was obtained from genotype BGM2026
(20.4%) followed by genotypes BD2331 (11.36%). However, the reduction rate
was the lowest in BARI Soybean-5 (2.66%). In case of seed size the rate of
reduction varied from 14.06 to 26% across the genotypes. The highest 100-seeds
weight was found in G00015 at both the environments but its reduction percent
was high. Lowest reduction occurred in Shohag followed by BARI Soybean-6
and BD2331. The genotype BGM2093 had the smallest seed size at both the
environments.
Water stress-induced yield reduction has been reported in many crop species (Farooq et al., 2009). Seed yield plant-1 was reduced by water stress in all the
soybean genotypes studied (Table 5). The rate of reduction ranged from 42.68 to 68.96% across the genotypes. The seed yield plant-1 under non-stress environment was the highest in genotype BARI Soybean-6 followed in decreasing order by BARI Soybean-5, BD2329, BGM2026, Shohag, BD2331, BD2340, G00015, BGM2093, and BD2336 genotypes. Pod number plant-1 and 100-seed weight might be responsible for highest seed yield in BARI soybean-6 and lowest in
BD2336. Under water stress, the highest seed yield plant-1 was also obtained from BARI Soybean-6 followed in decreasing order by Shohag, BD2331, BARI Soybean-5, BD2339, BGM2026, BD2340, G00015, BD2336 and BGM2093. The reduction in seed yield was primarily due to a decrease in pod number plant-1. The decrease in pod number plant-1 and seed size under drought stress was possibly due to reduction of photosynthesis, translocation of assimilates and increased rate
of reproductive organs abortion (Kukubun et al., 2001; Liu et al., 2003 and 2004; Tera’n and Singh, 2002). The number of seeds pod-1 and seed weight were reported to be more stable and less affected by environmental stress (Tera’n and Sigh 2002).

548 CHOWDHURY et al.
Table 4. Number of pods plant-1 and seeds pod-1 in soybean genotypes under non-
stress and water stress condition.
Genotypes
Pods plant-1 (no.) Seeds pod-1 (no.)
Non-
stress
Water
stress
%
Reduction
Non-
stress Water stress
%
Reduction
Shohag 44.16 29.57 33.03 2.25 2.15 4.44
BD2329 40.25 22.13 45.01 2.2 2.1 4.54
BARI Soybean-5 42.6 25.95 39.08 1.88 1.83 2.65
BARI Soybean-6 44.66 30.65 31.37 2.2 2.0 9.09
BD2340 41.5 19.14 53.87 2 1.92 4.00
BD2336 44.58 24.96 44.01 2.3 2.2 4.34
BGM2093 49.25 25.11 49.01 2.5 2.3 8.00
BD2331 42.16 28.44 32.54 2.2 1.95 11.36
G00015 25.66 12.08 52.92 2.25 2.04 9.33
BGM2026 59.25 26.14 55.88 2.3 1.83 20.43
LSD(0.05) SxG 9.585 NS
CV% 16.88 7.14
S= Stress, G= Genotype, NS=Not significant
Table 5. 1000-seeds weight and seed yield plant-1 of soybean genotypes under non-
stress and water stress condition.
Genotypes
1000-seeds weight (g) Seed Yield plant-1 (g)
Non
stress
Water
stress
%
Reduction
Non
stress
Water
stress
% Reduction
Shohag 110.2 90.6 14.28 8.62 4.79 44.43
BD2329 110.3 80.8 22.12 9.11 3.38 62.90
BARI Soybean-5 120.1 100.0 17.35 9.18 4.67 49.12
BARI Soybean-6 110.9 100.2 14.28 9.22 5.17 43.92
BD2340 110.3 90.05 19.91 7.99 2.48 68.96
BD2336 60.08 40.86 20.06 5.52 2.18 60.50
BGM2093 50.89 40.53 23.08 5.97 2.18 63.48
BD2331 90.88 80.49 14.06 8.2 4.7 42.68
G00015 130.9 100.4 25.17 6.42 2.22 65.42
BGM2026 70.5 50.55 26 9.1 3.05 66.48
LSD(0.05) SxG NS 0.5305
CV% 6.49 5.63
S= Stress, G= Genotype, NS=Not significant.
Conclusion
The results of the study indicated that the ten genotypes showed marked variations in plant growth characters, yield and yield attributes under water stress condition. Genotypes Shohag, BARI Soybean-6 and BD2331 were relatively water stress tolerant than others in respect of physiological adaptation associated with yield attributes and seed yield under water stress condition.

GENOTYPIC VARIATIONS IN GROWTH, YIELD AND YIELD 549
References
Anyia, A. O. and H. Herzog. 2004. Genotypic variability in drought performance and recovery in cowpea under controlled environment. J. Agron. Crop. Sci. 190: 151-159.
Arnon, I. 1972. Crop production in dry regions, Background and Principles. (Ed.): N. Polunin. Leonard Hill Book, London, 1: 203-211.
Brown, E. A., C. E. Caviness and D. A. Brown. 1985. Responses of selected soybean cultivars to soil moisture deficit. Agron. J. 77: 274-278.
Costa-Franca, M. G., A. T. P. Thi, C. Pimental, R. O. P. Rosseiello, Y. Zuily-Fodil and D. Laffray. 2000. Differences in growth and water relations among Phaseolus vulgaris cultivars in response to induced drought stress. Env. and Exp. Bot. 43: 227-237.
Eureka T. M., O. Ocampo, and P. Restituta Robles, 2000. Drought tolerance in Mung bean II. Stomatal movement, photosynthesis and leaf water potential. The Philippine Journal of Crop Science, 25:7–15.
Farooq, M., A. Wahid, N. Kobayashi, D. Fujita, S. M. A. Basra. 2009. Plant drought stress: effects, mechanisms and management. Agron. Sustain. Dev. 29: 185-212.
Gardner, F.P., R.B. Pearce and R.L. Mitchell, 1985. Physiology of Crop Pants. pp. 187–208. Iowa State University Press.
Gomez, K.A. and A.A. Gomez. 1983. Statistical Procedure for Agricultural Research. John Wiley and Sons. N.Y., Pp. 20-215.
Hamid, A., F. Kubota, W. Agata, and M. Morokuma. 1990. Photosynthesis, transpiration, dry matter accumulation and yield performance of mungbean plant in response to water stress. J. Fac. Agr. Kyushu Univ. 1-2: 81-92.
Islam, M. S. 2008. Water stress tolerance of mungbean [Vigna radiata (L.) Wilczek] genotypes as influenced by plant growth regulators. A Ph.D. Dissertation, Dept. of Agronomy, Bangabandhu Sheikh Mujibur Rahman Agricultural University, Gazipur, Bangladesh.
Islam, M. S., M. M. Haque, M. M. Khan, T. Hidaka and M. A. Karim. 2004. Effect of fertilizer potassium on growth, yield and water relations of bushbean (Phaseolus vulgaris L.) under water stress conditions. Jpn. J. Trop. Agr. 48:1-9.
Khan, M. S. A., M. A. Karim and M. M. Haque. 2014. Genotypic differences in growth and ions accumulation in soybean under NaCl salinity and water stress conditions. Bangladesh Agron. J. 17: 47-58.
Klepper, B. and R. W. Rickman. 1990. Modeling crop root growth and function. Adv. Agron. 44: 113-132.
Kokubun, M. S., Shimada and M. Takahashi. 2001. Flower abortion caused by preanthesis water deficit is not attributed to impairment of pollen in soybean. Crop. Sci. 41: 1517-1521.
Krishnamoorthy, H. N. 1993. Water deficit and plant growth. In “Physiology of Plant Growth and Development.” pp. 433-466. Pub. by Atma Ram and Sons, Delhi, India.
Ku, Y. S., W. K. A. Yeung, Y. L. Yung, M. W. Li, C. Q. Wen, X. Liu, and H. M. Lam. 2013. Drought Stress and Tolerance in Soybean. http://dx.doi.org/10.5772/52945.
Liu, F., M. N. Andersen and C. R. Jensen. 2003. Loss of pod set caused by drought stress is associated with water status and ABA content of reproductive structures in soybean. Funct. Plant Biol. 30: 271-280.
Liu, F., M. N. Andersen and C. R. Jensen. 2004. Root signal controls pod growth in drought-stressed soybean during the critical, abortion-sensitive phase of pod development. Field Crop Res. 85: 159-166.
Lizana, C., M. Wentworth, J. P. Mart-ynez, D. Villegas, R. Meneses, E. H. Murchic, C. Pastenses, B. Lercari, P. Vernieri, P. Horton and M. Pinto. 2006. Differential

550 CHOWDHURY et al.
adaptation of two varieties of common been to abiotic stress. I. Effects of drought on yield and photosynthesis. J. Expt. Bot. 57: 685-697.
Ludlow, M. M. and R. C. Muchow. 1990. A critical evaluation of trits for improved crop yields in water-limited environments. Adv. Agron. 43: 107-153.
Maleki A., A. Naderi, R. Naseri, A. Fathi, S. Bahamin and R. Maleki. 2013. Physiological Performance of Soybean cultivars under drought stress. Bulletin of environment, Pharmacology and life science. 2: 38-44.
Manavalan L. P., S. K. Guttikonda, L. S. P. Tran and Nguyen. 2009. Physiological and Molecular Approaches to improve Drought Resistance in soybean. Plant Cell Physiol. 50: 1260-1276.
Moreira, R. S., M. E. Medri1, N. Neumaier, N. G. Lemos, J. A. Pimenta, S. Tobita, R. L. Brogin, F. C. Marcelino-Guimarães, M. C. N. Oliveira, J. R. B. Farias, R. V. Abdelnoor and A. L. Nepomuceno. 2010. Soybean physiology and gene expression during drought. Genet. Mol. Res. 9: 1946-1956
Omae, H., A. Kumar, Y. Egawa, K. Kashiwaba and M. Shono. 2005. Midday drop of leaf water content to drought tolerance in snap bean (Phaseolus vulgarid L.). Plant Prod. Sci. 8: 465-467.
OO, H.H., T. Araki, K. Saitou and F. Kubota. 2008. Response of growth, gas exchange and PSII electron transport in greengram (Vigna radiata L. Wilczek) varieties and other pulse species to drought and re-watering. J. Fac. Agr. Kyushu Univ. 53: 19-25.
Razakou, A I. B. Y., B. Mensah, A. S. Kiari and R. Akromah. 2013. Using morpho-physiological parameters to evaluate cowpea varieties for drought tolerance. International Journal of Agricultural Science Research. 2: 153-162.
Samson, H. and H. Helmut. 2007. Drought effect on yield, leaf parameters and Evapotranspiration efficiency of cowpea. Conference of International Agricultural Research For Development. University of Kassel Witzenhause and University of Gotteingen, October 9/11/2007.
Saxena, C. M., S. N. Silim and B. K. Singh, 1990. Effect of supplementary irrigation during reproductive growth on winter and spring chickpea (Cicer arietinum) in a Mediterranean environment. J. Agri. Sci. 114: 285-293.
Specht, J. E., D. J. Hume, and S.V. Kumudini. 1999. Soybean yield potential-a genetic and physiological perspective. Crop Sci. 39: 1560-1570.
Sponchiado, B. N., J. W. White, J. A. Castillo and P. G. Jones. 1989. Root growth of four common bean cultivars in relation to drought tolerance in environments with contrasting soil types. Exp. Agric. 25: 249-257.
Tera’n, M. and S. P. Singh. 2002. Comparison of sources and lines selected for drought resistance in common bean. Crop Sci. 42: 64-70.
Thrikawela, B. S. and D. C. Bandara. 1992. Evaluation of leaf characteristics of cowpea (Vigna unguiculata L.) and Mung Bean (Vigna radiate L.) varieties for drought resistance. Tropical Agricultural Research. Vol. 4:
Yordanov, I., T. Tsonev, V. Goltsev, L. Kruleva, V. Velikova, 1997. Interactive effect of water deficit and high temperature on photosynthesis in sunflower and maize plants. 1. Chenges in the parameters of chlorophyll fluorescence induction kinetics and fluorescence quenching. Photosynthetica, 33: 391-402.
Water stress tends to increase biomass partitioning to roots, increasing the root: shoot ratio (Manavalan et al., 2009).
Plant productivity under drought stress is closely related to the processes of dry matter partitioning and the spatial and temporal root distribution (Kage et al., 2004).
Kage, H., M. Kochler and H. Stutzel. 2004. Root growth and dry matter partitioning of cauliflower under drought stress conditions: measurement and simulation. Eur. J. Agron. 20: 379-394.

ISSN 0258-7122
Bangladesh J. Agril. Res. 40(4): 551-566, December 2015
ADOPTION OF RAISED BED TECHNOLOGY IN SOME SELECTED
LOCATIONS OF RAJSHAHI DISTRICT OF BANGLADESH
M. A. MONAYEM MIAH1, MONIRUZZAMAN2, S. HOSSAIN3
J. M. DUXBURY4, J. G. LAUREN5
Abstract
The study evaluated the adoption and farmers’ practice of raised bed technology
at farm level since the close of the Soil Management Collaborative Research
Support Program (SMCRSP) through a follow-up survey conducted at Durgapur
Upazila of Rajshahi district. Data for the study were collected from 195 adopters
and 65 non-adopters through a pre-tested interview schedule during May, 2011.
The survey findings showed that the raised bed technology had a strong
demonstration effect and were adopted well (56%) by the respondent farmers.
The probability of adopting this technology was significantly influenced by
extension contact, societal membership, and the number of male member in the
household. Due to lack of machine, most farmers prepared raised bed by hand
(82.7%) without maintaining recommended bed size. The most cultivated crops
on bed were wheat (cultivated by 97.95% farmers) maize (27.69%) onion
(16.41%) and mungbean (12.31%). Respondent farmers mentioned various
positive benefits of bed technology and willing to continue this practice in future
with increased area of land. This immerging technology increased cop
productivity and farmers’ income to some extent. To popularize the raised bed
technology among farmers, bed planter should be available to the farmers and
the positive benefits should be broadcasted in the mass media
Keywords: Bed planter, raised bed technology, adoption.
Introduction
Crop establishment through bed planting is a good technique in the farming
systems of South Asia. This system is being extensively used in cultivating wheat both in India and Pakistan. This system was originated from Mexico’s Yaqui Valley, where more than 90% of farmers had adopted this practice for wheat cultivation. Its use is very negligible in the eastern Gangetic Plains of South Asia, due to lack of machinery for smaller land holdings (Hossain et al., 2004a). Raised bed cultivation facilitates more optimum planting time for rice, wheat,
maize, and pulses by providing timelier field access because of better drainage. Additionally, once the beds are established there are new opportunities to reduce crop turn-around time by re-using the same bed without tillage (Sayre, 2003). In addition, this system has many advantage, such as reducing the seed rate, requiring less irrigation water, imparting higher nitrogen use efficiency, reducing
1&2Senior Scientific Officer, Agricultural Economics Division, Bangladesh Agricultural
Research Institute (BARI), Joydebpur, Gazipur, 3Chief Scientific Officer, Regional
Agricultural Research Centre, BARI, Jamalpur, Bangladesh 4&5Professor, Cornell
University, USA.

552 MIAH et al.
crop lodging, and increasing crop yield over the conventional tillage/sowing systems (Meisner et al., 1992; Hobbs et al., 1997; Fahong et al., 2003; Lauren et
al., 2008).
The mechanized bed planter creates a trapezoidal raised bed and can perform seeding operations on the top of the bed simultaneously in one operation behind a power tiller. There is also a provision of fertilizer application along with seed sowing. The farm level performance of bed planter was tested for wheat, maize, mungbean, and other crop cultivation in different areas of Dinajpur and Rajshahi districts. On-farm research results revealed that this system saved 20-34% irrigation water, 16-69% planting cost, and ensured higher crop yield compared to conventional system (Hossain et al., 2010). The BCR of wheat cultivation on raised bed and permanent bed were 4.5 and 4.7 which was 41% and 47% higher than conventional method respectively (Hossain et al., 2004b). Lauren, et al. (2008) found mean yield response to N fertilization greater on raised beds than on the flat, and greater with rice than wheat. They also recorded consistent improvements in yield and reductions in irrigation inputs, together with cost savings in labour, land preparation, fertilizer, and seed inputs, on permanent beds which convinced a group of Bangladeshi farmers to adopt this innovative technology.
Realizing the importance of the raised bed for improved crop production, the scientists of Cornell University (USA) in collaboration with Bangladesh Agricultural Research Institute (BARI) and CIMMYT introduced the raised bed technology through the SM CRSP project (2003-2008) entitled ‘Enhancing technology adoption for the rice-wheat cropping system of the Indo-Gangetic Plains’. The focus area for the initial work was in Rajshahi and Natore districts. The technology was disseminated to 26 farmers from Duary, Santospur and Durgapur areas, who were interested in reducing their labor/input costs and diversifying their cropping system for more profitable production. All the farmers received hands-on training in the use of the power tiller with the bed former attachment and then used the knowledge and a bed former on loan from the project to compare raised bed versus conventional flat cultivation in a wheat-mungbean-rice rotation on their own farms. A research scientist from BARI-Rajshahi provided technical backstopping and monitoring support throughout.
The participating farmers were enthusiastic about raised bed because the practice improved livelihoods and food security for their families. Interest in the raised bed technology expanded beyond the initial group to farmers in the surrounding communities, who were part of a federation of 22 community groups which had formed from CARE farmer field schools. One farmer group took the lead to disseminate the raised bed technology to the other farmers through rallies and hands-on equipment trainings. Some group members obtained loan from a local NGO (CAR) to purchase the equipment and then provided bed formation services on a for-hire basis. By the end of the SM CRSP project in 2008, the use of raised bed cultivation had expanded from 26 farmers on 4.05 ha to over 900

ADOPTION OF RAISED BED TECHNOLOGY IN SOME SELECTED 553
farmers on 196.76 ha. In 2010, Cornell University, USA initiated the Food for Progress Project for Bangladesh with funding from the US Department of Agriculture. The objective of this project was to continue dissemination of the raised bed technology for smallholder farmers in the drought prone region of Rajshahi Division. Feedback from farmers who were involved with raised bed from the SM CRSP phase can be used to ensure the success of the new project.
With this background, a follow-up survey in the introduction area is needed to understand farmers’ practice of raised bed since the close of the SM CRSP project. Therefore, an attempt was made in this study to document the status of
current use of raised bed technology, farmers’ perceptions, and overall impact of this technology at farm level. The findings of the study will be very much helpful to the farmers, researchers, policy makers and donor agency for wider expansion of this proven technology throughout the country.
Objectives:
1. To know the present status of using raised bed technology for cultivating
crops at the farm level.
2. To assess the status of adoption of the raised bed technology at farm level and to find out the factors affecting its adoption and non-adoption.
3. To assess farmers’ perceptions on the impact of raised beds on input use and income through higher productivity.
Methodology
Sampling and data collection: The study followed purposive sampling in order to select study areas and sample raised bed using farmers. At the first stage of sampling, the study selected those areas where the raised bed technique of crop production was first introduced through SM CRSP between 2003 and 2008. Besides, the primary focus population of this survey was those farmers who are currently using the raised bed practice or have used the technique in the recent
past. Thus, a total of 13 villages namely Alipur, Uzalkhalshi, Namordakhali, Nandigram, Nowapara, Sunpukuria, Shyampur, Sakundhighi, Dorampur, Debipur, Usappur, Tiokhum, and Kashipur under Durgapur Upazila of Rajshahi district were selected purposively for the study.
A total of 195 raised bed technology using farmers taking 15 farmers from each village were selected for interview. Again, 65 non-using farmers taking five
farmers from each village were interviewed to know the causes of non-adoption of this technology. Thus the total number of sample was 260. Data were gathered through a pre-tested interview schedule during May, 2011.
Analytical technique: The collected data were scrutinized, edited, tabulated and analyzed for fulfilling the objectives of the study. Data were mostly analyzed

554 MIAH et al.
through tabular method using descriptive statistics. The level of adoption of the raised bed technology was measured by the following formula.
100familiesfarmofnumberTotal
familiesfarmadoptedofnumberTotal(%)adoptionylogTechno
Probit regression model has been extensively used by agricultural production and
farming systems economists for studying and analyzing farmer adoption and
diffusion of agricultural interventions. Therefore, the following empirical Probit
regression model was used to ascertain the probability of adoption of raised bed
technology at farm level.
Ai = α + βiXi + ……..Ui
Where,
Ai = Farmers adopting raised bed technology; (If, Adopted = 1; Otherwise =
0)
α = Intercept
Xi = Independent variables (i = 1, 2, 3 ------6)
Ui = Error term; and
The independent variables were:
X1 = Age of the respondent (year)
X2 = Male member (No/household)
X3 = Education (Year of schooling)
X4 = Total cultivated land (in decimal)
X5 = Extension contact (Scores, 0-20)
X6 = Membership of the society (Scores, 0-24)
Results and Discussion
1. Present Status of Raised Bed Cultivation at Farm Level
Crops and bed size: Using raised bed technique farmers in the study areas cultivated various crops such as wheat, lentil, mungbean, sesame, onion, maize and rice. The highly cultivated crop was wheat followed by maize, rice and onion. Most of the farmers prepared bed by hand (82.7%) without maintaining
recommended bed size. Few beds (11.3%) were prepared by bed planters. The bed widths were found to vary from crop to crop. They maintained the highest bed width for onion (73.9cm) and the lowest for wheat (42.8cm). Detailed information on bed size maintained by the respondent farmers has been shown in Table 1.

ADOPTION OF RAISED BED TECHNOLOGY IN SOME SELECTED 555
Many farmers in the study areas started cultivating crops on raised bed from 2003 and reported to be continued up to 2011. After ending the SMCRSP project
activities many farmers started using bed technology due to its strong and positive demonstration impact. Table 2 further shows that the average length of using bed technology was found to vary from crop to crop. The longest period involvement of the farmers was reported to be with T.Aman (5 years) followed by mungbean (4.42 years) and onion (4.09 years).
Table 1. Information on cultivated crops and bed size in using raised bed
technology.
Crops grown
with beds
Respondent
(n=195) Width of
bed (cm)
Raised bed prepared by
(%) Cultivation
length (yr) Number % Machine Hand Both
1. Lentil 4 2.05 63.0 - 100 - 1.50
2. Wheat 191 97.95 42.8 3.7 89.5 6.8 3.52
3. Mungbean 24 12.31 48.1 37.5 54.2 8.3 4.42
4. Jute 9 4.62 44.0 22.2 77.8 - 3.78
5. Sesame 5 2.56 45.7 40.0 40.0 20.0 1.40
6. Onion 32 16.41 73.9 3.1 96.9 - 4.09
7. Maize 54 27.69 49.5 9.3 85.2 5.6 3.02
8. Rice 36 18.47 17.6 25.0 69.5 7.4 3.61
Boro 18 9.23 44.9 5.6 88.9 5.6 3.33
Aus 9 4.62 45.7 44.4 55.6 - 2.78
T.Aman 9 4.62 43.7 44.4 44.4 11.1 5.00
Overall 391 -- -- 11.3 82.7 6.1 --
Table 2. Information regarding farmers’ raised bed in the study areas.
Particular No. of respondent % of responce
Tillage operation (No./bed) 195 3.2
Cost of bed preparation (Tk/decimal) 195 38.0
Bed-to-bed distance (cm) 195 18.1
Furrow-to-furrow distance (cm) 195 43.4
Measuring devices or instruments 195
Scale 11 5.6
Ware/rope 23 11.8
Stick 134 68.7
Spade 14 7.2
Based on idea 9 4.6
Foot 4 2.1
Adopting farmers generally plough their lands 3-4 times with country plough or
power tiller before preparing raised bed. The average cost of land preparation was Tk. 9,391 per ha. Irrespective of crops, the average distances from bed-to-bed and furrow-to-furrow were reported to be 18.1cm and 43.4cm. They used

556 MIAH et al.
measuring scale, rope/ware, stick, spade and foot in measuring bed-to-bed and furrow-to-furrow distance. In most cases, they used sticks (68.7%) for measuring
the distances mentioned above. At first, they measure two sticks by hand and these sticks are used later to make furrow between beds with the help of rope/ware. Sometimes, they dig furrow between beds with spade and in that case the distance of furrow is equal to the width of the spade. Furrow distance was sometime determined through farmers’ foot (Table 2).
Causes of bed preparation by hand: Preparation of raised bed through bed
planter has many advantages. Bed planter creates a trapezoidal raised bed and can perform seeding operations on the top of the bed simultaneously in one operation. It has also fertilizer application provision along with seed sowing. Machine made raised bed can save 20-34% irrigation water, 16-69% planting cost and ensure less human labour (Hossain et al. 2010a). Nevertheless, many farmers were found enthusiastic toward using bed planter in the study areas.
Despite these advantages, most of the farmers reported to prepare raised bed by hand. The principal reason was the non-availability of bed planter (96.41%) in the study areas. A few farmers have access to bed planter use due to close association with BARI scientists.
About 7% farmers of this category complained that bed planter was scarce at the time of need and because of that reason they prepared bed by hand. Some bed
planter using farmers could not bring bed planter to their fields due to lack of road. Sometimes it is difficult to bring bed planter to the desired fields crossing other crop fields. Due to these types of constraints 3.59% farmers prepared raised bed by hand. Few farmers opined that broadcasting of seed by hand was better than that of bed planter. Bed and furrow length can easily be maintained by hand which was mentioned by 3.08% farmers (Table 3).
Table 3. Reasons for preparing raised bed by hand (multiple response).
Reason Frequency Percentage
Number of respondent (n) 195 100
1. Non-availability of bed planter or power tiller 188 96.41
2. Scarcity of bed planter at the time of need 13 6.67
3. Constraints to using bed planter 7 3.59
4. Hand seed sowing is better than bed planter 9 4.62
5. Bed and furrow length can easily be
maintained
6 3.08
Modifications made in bed technology: At the initial stage of using bed technology, the recommended widths of bed and furrow were 127cm and 63.5cm
respectively for wheat, maize and onion. Besides, the recommended widths were 101.6cm and 50.8cm for mungbean. But a good proportion of the adopting farmers have modified these widths of bed and furrow from the way they originally learnt about it from scientists or any other person (Table 2). Table 4 shows that 30.8% adopting farmers told that they modification their bed size

ADOPTION OF RAISED BED TECHNOLOGY IN SOME SELECTED 557
(width of bed and furrow). The rest 69.2% of adopting farmers did not modify the bed size because they learnt and adopted bed technology with modified forms
that need no modification. Table 4 further shows that 29.2% of the adopting farmers shortened bed width whereas only 8.7% shortened furrow width. Some adopters also shortened plant to plant distance, changed measuring instrument and applied more fertilizer than recommended dose.
Table 4. Percent responses on modifications made in the raised bed technology.
Particular Frequency Percentage
Number of respondent (n) 195 100
Responses on modifications
Yes 60 30.8
No 135 69.2
Types of modifications
1. Shorten bed width 57 29.2
2. Shorten furrow width 17 8.7
3. Shorten plant to plan distance 4 2.1
4. Change measuring instrument 2 1.0
5. Apply more fertilizer 3 1.5
Sources of assistance: The respondent farmers mentioned various sources from which they received assistance for preparing raised bed at the first time. The highly reported source was neighbouring farmers (56.9%). Generally
farmers became enthusiastic toward bed technology observing positive benefits of the technology and later seek assistance from neighboring farmers to prepare bed for crop cultivation. About 26% farmers received assistance from local BARI scientists in preparing bed in the initial stage of using bed technology. Some respondents prepared raised bed at the first time without taking any help from others. They observed the technique of preparing raised bed from others
and did it themselves. Service provider, relatives, and CARE personnel had some contribution to assist farmers in preparing seed bed in the study areas (Table 5).
Table 5. Sources of assistance in preparing raised bed at the first time
Sources of assistance No. of respondent % of responces
1. Neighbouring farmer 111 56.9
2. BARI scientist 50 25.6
3. Self or observed others’ field 19 9.8
4. Sub Assistant Agriculture Officer 6 3.1
5. IPM club 3 1.5
6. Service provider 2 1.0

558 MIAH et al.
7. Relatives 2 1.0
8. CARE personnel 2 1.0
All sources 195 100
2. Adoption of Raised Bed Technology and Its Determinants
Adoption status: In order to reduce input costs and diversify cropping system for more profitable crop production, the scientists of BARI in collaboration with
Cornell University (USA) and CIMMYT disseminated the raised beds technology through SMCRSP project among the farmers of the study areas during the period from 2003 to 2008. After that period many farmers were found to practice this production technique for its versatile advantages. The survey result showed that on an average 56% of the respondent farm families adopted raised based technology for cultivating different types of crops. Table 6 showed
that the highest level of adoption was observed at Sunpukur village (76.3%) followed by Namudarkhali (73.5%) and Nawapara (69%).
Table 6. Status of adoption of raised bed technology for crop cultivation.
Name of village Total farm household Total adopting farm % of adopter
1. Alipur 613 312 50.9
2.Debipur 897 344 38.4
3. Darmapur 473 171 36.2
4. Isabpur 310 147 47.4
5. Kashipur 303 180 59.4
6. Namudarkhali 347 255 73.5
7. Nandigram 928 515 55.5
8. Nawapara 449 310 69.0
9. Shampur 530 316 59.6
10. Sukandipur 122 48 39.3
11. Sunpukur 940 717 76.3
12.Tiorkuri 116 56 48.3
13. Uzalkhalsi 591 330 55.8
All villages 6619 3701 55.9
Determinants of adoption: The adoption of raised bed technology is likely to be influenced by different socio-economic factors. At first nine explanatory variables, such as age, male family member, education, cultivated land, extension contact, membership with social organization, cosmopolitness, contact with mass media, and innovativeness of the respondent farmers were hypothesized to be
major determinants of raised bed technology adoption in the study areas. After testing the level of significance, six variables were finally included in the model. Table 7 shows that age, education, and farm size had positive influence on bed technology adoption but these influences were not significant at desired level. The reason behind this relationship was that farmers with younger age, lower

ADOPTION OF RAISED BED TECHNOLOGY IN SOME SELECTED 559
education, and smaller holdings might be the adopters of this bed planting technology in the study areas.
Many respondent farmers opined that crop cultivation on raised bed required more human labour compared to conventional flat method. The coefficient of variable household male member is positive and highly significant at 1% level implying that the farm families having higher male member adopted bed technology more than that of families having less male member (Table 7). It is important to note that female members in the study areas do not usually work in
the field. Marginal coefficient indicates that if the male member in the family is increased 10% the probability of adopting raised bed technology will be 1.032% (Table 8).
Table 2 further shows that respondent’s contact with different extension personnel such as Agriculture Officer, Sub Assistant Agriculture Officer, BARI scientist and neighbouring farmers had a positive and highly significant
relationship with the probability of adopting bed technology. The probability of adopting bed technology will be increased by 3.36% if the extension contact is increased by 100% (Table 8).
It was observed that the respondent farmers who involved different social organizations like farmers’ co-operative society, IPM club, youth development society, school/Madrasa (religious school)/mosque managing committee, etc.
adopted bed technology more than the farmers who involved less with social organizations. Probit estimate also shows that there is a positive and significant relationship between bed technology adoption and involvement with the society. The probability of adopting bed technology will be increased by 5.22% if the respondent’s involvement was increased by 100% (Table 8).
Table 7. Maximum likelihood estimates of variable determining adoption of raised
bed technology among respondent farmers.
Explanatory variable Coefficient Standard
Error z-statistic
Probability
(P>z)
Constant
-
1.3541*** 0.52117 -2.60 0.009
Age (year) 0.0039 0.00904 0.44 0.660
Male member (No./HH) 0.3804*** 0.00904 3.24 0.001
Education (year of schooling) 0.0037 0.02283 0.16 0.873
Cultivated land (decimal) 0.0004 0.00089 0.45 0.654
Extension contact (score; 0-20) 0.1239*** 0.03075 4.03 0.000
Membership of the society (score; 0-24) 0.1925*** 0.07403 2.60 0.009
Note: No. of observation = 260; LR Chi-square (6) = 50.86; Log likelihood = -
120.77505.
***Co-efficient significant at 1% level.

560 MIAH et al.
Reasons for not adoption: A good number of non-adopting farmers were asked to
answer the reasons of not adopting raised bed technology for crop cultivation. They
mentioned different reasons for not adopting raised bed technology. The highest
proportion of the respondent farmers (69.2%) did not adopt the technology due to
higher labour required for bed preparation and seed sowing at the initial stage of
cultivation. Majority of the respondents (67.7%) considered it as a laborious and
cumbersome job since there are scarcity of labour prevailed in their households as
well as in the study areas. A good percentage of farmers (47.7%) also reported the
lacking of awareness and technical know-how about the bed technology behind
their non-adoption of this technology. Some respondent farmers considered
broadcasting of seed on flat field to be a better technique compared to bed planter
since it requires less labour and time (Table 9).
Table 8. Marginal effect after probit.
Explanatory variable dy/dx
Standard
Error z-statistic
Probability
(P>z)
Age (year) 0.00108 0.00245 0.44 0.660
Male member (No./HH) 0.10322*** 0.03090 3.34 0.001
Education (year of schooling) 0.00099 0.00620 0.16 0.873
Cultivated land (decimal) 0.00011 0.00024 0.45 0.652
Extension contact (score; 0-20) 0.03364*** 0.00834 4.03 0.000
Membership of the society (score; 0-24) 0.05224*** 0.01896 2.75 0.006
Table 9. Reasons for not adopting raised bed technology (multiple responses).
Reasons Frequency Percentage
Number of respondent (N) 65 100
1. Required much labour 45 69.2
2. Bed preparation is a laborious and cumbersome job 44 67.7
3. Lack of awareness or know-how about bed technology 31 47.7
4. Scarcity of bed planter in the area 19 29.2
5. Required longer time 17 26.2
6. Hand broadcasting of seed is better than bed planter 13 20.0
3. Farmers’ Perceptions in Using Raised Bed Technology
Farmers’ observation: Crop establishment through raised bed technology has many advantages such as higher crop yield, reduction in input use, reduction in production cost over conventional practice. The respondent farmers in the study areas observed many positive benefits of the technology during crop production. The highest proportion of farmers (81.5%) told that they got much higher crop
yield due to use raised bed technology. The results of on-farm experiments (Hossain et al., 2004b; Lauren et al., 2008) also supported this statement. Another important observation (77.9%) of the farmers was that the established

ADOPTION OF RAISED BED TECHNOLOGY IN SOME SELECTED 561
crops on raised bed were not attacked by rats. Sometimes few plots were attacked by rats, but it could easily be controlled manually. Many farmers mentioned that
raised bed technology could successfully reduce the amount of various production inputs like irrigation water, seed, fertilizer, and labour. These observations were also similar to the observations made by Hossain et al. (2004b) and Lauren et al. (2008). The respondent farmers in the study areas mentioned that intercultural operations like weeding and insecticide application are become easy due to cultivate crop on raised bed. The other positive
observations of the farmers were erectness of plant; lower cost of production; and birds can’t take seed from field (Table 10).
Table 10. Farmers’ observations about raised bed technology in the study areas.
Observation Frequency Percentage
Positive observations (n = 195)
1. Higher crop yield 159 81.5
2. Less attack by rats/ Easy to control rats 152 77.9
3. Require less irrigation water 147 75.4
4. Crop weeding is easy 107 54.9
5. Require less amount of seed 101 51.8
6. Crop harvesting is easy 68 34.9
7. Require less fertilizer 52 26.7
8. Insecticide application is easy 42 21.5
9. Less infestation by insect-pest 31 15.9
10. Reduce crop lodging 25 12.8
11. Require less labour 14 7.2
12. Lower cost of production 11 5.6
13. Birds can’t take seed from field 5 2.6
Negative observations (n = 133)
1. No negative side is observed 62 31.8
2. Required higher labour 125 94.0
3. Require higher amount of irrigation water 22 16.5
4. Seed dropping is disrupted in case machine 4 3.0
5. Planter can’t prepare bed in the field side 6 3.8
Table 10 further reveals that 31.8% respondent farmers did not observe any negative side of the raised bed technology. The rest 68.2% farmers mentioned
some negative sides of this technology. Of them 94% mentioned about the higher requirement of labour for bed preparation and seeding through bed planter compared to conventional technique. It is important to state here that bed planter requires less number of labours and it has already been proved in many on-farm experiments. But, most respondent farmers prepared raised bed manually for crop production due to non-availability of bed planter. Bed technology has already
been proved as a water saving technology, but some farmers claimed that this

562 MIAH et al.
technique of cultivation needs more irrigation water than that of conventional technique. Such response might be due to their ignorance.
Future plan on raised beds use: The bed technology practicing farmers were asked to answer whether they increase land area for cultivating crops on raised bed or not in the next year. In this respect about 88% farmers wanted to increase area in the next year. They wanted to increase an average area of 28.5 decimal for the next year (Table 11). They mentioned many reasons for increasing land for cultivating crops on beds. These reasons were mostly similar to the positive
observations of the farmers regarding bed use (Table 10). Only 12.3% adopting farmers will not increase area due to some reasons such as lack of suitable land (100%), scarcity of land for mortgage in (37.5%) and lack of hired labour (12.5%).
Table 11. Reasons for increasing and not increasing crop cultivation on raised beds.
Particulars Frequency Percentage
Responses on increase crop cultivation on bed n = 195 100
Yes 171 87.7
No 24 12.3
Amount of land area increased (decimal) 171 28.5
Reasons for not increasing crop area
1. Lack of suitable land 24 100
2. Scarcity of land for mortgage in 9 37.5
3. Lack of hired labour 3 12.5
Table 12. Actions needed for increasing adoption of raised bed technology in future.
Type of actions Frequency Percentage
Number of respondent (n) 195 100
1. Raised bed planter should be made locally available 165 84.6
2. Provide training to the farmers on raised bed
technology 154 79.0
3. Broadcast positive impacts of RBT through mass
media 59 30.3
4. Provide soft loan to the enthusiastic farmers 41 21.0
5. Demonstrate bed planting technique in new areas 29 14.9
6. Provide subsidy to the enthusiastic farmers 10 5.1
7. Develop effective monitoring mechanism for
technology disseminators
4
2.1
Actions needed for higher adoption: The respondent farmers suggested many ways and means for increasing the adoption of this promising and versatile technology at farm level. The highest proportion of respondent (84.6%) mentioned that the government should make bed planter available to the farmers since it reduces input use and increases crop productivity. Seventy nine percent

ADOPTION OF RAISED BED TECHNOLOGY IN SOME SELECTED 563
farmers suggested the government to provide practical and field oriented training on raised bed technology to the enthusiastic farmers. Mass media like radio, TV
and daily newspaper can play important role in creating awareness and motivating farmers towards new technology.
Therefore, the government should broadcast the positive impact of raised bed technology using mass media suitable for farmers. In order to increase the use of bed planter soft loan and subsidy may be provided to the interested farmers. About 15% farmers stresses on the demonstration of bed planting technique in
other new areas. Monitoring is important to keep farmers’ interest toward new technology adoption and its continuous use. Some respondent farmers complained that scientists/extension personnel involved in technology dissemination did not come to the farmer after the completion of the project. Therefore, few farmers also gave emphasis on developing effective monitoring mechanism for technology disseminators (Table 12).
4. Impact of Raised Bed Technology
Raised bed technology has created a positive impact on crop productivity, income and livelihood of the farmers. Survey results revealed that one hundred percent respondent farmers opined that bed technology brought them positive impacts to some extent on household income, household food security and livelihood
improvement. Most farmers mentioned about the livelihood improvement but types of improvements were not clear to them since it was associated with overall socio-economic development of the society. Respondent farmers also stated various positive impacts of raised bed technology. About 70% farmers experienced with higher crop productivity. The results of the last 8 years on-farm experiment revealed that crop yield on new raised bed always higher than permanent bed
(Hossain et al., 2010; Hossain et al., 2004). More than 82% farmers received increased income due to use raised bed technology. The amount of food intake was also increased for some of the respondent households (Table 13).
Table 13. Responses on the impact of bed technology on crop productivity and
income of the respondent farmers.
Particulars Farmers’ responses
Frequency Percentage
Impacts on income n = 195
Positive impact 195 100
No impact - -
Type of positive impacts
1. Increase in crop productivity 136 69.7
2. Increase in household income 160 82.1
3. Increase in livelihood standard 113 57.9
4. Increase in food intake 26 13.3

564 MIAH et al.
Raised bed technology has also created a significant impact on input use. The preparation of raised bed by hand needs higher labour compared to bed planter.
That’s why majority of the respondent farmers (75.4%) opined that crop cultivation on bed needs higher human labour compared to conventional system. Some farmers argued that at the stage of bed preparation this technique required higher labour but intercultural operations and harvesting need less labour than that of conventional system. As a result bed technology reduces labour requirement in crop cultivation. About 22% farmers stated this view regarding
labour use. Bed technology also reduces the use of seed, fertilizer and irrigation water per unit area (Hobbs et al., 1997; Fahong et al., 2003). Majority of the respondent farmers reported that bed technology reduced the use of seed (94.4%), fertilizer (73.3%), and irrigation water (61%). Few farmers (21%) argued that this new technology required higher irrigation water because the furrow between beds contained more water and the rate of evaporation from bed
is much higher than that of conventional system (Table 14).
Table 14. Impact of raised bed technology on input use.
Inputs Frequency of responses (n=195) % of responses
Increased Constant Decreased Increased Constant Decreased
1. Use of labour 147 6 42 75.4 3.1 21.5
2. Use of seed - 11 184 - 5.6 94.4
3. Use of fertilizer 9 43 143 4.6 22.1 73.3
4. Use of water 41 35 119 21.0 18.0 61.0
Table 15. Comparative scenario of productivity and profitability of wheat and maize
cultivation under two cultivation systems.
Particular Bed system Conventional system % higher or lower
A. Wheat
Yield (t/ha) 4.3 2.3 87
Total cost (Tk/ha) 13540 10270 32
Gross benefit (Tk/ha) 60903 33403 82
Benefit cost ratio (BCR) 4.5 3.2 41
B. Maize
Yield (t/ha) 9.7 7.8 24
Total cost (Tk/ha) 20561 22166 -7
Gross benefit (Tk/ha) 61164 49764 23
Benefit cost ratio (BCR) 2.98 2.2 35
Source: Adopted from Hossain et al., 2004.
The use of raised bed technology is cost-effective and profitable to most of the
farmers because this technology ensures lower input use in one hand and higher
crop yield on the other. Hossain et al., (2004) found that wheat cultivation on

ADOPTION OF RAISED BED TECHNOLOGY IN SOME SELECTED 565
raised bed incurred 32% higher cost compared to conventional system. But the
cost of maize cultivation on bed is 7% lower than that of conventional system. In
both the cases, the benefits are much higher compared to the conventional
system.
Conclusion
The study has evaluated farmers’ practice of raised bed technology since the
close of the SM CRSP project through a follow-up survey. The survey findings
show that the raised bed technology has a strong and positive demonstration
effect and has been adopted well by the farmers of the study areas. The
probability of adopting this technology is significantly influenced by extension
contact, societal membership and number of male member in the household. Due
to lack of machine, most farmers prepare raised bed by hand without maintaining
recommended bed size. The most cultivated crops on bed are wheat, maize,
onion and mungbean. Responded farmers have mentioned various positive
benefits of raised bed cultivation and willing to continue this practice in future
with increased area of land. This versatile and immerging technology has created
a positive impact on crop productivity and farmers’ income to some extent.
Recommendations
Based on the findings of the study, Government should take the following steps for wider adoption of this technology.
a) Bed planter should be available to the farmers since it reduces input cost and increases crop productivity.
b) Hand-on training on raised bed technology should be provided to the enthusiastic farmers.
c) The positive impacts of raised bed technology should be broadcasted among farmers through mass media in creating awareness towards this new technology.
d) Soft loan and subsidy may be provided to the interested farmers for
increasing the use of raised bed planter.
e) Monitoring is important to keep farmers’ interest toward new technology adoption and its continuous use. Therefore, emphasis should be given on developing effective monitoring mechanism for technology disseminators.
Acknowledgements: We wish to acknowledge the financial support of Cornell
University, USA to conduct the study. We also appreciate the help of many others, both individuals and institutions, during conducting this study and regret our inability to acknowledge them all individually.

566 MIAH et al.
References
Fahong, W., W. Xuquing and K. D. Sayre. 2003. Comparison study on two different
planting methods for winter wheat in China. Bed planting course, CIMMYT,
Mexico.
Hobbs, P. R., G. S. Giri and P. Grace. 1997. Reduced and zero tillage options for the
establishment of wheat after rice in South Asia. RCW Paper No. 2. Mexico, D.F.:
Rice-Wheat Consortium for the Indo-Gangetic Plains and CIMMYT.
Hossain, M. I., M. S. Islam, I. Hossain, C. A. Meisner and M. S. Rahman. 2010. Seeding
performance of two wheel tractor operated bed planter for cereal crop establishment.
International Journal of Energy Machinery 3(1): 63-69.
Hossain, M. I., M. A. Sufian, M. A. Z. Sarker, E. Haque and A. B. M. M. Rahman.
2004a. Power tiller operated bed planter for improved crop establishment. Journal of
Science and Technology 2:17-23.
Hossain, M. I., C. A. Meisner, M. H. Rashid, M. A. Sufian and M. A. R. Akanda. 2004b.
Development and test of power tiller operated bed planter for upland crop
establishment. Bangladesh J. Agril. Res. 29(1):29-36.
Lauren, J. G., G. Shah, M. I. Hossain, A. S. M. H. M. Talukder, J. M. Duxbury, C.A.
Meisner and C. Adhikari. 2008. Research station and on-farm experiences with
permanent raised beds through the Soil Management Collaborative Research Support
Program. In: Proceedings of a workshop title “Permanent beds and rice-residue
management for rice–wheat systems in the Indo-Gangetic Plain” held in Ludhiana,
India, 7–9 September 2006. Australian Centre for International Agricultural
Research, Canberra, Australia. P-124-132.
Meisner, C. A., E. Flores, K. D. Sayre, I. Ortiz-Monasterio, D. Byerlee. 1992. Wheat
Production and Grower Practices in the Yaqui Vally, Sonara, Mexico. Wheat Special
Report No. 6. CIMMYT, Mexico DF.
Sayre, K. D. 2003. Raised bed System of Cultivation. Bed Planting course. CIMMYT,
Apdo. # 370, P.O. Box 60326, Houston, TX 77205, Mexico.

ISSN 0258-7122
Bangladesh J. Agril. Res. 40(4): 567-580, December 2015
INFLUENCE OF ETHEPHON ON RIPENING AND QUALITY OF
WINTER TOMATO FRUIT HARVESTED AT DIFFERENT
MATURITY STAGES
M. MONIRUZZAMAN1, R. KHATOON2, M. F. B. HOSSAIN3
M. T. RAHMAN4 AND S. N. ALAM5
Abstract
An experiment taking tomato fruits (cv. BARI Tomato-14) of three maturity
stages (mature green stage, breaker stage and half ripen stage) and four ethephon
levels [control (distilled water spray), 500, 750 and 1000 ppm] was carried out at
the laboratory of plant physiology section of Horticulture research centre,
Bangladesh Agricultural Research Institute) during February 14, 2013 to February
27, 2012 to find out the suitable stage of fruit maturity for post harvest application
of ethephon (ethrel) for tomato ripening. The source of ethrel was Spectrum
(ethephon 39%) manufactured in the United States of America. Treatment with
500 - 1000 ppm ethephon hastened ripening of tomato by 4 days in mature green
stage but by 2 and 4 days in breaker stage tomatoes when compared with control
fruits. The highest value of rotting was shown by half ripen tomatoes. The 1000
ppm ethrel gave the maximum rotting irrespective of maturity stages. However,
the maximum weight loss and shelf life were found in green mature tomatoes. The
shelf life of tomato fruits of green mature and breaker stage tomatoes treated with
500 and 750 ppm was also high. The percentage of rotting and weight loss was
increased with gradual advancement of time. The highest value of weight loss and
shelf life was recorded in green mature tomatoes without ethephon and with 500
and 750 ppm ethephon treatment. The highest value of vitamin-C, TSS and titrable
acidity were shown by half ripen and pH by green mature tomatoes at different
days of storage. The ethephon concentration of 750 ppm the gave maximum
vitamin-C at 6 and 9 days of storage but 1000 ppm gave the maximum TSS%
followed by 750 ppm ethephon. The ethephon @ 750 ppm produced the
maximum TSS at 9 day of storage in mature green tomatoes but in breaker and
half ripen stage tomatoes 750 ppm ethephon gave TSS identical to 1000 ppm at
different days of storage. The residue level of ethrel in tomato fruits treated with
all ethephon concentrations at 3 and 5 days of storage was below 2 mg/kg which is
safe for human health. Therefore, treated tomatoes should be consumed after 3
days of ethephon application.
Keywords: Maturity stage, ethephon (ethrel), ripening, quality, postharvest, tomato.
Introduction
Tomato (Solanum lycopersicon L.) is one of the most important and popular
vegetables in Bangladesh with a considerable total production of 190.2 thousand
1&4Principal Scientific Officer, HRC, Plant Physiology Section, Bangladesh Agricultural
Research Institute (BARI), 2&3Scientific Officer, HRC, Plant Physiology section, BARI, 5Chief Scientific Officer, Entomology Division, BARI, Bangladesh.

568 MONIRUZZAMAN et al.
tons produced in an area of 23,828 hectares (BBS, 2011). Tomato is an important horticultural commodity worldwide and plays a key role in the human diet.
Tomatoes are rich in flavonoids and other phytochemicals that have anticarcinogenic properties. They are also an excellent source of lutein, zeaxanthin, vitamin C, which is most concentrated in the jelly-like substance that surrounds the seeds, as well as vitamins A, E and B-complex, potassium, manganese and phosphorus.
Proper harvesting at suitable stage determines the nutrient contents as well as
storage durability of any fruit. Tomatoes are harvested at different maturity stages, such as green mature stage, breaker stage, half ripen stage and red ripen stage all over the world. Fruits are often harvested at the mature green stage to minimize the damage during post harvest handling. The fruits may later ripen spontaneously or after treatment with ethylene releasing compound (ethephon) before shipment to retailers (Wills and Ku., 2002). Losses often occurred from
excessive deterioration during holding and marketing of tomatoes. This problem is especially acute with tomato when harvested at the breaker or more advanced stages of ripeness. Although ripening makes fruit edible and flavourful, it also initiates the gradual deterioration of fruit quality especially in climacteric fruits such as tomato, in which the onset of ripening is considered to be initiated by endogenous ethylene (Abeles et al., 1992). Shelf life is the most important aspect
in loss reduction biotechnology of fruits and vegetables. There is a natural tendency for the perishable fruits and vegetables to degrade to the simpler compounds (CO2, H2O and NH3) through spontaneous biochemical reaction. This type of reaction reduces the shelf life as well as other qualities of fruits and vegetables. Anju-Kumari et al. (1993) reported that the shelf life for all tomato cultivars were longest with harvesting at the mature green stage (10.9-13.5 days).
The acid content is lower in immature fruit and is the highest at the stage when colour starts to appear, with a rapid decrease when the fruit ripens (Cantwell, 1994). During maturation and ripening of fruit there are changes in total soluble solid (TSS). TSS increases from mature green stage to red ripen stages (Helyes et al., 2006). The palatability of fruits depends on TSS which increases throughout the development of fruit.
Ethephon or ethrel (2-chloroethylphosphonic acid), an ethylene releasing compound, is known as a plant growth regulator which stimulates ripe evenly fruit, decreasing preservation time and minimizing post-harvest losses (Quoc, et al., 2012). Recently, there have been many mixed opinions on the toxicity of ethephon that confused the customers in Bangladesh. Ethephon has been registered with EPA (US Environmental Protection Agency) since 1973 as a
plant growth regulator used to promote fruit ripening and flower induction. Ethephon is irritant to the skin or the eyes but is not a skin sensitizer, it was not a carcinogen and is classified by IARC (International Agency for Research on Cancer) as group D (not carcinogenic to humans) and FAO pointed out a maximum allowable daily intake for ethephon at 0.05 mg/kg body weight/day

INFLUENCE OF ETHEPHON ON RIPENING AND QUALITY 569
(Bui, 2007). The recommended residue level of ethephon is 2 mg/kg of tomato fruit (Anon., 2001). The tomato fruits which are harvested at mature green or
breaker stage are treated with different ethephon containing compounds for the colour development and ripening. At present ethephon present in different commercial products viz. Tomtom, Profit and Ripen-15 is being utilized for ripening of immature tomato fruit indiscriminately in high doses (100 ml/5-7 litre of water for 600-800 kg tomatoes) (BARC, 2012) in Bangladesh. Suitable stages of fruit maturity and optimum doses of ethephon for quality and storage of
tomato has not yet been developed for developing countries like Bangladesh. Keeping all above facts in mind, this experiment was conducted to find out the suitable stage of tomato fruit for post harvest application of ethephon and to determine the optimum ethephon dose (s) for tomato ripening without affecting its nutrients.
Materials and Method
Site: The experimental site was in the physiology laboratory, Horticulture Research Centre, Bangladesh Agricultural Research Institute, Joydebpur, Gazipur. The experiment was conducted during February 14, 2013 to February 27, 2012 at ambient condition. Tomato fruits of different maturity stages were dipped in various concentrations of ethephon (etherl) for five minutes.
Plant material: Freshly harvested tomato fruits of the variety BARI Tomato-14
were collected as per requirement of the study from the vegetable field of HRC, where tomato plants have been grown for this purpose. Tomato fruits were harvested at two maturity stages according to the description by Mitcham et al. (1989): mature green (fully expanded but unripe fruit with mature seed) and
breaker (first visible sign of carotenoid accumulation on bottom). Another set of fruits were harvested at half ripen stages (50% of the fruit surface are pink coloured) (Moneruzzaman et al. 2008a). After drying in air, each group of fruits was further divided into two parts. One as for the inoculation experiment; the other was directly placed into plastic boxes with approx. 90% relative humidity (RH), stored at 20 oC, and sampled from fruit pericarp at various time of intervals
Treatment setting: The experiment consisted of three maturity stages (M1 = Mature green stage, M2 = breaker stage and M3 = Half- ripen stage) and four levels of ethephon concentrations (T1 = control , T2 = 500 ppm, T3 = 750 ppm and T4 = 1000 ppm). Fruits were selected based on the uniform size and no
physical injuries or infections. Prior to use, fruits were surface-disinfected with 2% (v/v) sodium hypochlorite for 2min, rinsed with tap water, and air-dried. Then, fruits at each stage were immersed in different solutions for 5 min. Ten tomato fruits weighing 1000 g were placed for each treatment. The experiment was laid out in CRD with three replications. The source of ethephon was Spectrum (Ethephon 39%) manufactured in the United States of America. The
temperature and relative humidity was 23.5 0c ± 1.5oC and 65-70%, respectively in the laboratory.

570 MONIRUZZAMAN et al.
Parameter studied: The parameters studied were days required for ripening, shelf life, weight loss (%), rotting (%), vitamin-C in tomato pulp, pH of tomato
juice, total titrable acidity content, TSS content of tomato pulp. Each data was recorded at 3 days interval upto 9 days but rotting (%) and shelf life was observed up to 11 and 14 days.
Days required for ripening: In order to determine days required for ripening,
tomatoes were daily observed for their colour and the time (days) required to reach light red stage, between 60 and 90% fully red ripe stage (that is red colour of tomato surface between 60 and 90%) was measured.
Shelf life: The shelf life was calculated by counting the days required to attain
the last stage of ripening but up to the stage when fruit remained still acceptable for marketing.
Weight loss: The weight loss of tomato fruit sample was calculated by using the following formula:
Total weight loss of fruit (%) = weightInitial
weight Final- weight Initial x 100
Rotting (%): Rotting was determined by visual observation. Unmarketable tomatoes including fruits with various spots developed on the peel, rotten, decayed and shriveled fruits were considered as rotten.
Vitamin-C content of tomato pulp: Vitamin-C in tomato pulp was estimated by 2,6-Dichlorophenol-indophenol visual titration method as described by Rangana (1986). The reagents used for the estimation of vitamin-C were as follows: 1)
Metaphosphoric acid (6%), 2) standard ascorbic acid solution, 3) 2-6 dichlorophenol-indophenol dye. For estimation of vitamin-C, the following steps were followed: Standardization of dye solution, preparation of solution and titration.
Vitamin-C content (mg per 100 g of fruit pulp) = W × V2
100 × V1 × D× T
Where, T = Titre, D = Dye factor, V1 = Volume made up, V2 = Volume of extract
taken for estimation and w = weight of sample taken for estimation
Total titrable acidity content of tomato pulp: Total titrable acidity was determined using the following steps (Rangana, 1986): At first sample blended, filtered, transferred to volumetric flax and volume made up to the mark. Ttitrated with 0.1 0.1N NaOH. Percentage of titrable acidity was calculated using the following formula:
Total titrable acidity (%) = W × V2
100 × V1 × E×N × T
Where, T = Titre, N = normality of NaOH, V1 = Volume made up,E = Equivalent
weight of acid V2 = Volume of extract taken for estimation and w = weight of sample taken for estimation.

INFLUENCE OF ETHEPHON ON RIPENING AND QUALITY 571
pH of tomato juice: The sample for pH determination was prepared by the method described by Rangana (1986). One gram of sample was homogenized in
1 ml of boiled distilled water and 1 ml of de-ionized water of pH 7.0 and the pH of tomato juice was recorded by an electronic pH meter. The pH meter was standardized with the help of buffer solution.
TSS content of tomato pulp: Total Soluble Solid (TSS) content of tomato fruit pulp was determined by using Digital Hand Refractometer by placing a drop of pulp solution on its prism. The percentage of TSS was obtained from the direct
reading of the refractometer.
Residue level of ethephon: Residue level of ethephon in ethrel (0-1000 ppm) treated tomatoes of green mature stage was measured by Gas Chromatography flame-ionized detector in Toxicology laboratory, Entomology Division, Bangladesh Agricultural Research Institute (Rahman et al., 2012). Extra treatment (tomatoes treated with 2000 ppm ethrel) was also analyzed for clear
understanding although this treatment was not included in this experiment.
The data collected were subjected to an analysis of variance using MSTAT-C. Mean separation was performed by DMRT at 5% level of probability.
Results and Discussion
Days required for ripening
The mature green tomatoes took about 6 days to reach the full ripening stage
whereas breaker stage tomatoes took 5 days and half ripen tomatoes 4 days (Table 1). The ethephon hastened ripening of tomatoes compared to control (Table 1). The 500, 750 and 1000 ppm ethephon hastened tomato ripening by 2, 3 and 4 days compared to control. In mature green tomatoes, 500 ppm ethephon accelerated ripening by 4 days while 750 and 1000 ppm ethephon accelerated ripening by 6 days (Table 2). But in breaker stage tomatoes 500 and 700 ppm
ethephon accelerated ripening by 2 days and 1000 ppm by 3 days. In case of half ripen tomatoes 500 ppm ethephon hastened ripening by 2 days while 750 and 1000 ppm by 3 days. Moura et al. (1997) found 1000 ppm ethephon solution was more efficient in hastening tomato ripening. It was found by Olympio and Norman (2000) that concentrations of 500 and 1000 ppm ethephon reduced the ripening time. The mango cultivars treated with 0.8% (8000 ppm) ethephon
accelerated ripening (Thanh Hai, et al., 2009).
Shelf life of tomato
Mature green tomato had a higher storability than the breaker stage followed by half ripen tomatoes (Table 1). Maximum shelf life was 11.3 days in mature green tomatoes followed by breaker stage (8.6 days) and minimum was 7.6 days for half ripen tomatoes. It was found by Moneruzzaman et al. (2008a) that mature
green tomatoes of cv. Roma VF had the highest shelf life (13 days) followed by

572 MONIRUZZAMAN et al.
half ripen tomato (12 days). Ethephon levels had also significant effect on shelf life of tomatoes (Table 1). Control was recorded to give the longest shelf life
(10.22 days), followed by 500 ppm (9.33 days) and 750 ppm (9.00 days). The lowest shelf life was recorded by 1000 ppm ethephon (8.00 days). After penetration into cell ethephon might cause damage to some tissues that helps in rotting of fruits and thus reduced the shelf life (Anon., 2010).
Table 1. Main effect of maturity stage and ethephon on days required for ripening
and shelf life of treated tomato (var. BARI Tomato-14).
Treatment Days required for
ripening
Shelf life (days)
Maturity stages
Mature green stage (M1) 5.9 a 11.3 a
Breaker stage (M2) 5.0 b 8.6 b
Half ripen stage (M3) 4.0 c 7.6 c
Ethephon concentration
Control (distilled water) (T1) 7.4 a 10.22 a
500 ppm (T2) 5.1 b 9.33 b
750 ppm (T3 4.1 c 9.00 b
1000 ppm (T4) 3.2 d 8.00 c
CV (%) 8.87 6.32
Means within a column having different letters are significantly different at 5% level by
DMRT.
Table 2. Combined effect of maturity stages and ethephon on days required for
ripening and shelf life of tomato (var. BARI Tomato-14).
Treatment
Days required for ripening Shelf life (days) Maturity stage Ethephon
conc.
M1
T1 9.7 a 12.3 a
T2 6.0 c 11.3 a
T3 4.3 ef 11.3 a
T4 3.7 fgh 10.0 b
M2
T1 7.0 b 9.3 bc
T2 5.3 cd 8.3 cd
T3 4.7 de 9.00 bcd
T4 3.0 h 7.7 de
M3
T1 5.7 c 9.0 bcd
T2 4.0 efg 8.3 cd
T3 3.3 gh 6.7 ef
T4 3.0 h 6.3 f
CV (%) 8.87 6.32
Means within a column having different letters are significantly different at 5% level by
DMRT, M1 = Mature green stage, M2 = Breaker stage, M3 = Half ripen stage, T1 =
Control (distilled water), T2 = 500 ppm, T3 = 750 ppm, T6 = 1000 ppm.

INFLUENCE OF ETHEPHON ON RIPENING AND QUALITY 573
The maximum shelf life (12.3 days) was recorded in case of mature green tomatoes without ethephon application (Table 2). The lowest shelf life was found
from 1000 ppm ethephon applied in half ripen tomatoes (6.3 days) closely followed by 750 ppm ethephon (6.7 days) applied in the same stage tomatoes. The ethephon level of 500 and 750 ppm coupled with mature green tomatoes gave shelf life identical to green mature tomatoes treated with distilled water (control). Similar results were given by 500 and 750 ppm ethephon in breaker stage tomatoes. The ethephon level of 500 ppm coupled with half ripen tomatoes
gave shelf life identical to same stage tomatoes treated with distilled water (control).
Table 3. Main effect of maturity stages and ethephon on weight loss and rotting of
tomato at different days of storage.
Duration of storage
Treatment Weight loss (%) Rotting (%)
0D 3 D 6 D 9 D 0D 3 D 6 D 9 D 11D
Stage of maturity
M1 0.00 3.52a 5.25a 7.64a 0.00 0.00 0.00c 6.67c 8.33c
M2 0.00 2.93b 4.35b 6.04b 0.00 0.00 2.23b 23.17b 35.83b
M3 0.00 2.65c 4.02b 5.90b 0.00 0.00 5.83a 30.83a 50.83a
Ethephon Conc.
T1 0.00 2.31c 3.82b 5.16c 0.00 0.00 0.00c 2.22c 2.22d
T2 0.00 2.78b 3.49b 5.12c 0.00 0.00 0.00c 15.56b 22.22c
T3 0.00 3.48a 5.26a 7.77b 0.00 0.00 5.56b 32.22a 45.56b
T4 0.00 3.56a 5.60a 8.54a 0.00 0.00 11.11a 30.22a 56.67a
CV (%) 7.23 7.68 7.09 11.58 13.56 13.39
Means within a column having different letters are significantly different at 5% level by
DMRT, M1 = Mature green stage, M2 = Breaker stage, M3 = Half ripen stage, T1 =
Control Control (distilled water), T2 = 500 ppm, T3 = 750 ppm, T6 = 1000 ppm, D = Day.
Weight loss (%)
Maturity stages, ethephon levels and their combination were found to have significant effect on total loss in weight of fruit (Tables 3 and 4). Total weight loss in mature green tomatoes was always higher during the entire period of storage. At the third day of storage, it was 3.52% that rose to 7.64% at 9th day. In half ripen tomatoes, weight loss was the lowest, being 2.65% at 3rd day and 5.90% at 9th day of storage. Weight loss in mature green tomatoes was higher
because of higher rate of dehydration that generally happened in tender tissue. This is in line with the result of Moneruzzaman et al. (2008a). Ethephon solution also had significant effect on weight loss of tomato (Table 3). The ethephon solution of 750 and 1000 ppm gave higher weight loss than other treatments at 3 and 6 day of storage. Ethephon 1000 ppm gave the highest weight loss at 9 day

574 MONIRUZZAMAN et al.
of storage. The ethephon level of 500 ppm produced higher weight loss than control at 3 day of storage but this level gave weight loss identical to control at 6
and 9 day of storage. The interaction effect was significant at 3, 6 and 9 day of storage with regard to total weight loss in fruit (Table 4). Here the weight loss gradually increased with the advancement of storage period. Ethephon at 750 and 1000 ppm at the 3rd and 6th day of storage and 1000 ppm at 9 day of storage gave maximum weight loss in green mature tomatoes. The half ripen tomatoes coupled with control gave minimum weight loss at all days of storage. It was also
found by Quoc et al. (2012) that during post harvest ripening, weight loss rate in acerolas fruit treated with ethephon increased over the preservation time.
Rotting (%)
Stages of maturity, ethephon levels, and their combinations were found to have
significant effect on rotting (%) of tomatoes (Tables 3 & 4). Rotting in half ripen
tomatoes was found always higher during the entire period of storage. There
were no rotten tomatoes found at 3rd day in all maturity stages. The green mature
tomatoes also did not get rotten at 6 day of storage. At the 6th day of storage total
rotting percent was 5.83% that rose to 50.83% on 9 day of storage in half ripen
tomatoes (Table 3). On the other hand rotting percent in mature green tomatoes
being 6.67% at 9th day and was 8.33% at 11 day of storage. In breaker stage the
rotting percent was 2.23% at 6 day, 23.17% at 9 day that rose to 35.83% at 11
day of storage. The rotting percent was higher in half ripen tomatoes because of
higher rate of transpiration, more skin permeability for water loss and high
susceptibility to decay organism of this climacteric type of fruit. This
corroborates the report of Moneruzzaman et al. (2008a). The highest rotting of
11.11% was recorded in 1000 ppm ethephon at 6 day of storage. But at 9 day of
storage the maximum rotting % was noticed in 750 ppm and 1000 ppm ethephon.
Again at 11 day of storage rotting % was found highest in 1000 ppm ethephon.
The ethephon level of 1000 ppm gave the highest rotting percent irrespective of
maturity at 6 day of storage (Table 5). The ethephon 500 and 750 ppm did not
show any rotting at 6 day of storage. The ethephon solution of 750 ppm gave no
rotting at 6 days storage. At 9 day of storage there was no significant difference
between 750 and 1000 ppm ethephon irrespective of maturity stages. The
highest rotting percent was recorded from 1000 ppm ethephon in half ripen
tomatoes closely followed by same ethephon solution in breaker stage tomatoes
and 750 ppm ethrel in half ripen tomatoes at 11 day of storage. This is perfect
agreement with the results of Dhall and singh (2013) who reported that rotting
percentage of green mature tomatoes increased with increase in the concentration
of ethephon (500-1500 ppm) and with the duration of days for which the fruits
were kept for ripening. The green mature and breaker stage tomatoes gave no
rotting when no ethephon was applied.

INFLUENCE OF ETHEPHON ON RIPENING AND QUALITY 575
Table 4. Combined effect of maturity stages and ethephon on weight loss of tomato
(cv.BARI Tomato-14) fruit during storage.
Days after storage
Treatment
0D 3D 6D 9D Maturity
stages
Ethephon
conc.
M1
T1 0.00 2.68cd 4.40de 5.93e
T2 0.00 3.21bc 3.92ef 5.71e
T3 0.00 4.01a 6.18a 9.02b
T4 0.00 4.17a 6.51a 9.90a
M2
T1 0.00 2.25de 4.74fg 5.04f
T2 0.00 2.72cd 3.4gh 5.00f
T3 0.00 4.40b 5.03bc 7.54c
T4 0.00 3.37b 5.25b 8.03c
M3
T1 0.00 2.00e 3.34gh 4.50f
T2 0.00 2.42de 3.17h 4.65f
T3 0.00 3.02bc 4.56cd 6.75d
T4 0.00 3.15bc 5.03bc 7.70c
CV(%) 7.23 7.68 7.09
Means within a column having different letters are significantly different at 5% level by
DMRT, M1 = Mature green stage, M2 = Breaker stage, M3 = Half ripen stage, T1 =
Control (distilled water), T2 = 500 ppm, T3 = 750 ppm, T6 = 1000 ppm; D = Day.
Table 5. Combined effect of and maturity stages and ethephon on rotting of tomato
(cv.BARI Tomato-14) fruits during storage.
Days after storage
Treatment
0D 3D 6D 9D 11D Maturity
stages
Ethephon
conc.
M1
T1 0.00 0.00 0.00d 0.00e 0.00d
T2 0.00 0.00 0.00d 10.00d 10.00c
T3 0.00 0.00 0.00d 10.00d 10.00c
T4 0.00 0.00 6.68c 6.68d 6.68cd
M2
T1 0.00 0.00 0.00d 0.00e 0.00d
T2 0.00 0.00 0.00d 13.34d 13.33bcd
T3 0.00 0.00 6.68c 36.67ab 53.33ab
T4 0.00 0.00 13.33a 36.67ab 76.67a
M3
T1 0.00 0.00 0.00d 6.68d 6.68d
T2 0.00 0.00 0.00d 23.34bc 36.67bcd
T3 0.00 0.00 10.00b 50.00a 73.33a
T4 0.00 0.00 13.33a 47.33a 86.67a
CV (%) 11.58 13.56 13.39
Means within a column having different letters are significantly different at 5% level by
DMRT, M1 = Mature green stage, M2 = Breaker stage, M3 = Half ripen stage,T1 = Control
Control (distilled water), T2 = 500 ppm, T3 = 750 ppm, T6 = 1000 ppm; D = day.

576 MONIRUZZAMAN et al.
Vitamin-C content of tomato pulp
Vitamin-C content of tomato pulp varied significantly in fruits of different maturity (Table 6). Results showed that vitamin-C content was decreased with the advancement of time. Half ripen tomato contained the highest quantity of vitamin-C (18.10mg/100g) while the mature green tomato contained the lowest quantity of vitamin-C (11.43mg/100g) at harvest. This is perfect agreement with Moneruzzaman et al. (2008b). At 6 and 9 day of storage ethephon treatment with all concentrations maintained a lead over control in respect of vitamin-C content. This in agreement with Thanh Hai, et al. (2009) who got the maximum Vitamin-C content in mango compared to control using 0.8% (8000 ppm) ethephon. The 1000 ppm ethephon gave the highest vitamin-C at 6 day of storage whereas 750 ppm ethephon gave the maximum at 9 day of storage. Maturity stages, ethephon and their combinations were found to have significant effect (Table 7). The maximum vitamin-C content at 6th and 9th day of storage was recorded in half ripen tomato coupled with 1000ppm ethephon which was statistically similar to 1000 ppm ethephon coupled with the same maturity. In mature green and breaker stage tomatoes 1000 ppm ethephon produced the maximum vit.-C.
Table 6. Main effect of maturity stages and ethephon on vitamin -C and pH content
of tomato (cv. BARI Tomato-14 ) at different days of storage.
Duration of storage
Treatment Vitamin-C (mg/100g) pH
0D 3 D 6 D 9 D 0D 3 D 6 D 9 D
Maturity stages
M1 11.43c 10.34c 10.25c 7.51c 4.12a 4.14 4.18a 4.22a
M2 14.26b 12.93b 13.20b 11.75b 4.09b 4.10 4.13ab 4.18b
M3 18.10a 16.45a 16.93a 14.54a 4.04c 4.06 4.09b 4.14c
Ethephon conc.
T1 14.56 14.38a 12.87d 11.02c 4.08 4.09 4.14 4.18
T2 14.60 13.00b 13.43c 10.81c 4.09 4.12 4.13 4.17
T3 14.60 13.82b 13.67b 11.88a 4.08 4.10 4.13 4.18
T4 14.62 12.76b 13.87a 11.36b 4.09 4.10 4.13 4.19
CV (%) 3.74 4.73 3.52 3.87 4.06 3.17 4.05 2.74
Means within a column having different letters are significantly different at 5% level by DMRT, M1 = Mature green, M2 = Breaker stage, M3 = Half ripen stage,T1 = Control (distilled water), T2 = 500 ppm, T3 = 750 ppm, T6 = 1000 ppm; D = Day.
pH of tomato juice
The pH content of tomato juice varied significantly in fruits of different maturity
(Table 6). It was found that pH increased with the advancement of ripening of
fruit. Matsumoto et al. (1983) declared that organic acids are metabolized by the
fruit during ripening and storage. During entire period of storage the highest pH
value was observed in mature green tomatoes followed by breaker stage and half
ripen fruit, respectively. This result corroborates the results of Moneruzzaman et
al. (2008b). The effects of ethephon on pH of tomato were not found significant
during storage. The interaction effect on pH was also insignificant.

INFLUENCE OF ETHEPHON ON RIPENING AND QUALITY 577
Table 7. Combined effect of maturity stages and ethephon on vitamin-C content of
tomato (cv. BARI Tomato-14 ) fruits during storage.
Duration of storage Treatment
0D 3D 6D 9D Maturity stages
Ethrel conc.
M1
T1 11.41 11.38 10.04g 7.45g T2 11.47 10.15 10.14f 7.82g T3 11.41 9.45 10.35f 7.87g T4 11.43 9.88 10.47f 6.91h
M2
T1 14.20 14.15 12.54d 11.16f T2 14.25 12.68 12.52d 11.79e T3 14.29 12.40 12.40e 12.32d T4 14.29 12.50 12.48e 11.73e
M3
T1 18.06 17.61 16.04b 14.44b T2 18.08 16.18 13.12c 12.82c T3 18.10 16.12 16.09b 15.45a T4 18.15 16.89 16.46a 15.45a
CV (%) 3.74 4.73 3.52 3.87
Means within a column having different letters are significantly different at 5% level by
DMRT, M1 = Mature green stage, M2 = Breaker stage, M3 = Half ripen stage,T1 = Control
(distilled water), T2 = 500 ppm, T3 = 750 ppm, T6 = 1000 ppm; D = Day.
Table 8. Main effect of maturity stages and ethrel and on TSS and titrable acidity
content of tomato (cv. BARI Tomato-14 ) at different days of storage.
Duration of storage
Treatment TSS Titrable acidity
0D 3 D 6 D 9 D 0D 3 D 6 D 9 D Maturity stages M1 3.83c 4.20c 4.21c 4.45b 0.35c 0.37c 0.42c 0.43 M2 4.06b 4.28b 4.38b 4.57a 0.38b 0.41b 0.44b 0.44 M3 4.27a 4.39a 4.50a 4.61a 0.42a 0.45a 0.46a 0.44 Ethephon conc. T1 4.06 4.111c 4.24d 4.36c 0.38 0.39 0.41c 0.43 T2 4.06 4.32b 4.32c 4.58b 0.37 0.41 0.43b 0.44 T3 4.08 4.36ab 4.42b 4.58b 0.39 0.42 0.46a 0.45 T4 4.02 4.37a 4.46a 4.65a 0.39 0.43 0.46a 0.46 CV (%) 3.55 2.69 3.84 4.06 2.78 2.52 3.45 4.13
Means within a column having different letters are significantly different at 5% level by
DMRT, M1 = Mature green stage, M2 = Breaker stage, M3 = Half ripen stage,T1 = Control
(distilled water), T2 = 500 ppm, T3 = 750 ppm, T6 = 1000 ppm; D = Day.
TSS content of tomato pulp
TSS content of tomato pulp varied significantly in fruits of different maturity
(Table 8). Half ripen tomato contained the highest quantity of TSS (4.27%) while
it was the lowest (3.83%) in mature green tomatoes at harvest. For all maturity
stages, TSS increased gradually with the advancement of ripening process. This
is in consonance with the results of Moneruzzaman et al. (2008b) and Helyes et
al. (2006). Ethephon levels were also found to have significant effects on
changes in TSS content of tomato juice at 3, 6, and 9 days of storage. The

578 MONIRUZZAMAN et al.
ethephon level of 1000 ppm gave the maximum TSS content at 3, 6 and 9 day of
storage, followed by 750 ppm ethephon in all days of storage. This corroborates
the results of Bal and Kok (2007) who found the highest value of TSS at 1000
ppm ethephon compared to 500 ppm ethephon. At 3 day of storage there was no
significant difference between 750 and 1000 ppm with regard to TSS content.
Table 9. Combined effect maturity stages and ethephon on TSS content of tomato
(cv. BARI Tomato-14 ) fruits during storage.
Duration of storage
Treatment
0D 3D 6D 9D Maturity
stage
Ethephon
conc.
M1
T1 3.82 3.92g 4.11g 4.26f
T2 3.85 4.25e 4.18f 4.46de
T3 3.85 4.31de 4.25e 4.49d
T4 3.80 4.32de 4.28e 4.59c
M2
T1 4.07 4.12f 4.23e 4.42e
T2 4.05 4.31de 4.35d 4.61bc
T3 4.09 4.35bcd 4.44c 4.61bc
T4 4.03 4.34cd 4.51b 4.65bc
M3
T1 4.28 4.30de 4.38d 4.40e
T2 4.05 4.40abc 4.43c 4.68ab
T3 4.28 4.42ab 4.57a 4.65abc
T4 4.22 4.46a 4.61a 4.72a
CV (%) 3.55 2.69 3.84 4.06
Means within a column having different letters are significantly different at 5% level by
DMRT, M1 = Mature green, M2 = Breaker stage, M3 = Half ripen stage, T1 = Control
(distilled water), T2 = 500 ppm, T3 = 750 ppm, T6 = 1000 ppm; D = Day.
The TSS content was also found to be significantly influenced by the combined effect of maturity stages and ethephon levels at 3, 6 and 9 days of storage (Table 9). At 3, 6 and 9 days of storage 500, 750 and 1000 ppm ethephon gave the highest total soluble solid (TSS) compared to control. In green mature tomatoes there was no significant difference between 750 and 1000 ppm ethephon with regard to TSS%. In breaker stage 500, 750 and 1000 ppm ethephon maintained a lead over control but they give identical results in respect of TSS content at 3 and 6 days of storage. Again in full ripen stage 750 and 1000 and 2000 ppm ethephon produced statistically similar TSS % at all days of storage.
Titrable acidity content of tomato pulp
The total titrable acidity in tomato pulp varied significantly in fruits of different maturity (Table 8). The half ripen tomato pulp gave the maximum titrable acidity at harvest and also during entire period of storage except 9 day of storage and contained the highest quantity of titrable acidity (0.46%) at 6 day of storage followed by breaker stage tomatoes. The mature green tomatoes produced lower titrable acidity in fresh and 3 and 6 day of storage. This is in consonance with the

INFLUENCE OF ETHEPHON ON RIPENING AND QUALITY 579
results of Moneruzzaman et al. (2008b). However, there was no significant difference among green mature stage, breaker stage and half ripen stage in respect of titrable acidity at 9 day of storage. The ethephon effect on titrable acidity was significant at 6 day of storage. The ethephon level of 750 and 1000 ppm gave the highest titrable acidity (0.46%) at 6 day of storage but no significant effect was found at 3 and 9 day of storage. The interaction effect was insignificant.
Table 10. Estimated residue level of ethrel (ethephon) (ppm) in treated tomato (var.
BARI Tomato-14).
Ethephon level Days after application
3 day 5 day
T1 0.00 0.00
T2 0.520 0.471
T3 0.658 0.569
T4 0.881 0.802
T5* 1.468 1.234
T1 = Contro (distilled water), T2 = 500 ppm, T3 = 750 ppm, T4 = 1000 ppm, *T5 = 2000
ppm (extra treament), Existing CXL (codex residue level)-2 mg/kg (2 ppm) ethephone
(Anon., 2001).
Residue Level of ethephon
Table 10 revealed that the tomato fruits treated with 2000 ppm ethrel solution showed the maximum residue value at 3 and 5 day of storage. The residue level in treated tomatoes decreased at 5 days compared to 3 days. It might be the reason that ethephon was a volatile compound. This was in perfect agreement with Beitz et al. (1977). The resdue level of ethrel in tomato fruits treated with
500-2000 ppm ethephon was less than the recommended residue level of ethephon (2 mg/kg) (Anon., 2001).
Based on the results and discussion it might be concluded that tomato fruits should be harvested at mature green stage and breaker stage for distant marketing for ethephon application @ 750 ppm for tomato ripening. The ethephon treated fruits should be consumed after 3 or 4 days of ethephon application.
References
Abeles, F. B., P. W. Morgan and M. Saltveit. 1992. Ethylene in Plant Biology. 2nd Ed., Academic Press New York. P. 156.
Anju-kumari, M. l., S. P. S. Bhardwaj and A. Kumari. 1993. Influence of stage of harvest on shelf life and quality of tomato. Hort. J. 6: 89-92.
Anonymous. 2001. European Community Position for the 33rd Session of the Codex Committee on Pesticide Residues. April, 2001. The Hague.
Anonymous. 2010. Delicious fruit quality can be affected by ethephon or retain. Post harvest information network. Washington State University. http://postharvest.tfree.wsu.edu /pages/ PC99A.
Bal, E. and D. Kok. 2007. The effects of glycerine added ethephon treatments on fruit characteristics of Aclimidia deliciosa cv. Hayward. Bulgarian J. Agril. Sci. 13: 291-300.

580 MONIRUZZAMAN et al.
BARC (Bangladesh Agricultural Research Council). 2012. Research Management Information System. http:/180. 211. 164. 225/rmis /index. php? t=detail_ info&linkid=1277.
BBS (Bangladesh Bureau of Statistics). 2011. Statistical Year Book of Bangladesh, Bangladesh Bureau of Statistics, Bangladesh. P. 136.
Beitz, H, U. Banasiak and U. Bergner. 1977. Behavior of ethephon residues on tomatoes. Part 1. Green house tomatoes. www. nebi.nlm.mh.gov./pubmed/703819.
Bui Q. Q., 2007. Ethephon and Jackfruit, Palo Alto, California. 231pp
Cantwell, M. 1994. Optimum procedures for ripening tomatoes. In: Management of Fruit ripening, Post harvest Horticulture. Series No. 9, Post harvesr Outreach Program, Dept. of Pomology, Univ. of California, Davis (UCDAVIS). Pp. 27-28.
Dhall R.K., P. Singh. 2013. Effect of ethephon and ethylene gas on ripening and quality of Tomato (Solanum lycopersicum L.) during cold storage. J. Nutr. Food Sci. 3: 244.
Helyes, L., J. Dimeny, Z. Pek and A. Lugasi. 2006. Effect of maturity stage on content, colour and quality of tomato (Lycopersican lycopersicum (L.) (Karsten) fruit. Int. J. Hort. Sci. 12 (1): 41-44.
Matsumoto, S., T. Obara and B. S. Luh. 1983. Changes in chemical constituents of Kiwi fruit during post-harvest ripening. J. Food Sci. 48: 607-611.
Mitcham, E.J., Gross, K.C., J-Ng, T., 1989. Tomato fruit cell synthesis during development and senescence. Plant Physiol. 89, 477–481.
Moneruzzaman, K. M., A. B. M. S. Hossain, W. Sani and M. Safiuddin. 2008a. Effect of stages of maturity and ripening conditions on the physical characteristics of tomato. Ame. J. Bioch. and Biotech. 4(4): 329-335.
Moneruzzaman, K. M., A. B. M. S. Hossain, W. Sani and M. Safiuddin. 2008b. Effect of stages of maturity and ripening conditions on the biochemical characteristics of tomato. Ame. J. Bioch. and Biotech. 4(4): 336-344.
Moura, M. A., S.R. Zanin and F.L. Finger. 1997. Influence of ethephon and a surfactant on ripening of harvested tomato fruit. HortScience. 32: 3478.
Olympio, V.M. and J.C. Norman. 2000. Influence of pre-post harvest application of ethephone (2 chloroethyl phosphonic acid) on tomatoes. http:// hortsci.ashspublications.org/ content/ 32/3/ 478.4.abstract
Quoc, L.P.T., C.P. Dat, A.T. Hang., T.H. Mi and L.T.T. Nga. 2012. Regarding the influence of ethephon on the ripe acerola (Malpighia glabra L.). Cercetări Agronomice în Moldova. 4: 152.
Rahman, M. A., M. S. Ahmed, A. Begum and M. W. Akon. 2012. Determination and quantification of left over residues of ethephon in tomato, banana and mango. Annual Report for 2011-2012. Enomology Division, Bangladesh Agricultural Research Institue, Gazipur. Pp. 192-197.
Ranganna, S. 1986. Handbook of Analysis and Quality control for Fruit and Vegetable products. Tata McGraw Hill Pub. Co. Ltd., New Delhi, India. Pp. 1143.
Thanh Hai, V. U., P. T. Huong, P. Sruamsiri, M. Hegele and J. N. Winsche. 2009. Effect of ethrel postharvest application on ripening of ‘Tron’ and ‘Hoi’ mangoes (Mangifera indica L.). Conf. on Int. Res. on Food Security, Natural Resource management and Rural Development, Univ. Of Humburg, Oct. 6-8, 2009. P. 75-76.
Wills, R. B. H. and V. V. V. Ku. 2002. Use of 1-MCP to extend the tomato ripen of green tomatoes and post harvest life of ripe tomatoes. Postharv. Biol. Technol. 26: 85-90.

ISSN 0258-7122
Bangladesh J. Agril. Res. 40(4): 581-590, December 2015
PERFORMANCE OF SEPARATED TILLERS OF TRANSPLANT AMAN
RICE AT DIFFERENT LEVELS OF UREA SUPER GRANULES
K. S. RAHMAN1, S. K. PAUL2 AND M. A. R. SARKAR3
Abstract
An experiment was conducted at the research field of Department of Agronomy,
Bangladesh Agricultural University, Mymensingh during June to December
2012 to investigate the effect of age of tiller seedlings, number of tiller seedlings
hill-1 and application of urea super granules (USG) on the yield and yield
contributing characters of transplant Aman rice (cv. BRRI dhan52). The
experiment consisted of two ages of tiller seedlings viz. 25 and 35-days old,
three levels of tiller seedlings hill-1 viz. 1, 3 and 5 seedlings hill-1 and three levels
of USG viz. 0, 1.8 (55 kg N ha-1) and 2.7g USG (80 kg N ha-1) four hill-1 in
every alternate row. The experiment was laid out in a Randomized Complete
Block Design (Factorial) with three replications. The highest plant height,
number of effective tillers hill-1, number of total tillers hill-1, number of total
spikelets panicle-1, number of grains panicle-1, grain yield and harvest index
were found in 1.8 g USG applied @ one granule 4-hill-1. The highest number of
sterile spikelets panicle-1 was found in control treatment and the lowest in 1.8 g
USG. The highest number of effective tillers hill-1, number of total spikelets
panicle-1 and grain yield ha-1 was found when 5 tiller seedlings were
transplanted hill-1 combined with 1.8 g USG. Application of urea super granules
1.8 g (55 kg N ha-1) at 10 days after transplanting @ one granule 4-hill-1 in every
alternate row with 25 day old tiller seedlings using 5 tiller seedlings hill-1 was
found beneficial for grain yield of transplant Aman rice. Tiller separation could
be an alternative source of seedling during seedling scarcity.
Keywords: Age of tiller seedlings, transplant Aman rice, USG, yield.
Introduction
Aman rice is very common in Bangladesh but damage occurred due to early or
late flash flood. Due to unavailability of seedlings farmers cannot re-transplant
their field after the recession flood water. If available, seedlings are either too
young or too old to produce a good crop. Re-transplantation of separated clonal
tillers from an unaffected Aman crop and subsequent management practices
could be a remedy to overcome this loss. This technique of transplanting of
separated clonal tillers may be a promising alternative for growing a post-flood
transplant Aman crop (Sarkar et al., 2011; Mridha et al., 1991 and Siddique et al.,
1991). Clonal propagation was somewhat superior to nursery seedlings and yield
did not decrease with the removal of clonal tillers (Sharma, 1994). In some flood-
prone lowlands, where the transplanted crop is damaged by natural hazard,
1&3Department of Agronomy, Bangladesh Agricultural University (BAU),
Mymensingh-2202, Bangladesh.

582 RAHMAN et al.
vegetative propagation using tillers separated (4 tillers hill-1) from the previously
established transplanted crop gave higher yield than nursery seedlings
transplanted on the same date (Biswas and Salokhe, 2001).
Age of tiller seedlings is an important determinant that may influence the tiller
production, growth, grain formation and other yield contributing characters of
rice. The highest grain yield could be obtained by transplanting tiller seedlings
which were separated from mother plants 35 days after transplanting (Biswas et
al., 1987). Tillers could be separated at 30-40 days after transplanting (BRRI,
1988). Paul et al. (2002) reported that tillers can be separated at 25 or 35 days
after transplanting (DAT) without hampering grain yield. Planting density,
number of tillers and their growth are greatly affected by number of seedlings
hill-1. Optimum number of tiller seedlings may enable the rice plant to grow
properly both in its aerial and underground parts which ultimately may lead to
enhancement of yield. While the least number of tiller seedlings hill-1 may cause
insufficient tiller growth. Urea super granules (USG), a slow release nitrogenous
fertilizers dissolves slowly in the soil providing a steady supply of available
nitrogen throughout the growing period of the crops can be applied in the root
zone of the rice plants at 8-10 cm depth of soil (reduced zone of rice soil), which
can save 30% nitrogen compared to prilled urea. Placement of USG in rice gave
significantly higher grain and straw yields than split application of prilled urea
(Mohanty et al., 1989, Bowen et al., 2005 and Hasan, 2007). It increases
absorption rate, improves soil health and ultimately increases rice yield. It is
therefore, necessary to find out the influence of age of tiller seedlings, number of
tiller seedlings hill-1 and application of urea super granules on the yield
performance of transplant Aman rice cv. BRRI dhan52.
Materials and Method
The experiment was conducted at the research field of Department of Agronomy,
Bangladesh Agricultural University, Mymensingh during the period from June to
December 2012. The experimental sites belongs to the Sonatola Soil Series of
Old Brahmaputra Floodplain (AEZ 9) having non calcareous dark grey
floodplain soil. The land was medium high with sandy loam texture having pH
6.5. Soil contained 1.67% organic matter, 0.10% total N, 26.0 ppm available P,
0.14 (me) % exchangeable K and 13.9 ppm available S. The experiment
consisted of two ages of tiller seedlings viz. 25 and 35 days old, three levels of
tiller seedling hill-1 viz. 1, 3 and 5 seedlings hill-1 and three levels of USG viz. 0,
1.8 and 2.7g USG. The experiment was laid out in a Randomized Complete
Block Design (Factorial) with three replications. The size of unit plot was 4.0m ×
2.5m. A high yielding variety BRRI dhan52 of transplant Aman rice was used as
the test crop. Tillers were separated from 25 and 35 days after transplanting from
previously transplanted rice field and then re-transplanted in the main field on 13

PERFORMANCE OF SEPARATED TILLERS OF TRANSPLANT 583
September 2012 according to treatments. Fertilizer P, K, S and Zn were applied
@ 21, 35, 11 and 3.5 kgha-1 in the form of triple super phosphate (TSP), muriate
of potash (MoP), gypsum and zinc sulphate respectively. TSP, MoP, gypsum and
zinc sulphate were applied at the time of final land preparation. Nitrogen was
applied according to experimental specification in the form of Urea Super
Granules (USG) at 10 days after transplanting @ one granule 4-hill-1 in every
alternate row. Irrigation, weeding and other intercultural operations were done as
and when required.
The crop was harvested on 20 November 2012. Grain and straw yields were
recorded from the harvest of 2.5m x 2.0m harvest area from the middle portion of
each plot. The grain yield was adjusted to 14% moisture content and straws dried
to record the straw yield. Grain yield and straw yield altogether were regarded as
biological yield i.e. Biological yield = Grain yield + Straw yield.
Harvest index is the relationship between grain yield and biological yield.
Harvest index was calculated by the following formula:
Harvest index (%) = 100)
1-ha(t yieldBiological
)-1
ha(t yieldGrain
The recorded data were statistically analyzed with the help of MSTAT-C
software. The differences among treatment means were adjudged by Duncan's
New Multiple Range Test (Gomez and Gomez, 1984).
Results and Discussion
Age of Tiller Seedlings
Age of tiller seedlings is an important determinant as that of nursery seedling for
the production of transplant Aman rice. Plant height and yield contributing
characters were significantly affected by age of tiller seedlings. The highest plant
height, number of total spikelet panicle-1, number of grains panicle-1 and number
of sterile spikelets panicle-1 were found in 25-day old tiller seedlings where
effective tillers hill-1, number of total tillers hill-1 and panicle length were found
in 35-day old tiller seedlings (Table 1). Plant height, number of grains panicle-1,
total number of sterile spikelets panicle-1, grain yield ha-1, biological yield ha-1
and harvest index were decreased with the increase of age of tiller seedlings.
Younger tiller seedling (25 days) and long duration for vegetative growth might
have influenced plant height, number of total spikelet panicle-1 and grains panicle-
1 (Table 1). Similar results were reported by Sarkar et al. (2011). On the contrary,
older tiller seedlings get less time for their proper vegetative growth and rapidly
entered into the reproductive phase producing decreased number of total spikelet
panicle-1 and grains panicle-1. Transplanting 25-day old tillers produced higher

584 RAHMAN et al.
Ta
ble
1.
Eff
ect
of
ag
e o
f ti
ller
see
dli
ng
s, n
o.
of
till
er s
eed
lin
gs
hil
l-1 a
nd
US
G a
pp
lica
tio
n o
n y
ield
an
d y
ield
co
ntr
ibu
tin
g c
ha
ract
ers
of
tra
nsp
lan
t A
ma
n r
ice.
P
lant
hei
ght
at
har
vest
(cm
)
Eff
ecti
ve
till
ers
hil
l-1
(no
.)
To
tal
till
ers
hil
l-1
(no
.)
Pan
icle
leng
th
(cm
)
To
tal
spik
elet
s
pan
icle
-1
(no
.)
Gra
ins
pan
icle
-1
(no
.)
Ste
rile
spik
elet
s
pan
icle
-1
(no
.)
Wei
ght
of
10
00
-
gra
ins
(g)
Gra
in
yie
ld
(t h
a-1)
Str
aw
yie
ld
(t h
a-1)
Bio
logic
al
yie
ld
(t h
a-1)
Har
ves
t
ind
ex
(%)
Ag
e o
f ti
ller
see
dli
ng
s (d
ay
s)
25
1
08
.23
a 6
.44
b
8.2
2b
24
.65b
18
6.1
9a
15
5.7
8a
30
.41
a 2
4.6
6
5.1
7a
5.8
3b
11
.00
a 4
7.0
0a
35
1
07
.09
b
8.1
9a
9.5
6a
25
.46
a 1
42
.81
b
12
1.7
0b
21
.11b
24
.71
4
.73
b
6.0
7a
10
.80b
43
.79b
CV
%
3.9
1
10
.09
8.9
8
9.3
1
4.1
6
3.9
1
0.9
4
3.4
5
6.9
6
18
.38
10
.66
10
.54
No
. o
f ti
ller
see
dli
ng
s h
ill-1
1
10
7.1
9
6.0
6c
7.5
0c
24
.89
15
5.8
3c
12
7.0
6c
28
.78
a 2
4.5
8
4.7
2b
5.7
7
10
.49
45
.11
3
10
8.9
7
7.3
3b
8.9
4b
25
.72
16
2.3
9b
13
5.7
2b
26
.67b
24
.68
4
.92
b
6.1
1
11
.03
44
.98
5
10
6.8
2
8.5
6a
10
.22
a 2
4.5
6
17
5.2
8a
15
3.4
4a
21
.83
c 2
4.7
9
5.2
0a
5.9
7
11
.17
46
.77
CV
%
3.9
1
10
.09
8.9
8
9.3
1
4.1
6
3.9
1
0.9
4
3.4
5
6.9
6
18
.38
10
.66
10
.54
US
G a
pp
lica
tio
n (
g)
0
10
4.7
6b
4.5
6c
5.8
3b
24
.82
12
8.1
7c
94
.39
c 3
3.7
8a
24
.42
4
.24
b
5.8
5
10
.08
42
.21b
1.8
1
09
.42
a 9
.17
a 1
0.7
2a
25
.91
18
5.4
4a
16
7.0
0a
18
.44
c 2
4.6
7
5.4
0a
6.1
4
11
.55
47
.52
a
2.7
1
08
.80
a 8
.22
b
10
.11
a 2
4.4
4
17
9.8
9b
15
4.8
3b
25
.06b
24
.96
5
.20
a 5
.86
11
.06
47
.14
a
CV
%
3.9
1
10
.09
8.9
8
9.3
1
4.1
6
3.9
1
0.9
4
3.4
5
6.9
6
18
.38
10
.66
10
.54
Mea
ns
hav
ing s
am
e o
r w
itho
ut
lett
er d
o n
ot
dif
fer
sign
ific
an
tly a
t 5
% l
evel
of
pro
bab
ilit
y b
y D
MR
T.

PERFORMANCE OF SEPARATED TILLERS OF TRANSPLANT 585
Ta
ble
2.
Inte
ract
ion
eff
ect
of
ag
e o
f ti
ller
see
dli
ng
s a
nd
no
. o
f ti
ller
see
dli
ng
s h
ill-1
on
yie
ld a
nd
yie
ld c
on
trib
uti
ng
ch
ara
cter
s o
f
tra
nsp
lan
t A
ma
n r
ice.
Age
of
till
er
seed
lin
gs
(day
s)
Til
ler
seed
lin
gs
hil
l-1
(no
.)
Pla
nt
hei
ght
at
har
vest
(cm
)
Eff
ecti
ve
till
ers
hil
l-1
(no
.)
To
tal
till
ers
hil
l-
1(n
o.)
Pan
icle
leng
th
(cm
)
To
tal
spik
elet
s
pan
icle
-1
(no
.)
Gra
ins
pan
icle
-1
(no
.)
Ste
rile
spik
elet
s
pan
icle
-1
(no
.)
Wei
ght
of
10
00
-
gra
ins
(g)
Gra
in
yie
ld
(t h
a-1)
Str
aw
yie
ld
(t h
a-1)
Bio
logic
al
yie
ld
(t h
a-1)
Har
ves
t
ind
ex
( %
)
25
1
10
6.7
8
5.1
1
6.7
8
25
.59
ab
14
3.4
4
10
8.5
6
34
.89
a 2
4.6
3
4.6
1
5.4
0
10
.01
45
.90
a
3
10
8.3
4
6.3
3
8.1
1
25
.12
ab
14
9.7
8
11
8.4
4
31
.33b
2
4.4
7
4.5
9
6.6
9
11
.28
40
.84b
5
10
6.1
6
7.8
9
9.7
8
23
.25b
16
3.1
1
13
8.1
1
25
.00
c 2
4.8
6
4.9
8
6.1
1
11
.09
45
.16
ab
35
1
10
7.6
1
7.0
0
8.2
2
24
.19
ab
16
8.2
2
14
5.5
6
22
.67
cd
24
.52
4.8
3
6.1
4
10
.97
44
.33
ab
3
10
9.6
0
8.3
3
9.7
8
26
.32
a 1
75
.00
15
3.0
0
22
.00d
2
4.9
0
5.2
4
5.5
3
10
.77
49
.13
a
5
10
7.4
7
9.2
2
10
.67
25
.87
a 1
87
.44
16
8.7
8
18
.67
e 2
4.7
2
5.4
2
5.8
3
11
.25
48
.38
a
CV
(%
)
3.9
1
10
.09
8.9
8
9.3
1
4.1
6
3.9
1
0.9
4
3.4
5
6.9
6
18
.38
10
.66
10
.54
Mea
ns
hav
ing s
am
e o
r w
itho
ut
lett
er d
o n
ot
dif
fer
sign
ific
an
tly a
t 5
% l
evel
of
pro
bab
ilit
y b
y D
MR
T.
Tab
le 3
. In
tera
ctio
n e
ffec
t of
age
of
tiller
see
dlin
gs
an
d U
SG
ap
plica
tion
on
yie
ld a
nd
yie
ld c
on
trib
uti
ng c
hara
cter
s of
tran
spla
nt
Am
an
ric
e.
Age
of
till
er
seed
lin
gs
(day
s)
US
G
app
lica
tion
(g)
Pla
nt
hei
ght
at
har
vest
(cm
)
Eff
ecti
ve
till
ers
hil
l-1
(no
.)
To
tal
till
ers
hil
l-1
(no
.)
Pan
icle
leng
th
(cm
)
To
tal
spik
elet
s
pan
icle
-1
(no
.)
Gra
ins
pan
icle
-1
(no
.)
Ste
rile
spik
elet
s
pan
icle
-1
(no
.)
Wei
ght
of
10
00
-
gra
ins
(g)
Gra
in
yie
ld
(t h
a-1)
Str
aw
yie
ld
(t h
a-1)
Bio
logic
al
yie
ld
(t h
a-1)
Har
ves
t
ind
ex
(%)
25
0
10
4.2
8
4.3
3e
5.5
6d
23
.72
12
0.3
f 7
9.4
4f
40
.89
a 2
4.4
8
3.8
6
5.8
3
9.6
9
40
.03
1.8
1
09
.31
8.0
0c
9.7
8c
26
.29
17
1.7
8c
14
9.2
2c
22
.56
c 2
4.4
2
5.2
4
6.4
5
11
.69
45
.16
2.7
1
07
.68
7.0
0d
9.3
3c
23
.95
16
4.2
2d
13
6.4
4d
27
.78b
2
5.0
7
5.0
8
5.9
2
10
.99
46
.70
35
0
10
5.2
4
4.7
8e
6.1
1d
25
.91
13
6.0
0e
10
9.3
3e
26
.67b
2
4.3
6
4.6
1
5.8
6
10
.47
44
.38
1.8
1
09
.52
10
.33
a 1
1.6
7a
25
.53
19
9.1
1a
18
4.7
8a
14
.33d
2
4.9
2
5.5
7
5.8
3
11
.40
49
.12
2.7
1
09
.92
9.4
4b
10
.89b
24
.93
19
5.5
6b
17
3.2
2b
22
.33
c 2
4.8
5
5.3
2
5.8
1
11
.13
48
.33
CV
(%
)
3.9
1
10
.09
8.9
8
9.3
1
4.1
6
3.9
1
0.9
4
3.4
5
6.9
6
18
.38
10
.66
10
.54
Mea
ns
hav
ing s
am
e o
r w
itho
ut
lett
er d
o n
ot
dif
fer
sign
ific
an
tly a
t 5
% l
evel
of
pro
bab
ilit
y b
y D
MR
T.

586 RAHMAN et al.
grain yield compared to older tiller seedlings but higher straw yield ha-1 from 35-
day old tiller seedlings (Table 1). Similar results were reported by Sarkar et al.
(2011) and Kirttania et al. (2013). The crop of 25-day old tiller seedlings
received relatively more time for their growth, development and grain filling and
resulted in the increased grain yield. In this case, the yield components were
improved and sterile spikelets panicle-1 were decreased which were mainly
responsible for the improvement of grain yield. Paul et al. (2002) reported that
cultivar BR23 appeared to be resistant to tiller separation and tillers could be
separated at 25 or 35 DAT without hampering grain yield.
Number of Tiller Seedlings Hill-1
Yield attributes and grain yield were significantly influenced by number of tiller
seedlings hill-1. The highest number of effective tillers hill-1, number of total
tillers hill-1, number of total spikelets panicle-1, number of grains panicle-1and
grain yield ha-1 were found in the crop raised from 5 tiller seedlings transplanted
hill-1 and the lowest from 1 tiller seedling hill-1 (Table 1). Sarkar et al. (2011)
reported that in cultivar BR 23, two tiller seedlings hill-1 appeared to be enough
for the cultivation of transplant Aman rice. Planting of one seedling hill-1 was at
par with planting of 2 seedlings hill-1 in terms of grain yield (Dongarwar et al.,
2002). Paul et al. (2002) reported that the highest number of effective tiller hill-1,
grains panicle-1 and grain yield ha-1 were obtained when 2 tillers were kept hill-1.
Biswas and Salokhe (2001) mentioned that higher densities of clonal tillers
transplanted hill-1 gave lower panicle number and grain weight. Intra-tiller
seedlings competition for nutrients, light, air and water in a hill resulted in the
reduced grain yield when 6 tiller seedlings were transplanted hill-1. There was no
significant difference in biological yield due to number of tiller seedlings hill-1
highest grain yield was observed when 5 tiller seedlings hill-1 (Table 1).
Therefore, increased grain yield was the main reason for increase of number of
effective tillers hill-1 and number of grains panicle-1. Transplanting 5 tiller
seedlings hill-1 produced highest the number of tillers hill-1 and also highest
number of grains panicle-1 thus produced the highest grain yield.
Urea Super Granules (USG) Application
Plant height, yield contributing characters, grain yield ha-1 and harvest index
were significantly influenced by the application of USG (Table 1). The highest
number of effective tillers hill-1, number of total spikelets panicle-1 and number of
grains panicle-1 were found when 1.8 g USG was applied but both 1.8 g and 2.7 g
USG applied per 4 hills in every alternate row showed results identical in respect
of plant height, total tillers, grain yield and harvest index. Grain yield and other
plant characters were lower where USG was not applied. Grain yield was the
highest in 1.8 g USG due to increasing number of grains panicle-1 for the

PERFORMANCE OF SEPARATED TILLERS OF TRANSPLANT 587
adequacy of nitrogen as USG probably favored the cellular activities during
panicle formation and development which led to increased number of productive
tillers hill-1. These results also agreed by Singh and Singh (1997). The increased
number of tillers hill-1 with increased nitrogen levels USG (Hasan, 2007).
Interactions
Panicle length, number of sterile spikelet’s panicle-1 and harvest index were
significantly influenced by the interaction between the age of tiller seedlings and
number of tiller seedlings hill-1. The longest panicle was produced when 35-day
old tiller seedlings by transplanting 3 tiller seedlings hill-1 and the shortest
panicle with 25-day old tiller seedlings with 5 tiller seedlings hill-1. Similar result
was reported by Kirttania et al. (2013). The highest number of sterile spikelets
panicle-1 was produced in the crop raised from 25-day old tiller seedlings using 1
tiller seedlings hill-1 and the lowest in 35-day old tiller seedlings with 5 tiller
seedlings hill-1. The maximum harvest index was produced by transplanting 35-
day old tiller seedlings using 5 tiller seedlings hill-1 followed by other treatments
except lowest in 25 day old tiller seedlings with 3 tiller seedlings hill-1 (Table 2).
Age of tiller seedlings and USG application significantly influenced number of
effective tillers hill-1, number of total tillers hill-1, total spikelets panicle-1, number
of grains panicle-1 and sterile spikelets panicle-1. The highest number of effective
tillers hill-1, number of total tillers hill-1, number of total spikelets panicle-1 and
grains panicle-1 were produced by transplanting 35-day old tiller seedlings when
1.8 g USG was applied and the lowest one was in the crop raised from 25-day old
tiller seedlings without USG (Table 3). Kirttania et al. (2013) reported that 35-
day old tiller seedlings of BRRI dhan49 fertilized with 2.7g USG produced the
higher number of effective tillers hill-1 and grains panicle-1 compared to 25-day
old tiller seedlings with 1.8 g USG. The highest number of sterile spikelets
panicle-1 was produced from 25-day old tiller seedlings without USG but lowest
in 35-day old tiller seedlings when 2.7 g USG was applied (Table 3).
Number of effective tillers hill-1, total tillers hill-1 and total spikelets panicle-1
were significantly influenced by the interaction between number of tiller
seedlings hill-1 and USG application. The highest number of effective tillers hill-1
was produced in the crop raised from 5 tiller seedlings hill-1 when 1.8 g USG was
applied and the lowest in 1 tiller seedling hill-1 when USG was not applied (Table
4). The maximum number of total tillers hill-1 was produced in 5 tiller seedlings
hill-1 along with application of 1.8 g USG followed by 2.7 g USG of same no. of
tiller. The lowest was produced in 1 tiller seedling hill-1 without application of
USG. Similar trend was followed in case of total spikelets panicle-1. Grain yield
was significantly influenced by the interaction between number of tiller seedlings
hill-1 and USG application. Higher grain yield ha-1was produced in the crop raised
from 5 tiller seedlings hill-1 when 1.8 g USG was applied followed by 1 and 3

588 RAHMAN et al.
Ta
ble
4.
Inte
ract
ion
eff
ect
of
no
. o
f ti
ller
see
dli
ng
s h
ill-1
an
d U
SG
ap
pli
cati
on
on
y
ield
an
d y
ield
co
ntr
ibu
tin
g c
ha
ract
ers
of
tra
nsp
lan
t A
ma
n r
ice
No
. o
f
till
er
seed
lin
gs
hil
l-1
US
G
app
lica
tio
n
(g)
Pla
nt
hei
ght
at
har
vest
(cm
)
Eff
ecti
ve
till
ers
hil
l-1
(no
.)
To
tal
till
ers
hil
l-1
(no
.)
Pan
icle
len
gth
(cm
)
To
tal
spik
elet
s
pan
icle
-1
(no
.)
Gra
ins
pan
icle
-1
(no
.)
Ste
rile
spik
elet
s
pan
icle
-1
(no
.)
Wei
ght
of
10
00
-
gra
ins
(g)
Gra
in
yie
ld
(t h
a-1)
Str
aw
yie
ld
(t h
a-1)
Bio
logic
al
yie
ld
(t h
a-1)
Har
ves
t
ind
ex
( %
)
1
0
10
4.2
6
4.0
0g
5.0
0f
25
.17
12
2.6
7f
84
.33
38
.33
2
4.2
8
3.9
2d
5.3
8
9.2
9
42
.17
1.8
1
08
.81
7.5
0d
e 9
.17
cd
26
.27
17
5.0
0c
15
4.5
0
20
.50
2
4.6
1
5.2
5ab
c 5
.97
11
.22
47
.07
2.7
1
08
.51
6.6
7e
8.3
3d
23
.23
16
9.8
3d
14
2.3
3
27
.50
2
4.8
4
5.0
0b
c 5
.96
10
.96
46
.09
3
0
10
4.7
2
5.1
7f
6.3
3e
24
.27
12
5.6
7f
90
.67
35
.00
2
4.8
1
4.3
8c
6.2
9
10
.67
41
.23
1.8
1
10
.61
8.8
3c
10
.50b
26
.34
18
4.5
0b
16
5.8
3
18
.67
2
4.3
1
5.1
6ab
c 6
.42
11
.57
45
.12
2.7
1
11
.59
8.0
0cd
1
0.0
0b
c 2
6.5
4
17
7.0
0c
15
0.6
7
26
.33
2
4.9
3
5.2
2ab
c 5
.63
10
.84
48
.60
5
0
10
5.3
2
4.5
0fg
6
.17
e 2
5.0
1
13
6.1
7e
10
8.1
7
28
.00
2
4.1
7
4.4
2c
5.8
8
10
.29
43
.22
1.8
1
08
.83
11
.17
a 1
2.5
0a
25
.12
19
6.8
3a
18
0.6
7
16
.17
2
5.1
0
5.8
1a
6.0
4
11
.85
49
.24
2.7
1
06
.30
10
.00b
12
.00
a 2
3.5
5
19
2.8
3a
17
1.5
0
21
.33
2
5.1
1
5.3
8ab
6
.00
11
.38
47
.85
CV
(%)
3
.91
10
.09
8.9
8
9.3
1
4.1
6
3.9
1
0.9
4
3.4
5
6.9
6
18
.38
10
.66
10
.54
Mea
ns
hav
ing s
am
e o
r w
itho
ut
lett
er d
o n
ot
dif
fer
sign
ific
an
tly a
t 5
% l
evel
of
pro
bab
ilit
y b
y D
MR
T.
Tab
le 5
. In
tera
ctio
n e
ffec
t o
f a
ge
of
sep
ara
ted
til
ler
seed
lin
gs,
no.
of
till
er s
eed
lin
gs
hil
l-1 a
nd
US
G a
pp
lica
tio
n o
n g
rain
yie
ld o
f tr
an
spla
nt
Am
an
ric
e
Age
of
till
er s
eed
lin
gs
(day
s)
Til
ler
seed
lings
hil
l-1
(no
.)
US
G a
pp
lica
tio
n (
g)
0
1.8
2
.7
1
3
.33
h
5.3
3b
cd
5.1
7b
cd
25
3
3.9
2g
4
.84
def
5
.00
cde
5
4
.33
fg
6.4
2a
5.0
7b
-e
1
4
.50
efg
5
.17
bcd
4
.83
def
35
3
4.8
3d
ef
5.4
7a-
d
5.4
3b
cd
5
4
.50
efg
5
.55
abc
5.5
8b
CV
(%
) 6
.96
6.9
6
6.9
6
Mea
ns
hav
ing s
am
e o
r w
itho
ut
lett
er d
o n
ot
dif
fer
sign
ific
an
tly a
t 5
% l
evel
of
pro
bab
ilit
y b
y D
MR
T.

PERFORMANCE OF SEPARATED TILLERS OF TRANSPLANT 589
tiller seedlings hill-1 (Table 4). Maximum seedlings without USG showed lower
grain yield. Kirttania et al. (2013) found that maximum number of effective
tillers hill-1, grains panicle-1 and grain yield were produced when 1.8 g USG was
applied.
Only grain yield ha-1 was significantly influenced by the interaction of age of
tiller seedlings, number of tiller seedlings hill-1 and USG application (Table 5).
The maximum grain yield was produced in the crop raised from 25-day old tiller
seedling using 5 tiller seedlings hill-1 with 1.8 g USG followed by 35-day old
seedlings using 3 tillers hill-1 of same amount of USG application. The lowest
grain yield was produced in 25-day old tiller seedling using 1 tiller seedlings hill-
1 when USG was not applied.
Conclusion
It appears that 25-day old tiller seedlings @ 5 hill-1 fertilized with 1.8g USG @
one granule 4-hill-1 in every alternate row was found to be a promising practice to
obtain the highest grain yield of transplant Aman rice cv. BRRI dhan52. The
highest grain yield of transplant Aman rice could also be obtained by
transplanting 35-day old tiller seedlings with 3 or 5 seedlings hill-1 and fertilized
with 1.8 g USG @ one granule 4-hill-1 in every alternate row.
References
Biswas, P. K. and V. M. Salokhe. 2001. Effects of planting date, intensity of tiller
separation and plant density on the yield of transplanted rice. The J. Agric. Sci. 137:
279-287.
Biswas, P. K., S. K. Rao and A. Quasem. 1987. Yield ability of tiller separated from
standing transplanted aman rice and replanted. Intl. Rice. Res. Newsl. 14 (2): 26.
Bowen, W. T., R. B. Diamand, U. Singh and T. P. Thompson. 2005. Urea deep
placement increases yield and saves nitrogen fertilizer in farmer’ fields in
Bangladesh. Rice in life: Scientific Perspectives for the 21st Century. In: Proc. World
Rice Res. Conf. held in Tsukuba, Japan, 4-7 Nov. 2004. Pp. 369-372.
BRRI (Bangladesh Rice Research Institute). 1988. Annual Report. Soil and Fertilizer
Management Programme, Bangladesh Rice Res. Inst, Joydebpur, Gazipur. 2: 1-20.
Dongarwar, U. R., M. N. Patnankar and. W.S. Parwar. 2002. Response of hybrid rice to
spacing and number of seedling per hill and their effects on growth and yield. Indian
J. Soils Crops. 12(2): 248-249.
Gomez, K. A. and A. A. Gomez. 1984. Statistical procedure forAgril. Res. Intl. Rice Res.
Inst., John Wiley and Sons. New York, Chichester, Brisbane Toronto, Singapore.
Pp. 139-240.
Hasan, S. M. 2007. Effect of level of urea super granules on the performance of T. aman
rice. M. S Thesis, Dept. Agron., Bangladesh Agril. Univ. Mymensingh. Pp.30-52.

590 RAHMAN et al.
Kirttania, B., M. A. R. Sarkar and S.K Paul. 2013. Performance of transplant Aman rice
as influenced by tiller seedlings and nitrogen management. J. Bangladesh Agril. Uni.
11(2): 249-256.
Mohanty, S. K., S. P. Chakravorti and A. Bhadrachalam. 1989. Nitrogen balances studies
in rice using 15 N-labeled urea super granules. J. Agic. Sci. 113(l): 119-121.
Mridha, M. A., J. M. Nasiruddin and S. B. Siddique. 1991. Tiller separation on yield and
area covered in rice. Proc. of the 16th Ann. BAAS conf. held on 5-7 July 1991,
Dhaka. P. 67.
Paul, S. K., M. A. R. Sarkar and M. Ahmed. 2002. Effect of row arrangement and tiller
separation on the yield and yield components of transplant aman rice. Pakistan J.
Agron. 1(1): 9-11.
Sarkar, M. A. R., S. K. Paul and M. A. Hossain. 2011. Effect of row arrangement, age of
tiller seedlings and number of tiller seedlings hill-1 on performance of transplant
aman rice. The J. Agric. Sci. 6(2): 59-68.
Sharma, A. R. 1994. Stand establishment practices affect performance of intermediate
deep water rice. Intl. Rice Res. Notes. 19(3): 26-27.
Siddique, S. B., M. A. Mazid, M. A. Mannan, K. U. Ahmed, M. A. Jabber, A. J. Mridha,
M. G. Ali, A. A. Chowdhury, B. C. Roy, M. A. Hafiz, J. C. Biswas and M.S. Islam.
1991. Cultural practices for modern rice cultivation under low land ecosystems.
Proceedings of workshop on experiences with modern rice cultivation in Bangladesh
held in 23-25 April, 1991 at BRRI, Gazipur.
Singh, S. P. and M. P. Singh. 1997. Response of dwarf rice cv. Jaya to different rates,
methods and forms of urea materials. Environ. And Ecol. 15(3) 612-613.

ISSN 0258-7122
Bangladesh J. Agril. Res. 40(4): 591-600, December 2015
EFFECT OF PLANT GROWTH REGULATORS ON FLOWER AND
BULB PRODUCTION OF HIPPEASTRUM (Hippeastrum hybridum Hort.)
M. K. JAMIL1, M. MIZANUR RAHMAN2, M. MOFAZZAL HOSSAIN3
M. TOFAZZAL HOSSAIN4, AND A. J. M. SIRAJUL KARIM5
Abstract
The experiment was conducted at the Horticultural research field of
Bangabandhu Sheikh Mujibur Rahman Agricultural University, Salna, Gazipur
during October 2008 to July 2009 to investigate the effect of plant growth
regulators on flower and bulb production of Hippeastrum. There were ten
treatments comprising of three concentrations of three growth regulators viz.,
IAA (20, 60 and 100 ppm), ethrel (100, 300 and 500 ppm) and GA3 (100, 300
and 500 ppm) along with control (soaked in water). The experiment was laid out
in a Randomized Complete Block Design (RCBD) with three replications.
Flower and bulb characteristics of Hippeastrum were influenced significantly by
different levels of growth regulators. Application of IAA at 60 and 100 ppm and
GA3 at 100, 300 or 500 ppm twice as foliar spray at an interval of 30 days
promoted the number of bulblets on the treated plants. Ethrel at a concentration
of 100 ppm increased the number of flowers per scape (4) and showed earliness
in days to flower scape emergence (72.33 days) and first flower open (88.67
days). On the other hand, the biggest size of flower (15.14 cm x 12.44 cm) and
flower scape (40.28 cm x 21.95cm) at harvest and the maximum days for
flowering (11.50 days) were evident from plants treated with 500 ppm GA3. The
highest number of bulblets per plot (40.00), bulbs weight per plot (4056 g) along
with bulb yield (40.56 t/ha) were also obtained in GA3 at 500 ppm.
Keywords: Hippeastrum, indole-acetic acid (IAA), 2-chloroethylphosphonic acid (Ethrel), gibberrellic acid (GA3), Hippeastrum flower and bulb yield.
Introduction
Hippeastrum (Hippeastrum hybridum Hort.) is an important ornamental bulbous plant used as cut flowers because of their large size, attractive colour, and good
keeping quality. In Bangladesh, the agro-ecological conditions are very conducive for the survival and culture of Hippeastrum. It has great potential for local as well as export market.
Ornamental crops like Hippeastrum find extensive use of growth regulators for modifying their developmental processes. The major areas where growth regulators have successfully played their roles in ornamental plants are in
vegetative propagation, inhibition of abscission, prevention of bud dormancy,
1Senior Scientific Officer, Biotechnology Division, Bangladesh Agricultural Research
Institute (BARI), Gazipur, 2&3Professor, Department of Horticulture, Bangabandhu
Sheikh Mujibur Rahman Agricultural University (BSMRAU), 4Professor, Department of
Crop Botany, BSMRAU, 5Professor, Department of Soil Science, BSMRAU, Salna,
Gazipur, Bangladesh.

592 JAMIL et al.
growth control, promotion of flowering, prolonging the vase life of flowers and retarding their senescence (Murti and Upreti, 1995).
Growth and flowering of Hippeastrum is influenced by several factors. Among the various external factors, growth regulators play an important role in developmental process of the plants. There are only a few floricultural crops on which growth regulators were applied for the purpose of enhancing growth. The gibberrelic acid (GA3) has been of considerable use for growth promotion. The cases in which growth promotion by growth regulators would be helpful are
those where environmental factors delay or inhibit growth or where problems are encountered due to excessive application of retardants.
Application of growth regulators was found to improve the growth and flowering
of Hippeastrum. Bhattacharjee (1983a) reported that treatment with GA3 at 10 ppm markedly improved the flower production of lily (Lilium tigrinum, Ker-Gawl). Naphthalene acetic acid (NAA) at 100 ppm and GA3 at 100 or 200 ppm induced early flowering in Lilium longiflorum whereas NAA at 200 ppm and GA3 at 200 ppm markedly increased flower production as reported by Pal and
Das (1990). In an experiment with growth regulators on Asiatic hybrid lily, Dantuluri et al. (2002) found that GA3 at 200 ppm produced the tallest plants and GA3 at 200 ppm exhibited earliest bud formation and flowering. Spraying with 2-chloro ethylphosphonic acid (ethrel) at 1000-4000 ppm, 1-3 times has been found to hasten the flower induction in Golden Shower Oncidium (Bose et al., 1999).
Soaking of Hippeastrum bulbs in three concentrations each of Indole acetic acid (IAA), GA3, Chlorocholine chloride (CCC) and ethrel showed various responses on growth and flowering. IAA increased the weight and number of bulblets while GA3 enhanced the flower diameter and bulb weight. Application of IAA at 100 ppm and GA3 at 10, 100 or 1000 ppm twice as foliar spray at an interval of 15 days promoted the number of bulbs on the treated plants while ethrel increased the weight of bulblets. All concentrations of IAA and GA3 increased the number and size of flowers as reported by Bose et al. (1980). Bhattacharjee (1983b) concluded that ethrel had beneficial effect on bulb formation. Application of IAA and GA3 each at 10 to 1000 ppm also promoted vegetative growth, induced early flowering, increased flower size and stalk length, enhanced the number of flower per stalk, extended flower longevity, improved number, size and weight of bulb. Information regarding the use of plant growth regulators on flower and bulb production of Hippeastrum in Bangladesh is very scanty. Keeping these views in mind, the present investigation was undertaken to study the effect of IAA, ethrel and GA3 on flower and bulb production of Hippeastrum.
Materials and Method
The experiment was carried out at the Horticultural research farm of Bangabandhu Sheikh Mujibur Rahman Agricultural University, Salna, Gazipur during October
2008 to July 2009. The experiment was laid out in a Randomized Complete Block Design (RCBD) having ten concentrations of growth regulators viz., T1 = 20 ppm

EFFECT OF PLANT GROWTH REGULATORS ON FLOWER AND BULB 593
IAA, T2 = 60 ppm IAA, T3 = 100 ppm IAA, T4 = 100 ppm ethrel, T5 = 300 ppm ethrel, T6 = 500 ppm ethrel, T7 = 100 ppm GA3, T8 = 300 ppm GA3, T9 = 500 ppm
GA3 and T10 = Control (soaked in water) with three replications. The experimental field was first disc-ploughed and harrowed. Final land preparation was done by a power tiller followed by leveling with scrapper. Clods were broken and weeds were removed from the field to obtain desirable tilth. Irrigation and drainage channels were made around the block. There were 30 (10 x 3) unit plots; each measuring 1 m x 1.5 m with 15 cm raised bed to prevent the bulbs from fungal
disease caused by water logging. The plots were separated from one another by 1 m spaces. Bulb to bulb distance 25 cm and row to row distance 50 cm were maintained which constituted 12 plants per plot. Total 360 (30 x 12) bulbs were used for different treatments in the experiment. Uniform sized (5 cm in diameter) bulbs were collected from the field and kept two weeks for curing. Curing is a drying process intended to dry off the necks and outer scale leaves of the bulbs to
prevent the loss of moisture and the attack by decay during storage. After harvesting when the bulbs were matured as indicated by yellowing and drying of leaves, the bulbs were dug out and tops were cut down. Then the bulbs were stored in trays and kept in a cool room (130 C). Selected bulbs were cleaned carefully by removing the roots, leaves and dry scales by using a sharp knife which was sterilized to avoid spread of diseases. Selected bulbs were soaked for 24 hours in
different concentrations of IAA, ethrel and GA3 solution and also in water as per the treatment schedule. After soaking, the treated bulbs were wrapped in tissue paper and immediately planted in the field. The crop was fertilized with Cow dung = 10t/ha, Urea = 200 kg/ha, TSP = 400 kg/ha and MP = 200 kg/ha (Jana and Bose, 1980). Total amount of cow dung, TSP and MP were applied at the time of final land preparation. Urea 200 kg/ha was applied in two equal installments of 30 and
60 days after emergence which was followed by irrigation. Cultural operations such as irrigating the crop at different growth stages, weeding and pest and disease control measures were taken as and when necessary. The scape of the flower was cut when the buds were fully elongated. Harvesting of scape was done early in the morning and the stalks were placed in water. Diameter of mother bulb and bulblets were measured after curing of bulb. Necessary data on different characters were
recorded and analyzed statistically using MSTAT- C program to find out the variation among the treatments by F-test. Treatment means were compared by Duncan’s Multiple Range Test (DMRT) for interpretation of results (Gomez and Gomez, 1984).
Results and Discussion
The results obtained in the study have been described and discussed along with
tables and figures.
Days to first flower scape emergence
Days to flower scape emergence of Hippeastrum was significantly influenced by different growth regulators (Table 1). From the table it can be revealed that first

594 JAMIL et al.
flower scape emergence (72.33 days) commenced the earliest with ethrel at 100 ppm while late (93.67 days) in plants with control. This is in agreement with the
findings of Bose et al. (1999) who reported that spraying with ethrel at 1000-4000 ppm, 1-3 times at intervals, has been found to hasten the flower induction in Golden Shower Oncidium. In this connection a little bit different results were found by Dhiman (1997) where earlier flowering in Lilium hybrids (115.50 and 120.20 days) was observed with GA3 at 100 ppm. Pal and Das (1990) also reported that NAA (100 ppm) and GA3 (100 or 200 ppm) induced early flowering
in Lilium longiflorum.
Days to first flower open
Different growth regulators was found to influence significantly the days to first flower open of Hippeastrum (Table 1). It can be revealed that days to first flower open was the earliest (88.67 days) in plants treated with ethrel at 100 ppm which was closely followed by ethrel at 300 ppm. The control plants took the longest period (113.40 days) for first flower open. This result is supported by Bose et al. (1999) who reported that spraying with ethrel at 1000-4000 ppm, 1-3 times at
intervals, hastened the flower induction in Golden Shower Oncidium.
Flower scape per plant
Flower scape per plant of Hippeastrum was counted at the time of flower scape harvest. Significant variation was not found in flower scape per plant due to different growth regulators (Table 1). However, the highest flower scape per plant (2.00) was produced in ethrel at 500 ppm treated plant and the lowest (1.00) in control and IAA at 20 ppm.
Flowers per scape
The effect of different growth regulators showed significant influence on flowers per scape of Hippeastrum (Table 1). The maximum flowers per scape (4.00) was
recorded in plants treated with ethrel at 100 ppm and the control plants produced the minimum (2.44). The result is in agreement with the report of Sujatha et al. (2002) and Karaguzel et al. (1999) who stated that the number of flowers per plant increased with different growth regulators. Similar trend in flowers per scape of Hippeastrum was also reported by Bose et al. (1980).
Length of flower
Length of flower of Hippeastrum was significantly influenced by different
growth regulators (Fig. 1). However, the highest length of flower (15.14 cm) was recorded from plants treated with GA3 at 500 ppm. The lowest value for flower length (12.24 cm) was noted in control. This might be due to the fact that GA3 treated plant produced more number of leaves compared to control and other treatments, which might have resulted in production and accumulation of more
photosynthates that were diverted to flowers resulting in longer and larger size flower. The findings are in agreement with those of Pal and Choudhury (1998)

EFFECT OF PLANT GROWTH REGULATORS ON FLOWER AND BULB 595
who found that GA3 at 100 ppm significantly increased leaf area, induced early appearance of flower spike, highest number of florets/spike and largest individual
florets in gladiolus cv. Hunting Song. Prakash and Jha (1998) also observed that application of GA3 at 150 ppm improved all the floral traits (time of flowering, inflorescence length, spike length, floret length and number of florets/spike) in gladiolus, cv. Friendship.
Table 1. Effect of plant growth regulators on flowering characteristics of
Hippeastrum.
Treatment Days to flower
scape emergence
Days to first
flower open
Flower scape
per plant
Flowers per
scape
IAA
20 ppm (T1) 91.00 ab 109.6 b 1.00 3.06 bc
60 ppm (T2) 90.00 ab 105.9 c 1.06 3.42 ab
100 ppm (T3) 88.67 bc 104.3 c 1.17 3.39 ab
Ethrel
100 ppm (T4) 72.33 e 88.67 h 1.11 4.00 a
300 ppm (T5) 84.33 d 92.28 g 1.22 3.28 ab
500 ppm (T6) 85.33 cd 95.83 f 2.00 3.06 bc
GA3
100 ppm (T7) 93.33 a 102.1 d 1.28 3.45 ab
300 ppm (T8) 92.67 ab 99.22 e 1.28 3.45 ab
500 ppm (T9) 91.00 ab 95.11 f 1.28 3.72 ab
Control (T10) 93.67 a 113.4 a 1.00 2.44 c
Level of significance ** ** ns **
CV(%) 2.34 1.52 11.98 6.22
Means having same letter(s) in a column are not significantly different by DMRT. **
indicates significant at 1% level.
Diameter of flower
A significant variation in the diameter of flower of Hippeastrum was observed due to the effect of different growth regulators (Fig. 1). GA3 at 500 ppm showed the maximum diameter of flower (12.44 cm) which was statistically similar with that of plants treated with ethrel at 500 ppm and the control plants produced the
narrowest flower (10.89 cm). This might be due to the fact that GA3 treated plant produced more food that was diverted to only a fewer sink and hence bigger flowers were produced. Similar result is reported by Bose et al. (1980) who studied the effect of growth regulators on the growth and flowering in Hippeastrum. Sujatha et al. (2002) found that foliar application of 100 ppm GA3 at monthly interval from January to May was the best for obtaining best growth
of plants, maximum number of cut blooms with stalk length as well as flower size in gerbera.

596 JAMIL et al.
Fig. 1. Effect of growth regulators on flower length and diameter of
Hippeastrum.
T1 = 20 ppm IAA T4 = 100 ppm Ethrel T7 = 100 ppm GA3
T2 = 60 ppm IAA T5 = 300 ppm Ethrel T8 = 300 ppm GA3
T3 = 100 ppm IAA T6 = 500 ppm Ethrel T9 = 500 ppm GA3 and
T10 = Control (soaked in water)
Flower scape length
Flower scape length of Hippeastrum was measured at the time of harvest. It was observed that flower scape length was significantly influenced by different growth regulators (Fig. 2). The longest flower scape (40.28 cm) was recorded
from GA3 at 500 ppm and the shortest (29.60 cm) was produced by control plants. This might be due to the fact that gibberrellic acids promote cell division and cell enlargement which ultimately resulted in longer flower scape. Similar results were reported by Karaguzel et al. (1999), Pal and Choudhury (1998) in gladiolus at 100 ppm GA3, and Prakash and Jha (1998) in gladiolus at 150 ppm GA3.
Flower scape diameter
Different growth regulators exhibited significant variation on flower scape diameter of Hippeastrum (Fig. 2). The maximum value for flower scape diameter (21.95 cm) was obtained from plants treated with GA3 at 500 ppm and the minimum (17.09 cm) from control plants. This might be due to that the highest concentration of GA3 enhanced plant growth which increased the diameter of
flower scape. This is in line with the findings of Karaguzel et al. (1999) in gladiolus. They found that soaking of corms at 100 ppm GA3 for one hour increased the length of flower stem and spikes, the number of flowers per spike and the diameter of flower stem.

EFFECT OF PLANT GROWTH REGULATORS ON FLOWER AND BULB 597
Fig. 2. Effect of growth regulators on flower scape length and diameter of
Hippeastrum at harvest.
T1 = 20 ppm IAA T4 = 100 ppm Ethrel T7 = 100 ppm GA3
T2 = 60 ppm IAA T5 = 300 ppm Ethrel T8 = 300 ppm GA3
T3 = 100 ppm IAA T6 = 500 ppm Ethrel T9 = 500 ppm GA3 and
T10 = Control (soaked in water)
Fig. 3. Effect of growth regulators on flowering duration of Hippeastrum.
T1 = 20 ppm IAA T4 = 100 ppm Ethrel T7 = 100 ppm GA3
T2 = 60 ppm IAA T5 = 300 ppm Ethrel T8 = 300 ppm GA3
T3 = 100 ppm IAA T6 = 500 ppm Ethrel T9 = 500 ppm GA3 and
T10 = Control (soaked in water)
Flowering duration
Significant influence was observed on flowering duration of Hippeastrum by different growth regulators (Fig. 3). The maximum duration of flowering (11.50 days) was observed in T9 (i.e. 500 ppm GA3) while the minimum (6.70 days) was in control. The increased flowering duration could be attributed to the higher root

598 JAMIL et al.
development by GA3 and increased the efficiency of manufacturing carbohydrate which maintained the freshness of flower for longer time. Similar findings were
reported by Verma et al. (1995) that a single foliar spray of GA3 (100 and 200 ppm) in chrysanthemum enhanced vegetative growth and flowering. Application of 40 ppm GA3 produced spikes having the longest (16.20 days) life in the field (Pal and Chowdhury, 1998).
Bulblets per plot
Number of bulblets per plot of Hippeastrum was counted after digging out of
bulb. It was observed that different growth regulators significantly influenced the bulblets per plot (Table 2). The maximum number of bulblets per plot (40.00) was obtained from GA3 at 500 ppm and the minimum (24.00) from control. This result is in full agreement with that of Bose et al. (1980). They reported that GA3 at 10, 100 or 1000 mg l−1 twice as foliar spray at an interval of 30 days promoted the number of bulblets of the treated plants.
Table 2. Effect of plant growth regulators on bulb characteristics of Hippeastrum.
Treatment Bulblets/plot Bulb diameter (mm) Bulb yield/plot
(g) Mother bulb Bulblets
IAA
20 ppm (T1) 30.67 cd 68.14 b-e 28.67 bcd 3091 f
60 ppm (T2) 36.00 abc 70.17 a-d 30.27 ab 3138 e
100 ppm (T3) 38.67 ab 72.63 ab 32.48 a 3458 d
Ethrel
100 ppm (T4) 29.33 cd 64.19 ef 26.35 cd 2879 h
300 ppm (T5) 30.67 cd 65.14 def 27.35 bcd 2898 g
500 ppm (T6) 32.00 bc 66.75 c-f 28.35 bcd 2902 g
GA3
100 ppm (T7) 34.67 abc 70.64 abc 29.71 abc 3615 c
300 ppm (T8) 38.67 ab 72.34 ab 32.39 a 3927 b
500 ppm (T9) 40.00 a 75.49 a 32.99 a 4056 a
Control (T10) 24.00 d 62.17 f 25.21 d 2639 i
Level of significance ** ** ** **
CV% 7.52 2.72 4.22 16.35
Means having same letter(s) and without letters in a column are not significant by
DMRT. ** indicates significant at 1% level.
Bulb diameter
Highly significant variation in diameter of bulb due to different growth regulators was found in this study (Table 2). However, the highest value for bulb diameter (75.49 mm) in case of mother bulb was recorded from GA3 at 500 ppm and the lowest (62.17 mm) was found in control. Similar trend was also found in case of bulblets diameter. Gibberellin might accelerated cell division and cell elongation which lead to increased elongation of root (Stewart and Jones, 1977). Thus, it

EFFECT OF PLANT GROWTH REGULATORS ON FLOWER AND BULB 599
enhanced the diameter of bulbs. The results are in partial agreement with Biswas et al. (1982) who reported that GA3 at 100 ppm produced the highest diameter of bulb in tuberose.
Bulb yield per plot
The effect of different growth regulators on bulb yield per plot was found significant (Table 2). The maximum bulb yield (4056 g) was obtained from GA3 at 500 ppm and the minimum (2639 g) from control. This may be due to that GA3 enhanced better growth of bulbs and consequently produced the higher bulb yield per plot. These results are in conformity with the findings reported by Umrao et al. (2007) where they found increased weight of corm for treating with GA3. A similar result was also reported by Bose et al. (1980) in Hippeastrum.
Bulb yield per hectare
Bulb yield per hectare of Hippeastrum varied significantly due to the influence of different growth regulators (Fig. 4). From the figure it can be revealed that the highest bulb yield (40.56 t/ha) was recorded in T9 while the lowest (26.39 t/ha) in control. This finding is in full agreement with that of Bose et al. (1980) who reported that GA3 enhanced the flower diameter and bulb yield of Hippeastrum.
Fig. 4. Effect of growth regulators on bulbs yield (t/ha) of Hippeastrum.
T1 = 20 ppm IAA T4 = 100 ppm Ethrel T7 = 100 ppm GA3
T2 = 60 ppm IAA T5 = 300 ppm Ethrel T8 = 300 ppm GA3
T3 = 100 ppm IAA T6 = 500 ppm Ethrel T9 = 500 ppm GA3 and
T10 = Control (soaked in water)
Conclusion
Based on the above discussion, it can be concluded that the plant growth regulators has significant effect on flower and bulb production of Hippeastrum. Bulbs treated with ethrel at 100 ppm enhanced early emergence of flower scape and flowering, maximum flowers per scape while GA3 at 500 ppm performed

600 JAMIL et al.
better for bigger size flower and flower scape, flowering duration and bulb production of Hippeastrum.
References:
Bhattacharjee, S.K. 1983(a). Response of Lilium tigrinum Ker-Gawl (tiger lily) to soil drench application of growth regulating chemicals. Progressive Agriculture. 15: 204-209.
Bhattacharjee, S.K. 1983(b). Influence of growth regulating chemicals on Hippeastrum hybridum Hort. Gardens Bulletin, Singapore. 30: 237-240.
Biswas, J., T.K. Bose and R.G. Matti. 1982. Effect of growth substances on growth and flowering of tuberose (Polianthes tuberose Lin.). South Indian Hort. 31(2): 129-132.
Bose,T.K., B.K. Jana, and T.P. Mukhopadhyay. 1980. Effect of growth regulators on growth and flowering of Hippeastrum hybridum. Scientia Horticulturae. 12: 195-200.
Bose,T.K., R.G. Maiti, R.S. Dhua and P. Das. 1999. Gerbera. Floriculture and Landscaping. Ist ed. Nayaprokash, Calcutta, India. pp. 530-537.
Dantuluri, V.S.R., R.L. Misra (ed.), Sanyat-Misra. 2002. Effect of growth regulating chemicals on Asiatic hybrid lily. Floriculture research trend in India. Proceedings of the national symposium on Indian floriculture in the new millennium, Lal-Bagh, Bangalore, 25-27 February, 2002. 147-149.
Dhiman, M.R. 1997. Effect of cold storage temperature and plant bio-regulators on growth and flower production in Lilium hybrids. M.Sc. thesis, Department of Floriculture and Landscape Architecture. Dr. Yashwant Singh Parmar University of Horticulture & Forestry, Nauni, Solan, India, pp. 20-55.
Gomez, K.A. and A.A. Gomez. 1984. Statistical Procedures for Agricultural Research (2nd edition). Int. Rice Res. Inst. John Wiley and Sons publication, New York. pp. 28-192.
Jana, B.K. and T.K. Bose. 1980. Effect of fertilizers on growth and flowering of Hippeastrum. Indian Agric. 24: 23-30.
Karaguzel, O., S. Alian., I. Doran and Z. Sogut. 1999. Improvement of gladiolus by growth regulator and nutrient management. J. Japanese Soc. Hort. Sci. 68: 168-175.
Murti, G.S.R. and K.K. Upreti, 1995. Advances in Horticulture – Ornamental Plants. In: Use of growth regulators in ornamental plants. Eds. K.L.Chadha and S.K. Bhattacharjee. Malhotra Publishing House, New Delhi-110064, India. 12: 863.
Pal, A.K. and S.N. Das, 1990. Effect of growth regulators on growth and flowering of Lilium longiflorum. Orissa J. Horticulture. 18: 18-21.
Pal, P. and T. Chowdhury. 1998. Elongation of flowering by GA3. Hort. J. 11: 69-77.
Prakash, V. and K.K. Jha. 1998. Physiology of gladiolus. J. Applied Biol. 8: 24-28.
Stewart, D.A. and R.I. Jones. 1977. The role of extensibility and turgor in gibberellins and dark stimulated growth. Plant Physiology. 59: 61-68.
Sujatha, A., I. Nair, V. Singh and T.V.R.S. Sharma. 2002. Effect of plant growth regulators on yield and quality of gerbera under Bay Island conditions. Indian J. Hort. 59 (1): 100-105.
Umrao, Vijai. K., R.P. Singh and A.R.Singh. 2007. Effect of gibberellic acid and growing media on vegetative and floral attributes of gladiolus. Indian J. Hort. 64 (1): 73-76.
Verma, S.C., M.M. Haider, M.A. Kher and A.S. Murty. 1995. A note on the influence of gibberellic acid (GA3) and ascorbic acid on stem length and blooming in chrysanthemum cv. Cotton Ball. J. Ornamental Hort. 3 (1-3): 30-31.

ISSN 0258-7122
Bangladesh J. Agril. Res. 40(4): 601-606, December 2015
EFFECT OF BAP AND SUCROSE ON THE DEVELOPMENT OF
CORMEL IN MUKHI KACHU
M. K. R. BHUIYAN1, S. M. SHARIFUZZAMAN2 AND M. J. HOSSAIN3
Abstract
In vitro cormel development in Mukhi Kachu (Colocasia esculenta) Var. Bilashi
was assessed in an experiment using three levels of BAP (0, 5 and 10 mg/l) and
four levels of sucrose (0, 5, 10 and 15 %). Individual shoot excised from
multiple shoot was used as explant in this experiment. In vitro cormel formation
of Colocasia is an important means of organogenesis, which initiated earlier
with 10% sucrose in 15% culture, whereas 15% sucrose produced cormels in
50% culture. While BAP at 10 mg/l formed cormels in 32.5% cultures but these
two factors together formed cormels in 85% cultures, having 2.5 cormel per
culture. The cormel weighed upto 1.7 g and contained 81.5% dry matter.
Keywords: Mukhi Kachu, BAP, Sucrose, Cormel development.
Introduction
Mukhi Kachu (Colocasia esculenta) is known as taro, cocoyam, eddoe and
dasheen in different places and used as an important vegetable in various parts of
the tropics (Denham et al., 2003). In Bangladesh, it comes to market as an
important summer vegetable when most of the vegetable are not available. It is
grown in high land and covering an area of 23,897 ha of land and production
236217 tones (Annon, 2012). Nutritionally, this crop is very rich in iron and
yield potentially of this crop is 30-32 tons per hectare (Rashid, 1990).
The variety Bilashi produces corm and cormels which are the propagating
materials but this cormels are also an important summer vegetables in
Bangladesh. The major part of this crop is generally used as vegetable keeping a
very small portion as seed. As cormels are used as planting materials in mukhi
kachu and seed cormel supply is a limiting factor, propagation of cormels in in
vitro can speed up the seed production program. In vitro cormels can be produced
year round and can be used as a basic material for quality seed production in the
country (Chandra et al., 1988; Rahim and Alamgir, 1995).
In vitro tuberization of potato has been studied by many authors (Wang and Hu,
1982; Tover et al., 1985; Pelacho and Mingo- Castel, 1991; Chandra et al., 1992;
Zakaria, 2003). But reports on taro are very scarce though these two crops are
identical (Zhou et al., 1999). The first report on taro micro-propagation was by
Yamamoto and Matsumoto (1992), who induced in vitro cormels after adding 8
1Principle Scientific Officer, TCRC, Bangladesh Agricultural Research Institute (BARI),
Gazipur, 2Principle Scientific Officer, Floriculture Division, HRC, BARI, Gazipur, 3Director, TCRC, BARI, Gazipur, Bangladesh.

602 BHUIYAN et al.
% sucrose in MS liquid medium. Many authors reported that Sucrose (Yamamoto
and Matsumoto, 1992; Zhou et al., 1999) and Benzyl adenine (Zhou et al., 1999)
are responsible for in vitro cormel production in taro. However, the work on in
vitro cormel induction of taro is very scanty in abroad and there is no report in
our country. Therefore, to develop cormels in in vitro plantlets, the present
investigation has been under taken.
Materials and Method
The experiment was conducted at the tissue culture laboratory of the Tuber Crops
Research Centre (TCRC), BARI, Joydebpur, Gazipur. Well sprouted cormels of
Mukhi Kachu variety ``Bilashi’’ was used. The cormels were cut into small size
with approximate 2.0 cm long sprout and were disinfected following the method
as described by Hossain et al. (1998). This small size sprout was put in to test
tube containing multiple shoot inducing MS media. Individual shoots were
excised from multiple shoot and cultured in this experiment for cormel
production.
Basic salts of Murashige and Skoog (Murashige and Skoog, 1962) culture media
were used. In order to induce cormels in detached multiple shoots, three levels of
BAP (0, 5 and 10 mg/l) and four levels of sucrose (0, 5, 10 and 15%) were used
in this experiment. Individual shoots were excised from multiple shoot and
multiplied. Shoots were inoculated into MS agar-solidified medium without
growth regulators and grew for 25 DAC (Days after culture) before placing into
corm induction medium. The cultures were maintained in a growth chamber at 22
10c with a 16 h photoperiod, and a photosynthetic photon flux of 3000 lux was
provided by white fluorescent lamps.
Shoots cultured in in vitro multiplication medium were cut off (3-5 cm high)
above the roots and transplanted into culture vessels with MS (Murashige and
Skoog, 1962) liquid medium, which was supplemented with sucrose and BAP
according to the treatment. Cultures were maintained under light (16 h
photoperiod). The number of DAC (days after culture) required for in vitro
cormel induction was recorded as swelling of cormel was visible. The average
number and weight was counted and recorded at harvest. The experiment was set
in a Complete Randomized Design (CRD), replicated thrice. Each replication
included three tubes. Data were analyzed following DMRT at 1% level of
probability.
Results and Discussion
Effect of sucrose
Results of cormel formation with sucrose is presented in Table 1. Cormel
formation did not occurred up to 5 % sucrose and the highest percentage of

EFFECT OF BAP AND SUCROSE ON THE DEVELOPMENT OF CORMEL 603
cormel (50.0) formed with 15 % sucrose. Cormel first appeared at 10 % sucrose
after 12.5 DAC (days after culture) and it was 22.5 DAC for 15 % sucrose, which
produced higher number of cormel per culture (1.5) than that with 10 % sucrose
(0.3). The size of cormel was 0.4 cm in diameter, which on weight basis was 1.1
mg at 15 % sucrose. There values for 10 % sucrose were 0.2 cm and 0.5 mg,
respectively. The DM % was highly varied over sucrose percentage; it was 22.5
% and 51.7 % for 10 and 15 % sucrose, respectively. In an experiment Zhou
et al. (1999) found that 5-10% sucrose promoted corm formation. They reported
that 15 % sucrose inhibited cormel formation. But in the present study 10-15 %
sucrose promoted cormel formation. Zhou et al. (1999) used a diploid type
variety which was quite different from that was used in the present study (a
triploid type variety).
Table 1. Main effect of sucrose on cormel induction and other parameters.
Sucrose
(%)
Cormel
formed/
culture (%)
DAC to
Cormel
formation
Number of
cormels /
culture
Wt. of
cormel
(g)
Dia. of
cormel
(cm)
DM (%) of
cormel
0 0.0 c 0.0 c 0.0 c 0.0 c 0.0 c 0.0 c
5 0.0 c 0.0 c 0.0 c 0.0 c 0.0 c 0.0 c
10 15.0 (3.9) b 12.5 b 0.3 b 0.5 b 0.2 b 22.5 (2.7) b
15 50.0 (7.1) a 22.5 a 1.5 a 1.1 a 0.4 a 51.7 (5.9) a
Figures in parenthesis indicate square root transformed data. In a column, means
followed by common letters are not significantly different from each other at 1 % of
level of probability by DMRT
Table 2. Main effect of BAP on cormel induction and other parameters.
BAP
(mg/l)
Cormel
formed/culture
(%)
DAC to
cormel
formation
Number of
cormel/
culture
Weight of
cormel (g)
Diameter
of cormel
(cm)
DM (%) of
cormel
0 0.0 c 0.0 c 0.0 c 0.0 c 0.0 c 0.0 c
5 16.3 (4.0) b 8.8 b 0.5 b 0.4 b 0.1 b 18.4 (2.1) b
10 32.5 (5.7) a 17.5 a 0.9 a 0.8 a 0.3 a 37.3 (4.3) a
Figures in parenthesis indicate square root transformed data. In a column, means
followed by common letters are not significantly different from each other at 1 % of level
of probability by DMRT
Detail explanation of the role/ function of sucrose in in vitro cormel formation is not enough in the literature. The question may pose as to whether it performs an osmotic role or purely a nutritional one. It is thought that sucrose dissociates to allow a higher osmotic potential within the cells. Thus the role of sucrose in plant tissue culture media as an osmoticum as well as a carbohydrate source has been
established. Cormel induction may depend on the osmotic stress of a high concentration of sucrose solution. However, developing cormels are sink for sucrose from the culture medium (Zakaria, 2003).

604 BHUIYAN et al.
Effect of BAP
The effect of BAP on cormel formation is shown in Table 2. No cormel was
formed in the control. The highest (32.5%) cormel formed with BAP 10 mg/l.
Whereas, it appeared first with 5 mg/l BAP after 8.8 DAC, whereas 10 mg/l BAP
took 17.5 DAC. The number of cormel was 0.5 with 5 mg/l BAP, which
increased to 0.9 with 10 mg/l BAP. The size of cormel was bigger for 10 mg/l
BAP (0.3 cm in diameter) compared to 0.1 cm diameter for 5 mg/l. These values
on weight basis were 0.8 and 0.4 mg, respectively. The DM % was higher for
larger cormel (37.3) than smaller cormel (18.3). Cytokinins or BAP are believed
to have strong promotive effects on cormel formation (Zakaria, 2003). The
results are in agreement with the findings of many scientists ( Priyakumari and
Sheela, 2005 and Zhou et al., 1999).
Table 3. Combined effect of sucrose and BAP on cormel induction and other
parameters
Treatment Cormel
formed/
culture (%)
DAC to
Cormel
formation
Number
of cormel
/culture
Wt. of
cormel
(g)
Dia. of
cormel
(cm)
DM (%) of
cormel Sucrose
(%)
BAP
(mg/l)
0 0 0.0 d 0.0 c 0.0 d 0.0 d 0.0 c 0.0 d
5 0.0 d 0.0 c 0.0 d 0.0 d 0.0 c 0.0 d
10 0.0 d 0.0 c 0.0 d 0.0 d 0.0 c 0.0 d
5 0 0.0 d 0.0 c 0.0 d 0.0 d 0.0 c 0.0 d
5 0.0 d 0.0 c 0.0 d 0.0 d 0.0 c 0.0 d
10 0.0 d 0.0 c 0.0 d 0.0 d 0.0 c 0.0 d
10 0 0.0 d 0.0 c 0.0 d 0.0 d 0.0 c 0.0 d
5 0.0 d 0.0 c 0.0 d 0.0 d 0.0 c 0.0 d
10 45.0 (6.7) c 37.5 a 1.0 c 1.4 c 0.5 b 67.5 (8.2) c
15 0 0.0 d 0.0 c 0.0 d 0.0 d 0.0 c 0.0 d
5 65.0 (8.1) b 35.0 ab 2.0 b 1.5 b 0.6 a 73.5 (8.6) b
10 85.0 (9.2) a 32.5 b 2.5 a 1.7 a 0.7 a 81.5 (9.1) a
Figures in parenthesis indicate square root transformed data. In a column, means
followed by common letters are not significantly different from each other at 1 % of level
of probability by DMRT.
For several reasons, cytokinin has often been considered to be a major
importance in cormel development process. Firstly, cytokinins are known to
stimulate cell division (Skoog and Miller, 1957); secondly, there are indications
that it inhibits cell elongation, while promoting cell expansion (Scott and
Liverman, 1956). These phenomenon are required for cormel formation and
development.

EFFECT OF BAP AND SUCROSE ON THE DEVELOPMENT OF CORMEL 605
Combined effect of BAP and sucrose
The combined result of BAP and sucrose for cormel formation is presented in
Table 3. Cormel formation did not occurred in most of the treatments except 10
mg/l BAP + 10% sucrose (45.0%), 5 mg/l BAP + 15% sucrose (65.0%) and 10
mg/l BAP + 15% sucrose (85.0%). The cormel formation was the earliest (32.5
DAC) in 10 mg/l BAP + 15% sucrose, which was followed by 5mg/l BAP + 15%
sucrose (35.0 DAC). The maximum cormel was obtained from 10 mg/l BAP +
15% sucrose (2.5) (Fig. 1a) and the minimum was with 10 mg/l BAP + 10%
sucrose (Fig. 1b). The size of cormel was the highest with 10 mg/l BAP + 15%
sucrose (0.7 cm diameter), which on weight basis was 1.7 mg. The DM % was
also higher for larger cormel (81.5). The detached cormels were shown in Fig.
1c. These results suggested that medium components are essential for cormel
formation. In this experiment BAP and sucrose both promoted cormel formation,
which is in accordance with previous work on potato (Ivan et al., 1995; Khuri
and Moorby, 1996) and on taro (Zhou et al., 1999).
Fig. 1. (a-c) : Cormel production in Mukhi Kachu (a) (sucrose 15% + BAP 10 mg/l)
(b) (sucrose 10% + BAP 10 mg/l) (c) Detached cormels ready for planting in
Mukhi Kachu.
References
Anonymous. 2012. Year book Agricultural statistics of Bangladesh. Bangladesh Bureau of Statistics. P. 99.
Chandra, R., J. H. Dodds and P. Tovar. 1988. In vitro tuberisation in potato. Newslet. Intl. Assoc. Plant Tissue Cult. 55: 10-12.
Chandra, R., G. R. Randhawa, D. R. Chaudhari and M. D. Upadhya. 1992. Efficacy of triazole for in vitro micro-tuber production in potato. Potato Res. 35: 339-341.
Denham, T. P., S. G. Haberle, C. Lentfer, R. Fullagar, J. Field. M. Therin, N. Porch, and B. Winsborough. 2003. Taro cultivation. Origins of Agriculture at Kuk Swamp in the Highlands of New Guinea Science 301: 189-193.
(a) (b) (c)

606 BHUIYAN et al.
Hossain, M. J., M. A. I. Khan and M. A. Hoque. 1998. Effect of IBA and NAA on rooting of potato stem cuttings. J. Indian pot. Assoc. 25(1-2): 53-56.
Ivan, G., M. Jiri, V. Josef, O. Milos, and A. V. O. Henri. 1995. The effect of an elevated cytokinin level using the ipt gene and N6-Benzyladenine on single node and intact potato plant tuberization in vitro. J. Plant Growth Reg. 14: 143-150.
Khuri, S and J. Moorby. 1996. Nodal segments or microtubers as explants for in vitro microtuber production of potato. Plant Cell Tiss. Org. Cult. 45: 215-222.
Murashige, T. and F. Skoog. 1962. A revised medium for rapid growth and bioassays with tobacco tissue cultutres. Physiol. Plant. 15: 473-491.
Pelacho, A. M. and A. M. Mingo-Castel. 1991. Jasmonic acid induces tuberization of potato stolons cultured in vitro. Plant Physiol. 97: 1253-1255.
Priyakumari, I. and V. L. Sheela. 2005. Micropropagation of gladiolus cv. Peach Blossom through enhanced release of auxiliary buds. J. Trop. Agric. 43(1-2): 4750.
Rahim, M .A. and M. Alamgir.1995.Effect of paclobutrazol and gibberellic acid on the growth of late planted Mukhikachu (Colocasia esculenta). Progressive Agriculture 6(1): 39-46.
Rashid, M. M. 1990. Varietal improvement of tuber crops in Bangladesh up to date progress and future possibilities. In: Plant breeding in Bangladesh. Proceed of 1st National symposium held in June 5-7, 1989. Pp. 253-261.
Scott, P. A and J. L. Liverman. 1956. Promotion of leaf expansion by kinetin and benzyl aminopurine, Plant Physiol. 31: 321-322.
Skoog, F. and C. O. Miller. 1957. Chemical regulation of growth and organ formation in plant tissues cultured in vitro. In: Symp. Soc. Expt. 1. Bot. 11: 118-130.
Tovar, P., L. Estrada, Schilde-Rentschler and J. H. Dodds. 1985. Induction of in vitro potato tubers. CIP Circular 13: 1-4.
Wang, P. J. and C. Y. Hu. 1982. In vitro mass tuberization and virus-free seed potato production in Taiwan. American Potato J. 59: 33-37.
Yamamoto, Y and O. Matsumoto, 1992. In vitro corm formation and growth habit of propagated seed corm in taro (Colocasia esculenta Schott.). J. Japan. Soc. Hort. Sci. 61(1): 55-61.
Zakaria, M. 2003. Induction and performance of potato microtuber. PhD Dissertation. Deptt. of Hort. BSMRAU. Salna. Gazipur. 188p.
Zhou, Su. P., Y, K. He and S. J. Li. 1999. Induction and characterization of in vitro corms of diploid taro. Plant Cell, Tissue and Org. Cult. 57: 173-178.

ISSN 0258-7122
Bangladesh J. Agril. Res. 40(4): 607-618, December 2015
VARIABILITY, CORRELATION AND PATH CO-EFFICIENT
ANALYSIS OF BITTER GOURD (Momordica charantia L.)
M. H. KHAN1, S. R. BHUIYAN2, K. C. SAHA3
M. R. BHUYIN4 AND A. S. M. Y. ALI5
Abstract
Seventeen genotypes of bitter gourd (Momordica charantia L.) were studied in a
field experiment conducted at the experimental field of Sher-e-Bangla
Agricultural University, Dhaka, during April 2009 to September 2010. The
objectives of the study were to measure the variability among the genotypes for
yield and yield contributing characters, estimate genetic parameters, association
among the characters and their contribution to yield. There was a great deal of
significant variation for all the characters among the genotypes. Considering
genetic parameters high genotypic co-efficient of variation (GCV) was observed
for branches per vine, yield per plant and number of fruit per plant whereas low
genotypic co-efficient of variation (GCV) was observed for days to first male
and female flowering. In all the cases, it was found that phenotypic co-efficient
of variation was greater than genotypic co-efficient of variation. Highest
genotypic and phenotypic co-efficient of variation was observed in branch per
vine, fruit length, fruit weight and number of fruit plant which indicated a wide
variability among the genotypes and offered better scope of selection. The
results obtained showed that fruit length showed low direct and positive effect
on yield per plant and indirect positive effect on yield per plant via fruit
diameter and average fruit weight. Similar result was found for fruit diameter.
Average fruit weight and number of fruits per plant showed high direct and
positive effect on yield per plant. Path analysis revealed that average fruit
weight, number of fruits per plant, days to male flowering and fruit length had
positive direct effect on fruit yield. Considering group distance and the
agronomic performance, the inter genotypic crosses between G2& G5;
G2&G14; G14&G15; G2&G15; G10&G11; G10&G13; G11&G13; G5&G15;
G5&G14 might be suitable choice for future hybridization programme.
Introduction
Bitter gourd (Momordica charantia L.), is one of the most important and a
popular cucurbit vegetable grown in Bangladesh. Bitter gourd contains a
reasonable amount of different nutrients such as proteins, carbohydrates, fats,
minerals and vitamins A, B2, and C etc. Raja et al. (1984) reported very high
amount of vitamin C (95mg/100g) and protein (930mg/100g) in some Indian
bitter gourd variety. The fruits are bitter to taste due to the presence of substance
1Scientific Officer (Plant Breeder), ORC, 3-5Scientific Officer, Bangladesh Agricultural
Research Institute (BARI), 2Professor, Dept. of Genetics & Plant Breeding, Sher-e-
Bangla Agricultural University, Dhaka, Bangladesh.

608 KHAN et al.
called cucurbitacin. Bitter gourd is also reported against diseases like paralysis,
indigestion and vomiting pain and diabetes (Mier and Yaniv, 1985). According to
BBS (2009-10) total area of bitter gourd in Bangladesh was 22143 acres, per acre
yield was 1871 kg and production was 41419 M.ton. Bitter gourd may contribute
to the nutritional shortage of the people of Bangladesh. Particularly, it can
provide added proteins, minerals and vitamins to the diet. There are a lot of
variabilities among the existing bitter gourd germplasm of Bangladesh. An
understanding of the nature and magnitude of the variability among the genetic
stocks of bitter gourd is of prime importance for the breeder. A good knowledge
of genetic wealth might also help in identifying desirable cultivars for
commercial production. Because of its nature of high cross pollination, hardly
any genetically pure strain is available to the growers. The basic key to a breeder
is to develop high yielding varieties through selection, either from the genotypes
or from the segregants of a crop. Expression of different plant character is
controlled by genetic and environmental factors. So, the study of genetic
parameters is necessary for a successful breeding program which will provide
valuable information on the mode of inheritance of different characters which
would be useful in selecting plants having desirable characters to develop new
varieties. In a hybridization program knowledge of interrelationship among and
between yield and yield components is necessary. Thus, determination of
correlation between the characters is a matter of considerable importance in
selection. Path analysis partitions the components of correlation co-efficient into
direct and indirect and visualizes the relationship in more meaningful way (Bhatt,
1973). Among the local cultivated varieties, a wide range of genetic variability
exists in this crop which can be exploited for its improvement. The basic key to a
breeder is to develop high yielding varieties through selection, either from the
genotypes or from the segregants of a crop. Expression of different plant
character is controlled by genetic and environmental factors. So, the study of
genetic parameters is necessary for a successful breeding program which will
provide valuable information on the mode of inheritance of different characters
which would be useful in selecting plants desirable characters to develop new
varieties of bitter gourd in the country.
Materials and method
Seventeen genotypes of bitter gourd were used for the present research work. The
genetically pure and physically healthy seeds of these genotypes were collected
from different location. The name and source of collection of these genotypes are
presented in Table 1. The experiment was laid out in Randomized Complete
Block Design (RCBD) with three replications. The genotypes were distributed
into the every plot of each block of the experiment. The individual plot was 3 m
× 1 m in size. The seventeen genotypes of the experiment were assigned at
random into plots of each replication. The distance maintained spacing row to

VARIABILITY, CORRELATION AND PATH CO-EFFICIENT ANALYSIS 609
row 50 cm and plant to plant 2 m. The distance maintained between two blocks
was 1 m. Seeds of different accessions were sown in the pit on 5thMay,
2010.Germination of seeds were completed within twelve days and in each pit
four seeds were sown and the soil around the plant was firmly pressed by hand.
Table 1. Name and sources of seventeen Bitter gourd genotypes used in the present
study.
Sl. No. Genotypes No. Source
1 G1 Siddiq Bazar, Gulistan, Dhaka
2 G2 Siddiq Bazar, Gulistan, Dhaka
3 G3 Narayanganj local market
4 G4 Agargaon local market, Agargaon, Dhaka
5 G5 Siddiq Bazar, Gulistan, Dhaka
6 G6 Agargaon local market, Agargaon, Dhaka
7 G7 Agargaon local market, Agargaon, Dhaka
8 G8 Siddiq Bazar, Gulistan, Dhaka,
9 G9 Narayanganj local market
10 G10 Kawran bazar,Dhaka
11 G11 Kawran bazar,Dhaka
12 G12 Narayanganj local market
13 G13 Agargaon local market, Agargaon, DhAka
14 G14 Siddiq Bazar, Gulistan, Dhaka,
15 G15 Kawran bazar,Dhaka
16 G16 Agargakn local market, Agargaon, Dhaka
17 G17 Narayanganj local market
The experiment plot was prepared by several ploughing and cross ploughing
followed by laddering and harrowing with tractor and power tiller to bring about
good tilth in the middle week of February 2010. Weeds and other stables were
removed carefully from the experimental plot and leveled properly. After final
land preparation, pits of 50 cm × 50 cm × 45 cm were prepared in each plot with
a spacing of 3 m × 1.25 m. The dose of manure and fertilizers used in the study
are Cow dung 10 ton/ha, Urea 150 kg/ha, TSP 100 kg/ha, MOP 150 kg/ha,
Gypsum 80 kg/ha, Zinc Oxide 8 kg/ha. The intercultural operations were done
from time to time throughout the cropping season for proper growth and
development of the plants. Only one healthy seedling was kept per pit for the
proper development and avoid crowd environment. Fruits were picked on the
basis of horticultural maturity, size, colour and age. Frequent picking was done
throughout the harvesting period. The following data such as, Days to first male
flowering, Days to first female flowering, Vine length (m), Number of nodes

610 KHAN et al.
per vine, Branches per vine, Fruit length (cm), Fruit diameter (cm), Number of
fruit per plant, Weight per fruit (g), Yield per plant (kg), were recorded on
parameters from the studied plants during the experiment. Mean data of the
characters were subjected to multivariate analysis. Univariate analysis of the
individual character was done for all characters under study using the mean
values (Singh and Chaudhury, 1985) and was estimated using MSTAT-C
computer programme. Duncan’s Multiple Range Test (DMRT) was performed
for all the characters to test the differences between the means of the genotypes.
Mean, range and co-efficient of variation (CV %) were also estimated using
MSTAT-C. For calculating the genotypic and phenotypic correlation co-efficient
for all possible combinations the formula suggested by Miller et al., (1958),
Johnson et al., (1955) and Hanson et al., (1956) were adopted. Broad sense
heritability was estimated (Lush, 1943) by the following formula, suggested by
Johnson et al., (1955). Path co-efficient analysis was done according to the
procedure employed by Dewey and Lu (1959) also quoted in Singh and
Chaudhary (1985), using simple correlation values. In path analysis, correlation
co-efficient is partitioned into direct and indirect independent variables on the
dependent variable.
Results and Disussion
The experiment was conducted to investigate the yield performance, variability,
character association and yield contributing characters of seventeen bitter gourd
genotypes. The result of the experiment have been presented and interpreted
under the following headings. The analysis of variance indicated the existence of
sufficient genetic variability among the 17 genotypes for all the plant characters
(Table 2).Vine length as observed in this experiment varied significantly among
the genotypes. Significantly, the highest vine length was found in G9 (4.53 m)
which were statistically similar with the genotypes G1, G2, G3, G5, G6, G7, G9,
G10, G12, G14, G16 and G17. On the other hand, the lowest vine length was
recorded in G15 (2.13 m). The results obtained related with the findings of
Robinson and Decker-Walters (1997). Prasad and Sing (1992) reported a wide
range of variability among the cucumber genotypes for vine length at final
harvest. Phenotypic expression of any traits depends on the genotypic and the
environmental variation. Generally, the higher environmental influence
suppresses the expression of genetic effect. Estimation of genotypic variance was
low and phenotypic variance was fairly high for vine length (Table 3).
Genotypic co-efficient of variation was found lower than the corresponding
phenotypic one, which indicated the larger influence of environment. It was
observed that branch per vine varied significantly among the genotypes and
ranged from 30.67 to 45.60 with the mean value of 38.21. The highest branch per
vine (45.60) was found in G5 followed by G3, G6, G7, G9, G10, G14, G16 and G17,

VARIABILITY, CORRELATION AND PATH CO-EFFICIENT ANALYSIS 611
where as the lowest branch per vine was observed in G2 (30.67) (Table 2).
Differences between phenotypic (25.27) and genotypic (14.01) variances and
also phenotypic (81.33%) and genotypic (60.55%) co-efficient of variation
indicating environmental effect upon the expression of the characters of branch
per vine (Table 3). The nodes per vine was observed significantly varied among
the genotypes and ranged from 81.33 to 91.23 with the mean value of 85.73
(Table 2). The highest nodes per vine (91.23) was found in G2 followed by G3,
G13 and G15, where as the lowest nodes/vine was observed in G11 (81.33).
Considerable differences between phenotypic (12.64) and genotypic (9.98)
variances and also phenotypic (38.41%) and genotypic (34.13%) co-efficient of
variation indicating environmental effect upon the expression of the characters of
nodes per vine (Table 3). The highest range of variation was recorded in days to
first male flower opening among the genotypes and ranged from 53.77 to 61.20
days with the mean value of 56.59 days (Table 2). The plant of G14 and G16
showed the minimum days to first male flowering which was statistically similar
with G3, G5, G7, G8, G9, G10, G11, G13, G15 and G17 .The G1 showed the maximum
days to first male flowering (61.20) followed by G2, G6 and G12. Differences
between genotypic (3.44) and phenotypic (6.74) variances as well as genotypic
(24.68%) and phenotypic (34.54%) co-efficient of variation (Table 3) was high
indicating considerable environmental effect upon the expression of this trait.
Abusaleha and Dutta (1990) found high genotypic and phenotypic (33.22 and
33.88) value for days to male flowering in bitter gourd.
The range of variation in days to first female flower opening among the
genotypes ranged from 62.90 to 71.43 days with the mean value of 66.29 days
(Table 2). The plants of genotype 1 showed the maximum days (71.43) to first
male flowering which was statistically similar with G2, G4, G6 and G8. The
genotype G9, G11, G13, G15 and G16 showed the minimum days to first male
flowering (62.90). Differences between genotypic (7.37) and phenotypic (9.13)
variances as well as genotypic (33.37%) and phenotypic (37.14%) co-efficient of
variation (Table 3) was high indicating considerable environmental effect upon
the expression of this trait. Abusaleha and Dutta (1990a) observed that the
genotypic and phenotypic variances were high (77.38 and 74.03) for days to first
female flowering in bitter gourd.
Significant variation in respect of fruit length was found among the studied
accessions. Genotypes 11 had the longest fruit (21.59cm) and the smallest fruit
was found in genotypes 5 (15.55cm). Sharma et al.,(2000), Krisna Prasad and
Singh (1994), Hormuzdi and More (1989) were found the similar results.
Comparatively higher degree of genotypic variance (5.56), phenotypic (5.91)
variance as well as genotypic (52.09%) and phenotypic (53.70%) co-efficient of
variation was found for fruit length. It was similar with the findings of Saha et
al.,(1992).

612 KHAN et al.
Ta
ble
2.
Pla
nt
ch
ara
cter
isti
cs a
nd
mea
n p
erfo
rm
an
ce i
n r
esp
ect
of
vin
e le
ng
th,
bra
nch
per
vin
e, n
od
es
per
vin
e, d
ay
s o
f 1
st m
ale
flo
wer
ing
, d
ay
s o
f 1
st f
em
ale
flo
wer
ing
, fr
uit
len
gth
, fr
uit
dia
met
er,
fru
it w
eig
ht,
no
of
fru
its
per
pla
nt
an
d f
ruit
s p
er
pla
nt
of
sev
ente
en
bit
ter g
ou
rd a
cces
sio
ns.
Gen
oty
pes
Vin
e
leng
th
(cm
)
Bra
nch
per
vin
e
No
des
per
vin
e
Days
of
1st
mal
e
flo
wer
ing
Days
of
1st
fem
ale
flo
wer
ing
Fru
it
leng
th
(cm
)
Fru
it
dia
met
er
(cm
)
Fru
it
wei
ght
(g)
No
of
fruit
s p
er
pla
nt
Fru
its
per
Pla
nt
(Kg)
Gen
oty
pe-1
4
.20
30
.87
85
.00
61
.20
71
.43
20
.19
1
1.7
7
11
9.3
2
3.3
3
2.2
67
Gen
oty
pe-2
3
.63
30
.67
91
.23
59
.67
69
.07
21
.40
1
1.3
3
12
7.8
1
9.6
7
2.2
00
Gen
oty
pe-3
3
.80
41
.03
89
.60
56
.07
68
.50
21
.10
1
1.8
4
13
0.2
2
2.3
3
2.6
40
Gen
oty
pe-4
3
.27
34
.10
82
.10
57
.77
69
.10
19
.08
9
.86
10
5.8
2
4.6
7
2.7
77
Gen
oty
pe-5
4
.07
45
.60
85
.37
56
.43
66
.73
15
.55
1
0.7
5
10
2.7
2
0.6
7
2.2
90
Gen
oty
pe-6
3
.57
39
.70
83
.33
58
.03
69
.07
21
.43
1
1.1
3
11
0.5
2
7.6
7
3.0
93
Gen
oty
pe-7
3
.77
40
.83
82
.47
55
.10
64
.53
20
.86
1
0.6
7
11
3.7
2
7.3
3
3.1
70
Gen
oty
pe-8
3
.37
35
.63
85
.37
57
.13
69
.93
20
.72
1
0.4
7
11
4.2
3
0.0
0
3.4
20
Gen
oty
pe-9
4
.53
43
.70
82
.87
56
.57
63
.47
20
.75
1
0.4
2
11
7.0
2
9.3
3
3.2
90
Gen
oty
pe-1
0
3.7
3
39
.13
87
.20
54
.27
65
.37
20
.38
1
0.6
5
11
6.8
2
9.3
3
3.1
10
Gen
oty
pe-1
1
3.2
3
37
.60
81
.33
54
.83
62
.90
21
.59
1
0.5
2
11
7.3
2
7.3
3
2.7
97
Gen
oty
pe-1
2
3.5
3
34
.93
82
.43
59
.27
66
.47
20
.77
1
0.8
2
11
2.5
2
5.0
0
2.5
87
Gen
oty
pe-1
3
3.2
0
37
.07
90
.50
55
.37
63
.47
20
.63
1
0.2
2
11
0.7
2
8.3
3
2.8
80
Gen
oty
pe-1
4
4.3
0
39
.50
86
.50
53
.77
64
.63
21
.20
1
0.7
3
11
9.3
2
6.0
0
2.9
73
Gen
oty
pe-1
5
2.1
3
36
.23
90
.73
55
.07
62
.90
21
.32
1
0.6
9
11
6.7
2
3.3
3
2.4
40
Gen
oty
pe-1
6
4.2
7
43
.47
87
.30
53
.77
62
.97
20
.83
1
0.6
5
11
2.5
2
1.0
0
2.3
27
Gen
oty
pe-1
7
3.5
0
39
.47
83
.10
55
.93
64
.70
20
.54
9
.87
11
0.8
2
5.0
0
2.7
47
LS
D(0
.05
) 0
.97
5.5
8
2.7
1
3.0
2
2.2
0
0.9
7
0.6
5
9.2
5
3.7
4
0.4
0
Max
imu
m
4.5
3
45
.6
91
.23
61
.2
71
.43
21
.59
1
1.8
4
13
0.2
3
0
3.4
2
Min
imu
m
2.1
3
30
.67
81
.33
53
.77
62
.9
15
.55
9
.86
10
2.7
1
9.6
7
2.2
Mea
n
3.6
1
38
.20
85
.73
56
.59
66
.29
20
.28
1
0.7
4
11
5.3
0
25
.26
2.7
69
CV
(%
) 1
6.0
1
8.7
8
1.9
0
3.2
2
2.0
0
2.8
7
3.6
4
4.8
3
8.9
0
8.7
6
SE
0
.15
3
48
.73
14
1.1
7
30
.93
13
.78
31
.31
5
.07
0.0
03
0.4
3
0.0
9

VARIABILITY, CORRELATION AND PATH CO-EFFICIENT ANALYSIS 613
Ta
ble
3.
Est
ima
tio
n o
f g
enet
ic p
ara
met
ers
of
yie
ld a
nd
yie
ld c
on
trib
uti
ng
ch
ara
cter
s o
f se
ven
teen
bit
ter g
ou
rd a
cces
sio
ns.
Acc
ess
ion
Vin
e
leng
th
(cm
)
Bra
nch
per
vin
e
No
des
per
vin
e
Days
of
1st
m
ale
flo
wer
ing
Days
of
1st
fem
ale
flo
wer
ing
Fru
it
leng
th
Fru
it
dia
met
er
Fru
it
wei
ght
No
of
fruit
s p
er
pla
nt
Fru
its
per
Pla
nt
(Kg)
Gen
oty
pic
Var
iance
0
.20
14
.01
9
.98
3.4
4
7.3
7
5.5
6
0.2
5
36
.75
8.7
5
0.1
2
Phen
oty
pic
Var
iance
0
.54
25
.27
1
2.6
4
6.7
4
9.1
3
5.9
1
0.4
0
67
.69
13
.83
0.1
8
Gen
oty
pic
co
-eff
icie
nt
of
var
iati
on (
%)
23
.40
60
.55
3
4.1
3
24
.68
33
.37
52
.09
1
5.2
6
56
.49
58
.79
20
.83
Phen
oty
pic
co
-eff
icie
nt
of
var
iati
on (
%)
38
.45
81
.33
3
8.4
1
34
.54
37
.14
53
.70
1
9.3
1
76
.67
73
.92
25
.52
Ran
ge
2.1
3-
4.5
3
30
.67
-
45
.60
81
.33
-
91
.23
53
.77
-
61
.20
62
.90
-
71
.43
15
.55
-
21
.59
9.8
6-
11
.84
10
2.7
-
13
0.2
19
.67
-
30
.0
2.2
-
3.4
2
CV
(%
) 1
6.0
1
8.7
8
1.9
3
.22
2.0
0
2.8
7
3.6
4
4.8
3
8.9
8
.76

614 KHAN et al.
Significant variation in respect of fruit diameter was found among the studied
accessions. Genotypes 3 had the longest fruit diameter (11.84cm) which was
statistically similar to genotype 1 and genotype 2. On the other hand, the smallest
fruit diameter was found in genotypes 4 and genotype 17 (9.86 cm). Sharma et
al.,(2000), Krisna Prasad and Singh (1994), Hormuzdi and More (1989) were
found the similar results. Higher degree of genotypic variance (0.25), phenotypic
(0.40) variance as well as genotypic (15.26%) and phenotypic (19.31%) co-
efficient of variation was found for fruit diameter. It was similar with the findings
of Saha et al.,(1992).
Average fruit weight varied significantly among the accessions and ranged from
102.7g to 130.2g where mean value was 115.30g. The genotype 3 had the highest
fruits weight (130.20g) followed by genotype 2. On the other hand genotype 5
was carried the lowest weighty (102.70g) fruits which was statistically similar
with G4, G6, G13, G16 and G17 (Table 2). Prasad and Singh (1992) observed high
variability among the bitter gourd genotypes for this trait. High genotypic (36.75)
and phenotypic (67.69) variances as well as genotypic (56.49%) and phenotypic
(76.67%) co-efficient of variation (Table 3) for this character indicated the
maximum amount of variability within the genotypes for average fruit weight
and offered better scope of selection. This finding was supported by Rastogi et
al.,(1990). The number of fruit per plant varied significantly among the
genotypes and ranged from 19.67 to 30.00 (Table 2). The genotype 8 obtained
the maximum number of fruits per plant (30.00) which was statistically similar
with G6, G7, G9, G10, G11 and G13. On the other hand, the minimum number of
fruits per plant (19.67) was obtained in genotype 2 followed by genotype number
G1, G3, G5, G15 and G16 (Table 2). Anonymous (2000) reported that number of
fruits per plant varied significantly among the studied cucumber lines. Slight
differences were observed between genotypic (8.75) and phenotypic (13.83)
variance as well as genotypic (58.79%), phenotypic (73.92%) co-efficient of
variation indicating low environmental influence on this trait (Table 3).
The cultivars showed a significant difference in producing yield per plant and
ranged from 2.2kg to 3.42kg (Table 3). From the above result, the data indicated
that genotype 8 (3.42kg) had the highest yield per plant followed by genotype G6,
G7, G9, G10 and G14 which were statistically similar with each other. The
genotype 2 (2.2kg) had the lowest yield per plant followed by genotype 1, G3, G5,
G12, G15 and G16 which were statistically similar to each other but significantly
different from the other accessions (Table 2). In a trial at BARI, Joydebpur
(Anonymous, 1997) with 28 bitter gourd lines, yield per plant varied from 0.48kg
to 3.69kg, which was more or less similar to the above findings. Little differences
were found between genotypic (0.12) and phenotypic (0.18) variance as well as
genotypic (20.83%) and phenotypic (25.52%) co-efficient of variation (Table 3)

VARIABILITY, CORRELATION AND PATH CO-EFFICIENT ANALYSIS 615
resulting low environmental influence on this character. Abusaleha and Dutta
(1990a) recorded low genotypic and phenotypic variances for this trait in bitter
gourd.
Correlation studies
Estimation of simple correlation co-efficient was made among seven important
yield components towards yield of the seventeen genotype of bitter gourd
accessions. The values of ‘r’ and the components correlated are presented in
Table 4.
Correlation co-efficient revealed that vine length had positive correlation with
days to first male flowering (0.026), female flowering (0.006), fruit length
(0.018), fruit diameter (0.15), individual fruit weight (0.10) and number of fruits
per plant (0.178). This indicates that days to first male and female flowering, fruit
length, fruit diameter, average fruit weight and number of fruits per plant will be
increased with the increased of vine length (Table 4). This finding was supported
by Abusaleha and Dutta (1989). Days to first male flowering had highly
significant and positive correlation with days to first female flowering (0.422)
and negative correlation with fruit length (-0.171), fruit diameter (-0.215),
individual fruit weight (-0.052), number of fruits per plant (-0.193) and yield per
plant (-0.184). This indicates that yield per plant will be decreased with the
increase of days to first male flowering (Table 5). This study agrees with the
finding of Li et al., (1997) and stated that days to first flowering was negatively
correlated with yield per plant in selected bitter gourd inbred lines.
It was observed that days to first female flowering was not positively correlated
with any of the parameter and negatively and significantly correlated with fruit
length (- 0.297), fruit diameter (- 0.331), individual fruit weight (- 0.287) and
yield per plant (- 0.332) (Table 5). Which indicate that days to first picking
increased and yield per plant decreased with the increase of days to first female
flowering. Ananthan and Pappiah (1997) reported that days to first female
flowering were negatively correlated with total fruit yield per plant in bitter
gourd. Days to first picking was also negatively correlated with yield per plant (-
0.145). With the respect of, the association of fruit characters, fruit length
(0.202), fruit diameter (0.407), individual fruit weight (0.601) and number of
fruits per plant (0.873) had the high degree of significant positive association
with yield per plant. This indicates that yield per plant will be increased with the
increase of fruit length, fruit diameter, individual fruit weight and number of fruit
per plant and average fruit weight.

616 KHAN et al.
Tab
le 4
. C
orr
elati
on
co-e
ffic
ien
t a
mon
g e
igh
t im
port
an
t yie
ld a
nd
yie
ld c
on
trib
uti
ng c
hara
cter
s of
seven
teen
gen
oty
pe
bit
ter
gou
rd.
Char
acte
rs
Days
to 1
st
mal
e
flo
wer
ing
Days
to 1
st
fem
ale
flo
wer
ing
Fru
it l
eng
th
(cm
)
Fru
it d
iam
eter
(cm
)
Aver
age
fruit
wei
ght
(g)
No
of
fruit
s
per
pla
nt
Yie
ld p
er p
lant
(kg)
Vin
e le
ngth
(cm
) 0
.02
6
0.0
06
0.1
08
0.1
5
0.1
0
0.1
78
0.1
85
Days
to 1
st m
ale
flo
wer
ing
0
.42
2**
-0.1
71
-0.2
15
-0.0
52
-0.1
93
-0.1
84
Days
to 1
st f
em
ale
flo
wer
flo
wer
ing
-0.2
97
*
-0.3
31
*
-0.2
87
*
-0.2
47
-0.3
32
*
Fru
it l
eng
th (
cm
)
0.1
54
0.4
27
**
-0.0
15
0.2
02
Fru
it d
iam
eter
(cm
)
0
.50
4**
0.2
03
0.4
07
***
Aver
age
fruit
wei
ght(
g)
0
.15
3
0.6
01
***
No
of
fruit
s p
er p
lant
0.8
73
**
*
** S
ignif
icant
at 1
% l
evel
of
pro
bab
ilit
y,
*S
ignif
icant
at 5
% l
evel
of
pro
bab
ilit
y.
Ta
ble
5.
Pa
th a
na
lysi
s sh
ow
ing
dir
ect
an
d i
nd
irec
t ef
fects
on
yie
ld c
om
po
nen
ts o
f se
ven
teen
gen
oty
pe
bit
ter g
ou
rd.
Char
acte
rs
Vin
e
leng
th
(cm
)
Days
to 1
st
mal
e
flo
wer
ing
Days
to 1
st
fem
ale
flo
wer
ing
Fru
it l
eng
th
(cm
)
Fru
it d
iam
eter
(cm
)
Aver
age
fruit
wei
ght
(g)
No
of
fruit
s
per
pla
nt
Yie
ld p
er
pla
nt
(kg)
Vin
e le
ngth
(cm
) -0
.008
65
0.0
000
2
0.0
000
8
0.0
018
7
0.0
018
0
.04
70
3
0.1
426
2
0.1
85
Days
to 1
st m
ale
flo
wer
ing
-0.0
00
22
0
.00
05
6
0.0
059
5
-0.0
02
96
-0
.00
25
8
-0.0
24
45
-0
.15
46
4
-0.1
84
Days
to 1
st f
em
ale
flo
wer
ing
-0.0
00
05
0
.00
02
4
0.0
141
-0.0
05
14
-0
.00
39
7
-0.1
34
97
-0
.19
79
-0.3
32
Fru
it l
eng
th (
cm
) -0
.00
09
3
-0.0
00
1
-0.0
00
42
0
.01
73
0.0
018
4
0.2
008
1
-0.0
12
02
0
.20
2
Fru
it d
iam
eter
(cm
) -0
.00
12
9
-0.0
00
12
-0
.00
46
7
0.0
026
6
0.0
199
8
0.2
370
2
0.1
626
5
0.4
07
Aver
age
fruit
wei
ght(
g)
-0.0
00
86
-0
.00
00
3
-0.0
04
04
0
.00
73
9
0.0
060
5
0.0
470
27
0
.12
25
9
0.6
01
No
of
fruit
s p
er p
lant
-0.0
01
54
-0
.00
01
1
-0.0
03
48
-0
.00
02
6
0.0
024
4
0.0
719
5
0.8
012
3
0.8
73
Und
erli
ned
fig
ure
s in
dic
ated
the
dir
ect
effe
cts.
Resi
dual
eff
ect
(R
) =
0.1
17
.

VARIABILITY, CORRELATION AND PATH CO-EFFICIENT ANALYSIS 617
Association of characters determined by correlation co-efficient may not provide an exact picture of the relative importance of direct and indirect influence of each
of the yield components towards yield. As a matter of fact, in order to find a clear picture of inter-relationship between fruit yield and yield contributing characters, direct and indirect effects were worked out using path analysis.
The results of the path analysis in table 5 revealed that direct effect of vine length on yield per plant was very low and negative (-0.00865). Where as positive indirect effect of vine length on yield per plant was contributed via days to first
male and female flowering, days to first picking, fruit length, fruit diameter, individual fruit weight and number of fruits per plant (Table 5). Days to first male flowering showed very lower direct and positive effect (0.00056) on yield per plant. This trait had also negative effect on yield per plant via fruit length, fruit diameter, average fruit weight and number of fruits per plant (Table 5). Days to flowering were negatively correlated with yield per plant reported by Li
et al.,(1997). Days to first female flowering showed very low direct and positive effect (0.0141) on yield per plant. This trait had also negative effect on yield per plant via fruit length, fruit diameter, average fruit weight and number of fruits per plant (Table 5). Fruit length showed low direct and positive effect (0.0173) on yield per plant and indirect positive effect on yield per plant via fruit diameter and average fruit weight. Similar result was found for fruit diameter and average
fruit weight. Number of fruits per plant showed high direct and positive effect (0.801) on yield per plant (Table 5). Three characters namely average fruit weight, number of fruits per plant and average fruit length had the largest direct effect of yield per plant in bitter gourd stated by Zhang et al.,(1999). Rajput et al.,(1991) found a significant positive correlation between number of fruits per plant and fruit yield among the indigenous and exotic bitter gourd cultivars. The
residual effect was 0.117 indicating that about 88 percent of the variability in yield per plant was contributed by the eight characters studied in path analysis. In the present study this residual effect towards yield might be due to many reasons such as other characters which were not studied, environmental factor and sampling errors. The path analysis carried out in the present investigation suggested that average fruit weight and number of fruits per plant which are the
main components of yield should be given priority in the selection programme and as well as variety development.
References
Abusaleha and O.P. Dutta, 1989. Interrelationship of yield components in cucumber. Veg. Sci., 15:(1): 75-85.
Abusaleha and O.P. Dutta, 1990a. study on variability, heritability and scope of improvement in cucumber. Haryana J. Hort. Sci., 19(3-4):349-352.
Ananthan, M. and C.M. Pappiah, 1997 Combining ability and correlation studies in cucumber (Cucumis sativus L.). South Indian Hort., 45(1): 57-58.
Anonymous.1997. Basat Barite Sabji Utpadan (in Bengali). BARI, Gazipur, Bangladesh. P. 239.

618 KHAN et al.
Anonymous, 2000. Annual Report (1999-2000). Bangladesh agricultural Research Institute, Joydebpur, Gazipur.
BBS, 2009-10, Agricultural production and area part, Bangladesh Bureau of Statistics,
Bhatt, G.M., 1973. Significant of path co-efficient analysis determining the nature of character association. Euphytica, 22: 338-343.
Dewey, D.K. and K. H. Lu, 1959. A correlation and path co-efficient analysis of components of crested wheat grass and production. Agron. J., 51: 515-518.
Hanson, C. H., H. F. Robinson and R. E. Comstock, 1956. Biometrical studies of yield in Segregation population of Korean Lespedza. Agron J., 48: 268 -272.
Hormuzdi, S. G. and T. A. More, 1989. Studies on combining ability in cucumber (Cucumis sativus L.). Indian J. Genet., 49(2): 161-166.
Johnson, H. W., H. F. Robinson and R. E. Comstock. 1955. Estimates of genetic and environmental variability in soybeans. Agron. J., 47: 314-408.
Krishna Prasad, V.S.R. and D. P. Singh, 1994. Standardized potence and combining ability in slicing cucumber (Cucumis sativus L.). Indian J. Hort., 51(1): 77-84.
Li, J.W., S.R. Sun and Y.H. Rer, 1997. Study on genetic correlation and path analysis of the main agronomic characters of cucumber. Acta Agril. Univ., Henanensis. 31(3): 244-247.
Lush, J. L., 1943. Animal Breeding Plans. Iowa State Press, Ames, Iowa, P. 437.
Meir, P. and Z. Yaniv, 1985. An in vitro study on effect of (Momordica charantia L.) on glucose uptake and glucose metabolism in rats. Plants Medica 1: 12-16
Miller, P. J., J. C.Williams, H. F. Robinson and R. E. Comstock, 1958. Estimation of genotypic and environmental variance and co-variance in upland cotton and their
Prasad, V.S.R.K. and D.P. Singh, 1992. Estimates of heritability, genetic advance and association between yield and its components in cucumber (Cucumis sativus L.). Indian J. Hort., 49(1): 62-69.
Raja, Sekaran, L.R. and Shanmugavalu, K.G., 1984. MDU1 bitter gourd. South Indian Hort. 31(1) : 47-48.
Rajput, J.C., S.B. Palve and B.M. Jamadagni, 1991. Correlation and path analysis studies in cucumber (Cucumis sativus L.). Maharastra J. Hort., 5(2): 52-55.
Rastogi, K.B., D. Arya and A. Deep, 1990. A note on interrelationship between yield and important plant characters of cucumber (Cucumis sativus L.). Veg. Sci., 17(1): 102-104.
Robinson, R. W. and D. S. Deeker-Walters, 1997. Cucurbits. University Press, Cambridge London, UK. Pp. 14-115.
Saha. R. R., B. N. Mitra, A. E. Hossain, M. Jamaluddin and A. M. M. Mosiul Hoque, 1992. Genetic variability, character association and path co-efficient analysis in pumpkin (Cucurbita moschata L). Bangladesh Hort. J. 20 (1): 59-62.
Sharma, A., K. Vidyasagar and N. K. Pathania, 2000. Studies on combining ability for earliness and marketable fruit yield in cucumber (Cucumis sativus L.). Himachal. J. Agril. Res., 26(1 & 2): 54-61.
Singh, R. K. and B. D. Chaudhury, 1985. Biometrical methods of quantitative genetic analysis. Haryana J. Hort. Sci., 12 (2): 151-156.
Zhang, M. R. and B. R. Murty, 1999. Genetic diversity in relation to geographical distribution in pear millet. J. Pl. Breed. Genet. 75 (3 &4): 125-128.

ISSN 0258-7122
Bangladesh J. Agril. Res. 40(4): 619-628, December 2015
EFFECT OF NITROGEN ON DIFFERENT GENOTYPES OF
MUNGBEAN AS AFFECTED BY NITROGEN LEVEL
IN LOW FERTILE SOIL
M. A. RAZZAQUE1, M. M. HAQUE2, M. A. KARIM3
A. R.M. SOLAIMAN4 AND M. M. RAHMAN5
Abstract
A pot experiment was conducted at Bangabandhu Sheikh Mujibur Rahman
Agricultural University, Gazipur during kharif- II season (August to November)
of 2010 to find out the nitrogen acquisition and yield of mungbean genotypes
affected by different levels of nitrogen fertilizer in low fertile soil. Ten
mungbean genotypes viz. IPSA-12, GK-27, IPSA-3, IPSA-5, ACC12890053,
GK-63, ACC12890055, BARI Mung-6, BUmug- 4 and Bina moog- 5 and six
nitrogen fertilizer levels viz. 0, 20, 40, 60, 80 and 100 kg N ha-1 were included
as experimental treatments. Results indicated that increasing applied nitrogenous
fertilizer in low fertile soil increased nitrogen acquisition of mungbean which
increased number of pods plant-1 and seeds pod-1 and finally increased yield of
mungbean upto 60 kg N ha-1 irrespective of genotype and thereafter decreased.
Genotype IPSA -12 produced the highest seed yield (14.22 g plant-1) at 60 kg N
ha-1. The lowest yield (7.33 g plant -1) was recorded in ACC12890053 in
control. From regression analysis, the optimum dose nitrogen for mungbean
cultivation in the low fertile soil is 54 kg ha-1.
Keyword: Yield, Nitrogen level, Nitrogen acquisition, Low fertile soil.
Introduction
Mungbean (Vigna radiata (L.) Wilczek) is an ancient and widely cultivated crop in
many Asian countries including China, India, Pakistan, Philippines, Indonesia and
Bangladesh (Akbari et al., 2008). Mungbean is a short duration crop and very
effective for intensive cropping system. Mungbean can be easily fitted in
mungbean - T. aus - T. aman (southern region), mungbean -T. aman wheat (north
western region) and mungbean - aus - aman - potato (northern region) cropping
systems without considering the fertility status of the soil (Haque, 2001). One of
the reasons of ignoring soil fertility in mungbean cultivation is its ability to fixation
of atmospheric nitrogen (Hardarson and Danso, 1993). However, amount of
nitrogen fixed by microbial association varies over many soil and environmental
factors which might not be sufficient for proper growth and yield formation of
mungbean. Most of the researchers evaluated mungbean genotype in optimum soil
1Senior Scientific Officer, Training and Communication Wing, Bangladesh Agricultural
Research Institute (BARI), Gazipur, 2&3Professor, Department of Agronomy,
Bangabandhu Sheikh Mujibur Rahman Agricultural University (BSMRAU), 4Professor,
Department of soil science, BSMRAU, 5Professor, Department of Horticulture,
BSMRAU, Gazipur, Bangladesh.

620 RAZZAQUE et al.
condition but they ignored low nutrient environments for evaluation of mungbean
(Anjum, et al., 2006; Akbari, et al., 2008 and Malik et al., 2002). There exists
ample scope to evaluated mungbean genotypes that have inherent capability for
producing higher yield under nutrient poor conditions. Therefore, the present study
was undertaken with view to yield and nitrogen acquisition behavior of mungbean
under low nitrogen condition in different nitrogen level.
Materials and Method
The pot experiment was conducted at Bangbandhu Sheikh Mujibur Rahman Agricultural University (BSMRAU), Gazipur during kharif II season (August to November) of 2010. The soil was used in this experiment belongs to Codda series, under Madhupur tract. The soil is called low fertile soil because nutrient content in soil below the critical limit in the fertilizer recommendation guide (FRG, 2005). The experimental pots were filled with 12 kg soil. Ten mungbean
genotypes (IPSA-12, GK-27, IPSA-3, IPSA-5, ACC12890053, GK-63, ACC12890055, BARI Mung-6, BUmug- 4 and Bina moog- 5 and six nitrogen levels (0, 20, 40, 60, 80 and 100 kg N ha-1 ) were used as treatment variables.. Four (4) seeds per pot were sown on 31 August 2010. The treatments were factorial combination of the two factors and the experiment was conducted using a completely randomized design with four replication. One plant pot-1 was
considered as one replication. Nitrogen fertilizers were top dressing at 15 days after sowing. All agronomic practices like two weeding (15 days and 30 days after emergence), three irrigation (12, 25 and 40 days after emergence) and one mulching was done at pod developing stage. Insect pest was controlled by spraying admire 0.5 ml litre-1 of water during the entire growth period of the crop. Genotypes differed in attainment of maturity and then the harvesting was
done twice one on 31 October and another on 13 November, 2010.
Table 1. Chemical properties of the experimental soil before sowing.
Soil properties Present value Critical level
Organic matter (%) 0.536 -
Total N (%) 0.05 0.10
Available P (ppm) 0.16 8.00
Exchangeable K meg 100-1g soil 0.85 0.08
Available S (ppm) 7.00 8.00
Available B (ppm) 0.15 0.16
Available Zn (ppm) 0.25 0.50
Exchangeable Ca meg 100-1g soil 14.83 2.00
Exchangeable Mg meg 100-1g soil 1.76 0.50
CEC meg 100-1g soil 6.90 3-7.5
Data on yield, yield components and nitrogen content of mungbean genotypes were recorded. Total nitrogen contents in plant were determined by modified

EFFECT OF NITROGEN ON DIFFERENT GENOTYPES OF MUNGBEAN 621
Kjeldahl digestion colorimatric method (Cataldo et al., 1974). Nitrogen uptake by plant (shoot) of ten genotypes determined at maturity stage. The data on
different parameters were subjected to statistical analysis Microsoft Excel and MSTAT C software programs were used wherever appropriate to perform statistical analysis.
Results and Discussion
Plant height
Genotype and nitrogen interacted significantly in plant height of mungbean
(Table 2). Although plant height of mungbean increased with the increase of
nitrogen levels but it attained peak differently in different genotypes treated by
different nitrogen levels. Thus, the tallest plant (63.66 cm) of IPSA 12 was
observed at 60 kg N ha-1 , GK 27 (43.00 cm) at 40 kg N ha-1, IPSA 3 (65.33 cm)
at 80 kg N ha-1, IPSA 5 (78.33 cm) at 80 kg N ha-1, ACC 12980053 (75.00 cm)
at 40 kg N ha-1, BU mug 4 (60.06 cm) at 40 kg N ha-1, BARI Mung 6 (57.00 cm)
at 60 kg N ha-1 and Binamoog 5 (68.33 cm) at 60 kg N ha-1. The lowest plant
height was obtained at o kg ha-1 irrespective of genotypes. The results revealed
that genotypes itself are responsible for variation in plant height while applied
nitrogen enhanced the growth of mungbean. Increase in plant height of
mungbean at higher nitrogen levels may be ascribed to increase of N in
chlorophyll which increased photosynthesis and enhanced meristematic activity
of plant (Sawwar et al., 1989). Besides, nitrogen is essential component of amino
acids which are vital building blocks for development of tissues and
consequently increased plant height. This result is an agreement with the findings
of Rahman et al. (1992) of French bean at higher level of nitrogen (120 kg ha-1).
Table 2. Plant height (cm) of mungbean genotypes as affected by nitrogen level.
Genotypes Nitrogen levels (kg ha-1)
0 20 40 60 80 100
IPSA -12 50.00cC 54.66bB 56.66bC 63.66aB 57.00bC 48.66cC
GK -27 40.00bC 42.66aC 43.00aD 42.66aC 42.66aC 40.00bC
IPSA- 3 63.00abA 64.66aAB 62.40bC 63.00abB 65.33aB 63.00abB
IPSA -5 58.30cB 63.44cAB 69.00bB 63.00bbB 78.33aA 69.66bA
ACC12890055 61.56bcA 63.00bAB 65.66bB 62.00bB 78.66aA 58.61cBC
GK -63 44.96bC 47.37aC 47.00aD 43.00bcC 41.66bcC 41.00cC
ACC12890053 56.64cB 68.66bA 75.00aA 71.33abA 70.65abA 70.00abA
BUmug -4 43.66bcC 46.06cC 60.60aC 59.00aC 42.66cC 43.00bcC
BARI Mung -6 41.66cC 44.12cC 54.00abC 57.00aC 53.66aC 51.33abC
Binamoog -5 54.33cBC 65.00abA 65.0abB 68.33aAB 60.33bcB 58.33bcBC
Means followed by same small letter (row) and capital letter (column) did not differ
significantly at 5% level of probability.

622 RAZZAQUE et al.
Yield components and yield
Pods plant-1
Number of pods plant-1 of mungbean genotypes significantly influenced by the N
levels. Increasing nitrogen level led to increase pod plant-1 up to 60 kg N ha-1
irrespective of genotypes and thereafter decreased due to increase in N rates
(Table 3). These results are agreed with the findings of Peter and Patel (1991)
they reported that number of pod plant-1 of mungbean increased with application
of nitrogen fertilizer and excess application reduced pod number of mungbean.
There were genotypic variations in pod development where the genotype IPSA
12 produced the highest pods plant-1 (30.16) with 60 kg N ha-1 and it was
statistically similar to IPSA 5 at same N level (Table 3). The lowest number of
pods plant-1 (16.16) was recorded in genotype GK- 63 which was identical with
pods plant-1 (16.83) with Binamoog-5 with 100 kg N ha-1. Control plant (no
fertilizer with N) produced lower number of pods in all the mungbean genotypes.
Plant absorbed nutrient from the soil which is required in the formation of seed is
not sufficient in control condition. Increased nitrogen level in the no fertile soil
were increased nutrient availability and increased number of pod plant-1 up to 60
kg N ha-1.Further increased nitrogen levels nutrient toxicity occur and decreased
pod plant-1. These results are supported by Ashraf (2001) that number of pods
plant-1 was significantly affected by application of N fertilizer. These means that
mungbean genotypes require additional N for better pod development although it
is capable to fix atmospheric N through rhizobium species living in root nodules
(Anjum et al., 2006).
Table 3. Number of pods per plant of mungbean genotype as affected by nitrogen level.
Genotype Nitrogen levels (kg ha-1)
N0 N20 N40 N60 N80 N100
IPSA 12 22.00cA 24.83bcA 27.50bA 30.16aA 26.16bA 22.66cA
GK 27 20.00bA 22.50abAB 23.60aB 23.50aC 22.33abB 19.66bB
IPSA 3 19.66cAB 22.16bAB 23.16bB 25.16aB 22.50bB 20.33bcB
IPSA 5 21.83bcA 25.33aA 26.33aA 27.50aB 26.00aA 23.16bA
ACC12890055 20.16cA 23.00abAB 23.16abB 25.00aB 21.66bB 20.83bcB
GK 63 16.83cC 21.33bB 21.63bC 23.33aC 22.33abB 17.16cC
ACC12890053 20.33cA 22.00bcAB 22.66bC 25.83aB 22.00bB 22.16bA
BU mug 4 19.00cAB 22.00bAB 24.16aAB 25.16aC 21.83bBC 21.00bcAB
BARI Mung 6 18.93cB 20.50bB 22.50abC 23.33aC 22.33aB 20.83bBC
Binamoog 5 16.83dC 19.83cC 23.33aB 24.83aC 21.50bB 17.66dC
Means followed by same small letter (row) and capital letter (column) did not differ
significantly at 5% level of probability.

EFFECT OF NITROGEN ON DIFFERENT GENOTYPES OF MUNGBEAN 623
Seeds pod-1
Interaction effect of genotype and nitrogen was not significant but genotype had
significant effects on seeds pod-1 of mungbean (Table 4.). The highest seed pod-1
(12.40) was obtained in IPSA 12 and the lowest seed pod-1 (10.20) was recorded
in BUmug 4 at o kg N ha-1. Seed pod-1 was highest in IPSA 12 in control
condition because lower number of pod plant-1 were obtained in this condition
and more nutrient were available in formation in seed but not significantly
different with other nitrogen level. These findings are agreed with Asaduzzaman
et al. (2008) where they reported that nitrogen level and irrigation had no
significant effect on seeds pod-1. The number of seeds pod-1 is mostly genetically
controlled but its number may be regulated by canopy photosynthesis during pod
developing stage. Seed number also may be limited by the activity of the source
(Akther, 2005). During seed filling, the ability of the individual seed to utilize
assimilate determines number of seeds pod-1 and limitation of assimilate reduce
the seeds pod-1 (Jenner et al. 1992). This results however contrasting with the
findings of Rashid et al. (1999) who reported that application of N fertilizer
increases seeds pod-1 significantly.
Table 4. Number of seeds per pod of mungbean genotype as affected by nitrogen
levels.
Genotypes Nitrogen levels (kg ha-1)
0 20 40 60 80 100
IPSA 12 12.40A 12.33A 12.13A 12.03A 11.66A 11.83A
GK-27 10.93A 11.11A 10.85A 10.76B 10.76B 10.66B
IPSA 3 11.65A 11.20A 11.91A 11.08A 11.38A 11.05A
IPSA 5 11.46A 12.15A 11.98A 11.96A 11.60A 11.86A
ACC12890055 10.60B 11.20A 11.16A 11.20A 11.00A 11.05A
GK-63 10.83B 11.23A 11.20A 11.36A 10.83A 10.23A
ACC12890053 10.40B 11.65A 11.25A 10.66B 11.23A 10.40B
BU mug 4 10.20B 10.84A 10.65B 11.15A 11.06A 11.20A
BARI Mung 6 10.30B 10.76A 10.75B 11.01A 11.40A 11.11A
Binamoog 5 11.40A 11.28A 10.73B 11.13A 11.10A 11.54A
Means followed by same capital letter (column) did not differ significantly at 5% level of
probability.
1000 - seed weight
Thousand seeds weight was not significantly affected by N fertilizer application
as it is largely governed by genetic factors. Thus, 1000- seeds weight varied in
among the mungbean genotypes where maximum 1000 -seed weight (50.2 g) was
recorded in GK -27 which was similar (50.1 g) to GK 63 and the lowest seed

624 RAZZAQUE et al.
size (34.2 g) was recorded in ACC12890053 (Table 5). In present study although,
soil N fertilizer failed to enhanced 1000 -seed weight but it increased in faba
bean (Elsheikh and Elzidany, 1997) and groundnut (Chetti et al., 1995) due to
soil N fertilizer application.
Table 5. Effect of nitrogen fertilizer on 1000 -seed weight (g) of mungbean
genotypes.
Genotypes Nitrogen levels (kg ha-1)
0 20 40 60 80 100
IPSA 12 41.5 38.8 38.7 39.2 40.7 40.3
GK-27 50.2 49.4 49.9 49.9 49.7 49.8
IPSA 3 47.1 47.7 46.5 47.8 45.5 46.1
IPSA 5 38.5 38.1 39.5 41.5 41.0 36.8
ACC12890055 43.7 46.2 45.7 43.9 45.9 42.9
GK-63 49.8 50.1 49.9 49.4 49.6 49.7
ACC12890053 34.7 34.2 35.8 34.9 37.7 34.5
BU mug- 4 46.1 43.4 41.6 40.3 43.5 40.8
BARI Mung -6 49.3 48.9 48.9 50.0 49.0 48.6
Binamoog -5 39.0 40.3 37.2 37.0 40.7 41.1
Seed yield plant-1
Seed yield plant-1 was significantly affected by the interaction of mungbean
genotypes and N fertilizer applications. Seed yield of mungbean varied from 7.33
g to 14.22 g plant-1 and it was the highest in IPSA 12 (14.22 g plant-1) grown with
60 kg N ha -1 and the lowest in ACC12890053(7.33 g plant-1) under control
condition (Table 6). The genotype IPSA 12 however respond well (11.32 g plant-
1) under control condition. There was general trend of increase seed yield with
the increase of N fertilizer up to 60 kg N ha-1 and thereafter decreased. Increase
nitrogen fertilizer in low fertile soil gradually increased seed yield upto 60 kg N
ha-1 due to increase pod plant-1. These findings agreed with Biswas and Hamid
(1989) and Mitra and Ghildiyal (1988) that seed yield of mungbean is limited by
nitrogen supply. Application of N fertilizer upto 60 kg N ha-1 enhanced leaf area,
dry matter production and consequently improved number of pods plant-1 and
seeds pod-1 of mungbean genotypes and hence increased the yield. Plants grown
without added nitrogen or lower levels of fertilizer produced the lowest seed
yield plant-1 irrespective of genotypes. the negative response of higher N doses
(beyond 60 kg N ha-1) might be the toxic effect or produced some barriers on
nutrition of mungbean plants. Yield of mungbean decrease in beyond 60 kg N
ha-1 may be explained by quadratic equation y = 9.37 + 0.101x – 0.001x2 as
illustrated in Fig. 1. This equation states that seed yield of mungbean is

EFFECT OF NITROGEN ON DIFFERENT GENOTYPES OF MUNGBEAN 625
maximum (11.92 g plant-1) at 54 kg N ha-1 and thereafter, yield decrease at the
rate of 0.001x2 for each unit of applied N fertilizer. The value of R2 (0.97)
indicates that the nitrogen rates can account for 97% of the total variable in each
yield.
Table 6. Seed yield (g plant -1) of mungbean genotype as affected by nitrogen
fertilizer.
Genotypes Nitrogen levels (kg ha-1)
0 20 40 60 80 100
IPSA 12 11.32Ac 11.87Ac 12.87Ab 14.22Aa 12.41Ab 10.80Ac
GK-27 10.97Ab 12.34Aa 12.80Aa 12.61Ba 11.94Ab 10.43Ab
IPSA 3 10.78Abc 11.83Ab 12.82Aa 13.32ABa 11.65Ab 10.35Ac
IPSA 5 9.60Bc 11.72Ab 12.45Aa 13.64Aa 12.36Aa 10.10Abc
ACC12890055 9.33Bc 11.90Aab 11.81Bab 12.29Ba 10.93Bb 9.87ABb
GK-63 10.06Bb 12.00Aa 12.20Ba 13.09Ba 11.99Aa 9.23ABb
ACC12890053 7.33Dcd 8.49Db 9.12Cab 9.60Ca 9.31BCab 7.95Cc
BU mug 4 8.93Bbc 10.35Bab 10.85Ba 11.14Ba 10.40Bab 9.59ABbc
BARI Mung -6 8.55Bbc 10.78Bb 11.82Bab 12.84Aa 12.40Aa 11.24Aab
Binamoog 5 7.48Dc 8.61Cb 9.31BCab 10.23Ca 9.71Cab 8.37Cbc
Means followed by same small letter (row) and capital letter (column) did not differ
significantly at 5% level of probability.
Fig. 1. Relationship between nitrogen fertilizer and seed yield of mungbean
genotypes.

626 RAZZAQUE et al.
Nitrogen acquisition
As nitrogen deficiency in soil of Bangladesh is common (FRG, 2005), the ability of the plants to acquire nitrogen and their efficient use is important for crop adaptation to soils with low fertility. Genotypic differences in nitrogen acquisition revealed that the genotype IPSA 12 acquired maximum amount of nitrogen (0.767 g plant-1) under 60 kg N ha-1 and it was the lowest in Binamoog 5 (0.381 g plant-1) at control condition (Table 7). It was observed that most of
the mungbean genotype acquired maximum nitrogen at 40 or 60 kg N ha-1 except ACC12890053. This genotype needs even 80 kg N ha-1 to acquire maximum nitrogen which supposed to be very expensive. Nitrogen regulates soil pH through NH+ and increases P availability (Havlin et al., 2006), and phosphorus enhances nodulation and subsequently accumulates more N in mungbean plants (Marschner et al., 1997).
Table 7. Plant nitrogen acquisition (g plant-1) of mungbean genotypes as affected by
different nitrogen levels.
Genotypes Nitrogen levels (kg ha-1)
N0 N20 N40 N60 N80 N100
IPSA 12 0.536 0.639 0.710 0.767 0.662 0.591
GK -27 0.437 0.495 0.533 0.531 0.531 0.483
IPSA 3 0.480 0.506 0.530 0.604 0.555 0.506
IPSA 5 0.430 0.537 0.650 0.676 0.643 0.541
ACC12890055 0.472 0.614 0.674 0.601 0.579 0.510
GK -63 0.402 0.481 0.508 0.525 0.480 0.446
ACC12890053 0.412 0.527 0.584 0.630 0.620 0.526
BUmug 4 0.420 0.516 0.565 0.531 0.517 0.484
BARI Mung -6 0.433 0.492 0.560 0.595 0.554 0.501
Bina moog 5 0.381 0.443 0.534 0.556 0.519 0.46
Conclusion
The results revealed that nitrogen is necessary to ensure better growth and
productivity of mungbean with low fertile soil. Increased N level mungbean
production increased up to 60 kg N ha-1 in low fertile soil irrespective of genotypes.
The genotype IPSA 12 performed the best in low fertile soil. The optimum dose of
nitrogen for mungbean cultivation in the low fertile soil is 54 kg ha-1.
References
Akbari, N., M. Barani and H. Ahmadi. 2008. Change of grain protein content and
correlations with other characteristics under planting pattern and starter N fertilizer
of mungbean (Vigna radiata L. Wilczek). Am. Eurasian J.Agric. Environ. Sci. 4:
306-310.

EFFECT OF NITROGEN ON DIFFERENT GENOTYPES OF MUNGBEAN 627
Akther, M. S. 2005. Physiological differences in yielding ability of traditional and
modern mungbean genotypes (Vigna radiata (L) Wilczek). A Ph D thesis submitted
Department of Agronomy, BSMRAU, Gazipur. Pp. 56
Anjum, M. S., Z. I. Ahmed and C. A. Rauf. 2006. Effect of Rhizobium inoculation and
nitrogen fertilizer on yield and yield components of mungbean. Int. J. Agric. and
Biol. 8: 238-240.
Asaduzzaman, M., M. F. Karim., M. J. Ullah and M. Hasunuzzaman. 2008. Response of
mungbean (Vigna radiata) to nitrogen and irrigation management. Am. Eurosia J.
Sci. Res. 3: 40-43.
Ashraf. M. 2001. Influence of seed inoculation and NPK application on growth, yield and
quality of mungbean (Vigna radiata L.Wilczek) cv. NM-98. M Sc Thesis,
Department of Agronomy . University of Agric. Faisalabad, Pakistan.
FRG, 2005. Fertilizer Recommendation Guide, Bangladesh Agricultural Research
Council, Farmgate, Dhaka.
Biswas, J. C and A, Hamid. 1989. Influence of carbofuran on leaf senescenes and
nitrogen uptake of mungbean (Vigna radiata) Bangladesh J. Agric. 14: 261-267.
Chetti, M. B., E. Antony, U. V. Mummigatti and M. B. Dodammi. 1995. Role of nitrogen
and rhizobium on nitrogen fixation on nitrogen utilization efficiency and
productivity potential of groundnut genotypes. Farming systems, 11:25-33.
Elsheikh, E. A. E and A. A. Elzidany.1997. Effects of rhizobium inoculation, organic and
chemical fertilizers on yield and physical properties of faba bean seed. Pl.Food Hum.
Nutr. 51: 137- 144.
Haque, M. M., M. A. Afzal, A Hamid, M Abu bakr, Q. A. Khaliq and M. A. Hossain.
2001.
Improvement variety of mungbean: BUmug 2, Publication no. 21. Lentil Blackgram and
Mungbean development pilot project, PRS, BARI. Gazipur. Pp. 6
Hardarson, G and S. K. A. Danso. 1993. Methods for measuring biological nitrogen
fixation in grain legumes, Plant and Soil. 152: 19-23.
Havlin, J. L., J. D.Beaton., S. L. Tisdale and W. I. Nelson. 2006. Soil fertility and
fertilizer. An introduction to nutrient management. 7th edition. p. 515. Asoke K.
Ghose. Printed Hall , New Delhi, publishers, India.
Jenner, C. F., T. D. Ugalde and D. Aspinall. 1992. The physiology of starch and protein
deposition in the endosperm of wheat. Aust. J. Plant Physiol. 18: 211-226.
Malik, M. A., S. Hussain, E. A. Warruich, A. Habib and S. Ullah. 2002. Effects of seed
inoculation and phosphorus application on growth, seed yield and quality of
mungbean (Vigna radiata L.) CV NM-98. Int. J. Agri. Biol. 4(4): 515-516.
Marschner, H. E., E. A. Kirby and C. Engels. 1997. Importance of cycling and ecycling
of mineral nutrients winter plants for growth and development. Bot. Acta. 265-273.
Mitra, S and M. C. Ghildiyal. 1988. Photosynthesis and assimilates partitioning in
mungbean in response to source sink alterations. J. Agron and Crop Sci. 160: 303-
308.

628 RAZZAQUE et al.
Pater, F. M and L. R. Patel. 1991.Response of greengram varieties to phosphorus and
rhizobium inoculation. Indian A. Agron. 36: 355-356.
Rahman, M. M., A. A. Miah, A. Hamid and A.F. M. Moniruzzaman. 1992. Growth
analysis of chickpea genotype in relation to grain filling period and yield potential.
Bangladesh J. Bot. 21: 225-231.
Rashid, A., M. Musa, N. K. Aadal, M. Yaqub and G. A. Choudhury. 1999. Response to
groundnut to Bradyrhizobium and Diazotroph bacterial inoculums under different
levels of nitrogen. Pakistan J. Soil. 16: 89-98
Sawwar, Z. M., M. S. Maddab Eldis and B. Gregg. 1989. Influence of nitrogen,
phosphorus and growth regulators on seed yield and viability and seedling vigour of
Egyptian cotton. Seed Sci. and Technol. 17: 507-509.

ISSN 0258-7122
Bangladesh J. Agril. Res. 40(4): 629-640, December 2015
PERFORMANCE OF DIFFERENT CROPS PRODUCTIVITY
ENHANCEMENT THROUGH ADAPTATION OF CROP VARIETIES AT
CHARLAND IN BANGLADESH
M. N. ISLAM1, M. S. RAHMAN2, M. S. ALOM3
AND M. AKHTERUZZAMAN4
Abstract
Charland that are emerged as islands within the river channel or as attached land
to the riverbanks as a result of erosion and accretion. In crop production
systems, screening of adaptable crop varieties for charland is necessary to
address the climate change issues. Hence, five separate experiments were
conducted at charland of the Padma River in Kushtia district during November
2012 to May 2013 to select suitable varieties of lentil, hybrid maize, soybean,
potato and mustard for increasing crop productivity. The experiment comprised
of four lentil varieties viz. BARI Masur-4, BARI Masur-5, BARI Masur-6 and a
local cultivar; four hybrid maize varieties namely BARI Hybrid maize-5, BARI
Hybrid maize-7, BARI Hybrid maize-9 and Pacific-11; three soybean varieties
like BARI Soybean-5, BARI Soybean-6 and Shohag; four potato varieties viz.,
BARI Alu-7, BARI Alu-8, BARI Alu-31 and Belgium; and five mustard
varieties viz., BARI Sarisha-11, BARI Sarisha-13, BARI Sarisha-14, BARI
Sarisha-15 and BARI Sarisha-16 were evaluated separately in five trials for their
adaptation in charland. Among the studied crops, lentil var. BARI Masur-6,
maize var. BARI Hybrid maize-9, soybean var. BARI Soybean-6, potato var.
BARI Alu-7 and mustard var. BARI Sarisha-11performed better in the charland
under climate change situation in Bangladesh.
Keywords: Crop Productivity, Adaptation, Crop Varieties, Charland, Climate
Change.
Introduction
Climate change refers to a change of climate that is attributed directly or
indirectly to human activities. Bangladesh is extremely vulnerable to climate
change impacts because of its geographical location, high population density,
high levels of poverty, and the dependence of many livelihoods on climate-
sensitive sectors, particularly agriculture and fisheries. Climate change will result
in greater variation in weather patterns or weather events such as irregular floods
(Mirza, 2002), increase in droughts (Amin et al., 2008), too much rainfall in
monsoon and too little rainfall in the dry season (Tanner et al., 2007), frequent
cyclone and storms (Salauddin and Ashikuzzaman, 2012), gradual rise in average
temperature (Islam et al., 2008), increase in intrusion of saline water (Ali et al.,
1&3Principal Scientific Officer, Agronomy Division, Bangladesh Agricultural Research
Institute (BARI), Gazipur, 2Senior Scientific Officer, On Farm Research Division, BARI,
Kushtia, 4Chief Scientific Officer, Farm Division, BARI, Gazipur, Bangladesh.

630 ISLAM et al.
2014), rise in sea-levels (Islam, 1994) as well as frequent river bank erosion and
formation of char land (Ahmed, 2006) in Bangladesh. In crop production
systems, screening and introducing adaptable crop varieties for char land eco-
system would be needed to address the climate change issues.
Chars are the lands that emerge as islands within the river channel or as attached
land to the riverbanks as a result of the dynamics of erosion and accretion in the
rivers of Bangladesh (Sattar and Islam, 2010). Char land areas are estimated to be
0.72 million hectares in Bangladesh which is about 5% of the country area and
about 6.5 million people (5% of the country’s population) live there (EGIS,
2000). It is mentionable that 64 to 97% of the char areas are cultivable (Ahmed et
al., 1987). The Char dwellers mainly depend on agriculture and agriculture
related activities. Other opportunities such as off farm activities are marginal
there. So, to increase cropping intensity and crop productivity in stress prone
areas like charland is urgently needed. Generally farmers in char lands cultivate
potato, hybrid maize, sweet potato, mustard, lentil, grasspea, field pea,
blackgram, chilli, proso millet, muskmelon, bitter gourd, sweet gourd, groundnut,
sugarcane etc. in rabi season and aus rice, jute, foxtail millet and sesame etc. in
kharif season with local variety and low management practices. As a result, much
lower yield is achieved in char areas (Islam et al., 2012). Introduction of new
crops with modern varieties (MV) along with appropriate agronomic
management practices would boost up the farm productivity that will reduce the
poverty level of resource poor farmers of that area.
Improvement of crop productivity and livelihood pattern as well as enhancement
of food security of all char land people is very cumbersome in relation to climate
change situation. As such char area under Bheramara Upazilla in Kushtia district
(Agro-ecological zone 11) was selected as the experimental site. Information
relating varietal adaptability of different crops like lentil, mustard, potato, hybrid
maize and soybean in the study areas of char land eco-system under climate
change situation is meagre. Therefore, five separate experiments were conducted
to select adaptable varieties of aforesaid crops for charland of the Padma River
under Kushtia district to increase crop productivity in that area.
Materials and Method
Five separate experiments were conducted at Golapnagar char of the Padma
River under Bheramara Upazilla in Kushtia district during the period from
November 2012 to May 2013. The soil of the experimental area was silty loam in
texture belonging to Calcareous Dark Grey Foodplain soil (Agro-ecological zone
11). Soil samples from experimental area were collected from 0-20 cm depth
prior to set up experiments and analyzed in the laboratory. Results of soil
analysis are presented in Table 1. The soil was neutral in soil reaction, low in
organic matter and available P content. Total N and available S content were very

PERFORMANCE OF DIFFERENT CROPS PRODUCTIVITY ENHANCEMENT 631
low but medium in exchangeable K and available B content. Each experiment
was laid out in randomized complete block design with five disperse replications.
The unit plot size was 8m x 10m.
Table 1. Chemical properties of experimental soil
Location pH
OM
(%)
Total
N
(%)
Available
P
(µg/ml)
Exchange-
able K
(meg/100g)
Available
S
(µg/ml)
Available
B
(µg/ml)
Golapnagar char 7.04 1.14
0.070
7.33
0.190
5.10
0.285
Status of soil L VL L M VL L
OM= Organic matter, L= low, VL= very low, M= medium.
Experiment 1
Three high yielding lentil varieties viz. BARI Masur-4, BARI Masur-5 and BARI
Masur-6 were tested for their adaptability and compared with local variety in
charland eco-system under climate change situation. The crop received total
rainfall of 13 mm during growing period. The average maximum and minimum
air temperatures during crop period were 26.9 oC and 14.1 oC, respectively. The
initial soil moisture content at the time of sowing was 20-22% by weight. Seeds
of lentil were sown 30 cm apart in solid line on 12 November, 2012. Fertilizers
@ 20-36-25 kg/ha of NPK (FRG, 2012) were applied at the time of final land
preparation in the form of urea, triple super phosphate and muriate of potash.
One hand weeding was done at 25 days after sowing (DAS). The crop was
harvested on 03 March, 2013 (111 DAS).
Experiment 2
Three BARI developed hybrid maize varieties viz. BARI Hybrid maize-5, BARI
Hybrid maize-7 and BARI Hybrid maize-9 were evaluated for their adaptability
and compared with Pacific-11(an imported maize hybrid) in char land under
climate change situation. The crop received total rainfall of 156 mm during
growing period. The average maximum and minimum air temperatures during
crop period were 28.9 oC and 20.5 oC, respectively. The initial soil moisture
content at the time of sowing was 19-21% by weight. Seeds were sown on 27
November in 2012 with 60 cm x 20 cm spacing. The crop was fertilized with
250-55-110-50-5 kg/ha of NPKSZn (FRG, 2012). One third N and full amount of
other fertilizers were applied at the time of final land preparation in the form of
urea, triple super phosphate, muriate of potash, gypsum and zinc sulphate. Rest
amount of N were applied in two equal splits at 30 and 60 DAS followed by
irrigations. One hand weeding and earthing up was done at 20 and 40 DAS,

632 ISLAM et al.
respectively. The crop was harvested at maturity stage on 26 April, 2013 (150
DAS).
Experiment 3
Three soybean varieties viz. BARI Soybean-5, BARI Soybean-6 and Shohag
were evaluated for their adaptability in char land under climate change situation.
The initial soil moisture content at the time of sowing was 18-20% by weight.
Seeds were sown with a spacing of 30 cm ×5 cm on 22 January, 2013. The crop
received total rainfall of 295 mm during growing period. The average maximum
and minimum air temperatures during crop period were 30.6 oC and 18.4 oC,
respectively. Crops were fertilized with 28-35-60-20 kg/ha of NPK (FRG, 2012)
as urea, triple super phosphate, muriate of potash, and gypsum, respectively. All
fertilizers were applied during final land preparation as basal. Two irrigations
were applied at 30 and 60 DAS. One hand weeding was done at 25 DAS. The
crop was harvested at maturity stage on 17 May, 2013 (115 DAS).
Experiment 4
Three BARI developed potato varieties viz. BARI Alu-7 (Diamant), BARI Alu-8
(Cardinal) and BARI Alu-31 (Sagita) were evaluated for their adaptability and
compared with Belgium (farmers practicing variety) in char land under climate
change situation. The initial soil moisture content at the time of sowing was 22-
24% by weight. Potato tubers were planted on 20 November, 2012 with 60 cm x
25 cm spacing. The crop received total rainfall of 13 mm during growing period.
The average maximum and minimum air temperatures during crop period were
26.0 oC and 13.9 oC, respectively. The crop was fertilized with 198-44-194-24-6-
1.2 kg/ha NPKSZnB (FRG, 2012). Half of N and full dose of other fertilizers
were applied as basal in the form of urea, triple super phosphate, muriate of
potash, gypsum, zinc sulphate and boric acid, respectively. The remaining N was
top dressed at 30 days after potato planting followed by irrigation. Earthing up of
potato and other intercultural operations were done as and when required. The
crop was harvested on 25 February, 2013 (97 DAS).
Experiment 5
Five HYV mustard varieties viz., BARI Sarisha-11, BARI Sarisha-13, BARI
Sarisha-14, BARI Sarisha-15 and BARI Sarisha-16 were tested for their
adaptability in char areas under climate change situation. The crop received total
rainfall of 14 mm during growing period. The average maximum and minimum
air temperatures during crop period were 26.2 oC and 14.1 oC, respectively.
Mustard was grown with 160-46-120-36-4 kg/ha NPKSZn (FRG, 2012). Half of
nitrogen and full quantity of PKSZn were applied as basal in the form of urea,
triple super phosphate, muriate of potash, gypsum and zinc sulphate,

PERFORMANCE OF DIFFERENT CROPS PRODUCTIVITY ENHANCEMENT 633
respectively. The initial soil moisture content at the time of sowing was 22-22%
by weight. Seeds of each variety were sown in 30 cm apart solid line on 20
November, 2012. Remaining half of nitrogen was applied at the time of flower
initiation (20-25 DAS) as top dressing followed by irrigation. The crop was kept
weed free up to 20 DAS by two hand weedings at 10 and 20 DAS. Harvesting of
different varieties was done from 12 February to 02 March, 2013 depending on
maturity.
In each experiment, data on plant population per square metre were recorded
from randomly selected three places and on yield contributing characters from
randomly selected 10 plants in each plot. Yield was taken from whole plot.
Collected data were analyzed statistically and the means were adjudged using
Least Significant Difference (LSD) test at 5% level of significance.
Results and Discussion
Experiment 1
Yield and yield contributing characters of lentil varieties are presented in Table
2. Number of days required from sowing to harvesting (108-111 days) of
different high yielding variety (BARI Masur-4, BARI Masur-5, BARI Masur-6)
and local variety of lentil did not differ significantly. However, BARI developed
lentil varieties required 2-3 days more than local variety. Plant population/m2 of
different lentil varieties were statistically similar and numerically higher in local
variety. Number of pods/plant of different lentil varieties varied significantly.
The maximum number of pods/plant (67) was recorded in BARI Masur-6, which
was statistically identical to BARI Masur-5 (59). The lowest number of
pods/plant was observed in local variety. The highest number of pods/plant in
BARI Masur-6 was contributed due to profuse pod setting. Number of seeds/pod
between BARI Masur-6 (1.9) and BARI Masur-5 (1.8) was statistically at par.
The minimum number of seeds/pod was obtained from local variety (1.2).
Thousand seed weight i.e. seed size is a genetically controlled trait of lentil. The
maximum 1000-seed weight was recorded in BARI Masur-6 (22.5 g) which was
statistically identical with BARI Masur-4 (21.4 g) and BARI Masur-5 (21.9g).
The lowest 1000-seed weight (18.0 g) was observed in local variety. Seed yield
of lentil varieties also differed significantly (Table 2). The maximum seed yield
was recorded in BARI Masur-6 (1042 kg/ha) and it was statistically similar with
BARI Masur-5 (1032 kg/ha) and BARI Masur-4 (1019 kg/ha). Local lentil
variety produced the lowest seed yield (875 kg/ha). Seed yield of BARI
developed lentil varieties was 16.5 – 19.1% higher than local lentil variety. The
higher seed yield in BARI developed lentil varieties were attributed to higher
pods/plant, seeds/pod and 1000- seed weight. Similar findings were obtained by
Islam et al. (2010). The results revealed that high yielding variety of lentil
developed by BARI performed better in char land eco-system under climate
change situation.

634 ISLAM et al.
Table 2. Seed yield and yield contributing characters of lentil varieties at char land
eco-systems under climate change situation (Kushtia, 2012-13)
Varieties
Days to
maturity
Plant/
m2
(no.)
Pods/
plant
(no.)
Seeds/
pod
(no.)
1000
seed
wt.
(g)
Seed yield
(kg/ha)
Yield increase
over local
(%)
BARI Masur- 4 110 159 54 1.7 21.4 1019 16.5
BARI Masur- 5 111 169 59 1.8 21.9 1031 17.8
BARI Masur- 6 111 154 67 1.9 22.5 1042 19.1
Local variety 108 177 43 1.2 18.0 875 -
LSD (0.05) NS NS 6 0.1 1.2 150 -
CV (%) 13 11 8 6 4 11 -
NS = Not significant
Table 3. Grain yield and yield contributing characters of hybrid maize varieties at
char land eco-systems under climate change situation (Kushtia, 2012-13).
Varieties
Plants
/m2
(no.)
Cobs/
plant
(no.)
Grains/
cob
(no.)
1000
grain
wt.(g)
Grain
yield
(t/ha)
Yield
increase
over Pacific
11 (%)
BARI Hybrid maize-5 7.96 1.0 410 312.6 7.14 1.4
BARI Hybrid maize-7 8.24 1.2 403 334.3 9.32 32.4
BARI Hybrid maize-9 8.24 1.2 431 345.0 10.29 46.2
Pacific-11 8.24 1.0 392 311.5 7.04 -
LSD (0.05) NS 0.1 23 10.8 1.18 -
CV (%) 8.2 6 4.1 2.4 10.1 -
NS = Not significant
Experiment 2
Yield and yield components of hybrid maize varieties except plant population/m2
differed significantly (Table 3). Plant population/m2 in all maize hybrids was
identical but it was slightly lower in BARI Hybrid maize-5 (7.96) due to lower
germination of seed. Similar number of cobs/plant (1.2) was recorded in BARI
Hybrid maize-7 and BARI Hybrid maize-9 while lower cobs/plant (1.0) was
obtained from BARI Hybrid maize-5 and Pacific-11. The maximum number of
grains/cob was recorded in BARI Hybrid maize-9 (431) which was identical with
BARI Hybrid maize-5 (410). The lowest number of grains/cob (392) was found
from Pacific-11 but at par with BARI Hybrid maize-7 (403) and BARI Hybrid
maize-5 (410). Thousand grain weight of maize hybrids is a genetically control

PERFORMANCE OF DIFFERENT CROPS PRODUCTIVITY ENHANCEMENT 635
parameter but it may be changed through changing the environment of growing
place. The maximum 1000-grain weight was obtained from BARI Hybrid maize-
9 (345.0g) which was at par with BARI Hybrid maize-7 (334.3g). Grain size of
Pacific -11 was minimum (311.5g) followed by BARI Hybrid maize-5 (312.6g).
The highest grain yield was recorded in BARI Hybrid maize-9 (10.29 t/ha) and it
was statistically identical with BARI Hybrid maize-7 (9.32 t/ha) and these two
varieties produced 46.2% and 32.4% higher yield, respectively than Pacific-11
(an imported maize hybrid). On the contrary, yield performance of BARI Hybrid
maize-5 (7.14 t/ha) and Pacific-11 (7.04 t/ha) was similar in char areas under
climate change situation. The higher grain yield of BARI Hybrid maize-9 and
BARI Hybrid maize-7 was contributed to the cumulative effect of yield
attributes. Similar findings were reported by Begum et al. (2010). The results
revealed that BARI Hybrid maize-9 exhibited the best performance in char land
areas under climate change situation. Alternately, BARI Hybrid maize-7 could be
grown for getting higher grain yield as compared to Pacific-11. Though BARI
Hybrid maize-5 is a quality protein variety but failed to show higher yield due to
lower cobs/plant and 1000- grain weight and can not be suitable in charland area.
Table 4. Seed yield and yield contributing characters of soybean varieties at char
land eco-systems under climate change situation (Kushtia, 2012-13).
Varieties Days to
maturity
Plant/m2
(no.)
Pods/
plant
(no.)
Seeds/
pod
(no.)
1000
seed wt.
(g)
Seed yield
(kg/ha)
BARI Soybean-5 113 35.6 48.8 2.5 141.0 1531
BARI Soybean-6 115 35.9 57.2 2.8 146.0 2099
Sohag 113 36.2 54.3 1.9 107.3 1002
LSD (0.05) NS NS 4.5 0.1 3.2 185
CV (%) 8.9 9.3 7.2 3.5 2.1 10.3
Experiment 3
Plant population/m2, number of pods/plant, seeds/pod, 1000-seed weight and
seed yield/ha of soybean varieties are presented in Table 4. Plant population/m2
and days to maturity of different soybean varieties did not differ significantly due
to uniform planting system. Number of pods/plant, seeds/pod and 1000-seed
weight of soybean varieties varied significantly in char land eco-system under
climate change situation (Table 4). BARI Soybean-6 produced profuse pods, as a
result, the highest number of pods/plant (57.2) was recorded in this variety and it
was statistically identical with Sohag (54.3). BARI Soybean-5 produced
minimum number of pods/plant (48.8). Seeds/pod is a genetically controlled trait
and sometimes it may be changed by environmental influence. The highest
number of seeds/pod (2.8) was obtained from BARI Soybean-6 and the lowest

636 ISLAM et al.
(1.9) from Sohag. Thousand seed weight followed a similar trend to seeds/pod.
Seed yield of soybean varieties differed significantly in char land eco-system.
BARI Soybean-6 produced the highest seed yield (2099 kg/ha) while Sohag was
the lowest yielder (1002 kg/ha). Yield variation in different soybean varieties was
attributed to the cumulative effects of different yield components. Similar finding
was also reported by Islam and Biswas (2010). The results revealed that the
performance of BARI Soybean-6 was the best in char land eco-system under
climate change situation.
Table 5. Tuber yield and yield contributing characters of potato varieties at char
land eco-systems under climate change situation (Kushtia, 2012-13).
Varieties Plant/m2
(no.)
Tuber/pl
ant
(no.)
Tuber wt
/plant
(g)
Single
tuber
wt. (no.)
Tuber
yield
(t/ha)
Yield
increase over
local
(%)
BARI Alu-7 (Diamant) 6.66 9.6 522 54.4 27.82 33.9
BARI Alu-8 (Cardinal) 6.66 8.9 473 53.1 25.18 21.2
BARI Alu-31 (Sagita) 6.66 8.3 460 55.4 24.50 18.0
Local (Belgium) 6.66 6.4 390 60.9 20.77 -
LSD (0.05) NS 0.7 33 3.8 3.11 -
CV (%) 2.3 6.5 5.2 4.9 9.2 -
Experiment 4
Number of tubers/plant, tuber weight/plant, single tuber weight and tuber
yield/ha of potato varieties differed significantly (Table 5). Tuber producing
capacity of potato varieties was different. BARI developed potato varieties were
superior to Belgium (farmers practicing variety) in respect of tubers/plant. The
maximum number of tubers/plant (9.6) was recorded in BARI Alu-7 which was
statistically identical with BARI Alu-8 (8.9). The minimum number of
tubers/plant (6.4) was found from Belgium. Tuber weight/plant varied among
potato varieties. The highest tuber weight/plant (522g) was found from BARI
Alu-7. Tuber weight/plant of BARI Alu-8 (473g) and BARI Alu-31 (460 g) was
at par while the lowest in Belgium (390 g).Tuber weight/plant directly
contributed to the variation in yield of potato varieties rather than single tuber
weight/plant. The largest sized tuber (60.9 g) was obtained from Belgium variety.
On the contrary, tuber size of BARI potato varieties was identical (53.1-55.4 g)
and significantly lower than Belgium variety. Tuber yield of potato varieties
varied significantly and the highest tuber yield (27.82 t/ha) was obtained from
BARI Alu-7 which was at par with BARI Alu-8 (25.18 t/ha). The higher tuber
yield in the aforesaid variety was occurred due to tuber/plant and tuber
weight/plant though single tuber weight was much lower than Belgium variety.

PERFORMANCE OF DIFFERENT CROPS PRODUCTIVITY ENHANCEMENT 637
Similar finding was corroborated with Abdullah et al. (2009). Belgium potato
variety produced the lowest tuber yield (20.77 t/ha) due to lower tuber/plant as
well as tuber weight/plant. Tuber yield of BARI developed potato varieties
showed 18.0-33.9% higher than Belgium variety. The results revealed that BARI
Alu-7 exhibited the best performance in char land eco-systems under climate
change situation. Alternately, BARI Alu-8 might be grown in char land areas.
Experiment 5
Yield and yield components of mustard varieties are presented in Table 6.
Number of days required from sowing to harvesting (84-102 days) of mustard
varieties differed significantly. The duration of BARI Sarisha-16 was the longest
(102 days) which was at par with BARI Sarisha-11 (101 days) and BARI
Sarisha-13 (101 days). On the contrary, duration of BARI Sarisha-14 (84 days)
and BARI Sarisha-15 (88 days) was identical but 8-14 days shorter than BARI
Sarisha-16. Plant population/m2 of different mustard varieties was statistically
similar (55-60 plants/m2) due to same planting system. On the other hand,
number of siliqua/plant was significantly different among the varieties (Table 6).
The highest number of siliqua/plant was recorded in BARI Sarisha-11 (155)
which was identical with BARI Sarisha-16 (146). Inversely, BARI Sarisha-13
(69) and BARI Sarisha-15 (60) produced statistically similar number of
siliqua/plant but much lower than BARI Sarisha-16 (146). The lowest number of
siliqua/plant was observed in BARI Sarisha-14 (44). Number of seeds/siliqua is a
genetically controlled trait and it also differed significantly in different mustard
varieties. BARI Sarisha-14 had the highest number of seeds/siliqua (31). BARI
Sarisha-11 (12) and BARI Sarisha-16 (12) produced statistically identical
number of seeds/siliqua. Thousand seed weight of mustard varieties also varied
significantly. Seed size i.e. 1000-seed weight of BARI Sarisha-13 (3.0 g), BARI
Sarisha-14 (3.1 g) and BARI Sarisha-15 (3.2 g) was identical. BARI Sarisha-11
produced the smaller sized seeds (2.8g) which was statistically similar with
BARI Sarisha-16 (2.9 g).
Yield is directly proportional to the cumulative effect of yield components. The
highest seed yield was recorded in BARI Sarisha-11 (1536 kg/ha) which was at
par with BARI Sarisha-16 (1499 kg/ha). The higher seed yields in the aforesaid
varieties were occurred due to higher number of siliqua/plant though much lower
in seeds/siliqua and also seed size. Mian and Islam (2010) also reported higher
seed yield due to higher siliqua/plant. On the contrary, as a short duration
varieties, BARI Sarisha-14 (1205 kg/ha) and BARI Sarisha-15 (1267 kg/ha)
produced significantly lower yield compared to long duration varieties (101-102
days). The results revealed that BARI Sarisha-11 and BARI Sarisha-16 (long
duration varieties) could be grown in char land areas for higher yield but if other
crops grown in kharif-I then short duration mustard variety BARI Sarisha-14 and
BARI Sarisha-15 may be grown.

638 ISLAM et al.
Table 6. Seed yield and yield contributing characters of mustard varieties at char
land eco-system under climate change situation (Kushtia, 2012-13).
Varieties Days to
maturity
Plant /m2
(no.)
Siliqua/
plant
(no.)
Seeds/
siliqua
(no.)
1000- seed
wt. (g)
Seed yield
(kg/ha)
BARI Sarisha-11 101 59 155 12 2.8 1536
BARI Sarisha-13 101 55 69 25 3.0 1423
BARI Sarisha-14 84 57 44 31 3.1 1205
BARI Sarisha-15 88 60 60 22 3.2 1267
BARI Sarisha-16 102 59 146 12 2.9 1499
LSD (0.05) 9.0 NS 9.5 0.9 0.2 111
CV (%) 7.3 10.1 7.5 3.4 5.1 6.0
NS = Not significant
Conclusion
The results revealed that BARI Masur-6 of lentil; BARI Hybrid maize-9 of
hybrid maize; BARI Soybean-6 of soybean; BARI Alu-7 of potato and BARI
Sarisha-11 of mustard performed the best in Golapnagar charland under climate
change situation in Bangladesh.
Acknowledgement
The authors are grateful to the Ministry of Science and Technology, Government
of the People’s Republic of Bangladesh for providing fund to conduct the
research at charland eco-system.
References
Abdullah, S., B.C. Kundu, A.T.M.T. Islam, M.K. Islam and S. Akhter. 2009. Effect of
planting time on the yield of processing varieties of potato. Annual Report (2008-
2009). Tuber Crops Research Centre, Bangladesh Agricultural Research Institute,
Joydebpur, Gazipur-1701. Pp. 86-89.
Ahmed, A.U. 2006. Bangladesh Climate Change Impacts and Vulnerability: A
Synthesis. Dhaka : Climate Change Cell, Bangladesh Department of Environment.
Pp. 69-88.
Ahmed, M. M., N. Alam, N. K. Kar, A. F. M. Maniruzzaman, Z. Abedin and G.
Jasimuddin. 1987. Crop production in saline and charlands–Existing situation and
potentials. pp.1-27. In Advances in Agronomic Research in Bangladesh. Vol. 2.
Ali, M.Y., S. Al-Emran , S. M. Zaman , M. B. Islam and S. E. Raheem.2014.
Adaptation to climate change in coastal saline area of south-western region of
Bangladesh. Int. J. Sustain. Agril. Tech. 10(4): 09-16. An online Journal of “G-

PERFORMANCE OF DIFFERENT CROPS PRODUCTIVITY ENHANCEMENT 639
Science Implementation and Publication”, website: www.gurpukur.com or
www.gscience.net
Amin, M., M. A. Rahman, S. M. Zaman, M. I. A. Howlader, M. Z. Hossain and M. S.
Islam. 2008. Cropping system in coastal and Barind area. Paper presented in
National workshop on Multiple Cropping, held at BARC, Farmgate, Dhaka on 23-24
April, 2008.
Begum, S., M.N. Islam, S.S. Kaon and W. Sultana. 2010. Performance of hybrid maize in
char land areas. Char land Research 2007-2010, Agronomy Division, Bangladesh
Agricultural Research Institute, Joydebpur, Gazipur-1701. Pp. 08-10.
EGIS (Environmental and Geographical information System). 2000. Riverine Chars in
Bangladesh- environmental dynamics and management issues. Environment and GIS
Support Project for Water Sector Planning (EGIS). University Press Ltd. ISBN 984
05 1580 2.
FRG. 2012. Fertilizer Recommendation Guide, Bangladesh Agricultural Research
Council (BARC), Farmgate, Dhaka 1215. 274 P.
Islam, M. B., M. Y. Ali, M. Amin and SK. M. Zaman 2008. Climatic variations: Farming
systems and livelihoods in the High Barind Tract and coastal areas of Bangladesh.
Paper presented in the international symposium on climate change and food security
in South Asia held on 25-30 August 2008, Dhaka, Bangladesh.
Islam, M. N. and M. Biswas. 2010. Performance of soybean varieties in the charland
area. Annual Research Report (2009-2010). Agronomy Division, Bangladesh
Agricultural Research Institute, Joydebpur, Gazipur-1701. Pp. 97-98.
Islam, M. N., M. Akhteruzzamam and S. Rahman. 2010. Performance of lentil varieties
in charland areas. Annual Research Report (2009-2010). Agronomy Division,
Bangladesh Agricultural Research Institute, Joydebpur, Gazipur-1701. Pp. 76-77.
Islam, M.N., M. A. Hossain, M. Mohiuddin, M.A.K. Mian, M. Biswas and M.
Akhteruzzaman. 2012. Crops and cropping of char areas in Bangladesh. Bangladesh
Agron. J. 15(2): 1-10.
Islam, T. 1994. Vulnerability of Bangladesh to Climate Change and Sea Level Rise:
Concepts and Tools for Calculating Risk in Integrated Coastal Zone Management.
Summary Report. Dhaka : Bangladesh Centre for Advanced Studies, Resource
Analysis, The Netherlands and Approtech Consultants Limited. Pp. 89-95.
Mian, M.A.K. and M.R. Islam. 2010. Adaptation of BARI released crop varieties in char
land. Annual Research Report (2009-2010). Agronomy Division, Bangladesh
Agricultural Research Institute, Joydebpur, Gazipur-1701. Pp. 93-94.
Mirza, M. M. Q. 2002. Global warming and changes in the probability of occurrence of
floods in Bangladesh and implications. Global Environmental Change. 12: 127-138.
Salauddin, M. and M. Ashikuzzaman. 2012. Nature and extent of population
displacement due to climate change triggered disasters in south-western coastal
region of Bangladesh. International Journal of Climate Change Strategies and
Management 4(1): 54-65.

640 ISLAM et al.
Sattar, S. A. and M. N. Islam. 2010. Charlands of Bangladesh: Their extent, management
practices and future research needs. Paper presented at the workshop on "Soil
fertility, fertilizer management and future research strategy" held on 18-19 January,
2010 at Bangladesh Agricultural Research Council, Farm gate, Dhaka.
Tanner T.M., Hassan A, Islam KMN, Conway, D, Mechler R, Ahmed AU, and Alam, M.
2007. ORCHID: Piloting Climate Risk Screening in DFID Bangladesh. Detailed
Research Report. Institute of Development Studies, University of Sussex, UK. Pp.
56-77.

ISSN 0258-7122
Bangladesh J. Agril. Res. 40(4): 641-656, December 2015
IMPACT OF HARVEST STAGE ON SEED YIELD QUALITY AND
STORABILITY OF FRENCH BEAN
MD. RAYHAN SHAHEB1, MD. NAZMUL ISLAM2, ASHRATUN NESSA3
MD. ALTAB HOSSAIN4 AND AYESHA SARKER5
Abstract
Good quality seeds are one of the least expensive but vital factors influencing
yield potential and key to agriculture progress. Studies were conducted both in
the field and laboratory with the objective to observe the impact of harvest stage
on the seed, quality and storability of French bean. Five harvest stages viz. H1-
deep green with light yellow colours of pod, H2-50% green and 50% yellowing
of pods, H3-light brown with few yellow colour pods, H4-90% brown colour of
pods and H5-100% brown colour and dried pods were considered as treatments
for field trial. Harvested seeds were then stored in both cool room and ambient
conditions up to 16 months and performed seed quality studies in every 4
months. The treatments combination of laboratory studies were T1: H1 seed
storage in cool room (SSCR), T2: H1 seed storage in ambient (SSAB), T3: H2
SSCR, T4: H2 SSAB; T5: H3 SSCR; T6: H3 SSAB; T7: H4 SSCR; T8: H4 SSAB;
T9: H5 SSCR and T10: H5 SSAB. Experiments were laid out in a RCBD and
CRD in the field and laboratory, respectively. Results revealed that the highest
seed yield and quality of French bean was observed in H3. On the contrary, seed
harvested in H4 and stored in cool room (with the mean temperature 18-20oC
and relative humidity around 60-70%) recorded the highest storability compared
to ambient condition. However, seeds harvested in H3 and H5 were also showed
better storability in cool room as well as ambient conditions. To sum up, all the
seed quality parameters were satisfactorily well up to 12 months of storage then
it declined in quality.
Keywords: Harvest stage, French bean, seed yield, seed storage, seed quality
Introduction
French bean (Phaseolus vulgaris L.) is a pulse crop but used as vegetable in
Bangladesh. It is ranked high as cheap sources of nourishing food, rich in protein,
carbohydrates, vitamins, calcium, iron etc. The immature pod and tender and also
dry beans of French bean has a possibility to meet up a good share of vegetables
demand in Bangladesh (BARI, 2011). The crop is generally cultivated in
Chittagong hill tracts districts, Sylhet and also some parts of northern region in
Bangladesh. The requirement of quality seeds of French bean was 10.5 t ha-1 in
1Senior Scientific Officer, OFRD, Bangladesh Agricultural Research Institute (BARI),
Sylhet-3100, 2Scientific Officer, 3Chief Scientific Officer, Seed Technology Division, 4Director (Ex.), Horticulture Research Centre, 5Assistant Professor, Dept. of Food
Engineering and Tea Technology, Shahjalal University of Science and Technology,
Sylhet-3100, Bangladesh.

642 SHAHEB et al.
the country but the supply was only 6.2 t ha-1 (Rakhi, 2000). There are many
factors that can narrow down the gap between potential and farm level yield.
Among them, use of quality seed is the most important one (Ahmad, 2001), as
quality seeds ensure better germination and increase yield as high as 30%
keeping the other factors of production as constant (BARI, 1993). Huda (2001)
reported that ten to fifteen percent production could be reduced due to use of
poor quality seed. Kumar et al. (2002) asserted that seed yield and quality largely
depends on the stage of maturity of crops. Results from the study of Mehta et al.
(1993) found that chickpea seed attained maximum dry matter when most pods
are appeared as light brown with a few yellow green colour stages.
Greven et al. (2004) reported that later sowing, higher plant populations,
desiccation and earlier harvesting reduced seed size of dwarf French beans, but
significant differences were found in seed vigour. Seed storability depends on
storage conditions (humidity and temperature), moisture content and physical
state of seeds, stage of seed maturity, external factors (temperature, relative
humidity and micro flora) and genetic factors (Ayyub et al., 2007). Although,
Mahesha et al. (2001) alluded that storability of seed is mainly a genetical
character and is influenced by pre-storage history of seed, seed maturation and
environmental factors during pre and post-harvest stages. There is hardly any
literature available on appropriate harvest stage of French bean in Bangladesh
condition where seed quality will be maximized and that will affects on
subsequent viability and storability. Considering the above points of view, the
present experiments were undertaken to find out the impact of harvest stage on
seed, quality and storability of French bean.
Materials and Method
Experimental site, design and management
Studies were conducted at the research field and laboratory of Seed Technology
Division, Bangladesh Agricultural Research Institute, Joydebpur, Gazipur,
Bangladesh during rabi season from 2008 to 2011. Five harvest stages viz. H1-
characterized by deep green with light yellow colours of pod, H2-50% green and
50% yellowing of pods, H3-light brown with few yellow colour pods, H4-90%
brown colour of pods and H5-100% brown colour and dried pods were
considered as treatments for field trial. Harvested seeds were then stored in both
cool room and ambient conditions up to 16 months and conducted seed quality
studies in every 4, 8, 12 and 16 Month in the laboratory. Thus, the combination
of treatments for laboratory studies were T1: H1 seed storage in cool room
(SSCR), T2: H1 seed storage in ambient (SSAB), T3: H2 SSCR, T4: H2 SSAB; T5:
H3 SSCR; T6: H3 SSAB; T7: H4 SSCR; T8: H4 SSAB; T9: H5 SSCR and T10: H5

IMPACT OF HARVEST STAGE ON SEED YIELD QUALITY 643
SSAB. Experiments were laid out in a RCBD and CRD in the field and
laboratory, respectively. The unit plot size was 12 m2. The land was fertilized
with 23-75-75-20 kg ha-1 of NPKS in the form of Urea, TSP, MoP and Gypsum,
respectively. Half of N and all other fertilizers were applied at the time of final
land preparation. The rest of N was applied at 30 days after sowing. Seeds of
French bean (cv. BARI Jharsheem-I) were sown in furrows @ 60 kg ha-1 in 30
cm apart from lines on 22 and 24 November in the year 2008 and 2009,
respectively. Before sowing, all seeds were treated with Bavistene @ 0.2 ml kg-1
of seed. Field emergences were recorded at 7 and 10 days after sowing of seed
and approximately more than 90% seeds germination were recorded. Intercultural
operations like weeding viz. two times each at 15 and 40 days after emergence
(DAE), thinning at 30 DAE, irrigation two times, each at 30 and 50 DAE,
respectively were accomplished. Fungicides Ridomil Gold and Diathene M 45 @
2 ml l-1 of water were sprayed 4 times alternatively at 7-10 days interval for
controlling of damping of disease. Pods were then harvested based on the
specified treatments. The collected pods were then threshed and seeds were sun
dried until the moisture content reach at 10-12%.
Weather recording
The average maximum and minimum air temperatures and total rainfall data
were collected from the weather station BRRI, Gazipur in every week during the
experimentation. Temperatures and relative humidity data were also recorded
daily during storability study trial in the laboratory by using wall thermometer
and moisture meter.
Data recording
Data on seed yield was recorded from individual plot and converted into t ha-1.
Dried seeds of different harvest stages were stored in air tied tin container at
moisture content 11.50% in cool room and ambient conditions up to sixteen
months. In every four month, seeds stored in cool room and ambient conditions
were sun dried and cooled at normal temperature under shade and then again
stored in the same way. The following quality parameters and seed vigour
contributing characters of seed were recorded:
Determination of moisture content
Moisture content of seed sample was determined according to ISTA (1999).
Moisture content data were taken before storage and every four months of
storage of French bean seed. Ground seed samples harvested at different stage
were taken into moisture cup and put into a pre heated oven at temperature of
103 ± 20C for one hour according to Morshed et al. (2003). After cooling, the
weight of the container with its cover and contents were taken. The seed samples

644 SHAHEB et al.
were cooled in desiccators and weighted to work out the percent moisture content
of the grains. The seed moisture content was determined by dry weight basis and
was calculated by the following formula:
Seed moisture content = 12
32
M
M
M
M
x 100 ................................................ (A)
Here,
M1 is the weight in ‘g’ of the container and its cover, M2 is the weight in ‘g’ of the container, its cover and its contents before drying and M3 is the weight in ‘g’ of the container, its cover and contents after drying.
Determination of germination percentage
The data on seed germination (%) was carried out by the following formula (ISTA, 1999). For each treatment, 100 seeds were put into large petridishes and then put at room temperature (25 ± 20C). After eight days, normal, abnormal and
diseased seeds were counted.
Seed germination = seed Total
germinated seed ofNumber x 100 ............................ (B)
Measurement of root and shoot length
From the eight days of seedlings, 10 plants were randomly selected. Seedlings
were then cut and root and shoot parts were separated and their lengths were
measured in each replication of each treatments using centimeter scale.
Determination of fresh and dry weight of seedling
After measurement of root and shoot length, fresh weight and dry weight of
seedlings were recorded. Then the roots and shoots were put into paper packet
and placed into the preheated oven (700C± 20C) for 48 hours. After cooling in
desiccators, the dry weights were taken.
Determination of vigour index
Seed vigour index is calculated and determined by multiplying germination (%)
and seedling length (Reddy and Khan, 2001).
Vigour index (VI)=(MRL+MSL)×PG………………………………………….(C)
Here,
VI, MRL, MSL and PG are for Vigour index, Mean root length (mm), Mean shoot length (mm) and Percentage germination, respectively.
The collected data were analyzed statistically following the ANOVA technique with the help of MSTAT-C software. The mean differences among the treatments were adjudged by LSD (Gomez and Gomez, 1984). The correlation co-efficient was done for different variables wherever needed.

IMPACT OF HARVEST STAGE ON SEED YIELD QUALITY 645
Results and Discussion
Weather data and results of experiments are presented in Fig.1-5 and Tables 1-5.
These are furnished below:
Weather conditions
The air temperature and rainfall regime experienced at the site in 2008-2010 were considered normal for this region and are presented in Fig.1. It was found that average maximum air temperature (34oC) was in the month of April in both the years while the lowest minimum air temperature (just above 9oC) was recorded in middle of January. There was almost no rainfall observed during the growing period (November to February) of French bean both the years except in the last
week of February where a very little amount of precipitation (5 mm) was recorded. However, total rainfall was recorded more or less in all rest of the months ranging from 5 mm to well above 160 mm. Average temperature and relative humidity (RH) data during storability study in the laboratory are also presented in Fig. 2 and 3. Fig. 2 shows that in 2009-10, the temperatures in cool room were ranged between 17-19oC from March 2009 to August 2010. While at
ambient condition these were varied between 25-32oC except in mid December 2009 to January 2010 where it was remained almost 20-22oC. The RH in cool room was recorded 78-84% up to October 2009 with some minor fluctuations then it increased and peaked (90%) at early December and remained static up to last week of January 2010. From this point, it decreased dramatically to about 68% RH in mid February 2010. After that the RH was 5-12% increasing in trend
with some fluctuations up to August 2010, where it was just above 78% in RH. At ambient condition, the RH was just above 35% in March 2009 and after that it was got an increasing in trend having the mean 60-65% RH and reached at apex 78% with some fluctuations in mid July 2009. From this point, there was a decrement of RH (about 45%) up to last week of September then increased up to mid October 2010. After that it turned slightly down up to 1st week of March
2010 with fluctuations. There was a slightly ceiling trend of RH (50%) from mid March to August 2010 (just below 80%) with some fluctuations (Fig. 2).
Similarly, in 2010-11, it was remarked that temperatures in cool room were fluctuated between 18-20oC from March 2010 to August 2011 (Fig. 3). But, ambient temperatures were recorded higher (22-31oC) than cool room during study periods. The cool room temperature ranged from 25-34oC from 3rd week of
March to mid May 2010. After that the temperatures were remained within 30-35oC up to mid October 2010 with some fluctuations. The temperature decrement started from end of October and touched the lowest mark about19oC in January 2011. From this point, temperatures rose with some oscillation and reached at peak (35oC) at end of April 2011 and almost unchanged up to August 2011. Observations of RH in cool room during 2010-11 showed that it was just above
80% in early of March and remained static up to August 2010 having the range 65-82% in RH. The RH trend line turned upward and touched the highest mark

646 SHAHEB et al.
88% in November 2010 and then remained the same up to early February 2011. After that it decreased to 68% in RH in mid March 2011 then an upward
tendency was observed up to mid June 2011 amounting about 86% RH. After remaining almost the static up to mid August 2011, it was observed decreasing in trend in RH. While in ambient condition, the RH was recorded about 60% in 1st week of March 2010 then deliberately decreased to just above 40% in mid March 2010. From this point there was an increasing in trend of RH with some fluctuations by touching the highest mark around 80% in mid June 2010. After
that the RH became static up to mid September 2010 (around 75%) then there was a decrement of RH with some oscillations up to mid December 2010 (around 45%). It was noted that from December 2010 to mid April 2011, the RH was remained around 55% and from this point there was an upward trend of RH up to August 2011 and onward (Fig. 3).
Fig. 1. Average maximum and minimum air temperatures (oC) and total rainfall
(mm) data from November to June in the year 2008-09 and 2009-10 at
Joydebpur, Gazipur
Fig. 2. Temperatures and relative humidity in cool room and ambient storage of
French bean during March 2009 to August 2010 (Source: Weather data
register book, Seed Technology laboratory, Seed Technology Division,
BARI, Gazipur).

IMPACT OF HARVEST STAGE ON SEED YIELD QUALITY 647
Fig. 3. Temperatures and relative humidity in cool room and ambient storage of
French bean during March 2010 to August 2011(Source: Weather data
register book, Seed Technology laboratory, Seed Technology Division,
BARI, Gazipur).
Fig. 4. Relationship between harvest stages on the seed yield of French bean (Pooled
of two years).
Seed yield of French bean
Result from the pooled data revealed that seed yield of French bean was
significantly influenced due to different harvest stages (Fig. 4). The highest seed
yield 1.23 t ha-1 was recorded in H3 and the lowest seed yield (0.69 t ha-1) was
obtained in H1. Pooled of two years regression co-efficient study revealed that
associations between harvest stage and with seed yield (r2 =0.63) showed highly
significant positive correlations. The present findings are in agreement with the
findings of Khatun et al. (2010) who observed that highest seed yield of chickpea
was recorded from the pods harvested at light brown with a few yellow green

648 SHAHEB et al.
colour stages. Kavak et al. (2012) observed that early and late harvests not only
decrease physical quality of seed lots but also decrease seed quality. Thus,
maximum seed quality of French bean may be ascertained during harvest at
physiological maturity (H3 stage).
Moisture content percentage (MC)
Before storage, the MC of French bean harvested seed was brought at 11.50%
(Table 1). Results observed that MC of French bean during storage was
significantly influenced by the harvest stage, storage conditions and periods
(Table 2). The lowest MC at 4 months (M) storage was recorded in T9 (12.20%)
and T7 (12.28%) while the maximum MC was observed in T8 and T4,
respectively. At 8 M storage, the MC was the lowest in T7 (12.62%) and the
maximum was in T10 (13.38%). Similar results were also observed in the seed
stored after 12 M. However, the minimum MC was recorded in T7 (12.51%) that
was statistically similar to T5 (12.82%) and T9 (12.83%). On the contrary, the
MC at 16 M storage was the lowest in T7 (12.59%) and the maximum was in T8
(14.44%). But, at end of 16 M storage, the MC was increased in trend specially
those who had stored in ambient condition (Table 2). Results revealed that
moisture content of seeds of all harvest stages found comparatively lower up to
12 M of storage then it increased onwards. Temperature and relative humidity
(RH) data both in cool room and ambient storage showed that seeds stored in
cool room got cooler temperatures 18-20oC that was much lower than ambient
storage in both the years (Fig. 2 and 3). RH was higher all the time in cool room
storage compared to ambient one. Therefore, RH around 60-70% and 18-20oC
temperature in cool room storage might be favoured to maintain lower MC in the
seed that might be played an important role to higher seed storability of French
bean. The findings are partially agreed with Ayyub et al. (2007) who reported
that good storage conditions, low MC of seed, stage of seed maturity etc. are
significantly influenced seed storability. The results of this study are also in
conformity with the findings of Coolbear (1995).
Germination percentage (GP)
Significant variations were found among seeds of different harvest stage on GP
of French bean both at before and during storage (Table 1 and 2). It was revealed
that the maximum GP (93.78 and 94.12%) were found in H3 in the year 2008-09
and 2009-10, respectively which was also similar to H4 and H5 for both the years.
The lowest GPs (62.7 and 64.11%) were recorded in H1 for both the years,
respectively. On the other hand, the highest GP of French bean seed at 4 M
storage was recorded in T9 (90.22%) while the lowest GP was found in T1
(58.33%). Similar results were also recorded at 8 and 12 M storage that were
statistically similar to T7 and T5, respectively. But the lowest GPs were observed

IMPACT OF HARVEST STAGE ON SEED YIELD QUALITY 649
Ta
ble
1.
Eff
ect
of
ha
rves
t ti
me
on
th
e se
ed
qu
ali
ty p
ara
met
ers
of
Fre
nch
bea
n b
efo
re s
tora
ge.
Tre
atm
ents
*
Mo
istu
re
conte
nt
(%)
Ger
min
atio
n (
%)
Ro
ot
leng
th (
cm
) S
ho
ot
len
gth
(cm
) S
eed
lin
g d
ry
wei
ght
(g)
Vig
our
ind
ex (
VI)
Y1
Y2
Y1
Y2
Y1
Y2
Y1
Y2
Y1
Y2
H1
11
.50
62
.67
6
4.1
1
8.3
9
7.9
8
18
.57
1
9.6
0
0.1
1
0.1
1
16
87
17
69
H 2
11
.50
74
.89
7
3.1
1
8.5
2
8.1
7
19
.42
2
1.2
5
0.1
2
0.1
1
20
92
21
53
H 3
11
.50
93
.78
9
4.1
2
9.5
9
10
.01
21
.25
2
2.5
9
0.1
4
0.1
3
28
91
30
69
H 4
11
.50
92
.89
9
0.5
6
9.5
8
8.9
7
20
.81
2
0.9
6
0.1
4
0.1
3
28
23
27
11
H 5
11
.50
92
.56
9
2.0
0
9.2
6
8.5
5
21
.26
2
0.9
1
0.1
2
0.1
2
28
25
27
12
LS
D (
0.0
5)
- 5
.12
1
5.2
18
0.3
859
0.7
531
0.8
12
1
.13
1
0.0
19
NS
1
18
.4
18
3.8
CV
(%
) -
3.2
6
3.3
5
2.5
4
.58
2.1
3
2.8
5
9.8
8
4.3
2
2.2
5
3.9
3
* H
1-d
eep
gre
en w
ith l
ight
yel
low
co
lours
of
po
d,
H2-5
0%
gre
en a
nd
50
% y
ello
win
g o
f p
od
s, H
3-l
ight
bro
wn w
ith
few
yel
low
co
lour
po
ds,
H4-9
0%
bro
wn c
olo
ur
of
po
ds
and
H5-1
00
% b
row
n c
olo
ur
and
dri
ed p
od
s an
d Y
1-2
00
8-0
9 a
nd
Y2-2
00
9-2
01
0.
Ta
ble
2.
Eff
ect
of
ha
rves
t ti
me,
sto
rag
e co
nd
itio
n a
nd
per
iod
s o
n t
he s
eed
mo
istu
re c
on
ten
t a
nd
see
d g
erm
ina
tio
n o
f F
ren
ch b
ean
(po
ole
d o
f tw
o y
ears
).
Tre
atm
ents
*
See
d m
ois
ture
co
nte
nt
(%)
See
d g
erm
inat
ion (
%)
4 M
8
M
12
M
16
M
4 M
8
M
12
M
16
M
T1:
H1 S
SC
R
12
.42
12
.76
12
.81
12
.89
58
.33
7
4.1
1
78
.61
75
.43
T2:
H1
SS
AB
1
2.6
7
12
.93
13
.59
13
.94
60
.00
7
6.6
7
78
.33
75
.00
T3:
H2 S
SC
R
12
.76
13
.03
12
.85
12
.66
73
.22
7
8.1
7
84
.33
87
.23
T4:
H2 S
SA
B
13
.15
12
.99
13
.40
13
.81
72
.33
8
0.6
7
81
.33
79
.63
T5:
H3
SS
CR
1
2.3
2
12
.79
12
.82
12
.76
88
.78
8
6.2
2
93
.28
87
.83
T6:
H3 S
SA
B
12
.84
13
.04
13
.67
14
.03
83
.67
8
5.0
0
83
.33
84
.07
T7:
H4 S
SC
R
12
.28
12
.62
12
.51
12
.59
85
.22
8
6.6
1
91
.29
87
.73
T8:
H4 S
SA
B
13
.17
13
.26
12
.68
14
.44
82
.50
8
4.5
0
90
.50
85
.25
T9:
H5 S
SC
R
12
.20
12
.80
12
.83
12
.51
90
.22
8
7.8
9
93
.65
87
.33
T10:
H5 S
SA
B
12
.74
13
.38
13
.37
14
.00
84
.89
8
6.0
0
89
.50
83
.50
LS
D(0
.05
) 0
.60
0.1
5
0.4
4
0.4
5
5.9
2
4.7
5
5.9
3
6.9
4
CV
(%
) 2
.78
2.0
2
1.9
5
1.9
7
4.4
6
3.3
7
4.0
3
4.8
9
* S
SC
R-S
eed
Sto
rage
in C
oo
l R
oo
m,
SS
AB
-See
d S
tora
ge
in a
mb
ient
and
M-M
onth

650 SHAHEB et al.
Ta
ble
3.
Eff
ect
of
ha
rves
t ti
me,
sto
rag
e p
erio
d a
nd
sto
rag
e co
nd
itio
ns
on
th
e se
edli
ng
ro
ot
an
d s
ho
ot
len
gth
of
Fre
nch
bea
n
(po
ole
d o
f tw
o y
ears
).
Tre
atm
ents
*
See
dli
ng r
oo
t le
ngth
(cm
) S
eed
lin
g s
ho
ot
leng
th (
cm
)
4 M
8
M
12
M
16
M
4 M
8
M
12
M
16
M
T1:
H1 S
SC
R
8.2
4
9.6
8
9.6
2
9.5
7
18
.93
1
6.1
2
16
.45
16
.83
T2:
H1
SS
AB
8
.17
8.8
8
9.4
3
9.4
2
18
.42
1
7.1
2
15
.42
15
.93
T3:
H2 S
SC
R
8.3
6
9.5
1
8.3
9
9.1
8
19
.26
1
6.9
9
15
.94
17
.46
T4:
H2 S
SA
B
8.7
7
9.2
4
9.5
3
9.2
4
19
.33
1
7.1
9
16
.36
16
.39
T5:
H3
SS
CR
9
.61
11
.47
12
.41
11
.37
21
.46
2
0.1
9
19
.42
17
.98
T6:
H3 S
SA
B
9.1
0
10
.52
10
.86
10
.82
21
.03
17
.17
18
.40
17
.07
T7:
H4 S
SC
R
9.2
7
10
.87
12
.20
11
.73
21
.53
2
0.5
6
18
.64
18
.83
T8:
H4 S
SA
B
8.7
7
10
.28
10
.46
10
.83
20
.77
1
9.1
7
17
.67
17
.02
T9:
H5 S
SC
R
9.2
4
10
.71
12
.60
11
.97
21
.07
1
9.8
3
19
.11
17
.42
T10:
H5 S
SA
B
8.9
0
10
.16
10
.57
10
.62
20
.43
1
7.4
9
17
.85
16
.77
LS
D(0
.05
) 0
.42
0.5
5
0.9
0
0.6
5
0.6
8
1.7
3
1.2
1
1.3
8
CV
(%
) 2
.81
3.2
2
4.9
8
3.6
3
1.9
9
5.5
8
4.0
6
4.7
4
* S
SC
R-S
eed
Sto
rage
in C
oo
l R
oo
m,
SS
AB
-See
d S
tora
ge
in a
mb
ient
and
M-M
onth

IMPACT OF HARVEST STAGE ON SEED YIELD QUALITY 651
in T1 (74.11%) and T2 (78.33%) at an end of 8 and 12 M storage, respectively. In
case of 16 M storage, the maximum GP of seed was recorded in T5 (87.33%) that
was statistically identical with T7 (87.73). The lowest GP was recorded in T2
treatment (75%) (Table 2). Results of this study are in conformity with the
findings of Seshu and Dadlani (1989) who reported that higher in seed quality
indicated by high seed germination % and vigour of the seed. Poor storage
conditions have been reported to cause 10% loss in seed quality (Genchev, 1997).
However, Eliud et al. (2010) asserted that longevity of bean seeds depends on the
ambient temperature and relative humidity at the stockiest stores.
Seedlings root length (SRL)
Results observed that harvest stage and storage conditions affected the SRL of
French bean both at pre-storage and during storage (Table 1 & 3). The longest
SRLs of French bean (9.59 and 10.01 cm) were found in H3 while the shortest
SRLs (8.39 and 7.98 cm) were recorded in H1 in the year 2008-09 and 2009-10,
respectively (Table 1). But, the longest SRL at 4 M storage of French bean was
recorded in T5 (9.61cm) and the shortest SRL was found in T2 (8.17 cm). Similar
results were also recorded at 8 M storage of French bean seed where, the
maximum SRL was found at T5 (11.47 cm) followed by T7 (1087 cm). It was
indicated that the longest SRL of French bean at 12 M storage was obtained in T9
(12.60 cm) and the shortest SRL was observed in T2 (9.43 cm). Statistically
similar result was also recorded in 16 M storage, where the longest SRL was
observed in T9 (11.97 cm) (Table 3).
Seedlings shoot length (SSL)
It was noted that harvest stage and storage conditions influenced significantly to
the SSL of French bean (Table 1 and 3). Similar to SRL, the longest SSLs of
French bean before storage (21.26 and 22.59 cm) were remarked in H5 and H3 in
the year 2008-09 and 2009-10, respectively while the shortest SSLs (18.57 and
19.60 cm) were recorded in H1 stage in both the years, respectively (Table 1).
Results from the storage of French bean seed at different storage conditions
showed that the longest SSL at 4 M storage was recorded in T7 (21.53 cm) while
the shortest SSL was found in T2 (18.42 cm). Similar results were also recorded
at 8 M storage of French bean seed. Result indicated that the maximum SSL of
French bean at 12 M storage was obtained in T5 (19.42 cm) that was statistically
similar with T9 (19.11cm) while the shortest SSL was observed in T2 (15.42cm).
Relevant results were also gained in 16 M storage, where the longest SSL was
observed in T7 (18.83 cm) and the shortest SSL was found in T2 (15.93 cm)
(Table 3).

652 SHAHEB et al.
Seedling dry weight (SDW)
SDW of French bean both at before (except in 2nd year) and during storage were
significantly influenced by different harvest stage and storage conditions (Table 1
and 4). It was revealed that the highest SDW (0.14 g) was recorded in both H3
and H4 while the lowest SDW (0.11g) was found in H1 and H2. SDW of French
bean at 4 M storage was recorded the maximum (0.134 g) in T8 followed by T7
and T5 (0.132 g) while the lowest SDW (0.111 g) was found T1. Significantly, the
maximum SDW of French bean at 8 M storage was recorded in T7 (0.144 g) that
was followed by T9 (0.143 g) and the lowest SDW (0.119 g) was gained in T2.
Results found that the highest SDW of French bean at 12 M storage was
remarked in T5 (0.159g) that was statistically similar with T7 (0.158 g).
Furthermore, at 16 M storage, the highest SDW was observed in T9 (0.148 g)
while the lowest SDW was confirmed in T2 (0.127 g) (Table 4).
Vigour index (VI)
It was observed that VI of before and during storage of French bean was
significantly varied due to different harvest stages, storage conditions and periods
(Table 1 and 4). It was indicated that the maximum VI of French bean (2891)
before storage was recorded in H3 that was statistically similar with H5 (2825)
and H4 (2823). Similar trends of VI were also observed in the year 2009-10
(Table 1). Results showed that the highest VI at 4 M storage was recorded in T5
(2759) while the lowest VI was found in T1 (1584). The same trends of result
were also recorded in VI of French bean at 8 M storage. But, at 12 M storage,
significantly higher VI (2972) of French bean was found in T9 that was
statistically similar with T5 (2971) and T7 (2814). However, VI of French bean at
16 M storage was found the maximum in T7 (2681) that was statistically similar
with T5 (2577) and T9 (2566) while the lowest VI was observed in T2 (1901)
(Table 7). The findings of the present investigation are agreed with Seshu and
Dadlani (1989) who reported that higher seed germination % and vigour resulted
in better seed quality. The results are also partially agreed with that of Bailly et
el. (2002) and Ayyub et al. (2007).
Correlation
Correlation matrix among the seed quality characters of French bean during
storage has been shown in Table 5. A positive and significant correlation was
observed between germination percentage and seedling root and shoot length of
French bean stored in all 4, 8, 12 and 16 months of storage. Similar results were
also observed in case of germination percentage and seedling dry weight and
vigour index in all the months of storage. Significantly, a positive and strong
correlation was also observed between seedling root and shoot length and
seedling dry weight; vigour index and seedling root length and shoot length and

IMPACT OF HARVEST STAGE ON SEED YIELD QUALITY 653
Ta
ble
4.
Eff
ect
of
ha
rves
t ti
me,
sto
rag
e p
erio
d a
nd
sto
rag
e co
nd
itio
n o
n t
he
seed
lin
g d
ry w
eig
ht
of
Fre
nch
bea
n (
po
ole
d o
f tw
o
yea
rs).
Tre
atm
ents
*
See
dli
ng d
ry w
eig
ht
(g)
Vig
our
ind
ex (
VI)
4 M
8
M
12
M
16
M
4 M
8
M
12
M
16
M
T1:
H1 S
SC
R
0.1
11
0.1
24
0.1
29
0.1
27
15
84
19
12
20
50
19
92
T2:
H1
SS
AB
0
.12
2
0.1
19
0.1
48
0.1
32
15
97
19
94
19
47
19
01
T3:
H2 S
SC
R
0.1
19
0.1
31
0.1
37
0.1
36
20
23
20
71
20
52
23
24
T4:
H2 S
SA
B
0.1
25
0.1
28
0.1
58
0.1
41
20
32
21
31
21
05
20
41
T5:
H3
SS
CR
0
.13
2
0.1
38
0.1
59
0.1
36
27
59
27
28
29
71
25
77
T6:
H3 S
SA
B
0.1
30
0.1
30
0.1
48
0.1
44
25
21
23
52
24
38
23
46
T7:
H4 S
SC
R
0.1
32
0.1
44
0.1
58
0.1
43
26
24
27
23
28
14
26
81
T8:
H4 S
SA
B
0.1
34
0.1
35
0.1
47
0.1
36
24
37
24
88
25
46
23
76
T9:
H5 S
SC
R
0.1
31
0.1
43
0.1
65
0.1
48
27
35
26
83
29
72
25
66
T10:
H5 S
SA
B
0.1
25
0.1
38
0.1
59
0.1
39
24
89
23
79
25
43
22
85
LS
D(0
.05
) 0
.12
0.1
2
0.1
2
0.1
2
17
8.4
1
79
.3
23
9.3
2
34
.8
CV
(%
) 5
.69
5.5
3
7.7
9
6.6
7
4.5
9
4.4
9
5.7
5
5.9
7
* S
SC
R-S
eed
Sto
rage
in C
oo
l R
oo
m,
SS
AB
-See
d S
tora
ge
in a
mb
ient
and
M-M
onth

654 SHAHEB et al.
Ta
ble
5.
Co
rrel
ati
on
ma
trix
am
on
g d
iffe
ren
t p
ara
met
ers
of
Fre
nch
bea
n d
uri
ng
sto
rag
e.
Char
acte
rs
Mo
nth
s C
orr
elat
ion c
oef
fici
ent
(r v
alu
e)
Mo
istu
re c
onte
nt
Ger
min
atio
n
per
centa
ge
See
dli
ng r
oo
t
leng
th
See
dli
ng s
ho
ot
leng
th
See
dli
ng d
ry
wei
ght
GP
4
-0
.01
0ns
8
0.1
23
ns
12
-0.2
64
ns
16
-0.3
06
ns
SR
L
4
-0.2
06
ns
0.7
96
**
8
-0.0
87
ns
0.6
96
**
12
-0.2
80
ns
0.7
31
**
16
-0.2
15
ns
0.5
64
**
SS
L
4
-0.0
95
ns
0.8
62
**
0.7
80
**
8
-0.3
77
*
0.0
53
*
0.6
60
**
12
-0.2
19
ns
0.6
83
**
0.8
12
**
16
-0.4
83
**
0
.45
4*
0.4
91
**
SD
W
4
0.0
31
ns
0.6
60
**
0.6
08
**
0.5
27
*
8
0.1
54
ns
0.7
09
**
0.6
69
**
0.4
36
*
12
-0.0
83
ns
0.4
53
*
0.4
53
*
0.4
00
*
16
-0.0
77
ns
0.4
99
**
0.3
71
*
0.1
17
ns
VI
4
-0.0
60
ns
0.4
90
**
0.8
48
**
0.9
15
**
0.6
55
**
8
-0.1
49
ns
0.8
69
**
0.8
51
**
0.8
75
**
0.6
78
**
12
-0.2
90
ns
0.9
12
**
0.9
19
**
0.8
90
**
0.5
08
*
16
-0.3
97
*
0.8
93
**
0.8
02
**
0.7
33
**
0.4
46
*
*S
ign
ific
ant
at 5
% l
evel
and
** S
ignif
icant
at 1
% l
evel,
ns-
No
t si
gnif
ican
t

IMPACT OF HARVEST STAGE ON SEED YIELD QUALITY 655
vigour index and seedling dry weight of French bean in all the months of storage.
But a negative correlation was found between moisture content and germination
percentage of French bean except in the 8 months of storage; seedling root and
shoot length, seedling dry weight except in the months of 4 and 8 months of
storage and vigour index in all the months of storage. A positive correlation
(r=0.596) between germination and dry matter was also found by Mehta et al.
(1993). They also observed that germination showed negative correlations
(r=0.856) with moisture content of seed and (r=0.573) with fresh weight of pod
wall. Reddy and Khan (2001) recorded a positive and significant correlation
between germination and seedling dry weight (0.68*), vigour index I (0.91**) and
vigour index II (0.97**). Similar results were also reported by Khatun et al. (2009).
Conclusion
Present investigations revealed that the highest seed yield and seed quality in
respect to seed vigour and higher seed germination of French bean was obtained in
H3 (while pods were shown light brown with few yellow in colour). On the
contrary, seeds stored in cool room up to 16 month, H3 (pods appeared 90% of
brown in colour) observed the highest storability in terms of higher germination
percentage and vigour index. It was also indicated that all the seeds stored in cool
room were found better in seed quality compared to ambient condition. However,
seeds harvested in H3 and H4 also showed better seed quality and storability in cool
room as well as ambient conditions. In addition, it was remarked that all the seed
quality parameters were satisfactorily well up to 12 months of storage then
declined in quality onwards. The findings of present investigations will help
researchers to formulate further study of seed preservation of French bean as these
seeds lose their germinability rapidly due to poor storage and shorter periods.
References
Ahmad, S. 2001. Environmental effects on seed characteristics of sunflower (Helianthus
annuus L.). J. Agron. Crop Sci. 187: 213-216.
Ayyub, C. M., K. Ziaf., M. A. Pervez., M. A. S. Rasheed and N. Akhtar. 2007. Effect of
seed maturity and storability on viability and vigour in pea (Pisum sativum L.) seeds.
In. Proceedings: International symposium on prospects of Horticultural Industry in
Pakistan, organized by University of Agriculture, Faisalabad (28-30 March 2007).
pp. 269-273
Bailly, C., R. Bogatek-Leszczynska., D. Come and F. Corbineau. 2002. Changes in
activities of antioxidant enzymes and lipoxygenase during growth of sunflower
seedlings from seeds of different vigor. Seed Sci. Res.12: 47-55.
BARI. 1993. Intensive vegetable growing and its utilization. Bangladesh Agricultural
Research Institute, Joydebpur, Gazipur. p. 245.
BARI. 2011. Agro-technology handbook (Part-1). Bangladesh Agricultural Research
Institute (BARI), Joydebpur. Gazipur. p. 431.

656 SHAHEB et al.
Coolbear, P. 1995. Mechanisms of seed deterioration. A. S Basra (ed), Seed quality.
Basic mechanisms and agricultural implications. Food Product press, London, pp.
223-277.
Eliud, R., M. Reuben and G. Linnet. 2010. Longevity of bean (Phaseolus vulgaris) seeds
stored at locations varying in temperature and relative humidity. J. Agric. Pure. Appl.
Sci. technol. 5: 60-70.
Genchev, D. 1997. Seed coat as a factor for breaking of common beans seed (Phaseolus
vulgaris). In: H. F Schwartz (ed), Bean improvement Cooperative. pp. 46-47.
Gomez, K. A. and A. A. Gomez. 1984. Statistical procedures for Agricultural Research.
2nd edn. John Wiley and Sons. New York. p. 194.
Greven, M. M., B. A. McKenzie., J. G. Hampton., M. J. Hill., J. R. Sedcole and G. D.
Hill. 2004. Factors affecting seed quality in dwarf French bean (Phaseolus vulgaris
L.) before harvest maturity. Seed Sci. and Technol. 32(3): 797-811.
Huda, M. N. 2001. Why quality seed? Reality & Vision, Bangladesh context.
Bangladesh-German Seed Development Project, Dhaka, Bangladesh. p. 90.
ISTA. 1999. International rules for seed testing. Seed Science and technology.
International Seed Testing Association, Zurich, Switzerland. 27: 155-199.
Kavak, S., L. B. Hulya., B. Eser., A. A. Powell and S. Matthews. 2012. Effects of seed
moisture content and threshing methods on bean (Phaseolus vulgaris L.) seed
quality. Süleyman Demirel Üniversitesi Ziraat Fakültesi Dergisi. 7(1):51-57.
Khatun, A., G. Kabir and A. H. Bhuiyan. 2009. Effect of harvesting stages on the seed
quality of Lentil (Lens culinaris L.,) during storage. Bangladesh J. Agril. Res. 34(4):
565-576.
Khatun, A., M. A. Bhuiyan., A. Nessa and S. M. B. Hossain. 2010. Effect of harvesting
time on yield and yield attibutes of chickpea (Cicer arietinum L.). Bangladesh
J. Agril. Res. 35(1):143-148.
Kumar, V., S. D. Shahidhan., M. B. Kurdikeri., A. S. Channaveeraswami and R. M.
Hosmani. 2002. Influence of harvesting stages on seed yield and quality in paprika
(Capsicum annuum L.) Seed Res. 30(1): 99-103.
Mahesha, C. R., A. S. Channaveeraswami., M. B. Kurdikeri., M. Shekhargouda and M.
N. Merwade. 2001. Seed maturation studies in sunflower genotypes. Seed Res. 29(1):
95-97.
Mehta, C. J. M. S. Kuhad., I. S. Sheoran and A. S. Nandwal. 1993. Studies on seed
development and germination in chickpea cultivars. Seed Res. 21(2): 89-91.
Morshed, M. S., M. Begum., M. A. Basher and W. Sultana. 2003. Effect of storage
containers on seed quality of three pulses. Bangladesh J. Life Sc. 15(1):107-112.
Rakhi, S. S. 2000. Strengthening of National Vegetable Seed Production. A Key note
paper presented on GCP/BGD/025/BEL and GCP/BGD/028/DEM in the National
Seminar on Vegetable Improvement and Seed Production, March 3-4, 2000 at BARI,
Gazipur, Bangladesh.
Reddy, Y. T. N. and M. M. Khan. 2001. Effect of osmopriming on germination, seedling
growth and vigour of khirni (Mimosops hexandra) seeds. Seed Res. 29 (1): 24-27.
Seshu, D. V. and M. Dadlani. 1989. Role of woman in seed management with special
reference to rice. IRTP Technical Bulletin 5. pp.24.

ISSN 0258-7122
Bangladesh J. Agril. Res. 40(4): 657-667, December 2015
EFFICACY OF SOME INSECTICIDES AGAINST INSECT PESTS OF
MUNGBEAN (Vigna radiata L.)
MD. ALTAF HOSSAIN1
Abstract
Efficacy and profitability of insecticidal management practices using different
insecticides were tested against insect pests of mungbean at Pulses Research
Center, Ishurdi, Pabna, Bangladesh during two consecutive seasons of kharif-1
2013 and 2014. Insect infestations were reduced significantly by the application
of synthetic insecticides. Spraying of Imidachloprid (Imitaf 20 SL) @ 0.5 ml/l of
water showed the best efficacy in reducing flower infestation and thrips
population followed by Fipronil (Regent 50 SC). Spraying of Thiamethoxam +
Chlorantraneliprol (Voliam flexi 300 SC) @ 0.5 ml/l of water showed the best
efficacy in reducing pod borer and flea beetle infestations. Spraying of Fipronil
(Regent 50 SC) performed highest efficacy against stemfly infestation. The yield
and the highest net return were obtained from Voliam flexi 300 SC, the highest
benefit was obtained from Regent 50 SC treated plots. This might be due to the
higher cost of Voliam flexi that reduced the profit margin and showed the lower
marginal benefit cost ratio (MBCR) compared to Regent. Therefore, considering
the efficacy and benefit, spraying of Fipronil (Regent 50 SC) @ 0.5 ml/l is the
most profitable insecticidal management approach against insect pests of
mungbean followed by Imidachloprid (Imitaf 20 SL) at the same dose.
Keywords: Insecticide, management, insect pests, mungbean
Introduction
Mungbean (Vigna radiata L.) is one of the important pulse crops in Bangladesh. Due to availability of short duration varieties, farmers are becoming more interested to cultivate this valuable crop after harvesting of rabi crops in kharif-I season. However, insect pests usually cause significant yield loss. More than twelve species of insect pests were found to infest mungbean in Bangladesh (Rahman et al., 2000). Among them, stemfly, flea beetles, flower thrips and pod borers are the most important.
Larvae of stemfly feed inside the main stem and finally tunnels even up to roots. The affected plants have stunted growth with poor yield. The adult flea beetles feed on the cotyledons and leaves of young plants making innumerable round holes. The damaged leaves dried up and the plant growth is rendered with few pods. Thrips (Megalurothrips distalis Karny, Megalurothrips usitatus Bagnall and Caliothrips indicus Bagnall) is associated mostly with the damage of tender buds and flowers of mungbean. Severe infestation of thrips resulted flower shedding causing significant yield loss (Chhabra and Kooner, 1985; Lal, 1985).
1Principal Scientific Officer (Entomology) Pulses Research Center, Bangladesh
Agricultural Research Institute (BARI), Ishurdi, Pabna, Bangladesh.

658 HOSSAIN
Pod borer is another insect pest causing significant yield reduction. Pod borer (Maruca vitrata) damages flowers, flower buds and developing or mature pods (Poehlman, 1991). In Bangladesh, pod borers (Maruca vitrata, Helicoverpa armigera Hubner and Euchrysops spp.) often cause serious problem resulting severe loss of the crop (Bakr, 1998). Farmers usually do not take any measure to control the insect pests due to its low profit margin. However, recent development of high yielding and short duration varieties and increased market value of mungbean, farmers become interested on the cultivation of mungbean following pest management measures. Due to easy availability of insecticides, farmers generally take action to control mungbean pests by applying synthetic chemical insecticides. Information regarding insecticidal management practices of insect pests in mungbean is not very available. Therefore, it is needed to develop insecticidal management approach to control mungbean pests and save the crop from significant yield loss. Keeping this in view, attempts have been made to evaluate the efficacy of some synthetic insecticides and economics of the management of mungberan insect pests.
Materials and Method
The experiment was conducted in the Pulses Research Center, Ishurdi, Pabna, Bangladesh during two consecutive seasons of kharif-I 2013 and 2014. Application of synthetic insecticides considered as treatments of the experiments which were: T1 = Spraying Cypermethrin (Ripcord 10 EC) @ 1 ml/l of water, T2 = Spraying Chlorpyrifos + Cypermethrin (Nitro 505 EC) @ 1 ml/l of water, T3 = Spraying Lambda Cyhalothrin (Reeva 2.5 EC) @ 1 ml/l of water, T4 = Spraying Dimethoate (Tafgor 40 EC) @ 2 ml/l of water, T5 = Spraying Thiamethoxam + Chlorantraneliprol (Voliam flexi 300 SC) @ 0.5 ml/l of water, T6 = Spraying Emamectin Benzoate (Wonder 5 G) @ 1 g/l, T7 = Spraying Fipronil (Regent 50 SC) @ 0.5 ml/l of water T8 = Spraying Imidachloprid (Imitaf 20 SL) @ 0.5 ml/l of water and T9 = Untreated control (water spray)
The experiment was laid out in randomized complete block design (RCBD) with three replications. The treatments were randomly allotted in each block. The unit plot size was 3m X 4m with a distance of 1m between the plots and 1.5m between the replications. The seeds of BARI Mung 6 were sown on March 28 in rows with the spacing of 30 cm in both the seasons. The plant populations were maintained constant by keeping plant to plant distance 7 cm. Urea, triple super phosphate and muriate of potash fertilizers were applied @ 40-90-40 kg/ha in both the seasons. But in 2014, 7.5 kg/ha boric acid was applied during final land preparation for reducing flower shedding and increasing pod setting with higher number of seed setting.
Three sprays were done, first at 20 days after sowing (DAS) when plants were in active vegetative growth stage (i.e., two trifoliate leaf stage) against leaf feeding and sucking insect pests. Second spray was done at 100% flowering stage (35 DAS) and the third at 100% podding stage (42 DAS) for flower thrips and pod borers because both the pests appeared that time.

EFFICACY OF SOME INSECTICIDES AGAINST INSECT PESTS 659
The population data for thrips in flowers were collected before spraying and one day after spraying. Thrips population was assessed from 20 opened flowers which were randomly collected from two rows of each side of the plot avoiding border and central four rows. The collected flowers were immediately opened on the white paper board and counted the adult and immature thrips present in the flowers. Central four rows were kept undisturbed for recording yield data.
Percentage of leaf area damaged by flea beetle was determined by eye estimation.
At the maturity, all pods were collected from 10 randomly selected plants from central four rows of each plot and examined. The infested (bored) and total numbers of pods were counted and the per cent pod infestation was calculated.
For recording stemfly infestation, ten mature plants were randomly selected also uprooted from two rows from each side of the plot avoiding border rows of each plot. The plants were brought to the laboratory and dissected the stem of each plant for determining the tunnel produced by stemfly larvae. Percentage of stemfly infestation was determined on the basis of stem tunneling.
The pods of central four rows of each plot comprising 4.8m2 (1.2m X 4m) area were harvested. The pods were then threshed; grains were and. The grains obtained from each plot were cleaned, sun dried and converted into kg/ha.
The experimental data were analyzed by MSTAT-C software. The per cent infestation data were transformed by square root and arc sine transformation as needed for statistical analysis. Mean comparisons for treatment parameters were compared using Duncan’s Multiple Range Test at 5% level of significance.
The marginal benefit cost ratio (MBCR) was calculated on the basis of prevailing market prices of mungbean and cost of insecticidal spraying. Marginal benefit cost ratio was calculated as follows:
Results and Discussion
Effect of insecticides on flower infestation and thrips population
Spraying of synthetic insecticides reduced flower infestation and thrips population significantly (Table 1 & 2). During 2013, after one day of spray application, the lowest number of infested flower (1.67/20 flowers) was observed in Imitaf sprayed plots which was statistically identical to Regent, Nitro, Ripcord, Voliam flexi and Tafgor. More than 80% flower infestation reduction was observed in Imitaf and Regent sprayed plots. Accordingly the lowest number of thrips (2.00/20 flowers) was observed in Imitaf sprayed plots which was statistically similar to Regent, Nitro, Ripcord and Reeva. All insecticides reduced more than 80% thrips population but Voliam flexi reduced little beat less (Table 1).
treatmentofCost
controlover Benefit BCR Marginal

660 HOSSAIN
In 2014, after one day of spray application, the lowest number of infested flower (0.83/20 flowers) was observed in Imitaf sprayed plots which was statistically identical to Nitro, Regent, Voliam flexi, Reeva and Tafgor. Like previous year Imitaf also reduced more than 80% flower infestation. Accordingly the lowest number of thrips (1.33/20 flowers) was observed in Imitaf sprayed plots which was statistically at par with Regent. Imitaf reduced more than 80% thrips population also (Table 2). These findings were agreed with the findings of Bhede et al. (2008) who reported the best effect of Imidachloprid for control of thrips in chilli. Hossain et. al. (2013) cited the best efficacy of Fipronil (Regent 50 SC) in managing thrips of onion with highest benifit. Hossain et al. (2011) and Hossain (2014) also found the best results of Imidachloprid (Imitaf 20 SL) to reduce flower infestation and suppression of thrips population in mungbean flowers.
Effects of insecticides on the incidence of stemfly, flea beetle and pod borers
Stemfly infestation varied depending on the efficacy of the insecticides. During cropping season of 2013, stemfly infestation among different treatments was non significant but varied 40.67 to 63.33% (Table 3). The lowest infestation (40.67%) was found in Voliam flexi sprayed plots and the highest (63.33%) was observed in untreated control plots.
In 2014, stemfly infestation significantly varied among the treatments. It ranged 40.00 to 80.00% (Table 3). The lowest infestation (40.00%) was found in Regent sprayed plots which were statistically similar to Voliam flexi, Wonder and Reeva. The highest (80.00%) was observed in untreated control plots.
Leaf area damaged by flea beetle was also varied among the insecticidal sprays. During 2013, it was non significant and ranged from 5.33 to 9.67% (Table 3). The lowest percentage of leaf area damaged by flea beetle (5.33%) was observed in Voliam flexi, Regent, and Reeva treated plots and the highest was in untreated plots.
But in 2014, leaf area damaged by flea beetle was significantly varied and ranged from 3.00 to 18.00% (Table 3). The lowest percentage of leaf area damaged by flea beetle (3.00%) was observed in Voliam flexi followed by Wonder and the highest (18.00%) was in untreated plots.
Pod borer infestation was low to moderate but varied significantly among the efficacy of the treatments. During 2013, pod infestation was low and varied from 1.02 – 8.02% (Table 3). The lowest pod borer infestation (1.02%) was found in Voliam flexi sprayed plots which were statistically similar to Reeva, Nitro, Dimethoate, Wonder, Imitaf and Regent. The highest pod infestation (8.02%) was found in untreated plots.
In 2014, pod borer infestation was moderate and it varied from 3.10 – 10.64% (Table 3). The lowest pod borer infestation (3.10%) was found in Voliam flexi sprayed plots which were statistically similar to Wonder, Regent, Nitro and Tafgor. The highest pod infestation (10.642%) was found in untreated plots.

EFFICACY OF SOME INSECTICIDES AGAINST INSECT PESTS 661
Ta
ble
1.
Eff
ica
cy o
f in
secti
cid
es o
n t
he
inci
den
ce o
f fl
ow
er i
nfe
sta
tio
n a
nd
th
rip
s p
op
ula
tio
n i
n m
un
gb
ean
du
rin
g K
ha
rif-
1,
20
13
.
Tre
atm
ents
(Inse
ctic
ides
)
Do
se
Mea
n n
o.
of
thri
ps
infe
sted
flo
wer
s/2
0 o
pen
flo
wer
s
Red
uct
ion o
f
flo
wer
infe
stat
ion
afte
r 1
day
of
spra
y (
%)
Mea
n n
o.
of
thri
ps/
20
op
en f
low
ers
Red
uct
ion o
f
thri
ps
po
pula
tio
n
afte
r 1
day
of
spra
y (
%)
Bef
ore
spra
y
Aft
er 1
day
of
spra
y
Bef
ore
spra
y
Aft
er 1
day
of
spra
y
Cyp
erm
eth
rin (
Rip
cord
10
EC
) 1
ml/
l 1
4.3
3 b
-d
3.6
7 b
c 7
4.3
9
27
.67 c
4
.67
b-d
8
3.1
2
Chlo
rpyri
fos
+ C
yp
. (N
itro
505
EC
) 1
ml/
l
14
.00 c
d
3.0
0 b
c 7
8.5
7
27
.67 c
3
.33
cd
87
.97
Lam
bd
a C
yh
alo
thri
n (
Ree
va
2.5
EC
) 1
ml/
l 1
6.0
0 a
-c
4.6
7 b
7
0.8
1
39
.67 a
5
.00
b-d
8
7.4
0
Dim
etho
ate
(Taf
go
r 4
0 E
C)
2 m
l/l
16
.00 a
-c
4.3
3 b
c 7
2.9
4
37
.33 a
b
5.3
3 b
c 8
5.7
2
Thia
met
ho
xam
+ C
hlo
rantr
anel
ipro
l
(Vo
liam
fle
xi
30
0 S
C)
0.5
ml/
l 1
2.6
7 d
3
.67
bc
71
.03
2
5.0
0 c
6
.67
b
73
.32
Em
am
ecti
n B
enzo
ate
(Wo
nd
er 5
G)
1 g
/l
16
.33 a
b
4.6
7 b
7
1.4
0
36
.67 a
b
6.0
0 b
c 8
3.6
4
Fip
ronil
(R
egent
50
SC
)
0.5
ml/
l 1
5.0
0 a
-c
3.0
0 b
c 8
0.0
0
31
.00 b
c 3
.33
cd
89
.26
Imid
achlo
pri
d (
Imit
af 2
0 S
L)
0.5
ml/
l 1
4.6
7 a
-d
1.6
7 c
8
8.6
2
27
.67 c
2
.00
d
92
.77
Untr
eate
d c
ontr
ol
(wat
er s
pra
y)
50
0 l
/ha
16
.67 a
1
3.0
0 a
2
2.0
2
41
.00 a
2
4.6
7 a
3
9.8
3
No
te:
In a
co
lum
n,
trea
tmen
t m
ean
s havin
g t
he
sam
e le
tter
(s)
are
no
t si
gnif
icantl
y d
iffe
rent
by D
MR
T a
t 5
% l
evel
.
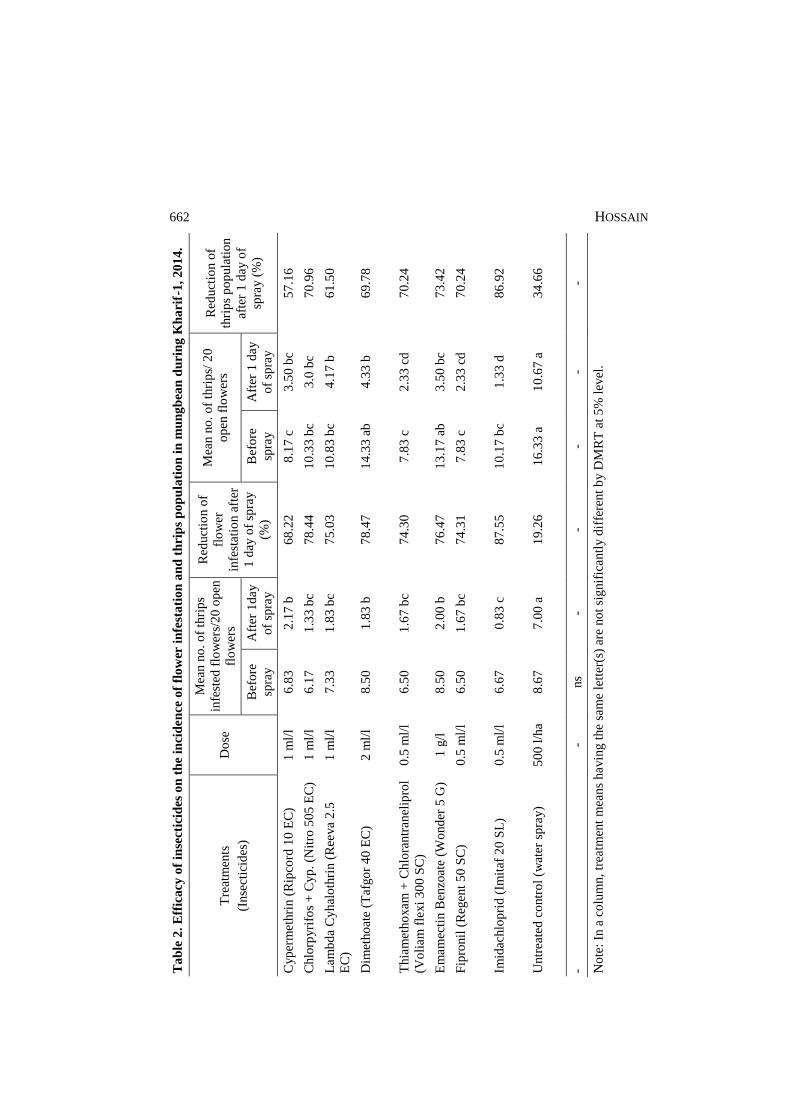
662 HOSSAIN
Ta
ble
2.
Eff
ica
cy o
f in
secti
cid
es o
n t
he
inci
den
ce o
f fl
ow
er i
nfe
sta
tio
n a
nd
th
rip
s p
op
ula
tio
n i
n m
un
gb
ean
du
rin
g K
ha
rif-
1,
20
14
.
Tre
atm
ents
(Inse
ctic
ides
)
Do
se
Mea
n n
o.
of
thri
ps
infe
sted
flo
wer
s/2
0 o
pen
flo
wer
s
Red
uct
ion o
f
flo
wer
infe
stat
ion a
fter
1 d
ay o
f sp
ray
(%)
Mea
n n
o.
of
thri
ps/
20
op
en f
low
ers
Red
uct
ion o
f
thri
ps
po
pula
tio
n
afte
r 1
day
of
spra
y (
%)
Bef
ore
spra
y
Aft
er 1
day
of
spra
y
Bef
ore
spra
y
Aft
er 1
day
of
spra
y
Cyp
erm
eth
rin (
Rip
cord
10
EC
) 1
ml/
l 6
.83
2.1
7 b
6
8.2
2
8.1
7 c
3
.50
bc
57
.16
Chlo
rpyri
fos
+ C
yp
. (N
itro
505
EC
) 1
ml/
l
6.1
7
1.3
3 b
c 7
8.4
4
10
.33 b
c 3
.0 b
c 7
0.9
6
Lam
bd
a C
yh
alo
thri
n (
Ree
va
2.5
EC
)
1 m
l/l
7.3
3
1.8
3 b
c 7
5.0
3
10
.83 b
c 4
.17
b
61
.50
Dim
etho
ate
(Taf
go
r 4
0 E
C)
2 m
l/l
8.5
0
1.8
3 b
7
8.4
7
14
.33 a
b
4.3
3 b
6
9.7
8
Thia
met
ho
xam
+ C
hlo
rantr
anel
ipro
l
(Vo
liam
fle
xi
30
0 S
C)
0.5
ml/
l 6
.50
1.6
7 b
c 7
4.3
0
7.8
3 c
2
.33
cd
70
.24
Em
am
ecti
n B
enzo
ate
(Wo
nd
er 5
G)
1 g
/l
8.5
0
2.0
0 b
7
6.4
7
13
.17 a
b
3.5
0 b
c 7
3.4
2
Fip
ronil
(R
egent
50
SC
)
0.5
ml/
l 6
.50
1.6
7 b
c 7
4.3
1
7.8
3 c
2
.33
cd
70
.24
Imid
achlo
pri
d (
Imit
af 2
0 S
L)
0.5
ml/
l 6
.67
0.8
3 c
8
7.5
5
10
.17 b
c 1
.33
d
86
.92
Untr
eate
d c
ontr
ol
(wat
er s
pra
y)
50
0 l
/ha
8.6
7
7.0
0 a
1
9.2
6
16
.33 a
1
0.6
7 a
3
4.6
6
- -
ns
- -
- -
-
No
te:
In a
co
lum
n,
trea
tmen
t m
ean
s havin
g t
he
sam
e le
tter
(s)
are
no
t si
gnif
icantl
y d
iffe
rent
by D
MR
T a
t 5
% l
evel
.

EFFICACY OF SOME INSECTICIDES AGAINST INSECT PESTS 663
Ta
ble
3.
Eff
ica
cy o
f in
secti
cid
es o
n t
he
inci
den
ce o
f st
em
fly
, fl
ea b
eetl
e a
nd
po
d b
ore
r in
mu
ng
bea
n d
uri
ng
20
13
an
d 2
01
4.
Tre
atm
ents
(Inse
ctic
ides
)
Ste
mfl
y i
nfe
sted
pla
nt
(%)
Lea
f ar
ea d
am
aged
by f
lea
bee
tle
(%)
Po
d i
nfe
stat
ion b
y p
od
bo
rer
(%)
20
13
20
14
20
13
20
14
20
13
20
14
Cyp
erm
eth
rin (
Rip
cord
10
EC
) 5
0.0
0
73
.33 a
bc
(59
.33
)
6.3
3
10
.00 d
(3.1
5)
4.5
4 a
b
(2.1
1)
6.9
5 b
(2.6
3)
Chlo
rpyri
fos
+ C
yp
. (N
itro
505
EC
) 5
0.0
0
76
.67 a
b
(56
.56
)
6.3
3
11
.00 d
(3.2
6)
2.0
7 b
c
(1.1
6)
4.5
0 b
cd
(2.1
1)
Lam
bd
a C
yh
alo
thri
n (
Ree
va
2.5
EC
) 5
0.0
0
56
.67 b
cd
(49
.23
)
5.3
3
13
.00 b
c
(3.6
5)
2.0
6 b
c
(1.1
7)
6.5
8 b
c
(2.5
5)
Dim
etho
ate
(Taf
go
r 4
0 E
C)
53
.33
70
.00 a
bc
(57
.10
)
6.0
0
16
.00 a
b
(4.0
)
2.0
7 b
c
(1.1
6)
5.1
0 b
cd
(2.2
6)
Thia
met
ho
xam
+ C
hlo
rantr
anel
ipro
l
(Vo
liam
fle
xi
30
0 S
C)
40
.67
53
.33 c
d
(47
.21
)
5.3
3
3.0
0 f
(1.7
3)
1.0
2 c
(0.8
1)
3.1
0 d
(1.7
5)
Em
am
ecti
n B
enzo
ate
(Wo
nd
er 5
G)
50
.00
56
.67 b
cd
(49
.14
)
5.6
7
5.3
3 e
(2.3
0)
2.3
9 b
c
(1.5
4)
3.5
6 d
(1.8
7)
Fip
ronil
(R
egent
50
SC
)
56
.67
40
.00 d
(39
.44
)
5.3
3
16
.67 a
(4.0
7)
2.7
4 a
-c
(1.6
5)
4.2
5 c
d
(2.0
5)
Imid
achlo
pri
d (
Imit
af 2
0 S
L)
40
.33
70
.00 a
bc
(57
.62
)
6.3
3
12
.00 c
d
(3.4
6)
2.3
9 b
c
(1.5
4)
6.2
3 b
c
(2.4
8)
Untr
eate
d c
ontr
ol
(wat
er s
pra
y)
63
.33
80
.00 a
(68
.28
)
9.6
7
18
.00 a
(4.2
4)
8.0
2 a
(2.8
3)
10
.64 a
(3.2
5)
- ns
- ns
- -
-
Mea
ns
in a
co
lum
n h
avin
g s
am
e le
tter
(s)
did
no
t d
iffe
r si
gn
ific
antl
y a
t 5
% b
y D
MR
T.
Val
ues
in t
he
par
enth
ese
s ar
e th
e a
rc s
ine
and
sq
uar
e ro
ot
tran
sfo
rmed
mea
n v
alues.

664 HOSSAIN
In both the years Voliam flexi performed the best in suppressing pod borer infestation. These findings agreed with the findings of Rouf and Islam (2012) and Hossain (2014) who reported that the best efficacy of Voliam flexi in controlling pod borers of mungbean.
Yield, return and marginal benefit cost ratio (MBCR)
Yield of mungbean varied significantly with the level of insect pest’s infestation depending on the efficacy of different insecticides (Table 4). During 2013, the highest yield (1570 kg/ha) obtained from Regent sprayed plots which was statistically identical to Wonder, Tafgor, Voliam flexi and Imitaf followed by Ripcord, Nitro and Reeva. The lowest yield (1166 kg/ha) was recorded from untreated control plots.
But in 2014, the highest yield (2347 kg/ha) obtained from Voliam flexi sprayed plots which was statistically identical to Tafgor and Wonder followed by Regent, Ripcord and Imitaf. The lowest yield (1701 kg/ha) was recorded from untreated control plots (Table 3). Considering two years average yield Voliam flexi provided the highest. Again, it is apparent that yield of mungbean was higher in kharif-I of 2014 than that of 2013. This might be due to the less thrips infestation with relatively favourable weather condition prevailing in kharif-I of 2014 compared to 2013 and also with boric acid application during 2014 cropping season might have some effect to produce more pods and seeds which influencing higher yield in later season. Alam et. al. 2010, Quddus et. al. 2011 and Abou EL-Yazied and Mady 2012 cited the positive effect of boron application to increase yield of mungbean. They reported that application of boric acid increased number of formed flowers, setted pods per plant, seed yields, as well as reduced shedding of flowers and pods.
Return and marginal benefit cost ratio are also presented in Table 4. The net return and marginal benefit cost ratio was varied depending on cost of insecticidal application. During 2013, the highest net return (Tk 21390/ha) was recorded from Regent sprayed plots followed by Wonder (Tk 15780/ha). And accordingly the highest monetary benefit (MBCR 7.51) come from Regent sprayed plots. But the second highest benefit (MBCR 4.78) obtained from Imitaf followed by Tafgor (MBCR 4.07). Due to higher cost of Wonder and Voliam flexi profit margin goes down and showed lower MBCR.
For each taka spent, Regent gave profit of Tk 7.51 as against Tk 4.78, Tk 4.07, Tk 2.77, Tk 2.43, Tk. 2.01, Tk. 1.98 and Tk. 1.48 in Regent, Imitaf, Tafgor, Wonder, Ripcord, Voliam flexi, Reeva and Nitro, respectively.
During 2014, the highest net return (Tk 33060/ha) was recorded from Voliam flexi sprayed plots followed by Tafgor, Wonder, Regent, Ripcord and Imitaf. But the highest monetary benefit (MBCR 7.34) also comes from Regent sprayed plots followed by Tafgor, Imitaf, Ripcord, Voliam flexi and Wonder. Though the Voliam flexi offered the highest net return but its higher cost broad down the profit margin and showed lower MBCR.

EFFICACY OF SOME INSECTICIDES AGAINST INSECT PESTS 665
Ta
ble
4.
Yie
ld,
cost
an
d r
etu
rn a
na
lysi
s o
f in
secti
cid
al
ma
na
gem
ent
on
of
mu
ng
bea
n i
nse
ct
pes
ts d
uri
ng
kh
ari
f-1
, 2
01
3 a
nd
20
14
.
Tre
atm
ents
(Inse
ctic
ides
)
Yie
ld (
kg/h
a)
Ad
dl.
yie
ld
over
co
ntr
ol
(kg/h
a)
Ad
dl.
ret
urn
over
co
ntr
ol
(Tk/h
a)
Co
st o
f
inse
ctic
ide
app
l. (
Tk/h
a)
Net
ret
urn
(Tk/h
a)
Mar
gin
al
ben
efit
co
st
rati
o
20
13
20
14
20
13
20
14
20
13
20
14
20
13
20
14
20
13
20
14
20
13
20
14
Cyp
erm
eth
rin (
Rip
cord
10
EC
) 1
35
5 b
c 2
07
7 b
1
89
37
6
11
340
22
560
33
00
33
00
80
40
19
260
2.4
3
5.8
4
Chlo
rpyri
fos
+ C
yp
. (N
itro
505
EC
) 1
32
1 c
1
84
2 d
1
55
14
1
93
00
84
60
37
50
37
50
55
50
47
10
1.4
8
1.2
6
Lam
bd
a C
yh
alo
thri
n (
Ree
va
2.5
EC
) 1
30
0 c
1
87
7 c
d
13
4
17
6
80
40
10
560
27
00
27
00
53
40
78
60
1.9
8
2.9
1
Dim
etho
ate
(Taf
go
r 4
0 E
C)
14
83
a
21
88
ab
31
7
48
7
19
020
29
220
37
50
37
50
15
270
25
470
4.0
7
6.7
9
Thia
met
ho
xam
+ C
hlo
rantr
anel
ipro
l
(Vo
liam
fle
xi
30
0 S
C)
14
52
ab
23
47
a
28
6
64
6
17
160
38
760
57
00
57
00
11
460
33
060
2.0
1
5.8
0
Em
am
ecti
n B
enzo
ate
(Wo
nd
er 5
G)
15
24
a
21
95
ab
35
8
49
4
21
480
29
640
57
00
57
00
15
780
23
940
2.7
7
4.2
0
Fip
ronil
(R
egent
50
SC
)
15
70
a
20
97
b
40
4
39
6
24
240
23
760
28
50
28
50
21
390
20
910
7.5
1
7.3
4
Imid
achlo
pri
d (
Imit
af 2
0 S
L)
14
48
ab
20
47
bc
28
2
34
6
16
920
20
760
29
25
29
25
13
995
17
835
4.7
8
6.1
0
Untr
eate
d c
ontr
ol
(wat
er s
pra
y)
11
66
d
17
01
d
- -
- -
- -
- -
- -
Ad
dl.
= A
dd
itio
nal
, ap
pl.
= a
pp
lica
tio
n.
Fo
r ca
lcula
ting i
nco
me
and
ben
efit
the
foll
ow
ing m
arket
pri
ces
wer
e use
d:
Mun
gb
ean =
Tk.
60
/kg
.
Rip
cord
10
EC
= T
k.
14
0/1
00
ml,
Nit
ro 5
05
EC
= T
k.
17
0/1
00
ml,
Ree
va 2
.5 E
C =
Tk.
10
0/1
00
ml,
Taf
go
r 4
0 E
C =
Tk.
85
/10
0 m
l,
Vo
liam
fle
xi
30
0 S
C =
Tk.
60
0/1
00
ml,
Wo
nd
er 5
G =
Tk.
30
0/1
00
g,
Reg
ent
50
SC
= T
k.
22
0/1
00
ml
and
Im
itaf
20
SL
= T
k.
23
0/1
00
ml.
Lab
our
wag
e fo
r sp
rayin
g i
nse
ctic
ides
= T
k.
200
/day
/lab
oure
r (8
ho
urs
day
).

666 HOSSAIN
For each taka spent, Regent gave profit of Tk 7.34 as against Tk 6.79, Tk 6.10, Tk 5.84, Tk 5.80, Tk. 4.20, Tk. 2.91 and Tk. 1.26 in Tafgor, Imitaf, Ripcord, Voliam flexi, Wonder, Reeva, and Nitro, respectively.
These profit findings showed very encouraging results of spraying in mungbean. Spraying of Imidachloprid (Imitaf 20 SL) @ 0.5 ml/l of water showed the best efficacy in reducing flower infestation and thrips population followed by Fipronil (Regent 50 SC). Spraying of Thiamethoxam + Chlorantraneliprol (Voliam flexi 300 SC) @ 0.5 ml/l of water showed the best efficacy in reducing pod borer and flea beetle infestation. Spraying of Fipronil (Regent 50 SC) performed best against stemfly infestation. Therefore, considering overall efficacy and benefit spraying of Fipronil (Regent 50 SC) at the concentration of 0.5 ml/l is the most profitable insecticidal management approach against insect pests of mungbean in Bangladesh followed by Imidachloprid (Imitaf. 20 SL) at the same dose.
Acknowledgements
The author is thankful to ACIAR (Rice-Pulse) project for providing necessary facilities to developing this program and conducts the study.
References
Alam, M.R., M.A. Ali, S. Rafiquzzaman, B. Ahmed
and M. Bazzaz. 2010. Effect of phosphorus and boron on the performance of summer mungbean in high Ganges river floodplain soil. J. Agrofor. Environ. 3(2): 183-186.
Abou EL-Yazied, A. and M.A. Mady. 2012. Effect of boron and yeast extract foliar application on growth, pod setting and both green pod and seed yield of broad bean (Vicia faba L.). J. Appl. Sci. Res. 8(2): 1240-1251.
Bakr, M.A. 1998. Disease and insect management of mungbean and blackgram. Resource manual-Location specific technologies for rice based cropping systems under irrigated conditions. Thana cereal technology transfer and identification project, Dhaka. Pp.201-205.
Bhede, B.V., D.S. Suryawanshi and D.G. More. 2008. Population dynamics and bioefficacy of newer insecticide against chilli thrips, Scirtothrips dorsalis (Hood). Indian J. Entomol. 70(3): 223-226.
Chhabra, K.S. and B.S. Kooner. 1985. Loss of summer mungbean due to insect pests in Punjub. Indian J. Entomol. 47(1):103-105.
Hossain, M.A., M.S. Zaman and M.J. Alam. 2011. Management of flower thrips and pod borers in mungbean, Vigna radiata L.). Bangladesh J. Life Sci. 23(2): 79-86.
Hossain, M.M., M.M. Kamal and D. Sarker. 2013. Integrated management of onion thrips (Thrips tabaci). Annual Report 2012-2013. Entomology Division, Bangladesh Agricultural Research Institute, Gazipur, Bangladesh. Pp. 157-159.
Hossain, M.A. 2014. Development of IPM practices for the control of flower thrips and pod borers in mungbean (Vigna radiata L.). Bull. Inst. Trop. Agr., Kyushu Univ. 37: 85-92.

EFFICACY OF SOME INSECTICIDES AGAINST INSECT PESTS 667
Lal, S.S. 1985. A review of insect pests of mungbean and their control on India. Trop. Pest Management 31(2): 105-114.
Poehlman, J.M. 1991. The Mungbean. Oxford and IBH Publ. Co. Pvt. Ltd., New Delhi, Bombay and Calcutta, 292 Pp.
Quddus, M. A., M. H. Rashid, M. A. Hossain and H.M. Naser. 2011. Effect of zinc and boron on yield and yield contributing characters of mungbean in low ganges river floodplain soil at Madaripur, Bangladesh.Bangladesh. J. Agril. Res. 36(1): 75-85.
Rahman, M.M., M.A. Bakr, M.F. Mia, K.M. Idris, C.L.L. Gowda, J. Kumar, U.K. Dev, M.A. Malek and A. Sobhan. 2000. Legumes in Bangladesh. In: Johansen, C., Duxbury, J.M., Virmani, S.M., Gowda, C.L.L., Pande, S. and Joshi, P.K. (eds.). Legumes in rice and wheat cropping systems of the Indo-Gangetic Plain – Constraints and opportunities. Patancheru 502 324, Andhra Pradesh, India: ICRISAT and Ithaca, New York, USA: Cornell University. 230 Pp.
Rouf, F.M.A. and M.I. Islam. 2012. Efficacy of some insecticides and btanical pesticides for controlling pod borer complex of mungbean. Annual Report 2011-2012. Entomology Division, Bangladesh Agricultural Research Institute, Gazipur, Bangladesh. Pp. 19-21.

668 HOSSAIN

ISSN 0258-7122
Bangladesh J. Agril. Res. 40(4): 669-682, December 2015
FARM LEVEL IMPACT STUDY OF POWER TILLER OPERATED
SEEDER ON SERVICE PROVIDERS’ LIVELIHOOD IN SOME
SELECTED SITES OF BANGLADESH
M. A. MONAYEM MIAH1 AND M. ENAMUL HAQUE2
Abstract
The custom hiring of power tiller operated seeder (PTOS) is highly profitable at
farm level and service providers could improve their livelihood through this
machine. The data and information on these aspects are scarce in Bangladesh.
Therefore, an attempt was made to conduct this study to assess the uses pattern
and the impacts of PTOS operations on service providers’ livelihood. A total of
53 service providers were randomly selected and interviewed for this study from
Dinajpur and Rajbari districts. The study revealed that most respondents
provided PTOS services almost throughout the year. The custom hiring of PTOS
created many positive impacts on the livelihoods of the service providers. PTOS
made a remarkable improvement in the livelihoods of its service providers in the
study areas. The respondent service providers experienced a considerable
increase in their land holdings (8.6%), annual income (63.4%), livestock
resources (44%), farm equipment (20%), household assets position, and
dwelling houses (42%). The increased income of beneficiaries are mostly spent
on farm machinery, nutritious food, cloths, health care, education, and making
of houses that indicate higher standard of riding to some extent, compared to pre
PTOS service period. The service providers faced some problems like higher
fuel cost, lack of riving facility, non-availability and higher price of spare parts,
roller jam, and lack of trained driver. Financial support and technical assistance
regarding PTOS should be made available by the government for service
providers and local manufacturers for the higher adoption of PTOS in
Bangladesh.
Keywords: PTOS, custom hire, service provider, livelihood.
1. Introduction
Most tillage operations in Bangladesh are now done by power tiller (PT) for
lower cost and require less time for cultivation (Islam, 2000; Miah, 2000; Barton,
2000; Miah et al., 2002; Haque et al., 2008). This tillage implement is introduced
basically for land preparation, but now it is used for different purposes depending
on environment, ability of farmers for buying attachments, and availability of
credit facilities. The percentage of area cultivated under PT is 67% and the
average growth rate of power tillers in Bangladesh was 21% during 1993-2003
1Senior Scientific Officer, Agricultural Economics Division, Bangladesh Agricultural
Research Institute (BARI), Joydebpur, Gazipur-1701, Bangladesh, 2Adjunct Associate
Professor, Murdock University, Australia, and Team Leader, Conservation Agriculture
Project, IDE Bangladesh, Gulshan, Dhaka-1212, Bangladesh.

670 MIAH AND HAQUE
(Quayum and Ali, 2012). There are about 7,00,000 PTs in Bangladesh (Hossain,
2014). The traditional tillage method reduces soil organic carbon at double rate
and decreases soil fertility (Grace, 2003), losses irrigation water and soils (Sayre
and Hobbs, 2003), and damages ecological environment (Grace, 2003).
Therefore, the concept of conservation tillage has been arisen all over the world
which is relatively new in Bangladesh.
PTOS is a two wheel tractor operated seed drill and widely used for various crop
establishments through conservation tillage, sowing of seeds and laddering
operations are done simultaneously in a single pass in many areas of Bangladesh.
Three operations could be done in one operation, i.e., prepare lands with fine
tilth, sowing seeds at the 2-3 cm depth and planking simultaneously. It performs
well at 15 to 36% of soil moisture level. If optimum soil moisture exists, it could
reduce turn-around-time up to zero days in between two crops establishment. It's
width of operation is 120cm having six rows sowing capacity at a time.
The service providers remove seeding unit from PTOS and convert only for High
Speed Rotary Tiller (HSRT). Most of the grain seeds like wheat, paddy, maize,
jute, pulses, oilseeds etc are sown in line using PTOS. The owners of PTOS are
using this device for their own land cultivation and earning cash income through
custom hiring to other farmers. The use of PTOS is getting popularity throughout
the country since its spare parts, repair and maintenance mechanics and
workshops are available at the village level. Nevertheless, the custom hiring of
PTOS is highly profitable at farm level (Miah et al. 2010) and many service
providers could improve their livelihood through this machine. The
socioeconomic impacts of this popular conservation tillage implement have not
been done in the country. Therefore, an attempt was made to conduct this study
with the following objectives.
Objectives
a) To describe the socio-economic profile of the PTOS service providers;
b) To determine the impacts of PTOS on the livelihoods of service
providers; and
c) To find out the uses pattern and problems of PTOS at service providers’
level.
2. Methodology
Sampling and data collection: The present study followed purposive sampling
technique in order to select study areas and sample service providers. At first
stage of sampling, four Upazillas namely Bochagonj, Fulbari and Dinajpur Sadar
under Dinajpur district and Baliakandi under Rajbari district were purposively
selected for the study. The reason of this selection was that PTOS is being widely

FARM LEVEL IMPACT STUDY OF POWER TILLER OPERATED 671
used in the aforesaid study areas. In Rajbari, PTOS is being used for sowing
wheat, jute, and sesame seed directly. In Dinajpur, it is widely used for planting
the seeds of wheat, maize, chickpea, lentil, mungbean, jute and sesame.
Nevertheless, PTOS is also being used for land preparation for transplanting
onion and garlic seedlings, paddling rice field in both the areas.
A total of 53 service providers1 taking 47 persons from Rajbari and six persons
from Dinajpur district were randomly selected for the study. Data and
information were gathered from selected service providers of PTOS through
conducting household survey using pre-tested interview schedules during July,
2008.
Analytical technique: The collected data were scrutinized, edited, tabulated, and
analyzed for fulfilling the objectives of the study. The impacts of PTOS on the
livelihoods of service providers were assessed through analyzing ‘Before’ and
‘After’ socio-economic standings of the service providers. Data regarding land
holdings, livestock resources, yearly household income, farm equipment,
household assets, liability status, and food intake were analyzed and compared
for measuring the impacts of PTOS service on its provider’s livelihoods. The
values of different household assets were collected based on present value. For
example, a house was built five years back with the amount of Tk.50,000 but due
to price hiking, the present value of this house is Tk.70,000 which is used for
reporting. Besides, if that farmer invested extra money for renovation and/or
extension of the house that amount is also added with the present value in this
report. T-test was also employed to show the level of significant difference
between two periods. Tabular method of analysis with descriptive statistics was
adopted to present the findings of the study.
3. Results and Discussion
3.1 Socioeconomic Profile of PTOS Service Providers
Socio-economic characteristics of the farmers are important in influencing farm
decision making and production planning. There are numerous interrelated and
constituent attributes that characterize a person and these profoundly influence
development behavior. Some related socioeconomic characteristics of the PTOS
Service Providers are shown in Table 1.
Age is an important factor that may be influenced entrepreneurs’ decision to
operate PTOS as a commercial business. The average age of the respondents was
40 years with minimum age of 23 years and the maximum of 90 years. They
were grouped into five categories based on their level of education. More than
47% of them completed secondary levels of education, followed by 34% of
1 Prepared land on contractual basis.

672 MIAH AND HAQUE
primary level. Only 3.8% were found to complete their higher level of education.
Only 2% service providers were not received any formal education. The average
length of experience of service providers in PTOS operations was four years
ranging from two to six years. Most of them were experienced by three years.
Three types of financing sources were reported in the study areas. More than half
of the respondents bought PTOS by own cash, cash from commercial banks or
PTOS sellers and from CIMMYT. A good number of service providers bought
by own cash. Many service providers owned a number of farms implement
namely power tiller, power thresher, shallow tube well (STW), sprayer and hand
weeder that were mostly used for renting out to others for earning cash income.
Nearly 86% of sample PTOS owners owned STW, 39.6% owned power thresher
and 18.9% owned sprayer. Furthermore, 26.4% of them bought an additional
power tiller for their own use as well as service providing business (Table 1).
Table 1: Socioeconomic profile of PTOS service provider in the study areas.
Items Frequency Mean
1. Farmers’ age (year) 53 40.0
2. Level of education (%)
a. Illiterate 2 3.8
b. Completed primary level 18 34.0
c. Completed secondary level 25 47.2
d. Completed higher secondary level 6 11.3
e. Degree and above 2 3.8
3. Experience with PTOS service (%)
a. 6 years (2002/03 to 2007/08) 2 3.8
b. 5 years (2003/04 to 2007/08) 6 11.3
c. 4 years (2004/05 to 2007/08) 9 17.0
d. 3 years (2005/06 to 2007/08) 23 43.4
e. 2 years (2006/07 to 2007/08) 13 24.5
4. Source of financing for PTOS (%)
a. Self 24 45.3
b. Credit 2 3.8
c. Both self & credit 27 50.9
5. Type of farm machineries owned (%)
a. Power tiller 14 26.4
b. Power thresher 21 39.6
c. Shallow tube well 45 86.8
d. Sprayer 10 18.9
e. Hand weeder 7 13.2

FARM LEVEL IMPACT STUDY OF POWER TILLER OPERATED 673
3.2 Uses Pattern and Trend of PTOS Operations
The sample service providers provided PTOS services almost throughout the
year. They rented out PTOS services for land preparation for sowing and
transplanting seeds/seedlings of different crops. Onion transplanting requires fine
tilth of soil. So, the highest land preparation was for onion followed by rice and
jute in the study areas. The period ranged from mid-October to mid-January was
reported to be the peak season of PTOS service since most of the Rabi crops are
grown within these periods. Contrarily, the periods ranged from mid-August to
mid-October and mid-May to mid-June were treated as lean period for PTOS
service (Fig-1).
Fig. 1. Seasonality of PTOS in the study areas.
3.3 Socioeconomic Impacts of PTOS on Service Providers’ Livelihood
A livelihood is a means of making a living. It encompasses people’s capabilities,
assets, income, and activities required to secure the necessities of life. In another
words, livelihood is defined as a set of activities, involving securing water, food,
fodder, medicine, shelter, clothing, and the capacity to acquire above necessities
working either individually or as a group by using endowments for meeting the
requirements of a household (http://en.wikipedia.org/wiki/ Livelihood).
Livelihood development is a broad issue usually which depends on the wider
economic development of the society. It was reported that PTOS had positive and
direct effects on its owners in generating employment and income; creating
household assets, and increasing the standard of living to a great extent in the
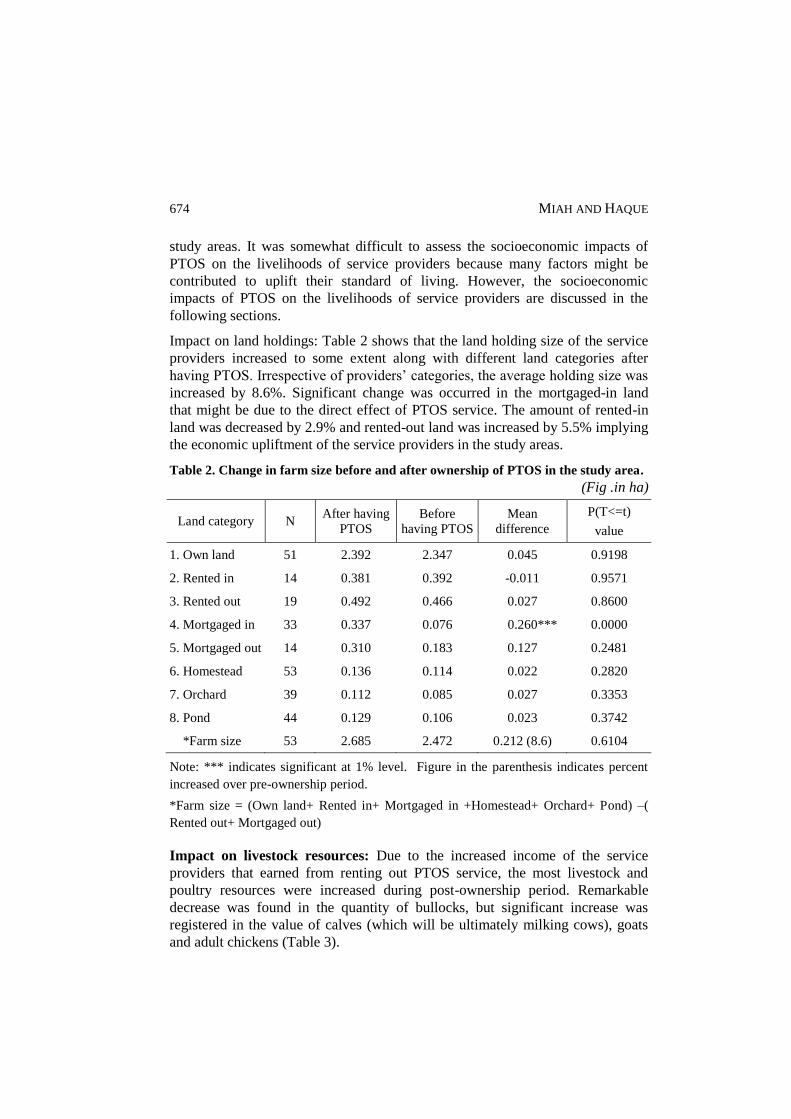
674 MIAH AND HAQUE
study areas. It was somewhat difficult to assess the socioeconomic impacts of
PTOS on the livelihoods of service providers because many factors might be
contributed to uplift their standard of living. However, the socioeconomic
impacts of PTOS on the livelihoods of service providers are discussed in the
following sections.
Impact on land holdings: Table 2 shows that the land holding size of the service
providers increased to some extent along with different land categories after
having PTOS. Irrespective of providers’ categories, the average holding size was
increased by 8.6%. Significant change was occurred in the mortgaged-in land
that might be due to the direct effect of PTOS service. The amount of rented-in
land was decreased by 2.9% and rented-out land was increased by 5.5% implying
the economic upliftment of the service providers in the study areas.
Table 2. Change in farm size before and after ownership of PTOS in the study area.
(Fig .in ha)
Land category N After having
PTOS
Before
having PTOS
Mean
difference
P(T<=t)
value
1. Own land 51 2.392 2.347 0.045 0.9198
2. Rented in 14 0.381 0.392 -0.011 0.9571
3. Rented out 19 0.492 0.466 0.027 0.8600
4. Mortgaged in 33 0.337 0.076 0.260*** 0.0000
5. Mortgaged out 14 0.310 0.183 0.127 0.2481
6. Homestead 53 0.136 0.114 0.022 0.2820
7. Orchard 39 0.112 0.085 0.027 0.3353
8. Pond 44 0.129 0.106 0.023 0.3742
*Farm size 53 2.685 2.472 0.212 (8.6) 0.6104
Note: *** indicates significant at 1% level. Figure in the parenthesis indicates percent
increased over pre-ownership period.
*Farm size = (Own land+ Rented in+ Mortgaged in +Homestead+ Orchard+ Pond) –(
Rented out+ Mortgaged out)
Impact on livestock resources: Due to the increased income of the service
providers that earned from renting out PTOS service, the most livestock and
poultry resources were increased during post-ownership period. Remarkable
decrease was found in the quantity of bullocks, but significant increase was
registered in the value of calves (which will be ultimately milking cows), goats
and adult chickens (Table 3).

FARM LEVEL IMPACT STUDY OF POWER TILLER OPERATED 675
Table 3. Change in livestock resources before and after ownership of PTOS
Livestock and
poultry N
After having PTOS Before having PTOS Mean difference
Quantity Value (Tk) Quantity Value (Tk) Quantity Value (Tk)
1. Bull/Ox 24 0.93 11691 1.52 13122 -0.59*** -1431
2. Cow 48 1.83 26669 1.56 21792 0.27 4877
3. Calves 40 1.33 9500 1.00 4095 0.33 5405***
4. Goat 33 3.48 5979 1.91 2218 1.57 3761***
5. Duck (Adult) 36 6.81 818 3.28 432 3.53 386
6.Chicken (Adult) 39 8.46 1204 6.64 793 1.82 411*
All types 22.84 55861 15.91 42452 6.93(44) 13409 (32)
Note: *** and * indicate significant at 1% and 10% level, respectively.
Figures in the parentheses indicate percent increased over pre-ownership period.
Impact on household income: The principal components of household income
of the service providers were crop farming, service, farm machinery, business,
and livestock and poultry farming. Table 4 shows the remarkable positive impact
of PTOS on the annual income of the service providers in the study areas. The
annual household income was significantly increased by 63.4% during post-
ownership period. The percent increase in income was found to be highest in case
of farm machineries followed by livestock rearing and crop production. The
service providers earned 19% of total income from PTOS. They stated that it
could be possible for them to buy other farm machineries like power tiller (PT),
STW, and thresher by the income received from PTOS.
Table 4. Change in yearly household income before and after ownership of PTOS.
Income source N After having
PTOS
Before having
PTOS
Mean
difference
P(T<=t)
value
1. Crop production 53 236460 (34) 179933 (53) 56527* 0.073
2. Service 15 140703 (20) 80933 (24) 59770 0.289
3. Business 13 51846 (8) 41615 (12) 10231 0.443
4. Livestock 40 18672 (3) 10097 (3) 8575*** 0.008
5. Fruit sale 6 7767 (1) 7300 (2) 467 0.959
6. Farm machinery 143 231851(34) 20874 (6) 210977*** 0.000
PTOS 53 130510 (19) 0 130510 -
PT 36 44833 (7) 8194 (2) 36639*** 0.000
STW 35 11929 (2) 2943 (1) 8986*** 0.000
Thresher 19 44579 (6) 9737 (3) 34842* 0.062
Total (Tk/year) 53 687299 (100) 340752 (100) 216037*** 0.002
Note: *** and * indicate significant at 1% and 10% level, respectively.
Figures within parentheses are the percentages of total income.

676 MIAH AND HAQUE
Impact on farm equipment: Increasing the household assets is closely related to
the financial condition of the service providers of PTOS. Renting out of PTOS
service in the study areas has boosted up their asset position to a great extent.
Table 5 revealed that the total quantity and value of farm equipment was
increased by 20% and 239% respectively during post-ownership period of PTOS.
Most service providers mentioned that they purchased modern farm equipment
like PT, STW, thresher, and sprayer by the income that earned from renting out
of PTOS service. That’s why the highest and significant increases were apparent
both in the number and value of STW, hand tube well (HTW), thresher, and
sprayer. Besides, the number of wooden plough decreased with the increase in
the use of PT and PTOS.
Table 5. Change in farm equipment before and after ownership of PTOS.
Farm equipment N
After having
PTOS
Before having
PTOS Mean difference
Quantity Value Quantity Value Quantity Value
1. PTOS 48 1.02 81,590 0 0 1.02 81,590***
2. Power tiller 25 1.00 54,760 0.64 35,620 0.36 19,140*
3. STW 49 1.08 15,106 0.65 8,551 0.43*** 6,555*
4. HTW 53 1.28 7,404 0.89 4,726 0.39*** 2,678***
5. Sprayer 23 1.13 2,355 0.65 527 0.48*** 1,828
6. Thresher 22 1.14 32,414 0.50 5,732 0.64** 26,682***
7. Wooden plough 27 0.19 52 1.44 743 -1.25*** -691***
8. Ladder 50 1.36 372 1.40 403 -0.04 -31
Total 8.2
194,053
6.17
56,302
2.03
(33)
1,37,751***
(245)
Note: ***, ** and * indicate significant at 1%, 5% and 10% level, respectively.
Figures in the parentheses indicate percent increased over pre-ownership period.
Impact on household assets: Due to increased income, the housing assests of all
service providers of PTOS has improved to a great extent. They have made
remarkable improvements in their dwelling houses and kitchens during post-
ownership period. Table 6 revealed that the number and value of semi-pacca
building were significantly increased by 42% and 69% respectively during post-
ownership period. On the contrary, the numbers of Katcha-pacca and Katcha
houses decreased by 3.7% and 17.1% respectively. Remarkable improvements
were also found in the number and value of both semi-pacca and Katcha-pacca
kitchen. Most sample service providers had to construct more number of valuable
store houses due to increase in both crop production and household assets.

FARM LEVEL IMPACT STUDY OF POWER TILLER OPERATED 677
Table 6. Change in house types before and after ownership of PTOS.
House type N
After having PTOS Before having PTOS Mean difference
Quantity Value
(Tk) Quantity Value (Tk) Quantity
Value
(Tk)
1.Dwelling house 7.07 529128 5.86 218224 1.21 310904
Pacca1 4 1.75 202500 1.00 10000 0.75 192500
Semi-pacca2 42 2.40 236310 1.69 139929 0.71** 96381**
Katcha-pacca3 19 1.32 49318 1.37 40895 -0.05 8423
Katcha4 5 1.60 41000 1.80 27400 -0.20 13600
2. Kitchen 3.28 93029 2.81 69319 0.47 23710
Pacca 2 1.00 50000 1.00 50000 0 0
Semi-pacca 19 1.11 29000 0.84 13968 0.27** 15032**
Katcha-pacca 35 1.17 14029 0.97 5351 0.20 8678**
3. Other houses 3.66 58656 3.14 43600 0.52 15056
Cow shed 43 1.12 26988 1.10 18290 0.02 8698
Poultry shed 25 1.44 1768 1.24 1510 0.20 258
Storehouse 10 1.10 29900 0.80 23800 0.30*** 6100
Note: 1 House with concrete roof and brick wall. 2 House with corrugated iron (CI) sheet roof and brick wall. 3 House with CI sheet roof and thrashed bamboo/jute stick/straw wall. 4 House with straw roof and thrashed bamboo/jute stick/straw wall.
***, ** and * indicate significant at 1%, 5% and 10% level, respectively.
Providing PTOS service has incredible impact in increasing the household assets
in the study areas. Table 7 shows the comparative scenarios of the household
asset positions of PTOS service providers. The quantity and quality (in terms of
value) of different types of furniture, modern amenities and other household
assets of the service providers were significantly increased after having PTOS.
However, no change was made in the quantity and quality of Chowki, radio and
boat in the study areas.
Impact on liabilities: The service providers of PTOS were reported to be
received loan from commercial bank, cooperative society, and local NGOs and
borrowed money from moneylender, relatives, and many other sources for
various purpose. Table 8 revealed that the average amount of loan received
during PTOS ownership period was about 50.5% higher than that of pre-
ownership period that might be due to purchase of PTOS and related accessories.
This scenario also clearly indicates their higher access to the institutional credit
facility in study areas.

678 MIAH AND HAQUE
Table 7. Change in household assets before and after ownership of PTOS.
Household
assets N
After having PTOS Before having PTOS Mean difference
Quantity Value
(Tk) Quantity
Value
(Tk) Quantity
Value
(Tk)
1. Furniture 27.35 57,592 14.12 23,944 13.23 33648
Cot 38 3.16 24,066 1.37 9,408 1.79*** 14658***
Chowki1 50 3.18 3,942 2.88 3,912 0.30 30
Almirah 36 1.64 9,500 0.72 3,819 0.92*** 5681***
Dressing table 25 1.56 5,544 0.24 1,000 1.32*** 4544***
Tables 53 2.79 3,104 1.34 1,340 1.45*** 1764***
Chairs 52 5.75 2,578 2.90 1,099 2.85*** 1479***
Bench 36 1.19 785 0.89 538 0.30* 247**
Dress-stand 48 2.75 2,543 1.27 1,115 1.48*** 1428***
Basket (large) 42 2.26 4,802 1.10 1,429 1.16*** 3373***
Tool2 41 3.07 728 1.41 284 1.66*** 444***
2.Modern amenities 12.98 120,376 5.75 26,509 7.23 93867
Mobile phone 47 1.81 7,569 0.15 543 1.66*** 7026***
Motor cycle 14 1.14 95,786 0.29 19,643 0.85*** 76143***
Television 35 1.31 11,589 0.49 3,397 0.82*** 8192***
Cassette player 24 0.92 2,119 0.50 1,313 0.42*** 806*
Radio 32 0.88 352 0.88 352 0 0
Wrist watch 41 2.49 1,390 1.39 599 1.10** 791***
Table/wall clock 45 1.91 573 0.78 228 1.13*** 345***
Torch light3 48 2.52 998 1.27 434 1.25*** 564***
3. Other assets 3.68 18,892 2.74 14,927 0.94 3965
Bicycle 47 1.79 6,004 1.23 3,574 0.56** 2430***
Rickshaw/van 26 0.92 3,312 0.54 1,777 0.38*** 1535***
Boat 33 0.97 9,576 0.97 9,576 0 0
1a four legged wooden bedstead; 2a wooden seat without a back for one person; 3a light to
be carried in the hand
Note: ***, ** and * indicate significant at 1%, 5% and 10% level, respectively.

FARM LEVEL IMPACT STUDY OF POWER TILLER OPERATED 679
Table 8. Change in liability position after ownership of PTOS.
Source of credit N After having
PTOS
Before having
PTOS
Mean
difference
P(T<=t)
value
1. Commercial bank 22 28,591 19,273 9,318 0.3037
2. Cooperative society 1 5,000 0 5,000 -
3. Local NGO 9 50,667 33,000 17,667 0.6570
4. Moneylender 2 17,500 27,500 -10,000 0.7788
5. Relatives 3 8,333 1,667 6,666 0.2522
6. Others 2 20,000 5,000 15,000 0.2048
All sources 21,682 14,407 7,275
Impact on food intake: Due to increased income that earned from renting out
PTOS service to others, the frequency and quality of food intake were
significantly increased in the study areas. One of the highest improvements was
reported in the case of weekly intake of milk, egg, and meat. Fish and vegetable
intake also increased remarkably (Table 9).
Table 9. Change in food intake pattern after ownership of PTOS.
Food intake pattern N
Frequency of food intake Mean
difference
P(T<=t)
value After having
PTOS
Before having
PTOS
1. Food intake (times/day) 53 3.32 (5) 3.15 0.17** 0.0400
2. Fish intake (time/week) 53 5.00 (25) 3.75 1.25*** 0.0000
3. Meat intake (time/month) 51 3.10 (30) 2.18 0.92** 0.0507
4. Egg intake (time/week) 52 3.10 (37) 1.97 1.13*** 0.0000
5. Milk intake (time/week) 53 5.79 (48) 3.02 2.77*** 0.0000
6. Vegetable intake (kg/week) 53 10.94 (28) 7.91 3.03*** 0.0043
Note: ***, ** and * indicate significant at 1%, 5% and 10% level, respectively.
Figures within parentheses indicate percent increase over pre-ownership period.
Impact on overall livelihood status: The overall standard of living social status of
the service providers of PTOS was improved remarkably. Table 10 showed that
irrespective of service providers’ category, more than 94% of respondents used
safe drinking water from hand tube-well and use sanitary toilet, and about 50%
extra households get connection of electricity at their residences. Awareness
development was another positive impact that was found in the service providers
during post-ownership period. It was reported that the awareness of service
providers regarding contraceptive use, sending children to school, and consultation
with MBBS doctor was increased (6.3-27%) to some extent. Furthermore, better
economic standing enabled them to buy more costly new clothes for several social

680 MIAH AND HAQUE
and religious events. It revealed that the members of service providers with local
level cooperative society increased by about 74% in the study areas.
Table 10. Increase in livelihood status before and after ownership of PTOS.
Livelihood criteria
% responses
% increased After having
PTOS
Before having
PTOS
Sample size (N) 53 53 53
1. Using tube well water 94.3 83.0 13.6*
2. Using sanitary toilet 94.3 69.8 35.1***
3. Using electricity 56.6 37.7 50.1*
4. Adopting contraceptive method 56.6 45.3 24.9*
5. Sending children to school 88.7 69.8 27.1*
6. Consultation with MBBS doctor 94.3 88.7 6.3
7. Buying new cloths in religious festivals 92.5 81.1 14.1*
8. Offering gifts in social events 94.3 83.0 13.6*
9. Membership with cooperative society 49.1 28.3 73.5**
3.4 Problems of Service Providers
About 38% of total service providers did not face any major problem except few minor things during renting out of PTOS service to the farmers. Among different problems, higher diesel price was ranked first which was mentioned by over 60% of the service providers. Driving of PTOS by walking sometimes create problem
for them. The non-availability and higher price of spare parts and roller jam due to soil store were mentioned by 47.2% and 28.3% of the service providers as problems. Some service providers told that trained and efficient driver become scares, especially in the peak season (Rabi season). A few respondents also mentioned that PTOS tilled land with shallow depth (Table 11).
Table 11. Problems encountered by sample service provider of PTOS/HSRT.
Type of problem Responses (N = 53)
Number %
1. No problem at all 20 37.7
2. Fuel cost is high 32 60.4
3. Driving by walking 28 52.8
4. Non-availability and higher price of spare parts 25 47.2
5. Soil store in roller/roller jam 15 28.3
6. Scarcity of trained driver 12 22.6
7. Shallow depth in cultivation 10 18.9
8. Others* 8 15.1
* Difficult to drive during rainy season; unable to drive at night; licking fuel from
reservoir; problem in radiator and sprocket

FARM LEVEL IMPACT STUDY OF POWER TILLER OPERATED 681
4. Conclusions and Recommendations
The study assessed the uses pattern of PTOS operations and its impacts on
service providers’ livelihood. Custom hiring business through PTOS made a
remarkable improvement in the livelihoods of its service providers in the study
areas. The average land holding of the service providers was increased to some
extent. Significant increase was registered in the value of livestock and poultry
resources. The annual household income and number and value of semi-pacca
building were also significantly increased by a great extent during post-
ownership period. Both the quantity and value of farm equipment and household
assets were significantly increased after having PTOS. The amount of loan
received during PTOS ownership period was much higher in the post-ownership
period compared to pre-ownership period. The increased income of beneficiaries
are mostly spent on farm machinery, nutritious food, cloths, health care,
education expenses and making of houses that indicate higher standard of living
of service providers. The service providers encountered problems like higher fuel
cost, lack of riving facility, non-availability and higher price of spare parts, roller
jam, and lack of trained driver.
Due to higher adoption of PTOS, financial support and technical assistance
should be made available by the government of Bangladesh for service providers
and local manufacturers. Fuel cost may be reduced for small holder farmers.
Training on repair and maintenance of PTOS for operators is highly required.
Furthermore, research work should be carried out to improve the machine with
riding facilities and adding fertilizers application system with existing PTOS that
will improve fertilizer uses efficiencies.
Acknowledgement: The financial assistance to carry out the study from Impact
Targeting and Assessment Unit of CIMMYT is greatly acknowledged. We also
appreciate the help of many others, both individuals and institutions, during
conducting this study and regret our inability to acknowledge them all
individually.
References
Barton, D. 2000. Options for farm power use in primary cultivation on small farms:
Summary of main findings. J. of Agril. Mach. & Mech. 4(1): 1-4, 2000.
Grace, P R. 2003. Rice-Wheat System and Climatic Change. Addressing Resource
Conservation Issues in Rice-Wheat Systems of South Asia: A Resource Book. Rice-
Wheat Consortium for the Indo-Gangetic Plains - International Maize and Wheat
Improvement Center, New Delhi, Pp. 63-67
Haque, M. E., Hossain, M. I., Wohab, M. A., Sayre, K. D., Bell, R.W., Hossain, M. I. and
Timsina, J. 2008. Agricultural Mechanization in Bangladesh and Conservation
Agriculture: The Opportunities, Priorities, Practices and Possibilities. Forth

682 MIAH AND HAQUE
International Conference of Conservation Agriculture. Forthcoming. February 2009,
New Delhi, India.
Hossain, M. A. 2014. Agricultural mechanization: The role of BARI. A key-note paper
presented in the seminar on 'Farm Mechanization in Bangladesh' organized by the
Department of Agricultural and Industrial Engineering, Hajee Mohammad Danesh
Science and Technology University, Dinajpur on 31 August 2014.
Islam, M. S. 2000. Socio-economic impacts of power tiller adoption on small farming in
Bangladesh. J. of Agril. Mach. & Mech. 4(1): 77-85.
Quayum, M. A. and A. M. Ali. 2012. Adoption and diffusion of power tillers in
Bangladesh. Bangladesh J. Agril. Res. 37(2): 307-325, June 2012.
Miah, M. A. M; Islam, M. S. and Miah, M. T. H. 2002. Socio-economic impacts of farm
mechanisation on the livelihoods of rural labourers in Bangladesh. Journal of Farm
Economy 12: 147-162.
Miah, M. A. M., Haque, M. E. Baksh, M. E. and Hossain, M. I. 2010. Economic analysis
of power tiller operated seeder operations at farm level, Journal of Agricultural
Engineering, The Institution of Engineers, Bangladesh, Vol. 38/AE, No. 1, June
2010.
Miah, T. H. 2000. Economic impacts of using power tillers and draught animals for
primary cultivation of small farms in Bangladesh. J. of Agril. Mach. & Mech. 4(1):
69-75.
Sayre, K. D. and Hoobs, P. 2003. Raised Bed System of Cultivation for Irrigated
Production Condition. Bed planting course, CIMMYT, Mexico.

ISSN 0258-7122
Bangladesh J. Agril. Res. 40(4): 683-692, December 2015
GENETIC DIVERGENCE IN PUMPKIN (Cucurbita moschata L.)
GENOTYPES
S. SULTANA1, M. A. KAWOCHAR2, S. NAZNIN3
H. RAIHAN4 AND F. MAHMUD5
Abstract
Genetic diversity using Mahalanobis’s D2 technique was studied for yield and its
components on twenty one genotypes of pumpkin (Cucurbita moschata L.).
Quantification of variability for each character was done using the Shannon
Weaver Diversity Index. High degree of variation was exhibited within the
collection, as reflected by mean diversity index value of 0.80. Data were
subjected to principal component analysis (PCA), principal coordinate analysis
(PCO), canonical variate analysis (CVA) and non-hierarchical clustering to
identify suitable parents having distant relationship for hybridization program.
The genotypes were grouped into five different clusters. Cluster IV contained
the maximum number of seven genotypes whereas cluster I contained least
number having only one genotype. The lowest inter-genotypic distance (0.75)
was found between BD-2174 and BD-9489 where the highest (47.46) was
between BARI Mistikumra-1 and BD-2150. The maximum inter cluster distance
was observed between cluster II and III (17.922) and the minimum inter cluster
distance was observed between cluster II and IV (6.825). The maximum intra
cluster distance was noticed for the cluster V (0.261) and the minimum intra
cluster distance was found in cluster I (0.00). Cluster I contained the highest
mean values for pedicel length of male flower, number of male flowers/plant,
fruit length, fruit breadth, single fruit weight and fruits/plant. Cluster II
contained the highest mean values for days to first male and female flowering.
Cluster III contained the highest mean values for leaf breadth, pedicel length of
female flower and number of female flowers/plant. Leaf breadth, pedicel length
of male flower, number of male flowers/plant and fruits/plant were the important
components of genetic divergence in the studied materials. Based on inter
cluster distance, inter genotypic distance and consideration of desirable
characters for high yield potential, the genotypes G19 (BARI mistikumra-1) and
G20 (BARI mistikumra-2) from cluster II; G21 (BD-2150) from cluster I and
G1 (BD-2151) and G13 (BD-266) from cluster III can be selected as better
parents for future hybridization program.
Keywords: Cucurbita moschata L., principal component analysis, cluster
analysis, genetic divergence.
1-3Scientific Officer (Plant Breeding), Tuber Crops Research Centre, Bangladesh
Agricultural Research Institute (BARI), Gazipur-1701, 4Scientific Officer, Agricultural
Research Station, BARI, Gazipur-1701, 5Professor, Department of Genetics and Plant
Breeding, Sher-e-Bangla Agricultural University, Dhaka-1207, Bangladesh.

684 SULTANA et al.
Introduction
Pumpkin (Cucurbita moschata L.) is locally known as ‘Misti kumra’ or ‘Misti
lau’ or ‘Misti kadu’ and is considered to have originated from Central and North
America (Whitaker and Davis, 1962). It is an under exploited popular vegetable
but has higher demand in Bangladesh. It is relatively high in energy and
carbohydrates and a good source of vitamins, especially high carotenoid
pigments and minerals (Bose and Som, 1986). It may contribute to improve the
nutritional status of the people, particularly the vulnerable groups in respect of
vitamin A requirement. It becomes available even in the lean period when other
vegetables are scarce in Bangladesh. Among the non-traditional crops,
Bangladesh has been earning a handsome amount of foreign currency by
exporting pumpkin to the U.K., Pakistan and Middle East (Alamgir, 1998). The
total production of pumpkin is 0.218 million tons in a year in this country (BBS,
2011). Lack of high yielding, disease and pest tolerant variety is the main
constrains towards its production. For developing a high yielding variety with
desired characters needs good parents. The selection of potential good parents in
a breeding program is based on the knowledge of genetic diversity amongst
them. Evaluation of genetic diversity is important to know the source of genes for
a particular character within the available germplasm (Tomooka 1991). To
realize heterosis, genetically divergent parents are generally considered to be
useful. In such crosses more variability could be expected in the resulting
segregating progenies. Genetic divergence can be estimated by D2 Statistic
suggested by Mahalanobis and in turn is based on multivariate analysis of
quantitative characters. The present study has been undertaken to generate
information on genetic divergence in pumpkin so that the useful parental material
for the breeding programs could be selected.
Materials and Method
The investigation was carried out at the experimental field of Sher-e-Bangla
Agricultural University, Bangladesh during the period from March 2010 to
August 2010 to study the genetic diversity in pumpkin. Twenty one genotypes
of pumpkin were used in Randomized Complete Block Design (RCBD) with
three replications. Those genotypes were assigned at random into pits of each
replication. Pits of 55 cm x 55 cm x 50 cm were prepared in each plot with
spacing of 3 m x 3 m. Number of pits/plot were 3. Standard package of cultural
practices was followed for raising healthy crops. For studying different genetic
parameters and inter-relationships, thirteen characters were taken into
consideration like leaf length (cm), leaf breadth (cm), internodes distance (cm),
days to first male flowering, days to first female flowering, pedicel length of
male flower (cm), pedicel length of female flower (cm), number of male flowers,
number of female flowers, fruit length (cm), fruit breadth (cm), fruit weight (Kg)
and fruit yield/ plant (Kg).

GENETIC DIVERGENCE IN PUMPKIN (Cucurbita moschata L.) GENOTYPES 685
Quantification of variability for each character was done using the Shannon-
Weaver Diversity Index. Estimate of variability for each character was computed
using the standardized Shannon-Weaver Diversity Index, designated as H’ and
has the formula:
H’= -∑Pi(log2Pi)/log2 n
Where, Pi is the proportion of the total number of genotypes belonging to the ith
class.
For each quantitative characters, the overall genotype means (x) and standard
deviation (σ) were used to subdivide the population values (xi) into 10 frequency
classes, ranging from class 1 (if xi ≤ -2σ} to class 10 (if xi ≤ X+2σ), the class
interval being 0.5σ. The lowest and highest values were considered to determine
the number of classes construct. The diversity considered high when H’ > 0.75,
moderate when H’ = 0.50 – 0.75 and low when H’ < 0.50. The Shannon-Weaver
Diversity Index has a value ranging from 0 to 1, where 0 indicates absence of
diversity and 1 indicates maximum diversity.
For both univariate and multivariate analysis, mean data for each character was
used. In case of univariate analysis, analysis of variance was done individually
by F test (Panse and shuhkhatme, 1978) and MSTATC software was used for
this purposes. Multivariate analysis viz. Principal Component Analysis (PCA),
Principal Coordinate Analysis (PCO), Cluster Analysis, and Canonical Vector
Analysis (CVA) were done by using Genestat 5.13 software program.
Result and Discussion
The analysis of variance showed significant variations among the genotypes for
all the characters studied (Table 1).
Estimation of variation Using the Shannon- Weaver Diversity Index
Only two characters like days to first male flowering (0.73) and leaf breadth
(0.74) exhibited medium variation while all the rest gave high diversity values.
The computed diversity ranged from 0.73 (days to first male flowering) to 0.85
(leaf length) with a mean diversity value of 0.80 indicated existence of high
variation within the collection (Table 2).
Cluster analysis
Based on cluster analysis, the twenty one genotypes were grouped into five
clusters (Table 3). Cluster IV contained the maximum number of seven
genotypes followed by cluster III, V and II having six, five and two, respectively,
while cluster I contained least number of one genotype. In many cases, the same
cluster included genotypes from different eco-geographic region indicating that

686 SULTANA et al.
the geographic distribution and genetic divergence did not follow the same trend.
The mean performances of thirteen characters in five clusters are shown in Table
4. Most of the characters showed distinct differences among the clusters. Cluster
I contained the highest mean values for pedicel length of male flower (22.60),
number of male flowers/plant (9.33), fruit length (74.40), fruit breadth (35.00),
single fruit weight (3.58) and fruits/plant (7.15), whereas the lowest mean values
for internodes distance (11.33). Cluster II contained the highest mean values for
days to first male flowering (85.83), days to first female flowering (86.83) and
the lowest mean values for leaf length (12.83), leaf breadth (18.33), pedicel
length of male flower (8.23), pedicel length of female flower (2.09), number of
male flowers/plant (1.00), number of female flowers/plant (1.00), fruit length
(40.06), fruit breadth (18.03), single fruit weight (0.85) and fruits/plant (0.85).
Cluster III got the highest mean values for pedicel length of female flower (5.52)
and number of female flowers/ plant (4.78) while the lowest values for days to
first male flowering (63.06) and days to first female flowering (67.78). Cluster
IV contained the highest mean values for leaf breadth (25.77) and internodes
distance (15.19).
Table 1. Range, Mean, Mean sum of square (MSG), Percent coefficient of variation
(CV) of 21 pumpkin genotypes.
Parameters Range Mean MSG CV (%)
Leaf length without petiole (cm) 11.33-21.60 17.20 24.51** 5.23
Leaf breadth (cm) 15.20-30.67 23.39 38.32** 4.70
Internodes distance 10.00-20.00 14.17 29.12** 14.73
Days to first male flowering 60.00-86.33 70.38 150.44** 6.07
Days to first female flowering 65.67-87.00 75.17 135.82** 5.31
Pedicel length of male flower (cm) 8.07-26.47 16.67 105.05** 6.73
Pedicel length of female flower (cm) 2.07-8.63 4.45 9.94** 8.35
Number of male flowers/plant 1.00-15.33 6.77 40.94** 34.57
Number of female flowers/plant 1.00-7.00 3.53 11.34** 52.68
Fruit length (cm) 39.60-74.40 53.34 201.36** 9.87
Fruit breadth (cm) 17.33-35.00 27.59 65.34** 10.04
Single fruit weight (kg) 0.80-3.58 2.09 1.77** 17.02
Fruit yield/plant (kg) 0.80-9.92 4.01 21.00** 40.09
** Variation is significant at 1% level of probability.

GENETIC DIVERGENCE IN PUMPKIN (Cucurbita moschata L.) GENOTYPES 687
Table 2. Computed diversity indices (H’) for 13 different characters of 21 pumpkin
genotypes.
Characters H’
Leaf length without petiole (cm) 0.85
Leaf breadth (cm) 0.74
Internodes distance 0.81
Days to first male flowering 0.73
Days to first female flowering 0.82
Pedicel length of male flower (cm) 0.81
Pedicel length of female flower (cm) 0.83
Number of male flowers/plant 0.78
Number of female flowers/plant 0.81
Fruit length (cm) 0.84
Fruit breadth (cm) 0.75
Single fruit weight (kg) 0.84
Fruit yield/plant (kg) 0.82
Average 0.80
Table 3. Distribution of genotypes in different clusters.
Cluster
no. No. of Genotypes
No. of
population Name of genotypes
I G21 1 BD-2150
II G19, G20 2 BARI mistikumra-1, BARI
mistikumra-2
III G1, G2, G9, G10, G11, G13 6 BD-266, BD-2214, BD-2151,
BD-2153, BD-2229, BD-2222
IV G3, G4, G6, G14, G15, G16,
G18 7
BD-2174, BD-2177, BD-2196,
BD-9489, BD-9494, BD-9491,
BD-9490
V G5, G7, G8, G12, G17 5 BD-264, BD-2203, BD-2212,
BD-9493, BD-4590
Principal Coordinate Analysis (PCO)
Inter-genotypic distances (D2) were obtained from PCO for all possible
combinations between pair of genotypes. Intergenotypic distances among the
pumpkin genotypes ranged from 0.75 (between BD-2174 and BD-9489) to 47.46
(between BARI mistikumra-2 and BD-2150) (Table 5). The difference between
the highest and lowest inter genotypic distance indicated the presence of
variability among the twenty one pumpkin genotypes.

688 SULTANA et al.
Table 4. Cluster mean values of 13 different characters of 21 pumpkin genotypes.
Characters I II III IV V
Leaf length without petiole (cm) 17.67 12.83 18.40 17.83 16.53
Leaf breadth (cm) 21.87 18.33 23.47 25.77 22.29
Internodes distance 11.33 13.00 14.33 15.19 13.60
Days to first male flowering 70.67 85.83 63.06 69.91 73.60
Days to first female flowering 74.33 86.83 67.78 76.19 78.13
Pedicel length of male flower (cm) 22.60 8.23 20.86 12.47 19.71
Pedicel length of female flower (cm) 5.10 2.09 5.52 4.65 3.72
Number of male flowers/plant 9.33 1.00 7.72 7.05 7.07
Number of female flowers/plant 4.67 1.00 4.78 3.67 2.67
Fruit length (cm) 74.40 40.06 54.18 57.27 47.95
Fruit breadth (cm) 35.00 18.03 27.65 30.11 26.35
Single fruit weight (kg) 3.58 0.85 2.05 2.54 1.71
Fruit yield/plant (kg) 7.15 0.85 6.10 3.63 2.70
Table 5.Ten of each higher and lower inter- genotypic distance (D2) among the 21
pumpkin genotypes.
Sl
No. Genotypic Combination
Ten
Maximum
(D2) Values
Sl
No. Genotypic Combination
Ten
Minimum
(D2)
Values
01 BD-
2150-
BARI
mistikumra-2
47.46 01 BD-2174 - BD-9489 0.75
02 BD-2151
-
BARI
mistikumra-2
46.39 02 BD-2177 - BD-2214 1.42
03 BD-
2150-
BARI
mistikumra-1
46.04 03 BARI
mistikumra-1
- BARI
mistikumra-2
1.57
04 BD-2151
-
BARI
mistikumra-1
44.82 04 BD-9489 - BD-9490 2.13
05 BD-266 - BARI
mistikumra-2
43.86 05 BD-2174 - BD-9490 2.41
06 BD-2229
-
BARI
mistikumra-2
43.04 06 BD-264 - BD-9491 2.92
07 BD-266 - BARI
mistikumra-1
42.30 07 BD-9490 - BD-9491 3.45
08 BD-2229
-
BARI
mistikumra-1
41.46 08 BD-2196 - BD-2214 3.60
09 BD-2196
-
BARI
mistikumra-2
38.98 09 BD-2151 - BD-2229 3.71
10 BD-2196
-
BARI
mistikumra-1
37.42 10 BD-2174 - BD-9491 3.74
The intra-cluster distances were computed by using the values of inter-genotypic
distances from distant matrix according to Sing and Chaudhury (1985). The

GENETIC DIVERGENCE IN PUMPKIN (Cucurbita moschata L.) GENOTYPES 689
magnitude of the intra cluster distances were not always proportional to the
number of genotypes in the clusters (Huque et al, 2012), as the maximum intra
cluster distance was noticed for the cluster V (0.261) followed by cluster III
(0.177) and cluster IV (0.109). The minimum intra cluster distance was found in
cluster I (0.00) followed by cluster II (0.01) (Table 6). This result supported by
Gaffar (2008) and he reported that the genotypes were grouped into five
clusters in which the highest intra cluster distance was noticed for the cluster
II (0.999) and the lowest for the cluster IV (0.439).
Table 6. Intra (Bold) and inter cluster distances (D2) for 21 pumpkin genotypes.
Cluster I II III IV V
I 00.00 15.472 11.858 6.825 10.326
II 00.01 17.922 14.444 10.447
III 0.177 7.284 9.274
IV 0.109 6.450
V 0.261
Table 7. Eigenvalues and percentage of variation in respect of 13 principal
components in 21 genotypes of pumpkin
Principal
component axis
Eigen values Percent variation Cumulative % of Percent
variation
1 5.735 44.12 44.12
2 2.066 15.89 60.12
3 1.684 12.95 72.96
4 1.176 9.05 82.01
5 0.812 6.24 88.25
6 0.558 4.29 92.54
7 0.328 2.53 95.07
8 0.233 1.80 96.87
9 0.185 1.42 98.29
10 0.137 1.06 99.35
11 0.035 0.27 99.62
12 0.033 0.25 99.88
13 0.018 0.13 100.00
Canonical Variate Analysis (CVA)
The inter-cluster distances were obtained from CVA. The inter cluster distances
were larger than intra cluster distances which indicated that wider genetic
diversity among the genotypes of different groups. The maximum inter cluster
distance was observed between cluster II and III (17.922) followed by cluster I
and II (15.472), cluster II and IV (14.444). The maximum inter cluster distance
indicated that the genotypes belonging to cluster II were far away from those of
cluster III. The minimum inter cluster distance was observed between cluster IV

690 SULTANA et al.
and V (6.45) followed by I and IV (6.825) (Table 6). The results revealed that the
crosses between the genotypes of cluster II and III would exhibit high heterosis
and produce new recombinant with desirable traits.
Principal Component Analysis (PCA)
PCA is a statistical method which attempts to describe the total variation in
multivariate sample using fewer variables than in the original data set (Bartolome
et al., 1999). The analysis results in the identification of the major attributes that
are responsible for the observed variation within a given collection. From
principal component analysis the values were found as 72.96% in the first three
components and it was 82.01% in the four components of the total variance
(Table 7). The two dimensional scatter diagram was prepared by using score
component 1 in X axis and 2 in Y axis, showing the groups into five clusters
among the genotypes which supported the result of cluster analysis (Fig 1).
Fig. 1. Scattered diagram of 21 pumpkin genotypes of superimposed clusters
Contribution of characters towards divergence of the genotypes
Contribution of characters towards divergence of the genotypes is presented in
table 8. The result of principal component analysis revealed that in vector I (Z1),
the important characters responsible for genetic divergence in the major axis of
differentiation were leaf length, leaf breadth, days to first male flowering, pedicel

GENETIC DIVERGENCE IN PUMPKIN (Cucurbita moschata L.) GENOTYPES 691
length of male flower, number of male flowers/plant, number of female
flowers/plant, single fruit weight and fruits/plant which accounted for 44.12% of
the total variation. In vector II (Z2), which was the second axis of differentiation,
leaf breadth, internodes distance, days to first female flowering, pedicel length of
male flower, pedicel length of female flower, number of male flowers/plant and
fruits/plant were important. Those characters contribute 15.89% of the total
variation. The role of leaf breadth, pedicel length of male flower, number of male
flowers/plant and fruit yield/plant in both the vectors was positive, which indicate
the important components of genetic divergence in the collected materials.
Divergence in the collected materials due to these four characters will offer a
good scope for improvement of yield through rational selection of parents for
producing hybrids. Banik (2003) reported that main vine length, first female
flower node number, nodes on main vine, fruit length and number of seeds/fruit
in snake gourd had the highest contribution towards the divergence.
Table 8. Relative contributions of the thirteen characters of 21 pumpkin genotypes
to the total divergence.
Characters Vector-1 Vector-2
Leaf length without petiole (cm) 0.5349 -0.1190
Leaf breadth (cm) 0.1333 0.0045
Internodes distance -0.1342 0.1140
Days to first male flowering 0.9228 -0.3450
Days to first female flowering -0.0185 0.1123
Pedicel length of male flower (cm) 0.1329 0.0509
Pedicel length of female flower (cm) -0.5019 0.2415
Number of male flowers/plant 0.1079 0.2099
Number of female flowers/plant 0.3500 -1.9159
Fruit length (cm) -0.0214 -0.2980
Fruit breadth (cm) -0.4121 -0.1813
Single fruit weight (kg) 1.3447 -1.4068
Fruit yield/plant (kg) 0.0004 1.4252
Selection of genotypes
It is generally assumed that maximum amount of heterosis would be manifested
in cross combinations involving the genotypes belonging to the most divergent
clusters. Genotypes in cluster II if crossed with cluster I and cluster III might
exhibit high heterosis as well as wide spectrum of genetic variation in F2
generation. Based on inter cluster distance, inter genotypic distance and
consideration of desirable characters for high yield potential, the genotypes G19

692 SULTANA et al.
(BARI mistikumra-1) and G20 (BARI mistikumra-2) from cluster II; G21 (BD-
2150) from cluster I and G1 (BD-2151) and G13 (BD-266) from cluster III may
be considered better parents for future hybridization program.
References
Alamgir, M. 1998. Export potential of non-traditional agricultural products (Bangladesh).
Bangladesh Quarterly, 1(3): 12-13.
Bartolome, V. I., L. C. Quintana, A. B. Olea, L. C. Paunlagui, M. A. Ynalvez and C. G.
Maclaren. 1999. Experimental design and data analysis for agricultural
research.Volume 2. Training Documents. Biometrics Unit. International Rice
Research Institute.
Banik, B. R. 2003. Variability, gene action and heterosis in snake gourd (Trichosanthes
anguina L.). Ph.D. thesis, Department of Genetics and Plant Breeding.
Bangabandhu Sheikh Mujibur Rahman Agricultural University, Salna, Gazipur,
Pp. 1-60.
BBS (Bangladesh Bureau of Statistics). 2011. Statistical Year Book of Bangladesh 2010-
2011. Bangladesh Bureau of Statistics Division, Ministry of Planning, Govt. of the
People ’s Republic of Bangladesh, Dhaka.
Bose,T. K. and M. G. Som. 1986. Vegetables Crops in India. Naya Prokash, Calcutta,
India, Pp. 92-95.
Gaffar, A. 2008. Characterization and genetic diversity of sponge gourd (Luffa
cylindrica L.). MS Thesis. Department of Genetics and Plant Breeding. Sher-e-
Bangla Agricultural University, Dhaka.
Huque, A. K. M. H., M. K. Hossain, N. Alam, M. Hasanuzzaman and B. K. Biswas.
2012. Genetic divergence in yardlong bean (Vigna unguiculata (L.) walp. Ssp.
Sesquipedalis verdc). Bangladesh J. Bot. 41(1):61-69.
Panse, V.G., and Sukhatme, P.V. 1978. Statistical methods for agricultural workers.
I.C.A.R., New Delhi.
Singh, R.K. and B.D. Chaudhury. 1985. Biometrical methods in quantitative genetic
analysis. Kalyani Publishers, New Delhi, India, P. 56.
Tomooka, N. 1991. Genetic diversity and landrace differentiation of mungbean, Vigna
radiata (L) Wilczek, and evaluation of its wild relatives (The subgenus
Ceratottropics) as breeding materials. Tech. Bull., Trop. Res. Center, Japan. No.28.
Ministry of Agriculture, Forestry and Fisheries, Japan, Pp. 1.
Whitaker, T. W. and G. N. Davis.1962. Cucurbits. Interscience Pub. INC. New York,
Pp. 13.

ISSN 0258-7122
Bangladesh J. Agril. Res. 40(4): 693-702, December 2015
DEVELOPMENT OF UNION LEVEL DIGITAL DATABASES AND
MAPS OF MAIZE GROWING AREAS AT PIRGONJ IN
THAKURGAON DISTRICT
M. A. UDDIN1, K. S. RAHMAN2, M. M. RAHMAN3
N. MOHAMMAD4 AND A. F. M. TARIQUL ISLAM5
Abstract
A study was conducted during 2012-13 to build union level digital databases and
maps of maize growing areas using both primary and secondary data. Primary
data were collected from maize growing areas of the upazilla namely Pirgonj of
Thakurgaon district. For summer and winter maize; union, upazila, district and
country level digitized maps were used in the study. Geographical Information
System (GIS), Global Positioning System (GPS) and Management Information
System (MIS) related Information Technology (IT) were also applied. Total
cultivable land 28138 ha in Pirgonj upazila and area and production of maize
were 5100 ha and 34508.75 t respectively. Sixteen (16) varieties were cultivated
in the study areas and maximum area (74.09%) of maize was cultivated by the
executive varieties NK40, Pacific 984, 900M Gold, 900M, 3396, and Supergold.
Average maize yield of the study areas was 6.77 t/ha during 2012-13. A web
site was developed for variety wise area coverage data collection of maize as
well as for other crops. This web site can also be used in mobile phone.
Keywords: Maize, Area, Cultivation, Production, Variety, Union, ICT and
Digital database.
Introduction
Agriculture is the backbone of the nation but agricultural land is the scarcest
means of production in Bangladesh. To overcome this situation, agricultural
lands should be utilized more efficiently through cultivating high yielding crops
like maize. Maize is playing an important role in the economy of Bangladesh.
The area under maize cultivation is increasing day by day due to high demand.
Thakurgaon districtis the third highest maize production area (28315ha) in
Bangladesh.We selected Pirgonj upazila which is maximum yield production of
maize at all upazilas in Thakurgaon district. Besides, the genetic yield potential
of maize is also very high. There is an important scope of increasing the current
yield and production in the country. Maize can be used as food for ensuring food
security presently as well as in future increasing population of the country.
1Chief Scientific Officer, ASICT Division, Bangladesh Agricultural Research Institute
(BARI), Gazipur-1701, 2-5Scientific Officer, ASICT Division, BARI, Gazipur-1701,
Bangladesh.

694 UDDIN et al.
In terms of area, maize holds rank 3rd followed by rice and wheat. Because of
higher nutritional status, it could be a good source of nutrients for mal-nourished
people in Bangladesh. It is now widely used in the poultry farms as animal feed,
as well as the people consume roasted and fried maize in Bangladesh. Moreover,
as a food item, maize is used in different forms such as maize flour, maize flour
mixed with wheat flour etc. (Roy, 2009).
Due to wide adaptability, maize is grown in the varied environmental conditions
in Bangladesh, from sub-tropical low land at sea level to high elevation.
Potentiality for growing maize is high in almost throughout Bangladesh. So, it is
under cultivation both in winter and summer season and well suited to the
existing agronomic conditions, particularly rain fed condition.
Bangladesh Agricultural Research Institute (BARI) has been conducting research
activities for varietal development of maize since 1976. Initially, thrust was given
for development of composite varieties. So far, BARI developed 19 varieties
among them eight open pollinated and 11 hybrid varieties. The yield potentiality
of the released composite varieties varies from 5.5 to 7.0 t/ha and that of the
hybrid varieties ranges 7.4 - 12.0 t/ha. Status of those varieties in the farmers’
field demands through investigation.
Now a day of ICT, it is necessary to build a IT based system for data collection
of maize from root level. This system might be used for all other crops. It would
be used for data collection of summer and winter maize from upazila, union even
block level. By using ICT, collection, documentation of different information and
preparation of maps can be done. So, the study was done with the following
objectives:
(1) To determine the variety wise area coverage of maize in block, union,
upazila and district.
(2) To develop a system for data collection, documentation and mapping of
maize.
(3) To develop a database using GIS, GPS and MIS on the basis of IT.
Materials and method
Both primary and secondary data were used in the study. For primary data, two
field surveys were done for summer and winter maize during 2012-13. Sites was
selected purposively at Pirganj upazila of Thakorgaon district. Simple random
sample procedure was followed for data collection and complete enumerations of
different varieties of maize were taken for whole population.

DEVELOPMENT OF UNION LEVEL DIGITAL DATABASES 695
Primary data were collected as follows:
1. Summer and winter maize data were collected from maize growers of
different upazilas by Sub Assistant Agriculture Officers (SAAO) during
2012-13.
2. Collected data were recorded by the concerned researcher from SAAO as per
prescribed database structure.
3. The data schedule was filled up by UAO/SAAO and passed through internet.
4. At the time of data collection, GPS technology was used.
5. A web site was developed which was used through mobile phone for data
collection.
The online data collection system through dedicated web portal is
www.asictbari.net
Secondary sources were NGOs and GOs such as Soil Resources Development
Institute (SRDI), Bangladesh Bureau of Statistics (BBS) and Department of
Agricultural Extension (DAE) as well as (FAO). Statistical package program
SPSS and Excel were applied in addition to Arc View GIS program and digitized
maps of union, upazila, district and country were utilized in this study.
Table-1. Indexing on area, production and yield of maize cultivation in Bangladesh.
Year Area (ha) Production
(t)
Yield
(t/ha)
Indexing on the
basis of base year Status (base year)
1969-70 Base year line Area Prod. Yield Area Prod. Yield
1969-70 3239 3000 0.93 100 100 100 1 1 1
1974-75 1 2834 2000 0.71 87.5 66.7 76.2 0.9 0.7 0.8
1979-80 2 2024 1000 0.49 62.5 33.3 53.3 0.6 0.3 0.5
1984-85 3 3644 3000 0.82 112.5 100 88.9 1.1 1 0.9
1989-90 4 3239 3000 0.93 100 100 100 1 1 1
1994-95 5 2713 2680 0.99 83.8 89.3 106.7 0.8 0.9 1.1
1999-00 6 3162 4075 1.29 97.6 135.8 139.1 1 1.4 1.4
2005-06 7 98447 521525 5.3 3039.6 17384 571.9 30.4 173.8 5.7
2007-08 8 223886 1346000 6.0 6912.2 44866.7 646.5 69.1 448.7 6.5
2008-09 9 174000 1137000 6.53 5372.3 37900 705.5 53.7 379 7.1
2009-10 10 230000 1435000 6.24 7101.3 47833 673.6 71 478.3 6.7
2010-11 11 2,27060 15,52267 6.84 7010.2 51742 735.5 70 517.4 7.3
2011-12 12 2,87243 19,86879 6.92 8868.3 66229 744.1 88.7 662.3 7.4
2012-13 13 3,12566 21,83183 6.98 9650.08 72772.77 750.54 96.5 727.7 7.5
Source: B.B.S. and DAE.

696 UDDIN et al.
In 1969-70, area of maize was 3239 ha and production was 3000 t pre-
independence whereas in 2012-13 those were 312566 ha and 2183183 t,
respectively. After 44 years, area, production and yield of maize were increased
96.5, 727.7 and 7.5 times respectively (Table-1).
Table- 2. Indexing on availability of maize crop in Bangladesh (base year1969-70).
Year Sl. No Population Production (t) Maize Availability
( kg/h/y) (g/h/m) ( g/h/d)
1969-70 69882512 3000 0.04 3.58 0.12
1974-75 1 78328571 2000 0.03 2.13 0.07
1979-80 2 87981429 1000 0.01 0.95 0.03
1984-85 3 98529274 3000 0.03 2.54 0.08
1989-90 4 109300867 3000 0.03 2.29 0.08
1994-95 5 118885011 2680 0.02 1.88 0.06
1999-20 6 128172293 4075 0.03 2.65 0.09
2004-05 7 136314875 521525 3.83 318.82 10.63
2007-08 8 141028719 1343444 9.53 793.84 26.46
2008-09 9 142600000 1137000 7.97 664.45 22.15
2009-10 10 144171281 1435000 9.95 829.45 27.65
2010-11 11 145759875 1552267 10.65 887.45 29.58
2011-12 12 152518015 19,86879 13.03 1085.60 36.19
2012-13 13 156194958 2183183 13.98 1164.77 38.83
Source: Population census of Bangladesh, B.B.S. and DAE.
In 1969-70, maize crop availability was 0.12 g/h/d but in 2013 it was 38.83 g/h/d
including seed and wastage (Table-2).

DEVELOPMENT OF UNION LEVEL DIGITAL DATABASES 697
Ta
ble
3.
Area
an
d p
rod
ucti
on
of
ma
jor m
aiz
e g
row
ing
dis
tric
ts o
f B
an
gla
desh
, 2
01
2-1
3.
SL
.N o
Dis
tric
t M
aiz
e a
rea
(ha
)
Per
cen
tag
e o
f
are
a
Cu
mu
lati
ve
% o
f
are
a
Pro
du
ctio
n
(t)
Per
cen
tag
e o
f
pro
d.
Cu
mu
lati
ve
% o
f
pro
du
ctio
n
Yie
ld
1 D
inaj
pur
56
938
18
.22
18
.22
42
171
0
19
.32
19
.32
2 C
huad
anga
41
500
13
.28
31
.49
32
475
0
14
.88
34
.19
3 T
hak
urg
ao
28
315
9.0
6
40
.55
19
595
7
8.9
8
43
.17
4 L
alm
onir
hat
2
50
90
8.0
3
48
.58
16
299
5
7.4
7
50
.63
5 R
angp
ur
16
670
5.3
3
53
.91
10
107
7
4.6
3
55
.26
6 M
anik
ganj
16
070
5.1
4
59
.05
10
526
3
4.8
2
60
.08
7 P
anch
agar
1
49
45
4.7
8
63
.84
95
016
4.3
5
64
.44
8 J
hen
aid
ah
13
803
4.4
2
68
.25
89
525
4.1
0
68
.54
9 R
ajsh
ahi
12
874
4.1
2
72
.37
77
104
3.5
3
72
.07
10 B
ogra
9
28
1
2.9
7
75
.34
71
752
3.2
9
75
.36
11 G
aib
and
ha
83
50
2.6
7
78
.01
59
467
2.7
2
78
.08
12 N
ilp
ham
ari
78
45
2.5
1
80
.52
50
377
2.3
1
80
.39
B
angla
des
h
31
256
6
21
831
83
6.9
8
Are
a an
d p
rod
uct
ion o
f m
aize
in B
ang
lad
esh w
ere
31
25
66
ha
and
21
831
83
t r
esp
ecti
vel
y i
n 2
01
2-1
3.
Tab
le-3
ind
icat
es t
he
top
12
dis
tric
ts’
cover
age
80
.52
% a
rea
whic
h c
ontr
ibute
s 8
0.3
9%
of
tota
l p
rod
uct
ion.

698 UDDIN et al.
Results and discussion
In total, there were 20 blocks under 10 unions in the upazila Pirganj of Thakurgaon districts, (Table-4). Different agricultural information of maize production under the upazila was noted below:
Table 4. Blocks, unions and cultivable lands Pirganj upazila in Thakurgaon district,
respectively in 2012-13.
Upazila Pirganj
(Thakurgaon)
Block 20
Union 10
Cultivable land (ha) 28,138
Source: Survey data of maize growers, 2012-13 collected by SAAO, DAE/Researcher,
BARI.
Data were collected from the maize growers of the targeted upazila regarding cultivable land, area production, as well as yield of the crop. Databases of cultivable land, area, production and yield of maize in 2012-13 were prepared according to district, upazila and union.
Table 5. Union wise area (ha), production (t) and yield (t/ha) of maize at Pirganj,
Thakurgaon, 2012-13
Union Area (ha) Production (t) Yield(t/ha)
Bhamradeha 380 2806.25 7.38
Koharani ganj 660 4083 6.19
Khangaon 260 1680 6.46
Suaidpur 410 3050 7.44
Pirganj 320 2590 8.09
Hagipur 725 4705 6.49
Dalatpur 215 1585.5 7.37
Sengaon 330 3251 9.85
Jabarhat 350 2673 7.64
Burchuna 1450 8085 5.58
Total 5100 34508.75 6.77
Average 510 3450.87 -
Max 1450 8085 9.85
Min 215 1585.5 5.58
Std 368.60 1886.37 1.19
Cv% 72.27 54.66 16.45
Source: Survey data of maize growers, 2012-13 collected by SAAO, DAE/Researcher, BARI.
There were 20 blocks under 10 unions at Pirganj upazila. Total area, production
and yield of maize at this upazila were 5100 ha, 34508.75 t and 6.77 t/ha,
respectively during 2012-13 (Table5).

DEVELOPMENT OF UNION LEVEL DIGITAL DATABASES 699
Ta
ble
6.
Va
riet
y w
ise
are
a c
ov
era
ge
(ha
) of
ma
ize
at
Pir
ga
nj,
Th
ak
urg
ao
n,
20
12
-13
.
Vari
ety
Un
ion
90
0M
9
00M
Gold
NK
-40
Paci
fic
-11
Paci
fic-
84
Paci
fic-
99
9
22
4
91
20
33
96
Pio
nee
r
Su
nsh
ine
Su
per
Gold
A
sta
8
27
96
2
GP
-50
Tota
l
Bham
rad
eha
0
35
16
0
0
30
0
0
10
0
30
40
75
0
0
0
3
80
Ko
har
ani
gan
j 5
7
5
26
0
0
43
80
45
0
0
10
0
59
80
0
3
0
66
0
Khangao
n
35
0
80
0
30
10
0
20
0
35
35
0
1
5
0
0
26
0
Suai
dp
ur
0
0
19
0
0
80
0
0
5
0
80
0
50
5
0
0
4
10
Pir
gan
j 5
2
0
19
0
0
30
0
0
20
0
10
0
30
0
5
1
0
32
0
Hag
ipur
10
3
00
15
11
0
55
5
50
0
0
15
65
10
0
0
0
0
72
5
Dal
atp
ur
0
20
90
15
30
0
0
5
0
12
0
5
10
10
8
10
21
5
Sen
gao
n
10
1
59
3
5
40
15
0
0
0
18
35
0
1
8
0
33
0
Jab
arhat
5
5
0
16
8
10
55
32
0
5
0
5
0
0
6
5
6
3
35
0
Burc
hu
na
30
30
0
50
0
0
12
0
0
20
0
0
30
0
0
0
0
0
0
0
1
45
0
To
tal
10
0
50
0
20
97
40
56
3
21
7
26
5
11
5
30
0
18
2
10
8
31
9
19
6
35
40
23
51
00
Per
centa
ge
1.9
6
9.8
0
41
.12
0.7
8
11
.04
4.2
5
5.2
0
2.2
5
5.8
8
3.5
7
2.1
2
6.2
5
3.8
4
0.6
9 0
.78
0.4
5
10
0.0
0
So
urc
e: S
urv
ey d
ata
of
mai
ze g
row
ers,
20
12
-13
co
llec
ted
by S
AA
O,
DA
E/R
ese
arch
er,
BA
RI.
Var
ieta
l st
atus
of
mai
ze a
t P
irgan
j w
as
pre
sente
d i
n T
able
-6.
Out
of
51
00
ha
mai
ze a
rea
at P
irgan
j; 2
097
ha,
56
3 h
a an
d 5
00
ha
wer
e
occ
up
ied
by N
K4
0,
pac
ific
-98
4,
and
90
0M
Go
ld,
resp
ecti
vel
y a
nd
the
rest
by v
ari
etie
s.

700 UDDIN et al.
Ta
ble
7.
Va
riet
y w
ise
pro
du
ctio
n(t
) o
f m
aiz
e a
t P
irg
an
j, T
ha
ku
rga
on
, 2
01
2-1
3
Vari
ety
Un
ion
90
0M
9
00M
Gold
N
K
-40
Paci
fic
-11
Paci
fic
-984
Paci
fic-
99
9
22
4
91
20
33
96
Pio
nee
r
Su
nsh
ine
Su
per
Gold
A
sta
9
62
GP
-50
Tota
l
Bham
rad
eha
0
28
8.7
5
11
50
0
22
0
0
0
90
0
21
0
30
0
54
7.5
0
0
0
2
80
6.2
5
Ko
har
ani
gan
j 3
7
0
17
81
0
33
8
35
5
20
8
0
0
83
0
86
3
40
0
18
0
40
83
Khangao
n
23
0
0
48
0
0
20
5
12
0
0
13
0
0
27
0
14
5
0
0
0
0
15
80
Suai
dp
ur
0
17
7
16
26
0
38
0
0
0
55
0
48
2
0
28
0
0
0
0
30
00
Pir
gan
j 3
5
17
0
16
70
0
21
9
0
0
15
5
0
0
0
23
7
0
34
70
25
90
Hag
ipur
11
0
0
20
45
25
5
54
5
34
7.5
4
0
35
0
0
0
15
0
36
2.5
5
00
0
0
47
05
Dal
atp
ur
0
16
0
72
0
12
7.5
1
83
.5
0
0
37
.5
0
94
0
26
60
52
70
15
30
.5
Sen
gao
n
11
0
0
14
90
45
33
3
40
0
13
3
0
0
0
21
0
35
0
0
18
0
0
32
51
Jab
arhat
7
5
47
0
12
95
42
.5
38
0
16
5
45
37
.5
0
40
0
0
42
37
16
.5
26
45
.5
Burc
hu
na
12
0
16
10
36
50
0
46
5
0
95
0
0
12
90
0
0
0
0
0
0
80
85
To
tal
71
7
28
75
.75
15
907
47
0
32
68
.5
13
87
.5
13
76
85
5
12
90
11
79
80
5
26
66
10
02
32
1
15
6.5
3
42
76
.25
Per
centa
ge
2.0
9
8.3
9
46
.41
1.3
7
9.5
4
4.0
5
4.0
1
2.4
9
3.7
6
3.4
4
2.3
5
7.7
8
2.9
2
0.9
4
0.4
6
10
0.0
0
So
urc
e: S
urv
ey d
ata
of
mai
ze g
row
ers,
20
12
-13
co
llec
ted
by S
AA
O,
DA
E/R
ese
arch
er,
BA
RI.
Out
of
34
27
6.2
5 t
mai
ze p
rod
uct
ion a
t P
irganj
in 2
01
2-1
3;
15
90
7 t
(4
6.1
4%
), 3
268
.5 t
(9
.54
%)
and
28
75.7
5t
(8.3
9%
) w
ere
co
ntr
ibute
d b
y
thre
e var
ieti
es
NK
40
, P
acif
ic -
98
4 a
nd
90
0M
Go
ld a
nd
the
rest
by v
arie
ties
( T
able
-7
).

DEVELOPMENT OF UNION LEVEL DIGITAL DATABASES 701
Table 8. Area (ha), production (t) and yield (t/ha) of maize at Pirganj of
Thakurgaon district, respectively, 2012-13.
Area Area (ha) Production (t) Yield(t/ha)
Pirganj (Thakorganj) 5100 34508.75 6.77
Source: Survey data of maize growers, 2012-13 collected by SAAO, DAE/Researcher,
BARI.
Cultivated area of maize in the study areas was 5100 ha. production was
34508.75 t and yield of maize was 6.77 t/ha (Table-8) at Pirganj, in Thakorganj.
Bairchuna
Jabarhat
Sengaon
Daulatpur
Hajipur
Pirganj
Bhomradaha
Khangaon
Kusha Raniganj
Saidpur
Union wise maize growing areas (ha) of Pirganj
Upazila, Thakurgaon district, 2012-13Union-bd.shp
1001 - 1500 ha501 - 1000200 - 500 haN
Source of data: Field survey through SAAO,2013 Source of Map: Agril. Statistics& ICT, BARI
Map-1. Union wise maize growing areas (ha) of Pirganj upazila, Thakurgaon
district, 2012-13.

702 UDDIN et al.
Table 9. Price (Tk/Kg), cost(Tk/Kg), benefit (Tk/Kg) and benefit cost ratio (BCR) of
maize at Pirganj of Thakurgaon district, 2012-13.
Area Price (Tk/Kg) Cost(Tk/Kg) Benefit/Profit (Tk/Kg) BCR
Pirganj (Thakorganj) 13.68 7.15 6.53 1.91
Benefit Cost Ratio (BCR) of maize was 1.91 at Pirganj in Thakorganj district. (Table-9)
Conclusion
In this study, digital databases of different parameters such as area, production,
yield and varietal information etc of maize were obtained. Union, upazila and
district maps of maize were also developed. Sixteen (16) varieties were cultivated
and Maximum area (74.09%) of maize was cultivated by the executive varieties
NK-40, Pacific-984, 900M Gold, 900M, 3396 and Super gold. A web site was
developed for variety wise area coverage data collection of maize as well as for
other crops. This web site can be used through mobile phone. It is noted that
BARI maize varieties were not cultivated in the study areas. However, it was
found in some places of Manikganj, Kushtia, Dinajpur, Chuadanga, Jamalpur and
Sherpur etc. Where germination capacity of BARI maize varieties needs
improvement and their cultivation must be expanded rapidly in the farmers’
fields. Furthermore dwarf type maize variety should be released. Besides
adopting HYVs, management practices should be improved. Finally it was
revealed that enhancement of maize production could be gained by vertical and
horizontal expansion.
References
BBS. (2010), The Yearbook of Agricultural Statistics of Bangladesh-2010, Bangladesh
Bureau of Statistics, Statistics Division, MOP, GOB, Dhaka.
BBS. (2010), The Yearbook of Agricultural Statistics of Bangladesh-2010, Bangladesh
Bureau of Statistics, Statistics Division, MOP, GOB, Dhaka.
DAE. (2010), Department of Agricultural Extension, Ministry of Agriculture, Khamar
Bari, Fram Gate, Dhaka.
DAE. (2011), Department of Agricultural Extension, Ministry of Agriculture, Khamar
Bari, Fram Gate, Dhaka.
UN,FAO(2009) The Food and Agriculture Organization of the UN,FAO
IITA (2009), International Institute for Tropical Agriculture
BBS.(2007), Yearbook of Agricultural Statistics of Bangladesh. Bangladesh Bureau of
Statistics, Ministry of Planning, Government of the people’s Republic of
Bangladesh, Dhaka.
Roy, Debasis Saha (2009) Vutta neya sangram rafiqer. Special report of Saturday,
Prothom Alo. 28 March.

ISSN 0258-7122
Bangladesh J. Agril. Res. 40(4): 703-709, December 2015
DETERMINATION OF OPTIMUM SAMPLE SIZE FOR MEASURING
THE CONTRIBUTING CHARACTERS OF BOTTLE GOURD
N. MOHAMMAD1, M. S. ISLAM2, K. S. RAHMAN3
M. M. RAHMAN4 AND S. NASRIN5
Abstract
To improve efficiency in collecting data from field experiment on fruit attributes
of bottle gourd (Lau), the sample size was studied for sample size at Olericulture
Division, Horticulture Research Centre (HRC) of Bangladesh Agricultural
Research Institute (BARI) Gazipur during 2012-13. The treatments/varieties
were LS 0026-5-3, LS 0012-5-3, LS 117-F-1, LS 117-A-2 and BARI Lau-3.
Fruit length, breadth and weight of bottle gourd (Lau) data were collected from
the experimental plot. The data were used to design optimum sampling plan
from equal number of observations per cell. The observation on fruit length
(cm), breadth (cm) and weight (kg) were taken from 5 plots/treatments at
random. A randomized complete block design (RCBD) with 3 replications and
five treatments/varieties was used in this experiment. Five (5) plants per plot and
2 fruits per plants (10 fruits per plot) were the original sampling plan for this
experiment. A sampling plan of selecting 4 plants at random and measuring 2
fruits per selected plant (8 fruits per plot and plots were 25m2 i.e. 10m long and
2.5m wide) was found to be optimum and economical for taking measurements
of fruit attributes in field experiments on bottle gourd.
Keywords: Measurement, Optimum sample size, Sampling technique and Bottle
gourd.
Introduction
In any field experiments, it is necessary to determine the optimum sample size as
well as optimum number of replications if researchers have to use sampling
techniques for collecting data from such experiments (Islam et al. 2000). It is not
possible to measure yield and yield contributing characteristics on the whole of
each experimental unit. In any field experiment, the researcher has to face the
problem in determines optimum (efficient) sample size for measuring plant
characters (Federer, 1963). The researcher has to face the problem of optimum
(efficient) sample size for measuring plant characters in the field experiment
(Islam et al.2001). The optimum sampling technique depends on the variability
associated with variable and the cost of reducing the variability (Kempthorne
,1952). Rigney and Nelson (1951) in cotton, Patel and Dalal (1992) in okra and
Hossain et al. (2005) in Brinjal, Hossain et al. (2008) in Teasle gourd, Islam et
1,3&4Scientific Officer, ASICT Division, BARI, Gazipur-1701, 2Principal Scientific
Officer, ASICT Division, BARI, Gazipur-1701, 5M.Sc in Statistics, Rajshahi University,
Bangladesh.

704 MOHAMMAD et al.
al. (2012) in Sweet gourd and Islam et al. (2013) in Bitter gourd estimated the
size of sample needed in taking measurements of plant characters. No such
information is available in bottle gourd (Lagenaria siceraria var.clavata). This
experiment deals with sample size study in bottle gourd particularly for taking
measurements of fruit character like Length, Breadth and Weight. The
investigation was carried out at Horticulture Research center (HRC), Bangladesh
Agricultural Research Institute (BARI), Joydebpur, Gazipur in 2012-2013. The
objective of the study is to find out optimum sample size for estimating yield
contributing characters of the field experiment on bottle gourd.
Material and Method
Sample size depends on the variability associated with variable and the cost of
reducing that variability. For such cases, it is necessary to choose optimum
sample size and number of replications. Estimation of optimum sample size and
number of replications are obtained by maximizing the information for a given
cost.
There were five treatments/varieties used as treatment in this experiment. The
treatments/varieties were LS 0026-5-3, LS 0012-5-3, LS 117-F-1, LS 117-A-2
and BARI Lau-3. Experimental plots were 25m2 (10m long and 2.5m wide). Fruit
length, breadth and weight of bottle gourd (Lau) data were collected from the
experimental plot. This data were used to calculate optimum sampling plan from
equal observation per cell. The observation on fruit length (cm), breadth (cm) and
weight (kg) were taken from 5 plots or treatments selected at random. The fruit
length, breadth and weight of first two fruits from each selected plant utilized in
this analysis. There were 10 fruits (5 plants per plot x 2 fruits per plant) per plot
and 50 fruits per replication. Considering the time factor, the data of three
replications were collected for deriving optimum sampling plan (Optimum in the
sense of time involved in taking fruits measurements). A randomized complete
block design (RCBD) with 3 replication was used for this experiment. The data
were analyzed replication wise by analysis of variance (ANOVA) technique
(Table 1) to estimate variance components associate with plots (2ˆp ), plants
(2ˆq ) and fruits (
2ˆn ).
Analytical Model
We have an experiment in p treatments (plots) are taken at random, then q plants
are randomly selected from each treatment. From each plant n random sampling
unit is taken. The observations may be denoted by Yijk where i denote the
treatments (i= 1, 2 ….. p), j the Plants (j = 1, 2, ……,q) and k the sampling unit
(k = 1, 2, ….., n).

DETERMINATION OF OPTIMUM SAMPLE SIZE FOR MEASURING 705
We also assume the following model:
ijkijiijk amY (1)
Where
mean general them
αi=the treatments effect
ij the plants effect due to the (ij)th experimental unit.
ijk = the sampling effect due to the (ijk)th observation
For the study we suppose that the ijk ’s are normally and independently
distributed with variance ijn ,2’s are normally and independently distributed
with variance 2
q and i ’s are normally and independently distributed. The
ijk ’s will be independent of the ij ’s and i ’s if the sampling random.
The least square estimates are obtained as follows:
ym ˆ
)(ˆ yya ii
)(ˆ iijij yy
)(ˆ.ijijkijk yy
Also
pqn
yy
ijk
n
k
q
j
p
i
i
111
qn
yy
ijk
n
k
q
j
i
11
n
yy
ijk
n
k
ij
1
.
Putting these values in equation (l) and squaring and summing on both sides.
Then the total sum of squares can be partitioned as:
p
i
q
j
n
k
ijijn
p
i
q
j
ijk
p
i
ijk
p
i
q
j
n
k
ijk yyyyyynqyy1 1 1
2
1 1
2
1
2
1 1 1
2 )()()()(
+ producttern

706 MOHAMMAD et al.
But product terms are usually zero.
Thus, Total (SS)= Treatment (SS) + Plant (SS)+ Sampling (SS)
With their degrees of freedom (npq-1) = (p-1) + p (q-1) + pq (n-1)
Table 1. The analysis of variance
Sources of
Variation (SV)
Degrees
of
Freedom
(D.F.)
Sum of Squares (S.S) Mean Sum of
Squares
(MSS)
Expected Mean Sum
of Squares (EMSS)
Plots/Treatment
(Levels A)
(p-1) 22
..... p
i
i Syynq T
p
S p
)1(
2
222
rqn nqn
Plants/Plot(Level
B within A)
p(q-1) 2
..... qiji
Syyn
p
qp
Sq
1
2
22
qn n
Fruits/Plant/Plot
Sampling
pq(n-1) 22
. )( n
i j k
ijijk Syy
S
npq
Sn 1
2
2
n
Total pqn-1 2...yyijkkji
Where, p = number of plot or treatment, q = number of plants/plot and, n =
number of fruits/plant/plot. Also T= The mean sum of square of Treatment, P=
The mean sum of square of Plant, S= The mean sum of square of Sampling
respectively.
According to estimation of optimum sampling plan, Snedacor and Cochran
(1967), the variance component may be estimated as.
The components of variance 222, pqn and estimated by
222222 ,ˆqqnpqn nqnandTnPS i.e
nq
PTand
n
SPqq
22 ˆˆ
Thus variance of mean is
npqpqPS nqp
y
222
2 ˆˆˆ (2)

DETERMINATION OF OPTIMUM SAMPLE SIZE FOR MEASURING 707
2ˆp , 2ˆ
q and 2
n for the character were obtained from the analysis of variance
table.
The same variance of mean can be altered for the mean by using various
combinations of q and n in equation (2)
qpnpqPS nqp
y ''
ˆˆˆ'
222
2 (3)
Where q΄ and n΄ are the altered values of q and n respectively.
The component 2ˆq was assumed as constant, as it represented variation due to
treatments.
Efficiency of new sampling plan,
E = 2
2
ˆ'
qz
y
y
S
S (4)
The formula of saving the work/time load i.e time factor (TF) without sacrificing
precision as compared with original plan i.e 10 fruits (5plant/plot x 2fruits/plant)
per plot is defined as
TF (%) = ''
''
nq
qnnq x 100 (5)
Where, q΄=5, n΄=2, q=1,2,------,5 and n=1,2,-------,5. Since 10 fruits per plot is
the original plan or control.
Results and discussion
The results of the study were utilized in arriving alternate sampling plans (i.e.,
altering the value of q from 1 to 5 plant per plot and from 1 to 5 fruits per plant,
making total 25 sampling plants per plot) (Table-2). The relative efficiency of
each plant was worded out in relation to original plan (5 plants per plot and 2
fruits per plants). Using equation-4 the relative efficiency of new alternate
sampling plans is given in Table-3. The results (Table-3) indicated that the
relative efficiency with the number of plants per plot and number of fruits per
plant.
The other alternate plan with 4 plant per plot and 2 fruits per plant (total 8 fruits
per plot) had also 99.62 percent efficiency in comparison to original plan but had
20 percent less amount field work (Using equation 5). The other plan which can
be employed with same efficiency is to select 3 plants at random per plot and

708 MOHAMMAD et al.
measure 3 fruits each selected plant (9 fruits per plot) had 94.21 but work load
will be about 10 percent less than the plan with 5 plants x 2 fruits per plot.
The results revealed that work load for field operation like lagging of flowers,
harvesting and measurement of individual fruit could be reduced effectively
without sacrificing efficiency by selecting proper sampling plan.
Table 2. The estimated variance components for plots (2ˆq ), plants (
2ˆq ) and fruits (
2ˆq ).
Variance
component
Fruit Length Fruit Breadth Fruit Weight
R-I R-II R-III R-I R-II R-III R-I R-II R-III
26.16 28.36 24.84 0.22 0.34 0.41 0.23 0.29 0.33
38.11 33.15 23.1 0.30 0.62 0.58 0.12 0.16 0.21
1.59 2.17 1.84 0.69 0.85 0.91 0.47 0.37 0.41
Table 3. The relative efficiency for some of the alternative sampling plants.
Number of Fruit Length Fruit Breadth Fruit Weight Average
over traits
Work/Time
Load
(%) Plants
/plot
Fruits
/plant R-I R-II R-III R-I R-II R-III R-I R-II R-III
1 1 51.31 55.10 59.26 24.79 27.51 29.47 45.12 51.82 58.42 44.76 90
1 5 62.40 56.66 61.06 45.59 44.07 47.78 83.33 81.10 89.22 63.47 50
2 3 74.41 77.48 80.38 61.85 62.90 63.64 100.45 98.45 110.26 81.09 40
2 4 67.45 77.64 80.56 65.75 65.85 68.79 102.86 102.10 114.13 82.79 20
2 5 74.58 77.73 80.65 68.33 67.75 71.33 109.72 104.42 116.59 85.68 0
3 2 86.49 88.25 89.81 68.96 72.34 74.59 106.22 108.49 118.50 90.41 40
3 3 86.68 88.52 90.01 75.63 77.67 79.49 114.82 110.54 124.56 94.21 10
3 4 86.78 88.66 90.23 79.47 82.54 82.45 111.63 103.58 127.83 94.80 20
5 2 100 100 100 100 100 100 100 100 100 100 0
5 1 99.24 98.79 98.90 71.77 78.54 79.09 106.32 107.32 122.24 95.80 50
5 3 99.85 99.90 99.72 92.02 95.64 96.67 129.67 122.59 138.98 108.33 50
4 2 94.23 95.07 95.64 78.68 82.82 83.73 116.07 112.95 137.46 99.62 20
4 3 94.48 95.31 95.88 85.10 88.01 86.65 123.67 117.78 133.20 102.23 20
4 1 93.78 94.38 94.93 64.17 70.38 89.25 98.01 100.59 114.43 91.10 60
3 5 86.84 88.74 90.32 81.96 82.54 84.33 122.78 115.48 129.87 98.09 50
Conclusion
Among different sampling plans a plan with 5 plants per plot and 1 fruits (total 5
fruits per plot) had on an average 95.80 percent efficiency i.e., almost equal
efficiency when compared with original sampling plan of 5 plants/plot and 2

DETERMINATION OF OPTIMUM SAMPLE SIZE FOR MEASURING 709
fruits per plant (10 fruits per plot). By adopting this new plan 50 percent work
load (time) could be saved without sacrificing precision.
Then we conclude that sampling of selecting 4 plants at random per plot and
measuring 2 fruits each selected plant (total 8 fruits per plot) appeared optimum
and efficient(closed to original sampling plan i.e. 10 fruits per plot ).
References
Federer W. T. 1963. Experimental design. Theory and application, Oxford and IBH
Publishing Co. New Delhi, India.
Hossain,M.I.; Islam, M.S.; Hossain, M.A; Nasrin, S. and Yesmin, S. 2005. Determination
of optimum sampling plant characters of brinjal. International Journal of Sustainable
Agricultural Technology, 1(6): 25-29.
Hossain,M.I.;Muhammad Shuaib; Kabita; Muhammad Tareq; M.S. Kabir and M. A.
Uddin. 2008. Optimum sampling for measuring different plant characters of Teasle
gourd. Eco-friendly Agril. J. 1(3): 172-175.
Islam, M.S.; Mohammad.N.; Rahman.K.S, Rahman.M.M. and Hoque.A.K.M.A. 2013.
Optimum sampling for measuring different plant characters of bitter gourd. Eco-
friendly Agril. J. 6(11): 234-237, 2013.
Islam, M.S.; Mohammad.N.; Rahman.K.S, Rahman.M.M. and Hoque.A.K.M.A. 2012. A
study of optimum sampling for measuring different plant characters of sweet gourd.
J. Bangladesh Soc. Agril. Sic. Tecnol. 9(1&2):195-199.
Islam, M.S.; Sen, K. and Rahim, K. 2000. Estimation of optimum sample size and
number of replications in RCBD with unequal observation per cell. Dhaka
University Journal of Science, 48(1): 89-94.
Islam, M. S. 2001. Statistical development of field plot technique for agronomic
experiments. Unpublished Ph. D. thesis, Dhaka University, Dhaka, Bangladesh.
Kempthorne, O. 1952. Design and analysis of experiment, John Wiley and Sons, Inc,
New York, USA.
Patel, J.N. and Dalal, K.C. 1992 Sampling technique for measuring pod characters of
okra. Gujarat Agricultural University Research Journal, 18(1): 81-84.
Rigney.J.A. and Nelson. WI L. 1951. Some factors affecting the accuracy of sampling
cotton for fibre determinations. Agronomy Journal 43: 531-535.

710 MOHAMMAD et al.

ISSN 0258-7122
Bangladesh J. Agril. Res. 40(4): 711-715, December 2015 Short Communication
EFFICACY OF FUNGICIDES AND BOTANICALS IN CONTROLLING
FOOT AND ROOT ROT OF LENTIL
MD. SHAHIDUZZAMAN1
Lentil (Lens culinaris Medik) is the second most important pulse crop in terms of
both area and production (Anon., 2014). In Bangladesh pulses constitute an
integral part of the daily diet as a direct source of protein for human beings
(Sattar et al., 1996). Consumption of lentils with small grains provides a
balanced diet. It is a cheap source of protein for human beings and also for
animals in Bangladesh (Sattar et al., 1996). Lentil is also important in crop
diversification in the cropping systems of the country. As the price of animal
protein is increasing day by day, the protein shortage in the diet system of the
people in the country can be met up through lentil. The yield of lentil in
Bangladesh is low which is associated with poor management practices,
unavailability of quality seeds and especially lack of proper disease management
options. Diseases play important role for yield reduction. Lentil is affected by a
wide range of fungal diseases. Productivity of lentil is reduced by pathogens
through infection and damage to leaves, stems, roots and pods. It also reduces
marketability due to discoloration of the seeds. Lentil suffer from attack of a
number of seed borne diseases such as vascular wilt, collar rot, root rot, stem rot,
rust, powdery mildew and downy mildew, which are caused by Fusarium
oxysporum f. sp. lentis, Sclerotium rolfsii, Rhizoctonia solani, Uromyces fabae,
Erysiphe polygoni and Peronospora lentis, rspectively (Khare et al., 1979, Singh
and Tripathy, 1999). The soil borne pathogens Fusarium oxysporum and
Sclerotium rolfsii commonly occur in the tropics and sub-tropics of the world
causing foot and root rot of many crops (Aycock, 1966).
Foot and root rot caused by Fusarium oxysporum and Sclerotium rolfsii is
considered as an important and destructive disease of pulses in almost all
legume-growing countries of the world including Bangladesh (Anon., 1986, Dey
et al., 1993). In Bangladesh, about 44% lentil plants are infected by foot and root
rot disease (Anon., 1986). It causes seedling death at early stage resulting very
poor plant stand which ultimately produces very low yield.
Despite of the many achievements in modern agriculture, chemical control still
holds a strong performance in combating certain destructive plant diseases.
Farmers’ use chemicals for controlling the diseases of crop plants in Bangladesh,
but limited information on the efficacy of these chemicals exits in our country
(Hoque et al., 2014). Considering the above facts the present study was
undertaken to evaluate efficacy of fungicides and botanicals for controlling foot
and root rot of lentil under field condition at Madaripur district of Bangladesh.
1Scientific Officer, Regional Pulses Research Station, Bangladesh Agricultural Research
Institute (BARI), Madaripur, Bangladesh.

712 SHAHIDUZZAMAN
The experiment was carried out at Regional Pulses Research Station of
Bangladesh Agricultural Research Institute (BARI), Madaripur, in the cropping
seasons of 2011-12 and 2012-13. Seeds of lentil variety BARI masur-1
susceptible to foot and root rot has been used in the study. The experiment plot
was prepared mechanically. Weeds and other materials were removed. The soil
was prepared into good tilth by four cross ploughings and ladderings. The soil of
the field was leveled before seed sowing. Fertilizers such as Urea, TSP and MOP
were applied @ 45, 85 and 35 kg/ha and Cowdung @ 5 ton/ha during final land
preparation (Anonymous, 2005). The experiment was laid out in randomized
complete block design with three replications. Each block was divided into seven
experimental units. The size of each experimental unit was 4 m3 m. The
treatments were assigned in each block at random. Three fungicides and three
botanicals were used as seed treatment with one untreated control. The lentil
seeds were sown in furrows made with tine where distance between the furrows
was 30 cm.
The fungicides and botanicals tested in the experiment were Provax 200 (Carboxin +
Thiram), Bavistin 50 WP (Carbendazim), Trichoderma compost (3 t/ha), Neem leaf
extract (1:4 w/v), Garlic clove extract (1:4 w/v), Allamanda leaf extract (1:4 w/v) and
control (untreated seed). Garlic bulb, allmanda and neem leaf extracts were
prepared separately by crushing the cloves and leaves with the help of a mortar
and pestle. The crushed materials were blended in an electric blender for fresh
extract, and required amount of sterile water was added at 1:1 for solution. The
blend was filtered through sterile cheesecloth. The supernatant was mixed with
carrier material (flour). The mixture was put into wooden pellet device, thus the
tablets of Garlic (Allium sativum), allamanda (Allamanda cathertica) and neem
(Azadiracta indica) were prepared separately. These tablets were melted in 1:4
(w/v) concentration before seed treatment. The required amounts of seeds for
each sub plot were taken in ployethylene bags, mixed with fungicides or
botanicals and then sown at a rate of 40 kg/ha in the furrows immediately. The
Trichoderma compost was applied in the plot before seed sowing.
Intercultural operations were done whenever, necessary and weeding was
performed two times during the growing period of the crop. One weeding was
done at 20 days and another at 35 days after sowing. During the growing period
the plots were inspected regularly to record the foot and root rot disease. Dead
plants were removed from the field after counting. Infected 5 plants were
collected to identify foot and root rot pathogens.
The incidence of foot and root rot of lentil was recorded at 10 days interval. The
incidence of the disease was calculated by the following formula:
Incidence (%) = 100plants ofnumber Total
plants infected ofNumber

EFFICACY OF FUNGICIDES AND BOTANICALS IN CONTROLLING 713
Data on growth parameters were recorded from 10 randomly selected plants in
each plot. The crop was harvested on 10 March in 2012 and 09 March in 2013.
Grain yield were determined based on the whole plot and expressed in kilogram
per hectare. The recorded data were analyzed statistically. Analysis of Variance
and LSD test were done to find out the significant difference among the
treatment means (Zaman et al., 1982).
Plant mortality, number of pod per plant and yield ranged from 7.06-10.90%,
49.33-74.33 and 1063-1465 kg/ha, respectively under various treatments during
2011-2012 cropping seasons (Table 1). The highest mortality (10.90%) was
recorded from the control plot. The lowest reduction was obtained with
allamanda leaf extract followed by garlic clove extract and neem leaf extract. The
reduction of disease severity under Bavistin 50WP and Trichoderma compost
was similar. The maximum and significant reduction was achieved with only
Provax 200 compared to control. The highest (74.33) number of pod was
achieved from Provax 200 which was statistically similar to Bavistin 50WP
(70.00) and the lowest (49.33) pod number was found under control plot (Table
1). The highest yield (1465 kg/ha) of lentil grain was recorded from Provax 200
and lowest yield (1063 kg/ha) form control. All treatments with fungicides as
well as botanicals increased the crop yield significantly over control. The highest
increase (37.82%) was achieved with Provax 200 followed by Trichoderma
compost (30.10%) and Bavistin 50WP (23.89 %).
Table 1. Efficacy of fungicides and botanicals in controlling foot and root rot disease
of lentil during rabi 2011-2012 at PRRS, Madaripur.
Treatment Plant
mortality (%)
No. of pods
per plant
Yield
(kg/ha)
Yield increase
over control
(%)
Provax 200 @ 2% 7.06 74.33 a 1465 a 37.82
Bavistin 50 WP @ 2% 8.23 70.00 ab 1317 bc 23.89
Trichoderma compost @ 3 t/ha 8.23 67.33 bc 1383 ab 30.10
Neem leaves extract (1:4 w/v) 8.86 63.67 bcd 1315 bc 23.70
Garlic clove extract (1:4 w/v) 9.16 61.00 cd 1256 cd 18.16
Allamanda leaf extract (1:4 w/v) 9.36 57.33 d 1195 d 12.42
Control 10.90 49.33 e 1063 e -
CV(%) 5.32 5.94 3.99 -
LSD(0.05) 0.83 6.68 91.25 -
Values within a column having a common letter(s) do not differ significantly (P=0.05).

714 SHAHIDUZZAMAN
Plant mortality, number of pod per plant and yield also significantly varied
among the treatments including control during 2012-2013. The highest %
mortality was recorded from control (Table-2). Treatments with different
fungicides reduced disease severity as compared to control. The lowest reduction
was obtained with garlic clove extract followed by allamanda leaf extract and
neem leaf extract. The reduction of disease severity under Bavistin 50WP and
Trichoderma compost was identical. The maximum and significant disease
reduction was achieved with Provax 200 compared to other treatments. The
highest number (66.33) of pod was achieved from Provax 200 which was
statistically similar with Bavistin 50WP (62.00) and Trichoderma compost
(59.67) treated plot and the lowest (43.67) pod number was found under control
(Table-2). The highest yield (1322 kg/ha) of lentil grain was recorded from
Provax 200 and lowest yield (963.30 kg/ha) from control. The highest yield
increase (37.24%) was achieved with Provax 200 followed by Bavistin 50WP
(34.23%) and Trichoderma compost (29.24%). The effect of Provax 200 on crop
yield was significantly higher over other treatments where Bavistin 50WP and
Trichoderma compost are statistically identical (Table 2).
Table 2. Efficacy of fungicides and botanicals in controlling foot and root rot disease
of lentil during rabi 2012-2013 at PRRS, Madaripur.
Treatment
Plant
mortality
(%)
No. of pods
per plant
Yield
(kg/ha)
Yield increase
over control
(%)
Provax 200 @ 2% 7.30 66.33 a 1322 a 37.24
Bavistin 50 WP @ 2% 9.33 62.00 ab 1293 ab 34.23
Trichoderma compost @ 3 t/ha 9.40 59.67 abc 1245ab 29.24
Neem leaves extract (1:4) 10.60 57.00 bc 1188 bc 23.33
Garlic clove extract (1:4) 11.00 54.33 cd 1123 c 16.58
Allamanda leaf extract(1:4) 11.60 50.00 de 1101 c 14.29
Control 12.90 43.67 e 963.30 d -
CV(%) 6.48 6.60 4.93 -
LSD(0.05) 1.18 6.58 103.2 -
Values within a column having a common letter(s) do not differ significantly (P=0.05).
It was quite evident that foot and root rot of lentil caused by Fusarium
oxysporum and Sclerotium rolfsii had immense impact on germination, disease
incidence, seedling mortality and yield (Dey et al., 1993). From the result it was
observed that seed treatment with all the tested fungicides/ botanicals reduced the
disease severity and increased pod number and crop yield of lentil as compared
to untreated control. Provax 200, Bavistin 50WP and Trichoderma compost
showed better performance than other treatments in both the seasons. However,

EFFICACY OF FUNGICIDES AND BOTANICALS IN CONTROLLING 715
in 2011-12 cropping season, Bavistin 50WP, Trichoderma compost and Neem
leaf extract showed statistically identical mortality, pods per plant and yield
while in 2012-13 cropping season, Bavistin 50WP and Trichoderma compost
showed statistically similar results.
The result of the present study clearly indicated that, seed treatment with
botanicals and fungicides promoted yield by reducing foot and root rot disease.
References
Anonymous. 1986. Annual Report 1985-86. Plant Path. Div. BARI, Gazipur, P-19.
Anonymous. 2005. Dal fasol utpadon poddoti. BARI Hand book, P. 101-104.
Anonymous. 2014. Acrage and Production of Pulse Crops. Agricultural Information
Service, Krishi Diary, Department of Agricultural Extension, Bangladesh, P-14.
Aycock, R. 1966. Stem rot and other diseases caused by S. rolfsii. Tech. Bull. No. 174.
Agric. Expt. Station, North Carolina State University, Raleigh, P. 202.
Dey, T. K., M. S. Ali and N. Chowdhury. 1993. Vegetative growth and sporangia
production in Phytophthora colocaseae. Indian J. Root Crops 17(2): 142-146.
Hoque, M. A., I. Hamim, M. R. Haque, M. A. Ali, M. Ashrafuzzaman. 2014. Effect of
Some Fungicides on Foot and Root Rot of Lentil. Universal J. Plant Science 2(2):
52-56.
Khare, M. V., S. C. Agrawal and A. C. Jain. 1979. Diseases of lentil and their control.
Tech. Bull.. Jabalpur, Madhya Prasesh, India: Jawaharlal Nehru Krisi Viswa
Vidyalaya.(http://www.hrpub.org).
Sattar, M. A., A. R. Podder, M. C. Chandra and M. Rahman. 1996. The most promising
BNF technology for green legume production in Bangladesh. BNF Association,
Dhaka, BD. 28 Nov 1994, Pp.15-20.
Singh, J. and S. C. Tripathy. 1999. Mycoflora association with stored seeds of Lens
esculenta. Herbal Pesticide Lab., Dept. of Botany, Gorakhpur Univ. Gorakhpur.
India. (http://www.hrpub.org)
Zaman, S. M. H., K. Rahim and M. Howladar. 1982. Simple lessions from biometry.
Bangladesh Rice Research Institute, Joydebpur, Gazipur. Publication No. 54.
(http://www.hrpub.org).

716 SHAHIDUZZAMAN

M. N. Islam, M. S. Rahman, M. S. Alom and M. Akhteruzzaman − performance of different crops productivity enhancement through adaptation of crop varieties at charland in Bangladesh
Md. Rayhan Shaheb, Md. Nazmul Islam, Ashratun Nessa, Md. Altab Hossain and Ayesha Sarker - impact of harvest stage on seed yield quality and storability of french bean
Md. Altaf Hossain − Efficacy of some insecticides against insect pests of mungbean (Vigna radiata L.)
M. A. Monayem Miah and M. Enamul Haque − Farm level impact study of power tiller operated seeder on service providers’ livelihood in some selected sites of Bangladesh
S. Sultana, M. A. Kawochar, S. Naznin, H. Raihan and F. Mahmud − Genetic divergence in pumpkin (Cucurbita moschata L.) Genotypes
M. A. Uddin, K. S. Rahman, M. M. Rahman, N. Mohammad and A. F. M. Tariqul Islam − Development of union level digital databases and maps of maize growing areas at pirgonj in Thakurgaon District
N. Mohammad, M. S. Islam, K. S. Rahman, M. M. Rahman and S. Nasrin − Determination of optimum sample size for measuring the contributing characters of bottle gourd
Short communication
Md. Shahiduzzaman − Efficacy of fungicides and botanicals in controlling foot and root rot of lentil
629
641
683
693
703
711
657
669
C O N T E N T S

M. Ataur Rahman, M. Mohabbatullah, C. K. Das, U. K. Sarker and S. M. M. Alam − Sowing time and varietal performance of wheat at higher elevation in hill environment at Khagrachari
M. M. Rohman, B. R. Banik, A. Biswas and M. S. Rahman − Genetic diversity of maize (Zea mays L.) Inbreds under salinity stress
J. A. Chowdhury, M. A. Karim, Q. A. Khaliq, A. R. M. Solaiman and J. U. Ahmed − Genotypic variations in growth, yield and yield components of soybean genotypes under drought stress conditions
M. A. Monayem Miah, Moniruzzaman, S. Hossain, J. M. Duxbury, J. G. Lauren − Adoption of raised bed technology in some selected locations of Rajshahi District of Bangladesh
M. Moniruzzaman, R. Khatoon, M. F. B. Hossain, M. T. Rahman and S. N. Alam − Influence of ethephon on ripening and quality of winter tomato fruit harvested at different maturity stages
K. S. Rahman, S. K. Paul and M. A. R. Sarkar - Performance of separated tillers of transplant Aman rice at different levels of urea super granules
M. K. Jamil, M. Mizanur Rahman, M. Mofazzal Hossain, M. Tofazzal hossain, and A. J. M. Sirajul Karim − Effect of plant growth regulators on flower and bulb production of hippeastrum (Hippeastrum hybridum Hort.)
M. K. R. Bhuiyan, S. M. Sharifuzzaman and M. J. Hossain − Effect of bap and sucrose on the development of cormel in mukhi kachu
M. H. Khan, S. R. Bhuiyan, K. C. Saha, M. R. Bhuyin and A. S. M. Y. Ali − Variability, correlation and path co-efficient analysis of bitter gourd (Momordica charantia L.)
M. A. Razzaque, M. M. Haque, M. A. Karim, A. R. M. Solaiman and M. M. Rahman − Effect of nitrogen on different genotypes of mungbean as affected by nitrogen level in low fertile soil
(Cont'd. inner back cover)
BANGLADESH JOURNAL OF AGRICULTURAL RESEARCH
Vol. 40 December 2015 No. 4
521
529
537
551
567
581
591
601
607
619
Published by the Director General, Bangladesh Agricultural Research Institute (BARI), Gazipur 1701, Bangladesh. Printed at Bengal Com-Print, 68/5, Green Road, Dhaka-1215, Phone : 01713009365.
Related Documents


