Resource Atlas of Isiolo County, Kenya Community-based mapping of pastoralist resources and their attributes July 2015

Welcome message from author
This document is posted to help you gain knowledge. Please leave a comment to let me know what you think about it! Share it to your friends and learn new things together.
Transcript

Resource Atlas of Isiolo
County, Kenya Community-based mapping of pastoralist resources
and their attributes
July 2015


i
Acknowledgements Many people and organisations contributed the development of this Resource Atlas of Isiolo County. I am grateful to His Excellency, the governor, Dr. Adhi Godana Doyo for his valuable
insight, effort, commitment and contribution that led to the successful completion of this Resource Atlas.
Special gratitude to development partners that included the National Drought management Authority (NDMA), Adaptation Consortium and Resource Advocacy Programme (RAP) who
provided the technical expertise on participatory digital mapping. This undertaking would not have been possible without their support.
I also express my appreciation to the GeoData Institute, University of Southampton, United Kingdom. They ensured the technical design, application and back-stopping in the digital
mapping process. Special thanks go to those who carried out the field work and those who mobilised the communities and facilitated their participation in this process.
Finally, I am indebted to DFID Kenya (UK Aid) and to CORDAID for the funding they provided through the Adaptation Consortium to enable this important work to have gone ahead. It is
with great pride that the county government would like to share this Resource Atlas. I hope that users will find it relevant and in line with the needs and realities of our time; that this
contributes to the realization of our vision of a developed, just and a cohesive County where all enjoy a high quality of life.
Mrs Amina A. Omar
Country Executive Committee Member
Water, irrigation, Environment and Natural Resources

ii

iii
Foreword The Resource Atlas of Isiolo County documenting pastoralists’ knowledge the resources that sustain their livelihoods is the first of its kind in Kenya. It is an important document in our
arsenal of planning tools to deliver the County Integrated Development Plan, 2013-17, and meet our mission of improving the livelihoods of the people of Isiolo through participatory
engagement in the provision of basic infrastructure and services.
The livestock sector, dominated by pastoralism, is the backbone of our county’s economy and the livelihood for the majority of our people. However, many years of under-investment in
this sector, have left pastoralists with high poverty levels and vulnerable to extreme climate events such as drought. The Isiolo CIDP, 2013-17 and the Isiolo County Livestock Strategy
have identified measures to strengthen the livestock sector. Among the identified interventions there are proposals to improve pasture and water management, enhance livestock
disease control initiatives, develop markets and market infrastructure, construct modern abattoirs and create disease free zones. The County Resource Atlas will guide us in planning and
implementing these interventions.
Furthermore, and equally importantly, this Atlas will contribute to the development of the County Land Policy and Spatial Plan. We will use the community’s intimate knowledge of the
location, extent and inherent qualities of the resources that underpin their livelihoods and the pastoral livestock sector to ensure we develop a coherent and complementary land use
plan for the county that promotes economic development, sustainable environment management and social harmony. The Atlas will guide us in where best to invest in water, health,
marketing, transport and communication facilities and infrastructure to support the growth of our economy and the well-being of our people.
In acknowledging this undertaking, this Resource Atlas indicates the commitment of my County Government in strengthening and improving the livelihoods of the people of Isiolo. I want
to say a special thank you to the people of Isiolo. Never before have we managed to capture the wealth of indigenous knowledge our people have of their environment in a way which can
be understood and appreciated by all development actors. Nor have we been able to involve them to such an extent in county government decision-making. The process by which the
Atlas has been developed has allowed us to ensure the enhanced participation of local people in the county planning process – a key objective of devolution as provided by the
Constitution.
Finally, I recognise that an atlas is never finished. All it can show is the situation at a certain time. We live in a changing and dynamic world. The climate is changing and impacting on our
rivers, forests, rangelands and water resources. As a county government we will continue to make investments that build a resilient economy and society. In view of this, and to ensure
our planning is always informed by the most up-to-date and relevant information and data, we will continue to review and update the Resource Atlas.
Dr Adhi Godana Doyo Governor, Isiolo County

iv

v
Contents
Acknowledgements ............................................................................................................................................................................................................................................................................. i
Foreword ........................................................................................................................................................................................................................................................................................... iii
Contents ............................................................................................................................................................................................................................................................................................. v
Participatory GIS mapping process .................................................................................................................................................................................................................................................... 1
Background ..................................................................................................................................................................................................................................................................................... 1
Mapping process ............................................................................................................................................................................................................................................................................ 1
Data management .......................................................................................................................................................................................................................................................................... 2
Isiolo maps and data ...................................................................................................................................................................................................................................................................... 3
Mapping ......................................................................................................................................................................................................................................................................................... 3
Location .............................................................................................................................................................................................................................................................................................. 5
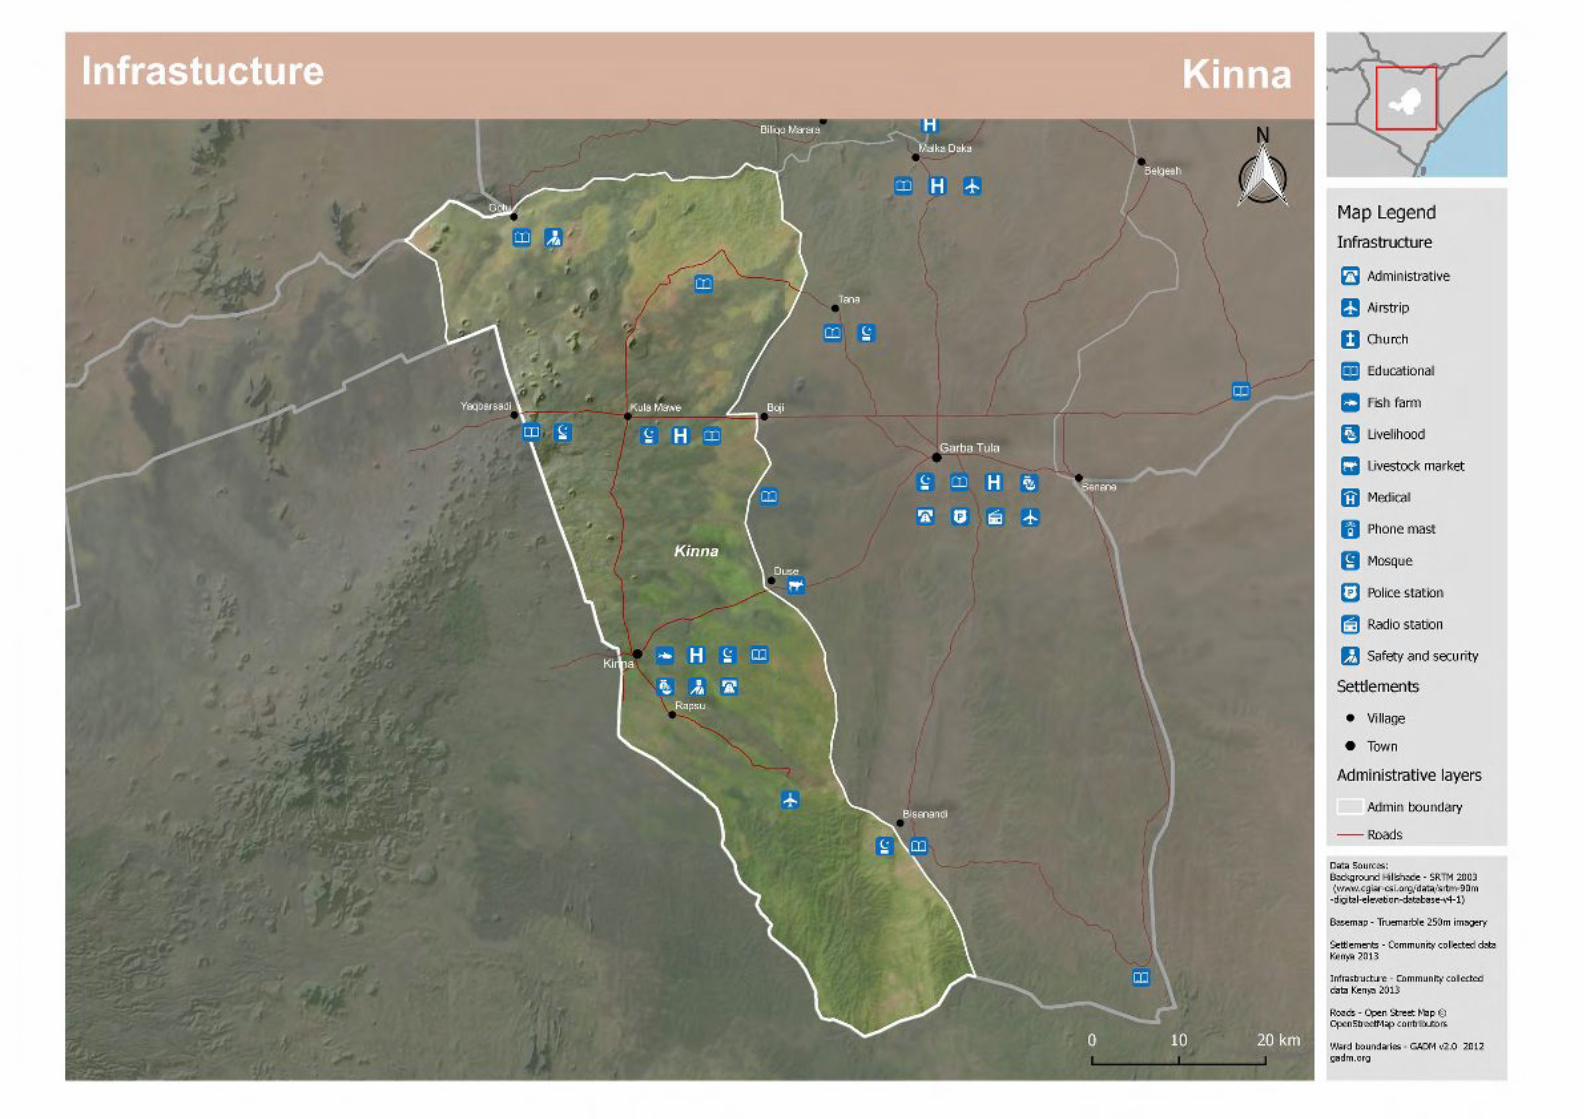
Infrastructure ..................................................................................................................................................................................................................................................................................... 7
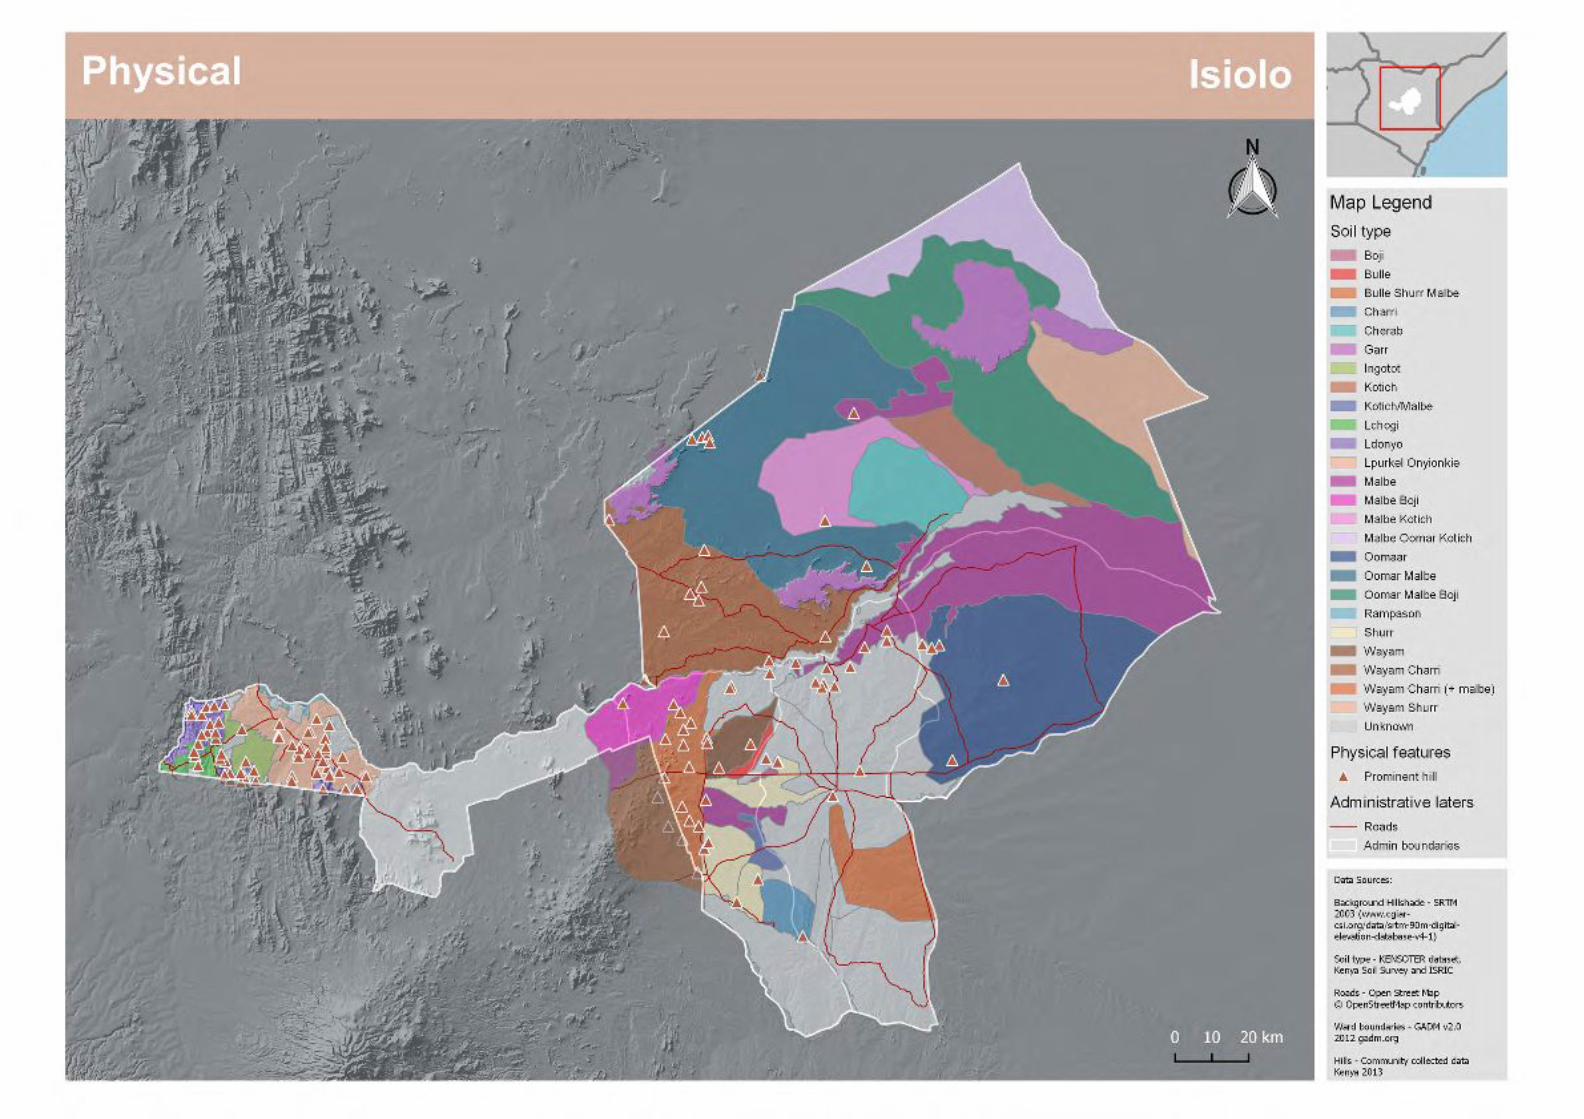
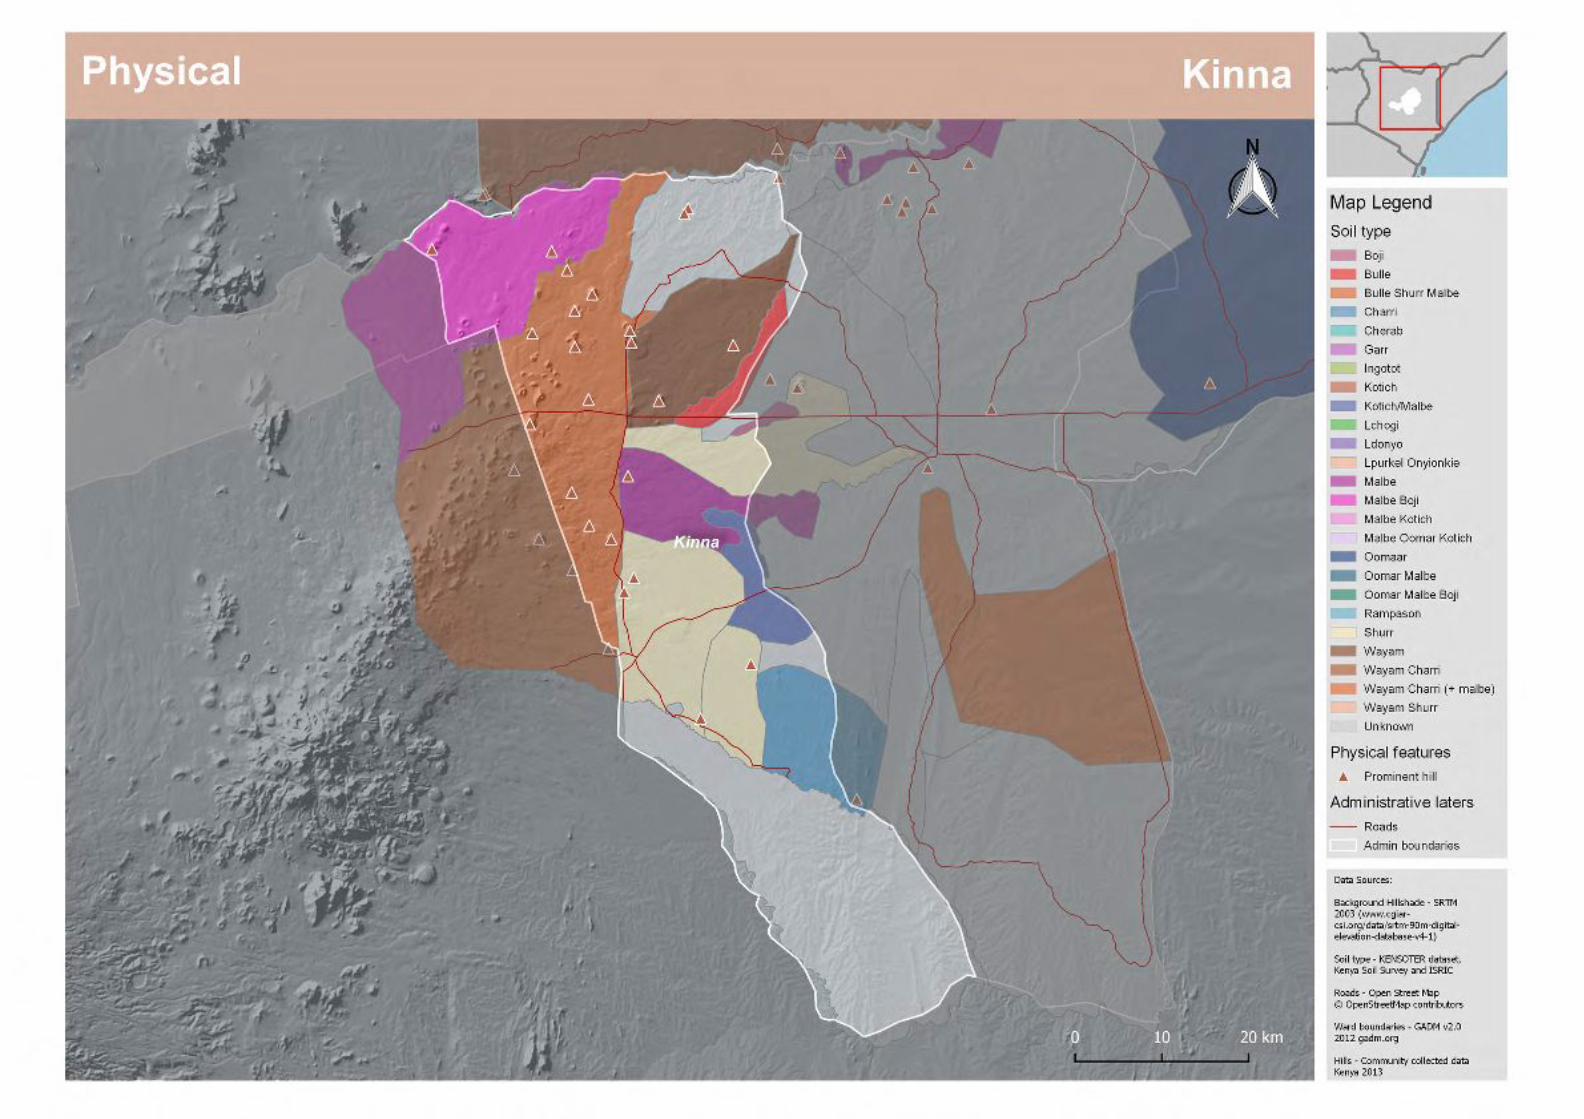
Physical ............................................................................................................................................................................................................................................................................................. 15
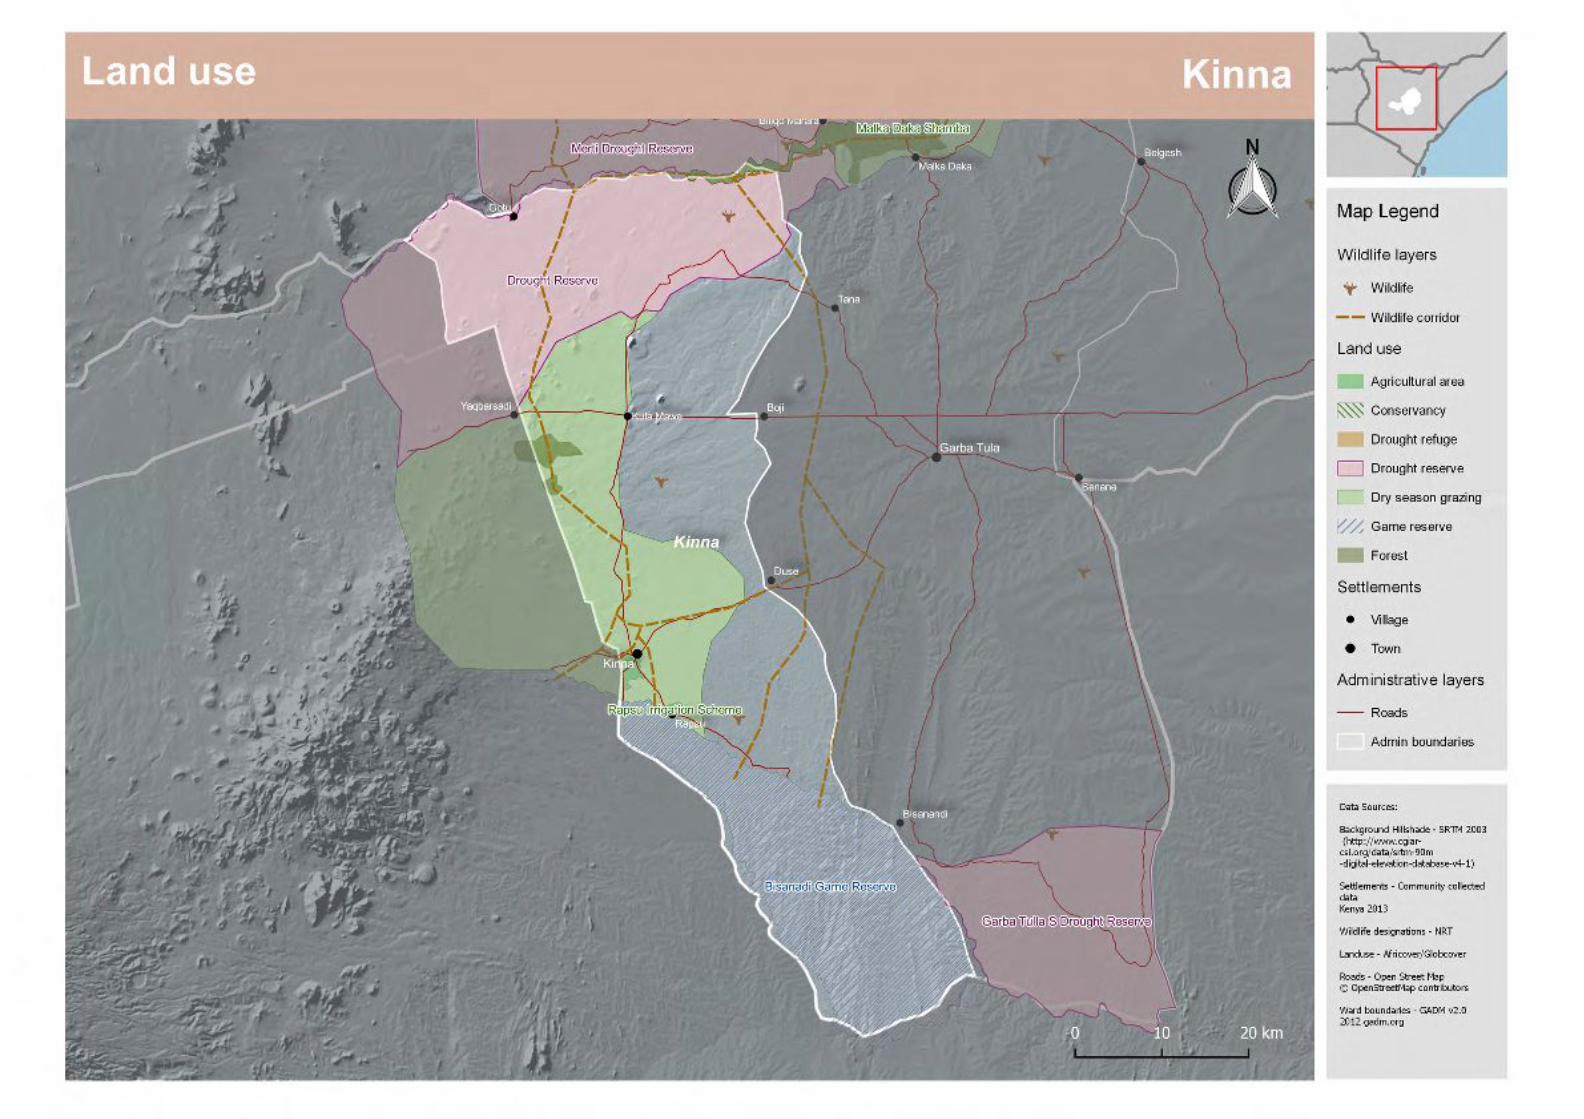
Land Use ........................................................................................................................................................................................................................................................................................... 23
Land Cover ........................................................................................................................................................................................................................................................................................ 31
Water and Drainage ......................................................................................................................................................................................................................................................................... 39
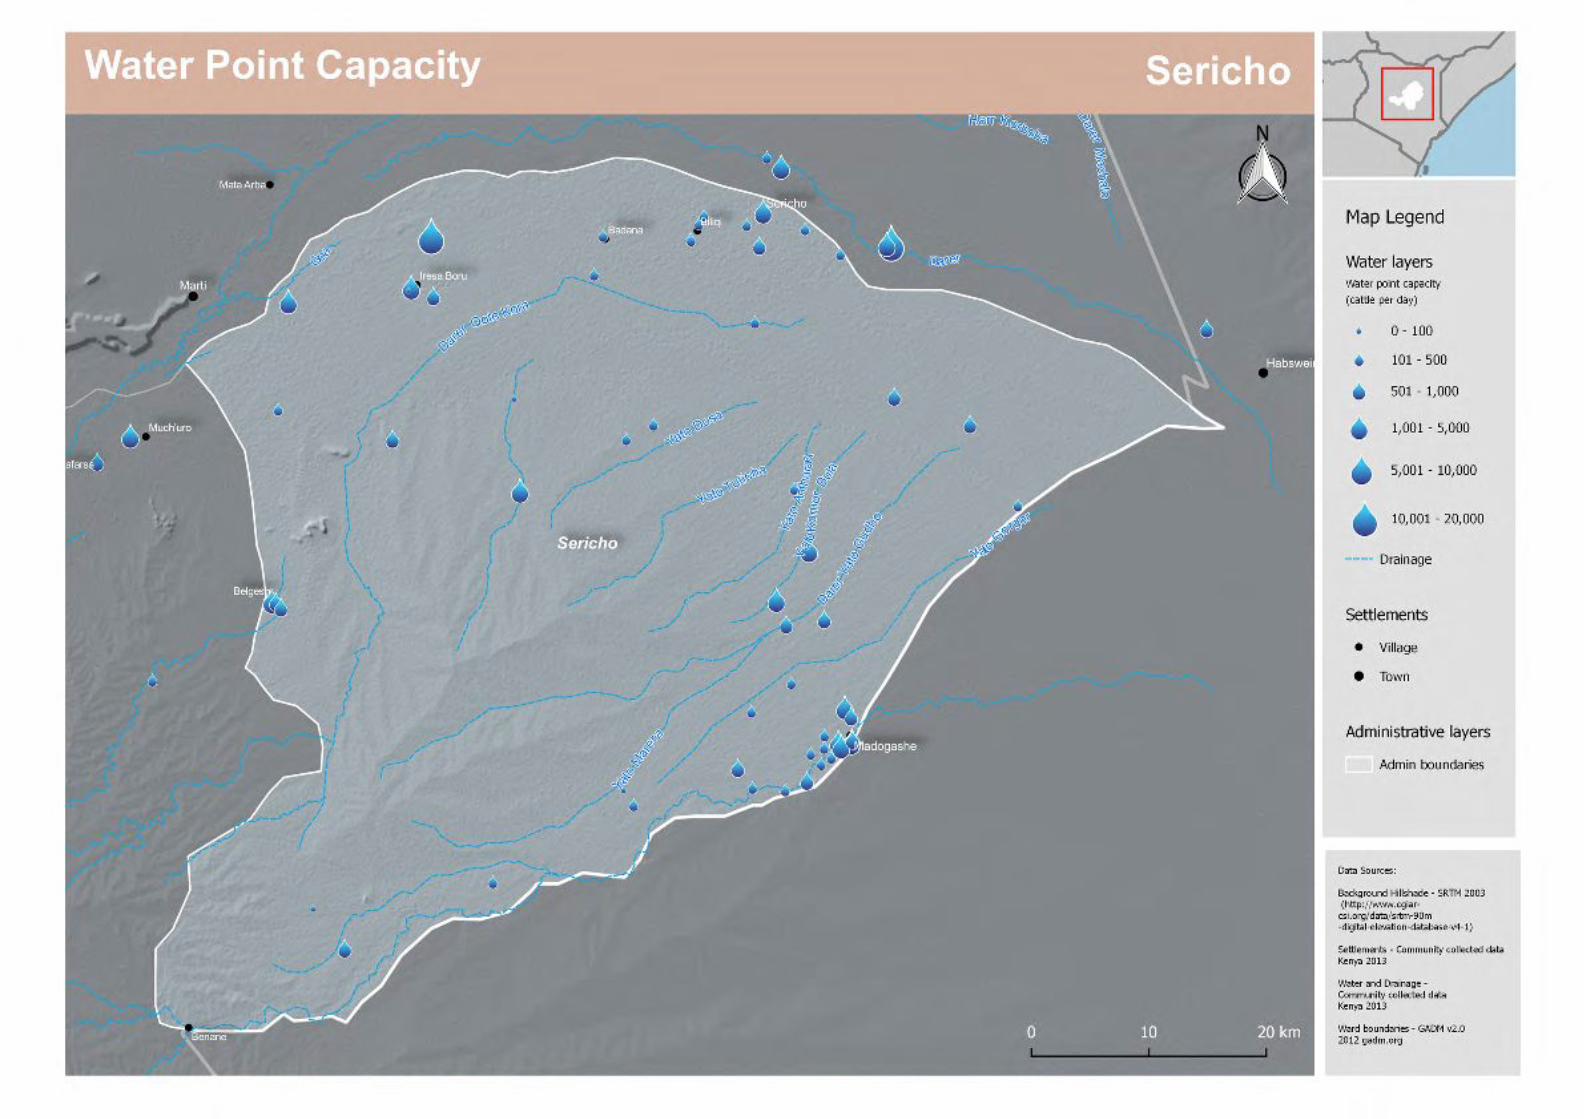
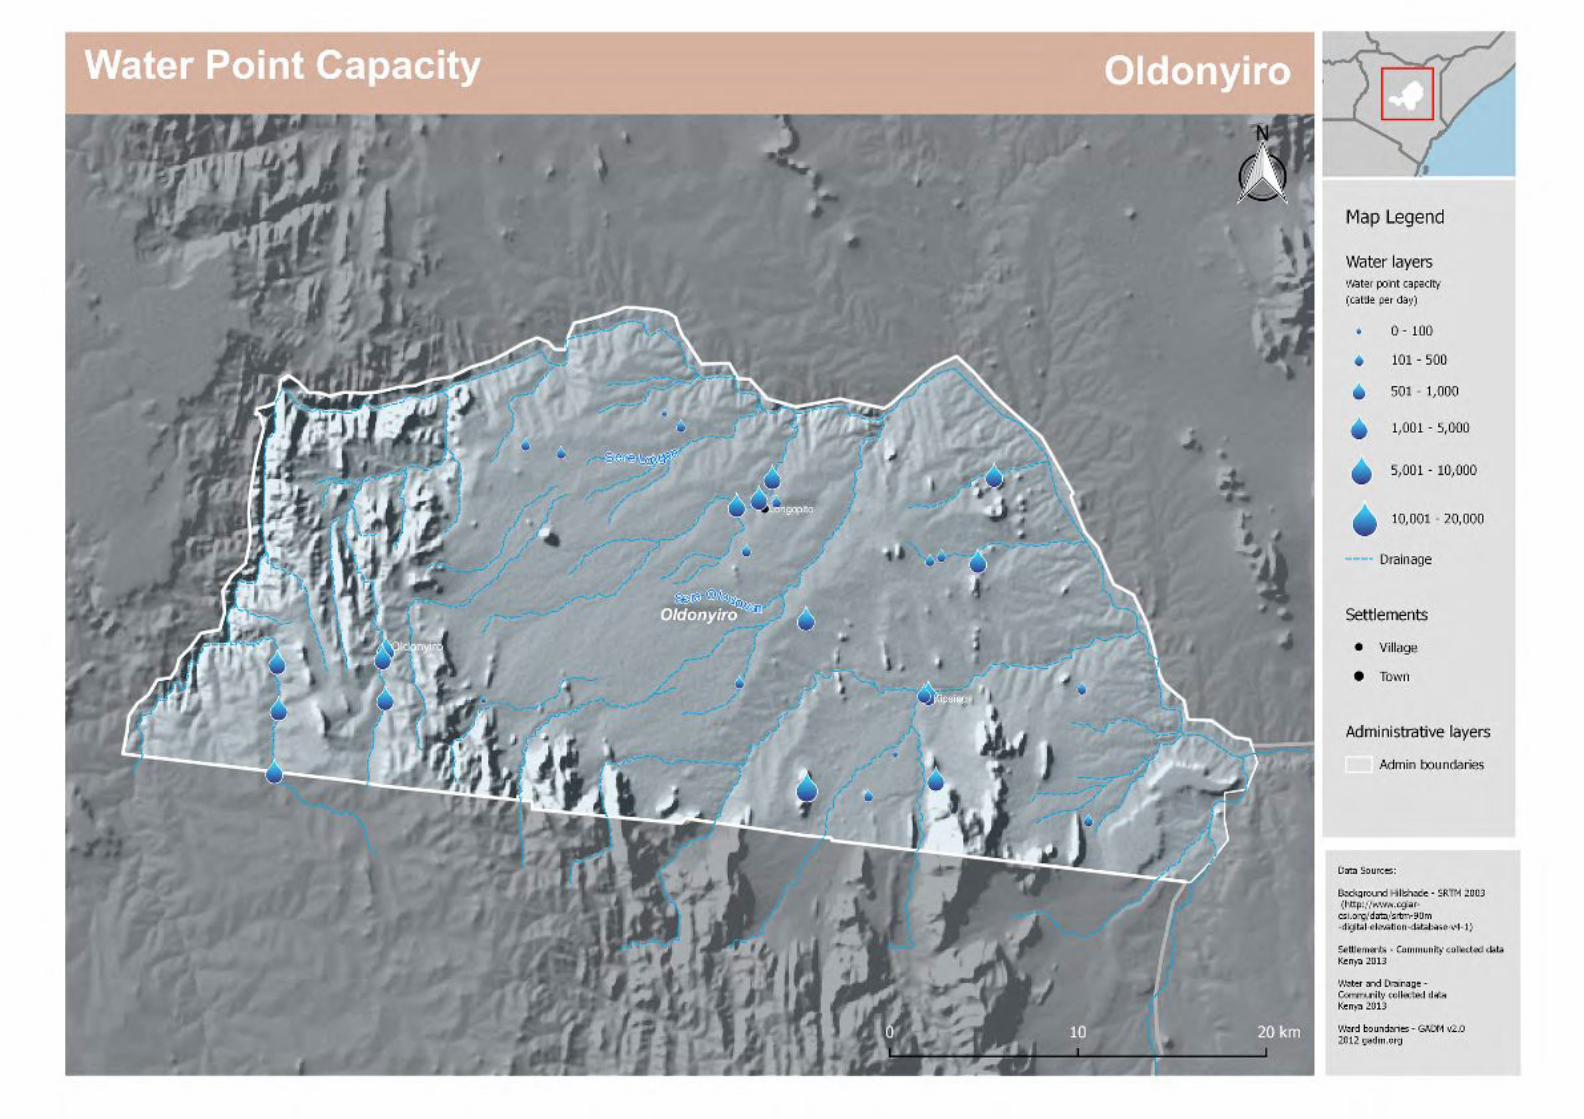
Water Point Capacity........................................................................................................................................................................................................................................................................ 47
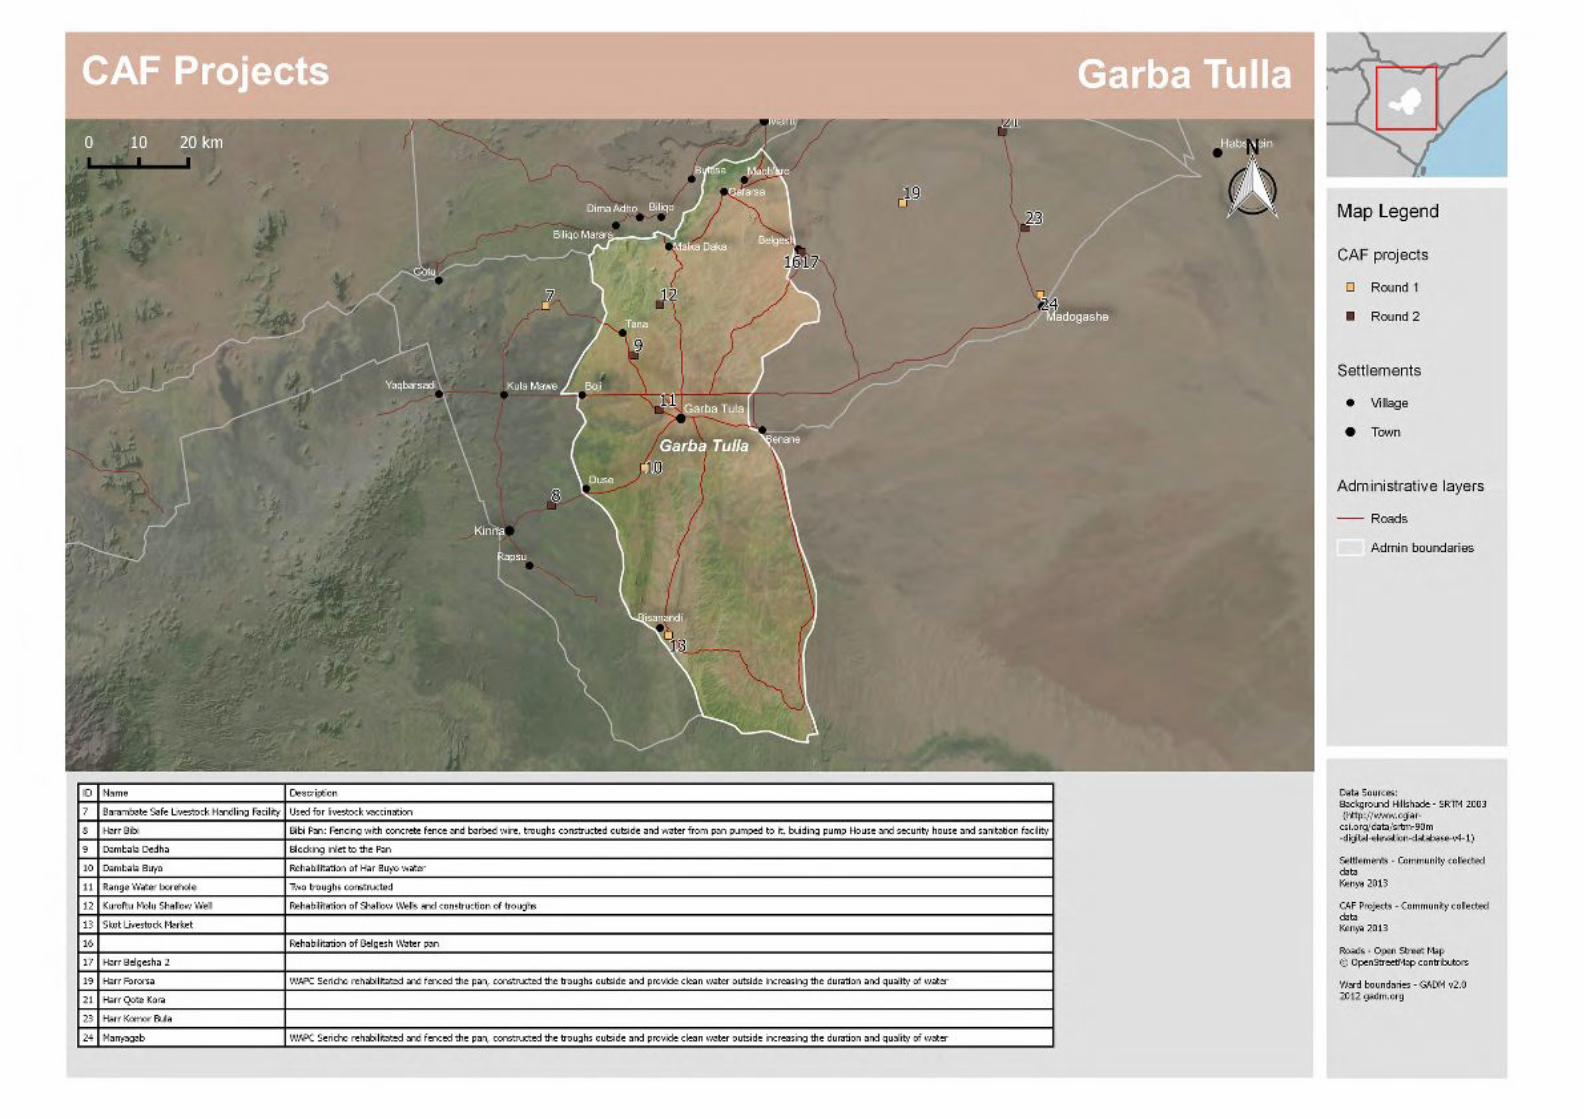
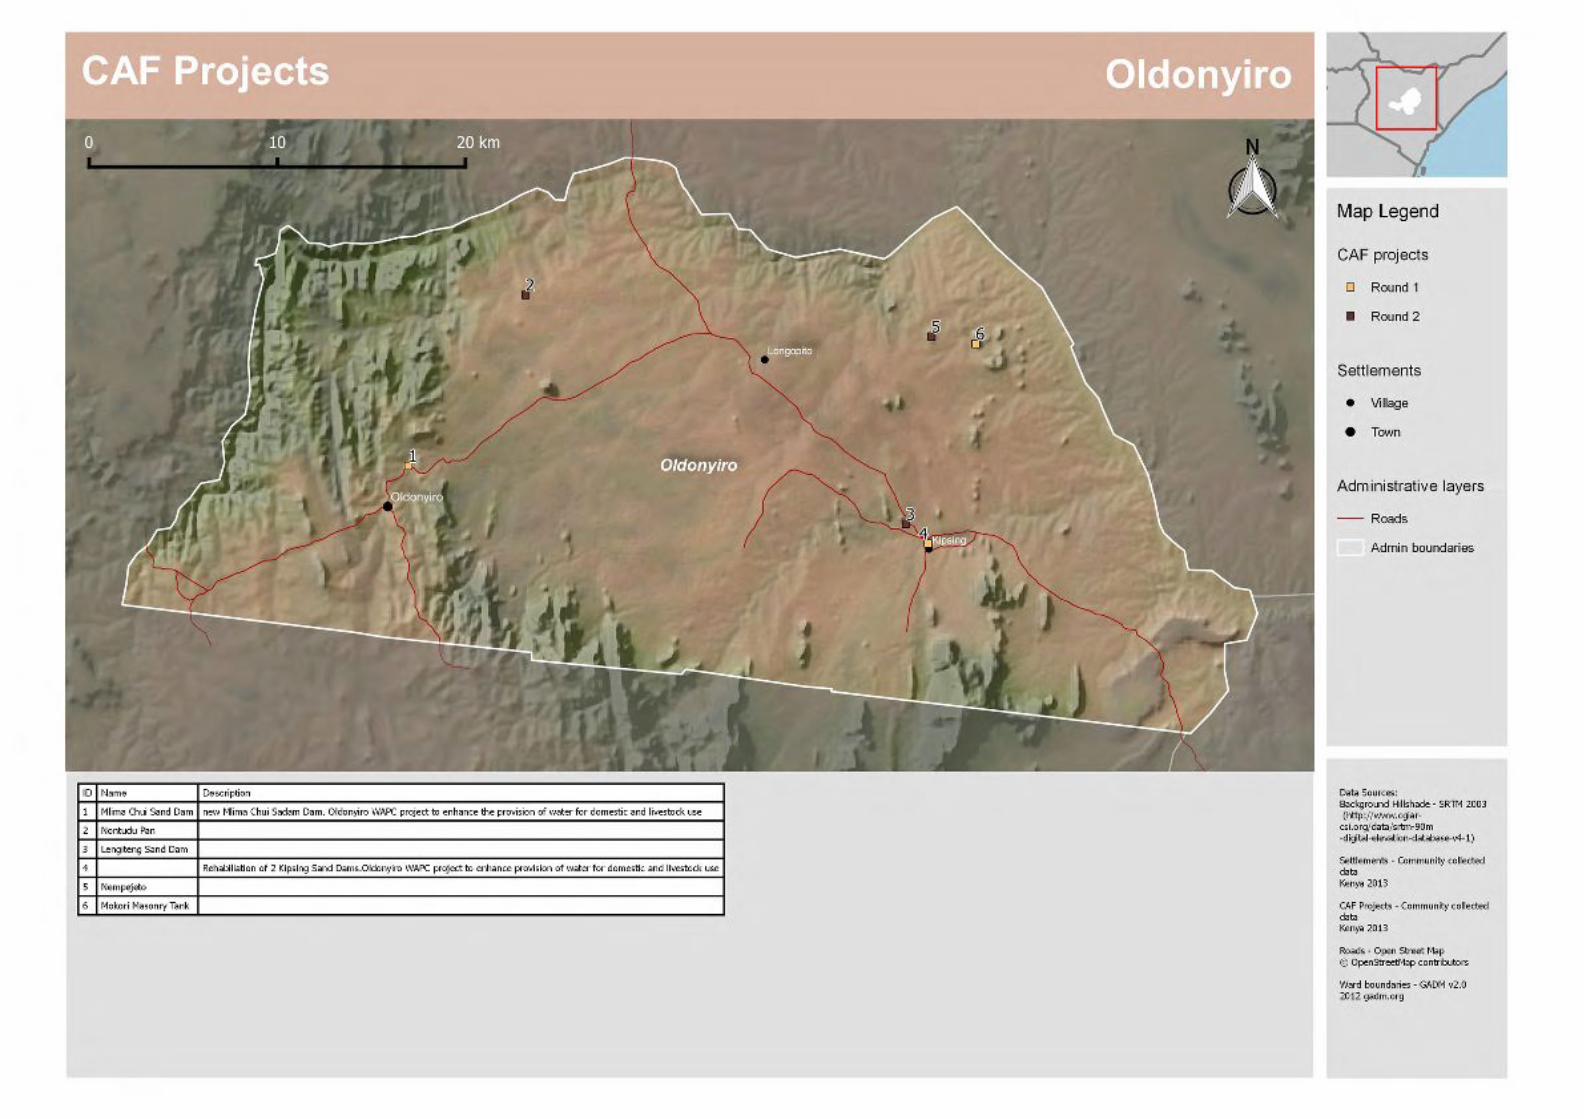
Climate Adaptation Fund Projects ................................................................................................................................................................................................................................................... 55

1
Participatory GIS mapping process
Background The policy and institutional environment in Kenya is
supportive of pastoral livestock development in the ASALs.
The Constitution of Kenya (2010) has provisions for
strengthening livestock production and transforming
ASAL economies, while Kenya Vision 2030 recognizes the
importance of livestock production in the ASALs to overall
national agricultural development.1
The Constitution of Kenya 2010 introduced devolved
government with an Executive and an Assembly. County
governments are responsible to provide opportunities for
communities and citizens to be more intimately involved
in the planning and implementation of development
projects that impact on their livelihoods. To support
community participation, practical measures are needed
to facilitate dialogue and understanding between county
government actors and local people. On the one hand,
county government staff need to better understand the
rationale of local livelihood systems and how different
communities plan their activities, particularly in the face
of climate change; but, on the other hand, local people
also have to understand how county government
planning and budgeting systems work.
Participatory digital mapping using satellite imagery and
digital earth and other open source Geographic
Information Systems (GIS) is a practical tool bridging the
knowledge and communication gap between pastoral
communities and county government planners. It is
offering an effective ‘tool’ for participatory planning and
1 Additional provisions in support of pastoral livestock
development are found within Sessional Paper No. 8 of 2012
on the National Policy for the Sustainable Development of
Northern Kenya and other Arid Lands, The National Land
Policy, the Agricultural Sector Development Strategy (ASDS)
2010 to 2020 and Sessional Paper No. 2 of 2008 on National
Livestock Policy.
decision-making in support of climate change adaptation
in the drylands of Kenya.
The use of participatory mapping is not new in seeking to
capture an understanding of the community and its use
of natural resources. These maps are typically drawn on
the ground using stones, bits of wood and other easily
available material to depict key features such as schools,
water points, forest areas, etc. Such processes produce
perception maps rich in local knowledge and reflecting
community priorities. From the perspective of
government planners, however, such maps are of limited
use for planning as they lack accurate scales and
coordinates – characteristics essential for demarcating
the location and extent of resources on which to develop
byelaws for their protection and good management.
The process used in Isiolo County combines digital
mapping with community-drawn perception maps. This
offers a number of benefits. While fully capturing the
wealth of local knowledge, they contain a built in
coordinate system which respond to a global reference
grid, enabling their linkage to maps used in formal
systems. Furthermore, the coordinate system provides a
geographically precise basis from which to discuss natural
resource management, making outputs of participation in
mapping more universally useable. These benefits,
however, need to be carefully balanced to avoid the risk
that through this process pastoral resources, that are
highly dynamic, are ‘frozen’ in time and space. The
flexible nature of digital maps allows users to zoom in and
work on specific areas, and then to zoom out to obtain a
wider view of the data. This is critical when developing
maps of pastoral resources and livelihood strategies that
require a presentation of data and analysis at the
ecosystem scale, reflecting the dimension at which the
system operates.
The participatory GIS mapping process was initiated by
the Adaptation Consortium (www.adaconsortium.org), a
government led initiative under the leadership of the
National Drought Management Authority within the
Ministry of Devolution and Planning. The Consortium
works in the arid and semi-arid counties of Garissa, Isiolo,
Kitui, Makueini and Wajir. The Consortium consists of
Christian Aid working with ADS-Eastern in Kitui and
Makueni; International Institute of Environment and
Development (IIED) working with Resource Advocacy
Programme (RAP) in Isiolo, Womankind Kenya in Garissa,
and Arid Lands Development Focus (ALDEF) in Wajir; the
Met Office (UK) and the Kenya Meteorological Services
(KMS). It is funded by DFID Kenya (UK Aid) under its
Strengthening Adaptation and Resilience to Climate
Change in Kenya plus programme and CORDAID..
Mapping process The participatory mapping process has adopted
Geographic Information System (GIS) workflows within
community workshops that has allowed for creation of
integrated, consistent and standardised geospatial
information.
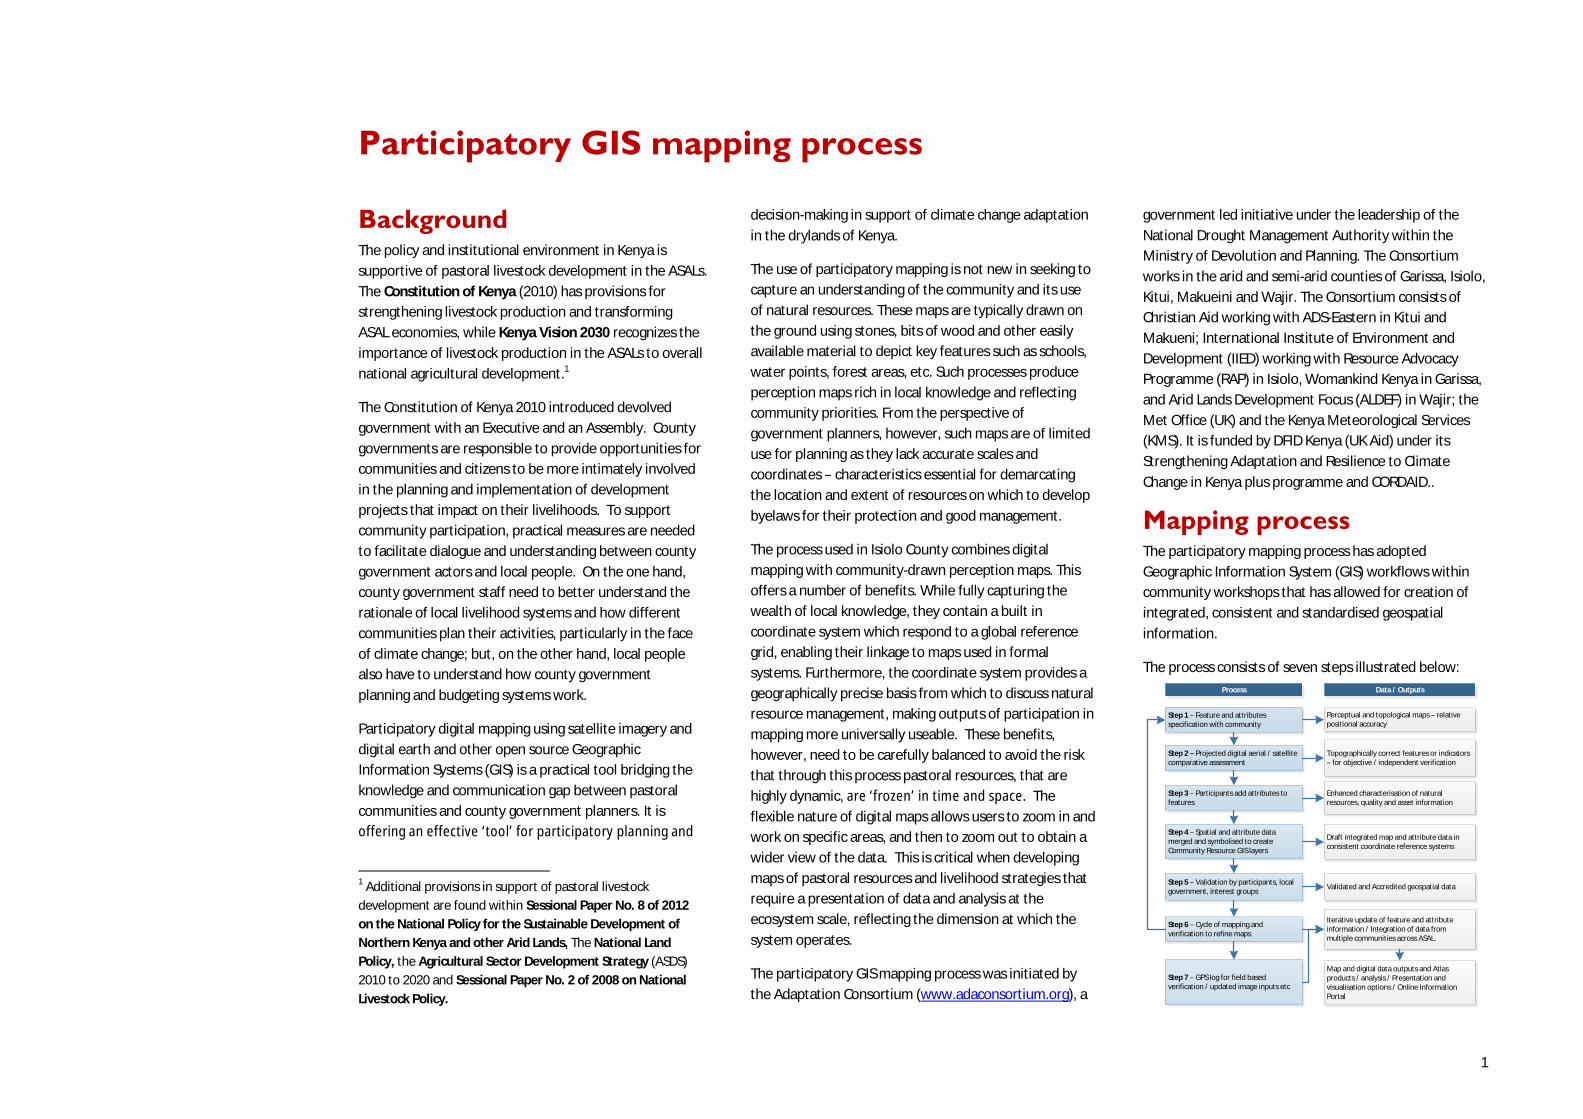
The process consists of seven steps illustrated below:
Step 1 – Feature and attributes specification with community
Step 2 – Projected digital aerial / satellite comparative assessment
Step 3 – Participants add attributes to features
Step 4 – Spatial and attribute data merged and symbolised to create Community Resource GIS layers
Step 5 – Validation by participants, local government, interest groups
Step 6 – Cycle of mapping and verification to refine maps
Step 7 – GPS log for field based verification / updated image inputs etc
Process
Perceptual and topological maps – relative positional accuracy
Topographically correct features or indicators – for objective / independent verification
Data / Outputs
Enhanced characterisation of natural resources, quality and asset information
Draft integrated map and attribute data in consistent coordinate reference systems
Validated and Accredited geospatial data
Iterative update of feature and attribute information / Integration of data from multiple communities across ASAL.
Map and digital data outputs and Atlas products / analysis / Presentation and visualisation options / Online Information Portal
2
Step 1: Community level meetings to develop perception
maps on the ground and/or on paper. The 1st step is the
production of a community perception map of the
resources important for their livelihood system. This map
can be drawn on the ground and should be done in a
community setting to enable the participation of a large
group of people. Several maps may be produced by
smaller sub-groups (women, youth, elders) and then
amalgamated. The final map is then copied onto paper.
Step 2. Digital mapping is introduced. This step takes
place in a workshop setting with a smaller group of key
informants chosen by the community as well as county
government planners and technical staff. The presence of
the latter is critical to the process of legitimising
community knowledge. Following a quick explanation of
satellite imagery, Google Earth is projected onto a wall
next to the perception maps developed under step 1. The
use of Google Earth is only for orientation and to enable
participants to navigate the imagery and cross-reference
their paper-mapped key resources against the satellite
imagery. Features that participants feel are important
(e.g. water points, wet and dry season grazing areas,
drought reserves, wildlife routes) are then captured
digitally using open source applications (Quantum GIS
(QGIS)) and JOSM, the Open Street Map editing platform).
This produces the coordinates that pinpoint the locations
of natural resources in a manner that can be
independently and objectively verified (see Figure 2).
This highly interactive process of geo-referencing local
knowledge to a coordinate reference system allows
resource maps to be produced to any scale, and in real-
time, with the community. This stage also allows the first
level of ‘validation’ of the data and discussion on the
suitability of the products to meet the stakeholders’
needs (community, local government and other external
stakeholders).
Step 3 Qualitative and quantitative attributes describing
the key resources are collected. As participants put
features onto the map they also describe the specified
characteristics or attributes of these features. Attribute
data includes a fuller description of the physical
characteristics of the resource (e.g. soil type, water
quantity and quality, pasture species) as well as issues
concerning its management (e.g. under customary or
modern management, land tenure status, negotiated or
paid access, area of conflict). Updating this data on a
regular basis will inherently add temporal and trend data
to the spatial database, highlighting the need to structure
the data systems well to manage time-based data and
record updates.
Steps 4-6: Data verification cycles integrated into the
mapping process to capture community feedback and
verify the records in the geospatial data and their
attribute values against the specification. The mapping
includes a series of validation, cross-checking and
verification cycles, run with the community and in a few
instances including on the ground verification. This stage
also allows the first level of ‘validation’ of the data; the
suitability of the products to meet the stakeholder
(community and external stakeholder) needs.
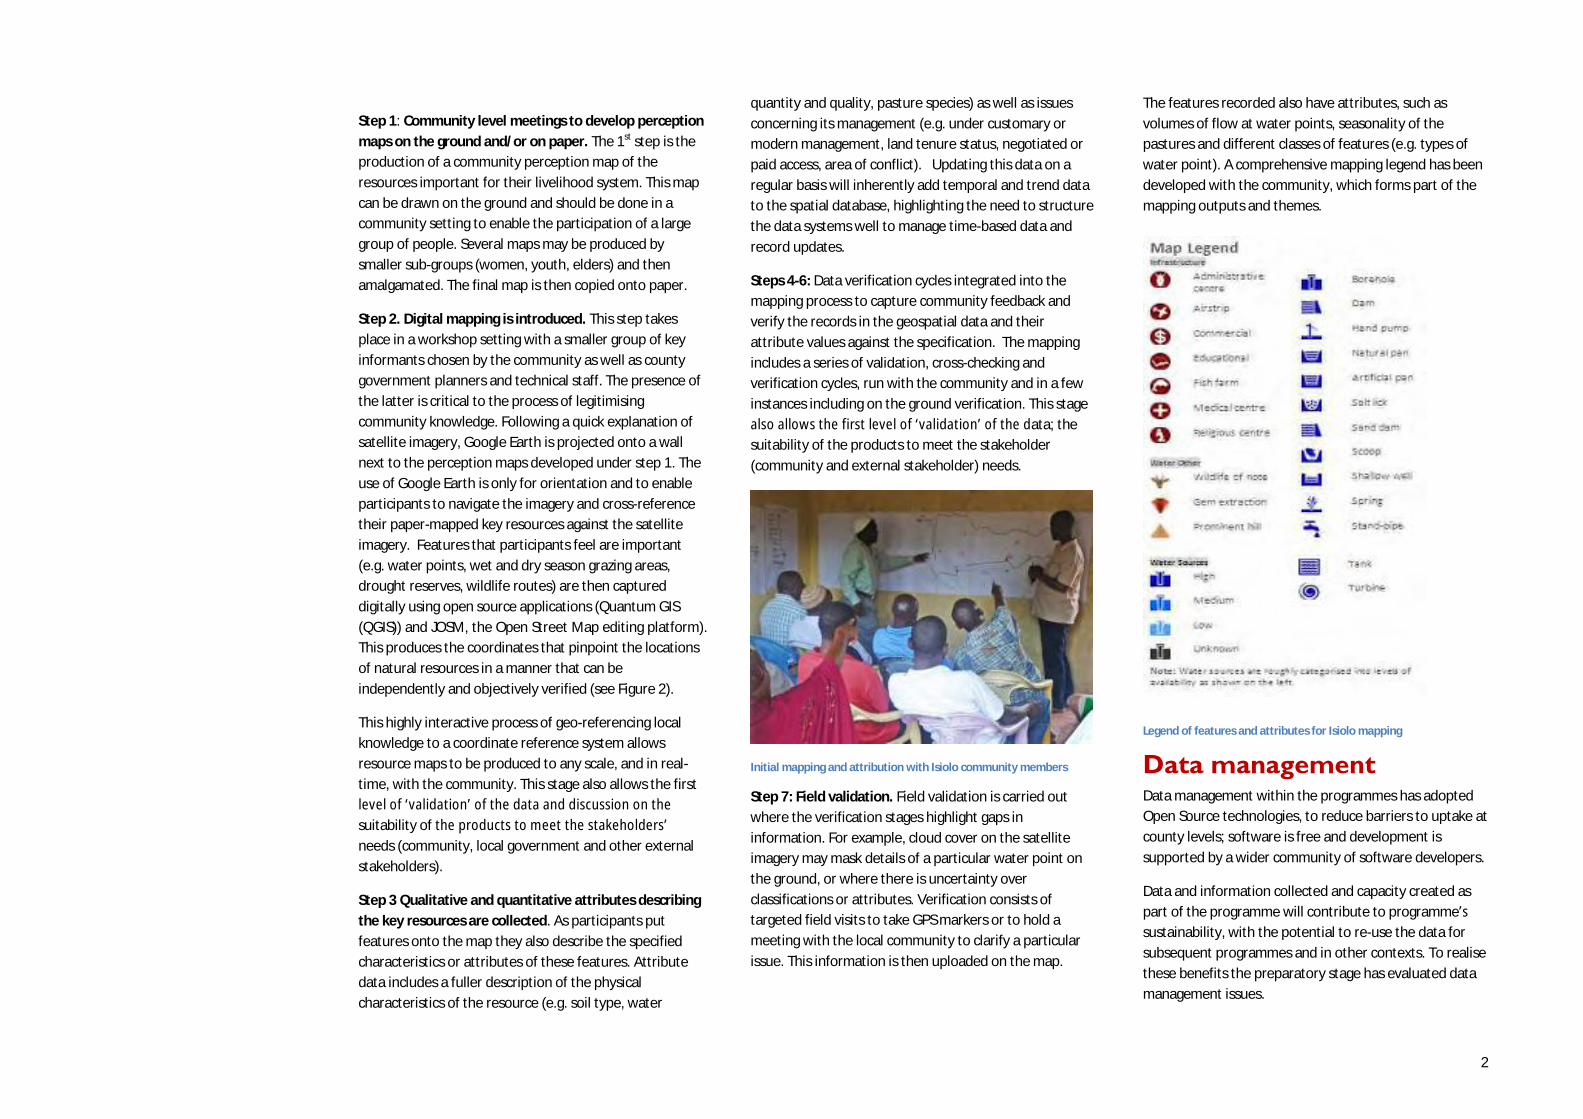
Initial mapping and attribution with Isiolo community members
Step 7: Field validation. Field validation is carried out
where the verification stages highlight gaps in
information. For example, cloud cover on the satellite
imagery may mask details of a particular water point on
the ground, or where there is uncertainty over
classifications or attributes. Verification consists of
targeted field visits to take GPS markers or to hold a
meeting with the local community to clarify a particular
issue. This information is then uploaded on the map.
The features recorded also have attributes, such as
volumes of flow at water points, seasonality of the
pastures and different classes of features (e.g. types of
water point). A comprehensive mapping legend has been
developed with the community, which forms part of the
mapping outputs and themes.
Legend of features and attributes for Isiolo mapping
Data management Data management within the programmes has adopted
Open Source technologies, to reduce barriers to uptake at
county levels; software is free and development is
supported by a wider community of software developers.
Data and information collected and capacity created as
part of the programme will contribute to programme’s
sustainability, with the potential to re-use the data for
subsequent programmes and in other contexts. To realise
these benefits the preparatory stage has evaluated data
management issues.

3
The technologies selected to support this participatory
GIS have been based on Open Source software
components; these have been explicitly experimental and
evolved through the programme. Within the preparatory
stages a series of platforms and data management
approaches have been tested using paper mapping,
satellite imagery, crowd-sourcing as part of validation,
update and data dissemination and validation through
the web portal.
ASALs cover a wide, trans-national area with multiple
communities with knowledge of their own
neighbourhood, with their own views of what features
are significant, with varied naming conventions of
features and with inherent geographic variation. These
factors present a further challenge for production of a
coherent dataset across a wide ASAL area. A technical
challenge has been to accommodate loosely structured
datasets that meet the community specification whilst
still allowing for ‘back office’ coordination and
standardisations. The approach adopted has been to use
the Open StreetMap (OSM) model; this has unstructured
data to represent features types by tags, which can be
defined by the community.
As datasets are combined for the wider area the
geographic database moves towards a spatial data
infrastructure. There is a need for a way of identifying
and aggregating similar features at different levels and
displaying these with the same cartographic. For example,
there were differences between the separate district
workshops and even between separate groups within a
single meeting for describing the same feature. In Isiolo
data were exported to OSM XML and JOSM, the OSM
editor, which was used to attribute similar features
through attribute-based rendering of the map data.
Isiolo maps and data Participatory mapping in Isiolo has generated three
principle outputs i) the paper based mapping – as
illustrated in the thematic mapping in this Resource Atlas
of Isiolo County ii) digital GIS data layers for the different
themes of natural resource information and iii) a
prototype web based information portal for wider access
and visualization of the data and information.
Participatory Mapping Workflow
Features, Attributes and
Standards
Collection, Validation and
Verification
Geospatial Data Store
Geospatial infrastructure /
Data management Metadata
Dissemination and Access / Web
Portal / Services
Protocols and regulations
Interfaces / Access / Analysis
Planning / Use
Capacity development
Advocay
Overview of proposed data management for Atlas geospatial data layers
This information can now support the resilience
assessments, total economic valuation studies and can
assist with the spatial targeting of actions within the
community adaptation fund.
Website access and visualisation of the combined mapping layers for part of Isiolo County
A prototype online portal, developed within the Isiolo
project, has initially been built around the ODC Open
Database License that allows the map data to be shared,
copied and adapted, subject to attribution, ‘share-alike’
and ‘keep open’. Similarly, the imagery used within the
portal has adopted the CC-BY-SA, with share, adapt and
commercialization rights subject to attribution and share-
alike conditions.
The wider access to these datasets needs further consultation with the community; current web-hosting of the portal is within GeoData Institute, with the objective to transfer this to a Kenyan host organisation.
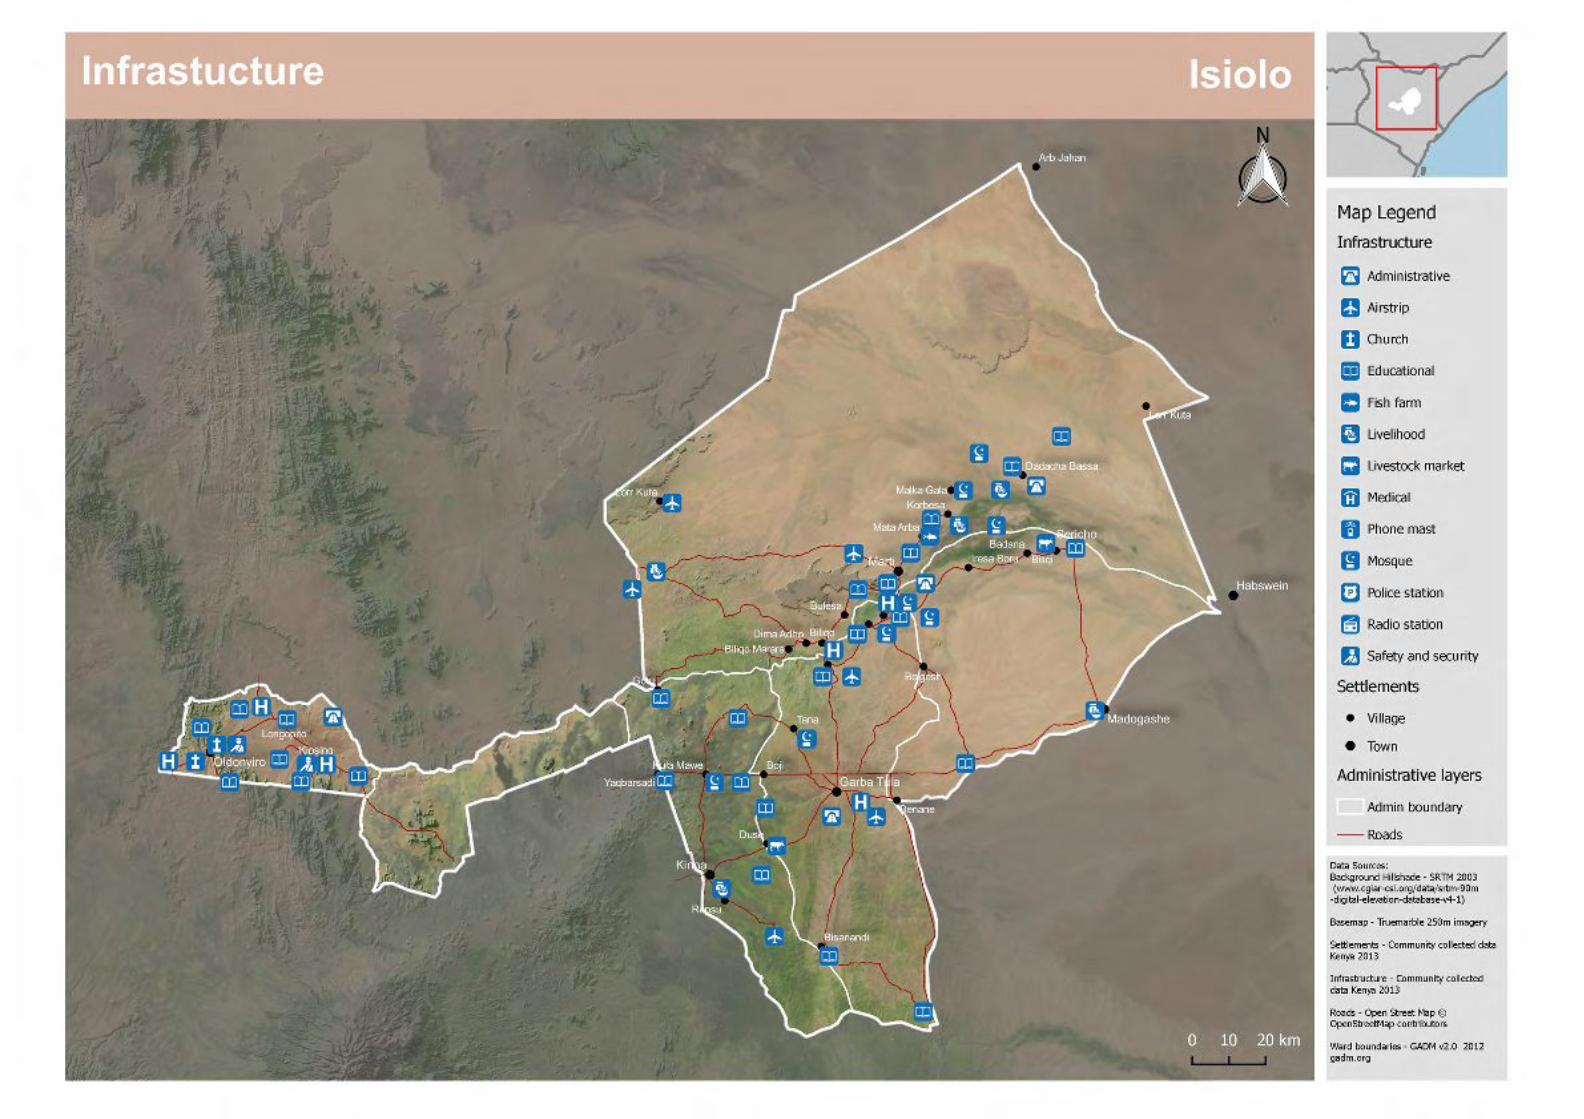
Mapping The following pages contain maps of natural resource
themes for Isiolo County. In each section an overview of
the whole county is shown, followed by larger scale maps
of portions of the county to show as much detail as
possible. Data sources for each mapping section are given
at the front of each thematic section.
At present the Central Ward has yet to conduct the
participatory mapping programme, hence the absence of
data in this area

4

Location
Data Sources
Imagery – Landsat 7 ETM+ Mosaic 2013 NASA Landsat Program
Ward boundaries - GADM v2.0 2012 gadm.org


Infrastructure
Data Sources
Background Hillshade - SRTM 2003 (http://www.cgiar-csi.org/data/srtm-90m-digital-elevation-database-v4-1)
Settlements - Community collected data Kenya 2013
Roads - Open Street Map © OpenStreetMap contributors
Ward boundaries - GADM v2.0 2012 gadm.org


Physical
Data Sources
Background Hillshade - SRTM 2003 (http://www.cgiar-csi.org/data/srtm-90m-digital-elevation-database-v4-1)
Soils, Prominent Hills - Community collected data Kenya 2013
Roads - Open Street Map © OpenStreetMap contributors
Ward boundaries - GADM v2.0 2012 gadm.org


Land Use
Data Sources
Background Hillshade - SRTM 2003 (http://www.cgiar-csi.org/data/srtm-90m-digital-elevation-database-v4-1)
Grazing Areas, Settlements, Forest, Wildlife locations - Community collected data Kenya 2013
Nature Conservancies – The World Database on Protected Areas (WDPA). Cambridge, UK: UNEP-WCMC. www.protectedplanet.net [Accessed May 2012]
Roads - Open Street Map © OpenStreetMap contributors
Ward boundaries - GADM v2.0 2012 gadm.org


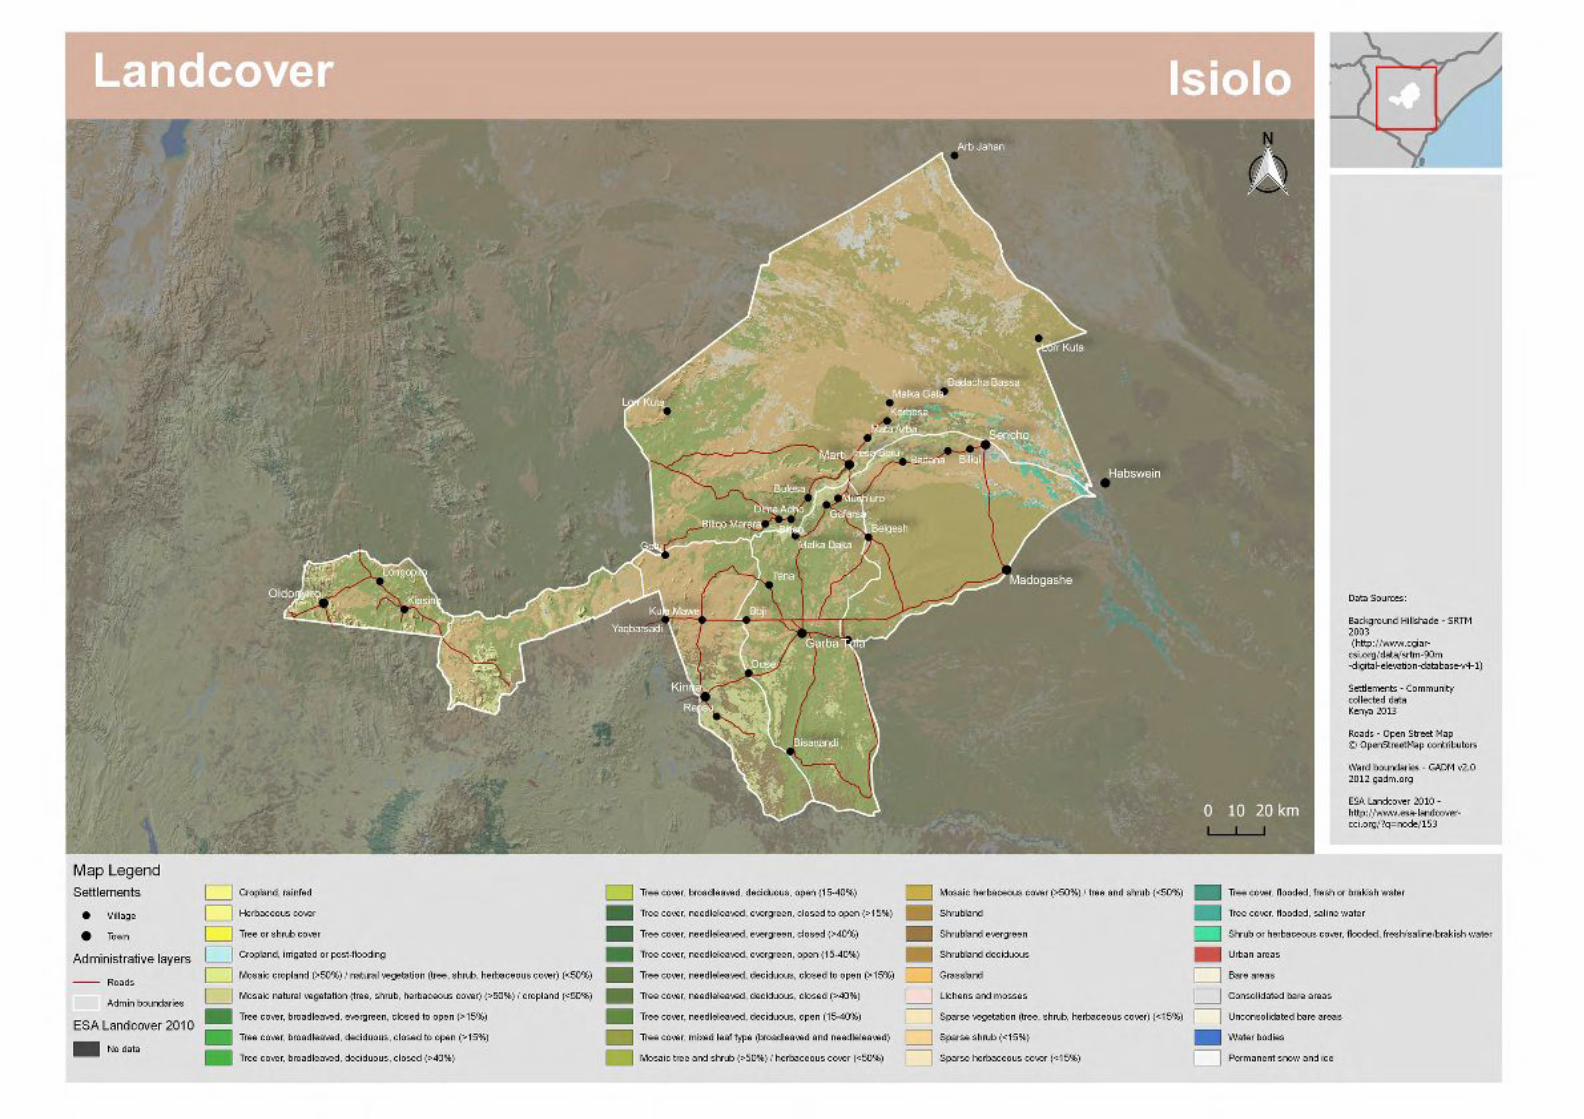
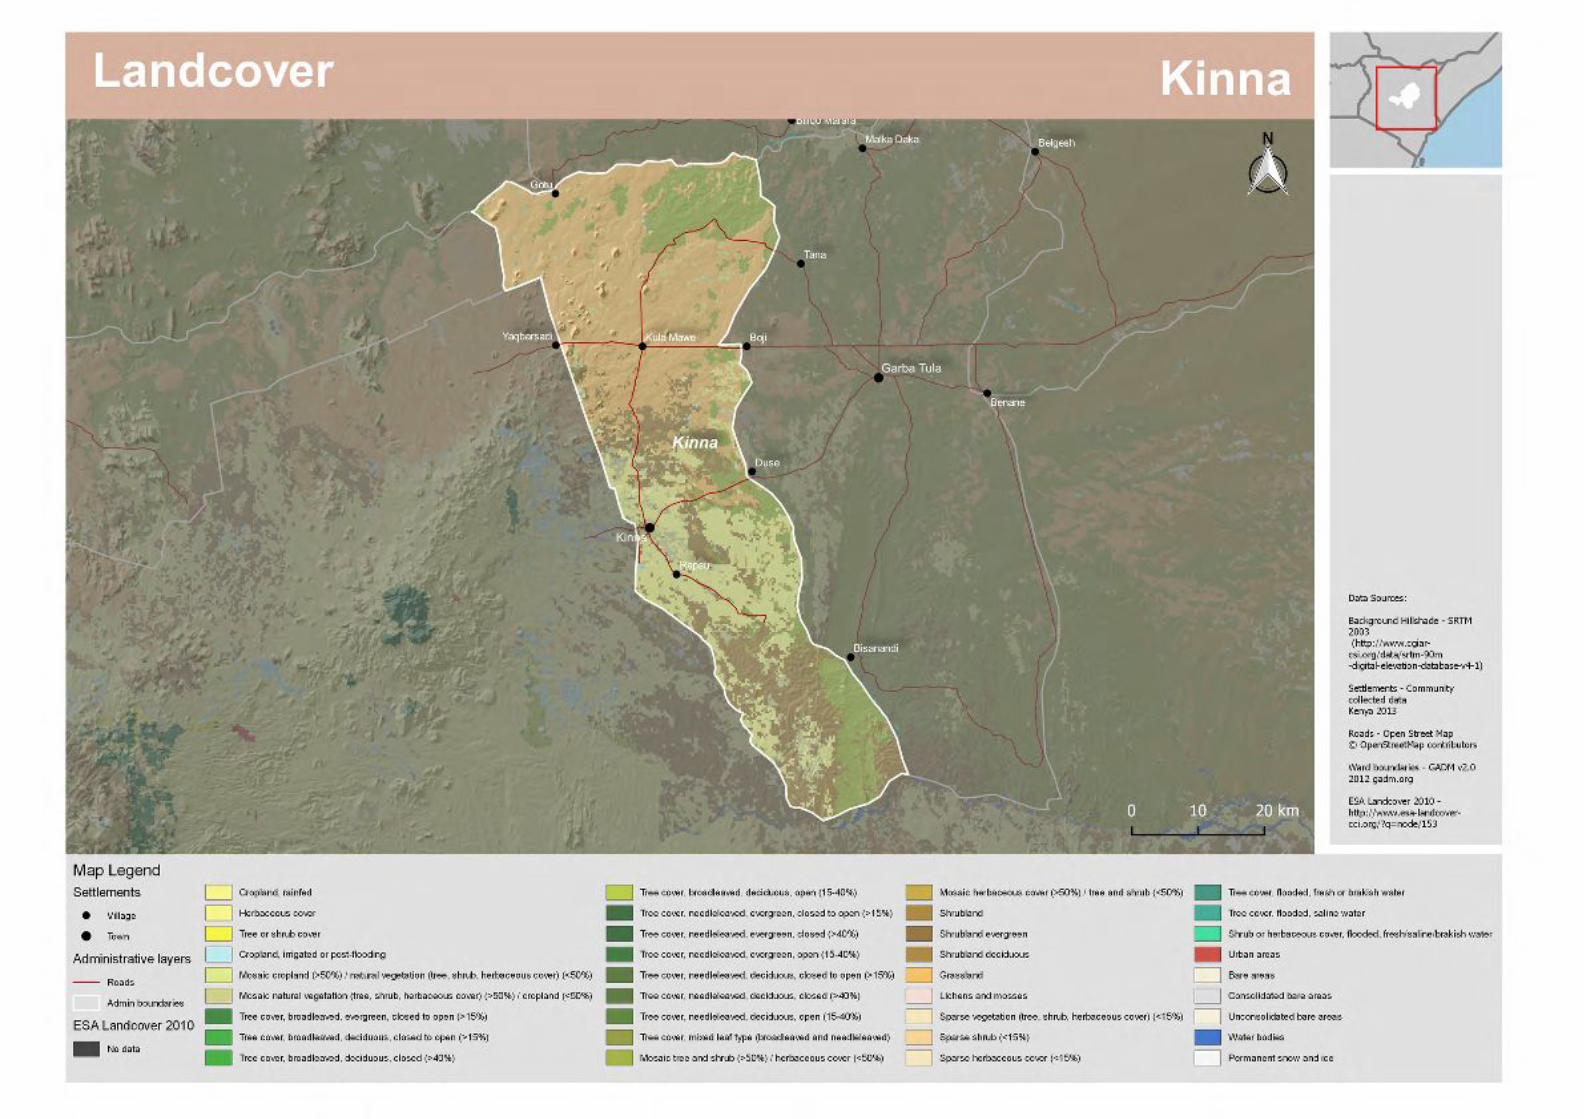
Land Cover
Data Sources
Globcover – Global Land Cover 2009. © ESA 2010 and UCLouvain
Ward boundaries - GADM v2.0 2012 gadm.org


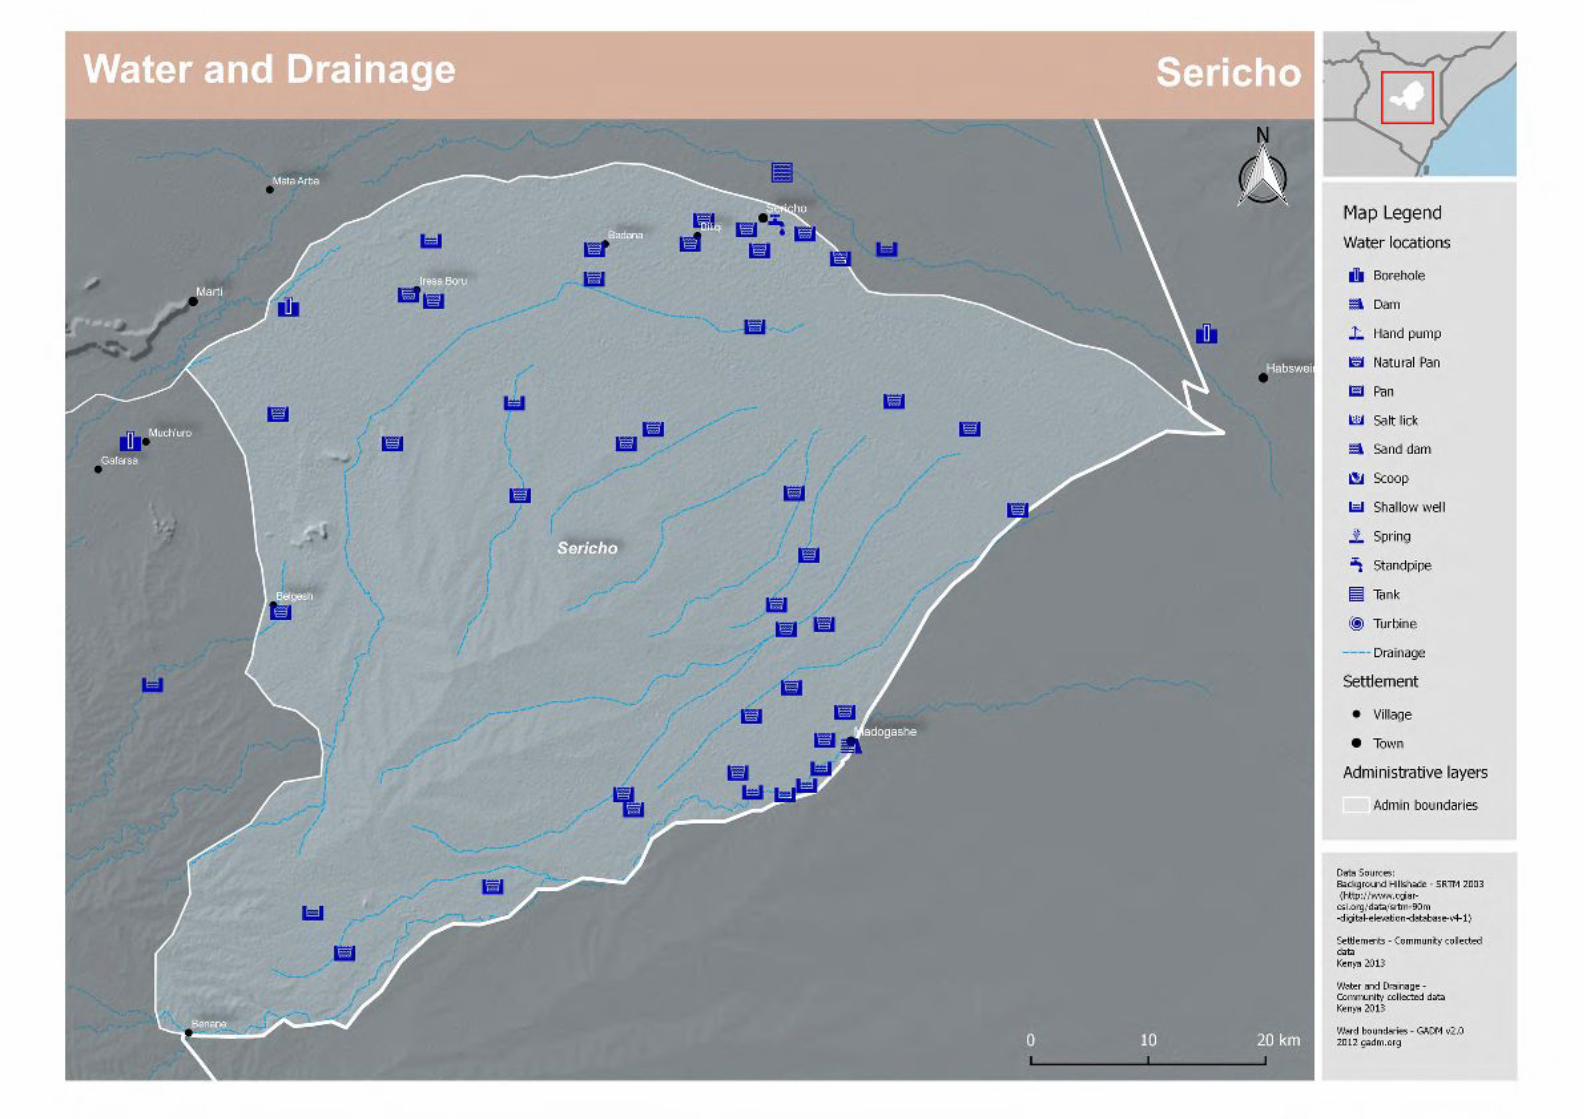
Water and Drainage
Data Sources
Background Hillshade - SRTM 2003 (http://www.cgiar-csi.org/data/srtm-90m-digital-elevation-database-v4-1)
Settlements, Waterpoints, Water features- Community collected data Kenya 2013
Roads - Open Street Map © OpenStreetMap contributors
Ward boundaries - GADM v2.0 2012 gadm.org


Water Point Capacity
Data Sources
Background Hillshade - SRTM 2003 (http://www.cgiar-csi.org/data/srtm-90m-digital-elevation-database-v4-1)
Settlements, Waterpoints, Water features- Community collected data Kenya 2013
Roads - Open Street Map © OpenStreetMap contributors
Ward boundaries - GADM v2.0 2012 gadm.org


Climate Adaptation
Fund Projects
Data Sources
Background Hillshade - SRTM 2003 (http://www.cgiar-csi.org/data/srtm-90m-digital-elevation-database-v4-1)
ICAF Project Locations - Community collected data Kenya 2013
Roads - Open Street Map © OpenStreetMap contributors
Ward boundaries - GADM v2.0 2012 gadm.org

56
The Kenyan Constitution, passed in 2010, foresaw an
increased role for local government, and the devolution
of increased powers to the level of the Counties. Over
the course of 2010, community-consultations assessed
how customary institutions for planning currently
interfaced with government and other institutions.
Traditional grassroots organizations, such as the Dedha,
were observed to have considerable legitimacy and
power at the local level, but were not recognized by the
State. Their activities and membership overlap with
those of the new democratic institutions, including the
elected councils at Ward level.
A series of workshops were held with community and
government participants in early 2011, to design the
institutional structure of a devolved finance mechanism
in keeping with the anticipated county government
structure, and to agree a workplan. The Isiolo Climate
Adaptation Fund (ICAF) was established by
representative County and Ward Adaptation Planning
Committees (CAPC and WAPCs) to finance public good
investments for improved resilience to climate change.
This was supported through a £900,000 accountable
grant from DFID (of which £500,000 was ring-fenced for
the ICAF), with an additional grant of EUR 152,327 from
CORDAID.
CAPC Meeting with Christian Aid
The ICAF established and supported WAPCs from rural
wards to identify, develop and implement priority
projects for adaptation to climate change. The one-off
cost to establish the Fund in Isiolo was £455,687. The
budget placed at the disposal of the WAPCs for the first
round of investments implemented in late 2013 and
early 2014 was £355,796. By August, 2014, all activities
designed by the WAPCs had been implemented and a
2nd round of adaptation investments was under
development.
Samburu women fetching water from the Mokori catchment tank CAF project
The first round included capacity building activities in
four wards (Kinna, Garba Tula, Sericho, and Merti), with
a total combined value of £66,234. The purpose of these
investments was to strengthen customary resource
management institutions, known locally as Dedha. These
institutions enable the communities to cope with
seasonal variability through the designation of areas
with ephemeral water sources for grazing during the wet
season, and others where there are permanent water
sources to be conserved for the dry season and drought
periods.
The capacity building activities included the preparation
and facilitation of strategic processes and meetings to
strengthen the functions of the customary institutions.
The strategies sometimes involved the purchase of
equipment to be used by teams of scouts under the
supervision of the customary institutions. The strategic
activities and purchases were carried out by qualified
NGOs, selected and contracted by the WAPCs for this
purpose.
Kulamawe Livestock handling facility CAF project


The Consortium brings together Christian Aid (CA), International Institute for Environment and Development (IIED), Kenya Meteorological Services (KMS) and UK Met Office. The Consortium is hosted by the National Drought Management Authority. The consortium funded under Strengthening Adaptation and Resilience to Climate Change in Kenya plus (StARCK+) aims at preparing county government to access global climate finance fund in support of adaptation and climate resilient development and to mainstream mechanisms that allow communities to prioritise investments in public goods that build their resilience to climate change. The Adaptation Consortium is funded by UK Aid from the Department for International Development. The Atlas also incorporates the work undertaken by earlier programmes.
Photographs in this Atlas courtesy of James Pattison, Tom Rowley, and RAP
Related Documents