Resource Allocation for Strategic Quality Management: A Goal Programming Approach Hisham Mostafa Alidrisi BSc (Industrial Engineering), MEng (Engineering Management) Griffith School of Engineering Science, Environment, Engineering and Technology Griffith University Submitted in fulfilment of the requirements of the degree of Doctor of Philosophy April 2010

Welcome message from author
This document is posted to help you gain knowledge. Please leave a comment to let me know what you think about it! Share it to your friends and learn new things together.
Transcript

Resource Allocation for Strategic Quality Management:
A Goal Programming Approach
Hisham Mostafa Alidrisi
BSc (Industrial Engineering), MEng (Engineering Management)
Griffith School of Engineering
Science, Environment, Engineering and Technology
Griffith University
Submitted in fulfilment of the requirements of the degree of
Doctor of Philosophy
April 2010

ii
Declaration
This work has not previously been submitted for a degree or diploma in any
university. To the best of my knowledge and belief, the thesis contains no
material previously published or written by another person except where due
reference is made in the thesis itself
Hisham Mostafa Alidrisi
April 2010

iii
Acknowledgements
First, and foremost, praise is due to almighty ALLAH, Who bestowed me to
complete this work. Many thanks are also due to my principal supervisor,
Professor Sherif Mohamed, for providing me with the opportunity to complete
this PhD study under his supervision. I am greatly indebted to Professor
Mohamed for providing the academic and technical assistance. I also
appreciate his unlimited support towards improving my research skills.
Many thanks for his patience, efforts, and valuable guidance.
Special thanks to my wife, Mona, for her patience, care, support, and
continuous encouragement, which enabled me to complete this thesis. Her
sacrifices have not gone unnoticed. Many thanks are also due to my little
son, Abdullah, for being a source of joy, laughter and encouragement
throughout.
I extend special thanks to my mother, Salma, and my father, Mustafa, for
their continuous support and prayers.
I owe my gratitude to my brother, sisters, relatives and friends who have
always encouraged me during the study period.
Many thanks are also due to all individuals (and their respective
organizations) who willingly participated in the questionnaire and the semi-
structured interviews.
Last, but not least, I am indebted to all my RHD colleagues, whether from
the School of Engineering or from other schools, for their lively discussions
and conversations. Thanks to Griffith University for providing such a
stimulating and knowledge-sharing environment.
iv
Abstract
The main aim of this thesis is to assist organizations in understanding the nature of quality management from a resource-based perspective by investigating the relationship between strategies needed to drive quality enhancement, and resources being allocated to support effective strategy implementation. To achieve this research aim, the thesis employs both quantitative and qualitative analysis techniques to give insight into how quality management strategies and resources interact. The thesis argues that organizations may veer away from their quality management implementation plans because of an inherent mismatch between the needed and allocated resources to support strategy implementation. Therefore, a secondary aim of this thesis is to develop a methodology whereby an organization can: 1) determine
how their resources are being allocated to support different quality enhancement strategies, and 2) identify any resource discrepancy between what is needed by a certain strategy, and what is being allocated to it. For any organization, whether small or large, manufacturing or service, Total Quality Management (TQM) is a recognized source of competitive advantage to sustain the organization’s position against its competitors. Benefits of applying TQM have been reported by various industries; in particular, the food-processing industry where quality is a major strategic issue. Food-processing organizations recognize that higher quality leads to better product reputation, increased market share and higher profits. They also operate under strict regulatory requirements, and therefore, adopt formal and disciplined approaches to quality management. Consequently, and keeping the above research aims in mind, this thesis adopts an organizational case study approach to explore quality management resource-strategy interactions, and related resource distribution challenges confronting Quality Departments in two of the largest food-processing organizations in Saudi Arabia. Two broad sets of elements are fundamental to the success of TQM: soft elements (e.g. management commitment, employment empowerment, etc.) and hard elements (e.g. control processes, technology utilization, etc.). Although the literature does not clearly demonstrate which set of elements is more significantly related to business and organizational performance, all TQM elements can be viewed as human, organizational, and technological resources. It is this resource-based view of TQM elements that led this thesis to deal with quality management from a strategic viewpoint, or what is known as Strategic Quality Management (SQM).
Critical review of the SQM literature identified eight strategies as drivers of quality enhancement. These strategies include the continuous: 1) use of human knowledge, 2) control of quality costs, 3) check of failures, 4) transfer of customer feedback, 5) approach towards targets, 6) management of quality information, 7) management of the quality system itself, and 8) the periodical quality appraisal (i.e. auditing). The review also highlighted a lack of theoretical framework or empirical model to examine the various levels of contribution of each strategy towards quality

v
enhancement, or to guide the process of resource allocation among those eight strategies. To bridge these identified research gaps, the thesis adopts a two-phase research methodology. In the first phase, the thesis handles the issue of resource allocation from the perspective of Multi-Criteria Decision Making (MCDM) as two MCDM techniques, namely Analytic Network Process (ANP) and Goal Programming (GP), are employed. In the first step of the first phase, a conceptual framework comprising three clusters (resources, strategies, and ability to enhance quality) has been developed in the form of a multi-criteria decision problem where the ANP was employed to model resource-dependence and resource-strategy interactions. This phase required the development and distribution of a questionnaire targeting managers who worked in the Quality Departments for the two selected organizations. The managers were asked to compare a pair of elements (e.g. resources or strategies) at a time with respect to a control criterion (e.g. supporting a certain strategy or enhancing overall quality). Evaluating the dependence and feedback, among and within the framework clusters, provided a systematic and objective way of deriving the weights to be used for prioritizing strategies (in terms of their individual contribution towards quality enhancement), and determining the relative levels of resource influence on each other, and on strategy implementation. Moreover, this phase identified resource-allocation discrepancies between what each strategy needs and what it actually receives from available resources. The second step of the first phase of the research utilized the output of the ANP analysis as input for a Goal Programming (GP) model to identify to what extent each strategy is under- or over-resourced. The model results indicated that both organizations, despite having different strategy priorities, need to re-allocate their resources to better support their quality enhancement strategies. The model results revealed interesting observations. For instance, one company ranked the strategy of controlling quality costs as having the least ability to enhance overall quality; however, this particular strategy was then found to be over-resourced by as much as 70%. Similarly, in the second company, the strategy of check of failures is the most over-resourced (16.8%), even though it is priority 6 in terms of resources that should be allocated for the eight strategies. In the second phase of the research, a series of semi-structured interviews were conducted with 12 managers working for the two organizations. For each organization, the interviews ascertained how individual quality, supply chain or
information technology managers manage, evaluate, and report the progress of strategy implementation. The interviews’ findings not only shed some light on quality management practices, and resource availability and allocation, but were also used to see if the quantitative output resulting from the developed hybrid ANP-GP methodology would be corroborated. There are two main contributions made by this thesis: 1) contribution to the existing body of knowledge on quality management through the development of a

vi
conceptual framework that explicitly captures the interactions among, and within, quality management resources and strategies, and 2) contribution to current industry practice through the provision of a methodology whereby organizations would identify resource-strategy allocation discrepancies, and hence be able to convey a message to senior management of what resource is needed, and to which strategy the identified resource should be allocated, thus improving the overall level of resource utilization. The proposed methodology relies heavily on the expertise, knowledge and experience of managers. As such, it involves subjective assessment of both qualitative and quantitative factors at a particular organization, as well as pertinent industry or country level variables. Consequently, the findings reported herein can only be analytically generalized in the context of large organizations operating in the Saudi food-processing industry. Nevertheless, the proposed methodology is generic in nature and could be replicated to provide a deliberate and structured approach to resource utilization in the context of implementing quality enhancement strategies.

vii
List of Peer-Reviewed Publications
The following papers were produced to disseminate some results from the
work undertaken by the author during the course of this PhD research.
Journal Paper
1. Alidrisi, H. and Mohamed, S (--). “Resource Allocation for Strategic
Quality Management: A Goal Programming Approach.” International
Journal of Quality & Reliability Management (under review).
Conference Paper
1. Alidrisi, H. and Mohamed, S. (2009). “Resource Allocation for Strategic
Quality Management: An Analytic Network Process (ANP) Model.”
Proceedings of the Fifth International Conference on Construction in the
21st Century (CITC-V), May 20-22, 2009, Istanbul, Turkey, 789-795.

viii
Table of Contents
Declaration ii
Acknowledgements iii
Abstract iv
List of Peer-Reviewed Publications vii
Table of Contents viii
List of Figures xiv
List of Tables xvi
Acronym xviii
Chapter 1: Introduction
1.1 Background 1
1.2 Research Rationale 7
1.3 Research Objectives 16
1.4 Research Design and Methodology 19
1.5 Thesis Organization 20
Chapter 2: Literature Review
2.1 Introduction 23
2.2 Categorization of Resources 23
2.3 The Role of Resources in Strategic Management 27
2.3.1 Definitions of Strategy and Resources 27
2.3.2 Resources as an Internal Power of Organization 30
2.3.3 Resources as a Creator of Competitive Advantage 33
2.2.4 The Strategic Role of the European Foundation
for Quality Management (EFQM) 35
2.4 The Role of Resources in Quality Management 37
2.4.1 Technological Resources and Quality Management 37
2.4.2 Organizational Resources and Quality Management 40

ix
2.4.3 Human Resources and Quality Management 43
2.4.4 TQM Elements as Resources 46
2.5 Strategic Quality Management (SQM) 46
2.5.1 Quality as a Competitive Advantage 47
2.5.2 Linking Quality to Strategy 49
2.5.3 Definition of SQM 51
2.6 Goal Programming and Analytic Network Process
in Resources and Quality Issues 55
2.6.1 GP and ANP/AHP in Resource Allocation 55
2.6.2 GP and ANP/AHP in Improving Quality 57
2.7 Summary 58
Chapter 3: Research Methodology
3.1 Introduction 60
3.2 The Quantitative Phase 60
3.2.1 First Step: The Analytic Network Process (ANP) 63
3.2.1.1 What is ANP? 63
3.2.1.2 Why ANP? 71
3.2.1.3 ANP Analysis 72
3.2.2 The Second Step: The Goal Programming (GP) 75
3.2.2.1 What is Goal Programming (GP)? 75
3.2.2.2 Why GP? 78
3.2.2.3 The GP Model 81
3.3 The Qualitative Phase 83
3.3.1 Semi-Structured Interviews 83
3.3.2 Why Semi-structured Interview? 84
3.3.3 Conducting the Semi-structured Interviews 85
3.4 Summary 86

x
Chapter 4: Research Design
4.1 Introduction 88
4.2 Case Study as a Research Design 89
4.2.1 Case Study Research Questions 91
4.2.2 Case Study’s Propositions 92
4.2.3 Unit of Analysis 94
4.2.4 Logic Linking Data to Propositions
and Criteria for Interpreting the Findings 95
4.3 Why Multiple Cases? 97
4.4 Validity 100
4.5 Reliability 102
4.6 Employing Mixed Methods 105
4.7 Summary 108
Chapter 5: Data Collection
5.1 Introduction 110
5.2 Sampling for the ANP Step 110
5.3 Sampling Strategy 113
5.4 Data Collection and Involvement of Participants 114
5.4.1 Quantitative Phase 114
5.4.2 Qualitative Phase 116
5.5 The Selected Cases/Companies 120
5.5.1 TQM in Saudi Arabia 120
5.5.2 Food Industry in Saudi Arabia 121
5.5.3 Company A 122
5.5.4 Company B 124
5.5.5 Comparing the Selected Companies 126
5.6 Summary 127

xi
Chapter 6: Quantitative Analysis
6.1 Introduction 129
6.2 Company A 130
6.2.1 Results of the ANP Analysis 130
6.2.1.1 RQ1 and RQ2 for Company A 130
6.2.1.2 RQ3 and RQ4 for Company A 132
6.2.2 The Need for GP Model 135
6.2.2.1 Further Explanations for the Strategy of QIM 138
6.2.2.2 Formulation of the GP model 140
6.2.2.3 GP Results and Discussion 143
6.2.2.4 Developing a Strategic Quality Management Index (SQMI) 144
6.2.2.5 Resource Re-allocation 146
6.3 Company B 150
6.3.1 Results of the ANP Analysis 150
6.3.1.1 RQ1 and RQ2 for Company B 150
6.3.1.2 RQ3 and RQ4 for Company B 153
6.3.2 The Need for GP Model 156
6.3.2.1 Further Explanations for the Strategy of CHF 158
6.3.2.2 Formulation of the GP Model 161
6.3.2.3 GP Results and Discussion 163
6.3.2.4 Developing a Strategic Quality Management Index (SQMI) 165
6.3.2.5 Resource Re-allocation 167
6.4 Summary 171
Chapter 7: Qualitative Analysis
7.1 Introduction 173
7.2 Strategies that are Under-resourced - Company A 174
7.2.1 Management of the Quality System (MQS) 174
7.2.2 Checking of Failures (CHF) 177

xii
7.2.3 Approach Towards Target (ATT) 180
7.2.4 Periodical Quality Audit (PQA) 184
7.3 Strategies that are Overloaded by Resources - Company (A) 186
7.3.1 Control of Quality Costs (CQC) 186
7.3.2 Quality Information Management (QIM) 189
7.3.3 Use of Human Knowledge (UHK) 194
7.3.4 Transfer of Customers' Feedback (TCF) 197
7.4 The Road Map for Company A 200
7.4.1 Cooperation 200
7.4.2 Innovation 202
7.4.3 Human Resources 203
7.5 Strategies that are Under-resourced - Company B 204
7.5.1 Control of Quality Costs (CQC) 204
7.5.2 Management of Quality System (MQS) 206
7.5.3 Approach Towards Target (ATT) 209
7.5.4 Transfer of Customers’ Feedback (TCF) 211
7.5.5 Quality Information Management (QIM) 214
7.6 Strategies that are Overloaded by Resources in Company (B) 217
7.6.1 Checking of Failures (CHF) 217
7.6.2 Periodical Quality Audit (PQA) 220
7.6.3 Use of Human Knowledge 222
7.7 The Road Map for Company B 225
7.7.1 Commitment 226
7.7.2 Overlap in Responsibilities 227
7.7.3 Balancing Human, Organizational, and Technological Resources 228
7.8 Summary 229

xiii
Chapter 8: Final Discussion and Conclusion
8.1 Introduction 230
8.2 Discussion 231
8.2.1 RQ1 and RQ2 231
8.2.1.1 Relative Contribution of Resources Needed to Ensure
Successful Strategy 231
8.2.1.2 Overall Contribution Made by Each Resource Type 236
8.2.2 RQ3 and RQ4 237
8.2.3 Soft and Hard TQM 243
8.2.4 RQ5 245
8.2.4.1 Overload and Shortage of Resources 245
8.2.5 RQ6 248
8.3 Conclusion 251
8.3.1 Research Contribution 251
8.3.2 Implication for Food-processing Companies in Saudi Arabia 254
8.3.3 Study Limitations and Directions for Future Research 256
8.3.3.1 Limitations and Directions for Future Research for the Proposed ANP-GP Methodology 258
8.4 Closure 259
References 261
Appendix A Categorization of TQM Critical Elements 285
Appendix B The Questionnaire 290
Appendix C The Prepared Questions for Interviews 298
Appendix D Case Study Protocol 300

xiv
List of Figures
Figure (1.1): Illustration of how research rationale
is developed from the Literature 15
Figure (1.2): Thesis Layout and Chapters 22
Figure (3.1) How the Six Research Questions are Addressed
within the Two Phases of this Research 62
Figure (3.2): The Structure of AHP 65
Figure (3.3): Calculations of AHP 66
Figure (3.4): Example of ANP 69
Figure (3.5): The ANP Analysis 73
Figure (3.6): The Proposed Hybrid ANP-GP Methodology 82
Figure (4.1): The Mixed Method Design of the Case Study in this Research 109
Figure (6.1): The Proposed GP Model for Company A 142
Figure (6.2) Results of the GP Model for Company A 144
Figure (6.3): The Modified GP Model for Company A 149
Figure (6.4): The Results of the Modified GP Model for Company A 150
Figure (6.5): The Proposed GP Model for Company B 163
Figure (6.6): Results of the GP Model for Company B 164
Figure (6.7): The Modified GP Model for Company B 169
Figure (6.8): The Results of the Modified GP Model for Company B 170
Figure (8.1): RQ1’s Findings 232
Figure (8.2): The Needed HR for each Strategy in Companies A and B 233
Figure (8.3): The Needed OR for each Strategy in Companies A and B 233
Figure (8.4): The Needed TR for each Strategy in Companies A and B 234
xv
Figure (8.5): Combining Findings of RQ1 and RQ2
for both Companies (A and B) 235
Figure (8.6): HR Support for each Strategy in Companies A and B 238
Figure (8.7): OR Support for each Strategy in Companies A and B 239
Figure (8.8): TR Support for each Strategy in Companies A and B 239
Figure (8.9): RQ4’s Findings for Companies A and B 240
Figure (8.10): Combining Findings of RQ3 and RQ4
for both Companies (A and B) 241
Figure (8.11): Summary of the RQ5’ Findings 247
Figure (8.12): Merging findings of RQ5 and RQ6 in Company A 249
Figure (8.13): Merging findings of RQ5 and RQ6 in Company B 250

xvi
List of Tables
Table (1.1): Critical Strategies to Enhance Strategic Quality Management
(source: Aravindan et al. (1996)) 12
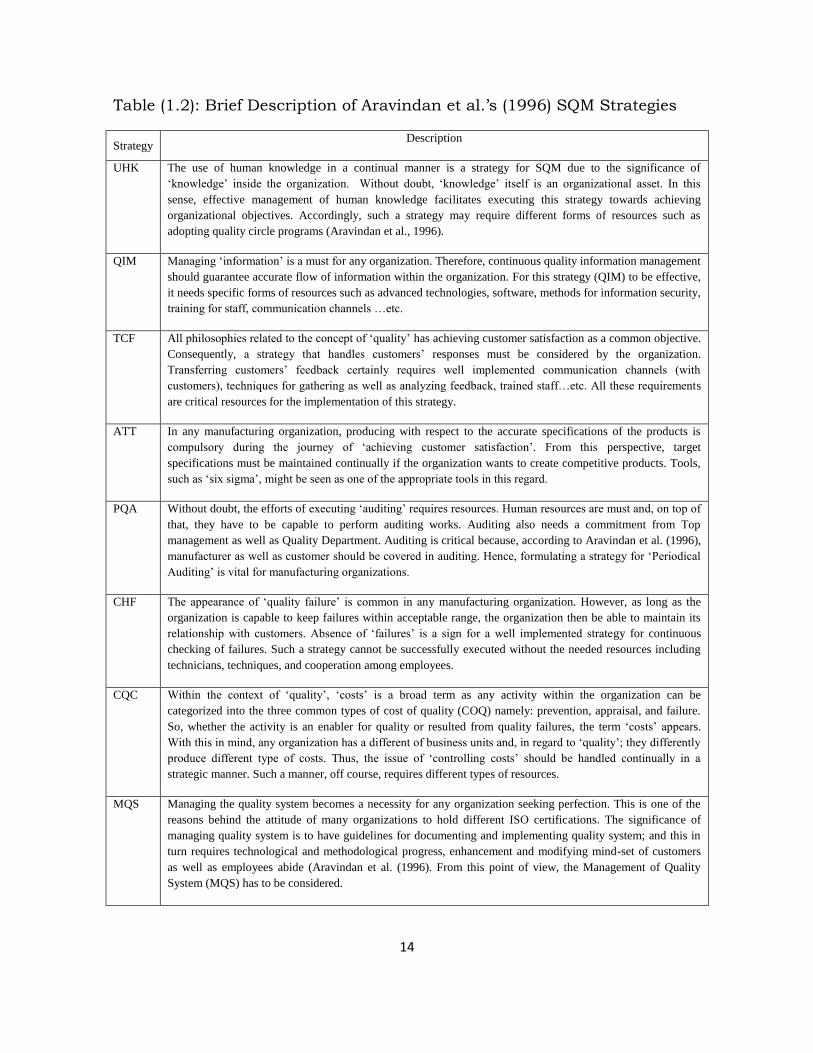
Table (1.2): Brief Description of Aravindan et al.’s (1996) SQM Strategies 14
Table (2.1): SQM Elements 54
Table (3.1) Saaty’s (1996) scale for pair wise comparison 64
Table (3.2): The Form of the Supermatrix 70
Table (3.3): Steps of the ANP 71
Table (3.4): Steps for Formulating a GP Model
summarized by Anderson et al. (2003) 79
Table (5.1): Experts Participants from Company A 118
Table (5.2): Experts Participants from Company B 119
Table (6.1): Relative contributions of each pair
of resources to support the third type of resource (RQ1) 131
Table (6.2): Relative contribution of resources needed
to ensure successful strategy implementation (RQ2) 132
Table (6.3): Overall contribution made by
each resource type (combining RQ1 and RQ2) 132
Table (6.4): The relative actual supports
of HR, OR, and TR for the eight critical strategies (RQ3) 134
Table (6.5): The relative contributions of each
critical strategy to quality enhancement (RQ4) 134
Table (6.6): Resource-based prioritization of the
eight critical strategies (combining RQ3 and RQ4) 135

xvii
Table (6.7): Relative actual supports received by
each critical strategy (Normalized version of Table (6.4)) 136
Table (6.8): Calculation and normalization of the needed
resources as portions of the available resources 139
Table (6.9): Relative contributions of each pair
of resources to support the third type of resource (RQ1) 152
Table (6.10): Relative contribution of resources needed
to ensure successful strategy implementation (RQ2) 152
Table (6.11): Overall contribution made by
each resource type (combining RQ1 and RQ2) 153
Table (6.12): The relative actual supports
of HR, OR, and TR for the eight critical strategies (RQ3) 154
Table (6.13): The relative contributions of each
critical strategy to quality enhancement (RQ4) 155
Table (6.14): Resource-based prioritization of the
eight critical strategies (combining RQ3 and RQ4) 155
Table (6.15): Relative actual supports received by
each critical strategy (Normalized version of Table (6.12)) 157
Table (6.16): Calculation and normalization of the needed
resources as portions of the available resources 160
Table (7.1): Critical Strategies to Enhance
Strategic Quality Management (source: Aravindan et al. (1996)) 174

xviii
Acronym
Quality Management: QM Quality Management TQM Total Quality Management SQM Strategic Quality Management MQS Continuous Management of Quality System CHF Continuous Checking of Failures ATT Continuous Approach Towards Target PQA Periodical Quality Audit (for customer and manufacturers) TCF Continuous Transfer of Customers’ Feedback UHK Continuous Use of Human Knowledge QIM Continuous Quality Information Management
CQC Continuous Control of Quality Costs SASO Saudi Arabian Standards Organization ISO International Organization for Standardization OHSAS Occupational Health and Safety Standards HACCP Hazard Analysis and Critical Control Point BRC British Retail Consortium BSI British Standards Institution SPS Statistical Process Control QFD Quality Function Deployment QC Quality Control QCS Quality Control Systems QA Quality Assurance TQC Total Quality Control PTR Product Technical Requirements HOQ House of Quality TQHRM Total Quality-Oriented Human Resources Management SQMI Strategic Quality Management Index Strategic Management: SM Strategic Management HR Human Resources OR Organizational Resources TR Technological Resources SWOT Strengths, Weaknesses, Opportunities, and Threats
RBV Resource-Based View General: IT Information Technology HRM Human Resource Management WTO World Trade Organization
xix
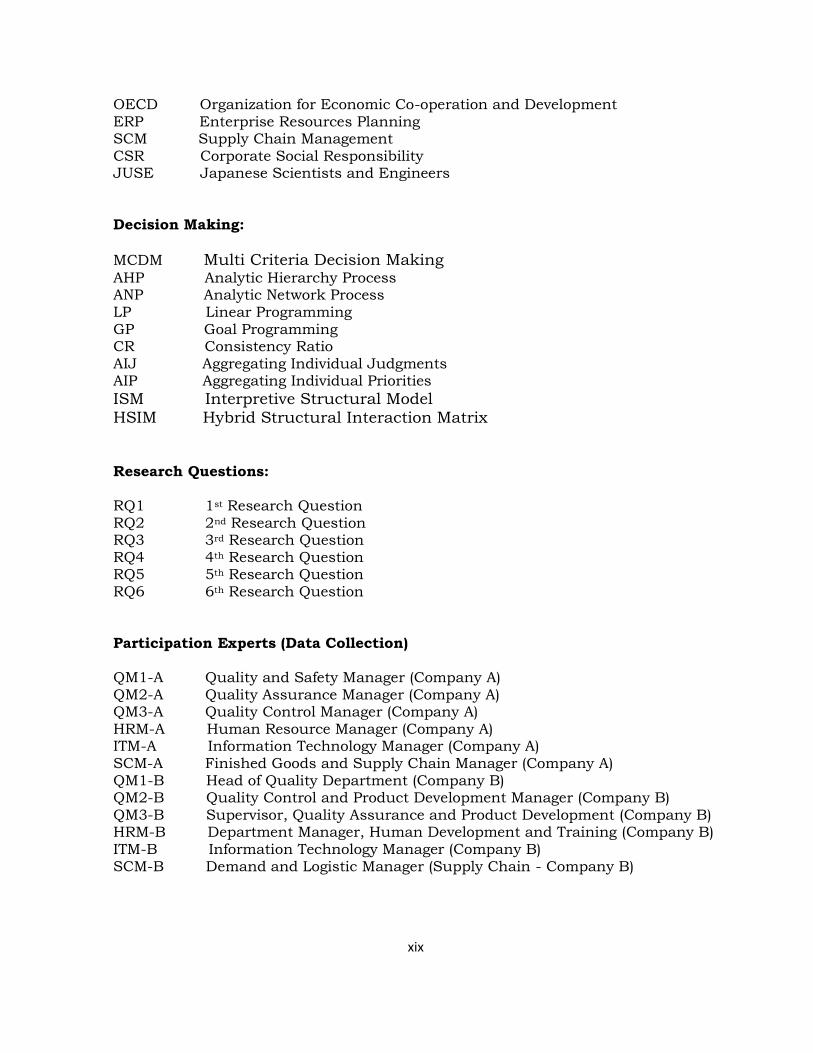
OECD Organization for Economic Co-operation and Development ERP Enterprise Resources Planning SCM Supply Chain Management CSR Corporate Social Responsibility JUSE Japanese Scientists and Engineers Decision Making:
MCDM Multi Criteria Decision Making AHP Analytic Hierarchy Process ANP Analytic Network Process LP Linear Programming GP Goal Programming CR Consistency Ratio AIJ Aggregating Individual Judgments AIP Aggregating Individual Priorities
ISM Interpretive Structural Model HSIM Hybrid Structural Interaction Matrix
Research Questions: RQ1 1st Research Question RQ2 2nd Research Question RQ3 3rd Research Question RQ4 4th Research Question RQ5 5th Research Question RQ6 6th Research Question Participation Experts (Data Collection) QM1-A Quality and Safety Manager (Company A) QM2-A Quality Assurance Manager (Company A) QM3-A Quality Control Manager (Company A) HRM-A Human Resource Manager (Company A) ITM-A Information Technology Manager (Company A) SCM-A Finished Goods and Supply Chain Manager (Company A) QM1-B Head of Quality Department (Company B) QM2-B Quality Control and Product Development Manager (Company B)
QM3-B Supervisor, Quality Assurance and Product Development (Company B) HRM-B Department Manager, Human Development and Training (Company B) ITM-B Information Technology Manager (Company B) SCM-B Demand and Logistic Manager (Supply Chain - Company B)

1
1.1 Background
During the last century, the world has been strongly affected by the
industrial evolution, during which a huge number of organizations were
established. Moreover, the competition between these organizations has
grown rapidly. Organizations have worked towards perfection, which has
resulted in the appearance of many industrial and managerial concepts.
One of these concepts is quality management. Indeed, the importance of
quality management comes from its direct effect on products and services.
Sales, market share, customer loyalty and other elements are also affected
directly or indirectly by quality. Different concepts have appeared since the
evolution of quality, including Quality Control (QC), Quality Assurance
(QA), Total Quality Control (TQC), and Total Quality Management (TQM).
TQM appeared in 1949 when the Union of Japanese Scientists and
Engineers (JUSE) decided to concentrate on “improving Japanese
productivity” (Powell, 1995). Since that time, the contributions of TQM in
different organizations has been confirmed by various studies that link
organizational performance to TQM (Douglas and Judge, 2001).
According to the literature on TQM, its critical elements can be separated
into two main categories: soft elements and hard elements (Wilkinson et
Chapter
1
Introduction

2
al., 1998). These two categories are also known as the philosophical side
(soft) and technical side (hard) of TQM (Vouzas and Psychogios, 2007).
These two sides of TQM are included in all TQM definitions. Indeed,
Rahman (2004) reported that the TQM literature views TQM as a
managerial methodology that aims to develop the performance of
organizations through mixing “technical and behavioural” themes. Soft
elements are “the behavioral aspects of management” (Rahman, 2004) that
can be represented by “management concepts and principles” (Vouzas and
Psychogios, 2007), such as leadership, human resource management
(Rahman, 2004), employee empowerment (Powell, 1995; Rahman, 2004),
executive commitment, open organization (Powell, 1995), employee
involvement, creating a shared vision, and customer focus (Dow et al.,
1999). In contrast, hard elements of TQM refer to “management tools and
techniques” (Vouzas and Psychogios, 2007), such as process management
tools and methods, JIT (Just-in-time) practices (Rahman, 2004),
benchmarking (Powell, 1995; Dow et al., 1999a; Rahman, 2004),
manufacturing technologies (Powell, 1995; Dow et al., 1999), process
improvement and improved measurement (Powell, 1995).
Generally, most empirical studies have shown that the soft elements of
TQM affect organizational performance more significantly than the hard
elements of TQM. For example, Hart and Schlesinger (1991) believe that
human resource (HR) activities should lead quality efforts and reported
that the Malcolm Baldrige National Quality Awards framework supports
this perception and helps HR experts to allocate corporate resources
towards quality objectives. Similarly, Bowen and Lawler (1992) emphasized
that HR and TQM should not act separately and proposed the so-called
total quality-oriented human resources management (TQHRM). Powell
(1995) identified that, even though quality tools and techniques are a must
for TQM to succeed, these techniques cannot provide the desired results

3
without the existence of soft elements such as “executive commitment …
and employee empowerment”. Further, he added that soft elements can
“produce success with or without formal TQM adaptation”. He argued that
this is similar to the resource-based theory suggestion that organizations
should focus on the culture in which the quality tools and techniques can
succeed. Also, Dow et al. (1999) discovered that soft elements, such as
employee commitment, shared vision, and customer focus, are positively
related to better-quality results. Ahire et al. (1996) postulated that human
resources are the main drivers for TQM strategies to be implemented. More
specifically, they identified that aspects of HRM, such as employee
empowerment, employee participation, and technical training, are
important in forming an ideal environment for QM. Samson and
Terziovski‟s (1999) findings were consistent with the overall TQM
perception that the soft side of TQM has a greater influence on
performance than the hard side. In particular, they found that leadership,
management of people, and customer focus are specifically related to the
performance. Recently, Soltani et al. (2004) reported that the success of
TQM in achieving better customer satisfaction is linked to HR performance
because the hard side of TQM cannot lead to the success of TQM alone.
Bou and Beltrán (2005) concluded that theories, as well as practice,
support the importance of the social side of the TQM (i.e. the
organizational) and the HR activities as being vital for TQM to be
implemented and performed successfully.
However, if TQM is only influenced by soft elements, the logical question
is: what do the hard elements of TQM do? (Rahman, 2004). The answer
could be as Tari (2005) stated, that “TQM is much more than a number of
critical factors; it also includes other components, such as tools and
techniques for quality improvement”. According to Tari, although TQM
tools and techniques are derived from the critical elements of TQM, these

4
tools and techniques are a must for TQM to be implemented. In fact,
Rahman (2004) supported this point when he argued that Statistical
Process Control (SPC) and other quality techniques have been blended
together to form what is now known as TQM. He also emphasized that,
according to the TQM‟s literature, TQM can be viewed as a “management
approach” that includes a range of “technical and behavioral” themes that
aim for better performance for the organization. Indeed, latter definitions of
TQM reveal that it is much more than a set of tools and techniques; it is a
mixture of technical systems as well as social systems (Vouzas and
Psychogios, 2007).
The significance of the soft TQM elements does not mean that the hard
elements are not essential. From the literature, it can also be noted that
many quality tools represent the roots of TQM. Powell (1995) reported that
TQM studies concentrated generally on TQM methods rather than the
organizational/workplace environment surrounding these methods.
Rahman and Bullock (2005) also stated that the literature on TQM
emphasized that the hard side of TQM also has a significant influence on a
firm‟s performance. In particular, Rahman and Bullock (2005) recently
identified positive relationships between Just-In-Time (JIT) principles and
four TQM measures. They also found that three TQM measures are
significantly correlated with two hard elements: technology utilization, and
continuous improvement enablers. Therefore, they concluded that:
… certain hard TQM elements have a significant effect on
performance and … for hard TQM to impact performance, it is
essential that such hard elements are supported by the
elements of soft TQM.
5
Most recently, Lewis et al. (2006) developed an Analytic Hierarchy Process
(AHP) model for TQM elements in small and medium-sized enterprises
(SME). They found that 65 per cent of the implemented elements were
hard, while 35 per cent were soft. These results conflict with those of
Powell (1995), Ahire et al. (1996), Dow et al. (1999), and Samson and
Terziovski (1999) which show that the hard elements of TQM do not
significantly affect organizational performance.
In practice, it is also difficult to ignore the success of hard elements in
several well-known companies. This is because these successful practices
provide realistic evidence for the importance of such elements. For
instance, Honda faced a technical problem in their painting department in
the United States of America (USA) when one painting line consumed
significant amount of pigmentation compared to the other painting line
(Maul and Gillard, 1994). Maul and Gillard (1994) reported that significant
expenses were reduced by solving the problem through the use of basic
quality tools and techniques that eliminated various causes of the
problem. Moreover, in 1987, Motorola reduced variation by introducing Six
Sigma as an effective quality tool (Smith et al., 1993). Additionally, to
attain the main strategic objective of Six Sigma, Motorola also applied
Statistical Process Control (SPC) as a technique to formulate their strategy,
looking for zero defects (Kumar and Gupta, 1993). In fact, in a theoretical
and mathematical sense, the SPC permits a better understanding of
systems‟ variations (Rahman, 2004). There are many other respected
companies such as General Electric, AlliedSignal (Honeywell), ABB,
Lockheed Martin, Polaroid, Sony, Honda, American Express, Ford, Lear
Corporation and Solectron, who are employing Six Sigma to minimize the
variation in their different processes (Klefsjo et al., 2001).

6
Another example, reported by Taguchi and Clausing (1990), related to Ford
asking Mazda to produce additional transmissions. They noticed that
although Ford applied the principles of zero defects, Ford's transmissions
generated more customer complaints and costs than Mazda's
transmissions, which were near to the target. From this observation,
Taguchi has formulated his loss function. Benton (1991) noted that “this
loss reduces to zero, when the production process manufactures at exactly
the target value”.
Quality Function Development (QFD), as a quality tool, also has a similar
importance level. QFD initially appeared in Japan‟s heavy industries when
Mitsubishi implemented the technique in 1972 (Clausing and Hauser,
1988). It was reported that Toyota applied QFD and 60% of its production
costs were subsequently reduced during 1977-1984. Additionally, many
well-known companies use QFD as part of their quality program, including
Digital Equipment, Hewlett-Packard, AT&T, ITT, Ford, General Motors
(Clausing and Hauser, 1988; Prasad, 1998) “Procter and Gamble” and
Baxter Healthcare (Prasad, 1998).
Therefore, it seems that the hard side and the soft side of TQM shares
almost the same importance level. Although several research outcomes
found that the hard elements of TQM are not strongly related to
organizational performance (Powell, 1995; Ahire et al., 1996; Dow et al.,
1999; Samson and Terziovski, 1999), the hard techniques of TQM, such as
SPC, Six Sigma, seven simple tools, QFD, and the Taguchi function, also
have a significant impact on organizational performance (Rahman, 2004).
The hard elements have also succeeded in practice. Thus, regardless of
which side of the TQM is more critical, the quality literature shows that
both the hard side and the soft side of TQM need each other to achieve
effective TQM. To illustrate this point, although Ahire et al. (1996)
7
concluded that the effects of the hard side of TQM are not strongly related
to the quality of the product, the indirect effect of such hard elements need
qualified employees (soft elements) to use and activate these tools (hard
elements). Additionally, unlike Powell (1995), Ahire et al. (1996), and
Samson and Terziovski (1999), Rahman (2004) recently proposed a model
that grouped all the TQM elements into two categories (soft and hard),
rather than investigating the effect of each element independently. This
attempt is similar to that undertaken by Dow et al. (1999) and Rahman
and Bullock (2005). Rahman (2004) attempted to explain the relationship
between soft TQM, hard TQM and performance. He proposed that soft
elements have two functions. Firstly, soft elements affect have an indirect
effect on performance through their responsibility to build a suitable
environment for the hard TQM that consequently has a direct effect on
performance. Secondly, soft elements directly affect performance in a
similar way to the traditional role HR plays in organizations. Thus, even
though the soft side or the hard side is found to be more critical than the
other, the interaction between them implies that the success of one side of
TQM is as a result of (or results in) the success of the other. This attests to
the way the soft elements and the hard elements need each other.
1.2 Research Rationale
The previous discussion highlights how experts in quality research
disagree about which TQM elements are more critical for organizational
performance. Indeed, “there is no agreement between researchers and
practitioners as to which elements are actually implemented in the
organization when a TQM system is set up” (Montes et al., 2003). Even
within these elements, the soft side itself is not accurately defined. To
illustrate this point, Vouzas and Psychogios (2007) noted that:
8
There is a general disagreement of what exactly composes the
“soft” side of TQM … while it is feasible to measure people’s
awareness of the “hard” aspects of TQM, it is quite problematic
to assess their actual understanding of its “soft” principles.
They added that this leads to the lack of a commonly accepted framework
for TQM. Further, as stated by Tari (2005), “there is no unique model for a
good TQM programme; and TQM is a network of interdependent
components, namely critical factors, practices, techniques and tools”. This
appears to be because “one of the main difficulties in the identification of
critical elements is the basis of defining these elements before they become
critical” (Rahman, 2004). Hence, due to the lack of appropriate attempts
that show the relations between soft and hard elements of TQM, Rahman
(2004) suggested future research should “rediscover the link between soft
TQM and hard TQM”.
With this in mind, this research endeavours to gain a better understanding
of the nature of TQM elements by focusing on the roots from which these
elements come. Once these roots are defined, the resulting definitions are
considered as the best representative of the TQM elements. Fortunately,
the TQM literature supports the perspective that all TQM elements can be
viewed as resources; namely, technological, organizational and human
resources (not listed here in specific order). Technological resources (TR)
can be said to stand for hard elements, while soft elements can be
represented by both organizational resources (OR) and human resources
(HR). To illustrate, TR can be defined as “information, equipment,
techniques and processes required to transform inputs into outputs in an
organization” (Robbins and Barnwell, 2002). From this definition, it is clear
that the hard elements of TQM are, in reality, TR. Indeed, Zbaracki (1998)

9
labels this category as technical TQM. On the other hand, OR are defined
as organizational aspects including history, culture, management systems,
policies, and formal and informal relationships (Barney, 1991; Barney,
1995). Many soft elements of TQM fit with this definition, including
leadership, supplier relations and customer relations. HR as a
organizational manpower (Daft, 2003) or as organizational functions that
deal with people (Tracey, 2003), can also be considered as soft elements of
TQM and include human resource management, training and
empowerment. The aforementioned definitions of TR, OR, and HR clearly
highlight the significant role of such resources in quality management
(QM).
In addition, a better knowledge of resources reveals that their strategic
importance, or what is referred to here as the role of resources in strategic
management (SM), is a reasonable issue to be considered. In other words,
the acceptance of the role of resources in QM implies that their strategic
importance cannot be ignored. Obviously, resources have been referred to
in SM definitions (Schendel and Hofer; 1978, Newman et al., 1985;
Chandler, 1990). Additionally, the strategic importance of resources
ensured their consideration as an internal organizational power (Barney,
1986; Grant, 1991; Lo´pez, 2005), through which the concept of the
Resource-Based View (RBV) obtained its recognition (Fahy, 2000;
Montealegre, 2002; Coates and McDermott, 2002; Finney et al., 2005).
Thus, resources can be considered as a source of competitive advantage
(Grant, 1991; Barney, 1991; Barney, 1995; Hill and Jones, 2004; Collis
and Montgomery, 2005).
As a consequence, in this research, accepting the important role of
resources in both QM and SM results in the perception that it is more
reasonable to deal with QM from a strategic point of view, or what is

10
known as a Strategic Quality Management (SQM), rather than TQM. Not
only does the role of resources in QM and SM justify this perception, its
emphasis within the SM literature reveals that resources are vital for any
strategy, and especially in generating a firm‟s competitive advantages. This
means that any strategy cannot be formulated without the existence of
resources. Hill and Jones (2004) reported that:
Distinctive competencies shape the strategies that the company
pursues, which lead to comparative advantage and superior
profitability. However, it is also very important to realize that
the strategies a company adopts can build new resources and
capabilities or strengthen the existing resources and capabilities
of the company, thereby enhancing the distinctive competencies
of the enterprise. Thus, the relationship between distinctive
competencies and strategies is not a linear one; rather, it is a
reciprocal one in which distinctive competencies shape
strategies, and strategies help to build and create distinctive
competency
As a result, soft elements and hard elements under the umbrella of TQM
are not appropriate to show an interaction between resources and
strategies. This is not to say that TQM is unsuccessful, expressly, but that
SQM provides a more appropriate explanation or description of how such
resources can interact with quality strategies. Moreover, the SQM
literature stresses the notion that quality should be linked to strategy.
Thus, Aravindan et al. (1996) advocated that strategies are essential for
quality to be improved. They identified eight critical strategies for quality
enhancement. However, although SQM is not a new concept, much
attention has been given to TQM. Focusing on TQM rather than SQM may
provide a reasonable explanation as to why quality gurus do not agree on

11
which side of TQM (hard or soft) is more significant for organizational
performance.
In fact, Aravindan et al. (1996) identified eight critical strategies for quality
enhancement by which SQM can be defined (Their detailed definition of
SQM is provided in Chapter 2.). They reported that quality gurus always
link traditional approaches, such as “company-wide quality control”, TQM,
and so on, in their attempt to define SQM. Thus, they stated that:
The fundamental weakness behind these traditional
approaches is that they are not supported by clear definitions.
Also, critical studies made on these approaches by the authors
and other researchers indicated that none of these approaches
is found to be complete and focused in attaining vital quality
strategies.
Regarding these critical strategies, Senthil et al. (2001) reported that
Aravindan et al.‟s theoretical model of SQM is “most exhaustive”. From this
point of view, the strategies shown in Table (1.1) will be selected for the
purpose of this research. These strategies are also briefly described in
Table (1.2) within the context of their connection to this research.
Figure 1.1 shows that resources can be seen as an umbrella under which
QM and SM are overlapped. QM‟s critical elements can be grouped into
human, organizational, and technological resources. From the perspective
of SM, these resources are vital in defining any strategy. They are
considered as an internal power and as source of competitive advantage
for any firm. Figure (1.1) summarizes the rationale of this research and the
next chapter covers the issues presented in Figure (1.1) in further details.

12
The eight strategies and the three types of resources represent the base
from which the proposed research questions are developed.
Table (1.1): Critical Strategies to Enhance Strategic Quality Management
(source: Aravindan et al. (1996))
Critical Strategy Acronym
Continuous management of quality system MQS
Continuous checking of failures CHF
Continuous approach towards target ATT
Periodical quality audit (for customers and manufacturers) PQA
Continuous transfer of customers' feedback TCF
Continuous use of human knowledge UHK
Continuous quality information management QIM
Continuous control of quality costs CQC
This research suggests investigating the interaction between the three
types of resources (HR, OR, and TR) and the eight critical strategies of
SQM enhancement in Table (1.1) to obtain a deeper understanding of how
SQM is practically implemented. Consequently, it is proposed that the
needed resources for each strategy should be identified first. This is
important to identify the overall available resources HR, OR, and TR in a
certain company.
To illustrate, the interaction between resources and strategies reveals that
each strategy will have its own need for HR, OR, and TR in the company;
regardless of the needs of the remaining seven strategies. For example, it
might be found in a certain company that the strategy of QIM may need TR
more than HR and OR resources. On the other hand, another strategy

13
such as UHK, for example, may see HR as the most important type of
resources for success, followed by OR and TR. With this in mind, there are
eight strategies under investigation, which confirms the complexity of the
issue. This situation also reveals that identifying the relative significance of
the overall available HR, OR, and TR by prioritizing the critical type of
resources with respect to the need of each single strategy is a multi-criteria
decision making (MCDM) issue. This will be addressed in this research.
Moreover, there is another factor that supports the MCDM nature of this
issue. Regardless of the needed amount of HR, OR, and TR for each
strategy, the actual support in practice from each type of resources toward
each strategy may not be an exact reflection of what is needed by each
strategy. The support of human resources toward the strategy of QIM in
practice, for example, might be different (more or less) to what is needed by
QIM as a human resource. All remaining strategies are in the same
situation, which may also exist in utilizing OR and TR. This confirms that
this is a MCDM issue, which this research will therefore handle from the
perspective of solving a MCDM problem.
Exploring the differences between the needed resources and the support
from resources for each strategy, as described above, is part of the issue
that is going to be handled in this research. To be more specific, the
differences between the needed resources and the support from resources
for each strategy raise the issue of resource allocation for SQM. Hence,
this research will identify to what extent each strategy is far from its
strategic objective whether due to over-resourcing or under-resourcing
(shortage of resources). In fact, such an attempt can be considered as a
further practical explanation to what has always been stated by Juran and
14
Table (1.2): Brief Description of Aravindan et al.‟s (1996) SQM Strategies
Strategy Description
UHK The use of human knowledge in a continual manner is a strategy for SQM due to the significance of
‘knowledge’ inside the organization. Without doubt, ‘knowledge’ itself is an organizational asset. In this
sense, effective management of human knowledge facilitates executing this strategy towards achieving
organizational objectives. Accordingly, such a strategy may require different forms of resources such as
adopting quality circle programs (Aravindan et al., 1996).
QIM Managing ‘information’ is a must for any organization. Therefore, continuous quality information management
should guarantee accurate flow of information within the organization. For this strategy (QIM) to be effective,
it needs specific forms of resources such as advanced technologies, software, methods for information security,
training for staff, communication channels …etc.
TCF All philosophies related to the concept of ‘quality’ has achieving customer satisfaction as a common objective.
Consequently, a strategy that handles customers’ responses must be considered by the organization.
Transferring customers’ feedback certainly requires well implemented communication channels (with
customers), techniques for gathering as well as analyzing feedback, trained staff…etc. All these requirements
are critical resources for the implementation of this strategy.
ATT In any manufacturing organization, producing with respect to the accurate specifications of the products is
compulsory during the journey of ‘achieving customer satisfaction’. From this perspective, target
specifications must be maintained continually if the organization wants to create competitive products. Tools,
such as ‘six sigma’, might be seen as one of the appropriate tools in this regard.
PQA Without doubt, the efforts of executing ‘auditing’ requires resources. Human resources are must and, on top of
that, they have to be capable to perform auditing works. Auditing also needs a commitment from Top
management as well as Quality Department. Auditing is critical because, according to Aravindan et al. (1996),
manufacturer as well as customer should be covered in auditing. Hence, formulating a strategy for ‘Periodical
Auditing’ is vital for manufacturing organizations.
CHF The appearance of ‘quality failure’ is common in any manufacturing organization. However, as long as the
organization is capable to keep failures within acceptable range, the organization then be able to maintain its
relationship with customers. Absence of ‘failures’ is a sign for a well implemented strategy for continuous
checking of failures. Such a strategy cannot be successfully executed without the needed resources including
technicians, techniques, and cooperation among employees.
CQC Within the context of ‘quality’, ‘costs’ is a broad term as any activity within the organization can be
categorized into the three common types of cost of quality (COQ) namely: prevention, appraisal, and failure.
So, whether the activity is an enabler for quality or resulted from quality failures, the term ‘costs’ appears.
With this in mind, any organization has a different of business units and, in regard to ‘quality’; they differently
produce different type of costs. Thus, the issue of ‘controlling costs’ should be handled continually in a
strategic manner. Such a manner, off course, requires different types of resources.
MQS Managing the quality system becomes a necessity for any organization seeking perfection. This is one of the
reasons behind the attitude of many organizations to hold different ISO certifications. The significance of
managing quality system is to have guidelines for documenting and implementing quality system; and this in
turn requires technological and methodological progress, enhancement and modifying mind-set of customers
as well as employees abide (Aravindan et al. (1996). From this point of view, the Management of Quality
System (MQS) has to be considered.

15
SMQM
Technological Resources
Organizational Resources
Human Resources
Definitions of Strategic
Management
Source of
Competitive Advantage
Internal Power
Soft TQM
Soft TQM
Hard TQM
Dealing with
QM
from a
strategic
point of view
Strategic Quality Management
(SQM)
Figure (1.1): Illustration of how research rationale is developed from the
Literature.
Gryna (1993), British Standards Institution (BSI) (1992), and Tummala
and Tang (1996) in their definition of SQM that, generally, SQM is linked
with the identified objectives (targets/goals) of the organization. In
particular, Tummala and Tang (1996) connected “quality improvement
efforts” within the context of SQM with resource allocation. This PhD
therefore aims to contribute to the field of SQM by providing a rational
understanding of the issue of resource allocation through investigating the
interaction between resources and strategies.

16
1.3 Research Objectives
In contrast to all recent attempts that have focused on hard and soft
elements, this research firstly will focus on resources, the root of hard and
soft elements of TQM. The purpose of this research is to develop a
comparative study by investigating two different cases (i.e. two case
studies). As Cavana et al. (2001) state, “the case study, which is an
examination of studies done in other similar organizational situations, is
also a method of solving problems, or of understanding phenomena of
interest and generating additional knowledge in that area”. Therefore, two
cases from the Saudi Arabian food industry are investigated to show how
the interaction between SQM‟s strategies and their allocated resources can
differ according to the strategic nature (environment) of each company.
Without doubt, for any organization, TQM is a source of competitive
advantage to sustain a position against competitors. This is due to the fact
that practicing QM has the potential to generate sustainable and
competitive advantages through the interaction between different
resources. This is because that the competitive advantage itself is a result
of practicing QM in parallel with the involvement of the interaction
between the organization‟s vision, strategies and environment. From this
point of view, understanding how resources are allocated to support
different strategies is a mandatory requirement for quality improvement.
Yet, within such a context, there are no existing models to assist Quality
Department managers to see how resources are being allocated, how
resources can be re-allocated for better utilization, or even how to convince
senior management about certain patterns of resource allocation.
Consequently, the main aim of this PhD research is to develop a
methodological manner through which a certain company can assess its
level of resource utilization for SQM by explaining how resources interact

17
with strategies. By understanding this interaction and the re-allocation of
resources based on strategy prioritization, organizations will ultimately
realize a better utilization of their resources.
Although SM provides a resource-based view of QM, QM studies have not
significantly focused on how resources interact with quality strategies.
Neither TQM nor SQM studies have highlighted this gap. Handling such an
issue through investigating soft elements and hard elements under the
umbrella of TQM, is not adequate to demonstrate such an interaction.
That is not to say that TQM is unsuccessful; but rather that SQM is more
appropriate to provide an explanation or description of how such resources
can interact with quality strategies. In this PhD research, the attempt is to
fill such a gap by demonstrating the interaction between resources and the
organization‟s strategies within the context of quality enhancement.
So in the context of SQM implementation in an organization, this thesis raises
the following four research questions:
RQ1:
Given that the three types of resources depend on, and influence, each
other; what is the relative contribution made by any two types of resources
to enable the third type to play its role effectively?
RQ2:
Given that each strategy depends on contributions by the three resources,
what is the relative contribution made by each type of resource to ensure
successful implementation of each critical strategy?

18
RQ3:
How is each available resource allocated for the eight strategies to ensure
successful implementation?
RQ4:
In light of their ability to enhance quality, what is the relative contribution
being made by each of the eight critical strategies?
Answers to RQ1 and RQ2 would give rise to the relative contributions
made by each resource as well as the actual needs of each single strategy
from HR, OR and TR. Moreover, the third and fourth research questions
provide the overall amount (expressed in percentages) of resources decided
to be assigned or allocated for each single strategy, regardless of its actual
need. Naturally, discrepancies between what is needed and what is being
allocated may occur in an organization. In light of this, this thesis
proposes and develops a model that has two parts. The first part utilizes
the Analytic Network Process (ANP) to differentiate quantitatively between
the needed resources for each strategy and the „resource support‟ it
actually receives. The second part formulates a Goal Programming (GP)
scenario in order to answer the following fifth research question:
RQ5:
How can resources be allocated for each strategy to satisfy its exact need,
or at least, to minimize the extent to which each single strategy is under-
resourced or over-resourced?
Answering the fifth research question reasonably leads to the sixth and
final research question:

19
RQ6:
Why does each single strategy receive resources, whether more
(overloaded) or less (shortage), than what should be allocated for it?
1.4 Research Design and Methodology
This case study research is conducted in two phases: quantitative and
qualitative. The sample frame of this research is restricted to experts in
quality management and top level managers. This approach ensures the
reliability of the data collected. The quantitative phase of this case study
research can be considered as a kind of operations research, as two
operational research techniques, namely ANP and GP, are employed. In the
first step of the quantitative phase, the ANP model is developed to address
the first four research questions. Within the implementation of ANP, six
quality experts (three from each company) are involved in comparison
judgments among SQM‟s strategies and their required resources. Super
Decisions® software, developed for AHP and ANP by Thomas L. Saaty for
structuring decision making models, will be used to build the ANP model
(Creative Decision Foundation, 2003).
In relation to the RQ5, the GP model is developed as a second step of the
quantitative phase. In this regard, QM for Windows software (Render et al.,
2006) is used to formulate and solve the GP model. Regarding the
qualitative phase, twelve semi-structured interviews (six with each
company) were conducted with „Quality‟ managers and other managers
from related areas such as human resource, supply chain, and
information technology (IT). The qualitative phase is conducted to address
RQ6. Answering these six research questions is the primary objective of
this research.

20
In fact, one of the vital aims of this case study research is to develop a
methodological manner through which a certain company can assess its
level of resource utilization for SQM. This is mainly achieved by employing
ANP and GP in the quantitative phase. Specifically, the issue (problem) of
resource allocation that should be handled from the strategic perspective
of a certain company, as argued above, is explored and illustrated through
ANP. As a consequence of an allocation problem caused by conflict among
quality strategies in terms of their strategic objective, GP then plays its
strategic role allowing a company to utilize its resources with respect to its
strategic objectives. Accordingly, a Strategic Quality Management Index
(SQMI) is generated and developed from the GP model as a tool for
companies to assess their SQM, or even through benchmarking with other
companies if applicable. The qualitative phase, in turn, validates the
SQM‟s situation in the investigated cases (companies) and draws a road
map for the investigated companies to improve their SQM implementation.
1.5 Thesis Organization
This thesis consists of eight chapters. This chapter (Chapter 1) introduces
the thesis through providing background, research rationale, and research
objective. A comprehensive literature review is provided in Chapter 2
covering the role of resources in strategic management, the role of
resources in quality management, SQM, applications of ANP, as well as GP
in quality management and resource allocation. Chapter 3 introduces the
three methodologies (ANP, GP, and semi-structured interviews) that are
used to discuss why and how they are employed. Chapter 4 shows how
this research is conducted within the context of the case study covering
the issue of validity and reliability. Chapter 4 also illustrates how the three
21
methodologies are mixed into two phases namely: quantitative phase
followed by the qualitative phase. Chapter 5 covers the aspects of data
collection for the quantitative and the qualitative phases. Justification is
provided for selecting the two cases (companies) as well as the participants
(experts). The quantitative results and analysis are presented in Chapter 6
by addressing the first five research questions, covering all aspects related
to the application of the ANP analysis and the GP model. The sixth (final)
research question is addressed within a full qualitative analysis in
Chapter 7 by utilizing semi-structured interviews. Chapter 8 concludes
the thesis by providing an overall discussion that merges the quantitative
and the qualitative findings. The main contributions, implications,
limitations, and directions for future research are also provided in Chapter
8. Figure (1.2) summarizes how research questions and methodologies are
handled within the eight chapters.

22
Chapter
1
Chapter
4
Chapter
3
Chapter
5
Chapter
2
Chapter
6
Chapter
7
Chapter
8
Research Methodologies
ANP Analysis
GP Model
Semi-structured Interview
Research Questions
RQ1
RQ2
RQ3
RQ4
RQ5
RQ6
Developing
Supporting
Introduced
Quantitative
Findings
Qualitative
Findings
Addressed
by
Addressed
by
Addressed
by
Interpreted
Mixed
Data
Collection
Case Study
Development
Figure (1.2): Thesis Layout and Chapters

23
2.1 Introduction
This chapter reviews the literature that supports the arguments presented
in Chapter 1 [See Figure (1.1)] and specifically the relative fields of
knowledge that belong to the rationale of this research. Firstly, this
chapter shows that TQM elements can be categorized into three types of
resources: human, organizational, and technological. Then, the role of
resources in Strategic Management (SM) and Quality Management (QM)
are critically reviewed. Accordingly, the concept of Strategic Quality
Management (SQM) is then introduced. The final part of this chapter
highlights the applicability of ANP as well as GP to be implemented in the
field of quality and resources allocation as they are selected as tools to
carry out the quantitative phase of this research.
2.2 Categorization of Resources
Hill and Jones (2004) classified a firm‟s resources into two broad
categories: tangible resources and intangible resources. Tangible resources
are those which are regularly shown in the balance sheet of the firm (Collis
and Montgomery, 2004), and include: physical resources (Hill and Jones,
2004; Penrose, 1995) such as land, buildings, plant, equipment, inventory
Chapter
2 Literature Review

24
(Collis and Montgomery, 2004; Hill and Jones, 2004; Hofer and Schendel,
1978; Chandler, 1995); natural resources, raw materials, semi-finished
goods, waste products, by-products, and stored finished goods (Penrose,
1995;services and distribution facilities (Hofer and Schendel, 1978); and
money (Hill and Jones, 2004). Intangible resources are those that usually
form critical functions for competitive advantage or disadvantage (Collis
and Montgomery, 2004). They are not physical and instead relate to things
that are created by a firm‟s employees (Hill and Jones, 2004), such as
brand names, reputation, and human knowledge (Collis and Montgomery,
2004; Hill and Jones, 2004); experiences, patents, copyright, and
trademarks (Hill and Jones, 2004); and technological knowledge (Collis
and Montgomery, 2004).
In addition to tangible and intangible resources, Collis and Montgomery
(2004) added a third category known as organizational capabilities, which
they defined as a mixed grouping of “assets, people and procedures” by
which firms convert their inputs to outputs. Thus, lean manufacturing and
product development, as applied in Japanese automobile firms, can be
considered amazing organizational capabilities.
Resource types have been classified into physical (or tangible) resources
and human resources, such as secretarial, executive, marketing, technical,
and financial staff (Penrose, 1995; Chandler, 1995; Hofer and Schendel,
1978), and inexpert and expert workers (Penrose, 1995). Steiner et al.
(1986) and Chandler (1995) added financial resources to the physical and
human resources, while Barney (1991) categorized resources into physical,
human and organizational. Later, he added financial resources to his
categorization (Barney, 1995). However, a more comprehensive
classification of a firm‟s resources is presented by Schendel and
Hofer(1978), who stated that there are five kinds of resources that enable

25
any organization to attain their goals. These resources are: financial
resources, physical resources, human resources, organizational resources
and technological capabilities.
Financial resources include debt, equity (Barney, 1995; Hofer and
Schendel, 1978), cash flow (Hofer and Schendel, 1978), and earning
(Barney, 1995). Examples for organizational resources include “the history,
relationships, trust, and organizational culture that are attributes of
groups of individuals associated with a firm, along with a firm's formal
reporting structure, explicit management control systems, and
compensation policies” (Barney, 1995). In relation to technological
capabilities, Schendel and Hofer (1978) reported that “the term technology
is used in the broad sense; that is, as a description of the way that each of
a business‟s various functional area activities are carried out … such as …
high-quality products, low-cost plants, and high brand loyalty”.
All the classifications of resources presented above reveal that Hofer and
Schendel‟s (1978) five categories of resources can be considered as the
most suitable classification of resources. There are two reasons for this
consideration. Firstly, some classifications are too broad and place all
resources in just two or three general categories; for example, tangible or
intangible resources (Hill and Jones, 2004). Organizational capabilities
only is added by Collis and Montgomery (2004). Similarly, resources can
be seen only as physical resources and human resources (Penrose, 1995).
Steiner et al. (1986) and Chandler (1995) have only added financial
resources. Including further categories will allow the types of resources to
be identified more accurately. Secondly, some categories are hidden or
mentioned only indirectly by the authors. For instance, although Hill and
Jones (2004) classified resources into tangible and intangible resources,
their definition of resources highlighted the significance of the five
26
categories of Hofer and Schendel. To illustrate, Hill and Jones (2004)
defined resources as the “capital or financial, physical, social or human,
technological, and organizational factor endowments that allow a company
to create value for its customers”. Moreover, they classified money
(financial resources) under tangible resources. Additionally, although
Barney reported that resources can be classified into physical, human,
organizational (Barney, 1991) and financial resources (Barney, 1995),
technological resources are also mentioned indirectly in his description of
physical resources. Specifically, he stated that “physical resources include
the machines, manufacturing facilities, and buildings firms use in their
operations” (Barney, 1995). It appears that Barney has combined physical
and technological resources under one category. To be specific, according
to the meaning of technology, as defined by Hofer and Schendel, it is clear
that technological resources can be represented by the “machines” and the
“manufacturing facilities” in Barney‟s description of physical resources.
Indeed, Amit and Schoemaker (1993) also highlight the significance of the
technological factor, noting that technological resources are one of the
main resources for the company to produce products or services.
In support of Hofer and Schendel‟s (1978) classification of resources, Wolf
and Reed (2000) contend that a general look at the resource-based
literature shows a slight agreement about the way resources should be
classified. They added that the broad classification of resources as tangible
and intangible resources can be considered as evidence that categorization
of resources should be more specific. Thus, they have selected the
classification of Schendel and Hofer (physical, financial, organizational,
human, and technological resources) in their work. The justification of the
selection of these five categories can be observed through the fact that
“there are no individual resources that do not fit this schema” (Wolf and
Reed, 2000).

27
2.3 The Role of Resources in Strategic Management
This section discusses the strategic importance of resources. This
discussion is divided into four dimensions. First, a number of definitions of
strategy, corporate strategy and resources are presented to show the link
between resources and strategy. Second, an understanding of the role of
resources as an internal and strategic power of an organization is
provided. Third, the significance of resources as a source of competitive
advantage is illustrated. Finally, the classification of different types of
resources according to the literature of strategic management (SM) is
presented. The aim of this part of the chapter is to show the significance of
resources in forming a firm‟s strategy.
2.3.1 Definitions of Strategy and Resources
The role of resources in strategy can be seen in the definition of strategy.
Originally, the word strategy was derived from the Greek word strategos,
meaning general; therefore, it can be described as an “art of the general”
(Steiner et al., 1986). Schendel and Hofer (1978) defined strategy as a
“fundamental pattern of present and planned resource deployments and
environmental interactions that indicates how the organization will achieve
its objectives”. Correspondingly, the determination of the main long-term
aims and targets of the firm, with implementation of methods of activities
and assigning of the critical resources to execute these aims, can be also
considered as a definition of strategy (Chandler, 1995).
Katz (1970) stated that there are two features of strategy: strategic position
and structure plan. According to Katz, the strategic position is the real
association or the real connection between the organization and its
28
environment at an exact moment of time. Newman et al. (1981) added that
obtaining resources earlier, specifically “tangible or intangible” assets that
will situate the organization in a beneficial position in the future, is
considered as a “strategic position”. On the other hand, the structure plan
is the proposed relation in the future, which includes a number of
corporate goals as well as activities that are necessary to achieve these
goals (Katz, 1970). Katz expressed the notion that the group of people, at
an exact moment of time, who enforce a collection of resources inside a
competitive environment, can be called an “enterprise‟s strategic posture”.
From this point of view, he defined corporate strategy as a “relationship
between an enterprise and its environment”.
Andrews (1980) differentiates between business strategy and corporate
strategy. Business strategy identifies the preference of the “product or
service and market” of the business inside the organization. In contrast,
corporate strategy regularly impacts comprehensively on the organization.
It identifies the business in which the firm fights through focusing on the
resources that will assist to translate the “distinctive competence” to
“competitive advantage”. Further, Andrews emphasized that the valuable
strategic decision is the decision that focuses on a significant portion of
the firm‟s resources. Hence, corporate strategy is forming an efficient
group of business-units through an accurate “investment (allocation) of
resources” and adding value to businesses through these resources
(Newman et al., 1981).
Understanding resources by definition will provide a better perception of
their role in strategy. Resources can be defined as “stocks of available
factors that are owned or controlled by the firm” (Amit and Schoemaker,
1993). Specifically, Collis and Montgomery (2004) defined resources as
“the assets, skills, and capabilities of the firm”, stating that resources are

29
essential elements because decisions about what a firm can do depend on
the resources. Similarly, resources can be defined as the “capital or
financial, physical, social or human, technological, and organizational
factor endowments that allow a company to create value for its customers”
(Hill and Jones, 2004). Steiner et al. (1986) defined resources as those
tangible and intangible capitals by which the firm can improve its capacity
for success. Montealegre (2002) has clearly shown the relationship
between resources and strategy in his definition of resources. According to
Montealegre, resources are “firm specific assets and competencies
controlled and used by firms to develop and implement their strategies”.
These opinions and views about resources appeared to be reasonable and
are supported in so far as “the firm is more than an administrative unit; it
is also a collection of productive resources” and the employment of these
resources represents the best way to measure the firm‟s size (Penrose,
1995).
In summary, the strategic importance of resources is identified through a
number of definitions of strategy, corporate strategy, and resources. First,
it can be said that resources are significant in forming the current position
of the firm, as well as the future position. Second, resources enable the
organization to create its competitive advantage. These two points have
been reported on directly and indirectly in the various definitions of
strategy and corporate strategy described above. Additionally, these
definitions support the idea that resources represent a base for strategy.
Indeed, the power of resources in a firm is reflected in the firm‟s ability to
perform activities within its strategic boundaries.

30
2.3.2 Resources as an Internal Power of Organization
Considerable research in the field of strategic management has
concentrated on strengthening product market positions as a foundation
for competitive advantage and superior profits (Dierickx and Cool, 1989).
However, the significance of organized resources as a tool to reach or
protect superior product market positions is frequently ignored.
Furthermore, Grant (1991) identified the lack of attention being given to
the relationship between strategy and resources, possibly due to the
limited awareness of most of the researchers in this area. Nevertheless,
limited attention was focused on a firm‟s resources as a base for strategy.
For example, Barney (1986) launched the notion of a “strategic factor
market”, which is the market that obtains and relies on resources essential
for strategy implementation.
In fact, a variety of suitable market opportunities can be identified by
resources; this relationship represents the main influence of resources on
“corporate strategy” (Collis and Montgomery, 2004). A SWOT (Strengths,
Weaknesses, Opportunities, and Threats) analysis is helpful in explaining
this relationship. To illustrate, the link between the external opportunities
and the firm‟s threats on one side, and their internal strengths and
weaknesses on the other side, can be considered as a definition for a
SWOT analysis (Barney, 1995a). Barney added that even though the
concept of SWOT analysis was introduced nearly forty years ago by
Learned, Christiansen, Andrews, and Guth, the current existence of this
concept as a strategic principle is evidence for its success. A SWOT
analysis employs the internal strength of the firm in exploring external
opportunities on the one hand, while reducing the effect of threats and
overlooking the weaknesses.

31
Many researchers have highlighted the importance of focusing on internal
strengths and weaknesses as a source of competitive advantage, resulting
in a better and more favourable situation. For instance, Barney (1986)
reported that strategic alternatives must be driven from an analysis of the
exclusive skills and capabilities of the firm rather than the firm‟s external
environment; further “analysing a firm's skills and capabilities can be a
source of more accurate expectations”. Grant (1991) identified how
changes in the external environment can justify the resources and
capabilities required as the steady base from which the firm can determine
its identity. Grant also emphasized that a business should be described
based on its capabilities to provide stronger strategy, rather being
described according to the requirements it aims to satisfy. Therefore, it is
important for strategists and executives to understand that investigating a
firm‟s internal assets provides a more reasonable analysis for formulating
strategies than concentrating on what the firm should do to meet demand
(Lo´pez, 2005).
This point leads naturally into a discussion of the concept of economic rent.
The notion of the economic rent appeared in the nineteenth century with a
disagreement on the exact meaning of this concept. Generally speaking,
there are three common types of rents: Ricardian rent, Quasi rent, and
Monopoly rent. Ricardian rents involve significant returns obtained from
fixed resources, or resources that are in restricted supply and can be
attained by possessing a precious and rare resource (Mahoney and
Pandian, 1992). According to Grant (1991), Ricardian rents are “the
returns to the resources which confer competitive advantage over and
above the real costs of these resources”. Quasi rents involve the difference
in payments to a resource between the first-best use of the resource and
its second-best use (Mahoney and Pandian, 1992; Amit and Schoemaker,
1993). The “returns to the market power” (Grant, 1991) or the rents that

32
are obtained through the protection of the government, are called
Monopoly rents (Amit and Schoemaker, 1993).
For clarity, it is important to explain the link between the resources and
the economic rents in the context of strategy. The concept of the Resource-
Based View (RBV) of a firm illustrates this relationship. Simply, RBV
considers a firm as a collection of resources and capabilities (Montealegre,
2002; Coates and McDermott, 2002). To be more specific, RBV is the
process of maximizing the income through highlighting strategic
alternatives and assigning the critical task of defining, improving, and
implementing the main organizational resources to management or the
decision makers (Fahy, 2003). Finney et al. (2005) reported that RBV
implies that resources are the base of success for organizations. Similarly,
for Coates and McDermott (2002), RBV reveals that the success of a
company‟s strategy depends on its collection of resources. Indeed, RBV
assumes that a sustainable competitive advantage results from the
required outputs of the management activities of the organization (Fahy,
2003). This way of obtaining a sustainable competitive advantage enables
the organization to acquire economic rents (Coates and McDermott, 2002;
Fahy, 2003). While Grant (1991) has also mentioned that the aim of RBV,
in the context of strategy, is to take full advantage of rents over time, he
emphasized that strategy must be built on the bases of Ricardian rents
rather than Quasi rents.
Resources thus represent an internal power for the organization. A SWOT
analysis and RBV are good examples of how an organization can be driven
successfully through its resources. As a SOWT analysis concentrates on
both internal and external environments, an analysis of the internal
factors, specifically resources, cannot be ignored. However, the significance
of resources is more important in RBV, which is an internally focused tool

33
specifically for building strategy. It focuses on the firm‟s resources
generating the firm‟s internal power. Thus, the role of resources in strategy
can be expressed through a description of resources as the internal power
of a firm.
2.3.3 Resources as a Creator of Competitive Advantage
The relationship between profitability and competitive advantage can
provide a good understanding of the role of resources in strategy. To
illustrate, although a positive relationship exists between profitability and
the market share, the main objective of “competitive position analysis” is to
provide a measurement method for continuing growth and profit instead of
analyzing the market share (Hofer and Schendel, 1978). Consequently, a
firm‟s profitability may be affected negatively if its competitive advantage is
lost. This is the reason that a failing firm can be defined as a one whose
profitability is considerably lower than its rivals‟ average profitability when
an ability to produce and manage the resources is absent (Hill and Jones,
2004). Further, Reed and Defillippi (1990) have declared that competency
consists of a collection of resources and the methods by which these
resources cooperate to provide outputs. Amit and Schoemaker (1993)
believe that the real challenge for executives is to make profits through a
sustainable competitive advantage by defining, improving, defending, and
implementing the required resources. Thus, according to Hill and Jones
(2004), the main goal of strategy (collection of resources) is to develop a
competitive advantage that obtains better profitability. From this point of
view, strategy can be seen as “the driver of competitive advantage and
profitability”.

34
Strategic executives and academic authors have always explored sources
of competitive advantage (Barney, 1991, Barney, 1995). A company is
considered to have a competitive advantage if it employs a “value creating
strategy” which is not available to its rivals; it is considered to have a
sustained competitive advantage if it has a competitive advantage and its
competitors are unable to duplicate the value creating strategy (Barney,
1991). Hill and Jones (2004) reported that, within the same industry, if the
firm‟s profitability exceeds the average profitability of its competitors, it is
considered to have competitive advantage. They added that the ability to
protect “above-average profitability” for years is equivalent to sustained
competitive advantage.
However, strategy cannot attain competitive advantage unless the firm
forms its distinctive competencies (Hill and Jones, 2004). Indeed, Schendel
and Hofer (1978) reported that a significant amount of research has
proposed that distinctive competency is the main base of strategy. To be
specific, they identified the importance of resources through their
definition of the firm‟s distinctive competency as “its unique resources and
resources deployment pattern”. In addition, Hill and Jones (2004) defined
distinctive competencies as particular powers of the organization to
differentiate its outputs and/or produce with a cost considerably lower
than its competitors. Similarly, Collis and Montgomery (2004) declared
that resources differentiate between firms and represent a durable supply
by which competitive advantage is revealed. These definitions imply that
resources represent organizational powers, by which strategy can be
successful.
As a result, resources and capabilities represent the two corresponding
sources for distinctive competencies (Hill and Jones, 2004). Indeed, Grant
(1991) has offered two reasonable points that place resources and

35
capabilities at the base of a firm‟s durable strategy: 1) they form the main
“direction” for the strategy, and 2) they represent a major source of profits.
However, understanding the difference between resources and capabilities
is important. Hence, Grant (1991) has specified that, “while resources are
the source of firm‟s capabilities, capabilities are the main source of its
competitive advantage”. Specifically, he considered the resources as a
main element of the analysis that represents the “inputs into production
processes”, while capability is the ability for a group of resources to
execute or carry out actions. For Hill and Jones (2004), capabilities are the
skills required to organize a firm‟s resources. These skills are inherent in a
firm‟s systems and procedures to attain the organizational goals through
controlling the internal processes. In summary, recognizing, forming, and
implementing vital resources is a significant contributor to corporate
strategy as well as competitive strategy (Collis and Montgomery, 2004).
Additionally, according to Hill and Jones (2004), the minimum
requirements for a firm to have distinctive competency are:
1. Special and valuable resources and capabilities to obtain the benefit
of the resources; or
2. Special capability to direct and control resources.
They added that having both, special-valuable resources and special
capability, will result in the strongest distinctive competency for a firm.
2.3.4 The Strategic Role of the European Foundation for Quality
Management (EFQM)
In the USA, and specifically in the early 1980‟s, there was a need for
national awards in quality (Olve et al., 1999). The need for such awards
36
has also been a concern in Europe and, in 1988, 14 famous European
companies formed what is known now as the European Foundation for
Quality Management (EFQM), and in 1992, The first EFQM or what is
known as the European Quality Award (EQA) was then founded
(Wongrassamee et al., 2003). Such awards are provided to companies that
achieve excellence in QM as a part of their continuous improvement
process (Shergold and Reed, 1996). In regard to the strategic role that
these frameworks, such as Balanced Scorecard and EFQM, play,
Wongrassamee et al. (2003) stated that:
A common theme in the newer integrated performance
models or frameworks has been a determined attempt to
tie performance metrics more closely to a firm’s strategy
and long-term vision…EFQM Excellence Model …received
wide publicity and …recently … adopted by many
organizations worldwide, particularly in Europe and the
USA.
As for the components of the EFQM, Shahroudi (2010) stated that:
The EFQM Excellence Model comprises nine criterions
grouped under five “enablers” criteria that include:
leadership, policy and strategy, people, partnerships, and
resources and process and also, four “results” criteria that
includes: customer results, people results, society results,
and key performance results. The enablers stand for how
the organization operates, and the results focus on the
achievements towards organizational stakeholders, those
who have an interest in the organization, and how they
can be measured and targeted.
37
Nowadays, many companies in Saudi Arabia, including the selected cases
of this research, seriously attempt to implement the EFQM in order to
guide their quality practices.
2.4 The Role of Resources in Quality Management
In this part of the chapter, the role of resources in the context of quality is
highlighted. TQM literature reveals that any TQM factor or element can be
considered as one of three types of resources, i.e. technological,
organizational and human resources (Saraph et al., 1989, Flynn, 1994,
Anderson et al., 1995, Badri et al., 1995, Powell, 1995, Ahire et al., 1996,
Black and Porter, 1996, Grandzol and Gershon, 1998, Quazi et al., 1998,
Rungtusanatham et al., 1998, Tamimi, 1998, Dow et al., 1999, Joseph et
al., 1999, Hua et al., 2000, Zhang et al., 2000, Tari, 2006, Perdomo-Ortiz
et al., 2006, Antony et al., 2002) [See Appendix A]. This part provides clear
definitions and descriptions of these resources to demonstrate the links
between TQM and each type of resource. The aim is to use TQM literature
to show how relevant human, organizational, and technological resources
are to the field of quality. The efforts of eighteen TQM philosophers are
summarized in Appendix A to show how TQM critical elements (or factors)
can be viewed as one of these types of recourses.
2.4.1 Technological Resources and Quality Management
Simply put, technology is the process of occupying the knowledge in order
to carry out the required job (Rousseau, 1979). It can also be defined as
“information, equipment, techniques and processes required to transform
inputs into outputs in an organization” (Robbins and Barnwell, 2002). A

38
similar definition has been given by Perrow (1967), who considered
technology as an action “that an individual performs upon an object, with
or without the aid of tools or mechanical devices, in order to make some
change in that object.” It can also be defined as a collection of capabilities
(knowledge and skills) that are supposed to be applied theoretically and
practically to provide and improve the products andr services (Burgelman
et al., 2008). Tompkins (2004) provided a broad definition of technology;
that is, coordination of a firm‟s “tools and techniques” to generate its
activities. All these definitions can be integrated into one definition (White
and Bruton (2007):
The practical implementation of learning and knowledge by
individuals and organizations to aid human endeavour.
Technology is the knowledge, products, processes, tools,
and systems used in the creation of goods or in the
provision of services.
In addition, technology has developed and modernized a firm‟s way of
managing services by updating the manners, methods, or techniques by
which employees are operating within the firm (Sivabrovornvatana et al.,
2005). Moreover, Sivabrovornvatana et al have emphasized that the
implemented technologies should be well-known and controlled by the
organization to generate the maximum advantage from these technologies.
They declared and summarized their view stating that “technology has
been used as a productive, tactical, and strategic resource, as a tool and
as a change agent.”
Previous definitions of technology highlight its role in quality management.
Consequently, Prajogo and Sohal (2006) stated that quality techniques,
such as Statistical Process Control (SPC) and Quality Function
39
Deployment (QFD), have always been considered in the TQM literature as a
technology. In fact, according to the definition of technology, the term can
include traditional forms, such as advanced tools and equipment, as well
as methods and techniques. Hence, Waldman and Gopalakrishnan (1996)
present techniques as “operational factors” that have an ability to reduce
the variations of the services. This helps to achieve customer satisfaction,
which is quality as it is defined by Juran (1988), Feigenbaum (1991), and
Oakland (1993).
Thus, due to the significance of technology as a main factor in forming
future contact between sellers and their customers, the influence of
technology on the “quality-value-loyalty chain” must be investigated
(Parasuraman and Grewal, 2000). Consequently, it is important to
understand that a superior innovation level is the result of combining TQM
and technology management (Prajogo and Sohal, 2006). This thinking
draws attention to the importance of integrating technology into a firm‟s
products or services to obtain customer loyalty (Kandampully and Duddy,
1999; Sivabrovornvatana et al., 2005). Logically, customer loyalty is driven
by customer satisfaction (i.e. “quality” as mentioned earlier). Therefore,
investing in research and development to improve the products or to
produce them more quickly implies considering quality itself (Ettlie, 1997).
In the context of quality, it is reasonable to highlight the importance of
information technology (IT) as the main form of technology. Indeed, IT has
always contributed and supported TQM factors (Dewhurst et al., 2003).
Therefore, firms must ensure that their TQM process recognizes the
significance of implementing new technologies to obtain competitive
advantage (McAdam and Henderson, 2004). Specifically, McAdam and
Henderson summarized that the future of TQM appeared to rely on new
forms of technology, such as e-commerce and IT.

40
2.4.2 Organizational Resources and Quality Management
Organizational resources can be defined simply as “relationships among
individuals” (Tomer, 1998). They can also be defined by organizational
characteristics, such as an organization‟s history, culture, trust,
management system, policies, formal and informal relationships (Barney,
1995), and long or short financial management systems (Hofer and
Schendel, 1978). Leana and Buren (1999) defined the concept of
organizational social capital as a resource that represents the nature of the
social relationships within organizations and that enables employees to
share trust, objectives, and activities to create a significant value for the
organization.
It might seem somewhat confusing to differentiate between organizational
and human resources. However, Tomer (1987) has clearly distinguished
between Pure Human Capital and Pure Organizational Capital through
some examples. He considered that training programs, as an ideal example
of pure human capital, can be viewed as values that are invested in
employees to increase their productivity. Where the employee does not
respond positively, the firm is supposed to fire him or her and hire a new
employee to protect its productivity. He justified this by saying: “This is
pure human capital because this attribute does not contribute to the
functioning of the organization … It is specific to the firm‟s technology but
not to the firm‟s organization”. On the other hand, Tomer also stated that
pure organizational capital can be explained by “a change in the formal
organizational structure in which the channels of communication and
formal relationships between several work groups are altered”. This is pure
organizational capital because it is a collective of organizational attributes
that form the required activities of the employee.

41
Thus, Barney‟s (1991) definition of organizational resources seems to be
appropriate in the context of quality. To illustrate, he stated that:
Organizational capital resources include a firm’s formal
reporting structure, its formal and informal planning,
controlling, and coordinating systems, as well as informal
relations among groups within a firm and between a firm
and those in its environment
From a quality perspective, the best representative of “… formal reporting
structure … formal and informal planning, controlling, and coordinating
systems…” in Barney‟s (1991) definition is the role of leaders (senior
management) in the TQM process. To exemplify this point, leadership is
one of the common TQM categories that always covers issues such as “„top
management leadership and quality policy‟, „top management
commitment‟, „top management implication‟, „visionary leadership‟,
„leadership and policy‟, „managerial support‟, „quality leadership‟, „visible
support for the change‟, „quality management system‟ and „company
orientation toward quality‟” (Sila and Ebrahimpour, 2003). Indeed,
organizational factors such as senior management commitment, the
quality policy, quality culture and the Quality Department‟s
responsibilities are important in obtaining better quality results and
achieving customer satisfaction (Waldman and Gopalakrishnan, 1996).
Hence, due to the fact that top management is responsible for improving
and protecting the organizational culture, executives should employ TQM
as a tool for organizational success (Gore, 1999). Furthermore, many
studies have shown the significance of the role of top management
commitment in TQM. The importance and the contribution of such a role
is clearly illustrated by Ahire and O‟Shaughnessy (1998), who reported
that all TQM constructs can be employed and executed successfully once

42
the top management is committed to TQM. Sila and Ebrahimpour (2005)
saw it as a requirement for firms to employ managers who are capable of
leading TQM matters, especially those related to people (HRM), strategic
plans, and customer relations.
In addition, from a TQM point of view, the statement of “… informal
relations among groups within a firm and between a firm and those in its
environment ...” in Barney‟s definition of organizational resources reveals
that internal relationships (employees) and external relationships
(customers and suppliers) can also be considered as organizational
resources. Indeed, these relationships have always been given attention by
quality gurus. For example, to obtain customer satisfaction, it is important
to consider real feedback from customers and ensure it is reflected in the
firm‟s products and services (Antony et al., 2002). This can be achieved
through communication between employees, customers, and suppliers.
Thus, if TQM is implemented with respect to customer requirements, a
firm can maintain a durable source of innovative ideas that conform to the
real demand (Perdomo-Ortiz et al., 2006; Zhang et al., 2000). Additionally,
success in TQM also relies on strong relationships with suppliers. Badri et
al. (1995) stated that durable and strong contracts with suppliers are vital
for TQM success. This fact is justified by Zhang et al. (2000) who stressed
that “supplier quality management” is a critical component of TQM
because the primary cause of quality troubles comes from goods obtained
from suppliers. Therefore, Appendix A illustrates how key TQM elements
can be considered as organizational resources.

43
2.4.3 Human Resources and Quality Management
The concept of human resources refers to the firm‟s employees (Daft,
2003), such as managers, researchers, technicians, engineers, sales people
and financial staff (Hofer and Schendel, 1978; Penrose, 1995). Indeed,
Chandler (1995) considered “technical, marketing, and administrative
skills” as one of the most significant types of resources. However, the
definition of human resources can be expressed broadly to include some
organizational activities. To illustrate this point, both “human resource
management (HRM)” and “human resources (HR)” have always been used
to describe the functions of managing employees (Armstrong, 2006).
Indeed, according to Akdere (2006), if firms are seen as “human systems”,
then HR is defined as:
The development and management of people in an
organization through a framework of activities and
practices that design, develop, organize, support, and
execute employees’ work—while ensuring compliance with
legislation and regulations governing the
employer/employee relationship.
Thus, it seems that Tracey‟s (2003) definition of HR in his book, The
Human Resources Glossary : The Complete Desk Reference for HR
Executives, represents the ideal description of what HR means. According
to Tracey, the two definitions of HR are:
1. The people that staff and operate an organization — the
executives, managers, supervisors, scientists and
engineers, technicians, marketing and sales personnel,
administrative and clerical personnel, and hourly workers

44
— as contrasted with the financial and material resources
of an organization.
2. The organizational function that deals with the people
who manage, produce, market, and sell the products and
services of an organization.
Regardless of the definition of HR, it has received significant attention in
the literature of quality management. It is a requirement for any effective
quality development process and top management should give it a high
level of attention and priority in their programs (Kufidu and Vouzas, 1998).
In relation to Tracey‟s second definition, the organizational functions can
be classified into four main HR processes: selection, appraisal, rewards,
and development (Armstrong, 2006). All these functions relate to Tracey‟s
first definition about organization‟s people. In addition, all these functions
are always mentioned as part of TQM‟s elements. For example, selection is
a process of assigning obtainable human resources to the required work
(Armstrong, 2006), which can be viewed as a critical task in the TQM
process. Ahmed and Schroeder (2002) stated that selecting employees is a
significant process for both service and manufacturing industries and
emphasized the need to study the importance of selection in the context of
quality. They added that TQM elements, such as training and
empowerment cannot be successful unless the appropriate person is
selected. Indeed, the existence of people who are committed and involved
in the quality process is important, as is the existence of a suitable
recruitment and selection system and training program (Calvo-mora et al.,
2005). In the selection process, Tari et al. (2006) reported that “employees
should possess skills for continuous improvement in a TQM context, such
as working in teams, problem solving and improving process aptitudes”.
Ahmed and Schroeder (2002) concluded that the importance of the
45
selection process is that it emphasizes a common quality principle that
“prevention is better than cure”.
Moreover, development as a HR function means “developing high quality
employees” (Armstrong, 2006). Therefore, training programs are considered
as a good way to demonstrate the importance of “developing employees” in
organizations that seek success in their TQM system. Yang‟s (2006) study
of HRM practices concluded that providing “training and education” and
“employee development” has a positive impact on TQM. Similar results
have shown that quality management, as one of the integrated
manufacturing practices, is supported by training (Snell and Dean, 1992).
Thus, the role of human resources in TQM reveals that training must be a
consideration in enabling employees to utilize their capabilities (Bou et al.,
2005).
TQM is also influenced by appraisal and rewarding. Appraisal, which
means “performance management” (Armstrong, 2006), has been mentioned
frequently as one of the critical elements of TQM. Soltani et al. (2004)
stressed that “TQM-driven HR performance evaluation must be an
organizational imperative if TQM objectives and customers (i.e. internal
and external) are to be met”. In addition, recognizing employees‟ efforts
and rewarding them must be considered as part of the quality
improvement process (Zhang et al., 2000; Baidoun, 2004). More
specifically, Zhang et al. (2000) suggested that “salary promotions, position
promotions, monetary or non-monetary rewards, (and) financial awards for
excellent suggestions” are effective ways for rewarding. Appendix A shows
how some of these TQM elements can be viewed as human resources.

46
2.4.4 TQM Elements as Resources
The definitions and descriptions discussed for technological,
organizational, and human resources demonstrate the significance of these
resources in TQM implementation. This, in turn, leads to the perspective
that TQM elements can be considered as resources. This is not surprising
and, in fact, is explained through the definitions of the resources. As
shown in Appendix A, 18 TQM advocates and researchers have used
different elements of TQM in their investigations of the critical factors of
TQM. According to the definitions presented earlier, these elements can
also be viewed as technological, organizational, or human resources.
2.5 Strategic Quality Management (SQM)
Human, organizational, and technological resources play a significant role
in both SM and QM, so the focus of this section is on the concept of
Strategic Quality Management (SQM). SQM is divided into three
dimensions. First, quality is investigated from a strategic perspective to
demonstrate how it can generate a competitive advantage. This dimension
is an extension of the previous two sections, providing further explanation
of the role of resources in SM and QM. The second dimension draws
attention to the need to link quality to strategy as a requirement for TQM
to succeed. In the third dimension, SQM is directly presented through its
definitions and critical elements of SQM are presented. The collective
discussion of SQM researchers who have directly used the terminology of
SQM is then summarized.

47
2.5.1 Quality as a Competitive Advantage
As illustrated in the previous sections, the strategic importance of quality
can be determined from the role of the resources in both QM and SM.
Further clarification can be obtained from the strategic view of QM or what
is known as SQM. In fact, a consideration of quality as a basis for building
strategy permits firms to cover all organizational aspects such as culture,
market position, identification of the strategic goals and identification of
the required resources (Leonard and McAdam, 2002a). Moreover, to enable
"quality strategy" to translate the mission and the vision of the firm into an
understandable and practical formate (i.e. specific goals), the external
environment (competitors) as well as internal capabilities (resources) must
be considered (Beecroft, 1999). In addition, it is important to understand
that resources cannot be utilized without a system that is capable of
assembling them, because “how a firm mobilizes its resources determines
what activities it becomes good at” (Pruett and Thomas, 1996). Pruett and
Thomas (1996) added that:
The capacity to achieve high quality is difficult to develop,
hard to buy, and provides a substantial benefit, which
sounds much like the definition of a valuable resource.
Clearly, a management system which manages for quality
is an abstract form of a resource.
The significance of resources can also be investigated throughout the
strategic role of the technological, human, and organizational resources in
QM. For example, achieving a high level of quality and productivity
requires good investment in “people, design of products and process
improvements” (Calingo, 1996). Pruett and Thomas (1996) noted that
“technological change drives and is driven by quality”. Moreover, in

48
strategic TQM, the focus is on issues related to social responsibilities to
attain high levels of competency (Madu and Kuei, 1993). From these
examples, it is obvious that people, design of products and process
improvement, and social responsibilities represent the human,
technological, and organizational resources, respectively.
Hence, it is not surprising that Juran and Gryna (1993) emphasized that
quality should be viewed from a business rather than from a technical
perspective. Similarly, Rapert and Babakus (1996) postulate that “quality
should not be viewed merely as a problem to be solved; it should be viewed
as a competitive opportunity”. Madu and Kuei (1993) introduced SQM
through the philosophy of strategic TQM (STQM) and emphasized that
attention should be concentrated on both the customer and the
environment because they represent the driving force for any quality
agenda. They stated that:
This approach views quality as the driving force to the
survivability and competitiveness of a firm … rather than
viewing quality just from the standpoint of the direct
products and services … quality is seen as a reflection of
the overall performance of a firm.
This reveals that the strategic force of resources can present quality as a
tool for competitive advantage. In fact, the relationship between quality
management and “competitive strategy” has not been examined in depth or
given significant consideration in the literature (Chang et al., 2003). It is
surprising that there is almost no theory that supports this relationship
(Reed et al., 2000). However, respected quality gurus, such as Crosby
(1979), Feigenbaum (1991), and Deming (2000), mention that quality is a
significant source for sustainable competitive advantage. Moreover,
49
although quality literature has not clearly shown the relationship between
competitive strategy and quality, there is significant evidence in the
strategy literature regarding the importance of quality in competitive
advantage (Morgan and Piercy, 1996). It is almost agreed that TQM is a
source for sustainable competitive advantage (Reed et al., 2000), and that
TQM is the only mechanism to sustain competitive advantage (Spitzer,
1993).
Indeed, Powell (1995) proposed that competitive advantage can be
generated through TQM, while Douglas and Judge (2001) found a strong
relationship between TQM and competitive advantage in their empirical
study. Similarly, Morgan and Piercy (1996) reported that the development
of product/service quality is discussed extensively as a suitable
competitive strategy that leads to sustainable competitive advantage.
From the previous discussion, therefore, it can be derived that TQM has
the potential to generate competitive advantage. Importantly this potential
comes from the vital role of valuable resources. It is important to note that
competitive advantage does not result from TQM alone, but is also the
result of the interaction between “strategy, firm orientation, and the
environment” (Reed et al., 2000). They show “how the process of TQM has
the potential to create sustainability of advantage” through interaction
between different resources.
2.5.2 Linking Quality to Strategy
Quality, as a business issue, should be managed from a strategic base
(Beecroft, 1999). To illustrate this point, rather than seeking causes for
quality, attention should be “on the strategic use of quality” (Leonard and
McAdam, 2002). For many executives, the significance of quality is purely
50
centred on the operational issues of production or marketing (Pruett and
Thomas, 1996). A lack of quality strategies that direct TQM activities
(Leonard and McAdam, 2002) results in a failure of senior management to
implement TQM successfully. For example, Srinidhi (1998) reported that
practice experts in management are dissatisfied with the effects of
implementing quality methods, such as re-engineering, process value
analysis, activity based cost management, target analysis and cost of
quality analysis.
However, Srinidhi (1998) noted that the failure of quality methods in many
organizations occurs for two main reasons: the absence of assigning these
methods to the overall strategy; and the absence of coordination between
these methods. He added that quality management cannot be employed
successfully without linking its activities to the strategic initiatives of the
organization. To support this point of view, Preiss et al. (1996) stated that:
The reason there was little improvement in bottom line
profit in many companies that tried re-engineering, total
quality management, or many of the other recommended
practices is that the tactical changes were not coordinated
by an overall strategy.
Consequently, TQM cannot be performed successfully if it is separated
from the overall strategy. Therefore, the success of an organization
depends on quality issues being considered in all strategic actions of the
organization; the “key to success” is to recognize the manners by which
quality can be assimilated with the “corporate strategy” (Calingo, 1996).
Calingo added that successful quality management implies that quality
initiatives are employed in activities which are unified under a formulated
strategy.
51
2.5.3 Definition of SQM
As organizational aspects, such as HRM and organizational procedures,
are influenced by TQM, the concept of TQM can be developed to form what
is known as SQM (Leonard and McAdam, 2002). Leonard and McAdam
(2002) added that a better understanding of environmental issues results
when the focus of TQM is on the strategic aspects of the firm and “this
emphasizes the importance and impacts of SQM”. Indeed, from a strategic
point of view, “TQM was found to be a means of achieving strategic level
targets” (Leonard and McAdam, 2002). From these bases, many
researchers have attempted to define SQM. Garvin (1988) stated that the
absence of specific work (books or articles) that describes the evolution of
SQM as a concept means the starting date cannot be identified. In fact,
although SQM is introduced and described by Garvin through five
elements, he did not provide a definition. Madu and Kuei (1993) see STQM
is an extended form of TQM that is intended to set up organizations for the
future. They introduce SQM through the following definition of STQM:
Perform a customer- and environment-driven analysis of
the internal and external performance of a firm to drive
defects to zero and maximize the satisfaction of customers
with the products/services of the firm.
Put simply, SQM blends customers‟ feedback into the firm‟s strategies (Lo
et al., 1998). Juran and Gryna (1993) also defined SQM as a process of
setting long-term quality objectives and identifying the method of attaining
these objectives. Additionally, the British Standards Institution (BSI)
defined SQM as attaining a firm‟s goals using its organizational practices
and management attitude to utilize and bind all available resources
effectively (BSI, 1992).

52
However, these definitions are either too short or too general (Tummala
and Tang, 1996, Aravindan et al., 1996) and do not explain the critical
factors (elements) that interact to achieve quality objectives (Tummala and
Tang, 1996). Hence, Tummala and Tang have defined SQM as:
… a comprehensive and strategic framework linking
profitability, business objectives, and competitiveness to
quality improvement efforts with the aim of harnessing the
human, material and information resources organization-
wide in continuously improving products or services that
will allow the delivery of customer satisfaction.
While Tummala and Tang‟s definition of SQM highlights the significance of
utilizing resources, Srinidhi (1998) concentrates on linking quality
techniques with corporate strategy. According to Srinidhi, SQM is:
… the formulation and deployment of quality management
within the overall framework of strategic planning, in a
way that is aligned with all the other initiatives such as
process re-engineering, cost management, inventory control
and target analysis.
However, although Tummala and Tang identified seven critical elements
for SQM and highlighted the importance of these elements as the base of
forming strategies for quality improvement, the strategies have not been
included in their definition. In contrast, Aravindan et al. (1996)
emphasized the significance of such strategies and stressed that “quality
enhancement approaches” should be driven by specific strategies.
Therefore, they defined SQM as:

53
The process by which quality management activities focus
towards the long range direction and progress of quality
enhancement strategies by ensuring the careful
formulation through strategic quality planning, proper
implementation through vital quality strategies, and
continuous evaluation through quality improvement and
control.
Senthil et al. (2001) stated that Aravindan et al.‟s (1996) theoretical model
of SQM, which is based on Aravindan et al.‟s definition of SQM, is
comprehensive and provides a better explanation of SQM. Senthil et
al.(2001) illustrated that this is because a number of essential strategies
for quality enhancement have been considered in the model. Thus,
Aravindan et al.‟s definition seems to be the most suitable definition for
SQM.
In practice, SQM unites the concept of corporate strategy with TQM where
quality activities are substituted by initiatives “such as cycle-time
reduction and business process re-engineering” (Pheng and Hong, 2005).
Thus, as the linking process is not easy and needs a methodical frame,
Srinidhi (1998) introduced a framework, named “congruence management
business architecture” as a practical way of implementing SQM. He
identified three fundamentals for implementing SQM: continuous
improvement, facilitating instruments, and HR empowerment. Pruett and
Thomas (1996) have identified four elements to incorporate the concept of
quality management into strategic management: environment, leadership,
method, and systems view. These elements and other elements identified
by Garvin (1988), Juran and Gryna (1993), and Tummala and Tang (1996)
are listed in Table 2.1.

54
Table (2.1): SQM Elements
Author SQM elements
Garvin (1988) Performance;
Features;
Reliability;
Conformance;
Durability;
Serviceability;
Aesthetics; and
Perceived quality.
Juran and Gryna (1993) Define the mission of our organization;
Analyze the opportunities and threats;
Analyze strengths and weaknesses;
Identify and evaluate alternative strategies;
Select a strategy;
Develop goals;
Prepare detailed short range plans;
Translate plans into budgets; and
Monitor performance.
Tummala and Tang (1996) Customer focus;
Leadership;
Continuous improvement;
Strategic quality planning;
Design quality, speed and prevention;
People participation and partnership; and
Fact-based management.
Pruett and Thomas (1996) Environment;
Leadership;
Method; and
Systems view.
Srinidhi (1998) Notion of continuous improvement;
Information and measurement; and
Involvement and empowerment of all employees.

55
2.6 Goal Programming and Analytic Network Process in Resources and
Quality Issues
This part of the chapter presents a number of applications for two
decision-making methods that are employed in this research. The first
method is the Analytic Network Process (ANP). This part of the chapter also
describes the Analytic Hierarchy Process (AHP), which represents root of
ANP and later AHP became known as a special form of ANP. The second
method is one of the well-known multi-criteria decision making (MCDM)
tools, Goal Programming (GP). The aim of this part of the chapter is to
provide evidence that these methods can be applied successfully to
allocate resources and improve quality. Some examples also show how
these two methods can be integrated so that a decision making problem
can be formulated in one (single) model. This section highlights these
methods through examples, while more detailed explanations are
discussed in the next chapter.
2.6.1 GP and ANP/AHP in Resource Allocation
A significant number of researchers have shown that linear programming
(LP or the root of GP) has always been associated with the application of
AHP (the special form of ANP). The allocation of energy resources, such as
coal, natural gas, solar thermal and other such resources, are presented
by Ramanathan and Ganesh (1995) as a MCDM problem They suggested
that solving such a problem needs an incorporated methodology and
therefore developed a model that integrates AHP and GP, where AHP is
employed to rank and quantify the criteria as the first step. Then, GP uses
these ranked quantities as coefficients for decision variables. Similarly, Lee

56
and Kwak (1999) have combined GP and AHP in one model to allocate
information resources that are applicable to strategic planning in a health-
care system. They added that this model:
(1) Utilizes a GP approach to reflect the multiple, conflicting
goals of the health-care system; (2) employs a GP solution
process to reflect multi-dimensional aspects of the resource
allocation planning; and (3) allows for some degree of
flexibility of decision-making with respect to resource
allocation.
In fact, many studies have employed GP models to address various
decision making issues, especially in the field of resource allocation. For
example, Schroeder (1974) proposed a GP model that takes into account
the long-term planning and allocation of financial resources and human
resources (academic staff) in universities. The significance of the model
came from its consideration of the fact that the process of planning is
driven by financial resources. However, Diminnie and Kwak (1986)
expressed their understanding of the educational process and reported
that academic objectives could be negatively affected by a focus on
financial resources. Thus, another GP model is designed by Diminnie and
Kwak (1986) to reduce financial expenses with respect to academic
objectives. They emphasized that department chairmen and deans are
responsible for allocating and mobilizing resources. Another interesting
application of goal programming in allocating resources is proposed by
Mardle et al. (2000) and illustrates how fisheries‟ resources could be
controlled through the power of GP as a MCDM tool. The reason for their
selection of GP is that they have noticed that a fishery is a MCDM problem
that deals with different economic, biological and social goals, “such as
57
improving the income of fishers, reducing the catch of depleted species and
maintaining employment”. Strategic resources were also allocated by Blake
and Carter (2002) when they applied two GP models in hospitals.
According to them, these two models assisted the decision maker to
“explore an institution‟s production possibility frontier”. Therefore, GP is
considered as a suitable tool for allocating resources.
2.6.2 GP and ANP/AHP in Improving Quality
There are several examples of the application of GP in the field of quality.
Process control, as a common problem in the manufacturing environment,
has been solved by Sengupta (1981) using GP. The model enables
manufacturers to align output characteristics with their required
specifications. The proposed model is also generally suitable for any
process-control problem. Schniederjans and Karuppan (1995) also
considered twelve constructs for quality control as a measures for a quality
system in a service organization. They designed a GP model with the aim of
choosing the best combinations of quality control instruments to “assist
decision makers in designing service QC systems for all types of business
organization”. Similarly, Cherif et al. (2008) formulated a GP model
intended to incorporate decision makers‟ perspectives to design QCS. They
added that this is a multi-criteria decision making problem that employs
GP as a powerful technique to balance input levels and output
specifications.
Moreover, Quality Function Deployment (QFD) has been commonly used
with GP and AHP (special case of ANP). In fact, combining QFD and AHP is
common in quality literature. Specifically, AHP has always been used as a
tool for defining and ranking customer requirements (Armacost et al.,

58
1994; Koksal and Egitman, 1998; Zakarian and Kusiak, 1999; Ho et al.,
1999). Additionally, customer requirements and design requirements can
be optimally matched by using mathematical programming and GP
respectively, as illustrated recently by Karsak (2004) and Chen and Weng
(2006).
Karsak et al.‟s (2002) work illustrates how these studies combined
AHP/ANP with GP, with common methodology. They sought to solve a
decision making problem by aiming to select the product technical
requirements (PTRs) that should be focused on in order to design exactly
what customers need. Firstly, they built the QFD‟s house of quality (HOQ)
using ANP to translate the voice of the customers. This process was
achieved by ranking customer needs with respect to the main goal, as well
as the “inner dependence of the customer needs”. PRTs are also ranked in
similar way. The output of the ANP is represented by one goal, which
represents the voice of customers in GP. GP is then developed as a second
step to consider of other goals, such as “cost budget, extendibility, and
manufacturability that need to be taken into account in the analysis”.
Finally, GP is formulated in a way that selects the best PTRs for the
designing process. A similar application of ANP-GP by Liu and Hsiao
(2006) achieved the best “product architecture” through consideration of
customer requirements.
2.7 Summary
The role of resources in SM has been critically reviewed and it can be
concluded that strategies generally can‟t be executed without resources. It
has also been found that all TQM elements, which have always been under
investigations by quality gurus, can be classified as human,

59
organizational, or technological resources, as shown in Appendix (A).
Therefore, it was appropriate that the third part of this chapter handled
the discussion of QM from a strategic point of view (i.e. SQM, not TQM).
While it is difficult to consider all the studies that used ANP/AHP and/or
GP, many previous examples provide a better understanding of these
techniques that can be formulated and applied in resource and quality
issues. Logically, the formulation of any problem depends on its research
question. Thus, previous examples showed different scenarios using
ANP/AHP and/or GP to demonstrate that these methods are capable of
handling resource and/or quality issues. Additionally, these methods have
demonstrated their flexibility to be integrated into one model.

60
3.1 Introduction
This research has been executed in two main phases: quantitative and
qualitative. The two phases employed a total of three appropriate research
tools, which are introduced in this chapter. In regard to the quantitative
phase, two tools were employed: the Analytic Network Process (ANP) and
Goal Programming (GP). ANP and GP represent the first and the second
step of the quantitative phase, respectively. In the qualitative phase, the
semi-structured interviews were conducted to explain the quantitative
findings. For each tool, the discussion is divided into three sections:
providing general background about the method, explaining the reason
behind the selection of this method, and describing how the methodology
is conducted in this research. This chapter introduces these methodologies
while further details are provided in chapter 4 (Research Design) and
chapter 5 (Data Collection).
3.2 The Quantitative Phase
In the first step of the quantitative phase, the first four research questions
are to be addressed. The attempt to answer these questions considers the
interaction among the three types of resource (human, organizational, and
technological resources) (RQ1), resources and strategies (RQ2 and RQ3),
and the ability of strategies to enhance quality (RQ4). Such an interaction
Chapter
3
Research
Methodology

61
requires a tool, such as an ANP, that is capable of prioritizing resources
and strategies within the context of the developed research questions (RQ1
to RQ4). The ANP is also employed in this step to discover and explore the
mismatching between the resources needed for each strategy and the
resources actually allocated for each strategy. This raises the issue of the
resource allocation (resource allocation problem).
In the second step of the quantitative phase, the GP model is introduced to
handle the issue of resource allocation. This addresses the fifth research
question (RQ5), regarding the extent to which each strategy is under-
resourced or over-resourced. After addressing RQ5, the attempt is to
address the sixth research question (RQ6) within the qualitative phase (the
second phase) to explain the quantitative findings in term of why each
strategy is under-resourced or over-resourced. Figure (3.1) illustrates how
the six research questions are addressed within the two phases of this
research.

62
RQ1 To investigate inner-
dependency among the
three resources (HR, OR,
and TR)
RQ2 To investigate resource
needed for each strategy
(outer-dependency)
RQ3 To investigate the actual
resource support towards
each strategy
RQ4 To investigate strategies'
ability to enhance quality
Findings
analysis for
RQ2 and
RQ3
reveals:
“Resource
Allocation
Problem”
RQ5 To investigate:
HOW resources can be
allocated for each strategy to
satisfy its need, or at least to
minimize the extent to which
each single strategy is whether
over-resourced or under-
resourced.
Using
findings
of RQ1,
RQ2,
RQ3,
and
RQ4 to
Formul
ate a
GP
model
For
Further
Explanations
Phase 1:
Quantitative Analysis
Step 1: ANP Analysis Step 2: GP Model
Phase 2:
Qualitative Analysis
RQ6 To investigate:
WHY each single strategy may receive resources,
whether more (over-resourced) or less (under-
resourced), than what should be allocated for it.
Semi-structured Interviews
Figure (3.1) How the Six Research Questions are Addressed within the Two
Phases of this Research

63
3.2.1 First Step: The Analytic Network Process (ANP)
3.2.1.1 What is ANP?
Prior to discussing ANP, it is prudent to highlight the methodology from
which it is developed. In fact, ANP is a developed form of what is known as
AHP. In the 1970s, Saaty developed AHP as a method for allocating
resources in the military (Cheng and Li, 2001). AHP “is a general theory of
measurement” (Saaty, 1996). Cheng and Li stated that AHP “is becoming
quite popular in research due to the fact that its utility outweighs other
research methods”. AHP and ANP combine qualitative and quantitative
components in one technique. The qualitative component is represented by
identifying the decision criteria by which the model is structured; While
the pair wise comparison that resulted in numerical weights represents the
quantitative component of the model (Cheng et al., 2005; Cheng and Heng,
2004; Cheng and Li, 2001). In 1996, Saaty launched ANP as a developed
version of AHP. In fact, due to the flexibility of ANP to solve different and
more complex forms of decision making problems, Saaty (1999) reported
that AHP is a special case of ANP and defined ANP as a “general theory of
relative measurement used to derive composite priority ratio scales from
individual ratio scales that represent relative measurements of the
influence of elements that interact with respect to control criteria”. Saaty
(1996) presented his fundamental scale of absolute value that used in AHP
to carry out the comparison judgments of ANP. He stated that “this scale
has been validated for effectiveness not only in many applications by a
number people but also through theoretical comparisons with many other
scales”. This scale is shown in Table (3.1).
To explain how AHP works, a simple example is presented. Suppose that
there are two options related to three criteria for a specific objective (goal).

64
The decision maker wants to identify which option is more suitable. Figure
(3.2) shows the hierarchal representation of such a problem. In this case,
four pair wise comparison matrices should be developed. Firstly, the three
criteria supposed to be ranked and weighted with respect to the main goal.
The two options should also be ranked and weighted with respect to first,
second, and third criteria to represent the second, third, and fourth pair-
wise comparison matrices respectively.
Table (3.1) Saaty‟s (1996) scale for pair wise comparison
Intensity of
weight* Definition Explanation
1 Equal importance Two activities contribute equally to the
objective
3 Moderate importance Experience and judgment slightly favor
one over another
5 Strong importance Experience and judgment strongly favor
one over another
7 Very strong importance
or demonstrated
importance
An activity is favored very strongly over
another; its dominance demonstrated in
practice
9 Extreme importance
The evidence favoring one activity over
another is of the highest possible order of
affirmation
2, 4, 6, 8 Intermediate values When a compromise needed
*If activity i has one of the above non-zero numbers assigned to it when
compared to activity j, then j has the reciprocal value when compared with i

65
Main Goal
Option
2Option
1
Criteria
3
Criteria
2
Criteria
1
Figure (3.2): The Structure of AHP
After pair-wise comparison matrices are formed, the next step is to
calculate and normalize the eigen-vector for each matrix. A simple
illustration for this step is presented by Cheng and Li (2001) when they
reported that this step is done by:
dividing the elements of each column of the matrix
by the sum of that column (i.e. normalizing the
column); then, obtaining the eigen-vector by adding
the elements in each resulting row (to obtain “a row
sum”) and dividing this sum by the number of
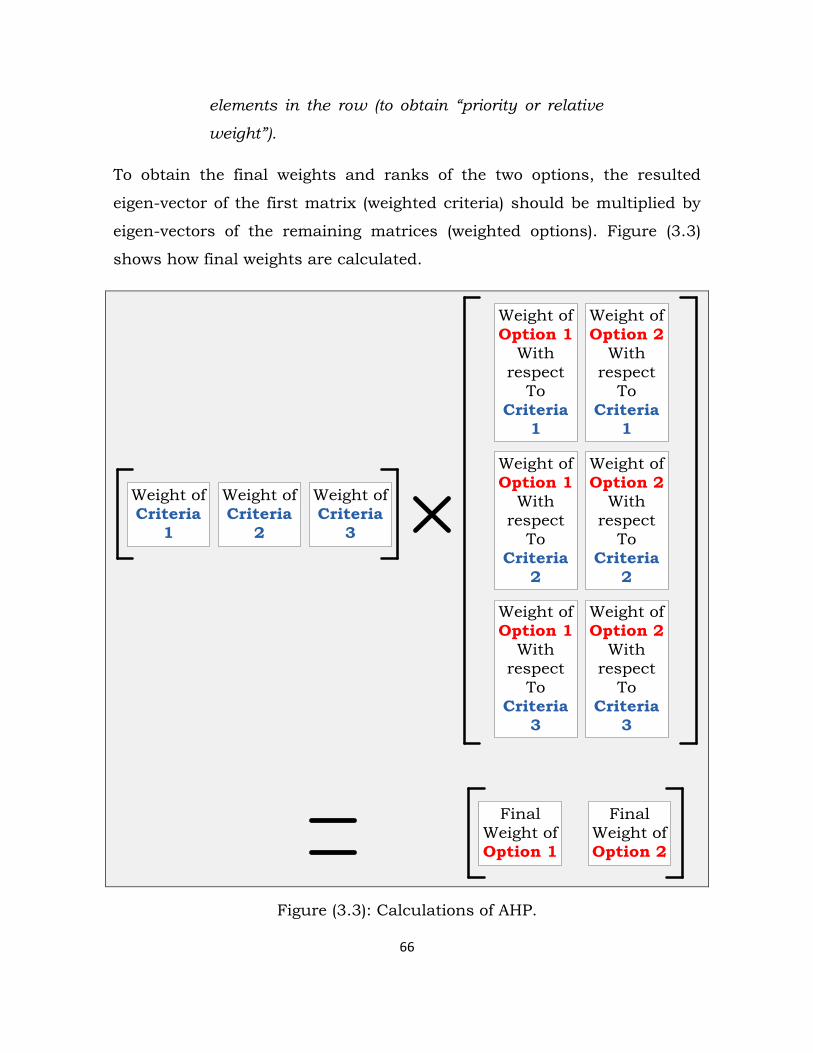
66
elements in the row (to obtain “priority or relative
weight”).
To obtain the final weights and ranks of the two options, the resulted
eigen-vector of the first matrix (weighted criteria) should be multiplied by
eigen-vectors of the remaining matrices (weighted options). Figure (3.3)
shows how final weights are calculated.
Weight of
Criteria
1
Weight of
Option 1
With
respect
To
Criteria
2
Weight of
Criteria
3
Weight of
Criteria
2
Weight of
Option 2
With
respect
To
Criteria
2
Final
Weight of
Option 1
Final
Weight of
Option 2
Weight of
Option 1
With
respect
To
Criteria
1
Weight of
Option 2
With
respect
To
Criteria
1
Weight of
Option 1
With
respect
To
Criteria
3
Weight of
Option 2
With
respect
To
Criteria
3
Figure (3.3): Calculations of AHP.

67
However, ANP differs slightly from AHP and offers more flexible
methodology for a decision maker. It is difficult for many decision making
problems to be formulated in a hierarchical way (Saaty, 2006; Buyukyazıcı
and Sucu, 2003; Saaty, 1996). In AHP, elements in lower level of hierarchy
are weighted and ranked with respect to the higher level. Figure 3.2 shows
that the rankings of the three criteria depend on the perception of the
main objective (i.e. higher level than criteria). It is also shown that ranking
of the two options depends on the perception of each criterion, which is
placed at a higher level compared to the options. This form of interaction
between these levels explains what Saaty (1996) referred to as
“dependence”. In ANP, however, the model is not restricted by such a
hierarchy. This point is clearly explained by Saaty (1996), the founder of
AHP as well as ANP, when he stated that in ANP:
Not only does the importance of the criteria
determine the importance of the alternatives, as in
a hierarchy, but also the importance of the
alternatives themselves determines the importance
of the criteria
When Saaty stated that “the importance of the alternatives themselves
determines the importance of the criteria”; he was referring to what he
called “Feedback”. He added that the dependence-feedback structured
model does not have to show the hierarchy as it looks like a network.
Significant problems can then be modelled using such a network
(Buyukyazıcı and Sucu, 2003). Thus, Saaty (1996) replaced the word
“level”, as used in AHP, with the word “cluster”, as used in ANP, to
represent a model in a more sensitive manner. These clusters include
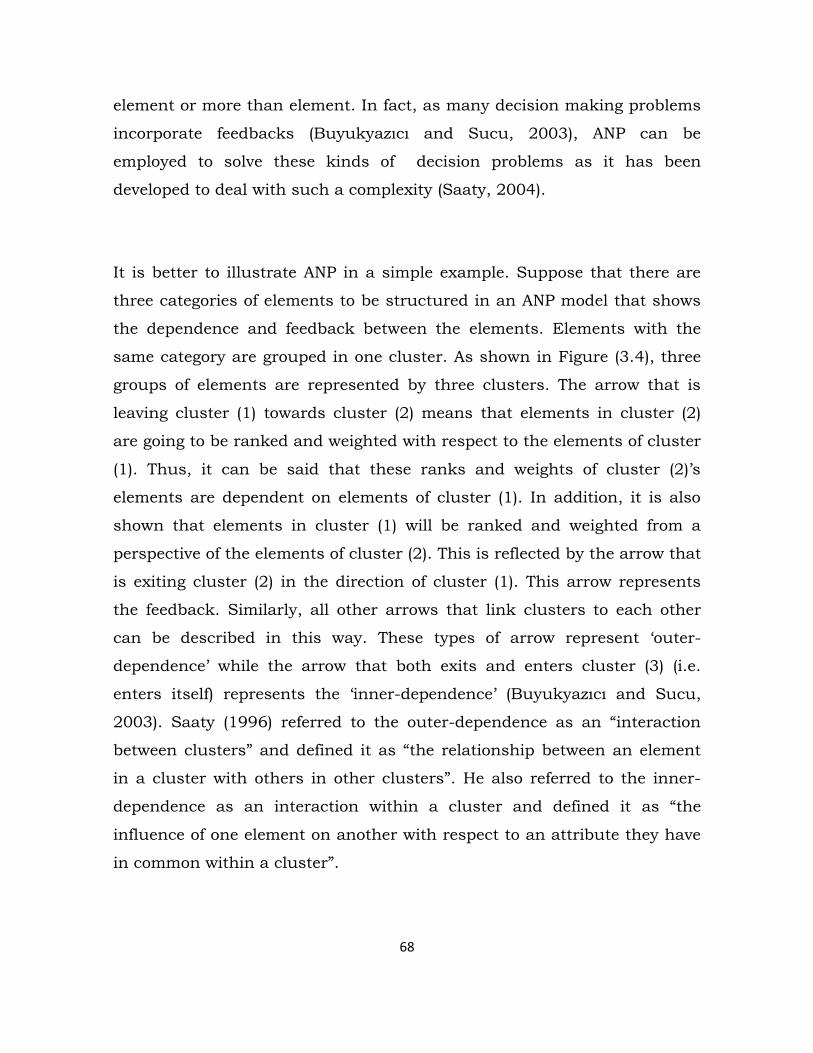
68
element or more than element. In fact, as many decision making problems
incorporate feedbacks (Buyukyazıcı and Sucu, 2003), ANP can be
employed to solve these kinds of decision problems as it has been
developed to deal with such a complexity (Saaty, 2004).
It is better to illustrate ANP in a simple example. Suppose that there are
three categories of elements to be structured in an ANP model that shows
the dependence and feedback between the elements. Elements with the
same category are grouped in one cluster. As shown in Figure (3.4), three
groups of elements are represented by three clusters. The arrow that is
leaving cluster (1) towards cluster (2) means that elements in cluster (2)
are going to be ranked and weighted with respect to the elements of cluster
(1). Thus, it can be said that these ranks and weights of cluster (2)‟s
elements are dependent on elements of cluster (1). In addition, it is also
shown that elements in cluster (1) will be ranked and weighted from a
perspective of the elements of cluster (2). This is reflected by the arrow that
is exiting cluster (2) in the direction of cluster (1). This arrow represents
the feedback. Similarly, all other arrows that link clusters to each other
can be described in this way. These types of arrow represent „outer-
dependence‟ while the arrow that both exits and enters cluster (3) (i.e.
enters itself) represents the „inner-dependence‟ (Buyukyazıcı and Sucu,
2003). Saaty (1996) referred to the outer-dependence as an “interaction
between clusters” and defined it as “the relationship between an element
in a cluster with others in other clusters”. He also referred to the inner-
dependence as an interaction within a cluster and defined it as “the
influence of one element on another with respect to an attribute they have
in common within a cluster”.

69
Cluster 1
Element
1
Element
2
Element
3
Cluster 3
Element
1
Element
2
Element
3
Cluster 2
Element
1
Element
2
Element
3
Figure (3.4): Example of ANP
The eigen-vectors that result from the pair-wise comparison matrices of
the ANP model are presented in a matrix called “supermatrix” (Saaty,
1996). This matrix is supposed to be multiplied by itself frequently until
each column is the same in each block in the matrix. The form of the
supermatrix that represents the relationships between the elements and
the clusters for the model shown in Figure (3.4) is represented in Table
(3.2). Cheng et al. (2005) summarize the qualitative as well as the
quantitative steps of ANP, as shown in Table (3.3).

70
Table 3.2: The Form of the Supermatrix
With respect to
Cluster 1 Cluster 2 Cluster 3
Elements
1 2 3
Elements
1 2 3
Elements
1 2 3
Cluster
1
Element 1 W W W
Element 2 W W W
Element 3 W W W
Cluster
2
Element 1 W W W W W W
Element 2 W W W W W W
Element 3 W W W W W W
Cluster
3
Element 1 W W W - W W
Element 2 W W W W - W
Element 3 W W W W W -

71
Table 3.3: Steps of the ANP
Steps Type
1 To state the decision problem Qualitative
2 To make sure that the decision problem is to be solved by
ANP
Qualitative
3 To structure the unstructured decision problem Qualitative
4 To determine who the raters are Qualitative
5 To design a questionnaire for eliciting data from raters Qualitative
6 To calculate the eigen-vector of each of the developed
matrices
Quantitative
7 To measure the consistency ratio (CR) of each of the matrices
to find the inconsistency of ratings
Quantitative
8 To form the supermatrix by the eigen-vectors of the individual
matrices (also known as submatrices)
Quantitative
9 To compute the final limit matrix Quantitative
3.2.1.2 Why ANP?
Although the ranking and weighting can be generated by other methods,
ANP is found to be more appropriate in meeting the needs of this research.
For example, although the Interpretive Structural Model (ISM) is a
methodology that can be used to rank and quantify a group of variables
(Mandal and Deshmukh, 1994; Singh et al., 2003), it concentrates mainly
on the driving power of the variables to identify whether they are
dependent, independent (driver), autonomous, or linkage. Additionally,
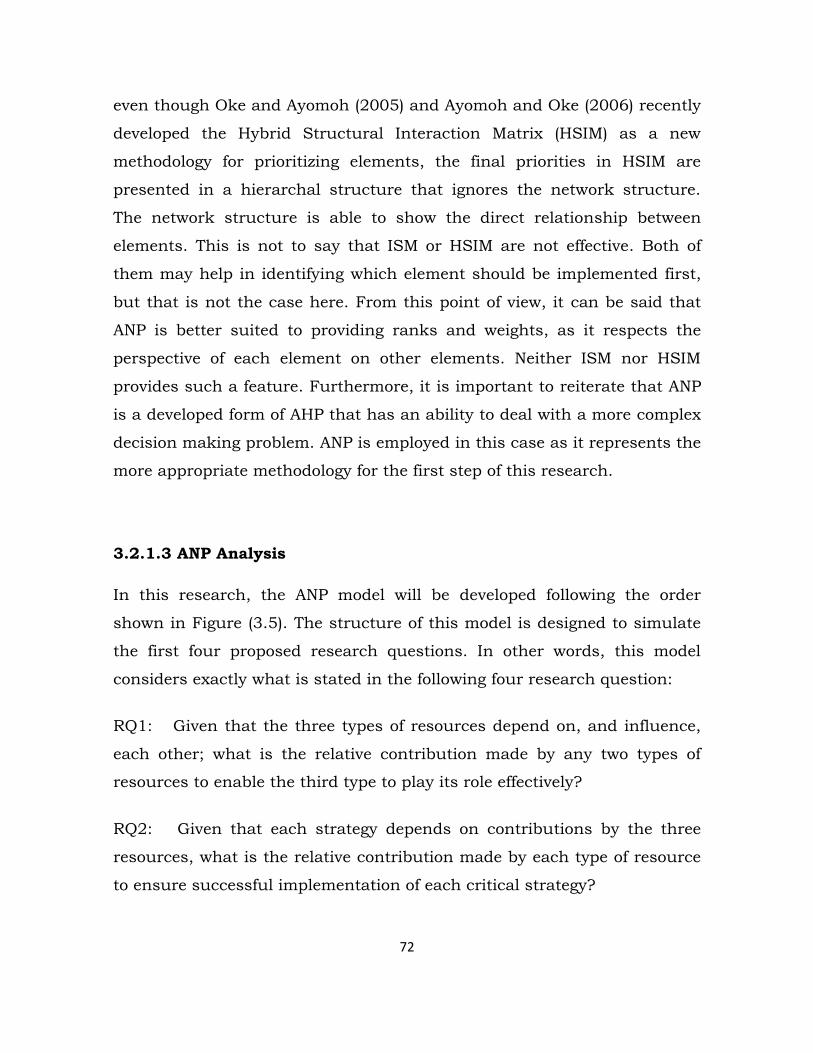
72
even though Oke and Ayomoh (2005) and Ayomoh and Oke (2006) recently
developed the Hybrid Structural Interaction Matrix (HSIM) as a new
methodology for prioritizing elements, the final priorities in HSIM are
presented in a hierarchal structure that ignores the network structure.
The network structure is able to show the direct relationship between
elements. This is not to say that ISM or HSIM are not effective. Both of
them may help in identifying which element should be implemented first,
but that is not the case here. From this point of view, it can be said that
ANP is better suited to providing ranks and weights, as it respects the
perspective of each element on other elements. Neither ISM nor HSIM
provides such a feature. Furthermore, it is important to reiterate that ANP
is a developed form of AHP that has an ability to deal with a more complex
decision making problem. ANP is employed in this case as it represents the
more appropriate methodology for the first step of this research.
3.2.1.3 ANP Analysis
In this research, the ANP model will be developed following the order
shown in Figure (3.5). The structure of this model is designed to simulate
the first four proposed research questions. In other words, this model
considers exactly what is stated in the following four research question:
RQ1: Given that the three types of resources depend on, and influence,
each other; what is the relative contribution made by any two types of
resources to enable the third type to play its role effectively?
RQ2: Given that each strategy depends on contributions by the three
resources, what is the relative contribution made by each type of resource
to ensure successful implementation of each critical strategy?
73
Figure (3.5): The ANP Analysis
RQ3: How is each available resource allocated for the eight strategies to
ensure successful implementation?
RQ4: In light of their ability to enhance quality, what is the relative
contribution being made by each of the eight critical strategies?
As shown schematically in Figure (3.5), the ANP model was developed by
identifying three clusters. The cluster of resources comprises the three
types of resource (HR, OR, and TR) while the cluster of strategies includes
all eight critical strategies listed in Table 1.1. The third cluster contains
one element: the ability to enhance quality. A sequence of pair-wise
comparisons has been made among these clusters. These pair-wise

74
comparisons were developed according to Saaty‟s scale, where a score of 1
signifies equal importance between the two elements under comparison
and a score of 9 indicates that one element is extremely important (or
preferred) compared with the other element [see Table (3.1)].
This scale was used firstly to determine the inner dependence among the
three resources (RQ1) (see Figure (3.5)) by indicating the extent to which
one type of resource has more influence than the other type in enabling
the third type to play its role effectively. As shown in Figure (3.5), the
arrow exiting the cluster of resources and entering itself (RQ1) implies
that the relative contributions of any two types of resources (HR, OR, or
TR) will be compared with each other with respect to the third type of
resource to address the first research question (RQ1). For example, OR is
compared with TR with respect to their relative contribution to HR to be
effectively activated. The remaining comparisons are conducted in a
similar way to address RQ1.
In regard to the second research question (RQ2), the same scale is used to
compare resources (with respect to each strategy) in terms of the
contribution they each make to each strategy. As seen in Figure (3.5), the
arrow exiting the cluster of strategies and entering the cluster of resources
(RQ2) implies that the relative contributions of HR, OR, and TR will be
compared with each other with respect to each critical strategy to address
the second research question (RQ2). For example, all types of resources
(HR, OR, and TR) are compared among each other relatively with respect
to their relative contribution to the strategy of MQS to be successfully
implemented. Similarly, remaining comparisons are conducted between
resources with respect to each single strategy to address RQ2.

75
For the third research question (RQ3), the scale is used to compare the
eight critical strategies considering the support of resources for each
strategy. Figure (3.5) also illustrates that the arrow exiting the cluster of
resources and entering the cluster of strategies (RQ3) implies that the eight
critical strategies will be compared with each other with respect to the
actual received support from HR, OR, and TR to identify how resources are
allocated for the eight strategies and address RQ3. For example, all eight
strategies are compared with each other relatively with respect to the
actual support received from HR. Similar comparisons are conducted
between strategies with respect to the actual received support from OR and
TR.
Finally, the scale is also used to compare the contribution of each critical
strategy to enhance quality (RQ4). As noticed in Figure (3.5), the arrow
exiting the cluster labelled “ability to enhance quality” and entering the
cluster of strategies (RQ4) implies that the eight critical strategies will be
compared with each other with respect to their ability to enhance quality
(addressing RQ4). A questionnaire was designed to execute the ANP and
divided into three parts (part 1, part 2 A, and part 2 B) that include all
required pair-wise comparisons for the first four research questions.
Further explanations regarding data collection are provided in chapter 5
and a sample of the questionnaire is presented in Appendix (B).
3.2.2 The Second Step: The Goal Programming (GP)
3.2.2.1 What is Goal Programming (GP)?
GP is an application of the Linear Programming (LP) model for considering
multiple goals (Levin et al., 1992). In fact, any LP model is aimed to
76
minimize or maximize a particular criterion of its objective function
(Anderson and Lievano, 1986). However, it is not always suitable for the
decision maker to formulate an individual objective that is to be
maximized or minimized (Anderson and Lievano, 1986; Tamiz et al., 1998;
Render et al., 2006). Indeed, managers are always challenged to achive
several goals within a single problem, which can be impossible to achieve
at one time (Cooke, 1985). Thus, GP is a method for solving Multi-Criteria
Decision Masking problems within the structure of LP (Anderson et al.,
2003). It is always presented as a quantitative research method (Cooke,
1985; Anderson and Lievano, 1986; Levin et al., 1992; Tamiz et al., 1998;
Aouni and Kettani, 2001; Anderson et al., 2003; Render et al., 2006).
Anderson and Lievano (1986) defined GP as an “extension of linear
programming in which management objectives are treated as goals to be
attained as closely as possible within the practical constraints of the
problem”. Render et al. (2006) also reported that in contrast to LP, GP
allows various objectives to be considered. Hence, they added that while LP
„optimize‟, GP tries to „satisfy‟ the goals as much as possible to come closer
to the targets. Simply, GP is a quantitative research method that aims to
minimize deviations of variables from the identified targets (Cooke, 1985;
Anderson and Lievano, 1986; Levin et al., 1992; Tamiz et al., 1998; Aouni
and Kettani, 2001; Anderson et al., 2003; Render et al., 2006). Tamiz et
al. (1998) stated that:
Within this kind of decision environment the DMs
try and achieve a set of goals (or targets) as closely
as possible. Although GP was not originally
conceived within a satisfying philosophy it still
77
provides a good framework in which to implement
this kind of philosophy.
Indeed, GP as a decision making tool is paid significant attention from
academics and practitioners who improved such a technique through
their theories and applications (Aouni and Kettani, 2001). Aouni and
Kettani added that GP as a research methodology, is going to be more
common as it is applicable to many fields including quality management,
human resources and production. They also stated that:
Another interesting development is the utilization of
GP as a statistical tool for estimation. Recent
studies suggest that GP could be an alternative to
the conventional statistical methods. In fact, GP
provides more flexibility for modeling the estimation
process; this flexibility provides the analyst with a
platform from which his/her knowledge and
experience can be an input to the parameters’
estimation.
In LP, the objective function contains only one goal that is subject to a
number of constraints. However, in GP, instead of considering each goal in
the objective function, goals are considered as constraints (goal
constraints) while remaining constraints (if applicable) represent system
constraints. Therefore, the objective function is aiming to minimize the
amount by which each goal deviates from targets. These amounts are
expressed as deviational variables, which mean that to attain the goal
exactly, the value must be equal to zero. Thus, GP “allows taking into

78
account simultaneously many objectives while the decision-maker is
seeking the best solution from among a set of feasible solutions” (Aouni
and Kettani, 2001). Moreover, if a decision maker finds that one goal is
more significant than other goal, GP is able to solve such a complexity
(Levin et al., 1992). The GP model in this case is called pre-emptive GP
(Winston, 1994). Render et al. (2006) stated that “it is necessary to
establish a hierarchy of importance among these goals so that lower-
priority goals are tackled only after higher-priority goals are satisfied”. This
will avoid “trade-offs” between goals of higher priority and lower priority,
and will also ensure that higher priority goals are satisfied before lower
priority (Anderson et al., 2003; Anderson and Lievano, 1986). Moreover,
the decision maker can add weights as coefficients in the objective
function for deviational variables (Anderson and Lievano, 1986; Render et
al., 2006) when the decision maker wants to show the associated
importance of the goals. Anderson et al. (2003) summarized the procedure
of developing a GP model in Table (3.4).
3.2.2.2 Why GP?
The ANP model quantitatively differentiates between the needed (critical or
important) resources for each strategy and the support received.
Responses to RQ2 may indicate that the needed HR (human resources) for
the implementation of the first strategy (MQS), for example, is X %, while
responses to RQ3 could indicate that HR (human resources) represents
more or less than X %.
Similarly, other strategies may have deviations between the perception of
what is needed and what is considered to be allocated from HR, OR and TR

79
(Further detailed explanations regarding how these differences are
obtained is provided in chapter 6). In such a situation, the company
cannot exactly satisfy the need of each strategy from each type of resourc
unless a single strategy receives more or less than what should be
allocated. This is because there are seven remaining strategies and each
strategy is in the same situation. Hence, the need for GP to handle such an
interaction arises.
Table (3.4): Steps for Formulating a GP Model summarized by Anderson et
al. (2003)
Steps of Goal Programming
1 Identify the goals and any other constraints that reflect resource capacities or other restrictions that may prevent achievement of the goals.
2 Determine the priority level of each goal; goals with priority level P1 are most important, those with priority level P2 are next most important, and so on.
3 Define the decision variables.
4 Formulate the constraints in the usual linear programming fashion.
5 For each goal, develop a goal equation, with the right-hand side specifying the target value for the goal. Deviation variables d1+ and d1- are included in each goal equation to reflect the possible deviations above or below the target value.
6 Write the objective function in terms of minimizing a prioritized function of the deviation variables.
To illustrate, responses to RQ1 indicate the contribution of each type of
resources among each other (inner-dependence), and responses to RQ2
indicates the needed resources for each strategy (outer-dependence).
Combining the results of RQ1 and RQ2 (using ANP) indicates the overall
contribution of each type of resources. From this point of view, the overall
contributions of HR, OR, and TR are considered representative of the
available resources for the investigated company. In other words, the

80
values (in percentages) of H, O, and T that belong to the available HR, OR,
and TR respectively are considered as system constraints for the GP model
as shown in Figure (3.6). So the first challenge for the firm is how to
exactly satisfy the need of the strategy of MQS (h (1), o(1), and t (1) ) for
example, within the existence of the remaining seven strategies, which are
actually sharing the MQS in an attempt to meet their own needs from the
overall HR (H%), OR (O%), and, TR (T%) as shown in Figure (3.6).
In the same way, as answering RQ3 provides the allocated resources for
each strategy, and as answering RQ4 provides the contribution of each
strategy to enhance quality, using ANP to combine the results of RQ3 and
RQ4 obtains the overall significance of each strategy. From this point of
view, the resulted overall weights of each strategy are considered to
represent the overall resources (whether HR, OR, or TR) that should be
allocated for each strategy. In the other word, the values of (s(i)), as shown
in Figure (3.6), are considered as objective constraints for the GP model.
So, regardless of the overall HR, OR, and, TR available (system
constraints), the second challenge for the firm is that how it can be
guaranteed that even though the actual need of the strategy of MQS,
for example, from HR (h (1) ), OR (o (1) ), and, TR (t (1)) were exactly
satisfied, the overall of resources that should be allocated for this
strategy (s (1)) would be maintained. With this in mind, the remaining
strategies are in the same situation; that is, each strategy has its own
objective that needs to be optimized. Specifically, the objective of each
strategy is to maintain what should be allocated for each strategy
[maintain s(i)]. However, as there are eight different strategies, the focus
should be on „satisfying‟ the objectives rather than to „optimizing‟ them.
From this point of view, the GP model is needed to see how far each
strategy is from its own objective (target), if its objective is to satisfy its
own need as much as possible (minimize the deviational variables).

81
3.2.2.3 The GP Model
As discussed, answering the previous research questions through the
proposed ANP model will result in exploring a deviation between what is
perceived to be needed and what is considered to be allocated for each
single strategy. This may result in a resource allocation issue; that is, a
situation may exist when a strategy i might mobilize more than (or less
than) what has been assigned (allocated) for it. Hence, in order to identify
the extent to which each single strategy is lacking in or overloaded by
resources (i.e. addressing RQ5), this thesis formulates the following GP
model:
Objective Function:
Minimize i [ di¯+ di
+ ]
Subject to:
[ h(i) × HR] + [ o(i) × OR] + [ t(i) × TR] + di¯- di
+ = s(i)
di¯, di
+ ≥ 0

82
• Subjected To:
h(i) HR+ o(i) OR + t(i) TR + di- - di
+ = s(i)
HR = H
OR = O
TR = T
System Constraints
di-, and di
+ ≥ 0, where i = 1, 2, 3, … 8
8 GoalConstraints(i = 1, 2, …8)
The GP Model [ to address RQ5 ]
• Objective Function:
Minimize ∑ Pi [ di- + di
+ ]
h (i) , o (i), and t (i) are the needed HR, OR,and TR for strategy i respectively. [resultedfrom RQ2- see Tables (6.2), (6.8) for company (A)
and Tables (6.10), (6.16) for company (B) in Chapter 6.
Answering RQ3 and RQ4(combined) provides theoverall resources thatshould be allocated for eachsingle strategy (i). [See Table(6.6) for company (A) and Table(6.14) for company (B) in Chapter 6].
Answering RQ1 and RQ2 (combined)provides the overall available resources[See Table (6.3) for company (A) and Table (6.11) forcompany (B) in Chapter 6].
Figure (3.6): The Proposed Hybrid ANP-GP Methodology
RQ2
RQ3
RQ4
RQ1ANP Analysis
[to address RQ1-RQ4]

83
Where HR, OR, and TR are decision variables for human, organizational, and technological
resources respectively; H, O, and T represent the overall available human, organizational,
and technological resources in a firm respectively; h (i) , o (i), and t (i) are the needed HR,
OR, and TR for a strategy i respectively; s (i) represents the amount of resources that should
be allocated for a strategy i; Pi represents the priority level for a strategy i, where the
highest priority is assigned to the strategy that receives more resources; n represents the
total number of strategies under the investigation (8 strategies); di+ and di
- represent the
deviational variables that illustrate to what extent a strategy i is “overloaded by” or “lacking
in” resources respectively.
The objective function is to minimize di+ and di
- to satisfy the needs of each strategy i
while maintaining s (i) (i.e. maintaining the amount of resources that should be allocated
for each strategy i ) as much as possible. As the inputs of the GP model were generated
from the results of the proposed ANP model, further description regarding the formulation
of the GP model is presented chapter 6. Figure (3.6) illustrates how the ANP-GP model is
developed.
3.3 The Qualitative Phase
This phase is conducted to address RQ6 in a qualitative manner and is to
be conducted using a qualitative tool known as semi-structured interviews.
Further details about semi-structured interviews are provided in next
sections.
3.3.1 Semi-Structured Interviews
Semi-structured interviews are one of the most common types of interview.
It might be seen as the most important method of executing an interview

84
due its flexibility in mixing structured with unstructured questions, which
in turn improve the collected qualitative data (Gillham, 2005). Gillham
concluded that the semi-structured interview is a type of interview in
which prepared questions are asked of all participants to obtain open-
ended answers that permit for further unprepared questions to be involved
to clarify some issues during the interview. Indeed, Bryman and Bell
(2007) confirmed that in this type of interview, the investigator has a list of
inquiries on particular issues to be included while at the same time the
participant is offered a flexible manner of answering. They explained that
these issues might not be presented in the same order that they are
“outlined on the schedule”. However, they also clarified that “questions
that are not included in the guide may be asked as the interviewer picks
up on things said by interviewees”. In fact, many methodologists confirmed
that the order of presenting issues and the phrasing of the questions are a
matter of investigator‟s tact (Corbetta and Patrick, 2003; Denscombe,
2007; French et al., 2001). Denscombe (2007) reported that this is
important to allow the interviewee to build up and expand his or her views
and thoughts, as well as to enable the interviewee to converse more
broadly on the subjects and concerns presented by the investigator.
However, this type of interview consumes time and costs and the
interviewer must have the required skills or be trained to conduct the
interview (Gillham, 2005).
3.3.2 Why Semi-structured Interview?
The two steps of the quantitative phase (ANP and GP) are executed to
ultimately answer RQ5, which helps to identify (quantitatively) how far
each strategy is from attaining its target. The phrase “how far”
quantitatively implies determining the values of di+ and di
-. Hence, in

85
order to know “why” resource shortages (di-) and overloading (di
+) appear
in quality strategies (i.e. to answer the RQ6), the qualitative phase is
conducted through employing the semi-structured interview. The aim of
this phase is generally to explain the reasons behind the quantitative
findings.
In fact, given that RQ6 requires a flexible technique to obtain as much
detailed explanation as possible, the semi-structured interview is
considered an appropriate choice. Even though the investigated issue in
such interviews is specific, (as in RQ6), interviewees are free to respond as
they see fit and, in such a situation, the interviewer has a chance to
encourage the interviewee “to expand on their answers by probing and
prompting” (French et al., 2001). Similarly, Corbetta and Patrick (2003)
stated that “within each topic, the interviewer is free to … give
explanations and ask for clarification … and to establish his/her own style
of conversation”. Denscombe (2007) also confirmed that in semi-structured
interviews, the answers are “open-ended”, and the focus is on how to
obtain sophisticated details about certain issues from the interviewee. In
this regard, qualitative findings are presented in chapter 7.
3.3.3 Conducting the Semi-structured Interviews
Generally, as the objective of the semi-structured interviews is to disclose
obtainable knowledge in a manner that can be articulated as answers
(Flick, 2009), semi-structured interviews are employed here to obtain
further/qualitative explanations through answering RQ6. Accordingly,
both prepared and unprepared questions are involved in this phase of
research. In regard to the former, they are prepared in a way that
encourages the interviewer to provide explanations. For instance, the

86
second part of each prepared question includes “why?” as an inquiry. Of
course, unprepared questions share the same objective, but are only
presented when they are needed as described above. It can be said that the
prepared questions are considered as guidelines for the interview. In fact,
according to Corbetta and Patrick (2003), “the interviewer‟s outline … may
simply be a checklist of the topics to be dealt with, or a list of questions
(usually of a general nature) having the goal supplying the interviewer with
guidelines”. The interview questions are provided in Appendix (C).
As Meuser and Negal, (2002) argue, expert interviews are a form of
conducting semi-structured interviews in which the participant “is of less
interest as a person than in his or her capacity of being an expert for a
certain field of activity” (Flick, 2009). Flick illustrated that the participant
is involved in the interview as a part of a “group of specific experts” rather
than representing him or herself. Therefore, six experts from each
company (total = 12) participated in the semi-structured interview to
execute the qualitative phase of this research. In this regard, further
details are provided in chapter 5.
3.4 Summary
The methods that are used in this research are described in this chapter.
In particular, this chapter shows how the developed research questions
will be answered by executing these methods. It illustrates „why‟ and „how‟
ANP is considered an appropriate technique to handle the first four
research questions due to its ability to deal with the interaction between
resources and strategies. Regarding RQ5, it was found to be suitable to
formulate a GP model to deal with the multi objectives of quality strategies.
Furthermore, as both ANP and GP represent the quantitative phase of this

87
research, it is illustrated that using the semi-structured interview in the
qualitative phase (answering RQ6) can help obtain further explanations.
Chapters 4 and 5 provide further details. More specifically, the focus in
chapter 4 is to explain in detail how these tools are executed in a mixed
design within the context of the case study while chapter 5 concentrates
on the aspects of data collection that are related to these methods.

88
4.1 Introduction
This chapter discusses how this research is designed and, in particular
how it is carried out within the context of „case study‟. Specifically, this
research develops a comparative analysis by selecting and investigating
two cases/companies within a single study. To the best of the author‟s
knowledge, the work of Yin (2003) in his book Case study research: design
and methods is the most respected work in the field of case study research
design. Accordingly, this case study research is conducted according to
Yin‟s elements of conducting case studies and most of the explanations are
obtained from his words. Of course, these explanations are supported by
the opinions of respected methodologists in the field. The chapter
describes how the case study is constructed with respect to employing the
appropriate research questions, propositions and unit of analysis as well
as the appropriate manner of presenting the findings. Validity as well as
reliability of the case study is highlighted. Case study research utilizes
more than one source of data, so this chapter also discusses the notion of
mixed method research and explains how this case study is built by
blending two quantitative techniques and one qualitative method. In this
regard, Creswell and Clark‟s (2007) contribution to the field of mixed
method research is paid significant attention in this chapter and in
developing this case study research.
Chapter
4 Research Design

89
4.2 Case Study as a Research Design
Before discussing the aspects of the case study, the related concepts for
research design are appropriately introduced. As the notion of „research
design‟ may conflict with the meaning of the „methodology‟, it is reasonable
to illustrate the difference. Methodology refers to theoretical frame and
primary suppositions of the study (Van Manen, 1990) while research
design in turn is a map of activities that connects the theoretical
suppositions to particular methods (Creswell, 2003; Crotty, 1998).
Methods are more precise as they refer to particular ways or processes of
gathering and analyzing data (Creswell, 2003; Van Manen, 1990). In fact,
Yin (2003) defined research design as a rational progression that links the
practical data to the original research questions to provide reasonable
conclusions. He illustrated that, generally, the research design is the
“logical plan for getting from here to there, where here … the initial set of
questions to be answered, and there is some set of conclusions”. However,
Yin declared that, “between here and there”, critical milestones could exist
such as steps of data gathering and data analysis. Within the context of
case study, Yin emphasized that the key reason of research design is to
protect the entire study from having answers that do not fit appropriately
with the original research questions. Thus, he believes that a research
design should deal “with a logical problem and not a logistical problem”.
Case study is a form of research design. In this regard, Schramm (1971)
defined case study as an attempt to clarify “a decision or set of decisions,
why they were taken, how they were implemented and with what result”.
Yin (2003) in turn defined case study as practical research that examines
an existing phenomenon in its authentic context, specifically if the borders
among the phenomenon and its context are not obviously apparent.

90
Accordingly, he stated that case study is “a comprehensive research
strategy”.
The processes of attempting case study as a research design have to be
unambiguous. Riege (2003) reported that designing case study is generally
“more subjective” than other research designs. Indeed, according to Yin
(2003), it is a fact that case study research needs to be “codified”. Yin
explained that case study design is different from other research strategies
as there is an absence of an inclusive “catalog” for designing case study
which “is a separate research method that has its own research designs”.
Even though Yin mentioned that his manner of conducting case study
requires continuous revision and adjustment in the future, he emphasized
that this manner will help the researchers “to design more rigorous and
methodologically sound case studies”. From this point of view, Yin
identified five elements for any case study research design:
1. Research questions;
2. The case study‟s propositions, if any;
3. The unit of analysis;
4. The logic linking the data to the propositions; and
5. The criteria for interpreting the findings.
This research, attempts to develop a case study research design using the
above elements as generic guidelines. Aspects of each element are
presented in the following sections.

91
4.2.1 Case Study Research Questions
The decision to conduct a case study should consider the types of research
questions involved. When Yin (2003) handled the issue of research
questions, he stressed that case study is suitable for “how” and “why”
questions rather than “what”, “who”, “where” , “how many”, or “how much”
questions. He explained that such questions are more suited to exploratory
studies or when the objective of the study is to “describe the incidence or
prevalence of a phenomenon or when it is to be predictive about certain
outcomes”. Case study, however, explains inquiries, which can be driven
using “how” and “why” questions (Benbasat et al., 1987). Indeed,
Edmondson and McManus (2007) reported that answering “how” and
“why” questions often strengthens the linkages within the phenomena
under investigation.
In this sense, RQ5 (quantitative) and RQ6 (qualitative) in this research are
expressed as:
RQ5:
How can resources be allocated for each strategy to satisfy its exact
need, or at least, to minimize the extent to which each single strategy is
lacking in (or overloaded by) resource support?
RQ6:
Why does each single strategy receive resources, whether more
(overloaded) or less (shortage), than what should be allocated for it?
92
RQ5 results from answers to the first four research questions (see Chapter
1). To illustrate, the first phase of this research attempts to employ two
quantitative techniques: ANP and GP. Firstly, the ANP differentiates
quantitatively between the needed resources for each strategy and the
“resource support” each strategy receives. Two cases/companies are
involved in this case study research and the ANP step provides
quantitative answers to the first four research questions. In the second
step of the quantitative phase, the analysis of the ANP model is used to
feed and formulate the GP scenario in order to answer (quantitatively)
RQ5, which is the final quantitative research question.
The second phase of this research is to conduct a number of semi-
structured interviews with selected experts to qualitatively answer RQ6.
This phase is conducted to explain the quantitative findings. Indeed, Yin
(2003) argued that an interview could be used as a second source of
evidence when investigator needs to find out “why” a certain phenomenon
is happening. It is clear that „how‟ and „why‟ questions have been employed
in this research to form the case study and represent the main directions
of the study. More descriptions are presented in the next sections.
4.2.2 Case Study’s Propositions
Although it is important for any case study to consider “how” and “why” in
formulating the main research questions, “propositions” should also not be
ignored. Yin clarified that “how” and “why” handles questions a researcher
wants answered, but do not indicate where the focus should be in the
study. He explained that the researcher cannot drive the case study

93
smoothly and reasonable conclusions cannot be obtained unless some
initial propositions have been identified to ensure the correct direction of
the study. Yin added that as long as a certain case study has precise
propositions, the study will be within realistic boundaries.
Hence, as Yin stated that “each proposition directs attention to something
that should be examined within the scope of study”, this case study
research attempts to answer four research questions that lead to RQ5. The
four research questions have been driven from three propositions that are
supported by the literature (as shown in Chapter 1 and 2). Specifically,
these three propositions are:
The three types of resources (HR, OR, and TR) depend on, and
influence, each other.
Each strategy depends on contributions of the three resources.
Each single strategy, in Aravindan et al.‟s (1996) SQM model, has a
different level of ability to enhance quality.
It is important to note that these propositions are employed as facts rather
than propositions. In other worlds, this research does not attempt to test
these propositions; but rather, it uses them as assumptions by which the
proposed ANP model is developed. As shown in Chapter1 and 2, the
literature clearly supports these assumptions, which are used to formulate
the four research questions. As presented also in Chapter 1, these four
research questions are:

94
1. RQ1:
Given that the three types of resources depend on, and influence, each
other; what is the relative contribution made by any two types of
resources to enable the third type to play its role effectively?
2. RQ2:
Given that each strategy depends on contributions by the three
resources, what is relative contribution made by each type of resource
to ensure successful implementation of each critical strategy?
3. RQ3:
How is each available resource allocated for the eight strategies to
ensure successful implementation?
4. RQ4:
In light of their ability to enhance quality, what is the relative
contribution being made by each of the eight critical strategies?
Answering these questions represents the first step of the quantitative
phase of this research. As described above, the second step of the
quantitative phase is to answer RQ5.
4.2.3 Unit of Analysis
Identifying the unit of analysis for the case study is a must; it is a vital
element in any case study (Tellis, 1997). Although the traditional case
study is centered on an individual, case study can also investigate events,
entities‟ decisions, programs, the implementation process, and
organizational change (Yin, 2003). In this regard, Yin also differentiated
between the “holistic” and the “embedded” case study design. In the latter
type of design, the case could have more than one unit of analysis while in

95
the former type the case, whether single or multiple, is designed to have
only one unit of analysis for each case.
According to this clarification, this research is a holistic case study in the
sense that two separate cases are investigated. The whole organization is
considered as one unit of analysis (i.e. the selected two companies
represent the two cases). Yin (2003) stated that, in contrast to embedded
design, holistic design can be employed “if the case study examined only
the global nature of an organization”. In this sense, this case study is a
comparative study that investigates two different companies within the
same industry. Specifically, both are selected from the Saudi Arabian food
industry and both are producing different products. As each organization
represents the unit of analysis, the focus then is to compare the selected
organizations within the context of how each one executes quality
strategies with respect to its own unique environment.
4.2.4 Logic Linking Data to Propositions and Criteria for Interpreting
the Findings.
These two issues are about how to conclude the case study with
convincing analysis and reporting. Although many techniques can be used
in this regard, such as pattern-matching (Yin, 2003),“the linking of the
data to the propositions and the criteria for interpretation of the findings
are not well developed in case studies” (Tellis, 1997). Tellis confirmed that
the analysis can rely on the theoretical propositions. Indeed, Yin (2003)
stated that “linking data to propositions can be done any number of ways,
but none has become as precisely defined”. Additionally, he added that
96
“currently, there is no precise way of setting the criteria” for understanding
the case study‟s results.
However, case study can still be a base for meaningful research findings.
In fact, developing theory is necessary in any case study, whether by
forming, examining, or simply exemplifying the theory through the five
elements of the case study research design (Yin, 2003). From this point of
view, Yin explained that it is important to understand that “theory” is not
like what is resulted from the use of “ground theory in social science”
rather that the case study investigator should not act as “a masterful
theoretician … the simple goal is to have a sufficient blueprint for your
study”. Indeed, Edmondson and McManus (2007) illustrated that “theory-
building research” project are, in reality, case studies as they usually seek
to investigate “how” and “why” research questions. In this regard, Riege
(2003) stated that:
The case study method is about theory construction and
building, and is based on the need to understand a real-
life phenomenon with researchers obtaining new holistic
and in-depth understandings, explanations and
interpretations about previously unknown practitioners’
rich experiences.
In fact, Edmondson and McManus (2007) explained that „theory‟ within the
context of management research, can be seen as either mature or nascent.
Mature theory deals with developing constructs and models that gain their
accuracy through a diverse group of researchers, while nascent theory
97
answers „how‟ and „why‟ questions, as they are involved in this case study,
to clarify the linkages for the investigated issue.
This case study research aims to explain „how‟ resources play their roles as
critical enablers for quality strategies. Moreover, the aim is to show that
handling the concept of quality management from a strategic perspective
results in a better understanding of „why‟ quality gurus and practitioners
still disagree on the critical elements of TQM. Put simply, considering that
“it is important to develop the QM theory, (and) investigate linkages among
the QM strategies” (Ahire et al., 1996), QM is studied in this case from a
strategic point of view, which adds a reasonable dimension to the QM
theory. This dimension reveals that QM as SQM, not TQM, provides a more
appropriate picture of how QM is practiced in organizations.
4.3 Why Multiple Cases?
Case studies are different from other traditional methods of conducting
research. Although the case study is a unique form of research, many have
disregarded it as an unattractive form of investigation compared to, for
example, more traditional surveys (Yin, 2003; Cresswell, 2007). According
to Yin (2003), there are two main reasons. First, many case study
researchers have not followed organized processes or have not reached
their conclusions in an appropriate manner. Indeed, Ruyter and Scholl
(1998) reported that there is a lack of scientific methods by which precise
case studies can be constructed. However, Yin‟s five elements of research
design support such research.

98
A second common issue is that findings cannot be easily generalized using
case study research design. In this regard, Yin (2003) stated that “scientific
facts … are usually based on a multiple set of experiments that have
replicated the same phenomenon under different conditions … the same
approach can be used with multiple-case studies”. From this point of view,
Yin clarified that case study research is similar to experimental research in
that both are seeking analytic generalization in which the sample is not an
issue at all; which is different to the traditional way of statistical
generalization. Further explanations are presented in the section of
validity.
The concept of „analytic generalization‟ raises the significance of employing
multiple cases within one study. In reality, case studies can be conducted
with single or multiple cases within one study. Additionally, Yin (2003)
stated that investigating two cases is worthwhile because comparative case
process is considered “as a distinctive form of multiple-case studies”. He
reported that multiple case studies, even when only using two cases
(comparative study), are preferred over using a single case study when
conducting this type of research. Indeed, the verification from multiple
cases is regularly seen as more convincing and multiple studies are then
generally viewed as more forceful (Herriott and Firestone, 1983). Yin
justified using two case studies saying that:
The first word of advice is that although all designs can
lead to successful case studies, when you have the choice
(and resources), multiple-case designs may be preferred
over single-case designs. Even if you can only do a "two-

99
case" case study, your chances of doing a good case study
will be better than using a single-case design … More
important, the analytic benefits from having two (or more)
cases may be substantial … even with two cases, you
have the possibility of direct … replication. Analytic
conclusion independently arising from two cases, as with
two experiments, will be more powerful than those coming
from a single case (or single experiment) alone. Second,
the contexts of the two cases are likely to differ to some
extent. If under these varied circumstances you still can
arrive at common conclusions from both cases, they will
have immeasurably expanded the external generalizability
of your findings.
Compared to a single case study, having more than one case consumes
more time and effort. Hence, it is a critical decision when a researcher
decides to attempt investigating more than one case within a study. This is
because, as described above, each case should be selected in order to help
the researcher execute the replication logic. Certainly, following the
replication logic is a key for shaping theory from the case study
(Eisenhardt, 1989). Recently, Eisenhardt and Graebner (2007) explained
this by saying that “each case serves as a distinct experiment that stands
on its own as an analytic unit”. They illustrated that cases are tested for
theoretical explanations such as disclosure of remarkable phenomenon,
replication of results through comparing the results of other cases,
exclusion of unconventional justifications, and explanation and expansion
of the growing theory. Thus, using multiple cases facilitates the process of
replication (Eisenhardt, 1991). According to Eisenhardt and Graebner

100
(2007), “theory building from multiple cases typically yields more robust,
generalizable, and testable theory than single-case research”. Put simply,
this case study seeks analytic rather than statistical generalization. This is
realized through conducting a comparative analysis of two different
cases/companies through which the concept of replication logic is
executed. Further explanations in this regard are presented in the next
section.
4.4 Validity
The quality of the case study, or specifically its validity, comes from the
ability to generalize the findings. However, generalizing findings from the
case study is different from the traditional method of generalization or
what is known as „statistical generalization‟. Many methodologists argue
that a case study‟s findings seek what is called „analytic generalization‟.
According to Yin (2003), the reason behind this is that “cases are not
„sampling units‟ and should not be chosen for this reason” and researchers
in such a situation “should avoid thinking in such confusing terms as „the
sample of cases‟ or the „small sample size of cases‟”. He explained that any
case study attempting to use “sampling logic” is unsuitable as the purpose
of case study is not to investigate the popularity of the phenomenon.
Moreover, the use of case study implies comprehensive investigation to the
specific phenomenon considering its context; which is impossible if the
researcher would apply the statistical logic.
Therefore, statistical generalization is suitable for survey research while
analytical generalization is more applicable for case studies as the

101
researcher attempts to generalize the findings to some broader theory
(Riege, 2003; Yin, 2003). Without doubt, the strongest point of any
multiple case studies is positioned in its replication logic (Riege, 2003). In
this regard, Yin (2003) stated that:
The generalization is not automatic … A theory must be
tested by replicating the findings in a second or even a
third neighborhood, where the theory has specified that
the same results should occur. Once such direct
replications have been made, the results might be accepted
as providing strong support for the theory, even though
further replications had not been performed.
The findings of each selected case identify the pattern of the replication. In
fact, Yin (2003) differentiates between literal and theoretical replication. He
explained that each case is selected to either seek similar findings to the
other case (a literal replication) or a different pattern of findings “but for
predictable reasons (a theoretical replication)”. Nevertheless, although
applying the replication logic in multiple case studies is a common method
of enhancing the validity of a case study (Riege, 2003), it is important for
the researchers to identify the scope and boundaries of the case to attain
sensible analytical generalization (Marshall and Rossman, 2006).
This case study attempts to execute the theoretical replication to enable
the author to extract meaningful findings that can be analytically
generalized. The analytic generalization is worthwhile, at least within the

102
context of the food industry in Saudi Arabia, which represents the
boundary of the study. As this study focuses on handling QM from a
strategic point of view, the attempt is to show that resources allocated for
quality strategies in the two selected companies are mobilized differently
because the strategic situation for each company/case is different. This
means that once the second case‟s findings show a different pattern of
results compared to the first case, the generalization can then be
analytically executed; and theoretically, if a third case was involved, its
own strategic position would provide a different form of resource
allocation. Thus, it can be said then that resources are mobilized
differently as each company has its own strategic objective for quality. This
may justifies why quality gurus still compare „soft‟ TQM elements with
„hard‟ elements in term of their effect on the performance, and still no
unique model for TQM is accepted. It can then also be said that handling
QM as SQM rather than TQM contributes to the field of QM as considering
the strategic dimension adds reasonable explanations to the current issue
of QM.
4.5 Reliability
A case study‟s reliability can support the research using different methods.
Developing protocol for the case study is one of these methods, and it is
preferred that any research has a protocol. Developing a protocol for a case
study is important especially if the study includes multiple cases (Yin,
2003). Yin explained that as the protocol includes the tools, mechanism,
and step-by-step methodology required to implement the case study, it is
the main approach to strengthen the reliability of the case study and
represent how the required data has been collected (Yin, 2003). Protocol
aims to guarantee that if a researcher attempts to conduct the same

103
research (case), he or she will achieve same results (Riege, 2003; Yin,
2003). Yin added that this “is to minimize the errors and biases in a
study”. In this regard, a protocol for this case study research has been
developed and summarized in in Appendix (D).
Reliability of the case study can be further strengthened by employing
more than one source of data. In fact, a case study can be fed through
many sources of evidence such as documents, archival data, interviews,
surveys, observations, and physical artifacts (Tellis, 1997; Yin, 2003;
Cresswell, 2007). Yin added that using more than one source of evidence is
the key element in the phase of data collection for a case study. Flick
(1992) and Peräkylä (2002) reported that using multiple sources of data
protect the study from having bias findings. Yin (2003) in turn illustrated
that the main benefit of using more than one source of evidence is to
maintain the efforts of investigation, or what is commonly known as
triangulation. Triangulation is considered a tool for enhancing the quality
of the research (Lincoln and Guba, 1985). In fact, according to Patton
(1987), triangulation may have different forms:
l. Data triangulation,
2. Investigator triangulation,
3. Theory triangulation, and
4. Methodological triangulation.
In this regard, two sources of data were involved in this thesis. First,
quantitative data was generated through participants from each company
who were involved in a questionnaire that was developed to execute the

104
ANP (the first step of the quantitative phase). Secondly, semi-structured
interviews were conducted with participants from each company to collect
the qualitative data for the qualitative phase of this case study research.
Noticeably, „data triangulation‟ as well as „methodological triangulation‟ is
used.
In addition, reliability can also be increased by showing the chain of
evidence (Hirschman, 1986). Yin (2003) illustrated that this can be done by
continuously presenting the “chain of evidence” to the reader by facilitating
the linkage between these evidences to the study‟s research questions.
Accordingly, the analysis of quantitative and the qualitative data is
presented in the following chapters to show how research questions were
answered and to carry out convenience conclusions. Moreover, the
reliability of the case study can be supported if the researcher paid the
required attention to build a database for the „case study‟. Yin (2003)
explained that this can be done through the collection of “notes,
documents, tabular materials, and narratives”. Thus, during the two
phases (trips) of data collection (quantitative and qualitative), notes
relating to the investigated companies/cases were combined and
documents relating to the history of each company were collected.
Additionally, the author was a management trainee in both companies
during 2001 and 2002, which facilitated data collection and enhanced
reliability.

105
4.6 Employing Mixed Methods
Case study as a research design, and as described above, requires
employing more than one source of data, which makes it appropriate for
this case study research to execute mixed methods. Indeed, “case studies
can be based on any mix of quantitative and qualitative evidence” (Yin,
2003). In fact, mixed-method research can be defined as a methodology
that deals with theoretical suppositions as well as ways/processes of
investigation to steer the route of gathering and analyzing data by blending
qualitative and quantitative techniques in various stages of the study to
carry out a better study of the issue compared with the use of a single
methodology only (Creswell and Clark, 2007). Creswell and Clark added
that mixing quantitative and qualitative methods positively influences the
study and is better than employing one type of method alone. Mixing two
methods imposes the potencies of each type to cover the limitations of the
other type. For instance, they explained that employing mixed methods
facilitates, answers to research questions that cannot be answered by one
method alone. They also clarified that mixing quantitative and qualitative
research methods is realistic, as people generally like to resolve issues
using “both numbers and words”. Hence, this research attempts to follow
the approach of mixed-method strategy,
Mixing quantitative and qualitative methods can be executed in many
ways. Morse (1991) classified mixed-method research into four types.
Firstly, Morse identified two general types: simultaneous triangulation and
sequential triangulation. For each type of triangulation, there are two
forms. For simultaneous triangulation, qualitative and the quantitative
processes are executed at the same time considering two forms where
either either the quantitative or the qualitative process is dominant over

106
the other (QUAN + qual, or QUAL + quan). For the sequential triangulation,
the research might be mainly qualitative followed by the quantitative phase
to further examine certain qualitative findings (QUAL quan). In contrast,
the second sequential form is when the research is principally quantitative
and the qualitative aspects are employed as a second phase to obtain more
understanding for the quantitative results (QUAN qual). Similar
classification has been suggested by Tashakkori and Teddlie (1998), with
slight additions. Tashakkori and Teddlie added another dimension, where
quantitative and qualitative both share the same dominance whether they
are employed in a research sequentially or parallel (simultaneously) (Quan
+ Qual, Qual Quan, and Quan Qual). Moreover, they proposed the
multi-level approach, where inputs come from different levels of firms or
different groups of participants to achieve a full understanding of certain
phenomenon. In fact, numerous methodologists from different disciplines
have paid significant attention to the issue of classifying mixed-method
research design (Greene et al., 1989; Patton, 1990; Morse, 1991; Steckler
et al., 1992; Greene and Caracelli, 1997; Morgan, 1998; Tashakkori and
Teddlie, 1998; Creswell, 1999; Sandelowski, 2000; Creswell et al., 2003;
Tashakkori and Teddlie, 2003; Creswell et al., 2004).
Although there are many classifications of mixed-method research design,
similarities exist between them. Recently, Creswell and Clark (2007)
attempted to review all previous attempts of classifying mixed method
designs and ended up with four major types: Triangulation, Embedded,
Explanatory, and Exploratory. In this case study, an explanatory mixed
method approach is used as the quantitative phase is followed by the
qualitative phase. They describe „explanatory‟ as “a two-phase mixed-
methods design”. The main objective of such a design is to enable

107
quantitative findings to be explained or extended by involving qualitative
data in the second phase of research (Creswell et al., 2003). Furthermore,
Creswell and Clark (2007) also illustrated that an explanation can be
executed in two forms: the follow-up model or the participant selection
model. The latter model is used when the investigator emphasizes
qualitative results rather than quantitative results. In contrast, the “follow-
up” model is used when the focus of the study is on quantitative findings
and participants for the second phase are selected on the bases of the
quantitative results. Accordingly, in this explanatory mixed-method
approach, the „follow-up‟ model is employed as the case study here is
mainly concentrated on the quantitative findings. Two quantitative
techniques are involved in this thesis (ANP and GP) while the qualitative
phase is conducted using one technique (semi-structured interview).
Additionally, in regards to the analysis, Creswell and Clark (2007)
illustrated that findings of mixed-methods can be analyzed either
concurrently or sequentially; however, for the explanatory design, the
applicable mode of analysis is the sequential one. They reported that the
aim of such an analysis is to use the first phase of analysis (quantitative in
this case) to direct the second phase (qualitative in this research). They
stated that:
The problem can best be understood by using qualitative
data to enrich and explain the quantitative results in the
words of participants ... quantitative results need further
interpretation as to what they mean or when more detailed
views of selected participants can help to explain the
quantitative results. A mixed methods design is thus the
preferred design.

108
Firstly, the analysis was conducted on the quantitative data that was
collected by the questionnaire developed for the ANP step. The analysis of
the ANP model answered the first four research questions. The findings of
the ANP analysis were then utilized to formulate the GP model, which was
the second step of the quantitative phase. After the analysis of all
quantitative aspects, the qualitative data was gathered separately (2
separate trips). Then, all recorded interviews were analyzed and presented
in Chapter 7 to explain the quantitative results. Figure (4.1) summarizes
the case study design of this research.
4.7 Summary
This chapter explained the vital elements of conducting a case study. It
illustrates how the case study developed considers these elements to
produce well-structured research. The notion of „theory‟ is explained from
the perspective of how it applies within a case study. Consequently, it has
shown how this case study attempts to obtain a reasonable understanding
of the theory of QM, in a way that contributes to the field of QM. It is also
concluded that employing two cases adds strength to the research.
Accordingly, a comparative analysis was conducted for two different
companies/cases. This point is important as the objective of the case
study is to seek analytical, not statistical generalization. Hence,
conducting the „analytic generalization‟ is explained through the concept of
„replication logic‟ by which the analysis of the selected cases generates
convenience findings. Nevertheless, any case study should employ more
than one source of data. Therefore, in this case study, quantitative
methods (ANP and GP) as well as the qualitative method (semi-structured
interview) is executed, as mixed-method design is critical for the success of
any case study.

109
3
Assumptions
4
Research
Questions
Application of the
ANP
*Questionnaire
*Super Decision®
Software
ANP
Analysis
Resource
Allocation
Problem
5th
Research
Question
(RQ5)
Application of
the GP Methodology
*QM for Windows®
SoftwareThe need for
further
explanations
6th
Research
Question
(RQ6)
Conducting the
semi-structured
interviews
Interpret the
Findings
Quantitative
Phase
Step 1
Quantitative
Phase
Step 2
Qualitative
Phase
Figure (4.1): The Mixed Method Design of the Case Study in this Research

110
5.1 Introduction
The objective of this chapter is to provide further details regarding how the
quantitative and qualitative data have been collected. This chapter starts
by discussing the selected sampling strategy for this case study, and
presenting some explanations and justifications of the sampling, in both
quantitative and qualitative phases. This chapter then illustrates how the
selected experts (participants) were involved in the two phases of the
research. Moreover, as the two selected companies are Saudi Arabian
companies, the significance of TQM practices in Saudi Arabia is
highlighted. Additionally, the food industry in Saudi Arabia is overviewed
as it represents the boundaries within which the two companies/cases
have been selected. Finally, the two selected companies are introduced,
with a focus on their ability to practice QM and compete with international
companies in producing high quality products.
5.2 Sampling for the ANP Step
In regard to sampling, a total of 12 experts are involved in this study - six
from each company/case. In the quantitative phase, three experts from the
Quality Department of each company are involved while in the qualitative
Chapter
5
Data Collection

111
phase all 12 experts are involved. It is appropriate here to justify
employing a small sample size in this case study, particularly for the
quantitative phase. Certainly, employing ANP and GP in the quantitative
phase reveals that the concept of operations research is supposed to be
briefly presented. In fact, the focus of operations research techniques such
as AHP/ANP and GP are usually on how to make a decision within
complex situations. Hence, ANP and GP are not traditional quantitative
methods; instead, they are an operational research method in which
statistical sampling is not the issue in all circumstances. To illustrate,
operations research is considered as a quantitative technique by Morse
(2007), who defined operations research as “a scientific method of
providing executive departments with a quantitative basis for decisions
regarding the operations under their control”. However, operations
research methods such as AHP/ANP do not involve large samples. Indeed,
seeking a large number of participants is not a necessity in AHP (Lam and
Zhao, 1998) as it is a technique in which the analytical manner of
sampling is targeted, rather than statistical one (Herath, 2004;
Sambasivan and Fei, 2008).
This sample adequacy issue has been investigated by Wong et al. (2008)
through reviewing many applications of AHP/ANP, especially the work of
Cheng and Li (2002), and they concluded that:
In fact, both AHP and ANP are subjective methods that
focus on specific issue where a large sample is not
mandatory… First, both AHP and ANP approaches may be
impractical for a survey with a large sample size as ‘cold-
called’ respondents may have a great tendency to provide
arbitrary answers, resulting in a very high degree of

112
inconsistency … Second, survey with small sample has
been conducted in previous AHP and ANP research
Indeed, many, if not most, ANP applications have been conducted with a
small group of experts. For example, the works of Cheng and Li (2002) and
Lam and Zhao (1998) were conducted by involving nine and eight experts,
respectively. Cheng et al. (2005) limited the participation in their ANP
questionnaire to the limited members of top management. In the same
way, only three experts were involved in Coulter and Sarkis (2005)‟s
application of ANP. Therefore, many AHP studies have been conducted
with a small sample size (Cheng and Li, 2001; Mawapanga and Debertin,
1996; Peterson et al., 1994) [Note that AHP is a special case of ANP; see
Chapter 3]. Additionally, Shrestha et al. (2004) said that this is applicable
as long as participants are experts in the field of the study. Specifically, in
regard to the ANP, a significant amount of research has been carried out
recently by limiting the participants to a small number of experts (Wong et
al., 2008; Jharkharia and Shankar, 2007; Cheng and Li, 2007;
Wolfslehner et al., 2005; Coulter and Sarkis, 2005; Cheng et al., 2005).
The resulted ANP analysis was used to feed the second step of the
quantitative phase, GP. So GP‟s inputs are resulted from the outputs of the
ANP. Note that GP is also a well known operations research method
(Schniederjans, 1995) and its applications are commonly used in case
studies (Shiong et al., 2008). As GP is a mathematical programming
technique that is used widely as a MCDM tool (see chapter 3) and
commonly used as an analytic tool (Bertolini and Bevilacqua, 2006) in
which ANP‟s outputs are used as inputs for GP, sampling is not applicable
for the GP step.

113
5.3 Sampling Strategy
In this case study, purposeful sampling is used. Creswell (2008)
differentiates between two general types of sampling: random and
purposeful sampling. In quantitative research that aims to generalize
findings for the whole population, random sampling is suitable as it
attempts to seek statistical generalization through the selected individuals.
However, in purposeful sampling, investigators deliberately choose
participants and decide on places/fields by which a certain phenomenon
can be studied and comprehended. Tashakkori and Teddlie (1998) defined
purposeful sampling as choosing a participant or a group of participants
according to particular inquiries or particular objectives of the study, as
well as according to the information related to those people rather than
selecting them randomly. As the attempt here is to develop a case study,
one of the objectives is to seek analytic generalization which is suitable for
purposeful sampling. Additionally, Creswell (2008) reported that using
purposeful sampling implies that the strategy of this sampling should be
explained, as many strategies are available in the literature (Patton, 1990;
Miles and Huberman, 1994).
One of the purposeful sampling strategies is maximal variation sampling.
Creswell (2008) explained that in maximal variation sampling strategy,
participants or places/fields are sampled according to their different
characters or attributes. From this point of view, maximal variation
sampling strategy is used to execute the purposeful sampling for this case
study research. Three experts from the managerial level of the Quality
Department from each company filled out questionnaires that were
developed for the ANP stage. Maximal variation sampling is applicable as
each participant has their own role within the Quality Department at each
114
company. Moreover, experts are selected from two different managerial
levels in both companies. This sort of diversity generates different
perspectives and supports the employment of the maximal variation
sampling.
Although purposeful sampling is classified as qualitative (Tashakkori and
Teddlie, 1998; Creswell, 2008) in the sense that the sample is small
compared to the traditional quantitative sampling strategies, it is employed
in both quantitative and qualitative phases. Undoubtedly, this type of
sampling is used in this research within the context of the case study, as
the goal is to achieve analytic, not statistical generalization. Moreover, the
case study itself, as a special type of inquiry, is generally considered as a
qualitative method (Cresswell, 2007). It is also important to note that ANP,
as a quantitative technique, does not require a large sample (as also
described above).
5.4 Data Collection and Involvement of Participants
5.4.1 Quantitative Phase
The three experts selected from each company filled out questionnaires
that were developed for the ANP stage. Participants were asked to respond
through a sequence of specific pair-wise comparisons, which were
presented to the participants as a questionnaire together with a set of
instructions on how to conduct the comparisons based on their own
experience. The questionnaires were designed to cover the aspects of the
first four research questions. Parts (1) and (2 –A) were designed to answer
the first and the second research questions respectively, while Part (2 – B)
115
addressed the third and the fourth research questions. A sample of the
questionnaire is presented in Appendix (B).
Various software is available which can be used for modelling and
analyzing ANP applications such as Ecnet, Maple, and Super Decisions®,
(Gencer and Gürpinar, 2007). In fact, Dr Thomas L. Saaty, the developer of
ANP, reported that the ANP team (working for the Creative Decisions
Foundation) wrote the program that was used to develop The Super
Decisions software (Erdogmus et al., 2005). Gencer and Gürpinar (2007)
stated that “Generally, managers might be inclined not to use a
sophisticated method, but by using a user friendly software like super
decision, developed by Saaty, the decision making process by using ANP
will be handled more easy”. Additionally, the software is capable to
detect/calculate the consistency ration for each pairwise comparison of the
ANP model (Erdogmus et al., 2005, Köne and Büke, 2007). Therefore,
many ANP studies were conducted using Super Decisions such as
(Erdogmus et al., 2005, Ulutas, 2005, Erdogmus et al., 2006, Gencer and
Gürpinar, 2007, Köne and Büke, 2007, Wu, 2008).
Super Decisions® the commercially available software developed for AHP
and ANP by Saaty (Creative Decision Foundation, 2006), was used to build
the ANP model. The software has the capability to determine the
consistency ratio (CR), which is the “degree to which the pair-wise
comparisons are consistent” (Hsu et al., 2009). Saaty (1994) stated that for
pair-wise comparisons between three elements (as in RQ2), the CR should
be less than 5%; while for pair-wise comparisons between more than four
elements (as in RQ3 and RQ4), the CR should be less than 10%. A

116
discussion about the CR was carried out with participants to inform them
that their judgments in each pair-wise comparison should be consistent
“otherwise, all or some of the comparisons must be repeated in order to
resolve the inconsistencies” (Kangas et al., 2008).
The findings obtained from each participant were aggregated to represent
each company‟s data. For example, the three experts‟ results for company
A were averaged to represent Company A‟s overall finding. According to
Mardele et al. (2004) and Forman and Peniwati (1998), individuals‟
opinions should be represented by aggregating individual judgments (AIJ)
or by aggregating individual priorities (AIP). Forman and Peniwati (1998)
explained that, in AIJ, the assumption is that individuals are combined
and “behave like one” to represent the opinion of the company while in AIP
“individuals are each acting in his or her own right”. In this research, it is
believed that AIP is more suitable as participants were selected from
different managerial levels and operational perspectives within the Quality
Department and their perspectives are supposed to be varied. As argued
by Mardele et al. (2004) when they used AIP in their work that, in some
fields, “individuals‟ opinions are typically distinct and widely varying”.
5.4.2 Qualitative Phase
Regarding the qualitative phase, the use of maximal variation sampling
together with the explanatory nature of the mixed methods in this research
implies using the same participants as well as adding more. To illustrate,
Creswell and Clark (2007) stated that:

117
… in an explanatory design, … the same individuals
should be included in both data collections. The intent of
these designs is to use qualitative data to provide more
detail about the quantitative results and to select
participant that can best provide the detail.
Therefore, the original three experts from each company have also been
included in the qualitative data collection phase. For the same reason (i.e.
obtaining more explaining), as well as to strengthen the use of maximal
variation sampling strategy in this research, another three experts from
three different departments were added to the study in the qualitative
phase. The three departments involved from both companies were related
to quality issues. They were Human Resource Management (HRM),
Information Technology (IT), and Supply Chain departments.
Qualitative data was collected through semi-structured interviews with the
12 participants (six from each company) including both prepared and
unprepared questions. The main objective of this phase is to explain „why‟
each single strategy may receive resources, regardless of whether it is more
or less than what should be allocated (RQ6). For the prepared questions,
participants were asked to identify to what extent each strategy is efficient
in resource utilization (using scale from 0 to 10) and why. Rather than
concentrating on the first part of the question, the focus was on the second
part, (i.e. why). Similarly the second question was to rank the three types
of resources with respect to each strategy and explain why. The third
question was regarding the future directions for each strategy and why
these directions will be the focus. All questions sought explanations, which
is supported by the use of “why” in all three interviews questions. The
attempt of the unprepared questions is also to attain the same objective

118
(RQ6). In other words, unprepared questions were utilized whenever the
investigator (i.e. the author) felt that more explanation was required from
the interviewee during the interview. Interview questions are presented in
Appendix (C). Table (5.1) and (5.2) show some characteristics of the experts
who were participated in this case study for company A and B respectively.
Table (5.1): Experts Participants from Company A
Company A
Acronym Position Qualification Years of
Experience
Participation in this Research
Participant
1
QM1-A Quality and
Safety
Manager
Bachelor of
Engineering
24 Quantitative (ANP Survey)
Qualitative Interview
Participant
2
QM2-A Quality
Assurance
Manager
Bachelor of Chemistry
Master of Science
(Environmental
Studies)
12 Quantitative (ANP Survey)
Qualitative Interview
Participant
3
QM3-A Quality
Control
Manager
Bachelor of Chemistry 12 Quantitative (ANP Survey)
Qualitative Interview
Participant
4
HRM-A Human
Resource
Manager
Bachelor of Business
(Human Resources)
13 Qualitative Interview Only
Participant
5
ITM-A Information
Technology
(IT) Manager
Bachelor of Computer
Engineering
9 Qualitative Interview Only
Participant
6
SCM-A Finished
Goods and
Supply Chain
Manager
Bachelor of Industrial
Engineering
9 Qualitative Interview Only

119
Table (5.2): Experts Participants from Company B
Company B
Acronym Position Qualification Years of
Experience
Participation in this Research
Participant
1
QM1-B Head of
Quality
Department
Bachelor of
Science
(Chemistry)
35
(30 years in
Company B)
Quantitative (ANP
Survey)
Qualitative Interview
Participant
2
QM2-B Quality
Control and
Product
Development
Manager
Bachelor of
Chemistry
Master of
Chemistry
25 Quantitative (ANP
Survey)
Qualitative Interview
Participant
3
QM3-B Supervisor,
Quality
Assurance
and Product
Development
Bachelor of
Science
17
(15 in
Company B)
Quantitative (ANP
Survey)
Qualitative Interview
Participant
4
HRM-B Department
Manager-
Human
Development
and Training
Bachelor of
Business
Administration
Advance Human
Resources
Courses
10 Qualitative Interview
Only
Participant
5
ITM-B Information
Technology
(IT) Manager
Bachelor of IT
Diploma in
Systems
26 (12 years
in Company
B).
Qualitative Interview
Only
Participant
6
SCM-B Demand &
Logistic
Manager
Bachelor of
Science
20 years Qualitative Interview
Only

120
5.5 The Selected Cases/Companies
5.5.1 TQM in Saudi Arabia
Saudi Arabia is the main exporter of the oil in the world and “one of the
top non-OECD (Organization for Economic Co-operation and Development)
economies” (Magd et al., 2003). The current progress of globalization and
worldwide trading enhances the expansion of the international market,
which provides a better environment for healthy rivalry in offering high
quality products/services with reasonable prices (Alsaleh, 2007). In fact, in
2005 Saudi Arabia became a member of the World Trade Organization
(WTO) (MCI, 2005). Accordingly, Saudi Arabia released its rules for a free-
market that enables international companies to meet the demand of Saudi
Arabian consumers (Magd et al., 2003). In Saudi Arabia, the consequences
of becoming a WTO member and the existence of strong competition
between companies, adds significant pressure to local companies (Alsaleh,
2007). Alsaleh explained that the existence of superior quality products
coming from all around the world will force the Saudi industries to
enhance their manufacturing standards to achieve customer satisfaction.
Indeed, Magd et al. (2003) reported that competitive products coming from
the US and Japan encourage the Saudi manufacturing companies to apply
and execute ISO 9000.
Generally, Saudi companies are aware of the latest quality practices. In
fact, quality concepts and applications in Saudi Arabia have matured as
Saudi industry expansion has progressively improved in the last few years.
However, the challenge is that quality concepts and applications have
improved foster than the manufacturing industry (Al-Harkan, 2007). Thus,
Al-Harkan stated that due to this sort of challenge, the focus should be on

121
evaluating TQM applications in Saudi companies. Curry and Kadasah
(2002) believe that Saudi Arabia is an appropriate country in which to
investigate TQM issues for two reasons. First, compared to the
industrialized countries, Saudi Arabia is less developed and its challenges
are definitely different. Second, there is a noticeable lack of inclusive (local)
studies for assessing quality management movement.
5.5.2 Food Industry in Saudi Arabia
The Saudi food industry appears to be one of the most significantly is
affected by worldwide competition. The Saudi Factories Directory‟s figures
in 2003 report that this industry represented 16 % of the whole Saudi
industrial segment (Alsaleh, 2007). Alsaleh stated that the steady increase
of imported food implies that the Saudi food industry is competing with
overseas companies and that should enhance quality standards in local
companies. According to the Saudi Ministry of Economy and Planning,
the volume of Saudi Arabia‟s imports of foodstuffs were SAR 35.5 billion,
44.8 and 62.2 in 2006, 2007, and 2008 respectively. For 2008, foodstuffs
represented 14.4% of all imports, which makes them the fourth largest
import category overall (SAMA, 2009). Moreover, the same report recorded
a growth in exports which reveals that Saudi food companies succeeded in
producing to international quality standards. Considering the fact that
Saudi Arabia is a non-agricultural country, the food industry is dependent
on the processes of refining and packaging imported raw foods from other
countries (Alsaleh, 2007). As the quality of the food industry is a critical
issue for human health (Kidd, 2000; Fearne and Lavelle, 1996; Ho and
Cho, 1995; Alsaleh, 2007), many Saudi food manufacturing companies
have practiced quality concepts, believing that these concepts should
support their products against overseas imports.

122
5.5.3 Company A
Company A was founded in Jeddah in 1998. Its factory is strategically
situated close to the Jeddah Islamic Sea Port, which facilitates the import
of raw foods and the export finished goods. Recent expansion in the
company‟s factory enabled the company to double its production capacity.
The company has one of the world‟s five largest factories for that
commodity. Currently, company A holds about 90% of the market share
for the commodity in which it is involved. One of the essential
responsibilities of the company is to pay attention to and exceed
customers‟ requirements; therefore the company creates a range of
different packaging sizes in response to market demand. Senior
management believes that the company‟s responsibility is to constantly
supply high quality products with reasonable prices. In addition, one of
the company‟s long term plans is to supply high quality products to
international markets. Currently, the company is exporting to Jordan, all
Gulf countries, Eastern Africa, and some Asian countries. This has been
achieved through the recent expansion of the company‟s factory in Jeddah.
Company A‟s training program is regarded as one of the most systematic
and comprehensive in Saudi Arabia. The company won awards from the
Saudi HR development fund for excellence in training. The company‟s
sophisticated capability programs, by which human resources are
evaluated and trained, considers business and personal requirements. The
company encourages staff to be leaders and to work in a teamwork
environment through awards such as 'Employee of the Month' and 'Team
of the Quarter'. Sauadization, a national policy of employing a local
workforce, is applied in this company and Saudi employees make up
almost 60% of the workforce. The company is also willing to increase this

123
number by 5% annually. The company aims to build an environment
where knowledge can be transferred from non-Saudi employees to the
nationals. Senior management therefore prefers to limit the appointment of
overseas experts to a handful of critical positions only.
At the beginning of each year, all employees are engaged to help shape
SMART objectives for each business unit. As these objectives have to be
met at the end of the financial year, SMARTs are documented daily and
reviewed weekly to monitor progress. One of the aspects that company A
has recently paid significant attention to is innovation. The company aims
to meet ever-changing customer requirements by launching what‟s known
as The Innovation Initiatives. These initiatives are developed by forming
different teams across various business units to share ideas that will feed
innovation initiatives. For example, as the company concentrates on
product development, much consideration has been given to product-
related innovation. This has resulted in the recent launch of four different
brands with multiple sizes to meet the market needs. In addition,
advanced packaging technologies are used to facilitate the creation of
innovative forms of packaging.
In Company A, priority is always given to customer satisfaction.
Customers, whether retailers or factories, are generally satisfied with the
company, as they experience high quality products, as well as services
provided to them after sales. Company A utilizes the technologies and
software, which means customers are satisfied with the availability of
highly developed and computerized functions, including order processing,
customer accounts, and dispatch. Moreover, the central aspect behind the

124
company‟s success is the integration between the company‟s business and
the associated practices that use up-to-date, advanced information
technology (IT). The company‟s IT service provider is the first IT company
in Saudi Arabia to be certified by ISO 9001:2000. Company A‟s factories
are run using advanced software applications. Well known systems such
as Oracle, ORSI, and Maximo are employed to support the company‟s
Enterprise Resources Planning (ERP), Supply Chain Management (SCM),
Automation Process and Maintenance Management.
5.5.4 Company B
Company B was founded in 1979 in Jeddah, the main port and the second
largest city in Saudi Arabia. In 1982, the company launched its first
brand, which received massive support in its initial period with aggressive
marketing, promotion, pricing and delivery actions. This facilitated the
company‟s brand to become a leader in the local market. In 1996, the
company started to build (or buy) its own factories in international
markets. Company B is the highest producer in the world of the type of
branded commodities that it produces, with an yearly income of
approximately SAR 1.5 billion. The company holds almost 70% of the
Saudi market for this commodity. Moreover, the company‟s brands are the
market leaders in most Middle East countries, including Egypt, Turkey
and Iran. The company‟s brands also hold a significant share in the rising
markets of Morocco, Sudan, and Kazakhstan. The is company now looking
for new markets in countries with positive growth potential, including
Indonesia, Pakistan, and India.

125
The company offers a range of resources and training programs to facilitate
the achievement of goals through the involvement of all employees. As
training is one of the managerial tools that provide the required knowledge
and skills to the human resources, it is a vital dimension in company‟s
human resources strategy. In this sense, the company aims to ensure that
training is provided in a way that guarantees the attainment of the
company‟s objectives. Generally, and especially when compared to other
Saudi companies, the company is entirely committed to investing in its
human resources and improving their capacity to achieve individual and
organizational success. The company offers an environment that enables
people from all managerial levels to share their opinions on how the
company‟s objectives can be met through human assets and this is clearly
reflected in the company‟s recruitment policy. The company believes that
quality recruitment and selection processes endorse accurate hiring
decisions that can lead to the success of the company. The recruitment
and selection process considers a blend of educational background, work
experience, and innovation capabilities in order to maximize the quality
and dependability of the employees.
Company B has well established quality and food safety guidelines that
aim for continuous improvement and an effective quality management
system. This in turn guarantees the company will offer products and
services that meet consumers‟ expectations. The company‟s products are
constantly reviewed with regard to relevant requirements and the highest
standards of food safety. They are produced under strict rules of hygiene
and managed according to the implemented ISO9001-2000, HACCP, and
BRC systems. Precise specifications are applied for the company‟s
products, as they already follow the principles of the Saudi Arabian

126
Standards Organization (SASO). Quality goals have always been evaluated
on an ongoing bases and with a focus on satisfying the company‟s
customers, continuous improvement processes, human resource aspects,
building teamwork, lunching new products, and strategic thinking. The
company, and specifically senior management, is aware of the
extraordinary or exceptional circumstances that are created and the many
strategic options that are driven by company‟s risk management policy.
Therefore, the selection of suppliers is in accordance with their aptitude to
meet the company‟s standards. Moreover, rather than activating Corporate
Social Responsibility (CSR) activities that strengthen friendliness and
kindliness, the company believes that CSR requires strategic business
planning. Thus, the company tries to keep its social responsibilities
authentic and focused on constructing significant and influential
relationships with the community.
5.5.5 Comparing the Selected Companies
The two companies were selected from the Saudi food industry for the case
study research. As company A was founded in 1998, the company‟s
products were newer than those of thier competitors. Therefore, company
A faced strong competition from competitors, who were actually importers
for the same types of products. As company A is the only national
producer for these products, the government set tariffs for importers to
assist the company and protect it from its competitors. This helps the
company to hold about 90% market share. However, this is not the case in
company B, which has been a leader in its field since it was established in
1979. Company A sells to the end consumer through retailers and to
various factories within the food industry, while Company B mainly sells to

127
the retailers. To demonstrate their ability to consistently provide products
that meet their customer requirements, both companies hold:
The seal of quality (Quality Mark) from SASO in 1998 and 1985
respectively.
The ISO 9001:2000 certificate in 1999 and 1994 respectively.
The Hazard Analysis and Critical Control Point (HACCP) certification
and an upgrade of their food safety management system to meet the
requirement of ISO 22000 in 2006 and 2005 respectively.
In addition, Company B was awarded the MRP II certification in 1998, the
Occupational Health and Safety Standards (OHSAS) in 2007, and the
British Retail Consortium (BRC) global standard certification for food and
safety in 2008. Company A is still developing its environmental
management system and safety management system against ISO 14001
and OHASAS 18001 respectively. The two cases were selected and
investigated to show how the interaction between strategies and their
allocated resources differs due to the nature of the business, product and
history of each company.
5.6 Summary
All issues related to data collection are explained in this chapter. Firstly, in
regard to the sampling for the first quantitative step (ANP), it is illustrated,
with the support of the literature of the AHP/ANP, that such a technique
does not need a large sample size to be employed. Rather, only experts
usually participate in such a technique. Conducting this research as a
case study also justifies the use of qualitative sampling (small sample size).
128
From this point of view, it is found that purposeful sampling is the most
appropriate type of qualitative sampling for this case study. In particular,
maximal variation sampling is conducted as a type of purposeful sampling.
This chapter shows how the selected experts are different in terms of their
roles and experiences; and how this variation justifies the use of maximal
variation sampling in both quantitative (ANP) and qualitative (semi-
structural interview) phases. This chapter also shows that the selected
companies are similar in terms of the boundaries from within which they
are selected (Saudi Arabian food industry), and also shows some
differences, which facilitate conducting the comparative study with
expected reasonable findings.

129
6.1 Introduction
This chapter presents the quantitative phase of this case study research.
Specifically, the objective of this chapter is to present the finding of the
quantitative phase, which includes the two vital steps: ANP analysis, and
GP analysis. For the purpose of executing the ANP step, the required data
are collected during the author‟s first visit to the two companies in Saudi
Arabia. As discussed in Chapter 5, three experts from each company are
involved in the ANP questionnaires. Firstly, company A‟s findings from the
ANP step are analyzed to address the first four research questions. This
includes presenting the results and demonstrating the need for employing
the GP methodology as a second step within the quantitative phase. In
particular, the issue of resource allocation is explained through RQ5. The
formulation of the GP model is described with explanations and discussion
of the developed tables and figures. The GP step concludes with the
development of what is proposed here in this research as a Strategic
Quality Management Index (SQMI). Following a full discussion and
analysis of Company A‟s results (for ANP and GP steps) the same
procedures are then applied for Company B and presented separately.
Chapter
6 Quantitative Analysis

130
6.2 Company A
6.2.1 Results of the ANP Analysis
6.2.1.1 RQ1 and RQ2 for Company A
After obtaining the input from each participant using „Super-Decision‟,
aggregation was simply determined using Microsoft Excel. Results
pertaining to the first four research questions are presented in Tables (6.1)
through (6.6). Specifically, Table (6.1) and (6.2) answer the first two
research questions. Table (6.3) is developed to combine the results of the
RQ1 and RQ2 as ANP is capable of providing overall “weights” for HR, OR,
and TR considering their overall relative contributions as described in RQ1
and RQ2. Table (6.1) shows that both HR and OR (i.e. soft TQM) are weakly
influenced by TR (i.e. hard TQM). To illustrate, the relative contribution of
TR is 26% for HR, while OR contributes 74% to HR. Similarly, TR
contributes 28% to OR while the relative contribution made by HR for OR
is 72%. It is also found that HR contributes significantly (76%) to TR
compared to the contribution of OR (24%).
In general, these results confirm that quality in company A is strategically
driven more by HR and OR (soft TQM), than TR (hard TQM). Indeed, the
overall contribution of resources, as shown in Table (6.3), confirms this
situation and specifically shows that HR has the highest contribution
(41%) followed by OR (38%). In regard to TR, as shown in Table (6.3), the
overall contribution is 21%. These percentages (Table (6.3)) are obtained
[using ANP] from answering RQ1, which identifies resources contributions
among themselves (Table (6.1)); as well as from answering RQ2, which
determines relatively the needed resources for each strategy (Table (6.2)).

131
Consequently, Table (6.3) represents the overall ranking of resources with
respect to the needs of the eight strategies collectively, considering
resources contributions among themselves. Accordingly, these
percentages are considered to represent the overall available
resources for company A.
Table (6.2) provides further details. It shows that the relative contribution
of HR (the needed HR compared to other resources) for the strategy of
MQS, CHF, ATT, PQA, TCF, UHK, QIM, and CQC is 33%, 21%, 44%, 30%,
39%, 25%, 26%, and 36% respectively. It can also be seen in Table (6.2)
that the relative contribution of OR for the strategy of MQS, CHF, ATT,
PQA, TCF, UHK, QIM, and CQC is 35%, 47%, 15%, 45%, 44%, 27%, 30%,
and 31% respectively. Regarding TR, its relative contribution to MQS, CHF,
ATT, PQA, TCF, UHK, QIM, and CQC is 32%, 32%, 41%, 25%, 17%, 48%,
44%, and 33% respectively as shown in Table (6.2).
Table (6.1): Relative contributions of each pair of resources to support the third
type of resource (RQ1)
HR OR TR
HR - 72.0% 76.0%
OR 74.0% - 24.0%
TR 26.0% 28.0% -
Total 100% 100% 100%

132
Table (6.2): Relative contribution of resources needed to ensure successful
strategy implementation (RQ2)
1 2 3 4 5 6 7 8
MQS CHF ATT PQA TCF UHK QIM CQC
HR 33.0% 21.0% 44.0% 30.0% 39.0% 25.0% 26.0% 36.0%
OR 35.0% 47.0% 15.0% 45.0% 44.0% 27.0% 30.0% 31.0%
TR 32.0% 32.0% 41.0% 25.0% 17.0% 48.0% 44.0% 33.0%
Total 100% 100% 100% 100% 100% 100% 100% 100%
Table (6.3): Overall contribution made by each resource type (combining RQ1 and
RQ2)
Overall Contribution
HR 41.0%
OR 38.0%
TR 21.0%
Total 100%
6.2.1.2 RQ3 and RQ4 for Company A
Moreover, results pertaining to RQ3 and RQ4 were presented in Table (6.4)
and (6.5) respectively. ANP was also used to combine the results of RQ3
and RQ4, as shown in Table (6.6), to provide the overall “weights” for each

133
strategy considering both RQ3 and RQ4. As can be seen in Table (6.4), the
actual HR supports that are received by the strategy of MQS, CHF, ATT,
PQA, TCF, UHK, QIM, and CQC is 9%, 17%, 17%, 15%, 12%, 15%, 7%,
and 8% respectively. Table (6.4) also illustrated that the actual OR
supports that are received relatively by the strategy of MQS, CHF, ATT,
PQA, TCF, UHK, QIM, and CQC is 33%, 11%, 11%, 15%, 8%, 5%, 9%, and
8% respectively. The same table show that the relative TR support that are
allocated is 14%, 20%, 17%, 8%, 12%, 9%, 13%, and 7% for the strategy
of MQS, CHF, ATT, PQA, TCF, UHK, QIM, and CQC respectively. In
Addition, the ability of each strategy to enhance quality as presented in
Table (6.5) is 13%, 9%, 9%, 22%, 22%, 11%, 10%, and 4% for the strategy
of MQS, CHF, ATT, PQA, TCF, UHK, QIM, and CQC respectively.
Accordingly, given that the eight strategies have not been treated equally
as each strategy received different support from HR, OR, and TR (RQ3);
and that each strategy also contributes differently to enhance quality
(RQ4), the results of Table (6.4) and (6.5) are combined using ANP and
shown in Table (6.6). This is to obtain the OVERALL prioritization of
Company A‟s strategies. As seen in Table (6.6), the eight strategies of MQS,
CHF, ATT, PQA, TCF, UHK, QIM, and CQC are prioritized as they are
collectively weighted as 16.28%, 14.61%, 13.63%, 13.62%, 13.24%,
10.83%, 10.37%, and 7.42% respectively. Accordingly, these
percentages (Table (6.6)) are considered to be the overall resources
that should be allocated for each strategy, as they are obtained from
answering RQ3 (Table (6.4)) and RQ4 (Table (6.5)).

134
Table (6.4): The relative actual supports of HR, OR, and TR for the eight critical
strategies (RQ3)
Table (6.5): The relative contributions of each critical strategy to quality
enhancement (RQ4)
Ability to Enhance Quality
1. MQS 13%
2. CHF 9.0%
3. ATT 9.0%
4. PQA 22%
5. TCF 22%
6. UHK 11%
7. QIM 10%
8. CQC 4.0%
Total 100%

135
Table (6.6): Resource-based prioritisation of the eight critical strategies
(combining RQ3 and RQ4)
Overall
[ s(i) ]
1. MQS 16.28%
2. CHF 14.61%
3. ATT 13.63%
4. PQA 13.62%
5. TCF 13.24%
6. UHK 10.83%
7. QIM 10.37%
8. CQC 7.42%
Total 100%
6.2.2 The Need for GP Model
The analysis of ANP reveals that the need of each strategy, in this
situation, cannot be optimized (i.e. exactly satisfied). This can be explained
through comparing the needs of each strategy with what is actually
allocated for it. Table (6.2) clearly represents the individual need of each
strategy from HR, OR and TR. It is obvious that the percentage of each
type of resource is presented relatively with the remaining two types of
resources.
However, the allocated resources for each strategy are presented differently
Table (6.4), which illustrates how the HR, OR, and TR are distributed
among the eight strategies. However, the table does not show how each
single strategy is mobilizing HR, OR, and TR in a relative form (i.e. their

136
total = 100%). For example, in the HR row in Table (6.4), each figure
represents the relative support of HR for a single strategy compared to the
remaining seven strategies. That means the relative allocated HR, OR, and
TR for a single strategy can be obtained by normalizing the support of HR,
OR, and TR for each single strategy. This normalization step should be
carried out to obtain the relative allocated HR, OR, and TR in terms of the
relative percentages within each single strategy as shown in Table (6.7).
For example, in Table (6.7), the allocated HR, OR, and TR for the strategy
of MQS are 16%, 59%, and 25%. These figures are calculated by
normalizing the values of 9%, 33%, and 14% that correspond to the
relative support of HR, OR, and TR to MQS that are directed relatively to
the remaining strategies as shown in Table (6.4). In the other words, Table
(6.7) is developed using data from Table (6.4) by normalizing the support of
the three types of resource (HR, OR, and TR) to obtain the relative support
of each type of resource within each single strategy. This means it can be
easily compared between the needs of each strategy as shown in Table
(6.2) with what is actually allocated for each strategy as presented in Table
(6.7).
Table (6.7): Relative actual supports received by each critical strategy (Normalized
version of Table (6.4))
1 2 3 4 5 6 7 8
MQS CHF ATT PQA TCF UHK QIM CQC
HR 16.0% 35.0% 38.0% 39.5% 37.5% 51.7% 24.0% 35.0%
OR 59.0% 23.0% 24.0% 39.5% 25.0% 17.2% 31.0% 35.0%
TR 25.0% 42.0% 38.0% 21.0% 37.5% 31.1% 45.0% 30.0%
Total(Normalized) 100% 100% 100% 100% 100% 100% 100% 100%

137
As can be seen in Tables (6.2) and (6.7), the ANP model quantitatively
differentiates between the needed resources for each strategy and the
support received. For example, in Table (6.2) where 33% of the needed
resources for the implementation of strategy MQS in the company were
HR while, in reality, as shown in Table (6.7), HR represents 16% of the
allocated resources for this strategy. Note that the 16% is about 50% less
than what is needed (33%). In such a situation, the company cannot
exactly satisfy the need of each strategy from each type of resource
unless a single strategy receives more or less than what actually has
been allocated for this strategy. This is because there are seven
remaining strategies, which each strategy face such resource discrepancy.
Similarly, other strategies appear to have deviations between what is
perceived to be needed and what is considered to be allocated. Specifically,
the needed HR for the seven remaining strategies; CHF, ATT, PQA, TCF,
UHK, QIM, and CQC, as shown in Table (6.2), are 21%, 44%, 30%, 39%,
25%, 26% and 36% respectively. In reality, however, the allocated HR for
these strategies are 35%, 38%, 39.5%, 37.5%, 51.7%, 24% and 35%
respectively as shown in Table (6.7).
The same issue exists for the OR, as the needed OR shown in Table (6.2)
is 35%, 47%, 15%, 45%, 44%, 27%, 30%, and 31% for the MQS, CHF,
ATT, PQA, TCF, UHK, QIM, and CQC respectively. In reality, however, the
allocated OR for these strategies, as shown in Table (6.7), is 59%, 23%,
24%, 39.5%, 25%, 17.2%, 31% and 35% respectively.
138
Similarly, the needed TR, as shown in Table (6.2), is 32%, 32%, 41%,
25%, 17%, 48%, 44%, and 33% for the MQS, CHF, ATT, PQA, TCF, UHK,
QIM, and CQC respectively. In reality, however, the allocated TR for
these strategies, as shown in Table (6.7), is 25%, 42%, 38%, 21%, 37.5%,
31%, 45%, and 30% respectively. Hence, the need arises for GP in order
to handle such an interaction.
6.2.2.1 Further Explanations for the Strategy of QIM
The disparities between the needed and allocated resources are obvious in
all strategies except QIM. In particular, it is found that the needed HR
(26%), OR (30%), and TR (44%), as shown in Table (6.2), are very close to
the allocated HR (24%), OR (31%), and TR (45%), as shown in Table (6.7).
That is why this strategy is selected to provide further justification for the
development of the GP model. Such an exceptional matching between the
needed resources and the allocated resources for QIM may indicate that it
is in an optimal situation. However, for Company A, this should not be a
strategic goal (or strategically desired) as it represents just one side of the
story. Remember, it is important to keep in mind that the aim of the
company is to satisfy, not to optimize, the need of the eight
strategies. That is why the GP model is proposed for such an issue.
That means the individual needs of each strategy is considered, but with
respect to the consideration of the individual needs of all remaining
strategies as well. So the aim is to satisfy these needs rather than optimize
the individual needs of one single strategy.
Therefore, in the case of the QIM, although the needed TR (44%), for
example, is very close the allocated TR (45%), the needed TR (44%) should
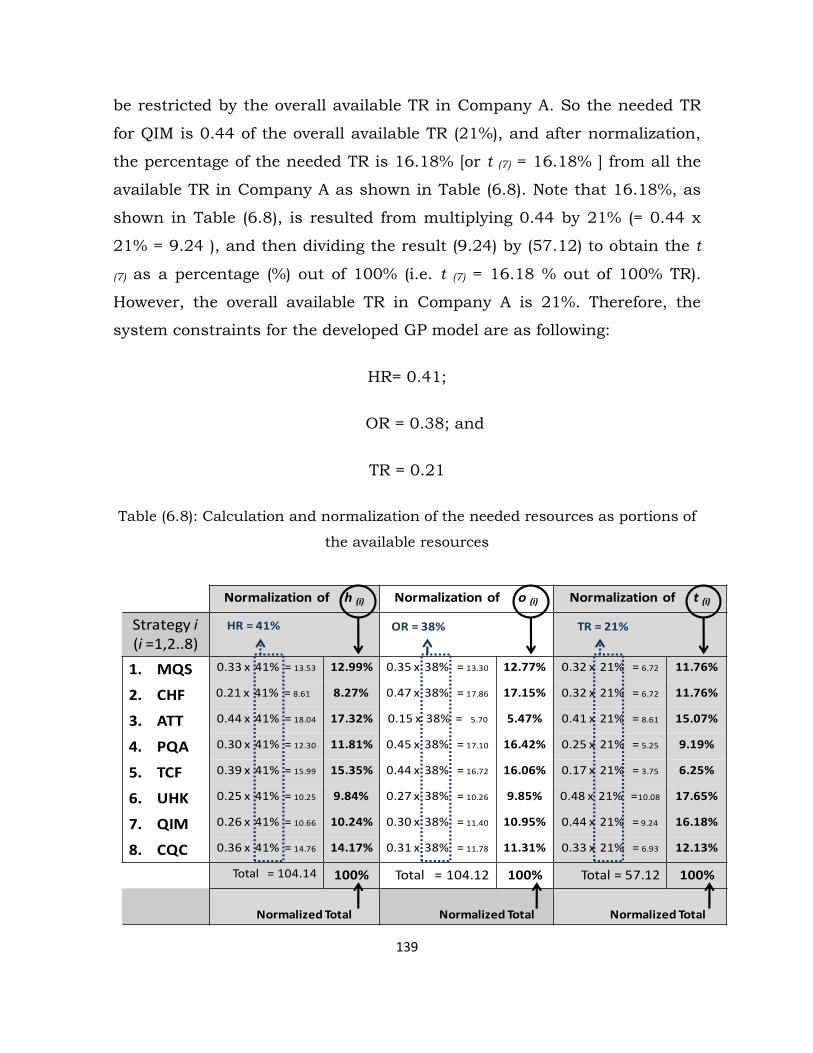
139
be restricted by the overall available TR in Company A. So the needed TR
for QIM is 0.44 of the overall available TR (21%), and after normalization,
the percentage of the needed TR is 16.18% [or t (7) = 16.18% ] from all the
available TR in Company A as shown in Table (6.8). Note that 16.18%, as
shown in Table (6.8), is resulted from multiplying 0.44 by 21% (= 0.44 x
21% = 9.24 ), and then dividing the result (9.24) by (57.12) to obtain the t
(7) as a percentage (%) out of 100% (i.e. t (7) = 16.18 % out of 100% TR).
However, the overall available TR in Company A is 21%. Therefore, the
system constraints for the developed GP model are as following:
HR= 0.41;
OR = 0.38; and
TR = 0.21
Table (6.8): Calculation and normalization of the needed resources as portions of
the available resources
Normalization of h (i) Normalization of o (i) Normalization of t (i)
Strategy i(i =1,2..8)
HR = 41% OR = 38% TR = 21%
1. MQS 0.33 x 41% = 13.53 12.99% 0.35 x 38% = 13.30 12.77% 0.32 x 21% = 6.72 11.76%
2. CHF 0.21 x 41% = 8.61 8.27% 0.47 x 38% = 17.86 17.15% 0.32 x 21% = 6.72 11.76%
3. ATT 0.44 x 41% = 18.04 17.32% 0.15 x 38% = 5.70 5.47% 0.41 x 21% = 8.61 15.07%
4. PQA 0.30 x 41% = 12.30 11.81% 0.45 x 38% = 17.10 16.42% 0.25 x 21% = 5.25 9.19%
5. TCF 0.39 x 41% = 15.99 15.35% 0.44 x 38% = 16.72 16.06% 0.17 x 21% = 3.75 6.25%
6. UHK 0.25 x 41% = 10.25 9.84% 0.27 x 38% = 10.26 9.85% 0.48 x 21% =10.08 17.65%
7. QIM 0.26 x 41% = 10.66 10.24% 0.30 x 38% = 11.40 10.95% 0.44 x 21% = 9.24 16.18%
8. CQC 0.36 x 41% = 14.76 14.17% 0.31 x 38% = 11.78 11.31% 0.33 x 21% = 6.93 12.13%
Total = 104.14 100% Total = 104.12 100% Total = 57.12 100%
Normalized Total Normalized Total Normalized Total

140
Additionally, the overall resources (whether HR, OR, or TR) that should be
allocated for QIM are obtained from combining the support of HR, OR, and
TR collectively, as well as considering the ability of each strategy to
enhance „quality‟ as shown in Table (6.6). As discussed above, these
percentages (in Table (6.6)) are considered the overall resources that
should be allocated for each strategy. Therefore, these percentages
represent the right side (targets) of the equations of the goal constraints
[see Figure (6.1)]. So, it can be understood that the overall support from all
resources that should be allocated for QIM is 10.37% of all available
resources in Company A (whether HR, OR, or TR) as shown in Table (6.6).
Thus, the right hand side of the equation of the goal constraint of the
strategy of QIM (the seventh strategy) is 0.1037 as shown in Figure (6.1).
Note that Figure (3.6), in Chapter 3, illustrates how the GP model is
proposed from the detailed ANP analysis.
6.2.2.2 Formulation of the GP model:
The results of the ANP model confirmed that the company cannot exactly
satisfy the need of each strategy from each type of resource (RQ2)
unless a single strategy receives more or less than what actually has
been allocated for it (RQ3). Answering RQ1 and RQ2 resulted in an
overall ranking of resources with respect to the needs of the eight
strategies collectively. In particular, the overall relative contribution of the
HR, OR, and, TR [or the overall need for the eight strategies], as shown in
Table (6.3), are 41%, 38%, and, 21% respectively. Accordingly, these
percentages are considered to represent the overall available
resources for Company A. These percentages represent the ‘system
constraints’ as shown in Figure (6.1)].

141
However, it is important to understand the consequences of such a
consideration [which is considering that the overall available HR, OR, and
TR is 41%, 38%, and 21% respectively]. To illustrate, if HR represents 33%
of the needed resources in MQS as shown in Table (6.2), the need of this
strategy is then to mobilize 33% from the overall HR (41%) in the company
or 12.99% of the overall HR (41%) as calculated in Table (6.8) [i.e. h(1)
= 12.99%]. So, as it can be seen in Table (6.8), the strategy of MQS needs
12.99%, 12.77%, and 11.76% from the overall HR, OR, and, TR
respectively. However, the first challenge for the company is how to
exactly satisfy the need of MQS, for example, within the existence of the
remaining seven strategies. These seven strategies are actually sharing
MQS in terms of obtaining their own needs from the overall HR (41%),
OR (38%), and, TR (21%).
In addition, regardless of the overall available HR, OR, and, TR, the
second challenge for the company is how to guarantee that even
though the actual needs for MQS (i.e. strategy 1) were exactly
satisfied [which is for HR, (h (1) = 12.99%), for OR (o (1) = 12.77%), and, for
TR (t (1) = 11.76%)], the overall resources that should be allocated for
this strategy (s (1) = 16.28%) will be maintained [16.28% is resulted from
the RQ3 and RQ4 (combined) as shown in Table (6.6)].
In other words, there is no guarantee that if MQS exactly mobilizes
12.99% of HR, 12.77% of OR, and, 11.76% of TR, the overall
resources for this strategy will represent exactly 16.28% (s(1)) of all
resources in the company. With this in mind, the remaining strategies
are also in the same situation; that is, each strategy has its own objective

142
that needs to be optimized. Specifically, the objective is to maintain what
should be allocated for each strategy [maintain s (i)]. However, as there
are eight different strategies, the aim is to „satisfy‟ the objectives rather
than to „optimize‟ them. From this point of view, this thesis proposed a GP
model, as shown in Figure (6.1), to see how far each strategy is from its
own objective (target) if its objective is to satisfy its own need as much as
possible (minimize the deviational variables, di+ and di
-). In the other word,
the GP model in Figure (6.1) is proposed to address RQ5 for this case
study. [See also Figure (3.6) in Chapter 3 that illustrates how the GP model
is proposed from the detailed ANP analysis].
MIN P1 [ d1- + d1
+ ] +
P2 [ d2- + d2
+ ] +
P3 [ d3- + d3
+ ] +
P4 [ d4- + d4
+ ] +
P5 [ d5- + d5
+ ] +
P6 [ d6- + d6
+ ] +
P7 [ d7- + d7
+ ] +
P8 [ d8- + d8
+ ]
HR = 0.41
OR = 0.38
TR = 0.21
System Constraints
GoalConstraints
di-, and di
+ ≥ 0, where i = 1, 2, 3, … 8
TheObjective Function
• Subjected To:
0.1299 HR + 0.1277 OR + 0.1176 TR + d1- - d1
+ = 0.1628
0.0827 HR + 0.1715 OR + 0.1176 TR + d2- - d2
+ = 0.1461
0.1732 HR + 0.0547 OR + 0.1507 TR + d3- - d3
+ = 0.1363
0.1181 HR + 0.1642 OR + 0.0919 TR + d4- - d4
+ = 0.1362
0.1535 HR + 0.1606 OR + 0.0625 TR + d5- - d5
+ = 0.1324
0.0984 HR + 0.0985 OR + 0.1765 TR + d6- - d6
+ = 0.1083
0.1024 HR + 0.1095 OR + 0.1618 TR + d7- - d7
+ = 0.1037
0.1417 HR + 0.1131 OR + 0.1213 TR + d8- - d8
+ = 0.0742
Figure (6.1): The Proposed GP Model for Company A

143
6.2.2.3 GP Results and Discussion
The results were obtained using „QM for Windows‟ and summarized in
Figure (6.2). Four strategies had a positive value of d+, which means they
consumed more resources than should have been allocated for them (i.e.
they were over-resourced). As shown in Figure (6.2), strategies TCF, UHK,
QIM, and CQC were over-resourced by 3.55%, 6.06%, 13.35%, and 70.59%
respectively. As a result, under-resourcing appeared in the remaining
strategies that had a positive value of d-. Namely, MQS, CHF, ATT, and
PQA were under-resourced by 22.28%, 15.27%, 9.41%, and 4.45%
respectively. Notably, the total under-resourcing or ∑ di- = 0.0775 (or
7.75%) of the resources is similar to the total over-resourcing ∑di+ =
0.0775 (or 7.75%). This confirms the assumption underpinning the model,
which is that under-resourcing in some strategies resulted from resources
consuming more than should have been assigned for the remaining
strategies. In other words, this situation indicates that there is a resource
allocation issue.

144
Strategy (i)
Target
(Goal)
[ si ]
d+
Overload d-
Shortage Actual allocationFactor
[Target / Actual
allocation]
MQS 0.1628 0.0363 (22.3%) [.1628 - .0363] = 0.1265 1.287
CHF 0.1461 0.0223 (15.3%) [.1461- .0223] = 0.1238 1.180
ATT 0.1363 0.0128 (9.4%) [.1363 - .0128] = 0.1235 1.104
PQA 0.1362 0.0061 (4.5%) [.1362 - .0061] = 0.13011.047
TCF 0.1324 0.0047 (3.5%) [.1324 +.0047] = 0.1371 0.966
UHK 0.1083 0.0066 (6.1%) [.1083 +.0066] = 0.1149 0.943
QIM 0.1037 0.0138 (13.4%) [.1073 +.0138] = 0.1175 0.882
CQC 0.0742 0.0524 (70.5%) [.0742 +.0524] = 0.1266 0.586
Total = 1
How 100% of the available recourses should be allocated
Total = 1 How 100% of the available resources is
actually being allocated
Figure (6.2) Results of the GP Model for Company (A)
6.2.2.4 Developing a Strategic Quality Management Index (SQMI)
From the analysis of the GP model, it becomes appropriate to develop a
Strategic Quality Management Index (SQMI), which is developed to assess
the level of utilization of the resources. This is important because, for
example, in the selected case (Company A), although the strategy of CQC is
over-resourced by 70.5% (i.e. 70.5% more than what should be allocated
for it; which may indicates ineffective management of resources), the

145
70.5% represents just a portion of what should be allocated for CQC.
Specifically, this portion is 70.5% of the 7.42% or [0.705 * 0.0742 =
5.24%]. That means only 5.24% of the overall available resources in
Company A were inappropriately consumed in CQC (i.e. placed in a wrong
strategy). Therefore, it is important for the company to have an index to
determine its efficiency level in term of resources utilization. The SQMI is
calculated using the proposed formula as shown below:
100 – ({[% of the inefficiency]} / 2)
= 100 – ({∑ [% of the under-resourcing in Strategy (i) × Weight of Strategy
(i)]
+ ∑ [% of the over-resourcing in Strategy (i) × Weight of Strategy (i)]} / 2)
The „percentage of under-resourcing‟ and the „percentage of over-
resourcing‟ of each strategy are shown in Figure (6.2) while the „weight‟ of
each strategy is shown in Table (6.6) [see the column of “overall”].
Accordingly, the SQMI for the company was determined as shown below:
= 100 – ({
[(%22.3×0.1628)+(15.3%×0.1461)+(9.4%×0.1363)+(4.5%×0.1362)]
+ [(%3.5×0.1324)+(6.1%×0.1083)+(13.4%×0.1037)+(70.5%×0.0742)]
} / 2)
= 100 – 7.75 = 92.25

146
Accordingly, the SQMI for Company A is 92.25; which means 92.75% of all
resources in Company A are allocated as they should be (i.e. distributed to
the eight strategies correctly). Conversely, this also reveals that 7.75% of
all resources in Company A are assigned to incorrect strategies (incorrect
positions). Indeed, the total over-resourcing or ∑ di+ = 0.0775 (or 7.75%) is
equal to the total under-resourcing ∑di- = 0.0775 (or 7.75%); which in
turn, as illustrated above, confirms the assumption that under-resourcing
in some strategies were resulted from over-resourcing in the remaining
strategies. This implies that 7.75% of the resources are supposed to be
transferred from the over-resourced strategies to the under-resourced
strategies. This is to cover the under-resourcing of 7.75% as a result of
eliminating under-resourcing of 7.75%. Such an action will result in 100%
of resource utilization (i.e. SQMI = 100).
The index can also be used by the company to assess its SQM practices, or
to benchmark its level of utilization of resources for SQM with other
companies. In this comparative study, SQMI for Company B is also
calculated.
6.2.2.5 Resource Re-allocation
The target for each strategy, which is to maintain what should be
allocated (the right side of the goal constraint [s (i)] ), cannot be
achieved exactly unless the needed resources for each strategy are
reallocated. Achieving targets “exactly” means that the value of ∑di- and
∑di+ should be equal to zero. Thus, the amount of the needed h (i), o (i), and
t (i) in the left side of the goal constraints should be modified in a way that
guarantees the disappearance of the deviational variables in the results (or
∑di+ should be = ∑di
- = 0).

147
To illustrate such a modification, the coefficients of the HR, OR, and TR (h
(1), o (1), and t (1)) for the strategy of MQS (the first goal constraint) should be
multiplied by a factor to cover the shortage [d1- = (.0363)] that appeared in
the results shown in Figure (6.2). This factor is obtained by dividing a
targeted amount of resources [i.e. what should be allocated for this
strategy (the right side of the first goal constraint [s (1)] that supposed
to be maintained)] by the „Actual‟ amount of resources assigned in
reality (in practice) for this strategy or [0.1628 / (0.1628 – {under-
resourced by 0.0363}) = 0.1628 / 0.1265]. Accordingly, the factor for this
goal constraint is 1.28. Note that the actual amount received by this
strategy in practice (0.1265) is determined as shown in Figure (6.2). Also
note that the factor for this strategy equals 1.28, which is greater than 1,
which means the coefficient of HR, OR, and TR (h (1), o (1), and t (1)) for MQS
will be increased and the percentage of the increase for each type of
resource is 28.7% (1.287 - 1 = 0.287 or 28.7%). The increase of 28.7% in h
(1), o (1), and t (1) should cover the shortage (under-resourcing) of 22% that
appeared in MQS as shown in Figure (6.2).
In contrast, the factor for the strategy of CQC is less than 1 (factor =
0.586), which reveals that the coefficient of HR, OR, and TR (h (8), o (8), and
t (8)) should be decreased by 41.4% (1-0.586 = 0.414 or 41.4%). This action
should remove the over-resourcing of 70.5% (d+=0.0524) that appeared in
the strategy of CQC as shown in Figure (6.2).
Similarly, all goal constraints were modified by determining a factor for
each equation. For the remaining six strategies (or remaining six equations
of the goal constraints), the factors are 1.180, 1.104, 1.047, 0.966, 0.943,
and 0.882 for CHF, ATT, PQA, TCF, UHK, and QIM respectively. In
particular, the coefficient of HR, OR, and TR (h (i), o (i), and t (i)) for the

148
strategy of CHF, ATT, and PQA should be increased by 18%, 10.4%, and
4.7% respectively to cover their shortages (under-resourcing) as shown in
Figure (6.2). In contrast, this also means that the coefficient of HR, OR,
and TR (h (i), o (i), and t (i)) for the strategy of TCF, UHK, and QIM should be
decreased by 3.4%, 5.7%, and 11.8% respectively to remove the over-
resourcing as shown in Figure (6.2). The modified form of the GP model is
shown in Figure (6.3). This action resulted in the disappearance of
divisional variables from the results as shown in Figure (6.4).
The rationale for developing such factors (modifications) is to change the
state of each strategy from „what is actually being practiced‟ [see the
column of „The actual allocation‟ in Figure (6.2)] to „what should be
allocated for each strategy‟ [see the column of „Target‟ in Figure (6.2)]. Such
modifications will guarantee that the GP model will exactly satisfy what
should be allocated for each strategy [s(i)] (i.e. ∑di- = ∑di
+ = 0). Naturally,
this will be at the expense of changing the specific, individual needs of HR,
OR and TR for each strategy using the identified factors.
Otherwise, without such a modification, attaining the original needs (non-
modified needs) of each strategy results in practicing quality strategies
with the existence of over-resourcing (di+) and under-resourcing (di
-) in the
strategies as shown in Figure (6.2); which represents the optimum
situation (not optimal because ∑di- and ∑di
+ > 0). Therefore, it is proposed
here that if Company A wants to attain the optimal (not optimum)
situation in which ∑di- = ∑di
+ = 0 as shown in Figure (6.4), the needed HR,
OR, and TR that are mobilized in each strategy must be modified with
respect to the developed factors, as shown in Figure (6.3).

149
• Subjected To:
0.1672 HR + 0.1644 OR + 0.1514 TR + d1- - d1
+ = 0.1628
0.0976 HR + 0.2025 OR + 0.1389 TR + d2- - d2
+ = 0.1461
0.1912 HR + 0.0604 OR + 0.1664 TR + d3- - d3
+ = 0.1363
0.1236 HR + 0.1719 OR + 0.0962 TR + d4- - d4
+ = 0.1362
0.1483 HR + 0.1551 OR + 0.0604 TR + d5- - d5
+ = 0.1324
0.0928 HR + 0.0929 OR + 0.1664 TR + d6- - d6
+ = 0.1083
0.0903 HR + 0.0966 OR + 0.1427 TR + d7- - d7
+ = 0.1037
0.0831 HR + 0.0663 OR + 0.0711 TR + d8- - d8
+ = 0.0742
HR = 0.41
OR = 0.38
TR = 0.21System Constraints
Modifications in
GoalConstraints
di-, and di
+ ≥ 0, where i = 1, 2, 3, … 8
MIN P1 [ d1- + d1
+ ] +
P2 [ d2- + d2
+ ] +
P3 [ d3- + d3
+ ] +
P4 [ d4- + d4
+ ] +
P5 [ d5- + d5
+ ] +
P6 [ d6- + d6
+ ] +
P7 [ d7- + d7
+ ] +
P8 [ d8- + d8
+ ]
TheObjective Function
GoalConstraints
Figure (6.3): The Modified GP Model for Company A

150
Strategy (i)
Target
(Goal)
[ si ]d+ d-
The actual achievement(following resource re-allocation)
MQS 0.1628 0 0 0.1628
CHF 0.1461 0 0 0.1461
ATT 0.1363 0 0 0.1363
PQA 0.1362 0 0 0.1362
TCF 0.1324 0 0 0.1324
UHK 0.1083 0 0 0.1083
QIM 0.1037 0 0 0.1037
CQC 0.0742 0 0 0.0742
=
Figure (6.4): The Results of the Modified GP Model for Company A
6.3 Company B
6.3.1 Results of the ANP Analysis
6.3.1.1 RQ1 and RQ2 for Company B
The ANP inputs for Company B‟s participants were analyzed using „Super
Decision‟ and the results of the three experts involved in the quantitative
phase were aggregated using Excel. Results pertaining to the first four
research questions are presented in Tables (6.9) through (6.14).
Specifically, Table (6.9) and (6.10) answer the first two research questions.
Table (6.11) combines the results for RQ1 and RQ2 as ANP is capable of

151
providing overall „weights‟ for HR, OR, and TR considering their overall
relative contributions.
As shown in Table (6.9), all types of resources in Company B share a very
similar level of significance, which is different to the findings for Company
A. However, this significance depends on the context in which these
resources are employed. For example, for HR to play its role effectively, it is
found that the relative contribution of OR and TR is 65% and 35%
respectively. In contrast, to enable OR to play its role effectively, TR
contributes significantly (64%) compared with the contribution of HR
(36%). Nevertheless, HR contributes 65% while OR contributes 35% to
enable TR to be effectively activated. This sort of „balancing‟ is reflected in
the overall ranking of these resource as shown in Table (6.11) which
indicates that the global contributions of HR, OR, and TR in company B
are 33%, 34%, and 33% respectively. As discussed for Company A, these
percentages (Table 6.11) are considered to represent the overall
available resources for Company B. Note that these global contributions
(i.e. percentages in Table 6.11) also consider the contribution of each type
of resource to each single strategy as shown in Table (6.10).
Additional details can be seen in Table (6.10). It shows that the relative
contribution of HR (i.e. the needed HR compared with other resources) for
the strategies of ATT, MQS, CQC, QIM, TCF, CHF, UHK, and PQA are 25%,
21%, 17%, 18%, 16%, 27%, 18%, and 16% respectively. Table (6.10) also
shows that the relative contribution of OR for the strategies of ATT, MQS,
CQC, QIM, TCF, CHF, UHK, and PQA are 45%, 56%, 55%, 46%, 61%,
40%, 51%, and 57% respectively. Regarding TR, its relative contributions
to ATT, MQS, CQC, QIM, TCF, CHF, UHK, and PQA are 30%, 23%, 28%,
36%, 23%, 33%, 31%, and 27% respectively as shown in Table (6.10).

152
Table (6.9): Relative contributions of each pair of resources to support the third
type of resource (RQ1)
HR OR TR
HR - 36% 65%
OR 65% - 35%
TR 35% 64% -
Total 100% 100% 100%
Table (6.10): Relative contribution of resources needed to ensure successful
strategy implementation (RQ2)
1 2 3 4 5 6 7 8
ATT MQS CQC QIM TCF CHF UHK PQA
HR 25.0% 21.0% 17.0% 18.0% 16.0% 27.0% 18.0% 16.0%
OR 45.0% 56.0% 55.0% 46.0% 61.0% 40.0% 51.0% 57.0%
TR 30.0% 23.0% 28.0% 36.0% 23.0% 33.0% 31.0% 27.0%
Total 100% 100% 100% 100% 100% 100% 100% 100%

153
Table (6.11): Overall contribution made by each resource type (combining RQ1
and RQ2)
Overall Contribution
HR 33%
OR 34%
TR 33%
Total 100%
6.3.1.2 RQ3 and RQ4 for Company B
Results pertaining to RQ3 and RQ4 were presented in Table (6.12) and
(6.13) respectively. ANP was used to combine the results of RQ3 and RQ4,
as shown in Table (6.14), to provide the overall „weights‟ for each strategy
considering both RQ3 and RQ4. As seen in Table (6.12), the actual HR
supports received by ATT, MQS, CQC, QIM, TCF, CHF, UHK, and PQA are
14%, 17%, 12%, 9%, 15%, 11%, 9%, and 13% respectively. Table (6.12)
also illustrates that the actual OR supports received relatively by ATT,
MQS, CQC, QIM, TCF, CHF, UHK, and PQA are 15%, 14%, 18%, 12%,
11%, 11%, 9%, and 10% respectively. The same table show that the
relative TR supports allocated are 15%, 10%, 16%, 13%, 11%, 11%, 14%,
and 10% for the strategies of ATT, MQS, CQC, QIM, TCF, CHF, UHK, and
PQA respectively. In addition, the ability of each strategy to enhance
„quality‟ as presented in Table (6.13) are 12%, 15%, 12%, 15%, 12%, 9%,
15%, and 10% for ATT, MQS, CQC, QIM, TCF, CHF, UHK, and PQA
respectively.
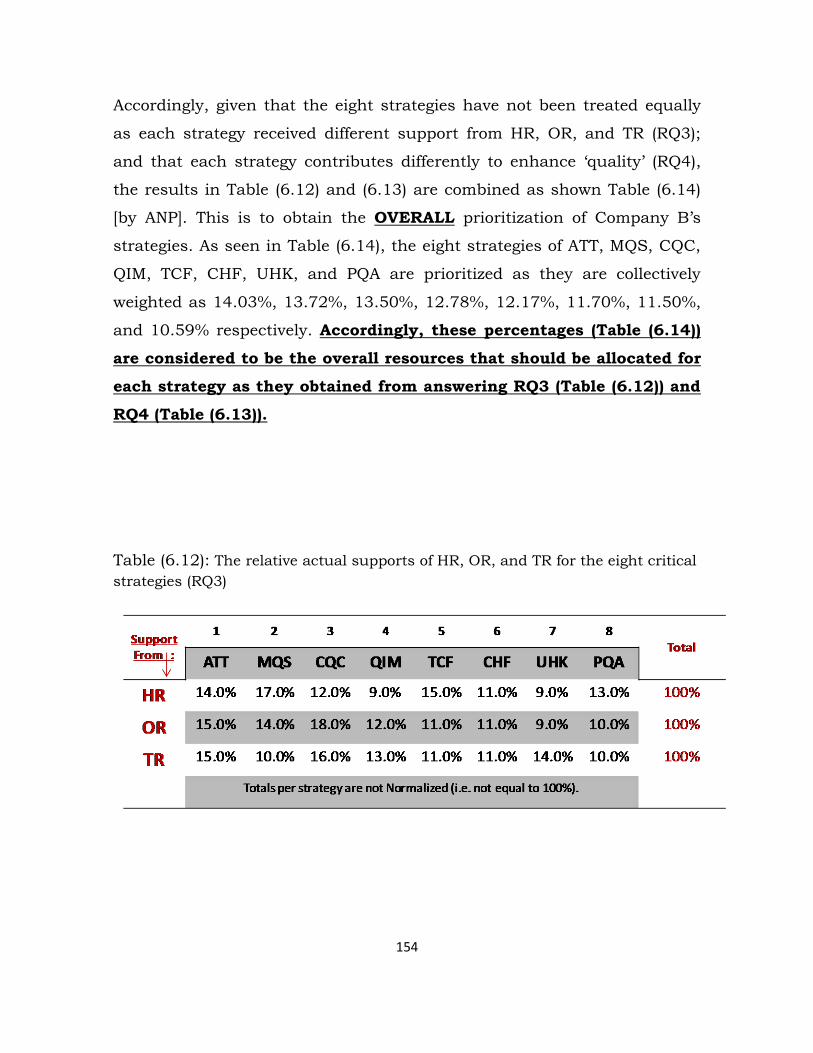
154
Accordingly, given that the eight strategies have not been treated equally
as each strategy received different support from HR, OR, and TR (RQ3);
and that each strategy contributes differently to enhance „quality‟ (RQ4),
the results in Table (6.12) and (6.13) are combined as shown Table (6.14)
[by ANP]. This is to obtain the OVERALL prioritization of Company B‟s
strategies. As seen in Table (6.14), the eight strategies of ATT, MQS, CQC,
QIM, TCF, CHF, UHK, and PQA are prioritized as they are collectively
weighted as 14.03%, 13.72%, 13.50%, 12.78%, 12.17%, 11.70%, 11.50%,
and 10.59% respectively. Accordingly, these percentages (Table (6.14))
are considered to be the overall resources that should be allocated for
each strategy as they obtained from answering RQ3 (Table (6.12)) and
RQ4 (Table (6.13)).
Table (6.12): The relative actual supports of HR, OR, and TR for the eight critical
strategies (RQ3)

155
Table (6.13): The relative contributions of each critical strategy to quality
enhancement (RQ4)
Ability to Enhance Quality
1. ATT 12%
2. MQS 15%
3. CQC 12%
4. QIM 15%
5. TCF 12%
6. CHF 9%
7. UHK 15%
8. PQA 10%
Total 100%
Table (6.14): Resource-based prioritisation of the eight critical strategies
(combining RQ3 and RQ4)
Overall
[ s(i) ]
1. ATT 14.03%
2. MQS 13.72%
3. CQC 13.50%
4. QIM 12.78%
5. TCF 12.17%
6. CHF 11.70%
7. UHK 11.50%
8. PQA 10.59%
Total 100%

156
6.3.2 The Need for GP Model
As seen in Company A, analysis of the ANP for Company B reveals that the
need of each strategy, in this situation, can‟t be optimized (i.e. exactly
satisfied). This can be explained by comparing the needs of each strategy
with what is actually allocated for it. Table (6.10) clearly represents the
individual need of each strategy from HR, OR and TR. The percentage of
each type of resource is presented relatively with the remaining two types
of resources.
The allocated resources for each strategy are presented differently in table
(6.12), which illustrates how the HR, OR, and TR are distributed among
the eight strategies. However, it does not show how each single strategy is
mobilizing HR, OR, and TR in a relative form (i.e. their total = 100%). For
example, in the row of HR support in Table (6.12), each percentage
represents the relative support of HR for a single strategy, relative to the
remaining seven strategies. However, the relative allocated HR, OR, and
TR for a single strategy can be obtained by normalizing the support of HR,
OR, and TR for each single strategy. This normalization step should be
carried out to get the relative allocated HR, OR, and TR in terms of the
relative percentages within each single strategy as shown in Table (6.15).
For example, in Table (6.15), the allocated HR, OR, and TR for the strategy
of ATT are 32%, 34%, and 34%. These figures are calculated by
normalizing the values of 14%, 15%, and 15%, that correspond to the
support of HR, OR, and TR to ATT that are directed relatively to the
remaining strategies as shown in Table (6.12). In other words, Table (6.15)
is developed using data from Table (6.12) by normalizing the support of the
three types of resource (HR, OR, and TR) to obtain the relative support of
each type of resource within each single strategy. Then it is easy to

157
compare the needs of each strategy (as shown in Table (6.10)) with what is
actually being allocated (as shown in Table (6.15)).
Table (6.15): Relative actual supports received by each critical strategy
(Normalized version of Table (6.12))
1 2 3 4 5 6 7 8
ATT MQS CQC QIM TCF CHF UHK PQA
HR 32.0% 42.0% 26.0% 27.0% 40.0% 33.3% 28.0% 40.0%
OR 34.0% 34.0% 39.0% 35.0% 30.0% 33.3% 28.0% 30.0%
TR 34.0% 24.0% 35.0% 38.0% 30.0% 33.3% 44.0% 30.0%
Total(Normalized) 100% 100% 100% 100% 100% 100% 100% 100%
As seen in Tables (6.10) and (6.15), the ANP model quantitatively
differentiates between the needed resources for each strategy and the
support received. As illustrated in Table (6.10), 25% of the needed
resources for the implementation of strategy ATT in the company were HR;
while in reality, as shown in Table (6.15), HR represents 32% of the
allocated resources for this strategy. Note that the 32% is “about 28%
more than” what is needed (25%). In such a situation, the company
cannot exactly satisfy the need of each strategy from each type of
resources unless a single strategy receives more or less than what has
actually been allocated for this strategy. This is because there are seven
remaining strategies facing such resource discrepancy.

158
Similarly, other strategies appear to have deviations between what is
perceived to be needed and what is considered to be allocated. Specifically,
the needed HR for the remaining seven strategies: MQS, CQC, QIM, TCF,
CHF, UHK, and PQA, as shown in Table (6.10), are 21%, 17%, 18%, 16%,
27%, 18% and 16% respectively while, in reality, the allocated HR for
these strategies are 42%, 26%, 27%, 40%, 33%, 28% and 40% respectively
as shown in Table (6.15).
The same issue is exists for the needed OR, as shown in Table (6.10) is
45%, 56%, 55%, 46%, 61%, 40%, 51% and 57% for the ATT, MQS, CQC,
QIM, TCF, CHF, UHK, and PQA respectively. In reality, however, the
allocated OR for these strategies, as shown in Table (6.15), is 34%, 34%,
39%, 35%, 30%, 33%, 28% and 30% respectively.
Similarly, the needed TR for seven out of the eight strategies, as shown in
Table (6.10), which is 30%, 23%, 28%, 36%, 23%, 31%, and 27% for the
ATT, MQS, CQC, QIM, TCF, UHK, and PQA respectively. In reality,
however, the allocated TR for these strategies, as shown in Table (6.15), is
34%, 24%, 35%, 38%, 30%, 44%, and 30% respectively. Hence, the need
arises for GP, which can handle such an interaction.
6.3.2.1 Further Explanations for the Strategy of CHF
The dissimilarities between the needed and allocated resources are obvious
in all strategies except CHF (in TR percentages). This strategy is, therefore,
selected to provide further justification for developing the GP model. In
particular, it is found that the needed TR for CHF is 33% (Table (6.10)),

159
which is equal to the allocated TR (33%) as shown in Table (6.15). Such an
exceptional matching between the needed TR and the allocated TR for CHF
may indicate that it is in an optimal situation. However, for Company B, as
well as in Company A, this should not be the strategic aim as it represents
just one side of the story. Again, it is important to keep in mind that the
aim of the company is to satisfy, not to optimize, the need of the eight
strategies; which is why the GP model is proposed for such an issue.
This means the individual needs of each strategy are considered, but with
respect to the consideration of the individual needs of all remaining
strategies as well. The aim is to satisfy these needs rather than optimize
the individual needs of one single strategy. Therefore, in the case of CHF,
although the needed TR (33%) is equal to the allocated TR (33%), the
needed TR (33%) should be restricted by the overall available TR in
Company B. So the needed TR for CHF is 0.33 [see Table 6.10] of the
overall available TR (33%) [see Table 6.11], and after normalization the
percentage of the needed TR is 14.29% [or t (6) = 14.29% ] from all the
available TR in Company B as shown in Table (6.16). Note that 14.29%, as
shown in Table (6.16), is calculated by multiplying 0.33 by 33% (= 0.33 x
33% = 10.89 ), and then dividing the result (10.89) by (76.23) to obtain the
t (6) as a percentage (i.e. t (6) = 14.29% TR). However, the overall available
TR in Company B is 33%. Therefore, the system constraints for the
developed GP model are as follows:
HR= 0.33;
OR = 0.34; and
TR = 0.33
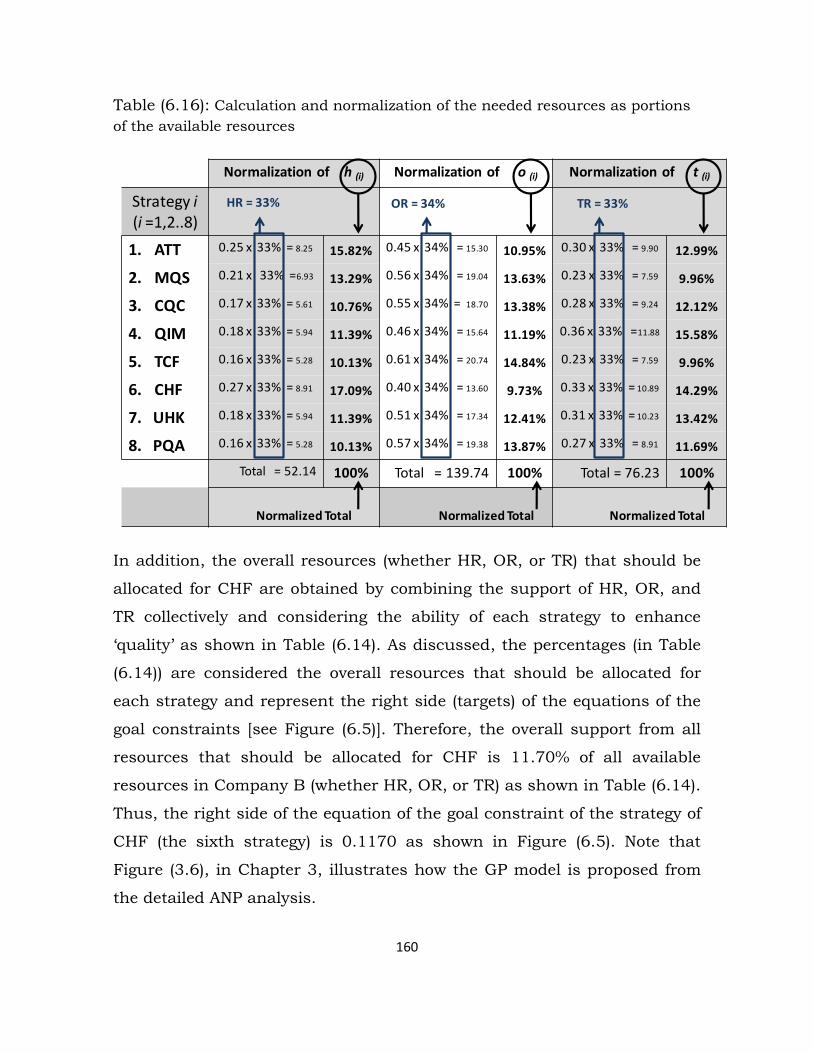
160
Table (6.16): Calculation and normalization of the needed resources as portions
of the available resources
Normalization of h (i) Normalization of o (i) Normalization of t (i)
Strategy i(i =1,2..8)
HR = 33% OR = 34% TR = 33%
1. ATT 0.25 x 33% = 8.25 15.82% 0.45 x 34% = 15.30 10.95% 0.30 x 33% = 9.90 12.99%
2. MQS 0.21 x 33% =6.93 13.29% 0.56 x 34% = 19.04 13.63% 0.23 x 33% = 7.59 9.96%
3. CQC 0.17 x 33% = 5.61 10.76% 0.55 x 34% = 18.70 13.38% 0.28 x 33% = 9.24 12.12%
4. QIM 0.18 x 33% = 5.94 11.39% 0.46 x 34% = 15.64 11.19% 0.36 x 33% =11.88 15.58%
5. TCF 0.16 x 33% = 5.28 10.13% 0.61 x 34% = 20.74 14.84% 0.23 x 33% = 7.59 9.96%
6. CHF 0.27 x 33% = 8.91 17.09% 0.40 x 34% = 13.60 9.73% 0.33 x 33% = 10.89 14.29%
7. UHK 0.18 x 33% = 5.94 11.39% 0.51 x 34% = 17.34 12.41% 0.31 x 33% = 10.23 13.42%
8. PQA 0.16 x 33% = 5.28 10.13% 0.57 x 34% = 19.38 13.87% 0.27 x 33% = 8.91 11.69%
Total = 52.14 100% Total = 139.74 100% Total = 76.23 100%
Normalized Total Normalized Total Normalized Total
In addition, the overall resources (whether HR, OR, or TR) that should be
allocated for CHF are obtained by combining the support of HR, OR, and
TR collectively and considering the ability of each strategy to enhance
„quality‟ as shown in Table (6.14). As discussed, the percentages (in Table
(6.14)) are considered the overall resources that should be allocated for
each strategy and represent the right side (targets) of the equations of the
goal constraints [see Figure (6.5)]. Therefore, the overall support from all
resources that should be allocated for CHF is 11.70% of all available
resources in Company B (whether HR, OR, or TR) as shown in Table (6.14).
Thus, the right side of the equation of the goal constraint of the strategy of
CHF (the sixth strategy) is 0.1170 as shown in Figure (6.5). Note that
Figure (3.6), in Chapter 3, illustrates how the GP model is proposed from
the detailed ANP analysis.

161
6.3.2.2 Formulation of the GP Model
The results of the ANP model confirmed that the company cannot exactly
satisfy the need of each strategy from each type of resources (RQ2)
unless a single strategy receives more or less than what has actually
been allocated for this strategy (RQ3). Answering RQ1 and RQ2 resulted
in the overall ranking of resources with respect to the needs of the eight
strategies collectively. In particular, the overall relative contribution of the
HR, OR, and, TR [or the overall need for the eight strategies], as shown in
Table (6.11), are 33%, 34%, and, 33% respectively. Accordingly, these
percentages are considered to represent the overall available
resources for Company B [System constraints as shown in Figure
(6.5)].
However, it is important to understand the consequences of considering
that the overall available HR, OR, and TR is 33%, 34%, and 33%
respectively. To illustrate, if HR represents 25% of the needed resources in
ATT as shown in Table (6.10), the need of this strategy is then to mobilize
25% from the overall HR (33%) in the company or 15.82% of the overall
HR (33%) as calculated in Table (6.16) [i.e. h(1) = 15.82%]. So, as it can
be seen in Table (6.16), the strategy of ATT needs 15.82%, 10.95%, and
12.99% from the overall HR, OR, and, TR respectively. However, the first
challenge for the company is how to exactly satisfy the need of ATT, for
example, within the existence of the remaining seven strategies, which are
actually sharing the strategy of ATT in terms of obtaining their own
needs from the overall HR (33%), OR (34%), and, TR (33%).

162
Moreover, regardless of the overall available HR, OR, and, TR, the second
challenge for the company is that how to guarantee that even though
the needs for ATT were exactly satisfied [which is for HR, (h (1) =
15.82%), for OR (o (1) = 10.95%), and, for TR (t (1) = 12.99%)], the overall
resources that should be allocated for this strategy (s (1) = 14.03%) will
be maintained [14.03% is resulted from the RQ3 and RQ4 (combined) as
shown in Table (6.14)].
In other words, there is no guarantee that if the strategy of ATT
exactly mobilizes 15.82% of HR, 10.95% of OR, and, 12.99% of TR,
the overall resources for this strategy will represent exactly 14.03%
(s(1)) of all resources in the company. With this in mind, the remaining
strategies are also in the same situation, with their own objectives that
need to be optimized. Specifically, the objective of each strategy is to
maintain what should be allocated for each strategy [maintain s (i)].
However, as there are eight different strategies, the attempt should be to
„satisfy‟ the objectives rather than to „optimize‟ them. This thesis therefore
proposed a GP model, as shown in Figure (6.5), to see how far each
strategy is from its own objective (target) if its objective is to satisfy its own
need as much as possible (i.e. minimize the deviational variables, di- and
di+). In the other word, the GP model in Figure (6.5) is proposed to address
RQ5. [See also Figure (3.6) in Chapter 3 that illustrates how the GP model
is proposed from the detailed ANP analysis].

163
MIN P1 [ d1- + d1
+ ] +
P2 [ d2- + d2
+ ] +
P3 [ d3- + d3
+ ] +
P4 [ d4- + d4
+ ] +
P5 [ d5- + d5
+ ] +
P6 [ d6- + d6
+ ] +
P7 [ d7- + d7
+ ] +
P8 [ d8- + d8
+ ]
• Subjected To:
0.1582 HR + 0.1095 OR + 0.1299 TR + d1- - d1
+ = 0.1403
0.1329 HR + 0.1363 OR + 0.0996 TR + d2- - d2
+ = 0.1372
0.1076 HR + 0.1338 OR + 0.1212 TR + d3- - d3
+ = 0.1350
0.1139 HR + 0.1119 OR + 0.1558 TR + d4- - d4
+ = 0.1278
0.1013 HR + 0.1484 OR + 0.0996 TR + d5- - d5
+ = 0.1217
0.1709 HR + 0.0973 OR + 0.1429 TR + d6- - d6
+ = 0.1170
0.1139 HR + 0.1241 OR + 0.1342 TR + d7- - d7
+ = 0.1150
0.1013 HR + 0.1387 OR + 0.1169 TR + d8- - d8
+ = 0.1059
HR = 0.33
OR = 0.34
TR = 0.33
System Constraints
GoalConstraints
di-, and di
+ ≥ 0, where i = 1, 2, 3, … 8
TheObjective Function
Figure (6.5): The Proposed GP Model for Company B
6.3.2.3 GP Results and Discussion
The results were obtained using „QM for Windows‟ and summarized in
Figure (6.6). Three strategies had a positive value of d+, which means they
consumed more resources than should have been allocated for them (i.e.
they were over-resourced). As shown in Figure (6.6), strategies CHF, UHK,

164
and PQA were over-resourced by 16.8%, 7.9%, 12.6% respectively. As a
result, under-resourcing appeared in the remaining five strategies that had
a positive value of di-. Namely, ATT, MQS, CQC, QIM, and TCF were under-
resourced by 5.7%, 10.3%, 10.4%, 0.59% and 4.03% respectively. The total
under-resourcing or ∑ di- = 0.042 (or 4.2%) was also found to be similar to
the total over-resourcing (∑di+ = .042 or 4.2%). This confirms the
assumption underpinning the model which is that under-resourcing in
some strategies resulted from consuming more resources than what
should have been allocated for the remaining strategies. In other words,
this situation indicates that there is a resource allocation issue.
Strategy (i)
Target
(Goal)
[ si ]
d+
Overload d-
Shortage Actual allocationFactor
[Target / Actual
allocation]
ATT 0.1403 0.0080 (5.7%) [.1430 - .0080] = 0.1323 1.06
MQS 0.1372 0.0141 (10.3%) [.1372- .0141] = 0.1231 1.115
CQC 0.1350 0.0140 (10.4%) [.1350 - .0140] = 0.1210 1.116
QIM 0.1278 0.000753 (0.59%) [.1278 - .000753] = 0.127047 1.006
TCF 0.1217 0.0049 (4.03%) [.1217- .0049] = 0.1168 1.042
CHF 0.1170 0.0196 (16.8%) [.1170 +.0196] = 0.1366 0.856
UHK 0.1150 0.0091 (7.9%) [.1150 +.0091] = 0.1241 0.927
PQA 0.1059 0.0133 (12.6%) [.1059 +.0133] = 0.1192 0.889
Total = 1
How 100% of the available recourses should be allocated
Total = 1 How 100% of the available resources is
actually being allocated
Figure (6.6): Results of the GP Model for Company B

165
6.3.2.4 Developing a Strategic Quality Management Index (SQMI)
Based on the analysis of the GP model, it is appropriate to develop a SQMI
to assess the level of the utilization of resources. This is important
because, for example, in the selected case (Company B), although the
strategy of PQA is over-resourced by 12.6% more than what should be
allocated for it [which may indicate ineffective management of resources],
the 12.6% represents just a portion of what should be allocated for PQA.
Specifically, this portion is 12.6% of the 10.59% or [0.126 * 10.95 =
1.33%]. That means only 1.33% of the overall available resources in
Company B were inappropriately consumed in PQA (i.e. placed in a wrong
strategy). Therefore, it is important for the company to have an index to
determine its efficiency level in term of resources utilization. The SQMI is
calculated using the proposed formula as shown below:
100 – ( {[% of the inefficiency]} / 2)
= 100 – ({∑ [% of the under-resourcing in strategy (i) × Weight of Strategy
(i)]
+ ∑ [% of the over-resourcing in strategy (i) × Weight of Strategy (i)]} / 2)
The “percentage of the under-resourced” and the “percentage of the over-
resourced” for each strategy is shown in Figure (6.6) while the „weight‟ of
each strategy is shown in Table (6.14) [see the column of “overall”].
Accordingly, the SQMI for the company was determined as shown below:

166
= 100 – ({
[(5.7%×0.1403)+(10.3%×0.1372)+(10.4%×0.1350)+(0.59%×0.1278)+(4.03%
×0.1217)]
+ [(16.8%×0.1170)+(7.9%×0.1150)+(12.6%×0.1059)] } / 2 )
= 100 – 4.2 = 95.8 [ or 95.8% ]
Accordingly, the SQMI for Company B is 95.8%; which means 95.8% of all
resources in Company B are allocated as they should be (i.e. distributed to
the eight strategies correctly). Conversely, this also reveals that 4.2% of all
resources in Company B are assigned to incorrect strategies (incorrect
positions). Indeed, as illustrated above, the total over-resourcing or ∑ di+ =
0.042 (or 4.2%) is equal to the total under-resourcing ∑di- = 0.042 (or
4.2%); which in turn confirms the assumption that under-resourcing in
some strategies resulted from over-resourcing in the remaining strategies.
This implies that 4.2% of the resources should be transferred from the
over-resourced strategies to the under-resourced strategies. This is to
cover the under-resourcing of 4.2% as a result of eliminating under-
resourcing of 4.2%. Such an action will result in 100% of resource
utilization (i.e. SQMI = 100).
The index can also be used by the company to assess its SQM practices or
to benchmark its level of utilization of resources for SQM with other
companies. Compared with Company A, where SQMI is 92.25, Company B
is more efficient in terms of resource utilization with an SQMI of 95.8.

167
6.3.2.5 Resource Re-allocation
The target for each strategy, which is to maintain what should be
allocated (the right side of the goal constraint [ s (i)] ), cannot be
achieved exactly unless needed resources for each strategy are reallocated.
Achieving targets „exactly‟ means that the value of ∑di- and ∑di
+ should be
equal to zero. Thus, the amount of the needed h (i), o (i), and t (i) in the left
side of the goal constraints equations should be modified in a way that
guarantees the disappearance of the deviational variables in the results (or
∑di+ should be = ∑di
- = 0).
To illustrate such a modification, the coefficients of the HR, OR, and TR (h
(1), o (1), and t (1)) for ATT (1st goal constraint) should be multiplied by a
factor to cover the shortage (under-resource) [d1- = (.008)] that appeared in
the results as shown in Figure (6.6). This factor is obtained by dividing a
targeted amount of resources [i.e. what should be allocated for this
strategy (i.e. the right side of the first goal constraint [s(1)] that
supposed to be maintained)] by the ‘actual’ amount of the resources
assigned in reality (i.e. in practice) for this strategy or [0.1403 / (0.1403
– {under-resourced by 0.0080}) = 0.1403 / 0.1323]. The factor for this goal
constraint is 1.06. Note that the actual amount received by this strategy in
practice (0.1323) is determined as shown in Figure (6.6). Also note that the
factor for this strategy equals 1.06, which is greater than 1, which means
the coefficient of HR, OR, and TR (h (1), o (1), and t (1)) for ATT will be
increased and the percentage of the increase for each type of resource is
6% (1.06 - 1 = 0.06 or 6%). The increase of 6% in h (1), o (1), and t (1) should
cover the shortage (under-resourcing) of 5.7% (d- = 0.0080) that appeared
in ATT, as shown in Figure (6.6).

168
In contrast, the factor for PQA is less than 1 (factor = 0.889), which reveals
that the coefficient of HR, OR, and TR (h (8), o (8), and t (8)) should be
decreased by 11.1% (1-0.889 = 0.111 or 11.1%). This action should remove
the over-resourcing of 12.6% (d+=0.0133) that appeared in PQA, as shown
in Figure (6.6).
Similarly, all goal constraints were modified by determining a factor for
each equation. For the remaining six strategies (or remaining six equations
of the goal constraints), the factors are 1.115, 1.116, 1.006, 1.042, 0.856,
and 0.927 for MQS, CQC, QIM, TCF, CHF, and UHK respectively. In
particular, the coefficient of HR, OR, and TR (i.e. h (i), o (i), and t (i)) for the
strategy of MQS, CQC, QIM, and TCF should be increased by 11.5%,
11.6%, 0.6% and 4.2% respectively to cover their shortages (under-
recourcing) as shown in Figure (6.6). In contract, this also means that the
coefficient of HR, OR, and TR (h (i), o (i), and t (i)) for the strategy of CHF and
UHK should be decreased by 14.4%, and 7.3% respectively to remove the
over-resourcing as shown in Figure (6.6). The modified form of the GP
model is shown in Figure (6.7). This action resulted in the disappearance
of divisional variables from the results as shown in Figure (6.8).

169
HR = 0.33
OR = 0.34
TR = 0.33
System Constraints
Modifications in
GoalConstraints
di-, and di
+ ≥ 0, where i = 1, 2, 3, … 8
MIN P1 [ d1- + d1
+ ] +
P2 [ d2- + d2
+ ] +
P3 [ d3- + d3
+ ] +
P4 [ d4- + d4
+ ] +
P5 [ d5- + d5
+ ] +
P6 [ d6- + d6
+ ] +
P7 [ d7- + d7
+ ] +
P8 [ d8- + d8
+ ]
TheObjective Function
GoalConstraints
• Subjected To:
0.1678 HR + 0.1161 OR + 0.1377 TR + d1- - d1
+ = 0.1403
0.1482 HR + 0.1519 OR + 0.1110 TR + d2- - d2
+ = 0.1372
0.1201 HR + 0.1493 OR + 0.1352 TR + d3- - d3
+ = 0.1350
0.1146 HR + 0.1126 OR + 0.1568 TR + d4- - d4
+ = 0.1278
0.1056 HR + 0.1547 OR + 0.1038 TR + d5- - d5
+ = 0.1217
0.1463 HR + 0.0833 OR + 0.1223 TR + d6- - d6
+ = 0.1170
0.1056 HR + 0.1150 OR + 0.1244 TR + d7- - d7
+ = 0.1150
0.0899 HR + 0.1233 OR + 0.1039 TR + d8- - d8
+ = 0.1059
Figure (6.7): The Modified GP Model for Company B

170
Strategy (i)
Target
(Goal)
[ si ]d+ d-
The actual achievement(following resource re-allocation)
ATT 0.1403 0 0 0.1403
MQS 0.1372 0 0 0.1372
CQC 0.1350 0 0 0.1350
QIM 0.1278 0 0 0.1278
TCF 0.1217 0 0 0.1217
CHF 0.1170 0 0 0.1170
UHK 0.1150 0 0 0.1150
PQA 0.1059 0 0 0.1059
=
Figure (6.8): The Results of the Modified GP Model for Company B
The rationale for developing such factors (modifications) is to change the
state of each strategy from “what is actually being practiced” [refer to „The
actual allocation in Figure (6.6)] to “what should be allocated for each
strategy” [see the column of „Target‟ in Figure (6.6)]. Such modifications
will guarantee that the GP model will exactly satisfy what should be
allocated for each strategy [s(i)] (i.e. ∑di- = ∑di
+ = 0). This will naturally be
at the expense of changing the specific, individual needs of HR, OR and TR
for each strategy using the identified factors.

171
Otherwise, without such a modification, attaining the original needs (non-
modified needs) of each strategy results in practicing quality strategies
with the existence of over-resourcing (di+) as well as under-resourcing (di
-)
in the strategies as shown Figure (6.6); which represent the optimum
situation (not optimal as ∑di- and ∑di
+ > 0 [see Figure(6.6)]). Therefore, it is
proposed that if Company B wants to attain the optimal (not optimum)
situation in which ∑di- = ∑di
+ = 0 as shown in Figure (6.8), the needed HR,
OR, and TR (i.e. h (i), o (i), and t (i)) that are mobilized in each strategy must
be modified with respect to the developed factors, as modified in Figure
(6.7).
6.4 Summary
In summary, this chapter answered the five research questions associated
with this case study. The ANP analysis demonstrated the resource
allocation problem. Accordingly, the GP model was found to be an
appropriate tool to handle such an issue. This issue was critically
discussed and analyzed for both: Company A and B. The quantitative
analysis concluded and confirmed that each company has its own way of
mobilizing resources in response to their own strategic objectives. This
chapter proposed a methodology by which the company can utilize its use
of resources. This can be attained by „satisfying‟ the strategic objectives of
company‟s quality strategies, rather than „optimizing‟ the objective of a
single strategy. From this point of view, this chapter has demonstrated
„HOW’ resources can be allocated for each strategy to satisfy its exact
need, or at least, to minimize the extent to which each single strategy is
lacking in or overloaded by resource support (i.e. the fifth research
question). This chapter also proposed an SQMI by which the company can

172
evaluate its level of utilization of resources. According to this proposed
index, Company B was more efficient than Company A.

173
7.1 Introduction
This chapter presents the qualitative phase of the case study research. The
objective is to explain the quantitative findings of RQ5. Explanations are
provided to answer RQ6 to illustrate „WHY each single strategy may receive
resources, whether it is over-resourced under-resourced compared with
what should be allocated for it. This is achieved by conducting semi-
structured interviews with a total of 12 experts (six from each
company/case) during the author‟s second visit to the two companies in
Saudi Arabia. The qualitative analysis starts by analyzing Company A‟s
strategies that are under-resourced, followed by analyzing the strategies
that are over-resourced. In the same way, Company B is then investigated
qualitatively and the findings are presented. For both companies, the
qualitative findings are summarized separately at the end of the analysis of
each company in order to form what can be called a road map for each
company. The eight strategies are listed again in Table (7.1).
Chapter
7 Qualitative Analysis

174
Table (7.1): Critical Strategies to Enhance Strategic Quality Management
(source: Aravindan et al. (1996))
Critical Strategy Acronym
Continuous management of quality system MQS
Continuous checking of failures CHF
Continuous approach towards target ATT
Periodical quality audit (for customers and manufacturers) PQA
Continuous transfer of customers' feedback TCF
Continuous use of human knowledge UHK
Continuous quality information management QIM
Continuous control of quality costs CQC
7.2 Strategies that are Under-resourced - Company A
7.2.1 Management of the Quality System (MQS)
Generally, according to the Supply Chain Manager (SCM-A), this strategy
has support from senior management. Each department has its own
responsibility for monitoring the management system, while the Quality
Department focuses more on written procedures and implemented
activities. The SCM-A added that “organizational resources are supporting
our “follow-up system … Head of each department gives attention to any
related issue”. The QM1-A illustrated that organizational, human, and
technological resources are feeding their balanced scorecard system as it
needs tools and techniques available for employees to control the current
practices, policies, and procedures. The QM3-A confirmed the support of

175
resources by stating that “they support … if there is no support the whole
management system will fall down”.
However, the quantitative analysis indicated that this strategy is under-
resourced by 22% of what should be allocated for it. In fact, the issue of
“shortage” was mentioned by the SCM-A when he talked about challenges
facing this strategy. He emphasized that their management of the quality
system focuses on the current situation while the real challenge is to also
concentrate on continuous improvement. He added that “there is a big
room for improvement … to be honest … there are hidden opportunities”.
He explained that the Quality Department has the authority to deal with
all corrective actions in all departments, which is an opportunity to learn
from mistakes. At the same time, he declared that “we miss some
opportunities” because staff in the Quality Department claim there is a
“lack of resources”. Further explanation regarding this point was obtained
when QM1-A stated that quality is associated with all functions in any
department and stressed that “everybody needs to be committed to quality
… however, it is difficult to engage all staff”. That is why the QM3-A
emphasized that, for this strategy, “the system should be applied to the
whole organization and each business unit should be involved”. So, what
the QM1-A and the QM3-A are inferring is that the Quality Department is
somehow suffering from the lack of cooperation between departments in
regard to managing “the quality system” issue. This is a critical issue, as
one of the 14 points for „management‟ that were identified by William
Edwards Deming, one of the most well known philosophers in the field of
Quality Management, is to “break down barriers between departments and
staff areas” (Deming, 2000).
Further details regarding the “lack of resources” are illustrated clearly by
the QM2-A. For example, he stated that:

176
We are squeezing our resources here … we have a high
shortage of manpower for this strategy. For instance, in
one shift, we have one inspector responsible for inspecting
13 production lines as well as the raw materials. It is not
an issue of training as we, at the managerial level, provide
the required training … The problem is that we have staff
shortage at the operational level … We need new
technologies, especially, new devices to inspect raw
material and test them in the lab … Still manpower is the
real issue … The staff of Quality Department should report
directly to the CEO, and it was, but now we are reporting
to the Supply Chain Department … So here there is a
problem because quality is “the police man” of the
organization but as we are reporting to the supply chain in
which most of our activities are there, our authority are not
as if we are reporting directly to the CEO.
This quotation the QM2-A describes the resource shortage and explains
that it relates to the strategy of (PQA), especially in the area of human
resources. However, the QM1-A emphasized that all strategies do interact.
Specifically the strategy of MQS has the highest priority compared to other
strategies because: “it manages other strategies through bringing them all
together … and this needs efforts”. In other words, this strategy needs
more resources.
Certainly, the quantitative results showed that this strategy should receive
more resources than any other strategy. This strategy needs more
organizational support from senior management as the Quality

177
Department is not reporting directly to the CEO. Indeed, this is confirmed
by the SCM-A when he stated: “I‟m not required to follow up what the
Quality Department recommends”.
In addition, to obtain further explanation, the QM1-A was asked by the
interviewer: “What is missing for this strategy?”. He replied that, according
to the new national policy for quality, all national companies have to adopt
the EFQM model, and the balanced scorecard should be merged with the
EFQM model. He stated that “… we have a lot of initiatives but we did not
bring them all in one model “. He summarized stating that:
Sometimes … we do not have a written methodology for
executing strategic planning … The success of the EFQM
depends on three things: written methodology, assessment
for the implementation of this methodology, and reviewing
the methodology from time to time.
Obviously, this strategy has to employ more resources.
7.2.2 Checking of Failures (CHF)
Analysis of the previous chapter reveals that this strategy has a shortage
of 15%. Indeed, although all who were involved in the study agreed that
checking of failures is one of the main responsibilities of the Quality
Department, the QM1-A stressed that, compared to other quality
strategies; resources are limited for this strategy. He added that “checking

178
of failures” is seen as a very specific issue by staff, who think that
“checking of failures is not something everybody in the organization should
be engaged with … certain people only should be aware for such an issue”.
Moreover, the QM2-A explained that even those certain people are not
given enough attention from top management. He affirmed that “we have
people who are aware, but not trained (for checking), to carry out the
corrective actions … the cost is also an issue … the cost sometimes
becomes an obstacle here”. In addition, the QM1-A stated that people in
this company focus on corrective actions rather than preventative actions
and, according to the QM2-A, “not all of these corrective actions get
implemented”.
Resources are seen as key drivers for this strategy. Although checking of
failures is generally dependent on technological resources, and more
specifically on, “the availability of equipment”, effective actions cannot be
implemented “in isolation of the skilled staff”, according to QM1-A. He
declared that the appropriate equipment is important to help inspectors
decide whether or not the inspected item meets company standards and
customers expectations. Equipment is also needed to identify the causes of
failure. Correspondingly, QM2-A illustrated the significance of resource
availability for this strategy by stating that failures cannot be under full
control unless “the human itself (human resource) has the required
technological resources and receives support from top management
(organizational resources)”. Although quality experts in Company A agree
that this strategy needs more resource support, the QM2-A believe that
failures are generally under control and explained that “even if we don‟t
have all required “technologies”, people is the key for this strategy and they
do their best considering our certain standards of quality”. All participants
agreed to this point.

179
Another perspective came from the QM2-A, who stressed the matter of
“belief in quality”, believing it to be a chronic problem in most Arab
countries. The QM1-A also mentioned that this could be a cultural issue.
From this point of view, the QM2-A recommended linking concepts such as
quality, prevention, and correction, to people beliefs such as religious
practices. For instance, he stated that:
I have just had a presentation and in the first slide I
presented that quality is not only a requirement of our
business, but it is also a pre-requisite religious duty
(obligation) … So once people believe that prevention is in
no conflict with their religion, it will be then easier to
deliver quality related policies.
Therefore, it is no surprise that in Egypt the concept of quality is matched
with the business nature better than other management philosophies
because “religion is a powerful motive in Egypt” and, hence, Egyptian
organizations prefer to be directed to “a spiritual philosophy” such as TQM
as such a philosophy is featured by some values such as
“loyalty”(Elghamrawy and Shibayama, 2008).
Furthermore, QM2-A also recommended that senior management
follows up initiatives to regularly review corrective actions. In the same
way, the QM1-A declared that:
To some extent, management is responsible for „follow up‟
… we have to have managers who are really taking a step
forward to ask why this is happening … how can we

180
prevent this? … and keep asking questions why and why
and why…
It seems that both are in agreement that senior management should
consider the issue of „follow up and reviewing‟ as more important.
All quality managers emphasized that identifying the cause of failure is one
of the main issues to guarantee the successful implementation of this
strategy. In this regard, they confirmed the need for “more advanced
methods and faster methodologies”. The QM1-A explained more
specifically by stating that “what we miss here is to activate the
methodology of root cause analysis, fishbone diagram, or any similar tool
… to be able to eliminate the source of problems”. In fact, Doggett (2006)
concluded that if decision makers utilize instruments that discover causes
and classify these causes according to the field in which the problem
exists, they can then focus on and be more specific with the fields that
show the most potential.
7.2.3 Approach Towards Target (ATT)
Overall, all participants seem to agree that this strategy is efficient in
utilizing the company‟s resources. This aligns well with what has been
obtained from the GP model (i.e. this strategy has utilized 90.6 % of its
needed resources and is under-resourced by just 9.4%). The three
participants confirmed this situation in their company. According to the
SCM-A, “almost all targets are reached”. This is because in “every single
meeting the target is there”, the HRM-A added. These clear target

181
specifications, according to the QM2-A , have resulted in production of
good, quality products.
The participants also confirmed that all three types of resources (HR, OR,
and TR) have significant roles to play to achieve such targets. The SCM-A
linked people productivity in this strategy with organizational support
when he declared that the support from senior management, “thanking by
words”, and appreciation of new achievements are what push people to
work and perform consistently. Moreover, according to the QM1-A, both
technological and human resources are a must for this strategy, which he
illustrated by saying:
Sometimes technologies are important because there are
certain specifications you cannot achieve them by human
effort alone … however, because staff are operating these
technologies and supervising these machines, human
resources have to be knowledgeable to achieve these
certain specifications.
A deeper understanding of how these resources are mobilized is obtained
from the HRM-A. He illustrated that employees know what targets they are
responsible for at the beginning of each financial year. Tools such as the
“SMART objective” are used to define specific, measurable, achievable,
realistic, and time-based targets for each employee. Furthermore, these
targets should work within a pre-defined strategic frame through the well
known strategic management technique, the balanced scorecard.
Quarterly reviews are conducted to control operational and technical target
specifications. This is also confirmed by QM2-A who declared that:

182
At the end of each year … we have a review of our SMART
objectives … me as a manager, at least 80% of my SMART
objectives should be achieved as a part of our Balanced
Scorecard … We have specific targets … even for each
department … even for each product … our quality control
is running 24 hours to ensure that our products are within
the specific range …
Going back to the quantitative results, reasonable justifications for the 9.4
% shortage of resources in this strategy is generated from interviewees. To
illustrate, although there is a consensus that this strategy is efficient in
mobilizing its needed resources, some participants mentioned that there is
still room for allocating more resources for this strategy. For example,
when the QM2-A stated that “at least 80% of my SMART objectives should
be achieved”, he means that it is not 100% because it may need more
resources. The SCM-A, for example, affirmed that “there are opportunities
for utilizing more resources”. He believes that implementing the technique
of six sigma will result in better data management in the company. He
added that this is very important because applying such a technique on
data will generate “realistic targets”. In supporting this point, the QM2-A
shared the same opinion and when asked if he applied six sigma, he
replied “not yet implemented … it (six sigma) is important in identifying
clear targets, objectives, and policies … it should be linked to our SMART
objectives”. In this regard, the SCM-A stressed that training programs for
human resources are a must if the company wants to implement six sigma
efficiently. In addition, all quality managers agreed that recently launched
„innovation initiatives‟ will support this strategy.

183
The HRM-A, looked at what was missing for this strategy to be successfully
implemented from a different angle. He declared that in the process of
developing a business through achieving operational and manufacturing
targets, “we always forget what we call developing the organization itself”.
He illustrated the point by saying procedures of achieving a certain target
should be documented and this documentation should be considered in
the business performance assessment. He recommended consideration of
“developing self” as well. The QM3-A confirmed the focus in Company A is
to achieve targets “for the business (to make money) … that is why
business is there … If there is no target to be achieved … business will
die”. Put simply, the company should not only be focusing on tangible
targets, but on how the company can achieve those targets while
considering the benefits to the company‟s human capital as well. That is
what the HRM-B meant by “developing organization” and “developing self”.
In this sense, Linderman et al. (2006) stated that:
Behavioral theories interact with technical tools and
method in interesting ways; that is, the use of technical
tools and motivational factors must be managed jointly
rather than in isolation … goals can be effective when used
with quality tools and method. This is particularly
important for Six Sigma … operations management is not
just a technical problem but also requires behavioral
consideration.
Linderman et al. (2006) concluded that executives who are involved in goal
setting “can regulate how much organizational knowledge is created
through Six Sigma”.

184
7.2.4 Periodical Quality Audit (PQA)
The previous chapter showed that this strategy (PQA) is the second best
strategy for utilization of resources. Quantitatively, only 4% of the
resources that should be allocated for it are missing, indicating that this
strategy is well implemented in the company. In fact, the SCM-A stressed
that they have a strong link to their customers through their technical
visits to customers‟ factories. The QM2-A explained that the aim of these
visits is to make sure that customers‟ requirements match the existing
manufacturing processes. All participants confirmed that the Marketing
Research Department as well as the Quality and Safety Departments are
capable of carrying out audits that cover both customers and the
production line. “By technical visits, all feedbacks are recorded and
important reports are generated”, the SCM-A stated. The QM2-A described
that their system of auditing “deals with customers‟ complaints formally
using surveys and informally through technical visits”. He emphasized that
technical visit is “done without and regardless of any complaints … It is
part of our strategy”. The company better understands their customers
from such visits. For example, the QM2-A stated that:
In the Jordan market, our customers require specifications
that are not implemented yet in our production line, but we
will … Our team found that Jordanians prefer our products
to be packaged in a smaller size because they lived
generally in villages and they (customers) divided the
current “large size” between them.

185
In addition, according to the QM1-A, production lines, facilities, and the
quality system itself are investigated periodically by external auditors and
by the company‟s key customers.
However, in order to justify the 4% shortage of resources, it might be
useful to know how the QM1-A looked at this shortage as a “lack of
cooperation”. He stated: “It is mainly commitment of people … once
auditing is assigned to employees they think this comes as a second
priority because it is not a part of their main or daily activities”. Therefore,
the ITM-A said that staff sometimes handle the auditing assignment
„carelessly‟ and he emphasized that “people from all departments should
be involved”. That is why the QM3-A stressed that involvement of people
will add diversity and that “switching auditors is important to improve the
experience of people”. For example, he illustrated that if a certain process
is investigated by one auditor, the next assignment for this auditor should
be a different process. Indeed, “the best way to ensure quality of operations
is to rely on the collective efforts of all individuals … rather than on the
efforts of just the few in the QA Unit and management. Quality is indeed
everyone‟s responsibility” (Foss and Breanndan Moore, 2003).
The lack of resources can also be justified by the QM1-A when he stated
that “we need resources for some specific issues that require limited
resources, not huge”. Although he confirmed that TR are required, he
stressed that HR should be the focus because the “auditing itself is a
technique done by people and this needs skilled people ... trained people”.
Indeed, the QM2-A agreed when he stated that “Wallah (he swears by God),
we need more people in auditing”. He also hoped that the company would
strengthen the relationship with customers through activating what he

186
called a “free customer inquiries phone number”. All previous declarations
may justify why this strategy has the 4% shortage of resources.
7.3 Strategies that are Overloaded by Resources - Company (A)
7.3.1 Control of Quality Costs (CQC)
Although all quality managers emphasized the significance of resource
availability for activating this strategy, the quantitative results in the
previous chapter showed that the strategy of control of quality costs CQC
has the lowest priority compared to the remaining seven strategies in
terms of the resources that should be allocated. Indeed, the QM1-A stated
that:
People normally ignore the costs … Control of the quality
costs is not a priority at all … Priority is always given to
getting the job done … I‟m talking in general … even
though cost issues generally are critical, but still the
general tendency of the top management here is that they
want to produce a good quality product … This is their
ultimate objective regardless of how much they spend in
producing these products in a good quality.
This does not conflict with the quantitative results that showed that this
strategy is over-resourced by 70%. It seems that, in company A, they
considered the significance of resources for this strategy regardless of how
187
critical the strategy itself was compared to other strategies. This is not the
case when the GP handled the problem of resource allocation in the
previous chapter. That is way, quantitatively, the GP, as a multi-criteria
decision making tool, showed that this strategy consumes 70% more than
what should be allocated for it, which represents just 7% of the overall
allocated resources for all strategies. So the 70%, in reality, represents just
4.9% of the overall resources because what should be allocated for this
strategy is just 7%.
In fact, all quality managers in Company A stressed that resources are
significant for this strategy. The QM1-A stated that this strategy “needs a
lot of resources … in reality we are controlling the cost using a lot of
resources because many activities are involved here”. He explained that
these activities are supervised by skilled staff and supported by the top
management (i.e. OR). He also added that TR are supporting this strategy
in terms of analyzing hidden costs. Indeed, the QM3-A confirmed this
when he stated that this strategy “is tough and consumes a lot of
resources”. The fact that this strategy is consuming more than needed can
be seen clearly by the QM2-A when he said that “till now, I think we did
not apply the concept of COQ as it should be … to be honest, we are
excellent in controlling failures (failure costs) but we spend more on
prevention and appraisal”. Without doubt, “prevention and appraisal are
also subject to cost reduction” (Rao et.al, 1996).
The QM2-A explained how resources can be lost or become useless for this
strategy. He claimed that although the company provides excellent training
programs related to this strategy and also supplies tools such as latest
software, the issue is that “the system should be applied to implement the
concept of COQ in a professional way … They teach us, but unfortunately,

188
COQ is not applied as it should be”. He means that training programs for
human resources, together with the latest technologies, should be utilized
effectively; otherwise, they are waste of investment. In this regard, for this
strategy, the QM3-A declared that “resources needed to be organized to be
more efficient”. So it is a not a matter of a shortage of resources, but rather
that resources have to be activated and well organized. The QM1-A stated
“the best approach for this strategy is to have a „focused‟ area”. He
explained that key performance indicators (KPI‟s) for the COQ should be
reviewed and then linked to the balanced scorecard. In other word, he
wants the spending in prevention and appraisal activities to be limited to
this „focused area‟. In this regard, Srivastava (2008) reported that to
improve the internal screening for COQ or even for conducting exterior
benchmarking, companies can apply various forms of KPIs “such as
quality costs as percentage of sales, ratio of quality costs to profits, quality
costs as percentage of cost of goods sold, quality costs as percentage of
Return on Investments (ROI) etc”.
However, having more resources means a strategy is executed
successfully, regardless of the efficiency of using the resources. Quality
managers validate this through the interviews. The QM1-A mentioned that
the issue of COQ “is becoming the focus”, especially during the last two
years. For example, the QM2-A reported that water consumption has been
reduced by 25% resulting in cost saving of SR 2,000,000 per year by
reviewing the process of water consumption by technical staff. All
managers stressed that the concept of „innovation‟, which is becoming part
of the culture of the organization, supported this strategy and, according
to the QM2-A, the last example is one of the evidences. Although there are
a lack of researchers that handle the connection between „quality‟ and
„innovation‟, a number of researchers agree that the two concepts

189
represent “the central concepts of new forms of economic theory of the
firm” (Perdomo-Ortiz et al., 2006).
7.3.2 Quality Information Management (QIM)
The strategy of continuous quality information management (QIM) is one of
the „over-resourced‟ strategies, which according to the quantitative
analysis in the previous chapter receives 13% more than resources that it
should be. In other words, it has enough resources for implementation.
Indeed, during the interview, it was repeatedly stated by the QM2-A that
the “resources are enough”. Regarding organizational resources, Company
A seems to have a good communication environment to support this
strategy. The QM2-A and the SCM-A stressed that their company has a
“good communication environment”. According to the QM2-A, “there is an
exchange of information through meetings, especially morning meetings ...
In each quarter we have a major meeting with the CEO … We have
meetings with supply chain people on a weekly basis”. This was supported
by the SCM-A who declared that company A‟s employees “are very keen to
look after the information, meet and call everybody and, sometimes,
people contact each other to make sure the information is delivered with
the right understanding … That helps the communication to be
successful”.
If the previous citations confirmed the existence of „soft‟ communication,
participants also verified that the „hard‟ communication or the
“technological infrastructures” for the communications are playing their
supportive role in Company A. To illustrate, the SCM-B stated that “we are
excellent in using emails in an efficient way”. The QM2-A added that

190
“rather than the existence of information in each department, we have „The
Reporter‟ (software) by which I can access to any department in order to
read or create reports”. The QM1-A confirmed this saying that:
Some people in IT were specialized in gathering
information from each department and built what is known
as datawarehouse … Now, instead of creating reports
using the traditional way of data entry, reports now can be
created automatically using datawarehouse … Now, some
of reports are automatically generated …
In addition, the ITM-A explained that the datawarehouse has recently been
implemented to link the database to the four dimensions of the balanced
scorecard. He also illustrated that the success of this strategy begins with
recruiting the right people and then training them “to ensure that they
have the skill of managing the Oracle system or any „ERP system‟ in the
future”. A general perspective for this strategy can be obtained from the
ITM-A, who stated that “we are becoming a more multinational company
… overall, we are in the right direction of implementing this strategy”.
However, it can also be understood from the last sentence that there is
room to improve this strategy. To explain, statements such as “we are in
the right direction” from ITM-A do not guarantee that Company A is
mobilizing resources effectively for this strategy. Substantiation can be
obtained from the QM1-A when he stated that “some of the reports are
automatically generated” which may mean that not all reports need to be
created automatically. It seems that it is not a matter of a shortage of
resources. Indeed, the QM2-A confirmed that “it is not an issue of lack of

191
resources” rather than an issue of “how we going to use them”. To support
this, the SCM-A explained that “we are have the infrastructures of e-
meeting across the company … but it is not activated … the networks are
not utilized or utilized very rarely”. In fact, all participants agreed that
infrastructure for e-meetings is non-value=adding technology in their
organization. Although the QM2-A affirmed that “technology is already
existing and it is implemented by default” and claimed that IT people
should activate these technologies to be more efficient, the ITM-A,
conversely, explained that this is not the responsibility of the IT
Department, but rather is a misunderstanding from staff that,
occasionally, these technologies are not needed in the business. This
clarification from the ITM-A therefore justifies why this strategy receive
more than its actual need of resources. Note that the ITM-A said that this
occurred “sometimes”, not all times. It is important to understand that,
according to SCM-A , people sometimes travel to the company‟s branch in
Egypt to have a traditional meeting despite the company‟s of “e-meetings”
infrastructure. That is why some interviewees, conversely, stressed that
these technologies should be activated. Regardless, both cases generate
costs due to unorganized resources.
The ITM-A provided some further examples to explain this issue. He
emphasized that it is a matter of “business process reengineering” rather
than a lack of supporting technologies. For example, he talked about
issues related to the process of the flow of information between
departments. Issues related to “damaged products, missing invoices, and
sales for unknown customers” were common. For example, he described
that damaged products come firstly to the Dispatching Department then to
the Quality Department to do their checking. At the end, all paper work
goes to the Sales Department for data entry. Regarding these data entries,

192
he added that “sales people do not know about the damaged products till
the second or third week” because the process itself needs reengineering.
Here, the ITM-A indirectly explained that the currant process is consuming
resources but can be done with less if it is restructured. Moreover, he
mentioned that all paper work is sent to the Sales Department manually in
hard copy format. However, the information could be documented
automatically once damaged products are received by the company, which
is possible because the company has already implemented the needed
technologies for that. He listed some advantages of „reengineering‟ such a
process by activating certain technologies saying that “if that happens,
nobody has to come early for data entry, data will be accurate, and people
can then be involved in the analysis work rather than doing what
computers should do”.
Similarly, the QM1-A confirmed that training for IT people is not the issue
for this strategy when asked if IT people need training. He stated:
Not specifically training rather than they have to know
what are our requirements in each process to be simplified
… I have to sit with one of them to discuss the flow of the
processes to enable them to understand and to improve the
system to generate the required reports … also to make
these reports accessible easily for all people to simplify the
decision making process … Sometimes, instead of having
meetings, people may just need to look at the screen to
make their decision.

193
Thus, the ITM-A mentioned that „change‟ is the key for this strategy to
effectively utilize resources. He stated that “we have the system but people
do not want to change … we have to make sure that the organization is
ready to accept the change”. Accordingly, the QM1-A and the QM2-A
emphasized that „innovation initiatives‟, with the current cooperation
between employees, will be the main driver to simplify complicated
processes and eliminate the „non-added values‟ processes. In this regard,
the ITM-A stressed that the company has to concentrate on key initiatives
(i.e. not all initiatives) to keep resources under control. Specifically, he said
that:
We need to focus … now what is happening is the
business or the department comes with a lot of initiatives,
projects, new ideas that are consuming a lot of resources
but many of these initiatives and projects are not focused
on supporting this strategy and many of them are not
critical to be implemented immediately ... and we end up
with nothing been implemented or effectively implemented
… We have to select, for example, one or two initiatives
and focus on them and then deliver them considering their
priority.
In the same way, the QM1-A confirmed that if the company believes in the
philosophy of „innovation initiatives‟, people in the company “have to
streamline the process and have a clean sheet of paper to identify their
objectives and then re-map the process again to make it simpler, faster,
and generate lesser costs … they have also to eliminate non-added value
processes”. Obviously, participants affirmed that resources should be

194
reduced for this strategy as it consumes a lot of resources for non-added
value processes.
7.3.3 Use of Human Knowledge (UHK)
Quantitatively, this strategy utilizes resources more effectively than other
strategies as it consumes only 6% more than what should be allocated for
it. Through interviewing the six experts, who are working in different
managerial positions in Company A, the overall opinion validates the
quantitative results. The SCM-A emphasized that “job description and job
responsibilities are not barriers” when asked to justify why he considered
that resources are utilized appropriately for this strategy. He believes that
once employees have the knowledge they can give more, and the company
usually assigns more responsibilities to them. Indeed, all participants
agreed that the company provides a suitable environment for knowledge
sharing. The company “utilizes people who are capable and have enough
experience”, SCM-A stated. He added that “then we go for developing
people” through training programs designed and presented by those
capable employees. This implies that the human knowledge flows inside
the company, which indicates good signs for knowledge sharing.
Evidence also came from the QM2-A who confirmed that the available
resources are sufficient for this strategy. However, he stressed that “some
knowledge cannot be shared unless you have specific technology” because
of the existence of “interaction between technological resources and other
resources to support this strategy” in the company. This supports the
argument in the literature as well as the quantitative results of this
research that resources have to interact to effectively support some
195
strategies. The head of quality and safety as well as the ITM-A also
supported this point.
However, a deeper understanding is obtained from the HRM-A. Although
the previous discussion demonstrates that Company A is a knowledge-
sharing company, it does not show how this knowledge is managed. For
this strategy, it is believed that the HRM-A should be most capable of
explaining where the hidden 6% of the resources is. He was the only one
who declared that this strategy is not “efficient” in utilizing the available
resources by saying:
I think part of the problem relates to the traditional
understanding of the organization … engineers are going to
work in the factory … marketing staff in marketing
department…HR in HR development … This traditional
way of classifying people … of labeling people … limits our
capabilities … if x graduated from HR … does that mean
he/she can contribute only in that area? …We do not go
beyond the departmental boundaries … As long as you
have years of experience, the educational background
becomes meaningless …
The HRM-A was asked to comment on how this statement conflicts with
what the SCM-A‟s statement that “job description and job responsibilities
are not barriers”. He answered “yes … that is true … but not in managerial
levels, which are more critical”. He tried to explain through the following
example:

196
Just two days ago … someone from the supply chain
department, I want to move him to a senior level in the
international trade and export department … I found a lot
of resistance in the company because they claimed the
man is not suitable for the new position because he does
not have “sales experience”… But I believe that he has
good management capabilities and the important thing is
that the man is smart … Within six months he will know
everything about these technical issues of the new position
… He knows how to manage operations …
He stressed that this issue has to be solved by senior management. He
added that the company has to have the “emergency sense” by which it
can squeeze their human capitals through involving them in various
responsibilities instead of hiring new experts, which is an expensive
choice. He justified this saying that it is especially important now, because
“…we had a pressure in the last two years in the labor market … there is a
lack of experts in the labor market so „top management‟ has to be willing to
accept this idea”. Indeed, the QM2-A confirmed saying that:
People have the knowledge … but sometimes we lose this
knowledge because there is head-hunting surrounding us
… Those skilled people who have learned in this company
… we lose them because of inappropriate positions or
salaries paid to them.
QM2-A‟s final words clearly demonstrate that there is sort of squandering
in the use of resources for this strategy.

197
7.3.4 Transfer of Customers' Feedback (TCF)
Compared with the other strategies, this strategy is best in the utilization
of resources, with the quantitative analysis revealing that just 3% of
resources are overloaded. In fact, the HRM-A stated that:
A couple of weeks ago, I was talking with the CEO and we
concluded that the traditional marketing research does not
work alone … Our technical people through their visits to
different factories (customers) are selling as well … Rather
than selling products, we sell solutions.
To illustrate, he explained that one customer has continually and
persistently asked about prices and, consequently, sales staff noticed that
this kind of customer needs to be understood. They analyzed the process
inside the customer‟s factory and discovered that the real need of that
factory is for another type (form) of product, which is, fortunately, also
produced by the company‟s production lines. The customer is informed
that the machines inside the factory need a modified formula and the
company begins selling according to the new requirements. Regarding this
work, the QM1-A stated that “we added value to their (the customers)
processes”. Again, the HRM-A stressed that “our technical people provide
beyond what traditional marketing do … they were able to sell a solution
for that customer”. This indicates a „healthy‟ relationship with customers.
The HRM-A also highlighted the significance of „innovation‟ and reported
that “we have to be creative as one of our competitors succeeded in
entering a new market through just converting “part of the waste” of the

198
production process to a “valuable product””. Indeed, “what was considered
as rubbish in the past is making profit now”, the ITM-A confirmed.
With regard to internal customers, IT services represent one way that
feedback from internal customers is implemented. The ITM-A illustrated
that they are activating „innovation‟ by forming different teams to obtain
the requirements of internal customers. These teams meet with people
from different departments and negotiate with them about their critical
issues. He reported that they “usually get surprised and receive valuable
ideas”. This is because people from different backgrounds are involved in
brainstorming exercises that link ideas together and result in suggestions
for implementation by IT Department.
However, although the QM1-A stressed that customers‟ issues are
appreciated in all business units and everyone is aiming to meet customer
requirements, some participants confirmed that this strategy should
receive just the minimal resource requirements. This is because the Saudi
government supports some commodities, including Company A‟s products,
by imposing a „Tariff‟ on local importers‟ products. This results in
weakened the competition between the company and local importers.
Keeping in mind that the company is the only national producer for this
commodity, some participants affirmed that sales‟ targets can be achieved
easily. From this point of view, the quantitative analysis has not
considered this strategy as the most important strategy. It is also shown
quantitatively that this strategy is the best strategy in terms of utilizing the
resources, as it mobilizes almost exactly what should be assigned for it
(only 3% over-resourced). Thus, all participants confirmed that the
existence of the „tariff‟ justified why this strategy is not consuming more
resources. The QM2-A explained that it is a fact that the “tariff supports us

199
against importers which may lead to not listening well to our customer”.
He also explained that sometimes, “some feedbacks conflict with the
company‟s strategy and generate extra costs” and a focus on analyzing and
implementing these feedbacks is „waste‟ because they do not believe that
this affects the quality of our products. He confirms that, generally, this
strategy only utilizes what it needs from resources. However, he
guaranteed that their products meet their customers‟ needs. To illustrate,
he stated that:
We are producing „high quality‟ products using our current
technologies and techniques … and at the end of the day,
customers will not be affected by not having the latest
technologies … so it is not a big issue for the company.
However, even though this strategy is generally efficient with resources,
the 3% over-resourcing has some justifications, which were obtained from
interviews and can be summarized into two points. Firstly, the HRM-A and
the SCM-A believe that the existence of „tariff‟ as a government support
should limit the focus on feedback from customers. They believe however,
that this is not the case as they claimed that quality staff provide an “over
concentration” on customers‟ feedbacks that consuming the Quality
Department‟s resources. This leads to the second point, which is that the
Quality Department, in some cases, mobilizes resources unsuitably. For
example, the QM1-A confirmed that they “do a customer satisfaction
survey on a yearly basis through a third party”. When asked why the
company uses a third party, he replied that “...because we don‟t want to be
bias… we need somebody independent to analyze and help us to
implement these feedbacks”. Some participants disagree with such a
perspective as it conflicts with the company‟s current strategy for dealing

200
with customers. The strategy implies that with government protection
supporting the company‟s products, there is no benefit from listening
carefully to customers. This is the perception of sales staff, which is quite
different to what staff in the Quality Department staff believe. These
perspectives may justify why there is a 3% over-resourcing, but the fact is
that compared to all other strategies, this strategy is the best in resource
allocation.
7.4 The Road Map for Company A
This section presents the major issues in Company A that have resulted
from the qualitative findings. There are three issues characterizing the
company‟s operating environment: cooperation, innovation, and human
resources. In this section, these issues are highlighted to show the extent
of their influence on quality strategies. Focusing on such issues will help
the company to facilitate optimum strategic allocation of resources.
7.4.1 Cooperation
Company A is affected by a „lack of cooperation‟ between departments as
some business units are not as committed as they should be to the overall
quality management system. This issue has a negative impact on decisions
made by the Quality Department as some departments do not pay the
required attention to the Quality Department‟s recommendations. The
Quality Department is also reporting to the CEO indirectly, which adds

201
complexity to the issue. For example, it is found that some employees still
believe that any quality issue is not part of their responsibilities. In
addition, it is found that even if somebody is selected for auditing
activities, they think these activities are a lower priority. That is way the
participants recommended that all departments should be involved in any
quality-related issue to add diversity. Without doubt, building a culture of
TQM is not limited to certain people; rather, it is everyone‟s responsibility
(Strolle, 1991).
Although the existence of „good‟ exchange of information among people
from different departments has been considered as evidence for the
successful implementation of QIM, issues such as missing invoices and
damaged products confirmed the existence of „lack of cooperation‟. Some
activities are carried out manually (paper work) and automatically
(intranet) at the same time for no specific reason, which proves the lack of
cooperation. Although job descriptions and job responsibilities do not
prohibit people from being involved in other activities, senior management
prefer to hire new experts rather than finding a solution from within other
departments‟ expertise. This, in turn, weakens the cooperation.
Cooperation plays a significant role in Company A. However, the
qualitative analysis showed some examples of a lack of cooperation. This
causes a shortage of organizational resources in some strategies, and leads
to the appearance of over-resourcing in some strategies too. Therefore, it is
considered that Company A is partially influenced by a „lack of
cooperation‟.

202
7.4.2 Innovation
All six participants strongly agreed that the company is driven by
innovation initiatives. The concept of innovation was launched recently as
a new belief in the company, and is found to have a great impact on ATT,
CQC, QIM, and TCF. For example, the consumption of water in the factory
is reduced by 25% by reviewing the related processes by technical people.
They ended up with an innovative idea that resulted in a reduction of the
water consumption and a saving of SAR 2,000,000 per year (1 AUD $ = 3.3
SAR [approximately]) for the company. It is also found that „innovation
initiatives‟ are going to be the main enforcer for simplifying the complicated
processes or reducing non-value added activities. Moreover, the company
wishes to keep the resources under control through the innovation
initiatives. However, it is also found from the analysis that these initiatives
have to be organized to provide realistic solutions that fit with company‟s
strategies, especially, the strategy of QIM. The IT Department succeeded in
arranging „brainstorming exercises‟ and received valuable feedbacks and
new ideas from their internal customers. What really proves the company‟s
attentiveness „toward innovation‟ is the relationship with customers. It is
found that „Traditional market research‟ cannot work alone as technical
people have to be involved creatively to provide more accurate
recommendations. The company started to sell „solutions‟ to their
industrial customers, rather than just selling the company‟s products to
them. Perdomo-Ortiz et al. (2006) confirmed the existence of the
connection between „quality‟ and „innovation‟ as both of them are 'sources
of competitive advantage”. Thus, within the context of SQM, regardless of
whether the „innovation initiatives‟ cause „over-resourcing‟ or „under-
resourcing‟ in company‟s strategies, these initiatives played a significant
role in Company A and it guided the future directions of the company.
203
7.4.3 Human Resources
People are the strategic key for this company. A lack of qualified people
represents one of the causes of the shortage of resources in the strategy of
MQS. In regard to CHF, it is also found that technical people need specific
training programs targeting corrective actions. It can also be said that, for
Company A, the qualitative findings support the quantitative results,
which show that the company‟s strategies are generally driven by soft TQM
rather than hard TQM. Although quality tools and related techniques and
technologies are important, especially for a strategy such as CHF, all
participants confirmed that the existence of skilled and qualified people is
more significant. It is also recommended by participants that for PQA,
people should be the focus. Although hard TQM played a significant role in
ATT, it is found that trained people facilitate the attainment of product
specifications. For ATT and CQC, training for technical employees is a
must if the company is going to implement Six Sigma. Additionally,
recruiting qualified people and providing the appropriate training for them
assists the company in maintaining its „Oracle‟ system. Capable people are
involved in designing and providing practical training programs for other
employees, which in turn supports the environment of „knowledge sharing‟
within the company. Put simply, although tools such as the „balanced
scorecard‟, fishbone diagrams, SMART objectives, and other IT
infrastructures are essential for „quality‟ to be strategically implemented,
the qualitative findings reveal that Company A‟s experts believe that
aspects of „human resources‟ are more critical for the company. Then
people can be effectively involved in activating all quality tools and
implementing all quality strategies.

204
7.5 Strategies that are Under-resourced - Company B
7.5.1 Control of Quality Costs (CQC)
Compared to other strategies, CQC is the most under-resourced, with a
shortage of 10.4% of what should be allocated for it. This does not indicate
ineffective use of resources. In regard to this strategy, the QM2-B
explained that, in the past, the perspective within the company was that
“producing high quality products” generates costs. However, this is no
longer the belief as the company has become aware of “quality”, and
decision makers are now convinced that “quality” saves. He added that,
fortunately, the company is now of about Quality Department as the
Quality Department has always stressed that the concept of “cost of
quality” should be understood firstly by senior management. In this
regard, he stated that “quality costs are controlled and we are very
conscious … we are working very efficiently on how to produce at
minimum cost without „compromising‟ on quality”. He added that if costs
need to be cut in any activity his first question to the decision maker is
always: “Are we going to lose „quality‟?”. He confirmed that, compared to
the past, decision makers have come to understand what the Quality
Department means by “cost of quality”.
However, according to HRM-B-M, even though he feels that senior
management is becoming aware of COQ, he still believes that cutting costs
can sometimes affect the ability to comply with “quality standards”. He
always judged that the logistic department could perform better if more
resources were allocated. That is why the QM1-B stressed that he cannot
claim that this strategy is fully implemented as long as he still notices, for

205
example, “delays in responses” to the results of auditing reports. He
remembered that, for example, the checkweigher of one machine was not
working and it took one month to be repaired. He stated that “this delay
generate a cost as it has an impact on „quality‟”. Thus QM3-B reported
that, for this strategy, although senior management are committed to
„quality‟, “commitment has to be stronger”. Even the QM2-B himself
affirmed that the “company should not compromise on quality … no
commitment without paying”. He explained that the impact of this strategy
is very strong as all quality strategies might be affected negatively due to
“cost issues”. He also emphasized that advanced technologies as well as
trained workers are a must for producing high quality products, and the
associated costs of these resources should be considered as “prevention
costs”. In addition, QM2-B and QM3-B mentioned that implementing
updated software and providing relevant training is important and needs
to be considered. The QM2-B also added that “prevention costs” should
also consider a “reward system” to motivate people, build awareness of
quality, and strengthen the loyalty of employees. He also recommended
visiting different symposia, seminars, organizations, and countries to see
examples of best practice for running COQ (benchmarking).
Although all quality managers confirmed that the company is strategically
headed in the right direction of controlling its quality costs, they agreed
that more resources should be allocated for this strategy. The QM2-B
stated that “although „quality‟ is a big concern for the company and we, in
general, are satisfied with our performance, the continuous improvement
of this strategy (CQC) required resources as TQM is a continuous
improvement process”. Specifically, the QM1-B clearly emphasized that
recruitment of the right technical people is, in some cases, one of the
issues. The QM3-B stated that “resources have to be 100% utilized and,

206
strategically, we are in the right direction but operationally, more work
should be focused on this strategy”.
7.5.2 Management of Quality System (MQS)
Similar to the strategy of CQC, MQS has a shortage of resources. The
percentage of the shortage is around 10%, which means that this strategy
mobilized 90% of resources that should be allocated to it. In fact, the QM2-
B confirmed that the company has always been driven by its well
implemented quality management system. The QM1-B stated that “ISO
certifications prove our success”. In addition, the SCM-B confirmed this
and stated that “the company uses its resources to the best of extent … all
procedures are documented”. The QM3-B reported that “compared to
others [competitors], we are satisfied”. The QM1-B illustrated that this
strategy is supported by the latest quality methods and techniques as well
as by the various HR programs and functional training.
Regarding the shortage of resources in this strategy (10.3%), the QM1-B
agreed that resources are not completely allocated for this strategy and
stated that “it is an issue of lack of support … lack of commitment”. He
stressed that a “consistent” commitment from executives is needed. The
QM2-B has also agreed with this point and added that the lack of
commitment leads to an increasing number of corrective actions. (Note
that quantitatively, the relevant strategy of CHF is the highest strategy in
term of consuming resources and is over-resourced by 16.8%). In fact, as
various TQM practices were failed because of a “lack of commitment”,
executives have to be individually motivated if the aim is to achieve a
successful TQM implementation (Goffin and Szwejczewski, 1996). The

207
QM2-B summarizes their needs in the MQS strategy in three points:
commitment, accountability, and follow up.
Regarding the commitment, the QM3-B also supported this opinion saying
that commitment is a must to make the quality system more efficient. In
regard to the point of “accountability”, the QM1-B said that:
We need support with accountability … We have a good
reputation but, internally, as I spent many years here
[Company B], I believe, and many employees are sharing
the same feeling, that the company should care more about
accountability.
Foss and Breanndan Moore (2003) confirmed that senior management,
without doubt, is responsible for assuring that the compulsory quality
“culture, facilities, resources, training, and oversight of reporting systems
are in place” to allow people to involve and be accountable for quality
activities. The QM2-B believes that accountability should be applied to all
employees, and especially top managers as “managers have more
responsibilities so more focused accountability should be logically
assigned”. For the “follow up”, the SCM-B emphasized that each business
unit has to make sure all activities are following ISO standards and added
that “manuals related to quality system must be 100% followed and they
are occasionally reviewed”. In the same way, the QM2-B added that
although the company is committed to employing educated people and has
always been aware of “ethics” in the workplace, “follow up processes are
important to be activated in this company” to guarantee complete and
successful implementation of the quality system.
208
Another issue that has been highlighted by participants relates to the
“recruitment process” as the SCM-B stressed that what is really required
for this strategy is “recruiting expertise”. This is due to the fact that the
Saudi government is pushing companies to employ nationals as a part of
its strategy (known as Sauadization or Nationalization) for reducing
unemployment. The QM2-B clarified saying “recruiting experts now is very
difficult because of „Sauadization‟”. The QM3-B considered this issue as
one of the most challenging for the company as the needed human
resources should not be limited to a certain nationality. Aanother issue
related to “qualified people” has been presented by the QM3-B, who
claimed that this is significant to increase the efficiency of monitoring and
controlling the quality system. He illustrated that for any new product
development process, the Quality Department deals with two business
units: the purchasing department and the raw material department.
However, he added that the Quality Department sometimes suffers from
“failed deliveries coming from the suppliers”. He stated that this is because
of the lack of qualified people in the purchasing department. He stated
that:
What we need is more skilled people in the purchasing
department to reduce the number of failed deliveries …
Even though we have a commitment towards a certain
supplier, some deliveries have variations, especially the
first delivery … I am talking here specifically about the first
delivery….so in that case; we cancel the agreement with
the supplier.
When asked “what if there is a lack of suppliers?” he replied by saying “we
have many options but the problem is that each time we need the same

209
type of monitoring”; which justifies the need for qualified people and also
justifies why CHF consumes extra resources (over-resourced by 16.8%).
7.5.3 Approach Towards Target (ATT)
Quantitatively, ATT has a shortage of 5.7%, which means it receives 94.3%
of what should be assigned for it. The QM3-B clarified that resources are
utilized properly saying: “I can say that I am satisfied ... the needed
resources are available and used in a scientific way to attain products
specifications”. The HRM-B confirmed this, saying “overall, we are in a very
good position”. The QM1-B stressed that this strategy is in the right
direction as he stated that “we are not just consuming resources … we are,
in reality, developing resources from existing resources”. He provided an
example that the machine devices were previously able to measure (read)
four decimal places while now they are able to measure up to six decimal
places. He explained saying that:
These two decimal places save huge quantity of raw
materials used in production … The saving last year was
SAR 16,000,000 and it is expected this year to save
around SAR 20,000,000 … So that is the reason of saying
that we developed resources from resources.
The QM2-B stressed that the existence of qualified people as well as the
implemented systems, processes and procedures represent the road map
by which the company reaches its destination. The QM1-B informed that
“many employees in the company are „qualified and talented‟ … some of

210
them have 25 to 30 years of industrial experiences … so the company
considers them as critical assets”. Moreover, the efforts of those technical
experts, according to the HRM-B, have recently been evaluated by the
company‟s Performance Management System (PMS). The HRM-B considers
those qualified people as enforcers for this strategy.
From this point of view, the QM1-B emphasized that the company has
always attempted to utilize manpower and machining capacity to the
maximum limit. The QM3-B agreed that human and organizational
resources helped in “achieving a set of specifications for the products”.
However, in an attempt to investigate how the shortage of resources (5.7%)
appeared in this strategy, the QM2-B was asked “Why can‟t you say that
this strategy utilizes 100% of its resources?”. He replied saying that:
Honestly, we have succeeded in implementing this
strategy but there are some minor things missing … These
things can contribute to this strategy ... People should
know their responsibilities … If they know their
responsibilities, the question is: are they committed to
these responsibilities? … If someone is responsible but not
committed or „vice versa‟, jobs would not be completed as
they should be … commitment between managerial levels
is also important to attain the pre-defined technical
specifications of the products.
He also emphasized that the focus of this strategy should be on “the
knowledge of how to do … training”. He stressed that the company should
strengthen the linkage between functional training and managerial

211
training as the company believes that the secret of the success is to align
“what to do (systems and procedures) with how to do it (HR training)”.
In fact, although the QM2-B highlighted what might be considered as
“missing” from this strategy, this doesn‟t imply that the strategy is heading
in the wrong direction. The QM1-B explained this, saying that “the best
thing is to maintain the current situation and to keep it as a base for
development … If we keep this momentum we will be one of the best food-
processing companies in the Middle East”. Nevertheless, he also affirmed
that continuous improvement reveals “refreshment of resources” through
adding new resources. When asked why resources need to be refreshed, he
replied that “why resources have to be refreshed?” stating that “the current
resources are important to be maintained to be a base for development,
but to make quality sustainable, the new resources have to be employed”
as a part of the continuous improvement process.
7.5.4 Transfer of Customers’ Feedback (TCF)
Quantitatively, TCF is the second best strategy in terms of utilizing
resources as it actually receives 96% of resources that should be allocated
for it and is therefore under-resourced by only 4.03%. Regarding how
efficient this strategy is in utilizing resources, the HRM-B stated “to the
maximum efficiency … as we respond effectively to both internal and
external customers”. Similarly, the QM2-B believes there is a “high level of
efficiency”. The SCM-B believes that “this strategy for this company is very
critical because it is a marketing-led company”. He feels that the company
has always assigned the required resources for this strategy and,

212
operationally, the related departments (such as quality, sales, and
marketing) are committed to analyzing and implementing customers‟
feedback. Specifically, he confirmed that both capable people and updated
techniques are professionally worked to carry out new shapes as well as
new designs for new products. He clarified that quality tools such as the
“fish-bone diagram” are used to attain customer requirements, which
change from time to time. He also reported that recently “the taste and the
labels of some of the new products have been changed as a response to the
feedback from our valuable customers”. All quality managers agree that
this strategy is implemented successfully as a result of the existence of
effective communication channels with customers. The QM1-B confirmed
that they are very strict in following their quality management system in
all issues related to customers. In addition, the QM3-B explained that the
availability of resources for this strategy facilitates their understanding as
well as their commitment to their customers.
In regard to the shortage of resources (4.03%) discussed in the previous
chapter, some justifications have been offered by the participants, who
affirmed that there is a lack of communication between sales, marketing
research, and the Quality Department, specifically in terms of
implementing customer suggestions. To be more specific, some
participants agreed that an “overlap in responsibilities” among these
departments causes such an issue. Note that an “overlap in
responsibilities” leads to consuming extra resources in the strategy of PQA,
as each of the three departments has its own ways of auditing with
customers. In contrast, this has a negative impact on implementing
customer feedback due to lack of cooperation between these departments.
The HRM-B supports this, saying that “we (as a company) have to build up
credibility through sharing the results of auditing”. In addition, although

213
both QM1-B and SCM-B emphasized that communication is very
important between theQuality Department and other departments that
deal directly with customers, the QM3-B stressed that the Quality
Department should have the main responsibility for developing new
products. He stated that:
There is an overlapping in responsibilities … overlap in
specializations … This, in some cases, leads to delay in
responding to customer suggestions … This is because of
lack of cooperation between some departments.
Therefore, a “delay in responding” is one of the issues that results from an
„overlap in responsibilities‟. Hence, “overlapping of responsibilities” among
senior managers as a result of a “lack of vision and planning” is seen by
Soltani et al. (2005) as one of the aspects that is considered as a barrier
and vital challenge to TQM in various companies.
Although the QM2-B stated that they are “very serious regarding
complaints and try to convey this to customers” through their customer
complaint system, he affirmed that they “have to better understand the
customer to expect what is in their mind … doing more preventive actions
rather than corrective actions”. The QM1-B confirmed saying that “we
should not wait till the complaint came … we should act instantly”.
It should be noted that this strategy has only a small shortage and all
participants generally agreed that customers are satisfied. To support this,
the QM1-B summarized the situation of this strategy saying that:

214
On average, we have 20 complaints per year … our market
share is 60-70% ... so relatively speaking the amount of the
complaints is not critical at all … but we have what I call
an internal complaint … for example, if I see our products
are not positioned appropriately on the shelf, I judge with
staff in the marketing and sales department.
Although complaints are few and far between, the Quality Department
believes that it is important to receive no complaints from external
customers as staff have to be alert and detect the problem or defect before
the external customers.
7.5.5 Quality Information Management (QIM)
Company B, QIM is the best strategy in the utilization of resources. In fact,
ITM-B reported that well implemented “procedures and process” and
“information security” support control of the quality of the information
system environment in the company. He added that, for example, “our
ERP (Enterprise Resource Planning) is centralized and fully controlled at
one point to facilitate secure and accurate delivery of the information”.
Additionally, he confirmed that the “IT” side of the “ISO” is reviewed and all
aspects of IT are successfully controlled. He added that the IT department
is also aware of maintenance and backup activities. He also clarified that
the internal relationships among different managerial levels reinforce the
capability of the IT department to understand their internal customers
(employees). Specifically, he stated that:

215
To be honest, if there is no support, definitely we can‟t
achieve anything … there is a harmonious relationship
between employees and their managers and as a service
provider, yes, I feel they understand each other very well;
which is one reason of why our IT services are accurate
and target specific requirements for our internal customers.
In the same way, the SCM-B expressed his satisfaction with the IT services
saying that “in general, IT services are very strong … whatever we need we
can get it … all employees have become good users and familiar with,
Internet and emails”. He added that, rather than providing such
technologies, the IT department has always been adapting these
technologies to fit with the strategic business units‟ requirements.
The success of this strategy is also considered to be the result of the
effective communication environment in the company. To illustrate, the
SCM-B stated that “each single piece of information” related to the
company‟s functions or its future strategies is known and accessible. He
added that the monthly performance reports and the CEO reports have
continuously been discussed in all departments. This sort of environment,
according to the SCM-B‟s opinion, supports the accuracy of the shared
information in the company. Moreover, he added that “recently, the
company organized a monthly conference to share “information” among all
business units about their achievements, objectives, and obstacles”.
According to the QM2-B, the information sharing at these seminars
guarantees accurate feeding for the company‟s database system. He also
believes that these seminars support the company‟s technical environment
as he stated that “at least, once a month, each manager presents what
new technologies they have to share with all departments”.

216
Without doubt, the success of this strategy is a reflection of its efficiency in
resource utilization. Further evidences can be obtained from the QM1-B
who emphasized that, the company does not “spend more than the needed
resource” for this strategy. He also stated that “we have to keep this type of
management to keep our information system useful and powerful”. He
added that this strategy is very efficient because all resources are
mobilized appropriately. He clarified that the resources for this strategies
include experts, clarity of procedures, and adopting any new technologies
or software such as Reporter (software used to generate reports using
company‟s database).
However, although the QM1-B agreed that the company is strictly following
policies and procedures strictly, he stressed that “full implementation of
information technology system needs full commitment”. He illustrated
saying that
We have resources and we properly use them … all
required technologies are implemented … but if something
has to be improved, it might be better for the company to
focus on monitoring, planning and controlling our existing
information system.
Note that he said “if something has to be improved”; which indicates that
he is, in general, satisfied. Indeed, although the QM2-B informed that they
need specific (qualified) people for specific job positions, he affirmed that “I
confidently can say this strategy is quite efficient in using resources
compared to other strategies”. He added that the company, in general,
succeeded in “seeking minimum cost with maximum benefit”. QM2-B‟s

217
statements clearly prove that this strategy is the best in term of resource
utilization, as also shown in the quantitative results. Although there is no
clear evidence to justify the “very small” shortage in resources in this
strategy (0.63%), the ITM-B provides justification regarding how efficient
this strategy is by saying that:
I can‟t say it is 100% efficient as quality is not static; it is a
continuous improvement process … In that sense, it can be
said that what is missing or what we should seek is
employing more resources in proactive management … for
example, improving time of delivering reports or providing
sustainable technical training.
Indeed, the quality is a “continuous improvement process”, which is why
the company recently updated its “Oracle” system. The QM1-B stated that
“we are a member of OPM (Oracle Processing Management System) and
have just updated our system to integrate all business units in the
company … we are in progress”.
7.6 Strategies that are Overloaded by Resources in Company (B)
7.6.1 Checking of Failures (CHF)
This strategy is one of the over-resourced strategies and, according to the
previous chapter mobilizes 16.8% more than what should be allocated for
it. So regardless of how efficient this strategy is in terms of utilizing the
218
resources, the amount of allocated resources implies that there are enough
resources for the strategy to be successfully implemented. The QM1-B
stated that “In regard to this strategy, Quality Department is very strict to
be committed to our quality system”. He added that the secret behind that
is that they have three gateways to ensure the quality of their products is
up to the desired standards. The QM2-B confirmed that the existence of
the inspection gates supports the successful implementation of this
strategy, stating that “we are in a position that I can guarantee that we are
capable to detect any failures”. On top of that, the QM1-B and the QM3-B
stressed that intellectual people are the heart of this strategy even though
technological resources have a significant role. The QM1-B reported that
tools such as Six Sigma drive the implementation of this strategy.
However, “capability” does not reflect the “utilization” appropriately and
this point may justify why this strategy is over-resourced by 16.8%. That is
why the QM3-B stated that “from my perspective, resources are not
„excellently‟ utilized…they are utilized efficiently but better utilization can
be considered”. When asked why resources could be better utilized, he
stated regardless of the great capability compared with competitors,
failures do still exist even though they are rarely detected by customers.
He stated that “we are capable in monitoring and checking but still we can
be better”. To understand this issue, it is suitable to link this with the
significant point that has always been reported by the QM1-B, which is
that managers have to be consistent in their decisions. In this regard, the
QM2-B illustrated that the focus should be on enhancing the coordination
between different managerial levels to avoid conflicting decisions. He
explained that “conflicting decisions” lead to actions that consume
resources and add little value. Over-resourcing in this strategy can be
clearly understood from the last quotation. In this regard, the QM3-B said

219
that coordination is important to sustain the checking system. Without
doubt, TQM‟s fundamentals are driven by the assumption that all business
units are totally integrated in their efforts of management (Gronstedt,
1996).
For instance, another point has was by the QM2-B when he recommended
that training for the national employees should be offered using Arabic,
which is ths official language in Saudi Arabia. He emphasized that this is
important to obtain the benefits of such trainings otherwise it is a “waste
of time”. Of course, “waste of time” is a non added-value activity (i.e.
resources in the wrong place). He added that “Japanese are pioneers in
quality management and they use their national languages officially in
their companies”.
The QM3-B discussed an interesting point saying that:
Although we have a lot of certificates related to quality and
safety, these certificates needed to be reviewed from time
to time through our monitoring system … I believe,
sometimes, these follow up actions, including auditing,
consume resources though repeating the same work …
especially when errors are repeated occasionally …
mistakes should be analyzed to guarantee efficient use of
our resources in next checking.
He also clearly affirmed the over-resourcing in this strategy saying that the
“availability of resources is not an issue rather than we have to maintain
our resources through organizing them”. Overall, all interviews confirmed
either directly or indirectly, that this strategy is over-resourced.

220
7.6.2 Periodical Quality Audit (PQA)
Quantitatively, PQA is the second most over-resourced strategy in
Company B. Reasonable justifications for the “overloading” have been
obtained from participants. This might be due to, according to the QM2-B,
the fact that auditing activities consume resources to match between the
factory‟s capabilities and customers‟ requirements. The QM3-B believes
that as the company is committed to sustaining its quality standards,
auditing as a strategy plays a key role in understanding customers‟
specifications in products. The QM1-B reported that “our success in
getting different certifications related to quality and safety proves that we
are able to conduct any kind of auditing as we are strictly following our
well implemented quality management system”. The QM3-B confirmed that
the company has “expertise and talented people” who work in parallel with
the required technologies to run this strategy successfully. Indeed, QM1-B
emphasized that only certified people only who are permitted to do the
auditing work as a result of our cooperation with the Human Resources
Department in this regard.
Deeper understanding, of auditing production lines has been obtained
from the SCM-B, who illustrated that “we have what we call mass
production and to track each single unit of product is not easy … That is
why auditing consumes resources such as … people machines, tools, and
techniques”. The SCM-B justified that the company has recently
implemented latest technologies to work in parallel with auditors, to
reduce the time required to release each patch that has to be investigated.
Moreover, he reported that, in regard to auditing works, “although we are
satisfied, we are working on taking a step forward to have what we call
„class A technologies‟ this year”.

221
However, another significant point illustrated by all participants is the
overlapping in auditing responsibilities between different departments.
This point has also been discussed in the strategy of TCF. The QM3-B
stated that although the Quality Department has always been professional
in preparing and analyzing customers‟ surveys for auditing, there is still
room for strengthening the utilization of resources. To be specific, he
stated that:
The reason in my opinion, is that there is a sort of sharing
between different departments (Quality, Sales, and
Marketing) who perform sometimes similar assignments
and they contact customers directly as we in Quality
Department do … but occasionally they do not cooperate
and share their findings with us.
Although Gronstedt (1996) reported that the focus of TQM is on the
internal cooperation between departments, Lakhe and Mohanty (1994)
confirmed that practicing TQM is not a straightforward application
because one of the obstacles is to clarify the responsibilities to avoid
“overlapping” in activities. The QM2-B agreed that these departments also,
whether they use similar or different software to analyze their auditing job,
are not connected properly to a shared database or network. The HRM-B
has also confirmed this sort of sharing in responsibility. The QM1-B
stressed that recommendation reports that result from auditing should not
be ignored and that the company has to respond faster to such reports.
[Note that „fast response‟ is related to the strategy of TCF; which is under-
resourced by (4.03%).] He justified that this is important to avoid detecting
the same errors in the next auditing exercise, as this consumes resources
for non added values activities. That is why, according to the QM1-B, a lot

222
of meetings have been conducted with auditors to discuss the repeated
mistakes (which is caused by a “over-resourcing” in this strategy) and also
to discuss the delaying in responses (which indicates “shortage of
resources” in the strategy of TCF). He stated that “our system for auditing
has to be customized”. Similarly, the QM2-B confirmed this issue saying
that “we have to respond immediately to the auditing report findings”. The
QM1-B summarized by saying it is all about “consistency of commitment”
from senior management. That is, as long as the company is aware of
auditing results, the company will facilitate its assignment in the next
audit and therefore consume less resources.
7.6.3 Use of Human Knowledge
The QM3-B said that staff generally provide their maximum effort to share
their knowledge as the company “gives value to the knowledge of the
people”. He confirmed that all contribute successfully to this strategy and
thus have a positive impact on “improving the quality system”. The
company believes that all implemented systems, policies, and strategies
are run through people knowledge. Additionally, he affirmed that this
strategy attained a “great utilization of resources”. Indeed, this reflects the
results from the quantitative analysis that this strategy is over-resourced
by 7.9%. To illustrate, the HRM-B stressed that for this strategy, “the
Company is very keen on using state of the art technology”. He added that
they are now updating their human resources management system
(HRMS) to facilitate the dealing with their databases and generate fresh
enquiries, reports, statistical figures, and self services. He reported that all
these aspects are “feeding the human knowledge”.

223
However, the SCM-B believes that resources can be managed in a more
efficient way to serve this strategy. For example, he explained that
although the HR department provides “special training for special
purposes” to build staff capabilities, there is a need to ensure that
“trainees are ready and suitable for that training”. He stressed that
utilization of resources has to be improved in a sense of evaluating who
should attend the training programs so not to waste the company‟s
resources. He stated that “this area needs to be improved … they
announce for training and people like it … but before that I want to know
whether this person (trainee) is capable or not”. Similarly, although the
QM2-B stated that “we have a practical demonstration … we develop
education by providing a practical demonstration for workers or new
employees who run the factory”, he emphasized that “some training
sessions should be specified for certain people”. The HRM-B confirmed
that saying “we had training but it was not implemented with the best
practice … it was just an extra responsibility added to the HR director”.
His statement clearly demonstrates inappropriate utilization of resources
(i.e. the 7.9% over-resourced).
It is a fact that the company is concerned about offering a suitable
knowledge-based environment for its employees through the “existence of a
number of libraries” (the HRM-B stated) or through subscribing in different
famous business/scientific magazines (the QM2-B stated). However, these
aspects may indicate an inefficiency in utilizing the available resources due
to a lack of “consistency in commitment”. The QM1-B reported that:
We still need to customize our usage of resources because
there is no consistency in commitment on how to

224
continually gain the benefits of these aspects … We need
steady approaches to keep things sustainable.
It can be understood, as the QM1-B always mentioned, that the lack of
“consistency in commitment” resulted in over-resourcing for this strategy
as the available resources have not been appropriately utilized to gain their
full benefits. For example, although the QM2-B believes that senior
management is capable of providing the required support, he stressed that
“one of the key things is commitment … what we say is what we have to
do” and explained that “lack of commitment”, sometimes, causes the
company to buy or implement something that it does not need. In addition,
the QM1-B gave an example of employing over-qualified people who are not
needed immediately saying that “bringing experts means spending money
… if the company (top management) is not ready for the reason of bringing
those people over, the company will not get any benefit from them”. His
use of “the company is not ready”, could indicate that senior management
is not committed to its strategic need. This example further explains how
a strategy may consume resources inappropriately due to a “lack of
consistency in commitments”. Although it is common that the role of the
CEO and senior management is vital to successful implementation of TQM,
“lack of commitment” from them could justify why TQM sometimes fails
(Soltani et al., 2005). Soltani et al. concluded that one of the issue is that
the CEO and senior management are “avoiding taking risk in the interest
of keeping the status quo”.
To obtain a deeper understanding, the QM2-B agreed that knowledge can
be shared in the company through different communication channels such
as the intranet, seminars, and visiting symposiums. Strategically, however,
as HRM-B explained, these channels are just part of the issue.

225
Specifically, he believes that these communication channels will not add
value as long as the linkage between the company‟s strategic objectives
and these channels is not clear. What he meant is that the strategic
objectives should drive the company towards how these channels are going
to be used; otherwise, they are a waste (i.e. over-resourced).
The QM1-B always stressed that “if we want to keep things going at the
same level of performance, we have to be consistent in our commitment to
keep our directions positive”. When asked abouts the consequences of not
having consistent commitment, he replied: “slow system, breaking down,
direct impact on cost of production, direct impact on sales, and the most
important thing is the opportunity cost … because you have skilled people
but you don‟t have the approach of consistent commitment”. The last
sentence supports the quantitative result (over-resourcing= 7.9%).
7.7 The Road Map for Company B
This section summarizes the qualitative findings by presenting the main
characteristics of Company B. Specifically, it is found that commitment,
overlap in responsibilities, and balancing soft and hard “quality” have a
significant effect on Company B‟s quality strategies. This section
discusses these issues in order to provide a “road map” for Company B to
allocate its resources in a more efficient manner.

226
7.7.1 Commitment
Participants frequently cited that the issue of “commitment” from senior
management is one of the critical issues in Company B. It can be said that
the lack of consistency in commitment played a major role in many
strategies that resulted in under-resourcing, or even over-resourcing. To
illustrate, according to the qualitative findings, the “inconsistency in
commitment” is one of the main causes of the issue of a “delay in
response”. It is found that the issue of “delay in response” affects company
B‟s performance towards perfection in “quality”. For example, for a strategy
of CHF, increasing the corrective actions compared to the prevention
activities requires a lot of resources to correct the resulted errors.
Similarly, this issue led to “inconsistent” decisions made in different
managerial levels. It is found that conflicting in decisions resulted in
consuming resources for non-value added activities.
For example, senior management still ignore the request to improve the
training programs using national languages, which is one of the
recommendations made by the QM2-B. The inconsistency of commitment
weakens the follow up actions, including the auditing processes, which in
turn weakens the accountability, and leads to resource consumption as
errors have to be detected and fixed. As a result, these issues support the
appearance of over-resourcing in CHF and PQA. As these issues are
aspects of “delay in response”, the strategy of TCF has also been affected
as it has a shortage of resources. It is confirmed that the company has to
respond faster to the auditing reports in a “consistent” manner as part of
the company‟s commitment to its internal and external customers. The
under-resourcing in CQC is also considered a result of inconsistent
commitment because the company has to attain high quality products

227
through strengthening its commitment to “prevention costs”. For a strategy
of UHK (over-resourced), it is found that the company has to be consistent
in its commitment to “customizing” the usage of resources as some
specialized practical training programs are still provided to any person,
rather than specific, relevant people. Full benefits of the available
resources cannot be obtained unless senior management becomes
consistently committed. Otherwise the company will suffer from a lack of
resources (shortage) or having inactivated resources (overloading).
Nevertheless, the issue of “inconsistency in commitment” does not mean
that the company is not committed to “quality”. Rather, the attempt here is
to show the critical nature of the issue of “commitment” regardless of the
extent to which senior management is committed. In other words,
“commitment” is also considered critical due to the positive impact of the
senior management commitment in some aspects. It is found that
“consistency in commitment” protects the positive direction of the
performance of the company and helps to attain “sustainability” in the
company‟s quality practices. The significant role of “consistency of
commitment” appeared clearly in QIM, which is the strategy that utilizes
resources most optimally in Company B. One of the secrets behind the
successful implementation of QIM is that senior management is noticeably
more committed to this strategy compared with other strategies.
7.7.2 Overlap in Responsibilities
The second reason for the “delay in responses” is “overlap in
responsibilities”. Specifically, the “over-resourcing” in CHF and PQA and
228
the “under-resourcing” in TCF can be seen as consequences of the
“overlapping in responsibilities” among different departments. The quality,
Sales, and Marketing Departments analyze the findings of their own
auditing activities without sharing their recommendations with each other.
This, of course, led to “delay in responses” as each department is supposed
to discus and shares the recommendations with other departments, which
consumes time and efforts. That is why quality experts in Company B
stressed that many auditing activities should be linked to the Quality
Department to avoid “delay in responses” and to best utilize the company‟s
efforts. Moreover, it is found that the issue of “overlapping in
responsibilities” weakens the coordination between different managerial
levels, which has a negative impact on ATT. Without doubt, this issue is
critical for Company B as different strategies are involved.
7.7.3 Balancing Human, Organizational, and Technological Resources
Although none of the participants directly stated that all types of resources
are sharing the same importance, the three types of resources do
contribute collectively in all strategies. This supports the quantitative
findings for Company B. Although intellectual assets (people) represent the
heart of CHF, tools such as Six Sigma are implemented to run the strategy
successfully. For PQA, the process of investigating each patch needs
qualified auditors with the support of the latest technologies. Recruiting
technical people and training them to use updated software are critical
issues related to “prevention costs”. In CQC, aspects related to rewarding
(soft TQM), recruitment (soft TQM) and benchmarking (hard TQM) are
significant. In addition, latest quality methods as well as HR training
programs are core in UHK and MQS. For TCF, the process of creating new
shapes and designs for the new products using the latest technologies (i.e.

229
TR) is fed by effective communication channels with customers (i.e. OR).
Moreover, although QIM seems to be technology-driven, the harmony
relationships (i.e. OR) between all managerial levels support the success of
the IT services. Moreover, qualified people are needed for this strategy. For
ATT, maximizing machine capabilities and manpower are essential. On top
of that, all these aspects of blending HR and TR are involved in all
strategies under the umbrella of the company‟s systems and procedures as
necessity of the continues improvement processes (i.e, OR). Noticeably,
Company B is balancing the use of the three types of resources.
7.8 Summary
This chapter attempted to explain and present full details of WHY each
single strategy mobilized resources more or less than what should be
allocated for it (i.e. RQ6). In the other word, this qualitative phase validates
the quantitative findings of the previous phase. A full qualitative
discussion for Company A and Company B is presented. The discussion
explains reasons and presents reasonable justifications from the
participants. Regardless of all the obtained details, a general perception for
each company can be carried out from this qualitative analysis. It can be
concluded that, in general, Company A is mainly driven by human and
organizational resources rather than technological resources. For instance,
aspects such as „cooperation‟ and „innovation‟ were found as vital drivers
in company A. In contrast, in Company B, HR, OR, and TR were sharing
the same level of significance; which in turn clearly validates the
quantitative findings of the ANP step. Two critical issues can be obtained
from the qualitative analysis of Company B: „commitment‟ and „overlap in
responsibilities‟. A Focus on resolving such issues could lead to better
utilization of resources.

261
References
Abdullah, M., Uli, J., and Tari, J. (2008). "The influence of soft factors on
quality improvement and performance: Perceptions from managers". The
TQM Journal, 20(5), 436-452.
Ahire, S. L., Golhar, D. Y., and Waller, M. A. (1996). "Development and
validation of TQM implementation constructs". Decision Sciences, 27(1),
23-56.
Ahire, S. L., and O’shaughnessy, K. C. (1998). "The role of top management
commitment in quality management: an empirical analysis of the auto
parts industry". International Journal of Quality Science, 3(1), 5-37.
Ahmad, S., and Schroeder, R. G. (2002). "The importance of recruitment and
selection process for sustainability of total quality management".
International Journal of Quality and Reliability Management, 19(5), 540-
550.
Akdere, M. (2006). "Quality management through human resources: An
integrated approach to performance improvement". The Business Review,
Cambridge, 5(2), 233-238.
Al-Harkan, I. M. (2007). Development of a Methodology to Assess the
Implementation of TQM in Selected Saudi Industries. The 37th
International Conference on Computers and Industrial Engineering
Alexandria, Egypt.
Alsaleh, N. A. (2007). "Application of quality tools by the Saudi food industry".
The TQM Magazine, 19(2), 150-161.
Amit, R., and Schoemaker, P. J. H. (1993). "Strategic assets and organizational
rent". Strategic management journal, 14(1), 33-46.
Anderson, D. R., Sweeney, D. J., Williams, T. A., Martin, R. K., Ragsdale, C.,
Albright, S. C., Winston, W. L., Baker, K., Winston, W., and Savage, S. L.

262
(2003). An Introduction to Management Science: a quantitative approach to
decision making.
Anderson, J. C., Rungtusanatham, M., Schroeder, R. G., and Devaraj, S.
(1995). "A Path Analytic Model of a Theory of Quality Management
Underlying the Deming Management Method: Preliminary Empirical
Findings*". Decision Sciences, 26(5), 637-658.
Anderson, M. Q., and Lievano, R. J. (1986). Quantitative management: an
introduction, Kent Pub Co.
Andrews, K. R. (1980). The concept of corporate strategy, Homewood, Irwin.
Antony, J., Leung, K., Knowles, G., and Gosh, S. (2002). "Critical success
factors of TQM implementation in Hong Kong industries". International
Journal of Quality and Reliability Management, 19(5), 551-566.
Aouni, B., and Kettani, O. (2001). "Goal programming model: A glorious history
and a promising future". European Journal of Operational Research,
133(2), 225-231.
Aravindan, P., Devadasan, S. R., and Selladurai, V. (1996). "A focused system
model for strategic quality management". International Journal of Quality
and Reliability Management, 13(8), 79.
Armacost, R. L., Componation, P. J., Mullens, M. A., and Swart, W. W. (1994).
"An AHP framework for prioritizing customer requirements in QFD: an
industrialized housing application". IIE transactions, 26(4), 72-79.
Armstrong, M. (2006). A handbook of human resource management practice,
Kogan Page Ltd.
Ayomoh, M. K. O., and Oke, S. A. (2006). "A framework for measuring safety
level for production environments". Safety Science, 44(3), 221-239.
Badri, M. A., Davis, D., and Davis, D. (1995). "A study of measuring the critical
factors of quality management". International Journal of Quality and
Reliability Management, 12(2), 36-53.
263
Baidoun, S. (2004). "The implementation of TQM philosophy in Palestinian
organization: a proposed non-prescriptive generic framework". The TQM
Magazine, 16(3), 174 - 185.
Barney, J. (1991). "Firm Resources and Sustained Competitive Advantage".
JOURNAL OF MANAGEMENT, 17(1).
Barney, J. B. (1986). "Strategic factor markets: expectations, luck, and
business strategy". Management science, 1231-1241.
Barney, J. B. (1995). "Looking inside for competitive advantage". The Academy
of Management Executive (1993-2005), 49-61.
Beecroft, G. D. (1999). "The role of quality in strategic management".
Management Decision, 37(6), 499-502.
Benbasat, I., Goldstein, D. K., and Mead, M. (1987). "The case research
strategy in studies of information systems". MIS quarterly, 369-386.
Benton, W. C. (1991). "Statistical process control and the Taguchi method: a
comparative evaluation". International Journal of Production Research,
29(9), 1761-1770.
Bertolini, M., and Bevilacqua, M. (2006). "A combined goal programming—AHP
approach to maintenance selection problem". Reliability Engineering and
System Safety, 91(7), 839-848.
Black, S. A., and Porter, L. J. (1996). "Identification of the critical factors of
TQM". Decision Sciences, 27, 1-22.
Blake, J. T., and Carter, M. W. (2002). "A goal programming approach to
strategic resource allocation in acute care hospitals". European Journal of
Operational Research, 140(3), 541-561.
Bou, J. C., and Beltrán, I. (2005). "Total quality management, high-
commitment human resource strategy and firm performance: an
empirical study". Total Quality Management & Business Excellence, 16(1),
71-86.
Bowen, D. E., and Lawler, E. E. (1992). "Total quality-oriented human
resources management". Organizational Dynamics, 20(4), 29-41.

264
Bryman, A., and Bell, E. (2007). Business research methods, Oxford University
Press, USA.
BSI (1992). Total Quality Management Part 1: Guide to Management Principles,
BS 7850, Part 1. Milton Keynes.
Burgelman, R. A., Christensen, C. M., and Wheelwright, S. C. (2008). Strategic
management of technology and innovation, McGraw-Hill/Irwin.
Buyukyazici, M., and Sucu, M. (2003). "The Analytical Hierarchy and Analytical
Network Processes". Hacettepe Journal of Mathematics and Statistics, 32,
65-73.
Calingo, L. M. R. (1996). "The evolution of strategic quality management".
International Journal of Quality & Reliability Management 13 (9), 19 - 37
Calvo-Mora, A., Leal, A., and Roldán, J. L. (2005). "Relationships between the
EFQM model criteria: a study in Spanish universities". Total quality
management & business excellence, 16(6), 741-770.
Cavana, R., Delahaye, B. L., and Sekeran, U. (2001). "Applied business
research: Qualitative and quantitative methods".
Chandler, A. D. (1995). Strategy and structure: Chapters in the history of the
industrial enterprise, MIT press.
Chang, S. C., Lin, N. P., Yang, C. L., and Sheu, C. (2003). "Quality dimensions,
capabilities and business strategy: an empirical study in high-tech
industry". Total Quality Management & Business Excellence, 14(4), 407-
421.
Chen, L. H., and Weng, M. C. (2006). "An evaluation approach to engineering
design in QFD processes using fuzzy goal programming models".
European Journal of Operational Research, 172(1), 230-248.
Cheng, E. W. L., and Li, H. (2001a). "Analytic hierarchy process: an approach
to determine measures for business performance". Measuring Business
Excellence, 5(3), 30-36.

265
Cheng, E. W. L., and Li, H. (2001b). "Information priority-setting for better
resource allocation using analytic hierarchy process (AHP)". Information
Management and Computer Security, 9(2/3), 61-70.
Cheng, E. and Li, H. (2002). "Construction partnering process and associated
critical success factors: quantitative investigation". Journal of
management in engineering, 18, 194.
Cheng, E. W. L., and Li, H. (2004). "Contractor selection using the analytic
network process". Construction Management and Economics, 22(10),
1021-1032.
Cheng, E. W. L., and Li, H. (2007). "Application of ANP in process models: An
example of strategic partnering". Building and Environment, 42(1), 278-
287.
Cheng, E. W. L., Li, H., and Yu, L. (2005). "The analytic network process (ANP)
approach to location selection: a shopping mall illustration". Construction
Innovation, 5(2), 83-98.
Cherif, M. S., Chabchoub, H., and Aouni, B. (2008). "Quality control system
design through the goal programming model and the satisfaction
functions". European Journal of Operational Research, 186(3), 1084-
1098.
Coates, T. T., and Mcdermott, C. M. (2002). "An exploratory analysis of new
competencies: a resource based view perspective". Journal of Operations
Management, 20(5), 435-450.
Collis, D. J., and Montgomery, C. A. (2004). Corporate Strategy: A Resource
based Approach, McGraw-Hill/Irwin.
Cooke, W. P. (1985). Quantitative methods for management decisions, McGraw-
Hill.
Corbetta, P., and Patrick, B. (2003). Social research: theory, methods and
techniques, Sage Publications Ltd.
Coulter, K., and Sarkis, J. (2005). "Development of a media selection model
using the analytic network process". ADVERTISING, 24(2), 193-215.
266
Creative Decision Foundation (2003). Super Decision Software [online
software], http://www.superdecisions.com/, 17/08/08.
Cresswell, J. W. (2007). Qualitative Inquiry & Research Design: Choosing
Among Five Approaches. Thousand Oajs, London, New Delhi, Sage
Publication Inc.
Creswell, J. W. (1999). Mixed-method research: Introduction and application.
IN Cizek, G. J. (Ed.) Handbook of educational policy. San Diego, CA:
Academic Press.
Creswell, J. W. (2003). Research design: Qualitative, Quantitative, and Mixed
Methods Approaches, Thousand Oaks, London, New Delhi, Sage.
Creswell, J. W. (2008). Educational research: Planning, conducting, and
evaluating quantitative and qualitative research, New Jersey,
Pearson/Merrill Prentice Hall.
Creswell, J. W., and Clark, V. L. P. (2007). Designing and Conducting Mixed
Methods Research, Thousand Oajs, London, New Delhi, Sage.
Creswell, J. W., Fetters, M. D., and Ivankova, N. V. (2004). "Designing a mixed
methods study in primary care". Annals of Family Medicine, 2(1), 7-12.
Creswell, J. W., Plano Clark, V. L., Gutmann, M. L., and Hanson, W. E. (2003).
Advanced mixed methods research designs. IN Tashakkori, A.andTeddlie,
C. (Eds.) Handbook of mixed methods in social and behavioral research.
Crosby, P. B. (1979). Quality is free: The art of making quality certain, New
American Library New York.
Crotty, M. (1998). The foundations of social research: Meaning and perspective
in the research process, London, Sage.
Curry, A., and Kadasah, N. (2002). "Focusing on key elements of TQM–
evaluation for sustainability". The TQM Magazine, 14(4), 207-16.
Daft, R. L. (2003). Management (6th). Australia: Thomsan.
Deming, W. E. (2000). Out of the Crisis, The MIT press.
Denscombe, M. (2007). The good research guide: for small-scale social research
projects, Open Univ Pr.

267
Dewhurst, F. W., Martinez-Lorente, A. R., and Sanchez-Rodriguez, C. (2003).
"An initial assessment of the influence of IT on TQM: a multiple case
study". International Journal of Operations and Production Management,
23(3/4), 348-374.
Dierickx, I., and Cool, K. (1989). "Asset stock accumulation and sustainability
of competitive advantage". Management science, 1504-1511.
Diminnie, C. B., and Kwak, N. K. (1986). "A hierarchical goal-programming
approach to reverse resource allocation in institutions of higher
learning". The Journal of the Operational Research Society, 37(1), 59-66.
Doggett, A. M. (2006). "Root cause analysis: A framework for tool selection".
QUALITY CONTROL AND APPLIED STATISTICS, 51(3), 279.
Douglas, T. J., and Judge Jr, W. Q. (2001). "Total quality management
implementation and competitive advantage: the role of structural control
and exploration". The Academy of Management Journal, 44(1), 158-169.
Dow, D., Samson, D., and Ford, S. (1999). "Exploding the myth: do all quality
management practices contribute to superior quality performance?"
Production and Operations Management, 8(1), 1-27.
Edmondson, A. C., and Mcmanus, S. E. (2007). "Methodological fit in
organizational field research". Academy of Management Review, 32(4),
1155-1179.
Eisenhardt, K. M. (1989). "Building theories from case study research".
Academy of management review, 532-550.
Eisenhardt, K. M. (1991). "Better stories and better constructs: The case for
rigor and comparative logic". Academy of Management Review, 620-627.
Eisenhardt, K. M., and Graebner, M. E. (2007). "Theory building from cases:
Opportunities and challenges". Academy of Management Journal, 50(1),
25-50.
Elghamrawy, T., and Shibayama, T. (2008). "Total Quality Management
Implementation in the Egyptian Construction Industry". Journal of
Management in Engineering, 24, 156.

268
Erdogmus, S., Aras, H. and Ko , E. (2006). "Evaluation of alternative fuels for
residential heating in Turkey using analytic network process (ANP) with
group decision-making". Renewable and Sustainable Energy Reviews, 10,
269-279.
Erdogmus, S., Kapanoglu, M. and Ko , E. (2005). "Evaluating high-tech
alternatives by using analytic network process with BOCR and
multiactors". Evaluation and Program Planning, 28, 391-399.
Ettlie, J. E. (1997). "Quality, technology, and global manufacturing". Production
and Operations Management, 6(2), 150-166.
Fahy, J., and Limerick, I. (2003). "The resource-based view of the firm: some
stumbling-blocks on the road to understanding sustainable competitive
advantage". Training, 4(2000), 94-104.
Fearne, A., and Lavelle, D. (1996). "Perceptions of food ―quality‖ and the power
of marketing communication: results of consumer research on a
branded-egg concept". Journal of Product & Brand Management, 5(2), 29-
42.
Feigenbaum, A. V. (1991). "Total quality control".
Finney, R. Z., Campbell, N. D., and Powell, C. M. (2005). "Strategies and
resources: Pathways to success?" Journal of Business Research, 58(12),
1721-1729.
Flick, U. (1992). "Triangulation revisited: Strategy of validation or alternative".
Journal for the theory of social behaviour, 22(2), 175-197.
Flick, U. (2009). An introduction to qualitative research, Sage Pubns Ltd.
Flynn, B. B. (1994). "The relationship between quality management practices,
infrastructure and fast product innovation". Benchmarking for Quality
Management & Technology, 1(1), 48-64.
Forman, E., and Peniwati, K. (1998). "Aggregating individual judgments and
priorities with the analytic hierarchy process". European Journal of
Operational Research, 108(1), 165-169.

269
Foss, M. L., and Breanndan Moore, S. (2003). "Evolution of quality
management: integration of quality assurance functions into operations,
or "quality is everyone's responsibility"". Transfusion, 43(9), 1330-1336.
Fotopoulos, C. B., and Psomas, E. L. (2009). "The impact of 'soft' and 'hard'
TQM elements on quality management results". International Journal of
Quality & Reliability Management, 26(2), 150-163.
French, S., Reynolds, F., and Swain, J. (2001). Practical research: A guide for
therapists, Butterworth-Heinemann Medical.
Garvin, D. A. (1988). Managing Quality, New York, THE FREE PRESS.
Gencer, C. and Gurpinar, D. (2007). "Analytic network process in supplier
selection: A case study in an electronic firm". Applied mathematical
modelling, 31, 2475-2486.
Gillham, B. (2005). Research interviewing: The range of techniques, Open Univ
Pr.
Goffin, K., and Szwejczewski, M. (1996). "Is management commitment to
quality just ―a given‖?" The TQM Magazine, 8(2), 26-31.
Gore, E. (1999). "Organizational culture, TQM and business process
reengineering: an empirical comparison''". Team Performance
Management, 5(5), 164-70.
Grandzol, J. R., and Gershon, M. (1998). "A survey instrument for
standardizing TQM modeling research". Science, 3(1), 80-105.
Grant, R. M. (1991). "The resource-based theory of competitive advantage:
implications for strategy formulation". California management review,
33(3), 114-135.
Greene, J. C., and Caracelli, V. J. (1997). Advances in mixed-method evaluation:
The challenges and benefits of integrating diverse paradigms, Jossey-Bass
Publishers.
Greene, J. C., Caracelli, V. J., and Graham, W. F. (1989). "Toward a conceptual
framework for mixed-method evaluation designs". Educational evaluation
and policy analysis, 11(3), 255.

270
Gronstedt, A. (1996). "Integrated communications at America's leading total
quality management corporations". Public Relations Review, 22(1), 25-42.
Hart, C., and Schlesinger, L. (1991). "Total quality management and the human
resource professional: applying the Baldrige framework to human
resources". Human Resource Management, 30(4).
Hauser, J. R., and Clausing, D. (1996). "The house of quality". IEEE
Engineering Management Review, 24(1), 24-32.
Herath, G. (2004). "Incorporating community objectives in improved wetland
management: the use of the analytic hierarchy process". Journal of
Environmental Management, 70(3), 263-273.
Herriott, R. E., and Firestone, W. A. (1983). "Multisite qualitative policy
research: Optimizing description and generalizability". Educational
Researcher, 12(2), 14-19.
Hill, C. W. L., and Jones, G. R. (2004). Strategic management: An integrated
approach, Wiley India Pvt. Ltd.
Hirschman, E. C. (1986). "Humanistic inquiry in marketing research:
philosophy, method, and criteria". Journal of Marketing Research, 23(3),
237-249.
Ho, E., Lai, Y. J., and Chang, S. I. (1999). "An integrated group decision-
making approach to quality function deployment". IIE transactions, 31(6),
553-567.
Ho, S. K. M., and Cho, W. K. (1995). "Manufacturing excellence in fast-food
chains". Total Quality Management, 6(2), 123-134.
Hsu, T. K., Tsai, Y. F., and Wu, H. H. (2009). "The preference analysis for
tourist choice of destination: A case study of Taiwan". Tourism
Management, 30(2), 288-297.
Hua, H., Chin, K. S., Sun, H., and Xu, Y. (2000). "An empirical study on quality
management practices in Shanghai manufacturing industries". Total
Quality Management & Business Excellence, 11(8), 1111-1122.

271
Jharkharia, S., and Shankar, R. (2007). "Selection of logistics service provider:
An analytic network process (ANP) approach". Omega, 35(3), 274-289.
Joseph, I. N., Rajendran, C., and Kamalanabhan, T. J. (1999). "An instrument
for measuring total quality management implementation in
manufacturing-based business units in India". International Journal of
Production Research, 37(10), 2201-2215.
Juran, J. M. (1988). Juran on planning for quality, Free press New York.
Juran, J. M., and Gryna, F. M. (1993). Quality planning and analysis: from
product development through use, McGraw-Hill
Science/Engineering/Math.
Kandampully, J., and Duddy, R. (1999). "Relationship marketing: a concept
beyond the primary relationship". Marketing Intelligence & Planning,
17(7), 315-323.
Kangas, A., Kangas, J., and Kurttila, M. (2008). Decision support for forest
management, Springer.
Karsak, E. E. (2004). "Fuzzy multiple objective programming framework to
prioritize design requirements in quality function deployment".
Computers & Industrial Engineering, 47(2-3), 149-163.
Karsak, E. E., Sozer, S., and Alptekin, S. E. (2002). "Product planning in
quality function deployment using a combined analytic network process
and goal programming approach". Computers & industrial engineering,
44(1), 171-190.
Katz, R. L. (1970). Cases and Concepts in Corporate Strategy, New Jersey,
Prentice-Hall.
Kidd, M. (2000). "Food safety-consumer concerns". Nutrition and Food Science,
53-55.
Klefsjo, B., Wiklund, H., and Edgeman, R. L. (2001). "Six sigma seen as a
methodology for total quality management". Measuring Business
Excellence, 5(1), 31-35.

272
Köksal, G., and E I Tman, A. (1998). "Planning and design of industrial
engineering education quality". Computers & Industrial Engineering, 35(3-
4), 639-642.
Köne, A. and Buke, T. (2007). "An Analytical Network Process (ANP) evaluation
of alternative fuels for electricity generation in Turkey". Energy Policy, 35,
5220-5228.
Kufidu, S., and Vouzas, F. (1998). "Human resource aspects of quality
management: evidence from MNEs operating in Greece". The International
Journal of Human Resource Management (UK), 818.
Kumar, S., and Gupta, Y. P. (1993). "Statistical Process Control at Motorola's
Austin Assembly Plant". Interfaces, 84-92.
Lakhe, R. R., and Mohanty, R. P. (1994). "Total quality management concepts,
evolution and acceptability in developing economies". International
Journal of Quality and Reliability Management, 11(9), 9-33.
Lam, K., and Zhao, X. (1998). "An application of quality function deployment to
improve the quality of teaching". International Journal of Quality and
Reliability Management, 15(4), 389-413.
Lau, H., and Idris, M. (2001). "The soft foundation of the critical success factors
on TQM implementation in Malaysia". The TQM Magazine, 13(1), 51-60.
Leana, C. R., and Van Buren Iii, H. J. (1999). "Organizational social capital and
employment practices". Academy of Management Review, 538-555.
Lee, C. W., and Kwak, N. K. (1999). "Information resource planning for a
health-care system using an AHP-based goal programming method".
Journal of the operational research society, 1191-1198.
Leonard, D., and Mcadam, R. (2002). "The strategic impact and implementation
of TQM ". The TQM Magazine 14(1), 51 - 60
Levin, R. I., and Kirkpatrick, C. A. (1992). Quantitative approaches to
management, Singapore, McGraw-Hill Companies.
Lewis, W. G., Pun, K. F., and Lalla, T. R. M. (2006). "Empirical investigation of
the hard and soft criteria of TQM in ISO 9001 certified small and

273
medium-sized enterprises". International Journal of Quality and Reliability
Management, 23(8), 964-985.
Lincoln, Y. S., and Guba, E. G. (1985). Naturalistic inquiry, Sage.
Linderman, K., Schroeder, R. G., and Choo, A. S. (2006). "Six Sigma: The role
of goals in improvement teams". Journal of Operations Management,
24(6), 779-790.
Liu, E., and Hsiao, S. W. (2006). "ANP-GP approach for product variety design".
The International Journal of Advanced Manufacturing Technology, 29(3),
216-225.
Lo, V. H. Y., Ho, C. O., and Sculli, D. (1998). "The strategic insights of Sun Tzu
and quality management". The TQM Magazine, 10(3), 161-8.
López, S. V. (2005). "Competitive advantage and strategy formulation".
Management Decision, 43(5), 661-669.
Madu, C. N., and Kuei, C. (1993). "Introducing strategic quality management".
Long Range Planning, 26(6), 121-131.
Magd, H., Kadasah, N., and Curry, A. (2003). "ISO 9000 implementation: a
study of manufacturing companies in Saudi Arabia". Managerial Auditing
Journal, 18(4), 313-322.
Mahoney, J. T., and Pandian, J. R. (1992). "The resource-based view within the
conversation of strategic management". Strategic management journal,
13(5), 363-380.
Mandal, A., and Deshmukh, S. G. (1994). "Vendor selection using interpretive
structural modelling (ISM)". International Journal of Operations and
Production Management, 14, 52-52.
Mardle, S., Pascoe, S., and Herrero, I. (2004). "Management objective
importance in fisheries: an evaluation using the analytic hierarchy
process (AHP)". Environmental Management, 33(1), 1-11.
Mardle, S., Pascoe, S., Tamiz, M., and Jones, D. (2000). "Resource allocation in
the North Sea demersal fisheries: a goal programming approach". Annals
of Operations Research, 94(1), 321-342.

274
Marshall, C., and Rossman, G. B. (2006). Designing qualitative research,
Thousand Oajs, London, New Delhi, Sage.
Maul, G. P., and Gillard, J. S. (1994). "Solving chronic problems with simple
tools". Quality Progress, 27(7), 51-56.
Mawapanga, M. N., and Debertin, D. L. (1996). "Choosing between alternative
farming systems: An application of the analytic hierarchy process".
Review of Agricultural Economics, 385-401.
Mcadam, R., and Henderson, J. (2004). "Influencing the future of TQM: internal
and external driving factors". International journal of quality and
reliability management, 21(1), 51-71.
Mcadam, R., Leonard, D., Henderson, J. and Hazlett, S. (2008). "A grounded
theory research approach to building and testing TQM theory in
operations management". Omega, 36, 825-837.
MCI (2005). Report of the Working Party on the Accession of the Kingdom of
Saudi Arabia to the World Trade Organization. Ministry of Commerce and
Industry, Kingdom of Saudi Arabia.
Meuser, M., and Nagel, U. (1991). "Experteninterviews viel erprobt, wenig
bedacht". Qualitativ-empirische Sozialforschung. Opladen: Westdeutscher
Verlag, 441-471.
Miles, M. B., and Huberman, A. M. (1994). Qualitative data analysis: An
expanded sourcebook, Sage Pubns.
Montealegre, R. (2002). "A process model of capability development: Lessons
from the electronic commerce strategy at Bolsa de Valores de Guayaquil".
Organization Science, 514-531.
Montes, F. J. L., Jover, A. V., and Fernandez, L. M. M. (2003). "Factors
affecting the relationship between total quality management and
organizational performance". International Journal of Quality and
Reliability Management, 20(2), 189-209.

275
Morgan, D. L. (1998). "Practical strategies for combining qualitative and
quantitative methods: Applications to health research". Qualitative
Health Research, 8(3), 362-376.
Morgan, N. A., and Piercy, N. F. (1996). "Competitive advantage, quality
strategy and the role of marketing". British Journal of Management, 7(3),
231-245.
Morse, J. M. (1991). "Approaches to qualitative-quantitative methodological
triangulation". Nursing Research, 40(2), 120.
Morse, P. M. (2007). Methods of operations research, Kormendi Press.
Newman, W. H., Logan, J. P., and Hegarty, W. H. (1981). Strategy, policy, and
central management, South-Western Publ.
Oakland, J. S. (1993). Total quality management: the route to improving
performance Butterworth-Heinemann.
Oke, S. A., and Ayomoh, M. K. O. (2005). "The hybrid structural interaction
matrix: A new prioritizing tool for maintenance". International Journal of
Quality and Reliability Management, 22(6), 607-625.
Olve, N., Roy, J. and Wetter, M. (1999). Performance Drivers: A practical guide to
using the Balanced Scorecard, J. Wiley, Chichester [England]; New York.
Parasuraman, A., and Grewal, D. (2000). "The impact of technology on the
quality-value-loyalty chain: a research agenda". Journal of the Academy
of Marketing Science, 28(1), 168-174.
Patton, M. Q. (1987). How to use qualitative methods in evaluation, Sage.
Patton, M. Q. (1990). Qualitative evaluation and research methods: A systematic
approach, Sage Publications (CA).
Penrose, E. (1995). The theory of the growth of the firm, New York, Oxford.
Peräkylä, A. (2002). "Reliability and validity in research based on tapes and
transcripts". Qualitative Research: Theory, Method and Practice, Sage
Publications, London.
Perdomo-Ortiz, J. (2008). "The intervening effect of business innovation
capability on the relationship between Total Quality Management and

276
technological innovation". International Journal of Production Research,
99999(1), 1-21.
Perdomo-Ortiz, J., González-Benito, J., and Galende, J. (2006). "Total quality
management as a forerunner of business innovation capability".
Technovation, 26(10), 1170-1185.
Perrow, C. (1967). "A framework for the comparative analysis of organizations".
American sociological review, 194-208.
Peterson, D. L., Silsbee, D. G., and Schmoldt, D. L. (1994). "A case study of
resources management planning with multiple objectives and projects".
Environmental Management, 18(5), 729-742.
Pheng, L. S., and Hong, S. H. (2005). "Strategic quality management for the
construction industry". The TQM Magazine 17(1), 35 – 53.
Powell, T. C. (1995). "Total quality management as competitive advantage: a
review and empirical study". Strategic Management Journal, 15-37.
Prajogo, D. I. (2006). "Progress of quality management practices in Australian
manufacturing firms". The TQM Magazine, 18(5), 501-513.
Prajogo, D. I., and Sohal, A. S. (2006). "The integration of TQM and
technology/R&D management in determining quality and innovation
performance". Omega, 34(3), 296-312.
Prasad, B. (1998). "Review of QFD and related deployment techniques". Journal
of manufacturing Systems, 17(3), 221-234.
Preiss, K., Goldman, S. L., and Nagel, R. N. (1996). Cooperate to compete:
Building agile business relationships, Van Nostrand Reinhold New York.
Pruett, M., and Thomas, H. (1996). "Thinking about quality and its links with
strategic management". European Management Journal, 14(1), 37-46.
Psychogios, A. and Wilkinson, A. (2007). "Exploring TQM awareness in the
Greek national business context: between conservatism and reformism
cultural determinants of TQM". The International Journal of Human
Resource Management, 18, 1042-1062.

277
Quazi, H. A., Jemangin, J., Kit, L. W., and Kian, C. L. (1998). "Critical factors
in quality management and guidelines for self-assessment: the case of
Singapore". Total Quality Management, 9(1), 35-56.
Rahman, S. (2004). "The future of TQM is past. Can TQM be resurrected?"
Total Quality Management & Business Excellence, 15(4), 411-422.
Rahman, S., and Bullock, P. (2005). "Soft TQM, hard TQM, and organisational
performance relationships: an empirical investigation". Omega, 33(1), 73-
83.
Ramanathan, R., and Ganesh, L. S. (1995). "Energy resource allocation
incorporating qualitative and quantitative criteria: an integrated model
using goal programming and AHP". Socio-Economic Planning Sciences,
29(3), 197-218.
Rapert, M. I., and Babakus, E. (1996). "Linking quality and performance.
Quality orientation can be a competitive strategy for health care
providers". Journal of health care marketing, 16(3), 39.
Reed, R., and Defillippi, R. J. (1990). "Causal ambiguity, barriers to imitation,
and sustainable competitive advantage". The Academy of Management
Review, 15(1), 88-102.
Reed, R., Lemak, D. J., and Mero, N. P. (2000). "Total quality management and
sustainable competitive advantage". Journal of Quality Management, 5(1),
5-26.
Render, B., Stair, R. M., and Hanna, M. E. (2006). Quantitative analysis for
management, Pearson Prentic Hall.
Riege, A. M. (2003). "Validity and reliability tests in case study research: a
literature review with hands-on' applications for each research phase".
Qualitative Market Research: An International Journal, 6(2), 75-86.
Robbins, S. P., and Barnwell, N. (2002). Organisation Theory: concepts and
cases 4th edition. Prentice Hall, Pearson Education Australia.
Roca-Puig, V., Escrig-Tena, A. B., Bou-Llusar, J. C., and Beltrán-Martín, I.
(2006). "A Systemic and Contingent View of the Basic Elements of

278
Quality Management". Total Quality Management & Business Excellence,
17(9), 1111-1127.
Rousseau, D. M. (1979). "Assessment of technology in organizations: closed
versus open systems approaches". The Academy of Management Review,
4(4), 531-542.
Rungtusanatham, M., Forza, C., Filippini, R., and Anderson, J. C. (1998). "A
replication study of a theory of quality management underlying the
Deming management method: insights from an Italian context". Journal
of Operations Management, 17(1), 77-95.
Ruyter, K. D., and Scholl, N. (1998). "Positioning qualitative market research:
reflections from theory and practice". Qualitative market research: An
international journal, 1(1), 7-14.
Saaty, T. L. (1994). "How to make a decision: the analytic hierarchy process".
Interfaces, 19-43.
Saaty, T. L. (1996). Decision making with dependence and feedback: the
analytic network process, RWS Publications, Pittsburgh, Pa.
Saaty, T. L. (1999). Fundamentals of the analytic network process, ISAHP
conference on the Analytic Hierarchy Process, 12-14 August Kope, Japan.
Saaty, T. L. (2004). "Fundamentals of the analytic network process—
Dependence and feedback in decision-making with a single network".
Journal of Systems science and Systems engineering, 13(2), 129-157.
Saaty, T. L. (2007). "Time dependent decision-making; dynamic priorities in the
AHP/ANP: Generalizing from points to functions and from real to
complex variables". Mathematical and Computer Modelling, 46(7-8), 860-
891.
SAMA (2009). Saudi Arabian Monetary Agency, The Latest Economic
Developments, Research and Statistics Department 45th Annual Report.
Riyadh, Saudi Arabian Monetary Agency.
Sambasivan, M., and Fei, N. Y. (2008). "Evaluation of critical success factors of
implementation of ISO 14001 using analytic hierarchy process (AHP): a

279
case study from Malaysia". Journal of Cleaner Production, 16(13), 1424-
1433.
Samson, D., and Terziovski, M. (1999). "The relationship between total quality
management practices and operational performance". Journal of
operations management, 17(4), 393-409.
Sandelowski, M. (2000). "Combining qualitative and quantitative sampling,
data collection, and analysis techniques in mixed-method studies".
Research in Nursing & Health, 23(3), 246-255.
Saraph, J. V., Benson, P. G., and Schroeder, R. G. (1989). "An instrument for
measuring the critical factors of quality management". Decision Sciences,
20(4), 810-829.
Schendel, D., and Hofer, C. W. (1978). Strategy formulation: Analytical concepts,
West Pub. Co.
Schniederjans, M. J. (1995). Goal programming: methodology and applications,
Springer.
Schniederjans, M. J., and Karuppan, C. M. (1995). "Designing a quality control
system in a service organization: A goal programming case study".
European Journal of Operational Research, 81(2), 249-258.
Schramm, W. (1971). "Notes on Case Studies of Instructional Media Projects".
Working Paper for the Academy for Educational Development.
Schroeder, R. G. (1974). "Resource planning in university management by goal
programming". Operations Research, 22(4), 700-710.
Sengupta, S. (1981). "Goal programming approach to a type of quality control
problem". The Journal of the Operational Research Society, 32(3), 207-
211.
Senthil, V., Devadasan, S. R., Selladurai, V., and Baladhandayutham, R.
(2001). "Integration of BPR and TQM: past, present and future trends".
Production Planning and Control, 12(7), 680-688.

280
Shahroudi, K. (2010). "The Application of Data Envelopment Analysis
Methodology to Improve the Benchmarking Process in the EFQM".
Business Model. IJO, 1.
Shergold, K. and Reed, D. (1996). "Striving for excellence: how self-assessment
using the business excellence model can result in step improvements in
all areas of business activities". The TQM Magazine, 8, 48-52.
Shiong, K. B., Aris, B., Ahmad, M. H., Ali, M. B., Harun, J., and Zaidatun, T.
(2008). "Learning``Goal Programming'' Using an Interactive Multimedia
Courseware: Design Factors and Students' Preferences". Journal of
Educational Multimedia and Hypermedia, 17(1), 59.
Shrestha, R. K., Alavalapati, J. R. R., and Kalmbacher, R. S. (2004). "Exploring
the potential for silvopasture adoption in south-central Florida: an
application of SWOT–AHP method". Agricultural Systems, 81(3), 185-199.
Sila, I., and Ebrahimpour, M. (2003). "Examination and comparison of the
critical factors of total quality management (TQM) across countries".
International Journal of Production Research, 41(2), 235-268.
Sila, I., and Ebrahimpour, M. (2005). "Critical linkages among TQM factors and
business results". International Journal of Operations and Production
Management, 25(11), 1123.
Singh, M. D., Shankar, R., Narain, R., and Agarwal, A. (2003). "An interpretive
structural modeling of knowledge management in engineering
industries". Journal of Advances in Management Research, 1(1), 28–40.
Sivabrovornvatana, N., Siengthai, S., Krairit, D., and Paul, H. (2005).
"Technology usage, quality management system, and service quality in
Thailand". International Journal of Health Care Quality Assurance, 18(6),
413-423.
Smith, B., Inc, M., and Schaumburg, I. L. (1993). "Six-sigma design [quality
control]". IEEE Spectrum, 30(9), 43-47.

281
Snell, S. A., and Dean Jr, J. W. (1992). "Integrated manufacturing and human
resource management: A human capital perspective". The Academy of
Management Journal, 35(3), 467-504.
Soltani, E., Gennard, J., Van Der Meer, R. B., and Williams, T. (2004). "HR
performance evaluation in the context of TQM: A review of the literature".
International Journal of Quality and Reliability Management, 21(4), 377-
396.
Soltani, E., Lai, P. C., and Gharneh, N. S. (2005). "Breaking through barriers to
TQM effectiveness: lack of commitment of upper-level management".
Total Quality Management, 16(8/9), 1009-21.
Spitzer, R. D. (1993). "TQM: the only source of sustainable competitive
advantage". Quality Progress, 26, 59-59.
Srinidhi, B. (1998 ). "Strategic quality management ". International Journal of
Quality Science 3(1 ), 38 - 70
Srivastava, S. K. (2008). "Towards estimating Cost of Quality in supply chains".
Total Quality Management & Business Excellence, 19(3), 193-208.
Steckler, A., Mcleroy, K. R., Goodman, R. M., Bird, S. T., and Mccormick, L.
(1992). "Toward integrating qualitative and quantitative methods: an
introduction". Health Education & Behavior, 19(1), 1.
Steiner, G. A., Miner, J. B., and Gray, E. R. (1986). Management policy and
strategy: Text, Readings, and Cases, New York, Macmillan.
Strolle, A. (1991). "Creating a TQM culture is everyone's business".
International Journal of Research Technology Management, 34(4), 25-8.
Taguchi, G., and Clausing, D. (1990). "Robust quality". Harvard Business
Review, 68(1), 65-75.
Tamimi, N. (1998). "A second-order factor analysis of critical TQM factors".
Science, 3(1), 71-79.
Tamiz, M., Jones, D., and Romero, C. (1998). "Goal programming for decision
making: An overview of the current state-of-the-art". European Journal of
Operational Research, 111(3), 569-581.

282
Tar, J. J., and Sabater, V. (2006). "Human aspects in a quality management
context and their effects on performance". Int. J. of Human Resource
Management, 17, 484-503.
Tarí, J. J. (2005). "Components of successful total quality management". The
TQM magazine, 17(2), 182–194.
Tashakkori, A., and Teddlie, C. (1998). Mixed methodology: Combining
qualitative and quantitative approaches, Thousand Oajs, London, New
Delhi, Sage Publications, Inc.
Tashakkori, A., and Teddlie, C. (2003). The past and future of mixed methods
research: From data triangulation to mixed model designs. IN
Tashakkori, A.andTeddlie, C. (Eds.) Handbook of mixed methods in social
and behavioral research. Thousand Oaks, CA: Sage.
Taylor, W. A., and Wright, G. H. (2006). "The contribution of measurement and
information infrastructure to TQM success". Omega, 34(4), 372-384.
Tellis, W. (1997). "Introduction to case study". The qualitative report, 3(2), 1-11.
Tomer, J. F. (1987). Organizational capital: The path to higher productivity and
well-being, Praeger, New York.
Tompkins, J. R. (2004). Organization theory and public management, Belmont,
Wadsworth.
Tracey, W. R. (2003). The human resources glossary: the complete desk
reference for HR executives, managers, and practitioners, CRC.
Tummala, V. M. R., and Tang, C. L. (1996). "Strategic quality management,
Malcolm Baldrige and European quality awards and ISO 9000
certification: Core concepts and comparative analysis". International
Journal of Quality & Reliability Management Volume 13 (4), 8-38.
Ulutas, B. (2005). "Determination of the appropriate energy policy for Turkey".
Energy, 30, 1146-1161.
Van Manen, M. (1990). Researching lived experience: Human science for an
action sensitive pedagogy, State Univ of New York Pr.

283
Vouzas, F. and Gotzamani, K. (2005). "Best practices of selected Greek
organizations on their road to business excellence: the contribution of
the new ISO 9000: 2000 series of standards". The TQM Magazine, 17,
259-266.
Vouzas, F., and Psychogios, A. G. (2007). "Assessing managers' awareness of
TQM". The TQM Magazine, 19(1), 62-75.
Waldman, D. A., and Gopalakrishman, M. (1996). "Operational, organizational,
and human resource factors predictive of customer perceptions of service
quality". Journal of Quality Management, 1(1), 91-107.
White, M. A., and Bruton, G. D. (2007). The management of technology and
innovation: a strategic approach, South-Western Pub.
Wilkinson, A., Redman, T., Snape, E., and Marchington, M. (1998). Managing
with total quality management: theory and practice, Macmillan Business.
Winston, W. L. (1994). "Operations research: applications and algorithms".
Belmont, California.
Wolff, J. A., and Reed, R. (2000). "Firm resources and joint ventures: what
determines zero-sum versus positive-sum outcomes?" Managerial and
Decision Economics, 21(7), 269-284.
Wolfslehner, B., Vacik, H., and Lexer, M. J. (2005). "Application of the analytic
network process in multi-criteria analysis of sustainable forest
management". Forest Ecology and Management, 207(1-2), 157-170.
Wong, J., Li, H., and Lai, J. (2008). "Evaluating the system intelligence of the
intelligent building systems Part 2: Construction and validation of
analytical models". Automation in Construction, 17(3), 303-321.
Wongrassamee, S., Gardiner, P. and Simmons, J. (2003). "Performance
measurement tools: the Balanced Scorecard and the EFQM Excellence
Model". Measuring Business Excellence, 7, 14-29.
Wu, W. (2008). "Choosing knowledge management strategies by using a
combined ANP and DEMATEL approach". Expert Systems with
Applications, 35, 828-835.

284
Yang, C. C. (2006). "The impact of human resource management practices on
the implementation of total quality management". The TQM Magazine,
18(2), 162-73.
Yin, R. K. (2003). Case Study Research: Design and Methods, Thousand Oaks,
London, New Delhi, Sage.
Zbaracki, M. J. (1998). "The Rhetoric and Reality of Total Quality
Management". Administrative Science Quarterly, 43(3), 602-605.
Zhang, Z., Waszink, A., and Wijngaard, J. (2000). "An instrument for
measuring TQM implementation for Chinese manufacturing companies".
International Journal of Quality and Reliability Management, 17(6-7), 730-
755.
Zkarian, A., and Kusiak, A. (1999). "Forming teams: an analytical approach".
IIE transactions, 31(1), 85-97.

285
Appendix A: Categorization of TQM Critical Elements into Three Types of Resources:
Technological, Organizational, and Human resources
Authors
Technological
Resources
Organizational
Resources
Human Resources
Saraph et al. (1989) Product/Service design
Process management
Management
leadership
Role of the Quality
Department
Supplier quality
Management
Quality data
and reporting
Training
Employee relations
Flynn (1994) New product quality
Product design
characteristics
Process control
Top management
quality leadership
Feedback
Cleanliness and
organization
Interfunctional design
efforts
Supplier relationship
Customer interaction
Rewards for quality
Anderson et al. (1995)
Process management
Continuous
improvement
Visionary leadership
Internal and external
cooperation
Customer satisfaction
Learning
Employee fulfilment
Badri et al. (1995) Product/service design
Process
management/operating
procedures
Role of divisional top
management and
quality policy
Role of Quality
Department
Quality data and
reporting
Supplier quality
management
Training
Employee relations
Powell (1995) Benchmarking
Measurement
(statistical methods)
Zero-defects mentality
Flexible manufacturing
Process improvement
Executive
commitment
Adopting the
philosophy
Closer to customers
Closer to suppliers
Open organization
Training
Employee
empowerment

286
Authors
Technological
Resources
Organizational
Resources
Human Resources
Ahire et al. (1996) SPC usage
Benchmarking
Design quality
management
Product quality
Top management
commitment
Supplier quality
management
Supplier performance
Customer focus
Internal quality
information usage
Employee involvement
Employee training
Employee
empowerment
Black and Porter (1996)
Quality improvement
measuring systems
Corporate quality
culture
Strategic quality
management
Suppliers partnerships
Teamwork structure
External interface
management
Operational quality
planning
Customer satisfaction
orientation
Communication of
improvement
information
People and Customer
management (linking
HR and customer
relations)
Grandzol and Gershon
(1998)
Continuous
improvement
Process management
Product/service quality
Leadership
Customer focus
Cooperation
Finance (as a result of
organizational success)
Customer satisfaction
Employee fulfilment
Learning
Employee satisfaction

287
Authors
Technological
Resources
Organizational
Resources
Human Resources
Quazi et al. (1998)
refining the model of
Saraph et al. (1989)
Product/Service design
Process
management/operating
procedures
Role of top
management and
quality policy
Role of the quality
department
Supplier quality
Quality data and
reporting
Training
Employee relations
Rungtusanatham et al.
(1998) used Anderson et
al‟s (1995) framework in
Italy
Process management
Continuous
improvement
Visionary leadership
Internal and external
cooperation
Customer satisfaction
Learning
Employee fulfillment
Tamimi (1998) Product/service
innovation
Top management
commitment
Supervisory leadership
Cross functional
communications to
improve quality
Supplier management
Education
Quality training,
Providing assurance to
employees

288
Authors
Technological
Resources
Organizational
Resources
Human Resources
Dow et al. (1999) Use of benchmarking
Advanced manuf
systems
Use of just-in-time
principles
Workforce
commitment
Shared vision
Customer focus
Use of teams
Co-operative supplier
relations
Personnel training
Joseph et al. (1999) Product design
Technology utilization
Operating procedures
Organizational
commitment
Supplier Integration
Quality policy
Role of quality
department
Quality information
systems
Human Resources
management
Training
Hua et al. (2000) Processes
Leadership
Policy and strategy
Quality assurance
Supplier quality
Business results
Customer satisfaction
Impact on society
People management
Employee involvement
Zhang et al. (2000)
Evaluation
Process control and
improvement
Product design
Quality system
improvement
Leadership
Supplier quality
management
Vision and plan
statement
Customer focus
Employee participation
Recognition and
reward
Education and training
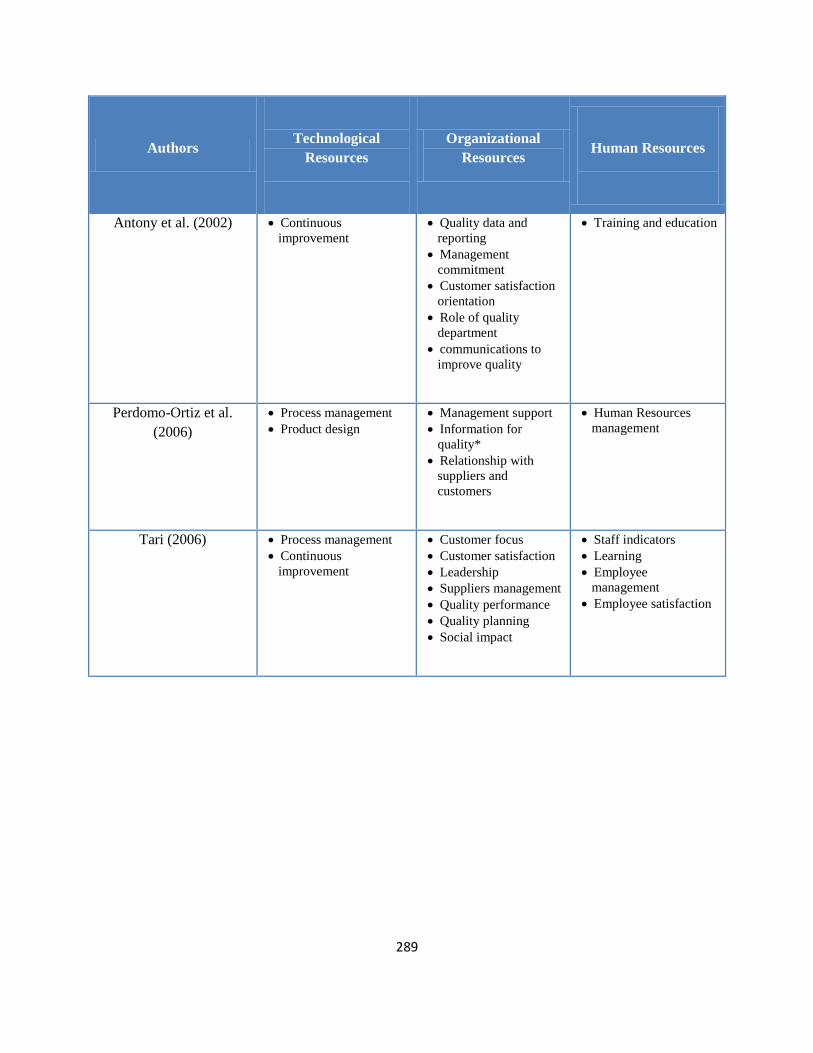
289
Authors
Technological
Resources
Organizational
Resources
Human Resources
Antony et al. (2002) Continuous
improvement
Quality data and
reporting
Management
commitment
Customer satisfaction
orientation
Role of quality
department
communications to
improve quality
Training and education
Perdomo-Ortiz et al.
(2006)
Process management
Product design
Management support
Information for
quality*
Relationship with
suppliers and
customers
Human Resources
management
Tari (2006) Process management
Continuous
improvement
Customer focus
Customer satisfaction
Leadership
Suppliers management
Quality performance
Quality planning
Social impact
Staff indicators
Learning
Employee
management
Employee satisfaction

290
Appendix B: The Questionnaire
Part (1):
“Human Resources” contribute significantly to the successful implementation of eight strategies
needed. This contribution is influenced by “Organizational Resources” and “Technological
Resources”.
Using the following scale, please compare their relative influence?
Extremely Strongly Strongly Extremely
Important Important Equally Important Important
“Organizational Resources” contribute significantly to the successful implementation of eight
strategies needed. This contribution is influenced by “Human Resources” and “Technological
Resources”.
Using the following scale, please compare their relative influence?
Extremely Strongly Strongly Extremely
Important Important Equally Important Important
“Technological Resources” contribute significantly to the successful implementation of eight strategies
needed. This contribution is influenced by “Human Resources” and “Organizational Resources”.
Using the following scale, please compare their relative influence?
Extremely Strongly Strongly Extremely
Important Important Equally Important Important
Organizational
Resources 9 8 7 6 5 4 3 2 1 2 3 4 5 6 7 8 9
Technological
Resources
Human
Resources 9 8 7 6 5 4 3 2 1 2 3 4 5 6 7 8 9
Technological
Resources
Human Resources
9 8 7 6 5 4 3 2 1 2 3 4 5 6 7 8 9 Organizational
Resources

291
Part (2-A):
With respect to “Strategy1: Continuous use of human knowledge”, what is the relative importance of
the resources appearing on the left side of the page to its counterpart appearing on the right side?
Extremely Strongly Strongly Extremely
Important Important Equally Important Important
With respect to “Strategy2: Continuous quality information management”, what is relative
importance of the resources appearing on the left side of the page to its counterpart appearing on the right
side?
Extremely Strongly Strongly Extremely
Important Important Equally Important Important
With respect to “Strategy3: Continuous approach towards targets”, what is the relative importance of
the resources appearing on the left side of the page to its counterpart appearing on the right side?
Extremely Strongly Strongly Extremely
Important Important Equally Important Important
Human
Resources 9 8 7 6 5 4 3 2 1 2 3 4 5 6 7 8 9
Organizational
Resources
Human
Resources 9 8 7 6 5 4 3 2 1 2 3 4 5 6 7 8 9
Technological
Resources
Organizational
Resources 9 8 7 6 5 4 3 2 1 2 3 4 5 6 7 8 9
Human
Resources
Human
Resources 9 8 7 6 5 4 3 2 1 2 3 4 5 6 7 8 9
Organizational
Resources
Human
Resources 9 8 7 6 5 4 3 2 1 2 3 4 5 6 7 8 9
Technological
Resources
Organizational
Resources 9 8 7 6 5 4 3 2 1 2 3 4 5 6 7 8 9
Human
Resources
Human
Resources 9 8 7 6 5 4 3 2 1 2 3 4 5 6 7 8 9
Organizational
Resources
Human
Resources 9 8 7 6 5 4 3 2 1 2 3 4 5 6 7 8 9
Technological
Resources
Organizational
Resources 9 8 7 6 5 4 3 2 1 2 3 4 5 6 7 8 9
Human
Resources
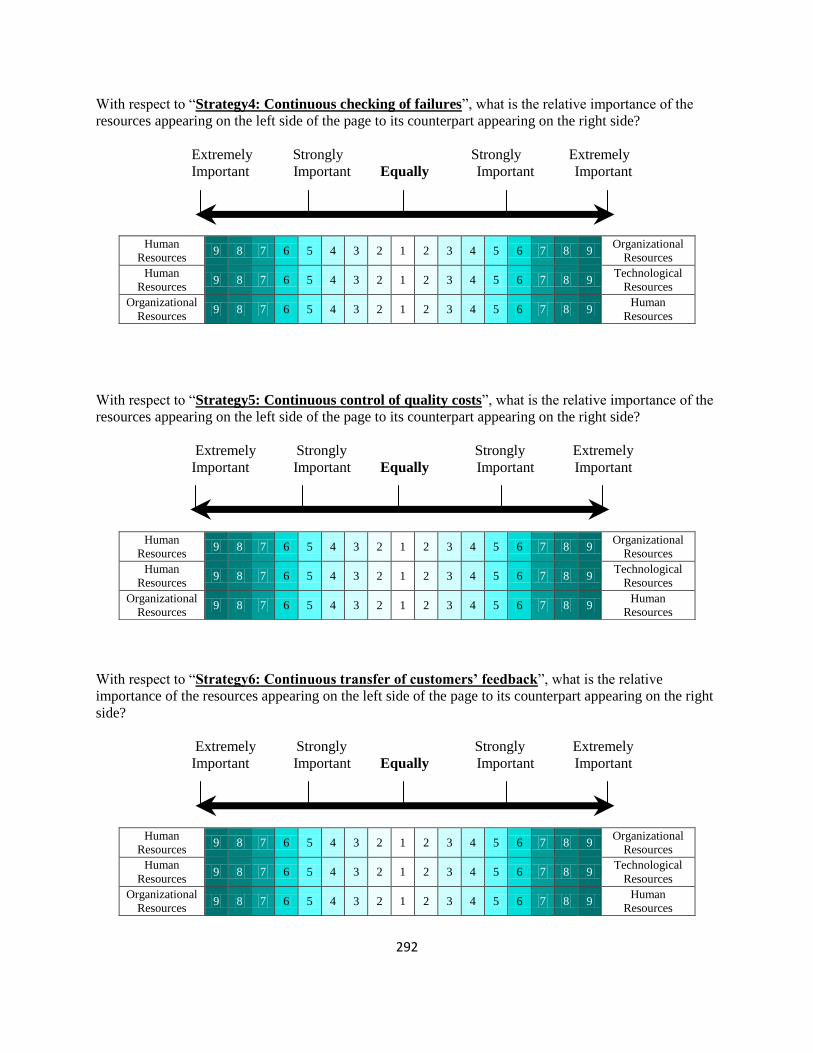
292
With respect to “Strategy4: Continuous checking of failures”, what is the relative importance of the
resources appearing on the left side of the page to its counterpart appearing on the right side?
Extremely Strongly Strongly Extremely
Important Important Equally Important Important
With respect to “Strategy5: Continuous control of quality costs”, what is the relative importance of the
resources appearing on the left side of the page to its counterpart appearing on the right side?
Extremely Strongly Strongly Extremely
Important Important Equally Important Important
With respect to “Strategy6: Continuous transfer of customers’ feedback”, what is the relative
importance of the resources appearing on the left side of the page to its counterpart appearing on the right
side?
Extremely Strongly Strongly Extremely
Important Important Equally Important Important
Human
Resources 9 8 7 6 5 4 3 2 1 2 3 4 5 6 7 8 9
Organizational
Resources
Human
Resources 9 8 7 6 5 4 3 2 1 2 3 4 5 6 7 8 9
Technological
Resources
Organizational
Resources 9 8 7 6 5 4 3 2 1 2 3 4 5 6 7 8 9
Human
Resources
Human
Resources 9 8 7 6 5 4 3 2 1 2 3 4 5 6 7 8 9
Organizational
Resources
Human
Resources 9 8 7 6 5 4 3 2 1 2 3 4 5 6 7 8 9
Technological
Resources
Organizational
Resources 9 8 7 6 5 4 3 2 1 2 3 4 5 6 7 8 9
Human
Resources
Human
Resources 9 8 7 6 5 4 3 2 1 2 3 4 5 6 7 8 9
Organizational
Resources
Human
Resources 9 8 7 6 5 4 3 2 1 2 3 4 5 6 7 8 9
Technological
Resources
Organizational
Resources 9 8 7 6 5 4 3 2 1 2 3 4 5 6 7 8 9
Human
Resources

293
With respect to “Strategy7: Continuous management of quality system”, what is the relative
importance of the resources appearing on the left side of the page to its counterpart appearing on the right
side?
Extremely Strongly Strongly Extremely
Important Important Equally Important Important
With respect to “Strategy8: Periodical quality audit”, what is the relative importance of the resources
appearing on the left side of the page to its counterpart appearing on the right side?
Extremely Strongly Strongly Extremely
Important Important Equally Important Important
Human
Resources 9 8 7 6 5 4 3 2 1 2 3 4 5 6 7 8 9
Organizational
Resources
Human
Resources 9 8 7 6 5 4 3 2 1 2 3 4 5 6 7 8 9
Technological
Resources
Organizational
Resources 9 8 7 6 5 4 3 2 1 2 3 4 5 6 7 8 9
Human
Resources
Human
Resources 9 8 7 6 5 4 3 2 1 2 3 4 5 6 7 8 9
Organizational
Resources
Human
Resources 9 8 7 6 5 4 3 2 1 2 3 4 5 6 7 8 9
Technological
Resources
Organizational
Resources 9 8 7 6 5 4 3 2 1 2 3 4 5 6 7 8 9
Human
Resources

294
Part (2-B):
“Human Resources” have significant role in maintaining the eight strategies. In your opinion, please
compare the relative significance of this role between each pair of the strategies listed on opposite side of
each row?
Extremely Strongly Strongly Extremely
Important Important Equally Important Important
UHK 9 8 7 6 5 4 3 2 1 2 3 4 5 6 7 8 9 QIM
UHK 9 8 7 6 5 4 3 2 1 2 3 4 5 6 7 8 9 ATT
UHK 9 8 7 6 5 4 3 2 1 2 3 4 5 6 7 8 9 CHF
UHK 9 8 7 6 5 4 3 2 1 2 3 4 5 6 7 8 9 CQC
UHK 9 8 7 6 5 4 3 2 1 2 3 4 5 6 7 8 9 TCF
UHK 9 8 7 6 5 4 3 2 1 2 3 4 5 6 7 8 9 MQS
UHK 9 8 7 6 5 4 3 2 1 2 3 4 5 6 7 8 9 PQA
QIM 9 8 7 6 5 4 3 2 1 2 3 4 5 6 7 8 9 ATT
QIM 9 8 7 6 5 4 3 2 1 2 3 4 5 6 7 8 9 CHF
QIM 9 8 7 6 5 4 3 2 1 2 3 4 5 6 7 8 9 CQC
QIM 9 8 7 6 5 4 3 2 1 2 3 4 5 6 7 8 9 TCF
QIM 9 8 7 6 5 4 3 2 1 2 3 4 5 6 7 8 9 MQS
QIM 9 8 7 6 5 4 3 2 1 2 3 4 5 6 7 8 9 PQA
ATT 9 8 7 6 5 4 3 2 1 2 3 4 5 6 7 8 9 CHF
ATT 9 8 7 6 5 4 3 2 1 2 3 4 5 6 7 8 9 CQC
ATT 9 8 7 6 5 4 3 2 1 2 3 4 5 6 7 8 9 TCF
ATT 9 8 7 6 5 4 3 2 1 2 3 4 5 6 7 8 9 MQS
ATT 9 8 7 6 5 4 3 2 1 2 3 4 5 6 7 8 9 PQA
CHF 9 8 7 6 5 4 3 2 1 2 3 4 5 6 7 8 9 CQC
CHF 9 8 7 6 5 4 3 2 1 2 3 4 5 6 7 8 9 TCF
CHF 9 8 7 6 5 4 3 2 1 2 3 4 5 6 7 8 9 MQS
CHF 9 8 7 6 5 4 3 2 1 2 3 4 5 6 7 8 9 PQA
CQC 9 8 7 6 5 4 3 2 1 2 3 4 5 6 7 8 9 TCF
CQC 9 8 7 6 5 4 3 2 1 2 3 4 5 6 7 8 9 MQS
CQC 9 8 7 6 5 4 3 2 1 2 3 4 5 6 7 8 9 PQA
TCF 9 8 7 6 5 4 3 2 1 2 3 4 5 6 7 8 9 MQS
TCF 9 8 7 6 5 4 3 2 1 2 3 4 5 6 7 8 9 PQA
MQS 9 8 7 6 5 4 3 2 1 2 3 4 5 6 7 8 9 PQA

295
“Organizational Resources” have significant role in maintaining the eight strategies. In your opinion,
please compare the relative significance of this role between each pair of the strategies listed on opposite
side of each row?
Extremely Strongly Strongly Extremely
Important Important Equally Important Important
UHK 9 8 7 6 5 4 3 2 1 2 3 4 5 6 7 8 9 QIM
UHK 9 8 7 6 5 4 3 2 1 2 3 4 5 6 7 8 9 ATT
UHK 9 8 7 6 5 4 3 2 1 2 3 4 5 6 7 8 9 CHF
UHK 9 8 7 6 5 4 3 2 1 2 3 4 5 6 7 8 9 CQC
UHK 9 8 7 6 5 4 3 2 1 2 3 4 5 6 7 8 9 TCF
UHK 9 8 7 6 5 4 3 2 1 2 3 4 5 6 7 8 9 MQS
UHK 9 8 7 6 5 4 3 2 1 2 3 4 5 6 7 8 9 PQA
QIM 9 8 7 6 5 4 3 2 1 2 3 4 5 6 7 8 9 ATT
QIM 9 8 7 6 5 4 3 2 1 2 3 4 5 6 7 8 9 CHF
QIM 9 8 7 6 5 4 3 2 1 2 3 4 5 6 7 8 9 CQC
QIM 9 8 7 6 5 4 3 2 1 2 3 4 5 6 7 8 9 TCF
QIM 9 8 7 6 5 4 3 2 1 2 3 4 5 6 7 8 9 MQS
QIM 9 8 7 6 5 4 3 2 1 2 3 4 5 6 7 8 9 PQA
ATT 9 8 7 6 5 4 3 2 1 2 3 4 5 6 7 8 9 CHF
ATT 9 8 7 6 5 4 3 2 1 2 3 4 5 6 7 8 9 CQC
ATT 9 8 7 6 5 4 3 2 1 2 3 4 5 6 7 8 9 TCF
ATT 9 8 7 6 5 4 3 2 1 2 3 4 5 6 7 8 9 MQS
ATT 9 8 7 6 5 4 3 2 1 2 3 4 5 6 7 8 9 PQA
CHF 9 8 7 6 5 4 3 2 1 2 3 4 5 6 7 8 9 CQC
CHF 9 8 7 6 5 4 3 2 1 2 3 4 5 6 7 8 9 TCF
CHF 9 8 7 6 5 4 3 2 1 2 3 4 5 6 7 8 9 MQS
CHF 9 8 7 6 5 4 3 2 1 2 3 4 5 6 7 8 9 PQA
CQC 9 8 7 6 5 4 3 2 1 2 3 4 5 6 7 8 9 TCF
CQC 9 8 7 6 5 4 3 2 1 2 3 4 5 6 7 8 9 MQS
CQC 9 8 7 6 5 4 3 2 1 2 3 4 5 6 7 8 9 PQA
TCF 9 8 7 6 5 4 3 2 1 2 3 4 5 6 7 8 9 MQS
TCF 9 8 7 6 5 4 3 2 1 2 3 4 5 6 7 8 9 PQA
MQS 9 8 7 6 5 4 3 2 1 2 3 4 5 6 7 8 9 PQA

296
“Technological Resources” have significant role in maintaining the eight strategies. In your opinion,
please compare the relative significance of this role between each pair of the strategies listed on opposite
side of each row?
Extremely Strongly Strongly Extremely
Important Important Equally Important Important
UHK 9 8 7 6 5 4 3 2 1 2 3 4 5 6 7 8 9 QIM
UHK 9 8 7 6 5 4 3 2 1 2 3 4 5 6 7 8 9 ATT
UHK 9 8 7 6 5 4 3 2 1 2 3 4 5 6 7 8 9 CHF
UHK 9 8 7 6 5 4 3 2 1 2 3 4 5 6 7 8 9 CQC
UHK 9 8 7 6 5 4 3 2 1 2 3 4 5 6 7 8 9 TCF
UHK 9 8 7 6 5 4 3 2 1 2 3 4 5 6 7 8 9 MQS
UHK 9 8 7 6 5 4 3 2 1 2 3 4 5 6 7 8 9 PQA
QIM 9 8 7 6 5 4 3 2 1 2 3 4 5 6 7 8 9 ATT
QIM 9 8 7 6 5 4 3 2 1 2 3 4 5 6 7 8 9 CHF
QIM 9 8 7 6 5 4 3 2 1 2 3 4 5 6 7 8 9 CQC
QIM 9 8 7 6 5 4 3 2 1 2 3 4 5 6 7 8 9 TCF
QIM 9 8 7 6 5 4 3 2 1 2 3 4 5 6 7 8 9 MQS
QIM 9 8 7 6 5 4 3 2 1 2 3 4 5 6 7 8 9 PQA
ATT 9 8 7 6 5 4 3 2 1 2 3 4 5 6 7 8 9 CHF
ATT 9 8 7 6 5 4 3 2 1 2 3 4 5 6 7 8 9 CQC
ATT 9 8 7 6 5 4 3 2 1 2 3 4 5 6 7 8 9 TCF
ATT 9 8 7 6 5 4 3 2 1 2 3 4 5 6 7 8 9 MQS
ATT 9 8 7 6 5 4 3 2 1 2 3 4 5 6 7 8 9 PQA
CHF 9 8 7 6 5 4 3 2 1 2 3 4 5 6 7 8 9 CQC
CHF 9 8 7 6 5 4 3 2 1 2 3 4 5 6 7 8 9 TCF
CHF 9 8 7 6 5 4 3 2 1 2 3 4 5 6 7 8 9 MQS
CHF 9 8 7 6 5 4 3 2 1 2 3 4 5 6 7 8 9 PQA
CQC 9 8 7 6 5 4 3 2 1 2 3 4 5 6 7 8 9 TCF
CQC 9 8 7 6 5 4 3 2 1 2 3 4 5 6 7 8 9 MQS
CQC 9 8 7 6 5 4 3 2 1 2 3 4 5 6 7 8 9 PQA
TCF 9 8 7 6 5 4 3 2 1 2 3 4 5 6 7 8 9 MQS
TCF 9 8 7 6 5 4 3 2 1 2 3 4 5 6 7 8 9 PQA
MQS 9 8 7 6 5 4 3 2 1 2 3 4 5 6 7 8 9 PQA

297
Ignoring all three resources and their influence, please compare each pair of strategies (appearing on
opposite sides) with respect to their ability to strategically enhance quality?
Extremely Strongly Strongly Extremely
Important Important Equally Important Important
UHK 9 8 7 6 5 4 3 2 1 2 3 4 5 6 7 8 9 QIM
UHK 9 8 7 6 5 4 3 2 1 2 3 4 5 6 7 8 9 ATT
UHK 9 8 7 6 5 4 3 2 1 2 3 4 5 6 7 8 9 CHF
UHK 9 8 7 6 5 4 3 2 1 2 3 4 5 6 7 8 9 CQC
UHK 9 8 7 6 5 4 3 2 1 2 3 4 5 6 7 8 9 TCF
UHK 9 8 7 6 5 4 3 2 1 2 3 4 5 6 7 8 9 MQS
UHK 9 8 7 6 5 4 3 2 1 2 3 4 5 6 7 8 9 PQA
QIM 9 8 7 6 5 4 3 2 1 2 3 4 5 6 7 8 9 ATT
QIM 9 8 7 6 5 4 3 2 1 2 3 4 5 6 7 8 9 CHF
QIM 9 8 7 6 5 4 3 2 1 2 3 4 5 6 7 8 9 CQC
QIM 9 8 7 6 5 4 3 2 1 2 3 4 5 6 7 8 9 TCF
QIM 9 8 7 6 5 4 3 2 1 2 3 4 5 6 7 8 9 MQS
QIM 9 8 7 6 5 4 3 2 1 2 3 4 5 6 7 8 9 PQA
ATT 9 8 7 6 5 4 3 2 1 2 3 4 5 6 7 8 9 CHF
ATT 9 8 7 6 5 4 3 2 1 2 3 4 5 6 7 8 9 CQC
ATT 9 8 7 6 5 4 3 2 1 2 3 4 5 6 7 8 9 TCF
ATT 9 8 7 6 5 4 3 2 1 2 3 4 5 6 7 8 9 MQS
ATT 9 8 7 6 5 4 3 2 1 2 3 4 5 6 7 8 9 PQA
CHF 9 8 7 6 5 4 3 2 1 2 3 4 5 6 7 8 9 CQC
CHF 9 8 7 6 5 4 3 2 1 2 3 4 5 6 7 8 9 TCF
CHF 9 8 7 6 5 4 3 2 1 2 3 4 5 6 7 8 9 MQS
CHF 9 8 7 6 5 4 3 2 1 2 3 4 5 6 7 8 9 PQA
CQC 9 8 7 6 5 4 3 2 1 2 3 4 5 6 7 8 9 TCF
CQC 9 8 7 6 5 4 3 2 1 2 3 4 5 6 7 8 9 MQS
CQC 9 8 7 6 5 4 3 2 1 2 3 4 5 6 7 8 9 PQA
TCF 9 8 7 6 5 4 3 2 1 2 3 4 5 6 7 8 9 MQS
TCF 9 8 7 6 5 4 3 2 1 2 3 4 5 6 7 8 9 PQA
MQS 9 8 7 6 5 4 3 2 1 2 3 4 5 6 7 8 9 PQA

298
Appendix C: The Prepared Questions for Interviews
Prepared Questions
(proposed for each strategy) Justification (why to be asked?)
Question 1.
A:
If “10” indicates highest level of efficiency and
“0” indicates lowest level of efficiency, how
efficient is your strategy of “X” in term of its
overall utilization of the available resources
(human, organizational, or technological resources,
which are required for its implementation)?
B:
And Why?
to obtain any information that is
supposed to be helpful to justify why
this strategy is taking more (or less)
than their need of resources
“why” is added to generate further
explanations
Question 2.
A:
With respect to strategy “X”, rank the three
types of resources (human, organizational, and
technological resources) in term of its utilization
of each type?
B:
And Why?
the previous question may not obtain
the required or completed justification,
or even for further details and
evidences.
“why” is added to generate further
explanations

299
Prepared Questions
(proposed for each strategy) Justification (why to be asked?)
Question 3.
A:
Based on your own perspective/experience, what
do you recommend for this strategy to be
successfully implemented?
B:
And Why?
Similar to the above.
Moreover, this open-ended question
will make the expert feel free to talk
more about the strategy.
“why” is added to generate further
explanations
300
Appendix D: Case Study Protocol
1. Phase 1: The Quantitative Phase
1.1 Selecting the case/company
1.2 Visiting the company
1.3 Selecting the most appropriate employees/experts from the Quality Department to be
involved.
1.4 Step 1: The ANP Analysis
1.4.1 Presenting the pair-wise comparisons between the three clusters (resources,
strategies, and ability to enhance quality) to the selected experts in a questionnaire
1.4.2 Providing a set of instructions to the participants/experts on how to conduct the
comparisons based on their own experience and distributing the questionnaire
1.4.3 Collecting the questionnaire
1.4.4 Analyzing the data using Super Decisions® (software)
1.4.5 Checking the Consistency Ratio (CR) for each pair-wise comparison for each
participant/expert
1.4.6 Aggregating the findings (averaging experts‟ results to represent the company‟s
overall finding)
301
1.4.6.1 Using Aggregating Individual Judgments (AIJ) if the preferred situation is
to consider that participants are combined and “behave like one” to represent
the opinion of the company
1.4.6.2 Using Aggregating Individual Priorities (AIP) if the preferred situation is
to consider that the participants “are each acting in his or her own right”
1.4.7 Analyzing ANP‟s findings to explore the differences between the needed resources
for each strategy and the actual support of resources towards each strategy
1.5 Step 2: GP Model
1.5.1 Developing the GP Model (ANP‟s Outputs to be GP‟s inputs)
1.5.1.1 Combining findings of RQ1 and RQ2 to formulate system constraints
1.5.1.2 Combining findings of RQ3 and RQ4 to formulate objective constraints
1.5.1.3 Determining the confections (hi, oi ,and ti) of each decision variable (H, O,
and T) in each objective constraint (each strategy, si)
1.5.2 Running the GP model using „QM for Windows®‟ (software) to determine di- and di
+
(Answering RQ5)
1.5.3 Developing the SQMI
1.6 Repeat Phase 1 for the second company
The end of the first phase
2. Phase 2: The Qualitative Phase

302
2.1 Re-visiting the first company
2.2 Selecting the interviewees
2.2.1 The involved experts in the first phase.
2.2.2 Involving other experts from different departments related to the Quality
Department for further explanations
2.3 Conducting the semi-structured interview with one of the experts
2.3.1 Asking the first prepared question for the semi-structured interview
2.3.2 Asking any unprepared questions during the answer for further explanations
2.3.3 Asking the second prepared question for the semi-structured interview
3.3.4 Asking any unprepared questions during the answer for further explanations
2.3.5 Asking the third prepared question for the semi-structured interview.
2.3.6 Asking any unprepared questions during the answer (for further explanations).
2.4 Repeating the semi-structured interview with individual expert from the first company
as described above
2.5 Re-visiting the second company
2.6 Conducting the semi-structured interviews in the second company as conducted in the
first company
2.7 Analyzing the qualitative findings
The end of the second phase
3. Interpreting quantitative and qualitative findings for both companies
Related Documents