Resource Adequacy Implications of Forthcoming EPA Air Quality Regulations December 2011

Welcome message from author
This document is posted to help you gain knowledge. Please leave a comment to let me know what you think about it! Share it to your friends and learn new things together.
Transcript
Resource Adequacy Implications of Forthcoming EPA Air Quality Regulations
December 2011

RESOURCE ADEQUACY IMPLICATIONS OF FORTHCOMING EPA AIR QUALITY REGULATIONS iii
Table of Contents
EXECUTIVE SUMMARY ............................................................................................................................... V
CHAPTER 1. INTRODUCTION ...................................................................................................................... 1
CHAPTER 2. ALIGNMENT OF POTENTIAL COMPLIANCE PATHWAYS WITH REGULATORY DEADLINES ......... 5
CHAPTER 3. RESOURCE ADEQUACY.......................................................................................................... 15
APPENDIX A: NERC REGIONS ................................................................................................................... 26
APPENDIX B. LOW NATURAL GAS PRICE CASES ........................................................................................ 27
APPENDIX C: RETROFIT COST ASSUMPTIONS ........................................................................................... 33
December 2010

iv RESOURCE ADEQUACY IMPLICATIONS OF FORTHCOMING EPA AIR QUALITY REGULATIONS

RESOURCE ADEQUACY IMPLICATIONS OF FORTHCOMING EPA AIR QUALITY REGULATIONS v
Executive Summary This report presents the results of an independent assessment by the U.S. Department of Energy (DOE) of the adequacy of U.S. electric generation resources under air pollution regulations being finalized by the U.S. Environmental Protection Agency (EPA). This report does not estimate the economic impacts of EPA regulations, nor does it provide detailed reliability assessments that planning authorities and other stakeholders will need to conduct to ensure deliverability of power and grid reliability during implementation of EPA rules.
This report considers two EPA regulations, the Cross-State Air Pollution Rule (CSAPR) and the Mercury and Air Toxics Standards (MATS), that are widely expected to have the greatest impact on the electric sector between now and 2015.1
In some cases, compliance with the new rules, particularly CSAPR, may be achieved through the use of existing controls, shifts in dispatch, purchase of allowances, and fuel switching. In other cases, compliance with new rules will require installation of new pollution controls and may motivate the construction of replacement generation, which can sometimes take multiple years to complete. Assuming prompt action by regulators and generators, the timelines associated with new construction and retrofit installations are generally comparable to EPA’s regulatory compliance timelines. If delays occur and if it is necessary to address localized reliability concerns, the Clean Air Act provides multiple mechanisms to extend these deadlines or bring sources into compliance over time on a plant-specific basis.
CSAPR creates multiple trading systems to control the emissions of NOx and SO2 from electric generators, and MATS imposes emissions rate standards on coal and oil-fired electric generators for mercury, acid gases and particulate matter. The trading systems for CSAPR begin in 2012, with the limits tightening for sources in some states in 2014. The first year of compliance for MATS is 2015, subject to potential extensions discussed in this report.
This report examines a Stringent Test Case, where, in addition to CSAPR requirements, each uncontrolled electric generator is required to install both a wet flue gas desulfurization (FGD) system and a fabric filter to reduce air toxics emissions. If such installations are not economically justified, this scenario assumes that the plant must retire by 2015. In reality, power plant owners will have multiple other technology options to comply with the regulations – options that typically cost less than installations of FGDs and fabric filters. Therefore, this scenario should not be viewed as an estimate of the expected impacts of CSAPR and MATS, but rather as a stress test used to bound resource adequacy implications of these rules under conservative assumptions. Specifically, this report focuses on whether, under the Stringent Test Case, there would be sufficient generation
1 Two other regulations, the Coal Combustion Residuals rule and the 316(b) Cooling Water Intake Structures rule, have been proposed, and the final rules may differ significantly from the proposed rules. New Source Performance Standards for greenhouse gases have not yet been proposed.

vi RESOURCE ADEQUACY IMPLICATIONS OF FORTHCOMING EPA AIR QUALITY REGULATIONS
capacity to meet electricity demand in each NERC region, before constraints on deliverability are considered.2
In the Stringent Test Case, a total of 29 GW of coal capacity would be retired by 2015 (21 GW over the Reference Case). DOE examined resource adequacy in this case compared to the planning reserve margins for each region. The analysis finds that target reserve margins can be met in all regions, even under these stringent assumptions. Moreover, in every region but one (TRE), no additional new capacity is needed to ensure resource adequacy in the Stringent Test Case beyond what is projected in the Reference Case. In TRE, the analysis finds that less than 1 GW of new natural gas capacity would be needed by 2015 beyond the additions already projected to occur in the Reference Case. This analysis also finds that the total amount of new capacity that would be added by 2015 is less than the amount that is already under development, only some of which is reflected in the Reference Case.
This is known as resource adequacy, and it is one determinant of grid reliability.
DOE’s analysis also considered impacts on available generation capacity of plant outages due to pollution control retrofit activity. Once construction of a new pollution control system is completed, a plant will pause operations for a short period as the system is connected or tied-in to the plant. For fabric filters, this has typically been accomplished during planned outages for routine maintenance that often last about one month, and the tie-in period for FGDs may extend for a few weeks beyond this typical period for maintenance outages. These planned outages are generally scheduled for the fall and spring seasons when electricity demand is well below peak. In the Stringent Test Case, taking into account projected capacity additions, DOE found that resources would be sufficient in all regions even when outages to tie-in pollution control retrofits were incorporated.
While the Stringent Test Case examined by DOE indicates that resource adequacy would not be compromised under CSAPR and MATS, retirements of power plants or other factors could lead to grid reliability challenges in some cases. Federal and state governments can use available regulatory and planning tools to address such reliability concerns as needed on a case-by-case basis. DOE is committed to providing technical assistance and working with stakeholders to ensure that the electric grid remains reliable as we strive to modernize the power sector.
In summary, this report concludes:
• Assuming prompt action by regulators and generators, the timelines associated with the construction of new generation capacity and installation of pollution control retrofits would generally be comparable to EPA’s regulatory compliance timelines.
• A Stringent Test Case more conservative than the anticipated implementation of CSAPR and the proposed MATS rule showed the overall supply-demand balance for electric power in each region examined would be adequate; however, further iterative analysis will be warranted to assess local reliability considerations as the rules are implemented.
2 NERC is the North American Electric Reliability Corporation. See Appendix A of this report for a map of NERC regions. See the technical supplement to the introduction of this report for limitations of this analysis and restrictions on its interpretation.

RESOURCE ADEQUACY IMPLICATIONS OF FORTHCOMING EPA AIR QUALITY REGULATIONS vii
• Mechanisms exist to address such reliability concerns or other extenuating
circumstances on a plant-specific or more local basis, and the Department of Energy is willing to provide technical assistance throughout this process.


RESOURCE ADEQUACY IMPLICATIONS OF FORTHCOMING EPA AIR QUALITY REGULATIONS 1
Chapter 1. Introduction The U.S. Environmental Protection Agency (EPA) has finalized or is in the process of finalizing several rules that will regulate a variety of environmental pollutants produced by power plants in the United States. Congress assigned authority to promulgate the rules to EPA, which must meet statutory deadlines and in some cases court-ordered deadlines.
This report considers two key EPA regulations, the Cross-State Air Pollution Rule (CSAPR) and the Mercury and Air Toxics Standards (MATS), that are widely expected to have the greatest impact on the electric sector between now and 2015.3
Compliance with new rules will require installation of new pollution controls on some plants and may motivate the construction of replacement generation, which can sometimes take multiple years to complete. Assuming prompt action by regulators and generators, the timelines associated with new construction and retrofit installations are generally comparable to EPA’s regulatory compliance timelines. If delays occur and if it is necessary to address localized reliability concerns, the Clean Air Act provides multiple mechanisms to extend these deadlines or bring sources into compliance over time on a plant-specific basis.
CSAPR creates multiple trading systems to control the emissions of NOx and SO2 from electric generators, and MATS imposes emissions rate standards on coal and oil-fired electric generators for mercury, acid gases and particulate matter. The trading systems for CSAPR begin in 2012, with the limits tightening for sources in some states in 2014. The first year of compliance for MATS is 2015, subject to potential extensions discussed in this report.
Beyond questions of timing, this report considers the issue of resource adequacy. Resource adequacy is the aspect of grid reliability that examines whether there is sufficient electricity generation capacity to meet demand before constraints on deliverability are considered. This report highlights several findings related to resource adequacy that would be valid under many alternative compliance pathways available to industry, and the analysis is intended to inform a broader discussion about how to manage the electric power sector’s response to new pollution rules. Since the scenario examined in this analysis is more conservative than the anticipated response to CSAPR and MATS, results of this analysis should not be viewed as an estimate of the expected impacts of any final or forthcoming EPA rules or combination of rules.
Resource adequacy is one necessary component of grid reliability, and it can be evaluated for a relatively broad region. However, it does not ensure delivery of power to end use consumers or the ability to recover from events such as the unexpected loss of a generator or transmission line. These aspects of grid reliability depend on transmission adequacy and provision of other ancillary services, which depend strongly on the local details of the electric power system. This report does not
3 Two other regulations, the Coal Combustion Residuals rule and the 316(b) Cooling Water Intake Structures rule, have been proposed, and the final rules may differ significantly from the proposed rules. New Source Performance Standards for greenhouse gases have not yet been proposed.
2 RESOURCE ADEQUACY IMPLICATIONS OF FORTHCOMING EPA AIR QUALITY REGULATIONS
attempt to identify or assess any aspect of reliability beyond resource adequacy.4
In summary, this report concludes:
However, several flexibility mechanisms provide tools to federal and state governments and other stakeholders to manage local reliability challenges that may arise after more detailed analysis is conducted. The U.S. Department of Energy (DOE) recognizes the role that regional transmission organizations (RTOs), independent system operators (ISOs), state public utility commissions (PUCs) and others will have in conducting and reviewing these detailed analyses.
• Assuming prompt action by regulators and generators, the timelines associated with the construction of new generation capacity and installation of pollution control retrofits would generally be comparable to EPA’s regulatory compliance timelines.
• A Stringent Test Case more conservative than the anticipated implementation of CSAPR and the proposed MATS rule showed the overall supply-demand balance for electric power in each region examined would be adequate; however, further iterative analysis will be warranted to assess local reliability considerations as the rules are implemented.
• Mechanisms exist to address such reliability concerns or other extenuating circumstances on a plant-specific or more local basis, and the Department of Energy is willing to provide technical assistance throughout this process.
The remainder of this report is divided into two sections. Section 2 provides an overview of EPA’s regulatory timeline and describes how various potential compliance pathways align with this timeline. Section 3 uses a version of the National Energy Modeling System (PI-NEMS)5
1.1 Technical Supplement
to explore resource adequacy implications of a test case in which potential future plant retirements, additions and pollution control retrofits are considered. The following technical supplement to this introduction is intended to describe the limitations of this analysis, recommended restrictions on its interpretation and the steps that could be taken to address those limitations or expand this analysis in the future.
The primary purpose of this report is to examine, for each North American Electric Reliability Corporation (NERC) region in the U.S. (see Appendix A of this report for a map), how the volume of retirements and pollution control installations prompted by constraints more strict than CSAPR and MATS requirements would affect the planning reserve margins and available capacity for that region. Two main cases were developed in this study: A Reference Case and a Stringent Test Case. For each of these cases, a low natural gas price sensitivity version was also considered. The resulting four cases were modeled using a version of the National Energy Modeling System (PI-NEMS) based
4 See technical supplement below for a discussion of the limitations of this analysis and restrictions on its interpretation. 5 The version of NEMS utilized in this report has been run by OnLocation, Inc. with input assumptions determined by DOE. Since this analysis was commissioned by DOE’s Office of Policy and International Affairs (PI) and uses a version of NEMS that differs from the one used by the U.S. Energy Information Administration (EIA), the model is referred throughout the document as PI-NEMS. The results described in this report do not necessarily represent the views of EIA.

RESOURCE ADEQUACY IMPLICATIONS OF FORTHCOMING EPA AIR QUALITY REGULATIONS 3
on EIA’s 2011 Annual Energy Outlook.6
The following limitations of PI-NEMS are most relevant for the interpretation of resource adequacy results:
These cases are not intended to capture the full set of possible outcomes related to resource adequacy under the implementation of EPA rules. However, the adoption of conservative assumptions implies that results of this study likely overstate required compliance actions by the utility sector and that the qualitative conclusions about resource adequacy in 2015 would not change under many other potential scenarios.
• The electric sector in PI-NEMS is modeled as 22 distinct regions. All electricity generated in or imported into a given region is assumed to be deliverable within that region, with explicit costs associated with that delivery. In other words, there are no transmission constraints within a given region, and flows of power between regions are constrained by a simple pipe flow representation of existing transmission capacity, with potential to build new transmission capacity between regions when it is economically justified.
• Natural gas is assumed to be deliverable where it is needed for generation, and the delivered cost varies by region.
These limitations imply that statements about resource adequacy should not be interpreted to imply that electric power or natural gas is deliverable within a given region, even when supply is adequate. Local studies will need to be undertaken to assess deliverability when appropriate. In addition, planning margins are one of several metrics available to evaluate resource adequacy. More focused studies could be carried out, when appropriate, using deterministic methods similar to the ones employed here or using alternative stochastic methods.
The following types of analyses could be performed in the future to examine other aspects of grid reliability beyond those examined here:
• Stochastic evaluation of resource adequacy (e.g., to evaluate loss of load probability)
• Transmission adequacy analysis using (DC power flow) production cost models with explicit representation of the full transmission system
• Static and/or dynamic AC power flow analysis to evaluate reactive power support, system stability, etc.
• Survey of plants providing relevant ancillary services in a given area
Many of these analyses require knowledge of the actual units being removed or added to the system, including specification of their location and connection to the transmission network, as well as an explicit representation of the overall system topology. Therefore, these analyses are most appropriate to conduct on a more localized basis, once particular units are identified for retirement, extended maintenance or new construction.
6 Specific modeling assumptions related to the cases are described in Section 3 of this report.

4 RESOURCE ADEQUACY IMPLICATIONS OF FORTHCOMING EPA AIR QUALITY REGULATIONS

RESOURCE ADEQUACY IMPLICATIONS OF FORTHCOMING EPA AIR QUALITY REGULATIONS 5
Chapter 2. Alignment of potential compliance pathways with regulatory deadlines This section gives an overview of the requirements and regulatory deadlines associated with two key EPA air quality rules. It then discusses the main compliance options available to generator owners to satisfy these requirements and evaluates the alignment between implementation timelines and regulatory deadlines.
2.1 Regulatory deadlines This analysis considers two major EPA power sector regulations that will have been finalized by the end of this year, namely the final Cross-State Air Pollution Rule (CSAPR) and the proposed Mercury and Air Toxics Standards (MATS).7 Two others, the Cooling Water Intake Structures Rule and the Coal Combustion Residuals Rule, are not examined here, as the details for their final requirements and implementation timelines are more uncertain.8
The Cross-State Air Pollution Rule was finalized in July 2011, and a proposed update was issued in October 2011. This rule was issued in response to a court order remanding the Clean Air Interstate Rule (CAIR). CSAPR puts in place four regional trading programs that set emissions limits for SO2 and NOx in 27 states.
EPA is also expected to release proposed New Source Performance Standards (NSPS) for greenhouse gas emissions from new power plants in coming months, but it is not possible to evaluate their impact at least until proposed rules with clear compliance options are offered by EPA for consideration. This study recognizes the significance of regulatory uncertainty in contemporary decision-making, and as discussed in Section 3.1, it includes a conservative investment payback requirement as a rough proxy for that uncertainty.
9
7 Both of these regulations are being promulgated by EPA under the Clean Air Act Amendments of 1990.
EPA issued a Supplemental Notice of Proposed Rulemaking to include six states in the seasonal NOx program (all but one are covered under another aspect of the program). SO2 and NOx are both precursors to particulate pollution, and NOx is also a precursor to ozone pollution. Both particulate and ozone pollution contribute to premature deaths, non-fatal heart attacks, aggravated
8 As proposed, the Cooling Water Intake Structures Regulations (under section 316(b) of the Clean Water Act) would require that cooling water intake structures reflect the best technology available for minimizing adverse environmental impact. Affected power plants would have to demonstrate compliance with a national impingement requirement and work with state and federal permitting authorities to address entrainment on a site-specific basis addressing factors detailed in the proposed regulations. EPA proposed a rule in March 2011 and is under a settlement agreement to issue a final rule by July 2012. Coal Combustion Residuals (CCR) rules proposed in June 2010 under the Resource Conservation and Recovery Act (RCRA) would regulate the handling of CCRs (such as coal ash) from their generation at power plants to final disposal. Depending on whether EPA classifies CCRs as RCRA Subtitle D waste or RCRA Subtitle C special waste, compliance could be required within six months after the final rule or several years later after states adopt the federal regulation, respectively. EPA does not face a legal requirement to issue a final rule by a specific deadline. For information about 316(b), see Federal Register Volume 76, Number 76 (Wednesday, April 20, 2011) pages 22174-22288. For information about CCR, see EPA, “Hazardous and Solid Waste Management System; Identification and Listing of Special Wastes; Disposal of Coal Combustion Residuals from Electric Utilities; Proposed Rule” 2011. 9 The four regional programs cover annual NOX emissions as well as ozone season NOX emissions and SO2 emissions from two separate groups of states.

6 RESOURCE ADEQUACY IMPLICATIONS OF FORTHCOMING EPA AIR QUALITY REGULATIONS
asthma attacks and acute bronchitis. EPA estimates the annualized social costs of CSAPR to be $0.8 billion and the annualized monetized social benefits to be $110-280 billion in 2014.10
The Mercury and Air Toxics Standards were proposed in March 2011, and EPA is under a court order to finalize the rule by December 16, 2011. MATS would set limits on emissions of mercury and acid gases, and it would reduce heavy metals and other toxic chemicals by limiting particulate matter. Mercury causes nerve and brain damage in children and other vulnerable populations. Acid gases cause lung damage and contribute to asthma and other respiratory diseases. Other toxic chemicals controlled by the rule such as arsenic and chromium can cause cancer. EPA estimates the annualized social costs of the proposed MATS rule to be $10.9 billion and the annualized monetized social benefits to be $53-140 billion in 2016.
11
CSAPR requires fossil fuel fired generators to demonstrate compliance annually. Requirements begin on January 1, 2012 and tighten in certain states in 2014. Starting in March 2013 and annually thereafter, sources must demonstrate compliance by submitting emissions allowances for each ton of regulated pollutants emitted in the previous year. MATS has a statutory compliance deadline of January 2015, subject to the flexibilities described in this report, after which coal and oil-fired generators must meet emissions limits for the pollutants described above.
2.2 Potential compliance pathways Some existing generation facilities already have sufficient pollution controls to ensure compliance with CSAPR and MATS. Electric generating units not already in compliance with new rules will have a variety of options available to them. Owners will typically choose among available options to comply with the requirements in the most cost-effective way. Given the compliance deadlines associated with CSAPR and MATS and the wide applicability of MATS to the generating fleet, the remainder of this section focuses on these rules.
Available compliance options for CSAPR and MATS may include:
• Use of existing controls: Some plants could increase utilization of existing pollution control technologies. Increasing utilization rates can decrease emissions.
10 All estimates are in 2007 dollars. The range in social benefits reflects the use of alternate discount rates (3% and 7%) and alternate studies for PM-related mortality. Social costs were also valued at the alternate discount rates, but the estimate is unchanged at this level of rounding. EPA “Regulatory Impact Analysis for the Federal Implementation Plans to Reduce Interstate Transport of Fine Particulate Matter and Ozone in 27 States; Correction of SIP Approvals for 22 States” June 2011. 11 All estimates are in 2007 dollars. The range in social benefits reflects the use of alternate discount rates (3% and 7%) and alternate studies for PM-related mortality. Social costs were also valued at the alternate discount rates, but the estimate is unchanged at this level of rounding. EPA “Regulatory Impact Analysis of the Proposed Toxics Rule” March 2011.

RESOURCE ADEQUACY IMPLICATIONS OF FORTHCOMING EPA AIR QUALITY REGULATIONS 7
• Shifts in dispatch (relevant to CSAPR only): Individual plants could comply with CSAPR by decreasing generation since compliance is based on total annual emissions.12
• Purchase of allowances (relevant to CSAPR only): Plant owners could purchase emissions allowances from other sources that emit less than their individual limits, in such a way that the total system-wide emissions caps would be maintained.
Other, cleaner plants could increase generation in order to meet electricity demand.
13
• Fuel switching: Some plants could switch to fuels with a lower pollutant content (such as low-sulfur and low-chlorine coals to comply with CSAPR and MATS respectively). Fuel switching (re-powering) to natural gas could also be possible.
• Retrofitting units with pollution controls: Existing generating units could deploy new pollution control equipment to reduce emissions. In some cases, existing controls could be upgraded to provide the necessary emissions reductions.
• Retiring uneconomic units: Existing generating units could be retired rather than improved to comply with the rules. Where replacement capacity would be needed, new generating units that meet environmental requirements could be added to the system or demand side measures could be implemented in order to meet expected electricity demand.
The first three options, where applicable, can be undertaken rapidly. Often, fuel switching between coals can also be done quickly. These four options are expected to be the main near-term compliance pathways for CSAPR, whose initial compliance deadlines precede those of MATS. Three remaining categories of options include repowering a plant with natural gas, retrofitting, and retiring a plant altogether. The remainder of this section focuses on the timelines associated with these options.
Table 1 lists technology options to control different pollutants regulated by CSAPR and MATS, as well as other potential measures available to comply with these rules. Typically, several options are available to control any given pollutant, and many control technologies can be used to facilitate compliance with multiple requirements. For example, a wet Flue Gas Desulfurization (FGD) system can facilitate compliance with both CSAPR and MATS by controlling SO2 and acid gases. As a result of such co-benefits, the number of potentially available pathways to comply with CSAPR and MATS is large.
12 MATS will require power plants to meet emissions rate standards, so this option is not generally relevant. However, power plants with multiple generating units may be able to shift generation between units to enable the entire plant to meet the standards under certain circumstances. 13 In addition, allowances can be banked for future use, so it is also possible to over-comply and accumulate allowances early in the program for use in subsequent compliance periods.

8 RESOURCE ADEQUACY IMPLICATIONS OF FORTHCOMING EPA AIR QUALITY REGULATIONS
Table 1: Retrofit control technologies and other potential measures available for compliance with CSAPR and MATS
Pollution control equipment will take time to install. Figure 1 shows estimated ranges for pollution control build times based on past experience from various sources for a variety of technologies. Excluding any necessary regulatory approvals, these technologies should generally require fewer than four years for combined design, construction and start-up, and, in most cases, the amount of time required should be significantly shorter.

RESOURCE ADEQUACY IMPLICATIONS OF FORTHCOMING EPA AIR QUALITY REGULATIONS 9
Figure 1: Estimated range of combined design, construction and start-up times for pollution control retrofit installations14
All plants installing pollution controls will require construction permits and may require modifications to existing Title V operating permits. In addition, owners of plants in regulated markets may require approval from the relevant public utility commission (PUC) to recover the costs of the retrofits through rates. While some of these additional requirements and approvals may be pursued simultaneously with design, construction and start-up activities, they may collectively extend completion times. For context,
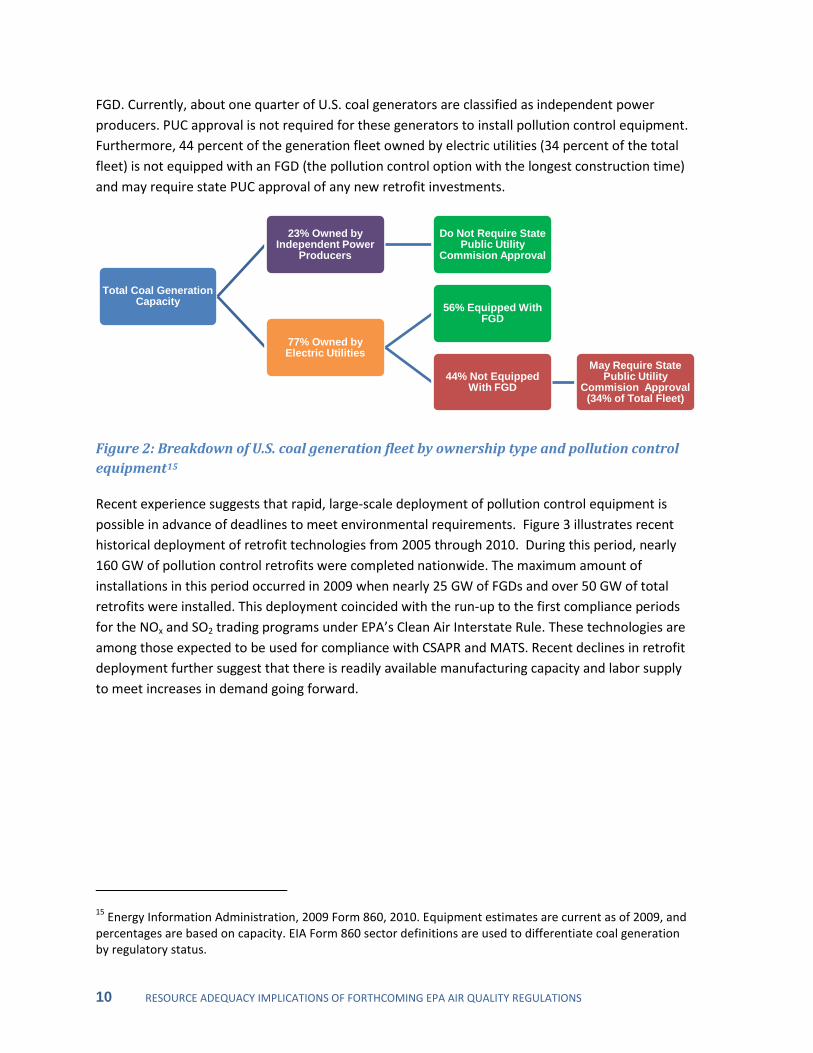
Figure 2 provides a breakdown of the U.S. coal generation fleet by ownership and whether or not a generator owned by an electric utility is equipped with an
14 These estimates assume all installations are for a single generating unit. Design, construction and start-up times could take longer if a single device is installed to control pollution from multiple generating units. Ranges do not include any potentially necessary public utility commission approval, selection of vendors or permitting and assume sufficient materials and labor are readily available. Sources: URS Corp. “Assessment of Technology Options Available to Achieve Reductions of Hazardous Air Pollutants” 2011; EPA “Engineering and Economic Factors Affecting the Installation of Control Technologies for Multi-pollutant Strategies” 2002; Utility Air Regulatory Group “Implementation Schedules For Selective Catalytic Reduction (SCR) and Flue Gas Desulfurization (FGD) Process Equipment” 2010.
10 RESOURCE ADEQUACY IMPLICATIONS OF FORTHCOMING EPA AIR QUALITY REGULATIONS
FGD. Currently, about one quarter of U.S. coal generators are classified as independent power producers. PUC approval is not required for these generators to install pollution control equipment. Furthermore, 44 percent of the generation fleet owned by electric utilities (34 percent of the total fleet) is not equipped with an FGD (the pollution control option with the longest construction time) and may require state PUC approval of any new retrofit investments.
Figure 2: Breakdown of U.S. coal generation fleet by ownership type and pollution control equipment15
Recent experience suggests that rapid, large-scale deployment of pollution control equipment is possible in advance of deadlines to meet environmental requirements.
Figure 3 illustrates recent historical deployment of retrofit technologies from 2005 through 2010. During this period, nearly 160 GW of pollution control retrofits were completed nationwide. The maximum amount of installations in this period occurred in 2009 when nearly 25 GW of FGDs and over 50 GW of total retrofits were installed. This deployment coincided with the run-up to the first compliance periods for the NOx and SO2 trading programs under EPA’s Clean Air Interstate Rule. These technologies are among those expected to be used for compliance with CSAPR and MATS. Recent declines in retrofit deployment further suggest that there is readily available manufacturing capacity and labor supply to meet increases in demand going forward.
15 Energy Information Administration, 2009 Form 860, 2010. Equipment estimates are current as of 2009, and percentages are based on capacity. EIA Form 860 sector definitions are used to differentiate coal generation by regulatory status.
Total Coal Generation Capacity
23% Owned by Independent Power
Producers
Do Not Require State Public Utility
Commision Approval
77% Owned by Electric Utilities
56% Equipped With FGD
44% Not Equipped With FGD
May Require State Public Utility
Commision Approval (34% of Total Fleet)

RESOURCE ADEQUACY IMPLICATIONS OF FORTHCOMING EPA AIR QUALITY REGULATIONS 11
Figure 3: Coal capacity receiving air pollution controls by in-service year, 2005-201016
Even though several retrofit options may be available to comply with the rules, it may not be profitable to install controls on some generating units. In these instances, owners may seek to repower those units with natural gas or retire them. Switching from coal to natural gas would likely require more time than switching between types of coals due to plant modifications and the potential need for new natural gas pipeline infrastructure. Even taking this into account, fuel switching to natural gas could be faster than construction of a new natural gas plant, which might be undertaken to replace the capacity of a unit to be retired. While individual plants can sometimes be retired without adverse impacts on electric system reliability, in some cases, new replacement generation or transmission capacity might be needed. Excluding time for any required regulatory approvals, some natural gas capacity (combustion turbines) could be built in as little as one year, while the construction of new baseload combined cycle natural gas power plants could take from two to four years. Expansion of the natural gas pipeline system to accommodate new natural gas-fired units can generally be undertaken in parallel to new plant construction and also typically takes between two and four years. New electric transmission lines could take significantly longer.
2.3 Relationship between potential compliance pathways and regulatory deadlines For CSAPR, plant owners have the option to purchase allowances (once a liquid allowance market is established) or to use banked allowances from previous years within each pollution control program to comply in the most cost-effective manner. Along with the flexibility provided by other non-build options such as fuel switching, greater use of existing controls and shifts in the dispatch of generators, this flexibility to trade allowances is expected to help facilitate compliance with CSAPR by the regulatory deadlines without the need for rapid fleet-wide investment in pollution control retrofits. Over the long-term, as requirements tighten, installation of additional environmental controls could be undertaken to maintain compliance with CSAPR.
16 EIA 2009 Form 860, 2010 (scrubbers and particulate controls), EPA NEEDS Database 4.1, 2011 (ACI and NOx controls). 2010 values are planned installations.

12 RESOURCE ADEQUACY IMPLICATIONS OF FORTHCOMING EPA AIR QUALITY REGULATIONS
MATS compliance will require use of additional options. Figure 3 provides a timeline for installation of pollution controls and construction of new generation capacity in relation to the compliance deadline for MATS. Assuming prompt action by plant owners, permitting authorities and (where applicable) public utility commissions, the anticipated completion times for new pollution controls and new generation capacity additions are generally comparable to the compliance period for MATS. Moreover, this figure omits other options such as fuel switching or greater use of existing controls that may facilitate compliance in some cases, and it does not include non-build options such as demand response or energy efficiency programs that might be deployed quickly to help maintain adequate resources when plants retire.
Figure 4: Retrofit and new build timelines in relation to EPA statutory deadline for the MATS rule and potential compliance extensions17
17 Independent power producers will be able to initiate compliance strategies as soon as the MATS rule is finalized, if not before. Owners of plants in regulated markets may need to acquire PUC approval before moving forward with major investments, which may delay the start time for the installation of retrofits and/or generation. A survey of over 100 recent coal plant pollution control retrofit approvals before PUCs in ten states found that the average approval time across all cases was 6.3 months. Less than 6 percent of all cases took more than one year. See: M.J. Bradley & Associates prepared for SRA International, Inc. "Public Utility Commission Study," 2011. The figure shows an illustrative case in which construction begins six months after rule finalization. Sources: URS Corp. “Assessment of Technology Options Available to Achieve Reductions of Hazardous Air Pollutants” 2011; EPA “Engineering and Economic Factors Affecting the Installation of Control Technologies for Multi-pollutant Strategies” 2002; Utility Air Regulatory Group “Implementation Schedules For Selective Catalytic Reduction (SCR) and Flue Gas Desulfurization (FGD) Process Equipment” 2010; Energy Information Administration “Assumptions to the Annual Energy Outlook” 2011; Letters to Southern Company from Transco Natural Gas and Southern Natural Gas 2011; Survey of state and industry natural gas plant construction data by Energetics Inc. 2011, Industry Expert Communication 2011.
2011 2012 2013 2014 2015 2016 2017
Typical build times for pollution controls on existing capacity
Typical build times for new capacity to replace retired units
Fabric Filter
Wet FGD
ACI
DSI
Low-end build time
High-end build time
Combustion Turbine
Statutory MATS Compliance
Deadline
Combined Cycle Natural GasNatural Gas Pipeline Expansion
One year case-by-case extension
Additional flexibility options
MATS Rule Finalized
Illustrative PUC approval and permitting –Independent Power Producers could start immediately
Dry FGD

RESOURCE ADEQUACY IMPLICATIONS OF FORTHCOMING EPA AIR QUALITY REGULATIONS 13
Nonetheless, there are likely to be circumstances where delays in PUC approval, permitting or construction push the completion date of a project beyond the 2015 compliance deadline. In such cases, there are multiple flexibility mechanisms available on a plant-specific basis to facilitate compliance. Specifically, Section 112(i)(3)(B) of the Clean Air Act (CAA) allows the EPA or the relevant permitting authority (e.g., a state environmental protection agency) to extend the MATS compliance deadline by an additional year to allow time for the installation of environmental controls. In addition to this one-year extension for compliance with MATS, other flexibility options are available to provide extra time on a plant-specific basis.18
Therefore, existing units that choose to retrofit in order to comply with MATS should have sufficient time to do so if industry and state regulatory authorities act swiftly and responsibly, even in instances where completion of a project takes longer than anticipated. Similarly, given timely notification of an intention to retire existing capacity
19
18 These options could include administrative orders under Section 113(a)(4) of the CAA (providing up to one additional year for compliance), negotiated Consent Decrees with the appropriate concurrences from the Department of Justice and the courts, or the flexibility provided by Section 112(i)(4) of the CAA.
, these same flexibility mechanisms might be used to align the timing of retirements of reliability-critical units with new capacity additions.
19 Current notification lead time to an Independent System Operator is approximately 90-120 days, which could be timely enough to identify a specific reliability standard that could be violated yet not long enough to resolve the issue. Such a case would be a candidate for use of one of the flexibility mechanisms.

14 RESOURCE ADEQUACY IMPLICATIONS OF FORTHCOMING EPA AIR QUALITY REGULATIONS

RESOURCE ADEQUACY IMPLICATIONS OF FORTHCOMING EPA AIR QUALITY REGULATIONS 15
Chapter 3. Resource adequacy This section examines an illustrative, stringent scenario to “stress test” one aspect of grid reliability – resource adequacy. Resource adequacy means that there are sufficient resources, in the form of available generation and demand response capacity, to meet peak electricity demand (and by extension, demand in all other hours of the year) in a given region, before constraints on deliverability are considered. Peak demand usually occurs in the afternoon during the heat of the summer months, although in some regions it can occur in other seasons. The difference between available capacity and normal peak demand is called the planning reserve margin, which is usually expressed as a percentage over normal peak demand.20
Although the North American Electric Reliability Corporation (NERC) assigns a default reserve margin of 15% for most regions
21, each region may adopt a standard with a different value. A common standard in electricity system planning is that resources should be sufficient to yield less than one day in ten years of unmet electricity demand22
EPA regulations can affect resource adequacy in two ways. First, they can lead to some additional retirements of existing generation capacity (typically coal-fired or simple cycle oil/natural gas steam capacity) beyond the retirements that would have occurred in the absence of new power sector regulations. Depending on the number and location of these retirements (including the retirements that would have occurred absent new regulations), there might be a need for new capacity in order to maintain planning reserve margins above the target for a specific region. Second, EPA regulations will motivate owners of many of the plants that do not retire to install pollution control equipment. Once construction of this equipment is complete, plants may have to pause generation for a short time to “tie-in” the controls. Whenever possible, these tie-ins are undertaken during or near routine planned maintenance outages and are not scheduled during peak load periods. In the case of certain installations, however, the tie-in period may extend for a few weeks beyond standard maintenance outages, reducing the available capacity to meet demand during those off-peak periods.
, and each region may apply such a standard to calculate a target for its planning reserve margin based on its resource mix. This report does not analyze other aspects of grid reliability that must be analyzed locally, such as transmission adequacy, voltage support and system stability.
23
To test the potential resource adequacy implications of new EPA rules, this report uses a version of the National Energy Modeling System (PI-NEMS) to examine two stringent scenarios. Planning
20 Intermittent resources such as wind and solar are discounted in this calculation, since they may not be available at the time of peak demand. 21 NERC assigns a default standard of 10% to regions with predominantly hydroelectric sources of generation. 22 See, for example, North American Electric Reliability Corporation, “Resource and Transmission Adequacy Recommendations” 2004. 23 See section 2.2.9 of Utility Air Regulatory Group, “Implementation Schedules for Selective Catalytic Reduction (SCR) and Flue Gas Desulfurization (FGD) Process Equipment” 2010. See section 2.2.9

16 RESOURCE ADEQUACY IMPLICATIONS OF FORTHCOMING EPA AIR QUALITY REGULATIONS
reserve margins are calculated for each NERC region in the U.S.24
3.1 Modeling assumptions
Results from these scenarios suggest that resource adequacy can be maintained in each NERC region in the U.S. under conservative assumptions about available compliance options, as long as some new capacity can be built before 2015 beyond that which is already planned.
This analysis consists of a comparison, conducted in PI-NEMS,25
Table 2
between a Reference Case that does not include CSAPR or MATS and a Stringent Test Case that includes constraints that are deliberately designed to be more conservative (in the sense of offering fewer compliance options and therefore driving greater retirements) than the CSAPR and MATS rules. The specific assumptions associated with these cases are provided in . The results from the low natural gas price (high natural gas supply) cases are discussed in Appendix B to this report.
24 See Appendix A for a map of the NERC regions. PI-NEMS represents the electric power sector using 22 regions, which combine in groups to form the eight main NERC regions in the U.S. 25 NEMS is a product of the U.S. Energy Information Administration (EIA), which uses it to issue its yearly Annual Energy Outlook as well as to evaluate the impacts of proposed policies. According to EIA, “NEMS projects the production, imports, conversion, consumption, and prices of energy, subject to assumptions on macroeconomic and financial factors, world energy markets, resource availability and costs, behavioral and technological choice criteria, cost and performance characteristics of energy technologies, and demographics.” Documentation for NEMS can be found on the website of EIA: http://www.eia.gov/forecasts/aeo/. As stated earlier, PI-NEMS refers to the version used in this report, and results expressed here should not be assumed to represent the views of EIA.

RESOURCE ADEQUACY IMPLICATIONS OF FORTHCOMING EPA AIR QUALITY REGULATIONS 17
Table 2: Descriptions of cases examined in PI-NEMS
Case Description
Reference Case Modified26
• Fabric Filter and ACI costs are increased to mirror EPA assumptions.
version of published AEO 2011 Reference Case with the following substantive changes:
27
• Construction and operation of unplanned
28
The existing CAIR rule is included and does not expire.
natural gas combustion turbines and combined cycle units are delayed until 2013 and 2014, respectively, reflecting the construction times associated with these technologies.
Stringent Test Case Identical to the Reference Case with the following additional constraints:
• CSAPR SO2, annual NOx and seasonal NOx limits29
• 90% mercury reduction requirement is imposed in 2015.
are in place in 2012 with variability limits starting in 2014 only for SO2. The SO2 control groups 1 and 2 are treated as a single trading market due to the regionality of PI-NEMS.
• All unscrubbed coal units must retrofit with a wet FGD or retire by 2015.
• All units not already equipped with a fabric filter must install one or retire by 2015.
• All pollution control capital retrofit technology costs must be paid back over 10 years.
Low Natural Gas Price Reference Case
Identical to the Reference Case above, except that the natural gas supply follows EIA’s “High Shale EUR” side case. This increases the amount of shale gas recovered in each well and effectively lowers natural gas prices at any given quantity.
Low Natural Gas Price Stringent Test Case
Identical to the Stringent Test Case above, except that the natural gas supply follows EIA’s “High Shale EUR” side case.
26 The major difference is that the logic associated with interregional capacity transfers has been modified so that the transfer capacity is reflected in the supply/demand balance of importing regions. 27 See Appendix C for a table of retrofit costs for representative plants. 28 Unplanned units refer to power plants built based on economic decisions made within the model, as opposed to planned units, which are those reported to EIA as being under construction as of December 31, 2009 as well as an additional 4.3 GW of renewable capacity included in the reference case by EIA. 29 These are the limits in the proposed update to the CSAPR rule in October 2011. States covered under EPA Supplemental Notice of Proposed Rulemaking are included in the seasonal NOX program.

18 RESOURCE ADEQUACY IMPLICATIONS OF FORTHCOMING EPA AIR QUALITY REGULATIONS
The Stringent Test Cases in this analysis should not be viewed as estimates of the expected impacts of CSAPR and MATS, but rather as illustrative, stringent cases used to bound resource adequacy implications. In particular, while the assumptions in the Stringent Test Cases result in a power system that would satisfy the environmental requirements of CSAPR and MATS, several other compliance options such as DSI or upgraded ESPs are not included in these scenarios. Such compliance options are commercially available, and in technically feasible situations, they will be more economically attractive than the options allowed in the Stringent Test Case. As fabric filters and wet FGDs are both more time- and capital-intensive than these alternative options, the scenario examined here is intended to be a stress test for resource adequacy, as the electric sector complies with the CSAPR and MATS rules. The inclusion of a 10-year investment payback requirement on pollution control retrofits is 10 years less than the default payback assumed in the Annual Energy Outlook30 and significantly less than the typical payback requirements assumed in other studies of the electricity system impacts of EPA rules.31
3.2 Modeled capacity retirements and retrofits
This assumption adds an additional level of conservatism and acts as a rough proxy for future regulatory uncertainty, including other forthcoming rules.
Figure 5 shows the cumulative retirements of coal plant capacity in the Reference and Stringent Test Cases. The amount of capacity attributed to the additional constraints nationally in 2015 is the difference between the amount in the Reference Case and the amount in the Stringent Test Case in that year, namely 21 GW. While the total number of modeled retirements is slightly higher in 2020, the difference remains at 21 GW (not shown). As discussed in Appendix B to this report, natural gas prices can have a significant impact on the number of coal and oil-fired plant retirements.
30 EIA, “Annual Energy Outlook, 2011” 2010. See page 48. 31 For example, see EPA-IPM v4.10 documentation, http://www.epa.gov/airmarkets/progsregs/epa-ipm/BaseCasev410.html; “2010 Special Reliability Scenario Assessment: Resource Adequacy Impacts of Potential U.S. Environmental Regulations”, NERC, October 2010. http://www.nerc.com/files/EPA_Scenario_Final.pdf; “Staying Power: Can US Coal Plants Dodge Retirement for Another Decade?”, IHS CERA, April 2011. http://www.ihs.com/products/cera/energy-report.aspx?id=1065929313; “Potential Impacts of Environmental Regulation on the U.S. Generation Fleet “, EEI, January 2011. With the exception of assumptions for independent power producers made by IHC CERA (10 years) and plants with a capacity factor below 35 percent made by NERC, these studies typically assumed pay back periods between 20 and 30 years and always greater than 10 years.

RESOURCE ADEQUACY IMPLICATIONS OF FORTHCOMING EPA AIR QUALITY REGULATIONS 19
Figure 5: Cumulative coal retirements by NERC region, 2011-2015, in Reference and Stringent Test Cases32
Figure 6
shows the total amount of capacity retrofit by 2015 under the Stringent Test Case. Nationally, owners of 253 GW of coal units would install fabric filters, and owners of 110 GW would install wet FGDs. This scenario conservatively assumes that every coal plant that is not retired must have both of these technologies installed. Again, in scenarios with less rigid compliance options, the scale of these installations is likely to be significantly lower than the numbers in Figure 6. For example, some units may be able to install DSI in order to comply with the acid gas limits under MATS and would therefore not need to install a new FGD. Similarly, some units might be able to use or upgrade existing ESPs to meet particulate matter limits and would not need to install a new fabric filter.
32 U.S. total values in this and subsequent figures include results for the lower 48 states only. In addition to coal retirements, by 2015 there are projected to be 25 GW of cumulative oil/natural gas steam unit retirements (of which 10 GW are incremental) in the Stringent Test Case and a total of 3 GW of natural gas combustion turbine retirements.

20 RESOURCE ADEQUACY IMPLICATIONS OF FORTHCOMING EPA AIR QUALITY REGULATIONS
Figure 6: Cumulative capacity retrofit from 2011-2015 in the Stringent Test Case, using three types of control technologies33
3.3 Modeled impacts of retirements on planning reserve margins and new capacity requirements
Figure 7 shows the results for both scenarios on planning reserve margins in 2015, the year by which most coal retirements attributed to the Stringent Test constraints would have occurred. In all regions, PI-NEMS will add new generation or transmission capacity if needed to ensure that target reserve margins are satisfied.34 Figure 8 To quantify this new capacity, shows the modeled cumulative capacity additions in 2015 by NERC region in the Reference Case. Most of these capacity additions are planned additions that are currently under construction or slated for completion no later than 2012. The model adds approximately 8 GW of unplanned renewable energy capacity, primarily wind in the SPP and WECC regions, in anticipation of the production tax credit expiring in
33 Figure does not include approximately 1 GW of planned dry FGD retrofits. No additional dry FGDs are built because this control technology is not available in the model for anything other than planned retrofits. In the Reference Case, 32 GW of SCRs and SNCRs are installed by 2015 in the U.S. to comply with the CAIR rule. Under the stress test case, 26 GW of SCRs and SNCRs are installed in the U.S. by the same year. 34 PI-NEMS is designed to always satisfy planning reserve margin targets. These targets are computed internally in the model to reflect the willingness of consumers to pay for additional capacity to avoid unserved energy. Reserve margin targets are calculated in PI-NEMS at the Electric Market Module region level and then aggregated in this report to the corresponding NERC region. To compute the capacity that can count toward planning reserves, the model discounts intermittent resources such as wind to capture the fact that these resources may not always be available to meet demand. The discounting of resources is similar, but not identical to the discounting used by NERC.

RESOURCE ADEQUACY IMPLICATIONS OF FORTHCOMING EPA AIR QUALITY REGULATIONS 21
2012.35
A relatively small amount of unplanned natural gas combustion turbine capacity is added by the model between 2013 and 2015 in the Reference Case.
Figure 7: PI-NEMS planning reserve margins and targets in 2015
Figure 9 shows the additional capacity that would be added in the Stringent Test Case, relative to the Reference Case. In most regions in the Stringent Test Case, no significant additional capacity would be built beyond what would already be built in the Reference Case. Most regions have more than sufficient capacity, in the sense that their planning reserve levels remain higher than their target levels. In such cases, there would be no resource adequacy-related reason to replace lost capacity with new additions (although there might be other reasons not captured by this analysis). However, as noted above, in at least one region (TRE), a small amount of new natural gas combustion turbine capacity (0.7 GW) would be required by 2015 to meet target margin levels, and this capacity would be added in 2015.
35 All of these additions are unplanned and were built by the model based on economic decisions. For context, the average annual amount of new wind added between 2005 and 2010 was 5.8 GW, with a peak of over 9 GW in 2009 (EIA, 2009 Form 860, 2010).

22 RESOURCE ADEQUACY IMPLICATIONS OF FORTHCOMING EPA AIR QUALITY REGULATIONS
Figure 8: Cumulative regional capacity additions, 2011-2015, in the Reference Case36
Figure 9: Cumulative regional capacity additions, 2011-2015, difference between Stringent Test Case and Reference Case 36 Planned additions are those reported to the EIA as under construction as of December 31, 2009 as well as an additional 4.3 GW of renewable capacity included in the reference case by EIA. Unplanned additions are those that are built for economic reasons according to the model. Most planned additions and unplanned renewable additions are operational before 2013. Unplanned combustion turbine additions occur after 2013.
RESOURCE ADEQUACY IMPLICATIONS OF FORTHCOMING EPA AIR QUALITY REGULATIONS 23
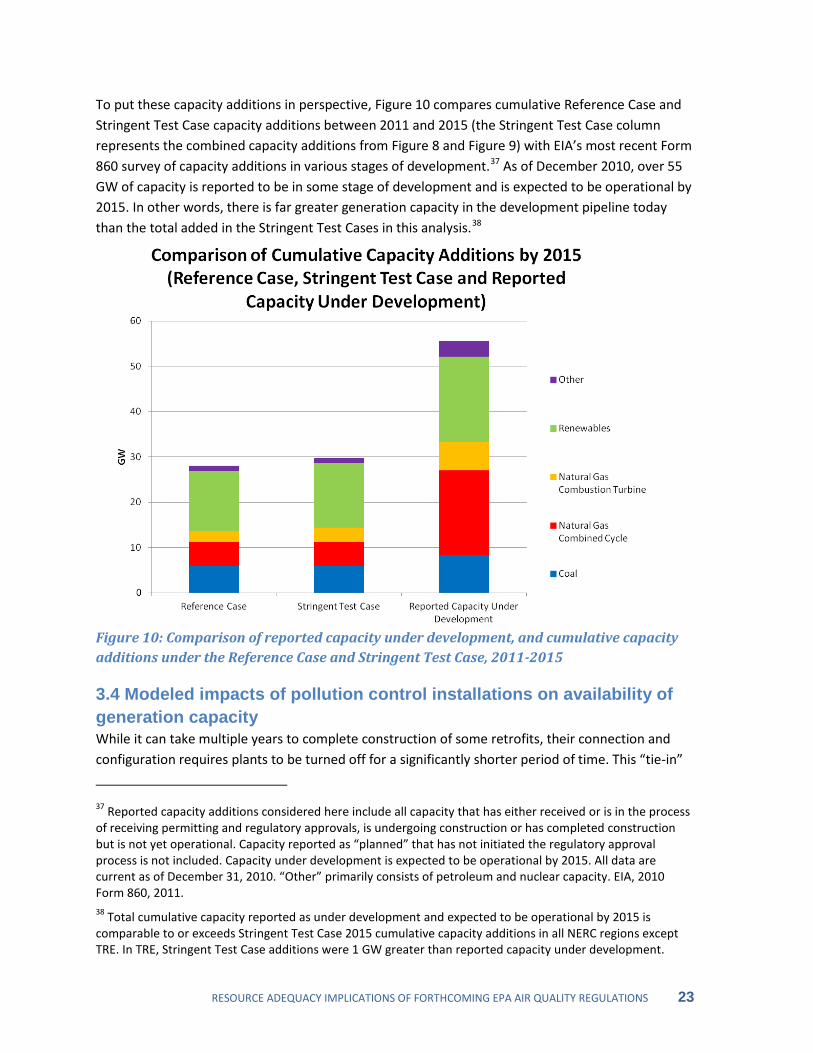
To put these capacity additions in perspective, Figure 10 compares cumulative Reference Case and Stringent Test Case capacity additions between 2011 and 2015 (the Stringent Test Case column represents the combined capacity additions from Figure 8 and Figure 9) with EIA’s most recent Form 860 survey of capacity additions in various stages of development.37 As of December 2010, over 55 GW of capacity is reported to be in some stage of development and is expected to be operational by 2015. In other words, there is far greater generation capacity in the development pipeline today than the total added in the Stringent Test Cases in this analysis.38
Figure 10: Comparison of reported capacity under development, and cumulative capacity additions under the Reference Case and Stringent Test Case, 2011-2015
3.4 Modeled impacts of pollution control installations on availability of generation capacity While it can take multiple years to complete construction of some retrofits, their connection and configuration requires plants to be turned off for a significantly shorter period of time. This “tie-in”
37 Reported capacity additions considered here include all capacity that has either received or is in the process of receiving permitting and regulatory approvals, is undergoing construction or has completed construction but is not yet operational. Capacity reported as “planned” that has not initiated the regulatory approval process is not included. Capacity under development is expected to be operational by 2015. All data are current as of December 31, 2010. “Other” primarily consists of petroleum and nuclear capacity. EIA, 2010 Form 860, 2011. 38 Total cumulative capacity reported as under development and expected to be operational by 2015 is comparable to or exceeds Stringent Test Case 2015 cumulative capacity additions in all NERC regions except TRE. In TRE, Stringent Test Case additions were 1 GW greater than reported capacity under development.

24 RESOURCE ADEQUACY IMPLICATIONS OF FORTHCOMING EPA AIR QUALITY REGULATIONS
time usually takes less than eight weeks and often can be completed during regular planned maintenance outages. A survey of outage times related to tie-in is provided in Figure 11.
Figure 11: Estimated range of plant tie-in times associated with pollution control retrofit installations39
Within PI-NEMS, coal plants are taken off-line for approximately one month each year for scheduled maintenance. These scheduled outages often occur in fall and spring when demand for electricity is lowest. In some regions, they can also occur in other seasons. These scheduled maintenance outages are included in the model when computing available capacity to meet load, but extended outages for retrofit tie-in are not taken into account. However, the effect on available capacity can be estimated outside of the model by assuming that wet FGD retrofit tie-in outages take eight weeks and are evenly distributed over the fall and spring months of a single year. In the Stringent Test Case, fabric filters are the most widely deployed retrofit (see
Figure 6), but they require relatively little tie-in time and are assumed to be completed during modeled scheduled outages.
39 Tie-in time is for a single unit only. Timeframes could be longer, or tie-in outages could be more frequent if a single device is installed to control pollution from multiple generating units. Ranges do not include start up and commissioning. Sources: URS Corp. “Assessment of Technology Options Available to Achieve Reductions of Hazardous Air Pollutants” 2011; EPA “Engineering and Economic Factors Affecting the Installation of Control Technologies for Multi-pollutant Strategies” 2002; Utility Air Regulatory Group “Implementation Schedules For Selective Catalytic Reduction (SCR) and Flue Gas Desulfurization (FGD) Process Equipment” 2010

RESOURCE ADEQUACY IMPLICATIONS OF FORTHCOMING EPA AIR QUALITY REGULATIONS 25
The results of this estimate are shown in Figure 12.40
Figure 7 The orange bar is identical to the calculated
reserve margin (summer excess capacity relative to peak summer demand) shown in . The light blue bar shows the fall/spring excess capacity (relative to peak demand in fall and spring), adjusted downward for retrofit-related outages. The lower demand in fall and spring increases excess capacity, leaving sufficient headroom to take plants off-line to tie-in the needed controls.
This estimate assumes that the outages would be coordinated so that they would be evenly distributed across the fall and spring months. However, a conservative assumption is also made that all FGD tie-in outages must occur in a single year. In reality, it is likely that these outages would be spread across multiple years and that some would take place during other parts of the year.
Figure 12: Excess adjusted capacity41
available in fall and spring of 2015 after outages due to pollution control tie-in are removed
40 This calculation assumes that if the regularly scheduled outage occurs in the winter, the retrofit outage is assumed to take eight weeks in the fall and spring. If the scheduled outage occurs in the fall and spring, the retrofit outage is assumed to take four weeks beyond the scheduled outage, again for a total of eight weeks. 41 Adjusted capacity refers to the sum of capacities available in the given season with appropriate discounting for intermittent resources.

26 RESOURCE ADEQUACY IMPLICATIONS OF FORTHCOMING EPA AIR QUALITY REGULATIONS
Appendix A: NERC regions
Figure 13: Map of NERC regions42
42 Map generated by the National Renewable Energy Laboratory (NREL).
TRE

RESOURCE ADEQUACY IMPLICATIONS OF FORTHCOMING EPA AIR QUALITY REGULATIONS 27
Appendix B. Low natural gas price cases The evolution of natural gas prices can significantly change the economics of retiring versus retrofitting existing coal plants. Given the uncertainty about shale gas resources, the U.S. Energy Information Administration (EIA) has done a number of additional cases exploring greater natural gas availability. This sensitivity uses EIA’s “High Shale EUR” case43 which increases the amount of shale gas recovered in each well. Although there is no explicit natural gas supply curve in PI-NEMS, this sensitivity effectively shifts the natural gas supply curve to the right, lowering natural gas prices at any quantity supplied. For context, the price of natural gas delivered to the power sector in 2015 is 4.8 dollars per Mcf in the Reference Case and 4.0 dollars per Mcf in the Low Natural Gas Price case.44
The Low Natural Gas Price Stringent Test Case constraints related to the rules are identical to those of the earlier Stringent Test Case. They are deliberately designed to be more conservative (in the sense of offering fewer compliance options and therefore driving greater retirements) than the CSAPR and MATS rules. The inclusion of a 10-year investment payback requirement of pollution control retrofits again adds conservatism and acts as a rough proxy for future regulatory uncertainty.
The results from the low natural gas cases are given in the following figures. The decrease in natural gas prices leads to a greater number of coal retirements in both the Low Natural Gas Price Reference Case and the Low Natural Gas Price Stringent Test Case (compare Figure 14 with Figure 5).
43 From Annual Energy Outlook 2011, p. 222: “In the High Shale EUR case, the EUR per shale gas well is assumed to be 50 percent higher than in the Reference Case, decreasing the per-unit cost of developing the resource. The total unproved technically recoverable shale gas resource is increased from 827 trillion cubic feet in the Reference Case to 1,230 trillion cubic feet.” 44 These prices are provided in 2009 dollars. NEMS fuel prices are endogenous and vary by year as well as by scenario.

28 RESOURCE ADEQUACY IMPLICATIONS OF FORTHCOMING EPA AIR QUALITY REGULATIONS
Figure 14: Cumulative coal retirements by NERC region, 2011-2015 in the low natural gas price cases45
Figure 15
shows that planning margins are once again maintained in these cases. In the Low Natural Gas Price Stringent Test Case, the number of incremental retirements is higher, since the price of natural gas is lower. As a result, the amount of additional new capacity needed in the Low Natural Gas Price Stringent Test Case relative to the Low Natural Gas Price Reference Case (13 GW) is generally higher than the additional capacity needed in the earlier Stringent Test Case (2 GW) relative to the earlier Reference Case (compare Figure 16 and Figure 9). This additional capacity is needed to meet PI-NEMS target planning reserve margins, replacing some portion of the higher number of retirements in the Low Natural Gas Price Stringent Test Case. The largest amount of additional new capacity is in SERC, where approximately 4 GW of primarily natural gas combustion turbine capacity is added.46
45 U.S. total values in this and subsequent figures include results for the lower 48 states only.
Outside of SERC, additional unplanned natural gas combined cycle capacity would be added across several regions, although the additional capacity would be relatively small in any one region. All of the additional natural gas capacity additions would be built in 2014 and 2015.
46 Some additional wind is added in SPP, but this is largely driven by the expiration of the PTC (similar to the wind additions in the earlier Reference Case).

RESOURCE ADEQUACY IMPLICATIONS OF FORTHCOMING EPA AIR QUALITY REGULATIONS 29
Figure 15: PI-NEMS planning reserve margins and targets in 2015 for the low natural gas price cases
Figure 16: Cumulative regional capacity additions, 2011-2015, in the Low Natural Gas Price Reference Case

30 RESOURCE ADEQUACY IMPLICATIONS OF FORTHCOMING EPA AIR QUALITY REGULATIONS
Figure 17: Cumulative regional capacity additions, 2011-2015, difference between Low Natural Gas Price Stringent Test Case and Low Natural Gas Price Reference Case
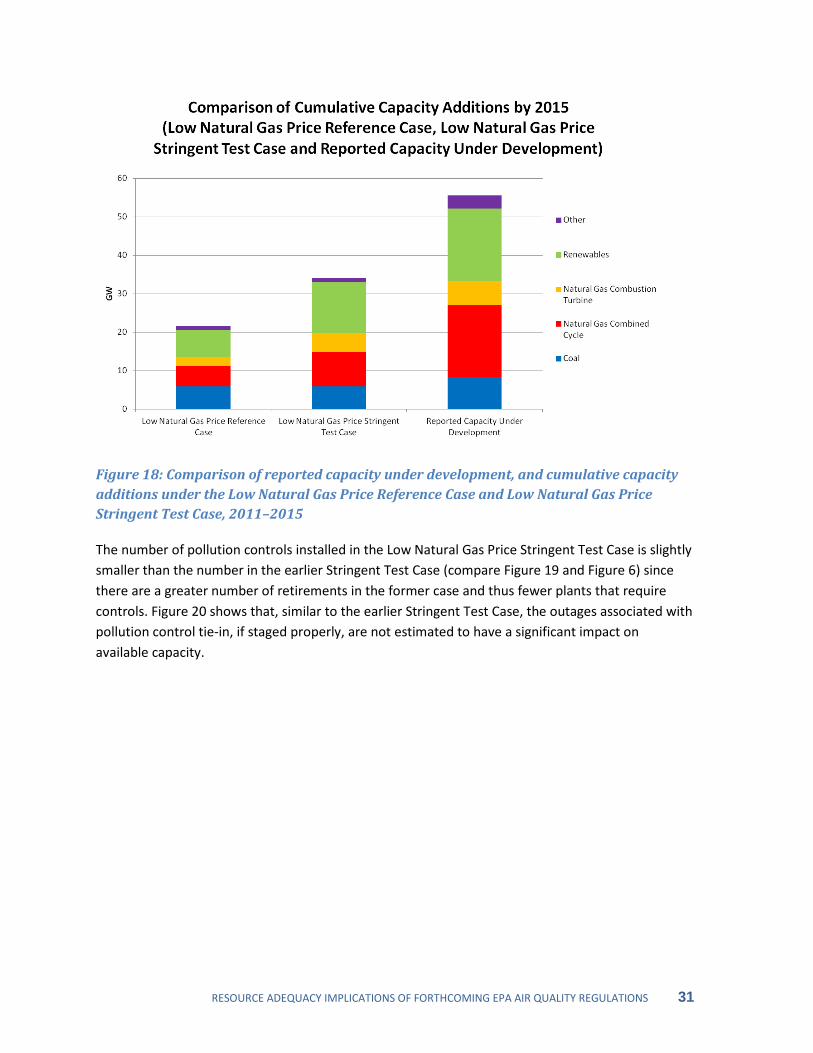
To put these capacity additions in perspective, Figure 18 compares cumulative Low Natural Gas Price Reference Case and Low Natural Gas Price Stringent Test Case capacity additions between 2011 and 2015 (Low Natural Gas Price Stringent Test Case column represents combined capacity additions from Figure 16 and Figure 17) with EIA’s most recent Form 860 survey of capacity additions in various stages of development.47
47 Capacity additions considered here include all capacity that has either received or is in the process of receiving permitting and regulatory approvals, is undergoing construction or has completed construction but is not yet operational. Capacity reported as “planned” that has not initiated the regulatory approval process is not included. Capacity under development is expected to be operational by 2015. All data are current as of December 31, 2010. “Other” primarily consists of petroleum and nuclear capacity. EIA, 2010 Form 860, 2011.
As shown earlier in Figure 10, there is far greater generation capacity in the development pipeline today than is added in any of the cases in this analysis.
RESOURCE ADEQUACY IMPLICATIONS OF FORTHCOMING EPA AIR QUALITY REGULATIONS 31
Figure 18: Comparison of reported capacity under development, and cumulative capacity additions under the Low Natural Gas Price Reference Case and Low Natural Gas Price Stringent Test Case, 2011–2015
The number of pollution controls installed in the Low Natural Gas Price Stringent Test Case is slightly smaller than the number in the earlier Stringent Test Case (compare Figure 19 and Figure 6) since there are a greater number of retirements in the former case and thus fewer plants that require controls. Figure 20 shows that, similar to the earlier Stringent Test Case, the outages associated with pollution control tie-in, if staged properly, are not estimated to have a significant impact on available capacity.

32 RESOURCE ADEQUACY IMPLICATIONS OF FORTHCOMING EPA AIR QUALITY REGULATIONS
Figure 19: Cumulative capacity retrofit from 2011-2015 in the Low Natural Gas Price Stringent Test Case, using three types of control technologies
Figure 20: Excess adjusted capacity available in fall and spring of 2015 in the Low Natural Gas Price Stringent Test Case after outages due to pollution control tie-in are removed

RESOURCE ADEQUACY IMPLICATIONS OF FORTHCOMING EPA AIR QUALITY REGULATIONS 33
Appendix C: Retrofit Cost Assumptions For retrofit costs, PI-NEMS relies on the same costs as those in EIA’s AEO 2011, except that costs for Fabric Filters and ACI are increased to mirror EPA’s cost assumptions in its IPM Base Case v4.10. Table 3 provides sample costs for representative plants burning bituminous coal with 9,000 BTU heat rates.
Table 3: Assumed Capital ($2009/kW) and Fixed O&M Costs ($2009/kW-yr) Costs for Representative Plants in PI-NEMS
Related Documents