Subscriber access provided by UNIV AUTONOMA DE BARCELONA ACS Nano is published by the American Chemical Society. 1155 Sixteenth Street N.W., Washington, DC 20036 Published by American Chemical Society. Copyright © American Chemical Society. However, no copyright claim is made to original U.S. Government works, or works produced by employees of any Commonwealth realm Crown government in the course of their duties. Article Resolving Material-Specific Structures within Fe O |#-Mn O Core|Shell Nanoparticles Using Anomalous Small-Angle X-ray Scattering (ASAXS) Kathryn L. Krycka, Julie Borchers, German Salazar-Alvarez, Alberto López- Ortega, Marta Estrader, Sonia Estrade, Elin Winkler, Roberto Daniel Zysler, Jordi Sort, Francesca Peiró, Maria Dolors Baró, Chi-Chang Kao, and Josep Nogués ACS Nano, Just Accepted Manuscript • DOI: 10.1021/nn303600e • Publication Date (Web): 04 Jan 2013 Downloaded from http://pubs.acs.org on January 8, 2013 Just Accepted “Just Accepted” manuscripts have been peer-reviewed and accepted for publication. They are posted online prior to technical editing, formatting for publication and author proofing. The American Chemical Society provides “Just Accepted” as a free service to the research community to expedite the dissemination of scientific material as soon as possible after acceptance. “Just Accepted” manuscripts appear in full in PDF format accompanied by an HTML abstract. “Just Accepted” manuscripts have been fully peer reviewed, but should not be considered the official version of record. They are accessible to all readers and citable by the Digital Object Identifier (DOI®). “Just Accepted” is an optional service offered to authors. Therefore, the “Just Accepted” Web site may not include all articles that will be published in the journal. After a manuscript is technically edited and formatted, it will be removed from the “Just Accepted” Web site and published as an ASAP article. Note that technical editing may introduce minor changes to the manuscript text and/or graphics which could affect content, and all legal disclaimers and ethical guidelines that apply to the journal pertain. ACS cannot be held responsible for errors or consequences arising from the use of information contained in these “Just Accepted” manuscripts.

Welcome message from author
This document is posted to help you gain knowledge. Please leave a comment to let me know what you think about it! Share it to your friends and learn new things together.
Transcript

Subscriber access provided by UNIV AUTONOMA DE BARCELONA
ACS Nano is published by the American Chemical Society. 1155 Sixteenth StreetN.W., Washington, DC 20036Published by American Chemical Society. Copyright © American Chemical Society.However, no copyright claim is made to original U.S. Government works, or worksproduced by employees of any Commonwealth realm Crown government in the courseof their duties.
Article
Resolving Material-Specific Structures within Fe3
O4
|#-Mn2
O3
Core|ShellNanoparticles Using Anomalous Small-Angle X-ray Scattering (ASAXS)
Kathryn L. Krycka, Julie Borchers, German Salazar-Alvarez, Alberto López-Ortega, Marta Estrader, Sonia Estrade, Elin Winkler, Roberto Daniel Zysler, Jordi
Sort, Francesca Peiró, Maria Dolors Baró, Chi-Chang Kao, and Josep NoguésACS Nano, Just Accepted Manuscript • DOI: 10.1021/nn303600e • Publication Date (Web): 04 Jan 2013
Downloaded from http://pubs.acs.org on January 8, 2013
Just Accepted
“Just Accepted” manuscripts have been peer-reviewed and accepted for publication. They are postedonline prior to technical editing, formatting for publication and author proofing. The American ChemicalSociety provides “Just Accepted” as a free service to the research community to expedite thedissemination of scientific material as soon as possible after acceptance. “Just Accepted” manuscriptsappear in full in PDF format accompanied by an HTML abstract. “Just Accepted” manuscripts have beenfully peer reviewed, but should not be considered the official version of record. They are accessible to allreaders and citable by the Digital Object Identifier (DOI®). “Just Accepted” is an optional service offeredto authors. Therefore, the “Just Accepted” Web site may not include all articles that will be publishedin the journal. After a manuscript is technically edited and formatted, it will be removed from the “JustAccepted” Web site and published as an ASAP article. Note that technical editing may introduce minorchanges to the manuscript text and/or graphics which could affect content, and all legal disclaimersand ethical guidelines that apply to the journal pertain. ACS cannot be held responsible for errorsor consequences arising from the use of information contained in these “Just Accepted” manuscripts.
Resolving Material-Specific Structures within
Fe3O4|γ-Mn2O3 Core|Shell Nanoparticles Using
Anomalous Small-Angle X-ray Scattering (ASAXS)
Kathryn L. Krycka,∗,† Julie Borchers,† German Salazar-Alvarez,‡ Alberto
López-Ortega,¶,§ Marta Estrader,‡,¶,§ Sonia Estrade,∥,⊥ Elin Winkler,# Roberto
Daniel Zysler,# Jordi Sort,@,§ Francesca Peiró,⊥ Maria Dolors Baró,§ Chi-Chang
Kao,△ and Josep Nogués@,¶,§
NIST Center for Neutron Research, National Institute of Standards and Technology, Gaithersburg,
Maryland 20899, Department of Materials and Environmental Chemistry, Stockholm University,
S-10691 Stockholm, Sweden, CIN2(ICN-CSIC) and Universitat Autònoma de Barcelona, Catalan
Institute of Nanotechnology (ICN), Campus de la UAB, E-08193 Bellaterra (Barcelona), Spain,
Department de Física, Universitat Autònoma de Barcelona, E-08193 Bellaterra (Barcelona),
Spain, TEM-MAT, CCiT, Universitat de Barcelona, Solè i Sabarí s 1, E-08028 Barcelona, Spain,
LENS, MIND-IN2UB, Department d’Electrònica, Universitat de Barcelona, Martí i Franquès 1,
E-08028 Barcelona, Spain, Centro Atómico Bariloche, CNEA-CONICET, 8400 S.C. de Bariloche,
Río Negro, Argentina, Institució Catalana de Recerca i Estudis Avançats (ICREA), and Stanford
Synchrotron Radiation Lightsource, Menlo Park, CA 94025
E-mail: [email protected]
1
Page 1 of 31
ACS Paragon Plus Environment
ACS Nano
123456789101112131415161718192021222324252627282930313233343536373839404142434445464748495051525354555657585960

Abstract
Here it is demonstrated that multiple-energy, anomalous small-angle x-ray scattering (ASAXS)
provides significant enhancement in sensitivity to internal material boundaries of layered nanopar-
ticles compared with the traditional modeling of a single scattering energy, even for cases in
which high scattering contrast naturally exists. Specifically, the material specific structure of
monodispersed Fe3O4|γ-Mn2O3 core|shell nanoparticles is determined, and the contribution of
each component to the total scattering profile is identified with unprecedented clarity. We show
that Fe3O4|γ-Mn2O3 core|shell nanoparticles with a diameter of 8.2 nm ± 0.2 nm consist of a
core with a composition near Fe3O4 surrounded by a (MnX Fe1−X )3O4 shell with a graded com-
position, i.e., ranging from X ≈ 0.40 at the inner shell toward X ≈ 0.46 at the surface. Eval-
uation of the scattering contribution arising from the interference between material-specific
layers additionally reveals the presence of Fe3O4 cores without a coating shell. Finally, it is
found that the material-specific scattering profile shapes and chemical compositions extracted
by this method are independent of the original input chemical compositions used in the analy-
sis, revealing multi-energy ASAXS as a powerful tool for determining internal nanostructured
morphology even if the exact composition of the individual layers is not known a priori.
Keywords
Core|shell nanoparticles, Fe3O4, γ-Mn2O3, neutron scattering, anomalous x-ray scattering
The exceptional impact of nanoparticles in industry and research during the last decade is un-
∗To whom correspondence should be addressed†NIST Center for Neutron Research, National Institute of Standards and Technology, Gaithersburg, Maryland
20899‡Department of Materials and Environmental Chemistry, Stockholm University, S-10691 Stockholm, Sweden¶CIN2(ICN-CSIC) and Universitat Autònoma de Barcelona, Catalan Institute of Nanotechnology (ICN), Campus
de la UAB, E-08193 Bellaterra (Barcelona), Spain§Department de Física, Universitat Autònoma de Barcelona, E-08193 Bellaterra (Barcelona), Spain∥TEM-MAT, CCiT, Universitat de Barcelona, Solè i Sabarí s 1, E-08028 Barcelona, Spain⊥LENS, MIND-IN2UB, Department d’Electrònica, Universitat de Barcelona, Martí i Franquès 1, E-08028
Barcelona, Spain#Centro Atómico Bariloche, CNEA-CONICET, 8400 S.C. de Bariloche, Río Negro, Argentina
@Institució Catalana de Recerca i Estudis Avançats (ICREA)△Stanford Synchrotron Radiation Lightsource, Menlo Park, CA 94025
2
Page 2 of 31
ACS Paragon Plus Environment
ACS Nano
123456789101112131415161718192021222324252627282930313233343536373839404142434445464748495051525354555657585960
deniable, spreading in fields with everyday applications such as cosmetics to high-end biotechnol-
ogy.1–5 Interestingly, advances in synthetic chemistry have allowed reaching beyond conventional
nanoparticles into more complex hybrid structures comprised of two (or more) materials such as
core|shell particles.6–8 These systems can combine in a synergetic way the diverse properties (e.g.,
catalytical, optical, magnetic or biomedical) of the different constituents leading to multifunctional
materials with novel and improved characteristics, paving the way for an even broader applicability
of nanoparticles. Given the unprecedented ability to control growth parameters during the synthe-
sis (i.e., core diameter, shell thickness, and material composition) the overall properties of the
particles can be accurately tailored to match specific applications. In fact, core|shell nanoparticles
have an extra degree of freedom since the properties can often be tuned not only by the core and
shell characteristics, but also through their interactions.9–18 Typically, the properties of core|shell
nanoparticles depend critically on the structural morphology such as the thickness (and variability)
of the constituent layers, their composition, and the sharpness of interfaces. Consequently, the pre-
cise determination of these parameters is vital to understanding and fine tuning the functionalities
of the core|shell systems.
While many techniques exist for non location-specific chemical analysis, such as Mössbauer
spectroscopy19,20 and x-ray absorption spectroscopy (XAS), characterizing the internal structure of
such core|shell nanoparticles continues to be a challenging endeavor. Even high-resolution trans-
mission electron microscopy (HR-TEM) imaging with electron energy loss spectroscopy (EELS)
analysis,21–27 which can often give an accurate account of the morphology of the particles (as
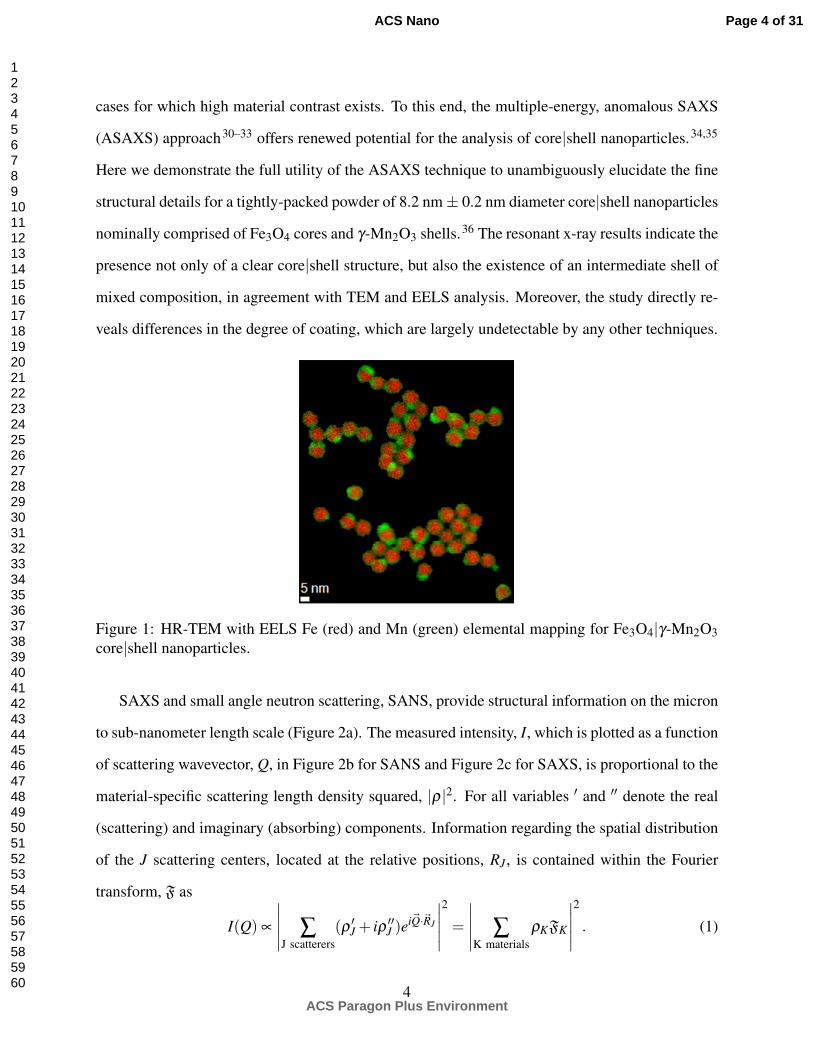
shown in Figure 1 applied to a subset of our 8.2 nm Fe3O4|γ-Mn2O3 core|shell nanoparticles),
remains insufficient since only a small number of particles can be analyzed. For this reason, com-
plementary techniques such as neutron and x-ray diffractive methods are desirable since they mea-
sure macroscopic amounts of sample (i.e., millions of nanoparticles), giving a better picture of the
overall morphology and dispersion. Yet, small angle x-ray scattering (SAXS), which is very use-
ful in evaluating particle size and polydispersity for homogeneous nanoparticles,28,29 suffers from
an inability to definitively pinpoint chemical boundaries within core|shell nanoparticles, even in
3
Page 3 of 31
ACS Paragon Plus Environment
ACS Nano
123456789101112131415161718192021222324252627282930313233343536373839404142434445464748495051525354555657585960
cases for which high material contrast exists. To this end, the multiple-energy, anomalous SAXS
(ASAXS) approach30–33 offers renewed potential for the analysis of core|shell nanoparticles.34,35
Here we demonstrate the full utility of the ASAXS technique to unambiguously elucidate the fine
structural details for a tightly-packed powder of 8.2 nm ± 0.2 nm diameter core|shell nanoparticles
nominally comprised of Fe3O4 cores and γ-Mn2O3 shells.36 The resonant x-ray results indicate the
presence not only of a clear core|shell structure, but also the existence of an intermediate shell of
mixed composition, in agreement with TEM and EELS analysis. Moreover, the study directly re-
veals differences in the degree of coating, which are largely undetectable by any other techniques.
Figure 1: HR-TEM with EELS Fe (red) and Mn (green) elemental mapping for Fe3O4|γ-Mn2O3core|shell nanoparticles.
SAXS and small angle neutron scattering, SANS, provide structural information on the micron
to sub-nanometer length scale (Figure 2a). The measured intensity, I, which is plotted as a function
of scattering wavevector, Q, in Figure 2b for SANS and Figure 2c for SAXS, is proportional to the
material-specific scattering length density squared, |ρ |2. For all variables ′ and ′′ denote the real
(scattering) and imaginary (absorbing) components. Information regarding the spatial distribution
of the J scattering centers, located at the relative positions, RJ , is contained within the Fourier
transform, F as
I(Q) ∝
∣∣∣∣∣ ∑J scatterers
(ρ ′J + iρ ′′
J )eiQ⃗·R⃗J
∣∣∣∣∣2
=
∣∣∣∣∣ ∑K materials
ρKFK
∣∣∣∣∣2
. (1)
4
Page 4 of 31
ACS Paragon Plus Environment
ACS Nano
123456789101112131415161718192021222324252627282930313233343536373839404142434445464748495051525354555657585960
From a modeling standpoint, |F|2 is viewed as the convolution of the structure factor (nanoparticle
packing), |S|2, with the form factor (internal nanoparticle structure), |F |2.
Although diffraction methods can be extremely sensitive to external nanoparticle diameter,
they are relatively insensitive to internal structures. As the room temperature SANS data under-
score (see Figure 2b and Supporting Information), even a high ρ contrast ratio > 4 (refer to Table
I) is not sufficient to distinguish through modeling37 whether the nanoparticles’ |F|2 is closer to
homogeneous Fe-Mn-oxide spheres or arises from distinctive Fe3O4|γ-Mn2O3 core|shell nanopar-
ticles.
Importantly, material sensitivity (and, thus, sensitivity to internal layering) may be enhanced
by collecting multiple, energy-dependent scattering patterns of varied ρ’s. For neutrons this can be
achieved in many organic systems through hydrogen-deuterium substitution,38,39 while for x-rays
ρ changes dramatically as a function of energy about atomic absorption edges, coined anomalous
or resonant scattering.40 Thus, as shown in Figure 2c, anomalous scattering patterns were acquired
at the Mn and Fe K-edges,41 6535 eV and 7112 eV, respectively, and off-resonance at 6000 eV
(Table I). Yet, aside from changes in total intensity and a slight low-Q oscillation shift, the profiles
appear to be strikingly similar. The reason for this is that the scattering is heavily influenced by
scattering interference between the Fe and Mn oxides (also referred to as a cross term, which will
be explicitly evaluated later on). To illustrate this, consider a two-layer system labeled as α and β ,
(α =Fe3O4 and β = γ-Mn2O3)
I(Q)∝ |ρα |2|Fα |2︸ ︷︷ ︸Iα
+ |ρβ |2|Fβ |2︸ ︷︷ ︸Iβ
+2(ρ ′αρ ′
β +ρ ′′αρ ′′
β )
FInt1︷ ︸︸ ︷(F′
αF′β +F′′
αF′′β )︸ ︷︷ ︸
IInt1
+2(ρ ′αρ ′′
β −ρ ′′αρ ′
β )
FInt2︷ ︸︸ ︷(F′′
αF′β −F′
αF′′β )︸ ︷︷ ︸
IInt2
,
(2)
where cross terms, IInt1 and IInt2, each depend on both ρα and ρβ . It is clear that material-specific
scattering cannot simply be extracted from the subtraction of scattering profiles obtained at ener-
gies just below and on a relevant absorption edge, as is commonly assumed.
However, the simultaneous analysis of multi-energy ASAXS profiles34,35 does provide the
means to uniquely separate material-specific |F|2s. The number of input scattering scans with
5
Page 5 of 31
ACS Paragon Plus Environment
ACS Nano
123456789101112131415161718192021222324252627282930313233343536373839404142434445464748495051525354555657585960
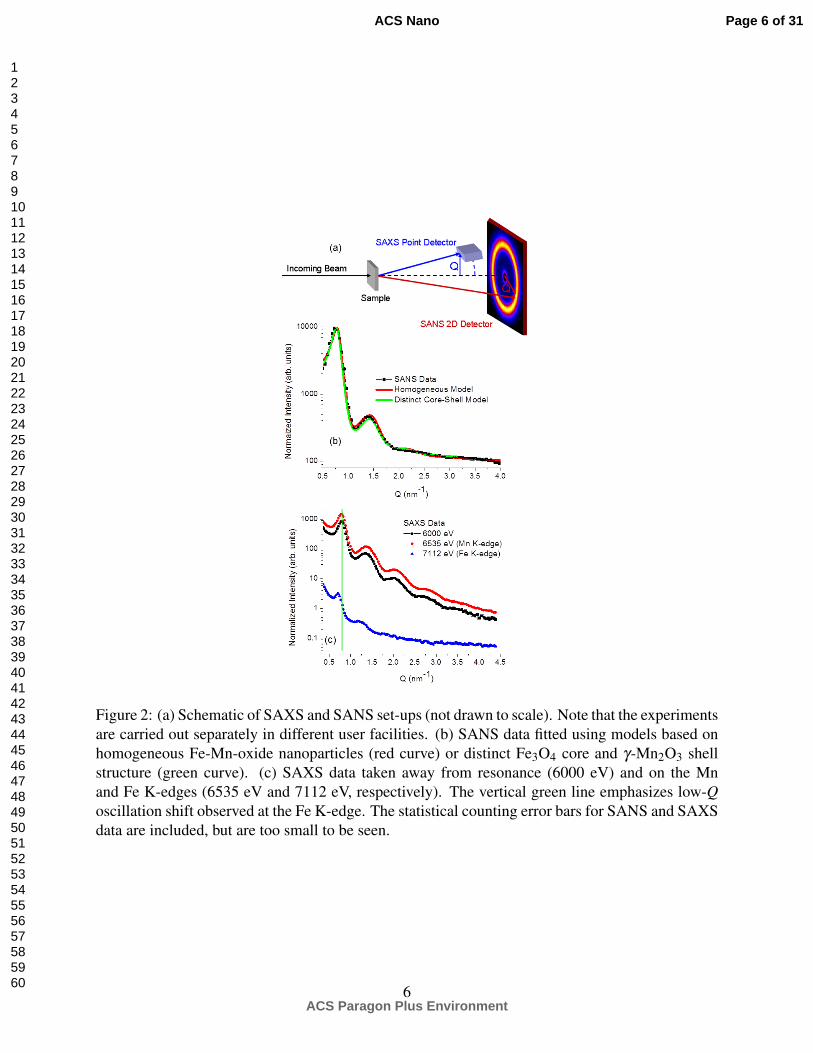
Figure 2: (a) Schematic of SAXS and SANS set-ups (not drawn to scale). Note that the experimentsare carried out separately in different user facilities. (b) SANS data fitted using models based onhomogeneous Fe-Mn-oxide nanoparticles (red curve) or distinct Fe3O4 core and γ-Mn2O3 shellstructure (green curve). (c) SAXS data taken away from resonance (6000 eV) and on the Mnand Fe K-edges (6535 eV and 7112 eV, respectively). The vertical green line emphasizes low-Qoscillation shift observed at the Fe K-edge. The statistical counting error bars for SANS and SAXSdata are included, but are too small to be seen.
6
Page 6 of 31
ACS Paragon Plus Environment
ACS Nano
123456789101112131415161718192021222324252627282930313233343536373839404142434445464748495051525354555657585960
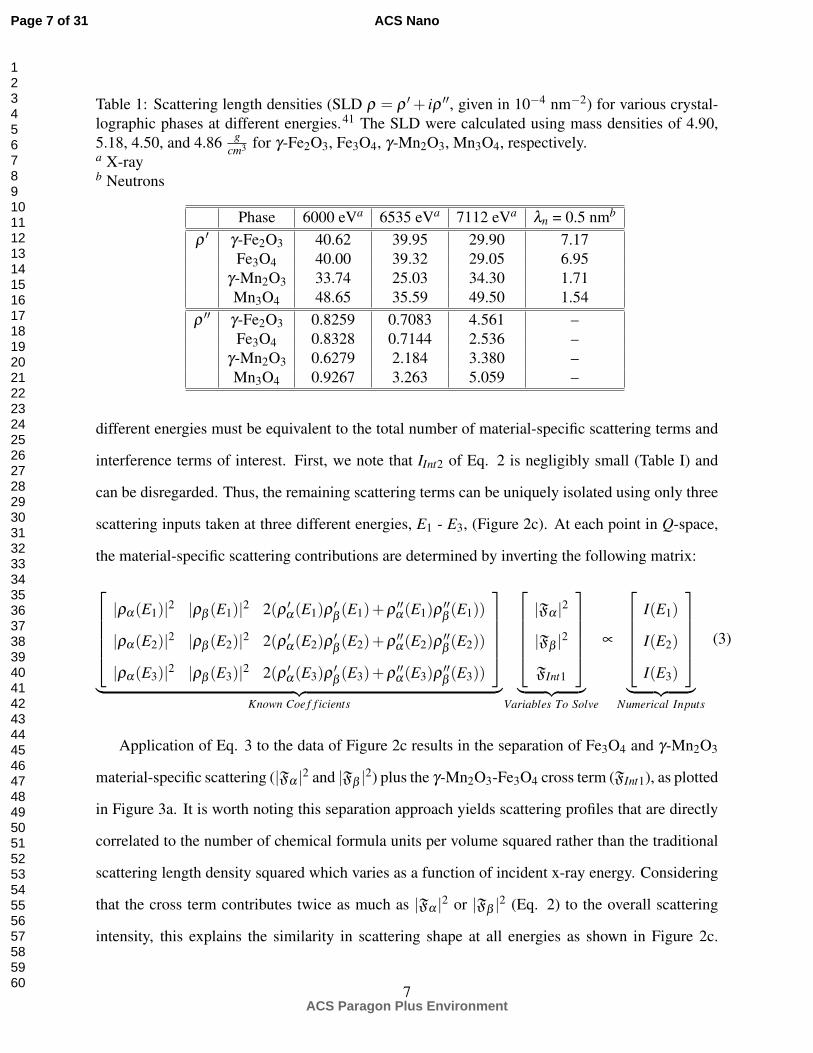
Table 1: Scattering length densities (SLD ρ = ρ ′+ iρ ′′, given in 10−4 nm−2) for various crystal-lographic phases at different energies.41 The SLD were calculated using mass densities of 4.90,5.18, 4.50, and 4.86 g
cm3 for γ-Fe2O3, Fe3O4, γ-Mn2O3, Mn3O4, respectively.a X-rayb Neutrons
Phase 6000 eVa 6535 eVa 7112 eVa λn = 0.5 nmb
ρ ′ γ-Fe2O3 40.62 39.95 29.90 7.17Fe3O4 40.00 39.32 29.05 6.95
γ-Mn2O3 33.74 25.03 34.30 1.71Mn3O4 48.65 35.59 49.50 1.54
ρ ′′ γ-Fe2O3 0.8259 0.7083 4.561 –Fe3O4 0.8328 0.7144 2.536 –
γ-Mn2O3 0.6279 2.184 3.380 –Mn3O4 0.9267 3.263 5.059 –
different energies must be equivalent to the total number of material-specific scattering terms and
interference terms of interest. First, we note that IInt2 of Eq. 2 is negligibly small (Table I) and
can be disregarded. Thus, the remaining scattering terms can be uniquely isolated using only three
scattering inputs taken at three different energies, E1 - E3, (Figure 2c). At each point in Q-space,
the material-specific scattering contributions are determined by inverting the following matrix:
|ρα(E1)|2 |ρβ (E1)|2 2(ρ ′
α(E1)ρ ′β (E1)+ρ ′′
α(E1)ρ ′′β (E1))
|ρα(E2)|2 |ρβ (E2)|2 2(ρ ′α(E2)ρ ′
β (E2)+ρ ′′α(E2)ρ ′′
β (E2))
|ρα(E3)|2 |ρβ (E3)|2 2(ρ ′α(E3)ρ ′
β (E3)+ρ ′′α(E3)ρ ′′
β (E3))
︸ ︷︷ ︸
Known Coe f f icients
|Fα |2
|Fβ |2
FInt1
︸ ︷︷ ︸
Variables To Solve
∝
I(E1)
I(E2)
I(E3)
︸ ︷︷ ︸
Numerical Inputs
(3)
Application of Eq. 3 to the data of Figure 2c results in the separation of Fe3O4 and γ-Mn2O3
material-specific scattering (|Fα |2 and |Fβ |2) plus the γ-Mn2O3-Fe3O4 cross term (FInt1), as plotted
in Figure 3a. It is worth noting this separation approach yields scattering profiles that are directly
correlated to the number of chemical formula units per volume squared rather than the traditional
scattering length density squared which varies as a function of incident x-ray energy. Considering
that the cross term contributes twice as much as |Fα |2 or |Fβ |2 (Eq. 2) to the overall scattering
intensity, this explains the similarity in scattering shape at all energies as shown in Figure 2c.
7
Page 7 of 31
ACS Paragon Plus Environment
ACS Nano
123456789101112131415161718192021222324252627282930313233343536373839404142434445464748495051525354555657585960
Although the interference term can be positively or negatively valued, simulation suggests that
for core|shell morphology the cross term will contribute negatively over the first oscillation, as
experimentally observed. Moreover, the existence of a non-zero cross-term implies that there must
be a correlation between the Fe3O4 and γ-Mn2O3 layers, i.e. a significant proportion of them must
co-exist within the same nanoparticles with a repeating morphology particle-to-particle.
The difference in the material-specific scattering profiles is especially striking at 1.1 nm−1
where the γ-Mn2O3 scattering contains a noticeably sharper dip than the Fe3O4 scattering (Fig-
ure 3b). Above Q = 1.5 nm−1 the profiles look similar. Extensive simulation suggests that if the
relative intensity of each energy-dependent experimental profile is not preserved to within a few
percent, then the extracted material-specific profiles will typically assume a common scattering
shape similar to that of the composite nanoparticle. Thus, the low-intensity region of Q ≥ 1.5
nm−1 is especially susceptible to any background subtraction issues during the material-specific
scattering reconstruction. Even so there are periodic differences, indicated by green arrows (Fig-
ure 3b). Division of the extracted Fe3O4 profile by the γ-Mn2O3 profile, |F|Fe3O4/|F|γ−Mn2O3 ,
further highlights these periodic differences (Figure 3c). These differences indicate that the Fe3O4
and γ-Mn2O3 components must be present in different morphological distributions as a function of
radius within the nanoparticles, which for spherical nanoparticles would correspond to a radially
graded (i.e. core|shell or core|shell|shell) structure.
Results and Discussion
Modeling of the material-specific x-ray scattering provides ensemble-average information regard-
ing nanoparticle core and shell dimensions, compositional uniformity, size polydispersity, nanopar-
ticle packing, and the relative ratio of Mn to Fe present. As discussed previously in regard to mod-
eling of the SANS data, |F|2 = |F |2|S|2, where |F |2 and |S|2 are the form and structure factors,
respectively.
Outermost Diameter: The γ-Mn2O3 (Figure 3a-b) distribution extends out to the edge of the
8
Page 8 of 31
ACS Paragon Plus Environment
ACS Nano
123456789101112131415161718192021222324252627282930313233343536373839404142434445464748495051525354555657585960

Figure 3: (a) Extracted, material-specific scattering profiles and cross term. (b) Arrows pinpoint theperiodic differences between Fe3O4 and γ-Mn2O3. (c) Division of the material-specific profiles,|FFe3O4|2/|Fγ−Mn2O3|2, highlight the variation between Fe3O4 and γ-Mn2O3 scattering and indicatea difference in their nanoparticle morphologies.
Figure 4: (a) γ-Mn2O3 scattering profile and fit where dips highlighted with arrows correspondto those of Figure 3a. (b) Fe3O4 scattering profile and fit. Although the insets in (a) and (b)which depict the γ-Mn2O3 and Fe3O4 portions of the model are not drawn to scale, their fit dimen-sions are listed exactly as modeled. (c) Division of Fe3O4 and γ-Mn2O3 modeled scattering pro-files reproduces the experimental features of Figure 3c. (d) Hard-sphere model |S|2s of core|shellnanoparticles and uncoated seed nanoparticles.
9
Page 9 of 31
ACS Paragon Plus Environment
ACS Nano
123456789101112131415161718192021222324252627282930313233343536373839404142434445464748495051525354555657585960

nanoparticle with scattering that is consistent with a spherical model of exterior diameter 8.2 nm ±
0.1 nm. The corresponding interior can vary from a sphere of uniform density to a sphere centrally
devoid of Mn up to the first 1.8 nm in diameter. (Even element-specific diffraction is most sensitive
to the outermost dimensions of that layer since more material resides there.) In contrast, the Fe3O4
oscillations and slope (Figure 3a-b) cannot be fit by a sphere of uniform density. Instead a graded
model where the amount of Fe3O4 decreases radially towards the surface is required. Depending
on the steepness of gradient chosen, the outer diameter can range from 8.2 nm (less gradient) to
8.4 nm (more gradient). However, since we know that the Fe3O4 should be concentrated toward
the interior of the core|shell particles based on knowledge about their chemical synthesis,36 we
impose the constraint that the Fe3O4 outer diameter should not exceed that of the γ-Mn2O3. This
constrains the average particle diameter to be 8.2 nm ± 0.2 nm.
Bimodal Distribution: The sharp γ-Mn2O3 dip at Q = 1.1 nm−1 (Figure 4a) is indicative of
very low polydispersity,37 on the order of 2%. In light of the monodispersity of the γ-Mn2O3
shells, the associated Fe3O4 portion of the core|shell particles should also be monodisperse, yet
the observed scattering (Figure 4b) does not display such sharp features. To reconcile this, a
bimodal model comprised of two different types of nanoparticles containing Fe3O4 is necessary.
The model consists of (i) monodisperse Fe3O4 core with reduced Fe-density shell nanoparticles
(whose outer shell diameter primarily dictates the dip locations observed) which are correlated
with the γ-Mn2O3 shells, and (ii) uncoated seeds (whose contributions smooth out the dips) which
are uncorrelated with the γ-Mn2O3 shells. This simple model can explain the diffusive Fe3O4
features without resorting to an unphysically large polydispersity for the Fe3O4 distribution. The
reciprocal space (Q) region surveyed was optimized for larger particles and, thus, it does not cover
a full oscillatory pattern of the seeds necessary for a rigorous determination of their sizes. The
modeled seed diameters ranged from ≈ 2.2 nm to 3.4 nm. The best Fe-based structure factor fit
encompassing both the Fe3O4 component of the core|shell nanoparticles and of the Fe3O4 uncoated
seeds consists of a hard sphere radius37 of 4.2 nm and volume fraction of 0.44. The γ-Mn2O3 hard
sphere structure factor diverges slightly from this with a volume fraction of 0.50 and hard-sphere
10
Page 10 of 31
ACS Paragon Plus Environment
ACS Nano
123456789101112131415161718192021222324252627282930313233343536373839404142434445464748495051525354555657585960
radius of 4.0 nm required to capture the higher-Q shift of the first peak (Figure 3a-b).
Layer Densities: Given these experimental constraints, the representative model (Figure 4a-b
insets) consists of a core|shell|shell nanoparticle of variable density. The inner core radius is set
at 0.4 nm ± 0.1 nm (to accommodate polydispersity), the inner shell thickness is 2 nm, and the
remaining outer shell thickness is 1.7 nm (adding up to a total diameter of 8.2 nm ± 0.2 nm).
Since we do not observe large changes in the relative densities of Fe3O4 and γ-Mn2O3 between
the inner and outer shells, we feel this level of shell delineation provides sufficient grading without
over determining the system. However, it should be noted that the choice of interior shell radii are
somewhat arbitrary and other shell radii choices yield similar results. Within this model the Fe3O4
density (number of formula units per volume multiplied by a scalar) is best fit from the interior to
exterior regions with values of 5.31 unitsvolume , 2.65 units
volume , and 2.32 unitsvolume , respectively (Figure 4b).
The γ-Mn2O3 component of our core|shell|shell model returns densities (also in formula units
per volume that are consistently scaled with and directly comparable to the Fe3O4 densities) of 0
unitsvolume , 2.70 units
volume , and 3.00 unitsvolume from interior to exterior, respectively (Figure 4a). The γ-Mn2O3
fit is fairly insensitive to the core region. Yet, it is reasonable to expect that the combined γ-Mn2O3
plus Fe3O4 density should not vary significantly throughout the particle and, thus, the sum should
be close to 5.3 unitsvolume for all layers. The Fe3O4 core region fit value of 5.31 units
volume hence drives
the resulting γ-Mn2O3 density toward zero, though we cannot completely exclude the possibility
that some Mn might reside within the core region. It is worthwhile to note that the division of the
γ-Mn2O3 and Fe3O4 models (Figure 4c) reproduces all the primary experimental features observed
in Figure 3c and strongly reinforces the core|graded-shell model.
Seed Fraction Estimate: As modeled, the uncoated Fe3O4 seeds can vary between 2.2 nm to
3.4 nm in diameter. When these seeds are modeled with pure Fe3O4 spheres of diameter 2.2 nm
and polydispersity of 30% (Figure 4b) their scattering profile must be scaled by a factor of 0.15
compared with the core|shell particles, indicating that the number of uncoated seeds are ≈ 15%
that of the core|shell particles. This sets an upper limit for the amount of uncoated seeds. If we
employ a larger seed model closer to 3.4 nm in diameter this seed:core|shell ratio drops as the seed
11
Page 11 of 31
ACS Paragon Plus Environment
ACS Nano
123456789101112131415161718192021222324252627282930313233343536373839404142434445464748495051525354555657585960

volume squared (i.e. ≈ 4%).
Structure Factor Variation: The difference in modeled packing structure |S|2 for the γ-Mn2O3
and Fe3O4 scattering contributions, depicted in Figure 4d, can arise only if a portion of the Mn and
Fe atoms are not all contained within the same set of nanoparticles, consistent with Fe3O4-only
seeds. (Note that this is by no means inconsistent with the presence of a cross term, Figure 3a,
which arises from Mn and Fe atoms contained within the set of nanoparticles and which can be
attributed to the core-shell nanoparticles.) The shift to slightly larger average spacing between
particles and a slightly lower packing density (embodied by |S|2 of the Fe3O4 compared with γ-
Mn2O3, Figure 4d) is also consistent with the presence of randomly dispersed, uncoated Fe3O4
seeds. Moreover, the experimentally-observed shift of the lowest-Q peak in the raw ASAXS scat-
tering (Figure 2c) to a lower-Q value at the Fe K-edge would be unexplained in the absence of
a bimodal distribution. Although it may seem counter-intuitive that the peak should shift toward
lower Q with decreased Fe scattering contribution at 7112 eV when the Fe3O4 |S|2 peaks at lower
Q than the γ-Mn2O3 |S|2 (Figure 4d), we note that the large, negatively-valued cross term (whose
peak placement is determined by both the γ-Mn2O3 and the Fe3O4) also diminishes at the Fe
K-edge.
Cross Term: As a self-consistency check, we note that the third solved term from Eq. 3, FInt1,
i.e., the cross term term, contains additional information about the material-specific |S|2s. Division
of the extracted terms, |FInt1|2 and |Fα,β |2, yields
FInt1/(|Fα,β |2) = |Fβ ,α |2(S′2α S′2β +S′′2α S′′2β +2S′αS′β S′′αS′′α)/|Sα,β |2 (4)
where F for a spherically symmetric object is always real. If Sα = Sβ (SFe3O4 = Sγ−Mn2O3), we
should be able to re-extract ¨|FFe3O4|2 and ¨|Fγ−Mn2O3|2 using
FInt1/(|Fα ,β |2) = |Sβ ,α |2|Fβ ,α |2 = ¨|Fβ ,α |2 (5)
where the double dot in ¨|Fα ,β | indicates that the previously extracted FInt1 and |Fα,β |2 (Eq. 2,3)
12
Page 12 of 31
ACS Paragon Plus Environment
ACS Nano
123456789101112131415161718192021222324252627282930313233343536373839404142434445464748495051525354555657585960

were utilized in this second-order reconstruction. The result of this procedure is shown in Fig-
ure 5a. Although features similar to Figure 3b are reproduced, the reconstruction using Eq. 4
differs noticeably in the circled region (specifically where the derived |SFe3O4|2 and |Sγ−Mn2O3|2
most strongly diverge in Figure 4d). This deviance confirms that SFe3O4 and Sγ−Mn2O3 , though sim-
ilar, are not identical. The result is again in full agreement with our differing |S|2 fits (Figure 4d)
and the experimental, first oscillation shift to lower-Q at the Fe K-edge (Figure 2c), and it rein-
forces the model consisting of core|graded-shell nanoparticles residing alongside uncoated Fe3O4
seeds.
Figure 5: (a) Material-specific scattering reconstruction obtained using Eq. 4. (b) The effectoxide-variation in material-specific profile reconstruction using Eq. 3.
Mn to Fe Ratio: The combined γ-Mn2O3 and Fe3O4 core|graded-shell fits produce a composite
nanoparticle tending toward Fe3O4 in the center surrounded by a graded shell comprised of both
Fe and Mn oxide (Figure 4). Using the fits described above the net chemical compositions are 5.31
Fe3O4volume | 2.65 Fe3O4
volume + 2.70 γ−Mn2O3volume | 2.32 Fe3O4
volume + 3.00 γ−Mn2O3volume . If we were to assume that the
shells are homogeneously mixed, then we can re-write the compositions in terms of Mn-ferrite as
(MnX Fe1−X )3O4.2, where X ranges from 0.40 to 0.46 for the average inner and outer shell regions,
respectively. Since the ASAXS technique is optimized to be highly sensitive to the Fe and Mn
content, yet less sensitive to the oxygen content, it is likely that the oxygen stoichiometric number
is in fact closer to 4.0.
13
Page 13 of 31
ACS Paragon Plus Environment
ACS Nano
123456789101112131415161718192021222324252627282930313233343536373839404142434445464748495051525354555657585960

Chemical Sensitivity: To determine the sensitivity of this technique to oxide type, we substitute
the ρ’s (Table I) of γ-Fe2O3 and Mn3O4 for Fe3O4 and γ-Mn2O3, respectively, into Eq. 3. As
shown in Figure 5b, the basic scattering shapes remain unaltered, while the difference between Fe
and Mn oxide scattering profiles changes by a relative factor of 4.6. Taking into account the scaling
of Fe-oxide core|shell and Mn-oxide shell scattering contributions with the fact that the measured
intensity is proportional to density squared, we extract a mixed-shell composition of 7.50 γ−Fe2O3volume
| 3.57 γ−Fe2O3volume + 1.78 Mn3O4
volume | 3.18 γ−Fe2O3volume + 1.98 Mn3O4
volume . Recast in terms of a composite ferrite
structure this becomes (MnX Fe1−X )3O4.3, where X ranges from 0.42 to 0.47 for inner and outer
shell regions, respectively. This is surprisingly close to the previously extracted X of 0.40 to 0.46
using Fe3O4 and γ-Mn2O3 as inputs. Our conclusion is that the extracted scattering profile shapes
and corresponding chemical compositions are largely independent of oxide inputs used.
Size Distribution via TEM: The overall diameter of the core|shell nanoparticles obtained from
TEM, Figure 6a-c, of 8.0 ± 1.9 nm corresponds satisfactorily with ASAXS analysis at 8.2 ± 0.2
nm. On the other hand, the size of the core|shell Fe3O4 cores obtained from ASAXS (≈ 0.8
nm) is remarkably small since the original Fe3O4 seeds used are 6.5 ± 1.1 nm (see Figure 6a,c).
The reduction in diameter of the pure Fe3O4 core regions within the core|shell particles from that
of the uncoated Fe3O4 seeds indicates that some of the Fe3O4 reacts with the γ-Mn2O3 and is
incorporated in a mixed-metal outer shell, as has been observed for similar particles.27,36 In fact,
the degree of interdiffusion between Mn and Fe and the exact Mn-oxide phase in this type of
nanoparticles depends critically on the temperature at which the nanoparticles are exposed to air
and on the size of the nanoparticles.27,36,42,43 The presence of uncoated Fe3O4 seeds evidenced
by the bimodal distribution of Fe3O4 nanoparticles in the ASAXS analysis is not obvious from
the TEM analysis. However, it may explain the unusually large increase in log-normal standard
deviation in the core|shell nanoparticles with respect to the original seeds (see Figure 6c). In
fact, closer inspection of the particle size distribution of the core|shell nanoparticles reveals an
asymmetric tail of the distribution towards smaller sizes. This part of the distribution might be
associated with the uncoated Fe3O4 nanoparticles, which according to ASAXS, are much smaller
14
Page 14 of 31
ACS Paragon Plus Environment
ACS Nano
123456789101112131415161718192021222324252627282930313233343536373839404142434445464748495051525354555657585960

(≈ 2.2 nm to 3.4 nm) than the mean size of the seeds (6.5 nm). Accordingly, Ostwald ripening is
likely the mechanism by which the relatively larger core|shell nanoparticles grow at the expense of
the smaller ones thereby redissolving the manganese oxide shell from the small seeds,44 although
traces of Mn on the uncoated seeds cannot be ruled out.
Figure 6: TEM image of (a) the Fe3O4 seeds and (b) the Fe3O4|γ-Mn2O3 core|shell nanoparticles.(c) Particle size distribution comparing the particles in (a) and (b). The lines show the fit of theexperimental data to a log-normal distribution. The values given in the figure correspond to themean value and the log-normal standard deviation.
Core|Shell Evidence via EELS: The imaging of the local composition of the core|shell nanopar-
ticles using STEM EELS-mapping clearly reveals a multilayered structure with an Fe-based core
and a Mn-rich shell, Figure 1. Quantitatively, EELS yields a 2.5 nm (core radius) Fe3O4 |1 nm
(inner shell) MnFe2O4|0.5 nm (outer shell) γ-Mn2O3, Figure 7. This is in qualitative agreement
with the ASAXS core|graded-shell structure, where both approaches clearly show the presence of
an intermixed shell structure and a reduced core size (with respect to the seeds). Nevertheless,
the ASAXS analysis indicates a more delocalized distribution of the Fe compared with the EELS
15
Page 15 of 31
ACS Paragon Plus Environment
ACS Nano
123456789101112131415161718192021222324252627282930313233343536373839404142434445464748495051525354555657585960

results. However, it is important to emphasize that the EELS results are based on a handful of
nanoparticles, while ASAXS measures the ensemble-average. Importantly, EEL spectra at dif-
ferent magnifications (see Figure S1 in the Supporting Information) demonstrate that the Mn|Fe
intensity ratio remains constant, indicating that the overall composition of the sample is approxi-
mately the same independent of the number of particles investigated.
Structural Characterization: High resolution scanning transmission electron microscopy (HR-
STEM) and its corresponding fast Fourier transform (FFT), Figure 8a-b, indicate that two, distinc-
tive spinel crystalline phases co-exist within the same nanoparticle, one cubic and one tetragonal.
Longer-ranged x-ray diffraction (XRD), Figure 8c, confirms the existence of cubic and tetragonal
spinel phases. Given that Fe-rich regions in the Fe-Mn oxide phase diagram (MnFe2O4-Fe3O4)
form a cubic spinel, while Mn-rich regions (FeMn2O4-Mn3O4) form a tetragonal spinel,45 we
identify the cubic structure as arising from the core and the tetragonal one from the shell. In fact,
the ratio of intensities between the tetragonal and cubic phases from XRD is in concordance with
a core|shell structure with a cubic spinel core and a thin tetragonal spinel shell.
Figure 7: Averaged Fe, Mn and O elemental quantification from nanoparticles shown in Fig. 1 anda simulation considering a 2.5 nm (radius) Fe3O4 core|1 nm MnFe2O4|0.5 nm γ-Mn2O3.
Spectroscopic Techniques: Apart from two weak resonances (α and δ ),46–49 electron spin
resonance (ESR) produces distinctive resonances, β and ξ , as a function of temperature (see details
in the Supporting Information, Figure S2). The more intense β line broadens and shifts towards
a lower field50 as the temperature decreases (Figure S3) and is qualitatively similar to the spectra
reported for Fe3O4 nanoparticle systems,51–53 while the ξ linewidth remains almost unchanged
down to 50 K and broadens54 below this (Figure S3), consistent with either Mn3O442,55–57 or a
16
Page 16 of 31
ACS Paragon Plus Environment
ACS Nano
123456789101112131415161718192021222324252627282930313233343536373839404142434445464748495051525354555657585960

MnxFe3−xO4 spinel.58
Based on previous studies on Fe-, Mn-, and FeMn-oxides,59–64 XAS and x-ray magnetic circu-
lar dichroism (XMCD) indicate that the Fe exists in a near single phase, whereas the Mn clearly ex-
ists in mixed oxidation states corresponding to multiple crystalline phases (see detailed description
in the Supporting Information, Figure S4). Thus, the complementary spectroscopic measurements
indicate the presence of multi-crystalline phases, consistent with the ASAXS modeling results of
a (MnX Fe1−X )3O4 core|shell|shell morphology with increasing Mn content toward the surface.
Figure 8: (a) HR-STEM image for the core|shell nanoparticle and (b) the FFT of the highlighted in(a). (c) X-ray diffraction. Cubic and tetragonal spinel structures, are labeled as c and t, respectively.
Conclusions
In summary, we have demonstrated that multiple-energy ASAXS provides significant enhance-
ment in sensitivity to internal material boundaries of layered nanoparticles compared with the
traditional modeling of a single scattering energy, even for cases in which high scattering length
density (ρ) contrast between the constituent materials exists. Applied to a system of nominal
core|shell Fe3O4|γ-Mn2O3 nanoparticles, this technique revealed that the core|shell nanoparticles
are comprised of a graded nanoparticle tending toward Fe3O4 at the center, yet retaining a signifi-
cant portion of Fe out to the exterior. The average Fe-Mn-oxide shell composition can be recast in
terms of a ferrite structure as (MnX Fe1−X )3O≈4 with X ranging from 0.40 (interior shell of diame-
ter 0.8 nm to 4.8 nm) to 0.46 (exterior shell of diameter 4.8 nm to 8.2 nm). The presence of a small
17
Page 17 of 31
ACS Paragon Plus Environment
ACS Nano
123456789101112131415161718192021222324252627282930313233343536373839404142434445464748495051525354555657585960
fraction of uncoated Fe3O4 seeds explains the smearing of the Fe3O4 scattering contribution with-
out assigning undue polydispersity. The model-derived concept of a dual distribution of core|shell
nanoparticles plus uncoated seeds is further corroborated by both a shift in low-Q peak placement
at the Fe K-edge and a measurable difference between structure factors SFe3O4 and Sγ−Mn2O3 ob-
tained from analysis of the derived interference term, FInt1. These fine details revealed through
the direct contrast of the material specific scattering profiles simply could not have been obtained
from simultaneous fitting of the resonant data as is generally practiced. The results, although they
are in concordance with TEM, EELS, HR-STEM, XRD, ESR, XAS, and XMCD analysis, evi-
dence ensemble-averaged structural details which would have been difficult to access using solely
these studies. Given how dependent core|shell nanoparticle behavior and functionality often are
on internal structure, multi-energy ASAXS shows great promise in the rapidly developing field of
nanoparticle research.
Methods
Synthesis. The synthesis of the onion particles was carried out following a multistep procedure
where preformed iron oxide nanoparticles were used as seeds for the subsequent growth of man-
ganese (II) oxide and its passivation to form γ-Mn2O3.36 Briefly, an iron (III) oleate precursor
was prepared following a similar procedure reported earlier.65 14 mmol of iron (III) chloride
(FeCl3·6H2O, 97 %, Aldrich), and 42 mmol of sodium oleate (NaOl, Riedel-de Haën) were dis-
solved in 21 mL ethanol (99.5 %, Panreac), 28 mL deionized water, and 50 mL hexane (Fluka) and
refluxed under magnetic stirring for 3 hours. During this time it is possible to see that the precursor
changes from a light red color to a burgundy red, indicating the formation of the precursor. The
organic phase was washed with 5 mL of deionized water three times and dried under vacuum. In
a typical synthesis, spheroidal particles with a particle diameter D = 6.5 nm ± 1.1 nm were pre-
pared by dissolving 3 mmol of the precursor, 3 mmol of oleic acid (OlOH, Aldrich) in 36 mL of
1-octadecene (ODE 90 %, Aldrich) at 70 oC. The mixture was heated to 320 o (at 5 oC/min) under
18
Page 18 of 31
ACS Paragon Plus Environment
ACS Nano
123456789101112131415161718192021222324252627282930313233343536373839404142434445464748495051525354555657585960

stirring at 130 rpm and kept for 30 min. The reaction vessel was allowed to cool down to room
temperature before exposure to air. The particles were retrieved by several cycles of centrifugation
at 2000xg, disposal of supernatant, re-dispersion in hexane and coagulation with ethanol.
The manganese oxide layers were laid on the iron oxide-based nanoparticles modifying an ear-
lier reported procedure used for the synthesis of MnO|γ-Mn2O3 nanoparticles.42,66 The procedure
is as follows: 30 mg of iron oxide seeds, 2.3 mmol of 1,2-hexadecanediol (HDD, Aldrich) and
1.9 mmol of manganese (II) acetylacetonate (Mn(acac)2, Aldrich) were added to 150 mL of ben-
zylether (Bz2O, Fluka) together with 5 mL (16 mmol) of oleic acid (OlOH, Aldrich) and 50 mL
of oleylamine (OlNH2, Fluka). The slurry was de-aerated with Ar for 15 min. The slurry was
then heated at ∼ 7 oC/min to 200 oC, allowed to proceed under reflux with a residence time, t ∼
60 min and then removed from the heating source and allowed to cool to room temperature. The
particles were washed from the reaction media by subsequent steps of precipitation under ethanol,
centrifugation, and re-dispersion in hexane.
Small Angle Neutron Scattering (SANS). SANS patterns collected at room temperature at
the NIST Center for Neutron Research beam line NG3. The incident wavelength was 0.5 nm with
11 % wavelength spread.
Anomalous Small Angle X-ray Scattering (ASAXS). SAXS patterns were measured at room
temperature at the Mn and Fe K-edges (6535 eV and 7112 eV, respectively)41 and off-resonance
(6000 eV) at the Advanced Photon Source beam line 6-ID-B. The scattering data were collected
using a SII Nano Technology Vortex detector.67 This type of detector was selected because it has
an energy discrimination of 134 eV which was used to separate the desired elastic x-ray scattering
from the background fluorescence (which can be non-negligible near absorption edges).
The incident beam intensity was monitored using a high voltage ion chamber. The detec-
tor/monitor response was calibrated as a function of incident x-ray energy by measuring the flu-
orescence produced by a vanadium thin film (with its own well-known energy response curve41)
over the range of 6.0 keV to 9.0 keV. The detector/monitor response was fit and well described
by a linear function over this energy range. The absorption of the nanoparticles as a function of
19
Page 19 of 31
ACS Paragon Plus Environment
ACS Nano
123456789101112131415161718192021222324252627282930313233343536373839404142434445464748495051525354555657585960

energy was measured via transmission through the nanoparticle sample at 6000 eV, 6535 eV, and
7112 eV. Finally, the elastic, small-angle scattering patterns obtained at same set of incident x-ray
energies were measured with the SII Nano Technology Vortex detector67 and were normalized by
(i) the ion chamber (measure of incident intensity), (ii) the detector/monitor energy response, and
(iii) the sample transmission values at the corresponding energies, respectively.
Transmission Electron Microscopy (TEM) and Electron Energy Loss Spectroscopy (EELS).
TEM images were obtained using a JEM-210067 with a LaB6 filament and a JEM-2010F67 with a
field-emission gun operating at 200 kV, the latter equipped with a post-column Gatan Image Filter
(GIF) energy spectrometer. Global EEL spectra were taken at different TEM magnifications at an
energy range containing the O K, Mn L2,3 and Fe L2,3 edges. Moreover, local EEL spectra were
acquired at different positions along the diameter of the nanoparticles on the L-edge of Mn and Fe
with an energy resolution of 0.8 eV. The quantitative analysis of the EELS spectra was performed
using the home-made software package MANGANITAS.67–69
High Resolution Scanning Tunneling Electron Microscopy (HR-STEM) and EELS Map-
ping).
HR-STEM and EELS have been obtained in a FEI Titan Low-base67 operating at 300 kV
(HR-STEM). The indexing of the FFT of HR-STEM image (Figure 8) reveals the presence of
two different crystallographic phases, related to iron oxide cubic spinel phase (JCPDS Card No.
82-1533) in the core and manganese oxide tetragonal spinel (JCPDS Card No. 24-0734) in the
shell.
X-ray Diffraction (XRD).
XRD patterns were collected using a Panalytical X’Pert Pro diffractometer67 with Cu Kα
radiation.
Electron Spin Resonance (ESR).
ESR measurements were performed in an ESP−300 Bruker spectrometer,67 operating at a fre-
quency ν ∼9.5 GHz (X−band), and in the 3− 300 K temperature range. In order to avoid spurious
signals, care was taken to not saturate the cavity due to the giant ESR sample signal. For this
20
Page 20 of 31
ACS Paragon Plus Environment
ACS Nano
123456789101112131415161718192021222324252627282930313233343536373839404142434445464748495051525354555657585960

purpose, and to ensure good penetration of the microwaves into the sample, the Fe3O4|γ−Mn2O3
nanoparticles were diluted in a non absorbing KCl salt. No noticeable changes of the cavity cou-
pling were registered in the whole set of experiments. From the ESR spectra we derived the
resonance field Hr, the peak to peak linewidth ∆H and the ESR intensity. From the resonance
condition: hν = gµBHr (where h and µB are the Plank constant and the Bohr magneton respec-
tively), the gyromagnetic g−factor was obtained, and the spectrum intensity is the area under the
absorption curve. As the materials studied in this work are powder samples the observed spectra
present inhomogeneous broadening due to the angular, size and shape distribution.
X-ray Absorption Spectroscopy (XAS) and X-ray Magnetic Circular Dichroism (XMCD).
XAS and XMCD measurements were performed on dried core|shell nanoparticles spread onto
carbon tape at the SIM beamline of the Swiss Light Source (SLS) of the Paul Scherrer institute.
Both XAS and XMCD spectra were recorded at the Fe and Mn L3,2 edges using total electron yield
(TEY) mode at 10 K in a magnetic field of 5 Tesla after field cooling (FC) from 300 K under an
applied field of 5 Tesla. The XMCD signal was normalized by the area of the XAS spectra after
correcting for the background.
Acknowledgement
This work utilized facilities supported in part by the National Science Foundation under Agreement
No. DMR-0944772 and DMR-0454672. U.S. department of Energy Contract No. DE-AC02-
06CH11357, and Ames Laboratory Contract No.W-7405-Eng-82. Work supported by the Span-
ish MICINN (MAT2008-01939-E, MAT2010-20616-C02, MAT2010-16407, CSD2009-00013 and
CSD2006-00012), and Catalan DGR (2009-SGR-1292 and 2009-SGR-00035). Use of the Ad-
vanced Photon Source, an Office of Science User Facility operated for the U.S. Department of
Energy (DOE) Office of Science by Argonne National Laboratory, was supported by the U.S.
DOE under Contract No. DE-AC02-06CH11357. Part of this work was performed on the SIM
beamline at the Paul Scherrer Institute, Villigen, Switzerland. The authors thank D. Robinson,
P. Ryan, and Z. Islam for their help performing the anomalous x-ray scattering measurements at
21
Page 21 of 31
ACS Paragon Plus Environment
ACS Nano
123456789101112131415161718192021222324252627282930313233343536373839404142434445464748495051525354555657585960

beam line 6-ID-B of the Advanced Photon Source. The authors also thank A. Fraile-Rodríguez and
A. Mayoral for their help during the XAS-XMCD and EELS mapping experiments, respectively.
GSA thanks the Wallenberg Wood Science Center for the partial financial support. ME thanks the
Generalitat de Catalunya for her Beatriu de Pinós scholarship. MDB was partially supported by an
ICREA ACADEMIA award.
References
1. Kallinteri, P.; Higgins, S.; Hutcheon, G. A.; St. Pourçain, C. B.; Garnett, M. C. Novel
Functionalized Biodegradable Polymers for Nanoparticle Drug Delivery Systems. Biomacro-
molecules 2005, 6, 1885–1894.
2. Davis, M. E.; Chen, Z.; Shin, D. M. Nanoparticle Therapeutics: an Emerging Treatment
Modality for Cancer. Nat. Rev. Drug Discov. 2008, 7, 771–782.
3. Frey, N. A.; Peng, S.; Cheng, K.; Sun, S. Magnetic Nanoparticles: Synthesis, Functionaliza-
tion, and Applications in Bioimaging and Magnetic Energy Storage. Chem. Soc. Rev. 2009,
38, 2532–2542.
4. Sharma, R.; Chen, C. Newer Nanoparticles in Hyperthermia Treatment and Thermometry. J.
Nanopart. Res. 2009, 11, 671–689.
5. Mishra, B.; Patel, B. B.; Tiwari, S. Colloidal Nanocarriers: a Review on Formulation Technol-
ogy, Types and Applications Toward Targeted Drug Delivery. Nanomed. Nanotechnol. Biol.
Med. 2010, 6, 9–24.
6. Costi, R.; Saunders, A.; Banin, U. Colloidal Hybrid Nanostructures: A New Type of Func-
tional Materials. Angew. Chem. Int. Ed. 2010, 49, 4878–4897.
7. Carbone, L.; Cozzoli, P. D. Colloidal Heterostructured Nanocrystals: Synthesis and Growth
Mechanisms. Nano Today 2010, 5, 449–493.
22
Page 22 of 31
ACS Paragon Plus Environment
ACS Nano
123456789101112131415161718192021222324252627282930313233343536373839404142434445464748495051525354555657585960
8. Schärtl, W. Current Directions in Core-Shell Nanoparticle Design. Nanoscale 2010, 2, 829–
843.
9. Ijiri, Y.; Kelly, C. V.; Borchers, J. A.; Rhyne, J. J.; Farrell, D. F.; Majetich, S. A. Detection of
Spin Coupling in Iron Nanoparticles with Small Angle Neutron Scattering. Appl. Phys. Lett.
2005, 86, 243102.
10. Kechrakos, D.; Trohidou, K.; Vasilakaki, M. Magnetic Properties of Dense Nanoparticle Ar-
rays with Core/Shell Morphology. J. Magn. Magn. Mater. 2007, 316, e291–e294.
11. Golosovsky, I. V.; Salazar-Alvarez, G.; López-Ortega, A.; González, M. A.; Sort, J.;
Estrader, M.; Suriñach, S.; Baró, M. D.; Nogués, J. Magnetic Proximity Effect Features in An-
tiferromagnetic/Ferrimagnetic Core-Shell Nanoparticles. Phys. Rev. Lett. 2009, 102, 247201.
12. Inderhees, S. E.; Borchers, J. A.; Green, K. S.; Kim, M. S.; Sun, K.; Strycker, G. L.; Aron-
son, M. C. Manipulating the Magnetic Structure of Co Core/CoO Shell Nanoparticles: Impli-
cations for Controlling the Exchange Bias. Phys. Rev. Lett. 2008, 101, 117202.
13. Berkowitz, A. E.; Rodriguez, G. F.; Hong, J. I.; An, K.; Hyeon, T.; Agarwal, N.; Smith, D. J.;
Fullerton, E. E. Antiferromagnetic MnO Nanoparticles with Ferrimagnetic Mn3O4 Shells:
Doubly Inverted Core-Shell System. Phys. Rev. B 2008, 77, 024403.
14. Elder, S. H.; Cot, F. M.; Su, Y.; Heald, S. M.; Tyryshkin, A. M.; Bowman, M. K.; Gao, Y.;
Joly, A. G.; Balmer, M. L.; Kolwaite, A. C. et al. The Discovery and Study of Nanocrystalline
TiO2-(MoO3) Core-Shell Materials. J. Am. Chem. Soc. 2000, 122, 5138–5146.
15. Peng, S.; Lei, C.; Ren, Y.; Cook, R. E.; Sun, Y. Plasmonic/Magnetic Bifunctional Nanoparti-
cles. Angew. Chem. Int. Ed. 2011, 50, 3158–3163.
16. Song, J.-H.; Atay, T.; Shi, S.; Urabe, H.; Nurmikko, A. V. Large Enhancement of Fluores-
cence Efficiency from CdSe/ZnS Quantum Dots Induced by Resonant Coupling to Spatially
Controlled Surface Plasmons. Nano Letters 2005, 5, 1557–1561.
23
Page 23 of 31
ACS Paragon Plus Environment
ACS Nano
123456789101112131415161718192021222324252627282930313233343536373839404142434445464748495051525354555657585960

17. Joo, S. H.; Park, J. Y.; Tsung, C.-K.; Yamada, Y.; Yang, P.; Somorjai, G. A. Thermally Stable
Pt/Mesoporous Silica Core-Shell Nanocatalysts for High-Temperature Reactions. Nat. Mater.
2009, 8, 126–131.
18. Bruchez Jr., M.; Moronne, M.; Gin, P.; Weiss, S.; Alivisatos, A. P. Semiconductor Nanocrys-
tals as Fluorescent Biological Labels. Science 1998, 281, 2013–2016.
19. Brodbeck, C. M.; Bukrey, R. R. Model Calculations for the Coordination of Fe3+ and Mn2+
Ions in Oxide Glasses. Phys. Rev. B 1981, 24, 2334 – 2343.
20. Trudel, S.; Jones, C. H. W.; Hill, R. H. Magnetic Properties of Nanocrystalline Iron Ox-
ide/Amorphous Manganese Oxide Nanocomposite Thin Films Prepared via Photochemical
Metal-Organic Deposition. J. Mater. Chem. 2007, 17, 2206.
21. Rojas, T. C.; Sayagues, M. J.; Caballero, A.; Koltypin, Y.; Gedanken, A.; Ponsonnet, L.;
Vacher, B.; Martin, J. M.; Fernandez, A. TEM, EELS and EFTEM Characterization of Nickel
Nanoparticles Encapsulated in Carbon. J. Mater. Chem. 2000, 10, 715–721.
22. Cho, S.; Idrobo, J.; Olamit, K., J.and Liu; Browning, N.; Kauzlarich, S. Growth Mechanisms
and Oxidation Resistance of Gold-Coated Iron Nanoparticles. Chem. Mater. 2005, 17, 3181–
3186.
23. Teng, X.; Yang, H. Synthesis of Magnetic Nanocomposites and Alloys from Platinum-Iron
Oxide Core-Shell Nanoparticles. Nanotechnology 2005, 16, S554–S561.
24. Bao, Y.; Calderon, H.; Krishnan, K. M. Synthesis and Characterization of Magnetic-Optical
Core-Shell Nanoparticles. J. Phys. Chem. C 2007, 111, 1941–1944.
25. Wang, J. X.; Inada, H.; Wu, L.; Zhu, Y.; Choi, Y.; Liu, P.; Zhou, W.-P.; Adzic, R. R. Oxy-
gen Reduction on Well-Defined Core-Shell Nanocatalysts: Particle Size, Facet, and Pt Shell
Thickness Effects. J. Am. Chem. Soc. 2009, 131, 17298–17302.
24
Page 24 of 31
ACS Paragon Plus Environment
ACS Nano
123456789101112131415161718192021222324252627282930313233343536373839404142434445464748495051525354555657585960

26. Koh, A. L.; Bao, K.; Khan, I.; Smith, W. E.; Kothleitner, G.; Nordlander, P.; Maier, S. A.;
McComb, D. W. Electron Energy-Loss Spectroscopy (EELS) of Surface Plasmons in Single
Silver Nanoparticles and Dimers: Influence of Beam Damage and Mapping of Dark Modes.
ACS Nano 2009, 3, 3015–3022.
27. Estradé, S.; Yedra, L.; López-Ortega, A.; Estrader, M.; Salazar-Alvarez, G.; Baró, M.;
Nogués, J.; Peiró, F. Distinguishing the Core from the Shell in MnOx/MnOy and FeOx/MnOx
Core/Shell Nanoparticles through Quantitative Electron Energy Loss Spectroscopy (EELS)
Analysis. Micron 2012, 43, 30–36.
28. Rieker, T.; Hanprasopwattana, A.; Datye, A.; Hubbard, P. Particle Size Distribution Inferred
from Small-Angle X-ray Scattering and Transmission Electron Microscopy. Langmuir 1999,
15, 638–641.
29. Vonk, C. G. On Two Methods of Determination of Particle Size Distribution Functions by
Means of Small-Angle X-ray Scattering. J. Appl. Cryst. 1976, 9, 433–440.
30. Karle, J. The Relative Scaling of Multiple-Wavelength Anomalous Dispersion Data. Acta
Crystallogr. Sect. A 1984, 40, 1–4.
31. Hendrickson, W. A. Determination of Macromolecular Structures from Anomalous Diffraction
of Synchrotron Radiation. Science 1991, 254, 51–58.
32. Stauber, D. J.; DiGabriele, A. D.; Hendrickson, W. A. Structural Interactions of Fibroblast
Growth Factor Receptor with Its Ligands. Proc. Natl. Acad. Sci. 2000, 97, 49–54.
33. Miao, J.; Charalambous, P.; Kirz, J.; Sayre, D. Extending the Methodology of X-ray Crys-
tallography to Allow Imaging of Micrometre-Sized Non-Crystalline Specimens. Nature 1999,
400, 342–344.
34. Barnardo, T.; Hoydalsvik, K.; Winter, R.; Martin, C. M.; Clark, G. F. In Situ Double Anoma-
25
Page 25 of 31
ACS Paragon Plus Environment
ACS Nano
123456789101112131415161718192021222324252627282930313233343536373839404142434445464748495051525354555657585960

lous Small-Angle X-ray Scattering of the Sintering and Calcination of Sol-Gel Prepared Yttria-
Stabilized-Zirconia Ceramics. J. Phys. Chem. C 2009, 113, 10021–10028.
35. Haug, J.; Kruth, H.; Dubiel, M.; Hofmeister, H.; Haas, S.; Tatchev, D.; Hoell, A. ASAXS
Study on the Formation of Core-Shell Ag/Au Nanoparticles in Glass. Nanotechnology 2009,
20, 505705.
36. Salazar-Alvarez, G.; Lidbaum, H.; López-Ortega, A.; Estrader, M.; Leifer, K.; Sort, J.;
Suriñach, S.; Baró, M. D.; Nogués, J. Two-, Three-, and Four-Component Magnetic Multi-
layer Onion Nanoparticles Based on Iron Oxides and Manganese Oxides. J. Am. Chem. Soc.
2011, 133, 16738–16741.
37. Kline, S. R. Reduction and Analysis of SANS and USANS Data Using IGOR Pro. J. Appl.
Cryst. 2006, 39, 895–900.
38. DeTitta, G. T.; Weeks, C. M.; Thuman, P.; Miller, R.; Hauptman, H. A. Structure Solution by
Minimal-Function Phase Refinement and Fourier Filtering. I. Theoretical Basis. Acta Crystal-
logr. Sect. A 1994, 50, 203–210.
39. Weeks, C. M.; DeTitta, G. T.; Hauptman, H. A.; Thuman, P.; Miller, R. Structure Solution by
Minimal-Function Phase Refinement and Fourier Filtering. II. Implementation and Applica-
tions. Acta Crystallogr. Sect. A 1994, 50, 210–220.
40. Materlik, G., Sparks, C. J., Fischer, K., Eds. Resonant Anomalous X-Ray Scattering: Theory
and Applications; Elsevier: North-Holland, 1994.
41. Henke, B.; Gullikson, E.; Davis, J. X-Ray Interactions: Photoabsorption, Scattering, Trans-
mission, and Reflection at E = 50-30,000 eV, Z = 1-92. Atomic Data and Nuclear Data Tables
1993, 54, 181–342.
42. López-Ortega, A.; Tobia, D.; Winkler, E.; Golosovsky, I. V.; Salazar-Alvarez, G.; Estradé, S.;
Estrader, M.; Sort, J.; González, M. A.; Suriñach, S. et al. Size-Dependent Passivation Shell
26
Page 26 of 31
ACS Paragon Plus Environment
ACS Nano
123456789101112131415161718192021222324252627282930313233343536373839404142434445464748495051525354555657585960

and Magnetic Properties in Antiferromagnetic/Ferrimagnetic Core/Shell MnO Nanoparticles.
J. Am. Chem. Soc. 2010, 132, 9398–9407.
43. López-Ortega, A.; Estrader, M.; Salazar-Alvarez, G.; Golosovsky, I. V.; Dumas, R. K.;
Keavney, D. J.; Vasilakaki, M.; Trohidou, K. N.; Sort, J.; Peiró, F. et al. Strongly Ex-
change Coupled Inverse Ferrimagnetic Soft/Hard, MnxFe3−xO4/FexMn3−xO4, Core/Shell Het-
erostructured Nanoparticles. Nanoscale 2012, 4, 5138–5147.
44. Li, Q.; Wang, J.; He, Y.; Liu, W.; Qiu, X. Growth of Nearly Monodisperse MnO Nanocrystals
in a Two-Size Distribution System. Cryst. Growth Des. 2009, 9, 3100–3103.
45. Guillemet-Fritsch, S.; Navrotsky, A.; Tailhades, P.; Coradin, H.; Wang, M. J. Thermochemistry
of Iron Manganese Oxide Spinels. J. Sol. State Chem. 2005, 178, 106–113.
46. Castner, T.; Newell, G. S.; Holton, W. C.; Slichter, C. P. Note on the Paramagnetic Resonance
of Iron in Glass. J. Chem. Phys. 1960, 32, 668–673.
47. Winkler, E.; Fainstein, A.; Etchegoin, P.; Fainstein, C. Fe Impurities in L-Alanine: An EPR,
Luminescence, and Raman Study. Phys. Rev. B 1999, 59, 1255–1262.
48. Winkler, E.; Zysler, R. D.; Fiorani, D. Surface and Magnetic Interaction Effects in Mn3O4
Nanoparticles. Phys. Rev. B 2004, 70, 174406.
49. Abragam, A., Bleaney, B., Eds. Electron Paramagnetic Resonance of Transition Ions; Dover
Publications: New York, 1986.
50. Fainstein, A.; Winkler, E.; Butera, A.; Tallon, J. Magnetic Interactions and Magnon Gap in the
Ferromagnetic Superconductor RuSr2GdCu2O8. Phys. Rev. B 1999, 60, 12597–12600.
51. Pal, S.; Dutta, P.; Shah, N.; Huffman, G. P.; Seehra, M. S. Surface Spin Disorder in Fe3O4
Nanoparticles Probed by Electron Magnetic Resonance Spectroscopy and Magnetometry.
IEEE Trans. Magn. 2007, 43, 3091–3093.
27
Page 27 of 31
ACS Paragon Plus Environment
ACS Nano
123456789101112131415161718192021222324252627282930313233343536373839404142434445464748495051525354555657585960

52. Koseoglu, Y. Effect of Surfactant Coating on Magnetic Properties of Fe3O4 Nanoparticles: An
FMR Study. J. Magn. Magn. Mater. 2006, 300, e327–e330.
53. Hsu, K. H.; Wu, J. H.; Huang, Y. Y.; Wang, L. Y.; Lee, H. Y.; Lin, J. G. Critical Size Effects
on the Magnetic Resonance in Fe3O4 Nanoparticles. J. Appl. Phys. 2005, 97, 114322.
54. de Biasi, E.; Ramos, C.; Zysler, R. Size and Anisotropy Determination by Ferromagnetic
Resonance in Dispersed Magnetic Nanoparticle Systems. J. Magn. Magn. Mater. 2003, 262,
235–241.
55. Chen, Z.; Zhang, S.; Tan, S.; Li, F.; Wang, J.; Jin, S.; Zhang, Y. Preparation and Electron Spin
Resonance Effect of Nanometer-Sized Mn2O3. J. Cryst. Growth 1997, 180, 280–283.
56. Seehra, M. S.; Srinivasan, G. Electron Spin Resonance of Mn3O4 Defects in MnO. J. Appl.
Phys. 1982, 53, 8345–8347.
57. Srinivasan, G.; Seehra, M. S. Magnetic Properties of Mn3O4 and a Solution of the Canted-Spin
Problem. Phys. Rev. B 1983, 28, 1–7.
58. Kliava, J.; Edelman, I.; Ivanova, O.; Ivantsov, R.; Petrakovskaja, E.; Hennet, L.; Thi-
audière, D.; Saboungi, M. Electron Magnetic Resonance and Magnetooptical Studies of
Nanoparticle-Containing Borate Glasses. J. Magn. Magn. Mater. 2011, 323, 451–460.
59. Abbate, M.; Goedkoop, J. B.; Groot, M. F. D.; Grioni, M.; Fuggle, J. C.; Hofmann, S.; Pe-
tersen, H.; Sacchi, M. Probing Depth of Soft-X Ray Absorption Spectroscopy in Total Electron
Yield Mode. Surf. Interface Anal. 1992, 18, 65–69.
60. Lee, H. J.; Kim, G.; Kim, D. H.; Kang, J.-S.; Zhang, C. L.; Cheong, S. W.; Shim, J. H.;
Lee, S.; Lee, H.; Kim, J.-Y. et al. Valence States and Occupation Sites in (Fe, Mn)3O4 Spinel
Oxides Investigated by Soft X-ray Absorption Spectroscopy and Magnetic Circular Dichro-
ism. J. Phys. Condens. Matter. 2008, 620, 295203.
28
Page 28 of 31
ACS Paragon Plus Environment
ACS Nano
123456789101112131415161718192021222324252627282930313233343536373839404142434445464748495051525354555657585960

61. Bayer, V.; Podloucky, R.; Franchini, C.; Allegretti, F.; Xu, B.; Parteder, G.; Ramsey, M. G.;
Surnev, S.; Netzer, F. P. Formation of Mn3O4(001) on MnO(001): Surface and Interface Struc-
tural Stability. Phys. Rev. B 2007, 76, 165428.
62. Chen, C. L. Electronic and Magnetic Properties of Transition Metal Ferrites and Superlattice
Studied by X-ray Absorption Spectroscopy.; PhD Thesis: Tamkang University, 2005.
63. Pellegrin, E.; Hagelstein, M.; Doyle, S.; Moser, H. O.; Fuchs, J.; Vollath, D.; Schuppler, S.;
James, M. A.; Saxena, S. S.; Niesen, L. et al. Characterization of Nanocrystalline γ-Fe2O3
with Synchrotron Radiation Techniques. Phys. Status Solidi B 1999, 215, 797–801.
64. Pool, V.; Klem, M.; Jolley, C.; Arenholz, E. A.; Douglas, T.; Young, M.; Idzerda, Y. U. Site
Determination and Magnetism of Mn Doping in Protein Encapsulated Iron Oxide Nanoparti-
cles. J. Appl. Phys. 2010, 107, 09B517.
65. Park, J.; An, K.; Hwang, Y.; Park, J.-G.; Noh, H.-J.; Kim, J.-Y.; Park, J.-H.; Hwang, N.-M.;
Hyeon, T. Ultra-Large-Scale Syntheses of Monodisperse Nanocrystals. Nat. Mater. 2004, 3,
891–895.
66. Salazar-Alvarez, G.; Sort, J.; Suriñach, S.; Baró, M. D.; Nogués, J. Synthesis and Size-
Dependent Exchange Bias in Inverted Core-Shell MnO|Mn3O4 Nanoparticles. J. Am. Chem.
Soc. 2007, 129, 9102–9108.
67. Certain commercial equipment, instruments, and software, have been identified in this paper
to foster understanding. Such identification does not imply recommendation or endorsement
by the National Institute of Standards and Technology, nor does it imply that the materials or
equipment identified are necessarily the best available for the purpose.
68. Estradé, S.; Arbiol, J.; Peiró, F.; Abad, L.; Laukhin, V.; Balcells, L.; Martínez, B. Cationic
Diffusion in La2/3Ca1/3MnO3 Thin Films Grown on LaAlO3 (001) Substrates. Appl. Phys.
Lett. 2007, 91, 252503.
29
Page 29 of 31
ACS Paragon Plus Environment
ACS Nano
123456789101112131415161718192021222324252627282930313233343536373839404142434445464748495051525354555657585960

69. Estradé, S.; Arbiol, J.; Peiró, F.; Infante, I. C.; Sanchéz, F.; Fontcuberta, J.; de la Peña, F.;
Walls, M.; Colliex, C. Cationic and Charge Segregation in La2/3Ca1/3MnO3 Thin Films
Grown on (001) and (110) SrTiO3. Appl. Phys. Lett. 2008, 93, 112505.
30
Page 30 of 31
ACS Paragon Plus Environment
ACS Nano
123456789101112131415161718192021222324252627282930313233343536373839404142434445464748495051525354555657585960

Table of Contents Image 155x87mm (300 x 300 DPI)
Page 31 of 31
ACS Paragon Plus Environment
ACS Nano
123456789101112131415161718192021222324252627282930313233343536373839404142434445464748495051525354555657585960
Related Documents