Resolution in structured illumination microscopy: a probabilistic approach Michael G. Somekh,* Ken Hsu, and Mark C. Pitter Institute of Biophysics, Imaging and Optical Science, School of Electrical and Electronic Engineering, The University of Nottingham, University Park, Nottingham, NG7 2RD, UK * Corresponding author: [email protected] Received November 15, 2007; revised March 20, 2008; accepted March 20, 2008; posted March 24, 2008 (Doc. ID 89744); published May 15, 2008 Structured illumination can be employed to extend the lateral resolution of wide-field fluorescence microscopy. Since a structured illumination microscopy image is reconstructed from a series of several acquired images, we develop a modified formulation of the imaging response of the microscope and a probabilistic analysis to assess the resolution performance. We use this model to compare the fluorescence imaging performance of structured illumination techniques to confocal microscopy. Specifically, we examine the trade-off between achievable lat- eral resolution and signal-to-noise ratio when photon shot noise is dominant. We conclude that for a given photon budget, structured illumination invariably achieves better lateral resolution than confocal microscopy. © 2008 Optical Society of America OCIS codes: 030.5290, 030.4280, 000.5490, 110.0180, 180.2520, 100.6640. 1. INTRODUCTION Lateral resolution has been one of the abiding and domi- nant themes in the history of microscopy. Lateral reso- lution cannot, however, be considered in isolation from the signal-to-noise ratio (SNR) when considering the practical performance of a microscope. To experienced us- ers of confocal fluorescence microscopes, the role of SNR is very apparent: A small confocal detection pinhole notice- ably improves lateral resolution; however, it reduces the SNR because fewer photons are detected, and this can re- sult in a noisy image. This trade-off between resolution and the number of photons detected is of particular im- portance in fluorescence microscopy, since most fluoro- phores can only produce a finite number of photons, typi- cally around 10 5 , before they photobleach. Since in many situations we may wish to obtain a series of time-lapsed images of a sample, the number of photons available in a single image pixel can be very low. It is clear from this brief discussion that an optimized microscope should give excellent lateral resolution and make the best possible use of the detected photons. The simplest and most widely used technique that is suitable for high-resolution fluorescent imaging is wide- field fluorescence microscopy. Laser scanning confocal fluorescence microscopy (CFM), although more complex and expensive to implement, is also now commonplace. CFM combines an optical sectioning capability with po- tentially higher lateral resolution than wide-field tech- niques. More recently, structured illumination microscopy (SIM) has been used to improve the resolution of simple wide-field fluorescence microscopy [1,2], in many cases achieving effective numerical apertures greater than val- ues that are physically realizable with conventional op- tics. In SIM a series of fine fringe patterns are projected onto the sample, and images are recorded. The acquired image is then a multiplication of the sample and the illu- mination, and the Fourier plane contains a convolution between the spatial spectra of the object and the illumi- nation structure. This convolution heterodynes high spa- tial frequencies into the passband of the microscope. By recording a series of images with different illumination structures and processing appropriately, an extended or superresolution image can be reconstructed by recovering the object spatial frequencies that are outside the normal bandwidth of the microscope. The imaging analysis of optical systems is very well es- tablished and provides a unified framework to under- stand the imaging performance of different microscope systems. A major result that applies to nonfluorescence microscopes is that the lateral resolution depends on the numerical aperture of both the illumination and the im- aging optics. In essence, the improvement in resolution with a high aperture condenser arises from the increased range of spatial frequencies that can be recovered by illu- minating the sample at many incident angles [3]. For ex- ample, an obliquely propagating plane wave can be dif- fracted through up to twice the semiaperture angle of the imaging objective, whereas a condenser with a small ap- erture will illuminate the sample close to normal inci- dence, such that only light diffracted through angles less than the semiaperture angle of the objective will contrib- ute to the image. In fluorescence microscopy, the sample illumination can also be used to improve the lateral resolution, but the simple diffraction argument needs to be modified because the fluorescence process discards the phase information of the illuminating light. In fluorescence microscopy, it is necessary to generate an intensity variation instead, and this is precisely how both CFM and SIM improve the lat- eral resolution. The improved resolution achieved with both CFM and SIM is associated with an increase in the amount of light Somekh et al. Vol. 25, No. 6/June 2008/J. Opt. Soc. Am. A 1319 1084-7529/08/061319-11/$15.00 © 2008 Optical Society of America

Welcome message from author
This document is posted to help you gain knowledge. Please leave a comment to let me know what you think about it! Share it to your friends and learn new things together.
Transcript
1LnltpevaSsappcsisbeu
sfiflaCtn(wautoi
Somekh et al. Vol. 25, No. 6 /June 2008/J. Opt. Soc. Am. A 1319
Resolution in structured illumination microscopy:a probabilistic approach
Michael G. Somekh,* Ken Hsu, and Mark C. Pitter
Institute of Biophysics, Imaging and Optical Science, School of Electrical and Electronic Engineering,The University of Nottingham, University Park, Nottingham, NG7 2RD, UK
*Corresponding author: [email protected]
Received November 15, 2007; revised March 20, 2008; accepted March 20, 2008;posted March 24, 2008 (Doc. ID 89744); published May 15, 2008
Structured illumination can be employed to extend the lateral resolution of wide-field fluorescence microscopy.Since a structured illumination microscopy image is reconstructed from a series of several acquired images, wedevelop a modified formulation of the imaging response of the microscope and a probabilistic analysis to assessthe resolution performance. We use this model to compare the fluorescence imaging performance of structuredillumination techniques to confocal microscopy. Specifically, we examine the trade-off between achievable lat-eral resolution and signal-to-noise ratio when photon shot noise is dominant. We conclude that for a givenphoton budget, structured illumination invariably achieves better lateral resolution than confocal microscopy.© 2008 Optical Society of America
OCIS codes: 030.5290, 030.4280, 000.5490, 110.0180, 180.2520, 100.6640.
mbntrsstb
tssmnawrmafiedtu
csttnte
S
. INTRODUCTIONateral resolution has been one of the abiding and domi-ant themes in the history of microscopy. Lateral reso-
ution cannot, however, be considered in isolation fromhe signal-to-noise ratio (SNR) when considering theractical performance of a microscope. To experienced us-rs of confocal fluorescence microscopes, the role of SNR isery apparent: A small confocal detection pinhole notice-bly improves lateral resolution; however, it reduces theNR because fewer photons are detected, and this can re-ult in a noisy image. This trade-off between resolutionnd the number of photons detected is of particular im-ortance in fluorescence microscopy, since most fluoro-hores can only produce a finite number of photons, typi-ally around 105, before they photobleach. Since in manyituations we may wish to obtain a series of time-lapsedmages of a sample, the number of photons available in aingle image pixel can be very low. It is clear from thisrief discussion that an optimized microscope should givexcellent lateral resolution and make the best possiblese of the detected photons.The simplest and most widely used technique that is
uitable for high-resolution fluorescent imaging is wide-eld fluorescence microscopy. Laser scanning confocaluorescence microscopy (CFM), although more complexnd expensive to implement, is also now commonplace.FM combines an optical sectioning capability with po-
entially higher lateral resolution than wide-field tech-iques. More recently, structured illumination microscopySIM) has been used to improve the resolution of simpleide-field fluorescence microscopy [1,2], in many caseschieving effective numerical apertures greater than val-es that are physically realizable with conventional op-ics. In SIM a series of fine fringe patterns are projectednto the sample, and images are recorded. The acquiredmage is then a multiplication of the sample and the illu-
1084-7529/08/061319-11/$15.00 © 2
ination, and the Fourier plane contains a convolutionetween the spatial spectra of the object and the illumi-ation structure. This convolution heterodynes high spa-ial frequencies into the passband of the microscope. Byecording a series of images with different illuminationtructures and processing appropriately, an extended oruperresolution image can be reconstructed by recoveringhe object spatial frequencies that are outside the normalandwidth of the microscope.The imaging analysis of optical systems is very well es-
ablished and provides a unified framework to under-tand the imaging performance of different microscopeystems. A major result that applies to nonfluorescenceicroscopes is that the lateral resolution depends on theumerical aperture of both the illumination and the im-ging optics. In essence, the improvement in resolutionith a high aperture condenser arises from the increased
ange of spatial frequencies that can be recovered by illu-inating the sample at many incident angles [3]. For ex-
mple, an obliquely propagating plane wave can be dif-racted through up to twice the semiaperture angle of themaging objective, whereas a condenser with a small ap-rture will illuminate the sample close to normal inci-ence, such that only light diffracted through angles lesshan the semiaperture angle of the objective will contrib-te to the image.In fluorescence microscopy, the sample illumination
an also be used to improve the lateral resolution, but theimple diffraction argument needs to be modified becausehe fluorescence process discards the phase information ofhe illuminating light. In fluorescence microscopy, it isecessary to generate an intensity variation instead, andhis is precisely how both CFM and SIM improve the lat-ral resolution.
The improved resolution achieved with both CFM andIM is associated with an increase in the amount of light
008 Optical Society of America
nilcdhtpopfFbbmfaTFw
optanpofnpr
uptfSCCpdftstdcascfstfssucdp
tt
2AMWtfdrTdtdiS
stclcdwmwarpets
cap�a
FiS
1320 J. Opt. Soc. Am. A/Vol. 25, No. 6 /June 2008 Somekh et al.
ecessary to achieve a given SNR; the theme of this papers to develop a formalism to assess this trade-off. The re-ationship between resolution and signal to noise is a cru-ial issue that has perhaps not received the attention iteserves in the literature. A recent survey by Lipson [4]as discussed this issue for a wide range of different sys-ems that achieve resolution beyond the Abbé limit. Hisaper discussed how quickly the SNR deteriorates as res-lution improves. Interestingly, he points out that thehoton efficiency decreases rapidly and at a similar rateor systems as apparently different as Toraldo di Francia’sourier plane masks [5] and near-field microscopy. Inoth cases the photon efficiency falls off at a similar rateetween the 5th and 6th power of the resolution improve-ent. Ram et al. [6] have developed a rigorous stochastic
ramework to assess the effect of Poisson noise on the im-ging performance of fluorescent microscope systems.heir approach considers a two-point object and uses theisher information matrix to calculate the accuracy withhich the two objects can be located.The method presented in this paper also develops a rig-
rous stochastic framework based on a Poissonian noiserocess. Our method, however, gives results in terms ofhe probability of falsely identifying a two-point object assingle point. A key novelty of the present paper that hasot been considered in previous works is that our ap-roach deals with “synthetic” images; this means that theutput is produced by processing a series of images, whichorm components of the final image. We show how theoise in the individual images propagates through therocessing to give the noise for the synthetic (high-esolution) image.
In this paper we compare the resolution and the photontilization of the CFM and the SIM systems. A primaryurpose of this work is to provide a general frameworkhat can be used to compare the lateral resolution of dif-erent microscopy techniques as a function of SNR. Inection 2 of this paper, the optical transfer functions ofFM and SIM are derived. Since the transfer function ofFM is well known, this is performed for review pur-oses. The transfer function of SIM is considered in someetail, however, because the formulation we present dif-ers from that in previous literature. It is convenient hereo formulate the microscope response in terms of point-pread functions (PSFs) so that probability density func-ions (PDFs) of the variations in signal strength can beerived. Section 3 introduces and considers our resolutionriterion in terms of probability. Here we derive the prob-bility for both CFM and SIM that two objects are re-olved according to this resolution criterion. In the formerase the analysis is straightforward because the image isormed directly from detected photons, and therefore weimply apply Poissonian statistics. For SIM, the deriva-ion is more involved because the image is reconstructedrom several acquired images. Here we apply a compactemianalytical method to derive the PDF of the outputignal of the microscope. In Subsections 3.B and 3.C wese the formulations developed in Sections 2 and 3 to cal-ulate the probability of resolving a pair of objects for theifferent microscope systems and provide a critical com-arison between the different techniques. Section 4 con-
ains conclusions and considers further generalizations ofhe techniques developed here.
. IMAGING ANALYSIS OF CONFOCALND STRUCTURED ILLUMINATIONICROSCOPESe make two simplifications in the following analysis of
he transfer functions, neither of which significantly af-ects the main conclusions: (i) We analyze one-imensional imaging optics, and (ii) we assume the fluo-escent excitation and emission wavelengths to be equal.he underlying principles behind the analysis techniqueeveloped in this paper is unaffected by the first assump-ion; however, the key stages are much clearer with a one-imensional formulation. We discuss the effects of extend-ng the analysis to a two-dimensional circular aperture inubsection 3.D.The essential elements of both CFM and SIM optics are
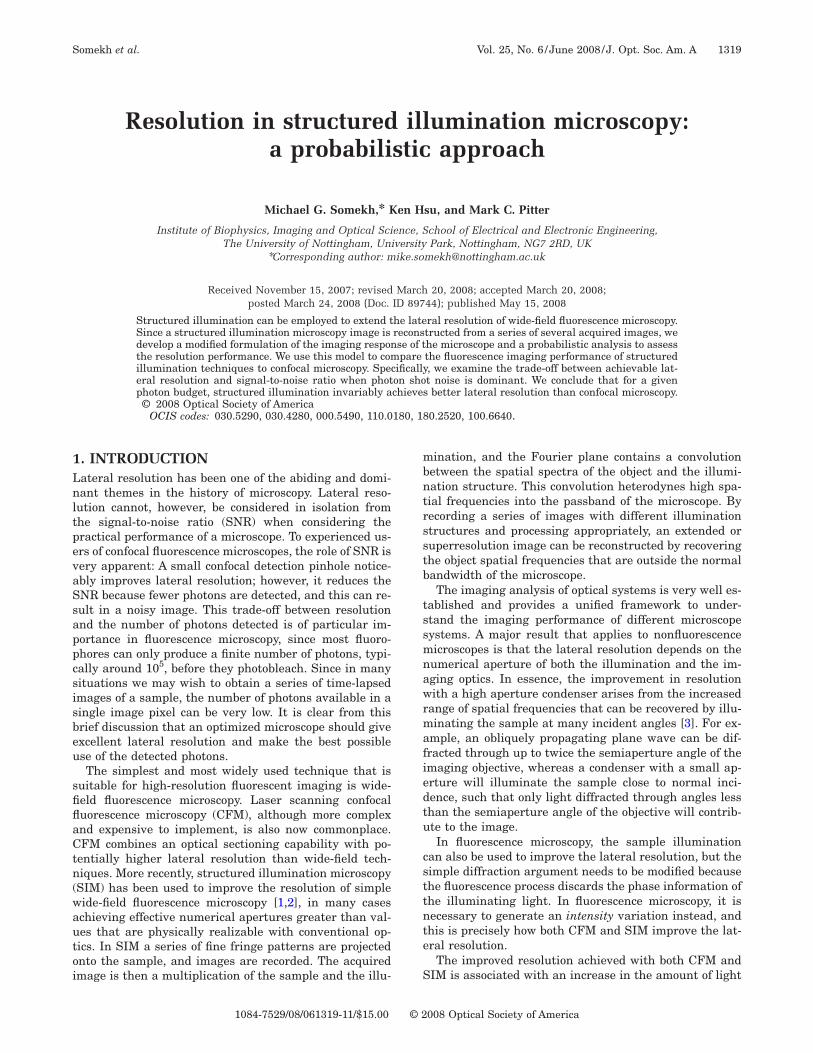
hown in Fig. 1. The microscope systems are shown inransmission mode for clarity, but the arguments are un-hanged for a reflected light configuration, where a singleens serves for both illumination and collection. We firstonsider CFM, shown in Fig. 1(a). The illumination opticselivers an intensity distribution at the sample, �h�x��2,here h�x� is the amplitude impulse response of the illu-ination optics. If the confocal pinhole is absent (or veryide), the detection optics serves simply to collect lightnd only the illumination optics contribute to the lateralesolution. The overall PSF of CFM without a confocalinhole is thus �h�x��2, which, under the assumption ofqual excitation and emission wavelengths, is the same ashe PSF of a conventional wide-field fluorescence micro-cope.
When the pinhole is present, the detection optics alsoontributes to the lateral resolution of the microscope,lthough simultaneously reducing the number of detectedhotons. The overall response of CFM is thus
h�x��2 �hd�x��2, where hd�x�=h�x� � p�x�, p�x� is the pinhole,nd � denotes convolution. As the size of the pinhole is
ig. 1. Schematic diagrams of the microscope systems analyzedn this paper. (a) Confocal fluorescence microscope (CFM). (b)tructured illumination microscope (SIM).
rtptcaws�fcdtth
tshthsiapppqrsfbfipsmtbF
Soatt
ctoi
wsgcci
tntteflFtffSltthcF
t
wdft
Fccwt
Somekh et al. Vol. 25, No. 6 /June 2008/J. Opt. Soc. Am. A 1321
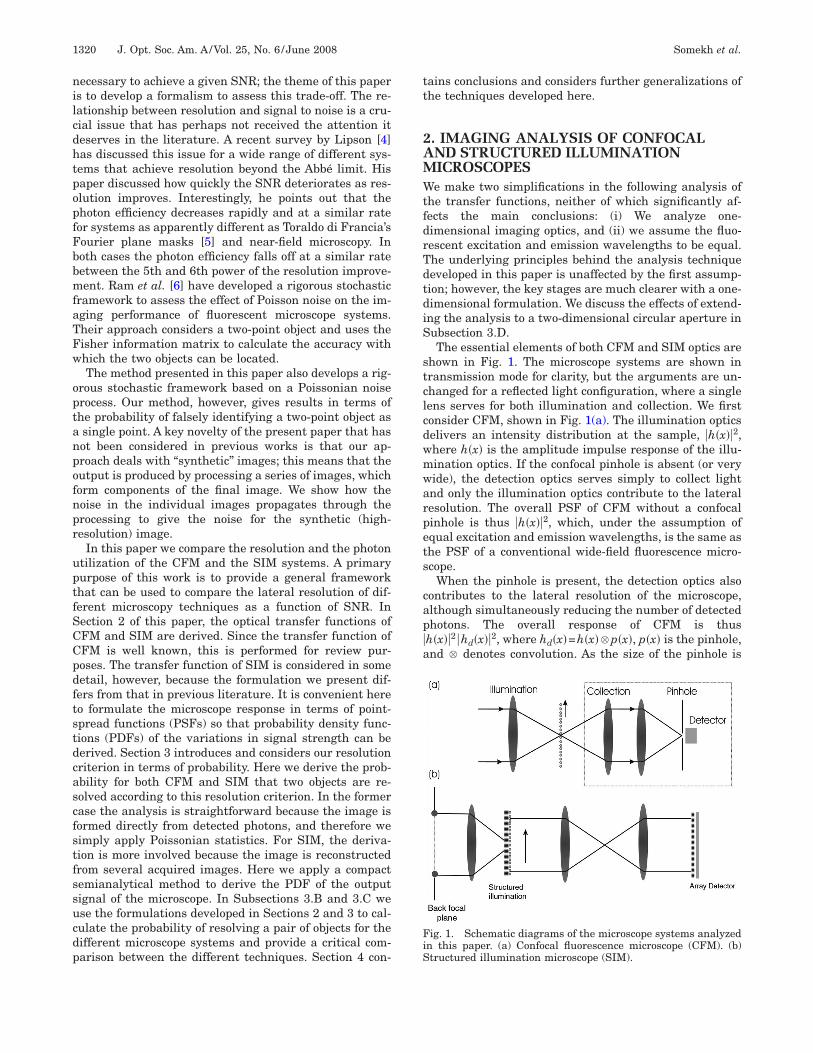
educed toward zero, p�x� becomes a delta function andherefore hd�x� tend toward h�x� and the system PSF ap-roaches �h�x��4. The solid triangle in Fig. 2 shows theransfer function (the Fourier transform of the PSF) foronventional fluorescence microscopy, or for CFM withoutpinhole, in units of normalized spatial frequency NA /�,here NA=sin � is the numerical aperture of the micro-
cope objective, � is the objective aperture half-angle, andis the excitation and emission wavelength. The transfer
unction of CFM with a point pinhole is thus the self-onvolution of the solid triangle and is plotted with theashed curve in Fig. 2. This means that for a point detec-ion CFM, spatial frequencies up to ±4NA /� can be de-ected, although the highest spatial frequencies areighly attenuated and the SNR would be very low.We now consider SIM as illustrated in Fig. 1(b), where
he sample is illuminated with a grating pattern. Thetructured illumination heterodynes (or mixes down)igh, out of band spatial frequencies into the passband ofhe microscope objective lens. In order to recover theseigh spatial frequencies, a process similar to that de-cribed in [1,2] is carried out. This requires that the grat-ng be translated by at least three phase steps and thatn image be acquired at each value of the illuminationhase. In the analysis to follow, and also in practice, fourhase steps are often used, as this is more robust in theresence of phase-stepping errors. The sum of the four ac-uired images is equal to the conventional wide-field fluo-escent image, but appropriate processing of the phase-tepped images reveals additional higher spatialrequencies in the object. The final output image can thene reconstructed by correctly recombining the differentrequency components and Fourier transforming backnto the spatial domain. For maximum resolution im-rovement it is necessary to use a grating of the highestpatial frequency allowed by the illumination optics. Thisay be achieved by illuminating the objective lens with
wo coherent point sources positioned at the edge of theack focal plane of the objective lens, as depicted inig. 1(b).
ig. 2. One-dimensional transfer functions of wide-field fluores-ence microscope or CFM with large pinhole (solid, bottomurve), CFM with small pinhole (dashed, middle curve), andide-field fluorescence microscope with doubled bandwidth (dot-
ed, top curve).
In the following paragraphs we derive the response ofIM, but rather than using Fourier methods, our analysisperates in the spatial domain. This provides a simplend elegant view of the system in its own right, but, forhe purposes of this paper, it also more readily lends itselfo the calculations of the PDFs discussed in Section 3.
Considering an object s�x�, a wide-field fluorescence mi-roscope image will be given by s�x� � �h�x��2. In SIM weypically acquire four images, each with a different phasef grating excitation. We can therefore represent the fourmages as follows:
i1�x� =1
2�1 + cos kgx�s�x� � H�x�, �1a�
i2�x� =1
2�1 − sin kgx�s�x� � H�x�, �1b�
i3�x� =1
2�1 − cos kgx�s�x� � H�x�, �1c�
i4�x� =1
2�1 + sin kgx�s�x� � H�x�, �1d�
here in�x� represents the four images used to recon-truct the composite image, H�x�= �h�x��2 and kg is therating vector of the illumination. The factor of 1/2 is in-luded so that the maximum intensity in each image isomparable to the maximum intensity without structuredllumination.
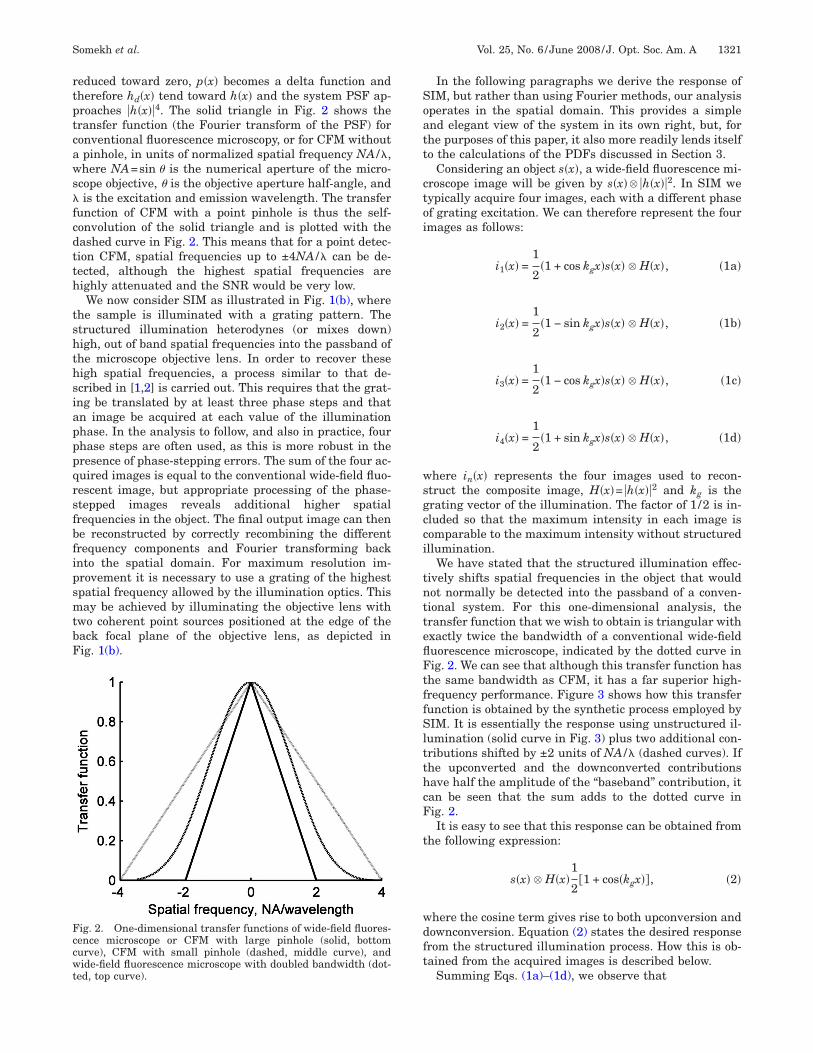
We have stated that the structured illumination effec-ively shifts spatial frequencies in the object that wouldot normally be detected into the passband of a conven-ional system. For this one-dimensional analysis, theransfer function that we wish to obtain is triangular withxactly twice the bandwidth of a conventional wide-fielduorescence microscope, indicated by the dotted curve inig. 2. We can see that although this transfer function has
he same bandwidth as CFM, it has a far superior high-requency performance. Figure 3 shows how this transferunction is obtained by the synthetic process employed byIM. It is essentially the response using unstructured il-
umination (solid curve in Fig. 3) plus two additional con-ributions shifted by ±2 units of NA /� (dashed curves). Ifhe upconverted and the downconverted contributionsave half the amplitude of the “baseband” contribution, itan be seen that the sum adds to the dotted curve inig. 2.It is easy to see that this response can be obtained from
he following expression:
s�x� � H�x�1
2�1 + cos�kgx��, �2�
here the cosine term gives rise to both upconversion andownconversion. Equation (2) states the desired responserom the structured illumination process. How this is ob-ained from the acquired images is described below.
Summing Eqs. (1a)–(1d), we observe that
T
w
W
Wt
Ns
s
Ecntmn
3DWcdsonshtat
AAfastqtsahtp
pt
F(flv
1322 J. Opt. Soc. Am. A/Vol. 25, No. 6 /June 2008 Somekh et al.
1
2s�x� � H�x� =
1
4�i1 + i2 + i3 + i4�. �3�
aking the Fourier transform of Eq. (1) yields
2i1�k� = H�k�s�k� +1
2H�k�s�k − kg� +
1
2H�k�s�k + kg�,
�4a�
2i2�k� = H�k�s�k� +j
2H�k�s�k − kg� −
j
2H�k�s�k + kg�,
�4b�
2i3�k� = H�k�s�k� −1
2H�k�s�k − kg� −
1
2H�k�s�k + kg�,
�4c�
2i4�k� = H�k�s�k� −j
2H�k�s�k − kg� +
j
2H�k�s�k + kg�,
�4d�
here the caret denotes Fourier transform.Simple manipulation gives
H�k�s�k − kg� = �i1�k� − i3�k�� − j�i2�k� − i4�k��, �5a�
H�k�s�k + kg� = �i1�k� − i3�k�� + j�i2�k� − i4�k��. �5b�
e now shift the expressions by −kg and kg, respectively,
�i1�k + kg� − i3�k + kg�� − j�i2�k + kg� − i4�k + kg��
= s�k�H�k + k �, �6a�
ig. 3. Synthesis of transfer function with doubled bandwidthdotted curve) by adding three transfer functions: conventionaluorescence microscope transfer function (solid curve), downcon-erted (dashed curve) and upconverted (dashed curve).
g
�i1�k − kg� − i3�k − kg�� + j�i2�k − kg� − i4�k − kg��
= s�k�H�k − kg�. �6b�
e then Fourier transform back into the spatial domaino give
s�x� � H�x�exp�− jkgx� = ��i1�x� − i3�x�� − j�i2�x� − i4�x���
�exp�− jkgx�, �7a�
s�x� � H�x�exp�jkgx� = ��i1�x� − i3�x�� + j�i2�x� − i4�x���
�exp�jkgx�. �7b�
ow, summing Eqs. (3), (7a), and (7b) allows the expres-ion in Eq. (2) to be obtained from the measured images.
�x� � H�x�1
2�1 + cos�kgx��
=1
4��1 + 2 cos kgx�i1 + �1 − 2 sin kgx�i2
+ �1 − 2 cos kgx�i3 + �1 + 2 sin kgx�i4�. �8�
quation (8) gives a simple expression that yields theomposite image from the measured images without theeed to perform Fourier transforms. For the purposes ofhis paper, Eq. (8) allows us to calculate a PDF for theeasured image distribution in the presence of shotoise.
. CALCULATION OF PROBABILITYENSITY FUNCTIONS FOR CFM AND SIMe make one further assumption in this section when
onsidering the noise analysis, namely, that shot noiseominates all other noise sources. This assumption repre-ents both the fundamental and the practical limit in anptimized microscope, as modern detectors for both scan-ing and wide-field microscopy are shot-noise limited. Forcanning systems, photon-counting photomultiplier tubesave been available for many years. For wide-field sys-ems such as SIM, affordable shot-noise-limited detectorsre becoming widely available in the form of electron mul-iplying charge coupled devices (EMCCDs).
. Some General Considerationss we are concerned with photon shot noise, the crucial
actor is the number of photons emitted by the samplend detected by the microscope system. We define theample brightness in terms of the actual number of pho-ons that pass through the objective lens divided by theuantum efficiency of the detector. “Detected” photonshus means the expected number of photons detected, as-uming all the photons passing through the microscopere available at the detector; clearly, because of the pin-ole in a confocal microscope, the number of photons ac-ually reaching the detector is smaller than the numberassing through the microscope system.If the pinhole of CFM is completely open, all photons
assing through the objective lens are available for detec-ion, which obviously maximizes the SNR. However the
PcFeieS
qFt4roamosatpttepoau
tl
fiedcfppcpr
BCTtjan0tctstbipi66narptftbt
Fax
F0
Somekh et al. Vol. 25, No. 6 /June 2008/J. Opt. Soc. Am. A 1323
SF is broader, so the overall imaging performance is aompromise between the SNR and the lateral resolution.or SIM, the number of photons detected includes themission from all four images that make up the compositemage. Direct comparison between CFM and SIM forquivalent photon doses on the sample will be made inubsection 3.C.Next, we define the parameters that will be used to
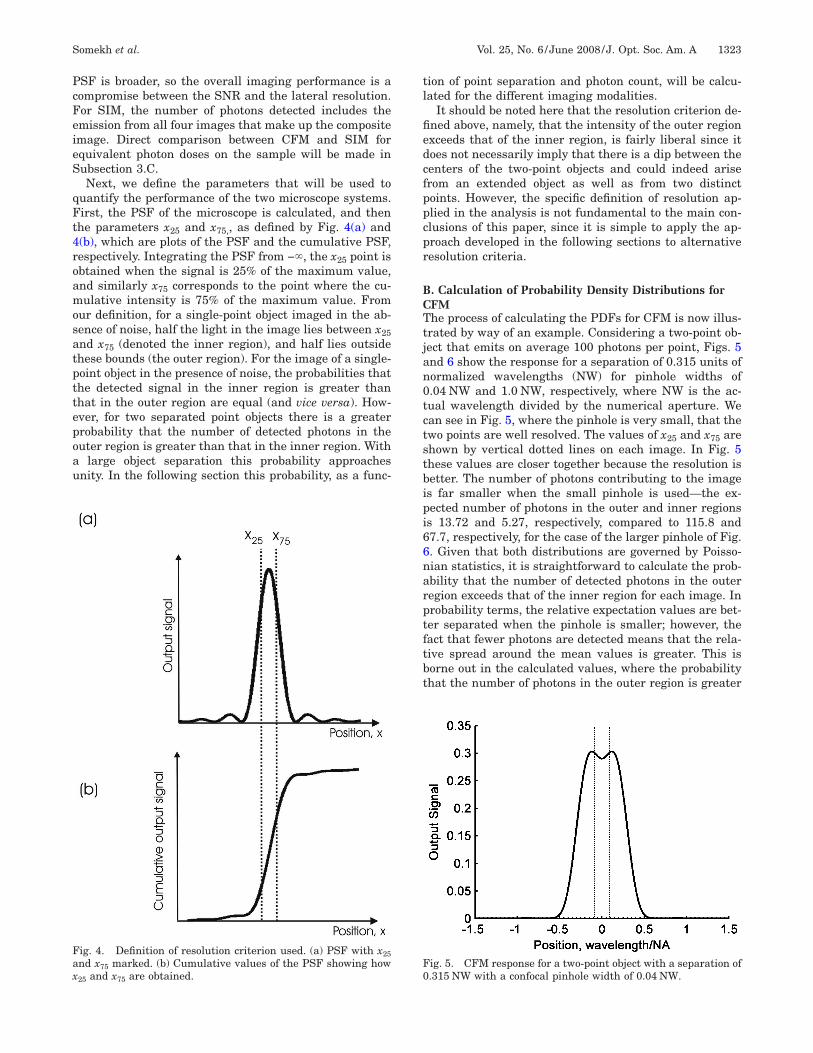
uantify the performance of the two microscope systems.irst, the PSF of the microscope is calculated, and thenhe parameters x25 and x75,, as defined by Fig. 4(a) and(b), which are plots of the PSF and the cumulative PSF,espectively. Integrating the PSF from −�, the x25 point isbtained when the signal is 25% of the maximum value,nd similarly x75 corresponds to the point where the cu-ulative intensity is 75% of the maximum value. From
ur definition, for a single-point object imaged in the ab-ence of noise, half the light in the image lies between x25nd x75 (denoted the inner region), and half lies outsidehese bounds (the outer region). For the image of a single-oint object in the presence of noise, the probabilities thathe detected signal in the inner region is greater thanhat in the outer region are equal (and vice versa). How-ver, for two separated point objects there is a greaterrobability that the number of detected photons in theuter region is greater than that in the inner region. With
large object separation this probability approachesnity. In the following section this probability, as a func-
ig. 4. Definition of resolution criterion used. (a) PSF with x25nd x75 marked. (b) Cumulative values of the PSF showing how
and x are obtained.
25 75ion of point separation and photon count, will be calcu-ated for the different imaging modalities.
It should be noted here that the resolution criterion de-ned above, namely, that the intensity of the outer regionxceeds that of the inner region, is fairly liberal since itoes not necessarily imply that there is a dip between theenters of the two-point objects and could indeed ariserom an extended object as well as from two distinctoints. However, the specific definition of resolution ap-lied in the analysis is not fundamental to the main con-lusions of this paper, since it is simple to apply the ap-roach developed in the following sections to alternativeesolution criteria.
. Calculation of Probability Density Distributions forFMhe process of calculating the PDFs for CFM is now illus-
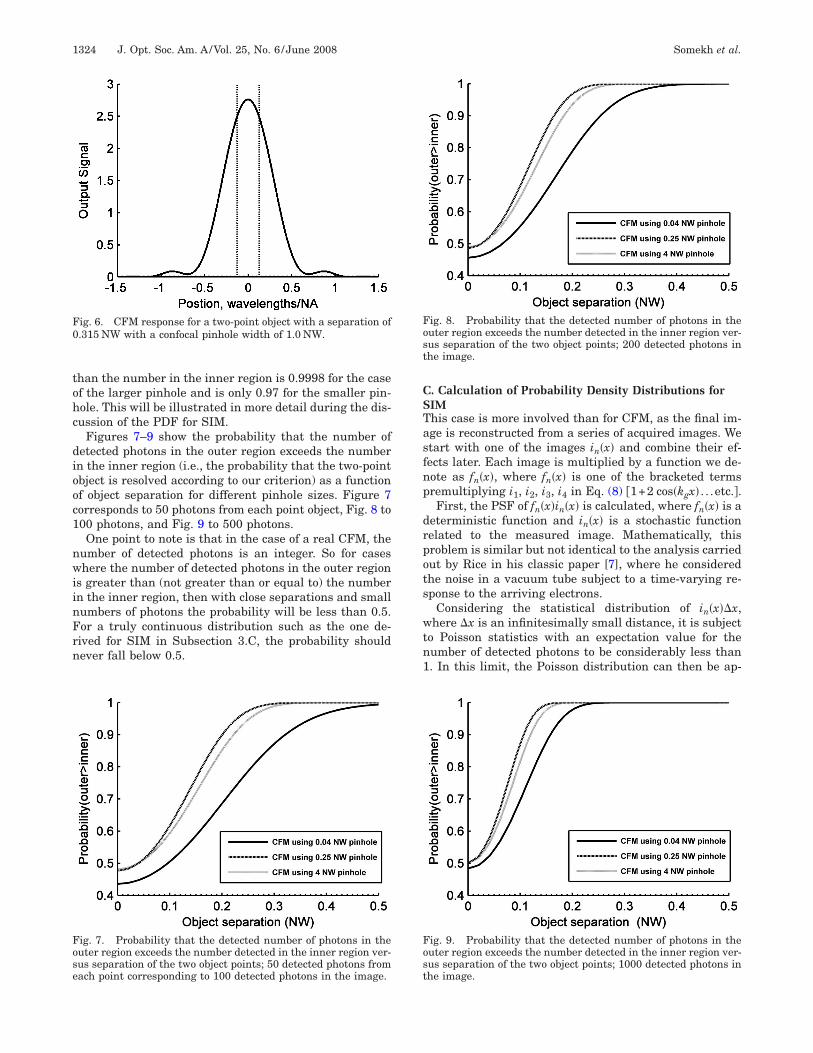
rated by way of an example. Considering a two-point ob-ect that emits on average 100 photons per point, Figs. 5nd 6 show the response for a separation of 0.315 units oformalized wavelengths (NW) for pinhole widths of.04 NW and 1.0 NW, respectively, where NW is the ac-ual wavelength divided by the numerical aperture. Wean see in Fig. 5, where the pinhole is very small, that thewo points are well resolved. The values of x25 and x75 arehown by vertical dotted lines on each image. In Fig. 5hese values are closer together because the resolution isetter. The number of photons contributing to the images far smaller when the small pinhole is used—the ex-ected number of photons in the outer and inner regionss 13.72 and 5.27, respectively, compared to 115.8 and7.7, respectively, for the case of the larger pinhole of Fig.. Given that both distributions are governed by Poisso-ian statistics, it is straightforward to calculate the prob-bility that the number of detected photons in the outeregion exceeds that of the inner region for each image. Inrobability terms, the relative expectation values are bet-er separated when the pinhole is smaller; however, theact that fewer photons are detected means that the rela-ive spread around the mean values is greater. This isorne out in the calculated values, where the probabilityhat the number of photons in the outer region is greater
ig. 5. CFM response for a two-point object with a separation of.315 NW with a confocal pinhole width of 0.04 NW.
tohc
diooc1
nwiinFrn
CSTasfnp
drpots
wtn1
F0
Fose
Fost
Fost
1324 J. Opt. Soc. Am. A/Vol. 25, No. 6 /June 2008 Somekh et al.
han the number in the inner region is 0.9998 for the casef the larger pinhole and is only 0.97 for the smaller pin-ole. This will be illustrated in more detail during the dis-ussion of the PDF for SIM.
Figures 7–9 show the probability that the number ofetected photons in the outer region exceeds the numbern the inner region (i.e., the probability that the two-pointbject is resolved according to our criterion) as a functionf object separation for different pinhole sizes. Figure 7orresponds to 50 photons from each point object, Fig. 8 to00 photons, and Fig. 9 to 500 photons.One point to note is that in the case of a real CFM, the
umber of detected photons is an integer. So for caseshere the number of detected photons in the outer region
s greater than (not greater than or equal to) the numbern the inner region, then with close separations and smallumbers of photons the probability will be less than 0.5.or a truly continuous distribution such as the one de-ived for SIM in Subsection 3.C, the probability shouldever fall below 0.5.
ig. 6. CFM response for a two-point object with a separation of.315 NW with a confocal pinhole width of 1.0 NW.
ig. 7. Probability that the detected number of photons in theuter region exceeds the number detected in the inner region ver-us separation of the two object points; 50 detected photons fromach point corresponding to 100 detected photons in the image.
. Calculation of Probability Density Distributions forIMhis case is more involved than for CFM, as the final im-ge is reconstructed from a series of acquired images. Wetart with one of the images in�x� and combine their ef-ects later. Each image is multiplied by a function we de-ote as fn�x�, where fn�x� is one of the bracketed termsremultiplying i1, i2, i3, i4 in Eq. (8) �1+2 cos�kgx� . . .etc.�.First, the PSF of fn�x�in�x� is calculated, where fn�x� is a
eterministic function and in�x� is a stochastic functionelated to the measured image. Mathematically, thisroblem is similar but not identical to the analysis carriedut by Rice in his classic paper [7], where he consideredhe noise in a vacuum tube subject to a time-varying re-ponse to the arriving electrons.
Considering the statistical distribution of in�x��x,here �x is an infinitesimally small distance, it is subject
o Poisson statistics with an expectation value for theumber of detected photons to be considerably less than. In this limit, the Poisson distribution can then be ap-
ig. 8. Probability that the detected number of photons in theuter region exceeds the number detected in the inner region ver-us separation of the two object points; 200 detected photons inhe image.
ig. 9. Probability that the detected number of photons in theuter region exceeds the number detected in the inner region ver-us separation of the two object points; 1000 detected photons inhe image.
pmfa
Nptw
w
ftt
ft
T
I
Ioiw
wttt
sp
TtNtap
twpsiocvtHtfvPcwstaftsTvDtt
tcsst
ecnns
Ftpst
Somekh et al. Vol. 25, No. 6 /June 2008/J. Opt. Soc. Am. A 1325
roximated by assuming that the probability of detectingore than one photon is vanishingly small, leading to the
ollowing results for the probability distribution for overn infinitesimal region of in�x�:
p�0� = exp�− in�x��x� � 1 − in�x��x, �9a�
p�1� = in�x��x exp�− in�x��x� � in�x��x. �9b�
oting that for two independent PDFs p1�y� and p2�z�, therobability p�y+z� is given by p1�y� � p2�z� [8]. This canhen be used to calculate the characteristic function C���,hich is the Fourier transform of the PDF. That is,
C��� =−�
�
p�y�exp�j�y�dy, �10�
here y is the detected signal.Therefore the characteristic function of the composite
unction can be calculated by multiplying all the infini-esimal characteristic functions and inverse transforminghe result to get the PDF.
We now extend this idea from in�x� to get the PDF of�x�in�x�, noting that in this case the detection of one pho-on returns a value of f�x�.
p�0� = exp�− in�x��x���y� � �1 − in�x��x���y�, �11a�
p�f�x�� = in�x��x exp�− in�x��x���y − f�x��
� in�x��x��y − f�x��. �11b�
he characteristic function is therefore given by
Cn��� � 1 + in�x��x�exp�j�fn�x�� − 1�. �12�
n the limit that �x→0 the expression of Eq. (12) becomes
Lim�x→0
Cn��� → exp�in�x��x�exp�j�fn�x�� − 1��. �13�
n order to get the characteristic function over the regionf interest, Cn
R���, we need to multiply all the character-stic functions corresponding to the infinitesimal regions,hich involves integrating the exponent thus:
CnR��� = exp
R
�exp�j�fn�x�� − 1�in�x�dx� , �14�
here R defines the region over which we integrate. Forhe outer region, this consists of two subregions from −�o x25 and from x75 to �; the inner region requires integra-ion from x25 to x75.
To obtain the characteristic function of the completeystem, the characteristic functions for each of the fourhase steps are then multiplied together.
CR��� = �1
4
CnR��,�. �15�
he PSF for the overall microscope response is simply ob-ained from the inverse Fourier transform of Eq. (15).ote that when f�x�=1, the expression in Eq. (13) reduces
o the characteristic function for the Poisson distributions given in [9], with the integral of i�x� simply the ex-ected number of detected photons.
Figure 10 shows the real part of the characteristic func-ion obtained for a structured illumination microscopeith 400 photons in the image for the case where two-oint objects, each emitting on average 200 photons, areeparated by 0.15 NW. The solid curve corresponds to thenner region, and the dashed curve corresponds to theuter region. The high frequency of the outer region indi-ates that the mean value of the PDF will be greater. Theariance of the PDF is related to the decay of the oscilla-ions. As the PDF is real, the characteristic function isermitian, so the imaginary part (not shown) passes
hrough the origin. The real part of the characteristicunction as shown is equal to unity when the transformariable is zero, simply indicating that the area under theDF curve is also 1. Figures 11 and 12 show the PDFs cal-ulated for the conditions stated above for a microscopeith and without structured illumination, respectively. It
hould be noted that while without structured illumina-ion the PDF is a true Poisson distribution, it is shown ascontinuous distribution for clarity in Fig. 11. There is a
ar greater separation of the mean values when struc-ured illumination is used. This arises from the greaterpatial bandwidth of the structured illumination system.his feature is somewhat mitigated by the fact that theariance of the structured illumination PDFs are greater.espite the increased variance, it is clear that in this case
he overlap between the two curves is far less for struc-ured illumination than for conventional illumination.
Figure 13 shows the variation in probability of detec-ion for SIM for 100, 200, and 1000 photons in the image,orresponding to the cases shown for the confocal micro-cope in Figs. 7–9, respectively. We can see that for anyeparation the probability of detection is better than allhe cases for the CFM.
A more direct comparison is shown in Fig. 14. In gen-ral, performance improves as the number of photons in-reases and may be expressed as the number of photonsecessary to ensure the probability that the detected sig-al in the outer region appears greater than the mea-ured signal in the inner region exceeds a certain value.
ig. 10. Real part of the characteristic function of the SIM sys-em with a total of 400 detected photons in the image for a two-oint object with a separation of 0.15 NW. The solid curve corre-ponds to the inner region, and the dashed curve corresponds tohe outer region.
FpsarfiCsf(Prttlccmmp
tatsttctp
DTfp
Fr
Fpor(cfl(t
Frpdd
Fm1
1326 J. Opt. Soc. Am. A/Vol. 25, No. 6 /June 2008 Somekh et al.
igure 14 is a plot of the number of photons required for arobability of 0.99 versus object separation. Curves corre-ponding to SIM and to CFM with different pinhole sizesre shown. It is clear that SIM is far superior to confocal,equiring less photons for all object separations. In thisgure the dashed and the dotted curves correspond to theFM cases; the dashed curve represents the case of amall pinhole aperture �0.04 NW�. The best performanceor CFM corresponds to the pinhole equal to 0.25 NWdotted curve), which gives the best compromise betweenSF and photon collection. The dotted–dashed curve cor-esponds to a wide pinhole of 4 NW, which is essentiallyhe response of wide-field fluorescence microscopy. Thehick solid curve shows the response for the structured il-umination microscope, which is superior to any of theurves corresponding to the CFM. The thin solid curveorresponds to a hypothetical conventional fluorescenceicroscope with twice the numerical aperture of the othericroscopes studied here (of course, this may not be
hysically realizable).
ig. 12. Probability density distribution for a conventional fluo-escence microscope with the same conditions as in Fig. 10.
ig. 11. Probability density distribution for the SIM system cor-esponding to an object separation of 0.15 NW and 400 detectedhotons in the image. The solid curve denotes the probabilityensity distribution corresponding to the inner region, and theashed curve corresponds to the outer region.
v
The structured illumination microscope performs ex-remely well in terms of noise performance, although nots well as a conventional fluorescence microscope withwice the numerical aperture, even though this micro-cope will have the same transfer function. For separa-ions up to 0.3 NW, approximately 3 times as many pho-ons are required to recover an image of similar qualityompared to the conventional fluorescence system withwice the numerical aperture (but similar light gatheringower).
. Effects of Extension to Two-Dimensional Geometryhe analysis described in this paper has been carried out
or a one-dimensional geometry. The stochastic approachresented here is applicable to a more realistic two-
ig. 14. Total number of image photons required to ensure arobability of 0.99 that the detected number of photons in theuter region exceeds the detected number of photons in the inneregion. (Top to bottom) CFM using a 0.04 NW pinhole widthdashed curve); CFM using a 4 NW pinhole width (dotted–dashedurve), which is essentially the case of a conventional wide-fielduorescence microscope; CFM using a 0.25 NW pinhole width
light gray curve). The thick solid curve corresponds to the struc-ured light microscope. The thin solid curve corresponds to a con-
ig. 13. Probability of detection for a structured illuminationicroscope with 100 (black solid curve), 200 (dashed curve), and
000 photons (light solid curve) used to form the image.
entional fluorescence microscope with doubled bandwidth.
dtrddtottccndtaptte“
dstc4tasgct
tc1atvatcfm
4Itgpt
vasTftPuwi
ftbSmlg
dsTtao
tdstfttpns
hgomTfiaCcu
ATWc
S
OT
Somekh et al. Vol. 25, No. 6 /June 2008/J. Opt. Soc. Am. A 1327
imensional geometry. There are several reasons why thewo-dimensional case is more involved, and we thereforeestrict the detailed discussion of this paper to a one-imensional geometry. In one dimension, under ideal con-itions, the transfer function of the microscope with ex-ended resolution is precisely the same as would bebtained with a conventional fluorescent microscope withwice the numerical aperture (Fig. 3). In two dimensionshe higher frequencies are more attenuated, so a directomparison with the hypothetical conventional fluores-ence microscope with twice the numerical apertureeeds to be treated with some caution. In addition, in twoimensions a truly circularly symmetrical response is ob-ained only when a large number of grating projectionsligned at different azimuthal directions are used. Theerformance is therefore dependent on the orientation ofhe object with respect to the direction of these projec-ions. Projections normal to the object direction will notnhance the resolution but will add as much noise asuseful” grating projection directions.
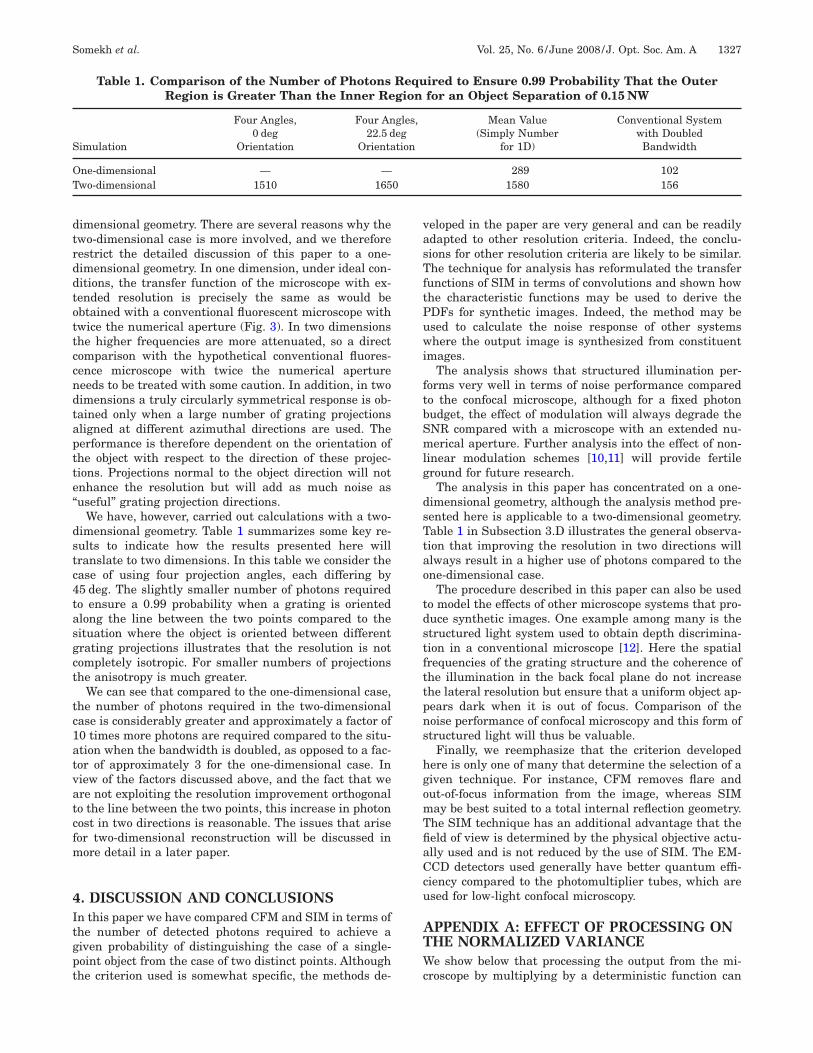
We have, however, carried out calculations with a two-imensional geometry. Table 1 summarizes some key re-ults to indicate how the results presented here willranslate to two dimensions. In this table we consider thease of using four projection angles, each differing by5 deg. The slightly smaller number of photons requiredo ensure a 0.99 probability when a grating is orientedlong the line between the two points compared to theituation where the object is oriented between differentrating projections illustrates that the resolution is notompletely isotropic. For smaller numbers of projectionshe anisotropy is much greater.
We can see that compared to the one-dimensional case,he number of photons required in the two-dimensionalase is considerably greater and approximately a factor of0 times more photons are required compared to the situ-tion when the bandwidth is doubled, as opposed to a fac-or of approximately 3 for the one-dimensional case. Iniew of the factors discussed above, and the fact that were not exploiting the resolution improvement orthogonalo the line between the two points, this increase in photonost in two directions is reasonable. The issues that ariseor two-dimensional reconstruction will be discussed inore detail in a later paper.
. DISCUSSION AND CONCLUSIONSn this paper we have compared CFM and SIM in terms ofhe number of detected photons required to achieve aiven probability of distinguishing the case of a single-oint object from the case of two distinct points. Althoughhe criterion used is somewhat specific, the methods de-
Table 1. Comparison of the Number of PhotonsRegion is Greater Than the Inner Re
imulation
Four Angles,0 deg
Orientation
Four An22.5 d
Orienta
ne-dimensional — —wo-dimensional 1510 165
eloped in the paper are very general and can be readilydapted to other resolution criteria. Indeed, the conclu-ions for other resolution criteria are likely to be similar.he technique for analysis has reformulated the transfer
unctions of SIM in terms of convolutions and shown howhe characteristic functions may be used to derive theDFs for synthetic images. Indeed, the method may besed to calculate the noise response of other systemshere the output image is synthesized from constituent
mages.The analysis shows that structured illumination per-
orms very well in terms of noise performance comparedo the confocal microscope, although for a fixed photonudget, the effect of modulation will always degrade theNR compared with a microscope with an extended nu-erical aperture. Further analysis into the effect of non-
inear modulation schemes [10,11] will provide fertileround for future research.
The analysis in this paper has concentrated on a one-imensional geometry, although the analysis method pre-ented here is applicable to a two-dimensional geometry.able 1 in Subsection 3.D illustrates the general observa-ion that improving the resolution in two directions willlways result in a higher use of photons compared to thene-dimensional case.
The procedure described in this paper can also be usedo model the effects of other microscope systems that pro-uce synthetic images. One example among many is thetructured light system used to obtain depth discrimina-ion in a conventional microscope [12]. Here the spatialrequencies of the grating structure and the coherence ofhe illumination in the back focal plane do not increasehe lateral resolution but ensure that a uniform object ap-ears dark when it is out of focus. Comparison of theoise performance of confocal microscopy and this form oftructured light will thus be valuable.
Finally, we reemphasize that the criterion developedere is only one of many that determine the selection of aiven technique. For instance, CFM removes flare andut-of-focus information from the image, whereas SIMay be best suited to a total internal reflection geometry.he SIM technique has an additional advantage that theeld of view is determined by the physical objective actu-lly used and is not reduced by the use of SIM. The EM-CD detectors used generally have better quantum effi-iency compared to the photomultiplier tubes, which aresed for low-light confocal microscopy.
PPENDIX A: EFFECT OF PROCESSING ONHE NORMALIZED VARIANCEe show below that processing the output from the mi-
roscope by multiplying by a deterministic function can
ired to Ensure 0.99 Probability That the Outerfor an Object Separation of 0.15 NW
Mean Value(Simply Number
for 1D)
Conventional Systemwith Doubled
Bandwidth
289 1021580 156
Requgion
gles,egtion
0
nv
isjroci
wtpip
i[
Idc
tcf
Wc
Wt
T
W
S
Wftei
N
IE
R
1328 J. Opt. Soc. Am. A/Vol. 25, No. 6 /June 2008 Somekh et al.
ever increase the SNR; this corresponds to the increasedariance shown in the body of the paper.
The key metric to describe the SNR of an isolated objects the variance divided by the mean-square output. In es-ence, this describes the ability to identify an isolated ob-ect. This does not, of course, relate to the resolution di-ectly, since the separation of the means of the inner anduter distributions is also involved in the resolution pro-ess as discussed in Subsection 3.C. We pose the questionn the form of the normalized variance represented below:
�2
2�unprocessed
�2
2�processed
= y2� − y�2
y�2 , �A1�
here and �2 are the mean and the variance, respec-ively, of the PDF of the microscope response p�y�. Therocessed signal corresponds to the output after multiply-ng each image by a spatially varying signal such as thoseresented in Eq. (8).Starting with the characteristic function, C���, which
s the Fourier transform of the PDF, p�y�, derived earlierEq. (13)]:
C��� = expR
�exp�j�f�x�� − 1�i�x�dx� . �A2�
n Eq. (A2) the superscripts used in the main text are nowropped, since we are not confining ourselves to the spe-ific cases studied in this paper.
The normalized variance can be expressed in terms ofhe first and the second moments, which in turn can bealculated in terms of the derivatives of the characteristicunctions:
�C������=0 = j y�; �C������=0 = − y2�. �A3�
e can therefore relate the normalized variance to theharacteristic function below:
y2� − y�2
y�2 =�C������=0 − �C������=0
2
�C������=02 . �A4�
e evaluate the differentials of the characteristic func-ion by taking
Lim��→0
=C�� + ��� − C���
��. �A5�
his gives
C���� = jC���R
f�x�i�x�dx,
C���� = jC����R
f�x�i�x�exp�j�f�x��dx
− C���R
�f�x��2i�x�exp�j�f�x��dx. �A6�
hen evaluated at �=0, this gives
�C������=0 = jR
f�x�i�x�dx,
�C������=0 = − �R
f�x�i�x�dx�2
−R
�f�x��2i�x�dx.
�A7�
ubstituting Eq. (A7) into Eq. (A4) gives
y2� − y�2
y�2 =
R
�f�x��2i�x�dx
�R
f�x�i�x�dx�2 . �A8�
e now wish to compare the parameter for an arbitraryunction, f�x�, corresponding to the processed signal withhe case where f�x�=1, which corresponds to the unproc-ssed signal. If this is the case, the relationship expressedn Eq. (A9) applies:
R
�f�x��2i�x�dx
�R
f�x�i�x�dx�2 �
R
i�x�dx
�R
i�x�dx�2 =1
R
i�x�dx
. �A9�
ow Schwarz’s inequality states that
R
���x��2dx
�R
�x���x�dx�2 �1
R
� �x��2dx
. �A10�
f we associate the �x�→�i�x� and ��x�→ f�x��i�x�, thenq. (A9) is proved.
EFERENCES1. M. G. L. Gustafsson, “Surpassing the lateral resolution
limit by a factor of two using structured illuminationmicroscopy,” J. Microsc. 198, 82–87 (2000).
2. M. G. L. Gustafsson, D. A. Agard, and J. W. Sedat,“Doubling the lateral resolution of wide-field fluorescencemicroscopy using structured illumination,” Proc. SPIE3919, 141–150 (2000).
3. H. H. Hopkins and P. M. Barham, “The influence of thecondenser on microscopic resolution,” Proc. Phys. Soc.London, Sect. B 63, 737–744 (1950).
4. S. G. Lipson, “Why is super-resolution so inefficient?”Micron 34, 309–312 (2003).
5. G. Toraldo di Francia, “Super-gain antennas and opticalresolving power,” Nuovo Cimento, Suppl. 9, 426–438(1952).
6. S. Ram, E. S. Ward, and R. J. Ober, “Beyond Rayleigh’scriterion: a resolution measure with application to single-molecule microscopy,” Proc. Natl. Acad. Sci. U.S.A. 103,4457–4462 (2006).
7. S. O. Rice, “Mathematical analysis of random noise,” BellSyst. Tech. J. 23, 282–332 (1944).
8. R. N. Bracewell, “Applications in statistics,” in The FourierTransform and Its Applications, 3rd ed. (McGraw-Hill,2000), pp. 428–438.

1
1
1
Somekh et al. Vol. 25, No. 6 /June 2008/J. Opt. Soc. Am. A 1329
9. A. Papoulis and S. U. Pillai, “Characteristic functions,” inProbability, Random Variables and Stochastic Processes(McGraw-Hill, 2002), Chap. 5, pp. 152–168.
0. M. G. L. Gustafsson, “Nonlinear structured-illuminationmicroscopy: wide-field fluorescence imaging withtheoretically unlimited resolution,” Proc. Natl. Acad. Sci.
U.S.A. 102, 13081–13086 (2005).1. R. Heintzmann, “Saturated patterned excitationmicroscopy with two-dimensional excitation patterns,”Micron 34, 283–291 (2003).
2. M. A. A. Neil, R. Juskaitis, and T. Wilson, “Method ofobtaining optical sectioning by using structured light in aconventional microscope,” Opt. Lett. 22, 1905–1907 (1997).
Related Documents