Resilient Today for a Brighter Tomorrow ANNUAL REPORT 2020-21 NAYARA ENERGY LIMITED

Welcome message from author
This document is posted to help you gain knowledge. Please leave a comment to let me know what you think about it! Share it to your friends and learn new things together.
Transcript

Resilient Today for a Brighter Tomorrow
ANNUAL REPORT 2020-21NAYARA ENERGY LIMITED
RESILIENT TODAY FOR A BRIGHTER TOMORROW
RESILIENT TODAYResilience is an attribute that is not built overnight and may not be visible on the surface. The real character of an organisation is unleashed when faced with challenges. While COVID-19 brought unprecedented disruption to the worlds of commerce and governance, Nayara Energy found itself agile and reinvented - not only to navigate well through a year marked by challenges, but also to persevere determinedly with its focused agenda.
Backed by the building blocks of growth established over recent years, Nayara Energy has demonstrated remarkable resilience, driving robust initiatives that speak to our true potential. At Nayara Energy, growth must always be inclusive. As a result, we prioritise the wellbeing and socio-economic development of our communities. To us, providing them with due support through the current pandemic, has been extremely important. Our focused initiatives with local administrations and various government departments have been fundamental in building resilience within many households during the crisis. Despite the various challenges of a highly unusual year, Nayara Energy delivered commendable performance for our shareholders in FY2021.
A BRIGHTER TOMORROWEnergy is fundamental to mankind’s progress. As a leading energy provider, Nayara Energy augurs future growth by embracing technology, and encouraging innovation that meets the energy and petrochemical needs of India’s growing population. Our future is truly underpinned by the opportunities of a reforming energy sector within the country, our own operational and functional excellence, and our highly capable talent. Leveraging the opportunities ahead of us and using our transformational strategies to make the best use of our resources, we are prepared for a journey towards a brighter tomorrow.
While COVID-19 brought unprecedented disruption to the worlds of commerce and governance, Nayara Energy found itself agile and reinvented - not only to navigate well through a year marked by challenges, but also to persevere determinedly with its focused agenda.
2 3

WHO WE AREWE ARE A DYNAMIC AND NEW-AGE DOWNSTREAM COMPANYNayara Energy is a new-age downstream energy & petrochemicals company of international scale with a unique mix of young and experienced minds and a robust foundation of best-in-class infrastructure and processes with a desire to deliver excellence, every step of the way.
Nayara Energy owns and operates India’s second-largest single-site, state-of-the-art refinery, and one of the most modern and complex refineries in the country. With businesses straddling across the hydrocarbon value chain, from refining to retail, we are primely positioned to realise our vision for delivering crude to chemicals.
As the fastest growing pan India fuel retail network, Nayara Energy is powering India’s growing energy demands.
Driving inclusive growth, providing a safe environment and delivering value for our stakeholders, including society-at-large, is at the heart of what we believe in.
We continue to partner with our the communities through various sustainable development projects, in the areas of health & nutrition, education & skill development and sustainable livelihoods & environment, playing a pivotal role in improving their quality of life.
OUR VALUES
ENERGETICWe are constantly looking at better ways to shape tomorrow, today and we do this with a sense of zeal and determination. By making a tangible difference through our products, services, and interactions; we are determined to continually energise the lives of our stakeholders.
XTRAORDINARYPivotal in our journey towards an ‘xtraordinary’ future is our creative, diligent and high-potential workforce that constantly asks the question, “Is there a better way of doing things?”
COURAGEOUSWe welcome new challenges and chase big dreams with conviction. Taking bold steps to succeed in the ever-changing Indian and global energy markets is what makes us stronger, faster and better.
ETHICALWe honour commitments. Be it in our dealings with the environment, people or community, we always do things the right way - with integrity, consistency and transparency.
LEADWe lead by example. By being proactive, taking ownership of our actions, and building a team that is future-ready, we challenge the status quo to always stay one-step ahead of the rest.
Nayara Energy owns and operates India’s second-largest single-site, state-of-the-art refinery, and one of the most modern and complex refineries in the country.
4 5
CORPORATE OVERVIEW
Key Performance Indicators 10
Chairman’s Note 12
CEO’s Message 16
Board of Directors 20
Management Committee 22
FINANCIAL STATEMENTS
Independent Auditor’s Report on Standalone Financial Statements 70
Standalone Financial Statements 78
Independent Auditor’s Report on Consolidated Financial Statements 142
Consolidated Financial Statements 147
Form AOC-1 213
BOARD’S REPORT 26
AGM NOTICE 214
CONTENTS
CORPORATE OVERVIEW
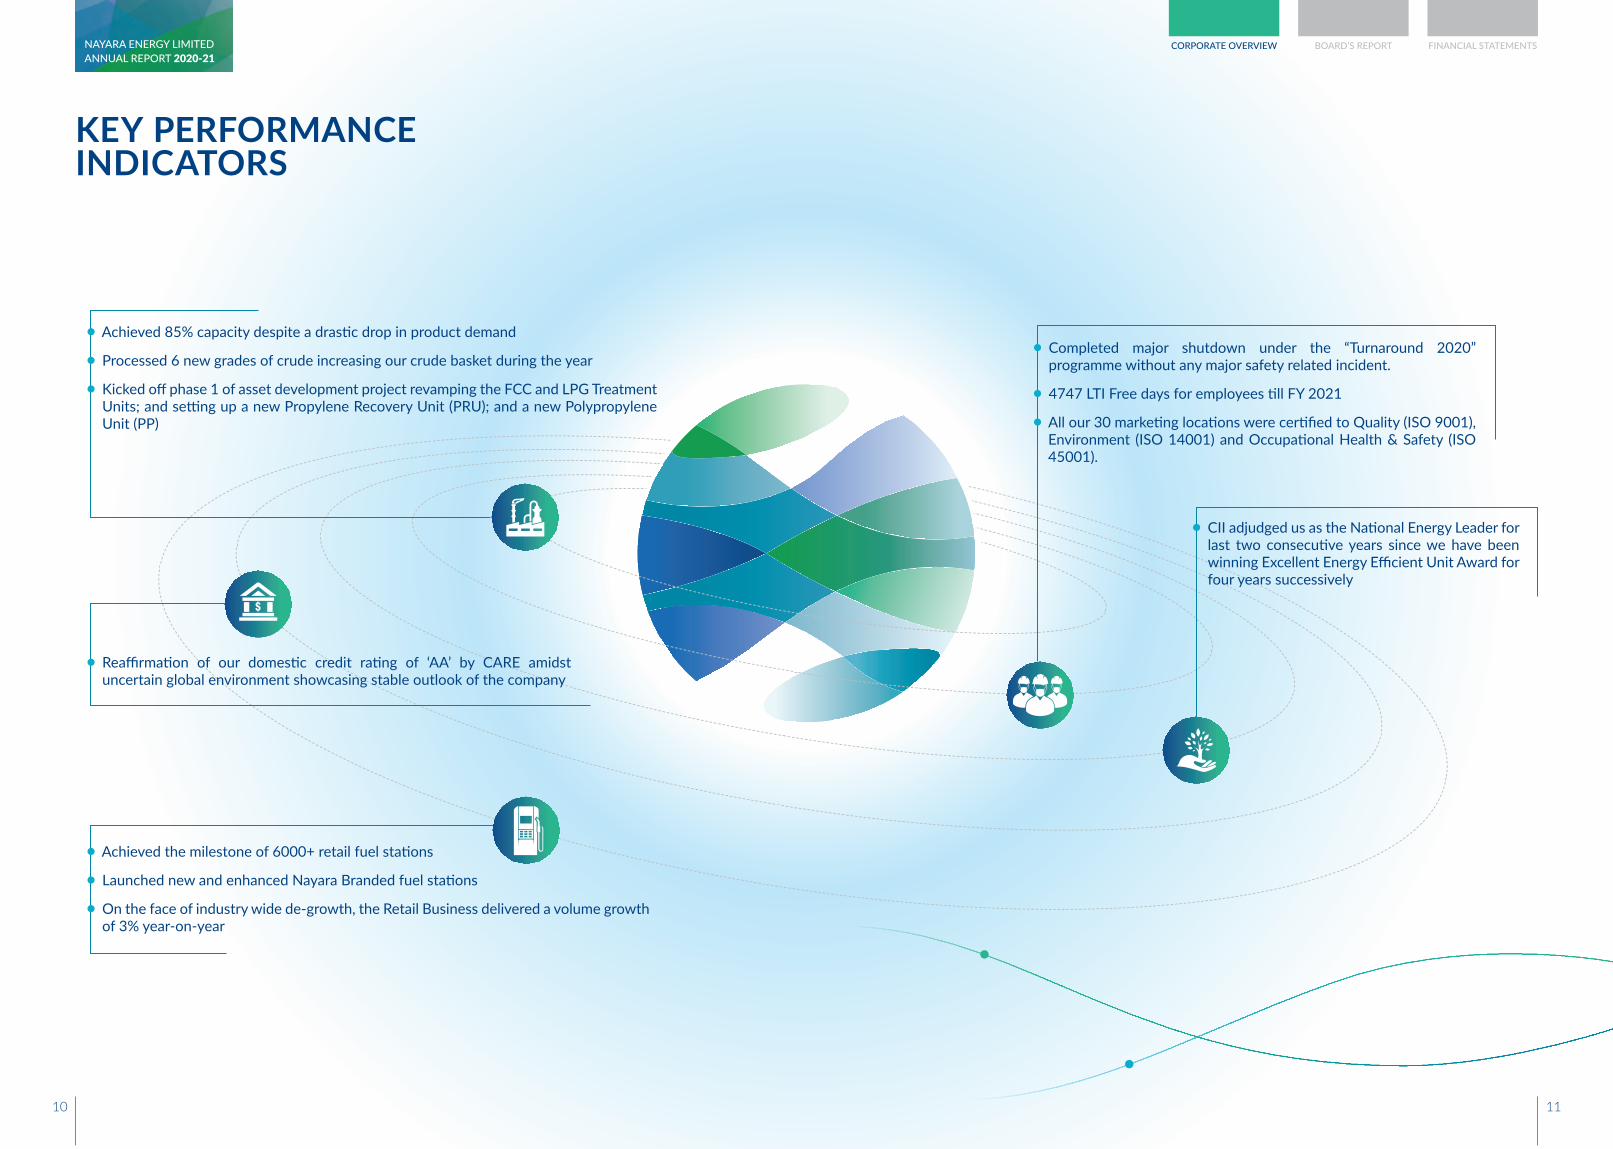
Achieved 85% capacity despite a drastic drop in product demand
Processed 6 new grades of crude increasing our crude basket during the year
Kicked off phase 1 of asset development project revamping the FCC and LPG Treatment Units; and setting up a new Propylene Recovery Unit (PRU); and a new Polypropylene Unit (PP)
Reaffirmation of our domestic credit rating of ‘AA’ by CARE amidst uncertain global environment showcasing stable outlook of the company
Achieved the milestone of 6000+ retail fuel stations
Launched new and enhanced Nayara Branded fuel stations
On the face of industry wide de-growth, the Retail Business delivered a volume growth of 3% year-on-year
Completed major shutdown under the “Turnaround 2020” programme without any major safety related incident.
4747 LTI Free days for employees till FY 2021
All our 30 marketing locations were certified to Quality (ISO 9001), Environment (ISO 14001) and Occupational Health & Safety (ISO 45001).
CII adjudged us as the National Energy Leader for last two consecutive years since we have been winning Excellent Energy Efficient Unit Award for four years successively
KEY PERFORMANCE INDICATORS
ANNUAL REPORT 2020-21NAYARA ENERGY LIMITED CORPORATE OVERVIEW BOARD’S REPORT FINANCIAL STATEMENTS
10 11
CHAIRMAN’S NOTE
Dear Shareholders,Last year was like no other in recent history. As the situation began to improve and businesses started recovering in early 2021, India found itself at the centre-stage of the second wave of the COVID-19 pandemic. The unforeseen spike in cases overwhelmed the nation, consuming its resources and healthcare infrastructure, compelling many States to return to complete or partial lockdowns. We have lost cherished employees and feel and share the grief of their families.
Amidst this humanitarian crisis, we salute the spirit and tireless efforts of countless frontline workers in combatting the virus. With the vaccination programme well under way, there is hopefully a path that will allow us to live alongside this awful virus.
The impact of the pandemic on the global oil industry was severe and unprecedented. World oil demand has partially recovered but it is still a very turbulent and dynamic period. The environment has been very challenging for Nayara and we are by no means unscathed. The performance that has been delivered and our financial position is attributable to the courage and agility of the Nayara team, its leadership and the support of our shareholders.
The impact of the pandemic on the global oil industry was severe and unprecedented. World oil demand has partially recovered but it is still a very turbulent and dynamic period. The environment has been very challenging for Nayara and we are by no means unscathed. The performance that has been delivered and our financial position is attributable to the courage and agility of the Nayara team, its leadership and the support of our owners.
TONY FOUNTAINExecutive Chairman
ANNUAL REPORT 2020-21NAYARA ENERGY LIMITED CORPORATE OVERVIEW BOARD’S REPORT FINANCIAL STATEMENTS
12 13
Resilience in a crisisThrough this crisis, it is to the credit of the Management that we kept all of our operations running. Indeed against the backdrop of overall decline, our fuel retail business grew by 3%. Despite challenges of depleting demand and availability of heavy crude oil in FY2021, our refinery in Vadinar operated above 85% capacity. The refinery also successfully delivered a scheduled shutdown, with over 10000 contract workforce on site, during the first wave without spreading infection.
We have continued to deliver the required financial liquidity to support and grow our business as well as maintain stability through this turbulent period. We maintained the AA credit rating vindicating the progress made in our financial transformation journey.
The significant investments in digitization and automation in the last three years really paid off as we were able to seamlessly move to work-from-home (WFH) and close the books in a record time. The goal is to automate every aspect of our business to build a future-ready organization.
We remain committed to help make India a petrochemical hub of the world. Aligned with the Government of India’s vision of Atmanirbhar Bharat, our focus is to build a world-class integrated petrochemical complex to fulfil India’s growing demand for petrochemicals. There is now concrete progress in
delivering the first phase polypropylene expansion of our journey. A Key milestone is the appointment of Thyssenkrupp, Toyo and Technip as partners for this programme.
Support to Communities During these extraordinary times, we have driven a multi-pronged support strategy to provide Covid relief in and around Vadinar. Nayara has set up a Covid Care centre comprising of 50 beds to treat patients with mild infection. The overall operation and management of the Centre is being led by the Company in collaboration with Helpage India and the Gram Panchayat in Jhakhar Village. A Mobile Health Van has been launched that provides services to more than 20,000 people across ten villages in Khambhallia Taluka and supplied PPE kits, ventilators, oxygen cylinders, and equipment for medical professionals and frontline workers. Nayara’s Community Health Project encompassing primary healthcare services, pathological facilities and emergency response infrastructure has benefitted more than 50,000 people across 15 villages in Jamnagar and Devbhumi Dwarka districts.
The Company is consistently working to foster inclusive development through effective programs in the areas of health and nutrition, education & skill development and sustainable livelihoods. In collaboration with various partners, we are enhancing the ability of the youth and women in the community through skill development initiatives.
Changes for the FutureAt the end of this financial year, we announced key leadership changes to drive performance and deliver our strategy over the coming years. Mr. B Anand the erstwhile CEO of Nayara Energy played a very crucial role as first CEO of Nayara Energy in its new avatar. I would like to personally thank Anand for guiding the company through its post-acquisition transformation journey and laying a strong foundation to translate our vision to strengthen India’s energy security. Starting April 1st 2021, Dr Alois Virag has joined Nayara Energy as our new CEO. I welcome him to lead the Company through the next exciting period. Alois is a senior and highly experienced oil downstream and petrochemical executive having spent more than 30 years at OMV, most recently as a senior vice president running their Middle Eastern and Asian interests.
I remain confident that Nayara Energy will continue on its path to strengthen India’s energy and petrochemical security, while also supporting the near term fight against coronavirus. We remain committed to delivering performance on behalf of our shareholders and in the interest of the wider community we engage with.
Warm regards,
Tony FountainExecutive Chairman
We remain committed to help make India a petrochemical hub of the world. Aligned with the Government of India’s vision of Atmanirbhar Bharat, our focus is to build a world-class integrated petrochemical complex to fulfil India’s growing demand for petrochemicals. There is now concrete progress in delivering the first phase polypropylene expansion of our journey.
CHAIRMAN’S NOTE
I remain confident that Nayara Energy will continue its path to strengthen India’s energy and petrochemical security, while also supporting the near-term fight against coronavirus. We remain committed to delivering performance on behalf of our shareholders and in the interest of the wider community we engage with.
ANNUAL REPORT 2020-21NAYARA ENERGY LIMITED CORPORATE OVERVIEW BOARD’S REPORT FINANCIAL STATEMENTS
14 15

DR. ALOIS VIRAGChief Executive Officer
CEO’S MESSAGE
Dear Shareholders,It is beyond question that the past financial year, marred by a flummoxing first wave and a grievous second one, left us all vacillating between hope and despair. This unprecedented pandemic affected every one of us, unifying us in our vulnerability – as communities, cities, nations and as companies, sectors and economies. Naturally, this crisis brought along several learnings, for governments and corporates alike. That collaboration and one-track focus could demonstrably condense a whole decade of R&D into a single year for producing efficacious vaccines is a great testimonial of what we can achieve, together. The year 2020 also shined light upon the criticality of resilience, a virtue otherwise eclipsed during merrier times.
For Nayara Energy, FY20-21 meant leveraging our innate strengths and cultivated virtues to surmount the disruptions and uncertainty. With our business continuity plans well in order and supported by the courage and commitment of our employees and franchisees, we remained optimally operational at a time when lockdowns brought the country to a standstill. Further, throughout the year, we have resolutely marched ahead with concretization of our expansion plans.
Health, Safety and Emotional Well-being at the ForefrontAt Nayara, health and safety have always taken priority. Taking prompt cognizance of the evolving risks, we implemented Covid-19 safety protocols across all our operations, as well as put together supportive policies to ensure our employees could avail paid leave and advance medical funds for treatment. We also doubled the insurance cover for our on-field contract staff.
Further, the pandemic and resultant isolation and grief have brought to the fore some important conversations regarding mental and emotional well-being, an area that is typically overlooked in comparison to physical health. We, at Nayara, have equally pivoted our focus towards therapy for stress, anxiety, depression, etc. and rolled out employee assistance programs aimed at alleviating these conditions.
Strengthening Community ResilienceOur local communities are not just our neighbours, but a reflection of the inclusivity of our business. It is universally observed that the pandemic has discriminately impacted the underprivileged, jeopardizing their lives and livelihoods. Stepping up to the needs of communities in Devbhumi Dwarka and Jamnagar districts, Nayara instantly pivoted its CSR strategy to focus on response and rehabilitation for 12,000-odd families in our nearby villages. Our community kitchen fed the needy, while grocery kit distribution at Vadinar as well as across our retail network took care of their immediate well-being. Our CSR team also rallied a women-led stitching centre which distributed more than 100,000 masks. We intensified agricultural support program to cover 5000 local farmers. Leveraging technology, we launched several Covid-adaptive social innovations such as installation of 4 telemedicine kiosks; mobile training app for health, nutrition and soft skills; home-based self-learning modules for school children.
The second wave of Covid-19 in India has been more gruelling. The over-burdening of healthcare infrastructure sounded a clarion call to the private sector to jump in for ameliorating the situation. At Nayara, in addition to the 50-bed Covid-19 Care Center at Jhakhar village, we are also installing 2 oxygen plants at government-run hospitals in Jamnagar and Rajkot and 1 oxygen plant in Military Hospital in Jamnagar respectively to ensure uninterrupted supply of medical oxygen.
With our business continuity plans well in order and supported by the courage and commitment of our employees and franchisees, we remained optimally operational at a time when lockdowns brought the country to a standstill.
At Nayara, in addition to the 50-bed Covid-19 Care Center at Jhakhar village, we are also installing 2 oxygen plants at government-run hospitals in Jamnagar and Rajkot and 1 oxygen plant in Military Hospital in Jamnagar respectively to ensure uninterrupted supply of medical oxygen.
ANNUAL REPORT 2020-21NAYARA ENERGY LIMITED CORPORATE OVERVIEW BOARD’S REPORT FINANCIAL STATEMENTS
16 17
Agility through Digitization and InnovationAt Nayara, we believe digitization is future-proofing. Our early investments in digital infrastructure helped us navigate an agile and seamless transition to remote working. While a sizeable part of our workforce moved online, we managed the haul while keeping any cybersecurity incidents at bay.
Our digital innovation initiatives in marketing operations have been particularly noteworthy. Despite pandemic-related challenges, we completed automation at a total of 3600+ retail outlets, making marked improvement in equipment uptime, compliance and retail inventory management. During the year, we also launched Nayara Indent Management System in 5500+ outlets, reducing indent-to-fulfilment cycle time by 50%. Further, our supply operations were bolstered by the newly deployed VTS (Vehicle Tracking System) along with 24x7 central monitoring, improving field safety and control over tank trucks. We also succeeded in automating the entire manual invoice-to-payment process.
Operational Optimization and OutperformanceWhile stringent lockdown diminished domestic demand for petroleum products substantially, Nayara could maintain its throughput in the range of 90% for most of the year, the highest among Indian refiners, thanks to our built-in exports optionality and prepaid term contracts which are an outcome of our consciously curated market diversification strategy. Despite declining global availability of ultra-heavy crude oil, we sustained ultra-heavy processing at greater than 60% by introducing 6 new crudes in our diversified crude basket and signing up 4 new counterparties. Further, the planned shutdown in October ensured optimization of yields and reliability of our crude distillation and hydro-treating units as we continue producing top-grade BS VI fuel. In domestic marketing, we continue to strengthen our supply backbone through strategic hired depots and progressing construction at own depot in Rajasthan.
2020 was indeed an outstanding year for retail performance, not withstanding the anomalous market environment. Focused expansion in priority markets complemented by a slew of strategic initiatives such as automation, infrastructural upgrade, digital fleet program and tail management has delivered a steady rise in our market share to 6.1%. Our volumes, which grew 3% YoY in spite of lockdowns, consistently outperformed the industry by double digits from April to October, and displayed remarkable buoyancy. Powered by extraordinarily lucrative margins in the first two quarters, EBITDA contribution from retail stood tall at $410 MN in FY20.
Spend Prioritization and Efficient Refinancing Amidst Adverse EnvironmentA distinguished achievement this year has been the resounding affirmation of our domestic credit rating at AA with stable outlook, in the backdrop of a globally precarious market environment. This challenging feat was made possible by the tenacious efforts undertaken by management towards robust cost control initiatives including opex reduction, capex prioritization and deferment; adept liquidity management through timely short and long term prepayments as well as working capital optimization; and efficient refinancing of high-interest debt despite prevailing conditions.
A notable update is that amidst a tepid market, we accomplished financial closure of project term loans for Phase 1 of Nayara’s expansion plan which marks our foray into the petrochemicals segment. This underpins a strong belief in our asset quality, market potential and management wherewithal.
Sustained Focus on Performance Culture With the advent of the ‘new normal’, Nayara moved onto a digitally elastic workspace with alacrity. We further initiated digitization of the entire hire-to-retire cycle – starting with remote on-boarding of new joiners. As we pivoted to a hybrid working model, we ensured zero lost productive days and sustained the emphasis on operational excellence and going the extra mile through quality employee engagement and performance management, manifest in the resilient business outcomes during this exacting year.
Taking advantage of the prevailing circumstances to support career development, we launched a virtual rapid upskilling series for 2500+ employees. Moreover, with the uncertainty unleashed by the pandemic, we accelerated our succession planning and leadership readiness program in line with business continuity planning scenarios.
Setting Sights on ExpansionA laudable milestone for FY20 was our retail network touching the 6,000-mark while being the fastest-growing private fuel retailer In India. In the last three years, we have not only tripled our retail network, but carved out a presence in the Indian market as trustworthy, transparent, hygienic and hassle-free. From October 2020, the Company has been commissioning all new outlets in Nayara Brand with an eye-catching visual identity, augmented by a host of core & segment-specific value propositions for our customers. With an aim to fuel the aspirations of a rising India mile-by-mile, we are set to expand our network to 7,600 outlets in the next three years.
Driven by zeal and conviction, our Phase 1 expansion plan, which entails existing unit revamps, a propylene recovery unit and a 450 KTPA polypropylene production unit, is set for execution stage. The work on front-end engineering and design as well as EPC tendering continued undisrupted during the pandemic and requisite statutory approvals have been received to proceed with the project. EPC contracts have been awarded to Technip India and Toyo Engineering who shall help us steer the project in keeping with our undivided focus on operational excellence.
I express my heartfelt appreciation to our employees for their outstanding contribution. I’m grateful to our shareholders for their unwavering support and look forward to a fulfilling journey together!
Best Regards,
Alois ViragChief Executive Officer
CEO’S MESSAGE
Nayara Brand with an eye-catching visual identity, augmented by a host of core & segment-specific value propositions for our customers. With an aim to fuel the aspirations of a rising India mile-by-mile, we are set to expand our network to 7,600 outlets in the next three years.
While stringent lockdown diminished domestic demand for petroleum products substantially, Nayara could maintain its throughput in the range of 90% for most of the year, the highest among Indian refiners, thanks to our built-in exports optionality and prepaid term contracts which are an outcome of our consciously curated market diversification strategy.
ANNUAL REPORT 2020-21NAYARA ENERGY LIMITED CORPORATE OVERVIEW BOARD’S REPORT FINANCIAL STATEMENTS
18 19

BOARD OF DIRECTORS
CHARLES ANTHONY FOUNTAINExecutive Chairman
JONATHAN KOLLEKNon-Executive Director
PRASAD K PANICKERDirector & Head of Refinery
VICTORIA CUNNINGHAMNon-Executive Director
CHIN HWEE TANNon-Executive Director
KRZYSZTOF ZIELICKINon-Executive Director
AVRIL CONROYNon-Executive Director
ALEXANDER ROMANOV Non-Executive Director
DEEPAK KAPOORIndependent Director
NAINA LAL KIDWAIIndependent Director
ALEXEY LIZUNOVNon-Executive Director
ANNUAL REPORT 2020-21NAYARA ENERGY LIMITED CORPORATE OVERVIEW BOARD’S REPORT FINANCIAL STATEMENTS
20 21
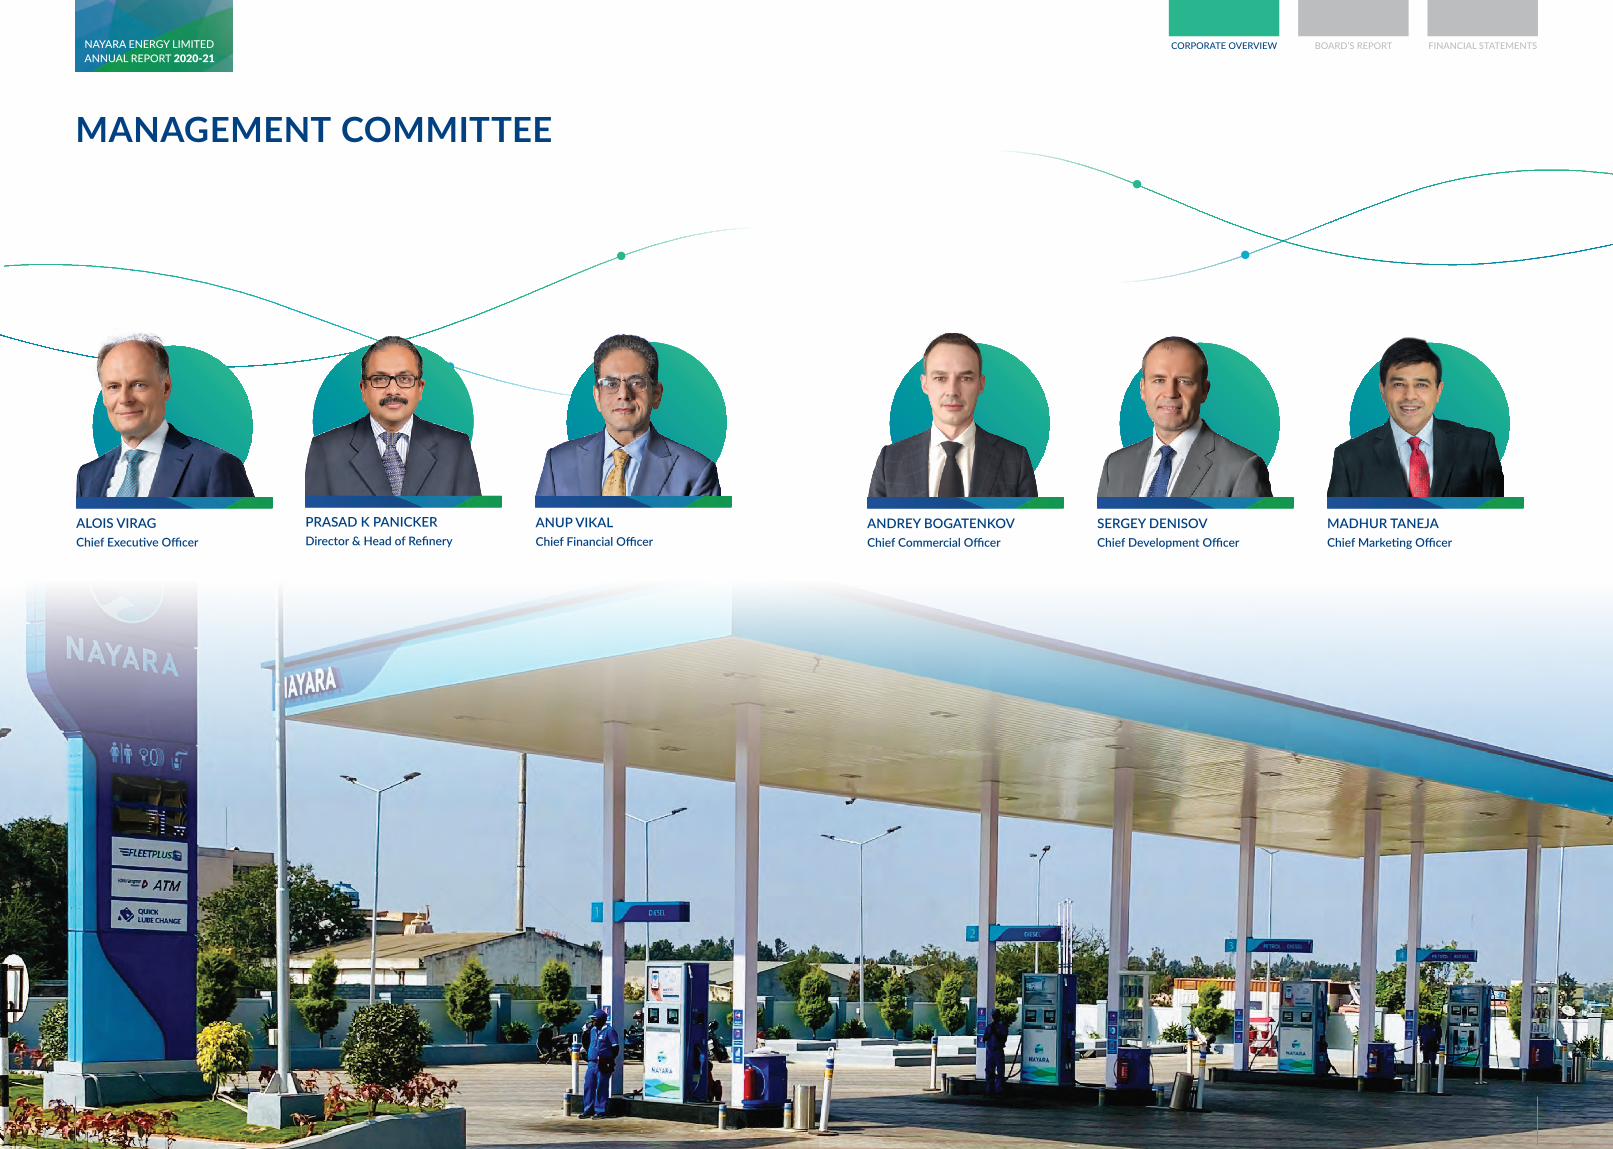
MANAGEMENT COMMITTEE
ALOIS VIRAGChief Executive Officer
ANUP VIKALChief Financial Officer
SERGEY DENISOVChief Development Officer
MADHUR TANEJAChief Marketing Officer
ANDREY BOGATENKOVChief Commercial Officer
PRASAD K PANICKERDirector & Head of Refinery
ANNUAL REPORT 2020-21NAYARA ENERGY LIMITED CORPORATE OVERVIEW BOARD’S REPORT FINANCIAL STATEMENTS
22 23
BOARD’S REPORT
24 25
BOARD’S REPORT
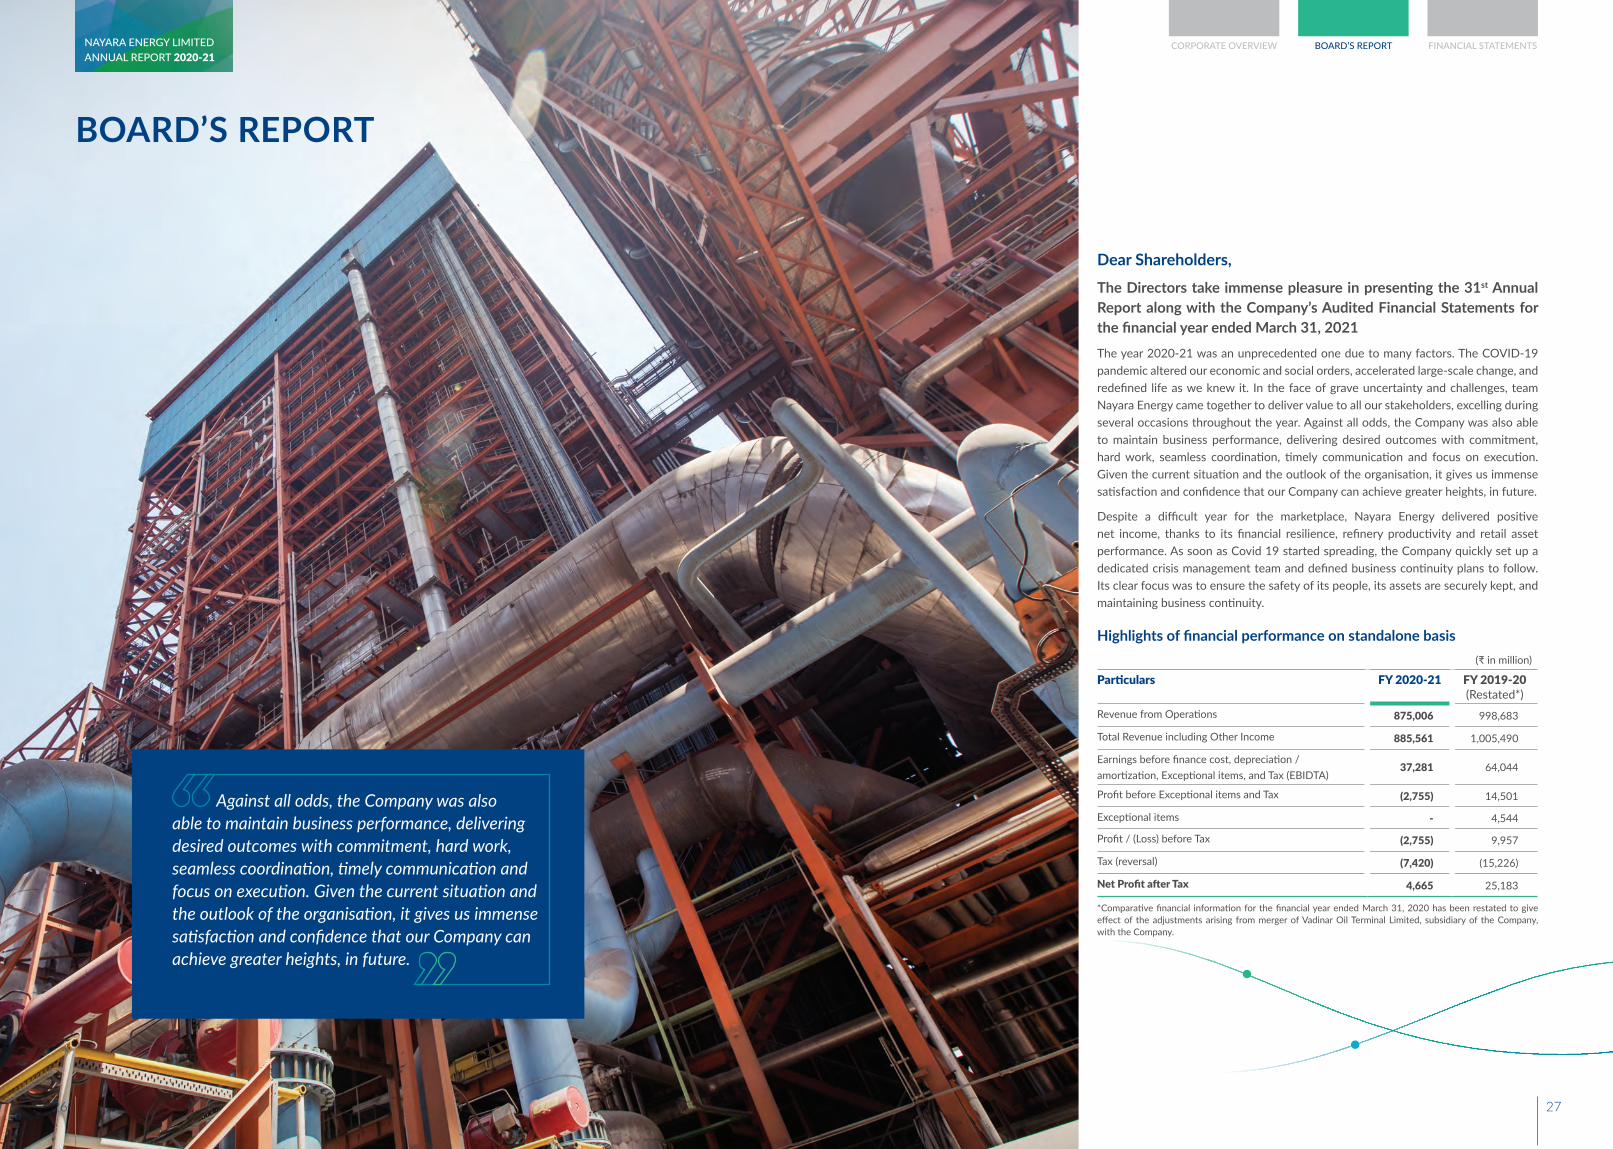
Against all odds, the Company was also able to maintain business performance, delivering desired outcomes with commitment, hard work, seamless coordination, timely communication and focus on execution. Given the current situation and the outlook of the organisation, it gives us immense satisfaction and confidence that our Company can achieve greater heights, in future.
Dear Shareholders, The Directors take immense pleasure in presenting the 31st Annual Report along with the Company’s Audited Financial Statements for the financial year ended March 31, 2021The year 2020-21 was an unprecedented one due to many factors. The COVID-19 pandemic altered our economic and social orders, accelerated large-scale change, and redefined life as we knew it. In the face of grave uncertainty and challenges, team Nayara Energy came together to deliver value to all our stakeholders, excelling during several occasions throughout the year. Against all odds, the Company was also able to maintain business performance, delivering desired outcomes with commitment, hard work, seamless coordination, timely communication and focus on execution. Given the current situation and the outlook of the organisation, it gives us immense satisfaction and confidence that our Company can achieve greater heights, in future.
Despite a difficult year for the marketplace, Nayara Energy delivered positive net income, thanks to its financial resilience, refinery productivity and retail asset performance. As soon as Covid 19 started spreading, the Company quickly set up a dedicated crisis management team and defined business continuity plans to follow. Its clear focus was to ensure the safety of its people, its assets are securely kept, and maintaining business continuity.
Highlights of financial performance on standalone basis(₹ in million)
Particulars FY 2020-21 FY 2019-20 (Restated*)
Revenue from Operations 875,006 998,683
Total Revenue including Other Income 885,561 1,005,490
Earnings before finance cost, depreciation / amortization, Exceptional items, and Tax (EBIDTA)
37,281 64,044
Profit before Exceptional items and Tax (2,755) 14,501
Exceptional items - 4,544
Profit / (Loss) before Tax (2,755) 9,957
Tax (reversal) (7,420) (15,226)
Net Profit after Tax 4,665 25,183
*Comparative financial information for the financial year ended March 31, 2020 has been restated to give effect of the adjustments arising from merger of Vadinar Oil Terminal Limited, subsidiary of the Company, with the Company.
ANNUAL REPORT 2020-21NAYARA ENERGY LIMITED CORPORATE OVERVIEW BOARD’S REPORT FINANCIAL STATEMENTS
26 27
GLOBAL MARKET
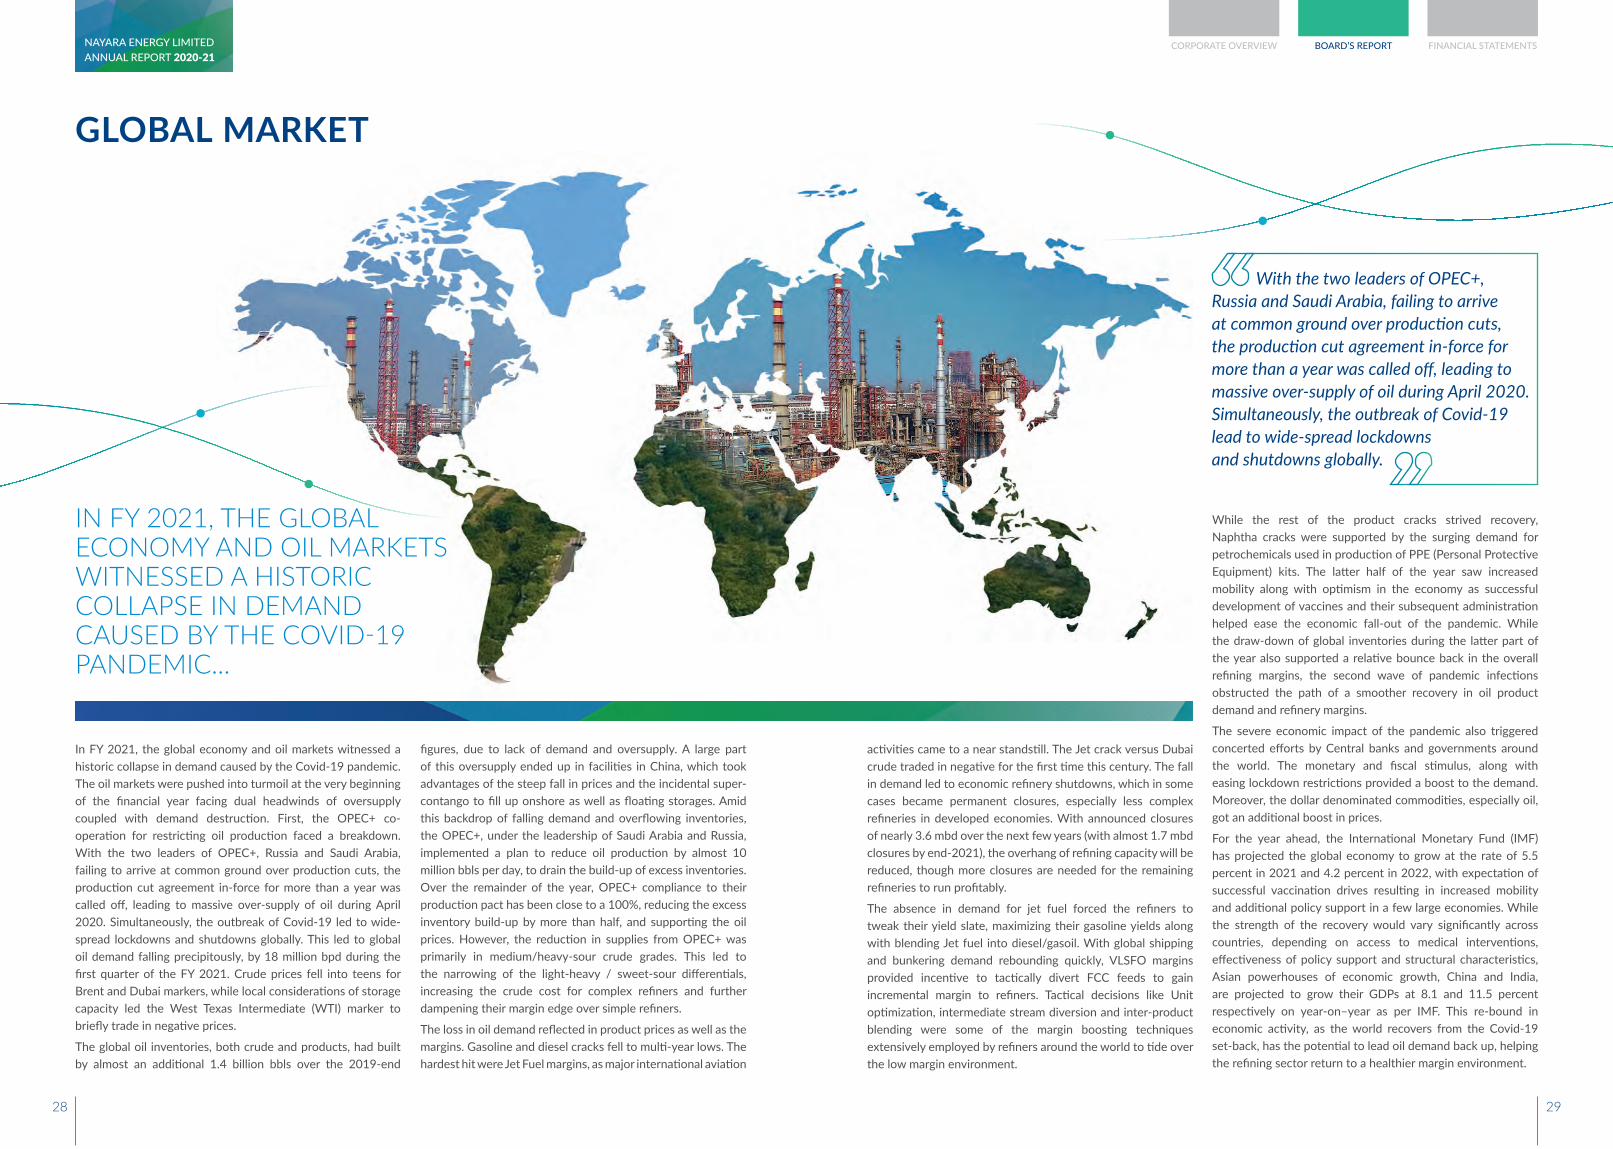
In FY 2021, the global economy and oil markets witnessed a historic collapse in demand caused by the Covid-19 pandemic. The oil markets were pushed into turmoil at the very beginning of the financial year facing dual headwinds of oversupply coupled with demand destruction. First, the OPEC+ co-operation for restricting oil production faced a breakdown. With the two leaders of OPEC+, Russia and Saudi Arabia, failing to arrive at common ground over production cuts, the production cut agreement in-force for more than a year was called off, leading to massive over-supply of oil during April 2020. Simultaneously, the outbreak of Covid-19 led to wide-spread lockdowns and shutdowns globally. This led to global oil demand falling precipitously, by 18 million bpd during the first quarter of the FY 2021. Crude prices fell into teens for Brent and Dubai markers, while local considerations of storage capacity led the West Texas Intermediate (WTI) marker to briefly trade in negative prices.
The global oil inventories, both crude and products, had built by almost an additional 1.4 billion bbls over the 2019-end
figures, due to lack of demand and oversupply. A large part of this oversupply ended up in facilities in China, which took advantages of the steep fall in prices and the incidental super-contango to fill up onshore as well as floating storages. Amid this backdrop of falling demand and overflowing inventories, the OPEC+, under the leadership of Saudi Arabia and Russia, implemented a plan to reduce oil production by almost 10 million bbls per day, to drain the build-up of excess inventories. Over the remainder of the year, OPEC+ compliance to their production pact has been close to a 100%, reducing the excess inventory build-up by more than half, and supporting the oil prices. However, the reduction in supplies from OPEC+ was primarily in medium/heavy-sour crude grades. This led to the narrowing of the light-heavy / sweet-sour differentials, increasing the crude cost for complex refiners and further dampening their margin edge over simple refiners.
The loss in oil demand reflected in product prices as well as the margins. Gasoline and diesel cracks fell to multi-year lows. The hardest hit were Jet Fuel margins, as major international aviation
IN FY 2021, THE GLOBAL ECONOMY AND OIL MARKETS WITNESSED A HISTORIC COLLAPSE IN DEMAND CAUSED BY THE COVID-19 PANDEMIC...
activities came to a near standstill. The Jet crack versus Dubai crude traded in negative for the first time this century. The fall in demand led to economic refinery shutdowns, which in some cases became permanent closures, especially less complex refineries in developed economies. With announced closures of nearly 3.6 mbd over the next few years (with almost 1.7 mbd closures by end-2021), the overhang of refining capacity will be reduced, though more closures are needed for the remaining refineries to run profitably.
The absence in demand for jet fuel forced the refiners to tweak their yield slate, maximizing their gasoline yields along with blending Jet fuel into diesel/gasoil. With global shipping and bunkering demand rebounding quickly, VLSFO margins provided incentive to tactically divert FCC feeds to gain incremental margin to refiners. Tactical decisions like Unit optimization, intermediate stream diversion and inter-product blending were some of the margin boosting techniques extensively employed by refiners around the world to tide over the low margin environment.
While the rest of the product cracks strived recovery, Naphtha cracks were supported by the surging demand for petrochemicals used in production of PPE (Personal Protective Equipment) kits. The latter half of the year saw increased mobility along with optimism in the economy as successful development of vaccines and their subsequent administration helped ease the economic fall-out of the pandemic. While the draw-down of global inventories during the latter part of the year also supported a relative bounce back in the overall refining margins, the second wave of pandemic infections obstructed the path of a smoother recovery in oil product demand and refinery margins.
The severe economic impact of the pandemic also triggered concerted efforts by Central banks and governments around the world. The monetary and fiscal stimulus, along with easing lockdown restrictions provided a boost to the demand. Moreover, the dollar denominated commodities, especially oil, got an additional boost in prices.
For the year ahead, the International Monetary Fund (IMF) has projected the global economy to grow at the rate of 5.5 percent in 2021 and 4.2 percent in 2022, with expectation of successful vaccination drives resulting in increased mobility and additional policy support in a few large economies. While the strength of the recovery would vary significantly across countries, depending on access to medical interventions, effectiveness of policy support and structural characteristics, Asian powerhouses of economic growth, China and India, are projected to grow their GDPs at 8.1 and 11.5 percent respectively on year-on–year as per IMF. This re-bound in economic activity, as the world recovers from the Covid-19 set-back, has the potential to lead oil demand back up, helping the refining sector return to a healthier margin environment.
With the two leaders of OPEC+, Russia and Saudi Arabia, failing to arrive at common ground over production cuts, the production cut agreement in-force for more than a year was called off, leading to massive over-supply of oil during April 2020. Simultaneously, the outbreak of Covid-19 lead to wide-spread lockdowns and shutdowns globally.
ANNUAL REPORT 2020-21NAYARA ENERGY LIMITED CORPORATE OVERVIEW BOARD’S REPORT FINANCIAL STATEMENTS
28 29
DOMESTIC MARKET OVERVIEW
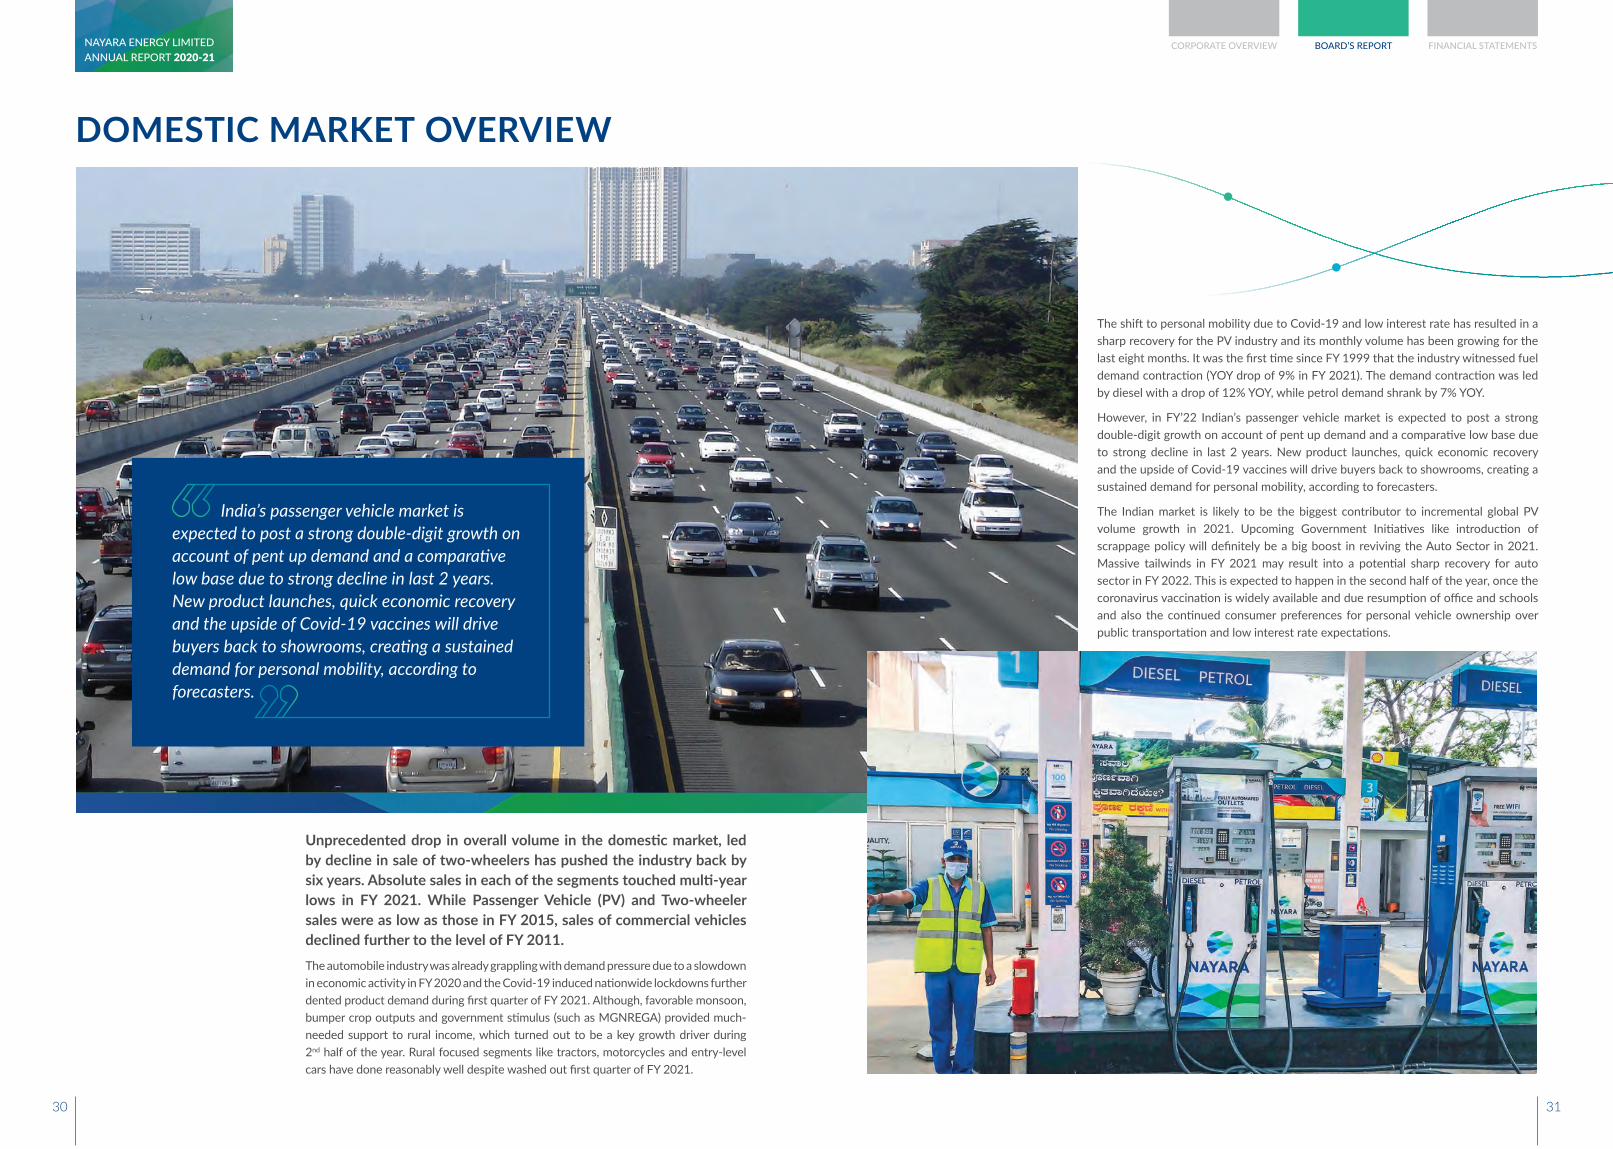
Unprecedented drop in overall volume in the domestic market, led by decline in sale of two-wheelers has pushed the industry back by six years. Absolute sales in each of the segments touched multi-year lows in FY 2021. While Passenger Vehicle (PV) and Two-wheeler sales were as low as those in FY 2015, sales of commercial vehicles declined further to the level of FY 2011.The automobile industry was already grappling with demand pressure due to a slowdown in economic activity in FY 2020 and the Covid-19 induced nationwide lockdowns further dented product demand during first quarter of FY 2021. Although, favorable monsoon, bumper crop outputs and government stimulus (such as MGNREGA) provided much-needed support to rural income, which turned out to be a key growth driver during 2nd half of the year. Rural focused segments like tractors, motorcycles and entry-level cars have done reasonably well despite washed out first quarter of FY 2021.
India’s passenger vehicle market is expected to post a strong double-digit growth on account of pent up demand and a comparative low base due to strong decline in last 2 years. New product launches, quick economic recovery and the upside of Covid-19 vaccines will drive buyers back to showrooms, creating a sustained demand for personal mobility, according to forecasters.
The shift to personal mobility due to Covid-19 and low interest rate has resulted in a sharp recovery for the PV industry and its monthly volume has been growing for the last eight months. It was the first time since FY 1999 that the industry witnessed fuel demand contraction (YOY drop of 9% in FY 2021). The demand contraction was led by diesel with a drop of 12% YOY, while petrol demand shrank by 7% YOY.
However, in FY’22 Indian’s passenger vehicle market is expected to post a strong double-digit growth on account of pent up demand and a comparative low base due to strong decline in last 2 years. New product launches, quick economic recovery and the upside of Covid-19 vaccines will drive buyers back to showrooms, creating a sustained demand for personal mobility, according to forecasters.
The Indian market is likely to be the biggest contributor to incremental global PV volume growth in 2021. Upcoming Government Initiatives like introduction of scrappage policy will definitely be a big boost in reviving the Auto Sector in 2021. Massive tailwinds in FY 2021 may result into a potential sharp recovery for auto sector in FY 2022. This is expected to happen in the second half of the year, once the coronavirus vaccination is widely available and due resumption of office and schools and also the continued consumer preferences for personal vehicle ownership over public transportation and low interest rate expectations.
ANNUAL REPORT 2020-21NAYARA ENERGY LIMITED CORPORATE OVERVIEW BOARD’S REPORT FINANCIAL STATEMENTS
30 31
OPERATIONAL EXCELLENCE
Your Company optimized performance through the introduction of new products such as Marine Fuel Oil, Heavy Naphtha and High-Density Diesel giving it market share gains in extremely volatile markets. The Company replaced key heavy crude diet with optimum light crudes and achieved worthwhile cost savings. The Company generated value through significantly higher utilization of refinery operations, as compared to industry peers.
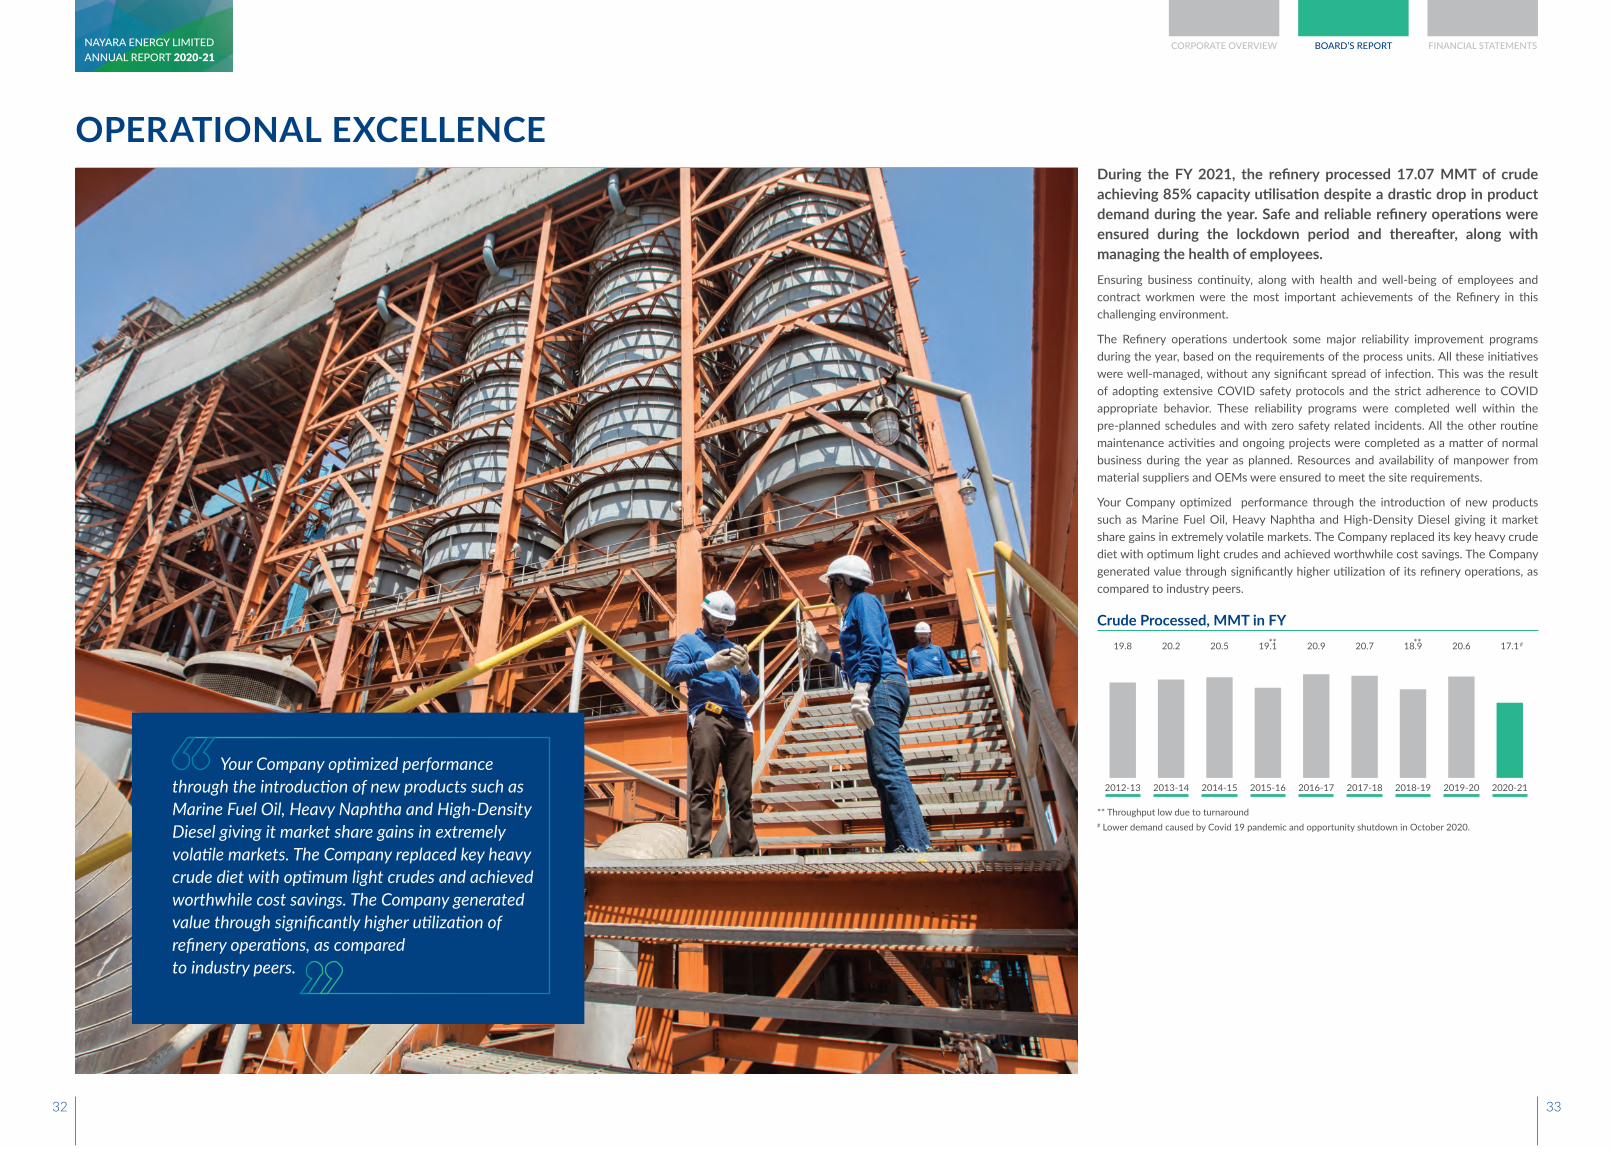
During the FY 2021, the refinery processed 17.07 MMT of crude achieving 85% capacity utilisation despite a drastic drop in product demand during the year. Safe and reliable refinery operations were ensured during the lockdown period and thereafter, along with managing the health of employees. Ensuring business continuity, along with health and well-being of employees and contract workmen were the most important achievements of the Refinery in this challenging environment.
The Refinery operations undertook some major reliability improvement programs during the year, based on the requirements of the process units. All these initiatives were well-managed, without any significant spread of infection. This was the result of adopting extensive COVID safety protocols and the strict adherence to COVID appropriate behavior. These reliability programs were completed well within the pre-planned schedules and with zero safety related incidents. All the other routine maintenance activities and ongoing projects were completed as a matter of normal business during the year as planned. Resources and availability of manpower from material suppliers and OEMs were ensured to meet the site requirements.
Your Company optimized performance through the introduction of new products such as Marine Fuel Oil, Heavy Naphtha and High-Density Diesel giving it market share gains in extremely volatile markets. The Company replaced its key heavy crude diet with optimum light crudes and achieved worthwhile cost savings. The Company generated value through significantly higher utilization of its refinery operations, as compared to industry peers.
Crude Processed, MMT in FY
2012-13
19.8 20.2
2013-14
20.5
2014-15
20.9
2016-17
20.7
2017-18
18.9
2018-19
20.6
2019-20
17.1
2020-21
** Throughput low due to turnaround# Lower demand caused by Covid 19 pandemic and opportunity shutdown in October 2020.
19.1
2015-16
** ** #
ANNUAL REPORT 2020-21NAYARA ENERGY LIMITED CORPORATE OVERVIEW BOARD’S REPORT FINANCIAL STATEMENTS
32 33
MARKETING PERFORMANCE
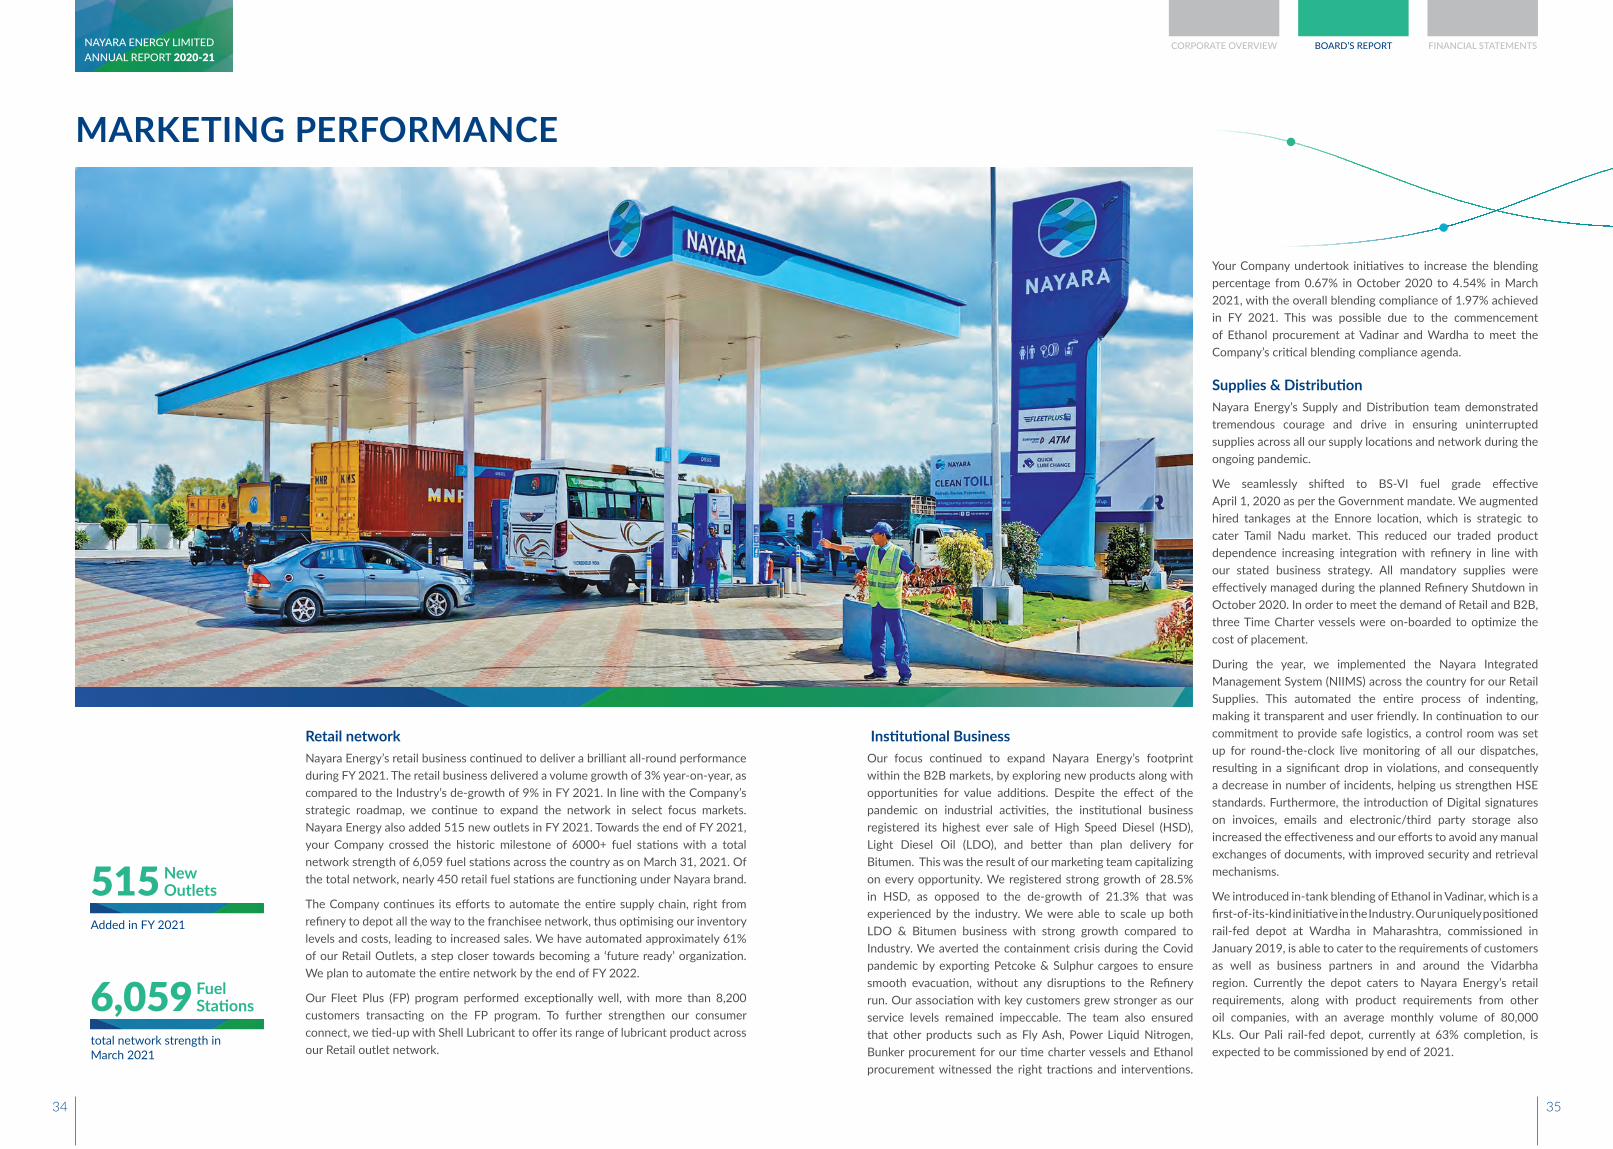
Retail network Nayara Energy’s retail business continued to deliver a brilliant all-round performance during FY 2021. The retail business delivered a volume growth of 3% year-on-year, as compared to the Industry’s de-growth of 9% in FY 2021. In line with the Company’s strategic roadmap, we continue to expand the network in select focus markets. Nayara Energy also added 515 new outlets in FY 2021. Towards the end of FY 2021, your Company crossed the historic milestone of 6000+ fuel stations with a total network strength of 6,059 fuel stations across the country as on March 31, 2021. Of the total network, nearly 450 retail fuel stations are functioning under Nayara brand.
The Company continues its efforts to automate the entire supply chain, right from refinery to depot all the way to the franchisee network, thus optimising our inventory levels and costs, leading to increased sales. We have automated approximately 61% of our Retail Outlets, a step closer towards becoming a ‘future ready’ organization. We plan to automate the entire network by the end of FY 2022.
Our Fleet Plus (FP) program performed exceptionally well, with more than 8,200 customers transacting on the FP program. To further strengthen our consumer connect, we tied-up with Shell Lubricant to offer its range of lubricant product across our Retail outlet network.
Added in FY 2021
515 New Outlets
total network strength in March 2021
6,059 Fuel Stations
Institutional BusinessOur focus continued to expand Nayara Energy’s footprint within the B2B markets, by exploring new products along with opportunities for value additions. Despite the effect of the pandemic on industrial activities, the institutional business registered its highest ever sale of High Speed Diesel (HSD), Light Diesel Oil (LDO), and better than plan delivery for Bitumen. This was the result of our marketing team capitalizing on every opportunity. We registered strong growth of 28.5% in HSD, as opposed to the de-growth of 21.3% that was experienced by the industry. We were able to scale up both LDO & Bitumen business with strong growth compared to Industry. We averted the containment crisis during the Covid pandemic by exporting Petcoke & Sulphur cargoes to ensure smooth evacuation, without any disruptions to the Refinery run. Our association with key customers grew stronger as our service levels remained impeccable. The team also ensured that other products such as Fly Ash, Power Liquid Nitrogen, Bunker procurement for our time charter vessels and Ethanol procurement witnessed the right tractions and interventions.
Your Company undertook initiatives to increase the blending percentage from 0.67% in October 2020 to 4.54% in March 2021, with the overall blending compliance of 1.97% achieved in FY 2021. This was possible due to the commencement of Ethanol procurement at Vadinar and Wardha to meet the Company’s critical blending compliance agenda.
Supplies & Distribution Nayara Energy’s Supply and Distribution team demonstrated tremendous courage and drive in ensuring uninterrupted supplies across all our supply locations and network during the ongoing pandemic.
We seamlessly shifted to BS-VI fuel grade effective April 1, 2020 as per the Government mandate. We augmented hired tankages at the Ennore location, which is strategic to cater Tamil Nadu market. This reduced our traded product dependence increasing integration with refinery in line with our stated business strategy. All mandatory supplies were effectively managed during the planned Refinery Shutdown in October 2020. In order to meet the demand of Retail and B2B, three Time Charter vessels were on-boarded to optimize the cost of placement.
During the year, we implemented the Nayara Integrated Management System (NIIMS) across the country for our Retail Supplies. This automated the entire process of indenting, making it transparent and user friendly. In continuation to our commitment to provide safe logistics, a control room was set up for round-the-clock live monitoring of all our dispatches, resulting in a significant drop in violations, and consequently a decrease in number of incidents, helping us strengthen HSE standards. Furthermore, the introduction of Digital signatures on invoices, emails and electronic/third party storage also increased the effectiveness and our efforts to avoid any manual exchanges of documents, with improved security and retrieval mechanisms.
We introduced in-tank blending of Ethanol in Vadinar, which is a first-of-its-kind initiative in the Industry. Our uniquely positioned rail-fed depot at Wardha in Maharashtra, commissioned in January 2019, is able to cater to the requirements of customers as well as business partners in and around the Vidarbha region. Currently the depot caters to Nayara Energy’s retail requirements, along with product requirements from other oil companies, with an average monthly volume of 80,000 KLs. Our Pali rail-fed depot, currently at 63% completion, is expected to be commissioned by end of 2021.
ANNUAL REPORT 2020-21NAYARA ENERGY LIMITED CORPORATE OVERVIEW BOARD’S REPORT FINANCIAL STATEMENTS
34 35
ASSET DEVELOPMENT
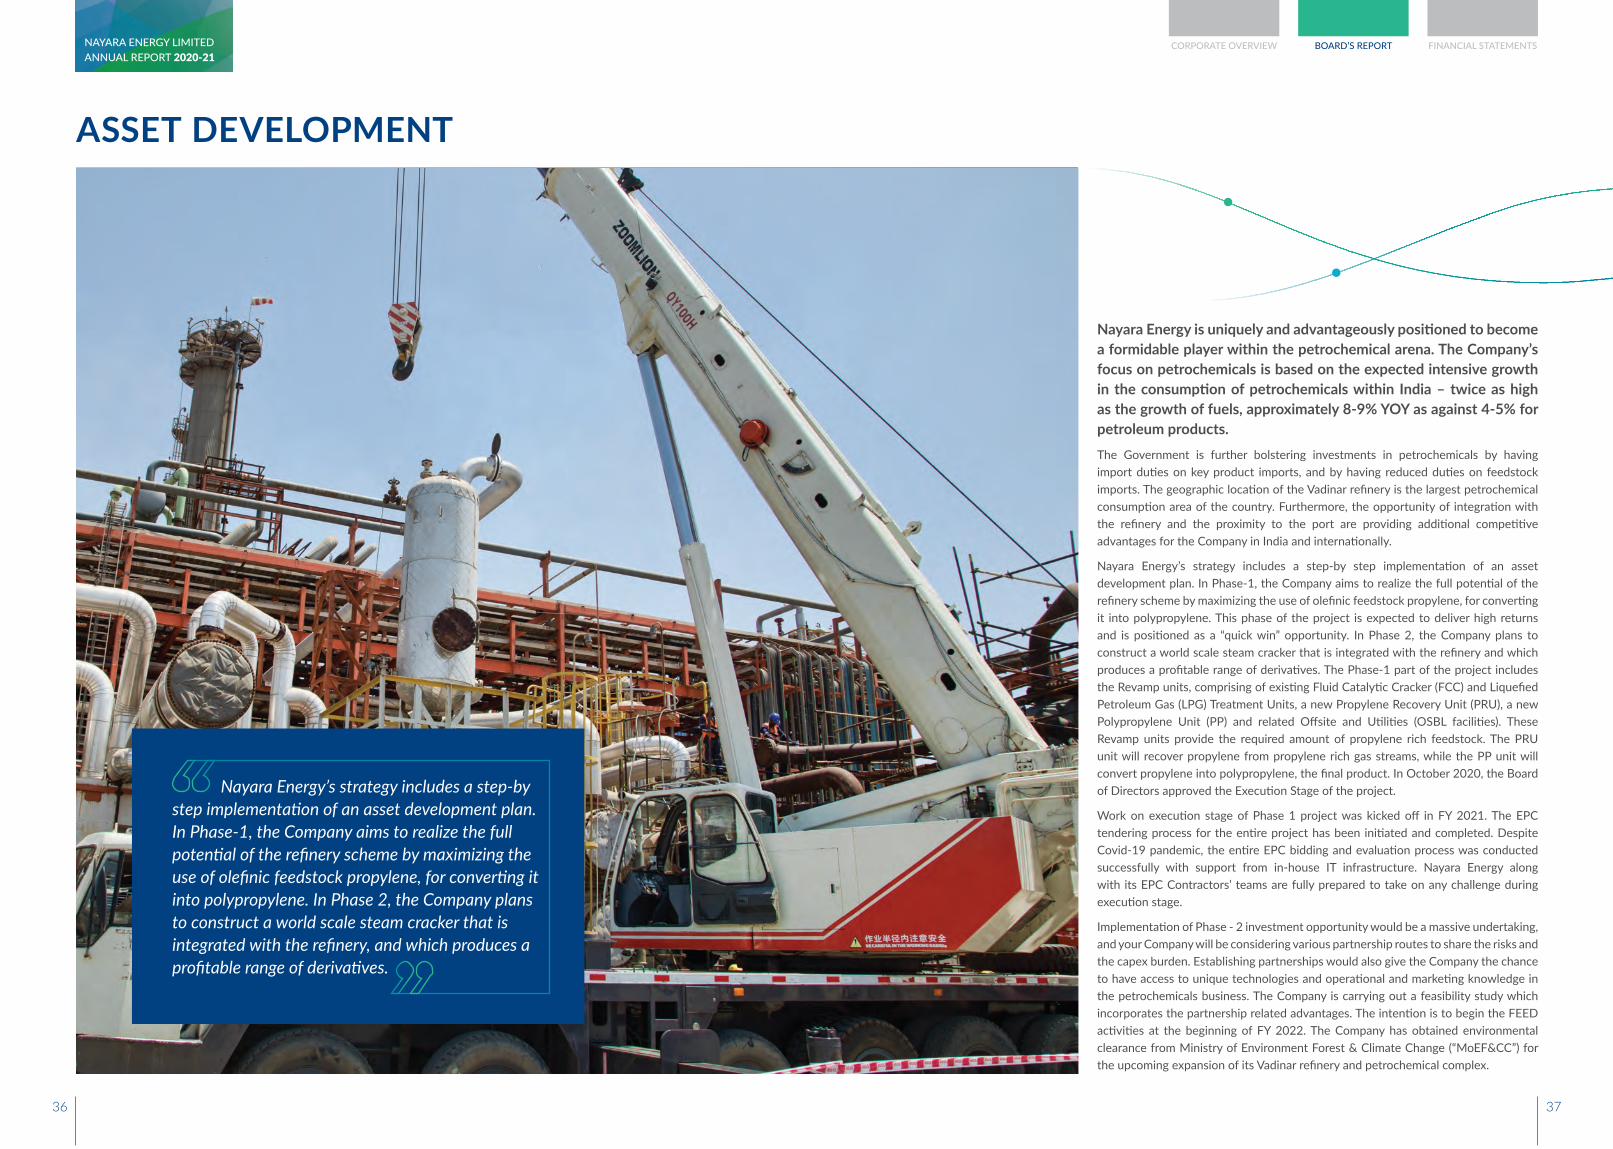
Nayara Energy’s strategy includes a step-by step implementation of an asset development plan. In Phase-1, the Company aims to realize the full potential of the refinery scheme by maximizing the use of olefinic feedstock propylene, for converting it into polypropylene. In Phase 2, the Company plans to construct a world scale steam cracker that is integrated with the refinery, and which produces a profitable range of derivatives.
Nayara Energy is uniquely and advantageously positioned to become a formidable player within the petrochemical arena. The Company’s focus on petrochemicals is based on the expected intensive growth in the consumption of petrochemicals within India – twice as high as the growth of fuels, approximately 8-9% YOY as against 4-5% for petroleum products. The Government is further bolstering investments in petrochemicals by having import duties on key product imports, and by having reduced duties on feedstock imports. The geographic location of the Vadinar refinery is the largest petrochemical consumption area of the country. Furthermore, the opportunity of integration with the refinery and the proximity to the port are providing additional competitive advantages for the Company in India and internationally.
Nayara Energy’s strategy includes a step-by step implementation of an asset development plan. In Phase-1, the Company aims to realize the full potential of the refinery scheme by maximizing the use of olefinic feedstock propylene, for converting it into polypropylene. This phase of the project is expected to deliver high returns and is positioned as a “quick win” opportunity. In Phase 2, the Company plans to construct a world scale steam cracker that is integrated with the refinery and which produces a profitable range of derivatives. The Phase-1 part of the project includes the Revamp units, comprising of existing Fluid Catalytic Cracker (FCC) and Liquefied Petroleum Gas (LPG) Treatment Units, a new Propylene Recovery Unit (PRU), a new Polypropylene Unit (PP) and related Offsite and Utilities (OSBL facilities). These Revamp units provide the required amount of propylene rich feedstock. The PRU unit will recover propylene from propylene rich gas streams, while the PP unit will convert propylene into polypropylene, the final product. In October 2020, the Board of Directors approved the Execution Stage of the project.
Work on execution stage of Phase 1 project was kicked off in FY 2021. The EPC tendering process for the entire project has been initiated and completed. Despite Covid-19 pandemic, the entire EPC bidding and evaluation process was conducted successfully with support from in-house IT infrastructure. Nayara Energy along with its EPC Contractors’ teams are fully prepared to take on any challenge during execution stage.
Implementation of Phase - 2 investment opportunity would be a massive undertaking, and your Company will be considering various partnership routes to share the risks and the capex burden. Establishing partnerships would also give the Company the chance to have access to unique technologies and operational and marketing knowledge in the petrochemicals business. The Company is carrying out a feasibility study which incorporates the partnership related advantages. The intention is to begin the FEED activities at the beginning of FY 2022. The Company has obtained environmental clearance from Ministry of Environment Forest & Climate Change (“MoEF&CC”) for the upcoming expansion of its Vadinar refinery and petrochemical complex.
ANNUAL REPORT 2020-21NAYARA ENERGY LIMITED CORPORATE OVERVIEW BOARD’S REPORT FINANCIAL STATEMENTS
36 37
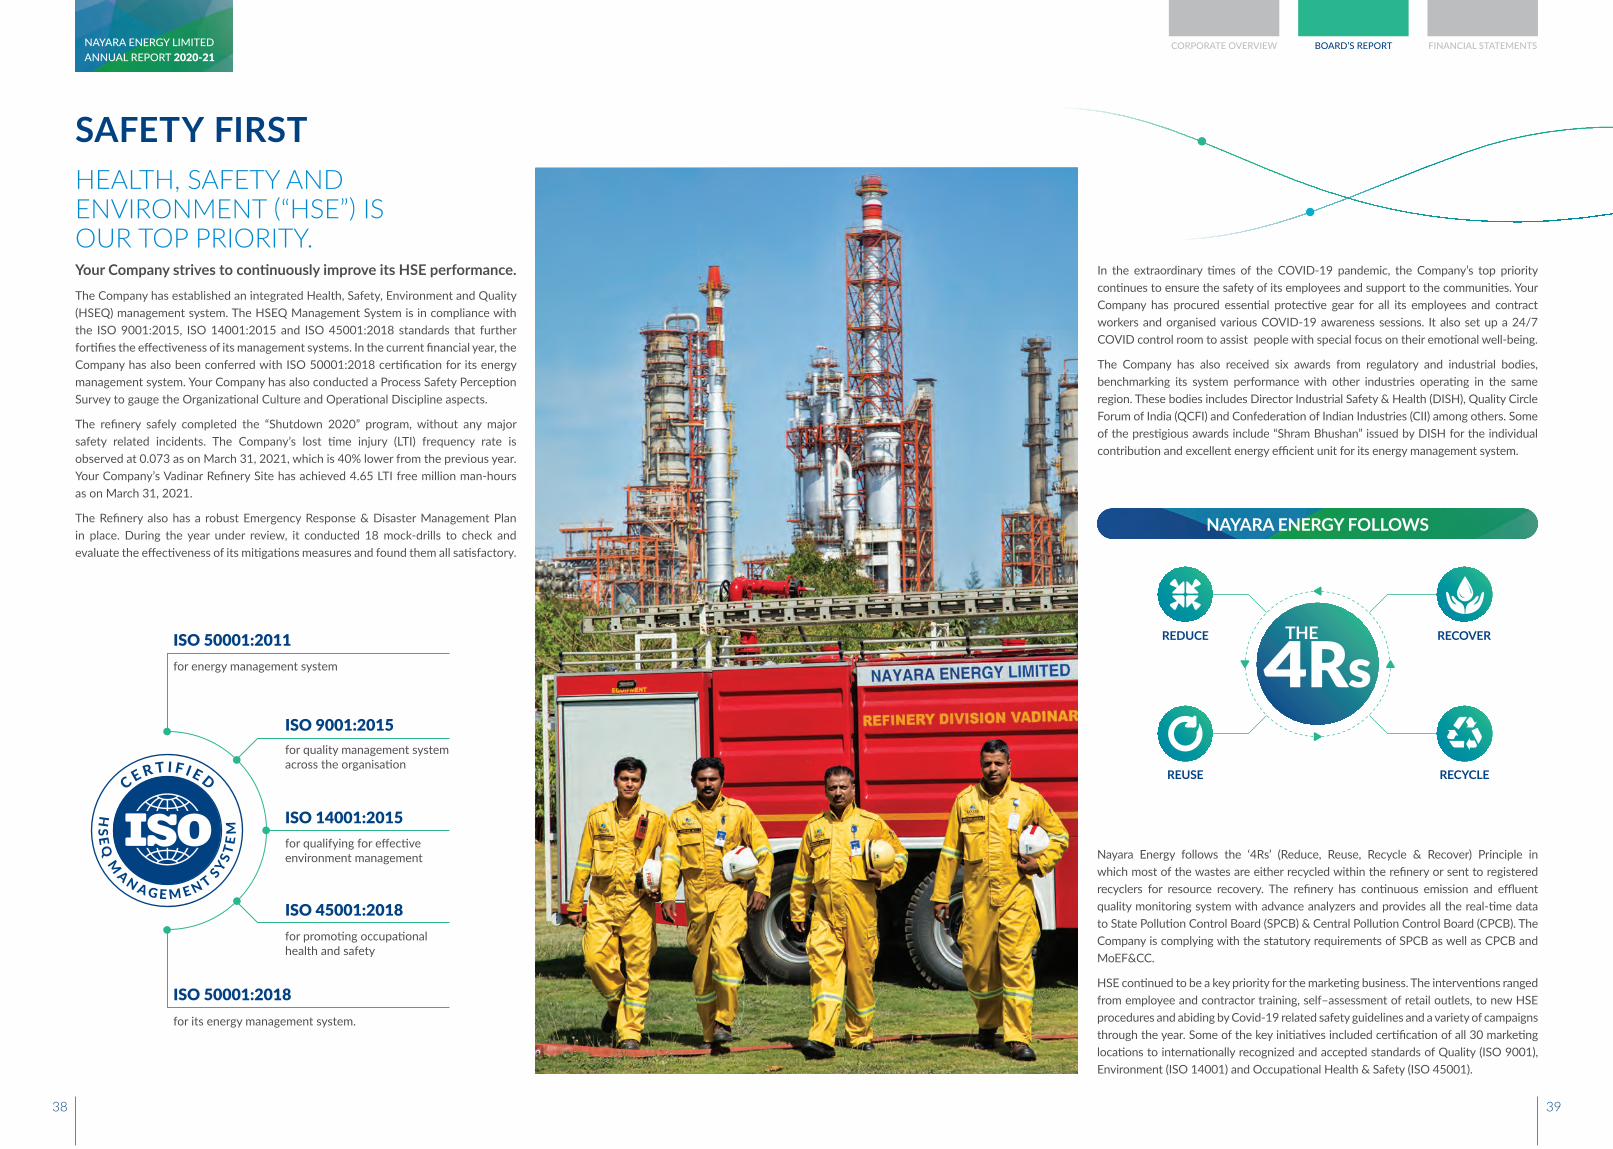
SAFETY FIRSTHEALTH, SAFETY AND ENVIRONMENT (“HSE”) IS OUR TOP PRIORITY. Your Company strives to continuously improve its HSE performance. The Company has established an integrated Health, Safety, Environment and Quality (HSEQ) management system. The HSEQ Management System is in compliance with the ISO 9001:2015, ISO 14001:2015 and ISO 45001:2018 standards that further fortifies the effectiveness of its management systems. In the current financial year, the Company has also been conferred with ISO 50001:2018 certification for its energy management system. Your Company has also conducted a Process Safety Perception Survey to gauge the Organizational Culture and Operational Discipline aspects.
The refinery safely completed the “Shutdown 2020” program, without any major safety related incidents. The Company’s lost time injury (LTI) frequency rate is observed at 0.073 as on March 31, 2021, which is 40% lower from the previous year. Your Company’s Vadinar Refinery Site has achieved 4.65 LTI free million man-hours as on March 31, 2021.
The Refinery also has a robust Emergency Response & Disaster Management Plan in place. During the year under review, it conducted 18 mock-drills to check and evaluate the effectiveness of its mitigations measures and found them all satisfactory.
ISO 50001:2018
ISO 45001:2018
for its energy management system.
ISO 9001:2015
for promoting occupational health and safety
for quality management system across the organisation
HSE
Q M
A N A G E M E N T SYST
EM
C E R T I F I E D
ISO 14001:2015for qualifying for effective environment management
ISO 50001:2011for energy management system
Nayara Energy follows the ‘4Rs’ (Reduce, Reuse, Recycle & Recover) Principle in which most of the wastes are either recycled within the refinery or sent to registered recyclers for resource recovery. The refinery has continuous emission and effluent quality monitoring system with advance analyzers and provides all the real-time data to State Pollution Control Board (SPCB) & Central Pollution Control Board (CPCB). The Company is complying with the statutory requirements of SPCB as well as CPCB and MoEF&CC.
HSE continued to be a key priority for the marketing business. The interventions ranged from employee and contractor training, self–assessment of retail outlets, to new HSE procedures and abiding by Covid-19 related safety guidelines and a variety of campaigns through the year. Some of the key initiatives included certification of all 30 marketing locations to internationally recognized and accepted standards of Quality (ISO 9001), Environment (ISO 14001) and Occupational Health & Safety (ISO 45001).
NAYARA ENERGY FOLLOWS
4RsTHE REDUCE RECOVER
REUSE RECYCLE
In the extraordinary times of the COVID-19 pandemic, the Company’s top priority continues to ensure the safety of its employees and support to the communities. Your Company has procured essential protective gear for all its employees and contract workers and organised various COVID-19 awareness sessions. It also set up a 24/7 COVID control room to assist people with special focus on their emotional well-being.
The Company has also received six awards from regulatory and industrial bodies, benchmarking its system performance with other industries operating in the same region. These bodies includes Director Industrial Safety & Health (DISH), Quality Circle Forum of India (QCFI) and Confederation of Indian Industries (CII) among others. Some of the prestigious awards include “Shram Bhushan” issued by DISH for the individual contribution and excellent energy efficient unit for its energy management system.
ANNUAL REPORT 2020-21NAYARA ENERGY LIMITED CORPORATE OVERVIEW BOARD’S REPORT FINANCIAL STATEMENTS
38 39

FINANCIAL PERFORMANCE
Earnings before interest, tax, depreciation and amortization (EBITDA) was lower by 42% to ₹37,281 million from ₹64,044 million in the preceding financial year mainly on account of lower product margins amidst prevailing COVID-19 Pandemic.
The Company earned a profit after tax (PAT) of ₹4,665 million in FY 2021 against a PAT of ₹25,183 million in the preceding financial year. During FY 2021, Vadinar Oil Terminal Limited (VOTL), a subsidiary of the Company, got merged with the Company and therefore, the Company has restated the comparative financial information included in the standalone financial statements to give effect of the adjustments arising from the aforesaid merger.
Considering the accumulated losses of previous years, the Board of Directors has not recommended any dividend for the financial year ended March 31, 2021. Further, no amounts are proposed to be transferred to the General Reserve during the FY 2021.
Standalone and Consolidated Financial StatementsThe audited Standalone Financial Statements, prepared as per the Indian Accounting Standards (Ind AS) for the financial year ended March 31, 2021, form part of this Annual Report.
The audited Consolidated Financial Statements of the Company, as required under Section 129 of the Companies Act, 2013 (Act), also form part of this Annual Report.
Ownership Nayara Energy does not have any holding company. Rosneft Singapore Pte. Limited, a subsidiary of PJSC Rosneft Oil Company and Kesani Enterprises Company Limited, a consortium led by Trafigura Group and UCP Investment Group, hold 49.13% stake each, in the Company’s share capital.
Subsidiary CompaniesPursuant to the Order passed by the Hon’ble National Company Law Tribunal approving a Scheme of Amalgamation on November 13, 2020, Vadinar Oil Terminal Limited (“VOTL”), a subsidiary of the Company got merged with Nayara Energy Limited with effect from December 14, 2020 (close of business).
Consequent to the aforesaid merger of VOTL with the Company, its shareholding in Coviva Energy Terminals Limited stood transferred to Nayara Energy Limited and accordingly, the entire share capital of Coviva Energy Terminals Limited is now held by the Company.
On September 15, 2020, your Company incorporated a wholly owned subsidiary company in Singapore by name ‘Nayara Energy Singapore Pte Limited’ (“NESPL”) for undertaking trading, sourcing of crude oil, product offtake and other financing activities. Further, Nayara Energy Global Limited, a Mauritius based wholly owned subsidiary of the Company is under liquidation.
There were no other changes in the subsidiary companies’ position during the financial year. The Company does not have any associates.
A report on the performance and financial position of each of the subsidiaries, in Form AOC -1, forms a part of this Annual Report and hence is not repeated here for the sake of brevity.
The financial statements of these subsidiaries for the financial year ended March 31, 2021, and other related information will be made available to any member of the Company / its subsidiary(ies), seeking such information at any point of time. The same is also available for inspection by any member at the Company’s Registered Office/Corporate Office.
Share CapitalPursuant to the Scheme of Amalgamation of VOTL with the Company, which became effective on December 14, 2020, the authorized share capital of VOTL was combined with the authorized share capital of the Company. Accordingly, the authorised share capital of the Company stands increased to ₹180,006.8 million. There is no change in the issued, subscribed and the paid-up share capital of the Company during FY 2021.
Issue of Non-Convertible DebenturesAs a consideration for acquiring shares held by the resident public shareholders of VOTL, Nayara Energy allotted 7,338,221 Rated, Unlisted, Secured Non-Convertible Debentures (“NCDs”) of the face value of ₹ 350 each on December 16, 2020. Since NCDs can be allotted only in electronic form, the resident public shareholders of VOTL who were holding shares in physical form could not be allotted NCDs. NCDs in respect to such shareholders were allotted to Axis Trustee Services Limited, the Trustee to Nayara Energy NCD Beneficial Owners Trust. All such holders of benefits of NCDs have been requested to provide the details of their demat accounts along with supporting documents to enable transfer of NCDs from the Trustee to their respective demat accounts.
Revenue from operations were at ₹875,006 million for the financial year ended March 31, 2021, as compared to ₹998,683 million for the financial year ended March 31, 2020. The decrease in revenue was mainly due to decline in oil prices, lower demand due to prevailing Covid-19 pandemic and the reduced throughput on account of 20 days planned refinery shutdown during the financial year.
INFORMATION TECHNOLOGY
Your Company took up various initiatives by moving towards a greater degree of digitalisation of its processes. As part of its digital initiatives, the Company has implemented cloud-based connected plant services to analyse the plant’s performance data with proprietary models. Through this approach, the Company was seamlessly able to receive recommendations for optimizing its processes from its process licensor. It was also able to enhance the plant’s operational reliability and yield improvement in real-time. The Digital Refinery Performance Monitoring System (RPMS) Mobile application was custom designed, developed and deployed successfully during the year. This allowed the Company to monitor the performance of all units, key performance indicators, margins, energy consumption and product quality on a real-time basis enabling quick corrective actions and measures to be taken as required.
Seamless transition from in-office work culture to a Work-from-Anywhere was achieved with zero change management. This has paved the way for future norms of working such as remote collaboration, optimization of office spaces and digital business operations.
The Company’s futuristic vision and timely investments in digitalisation ensured that the business was unaffected and your Company was better prepared to manage the work-from-home situations during the Covid-19 pandemic and subsequent lockdowns.
Seamless transition from ‘in-office work culture’ to a ‘Work-from-Anywhere’ was achieved with zero change management. This has paved the way for future norms of working such as remote collaboration, optimization of office spaces and digital business operations.
Since September 2017, your Company has made strategic technology investments such as modern networking, faster computing devices and digital resilience. These investments, as envisioned, have given us the edge in these testing times. During the pandemic, our businesses have been running un-interrupted with zero downtime in all areas across the Company. The testimony to our long-term technological commitment and absolute returns on our investments is that we had near 100% system availability with zero cyber breakout in FY 2021.
Nayara Energy has implemented a full-cycle digital transformation of business functions including finance, procurement, marketing and EPS / IST, as we continue to leverage technology to improve performance and resilience of our business processes. We continue to invest in cutting-edge technologies with large virtual environments and enhanced fault-tolerant capabilities. With such deliveries, our digital adoption has substantially improved in FY 2021.
ANNUAL REPORT 2020-21NAYARA ENERGY LIMITED CORPORATE OVERVIEW BOARD’S REPORT FINANCIAL STATEMENTS
40 41
PEOPLE
Your Company has undertaken various strong initiatives such as employee assistance program, 24/7 counselling and doctor consultation support, awareness sessions, RT-PCR tests for employees and their dependents, and hospitalization & insurance support, among others, for all employees.
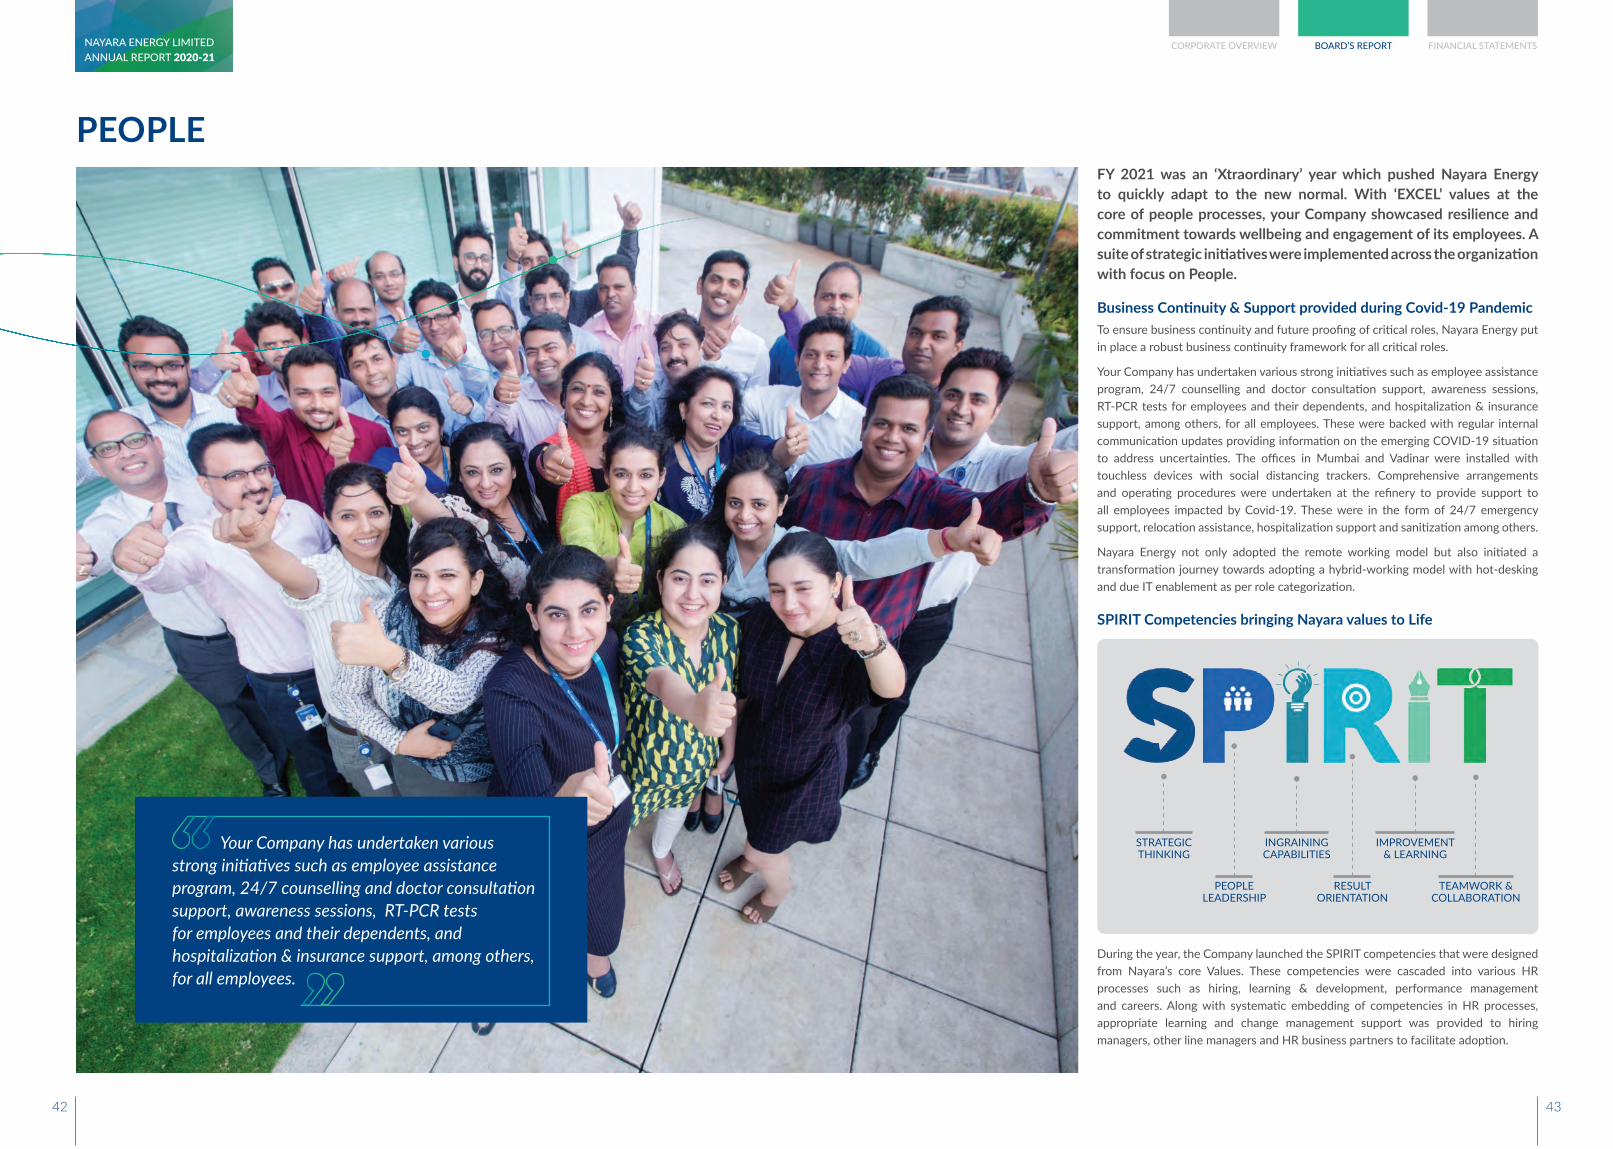
FY 2021 was an ‘Xtraordinary’ year which pushed Nayara Energy to quickly adapt to the new normal. With ‘EXCEL’ values at the core of people processes, your Company showcased resilience and commitment towards wellbeing and engagement of its employees. A suite of strategic initiatives were implemented across the organization with focus on People.
Business Continuity & Support provided during Covid-19 PandemicTo ensure business continuity and future proofing of critical roles, Nayara Energy put in place a robust business continuity framework for all critical roles.
Your Company has undertaken various strong initiatives such as employee assistance program, 24/7 counselling and doctor consultation support, awareness sessions, RT-PCR tests for employees and their dependents, and hospitalization & insurance support, among others, for all employees. These were backed with regular internal communication updates providing information on the emerging COVID-19 situation to address uncertainties. The offices in Mumbai and Vadinar were installed with touchless devices with social distancing trackers. Comprehensive arrangements and operating procedures were undertaken at the refinery to provide support to all employees impacted by Covid-19. These were in the form of 24/7 emergency support, relocation assistance, hospitalization support and sanitization among others.
Nayara Energy not only adopted the remote working model but also initiated a transformation journey towards adopting a hybrid-working model with hot-desking and due IT enablement as per role categorization.
SPIRIT Competencies bringing Nayara values to Life
During the year, the Company launched the SPIRIT competencies that were designed from Nayara’s core Values. These competencies were cascaded into various HR processes such as hiring, learning & development, performance management and careers. Along with systematic embedding of competencies in HR processes, appropriate learning and change management support was provided to hiring managers, other line managers and HR business partners to facilitate adoption.
STRATEGIC THINKING
INGRAINING CAPABILITIES
IMPROVEMENT & LEARNING
PEOPLE LEADERSHIP
RESULT ORIENTATION
TEAMWORK & COLLABORATION
ANNUAL REPORT 2020-21NAYARA ENERGY LIMITED CORPORATE OVERVIEW BOARD’S REPORT FINANCIAL STATEMENTS
42 43
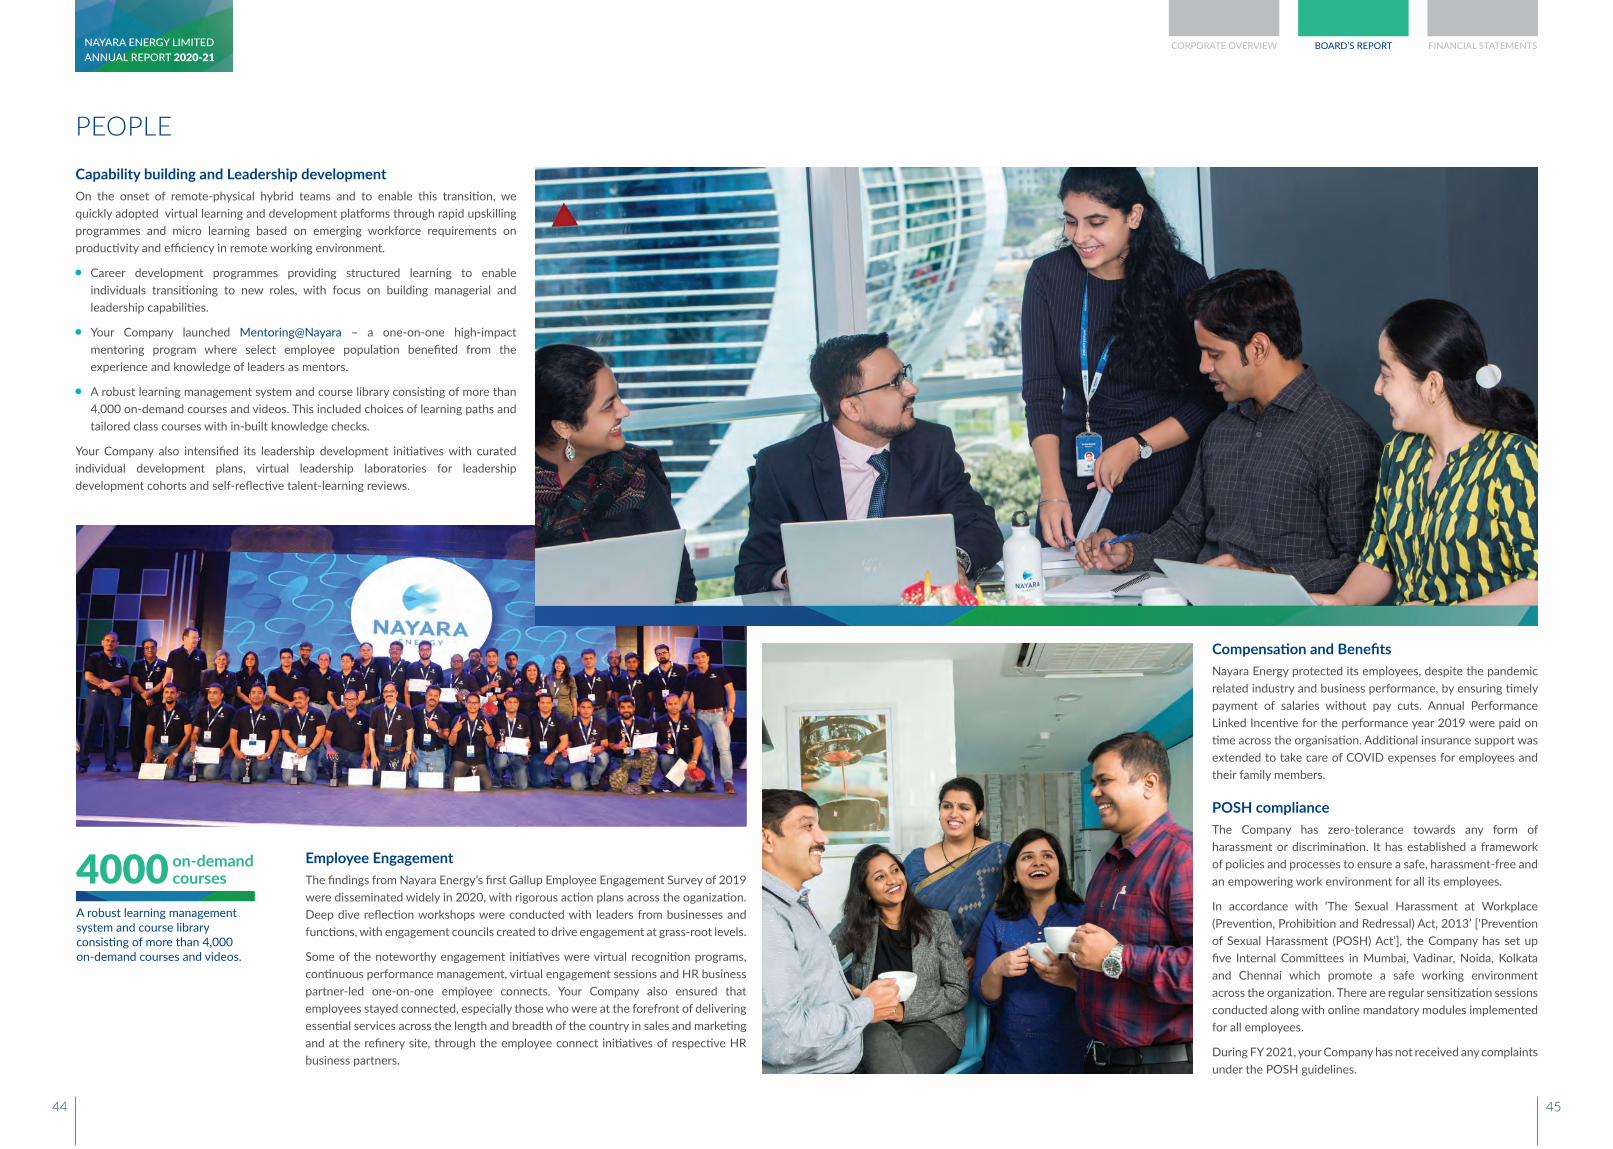
Capability building and Leadership developmentOn the onset of remote-physical hybrid teams and to enable this transition, we quickly adopted virtual learning and development platforms through rapid upskilling programmes and micro learning based on emerging workforce requirements on productivity and efficiency in remote working environment.
Career development programmes providing structured learning to enable individuals transitioning to new roles, with focus on building managerial and leadership capabilities.
Your Company launched Mentoring@Nayara – a one-on-one high-impact mentoring program where select employee population benefited from the experience and knowledge of leaders as mentors.
A robust learning management system and course library consisting of more than 4,000 on-demand courses and videos. This included choices of learning paths and tailored class courses with in-built knowledge checks.
Your Company also intensified its leadership development initiatives with curated individual development plans, virtual leadership laboratories for leadership development cohorts and self-reflective talent-learning reviews.
PEOPLE
Employee EngagementThe findings from Nayara Energy’s first Gallup Employee Engagement Survey of 2019 were disseminated widely in 2020, with rigorous action plans across the oganization. Deep dive reflection workshops were conducted with leaders from businesses and functions, with engagement councils created to drive engagement at grass-root levels.
Some of the noteworthy engagement initiatives were virtual recognition programs, continuous performance management, virtual engagement sessions and HR business partner-led one-on-one employee connects. Your Company also ensured that employees stayed connected, especially those who were at the forefront of delivering essential services across the length and breadth of the country in sales and marketing and at the refinery site, through the employee connect initiatives of respective HR business partners.
A robust learning management system and course library consisting of more than 4,000 on-demand courses and videos.
4000 on-demand courses
Compensation and BenefitsNayara Energy protected its employees, despite the pandemic related industry and business performance, by ensuring timely payment of salaries without pay cuts. Annual Performance Linked Incentive for the performance year 2019 were paid on time across the organisation. Additional insurance support was extended to take care of COVID expenses for employees and their family members.
POSH complianceThe Company has zero-tolerance towards any form of harassment or discrimination. It has established a framework of policies and processes to ensure a safe, harassment-free and an empowering work environment for all its employees.
In accordance with ‘The Sexual Harassment at Workplace (Prevention, Prohibition and Redressal) Act, 2013’ [‘Prevention of Sexual Harassment (POSH) Act’], the Company has set up five Internal Committees in Mumbai, Vadinar, Noida, Kolkata and Chennai which promote a safe working environment across the organization. There are regular sensitization sessions conducted along with online mandatory modules implemented for all employees.
During FY 2021, your Company has not received any complaints under the POSH guidelines.
ANNUAL REPORT 2020-21NAYARA ENERGY LIMITED CORPORATE OVERVIEW BOARD’S REPORT FINANCIAL STATEMENTS
44 45
Your Company has constituted a Corporate Social Responsibility Committee named as CSR and Sustainability Committee (“CSR Committee”). The Board of Directors, on the recommendation of the CSR Committee, has adopted a CSR policy identifying the activities to be undertaken by the Company. The policy can be accessed on the Company’s website: www.nayaraenergy.com/sustainability/csr-policy
The annual report on CSR containing the details of the CSR policy adopted by the Company and other particulars specified in the Companies (Corporate Social Responsibility Policy) Rules, 2014 is annexed to this report as Annexure A. On account of accumulated losses computed in accordance with the provisions of Section 198 of the Act, the Company was not required to mandatorily spend any amount on CSR activities during FY 2021. However, in line with the overall CSR strategy and commitments made to the Government of Gujarat at Vibrant Gujarat Summit in 2019, some of the flagship projects of the Company were to be either augmented or initiated. Considering this, the CSR Committee recommended to the Board to voluntarily spend an amount of ₹202.1 million as planned CSR expenditure for the financial year 2021. Of the allocated amount, the Company spent an amount of ₹191.8 million, while ₹10.3 million remained unspent. The reason for underspend was putting up infrastructure for developing health centre and multi utility centre got delayed as Gram Panchayat could not donate land due to litigation issues. Secondly monitoring, evaluation and external assessment of programmes could not be taken up in FY 2021.
CSR expenditure for the financial year 2021
19.18 crore INR
SUSTAINABLE DEVELOPMENT OF COMMUNITIES
Strengthening Social responsibility commitmentsNayara Energy demonstrates deeper commitment and strategic integration of social responsibilities as part of its corporate structure. The Company incessantly works towards sustaining its CSR legacy of inclusive development and being a responsible “neighbour of choice” for the communities around our refinery and depot.
The social initiatives nurtured and are in line with the Company’s CSR policy, span across areas of Sustainable Livelihoods & Environmental Sustainability, Education & Skill Development and Health & Sanitation.
Below are the details of the programmes and the impacts that they have had on the communities, inclusive of the social and environmental fabric -
Sustainable Livelihoods and Environmental Sustainability ProgrammeNayara Energy has been implementing long-term programmes to create sustainable livelihoods, empower local communities, as well as improve their social infrastructure. Programmes related to farm and non-farm livelihoods, sustainable and customized agricultural practices, animal husbandry initiatives and ones related to water sustenance form the backbone of the programme. The flagship programme on livelihood is known as Gramsamruddhi and it has been bringing about positive and long term changes into the communities, thereby living up to its nomenclature.
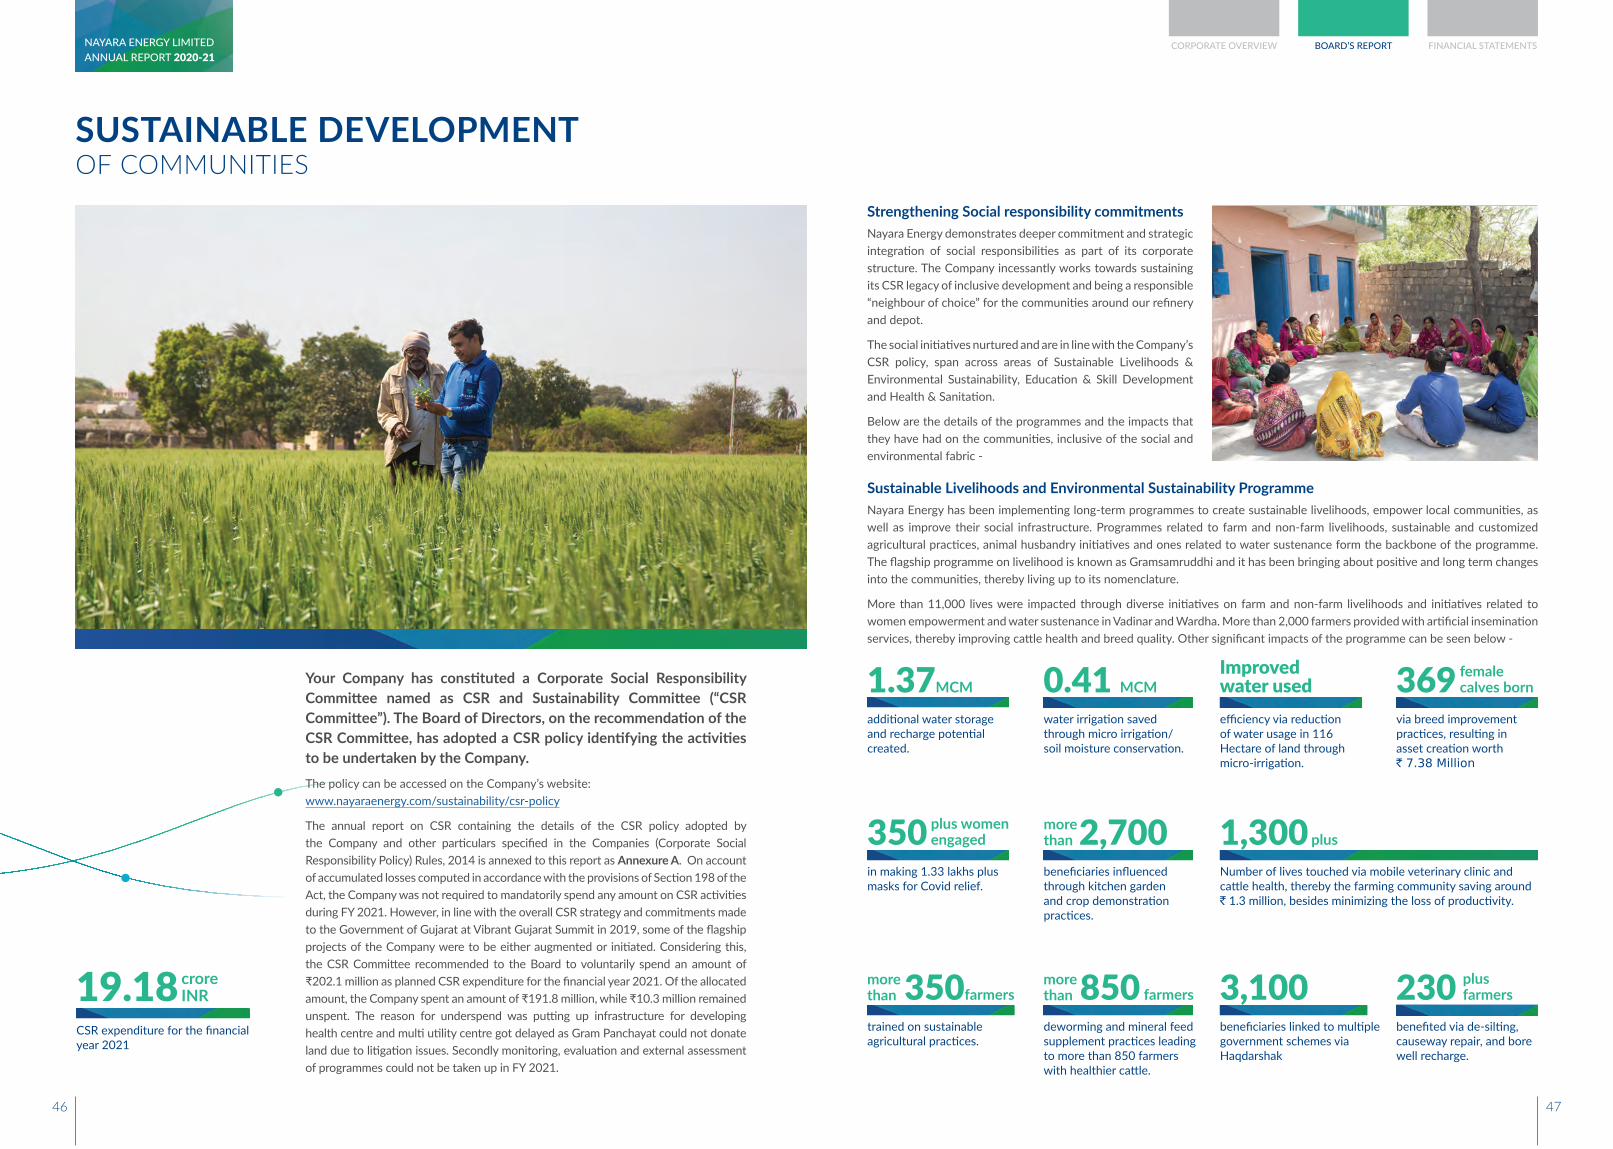
More than 11,000 lives were impacted through diverse initiatives on farm and non-farm livelihoods and initiatives related to women empowerment and water sustenance in Vadinar and Wardha. More than 2,000 farmers provided with artificial insemination services, thereby improving cattle health and breed quality. Other significant impacts of the programme can be seen below -
additional water storage and recharge potential created.
1.37MCM
water irrigation saved through micro irrigation/soil moisture conservation.
0.41 MCM
efficiency via reduction of water usage in 116 Hectare of land through micro-irrigation.
Improved water used
via breed improvement practices, resulting in asset creation worth ` 7.38 Million
369 female calves born
benefited via de-silting, causeway repair, and bore well recharge.
230 plus farmers
in making 1.33 lakhs plus masks for Covid relief.
350 plus women engaged
beneficiaries influenced through kitchen garden and crop demonstration practices.
2,700more than
deworming and mineral feed supplement practices leading to more than 850 farmers with healthier cattle.
850 farmersmore than
trained on sustainable agricultural practices.
350farmersmore than
Number of lives touched via mobile veterinary clinic and cattle health, thereby the farming community saving around ` 1.3 million, besides minimizing the loss of productivity.
1,300 plus
beneficiaries linked to multiple government schemes via Haqdarshak
3,100
ANNUAL REPORT 2020-21NAYARA ENERGY LIMITED CORPORATE OVERVIEW BOARD’S REPORT FINANCIAL STATEMENTS
46 47
SUSTAINABLE DEVELOPMENT OF COMMUNITIES
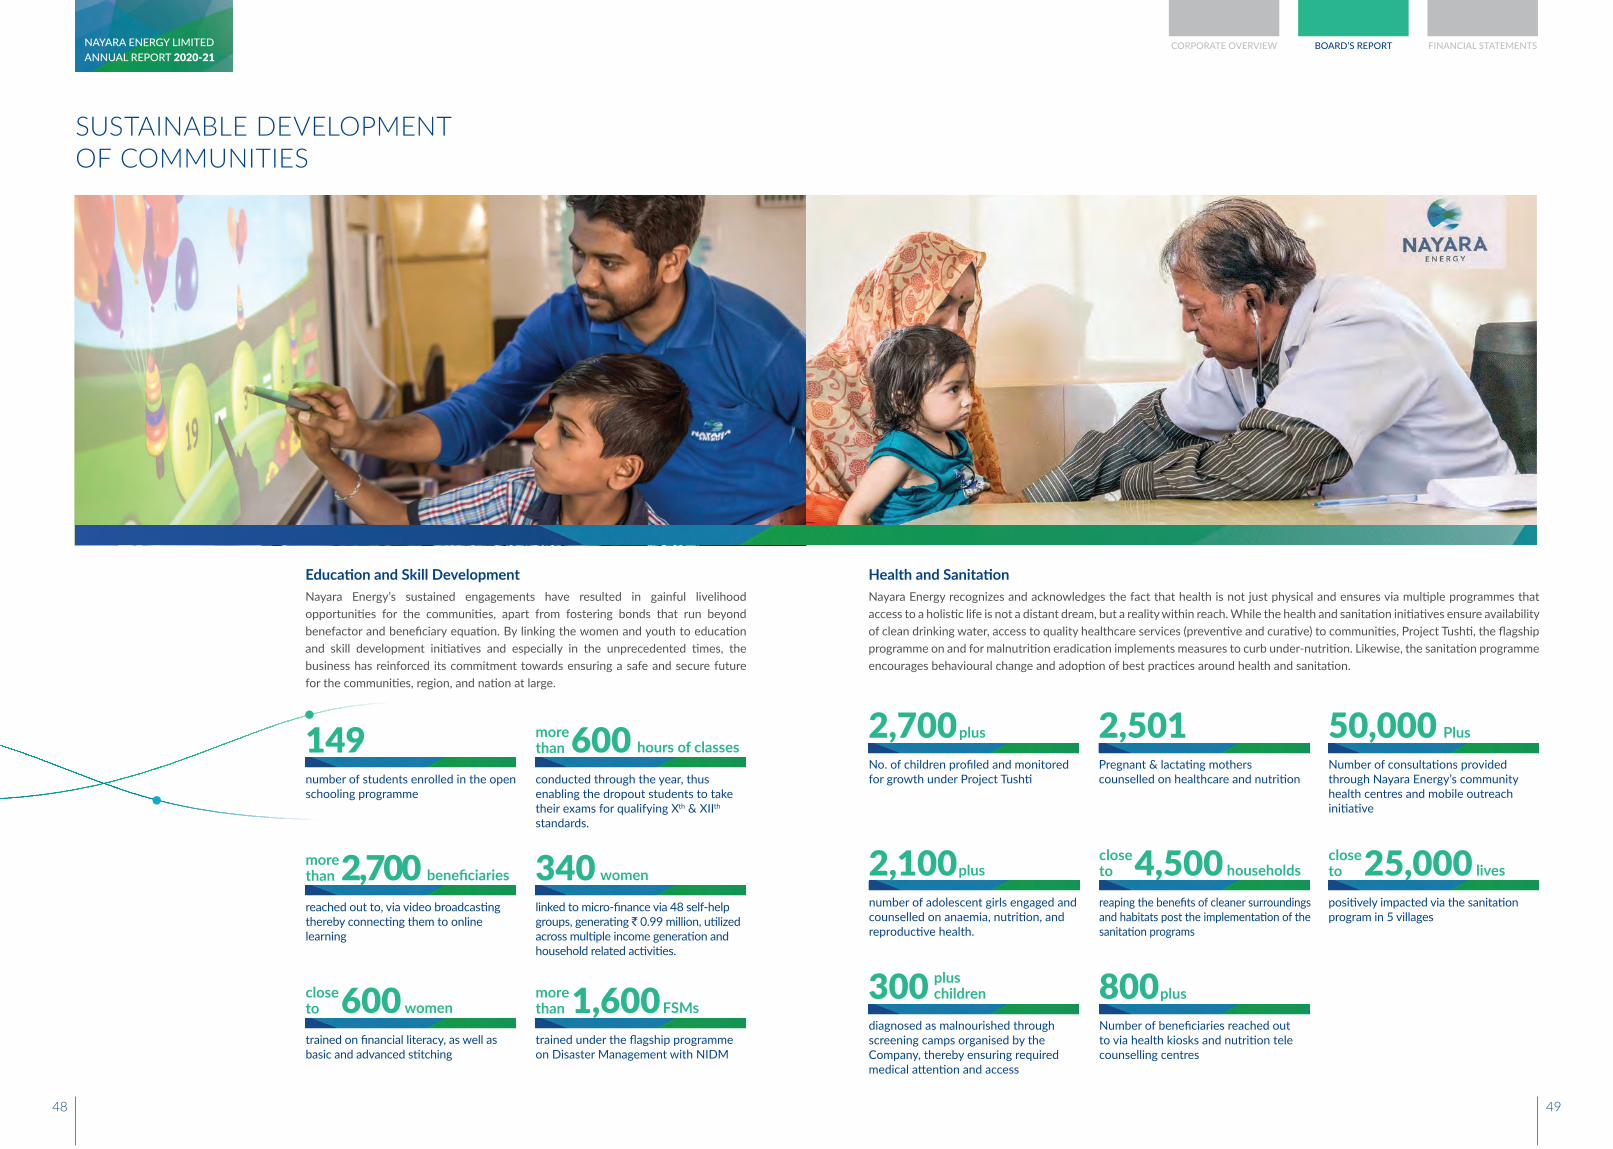
Education and Skill DevelopmentNayara Energy’s sustained engagements have resulted in gainful livelihood opportunities for the communities, apart from fostering bonds that run beyond benefactor and beneficiary equation. By linking the women and youth to education and skill development initiatives and especially in the unprecedented times, the business has reinforced its commitment towards ensuring a safe and secure future for the communities, region, and nation at large.
number of students enrolled in the open schooling programme
149conducted through the year, thus enabling the dropout students to take their exams for qualifying Xth & XIIth standards.
600more than hours of classes
trained under the flagship programme on Disaster Management with NIDM
1,600more than FSMs
linked to micro-finance via 48 self-help groups, generating ` 0.99 million, utilized across multiple income generation and household related activities.
340 women
reached out to, via video broadcasting thereby connecting them to online learning
2,700 beneficiariesmore than
trained on financial literacy, as well as basic and advanced stitching
600 womenclose to
Health and SanitationNayara Energy recognizes and acknowledges the fact that health is not just physical and ensures via multiple programmes that access to a holistic life is not a distant dream, but a reality within reach. While the health and sanitation initiatives ensure availability of clean drinking water, access to quality healthcare services (preventive and curative) to communities, Project Tushti, the flagship programme on and for malnutrition eradication implements measures to curb under-nutrition. Likewise, the sanitation programme encourages behavioural change and adoption of best practices around health and sanitation.
Number of consultations provided through Nayara Energy’s community health centres and mobile outreach initiative
50,000 Plus
diagnosed as malnourished through screening camps organised by the Company, thereby ensuring required medical attention and access
300 plus children
No. of children profiled and monitored for growth under Project Tushti
2,700plus
number of adolescent girls engaged and counselled on anaemia, nutrition, and reproductive health.
2,100plus
Pregnant & lactating mothers counselled on healthcare and nutrition
2,501
Number of beneficiaries reached out to via health kiosks and nutrition tele counselling centres
800plus
positively impacted via the sanitation program in 5 villages
25,000 livesclose to
reaping the benefits of cleaner surroundings and habitats post the implementation of the sanitation programs
4,500 householdsclose to
ANNUAL REPORT 2020-21NAYARA ENERGY LIMITED CORPORATE OVERVIEW BOARD’S REPORT FINANCIAL STATEMENTS
48 49

GOVERNANCE
Corporate Governance is a vital part of our business framework. It is designed to ensure compliance, transparency, and integrity in all areas of our work.
DirectorsThere was no change in the composition of the Board of Directors of the Company since reported in the last Board’s Report.
The Company received declarations of independence, as stipulated under Section 149 (6) of the Act, from the Independent Directors.
Directors’ Responsibility StatementPursuant to the provisions of Section 134(3)(c) of the Act, it is hereby confirmed that:
In the preparation of the annual accounts for FY 2021, applicable accounting standards were followed along with proper explanation relating to material departures
The Directors selected accounting policies, and applied them consistently and made judgments and estimates that were reasonable and prudent so as to give a true and fair view of the Company’s state of affairs at the end of FY 2021 and of the profit and loss for the same period
The Directors took proper and sufficient care for maintaining adequate accounting records in accordance with the provisions of the Act, to safeguard the Company’s assets, and prevent and detect fraud and other irregularities
The Directors prepared the accounts for the year ended March 31, 2021 on a ‘going concern’ basis
The Directors devised proper systems ensuring compliance with the provisions of all applicable laws, and that such systems were adequate and operating effectively
Policy on Appointment of Directors and RemunerationThe Board has adopted a policy for appointment, remuneration, training, and evaluation of Directors and employees. The policy, inter-alia, included the criteria and procedures for selection, identification and appointment of Directors, criteria for appointment of Senior Management Executives, remuneration to Executive and Non-Executive Directors, training and performance evaluation of the Board, among others, and other matters provided under Section 178(3) of the Act. The above policy is available on the Company’s website at https://www.nayaraenergy.com/investors/information.
Performance Evaluation of the Board, Chairman, Committees, and Individual DirectorsFormal performance evaluation of the Board, its Committees, the Chairman and Individual Directors for FY 2021 was carried out. The Independent Directors evaluated performance of the Chairman, Non-Independent Directors and the Board. Feedback from Individual Directors was sought based on a structured questionnaire. The evaluation was reviewed by the Nomination and Remuneration Committee and the Board of Directors.
Key Managerial PersonnelDr. Alois Virag joined the Company as “Chief Executive Officer” with effect from April 1, 2021 to hold office for a period of 3 years. Mr. B. Anand ceased to be a “Chief Executive Officer” with effect from March 31, 2021.
The following executives were designated as Key Managerial Personnel under the Act:
Mr. Charles Anthony Fountain Executive Chairman
Dr. Alois Virag Chief Executive Officer (w.e.f. April 1, 2021)
Mr. B. Anand Chief Executive Officer (up to March 31, 2021)
Mr. Anup Vikal Chief Financial Officer
Mr. Prasad Panicker Director & Head of Refinery
Mr. Mayank Bhargava Company Secretary
Audit CommitteeDuring the year, the Audit Committee comprised of Mr. Deepak Kapoor (Independent Director) as its Chairman and Ms. Naina Lal Kidwai (Independent Director) and Mr. Chin Hwee Tan as its members. There was no change in the constitution of the Audit Committee during FY 2021. During FY 2021, all the recommendations of the Audit Committee were accepted by the Board.
ANNUAL REPORT 2020-21NAYARA ENERGY LIMITED CORPORATE OVERVIEW BOARD’S REPORT FINANCIAL STATEMENTS
50 51

To deal with ever-changing risk landscape, Nayara Energy has a comprehensive and robust risk management policy and framework that drives a risk aware culture across the organization and ensures all the risks are effectively identified and managed.
The Company has constituted a Risk & HSE Committee which regularly reviews the organization’s risk profile and keeps a track of all existing and potential risks. These risks are further classified into ‘intolerable’, ‘critical’ and ‘moderate’ category depending upon probability of the occurrence and potential impact. The Company has also developed a risk appetite statement which articulates the amount of risk the Company is willing to take in pursuit of its objectives and is measured in the form of a descriptive statement for various risk parameters. Based on the appetite as finalized under risk appetite statement, tolerances are defined for the identified risk parameters as part of ‘Risk Assessment Criteria’ to facilitate an objective impact assessment.
The Company effectively addresses its key risks by implementing appropriate and adequate risk response plans and/or internal control measures that brings down the risks to
acceptable and manageable levels. In the opinion of the Board, the Company has an adequate robust framework for identifying and mitigating all key risks that the Company is facing.
INTERNAL FINANCIAL CONTROLS Nayara Energy has in place a robust system and framework of Internal Financial Controls. This framework provides a reasonable assurance regarding the adequacy of operating effectiveness of controls with regard to financial reporting, operational and compliance risks. The framework ensures that the Company has policies and procedures for ensuring orderly and efficient conduct of the business, safeguarding of assets of the Company, prevention and detection of frauds, accuracy and completeness of accounting records and timely preparation of reliable financial information. The Company has devised appropriate systems and framework including proper delegation of authority, effective IT systems aligned to business requirements, risk based internal audits, risk management framework and whistle-blower mechanism. The Company has also developed and implemented a framework for ensuring internal controls over financial reporting. This framework includes a risk and control matrix covering entity level controls, process and operating level controls and IT general controls.
Such controls have been assessed during the year under review taking into consideration the essential components of internal controls stated in the “Guidance Note on Audit of Internal Financial Controls over Financial Reporting” issued by “The Institute of Chartered Accountants of India”. The entity level policies include anti-fraud policies such as Ethics Code, Conflict of Interest, Confidentiality and Whistle Blower Policy and other policies (viz. organization structure, HR policies, IT security policies).
During the year, controls were tested and no material weakness in design and effectiveness were observed. Nonetheless, the Company recognizes that any internal control framework, no matter how well-designed, has inherent limitations and accordingly, regular audits and review processes ensure that such systems are reinforced on an ongoing basis.
Governance & Control Framework Implementation During the year, the Company also implemented Governance & Control Framework in critical areas of the Company like Refinery, IST, EPS and Marketing. This involved self-certification of design of the operational and financial controls in their respective business areas by the Business Head/ Finance Head.
VIGIL MECHANISMThe Ethics Code, which is fundamental to the values of Nayara Energy Limited, has been introduced to promote the highest standards of ethical conduct, professional excellence and integrity.
With the purpose to help Directors, Employees and Associates to recognize corrupt and unethical business practices and to steer themselves away from them, we introduced Anti-Corruption Policy. The policy will help us to create an honest and transparent culture that permeates throughout the organization and to achieve “zero tolerance” approach towards Bribery and Corruption.
To maintain Ethical standards at highest level, the Company encourages its employees and other stakeholders, who have concerns about the actual or suspected improper conduct or behavior such as demanding or accepting bribes, dishonest, abuse of powers, corruption, fraud, theft, embezzlement, misuse of funds, etc. to come forward and express these concerns without fear of punishment or unfair treatment. The Whistle-Blower Policy was also implemented in Nayara Energy.
RISK MANAGEMENT
ANNUAL REPORT 2020-21NAYARA ENERGY LIMITED CORPORATE OVERVIEW BOARD’S REPORT FINANCIAL STATEMENTS
52 53

AUDITORS AND AUDIT DISCLOSURESStatutory AuditorThe reports given by M/s. S. R. Batliboi & Co. LLP, Statutory Auditors, on the Company’s standalone and consolidated financial statements for FY 2021, form a part of this Annual Report. There were no qualifications, reservations, adverse remarks, or disclaimers given by the Auditors in their reports. The notes on financial statements, referred to in the Auditors’ Report, are self-explanatory and do not call for any further comments.
Cost AuditorIn accordance with the provisions of Section 148 of the Act, the Company maintained cost records as specified by the Central Government.
The Cost Audit Report for the financial year ended March 31, 2021, will be filed with the Ministry of Corporate Affairs within the prescribed time period.
Secretarial AuditorThe Secretarial Audit Report, issued by M/s. Parikh Parekh & Associates, Practicing Company Secretaries, for the year ended March 31, 2021, is attached as Annexure - B to this Report. The Secretarial Audit Report does not contain any qualification, reservation, or adverse remark.
Compliance with Secretarial StandardYour Company fully complied with the provisions of Secretarial Standards 1 (SS 1) on Board/Committee meetings and Secretarial Standards 2 (SS 2) on the General meeting of Shareholders, issued by the Institute of Company Secretaries of India and approved by the Central Government, pursuant to Section 118 of the Companies Act, 2013.
Number of meetings of the BoardDuring the FY 2021, the Board of Directors met six times i.e. April 30, 2020, June 30, 2020, October 22, 2020, October 27, 2020, January 19, 2021 and February 3, 2021. All these meetings were well attended by the directors.
Particulars of Contracts or Arrangements with Related PartiesThe details of contracts entered with related parties, during the year, in compliance with the provisions of Section 188 of the Act, are specified in Form AOC 2 and enclosed as Annexure – C. The details of material Related Party Transactions entered during the year, by the Company are also required to be included in the Form AOC 2. Though the Act has not defined the criteria for “Material Related Party Transactions” and the Company is no more listed on Stock Exchanges, it continues to follow the criteria for determining the material related party transaction prescribed in the SEBI (Listing Obligations and Disclosure Requirements), Regulations 2015. No material related party transaction was entered into by the Company during the financial year 2021.
Related party disclosures, as required by Ind AS 24, have been made in Note no. 44 and 46 to the standalone and consolidated financial statements of the Company, respectively.
Particulars of Loans given, Investments made and Guarantees given and Security providedParticulars of investments made are provided in the standalone financial statements (please refer Note no. 7 of the standalone financial statements). Since Nayara Energy belongs to the petroleum sector and operates ‘infrastructure facilities’ as defined under Schedule VI of the Act, it is not required to comply with provisions relating to making of investment, loans, giving guarantees, or providing security as prescribed in Section 186 of the Act.
Conservation of Energy, Technology Absorption, Foreign Exchange Earnings, and OutgoThe particulars relating conservation of energy, technology absorption, and foreign exchange earnings and outgo, as required to be disclosed under the Act, are provided as Annexure – D to this Report.
Annual Return The Annual Return for the financial year ended March 31, 2020, filed with the Registrar of Companies, after conclusion of the 30th Annual General Meeting, held on September 17, 2020, is placed on the Company website and can be accessed at https://www.nayaraenergy.com/investors/information.
Further, the Annual Return of the Company as on March 31, 2021 is available on the Company’s website and can be accessed at https://www.nayaraenergy.com/investors/information.
Fixed DepositsThe Company did not accept any deposits from the public in accordance with the provisions of Sections 73 to 76 of the Act and the Rules framed thereunder. Accordingly, the details required to be reported under Rule 8(5) of the Companies (Accounts) Rules, 2014, were not applicable.
General DisclosuresYour Directors state that for the year ended March 31, 2021, no disclosure was required in respect of the following items and accordingly confirm as under:
The Executive Directors did not receive any remuneration from the subsidiary companies
The Company revised neither the financial statements nor the report of Board of Directors
The Company did not issue equity shares with differential rights as to dividend, voting, or otherwise or sweat equity shares
No significant or material orders were passed by the Regulators or Courts or Tribunals, which impact the going concern status or operations in future
The Company did not buy back any shares during the year
No instance of fraud was reported to either Audit Committee or the Board of Directors
ACKNOWLEDGEMENTThe Board expresses its sincere appreciation and gratitude to Financial Institutions, Banks, Customers, Suppliers, and Investors of the Company, for their continual support. We also value the ongoing cooperation extended to the Company by the Government of India, Gujarat and other state governments and various government agencies/departments.
In these challenging times resulting from COVID-19 pandemic the Board expresses regret over the loss of life and difficulties being faced by people. The Company salutes all the people who have risked their life and safety to fight this pandemic and helped fellow citizens in this hour of need.
The Board also recognizes all team members for their efforts behind our results and maintaining resilience during these difficult times. Their talent, passion and agility has made the Company sustain its performance year-on-year.
For and on behalf of the Board of Directors
Date: July 1, 2021 Charles Anthony FountainPlace: Sussex, United Kingdom Executive Chairman
(DIN - 07719852)
ANNUAL REPORT 2020-21NAYARA ENERGY LIMITED CORPORATE OVERVIEW BOARD’S REPORT FINANCIAL STATEMENTS
54 55
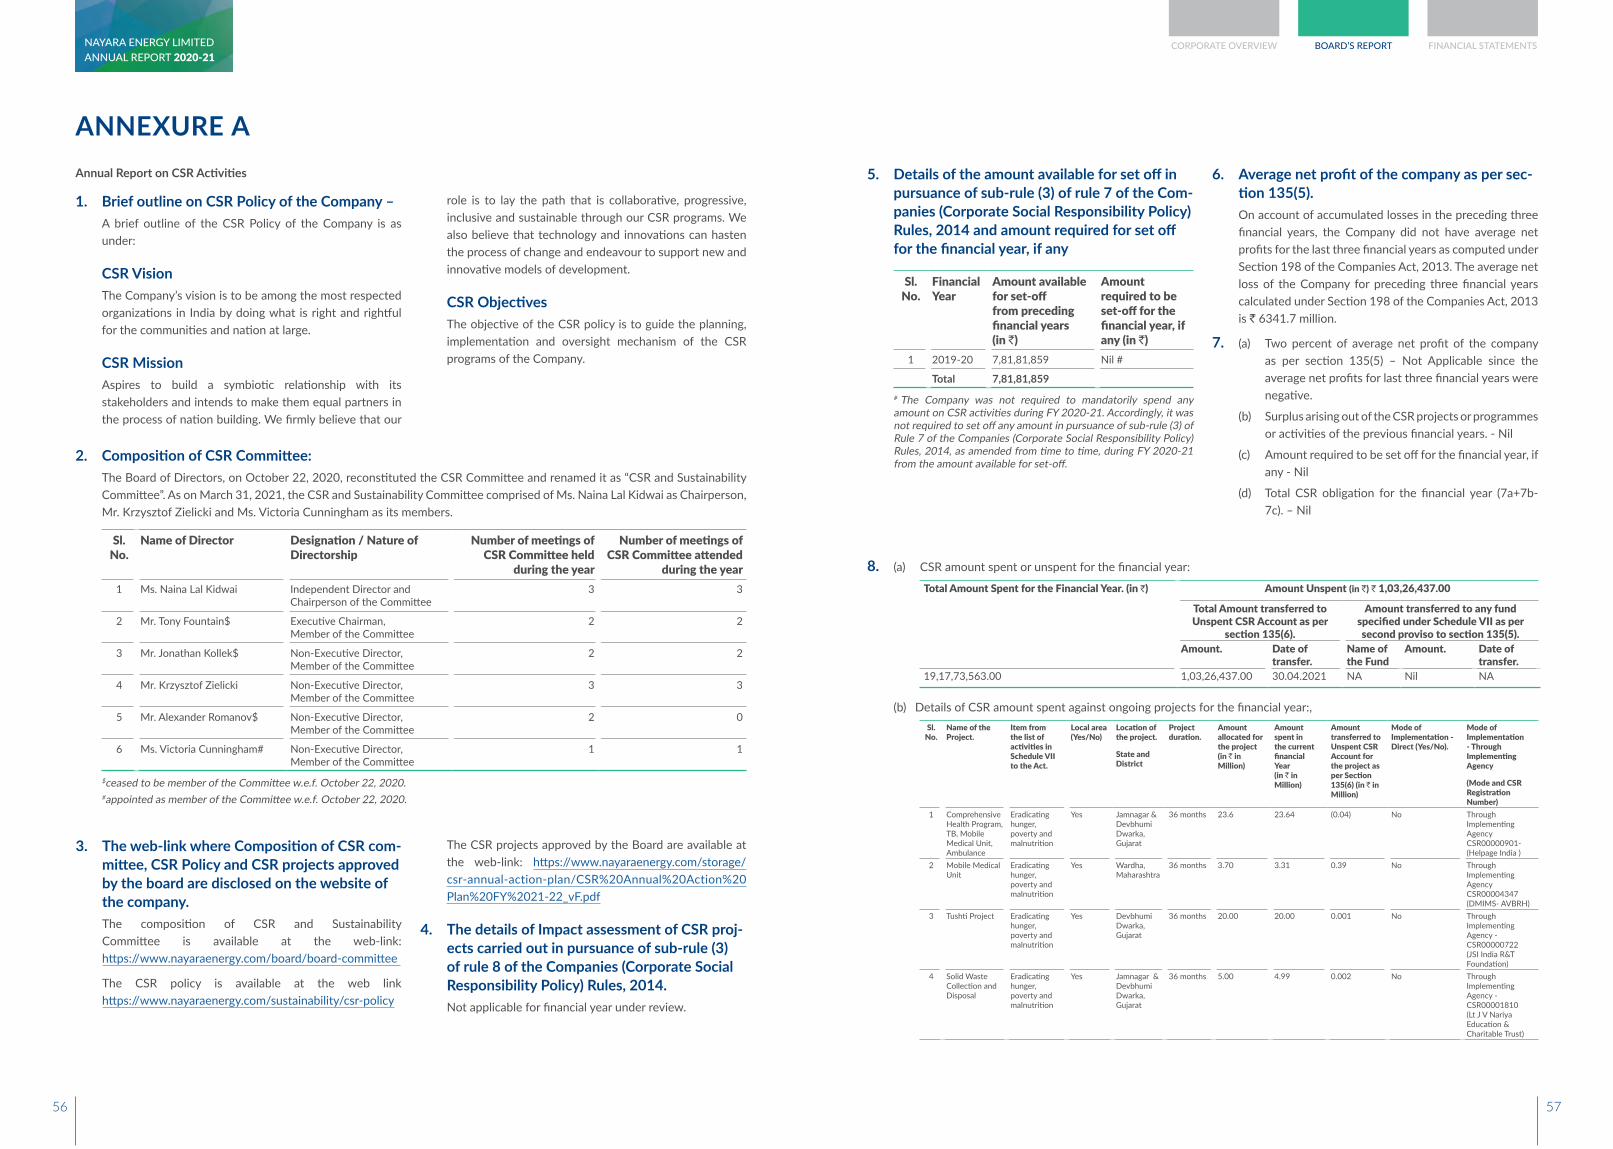
ANNEXURE A
1. Brief outline on CSR Policy of the Company – A brief outline of the CSR Policy of the Company is as
under:
CSR Vision The Company’s vision is to be among the most respected
organizations in India by doing what is right and rightful for the communities and nation at large.
CSR Mission Aspires to build a symbiotic relationship with its
stakeholders and intends to make them equal partners in the process of nation building. We firmly believe that our
role is to lay the path that is collaborative, progressive, inclusive and sustainable through our CSR programs. We also believe that technology and innovations can hasten the process of change and endeavour to support new and innovative models of development.
CSR Objectives The objective of the CSR policy is to guide the planning,
implementation and oversight mechanism of the CSR programs of the Company.
2. Composition of CSR Committee: The Board of Directors, on October 22, 2020, reconstituted the CSR Committee and renamed it as “CSR and Sustainability
Committee”. As on March 31, 2021, the CSR and Sustainability Committee comprised of Ms. Naina Lal Kidwai as Chairperson, Mr. Krzysztof Zielicki and Ms. Victoria Cunningham as its members.
Sl. No.
Name of Director Designation / Nature of Directorship
Number of meetings of CSR Committee held
during the year
Number of meetings of CSR Committee attended
during the year1 Ms. Naina Lal Kidwai Independent Director and
Chairperson of the Committee3 3
2 Mr. Tony Fountain$ Executive Chairman, Member of the Committee
2 2
3 Mr. Jonathan Kollek$ Non-Executive Director, Member of the Committee
2 2
4 Mr. Krzysztof Zielicki Non-Executive Director, Member of the Committee
3 3
5 Mr. Alexander Romanov$ Non-Executive Director, Member of the Committee
2 0
6 Ms. Victoria Cunningham# Non-Executive Director, Member of the Committee
1 1
$ceased to be member of the Committee w.e.f. October 22, 2020. #appointed as member of the Committee w.e.f. October 22, 2020.
3. The web-link where Composition of CSR com-mittee, CSR Policy and CSR projects approved by the board are disclosed on the website of the company.
The composition of CSR and Sustainability Committee is available at the web-link: https://www.nayaraenergy.com/board/board-committee
The CSR policy is available at the web link https://www.nayaraenergy.com/sustainability/csr-policy
The CSR projects approved by the Board are available at the web-link: https://www.nayaraenergy.com/storage/csr-annual-action-plan/CSR%20Annual%20Action%20Plan%20FY%2021-22_vF.pdf
4. The details of Impact assessment of CSR proj-ects carried out in pursuance of sub-rule (3) of rule 8 of the Companies (Corporate Social Responsibility Policy) Rules, 2014.
Not applicable for financial year under review.
5. Details of the amount available for set off in pursuance of sub-rule (3) of rule 7 of the Com-panies (Corporate Social Responsibility Policy) Rules, 2014 and amount required for set off for the financial year, if any
Sl. No.
Financial Year
Amount available for set-off from preceding financial years (in `)
Amount required to be set-off for the financial year, if any (in `)
1 2019-20 7,81,81,859 Nil #
Total 7,81,81,859
# The Company was not required to mandatorily spend any amount on CSR activities during FY 2020-21. Accordingly, it was not required to set off any amount in pursuance of sub-rule (3) of Rule 7 of the Companies (Corporate Social Responsibility Policy) Rules, 2014, as amended from time to time, during FY 2020-21 from the amount available for set-off.
6. Average net profit of the company as per sec-tion 135(5).
On account of accumulated losses in the preceding three financial years, the Company did not have average net profits for the last three financial years as computed under Section 198 of the Companies Act, 2013. The average net loss of the Company for preceding three financial years calculated under Section 198 of the Companies Act, 2013 is ` 6341.7 million.
7. (a) Two percent of average net profit of the company as per section 135(5) – Not Applicable since the average net profits for last three financial years were negative.
(b) Surplus arising out of the CSR projects or programmes or activities of the previous financial years. - Nil
(c) Amount required to be set off for the financial year, if any - Nil
(d) Total CSR obligation for the financial year (7a+7b-7c). – Nil
8. (a) CSR amount spent or unspent for the financial year:
Total Amount Spent for the Financial Year. (in `) Amount Unspent (in `) ` 1,03,26,437.00
Total Amount transferred to Unspent CSR Account as per
section 135(6).
Amount transferred to any fund specified under Schedule VII as per second proviso to section 135(5).
Amount. Date of transfer.
Name of the Fund
Amount. Date of transfer.
19,17,73,563.00 1,03,26,437.00 30.04.2021 NA Nil NA
(b) Details of CSR amount spent against ongoing projects for the financial year:,Sl.
No.Name of the Project.
Item from the list of activities in Schedule VII to the Act.
Local area (Yes/No)
Location of the project.
State and District
Project duration.
Amount allocated for the project (in ` in Million)
Amount spent in the current financial Year (in ` in Million)
Amount transferred to Unspent CSR Account for the project as per Section 135(6) (in ` in Million)
Mode of Implementation - Direct (Yes/No).
Mode of Implementation - Through Implementing Agency
(Mode and CSR Registration Number)
1 Comprehensive Health Program, TB, Mobile Medical Unit, Ambulance
Eradicating hunger, poverty and malnutrition
Yes Jamnagar & Devbhumi Dwarka, Gujarat
36 months 23.6 23.64 (0.04) No Through Implementing AgencyCSR00000901- (Helpage India )
2 Mobile Medical Unit
Eradicating hunger, poverty and malnutrition
Yes Wardha, Maharashtra
36 months 3.70 3.31 0.39 No Through Implementing AgencyCSR00004347(DMIMS- AVBRH)
3 Tushti Project Eradicating hunger, poverty and malnutrition
Yes Devbhumi Dwarka,Gujarat
36 months 20.00 20.00 0.001 No Through Implementing Agency - CSR00000722(JSI India R&T Foundation)
4 Solid Waste Collection and Disposal
Eradicating hunger, poverty and malnutrition
Yes Jamnagar & Devbhumi Dwarka, Gujarat
36 months 5.00 4.99 0.002 No Through Implementing Agency - CSR00001810(Lt J V Nariya Education & Charitable Trust)
Annual Report on CSR Activities
ANNUAL REPORT 2020-21NAYARA ENERGY LIMITED CORPORATE OVERVIEW BOARD’S REPORT FINANCIAL STATEMENTS
56 57
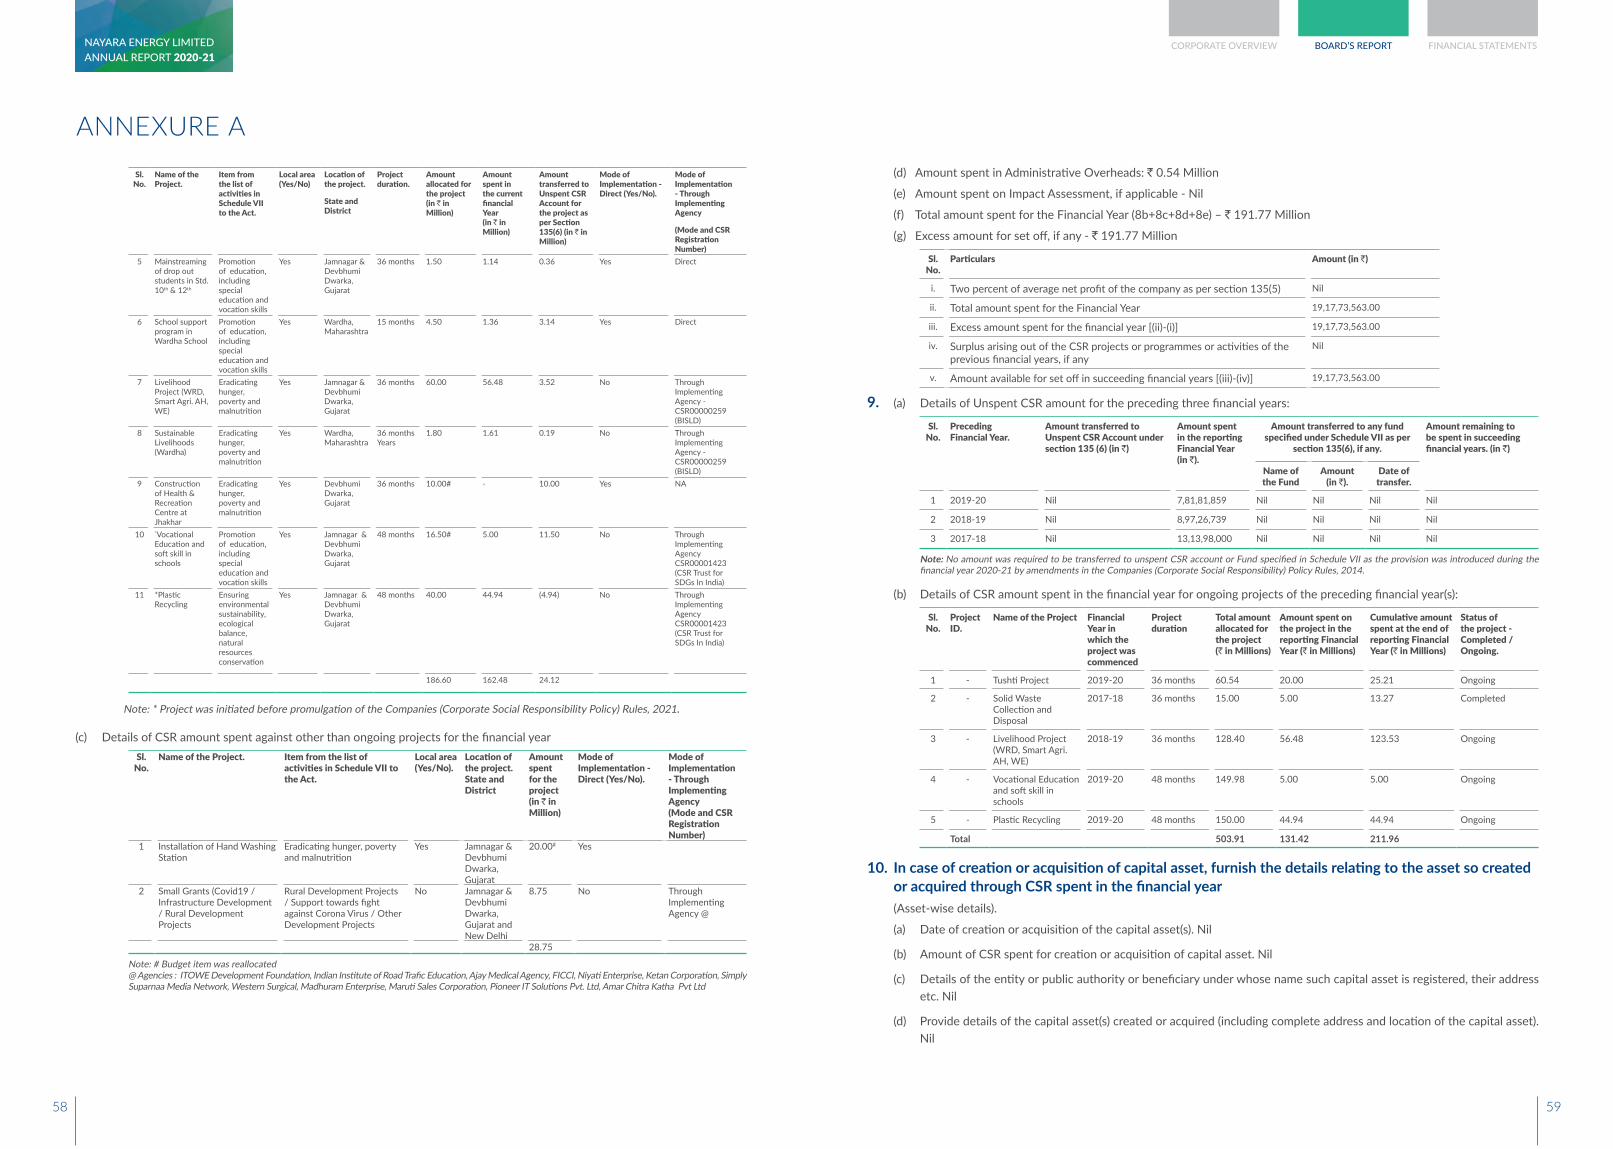
Sl. No.
Name of the Project.
Item from the list of activities in Schedule VII to the Act.
Local area (Yes/No)
Location of the project.
State and District
Project duration.
Amount allocated for the project (in ` in Million)
Amount spent in the current financial Year (in ` in Million)
Amount transferred to Unspent CSR Account for the project as per Section 135(6) (in ` in Million)
Mode of Implementation - Direct (Yes/No).
Mode of Implementation - Through Implementing Agency
(Mode and CSR Registration Number)
5 Mainstreaming of drop out students in Std. 10th & 12th
Promotion of education, including special education and vocation skills
Yes Jamnagar & Devbhumi Dwarka, Gujarat
36 months 1.50 1.14 0.36 Yes Direct
6 School support program in Wardha School
Promotion of education, including special education and vocation skills
Yes Wardha, Maharashtra
15 months 4.50 1.36 3.14 Yes Direct
7 Livelihood Project (WRD, Smart Agri. AH, WE)
Eradicating hunger, poverty and malnutrition
Yes Jamnagar & Devbhumi Dwarka, Gujarat
36 months 60.00 56.48 3.52 No Through Implementing Agency - CSR00000259(BISLD)
8 Sustainable Livelihoods (Wardha)
Eradicating hunger, poverty and malnutrition
Yes Wardha, Maharashtra
36 months Years
1.80 1.61 0.19 No Through Implementing Agency - CSR00000259(BISLD)
9 Construction of Health & Recreation Centre at Jhakhar
Eradicating hunger, poverty and malnutrition
Yes Devbhumi Dwarka, Gujarat
36 months 10.00# - 10.00 Yes NA
10 *Vocational Education and soft skill in schools
Promotion of education, including special education and vocation skills
Yes Jamnagar & Devbhumi Dwarka, Gujarat
48 months 16.50# 5.00 11.50 No Through Implementing AgencyCSR00001423(CSR Trust for SDGs In India)
11 *Plastic Recycling
Ensuring environmental sustainability, ecological balance, natural resources conservation
Yes Jamnagar & Devbhumi Dwarka, Gujarat
48 months 40.00 44.94 (4.94) No Through Implementing AgencyCSR00001423(CSR Trust for SDGs In India)
186.60 162.48 24.12
Note: * Project was initiated before promulgation of the Companies (Corporate Social Responsibility Policy) Rules, 2021.
(c) Details of CSR amount spent against other than ongoing projects for the financial yearSl.
No.Name of the Project. Item from the list of
activities in Schedule VII to the Act.
Local area (Yes/No).
Location of the project.State and District
Amount spent for the project (in ` in Million)
Mode of Implementation - Direct (Yes/No).
Mode of Implementation - Through Implementing Agency(Mode and CSR Registration Number)
1 Installation of Hand Washing Station
Eradicating hunger, poverty and malnutrition
Yes Jamnagar & Devbhumi Dwarka, Gujarat
20.00# Yes
2 Small Grants (Covid19 / Infrastructure Development / Rural Development Projects
Rural Development Projects / Support towards fight against Corona Virus / Other Development Projects
No Jamnagar & Devbhumi Dwarka, Gujarat and New Delhi
8.75 No Through Implementing Agency @
28.75
Note: # Budget item was reallocated @ Agencies : ITOWE Development Foundation, Indian Institute of Road Trafic Education, Ajay Medical Agency, FICCI, Niyati Enterprise, Ketan Corporation, Simply
Suparnaa Media Network, Western Surgical, Madhuram Enterprise, Maruti Sales Corporation, Pioneer IT Solutions Pvt. Ltd, Amar Chitra Katha Pvt Ltd
ANNEXURE A (d) Amount spent in Administrative Overheads: ` 0.54 Million
(e) Amount spent on Impact Assessment, if applicable - Nil
(f) Total amount spent for the Financial Year (8b+8c+8d+8e) – ` 191.77 Million
(g) Excess amount for set off, if any - ` 191.77 Million
Sl. No.
Particulars Amount (in `)
i. Two percent of average net profit of the company as per section 135(5) Nil
ii. Total amount spent for the Financial Year 19,17,73,563.00
iii. Excess amount spent for the financial year [(ii)-(i)] 19,17,73,563.00
iv. Surplus arising out of the CSR projects or programmes or activities of the previous financial years, if any
Nil
v. Amount available for set off in succeeding financial years [(iii)-(iv)] 19,17,73,563.00
9. (a) Details of Unspent CSR amount for the preceding three financial years:
Sl. No.
Preceding Financial Year.
Amount transferred to Unspent CSR Account under section 135 (6) (in `)
Amount spent in the reporting Financial Year (in `).
Amount transferred to any fund specified under Schedule VII as per
section 135(6), if any.
Amount remaining to be spent in succeeding financial years. (in `)
Name of the Fund
Amount (in `).
Date of transfer.
1 2019-20 Nil 7,81,81,859 Nil Nil Nil Nil
2 2018-19 Nil 8,97,26,739 Nil Nil Nil Nil
3 2017-18 Nil 13,13,98,000 Nil Nil Nil Nil
Note: No amount was required to be transferred to unspent CSR account or Fund specified in Schedule VII as the provision was introduced during the financial year 2020-21 by amendments in the Companies (Corporate Social Responsibility) Policy Rules, 2014.
(b) Details of CSR amount spent in the financial year for ongoing projects of the preceding financial year(s):
Sl. No.
Project ID.
Name of the Project Financial Year in which the project was commenced
Project duration
Total amount allocated for the project (` in Millions)
Amount spent on the project in the reporting Financial Year (` in Millions)
Cumulative amount spent at the end of reporting Financial Year (` in Millions)
Status of the project - Completed /Ongoing.
1 - Tushti Project 2019-20 36 months 60.54 20.00 25.21 Ongoing
2 - Solid Waste Collection and Disposal
2017-18 36 months 15.00 5.00 13.27 Completed
3 - Livelihood Project (WRD, Smart Agri. AH, WE)
2018-19 36 months 128.40 56.48 123.53 Ongoing
4 - Vocational Education and soft skill in schools
2019-20 48 months 149.98 5.00 5.00 Ongoing
5 - Plastic Recycling 2019-20 48 months 150.00 44.94 44.94 Ongoing
Total 503.91 131.42 211.96
10. In case of creation or acquisition of capital asset, furnish the details relating to the asset so created or acquired through CSR spent in the financial year
(Asset-wise details).
(a) Date of creation or acquisition of the capital asset(s). Nil
(b) Amount of CSR spent for creation or acquisition of capital asset. Nil
(c) Details of the entity or public authority or beneficiary under whose name such capital asset is registered, their address etc. Nil
(d) Provide details of the capital asset(s) created or acquired (including complete address and location of the capital asset). Nil
ANNUAL REPORT 2020-21NAYARA ENERGY LIMITED CORPORATE OVERVIEW BOARD’S REPORT FINANCIAL STATEMENTS
58 59
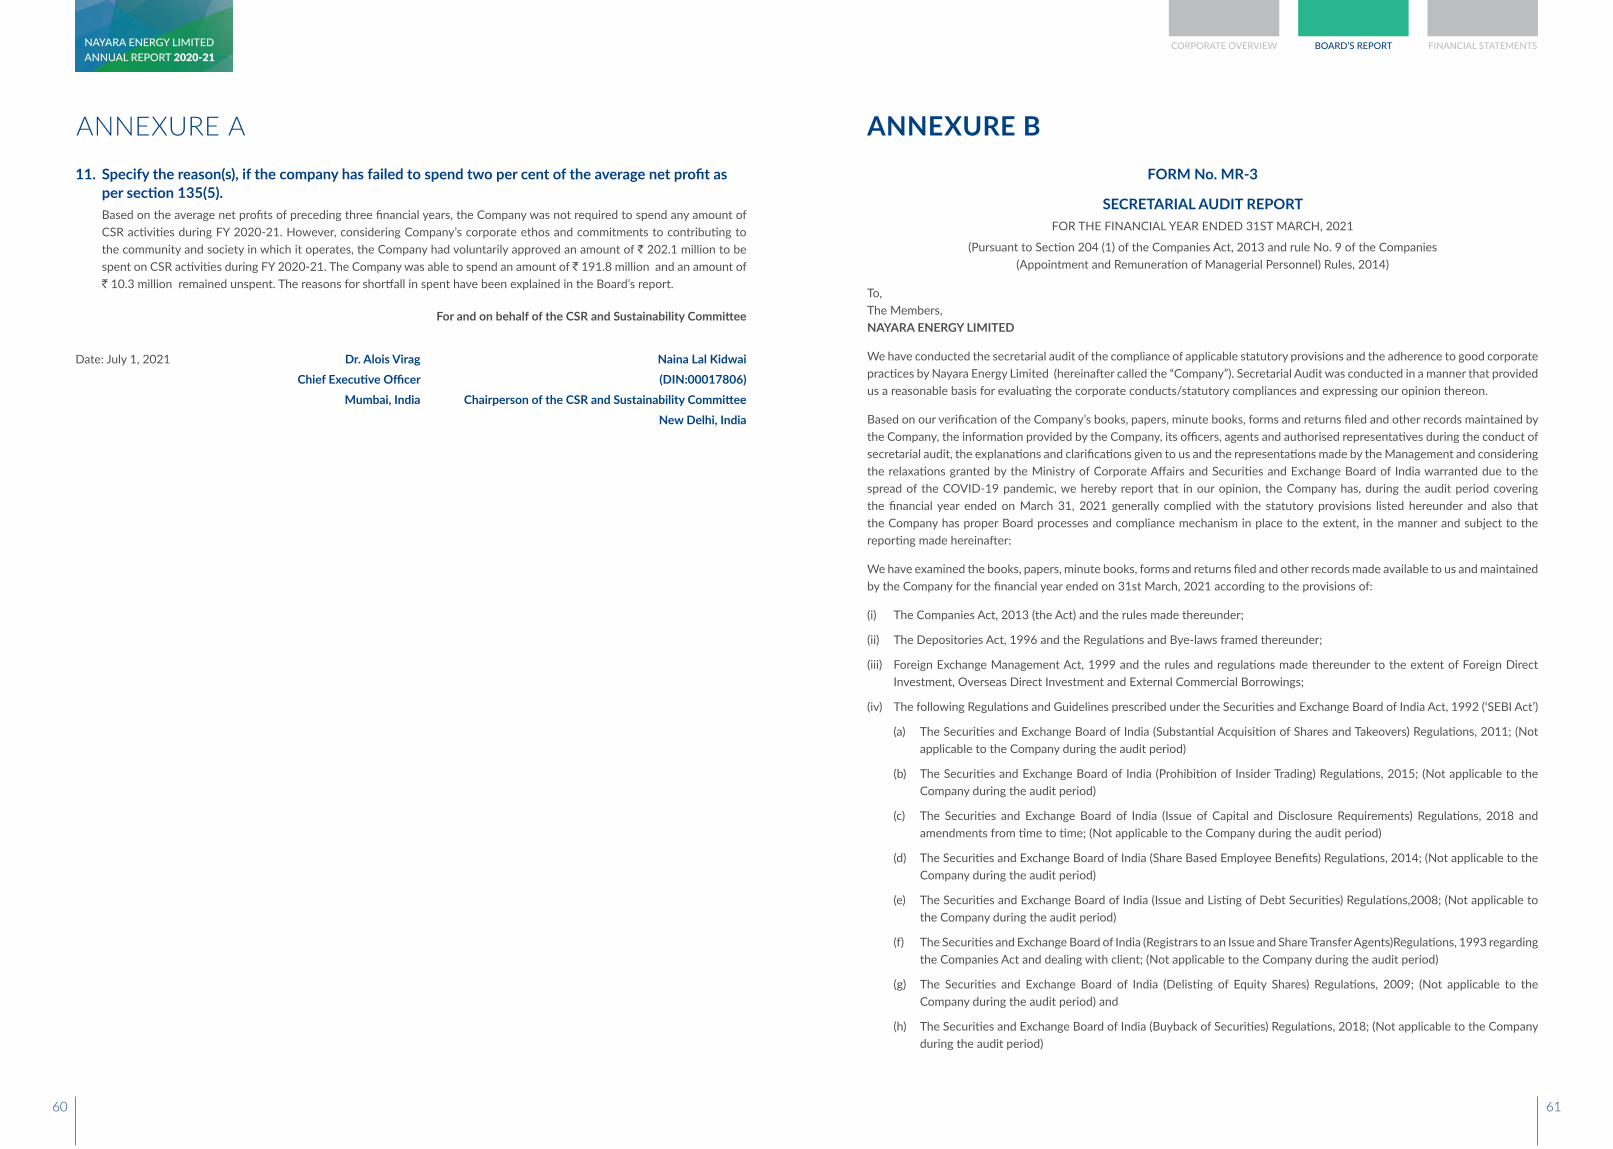
11. Specify the reason(s), if the company has failed to spend two per cent of the average net profit as per section 135(5).
Based on the average net profits of preceding three financial years, the Company was not required to spend any amount of CSR activities during FY 2020-21. However, considering Company’s corporate ethos and commitments to contributing to the community and society in which it operates, the Company had voluntarily approved an amount of ` 202.1 million to be spent on CSR activities during FY 2020-21. The Company was able to spend an amount of ` 191.8 million and an amount of ` 10.3 million remained unspent. The reasons for shortfall in spent have been explained in the Board’s report.
For and on behalf of the CSR and Sustainability Committee
Date: July 1, 2021 Dr. Alois Virag Naina Lal KidwaiChief Executive Officer (DIN:00017806)
Mumbai, India Chairperson of the CSR and Sustainability CommitteeNew Delhi, India
ANNEXURE A ANNEXURE BFORM No. MR-3
SECRETARIAL AUDIT REPORTFOR THE FINANCIAL YEAR ENDED 31ST MARCH, 2021
(Pursuant to Section 204 (1) of the Companies Act, 2013 and rule No. 9 of the Companies (Appointment and Remuneration of Managerial Personnel) Rules, 2014)
To,The Members,NAYARA ENERGY LIMITED
We have conducted the secretarial audit of the compliance of applicable statutory provisions and the adherence to good corporate practices by Nayara Energy Limited (hereinafter called the “Company”). Secretarial Audit was conducted in a manner that provided us a reasonable basis for evaluating the corporate conducts/statutory compliances and expressing our opinion thereon.
Based on our verification of the Company’s books, papers, minute books, forms and returns filed and other records maintained by the Company, the information provided by the Company, its officers, agents and authorised representatives during the conduct of secretarial audit, the explanations and clarifications given to us and the representations made by the Management and considering the relaxations granted by the Ministry of Corporate Affairs and Securities and Exchange Board of India warranted due to the spread of the COVID-19 pandemic, we hereby report that in our opinion, the Company has, during the audit period covering the financial year ended on March 31, 2021 generally complied with the statutory provisions listed hereunder and also that the Company has proper Board processes and compliance mechanism in place to the extent, in the manner and subject to the reporting made hereinafter:
We have examined the books, papers, minute books, forms and returns filed and other records made available to us and maintained by the Company for the financial year ended on 31st March, 2021 according to the provisions of:
(i) The Companies Act, 2013 (the Act) and the rules made thereunder;
(ii) The Depositories Act, 1996 and the Regulations and Bye-laws framed thereunder;
(iii) Foreign Exchange Management Act, 1999 and the rules and regulations made thereunder to the extent of Foreign Direct Investment, Overseas Direct Investment and External Commercial Borrowings;
(iv) The following Regulations and Guidelines prescribed under the Securities and Exchange Board of India Act, 1992 (‘SEBI Act’)
(a) The Securities and Exchange Board of India (Substantial Acquisition of Shares and Takeovers) Regulations, 2011; (Not applicable to the Company during the audit period)
(b) The Securities and Exchange Board of India (Prohibition of Insider Trading) Regulations, 2015; (Not applicable to the Company during the audit period)
(c) The Securities and Exchange Board of India (Issue of Capital and Disclosure Requirements) Regulations, 2018 and amendments from time to time; (Not applicable to the Company during the audit period)
(d) The Securities and Exchange Board of India (Share Based Employee Benefits) Regulations, 2014; (Not applicable to the Company during the audit period)
(e) The Securities and Exchange Board of India (Issue and Listing of Debt Securities) Regulations,2008; (Not applicable to the Company during the audit period)
(f) The Securities and Exchange Board of India (Registrars to an Issue and Share Transfer Agents)Regulations, 1993 regarding the Companies Act and dealing with client; (Not applicable to the Company during the audit period)
(g) The Securities and Exchange Board of India (Delisting of Equity Shares) Regulations, 2009; (Not applicable to the Company during the audit period) and
(h) The Securities and Exchange Board of India (Buyback of Securities) Regulations, 2018; (Not applicable to the Company during the audit period)
ANNUAL REPORT 2020-21NAYARA ENERGY LIMITED CORPORATE OVERVIEW BOARD’S REPORT FINANCIAL STATEMENTS
60 61
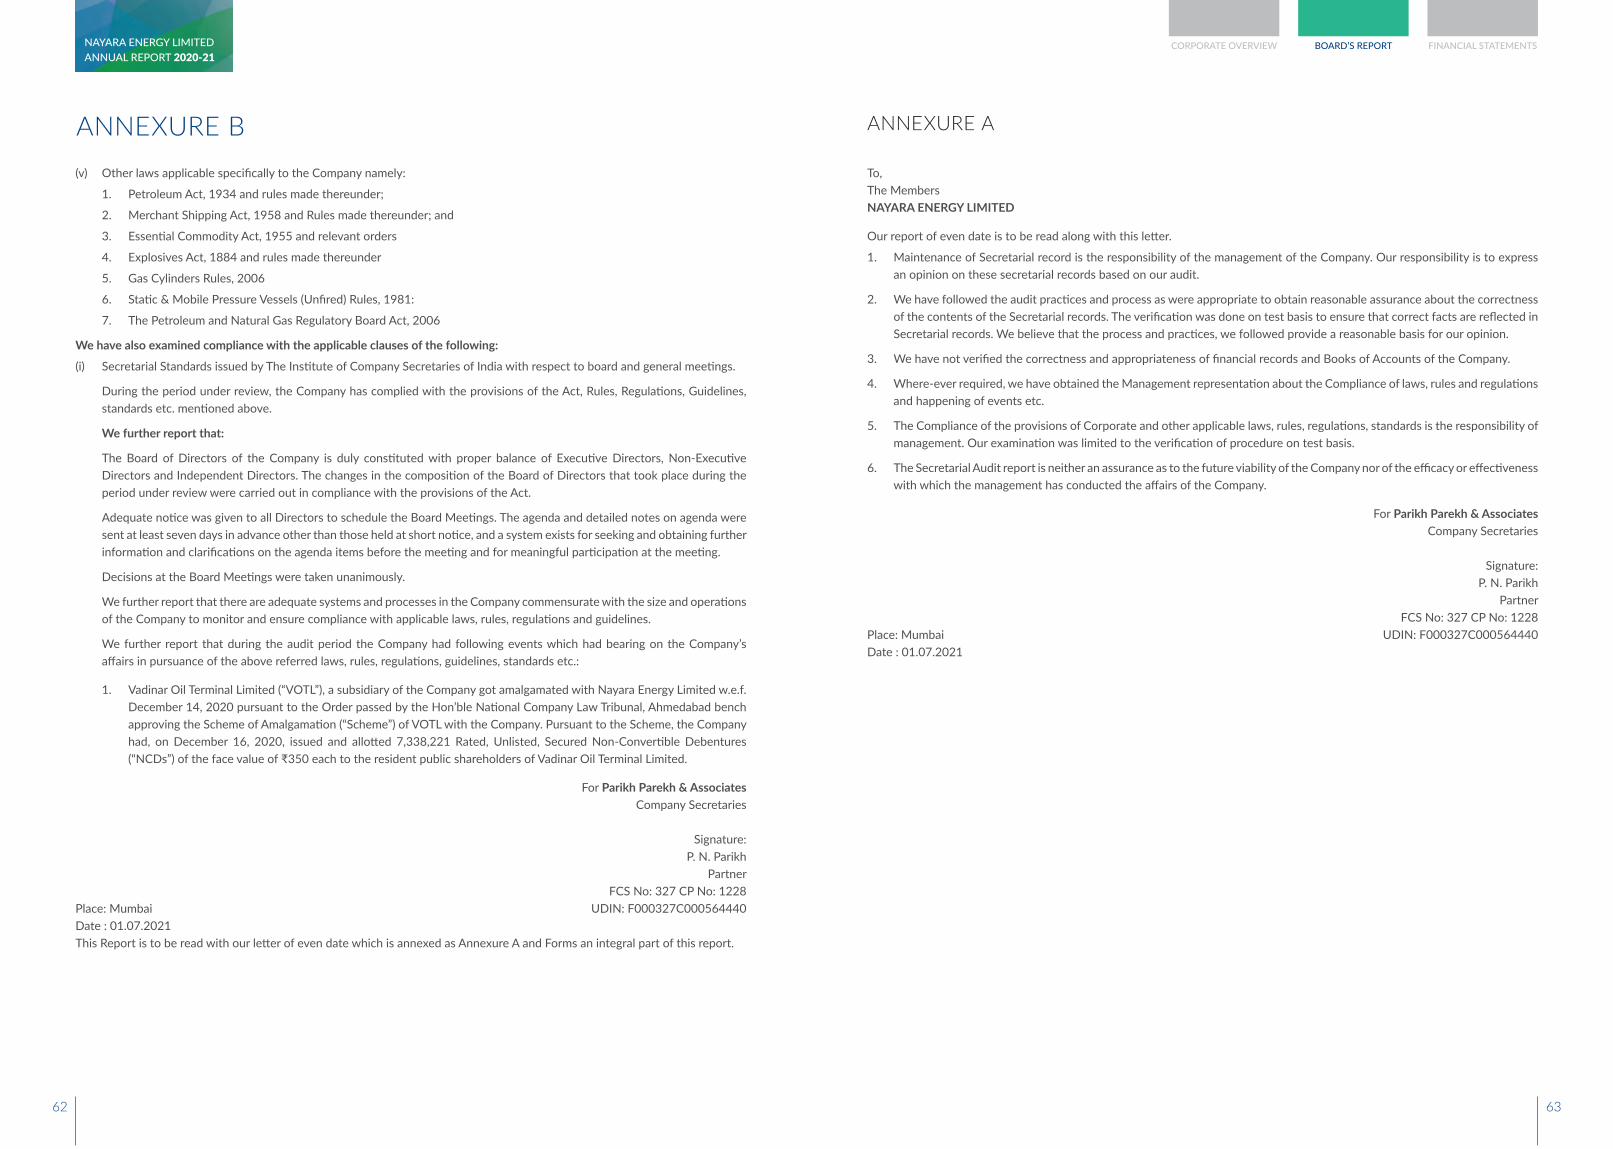
(v) Other laws applicable specifically to the Company namely:
1. Petroleum Act, 1934 and rules made thereunder;
2. Merchant Shipping Act, 1958 and Rules made thereunder; and
3. Essential Commodity Act, 1955 and relevant orders
4. Explosives Act, 1884 and rules made thereunder
5. Gas Cylinders Rules, 2006
6. Static & Mobile Pressure Vessels (Unfired) Rules, 1981:
7. The Petroleum and Natural Gas Regulatory Board Act, 2006
We have also examined compliance with the applicable clauses of the following:
(i) Secretarial Standards issued by The Institute of Company Secretaries of India with respect to board and general meetings.
During the period under review, the Company has complied with the provisions of the Act, Rules, Regulations, Guidelines, standards etc. mentioned above.
We further report that:
The Board of Directors of the Company is duly constituted with proper balance of Executive Directors, Non-Executive Directors and Independent Directors. The changes in the composition of the Board of Directors that took place during the period under review were carried out in compliance with the provisions of the Act.
Adequate notice was given to all Directors to schedule the Board Meetings. The agenda and detailed notes on agenda were sent at least seven days in advance other than those held at short notice, and a system exists for seeking and obtaining further information and clarifications on the agenda items before the meeting and for meaningful participation at the meeting.
Decisions at the Board Meetings were taken unanimously.
We further report that there are adequate systems and processes in the Company commensurate with the size and operations of the Company to monitor and ensure compliance with applicable laws, rules, regulations and guidelines.
We further report that during the audit period the Company had following events which had bearing on the Company’s affairs in pursuance of the above referred laws, rules, regulations, guidelines, standards etc.:
1. Vadinar Oil Terminal Limited (“VOTL”), a subsidiary of the Company got amalgamated with Nayara Energy Limited w.e.f. December 14, 2020 pursuant to the Order passed by the Hon’ble National Company Law Tribunal, Ahmedabad bench approving the Scheme of Amalgamation (“Scheme”) of VOTL with the Company. Pursuant to the Scheme, the Company had, on December 16, 2020, issued and allotted 7,338,221 Rated, Unlisted, Secured Non-Convertible Debentures (“NCDs”) of the face value of ₹350 each to the resident public shareholders of Vadinar Oil Terminal Limited.
For Parikh Parekh & AssociatesCompany Secretaries
Signature:P. N. Parikh
PartnerFCS No: 327 CP No: 1228
Place: Mumbai UDIN: F000327C000564440 Date : 01.07.2021 This Report is to be read with our letter of even date which is annexed as Annexure A and Forms an integral part of this report.
ANNEXURE B ANNEXURE A
To, The Members NAYARA ENERGY LIMITED
Our report of even date is to be read along with this letter.
1. Maintenance of Secretarial record is the responsibility of the management of the Company. Our responsibility is to express an opinion on these secretarial records based on our audit.
2. We have followed the audit practices and process as were appropriate to obtain reasonable assurance about the correctness of the contents of the Secretarial records. The verification was done on test basis to ensure that correct facts are reflected in Secretarial records. We believe that the process and practices, we followed provide a reasonable basis for our opinion.
3. We have not verified the correctness and appropriateness of financial records and Books of Accounts of the Company.
4. Where-ever required, we have obtained the Management representation about the Compliance of laws, rules and regulations and happening of events etc.
5. The Compliance of the provisions of Corporate and other applicable laws, rules, regulations, standards is the responsibility of management. Our examination was limited to the verification of procedure on test basis.
6. The Secretarial Audit report is neither an assurance as to the future viability of the Company nor of the efficacy or effectiveness with which the management has conducted the affairs of the Company.
For Parikh Parekh & AssociatesCompany Secretaries
Signature:P. N. Parikh
PartnerFCS No: 327 CP No: 1228
Place: Mumbai UDIN: F000327C000564440 Date : 01.07.2021
ANNUAL REPORT 2020-21NAYARA ENERGY LIMITED CORPORATE OVERVIEW BOARD’S REPORT FINANCIAL STATEMENTS
62 63
ANNEXURE CForm No. AOC 2
(Pursuant to clause (h) of sub-section (3) of section 134 of the Act and Rule 8(2) of the Companies (Accounts) Rules, 2014)
Form for disclosure of particulars of contracts/arrangements entered into by the company with related parties referred to in sub-section (1) of section 188 of the Companies Act, 2013 including certain arm’s length transactions under third proviso thereto
1. Details of contracts or arrangements or transactions not at arm’s length basis – Nil
2. Details of material contracts or arrangement or transactions at arm’s length basis
Following were the transactions undertaken by the Company during financial year 2020–21:
Name(s) of the related party and nature of relationship
Nature of contracts / arrangements / transactions
Duration of the contracts / arrangements / transactions
Salient terms of the contracts or arrangements or transactions including the value, if any
Date(s) of approval by the Board, if any
Amount paid as advances, if any
United Capital Partners Advisory LLC (“UCP Russia”)Nature of Relationship: UCP Russia is related to UCP PE Investments Limited, Cyprus (“UCP Cyprus”). UCP Cyprus holds 49.86% shareholding of Kesani Enterprises Company Limited, Cyprus, (“Kesani”) and Kesani holds 49.13% of the paid up equity share capital of the Company
Extension of Infrastructure Consultancy Agreement (for refinery expansion project) for availing advisory and consultancy services
Up to July 23, 2021
UCP Russia to provide specialized services in connection with investment, design and implementation of various infrastructure projects refinery expansion and setting up downstream units for an annual fees of USD 24,75,000
October 22, 2020
Nil
Energopole SA, Switzerland (“ENP”)
Nature of Relationship: Rosneft Singapore Pte. Limited, a wholly owned subsidiary of PJSC Rosneft Oil Company, holds 49.13% in the share capital of the Company and is a related party of the Company pursuant to provisions of section 2(76) of the Companies Act, 2013. ENP is also a 100% owned subsidiary of PJSC Rosneft Oil Company and therefore a co-subsidiary of Rosneft Singapore Pte Ltd.
Master Crude Oil Supply and Products Offtake Agreement (“MCSPO Agreement”) to import crude from and supply petroleum products to ENP and also avail certain services from ENP.
Initial term up to August 14, 2027.
Automatic extension by one year on the expiry of the Initial Term / each anniversary until terminated
Under MCSPO Agreement, ENP would from time to time, be able to offer to supply/offtake the crude to / products from the Company at market price and also provide certain services in lieu of a fee to the Company, including but not limited to provide assessments of market differentials and availability of crudes/products to assist the Company with a price-set, explore opportunities to accept/provide delivery/supply of new, blended and non-standard grades of crude/products at/from the refinery and any other services as may be desired by the Company in line with the MCSPO Agreement.
The monetary value of the services to be availed and the transactions to be undertaken pursuant to the MCSPO Agreement cannot be ascertained. The Company anticipates to source crude and export finished products estimated at up to ` 561,740 million and ` 306,620 million respectively on annual basis. Fees for above specified services for a year is estimated at ` 690 million. The monetary value for FY 2020-21 and in subsequent years is however subject to throughput, actual imports / exports, the business plan and the prevailing prices of crude and products in the international market apart from the extent to which ENP actually supplies or offtakes the barrels to / from the Company.
October 22, 2020
Nil
For and on behalf of the Board of Directors
Date: July 1, 2021 Charles Anthony FountainPlace: Sussex, United Kingdom Executive Chairman
(DIN - 07719852)
ANNEXURE DA. CONSERVATION OF ENERGY Energy conservation, efficient operation and minimising operating expenses is always a greater priority to refinery to earn
more GRM. Refinery always keeps energy conservation as highest priority and continuously tries to implement various energy minimization schemes and improve furnaces efficiency.
Nayara Energy Limited demonstrates energy conversion and optimization at national level on sustained basis. Nayara Energy received two prestigious awards “Excellent Energy Efficient Unit” and “National Energy Leader” for the best performance in 2020-21 at National Energy Efficiency Summit held by CII Hyderabad.
Energy Management system (ENMS) Standard transition from 50001:2011 to 50001:2018 and has received ISO-50001-2018 certification which is valid up to May 2023.
Comprehensive energy audit of refinery complex was completed in December 2020 and the recommendations are being studied for implementation.
Energy conservation team is steadily monitoring energy performance and focusing on identifying opportunities and converting them into schemes to reduce energy consumption at the Refinery.
Energy conservation initiatives contributed to reduce significant total energy consumption of ~ 17.0 Gcal/hr for this year.
Some of major initiatives to minimize energy cost during this period are as follows:
1. FCCU Feed V/S slurry third exchanger commissioned which resulted in preheat improvement.
This is appearing in last year Board’s Report and hence deleted.
2. Drive to arrest all steam leaks and installation/repair of many steam traps resulted in 26 MT of steam savings.
3. Energy saving on Utility water pump impeller trimming.
(I) Steps taken for utilizing the Alternate Sources of Energy
Feasibility study began for installation of 100 MWH solar power plant.
(II) The capital investment on energy conservation equipment
During the financial year, the Company made investment of ₹22 Million on energy conservation equipment.
B. TECHNOLOGY ABSORPTION (I) The efforts made towards technology absorption
Nil during FY 2020-21.
(II) The benefits derived like project improvement, cost reduction, project development or import substitution
Our R&D center at the Refinery continuously tries to address critical issues associated with different crude blends. Routine monitoring of prediction of fouling potential and compatibility of various crude blends before processing at refinery has resulted in smooth operation of crude distillation units of our refinery. Certain high viscous and pour point crudes were blended and subjected to compatibility study so to establish their stability; based on which various blended crudes are shipped.
Major R&D activities carried during the year were as follows:
a) Test method developed for measurement of asphaltenes in crude oil and residue samples.
b) Process developed to separate water and sediments from slop oil.
c) Method developed to estimate petcoke Sulphur from crude oil.
The benefits expected to derive from the above R&D activities are:
a) The test method developed by Nayara Energy research & development team using spectroscopic technique is novel hence applied for patent and having many advantages over gravimetric method like simple in use, high precision, consume less chemicals, cost effective, reduce HSEF risk, short testing time (2 hrs) and wider range of measurement. Test method implemented for internal use and we are anticipating that method will be highly useful globally for petroleum exploration & refining industries, testing laboratories, research institutes, academic institutes.
ANNUAL REPORT 2020-21NAYARA ENERGY LIMITED CORPORATE OVERVIEW BOARD’S REPORT FINANCIAL STATEMENTS
64 65
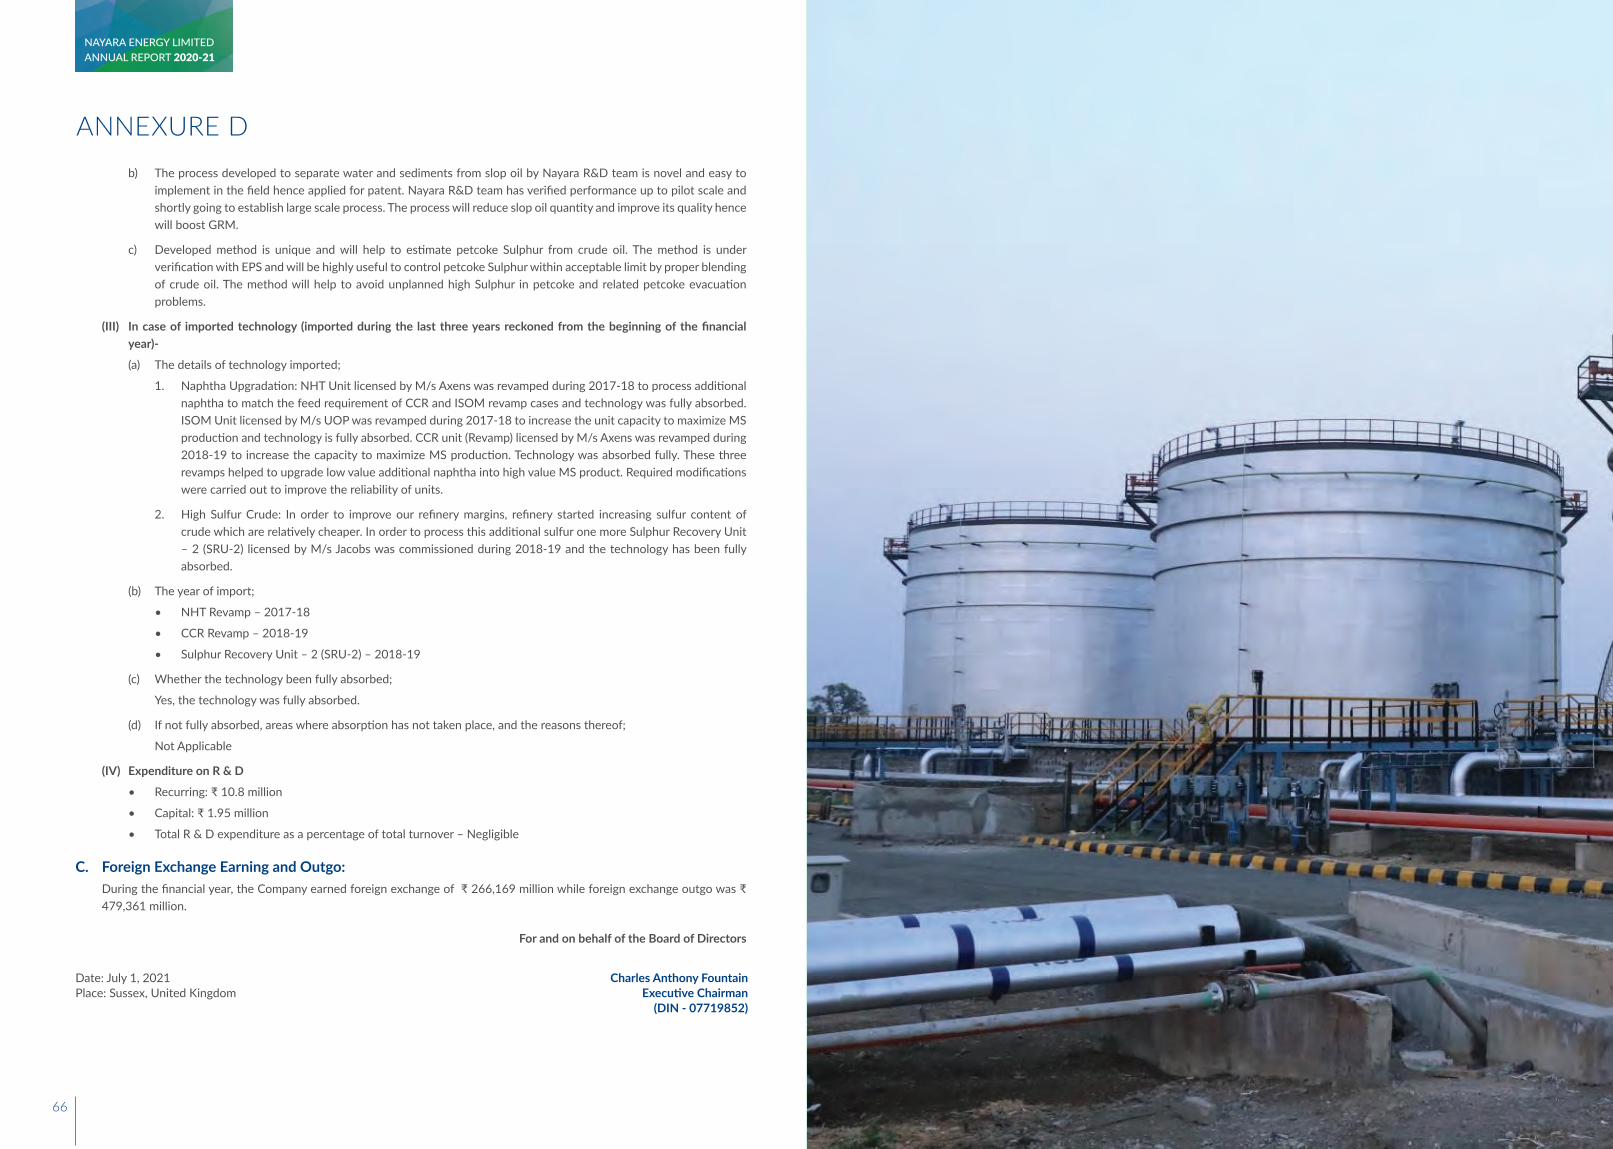
b) The process developed to separate water and sediments from slop oil by Nayara R&D team is novel and easy to implement in the field hence applied for patent. Nayara R&D team has verified performance up to pilot scale and shortly going to establish large scale process. The process will reduce slop oil quantity and improve its quality hence will boost GRM.
c) Developed method is unique and will help to estimate petcoke Sulphur from crude oil. The method is under verification with EPS and will be highly useful to control petcoke Sulphur within acceptable limit by proper blending of crude oil. The method will help to avoid unplanned high Sulphur in petcoke and related petcoke evacuation problems.
(III) In case of imported technology (imported during the last three years reckoned from the beginning of the financial year)-
(a) The details of technology imported;
1. Naphtha Upgradation: NHT Unit licensed by M/s Axens was revamped during 2017-18 to process additional naphtha to match the feed requirement of CCR and ISOM revamp cases and technology was fully absorbed. ISOM Unit licensed by M/s UOP was revamped during 2017-18 to increase the unit capacity to maximize MS production and technology is fully absorbed. CCR unit (Revamp) licensed by M/s Axens was revamped during 2018-19 to increase the capacity to maximize MS production. Technology was absorbed fully. These three revamps helped to upgrade low value additional naphtha into high value MS product. Required modifications were carried out to improve the reliability of units.
2. High Sulfur Crude: In order to improve our refinery margins, refinery started increasing sulfur content of crude which are relatively cheaper. In order to process this additional sulfur one more Sulphur Recovery Unit – 2 (SRU-2) licensed by M/s Jacobs was commissioned during 2018-19 and the technology has been fully absorbed.
(b) The year of import;
• NHT Revamp – 2017-18
• CCR Revamp – 2018-19
• Sulphur Recovery Unit – 2 (SRU-2) – 2018-19
(c) Whether the technology been fully absorbed;
Yes, the technology was fully absorbed.
(d) If not fully absorbed, areas where absorption has not taken place, and the reasons thereof;
Not Applicable
(IV) Expenditure on R & D
• Recurring: ₹ 10.8 million
• Capital: ₹ 1.95 million
• Total R & D expenditure as a percentage of total turnover – Negligible
C. Foreign Exchange Earning and Outgo: During the financial year, the Company earned foreign exchange of ₹ 266,169 million while foreign exchange outgo was ₹
479,361 million.
For and on behalf of the Board of Directors
Date: July 1, 2021 Charles Anthony FountainPlace: Sussex, United Kingdom Executive Chairman
(DIN - 07719852)
ANNEXURE D
ANNUAL REPORT 2020-21NAYARA ENERGY LIMITED
66

STANDALONEFINANCIAL STATEMENTS
68 6968 69
To the Members of Nayara Energy Limited
Report on the Audit of the Standalone Financial StatementsOpinion
We have audited the accompanying standalone financial statements of Nayara Energy Limited (“the Company”), which comprise the Balance sheet as at March 31, 2021, the Statement of Profit and Loss, including the statement of Other Comprehensive Income, the Cash Flow Statement and the Statement of Changes in Equity for the year then ended, and notes to the standalone financial statements, including a summary of significant accounting policies and other explanatory information.
In our opinion and to the best of our information and according to the explanations given to us, the aforesaid standalone financial statements give the information required by the Companies Act, 2013 (“the Act”), as amended, in the manner so required and give a true and fair view in conformity with the accounting principles generally accepted in India, of the state of affairs of the Company as at March 31, 2021, its profit including other comprehensive income, its cash flows and the changes in equity for the year ended on that date.
Basis for Opinion
We conducted our audit of the standalone financial statements in accordance with the Standards on Auditing (SAs), as specified under section 143(10) of the Act. Our responsibilities under those Standards are further described in the ‘Auditor’s Responsibilities for the Audit of the Standalone Financial Statements’ section of our report. We are independent of the Company in accordance with the ‘Code of Ethics’ issued by the Institute of Chartered Accountants of India together with the ethical requirements that are relevant to our audit of the financial statements under the provisions of the Act and the Rules thereunder, and we have fulfilled our other ethical responsibilities in accordance with these requirements and the Code of Ethics. We believe that the audit evidence we have obtained is sufficient and appropriate to provide a basis for our audit opinion on the standalone financial statements.
Other Information
The Company’s Board of Directors is responsible for the other information. The other information comprises the information included in the Annual report, but does not include the standalone financial statements and our auditor’s report thereon.
Independent Auditor’s Report (Contd.)
Our opinion on the standalone financial statements does not cover the other information and we do not express any form of assurance conclusion thereon.
In connection with our audit of the standalone financial statements, our responsibility is to read the other information and, in doing so, consider whether such other information is materially inconsistent with the financial statements or our knowledge obtained in the audit or otherwise appears to be materially misstated. If, based on the work we have performed, we conclude that there is a material misstatement of this other information, we are required to report that fact. We have nothing to report in this regard.
Responsibility of Management for the Standalone Financial StatementsThe Company’s Board of Directors is responsible for the matters stated in section 134(5) of the Act with respect to the preparation of these standalone financial statements that give a true and fair view of the financial position, financial performance including other comprehensive income, cash flows and changes in equity of the Company in accordance with the accounting principles generally accepted in India, including the Indian Accounting Standards (Ind AS) specified under section 133 of the Act read with the Companies (Indian Accounting Standards) Rules, 2015, as amended. This responsibility also includes maintenance of adequate accounting records in accordance with the provisions of the Act for safeguarding of the assets of the Company and for preventing and detecting frauds and other irregularities; selection and application of appropriate accounting policies; making judgments and estimates that are reasonable and prudent; and the design, implementation and maintenance of adequate internal financial controls, that were operating effectively for ensuring the accuracy and completeness of the accounting records, relevant to the preparation and presentation of the standalone financial statements that give a true and fair view and are free from material misstatement, whether due to fraud or error.
In preparing the standalone financial statements, management is responsible for assessing the Company’s ability to continue as a going concern, disclosing, as applicable, matters related to going concern and using the going concern basis of accounting unless management either intends to liquidate the Company or to cease operations, or has no realistic alternative but to do so.
Those Board of Directors are also responsible for overseeing the Company’s financial reporting process.
Auditor’s Responsibilities for the Audit of the Standalone Financial StatementsOur objectives are to obtain reasonable assurance about whether the standalone financial statements as a whole are free from material misstatement, whether due to fraud or error, and to issue an auditor’s report that includes our opinion. Reasonable assurance is a high level of assurance, but is not a guarantee that an audit conducted in accordance with SAs will always detect a material misstatement when it exists. Misstatements can arise from fraud or error and are considered material if, individually or in the aggregate, they could reasonably be expected to influence the economic decisions of users taken on the basis of these standalone financial statements.
As part of an audit in accordance with SAs, we exercise professional judgment and maintain professional skepticism throughout the audit. We also:
• Identify and assess the risks of material misstatement of the standalone financial statements, whether due to fraud or error, design and perform audit procedures responsive to those risks, and obtain audit evidence that is sufficient and appropriate to provide a basis for our opinion. The risk of not detecting a material misstatement resulting from fraud is higher than for one resulting from error, as fraud may involve collusion, forgery, intentional omissions, misrepresentations, or the override of internal control.
• Obtain an understanding of internal control relevant to the audit in order to design audit procedures that are appropriate in the circumstances. Under section 143(3)(i) of the Act, we are also responsible for expressing our opinion on whether the Company has adequate internal financial controls with reference to financial statements in place and the operating effectiveness of such controls.
• Evaluate the appropriateness of accounting policies used and the reasonableness of accounting estimates and related disclosures made by management.
• Conclude on the appropriateness of management’s use of the going concern basis of accounting and, based on the audit evidence obtained, whether a material uncertainty exists related to events or conditions that may cast significant doubt on the Company’s ability to continue as a going concern. If we conclude that a material uncertainty exists, we are required to draw attention in our auditor’s report to the related disclosures in the financial statements or, if such disclosures are inadequate, to modify our opinion. Our conclusions are based on the
audit evidence obtained up to the date of our auditor’s report. However, future events or conditions may cause the Company to cease to continue as a going concern.
• Evaluate the overall presentation, structure and content of the standalone financial statements, including the disclosures, and whether the standalone financial statements represent the underlying transactions and events in a manner that achieves fair presentation.
We communicate with those charged with governance regarding, among other matters, the planned scope and timing of the audit and significant audit findings, including any significant deficiencies in internal control that we identify during our audit.
We also provide those charged with governance with a statement that we have complied with relevant ethical requirements regarding independence, and to communicate with them all relationships and other matters that may reasonably be thought to bear on our independence, and where applicable, related safeguards.
Other MatterAs more fully described in note 45, the comparative financial information of the Company as at and for the year ended March 31, 2020 included in these Standalone Financials Statements have been restated to give the effect of the adjustments arising from merger of Vadinar Oil Terminal Limited, subsidiary of the Company, with the Company.
Report on Other Legal and Regulatory Requirements1. As required by the Companies (Auditor’s Report) Order,
2016 (“the Order”), issued by the Central Government of India in terms of sub-section (11) of section 143 of the Act, we give in the “Annexure 1” a statement on the matters specified in paragraphs 3 and 4 of the Order.
2. As required by Section 143(3) of the Act, we report that:
(a) We have sought and obtained all the information and explanations which to the best of our knowledge and belief were necessary for the purposes of our audit;
(b) In our opinion, proper books of account as required by law have been kept by the Company so far as it appears from our examination of those books;
(c) The Balance Sheet, the Statement of Profit and Loss including the Statement of Other Comprehensive
Independent Auditor’s Report
CORPORATE OVERVIEW BOARD’S REPORT FINANCIAL STATEMENTS
70 71
ANNUAL REPORT 2020-21NAYARA ENERGY LIMITED
Income, the Cash Flow Statement and Statement of Changes in Equity dealt with by this Report are in agreement with the books of account;
(d) In our opinion, the aforesaid standalone financial statements comply with the Accounting Standards specified under Section 133 of the Act, read with Companies (Indian Accounting Standards) Rules, 2015, as amended;
(e) On the basis of the written representations received from the directors as on March 31, 2021 taken on record by the Board of Directors, none of the directors is disqualified as on March 31, 2021 from being appointed as a director in terms of Section 164 (2) of the Act;
(f) With respect to the adequacy of the internal financial controls with reference to these standalone financial statements and the operating effectiveness of such controls, refer to our separate Report in “Annexure 2” to this report;
(g) In our opinion, the managerial remuneration for the year ended March 31, 2021 has been paid / provided by the Company to its directors in excess of the amount permissible under the provisions of section 197 read with Schedule V to the Act (refer note 44). As stated in the said note, the Company proposes to obtain necessary shareholder approval in the ensuing annual general meeting;
(h) With respect to the other matters to be included in the Auditor’s Report in accordance with Rule 11 of
Referred to in paragraph 1 under the heading “Report on Other Legal and Regulatory Requirements” of our report of even date(i) (a) The Company has maintained proper records
showing full particulars, including quantitative details and situation of fixed assets.
(b) The Company has a regular programme for verification of fixed assets in phased manner over three years which, in our opinion, is reasonable having regard to the size of the Company and the nature of its assets. No material discrepancies were noticed on such verification.
(c) According to the information and explanations given by the management and audit procedures performed by us, the title deeds of immovable properties included in property, plant and equipment are held in the name of the Company.
(ii) The management has conducted physical verification of inventory at reasonable intervals during the year and no material discrepancies were noticed on such physical verification.
(iii) According to the information and explanations given to us, the Company has not granted any loans, secured or unsecured to companies, firms, Limited Liability Partnerships or other parties covered in the register maintained under section 189 of the Companies Act, 2013. Accordingly, the provisions of clause 3(iii)(a), (b) and (c) of the Order are not applicable to the Company and hence not commented upon.
(iv) In our opinion and according to the information and explanations given to us, there are no loans, investments, guarantees, and securities given in respect of which provisions of section 185 and 186 of the Companies Act 2013 are applicable and hence not commented upon.
the Companies (Audit and Auditors) Rules, 2014, as amended in our opinion and to the best of our information and according to the explanations given to us:
i. The Company has disclosed the impact of pending litigations on its financial position in its standalone financial statements – Refer note 36 to the standalone financial statements;
ii. The Company has made provision, as required under the applicable law or accounting standards, for material foreseeable losses, if any, on long-term contracts including derivative contracts – Refer note 20 and 25 to the standalone financial statements;
iii. There were no amounts which were required to be transferred to the Investor Education and Protection Fund by the Company.
For S.R. Batliboi & Co. LLP Chartered Accountants
ICAI Firm Registration Number: 301003E/E300005
per Naman Agarwal Partner
Membership Number: 502405 UDIN: 21502405AAAABY9174
Place of Signature: New Delhi Date: July 1, 2021
Further, in our opinion and according to the information and explanations given to us, since the Company is in the business of infrastructure facilities for petroleum, the provisions of section 186 of the Act, in so far as they relate to grant of loans and guarantees and purchase of securities, are not applicable to the Company and hence not commented upon.
(v) The Company has not accepted any deposits within the meaning of Sections 73 to 76 of the Act and the Companies (Acceptance of Deposits) Rules, 2014 (as amended). Accordingly, the provisions of clause 3(v) of the Order are not applicable.
(vi) We have broadly reviewed the books of account maintained by the Company pursuant to the rules made by the Central Government for the maintenance of cost records under section 148(1) of the Companies Act, 2013, related to the manufacture of petroleum products, and are of the opinion that prima facie, the specified accounts and records have been made and maintained. We have not, however, made a detailed examination of the same.
(vii) (a) The Company has generally been regular in depositing with appropriate authorities undisputed statutory dues including provident fund, , income-tax, sales-tax, service tax, duty of custom, duty of excise, value added tax, goods and service tax, cess and other statutory dues applicable to it.
(b) According to the information and explanations given to us, no undisputed amounts payable in respect of provident fund, , income-tax, service tax, sales-tax, duty of custom, duty of excise, value added tax, goods and service tax, cess and other statutory dues were outstanding, at the year end, for a period of more than six months from the date they became payable.
(c) According to the records of the Company, the dues
Annexure 1Independent Auditor’s Report (Contd.)
CORPORATE OVERVIEW BOARD’S REPORT FINANCIAL STATEMENTS
72 73
ANNUAL REPORT 2020-21NAYARA ENERGY LIMITED
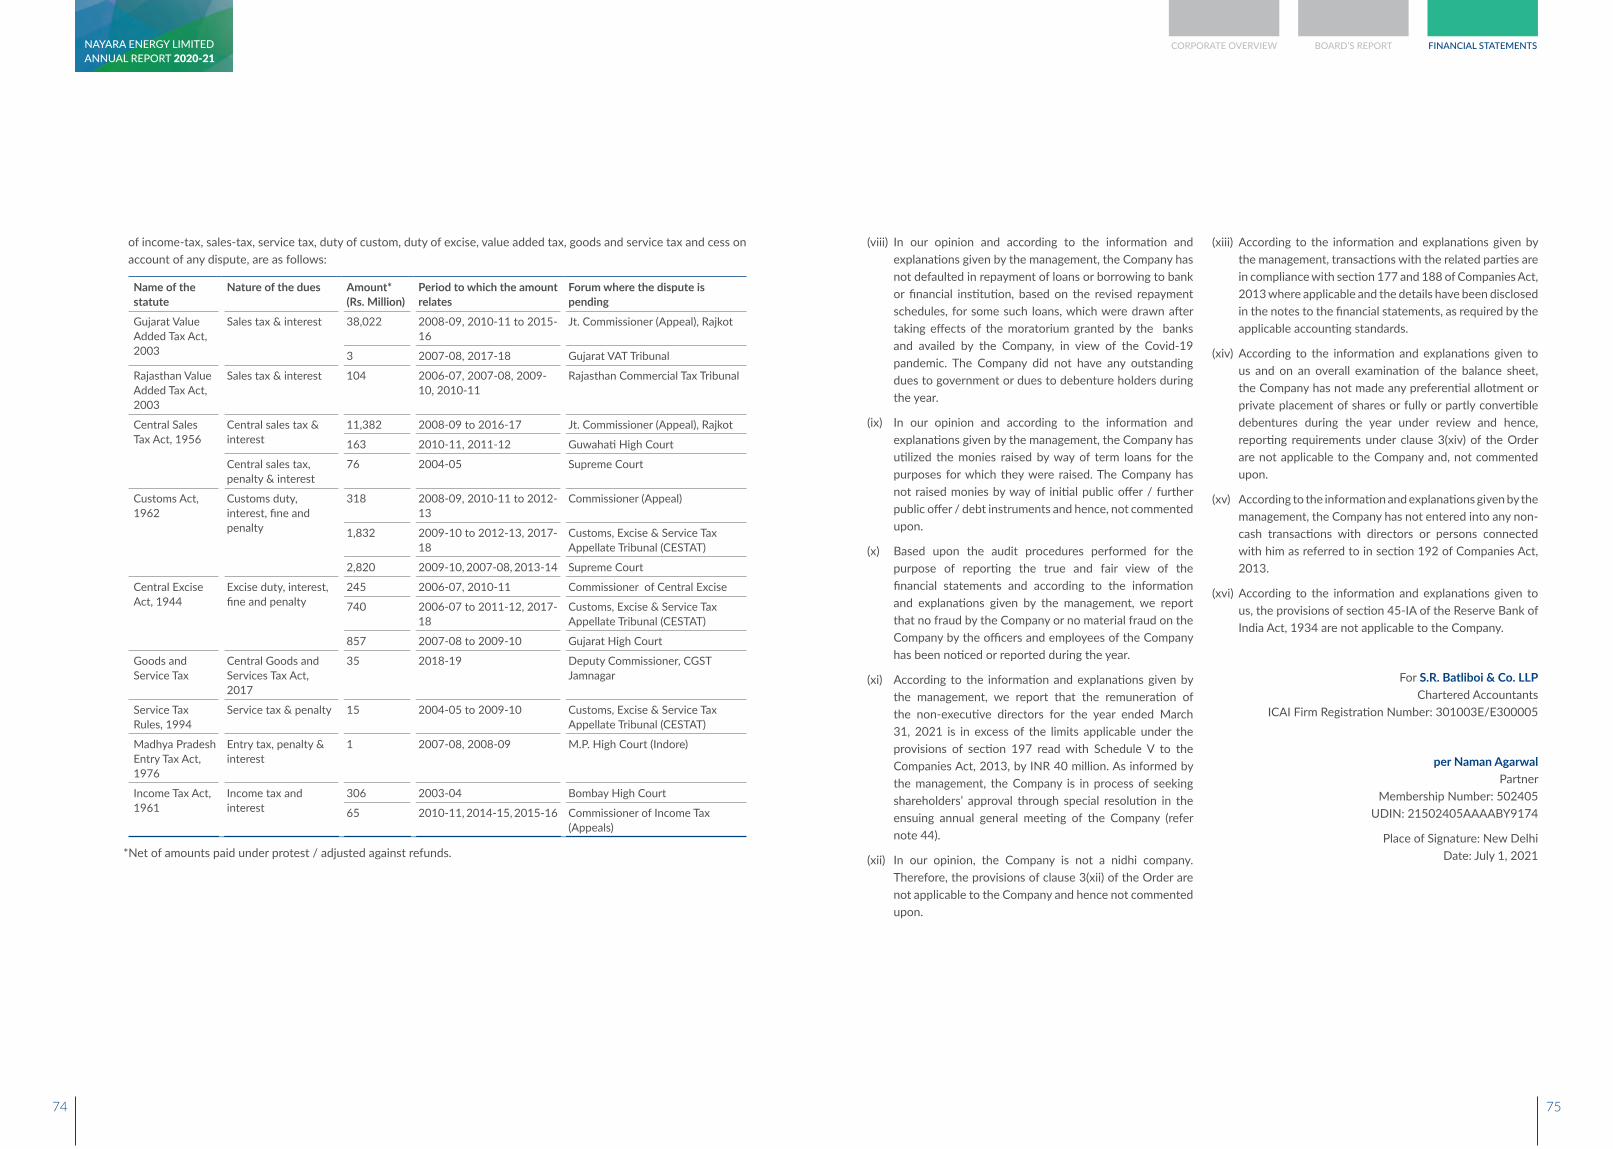
of income-tax, sales-tax, service tax, duty of custom, duty of excise, value added tax, goods and service tax and cess on account of any dispute, are as follows:
Name of the statute
Nature of the dues Amount* (Rs. Million)
Period to which the amount relates
Forum where the dispute is pending
Gujarat Value Added Tax Act, 2003
Sales tax & interest 38,022 2008-09, 2010-11 to 2015-16
Jt. Commissioner (Appeal), Rajkot
3 2007-08, 2017-18 Gujarat VAT Tribunal
Rajasthan Value Added Tax Act, 2003
Sales tax & interest 104 2006-07, 2007-08, 2009-10, 2010-11
Rajasthan Commercial Tax Tribunal
Central Sales Tax Act, 1956
Central sales tax & interest
11,382 2008-09 to 2016-17 Jt. Commissioner (Appeal), Rajkot
163 2010-11, 2011-12 Guwahati High Court
Central sales tax, penalty & interest
76 2004-05 Supreme Court
Customs Act, 1962
Customs duty, interest, fine and penalty
318 2008-09, 2010-11 to 2012-13
Commissioner (Appeal)
1,832 2009-10 to 2012-13, 2017-18
Customs, Excise & Service Tax Appellate Tribunal (CESTAT)
2,820 2009-10, 2007-08, 2013-14 Supreme Court
Central Excise Act, 1944
Excise duty, interest, fine and penalty
245 2006-07, 2010-11 Commissioner of Central Excise
740 2006-07 to 2011-12, 2017-18
Customs, Excise & Service Tax Appellate Tribunal (CESTAT)
857 2007-08 to 2009-10 Gujarat High Court
Goods and Service Tax
Central Goods and Services Tax Act, 2017
35 2018-19 Deputy Commissioner, CGST Jamnagar
Service Tax Rules, 1994
Service tax & penalty 15 2004-05 to 2009-10 Customs, Excise & Service Tax Appellate Tribunal (CESTAT)
Madhya Pradesh Entry Tax Act, 1976
Entry tax, penalty & interest
1 2007-08, 2008-09 M.P. High Court (Indore)
Income Tax Act, 1961
Income tax and interest
306 2003-04 Bombay High Court
65 2010-11, 2014-15, 2015-16 Commissioner of Income Tax (Appeals)
*Net of amounts paid under protest / adjusted against refunds.
(viii) In our opinion and according to the information and explanations given by the management, the Company has not defaulted in repayment of loans or borrowing to bank or financial institution, based on the revised repayment schedules, for some such loans, which were drawn after taking effects of the moratorium granted by the banks and availed by the Company, in view of the Covid-19 pandemic. The Company did not have any outstanding dues to government or dues to debenture holders during the year.
(ix) In our opinion and according to the information and explanations given by the management, the Company has utilized the monies raised by way of term loans for the purposes for which they were raised. The Company has not raised monies by way of initial public offer / further public offer / debt instruments and hence, not commented upon.
(x) Based upon the audit procedures performed for the purpose of reporting the true and fair view of the financial statements and according to the information and explanations given by the management, we report that no fraud by the Company or no material fraud on the Company by the officers and employees of the Company has been noticed or reported during the year.
(xi) According to the information and explanations given by the management, we report that the remuneration of the non-executive directors for the year ended March 31, 2021 is in excess of the limits applicable under the provisions of section 197 read with Schedule V to the Companies Act, 2013, by INR 40 million. As informed by the management, the Company is in process of seeking shareholders’ approval through special resolution in the ensuing annual general meeting of the Company (refer note 44).
(xii) In our opinion, the Company is not a nidhi company. Therefore, the provisions of clause 3(xii) of the Order are not applicable to the Company and hence not commented upon.
(xiii) According to the information and explanations given by the management, transactions with the related parties are in compliance with section 177 and 188 of Companies Act, 2013 where applicable and the details have been disclosed in the notes to the financial statements, as required by the applicable accounting standards.
(xiv) According to the information and explanations given to us and on an overall examination of the balance sheet, the Company has not made any preferential allotment or private placement of shares or fully or partly convertible debentures during the year under review and hence, reporting requirements under clause 3(xiv) of the Order are not applicable to the Company and, not commented upon.
(xv) According to the information and explanations given by the management, the Company has not entered into any non-cash transactions with directors or persons connected with him as referred to in section 192 of Companies Act, 2013.
(xvi) According to the information and explanations given to us, the provisions of section 45-IA of the Reserve Bank of India Act, 1934 are not applicable to the Company.
For S.R. Batliboi & Co. LLP Chartered Accountants
ICAI Firm Registration Number: 301003E/E300005
per Naman Agarwal Partner
Membership Number: 502405 UDIN: 21502405AAAABY9174
Place of Signature: New Delhi Date: July 1, 2021
CORPORATE OVERVIEW BOARD’S REPORT FINANCIAL STATEMENTS
74 75
ANNUAL REPORT 2020-21NAYARA ENERGY LIMITED
TO THE INDEPENDENT AUDITOR’S REPORT OF EVEN DATE ON THE STANDALONE FINANCIAL STATEMENTS OF NAYARA ENERGY LIMTED
Report on the Internal Financial Controls under Clause (i) of Sub-section 3 of Section 143 of the Companies Act, 2013 (“the Act”)
We have audited the internal financial controls over financial reporting with reference to standalone financial statements of Nayara Energy Limited (“the Company”) as of March 31, 2021 in conjunction with our audit of the standalone financial statements of the Company for the year ended on that date.
Management’s Responsibility for Internal Financial Controls
The Company’s Management is responsible for establishing and maintaining internal financial controls based on the internal control over financial reporting criteria established by the Company considering the essential components of internal control stated in the Guidance Note on Audit of Internal Financial Controls Over Financial Reporting issued by the Institute of Chartered Accountants of India (“ICAI”). These responsibilities include the design, implementation and maintenance of adequate internal financial controls that were operating effectively for ensuring the orderly and efficient conduct of its business, including adherence to the Company’s policies, the safeguarding of its assets, the prevention and detection of frauds and errors, the accuracy and completeness of the accounting records, and the timely preparation of reliable financial information, as required under the Companies Act, 2013.
Auditor’s Responsibility
Our responsibility is to express an opinion on the Company's internal financial controls over financial reporting with reference to these standalone financial statements based on our audit. We conducted our audit in accordance with the Guidance Note on Audit of Internal Financial Controls Over Financial Reporting (the “Guidance Note”) and the Standards on Auditing, as specified under section 143(10) of the Act, to the extent applicable to an audit of internal financial controls, both issued by ICAI. Those Standards and the Guidance Note require that we comply with ethical requirements and plan and perform the audit to obtain reasonable assurance about whether adequate internal financial controls with reference
to these standalone financial statements was established and maintained and if such controls operated effectively in all material respects.
Our audit involves performing procedures to obtain audit evidence about the adequacy of the internal financial controls over financial reporting with reference to these standalone financial statements and their operating effectiveness. Our audit of internal financial controls over financial reporting with reference to standalone financial statements included obtaining an understanding of internal financial controls over financial reporting with reference to these standalone financial statements, assessing the risk that a material weakness exists, and testing and evaluating the design and operating effectiveness of internal control based on the assessed risk. The procedures selected depend on the auditor’s judgement, including the assessment of the risks of material misstatement of the financial statements, whether due to fraud or error.
We believe that the audit evidence we have obtained is sufficient and appropriate to provide a basis for our audit opinion on the Company’s internal financial controls with reference to these standalone financial statements.
Meaning of Internal Financial Controls Over Financial Reporting With Reference to these Standalone Financial Statements
A company's internal financial controls over financial reporting with reference to standalone financial statements is a process designed to provide reasonable assurance regarding the reliability of financial reporting and the preparation of financial statements for external purposes in accordance with generally accepted accounting principles. A company's internal financial controls over financial reporting with reference to standalone financial statements includes those policies and procedures that (1) pertain to the maintenance of records that, in reasonable detail, accurately and fairly reflect the transactions and dispositions of the assets of the company; (2) provide reasonable assurance that transactions are recorded as necessary to permit preparation of financial statements in accordance with generally accepted accounting principles, and that receipts and expenditures of the company are being made only in accordance with authorisations of management and directors of the company; and (3) provide reasonable assurance regarding prevention or timely detection of unauthorised
Annexure 2
acquisition, use, or disposition of the company's assets that could have a material effect on the financial statements.
Inherent Limitations of Internal Financial Controls Over Financial Reporting With Reference to Standalone Financial Statements
Because of the inherent limitations of internal financial controls over financial reporting with reference to these standalone financial statements, including the possibility of collusion or improper management override of controls, material misstatements due to error or fraud may occur and not be detected. Also, projections of any evaluation of the internal financial controls over financial reporting with reference to these standalone financial statements to future periods are subject to the risk that the internal financial control with reference to these standalone financial statements may become inadequate because of changes in conditions, or that the degree of compliance with the policies or procedures may deteriorate.
Opinion
In our opinion, the Company has, in all material respects, adequate internal financial controls over financial reporting with reference to these standalone financial statements and such internal financial controls over financial reporting with reference to these standalone financial statements were operating effectively as at March 31, 2021, based on the internal control over financial reporting criteria established by the Company considering the essential components of internal control stated in the Guidance Note issued by the ICAI.
For S.R. Batliboi & Co. LLP Chartered Accountants
ICAI Firm Registration Number: 301003E/E300005
per Naman Agarwal Partner
Membership Number: 502405 UDIN: 21502405AAAABY9174
Place of Signature: New Delhi Date: July 1, 2021
CORPORATE OVERVIEW BOARD’S REPORT FINANCIAL STATEMENTS
76 77
ANNUAL REPORT 2020-21NAYARA ENERGY LIMITED
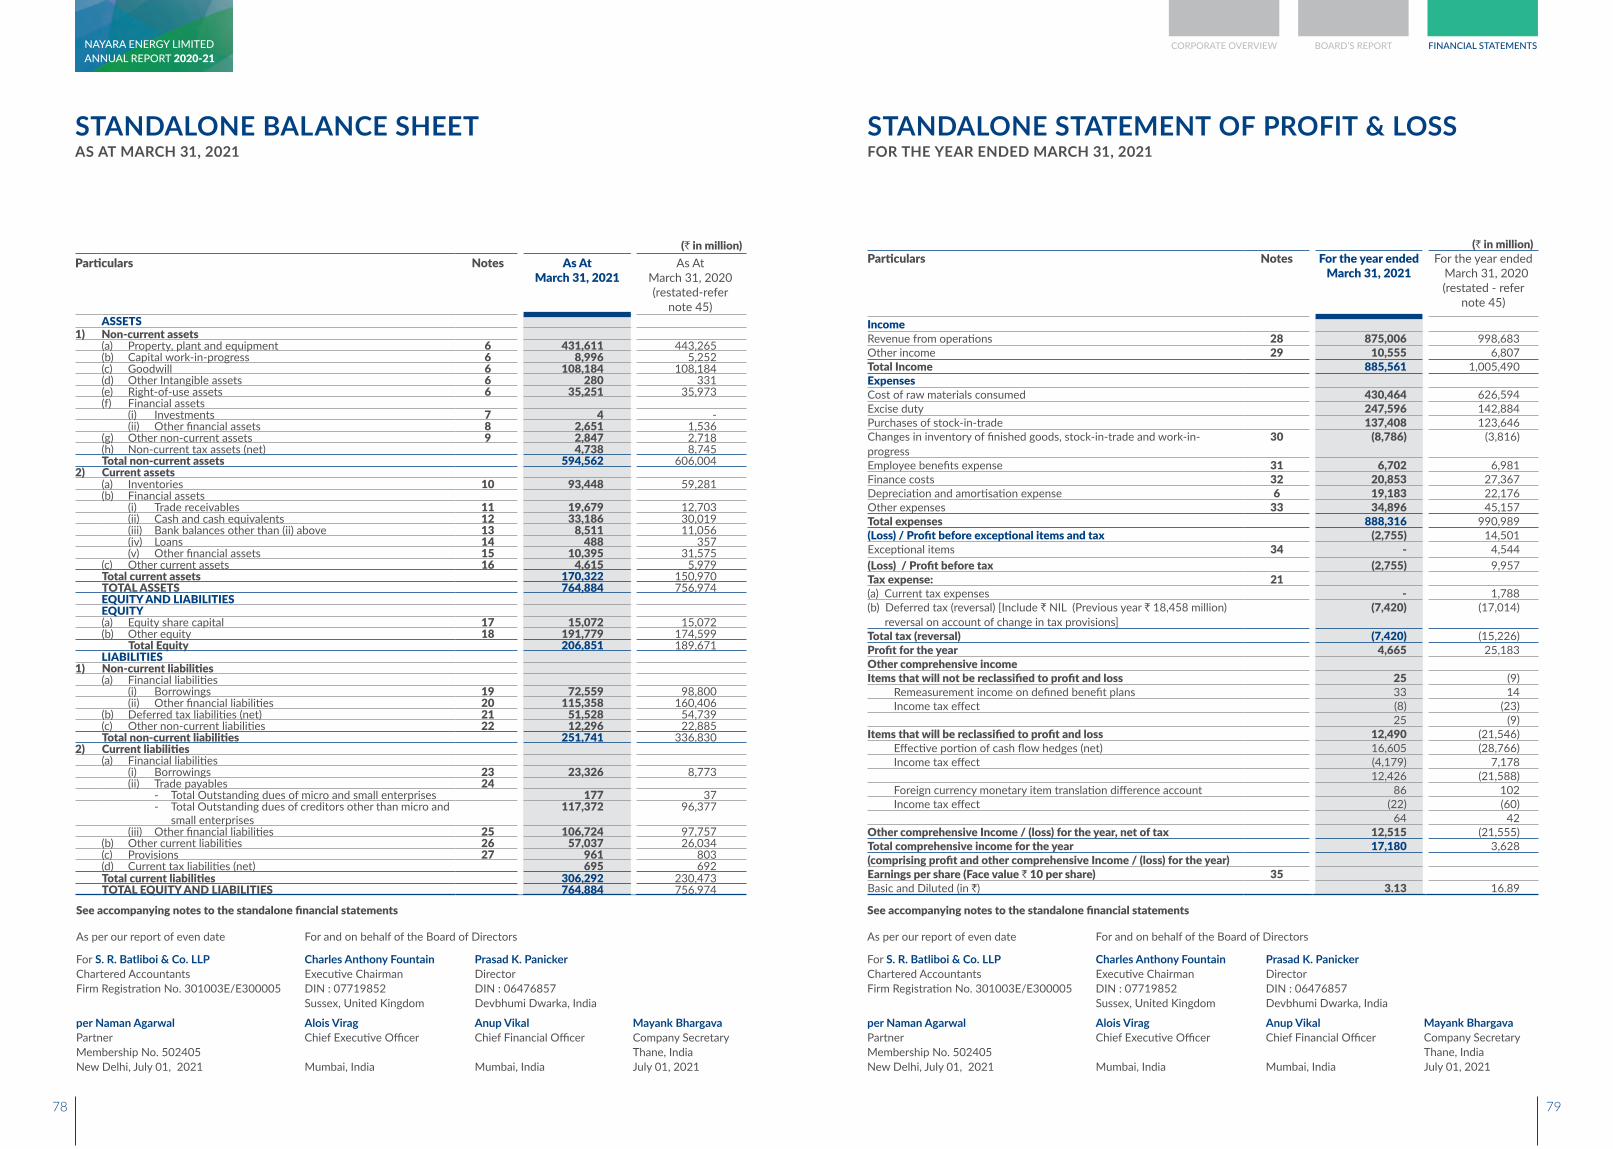
STANDALONE BALANCE SHEETAS AT MARCH 31, 2021
STANDALONE STATEMENT OF PROFIT & LOSSFOR THE YEAR ENDED MARCH 31, 2021
(` in million)Particulars Notes As At
March 31, 2021As At
March 31, 2020 (restated-refer
note 45)ASSETS
1) Non-current assets(a) Property, plant and equipment 6 431,611 443,265(b) Capital work-in-progress 6 8,996 5,252(c) Goodwill 6 108,184 108,184(d) Other Intangible assets 6 280 331(e) Right-of-use assets 6 35,251 35,973(f) Financial assets (i) Investments 7 4 - (ii) Other financial assets 8 2,651 1,536(g) Other non-current assets 9 2,847 2,718(h) Non-current tax assets (net) 4,738 8,745Total non-current assets 594,562 606,004
2) Current assets(a) Inventories 10 93,448 59,281(b) Financial assets (i) Trade receivables 11 19,679 12,703 (ii) Cash and cash equivalents 12 33,186 30,019 (iii) Bank balances other than (ii) above 13 8,511 11,056 (iv) Loans 14 488 357 (v) Other financial assets 15 10,395 31,575(c) Other current assets 16 4,615 5,979Total current assets 170,322 150,970TOTAL ASSETS 764,884 756,974EQUITY AND LIABILITIESEQUITY(a) Equity share capital 17 15,072 15,072(b) Other equity 18 191,779 174,599
Total Equity 206,851 189,671LIABILITIES
1) Non-current liabilities(a) Financial liabilities (i) Borrowings 19 72,559 98,800 (ii) Other financial liabilities 20 115,358 160,406(b) Deferred tax liabilities (net) 21 51,528 54,739(c) Other non-current liabilities 22 12,296 22,885Total non-current liabilities 251,741 336,830
2) Current liabilities(a) Financial liabilities (i) Borrowings 23 23,326 8,773 (ii) Trade payables 24 - Total Outstanding dues of micro and small enterprises 177 37 - Total Outstanding dues of creditors other than micro and
small enterprises117,372 96,377
(iii) Other financial liabilities 25 106,724 97,757(b) Other current liabilities 26 57,037 26,034(c) Provisions 27 961 803(d) Current tax liabilities (net) 695 692Total current liabilities 306,292 230,473TOTAL EQUITY AND LIABILITIES 764,884 756,974
(` in million)Particulars Notes For the year ended
March 31, 2021For the year ended March 31, 2020 (restated - refer
note 45)
IncomeRevenue from operations 28 875,006 998,683 Other income 29 10,555 6,807 Total Income 885,561 1,005,490 ExpensesCost of raw materials consumed 430,464 626,594 Excise duty 247,596 142,884 Purchases of stock-in-trade 137,408 123,646 Changes in inventory of finished goods, stock-in-trade and work-in-progress
30 (8,786) (3,816)
Employee benefits expense 31 6,702 6,981 Finance costs 32 20,853 27,367 Depreciation and amortisation expense 6 19,183 22,176 Other expenses 33 34,896 45,157 Total expenses 888,316 990,989(Loss) / Profit before exceptional items and tax (2,755) 14,501 Exceptional items 34 - 4,544(Loss) / Profit before tax (2,755) 9,957 Tax expense: 21(a) Current tax expenses - 1,788 (b) Deferred tax (reversal) [Include ` NIL (Previous year ` 18,458 million)
reversal on account of change in tax provisions](7,420) (17,014)
Total tax (reversal) (7,420) (15,226)Profit for the year 4,665 25,183 Other comprehensive incomeItems that will not be reclassified to profit and loss 25 (9)
Remeasurement income on defined benefit plans 33 14 Income tax effect (8) (23)
25 (9)Items that will be reclassified to profit and loss 12,490 (21,546)
Effective portion of cash flow hedges (net) 16,605 (28,766)Income tax effect (4,179) 7,178
12,426 (21,588)Foreign currency monetary item translation difference account 86 102 Income tax effect (22) (60)
64 42 Other comprehensive Income / (loss) for the year, net of tax 12,515 (21,555)Total comprehensive income for the year 17,180 3,628 (comprising profit and other comprehensive Income / (loss) for the year)Earnings per share (Face value ` 10 per share) 35Basic and Diluted (in `) 3.13 16.89
See accompanying notes to the standalone financial statements
As per our report of even date For and on behalf of the Board of Directors
For S. R. Batliboi & Co. LLP Chartered Accountants Firm Registration No. 301003E/E300005
Charles Anthony Fountain Executive ChairmanDIN : 07719852Sussex, United Kingdom
Prasad K. Panicker DirectorDIN : 06476857Devbhumi Dwarka, India
per Naman Agarwal Partner Membership No. 502405 New Delhi, July 01, 2021
Alois Virag Chief Executive Officer
Mumbai, India
Anup Vikal Chief Financial Officer
Mumbai, India
Mayank Bhargava Company Secretary Thane, India July 01, 2021
CORPORATE OVERVIEW BOARD’S REPORT FINANCIAL STATEMENTS
78 79
ANNUAL REPORT 2020-21NAYARA ENERGY LIMITED
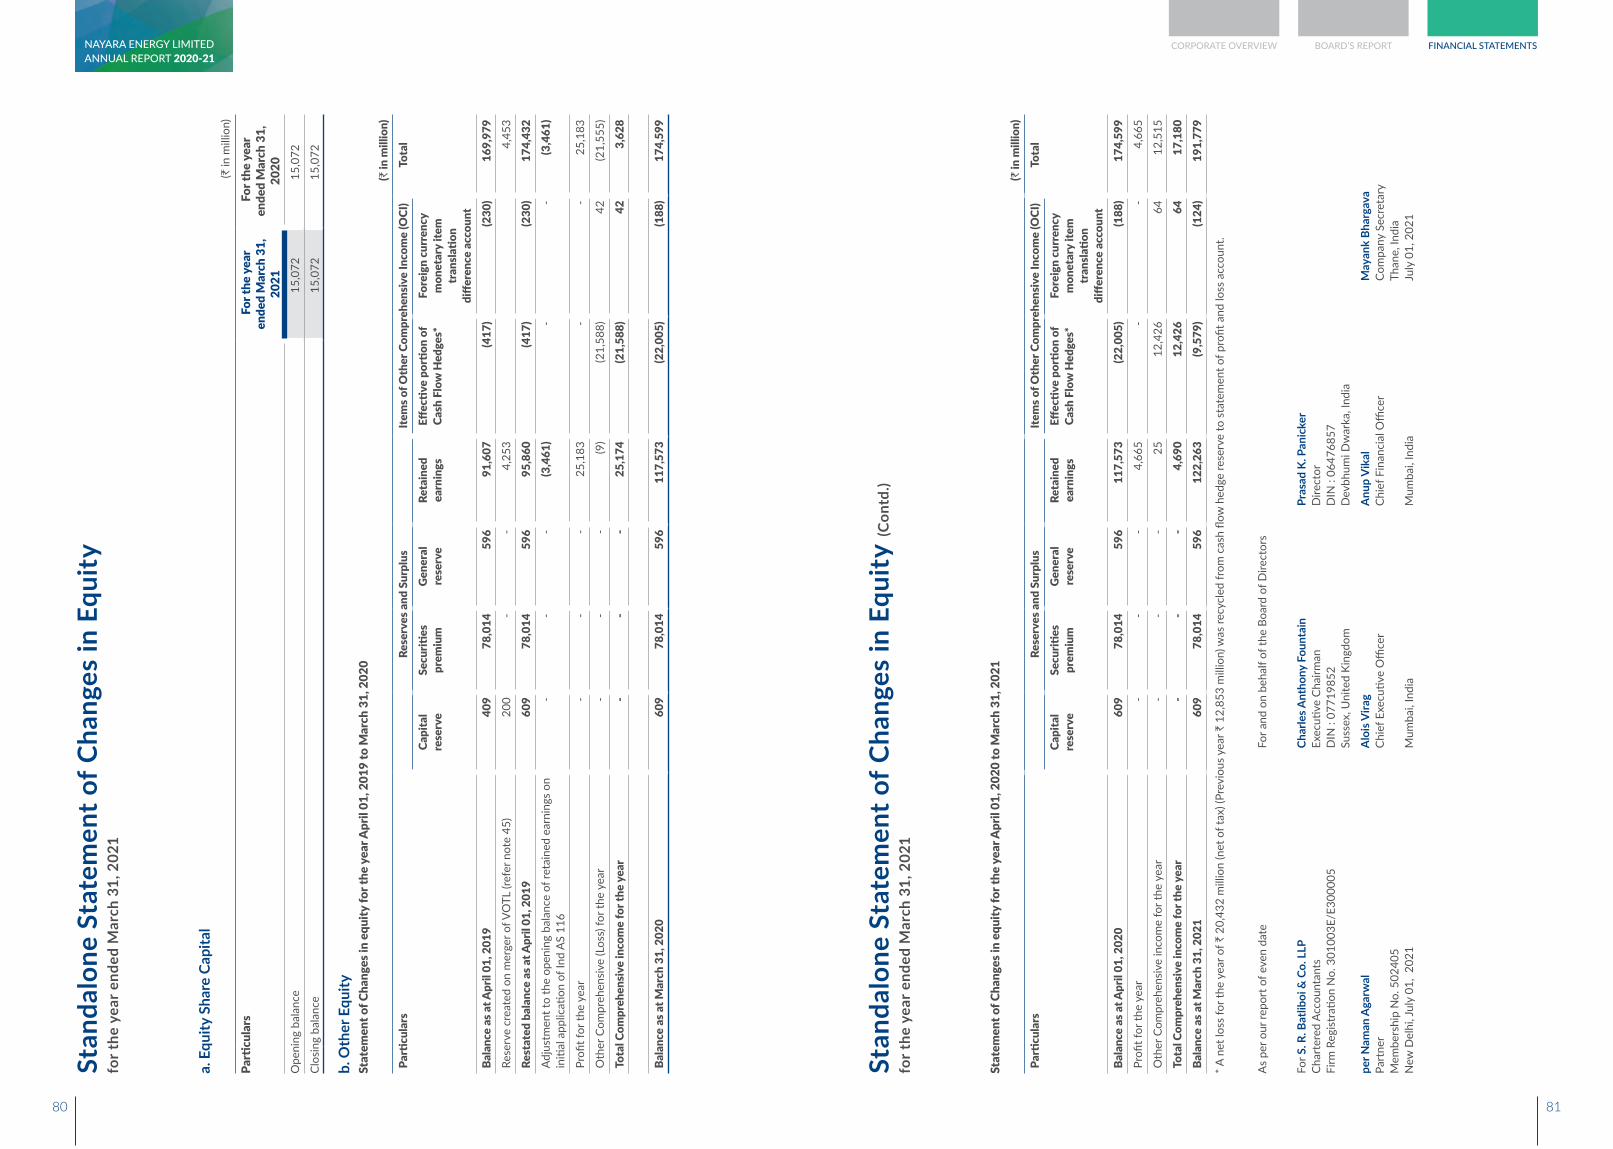
Stan
dalo
ne S
tate
men
t of C
hang
es in
Equ
ityfo
r the
yea
r end
ed M
arch
31,
202
1
a. E
quity
Sha
re C
apita
l(`
in m
illio
n)
Parti
cula
rs F
or th
e ye
ar
ende
d M
arch
31,
20
21
For
the
year
en
ded
Mar
ch 3
1,
2020
Ope
ning
bal
ance
15,
072
15,
072
Clos
ing
bala
nce
15,
072
15,
072
b. O
ther
Equ
itySt
atem
ent o
f Cha
nges
in e
quity
for t
he y
ear A
pril
01, 2
019
to M
arch
31,
202
0(`
in m
illio
n)Pa
rticu
lars
Rese
rves
and
Sur
plus
Item
s of O
ther
Com
preh
ensi
ve In
com
e (O
CI)
Tota
lCa
pita
l re
serv
eSe
curiti
es
prem
ium
Gen
eral
re
serv
eRe
tain
ed
earn
ings
Effec
tive
porti
on o
f Ca
sh F
low
Hed
ges*
Fore
ign
curr
ency
m
onet
ary
item
tr
ansla
tion
diffe
renc
e ac
coun
tBa
lanc
e as
at A
pril
01, 2
019
409
78,0
1459
691
,607
(417
)(2
30)
169,
979
Rese
rve
crea
ted
on m
erge
r of V
OTL
(ref
er n
ote
45)
200
--
4,25
34,
453
Rest
ated
bal
ance
as a
t Apr
il 01
, 201
960
978
,014
596
95,8
60(4
17)
(230
)17
4,43
2Ad
just
men
t to
the
open
ing
bala
nce
of re
tain
ed e
arni
ngs
on
initi
al a
pplic
ation
of I
nd A
S 11
6-
--
(3,4
61)
--
(3,4
61)
Profi
t for
the
year
--
-25
,183
--
25,1
83
Oth
er C
ompr
ehen
sive
(Los
s) fo
r the
yea
r-
--
(9)
(21,
588)
42(2
1,55
5)
Tota
l Com
preh
ensi
ve in
com
e fo
r the
yea
r-
--
25,1
74(2
1,58
8)42
3,62
8
Bala
nce
as a
t Mar
ch 3
1, 2
020
609
78,0
1459
611
7,57
3(2
2,00
5)(1
88)
174,
599
Stan
dalo
ne S
tate
men
t of C
hang
es in
Equ
ity (C
ontd
.)fo
r the
yea
r end
ed M
arch
31,
202
1
Stat
emen
t of C
hang
es in
equ
ity fo
r the
yea
r Apr
il 01
, 202
0 to
Mar
ch 3
1, 2
021
(` in
mill
ion)
Parti
cula
rsRe
serv
es a
nd S
urpl
usIte
ms o
f Oth
er C
ompr
ehen
sive
Inco
me
(OCI
)To
tal
Capi
tal
rese
rve
Secu
rities
pr
emiu
mG
ener
al
rese
rve
Reta
ined
ea
rnin
gsEff
ectiv
e po
rtion
of
Cash
Flo
w H
edge
s*Fo
reig
n cu
rren
cy
mon
etar
y ite
m
tran
slatio
n di
ffere
nce
acco
unt
Bala
nce
as a
t Apr
il 01
, 202
060
978
,014
596
117,
573
(22,
005)
(188
)17
4,59
9Pr
ofit f
or th
e ye
ar-
--
4,66
5-
-4,
665
Oth
er C
ompr
ehen
sive
inco
me
for t
he y
ear
--
-25
12,4
2664
12,5
15
Tota
l Com
preh
ensi
ve in
com
e fo
r the
yea
r-
--
4,69
012
,426
6417
,180
Bala
nce
as a
t Mar
ch 3
1, 2
021
609
78,0
1459
612
2,26
3(9
,579
)(1
24)
191,
779
* A n
et lo
ss fo
r the
yea
r of `
20,
432
mill
ion
(net
of t
ax) (
Prev
ious
yea
r ` 1
2,85
3 m
illio
n) w
as re
cycl
ed fr
om c
ash
flow
hed
ge re
serv
e to
sta
tem
ent o
f pro
fit a
nd lo
ss a
ccou
nt.
As
per o
ur re
port
of e
ven
date
For a
nd o
n be
half
of th
e Bo
ard
of D
irect
ors
For S
. R. B
atlib
oi &
Co.
LLP
Ch
arte
red
Acco
unta
nts
Firm
Reg
istra
tion
No.
301
003E
/E30
0005
Char
les A
ntho
ny F
ount
ain
Exec
utive
Cha
irman
DIN
: 07
7198
52Su
ssex
, Uni
ted
King
dom
Pras
ad K
. Pan
icke
r D
irect
orD
IN :
0647
6857
Dev
bhum
i Dw
arka
, Ind
ia
per N
aman
Aga
rwal
Pa
rtne
r M
embe
rshi
p N
o. 5
0240
5 N
ew D
elhi
, Jul
y 01
, 20
21
Alo
is V
irag
Chie
f Exe
cutiv
e O
ffice
r
Mum
bai,
Indi
a
Anu
p V
ikal
Ch
ief F
inan
cial
Offi
cer
Mum
bai,
Indi
a
May
ank
Bhar
gava
Co
mpa
ny S
ecre
tary
Th
ane,
Indi
a Ju
ly 0
1, 2
021
CORPORATE OVERVIEW BOARD’S REPORT FINANCIAL STATEMENTS
80 81
ANNUAL REPORT 2020-21NAYARA ENERGY LIMITED
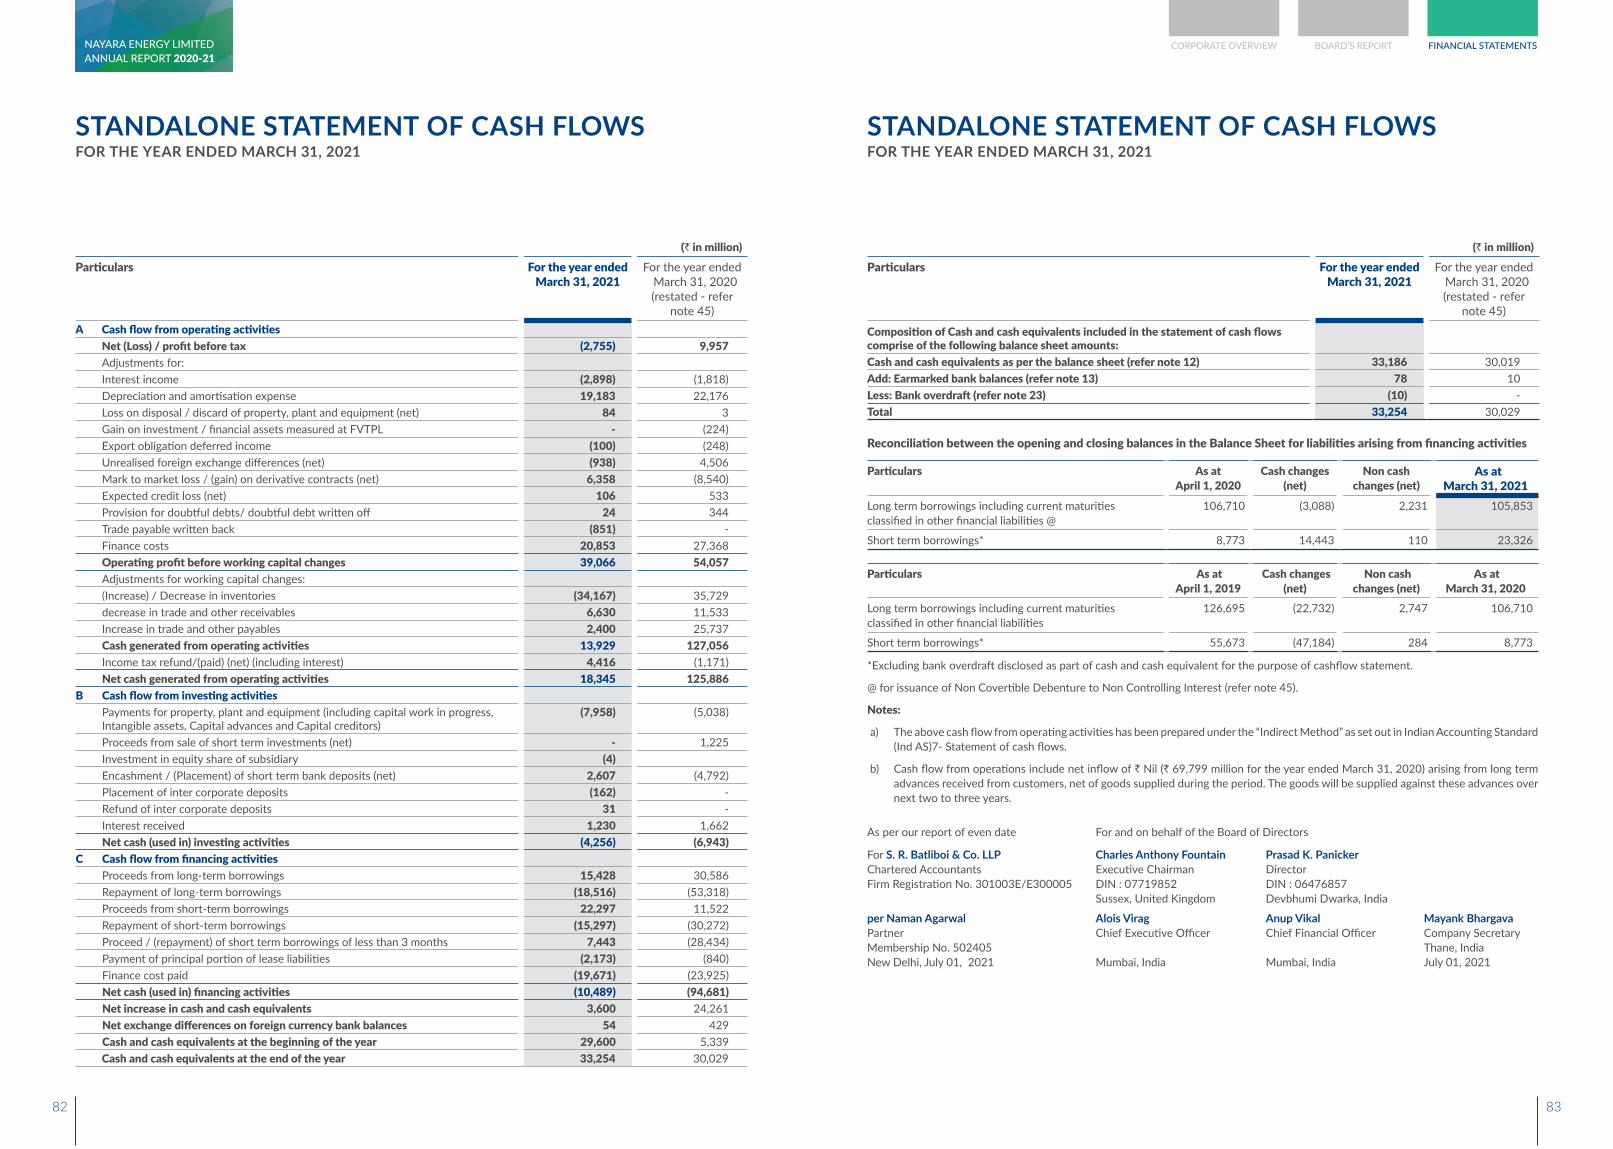
STANDALONE STATEMENT OF CASH FLOWSFOR THE YEAR ENDED MARCH 31, 2021
STANDALONE STATEMENT OF CASH FLOWSFOR THE YEAR ENDED MARCH 31, 2021
(` in million)
Particulars For the year ended March 31, 2021
For the year ended March 31, 2020 (restated - refer
note 45)A Cash flow from operating activities
Net (Loss) / profit before tax (2,755) 9,957Adjustments for:Interest income (2,898) (1,818)Depreciation and amortisation expense 19,183 22,176Loss on disposal / discard of property, plant and equipment (net) 84 3Gain on investment / financial assets measured at FVTPL - (224)Export obligation deferred income (100) (248)Unrealised foreign exchange differences (net) (938) 4,506Mark to market loss / (gain) on derivative contracts (net) 6,358 (8,540)Expected credit loss (net) 106 533Provision for doubtful debts/ doubtful debt written off 24 344Trade payable written back (851) -Finance costs 20,853 27,368Operating profit before working capital changes 39,066 54,057Adjustments for working capital changes:(Increase) / Decrease in inventories (34,167) 35,729decrease in trade and other receivables 6,630 11,533Increase in trade and other payables 2,400 25,737Cash generated from operating activities 13,929 127,056Income tax refund/(paid) (net) (including interest) 4,416 (1,171)Net cash generated from operating activities 18,345 125,886
B Cash flow from investing activitiesPayments for property, plant and equipment (including capital work in progress, Intangible assets, Capital advances and Capital creditors)
(7,958) (5,038)
Proceeds from sale of short term investments (net) - 1,225Investment in equity share of subsidiary (4)Encashment / (Placement) of short term bank deposits (net) 2,607 (4,792)Placement of inter corporate deposits (162) -Refund of inter corporate deposits 31 -Interest received 1,230 1,662Net cash (used in) investing activities (4,256) (6,943)
C Cash flow from financing activitiesProceeds from long-term borrowings 15,428 30,586Repayment of long-term borrowings (18,516) (53,318)Proceeds from short-term borrowings 22,297 11,522Repayment of short-term borrowings (15,297) (30,272)Proceed / (repayment) of short term borrowings of less than 3 months 7,443 (28,434)Payment of principal portion of lease liabilities (2,173) (840)Finance cost paid (19,671) (23,925)Net cash (used in) financing activities (10,489) (94,681)Net increase in cash and cash equivalents 3,600 24,261Net exchange differences on foreign currency bank balances 54 429Cash and cash equivalents at the beginning of the year 29,600 5,339Cash and cash equivalents at the end of the year 33,254 30,029
(` in million)
Particulars For the year ended March 31, 2021
For the year ended March 31, 2020 (restated - refer
note 45)
Composition of Cash and cash equivalents included in the statement of cash flows comprise of the following balance sheet amounts:Cash and cash equivalents as per the balance sheet (refer note 12) 33,186 30,019Add: Earmarked bank balances (refer note 13) 78 10Less: Bank overdraft (refer note 23) (10) -Total 33,254 30,029
Reconciliation between the opening and closing balances in the Balance Sheet for liabilities arising from financing activities
Particulars As at April 1, 2020
Cash changes (net)
Non cash changes (net)
As at March 31, 2021
Long term borrowings including current maturities classified in other financial liabilities @
106,710 (3,088) 2,231 105,853
Short term borrowings* 8,773 14,443 110 23,326
Particulars As at April 1, 2019
Cash changes (net)
Non cash changes (net)
As at March 31, 2020
Long term borrowings including current maturities classified in other financial liabilities
126,695 (22,732) 2,747 106,710
Short term borrowings* 55,673 (47,184) 284 8,773
*Excluding bank overdraft disclosed as part of cash and cash equivalent for the purpose of cashflow statement.
@ for issuance of Non Covertible Debenture to Non Controlling Interest (refer note 45).
Notes:
a) The above cash flow from operating activities has been prepared under the “Indirect Method” as set out in Indian Accounting Standard (Ind AS)7- Statement of cash flows.
b) Cash flow from operations include net inflow of ` Nil (` 69,799 million for the year ended March 31, 2020) arising from long term advances received from customers, net of goods supplied during the period. The goods will be supplied against these advances over next two to three years.
As per our report of even date For and on behalf of the Board of Directors
For S. R. Batliboi & Co. LLP Chartered Accountants Firm Registration No. 301003E/E300005
Charles Anthony Fountain Executive ChairmanDIN : 07719852Sussex, United Kingdom
Prasad K. Panicker DirectorDIN : 06476857Devbhumi Dwarka, India
per Naman Agarwal Partner Membership No. 502405 New Delhi, July 01, 2021
Alois Virag Chief Executive Officer
Mumbai, India
Anup Vikal Chief Financial Officer
Mumbai, India
Mayank Bhargava Company Secretary Thane, India July 01, 2021
CORPORATE OVERVIEW BOARD’S REPORT FINANCIAL STATEMENTS
82 83
ANNUAL REPORT 2020-21NAYARA ENERGY LIMITED
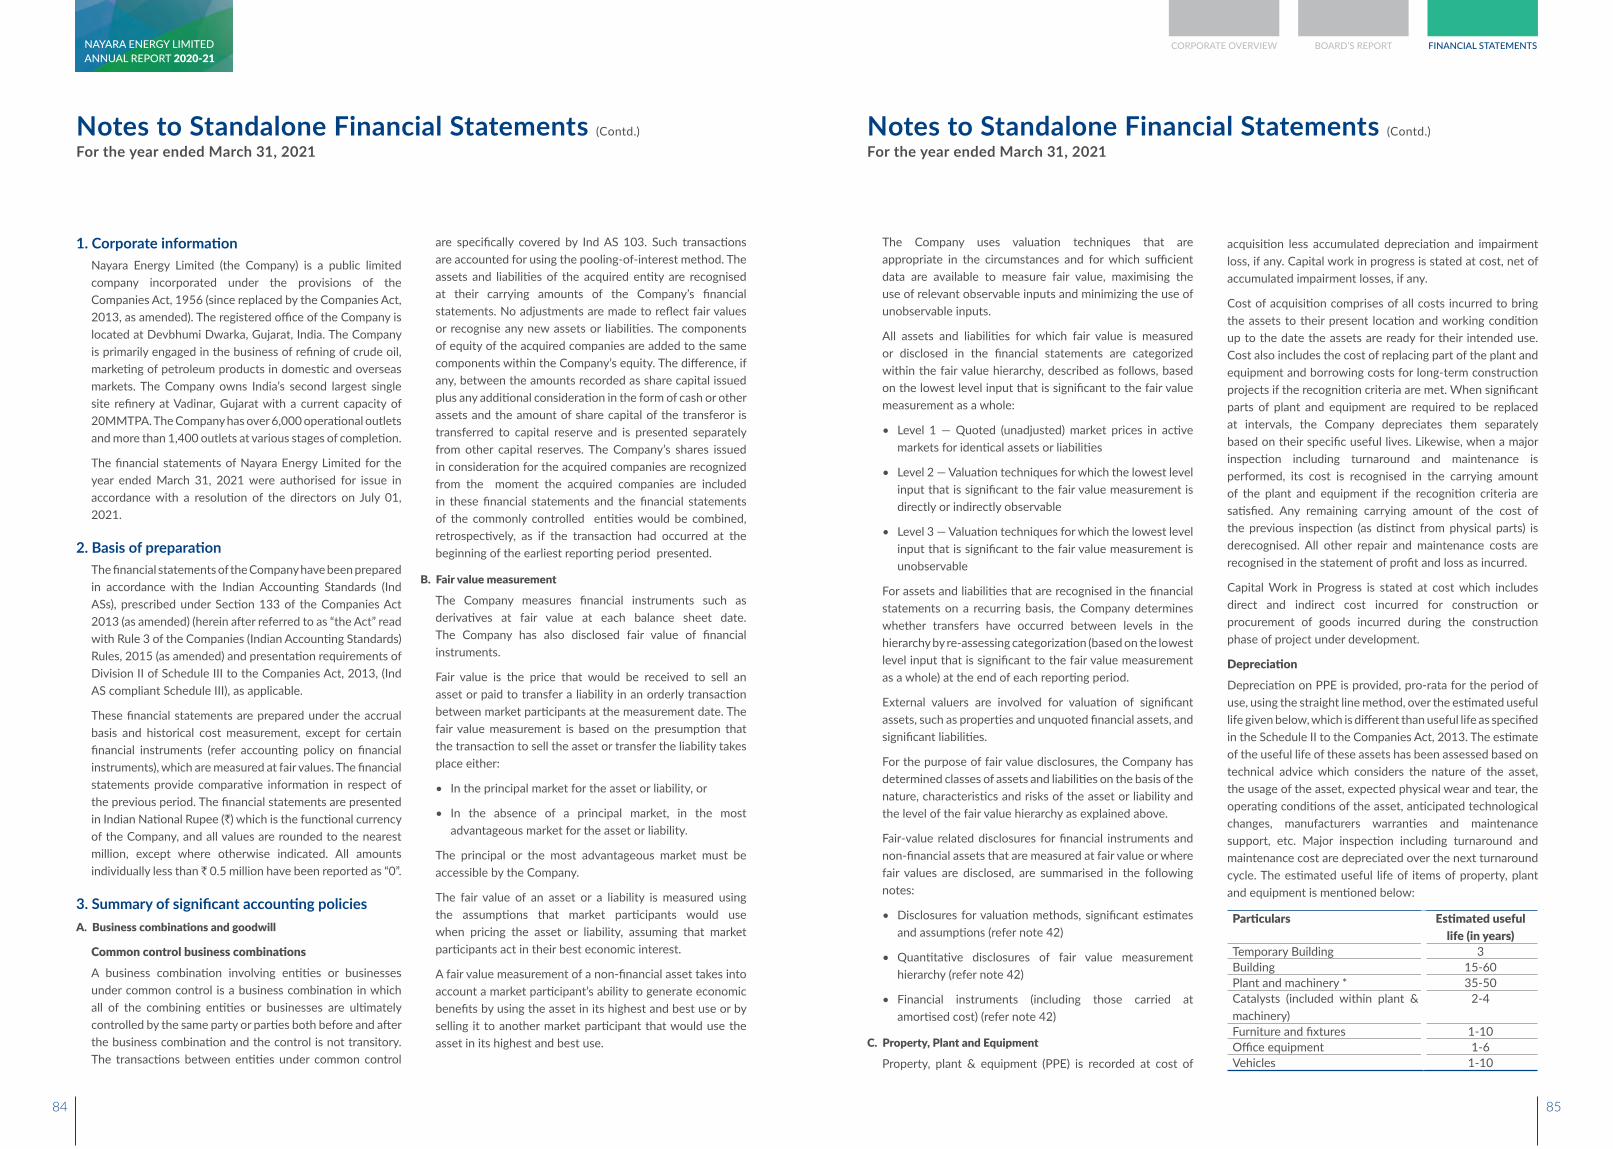
Notes to Standalone Financial Statements (Contd.)
For the year ended March 31, 2021Notes to Standalone Financial Statements (Contd.)
For the year ended March 31, 2021
1. Corporate informationNayara Energy Limited (the Company) is a public limited company incorporated under the provisions of the Companies Act, 1956 (since replaced by the Companies Act, 2013, as amended). The registered office of the Company is located at Devbhumi Dwarka, Gujarat, India. The Company is primarily engaged in the business of refining of crude oil, marketing of petroleum products in domestic and overseas markets. The Company owns India’s second largest single site refinery at Vadinar, Gujarat with a current capacity of 20MMTPA. The Company has over 6,000 operational outlets and more than 1,400 outlets at various stages of completion.
The financial statements of Nayara Energy Limited for the year ended March 31, 2021 were authorised for issue in accordance with a resolution of the directors on July 01, 2021.
2. Basis of preparationThe financial statements of the Company have been prepared in accordance with the Indian Accounting Standards (Ind ASs), prescribed under Section 133 of the Companies Act 2013 (as amended) (herein after referred to as “the Act” read with Rule 3 of the Companies (Indian Accounting Standards) Rules, 2015 (as amended) and presentation requirements of Division II of Schedule III to the Companies Act, 2013, (Ind AS compliant Schedule III), as applicable.
These financial statements are prepared under the accrual basis and historical cost measurement, except for certain financial instruments (refer accounting policy on financial instruments), which are measured at fair values. The financial statements provide comparative information in respect of the previous period. The financial statements are presented in Indian National Rupee (`) which is the functional currency of the Company, and all values are rounded to the nearest million, except where otherwise indicated. All amounts individually less than ̀ 0.5 million have been reported as “0”.
3. Summary of significant accounting policiesA. Business combinations and goodwill
Common control business combinationsA business combination involving entities or businesses under common control is a business combination in which all of the combining entities or businesses are ultimately controlled by the same party or parties both before and after the business combination and the control is not transitory. The transactions between entities under common control
are specifically covered by Ind AS 103. Such transactions are accounted for using the pooling-of-interest method. The assets and liabilities of the acquired entity are recognised at their carrying amounts of the Company’s financial statements. No adjustments are made to reflect fair values or recognise any new assets or liabilities. The components of equity of the acquired companies are added to the same components within the Company’s equity. The difference, if any, between the amounts recorded as share capital issued plus any additional consideration in the form of cash or other assets and the amount of share capital of the transferor is transferred to capital reserve and is presented separately from other capital reserves. The Company’s shares issued in consideration for the acquired companies are recognized from the moment the acquired companies are included in these financial statements and the financial statements of the commonly controlled entities would be combined, retrospectively, as if the transaction had occurred at the beginning of the earliest reporting period presented.
B. Fair value measurement
The Company measures financial instruments such as derivatives at fair value at each balance sheet date. The Company has also disclosed fair value of financial instruments.
Fair value is the price that would be received to sell an asset or paid to transfer a liability in an orderly transaction between market participants at the measurement date. The fair value measurement is based on the presumption that the transaction to sell the asset or transfer the liability takes place either:
• In the principal market for the asset or liability, or
• In the absence of a principal market, in the most advantageous market for the asset or liability.
The principal or the most advantageous market must be accessible by the Company.
The fair value of an asset or a liability is measured using the assumptions that market participants would use when pricing the asset or liability, assuming that market participants act in their best economic interest.
A fair value measurement of a non-financial asset takes into account a market participant’s ability to generate economic benefits by using the asset in its highest and best use or by selling it to another market participant that would use the asset in its highest and best use.
The Company uses valuation techniques that are appropriate in the circumstances and for which sufficient data are available to measure fair value, maximising the use of relevant observable inputs and minimizing the use of unobservable inputs.
All assets and liabilities for which fair value is measured or disclosed in the financial statements are categorized within the fair value hierarchy, described as follows, based on the lowest level input that is significant to the fair value measurement as a whole:
• Level 1 — Quoted (unadjusted) market prices in active markets for identical assets or liabilities
• Level 2 — Valuation techniques for which the lowest level input that is significant to the fair value measurement is directly or indirectly observable
• Level 3 — Valuation techniques for which the lowest level input that is significant to the fair value measurement is unobservable
For assets and liabilities that are recognised in the financial statements on a recurring basis, the Company determines whether transfers have occurred between levels in the hierarchy by re-assessing categorization (based on the lowest level input that is significant to the fair value measurement as a whole) at the end of each reporting period.
External valuers are involved for valuation of significant assets, such as properties and unquoted financial assets, and significant liabilities.
For the purpose of fair value disclosures, the Company has determined classes of assets and liabilities on the basis of the nature, characteristics and risks of the asset or liability and the level of the fair value hierarchy as explained above.
Fair-value related disclosures for financial instruments and non-financial assets that are measured at fair value or where fair values are disclosed, are summarised in the following notes:
• Disclosures for valuation methods, significant estimates and assumptions (refer note 42)
• Quantitative disclosures of fair value measurement hierarchy (refer note 42)
• Financial instruments (including those carried at amortised cost) (refer note 42)
C. Property, Plant and Equipment
Property, plant & equipment (PPE) is recorded at cost of
acquisition less accumulated depreciation and impairment loss, if any. Capital work in progress is stated at cost, net of accumulated impairment losses, if any.
Cost of acquisition comprises of all costs incurred to bring the assets to their present location and working condition up to the date the assets are ready for their intended use. Cost also includes the cost of replacing part of the plant and equipment and borrowing costs for long-term construction projects if the recognition criteria are met. When significant parts of plant and equipment are required to be replaced at intervals, the Company depreciates them separately based on their specific useful lives. Likewise, when a major inspection including turnaround and maintenance is performed, its cost is recognised in the carrying amount of the plant and equipment if the recognition criteria are satisfied. Any remaining carrying amount of the cost of the previous inspection (as distinct from physical parts) is derecognised. All other repair and maintenance costs are recognised in the statement of profit and loss as incurred.
Capital Work in Progress is stated at cost which includes direct and indirect cost incurred for construction or procurement of goods incurred during the construction phase of project under development.
DepreciationDepreciation on PPE is provided, pro-rata for the period of use, using the straight line method, over the estimated useful life given below, which is different than useful life as specified in the Schedule II to the Companies Act, 2013. The estimate of the useful life of these assets has been assessed based on technical advice which considers the nature of the asset, the usage of the asset, expected physical wear and tear, the operating conditions of the asset, anticipated technological changes, manufacturers warranties and maintenance support, etc. Major inspection including turnaround and maintenance cost are depreciated over the next turnaround cycle. The estimated useful life of items of property, plant and equipment is mentioned below:
Particulars Estimated useful life (in years)
Temporary Building 3Building 15-60Plant and machinery * 35-50Catalysts (included within plant & machinery)
2-4
Furniture and fixtures 1-10Office equipment 1-6Vehicles 1-10
84 85
CORPORATE OVERVIEW BOARD’S REPORT FINANCIAL STATEMENTSANNUAL REPORT 2020-21NAYARA ENERGY LIMITED
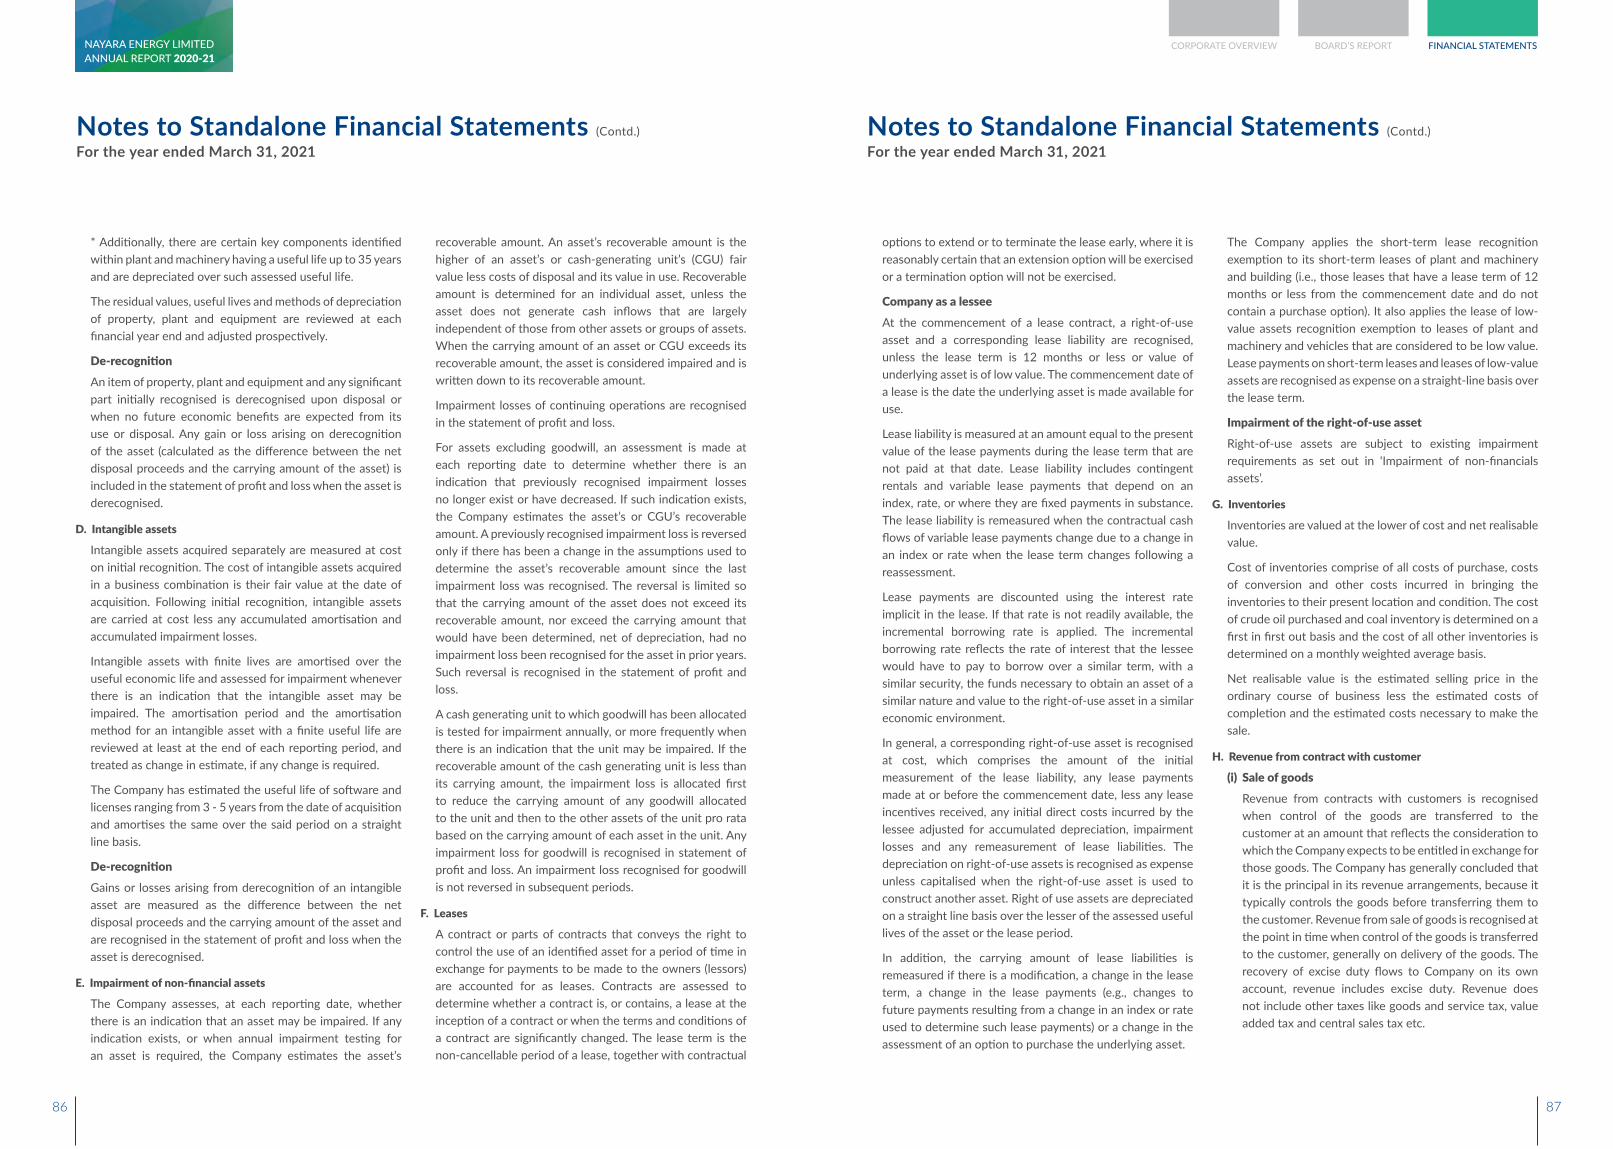
Notes to Standalone Financial Statements (Contd.)
For the year ended March 31, 2021Notes to Standalone Financial Statements (Contd.)
For the year ended March 31, 2021
* Additionally, there are certain key components identified within plant and machinery having a useful life up to 35 years and are depreciated over such assessed useful life.
The residual values, useful lives and methods of depreciation of property, plant and equipment are reviewed at each financial year end and adjusted prospectively.
De-recognition An item of property, plant and equipment and any significant
part initially recognised is derecognised upon disposal or when no future economic benefits are expected from its use or disposal. Any gain or loss arising on derecognition of the asset (calculated as the difference between the net disposal proceeds and the carrying amount of the asset) is included in the statement of profit and loss when the asset is derecognised.
D. Intangible assets
Intangible assets acquired separately are measured at cost on initial recognition. The cost of intangible assets acquired in a business combination is their fair value at the date of acquisition. Following initial recognition, intangible assets are carried at cost less any accumulated amortisation and accumulated impairment losses.
Intangible assets with finite lives are amortised over the useful economic life and assessed for impairment whenever there is an indication that the intangible asset may be impaired. The amortisation period and the amortisation method for an intangible asset with a finite useful life are reviewed at least at the end of each reporting period, and treated as change in estimate, if any change is required.
The Company has estimated the useful life of software and licenses ranging from 3 - 5 years from the date of acquisition and amortises the same over the said period on a straight line basis.
De-recognition Gains or losses arising from derecognition of an intangible
asset are measured as the difference between the net disposal proceeds and the carrying amount of the asset and are recognised in the statement of profit and loss when the asset is derecognised.
E. Impairment of non-financial assets
The Company assesses, at each reporting date, whether there is an indication that an asset may be impaired. If any indication exists, or when annual impairment testing for an asset is required, the Company estimates the asset’s
recoverable amount. An asset’s recoverable amount is the higher of an asset’s or cash-generating unit’s (CGU) fair value less costs of disposal and its value in use. Recoverable amount is determined for an individual asset, unless the asset does not generate cash inflows that are largely independent of those from other assets or groups of assets. When the carrying amount of an asset or CGU exceeds its recoverable amount, the asset is considered impaired and is written down to its recoverable amount.
Impairment losses of continuing operations are recognised in the statement of profit and loss.
For assets excluding goodwill, an assessment is made at each reporting date to determine whether there is an indication that previously recognised impairment losses no longer exist or have decreased. If such indication exists, the Company estimates the asset’s or CGU’s recoverable amount. A previously recognised impairment loss is reversed only if there has been a change in the assumptions used to determine the asset’s recoverable amount since the last impairment loss was recognised. The reversal is limited so that the carrying amount of the asset does not exceed its recoverable amount, nor exceed the carrying amount that would have been determined, net of depreciation, had no impairment loss been recognised for the asset in prior years. Such reversal is recognised in the statement of profit and loss.
A cash generating unit to which goodwill has been allocated is tested for impairment annually, or more frequently when there is an indication that the unit may be impaired. If the recoverable amount of the cash generating unit is less than its carrying amount, the impairment loss is allocated first to reduce the carrying amount of any goodwill allocated to the unit and then to the other assets of the unit pro rata based on the carrying amount of each asset in the unit. Any impairment loss for goodwill is recognised in statement of profit and loss. An impairment loss recognised for goodwill is not reversed in subsequent periods.
F. Leases
A contract or parts of contracts that conveys the right to control the use of an identified asset for a period of time in exchange for payments to be made to the owners (lessors) are accounted for as leases. Contracts are assessed to determine whether a contract is, or contains, a lease at the inception of a contract or when the terms and conditions of a contract are significantly changed. The lease term is the non-cancellable period of a lease, together with contractual
options to extend or to terminate the lease early, where it is reasonably certain that an extension option will be exercised or a termination option will not be exercised.
Company as a lessee At the commencement of a lease contract, a right-of-use
asset and a corresponding lease liability are recognised, unless the lease term is 12 months or less or value of underlying asset is of low value. The commencement date of a lease is the date the underlying asset is made available for use.
Lease liability is measured at an amount equal to the present value of the lease payments during the lease term that are not paid at that date. Lease liability includes contingent rentals and variable lease payments that depend on an index, rate, or where they are fixed payments in substance. The lease liability is remeasured when the contractual cash flows of variable lease payments change due to a change in an index or rate when the lease term changes following a reassessment.
Lease payments are discounted using the interest rate implicit in the lease. If that rate is not readily available, the incremental borrowing rate is applied. The incremental borrowing rate reflects the rate of interest that the lessee would have to pay to borrow over a similar term, with a similar security, the funds necessary to obtain an asset of a similar nature and value to the right-of-use asset in a similar economic environment.
In general, a corresponding right-of-use asset is recognised at cost, which comprises the amount of the initial measurement of the lease liability, any lease payments made at or before the commencement date, less any lease incentives received, any initial direct costs incurred by the lessee adjusted for accumulated depreciation, impairment losses and any remeasurement of lease liabilities. The depreciation on right-of-use assets is recognised as expense unless capitalised when the right-of-use asset is used to construct another asset. Right of use assets are depreciated on a straight line basis over the lesser of the assessed useful lives of the asset or the lease period.
In addition, the carrying amount of lease liabilities is remeasured if there is a modification, a change in the lease term, a change in the lease payments (e.g., changes to future payments resulting from a change in an index or rate used to determine such lease payments) or a change in the assessment of an option to purchase the underlying asset.
The Company applies the short-term lease recognition exemption to its short-term leases of plant and machinery and building (i.e., those leases that have a lease term of 12 months or less from the commencement date and do not contain a purchase option). It also applies the lease of low-value assets recognition exemption to leases of plant and machinery and vehicles that are considered to be low value. Lease payments on short-term leases and leases of low-value assets are recognised as expense on a straight-line basis over the lease term.
Impairment of the right-of-use asset Right-of-use assets are subject to existing impairment
requirements as set out in ‘Impairment of non-financials assets’.
G. Inventories
Inventories are valued at the lower of cost and net realisable value.
Cost of inventories comprise of all costs of purchase, costs of conversion and other costs incurred in bringing the inventories to their present location and condition. The cost of crude oil purchased and coal inventory is determined on a first in first out basis and the cost of all other inventories is determined on a monthly weighted average basis.
Net realisable value is the estimated selling price in the ordinary course of business less the estimated costs of completion and the estimated costs necessary to make the sale.
H. Revenue from contract with customer
(i) Sale of goods Revenue from contracts with customers is recognised
when control of the goods are transferred to the customer at an amount that reflects the consideration to which the Company expects to be entitled in exchange for those goods. The Company has generally concluded that it is the principal in its revenue arrangements, because it typically controls the goods before transferring them to the customer. Revenue from sale of goods is recognised at the point in time when control of the goods is transferred to the customer, generally on delivery of the goods. The recovery of excise duty flows to Company on its own account, revenue includes excise duty. Revenue does not include other taxes like goods and service tax, value added tax and central sales tax etc.
86 87
CORPORATE OVERVIEW BOARD’S REPORT FINANCIAL STATEMENTSANNUAL REPORT 2020-21NAYARA ENERGY LIMITED
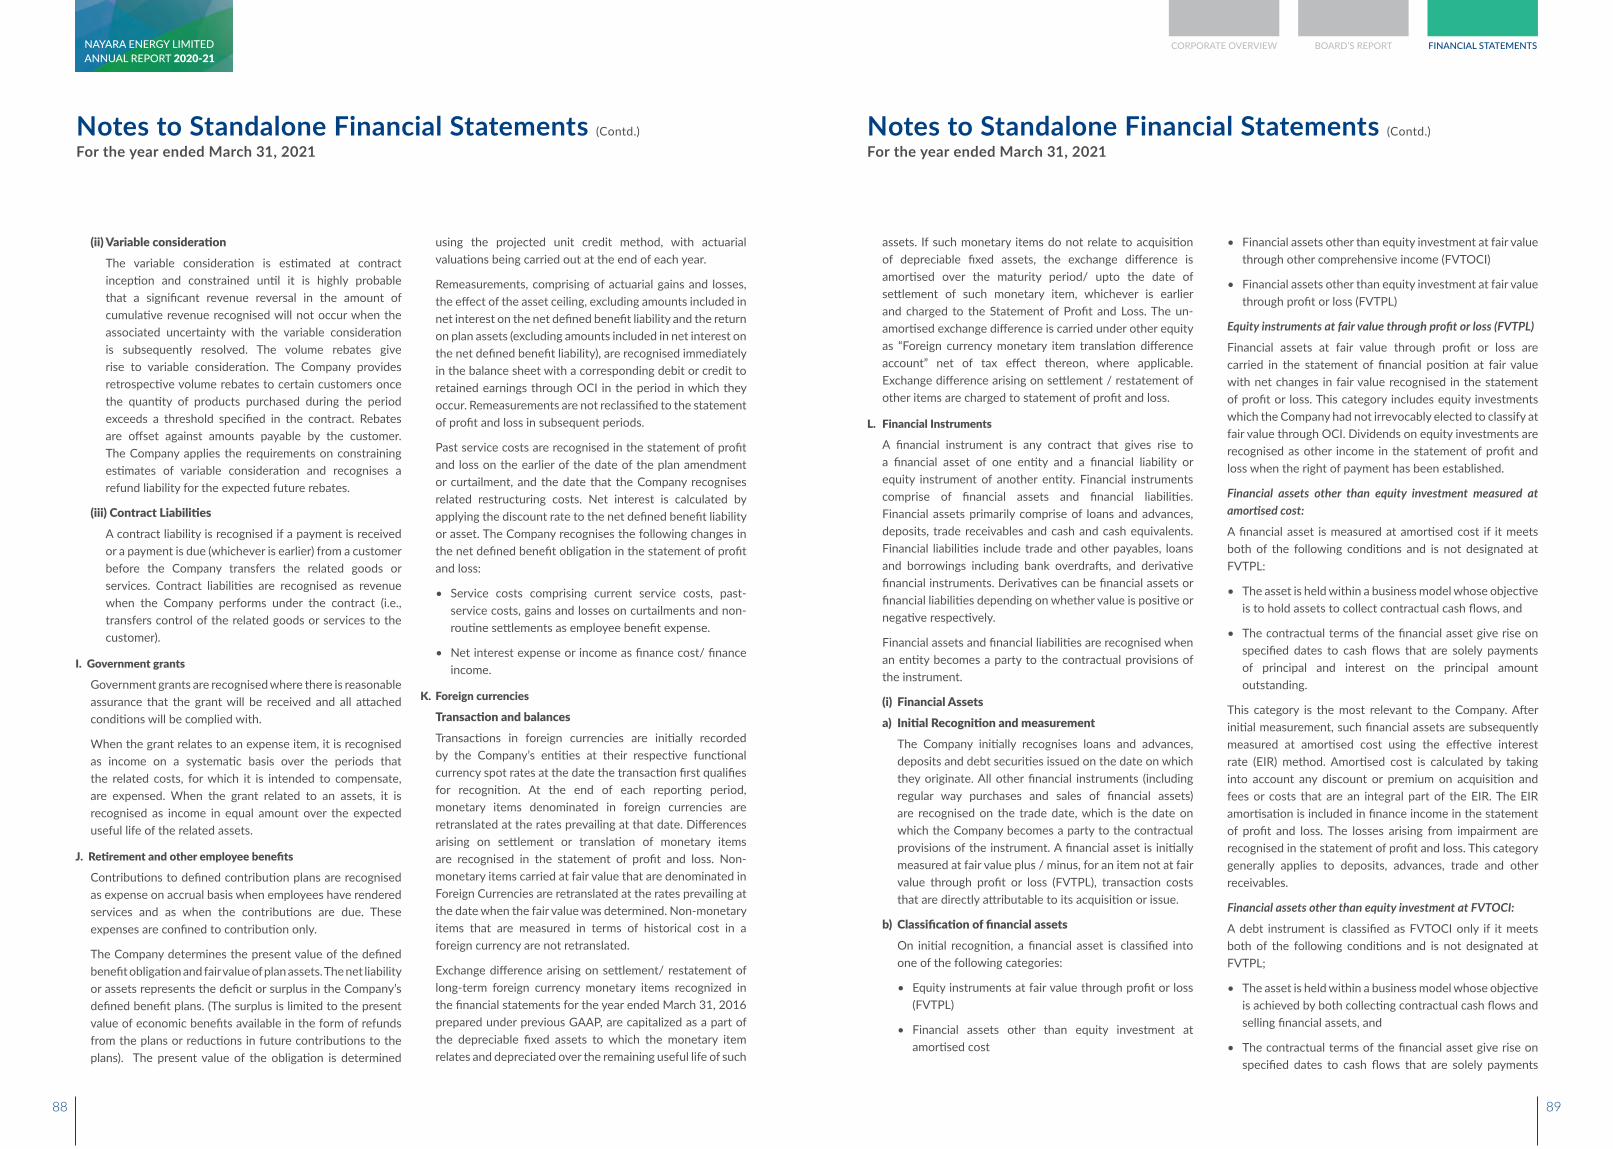
Notes to Standalone Financial Statements (Contd.)
For the year ended March 31, 2021Notes to Standalone Financial Statements (Contd.)
For the year ended March 31, 2021
(ii) Variable consideration The variable consideration is estimated at contract
inception and constrained until it is highly probable that a significant revenue reversal in the amount of cumulative revenue recognised will not occur when the associated uncertainty with the variable consideration is subsequently resolved. The volume rebates give rise to variable consideration. The Company provides retrospective volume rebates to certain customers once the quantity of products purchased during the period exceeds a threshold specified in the contract. Rebates are offset against amounts payable by the customer. The Company applies the requirements on constraining estimates of variable consideration and recognises a refund liability for the expected future rebates.
(iii) Contract Liabilities A contract liability is recognised if a payment is received
or a payment is due (whichever is earlier) from a customer before the Company transfers the related goods or services. Contract liabilities are recognised as revenue when the Company performs under the contract (i.e., transfers control of the related goods or services to the customer).
I. Government grants
Government grants are recognised where there is reasonable assurance that the grant will be received and all attached conditions will be complied with.
When the grant relates to an expense item, it is recognised as income on a systematic basis over the periods that the related costs, for which it is intended to compensate, are expensed. When the grant related to an assets, it is recognised as income in equal amount over the expected useful life of the related assets.
J. Retirement and other employee benefits
Contributions to defined contribution plans are recognised as expense on accrual basis when employees have rendered services and as when the contributions are due. These expenses are confined to contribution only.
The Company determines the present value of the defined benefit obligation and fair value of plan assets. The net liability or assets represents the deficit or surplus in the Company’s defined benefit plans. (The surplus is limited to the present value of economic benefits available in the form of refunds from the plans or reductions in future contributions to the plans). The present value of the obligation is determined
using the projected unit credit method, with actuarial valuations being carried out at the end of each year.
Remeasurements, comprising of actuarial gains and losses, the effect of the asset ceiling, excluding amounts included in net interest on the net defined benefit liability and the return on plan assets (excluding amounts included in net interest on the net defined benefit liability), are recognised immediately in the balance sheet with a corresponding debit or credit to retained earnings through OCI in the period in which they occur. Remeasurements are not reclassified to the statement of profit and loss in subsequent periods.
Past service costs are recognised in the statement of profit and loss on the earlier of the date of the plan amendment or curtailment, and the date that the Company recognises related restructuring costs. Net interest is calculated by applying the discount rate to the net defined benefit liability or asset. The Company recognises the following changes in the net defined benefit obligation in the statement of profit and loss:
• Service costs comprising current service costs, past-service costs, gains and losses on curtailments and non-routine settlements as employee benefit expense.
• Net interest expense or income as finance cost/ finance income.
K. Foreign currencies
Transaction and balances Transactions in foreign currencies are initially recorded
by the Company’s entities at their respective functional currency spot rates at the date the transaction first qualifies for recognition. At the end of each reporting period, monetary items denominated in foreign currencies are retranslated at the rates prevailing at that date. Differences arising on settlement or translation of monetary items are recognised in the statement of profit and loss. Non-monetary items carried at fair value that are denominated in Foreign Currencies are retranslated at the rates prevailing at the date when the fair value was determined. Non-monetary items that are measured in terms of historical cost in a foreign currency are not retranslated.
Exchange difference arising on settlement/ restatement of long-term foreign currency monetary items recognized in the financial statements for the year ended March 31, 2016 prepared under previous GAAP, are capitalized as a part of the depreciable fixed assets to which the monetary item relates and depreciated over the remaining useful life of such
assets. If such monetary items do not relate to acquisition of depreciable fixed assets, the exchange difference is amortised over the maturity period/ upto the date of settlement of such monetary item, whichever is earlier and charged to the Statement of Profit and Loss. The un-amortised exchange difference is carried under other equity as “Foreign currency monetary item translation difference account” net of tax effect thereon, where applicable. Exchange difference arising on settlement / restatement of other items are charged to statement of profit and loss.
L. Financial Instruments
A financial instrument is any contract that gives rise to a financial asset of one entity and a financial liability or equity instrument of another entity. Financial instruments comprise of financial assets and financial liabilities. Financial assets primarily comprise of loans and advances, deposits, trade receivables and cash and cash equivalents. Financial liabilities include trade and other payables, loans and borrowings including bank overdrafts, and derivative financial instruments. Derivatives can be financial assets or financial liabilities depending on whether value is positive or negative respectively.
Financial assets and financial liabilities are recognised when an entity becomes a party to the contractual provisions of the instrument.
(i) Financial Assets a) Initial Recognition and measurement The Company initially recognises loans and advances,
deposits and debt securities issued on the date on which they originate. All other financial instruments (including regular way purchases and sales of financial assets) are recognised on the trade date, which is the date on which the Company becomes a party to the contractual provisions of the instrument. A financial asset is initially measured at fair value plus / minus, for an item not at fair value through profit or loss (FVTPL), transaction costs that are directly attributable to its acquisition or issue.
b) Classification of financial assets On initial recognition, a financial asset is classified into
one of the following categories:
• Equity instruments at fair value through profit or loss (FVTPL)
• Financial assets other than equity investment at amortised cost
• Financial assets other than equity investment at fair value through other comprehensive income (FVTOCI)
• Financial assets other than equity investment at fair value through profit or loss (FVTPL)
Equity instruments at fair value through profit or loss (FVTPL)
Financial assets at fair value through profit or loss are carried in the statement of financial position at fair value with net changes in fair value recognised in the statement of profit or loss. This category includes equity investments which the Company had not irrevocably elected to classify at fair value through OCI. Dividends on equity investments are recognised as other income in the statement of profit and loss when the right of payment has been established.
Financial assets other than equity investment measured at amortised cost:
A financial asset is measured at amortised cost if it meets both of the following conditions and is not designated at FVTPL:
• The asset is held within a business model whose objective is to hold assets to collect contractual cash flows, and
• The contractual terms of the financial asset give rise on specified dates to cash flows that are solely payments of principal and interest on the principal amount outstanding.
This category is the most relevant to the Company. After initial measurement, such financial assets are subsequently measured at amortised cost using the effective interest rate (EIR) method. Amortised cost is calculated by taking into account any discount or premium on acquisition and fees or costs that are an integral part of the EIR. The EIR amortisation is included in finance income in the statement of profit and loss. The losses arising from impairment are recognised in the statement of profit and loss. This category generally applies to deposits, advances, trade and other receivables.
Financial assets other than equity investment at FVTOCI:
A debt instrument is classified as FVTOCI only if it meets both of the following conditions and is not designated at FVTPL;
• The asset is held within a business model whose objective is achieved by both collecting contractual cash flows and selling financial assets, and
• The contractual terms of the financial asset give rise on specified dates to cash flows that are solely payments
88 89
CORPORATE OVERVIEW BOARD’S REPORT FINANCIAL STATEMENTSANNUAL REPORT 2020-21NAYARA ENERGY LIMITED
Notes to Standalone Financial Statements (Contd.)
For the year ended March 31, 2021Notes to Standalone Financial Statements (Contd.)
For the year ended March 31, 2021
of principal and interest on the principal amount outstanding.
For debt instruments at fair value through OCI, interest income, foreign exchange revaluation and impairment losses or reversals are recognised in the statement of profit or loss and computed in the same manner as for financial assets measured at amortised cost. The remaining fair value changes are recognised in OCI. Upon derecognition, the cumulative fair value change recognised in OCI is recycled to profit or loss.
Financial assets other than equity investment at FVTPL:
FVTPL is a residual category for financial assets. Any debt instrument, which does not meet the criteria for categorization as at amortized cost or as FVTOCI, is classified as at FVTPL. In addition, the Company may elect to designate a debt instrument, which otherwise meets amortized cost or FVTOCI criteria, as at FVTPL. However, such election is allowed only if doing so reduces or eliminates a measurement or recognition inconsistency (referred to as ‘accounting mismatch’).
Debt instruments included within the FVTPL category are measured at fair value with all changes recognized in the statement of profit and loss.
c) Equity Investments All equity investments within the scope of Ind AS 109 are
measured at fair value with value changes recognised in Statement of Profit and Loss, except for those equity investments for which the Company has elected to present the value changes in ‘Other Comprehensive Income’.
The Company accounts for its equity investments in subsidiaries at cost less impairment loss (if any). The impairment, if any, is assessed, determined and recognised in accordance with policy applicable to ‘impairment of non-financial assets.
d) Derecognition of financial assets The Company derecognises a financial asset when the
contractual rights to the cash flows from the asset expire, or when it transfers the financial asset and substantially all the risks and rewards of ownership of the asset to another party.
On derecognition of a financial asset in its entirety, the difference between the asset’s carrying amount and the sum of the consideration received and receivable and the cumulative gain or loss that had been recognised in other
comprehensive income and accumulated in equity is recognised in profit or loss if such gain or loss would have otherwise been recognised in profit or loss on disposal of that financial asset.
e) Impairment of financial assets In accordance with Ind AS 109, the Company uses
‘Expected Credit Loss’ (ECL) model, for evaluating impairment of financial assets other than those measured at FVTPL. Expected credit losses are measured through a loss allowance at an amount equal to:
• The 12-months expected credit losses (expected credit losses that result from those default events on the financial instrument that are possible within 12 months after the reporting date); or
• For other assets, the Company uses 12 month Expected Credit Loss to provide for impairment loss where there is no significant increase in credit risk. If there is significant increase in credit risk full lifetime Expected Credit Loss is used.
• Full lifetime expected credit losses (expected credit losses that result from all possible default events over the life of the financial instrument).
For trade receivables, the Company applies ‘simplified approach’ which requires expected lifetime losses to be recognised from initial recognition of the receivables. The Company uses historical default rates to determine impairment loss on the portfolio of trade receivables. At every reporting date these historical default rates are reviewed and changes in the forward looking estimates are analysed.
f) Effective interest method The effective interest method is a method of calculating
the amortised cost of a debt instrument and of allocating interest income over the relevant period. The effective interest rate is the rate that exactly discounts estimated future cash receipts (including all fees and points paid or received that form an integral part of the effective interest rate, transaction costs and other premiums or discounts) through the expected life of the debt instrument, or, where appropriate, a shorter period, to the net carrying amount on initial recognition.
Income is recognised on an effective interest basis for debt instruments other than those financial assets classified as at FVTPL. Interest income is recognized in the statement of profit and loss and is included in the ‘Other income’ line item.
(ii) Financial liabilities / debt and equity instruments a) Classification as financial liability / debt or equity Debt and equity instruments issued by the Company
are classified as either financial liabilities or as equity in accordance with the substance of the contractual arrangements and the definitions of a financial liability and an equity instrument in Ind AS 32.
b) Financial liabilities / debt Financial liabilities are classified, at initial recognition,
as financial liabilities at fair value through profit or loss, loans and borrowings including payables, or as derivatives designated as hedging instruments in an effective hedge, as appropriate.
All financial liabilities are recognised initially at fair value and, in the case of loans and borrowings and payables, plus directly attributable transaction costs.
The Company’s financial liabilities include trade and other payables, loans and borrowings including bank overdrafts, and derivative financial instruments. Derivative can be financial assets or financial liabilities depending on whether value is positive or negative respectively.
c) Supplier’s credit and Buyer’s credit: The Company enters into an arrangement whereby
banks make direct payment to supplier on due date. The banks are subsequently paid by the Company at later date based on the extended credit terms agreed with the banks. Where this arrangement is agreed with supplier and the Company's legal liability remains towards the supplier only, in such cases the liability is classified as Trade Payable in the balance sheet and in other instances the same is classified as a borrowing.
If the classification of the liability under the above arrangement is a Trade Payable, the Company treats the payment of the supplier by the financial institution as a non-cash transaction and the other associated cash flows are presented as cash flows from operating activities. In other instances, the associated cash flows are presented as cash flows from financing activities.
Interest expense on these are recognised in the finance cost.
d) Equity instruments An equity instrument is any contract that evidences a
residual interest in the assets of an entity after deducting
all of its liabilities. Equity instruments issued by the Company are recognised at the proceeds received, net of direct issue costs.
e) Financial liabilities: The financial liabilities used to minimise accounting
mismatch are classified and measured as at FVTPL in accordance with Ind AS 109. All other financial liabilities (including borrowings and trade and other payables) are subsequently measured at amortised cost using the effective interest method. Gains and losses are recognised in the standalone financial statement of profit and loss when the liabilities are derecognised as well as through the EIR amortisation process.
f) Derecognition of financial liabilities: The Company derecognises financial liabilities when, and
only when, the Company’s obligations are discharged, cancelled or have expired. An exchange between with a lender of debt instruments with substantially different terms is accounted for as an extinguishment of the original financial liability and the recognition of a new financial liability. Similarly, a substantial modification of the terms of an existing financial liability (whether or not attributable to the financial difficulty of the debtor) is accounted for as an extinguishment of the original financial liability and the recognition of a new financial liability. The difference between the carrying amount of the financial liability derecognised and the new liability recognised plus consideration paid or payable is recognised in the statement of profit and loss.
M. Derivative financial instruments and hedge accounting
(i) Initial recognition and subsequent measurement of Derivative and embedded derivatives financial instruments
The Company enters into a variety of derivative financial instruments to manage its exposure to interest rate, commodity price and foreign exchange rate risks. These derivatives include foreign exchange forward contracts, foreign exchange options, commodity forward contracts, interest rate swaps and cross / full currency swaps. For risk management objectives refer note 42(C).
All derivatives are initially recognised at fair value at the date the derivative contracts are entered into and are subsequently remeasured to their fair value at the end of each reporting period. Derivatives are carried as financial assets when the fair value is positive and as financial liabilities when the fair value is negative.
90 91
CORPORATE OVERVIEW BOARD’S REPORT FINANCIAL STATEMENTSANNUAL REPORT 2020-21NAYARA ENERGY LIMITED
Notes to Standalone Financial Statements (Contd.)
For the year ended March 31, 2021Notes to Standalone Financial Statements (Contd.)
For the year ended March 31, 2021
The resulting gain or loss is recognised in the statement of profit and loss immediately unless the derivative is designated and effective as a hedging instrument, in which event the timing of the recognition in the statement of profit and loss or otherwise depends on the nature of the hedge item.
Derivatives embedded in non-derivative host contracts that are not financial assets within the scope of Ind AS 109 ‘Financial Instruments’ are treated as separate derivatives when their risks and characteristics are not closely related to those of the host contracts and the host contracts are not measured at FVTPL.
(ii) Hedge Accounting For the purpose of hedge accounting, hedges are classified
as:
• Fair value hedges when hedging the exposure to changes in the fair value of a recognised asset or liability or an unrecognised firm commitment
• Cash flow hedges when hedging the exposure to variability in cash flows that is either attributable to a particular risk associated with a recognised asset or liability or a highly probable forecast transaction or the foreign currency risk in an unrecognised firm commitment
• Hedges of a net investment in a foreign operation
At the inception of the hedge relationship, the Company documents the relationship between the hedging instrument and the hedged item, along with its risk management objectives and its strategy for undertaking various hedge transactions. Furthermore, at the inception of the hedge and on an ongoing basis, the Company documents whether the hedging instrument is effective in offsetting changes in cash flows of the hedged item attributable to the hedged risk.
(iii) Cash flow hedges Changes in the fair value of derivatives/ hedging
instruments that are designated and qualify as cash flow hedges are deferred in the “Cash Flow Hedge Reserve”. The gain or loss relating to the ineffective portion is recognised immediately in the statement of profit and loss. Amounts deferred in the Cash Flow Hedge Reserve Account are recycled in the statement of profit and loss in the periods when the hedged item is recognised and affects the statement of profit and loss, in the same line as the hedged item.
Hedge accounting is discontinued when the hedging instrument expires or is sold, terminated, or exercised, or no longer qualifies for hedge accounting. In case of cash flow hedges, any cumulative gain or loss deferred in the Cash Flow Hedge Reserve Account at that time is retained and is recognised when the forecast transaction is ultimately recognised and affects the statement of profit and loss. When a forecast transaction is no longer expected to occur, the cumulative gain or loss that was deferred is recognised immediately in the statement of profit and loss.
N. Borrowing Costs
Borrowing costs consists of interest and other costs that an entity incurs in connection with the borrowing of funds.
Borrowing cost also includes exchange differences to the extent regarded as an adjustment to the borrowing costs.
Borrowing costs directly attributable to the acquisition, construction or production of qualifying assets, which are assets that necessarily take a substantial period of time to get ready for their intended use, are added to the cost of those assets, until such time as the assets are substantially ready for their intended use. All other borrowing costs are recognised in the Statement of profit and loss in the period in which they are incurred.
O. Taxes
(i) Current Income tax Current income tax assets and liabilities are measured at the
amount expected to be recovered from or paid to the taxation authorities. The tax rates and tax laws used to compute the amount are those that are enacted or substantively enacted, at the reporting date.
Current income tax relating to items recognised outside statement of profit and loss is recognised outside statement of profit and loss (either in other comprehensive income or in equity). Current tax items are recognised in correlation to the underlying transaction either in OCI or directly in equity. Management periodically evaluates positions taken in the tax returns with respect to situations in which applicable tax regulations are subject to interpretation and establishes provisions where appropriate.
(ii) Deferred tax Deferred tax is provided using the liability method on
temporary differences between the tax bases of assets and liabilities and their carrying amounts for financial reporting purposes at the reporting date.
Deferred tax liabilities are recognised for all taxable temporary differences, except:
• When the deferred tax liability arises from the initial recognition of goodwill or an asset or liability in a transaction that is not a business combination and, at the time of the transaction, affects neither the accounting profit nor taxable profit or loss.
• In respect of taxable temporary differences associated with investments in subsidiaries, when the timing of the reversal of the temporary differences can be controlled and it is probable that the temporary differences will not reverse in the foreseeable future. Deferred tax assets are recognised for all deductible temporary differences, the carry forward of unused tax credits and any unused tax losses. Deferred tax assets are recognised to the extent that it is probable that taxable profit will be available against which the deductible temporary differences, and the carry forward of unused tax credits and unused tax losses can be utilised. However, recognition of deferred tax asset is subject to the following exceptions: When the deferred tax asset relating to the deductible temporary difference arises from the initial recognition of an asset or liability in a transaction that is not a business combination and, at the time of the transaction, affects neither the accounting profit nor taxable profit or loss
• In respect of deductible temporary differences associated with investments in subsidiaries, deferred tax assets are recognised only to the extent that it is probable that the temporary differences will reverse in the foreseeable future and taxable profit will be available against which the temporary differences can be utilized.
The carrying amount of deferred tax assets is reviewed at each reporting date and reduced to the extent that it is no longer probable that sufficient taxable profit will be available to allow all or part of the deferred tax asset to be utilised. Unrecognised deferred tax assets are re-assessed at each reporting date and are recognised to the extent that it has become probable that future taxable profits will allow the deferred tax asset to be recovered.
Deferred tax assets and liabilities are measured at the tax rates that are expected to apply in the year when the asset is realised or the liability is settled, based on tax rates (and tax laws) that have been enacted or substantively enacted at the reporting date.
Deferred tax relating to items recognised outside statement of profit and loss is recognised outside
statement of profit and loss (either in other comprehensive income or in equity). Deferred tax items are recognised in correlation to the underlying transaction either in OCI or directly in equity.
Deferred tax assets and deferred tax liabilities are offset if a legally enforceable right exists to set off current tax assets against current tax liabilities and the deferred taxes relate to income taxes levied by the same taxation authority on the same taxable entity.
(iii) Sales tax (includes value added tax and Goods and services tax)
Expenses and assets are recognised net of the amount of sales tax, except:
• When the sales tax incurred on a purchase of assets or services is not recoverable from the taxation authority, in which case, the tax paid is recognised as part of the cost of acquisition of the asset or as part of the expense item, as applicable
• When receivables and payables are stated with the amount of tax included
The net amount of sales tax recoverable from, or payable to, the taxation authority is included as part of other assets and other liabilities in the balance sheet.
P. Provisions and Contingent liabilities
A provision is recognised when there is a present obligation as a result of a past event, it is probable that an outflow of resources embodying economic benefits will be required to settle the obligation and a reliable estimate can be made of the amount of the obligation.
A contingent liability is a possible obligation that arises from past events and whose existence will be confirmed only by the occurrence or non-occurrence of one or more uncertain future events not wholly within the control of the Company or a present obligation that is not recognized because it is not probable that an outflow of resources will be required to settle the obligation. A contingent liability also arises in extremely rare cases where there is a liability that cannot be recognized because it cannot be measured reliably. The Company does not recognize a contingent liability but discloses it in the financial statements, unless the possibility of an outflow of resources embodying economic benefits is remote.
Q. Cash and Cash Equivalent
Cash and short-term deposits in the balance sheet comprise cash at banks and on hand and short-term deposits with an
92 93
CORPORATE OVERVIEW BOARD’S REPORT FINANCIAL STATEMENTSANNUAL REPORT 2020-21NAYARA ENERGY LIMITED
Notes to Standalone Financial Statements (Contd.)
For the year ended March 31, 2021Notes to Standalone Financial Statements (Contd.)
For the year ended March 31, 2021
original maturity of three months or less, which are subject to an insignificant risk of changes in value.
For the purpose of the statement of cash flows, cash and cash equivalents consist of cash and short-term deposits, as defined above, net of outstanding bank overdrafts as they are considered an integral part of the Company’s cash management.
R. Exceptional items
Exceptional items are those items that management considers, by virtue of their size or incidence, should be disclosed separately to ensure that the financial information allows a better understanding of the underlying performance of the business in the year and facilitates more appropriate comparison with prior periods. Exceptional items are adjusted in arriving at profit before tax.
S. Current and Non-Current Classification
The Company presents assets and liabilities in the balance sheet based on current/ non-current classification.
An asset is treated as current when it is:
• Expected to be realised or intended to be sold or consumed in normal operating cycle
• Held primarily for the purpose of trading
• Expected to be realised within twelve months after the reporting period, or
• Cash or cash equivalent unless restricted from being exchanged or used to settle a liability for at least twelve months after the reporting period
• All other assets are classified as non-current.
A liability is current when:
• It is expected to be settled in normal operating cycle
• It is held primarily for the purpose of trading
• It is due to be settled within twelve months after the reporting period, or
• There is no unconditional right to defer the settlement of the liability for at least twelve months after the reporting period
The Company classifies all other liabilities as Non Current.
Deferred tax assets and liabilities are classified as Non – current assets and liabilities.
The terms of the liability that could, at the option of the counterparty, result in its settlement by the issue of equity instruments do not affect its classification.
4. Critical accounting judgments and key sources of estimation uncertainty
The preparation of the Company’s financial statements requires management to make judgements, estimates and assumptions about the reported amounts of assets and liabilities, and, income and expenses and accompanying disclosures, and the disclosure of contingent liabilities. Uncertainty about these assumptions and estimates could result in outcomes that require a material adjustment to the carrying amount of assets or liabilities affected in future periods.
A. Critical accounting judgements
In the process of applying the Company’s accounting policies, the management has made the following judgements, which have the most significant effect on the amounts recognised in the financial statements:
i) Determination of functional currency The Management makes judgements in determining the
functional currency based on economic substance of the transactions relevant to each entity in the Company. In concluding that Indian Rupees is the functional currency for the parent company, the management considered (i) the currency that mainly influences the sales prices for goods and services, the labour, material and other costs of providing goods and services, and (ii) the effect of the competitive forces and regulations of the country which mainly determine the sales prices of the goods and services. As no single currency was clearly dominant, the management also considered secondary indicators including the currency in which funds from financing activities are denominated and the currency in which funds are retained. The management has concluded that INR is the functional currency of the parent.
B. Estimates and assumptions
The key assumptions concerning the future and other key sources of estimation uncertainty at the reporting date, that have a significant risk of causing a material adjustment to the carrying amounts of assets and liabilities within the next financial year, are described below. The Company based its assumptions and estimates on parameters available when the
financial statements were prepared. Existing circumstances and assumptions about future developments, however, may change due to market changes or circumstances arising that are beyond the control of the Company. Such changes are reflected in the assumptions when they occur.
i) Contingencies In the normal course of business, contingent liabilities may
arise from litigation and other claims against the Company. Potential liabilities that are possible but not probable of crystalizing or cannot be quantified reliably are treated as contingent liabilities. Among other matters, such determination require involvement of legal and other subject matter experts. Depending on materiality, the Company may involve internal and/ or external experts to make such assessment. Contingent liabilities are disclosed in the notes but are not recognized. refer note 36.
ii) Duty drawback Income on duty draw-back is recognised to the extent
that it is probable that the economic benefits will flow to the Company and the revenue can be reliably measured, regardless of when the payment is being made. The Company claims drawback of National Calamity Contingent duty (NCCD) and Basic Custom duty (BCD) on exports in line with duty drawback rules and recognizes the same as revenue. Refer note 38 (A) for details.
iii) Impairment of non-financial assets Goodwill is tested for impairment annually and when
circumstances indicate that the carrying value may be impaired. Impairment is determined for goodwill by assessing the recoverable amount of each CGU (or group of CGUs) to which the goodwill relates.
Impairment exists when the carrying value of an asset or cash generating unit exceeds its recoverable amount, which
is the higher of its fair value less costs of disposal and its value in use. In assessing value in use, the estimated future cash flows are discounted to their present value using pre-tax discount rate that reflects current market assessments of the time value of money and the risks specific to the asset. In determining fair value less costs of disposal, recent market transactions are taken into account, if no such transactions can be identified, an appropriate valuation model is used.
The key assumptions used to determine the recoverable amount for the different CGUs, including a sensitivity analysis, are disclosed and further explained in note 46 in Standalone financial statements.
iv) Property Plant and Equipment/Other Intangible Assets Property, Plant and Equipment/Other Intangible Assets are
depreciated/ amortised over their estimated useful life, after taking into account estimated residual value.
Management reviews the estimated useful life and residual values of the assets annually in order to determine the amount of depreciation/amortisation to be recorded during any reporting period. The useful life and residual values are based on the Company’s historical experience with similar assets and take into account anticipated technological changes. The depreciation/ amortisation for future periods is revised if there are significant changes from previous estimates. Details of changes, the reason thereto and its financial effect are given in note 6 (6) below.
5. Changes in accounting policies and Standards issued but not yet effective
There are no new standards that are notified, but not yet effective, upto the date of issuance of the Company’s financial statements.
94 95
CORPORATE OVERVIEW BOARD’S REPORT FINANCIAL STATEMENTSANNUAL REPORT 2020-21NAYARA ENERGY LIMITED
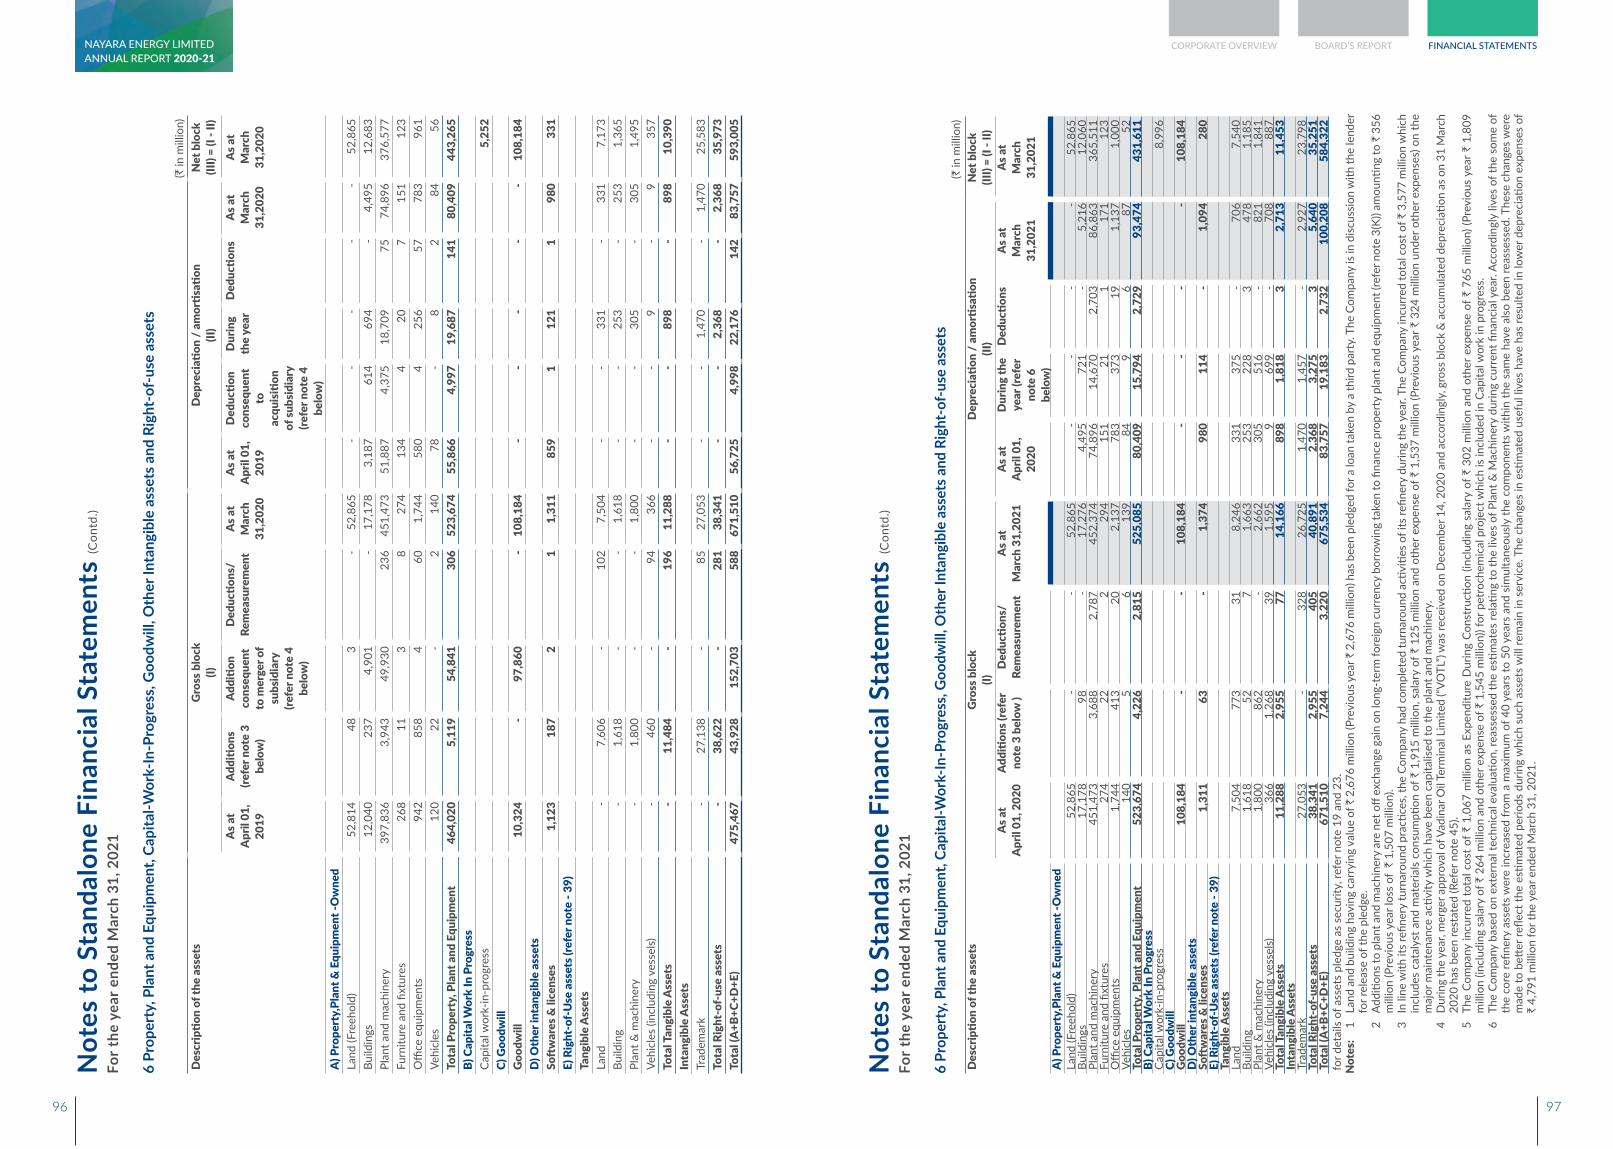
6 Pr
oper
ty, P
lant
and
Equ
ipm
ent,
Capi
tal-W
ork-
In-P
rogr
ess,
Goo
dwill
, Oth
er In
tang
ible
ass
ets a
nd R
ight
-of-
use
asse
ts
(` in
mill
ion)
Des
crip
tion
of th
e as
sets
Gro
ss b
lock
(I)
Dep
reci
ation
/ a
mor
tisati
on
(II)
Net
blo
ck
(III)
= (I
- II)
As a
t A
pril
01,
2019
Addi
tions
(re
fer n
ote
3 be
low
)
Addi
tion
cons
eque
nt
to m
erge
r of
subs
idia
ry
(refe
r not
e 4
belo
w)
Ded
uctio
ns/
Rem
easu
rem
ent
As a
t M
arch
31
,202
0
As a
t A
pril
01,
2019
Ded
uctio
n co
nseq
uent
to
ac
quis
ition
of
subs
idia
ry
(refe
r not
e 4
belo
w)
Dur
ing
the
year
Ded
uctio
nsA
s at
Mar
ch
31,2
020
As a
t M
arch
31
,202
0
A) P
rope
rty,
Plan
t & E
quip
men
t -O
wne
dLa
nd (F
reeh
old)
52,8
1448
3-
52,8
65-
--
--
52,8
65Bu
ildin
gs12
,040
237
4,90
1-
17,1
783,
187
614
694
-4,
495
12,6
83Pl
ant a
nd m
achi
nery
397,
836
3,94
349
,930
236
451,
473
51,8
874,
375
18,7
0975
74,8
9637
6,57
7Fu
rnitu
re a
nd fi
xtur
es26
811
38
274
134
420
715
112
3O
ffice
equ
ipm
ents
942
858
460
1,74
458
04
256
5778
396
1Ve
hicl
es12
022
-2
140
78-
82
8456
Tota
l Pro
pert
y, P
lant
and
Equ
ipm
ent
464,
020
5,11
954
,841
306
523,
674
55,8
664,
997
19,6
8714
180
,409
443,
265
B) C
apita
l Wor
k In
Pro
gres
sCa
pita
l wor
k-in
-pro
gres
s5,
252
C) G
oodw
illG
oodw
ill10
,324
-97
,860
-10
8,18
4-
--
--
108,
184
D) O
ther
inta
ngib
le a
sset
sSo
ftw
ares
& li
cens
es1,
123
187
21
1,31
185
91
121
198
033
1E)
Rig
ht-o
f-U
se a
sset
s (re
fer n
ote
- 39)
Tang
ible
Ass
ets
Land
-7,
606
-10
27,
504
--
331
-33
17,
173
Build
ing
-1,
618
--
1,61
8-
-25
3-
253
1,36
5Pl
ant &
mac
hine
ry-
1,80
0-
-1,
800
--
305
-30
51,
495
Vehi
cles
(inc
ludi
ng v
esse
ls)-
460
-94
366
--
9-
935
7To
tal T
angi
ble
Ass
ets
-11
,484
-19
611
,288
--
898
-89
810
,390
Inta
ngib
le A
sset
sTr
adem
ark
-27
,138
-85
27,0
53-
-1,
470
-1,
470
25,5
83To
tal R
ight
-of-
use
asse
ts-
38,6
22-
281
38,3
41-
-2,
368
-2,
368
35,9
73To
tal (
A+B
+C+D
+E)
475,
467
43,9
2815
2,70
358
867
1,51
056
,725
4,99
822
,176
142
83,7
5759
3,00
5
6 Pr
oper
ty, P
lant
and
Equ
ipm
ent,
Capi
tal-W
ork-
In-P
rogr
ess,
Goo
dwill
, Oth
er In
tang
ible
ass
ets a
nd R
ight
-of-
use
asse
ts(`
in m
illio
n)D
escr
iptio
n of
the
asse
tsG
ross
blo
ck
(I)D
epre
ciati
on /
am
ortis
ation
(II
)N
et b
lock
(II
I) =
(I - I
I)A
s at
Apr
il 01
, 202
0Ad
ditio
ns (r
efer
no
te 3
bel
ow )
Ded
uctio
ns/
Rem
easu
rem
ent
As a
t M
arch
31,
2021
As a
t A
pril
01,
2020
Dur
ing
the
year
(ref
er
note
6
belo
w)
Ded
uctio
nsA
s at
Mar
ch
31,2
021
As a
t M
arch
31
,202
1
A) P
rope
rty,
Plan
t & E
quip
men
t -O
wne
dLa
nd (F
reeh
old)
52,8
65-
-52
,865
--
--
52,8
65Bu
ildin
gs17
,178
98-
17,2
764,
495
721
-5,
216
12,0
60Pl
ant a
nd m
achi
nery
451,
473
3,68
82,
787
452,
374
74,8
9614
,670
2,70
386
,863
365,
511
Furn
iture
and
fixt
ures
274
222
294
151
211
171
123
Offi
ce e
quip
men
ts1,
744
413
202,
137
783
373
191,
137
1,00
0Ve
hicl
es14
05
613
984
96
8752
Tota
l Pro
pert
y, P
lant
and
Equ
ipm
ent
523,
674
4,22
62,
815
525,
085
80,4
0915
,794
2,72
993
,474
431,
611
B) C
apita
l Wor
k In
Pro
gres
sCa
pita
l wor
k-in
-pro
gres
s8,
996
C) G
oodw
illG
oodw
ill10
8,18
4-
-10
8,18
4-
--
-10
8,18
4D
) Oth
er in
tang
ible
ass
ets
Soft
war
es &
lice
nses
1,31
163
-1,
374
980
114
-1,
094
280
E) R
ight
-of-
Use
ass
ets (
refe
r not
e - 3
9)Ta
ngib
le A
sset
sLa
nd7,
504
773
318,
246
331
375
-70
67,
540
Build
ing
1,61
852
71,
663
253
228
347
81,
185
Plan
t & m
achi
nery
1,80
086
2-
2,66
230
551
6-
821
1,84
1Ve
hicl
es (i
nclu
ding
ves
sels)
366
1,26
839
1,59
59
699
-70
888
7To
tal T
angi
ble
Ass
ets
11,2
882,
955
7714
,166
898
1,81
83
2,71
311
,453
Inta
ngib
le A
sset
sTr
adem
ark
27,0
53-
328
26,7
251,
470
1,45
7-
2,92
723
,798
Tota
l Rig
ht-o
f-us
e as
sets
38,3
412,
955
405
40,8
912,
368
3,27
53
5,64
035
,251
Tota
l (A
+B+C
+D+E
)67
1,51
07,
244
3,22
067
5,53
483
,757
19,1
832,
732
100,
208
584,
322
for d
etai
ls of
ass
ets
pled
ge a
s se
curit
y, re
fer n
ote
19 a
nd 2
3.
Not
es:
1 La
nd a
nd b
uild
ing
havi
ng c
arry
ing
valu
e of
` 2
,676
mill
ion
(Pre
viou
s yea
r ` 2
,676
mill
ion)
has
bee
n pl
edge
d fo
r a lo
an ta
ken
by a
third
par
ty. T
he C
ompa
ny is
in d
iscus
sion
with
the
lend
er
for r
elea
se o
f the
ple
dge.
2
Addi
tions
to p
lant
and
mac
hine
ry a
re n
et o
ff ex
chan
ge g
ain
on lo
ng-t
erm
fore
ign
curr
ency
bor
row
ing
take
n to
fina
nce
prop
erty
pla
nt a
nd e
quip
men
t (re
fer n
ote
3(K)
) am
ounti
ng to
` 3
56
mill
ion
(Pre
viou
s yea
r los
s of
` 1
,507
mill
ion)
.
3 In
line
with
its
refin
ery
turn
arou
nd p
racti
ces,
the
Com
pany
had
com
plet
ed tu
rnar
ound
acti
vitie
s of
its
refin
ery
durin
g th
e ye
ar. T
he C
ompa
ny in
curr
ed to
tal c
ost o
f ` 3
,577
mill
ion
whi
ch
incl
udes
cat
alys
t and
mat
eria
ls co
nsum
ption
of `
1,9
15 m
illio
n, s
alar
y of
` 1
25 m
illio
n an
d ot
her e
xpen
se o
f ` 1
,537
mill
ion
(Pre
viou
s ye
ar `
324
mill
ion
unde
r oth
er e
xpen
ses)
on
the
maj
or m
aint
enan
ce a
ctivi
ty w
hich
hav
e be
en c
apita
lised
to th
e pl
ant a
nd m
achi
nery
.
4 D
urin
g th
e ye
ar, m
erge
r app
rova
l of V
adin
ar O
il Te
rmin
al L
imite
d (“V
OTL
”) w
as re
ceiv
ed o
n D
ecem
ber 1
4, 2
020
and
acco
rdin
gly,
gro
ss b
lock
& a
ccum
ulat
ed d
epre
ciati
on a
s on
31 M
arch
20
20 h
as b
een
rest
ated
(Ref
er n
ote
45).
5
The
Com
pany
incu
rred
tota
l cos
t of `
1,0
67 m
illio
n as
Exp
endi
ture
Dur
ing
Cons
truc
tion
(incl
udin
g sa
lary
of `
302
mill
ion
and
othe
r exp
ense
of `
765
mill
ion)
(Pre
viou
s ye
ar `
1,8
09
mill
ion
(incl
udin
g sa
lary
of `
264
mill
ion
and
othe
r exp
ense
of `
1,5
45 m
illio
n)) f
or p
etro
chem
ical
pro
ject
whi
ch is
incl
uded
in C
apita
l wor
k in
pro
gres
s.
6 Th
e Co
mpa
ny b
ased
on
exte
rnal
tech
nica
l eva
luati
on, r
eass
esse
d th
e es
timat
es re
latin
g to
the
lives
of P
lant
& M
achi
nery
dur
ing
curr
ent fi
nanc
ial y
ear.
Acco
rdin
gly
lives
of t
he s
ome
of
the
core
refin
ery
asse
ts w
ere
incr
ease
d fr
om a
max
imum
of 4
0 ye
ars
to 5
0 ye
ars
and
simul
tane
ously
the
com
pone
nts
with
in th
e sa
me
have
also
bee
n re
asse
ssed
. The
se c
hang
es w
ere
mad
e to
bett
er re
flect
the
estim
ated
per
iods
dur
ing
whi
ch s
uch
asse
ts w
ill re
mai
n in
ser
vice
. The
cha
nges
in e
stim
ated
use
ful l
ives
hav
e ha
s re
sulte
d in
low
er d
epre
ciati
on e
xpen
ses
of
` 4,
791
mill
ion
for t
he y
ear e
nded
Mar
ch 3
1, 2
021.
Not
es to
Sta
ndal
one
Fina
ncia
l Sta
tem
ents
(Con
td.)
For t
he y
ear e
nded
Mar
ch 3
1, 2
021
Not
es to
Sta
ndal
one
Fina
ncia
l Sta
tem
ents
(Con
td.)
For t
he y
ear e
nded
Mar
ch 3
1, 2
021
CORPORATE OVERVIEW BOARD’S REPORT FINANCIAL STATEMENTS
96 97
ANNUAL REPORT 2020-21NAYARA ENERGY LIMITED
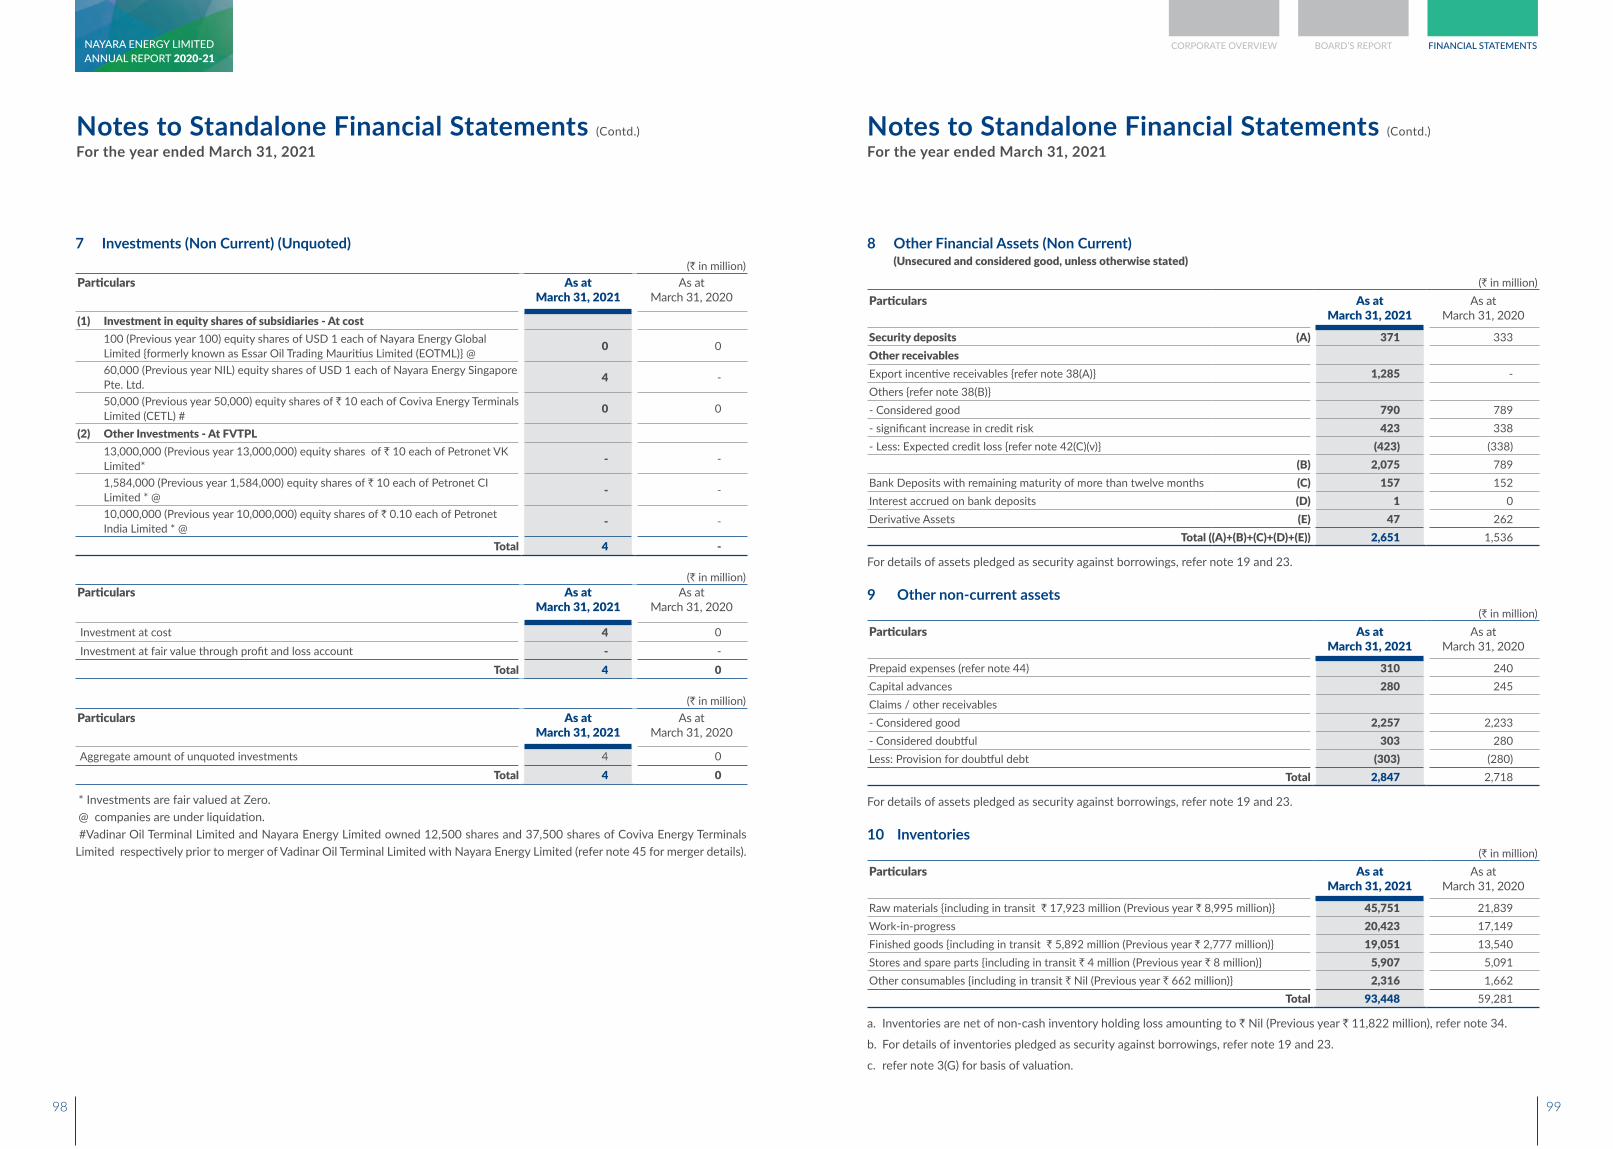
Notes to Standalone Financial Statements (Contd.)
For the year ended March 31, 2021Notes to Standalone Financial Statements (Contd.)
For the year ended March 31, 2021
8 Other Financial Assets (Non Current)(Unsecured and considered good, unless otherwise stated)
(` in million)Particulars As at
March 31, 2021As at
March 31, 2020
Security deposits (A) 371 333Other receivablesExport incentive receivables {refer note 38(A)} 1,285 -Others {refer note 38(B)}- Considered good 790 789- significant increase in credit risk 423 338- Less: Expected credit loss {refer note 42(C)(v)} (423) (338)
(B) 2,075 789Bank Deposits with remaining maturity of more than twelve months (C) 157 152Interest accrued on bank deposits (D) 1 0Derivative Assets (E) 47 262
Total ((A)+(B)+(C)+(D)+(E)) 2,651 1,536
For details of assets pledged as security against borrowings, refer note 19 and 23.
9 Other non-current assets (` in million)
Particulars As atMarch 31, 2021
As atMarch 31, 2020
Prepaid expenses (refer note 44) 310 240 Capital advances 280 245 Claims / other receivables- Considered good 2,257 2,233 - Considered doubtful 303 280 Less: Provision for doubtful debt (303) (280)
Total 2,847 2,718
For details of assets pledged as security against borrowings, refer note 19 and 23.
10 Inventories(` in million)
Particulars As atMarch 31, 2021
As atMarch 31, 2020
Raw materials {including in transit ` 17,923 million (Previous year ` 8,995 million)} 45,751 21,839 Work-in-progress 20,423 17,149 Finished goods {including in transit ` 5,892 million (Previous year ` 2,777 million)} 19,051 13,540 Stores and spare parts {including in transit ` 4 million (Previous year ` 8 million)} 5,907 5,091 Other consumables {including in transit ` Nil (Previous year ` 662 million)} 2,316 1,662
Total 93,448 59,281
a. Inventories are net of non-cash inventory holding loss amounting to ` Nil (Previous year ` 11,822 million), refer note 34.
b. For details of inventories pledged as security against borrowings, refer note 19 and 23.
c. refer note 3(G) for basis of valuation.
7 Investments (Non Current) (Unquoted)(` in million)
Particulars As atMarch 31, 2021
As atMarch 31, 2020
(1) Investment in equity shares of subsidiaries - At cost 100 (Previous year 100) equity shares of USD 1 each of Nayara Energy Global
Limited {formerly known as Essar Oil Trading Mauritius Limited (EOTML)} @ 0 0
60,000 (Previous year NIL) equity shares of USD 1 each of Nayara Energy Singapore Pte. Ltd. 4 -
50,000 (Previous year 50,000) equity shares of ` 10 each of Coviva Energy Terminals Limited (CETL) # 0 0
(2) Other Investments - At FVTPL 13,000,000 (Previous year 13,000,000) equity shares of ` 10 each of Petronet VK
Limited* - -
1,584,000 (Previous year 1,584,000) equity shares of ` 10 each of Petronet CI Limited * @ - -
10,000,000 (Previous year 10,000,000) equity shares of ` 0.10 each of Petronet India Limited * @ - -
Total 4 -
(` in million)Particulars As at
March 31, 2021As at
March 31, 2020
Investment at cost 4 0 Investment at fair value through profit and loss account - -
Total 4 0
(` in million)Particulars As at
March 31, 2021As at
March 31, 2020
Aggregate amount of unquoted investments 4 0 Total 4 0
* Investments are fair valued at Zero. @ companies are under liquidation. #Vadinar Oil Terminal Limited and Nayara Energy Limited owned 12,500 shares and 37,500 shares of Coviva Energy Terminals Limited respectively prior to merger of Vadinar Oil Terminal Limited with Nayara Energy Limited (refer note 45 for merger details).
98 99
CORPORATE OVERVIEW BOARD’S REPORT FINANCIAL STATEMENTSANNUAL REPORT 2020-21NAYARA ENERGY LIMITED
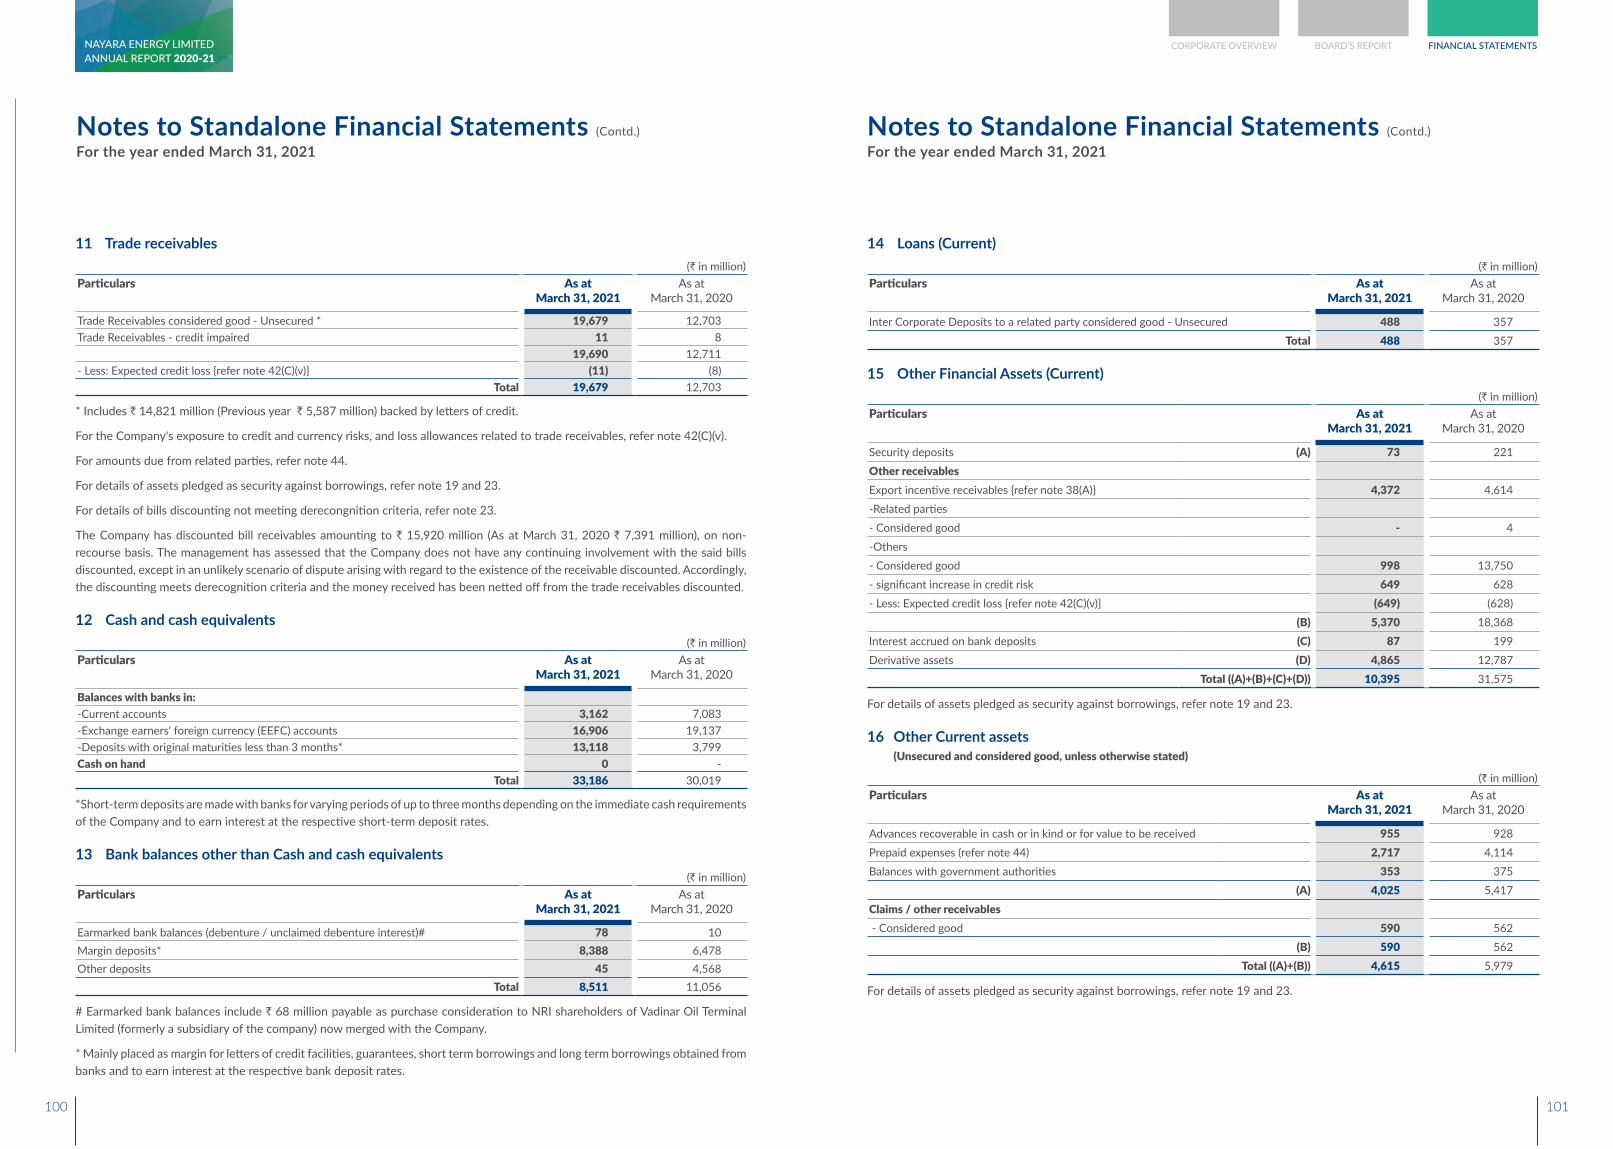
Notes to Standalone Financial Statements (Contd.)
For the year ended March 31, 2021Notes to Standalone Financial Statements (Contd.)
For the year ended March 31, 2021
11 Trade receivables (` in million)
Particulars As atMarch 31, 2021
As atMarch 31, 2020
Trade Receivables considered good - Unsecured * 19,679 12,703 Trade Receivables - credit impaired 11 8
19,690 12,711 - Less: Expected credit loss {refer note 42(C)(v)} (11) (8)
Total 19,679 12,703
* Includes ` 14,821 million (Previous year ` 5,587 million) backed by letters of credit.
For the Company's exposure to credit and currency risks, and loss allowances related to trade receivables, refer note 42(C)(v).
For amounts due from related parties, refer note 44.
For details of assets pledged as security against borrowings, refer note 19 and 23.
For details of bills discounting not meeting derecongnition criteria, refer note 23.
The Company has discounted bill receivables amounting to ` 15,920 million (As at March 31, 2020 ` 7,391 million), on non-recourse basis. The management has assessed that the Company does not have any continuing involvement with the said bills discounted, except in an unlikely scenario of dispute arising with regard to the existence of the receivable discounted. Accordingly, the discounting meets derecognition criteria and the money received has been netted off from the trade receivables discounted.
12 Cash and cash equivalents (` in million)
Particulars As atMarch 31, 2021
As atMarch 31, 2020
Balances with banks in:-Current accounts 3,162 7,083 -Exchange earners' foreign currency (EEFC) accounts 16,906 19,137 -Deposits with original maturities less than 3 months* 13,118 3,799 Cash on hand 0 -
Total 33,186 30,019
*Short-term deposits are made with banks for varying periods of up to three months depending on the immediate cash requirements of the Company and to earn interest at the respective short-term deposit rates.
13 Bank balances other than Cash and cash equivalents (` in million)
Particulars As atMarch 31, 2021
As atMarch 31, 2020
Earmarked bank balances (debenture / unclaimed debenture interest)# 78 10 Margin deposits* 8,388 6,478 Other deposits 45 4,568
Total 8,511 11,056
# Earmarked bank balances include ` 68 million payable as purchase consideration to NRI shareholders of Vadinar Oil Terminal Limited (formerly a subsidiary of the company) now merged with the Company.
* Mainly placed as margin for letters of credit facilities, guarantees, short term borrowings and long term borrowings obtained from banks and to earn interest at the respective bank deposit rates.
14 Loans (Current) (` in million)
Particulars As atMarch 31, 2021
As atMarch 31, 2020
Inter Corporate Deposits to a related party considered good - Unsecured 488 357 Total 488 357
15 Other Financial Assets (Current) (` in million)
Particulars As atMarch 31, 2021
As atMarch 31, 2020
Security deposits (A) 73 221 Other receivables Export incentive receivables {refer note 38(A)} 4,372 4,614 -Related parties- Considered good - 4 -Others- Considered good 998 13,750 - significant increase in credit risk 649 628 - Less: Expected credit loss {refer note 42(C)(v)} (649) (628)
(B) 5,370 18,368 Interest accrued on bank deposits (C) 87 199 Derivative assets (D) 4,865 12,787
Total ((A)+(B)+(C)+(D)) 10,395 31,575
For details of assets pledged as security against borrowings, refer note 19 and 23.
16 Other Current assets(Unsecured and considered good, unless otherwise stated)
(` in million)Particulars As at
March 31, 2021As at
March 31, 2020
Advances recoverable in cash or in kind or for value to be received 955 928 Prepaid expenses (refer note 44) 2,717 4,114 Balances with government authorities 353 375
(A) 4,025 5,417 Claims / other receivables - Considered good 590 562
(B) 590 562 Total ((A)+(B)) 4,615 5,979
For details of assets pledged as security against borrowings, refer note 19 and 23.
100 101
CORPORATE OVERVIEW BOARD’S REPORT FINANCIAL STATEMENTSANNUAL REPORT 2020-21NAYARA ENERGY LIMITED
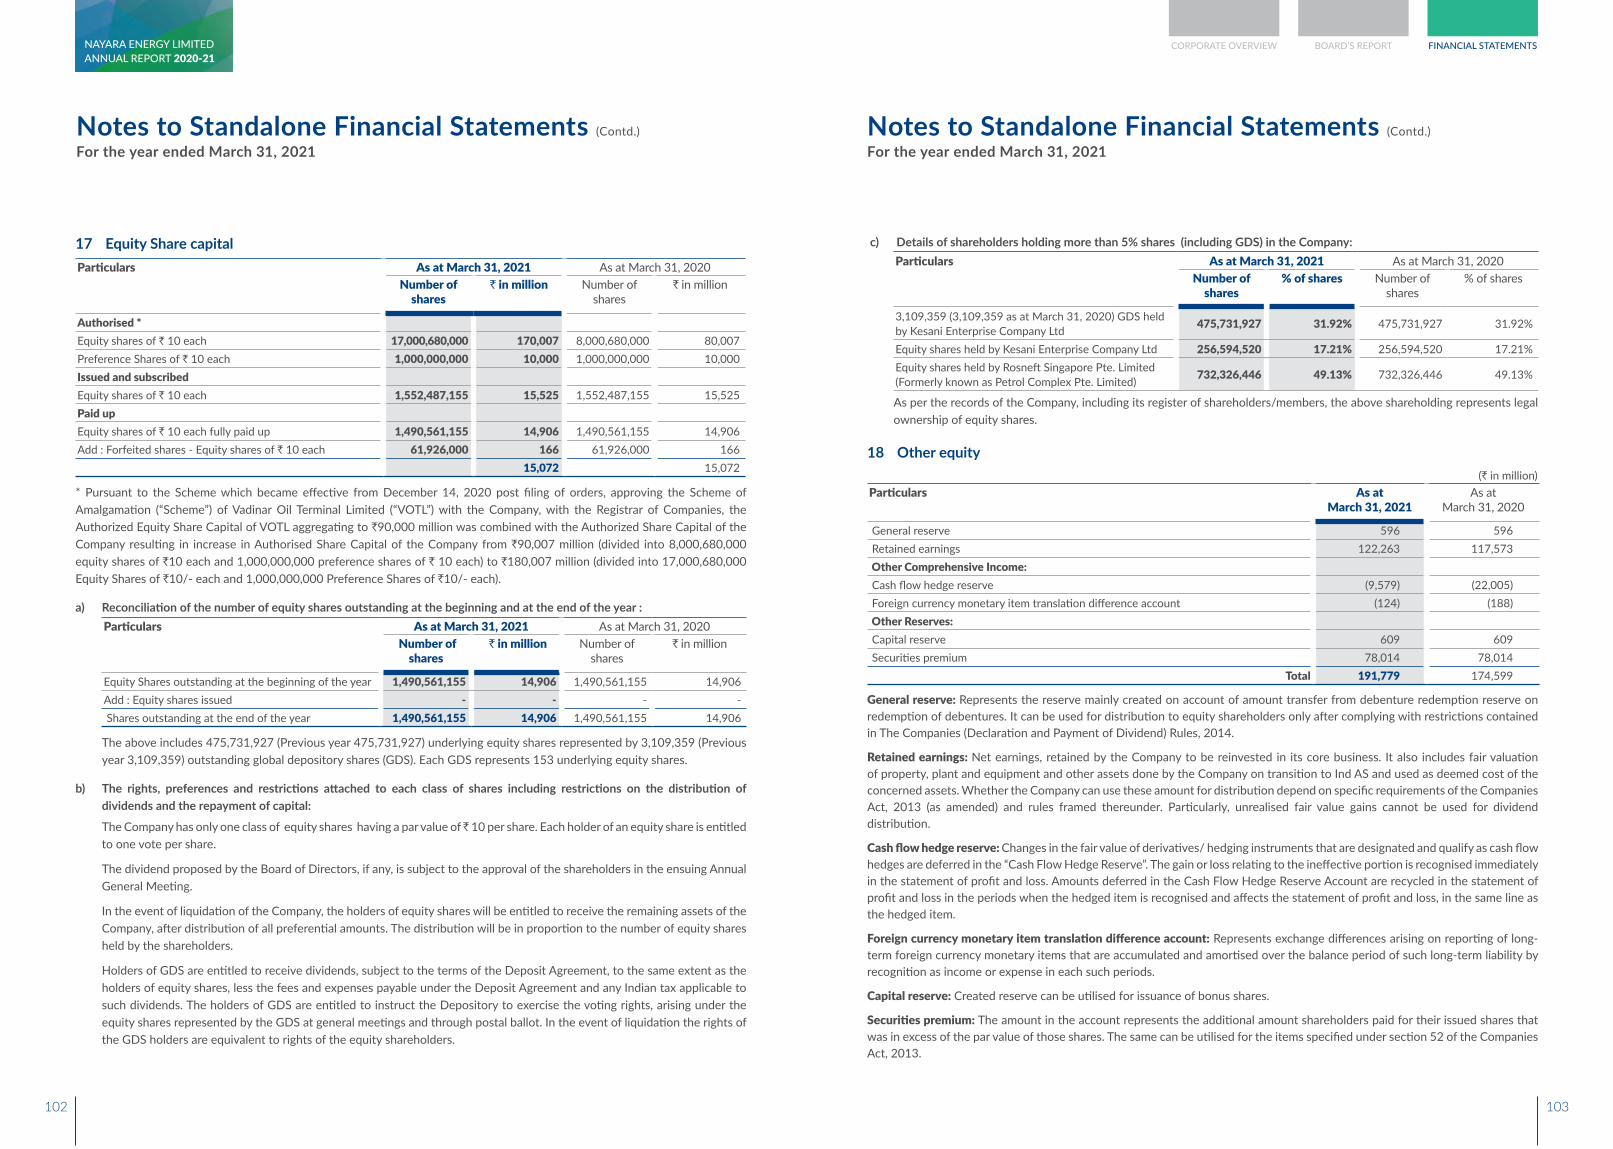
Notes to Standalone Financial Statements (Contd.)
For the year ended March 31, 2021Notes to Standalone Financial Statements (Contd.)
For the year ended March 31, 2021
17 Equity Share capital Particulars As at March 31, 2021 As at March 31, 2020
Number of shares
` in million Number of shares
` in million
Authorised * Equity shares of ` 10 each 17,000,680,000 170,007 8,000,680,000 80,007 Preference Shares of ` 10 each 1,000,000,000 10,000 1,000,000,000 10,000 Issued and subscribed Equity shares of ` 10 each 1,552,487,155 15,525 1,552,487,155 15,525 Paid up Equity shares of ` 10 each fully paid up 1,490,561,155 14,906 1,490,561,155 14,906 Add : Forfeited shares - Equity shares of ` 10 each 61,926,000 166 61,926,000 166
15,072 15,072
* Pursuant to the Scheme which became effective from December 14, 2020 post filing of orders, approving the Scheme of Amalgamation (“Scheme”) of Vadinar Oil Terminal Limited (“VOTL”) with the Company, with the Registrar of Companies, the Authorized Equity Share Capital of VOTL aggregating to `90,000 million was combined with the Authorized Share Capital of the Company resulting in increase in Authorised Share Capital of the Company from `90,007 million (divided into 8,000,680,000 equity shares of `10 each and 1,000,000,000 preference shares of ` 10 each) to `180,007 million (divided into 17,000,680,000 Equity Shares of `10/- each and 1,000,000,000 Preference Shares of `10/- each).
a) Reconciliation of the number of equity shares outstanding at the beginning and at the end of the year :Particulars As at March 31, 2021 As at March 31, 2020
Number of shares
` in million Number of shares
` in million
Equity Shares outstanding at the beginning of the year 1,490,561,155 14,906 1,490,561,155 14,906 Add : Equity shares issued - - - - Shares outstanding at the end of the year 1,490,561,155 14,906 1,490,561,155 14,906
The above includes 475,731,927 (Previous year 475,731,927) underlying equity shares represented by 3,109,359 (Previous year 3,109,359) outstanding global depository shares (GDS). Each GDS represents 153 underlying equity shares.
b) The rights, preferences and restrictions attached to each class of shares including restrictions on the distribution of dividends and the repayment of capital:
The Company has only one class of equity shares having a par value of ̀ 10 per share. Each holder of an equity share is entitled to one vote per share.
The dividend proposed by the Board of Directors, if any, is subject to the approval of the shareholders in the ensuing Annual General Meeting.
In the event of liquidation of the Company, the holders of equity shares will be entitled to receive the remaining assets of the Company, after distribution of all preferential amounts. The distribution will be in proportion to the number of equity shares held by the shareholders.
Holders of GDS are entitled to receive dividends, subject to the terms of the Deposit Agreement, to the same extent as the holders of equity shares, less the fees and expenses payable under the Deposit Agreement and any Indian tax applicable to such dividends. The holders of GDS are entitled to instruct the Depository to exercise the voting rights, arising under the equity shares represented by the GDS at general meetings and through postal ballot. In the event of liquidation the rights of the GDS holders are equivalent to rights of the equity shareholders.
c) Details of shareholders holding more than 5% shares (including GDS) in the Company: Particulars As at March 31, 2021 As at March 31, 2020
Number of shares
% of shares Number of shares
% of shares
3,109,359 (3,109,359 as at March 31, 2020) GDS held by Kesani Enterprise Company Ltd 475,731,927 31.92% 475,731,927 31.92%
Equity shares held by Kesani Enterprise Company Ltd 256,594,520 17.21% 256,594,520 17.21%Equity shares held by Rosneft Singapore Pte. Limited (Formerly known as Petrol Complex Pte. Limited) 732,326,446 49.13% 732,326,446 49.13%
As per the records of the Company, including its register of shareholders/members, the above shareholding represents legal ownership of equity shares.
18 Other equity (` in million)
Particulars As atMarch 31, 2021
As atMarch 31, 2020
General reserve 596 596 Retained earnings 122,263 117,573 Other Comprehensive Income: Cash flow hedge reserve (9,579) (22,005) Foreign currency monetary item translation difference account (124) (188) Other Reserves: Capital reserve 609 609 Securities premium 78,014 78,014
Total 191,779 174,599
General reserve: Represents the reserve mainly created on account of amount transfer from debenture redemption reserve on redemption of debentures. It can be used for distribution to equity shareholders only after complying with restrictions contained in The Companies (Declaration and Payment of Dividend) Rules, 2014.
Retained earnings: Net earnings, retained by the Company to be reinvested in its core business. It also includes fair valuation of property, plant and equipment and other assets done by the Company on transition to Ind AS and used as deemed cost of the concerned assets. Whether the Company can use these amount for distribution depend on specific requirements of the Companies Act, 2013 (as amended) and rules framed thereunder. Particularly, unrealised fair value gains cannot be used for dividend distribution.
Cash flow hedge reserve: Changes in the fair value of derivatives/ hedging instruments that are designated and qualify as cash flow hedges are deferred in the “Cash Flow Hedge Reserve”. The gain or loss relating to the ineffective portion is recognised immediately in the statement of profit and loss. Amounts deferred in the Cash Flow Hedge Reserve Account are recycled in the statement of profit and loss in the periods when the hedged item is recognised and affects the statement of profit and loss, in the same line as the hedged item.
Foreign currency monetary item translation difference account: Represents exchange differences arising on reporting of long-term foreign currency monetary items that are accumulated and amortised over the balance period of such long-term liability by recognition as income or expense in each such periods.
Capital reserve: Created reserve can be utilised for issuance of bonus shares.
Securities premium: The amount in the account represents the additional amount shareholders paid for their issued shares that was in excess of the par value of those shares. The same can be utilised for the items specified under section 52 of the Companies Act, 2013.
102 103
CORPORATE OVERVIEW BOARD’S REPORT FINANCIAL STATEMENTSANNUAL REPORT 2020-21NAYARA ENERGY LIMITED
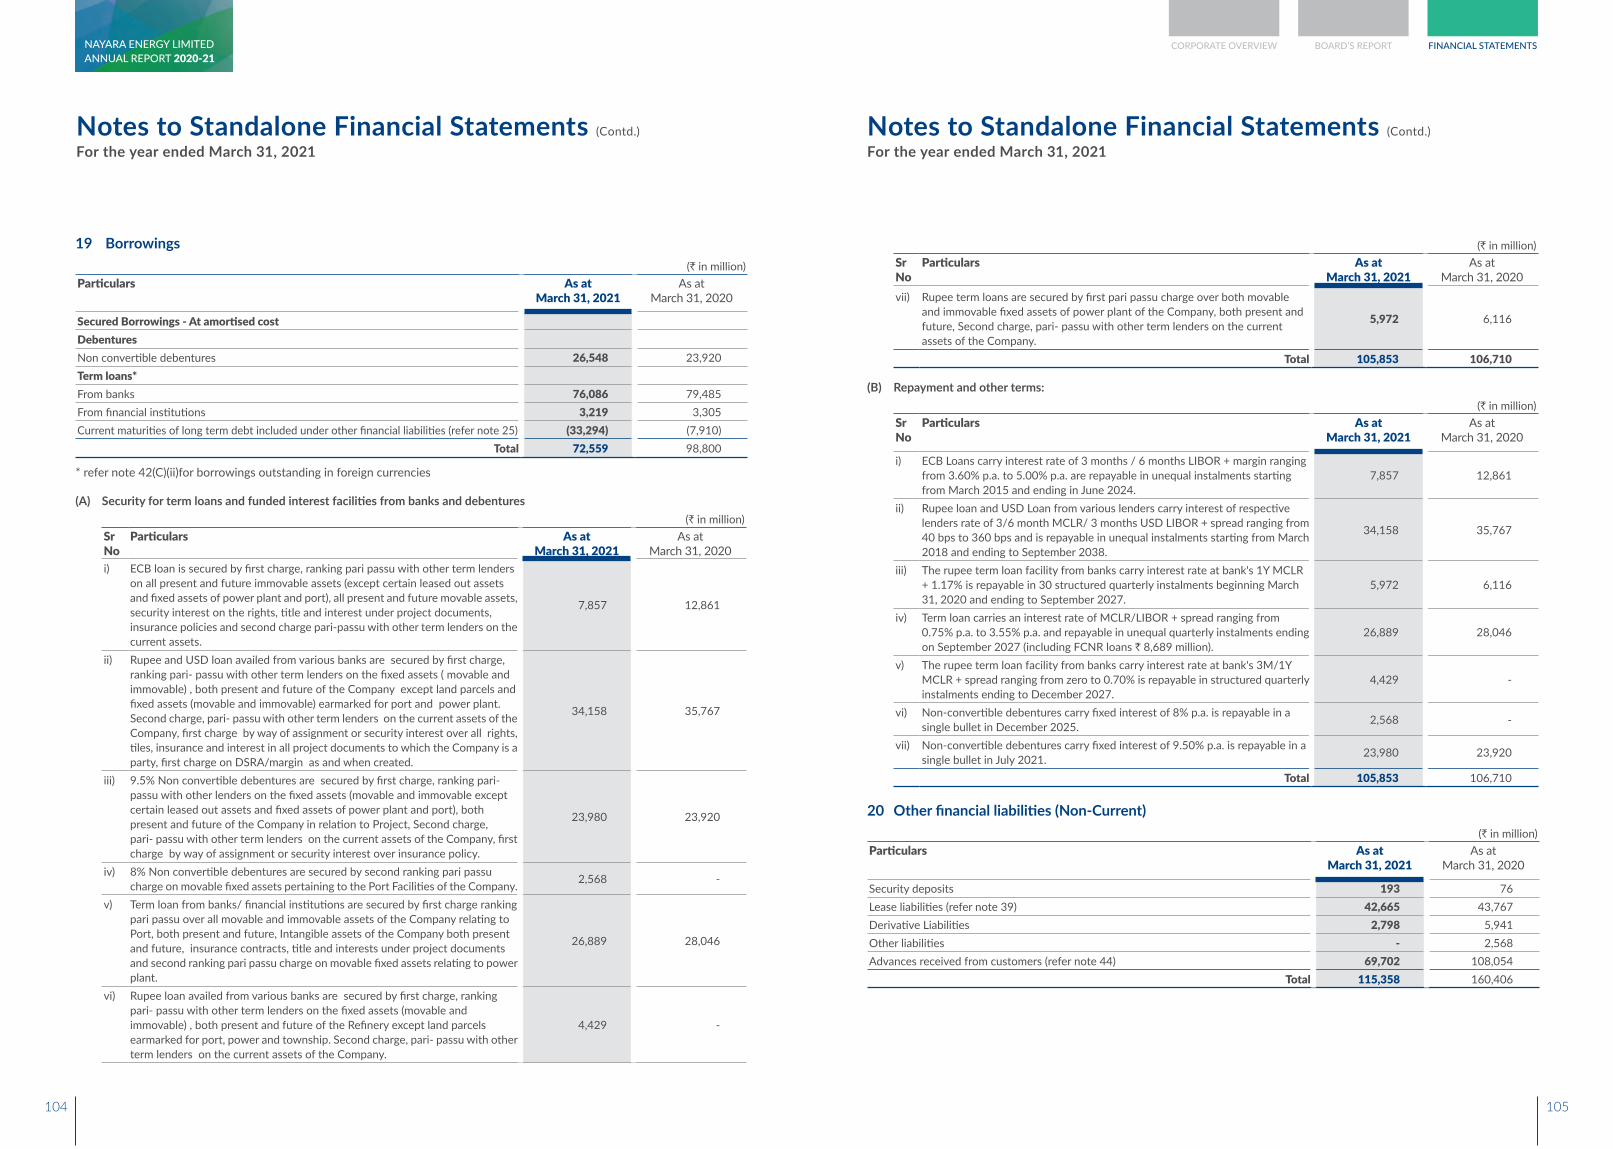
Notes to Standalone Financial Statements (Contd.)
For the year ended March 31, 2021Notes to Standalone Financial Statements (Contd.)
For the year ended March 31, 2021
19 Borrowings (` in million)
Particulars As atMarch 31, 2021
As atMarch 31, 2020
Secured Borrowings - At amortised costDebentures Non convertible debentures 26,548 23,920 Term loans* From banks 76,086 79,485 From financial institutions 3,219 3,305 Current maturities of long term debt included under other financial liabilities (refer note 25) (33,294) (7,910)
Total 72,559 98,800
* refer note 42(C)(ii)for borrowings outstanding in foreign currencies
(A) Security for term loans and funded interest facilities from banks and debentures(` in million)
Sr No
Particulars As atMarch 31, 2021
As atMarch 31, 2020
i) ECB loan is secured by first charge, ranking pari passu with other term lenders on all present and future immovable assets (except certain leased out assets and fixed assets of power plant and port), all present and future movable assets, security interest on the rights, title and interest under project documents, insurance policies and second charge pari-passu with other term lenders on the current assets.
7,857 12,861
ii) Rupee and USD loan availed from various banks are secured by first charge, ranking pari- passu with other term lenders on the fixed assets ( movable and immovable) , both present and future of the Company except land parcels and fixed assets (movable and immovable) earmarked for port and power plant. Second charge, pari- passu with other term lenders on the current assets of the Company, first charge by way of assignment or security interest over all rights, tiles, insurance and interest in all project documents to which the Company is a party, first charge on DSRA/margin as and when created.
34,158 35,767
iii) 9.5% Non convertible debentures are secured by first charge, ranking pari- passu with other lenders on the fixed assets (movable and immovable except certain leased out assets and fixed assets of power plant and port), both present and future of the Company in relation to Project, Second charge, pari- passu with other term lenders on the current assets of the Company, first charge by way of assignment or security interest over insurance policy.
23,980 23,920
iv) 8% Non convertible debentures are secured by second ranking pari passu charge on movable fixed assets pertaining to the Port Facilities of the Company. 2,568 -
v) Term loan from banks/ financial institutions are secured by first charge ranking pari passu over all movable and immovable assets of the Company relating to Port, both present and future, Intangible assets of the Company both present and future, insurance contracts, title and interests under project documents and second ranking pari passu charge on movable fixed assets relating to power plant.
26,889 28,046
vi) Rupee loan availed from various banks are secured by first charge, ranking pari- passu with other term lenders on the fixed assets (movable and immovable) , both present and future of the Refinery except land parcels earmarked for port, power and township. Second charge, pari- passu with other term lenders on the current assets of the Company.
4,429 -
(` in million)Sr No
Particulars As atMarch 31, 2021
As atMarch 31, 2020
vii) Rupee term loans are secured by first pari passu charge over both movable and immovable fixed assets of power plant of the Company, both present and future, Second charge, pari- passu with other term lenders on the current assets of the Company.
5,972 6,116
Total 105,853 106,710
(B) Repayment and other terms:(` in million)
Sr No
Particulars As atMarch 31, 2021
As atMarch 31, 2020
i) ECB Loans carry interest rate of 3 months / 6 months LIBOR + margin ranging from 3.60% p.a. to 5.00% p.a. are repayable in unequal instalments starting from March 2015 and ending in June 2024.
7,857 12,861
ii) Rupee loan and USD Loan from various lenders carry interest of respective lenders rate of 3/6 month MCLR/ 3 months USD LIBOR + spread ranging from 40 bps to 360 bps and is repayable in unequal instalments starting from March 2018 and ending to September 2038.
34,158 35,767
iii) The rupee term loan facility from banks carry interest rate at bank's 1Y MCLR + 1.17% is repayable in 30 structured quarterly instalments beginning March 31, 2020 and ending to September 2027.
5,972 6,116
iv) Term loan carries an interest rate of MCLR/LIBOR + spread ranging from 0.75% p.a. to 3.55% p.a. and repayable in unequal quarterly instalments ending on September 2027 (including FCNR loans ` 8,689 million).
26,889 28,046
v) The rupee term loan facility from banks carry interest rate at bank's 3M/1Y MCLR + spread ranging from zero to 0.70% is repayable in structured quarterly instalments ending to December 2027.
4,429 -
vi) Non-convertible debentures carry fixed interest of 8% p.a. is repayable in a single bullet in December 2025. 2,568 -
vii) Non-convertible debentures carry fixed interest of 9.50% p.a. is repayable in a single bullet in July 2021. 23,980 23,920
Total 105,853 106,710
20 Other financial liabilities (Non-Current) (` in million)
Particulars As atMarch 31, 2021
As atMarch 31, 2020
Security deposits 193 76Lease liabilities (refer note 39) 42,665 43,767Derivative Liabilities 2,798 5,941Other liabilities - 2,568Advances received from customers (refer note 44) 69,702 108,054
Total 115,358 160,406
104 105
CORPORATE OVERVIEW BOARD’S REPORT FINANCIAL STATEMENTSANNUAL REPORT 2020-21NAYARA ENERGY LIMITED
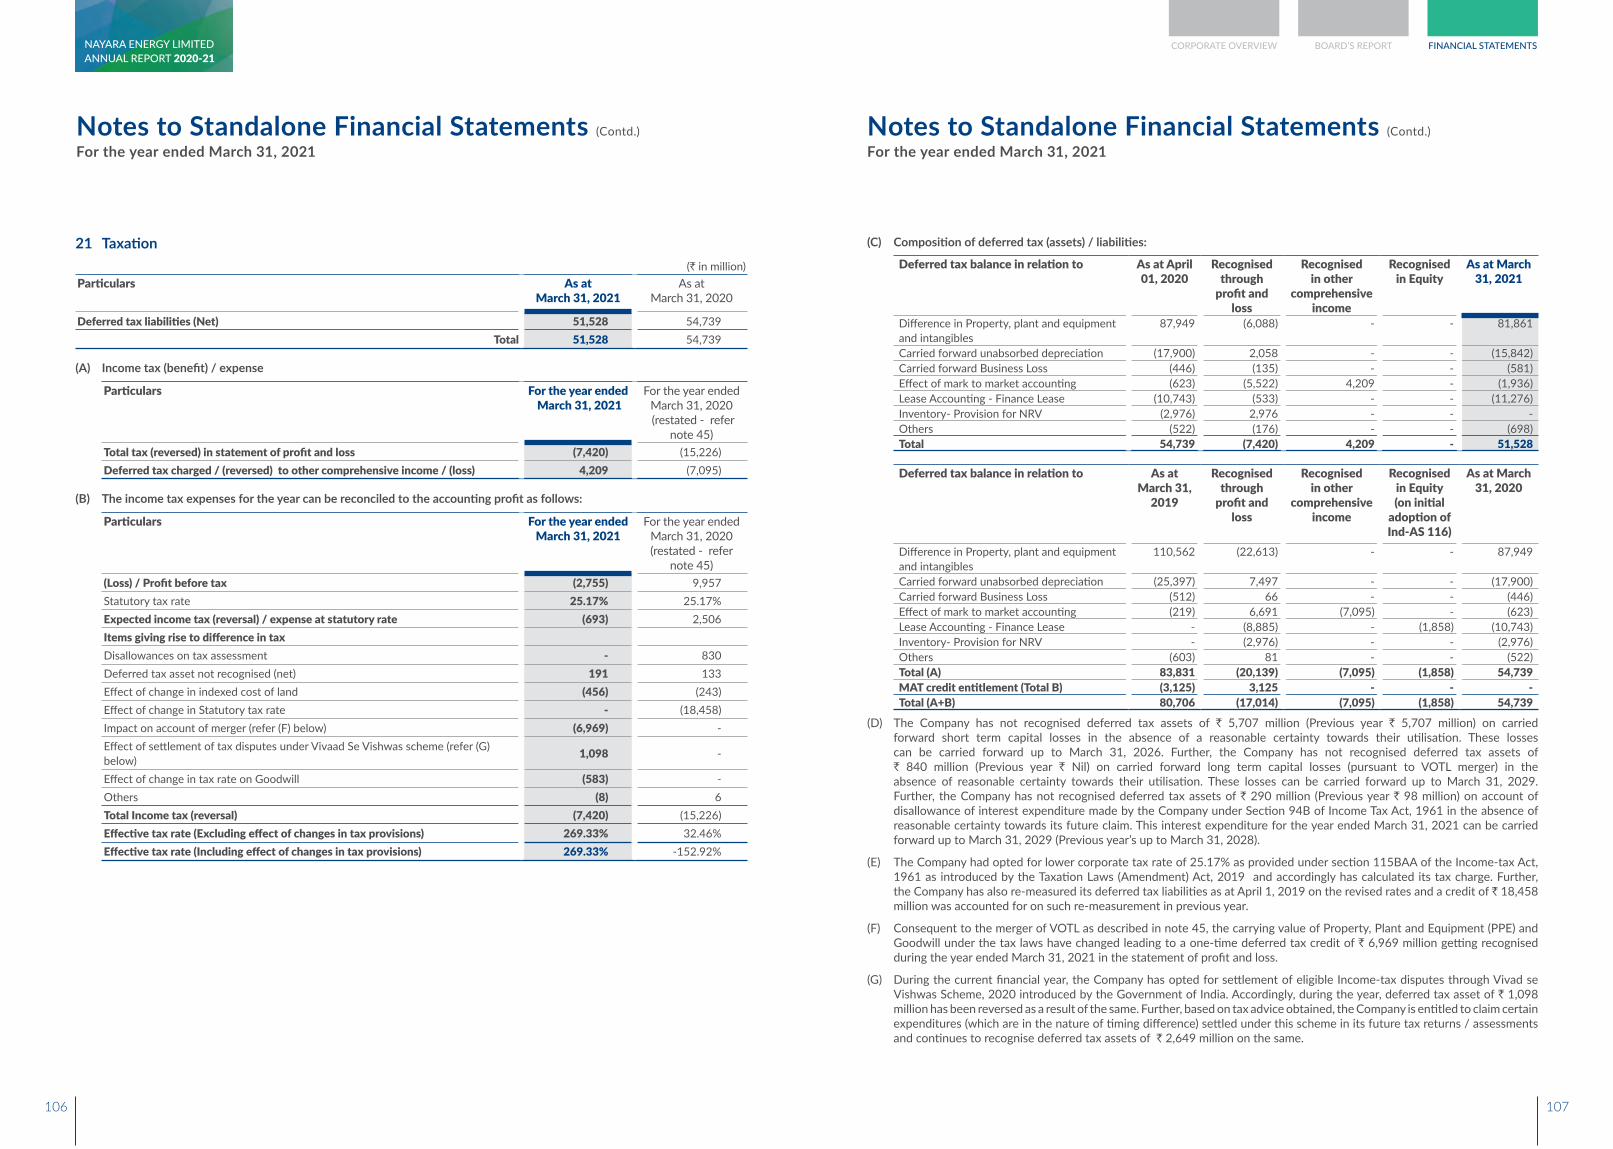
Notes to Standalone Financial Statements (Contd.)
For the year ended March 31, 2021Notes to Standalone Financial Statements (Contd.)
For the year ended March 31, 2021
21 Taxation(` in million)
Particulars As atMarch 31, 2021
As atMarch 31, 2020
Deferred tax liabilities (Net) 51,528 54,739 Total 51,528 54,739
(A) Income tax (benefit) / expense
Particulars For the year ended March 31, 2021
For the year ended March 31, 2020 (restated - refer
note 45)Total tax (reversed) in statement of profit and loss (7,420) (15,226)Deferred tax charged / (reversed) to other comprehensive income / (loss) 4,209 (7,095)
(B) The income tax expenses for the year can be reconciled to the accounting profit as follows:
Particulars For the year ended March 31, 2021
For the year ended March 31, 2020 (restated - refer
note 45)(Loss) / Profit before tax (2,755) 9,957Statutory tax rate 25.17% 25.17%Expected income tax (reversal) / expense at statutory rate (693) 2,506Items giving rise to difference in taxDisallowances on tax assessment - 830Deferred tax asset not recognised (net) 191 133Effect of change in indexed cost of land (456) (243)Effect of change in Statutory tax rate - (18,458)Impact on account of merger (refer (F) below) (6,969) -Effect of settlement of tax disputes under Vivaad Se Vishwas scheme (refer (G) below) 1,098 -
Effect of change in tax rate on Goodwill (583) -Others (8) 6Total Income tax (reversal) (7,420) (15,226)Effective tax rate (Excluding effect of changes in tax provisions) 269.33% 32.46%Effective tax rate (Including effect of changes in tax provisions) 269.33% -152.92%
(C) Composition of deferred tax (assets) / liabilities:
Deferred tax balance in relation to As at April 01, 2020
Recognised through
profit and loss
Recognised in other
comprehensive income
Recognised in Equity
As at March 31, 2021
Difference in Property, plant and equipment and intangibles
87,949 (6,088) - - 81,861
Carried forward unabsorbed depreciation (17,900) 2,058 - - (15,842)Carried forward Business Loss (446) (135) - - (581)Effect of mark to market accounting (623) (5,522) 4,209 - (1,936)Lease Accounting - Finance Lease (10,743) (533) - - (11,276)Inventory- Provision for NRV (2,976) 2,976 - - -Others (522) (176) - - (698)Total 54,739 (7,420) 4,209 - 51,528
Deferred tax balance in relation to As at March 31,
2019
Recognised through
profit and loss
Recognised in other
comprehensive income
Recognised in Equity (on initial
adoption of Ind-AS 116)
As at March 31, 2020
Difference in Property, plant and equipment and intangibles
110,562 (22,613) - - 87,949
Carried forward unabsorbed depreciation (25,397) 7,497 - - (17,900)Carried forward Business Loss (512) 66 - - (446)Effect of mark to market accounting (219) 6,691 (7,095) - (623)Lease Accounting - Finance Lease - (8,885) - (1,858) (10,743)Inventory- Provision for NRV - (2,976) - - (2,976)Others (603) 81 - - (522)Total (A) 83,831 (20,139) (7,095) (1,858) 54,739MAT credit entitlement (Total B) (3,125) 3,125 - - -Total (A+B) 80,706 (17,014) (7,095) (1,858) 54,739
(D) The Company has not recognised deferred tax assets of ` 5,707 million (Previous year ` 5,707 million) on carried forward short term capital losses in the absence of a reasonable certainty towards their utilisation. These losses can be carried forward up to March 31, 2026. Further, the Company has not recognised deferred tax assets of ` 840 million (Previous year ` Nil) on carried forward long term capital losses (pursuant to VOTL merger) in the absence of reasonable certainty towards their utilisation. These losses can be carried forward up to March 31, 2029. Further, the Company has not recognised deferred tax assets of ` 290 million (Previous year ` 98 million) on account of disallowance of interest expenditure made by the Company under Section 94B of Income Tax Act, 1961 in the absence of reasonable certainty towards its future claim. This interest expenditure for the year ended March 31, 2021 can be carried forward up to March 31, 2029 (Previous year’s up to March 31, 2028).
(E) The Company had opted for lower corporate tax rate of 25.17% as provided under section 115BAA of the Income-tax Act, 1961 as introduced by the Taxation Laws (Amendment) Act, 2019 and accordingly has calculated its tax charge. Further, the Company has also re-measured its deferred tax liabilities as at April 1, 2019 on the revised rates and a credit of ` 18,458 million was accounted for on such re-measurement in previous year.
(F) Consequent to the merger of VOTL as described in note 45, the carrying value of Property, Plant and Equipment (PPE) and Goodwill under the tax laws have changed leading to a one-time deferred tax credit of ` 6,969 million getting recognised during the year ended March 31, 2021 in the statement of profit and loss.
(G) During the current financial year, the Company has opted for settlement of eligible Income-tax disputes through Vivad se Vishwas Scheme, 2020 introduced by the Government of India. Accordingly, during the year, deferred tax asset of ` 1,098 million has been reversed as a result of the same. Further, based on tax advice obtained, the Company is entitled to claim certain expenditures (which are in the nature of timing difference) settled under this scheme in its future tax returns / assessments and continues to recognise deferred tax assets of ` 2,649 million on the same.
106 107
CORPORATE OVERVIEW BOARD’S REPORT FINANCIAL STATEMENTSANNUAL REPORT 2020-21NAYARA ENERGY LIMITED
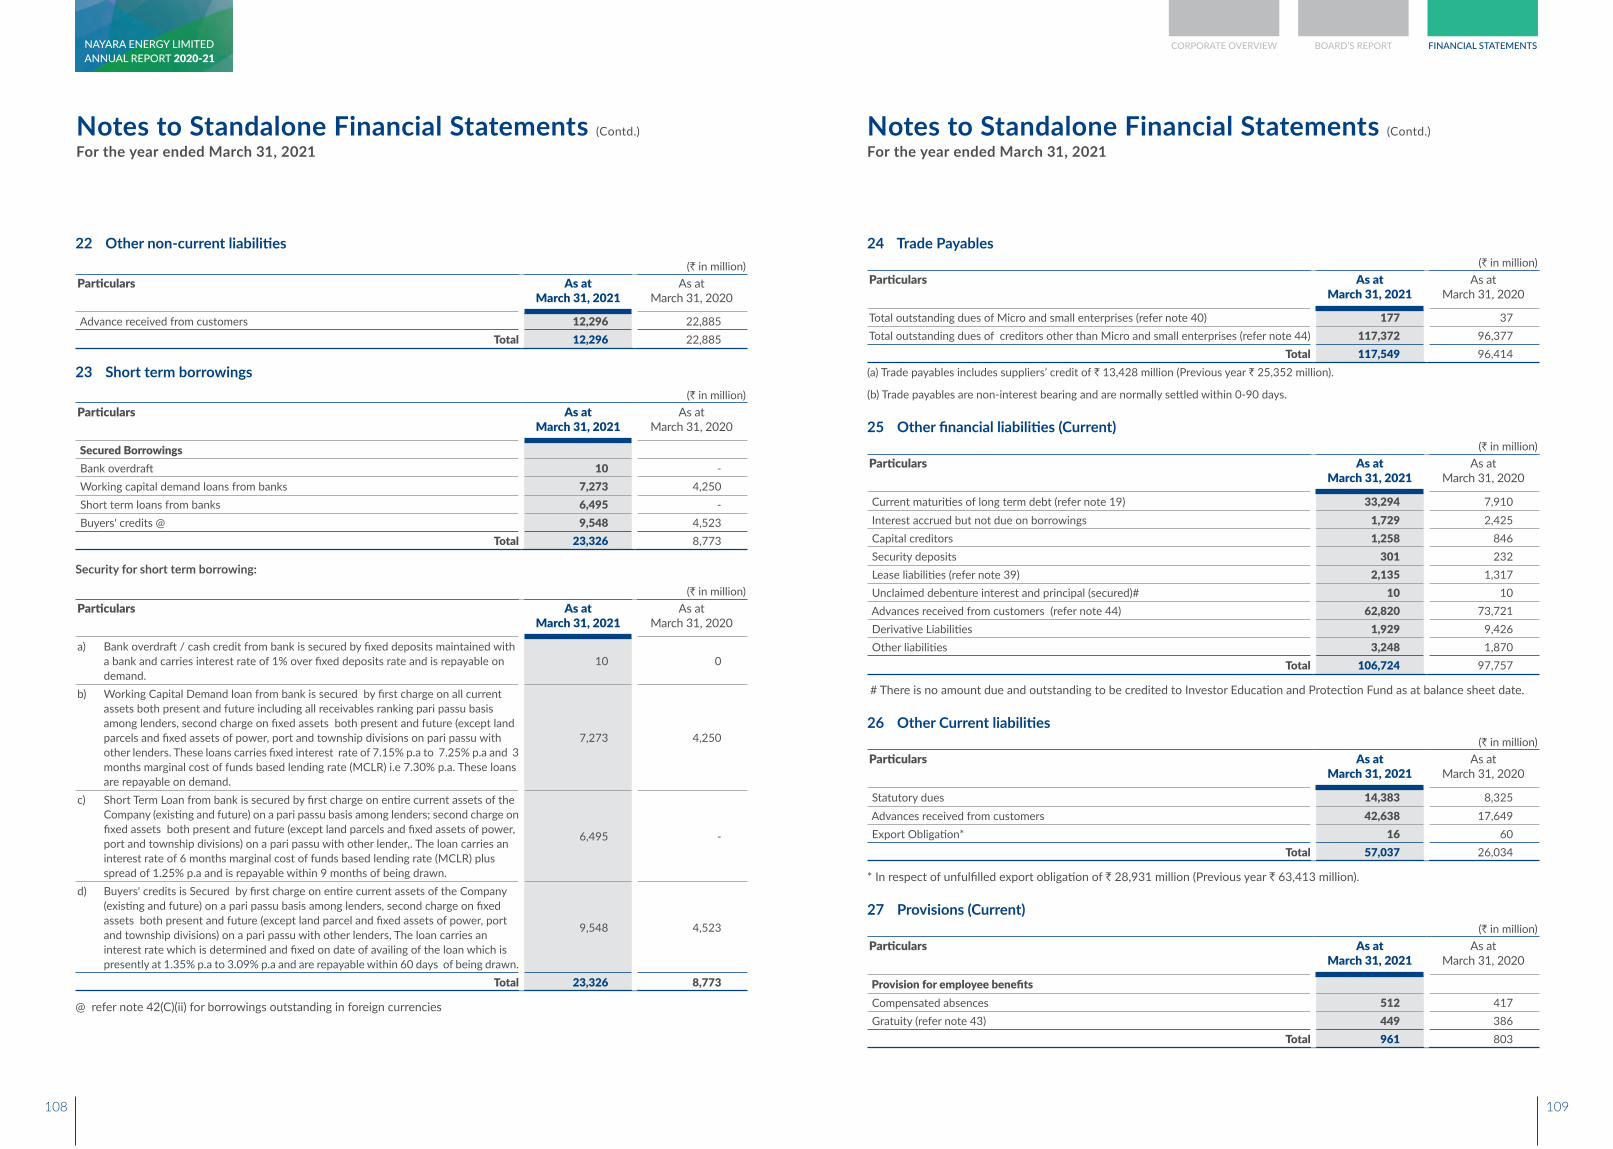
Notes to Standalone Financial Statements (Contd.)
For the year ended March 31, 2021Notes to Standalone Financial Statements (Contd.)
For the year ended March 31, 2021
22 Other non-current liabilities (` in million)
Particulars As atMarch 31, 2021
As atMarch 31, 2020
Advance received from customers 12,296 22,885 Total 12,296 22,885
23 Short term borrowings (` in million)
Particulars As atMarch 31, 2021
As atMarch 31, 2020
Secured Borrowings Bank overdraft 10 - Working capital demand loans from banks 7,273 4,250 Short term loans from banks 6,495 - Buyers' credits @ 9,548 4,523
Total 23,326 8,773
Security for short term borrowing:
(` in million)Particulars As at
March 31, 2021As at
March 31, 2020
a) Bank overdraft / cash credit from bank is secured by fixed deposits maintained with a bank and carries interest rate of 1% over fixed deposits rate and is repayable on demand.
10 0
b) Working Capital Demand loan from bank is secured by first charge on all current assets both present and future including all receivables ranking pari passu basis among lenders, second charge on fixed assets both present and future (except land parcels and fixed assets of power, port and township divisions on pari passu with other lenders. These loans carries fixed interest rate of 7.15% p.a to 7.25% p.a and 3 months marginal cost of funds based lending rate (MCLR) i.e 7.30% p.a. These loans are repayable on demand.
7,273 4,250
c) Short Term Loan from bank is secured by first charge on entire current assets of the Company (existing and future) on a pari passu basis among lenders; second charge on fixed assets both present and future (except land parcels and fixed assets of power, port and township divisions) on a pari passu with other lender,. The loan carries an interest rate of 6 months marginal cost of funds based lending rate (MCLR) plus spread of 1.25% p.a and is repayable within 9 months of being drawn.
6,495 -
d) Buyers' credits is Secured by first charge on entire current assets of the Company (existing and future) on a pari passu basis among lenders, second charge on fixed assets both present and future (except land parcel and fixed assets of power, port and township divisions) on a pari passu with other lenders, The loan carries an interest rate which is determined and fixed on date of availing of the loan which is presently at 1.35% p.a to 3.09% p.a and are repayable within 60 days of being drawn.
9,548 4,523
Total 23,326 8,773
@ refer note 42(C)(ii) for borrowings outstanding in foreign currencies
24 Trade Payables (` in million)
Particulars As atMarch 31, 2021
As atMarch 31, 2020
Total outstanding dues of Micro and small enterprises (refer note 40) 177 37 Total outstanding dues of creditors other than Micro and small enterprises (refer note 44) 117,372 96,377
Total 117,549 96,414 (a) Trade payables includes suppliers’ credit of ` 13,428 million (Previous year ` 25,352 million).
(b) Trade payables are non-interest bearing and are normally settled within 0-90 days.
25 Other financial liabilities (Current) (` in million)
Particulars As atMarch 31, 2021
As atMarch 31, 2020
Current maturities of long term debt (refer note 19) 33,294 7,910 Interest accrued but not due on borrowings 1,729 2,425 Capital creditors 1,258 846 Security deposits 301 232 Lease liabilities (refer note 39) 2,135 1,317 Unclaimed debenture interest and principal (secured)# 10 10 Advances received from customers (refer note 44) 62,820 73,721 Derivative Liabilities 1,929 9,426 Other liabilities 3,248 1,870
Total 106,724 97,757
# There is no amount due and outstanding to be credited to Investor Education and Protection Fund as at balance sheet date.
26 Other Current liabilities (` in million)
Particulars As atMarch 31, 2021
As atMarch 31, 2020
Statutory dues 14,383 8,325 Advances received from customers 42,638 17,649 Export Obligation* 16 60
Total 57,037 26,034
* In respect of unfulfilled export obligation of ` 28,931 million (Previous year ` 63,413 million).
27 Provisions (Current) (` in million)
Particulars As atMarch 31, 2021
As atMarch 31, 2020
Provision for employee benefits Compensated absences 512 417 Gratuity (refer note 43) 449 386
Total 961 803
108 109
CORPORATE OVERVIEW BOARD’S REPORT FINANCIAL STATEMENTSANNUAL REPORT 2020-21NAYARA ENERGY LIMITED
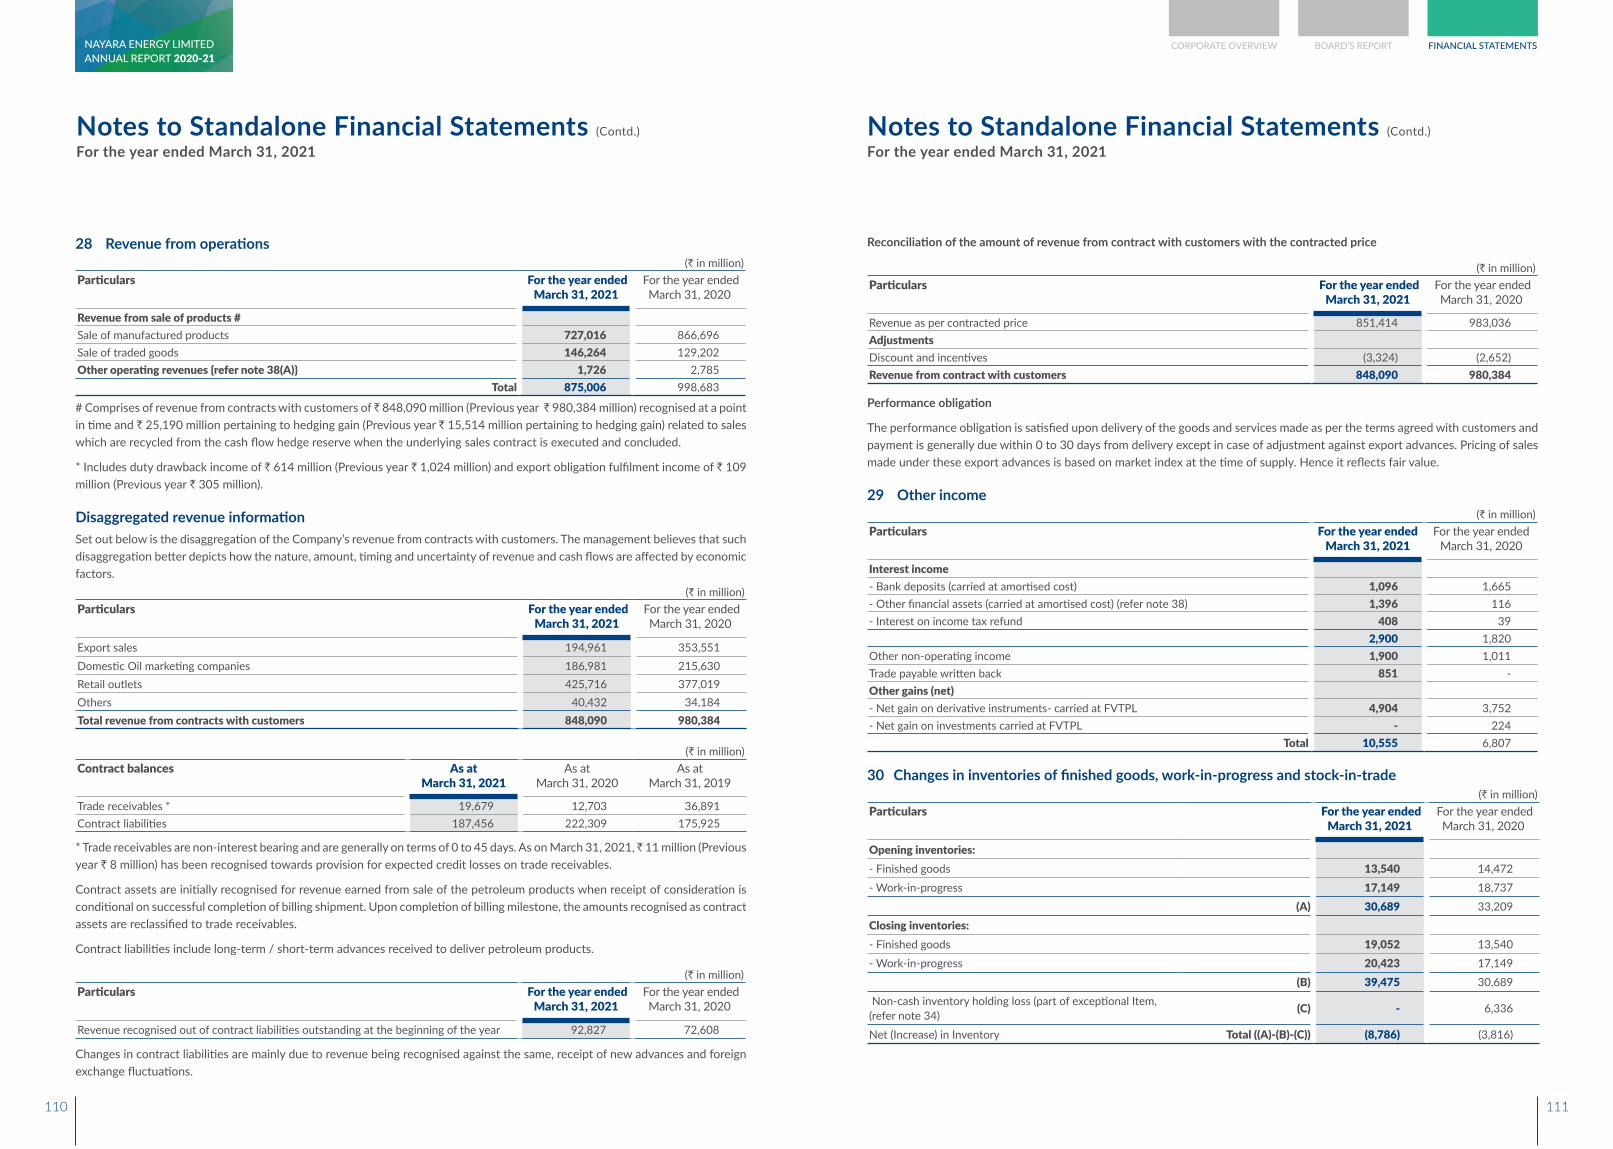
Notes to Standalone Financial Statements (Contd.)
For the year ended March 31, 2021Notes to Standalone Financial Statements (Contd.)
For the year ended March 31, 2021
28 Revenue from operations (` in million)
Particulars For the year ended March 31, 2021
For the year ended March 31, 2020
Revenue from sale of products #Sale of manufactured products 727,016 866,696 Sale of traded goods 146,264 129,202 Other operating revenues {refer note 38(A)} 1,726 2,785
Total 875,006 998,683
# Comprises of revenue from contracts with customers of ̀ 848,090 million (Previous year ̀ 980,384 million) recognised at a point in time and ` 25,190 million pertaining to hedging gain (Previous year ` 15,514 million pertaining to hedging gain) related to sales which are recycled from the cash flow hedge reserve when the underlying sales contract is executed and concluded.
* Includes duty drawback income of ` 614 million (Previous year ` 1,024 million) and export obligation fulfilment income of ` 109 million (Previous year ` 305 million).
Disaggregated revenue information Set out below is the disaggregation of the Company’s revenue from contracts with customers. The management believes that such disaggregation better depicts how the nature, amount, timing and uncertainty of revenue and cash flows are affected by economic factors.
(` in million)Particulars For the year ended
March 31, 2021 For the year ended
March 31, 2020
Export sales 194,961 353,551 Domestic Oil marketing companies 186,981 215,630 Retail outlets 425,716 377,019 Others 40,432 34,184 Total revenue from contracts with customers 848,090 980,384
(` in million)Contract balances As at
March 31, 2021As at
March 31, 2020As at
March 31, 2019
Trade receivables * 19,679 12,703 36,891 Contract liabilities 187,456 222,309 175,925
* Trade receivables are non-interest bearing and are generally on terms of 0 to 45 days. As on March 31, 2021, ̀ 11 million (Previous year ` 8 million) has been recognised towards provision for expected credit losses on trade receivables.
Contract assets are initially recognised for revenue earned from sale of the petroleum products when receipt of consideration is conditional on successful completion of billing shipment. Upon completion of billing milestone, the amounts recognised as contract assets are reclassified to trade receivables.
Contract liabilities include long-term / short-term advances received to deliver petroleum products.
(` in million)Particulars For the year ended
March 31, 2021 For the year ended
March 31, 2020
Revenue recognised out of contract liabilities outstanding at the beginning of the year 92,827 72,608
Changes in contract liabilities are mainly due to revenue being recognised against the same, receipt of new advances and foreign exchange fluctuations.
Reconciliation of the amount of revenue from contract with customers with the contracted price
(` in million)Particulars For the year ended
March 31, 2021 For the year ended
March 31, 2020
Revenue as per contracted price 851,414 983,036 AdjustmentsDiscount and incentives (3,324) (2,652)Revenue from contract with customers 848,090 980,384
Performance obligation
The performance obligation is satisfied upon delivery of the goods and services made as per the terms agreed with customers and payment is generally due within 0 to 30 days from delivery except in case of adjustment against export advances. Pricing of sales made under these export advances is based on market index at the time of supply. Hence it reflects fair value.
29 Other income (` in million)
Particulars For the year ended March 31, 2021
For the year ended March 31, 2020
Interest income- Bank deposits (carried at amortised cost) 1,096 1,665- Other financial assets (carried at amortised cost) (refer note 38) 1,396 116- Interest on income tax refund 408 39
2,900 1,820Other non-operating income 1,900 1,011Trade payable written back 851 -Other gains (net)- Net gain on derivative instruments- carried at FVTPL 4,904 3,752- Net gain on investments carried at FVTPL - 224
Total 10,555 6,807
30 Changes in inventories of finished goods, work-in-progress and stock-in-trade (` in million)
Particulars For the year ended March 31, 2021
For the year ended March 31, 2020
Opening inventories: - Finished goods 13,540 14,472 - Work-in-progress 17,149 18,737
(A) 30,689 33,209 Closing inventories: - Finished goods 19,052 13,540 - Work-in-progress 20,423 17,149
(B) 39,475 30,689 Non-cash inventory holding loss (part of exceptional Item, (refer note 34) (C) - 6,336
Net (Increase) in Inventory Total ((A)-(B)-(C)) (8,786) (3,816)
110 111
CORPORATE OVERVIEW BOARD’S REPORT FINANCIAL STATEMENTSANNUAL REPORT 2020-21NAYARA ENERGY LIMITED
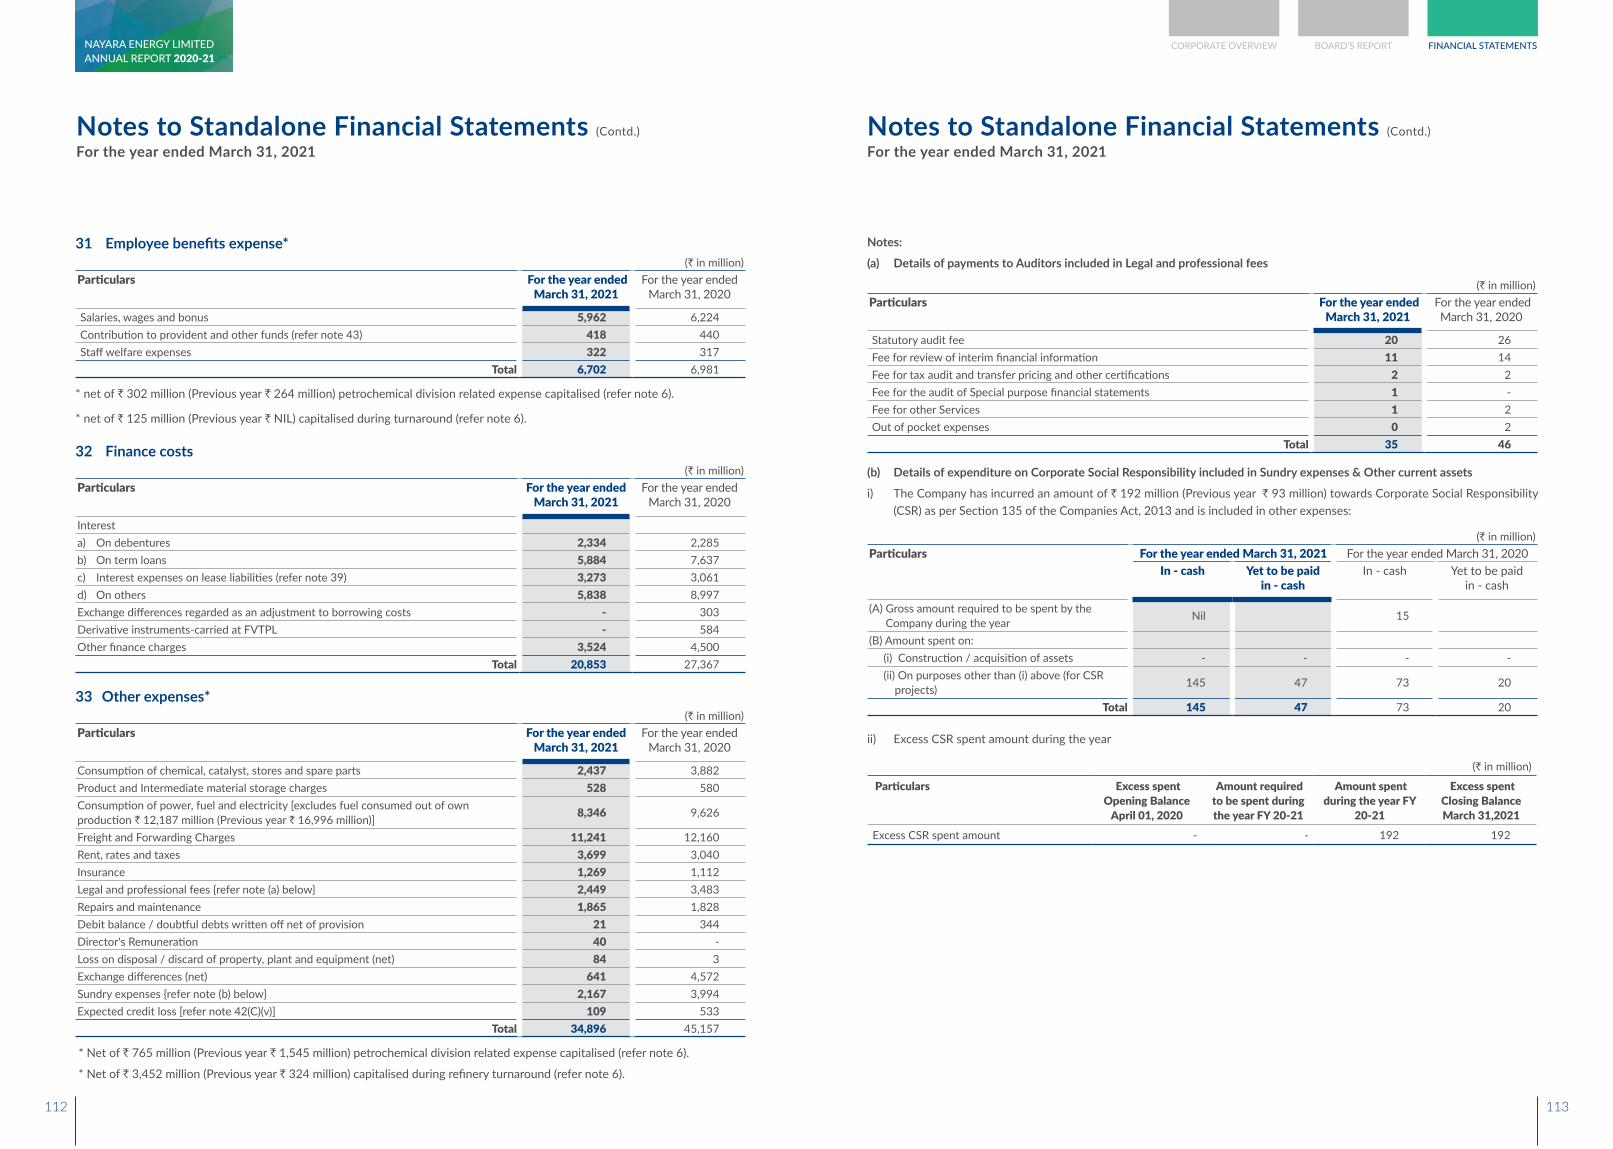
Notes to Standalone Financial Statements (Contd.)
For the year ended March 31, 2021Notes to Standalone Financial Statements (Contd.)
For the year ended March 31, 2021
31 Employee benefits expense* (` in million)
Particulars For the year ended March 31, 2021
For the year ended March 31, 2020
Salaries, wages and bonus 5,962 6,224 Contribution to provident and other funds (refer note 43) 418 440 Staff welfare expenses 322 317
Total 6,702 6,981
* net of ` 302 million (Previous year ` 264 million) petrochemical division related expense capitalised (refer note 6).
* net of ` 125 million (Previous year ` NIL) capitalised during turnaround (refer note 6).
32 Finance costs (` in million)
Particulars For the year ended March 31, 2021
For the year ended March 31, 2020
Interesta) On debentures 2,334 2,285b) On term loans 5,884 7,637c) Interest expenses on lease liabilities (refer note 39) 3,273 3,061d) On others 5,838 8,997Exchange differences regarded as an adjustment to borrowing costs - 303Derivative instruments-carried at FVTPL - 584Other finance charges 3,524 4,500
Total 20,853 27,367
33 Other expenses* (` in million)
Particulars For the year ended March 31, 2021
For the year ended March 31, 2020
Consumption of chemical, catalyst, stores and spare parts 2,437 3,882Product and Intermediate material storage charges 528 580Consumption of power, fuel and electricity [excludes fuel consumed out of own production ` 12,187 million (Previous year ` 16,996 million)] 8,346 9,626
Freight and Forwarding Charges 11,241 12,160Rent, rates and taxes 3,699 3,040Insurance 1,269 1,112Legal and professional fees {refer note (a) below} 2,449 3,483Repairs and maintenance 1,865 1,828Debit balance / doubtful debts written off net of provision 21 344Director's Remuneration 40 -Loss on disposal / discard of property, plant and equipment (net) 84 3Exchange differences (net) 641 4,572Sundry expenses {refer note (b) below} 2,167 3,994Expected credit loss [refer note 42(C)(v)] 109 533
Total 34,896 45,157
* Net of ` 765 million (Previous year ` 1,545 million) petrochemical division related expense capitalised (refer note 6).
* Net of ` 3,452 million (Previous year ` 324 million) capitalised during refinery turnaround (refer note 6).
Notes:
(a) Details of payments to Auditors included in Legal and professional fees
(` in million)Particulars For the year ended
March 31, 2021 For the year ended
March 31, 2020
Statutory audit fee 20 26 Fee for review of interim financial information 11 14 Fee for tax audit and transfer pricing and other certifications 2 2 Fee for the audit of Special purpose financial statements 1 - Fee for other Services 1 2 Out of pocket expenses 0 2
Total 35 46
(b) Details of expenditure on Corporate Social Responsibility included in Sundry expenses & Other current assets
i) The Company has incurred an amount of ` 192 million (Previous year ` 93 million) towards Corporate Social Responsibility (CSR) as per Section 135 of the Companies Act, 2013 and is included in other expenses:
(` in million)Particulars For the year ended March 31, 2021 For the year ended March 31, 2020
In - cash Yet to be paid in - cash
In - cash Yet to be paid in - cash
(A) Gross amount required to be spent by the Company during the year Nil 15
(B) Amount spent on: (i) Construction / acquisition of assets - - - - (ii) On purposes other than (i) above (for CSR
projects) 145 47 73 20
Total 145 47 73 20
ii) Excess CSR spent amount during the year
(` in million)
Particulars Excess spent Opening Balance
April 01, 2020
Amount required to be spent during the year FY 20-21
Amount spent during the year FY
20-21
Excess spent Closing Balance March 31,2021
Excess CSR spent amount - - 192 192
112 113
CORPORATE OVERVIEW BOARD’S REPORT FINANCIAL STATEMENTSANNUAL REPORT 2020-21NAYARA ENERGY LIMITED
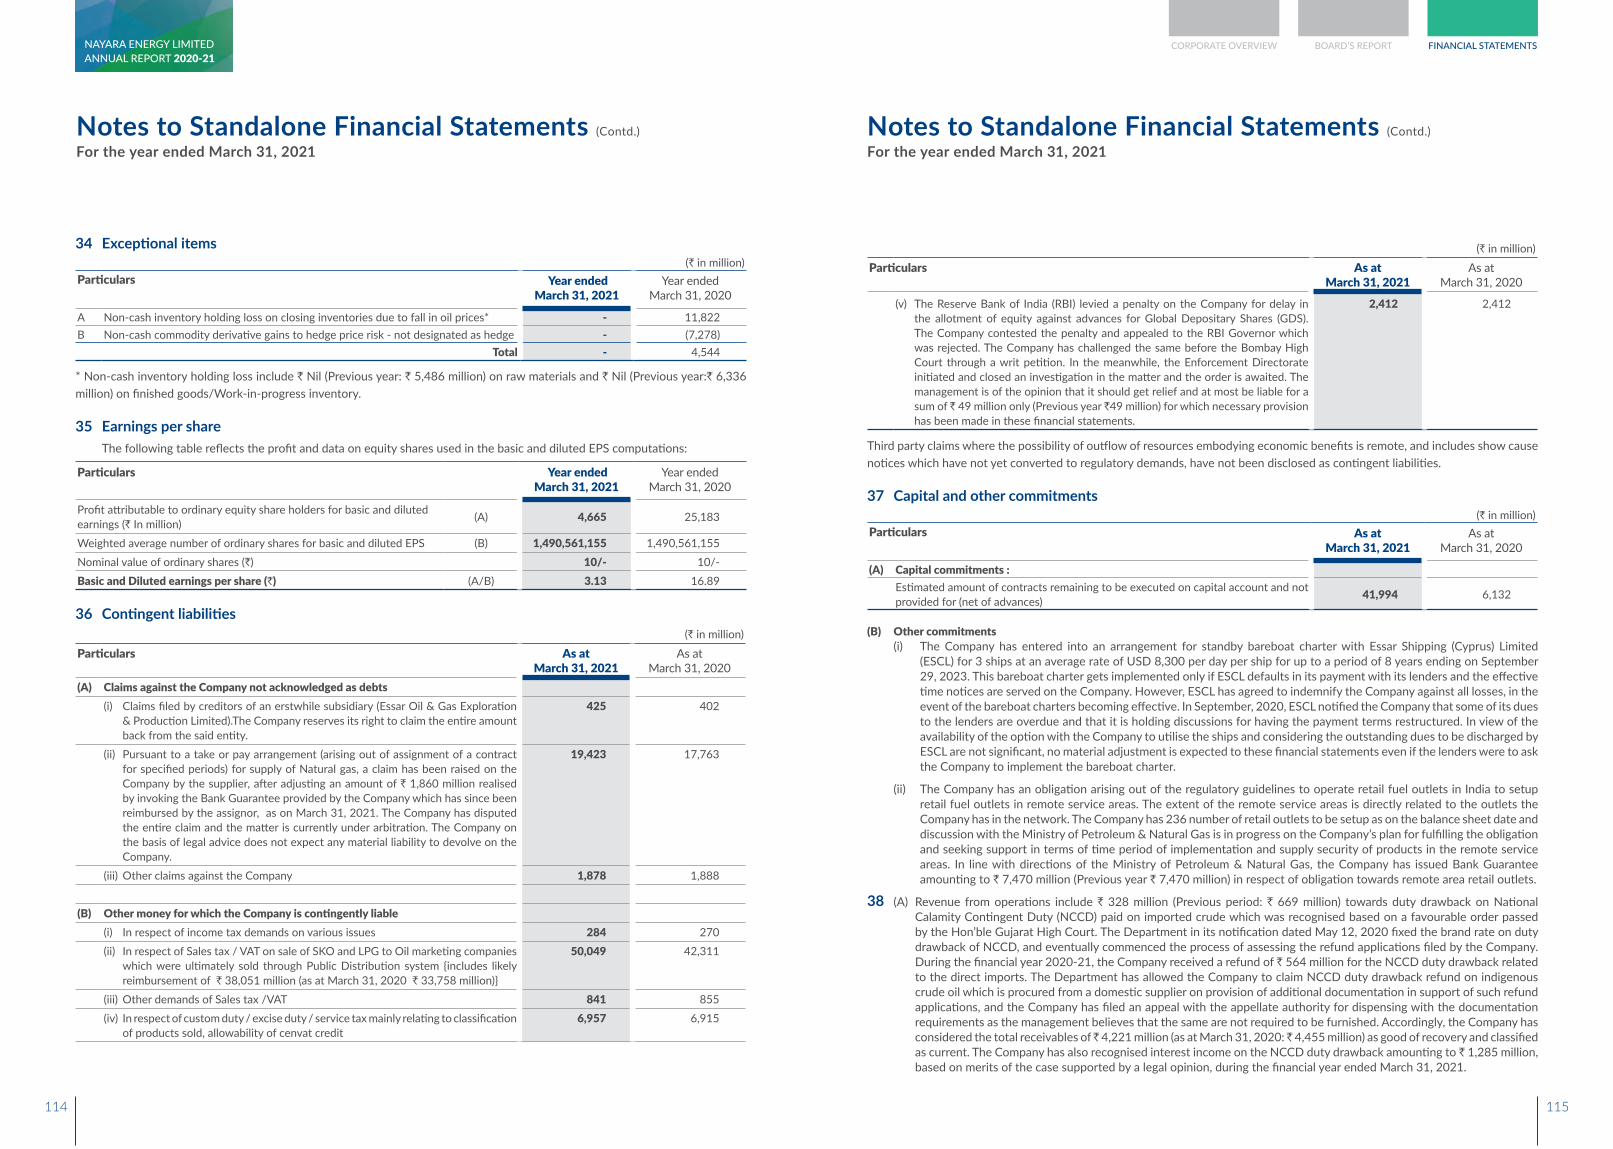
Notes to Standalone Financial Statements (Contd.)
For the year ended March 31, 2021Notes to Standalone Financial Statements (Contd.)
For the year ended March 31, 2021
34 Exceptional items(` in million)
Particulars Year ended March 31, 2021
Year ended March 31, 2020
A Non-cash inventory holding loss on closing inventories due to fall in oil prices* - 11,822 B Non-cash commodity derivative gains to hedge price risk - not designated as hedge - (7,278)
Total - 4,544
* Non-cash inventory holding loss include ` Nil (Previous year: ` 5,486 million) on raw materials and ` Nil (Previous year:` 6,336 million) on finished goods/Work-in-progress inventory.
35 Earnings per share The following table reflects the profit and data on equity shares used in the basic and diluted EPS computations:
Particulars Year ended March 31, 2021
Year ended March 31, 2020
Profit attributable to ordinary equity share holders for basic and diluted earnings (` In million) (A) 4,665 25,183
Weighted average number of ordinary shares for basic and diluted EPS (B) 1,490,561,155 1,490,561,155 Nominal value of ordinary shares (`) 10/- 10/- Basic and Diluted earnings per share (`) (A/B) 3.13 16.89
36 Contingent liabilities(` in million)
Particulars As at March 31, 2021
As at March 31, 2020
(A) Claims against the Company not acknowledged as debts(i) Claims filed by creditors of an erstwhile subsidiary (Essar Oil & Gas Exploration
& Production Limited).The Company reserves its right to claim the entire amount back from the said entity.
425 402
(ii) Pursuant to a take or pay arrangement (arising out of assignment of a contract for specified periods) for supply of Natural gas, a claim has been raised on the Company by the supplier, after adjusting an amount of ` 1,860 million realised by invoking the Bank Guarantee provided by the Company which has since been reimbursed by the assignor, as on March 31, 2021. The Company has disputed the entire claim and the matter is currently under arbitration. The Company on the basis of legal advice does not expect any material liability to devolve on the Company.
19,423 17,763
(iii) Other claims against the Company 1,878 1,888
(B) Other money for which the Company is contingently liable(i) In respect of income tax demands on various issues 284 270(ii) In respect of Sales tax / VAT on sale of SKO and LPG to Oil marketing companies
which were ultimately sold through Public Distribution system {includes likely reimbursement of ` 38,051 million (as at March 31, 2020 ` 33,758 million)}
50,049 42,311
(iii) Other demands of Sales tax /VAT 841 855(iv) In respect of custom duty / excise duty / service tax mainly relating to classification
of products sold, allowability of cenvat credit6,957 6,915
(` in million)
Particulars As at March 31, 2021
As at March 31, 2020
(v) The Reserve Bank of India (RBI) levied a penalty on the Company for delay in the allotment of equity against advances for Global Depositary Shares (GDS). The Company contested the penalty and appealed to the RBI Governor which was rejected. The Company has challenged the same before the Bombay High Court through a writ petition. In the meanwhile, the Enforcement Directorate initiated and closed an investigation in the matter and the order is awaited. The management is of the opinion that it should get relief and at most be liable for a sum of ` 49 million only (Previous year `49 million) for which necessary provision has been made in these financial statements.
2,412 2,412
Third party claims where the possibility of outflow of resources embodying economic benefits is remote, and includes show cause notices which have not yet converted to regulatory demands, have not been disclosed as contingent liabilities.
37 Capital and other commitments(` in million)
Particulars As at March 31, 2021
As at March 31, 2020
(A) Capital commitments :Estimated amount of contracts remaining to be executed on capital account and not provided for (net of advances) 41,994 6,132
(B) Other commitments (i) The Company has entered into an arrangement for standby bareboat charter with Essar Shipping (Cyprus) Limited
(ESCL) for 3 ships at an average rate of USD 8,300 per day per ship for up to a period of 8 years ending on September 29, 2023. This bareboat charter gets implemented only if ESCL defaults in its payment with its lenders and the effective time notices are served on the Company. However, ESCL has agreed to indemnify the Company against all losses, in the event of the bareboat charters becoming effective. In September, 2020, ESCL notified the Company that some of its dues to the lenders are overdue and that it is holding discussions for having the payment terms restructured. In view of the availability of the option with the Company to utilise the ships and considering the outstanding dues to be discharged by ESCL are not significant, no material adjustment is expected to these financial statements even if the lenders were to ask the Company to implement the bareboat charter.
(ii) The Company has an obligation arising out of the regulatory guidelines to operate retail fuel outlets in India to setup retail fuel outlets in remote service areas. The extent of the remote service areas is directly related to the outlets the Company has in the network. The Company has 236 number of retail outlets to be setup as on the balance sheet date and discussion with the Ministry of Petroleum & Natural Gas is in progress on the Company’s plan for fulfilling the obligation and seeking support in terms of time period of implementation and supply security of products in the remote service areas. In line with directions of the Ministry of Petroleum & Natural Gas, the Company has issued Bank Guarantee amounting to ` 7,470 million (Previous year ` 7,470 million) in respect of obligation towards remote area retail outlets.
38 (A) Revenue from operations include ` 328 million (Previous period: ` 669 million) towards duty drawback on National Calamity Contingent Duty (NCCD) paid on imported crude which was recognised based on a favourable order passed by the Hon’ble Gujarat High Court. The Department in its notification dated May 12, 2020 fixed the brand rate on duty drawback of NCCD, and eventually commenced the process of assessing the refund applications filed by the Company. During the financial year 2020-21, the Company received a refund of ` 564 million for the NCCD duty drawback related to the direct imports. The Department has allowed the Company to claim NCCD duty drawback refund on indigenous crude oil which is procured from a domestic supplier on provision of additional documentation in support of such refund applications, and the Company has filed an appeal with the appellate authority for dispensing with the documentation requirements as the management believes that the same are not required to be furnished. Accordingly, the Company has considered the total receivables of ̀ 4,221 million (as at March 31, 2020: ̀ 4,455 million) as good of recovery and classified as current. The Company has also recognised interest income on the NCCD duty drawback amounting to ` 1,285 million, based on merits of the case supported by a legal opinion, during the financial year ended March 31, 2021.
114 115
CORPORATE OVERVIEW BOARD’S REPORT FINANCIAL STATEMENTSANNUAL REPORT 2020-21NAYARA ENERGY LIMITED
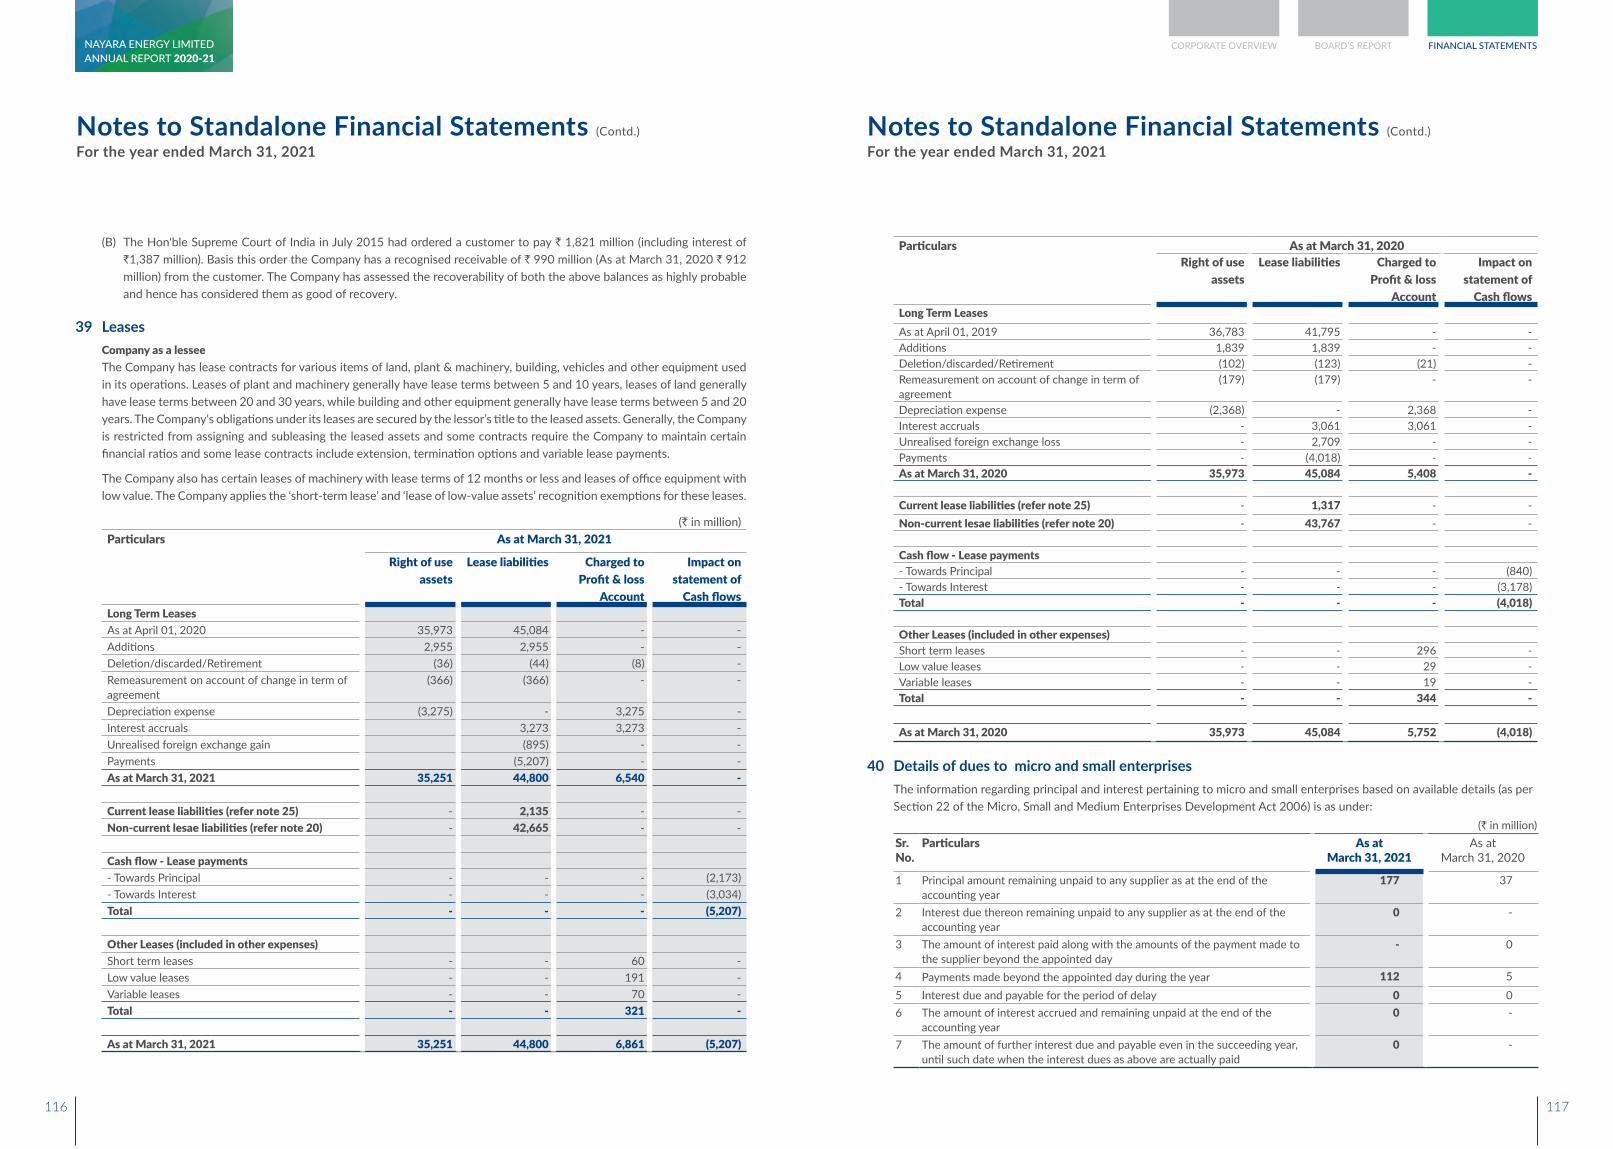
Notes to Standalone Financial Statements (Contd.)
For the year ended March 31, 2021Notes to Standalone Financial Statements (Contd.)
For the year ended March 31, 2021
(B) The Hon'ble Supreme Court of India in July 2015 had ordered a customer to pay ` 1,821 million (including interest of `1,387 million). Basis this order the Company has a recognised receivable of ` 990 million (As at March 31, 2020 ` 912 million) from the customer. The Company has assessed the recoverability of both the above balances as highly probable and hence has considered them as good of recovery.
39 Leases Company as a lessee The Company has lease contracts for various items of land, plant & machinery, building, vehicles and other equipment used
in its operations. Leases of plant and machinery generally have lease terms between 5 and 10 years, leases of land generally have lease terms between 20 and 30 years, while building and other equipment generally have lease terms between 5 and 20 years. The Company's obligations under its leases are secured by the lessor’s title to the leased assets. Generally, the Company is restricted from assigning and subleasing the leased assets and some contracts require the Company to maintain certain financial ratios and some lease contracts include extension, termination options and variable lease payments.
The Company also has certain leases of machinery with lease terms of 12 months or less and leases of office equipment with low value. The Company applies the ‘short-term lease’ and ‘lease of low-value assets’ recognition exemptions for these leases.
(` in million)Particulars As at March 31, 2021
Right of use assets
Lease liabilities Charged to Profit & loss
Account
Impact on statement of
Cash flows Long Term LeasesAs at April 01, 2020 35,973 45,084 - - Additions 2,955 2,955 - - Deletion/discarded/Retirement (36) (44) (8) - Remeasurement on account of change in term of agreement
(366) (366) - -
Depreciation expense (3,275) - 3,275 - Interest accruals 3,273 3,273 - Unrealised foreign exchange gain (895) - - Payments (5,207) - - As at March 31, 2021 35,251 44,800 6,540 -
Current lease liabilities (refer note 25) - 2,135 - - Non-current lesae liabilities (refer note 20) - 42,665 - -
Cash flow - Lease payments- Towards Principal - - - (2,173)- Towards Interest - - - (3,034)Total - - - (5,207)
Other Leases (included in other expenses)Short term leases - - 60 - Low value leases - - 191 - Variable leases - - 70 - Total - - 321 -
As at March 31, 2021 35,251 44,800 6,861 (5,207)
Particulars As at March 31, 2020Right of use
assetsLease liabilities Charged to
Profit & loss Account
Impact on statement of
Cash flows Long Term LeasesAs at April 01, 2019 36,783 41,795 - - Additions 1,839 1,839 - - Deletion/discarded/Retirement (102) (123) (21) - Remeasurement on account of change in term of agreement
(179) (179) - -
Depreciation expense (2,368) - 2,368 - Interest accruals - 3,061 3,061 - Unrealised foreign exchange loss - 2,709 - - Payments - (4,018) - - As at March 31, 2020 35,973 45,084 5,408 -
Current lease liabilities (refer note 25) - 1,317 - - Non-current lesae liabilities (refer note 20) - 43,767 - -
Cash flow - Lease payments- Towards Principal - - - (840)- Towards Interest - - - (3,178)Total - - - (4,018)
Other Leases (included in other expenses)Short term leases - - 296 - Low value leases - - 29 - Variable leases - - 19 - Total - - 344 -
As at March 31, 2020 35,973 45,084 5,752 (4,018)
40 Details of dues to micro and small enterprises The information regarding principal and interest pertaining to micro and small enterprises based on available details (as per
Section 22 of the Micro, Small and Medium Enterprises Development Act 2006) is as under:(` in million)
Sr. No.
Particulars As at March 31, 2021
As at March 31, 2020
1 Principal amount remaining unpaid to any supplier as at the end of the accounting year
177 37
2 Interest due thereon remaining unpaid to any supplier as at the end of the accounting year
0 -
3 The amount of interest paid along with the amounts of the payment made to the supplier beyond the appointed day
- 0
4 Payments made beyond the appointed day during the year 112 55 Interest due and payable for the period of delay 0 06 The amount of interest accrued and remaining unpaid at the end of the
accounting year0 -
7 The amount of further interest due and payable even in the succeeding year, until such date when the interest dues as above are actually paid
0 -
116 117
CORPORATE OVERVIEW BOARD’S REPORT FINANCIAL STATEMENTSANNUAL REPORT 2020-21NAYARA ENERGY LIMITED
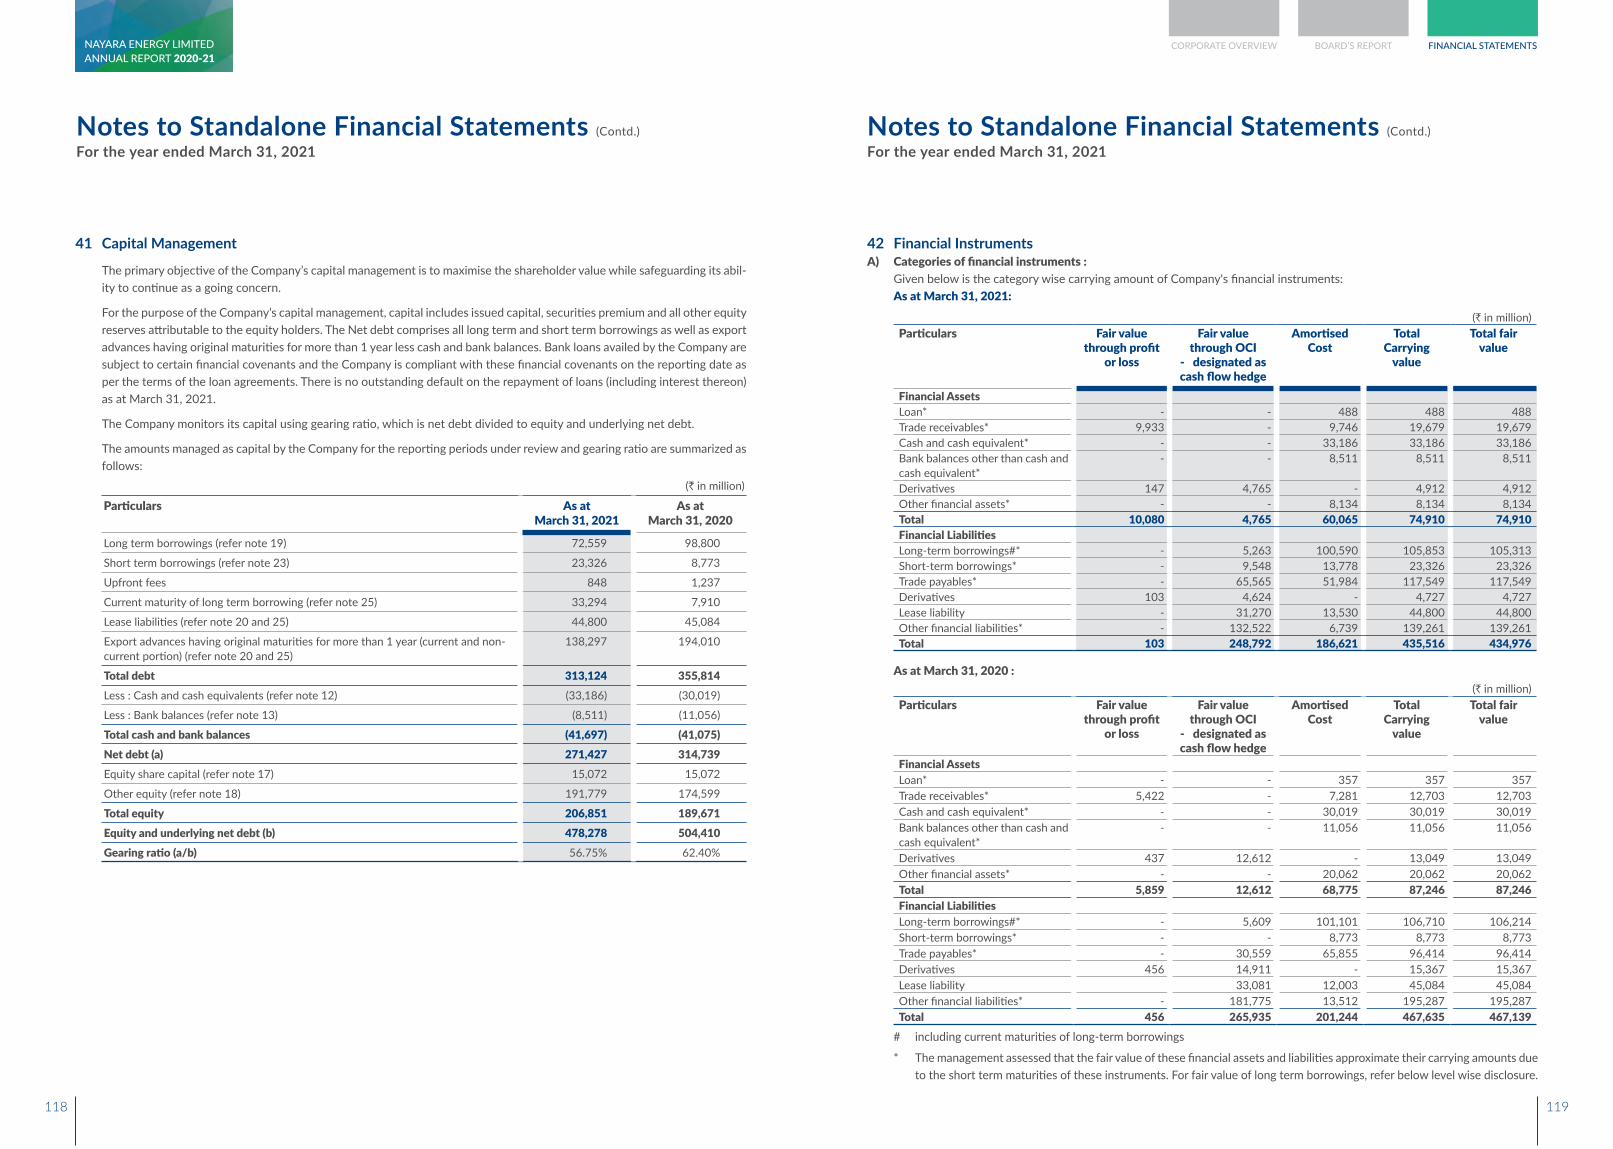
Notes to Standalone Financial Statements (Contd.)
For the year ended March 31, 2021Notes to Standalone Financial Statements (Contd.)
For the year ended March 31, 2021
41 Capital Management
The primary objective of the Company’s capital management is to maximise the shareholder value while safeguarding its abil-ity to continue as a going concern.
For the purpose of the Company’s capital management, capital includes issued capital, securities premium and all other equity reserves attributable to the equity holders. The Net debt comprises all long term and short term borrowings as well as export advances having original maturities for more than 1 year less cash and bank balances. Bank loans availed by the Company are subject to certain financial covenants and the Company is compliant with these financial covenants on the reporting date as per the terms of the loan agreements. There is no outstanding default on the repayment of loans (including interest thereon) as at March 31, 2021.
The Company monitors its capital using gearing ratio, which is net debt divided to equity and underlying net debt.
The amounts managed as capital by the Company for the reporting periods under review and gearing ratio are summarized as follows:
(` in million)
Particulars As at March 31, 2021
As at March 31, 2020
Long term borrowings (refer note 19) 72,559 98,800
Short term borrowings (refer note 23) 23,326 8,773
Upfront fees 848 1,237
Current maturity of long term borrowing (refer note 25) 33,294 7,910
Lease liabilities (refer note 20 and 25) 44,800 45,084
Export advances having original maturities for more than 1 year (current and non-current portion) (refer note 20 and 25)
138,297 194,010
Total debt 313,124 355,814 Less : Cash and cash equivalents (refer note 12) (33,186) (30,019)
Less : Bank balances (refer note 13) (8,511) (11,056)
Total cash and bank balances (41,697) (41,075)Net debt (a) 271,427 314,739 Equity share capital (refer note 17) 15,072 15,072
Other equity (refer note 18) 191,779 174,599
Total equity 206,851 189,671 Equity and underlying net debt (b) 478,278 504,410 Gearing ratio (a/b) 56.75% 62.40%
42 Financial InstrumentsA) Categories of financial instruments : Given below is the category wise carrying amount of Company's financial instruments: As at March 31, 2021:
(` in million)Particulars Fair value
through profit or loss
Fair value through OCI
- designated as cash flow hedge
Amortised Cost
Total Carrying
value
Total fair value
Financial AssetsLoan* - - 488 488 488 Trade receivables* 9,933 - 9,746 19,679 19,679 Cash and cash equivalent* - - 33,186 33,186 33,186 Bank balances other than cash and cash equivalent*
- - 8,511 8,511 8,511
Derivatives 147 4,765 - 4,912 4,912 Other financial assets* - - 8,134 8,134 8,134 Total 10,080 4,765 60,065 74,910 74,910 Financial LiabilitiesLong-term borrowings#* - 5,263 100,590 105,853 105,313 Short-term borrowings* - 9,548 13,778 23,326 23,326 Trade payables* - 65,565 51,984 117,549 117,549 Derivatives 103 4,624 - 4,727 4,727 Lease liability - 31,270 13,530 44,800 44,800 Other financial liabilities* - 132,522 6,739 139,261 139,261 Total 103 248,792 186,621 435,516 434,976
As at March 31, 2020 :(` in million)
Particulars Fair value through profit
or loss
Fair value through OCI
- designated as cash flow hedge
Amortised Cost
Total Carrying
value
Total fair value
Financial AssetsLoan* - - 357 357 357 Trade receivables* 5,422 - 7,281 12,703 12,703 Cash and cash equivalent* - - 30,019 30,019 30,019 Bank balances other than cash and cash equivalent*
- - 11,056 11,056 11,056
Derivatives 437 12,612 - 13,049 13,049 Other financial assets* - - 20,062 20,062 20,062 Total 5,859 12,612 68,775 87,246 87,246 Financial LiabilitiesLong-term borrowings#* - 5,609 101,101 106,710 106,214 Short-term borrowings* - - 8,773 8,773 8,773 Trade payables* - 30,559 65,855 96,414 96,414 Derivatives 456 14,911 - 15,367 15,367 Lease liability 33,081 12,003 45,084 45,084 Other financial liabilities* - 181,775 13,512 195,287 195,287 Total 456 265,935 201,244 467,635 467,139
# including current maturities of long-term borrowings
* The management assessed that the fair value of these financial assets and liabilities approximate their carrying amounts due to the short term maturities of these instruments. For fair value of long term borrowings, refer below level wise disclosure.
118 119
CORPORATE OVERVIEW BOARD’S REPORT FINANCIAL STATEMENTSANNUAL REPORT 2020-21NAYARA ENERGY LIMITED
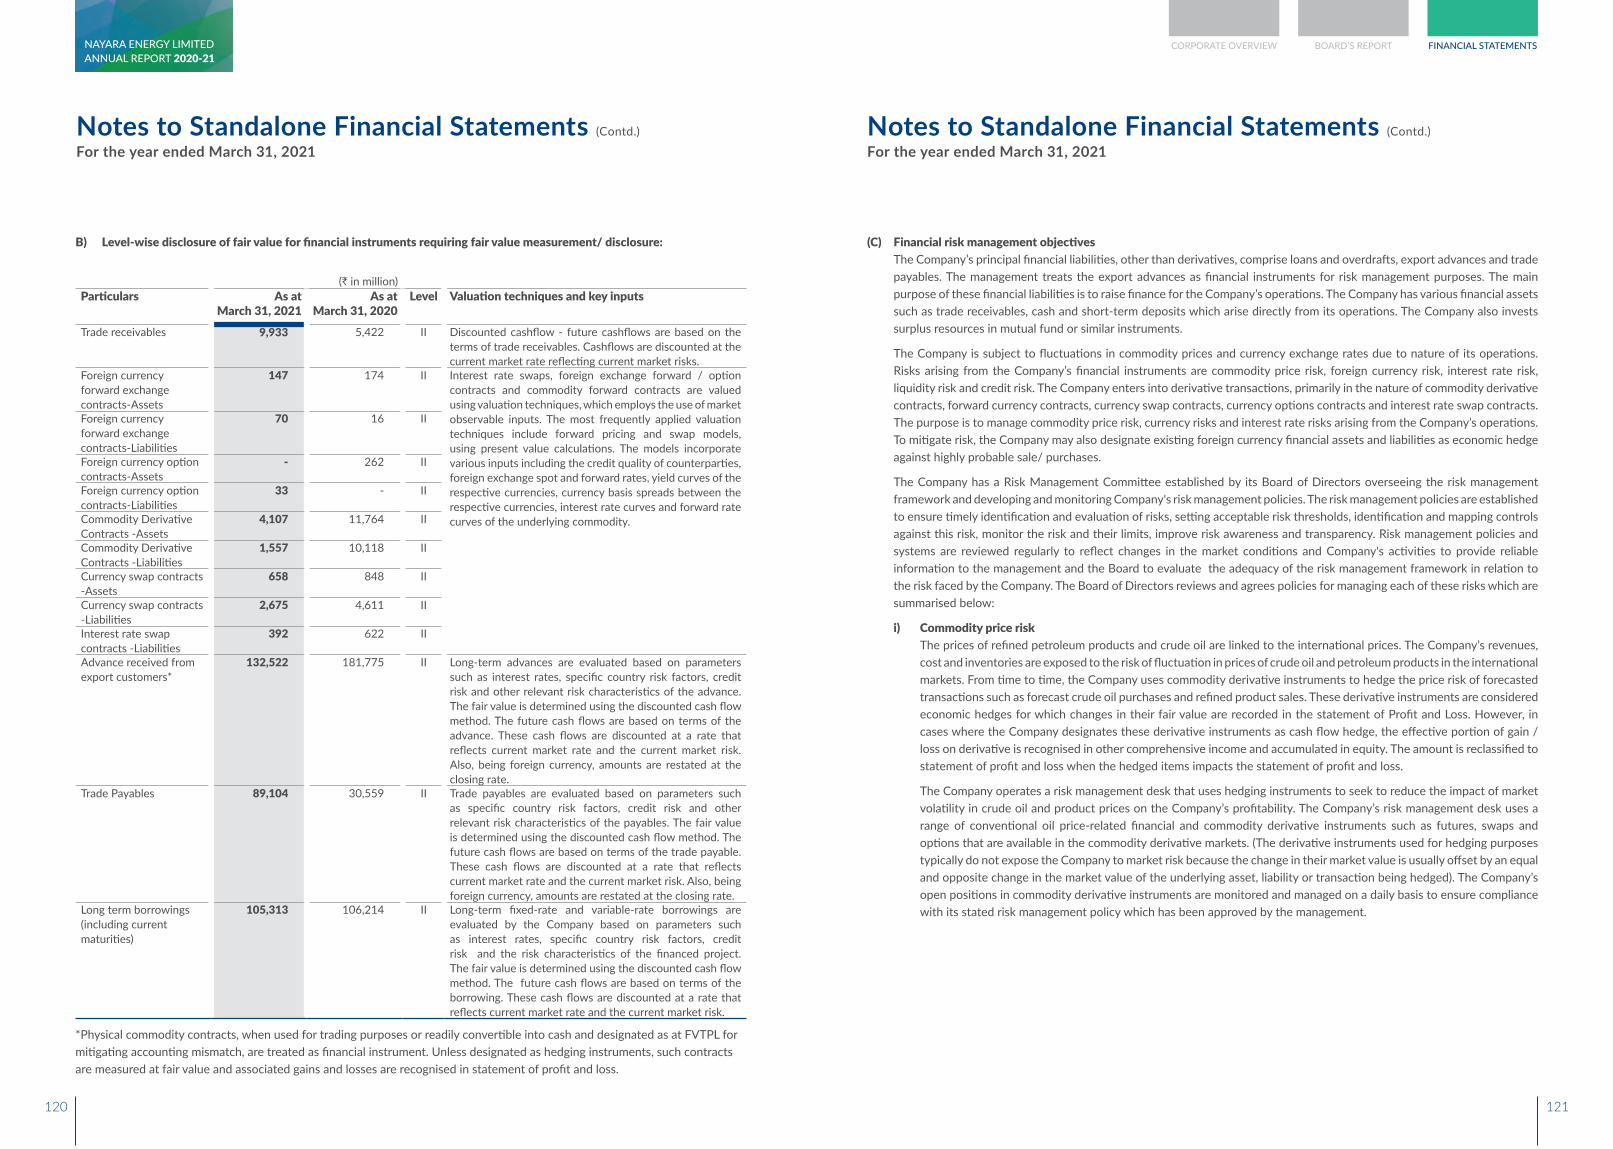
Notes to Standalone Financial Statements (Contd.)
For the year ended March 31, 2021Notes to Standalone Financial Statements (Contd.)
For the year ended March 31, 2021
B) Level-wise disclosure of fair value for financial instruments requiring fair value measurement/ disclosure:
(` in million)Particulars As at
March 31, 2021As at
March 31, 2020Level Valuation techniques and key inputs
Trade receivables 9,933 5,422 II Discounted cashflow - future cashflows are based on the terms of trade receivables. Cashflows are discounted at the current market rate reflecting current market risks.
Foreign currency forward exchange contracts-Assets
147 174 II Interest rate swaps, foreign exchange forward / option contracts and commodity forward contracts are valued using valuation techniques, which employs the use of market observable inputs. The most frequently applied valuation techniques include forward pricing and swap models, using present value calculations. The models incorporate various inputs including the credit quality of counterparties, foreign exchange spot and forward rates, yield curves of the respective currencies, currency basis spreads between the respective currencies, interest rate curves and forward rate curves of the underlying commodity.
Foreign currency forward exchange contracts-Liabilities
70 16 II
Foreign currency option contracts-Assets
- 262 II
Foreign currency option contracts-Liabilities
33 - II
Commodity Derivative Contracts -Assets
4,107 11,764 II
Commodity Derivative Contracts -Liabilities
1,557 10,118 II
Currency swap contracts -Assets
658 848 II
Currency swap contracts -Liabilities
2,675 4,611 II
Interest rate swap contracts -Liabilities
392 622 II
Advance received from export customers*
132,522 181,775 II Long-term advances are evaluated based on parameters such as interest rates, specific country risk factors, credit risk and other relevant risk characteristics of the advance. The fair value is determined using the discounted cash flow method. The future cash flows are based on terms of the advance. These cash flows are discounted at a rate that reflects current market rate and the current market risk. Also, being foreign currency, amounts are restated at the closing rate.
Trade Payables 89,104 30,559 II Trade payables are evaluated based on parameters such as specific country risk factors, credit risk and other relevant risk characteristics of the payables. The fair value is determined using the discounted cash flow method. The future cash flows are based on terms of the trade payable. These cash flows are discounted at a rate that reflects current market rate and the current market risk. Also, being foreign currency, amounts are restated at the closing rate.
Long term borrowings (including current maturities)
105,313 106,214 II Long-term fixed-rate and variable-rate borrowings are evaluated by the Company based on parameters such as interest rates, specific country risk factors, credit risk and the risk characteristics of the financed project. The fair value is determined using the discounted cash flow method. The future cash flows are based on terms of the borrowing. These cash flows are discounted at a rate that reflects current market rate and the current market risk.
*Physical commodity contracts, when used for trading purposes or readily convertible into cash and designated as at FVTPL for mitigating accounting mismatch, are treated as financial instrument. Unless designated as hedging instruments, such contracts are measured at fair value and associated gains and losses are recognised in statement of profit and loss.
(C) Financial risk management objectives The Company’s principal financial liabilities, other than derivatives, comprise loans and overdrafts, export advances and trade
payables. The management treats the export advances as financial instruments for risk management purposes. The main purpose of these financial liabilities is to raise finance for the Company’s operations. The Company has various financial assets such as trade receivables, cash and short-term deposits which arise directly from its operations. The Company also invests surplus resources in mutual fund or similar instruments.
The Company is subject to fluctuations in commodity prices and currency exchange rates due to nature of its operations. Risks arising from the Company’s financial instruments are commodity price risk, foreign currency risk, interest rate risk, liquidity risk and credit risk. The Company enters into derivative transactions, primarily in the nature of commodity derivative contracts, forward currency contracts, currency swap contracts, currency options contracts and interest rate swap contracts. The purpose is to manage commodity price risk, currency risks and interest rate risks arising from the Company’s operations. To mitigate risk, the Company may also designate existing foreign currency financial assets and liabilities as economic hedge against highly probable sale/ purchases.
The Company has a Risk Management Committee established by its Board of Directors overseeing the risk management framework and developing and monitoring Company's risk management policies. The risk management policies are established to ensure timely identification and evaluation of risks, setting acceptable risk thresholds, identification and mapping controls against this risk, monitor the risk and their limits, improve risk awareness and transparency. Risk management policies and systems are reviewed regularly to reflect changes in the market conditions and Company's activities to provide reliable information to the management and the Board to evaluate the adequacy of the risk management framework in relation to the risk faced by the Company. The Board of Directors reviews and agrees policies for managing each of these risks which are summarised below:
i) Commodity price risk The prices of refined petroleum products and crude oil are linked to the international prices. The Company’s revenues,
cost and inventories are exposed to the risk of fluctuation in prices of crude oil and petroleum products in the international markets. From time to time, the Company uses commodity derivative instruments to hedge the price risk of forecasted transactions such as forecast crude oil purchases and refined product sales. These derivative instruments are considered economic hedges for which changes in their fair value are recorded in the statement of Profit and Loss. However, in cases where the Company designates these derivative instruments as cash flow hedge, the effective portion of gain / loss on derivative is recognised in other comprehensive income and accumulated in equity. The amount is reclassified to statement of profit and loss when the hedged items impacts the statement of profit and loss.
The Company operates a risk management desk that uses hedging instruments to seek to reduce the impact of market volatility in crude oil and product prices on the Company’s profitability. The Company’s risk management desk uses a range of conventional oil price-related financial and commodity derivative instruments such as futures, swaps and options that are available in the commodity derivative markets. (The derivative instruments used for hedging purposes typically do not expose the Company to market risk because the change in their market value is usually offset by an equal and opposite change in the market value of the underlying asset, liability or transaction being hedged). The Company’s open positions in commodity derivative instruments are monitored and managed on a daily basis to ensure compliance with its stated risk management policy which has been approved by the management.
120 121
CORPORATE OVERVIEW BOARD’S REPORT FINANCIAL STATEMENTSANNUAL REPORT 2020-21NAYARA ENERGY LIMITED
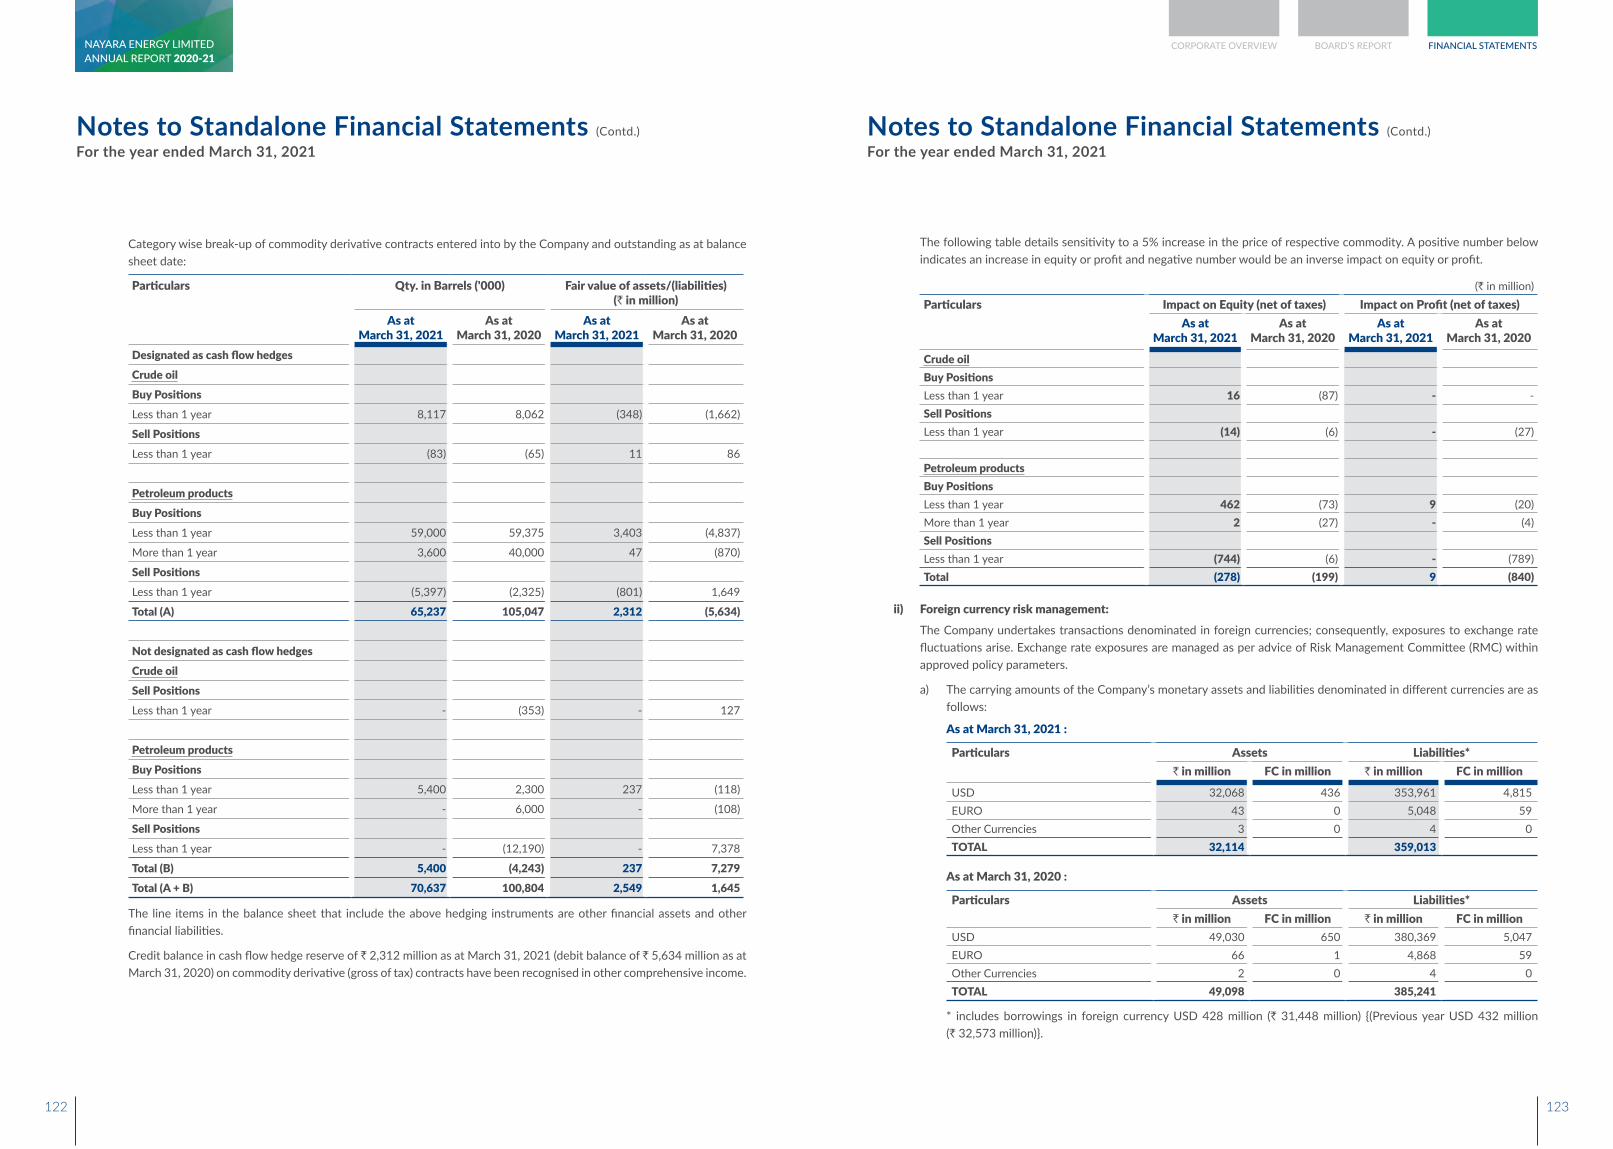
Notes to Standalone Financial Statements (Contd.)
For the year ended March 31, 2021Notes to Standalone Financial Statements (Contd.)
For the year ended March 31, 2021
Category wise break-up of commodity derivative contracts entered into by the Company and outstanding as at balance sheet date:
Particulars Qty. in Barrels ('000) Fair value of assets/(liabilities) (` in million)
As at March 31, 2021
As at March 31, 2020
As at March 31, 2021
As at March 31, 2020
Designated as cash flow hedgesCrude oilBuy PositionsLess than 1 year 8,117 8,062 (348) (1,662)
Sell PositionsLess than 1 year (83) (65) 11 86
Petroleum productsBuy PositionsLess than 1 year 59,000 59,375 3,403 (4,837)
More than 1 year 3,600 40,000 47 (870)
Sell PositionsLess than 1 year (5,397) (2,325) (801) 1,649
Total (A) 65,237 105,047 2,312 (5,634)
Not designated as cash flow hedgesCrude oilSell PositionsLess than 1 year - (353) - 127
Petroleum productsBuy PositionsLess than 1 year 5,400 2,300 237 (118)
More than 1 year - 6,000 - (108)
Sell PositionsLess than 1 year - (12,190) - 7,378
Total (B) 5,400 (4,243) 237 7,279 Total (A + B) 70,637 100,804 2,549 1,645
The line items in the balance sheet that include the above hedging instruments are other financial assets and other financial liabilities.
Credit balance in cash flow hedge reserve of ` 2,312 million as at March 31, 2021 (debit balance of ` 5,634 million as at March 31, 2020) on commodity derivative (gross of tax) contracts have been recognised in other comprehensive income.
The following table details sensitivity to a 5% increase in the price of respective commodity. A positive number below indicates an increase in equity or profit and negative number would be an inverse impact on equity or profit.
(` in million)Particulars Impact on Equity (net of taxes) Impact on Profit (net of taxes)
As at March 31, 2021
As at March 31, 2020
As at March 31, 2021
As at March 31, 2020
Crude oilBuy PositionsLess than 1 year 16 (87) - - Sell PositionsLess than 1 year (14) (6) - (27)
Petroleum productsBuy PositionsLess than 1 year 462 (73) 9 (20)More than 1 year 2 (27) - (4)Sell PositionsLess than 1 year (744) (6) - (789)Total (278) (199) 9 (840)
ii) Foreign currency risk management: The Company undertakes transactions denominated in foreign currencies; consequently, exposures to exchange rate
fluctuations arise. Exchange rate exposures are managed as per advice of Risk Management Committee (RMC) within approved policy parameters.
a) The carrying amounts of the Company’s monetary assets and liabilities denominated in different currencies are as follows:
As at March 31, 2021 :
Particulars Assets Liabilities*` in million FC in million ` in million FC in million
USD 32,068 436 353,961 4,815 EURO 43 0 5,048 59 Other Currencies 3 0 4 0 TOTAL 32,114 359,013
As at March 31, 2020 :
Particulars Assets Liabilities*` in million FC in million ` in million FC in million
USD 49,030 650 380,369 5,047 EURO 66 1 4,868 59 Other Currencies 2 0 4 0 TOTAL 49,098 385,241
* includes borrowings in foreign currency USD 428 million (` 31,448 million) {(Previous year USD 432 million (` 32,573 million)}.
122 123
CORPORATE OVERVIEW BOARD’S REPORT FINANCIAL STATEMENTSANNUAL REPORT 2020-21NAYARA ENERGY LIMITED
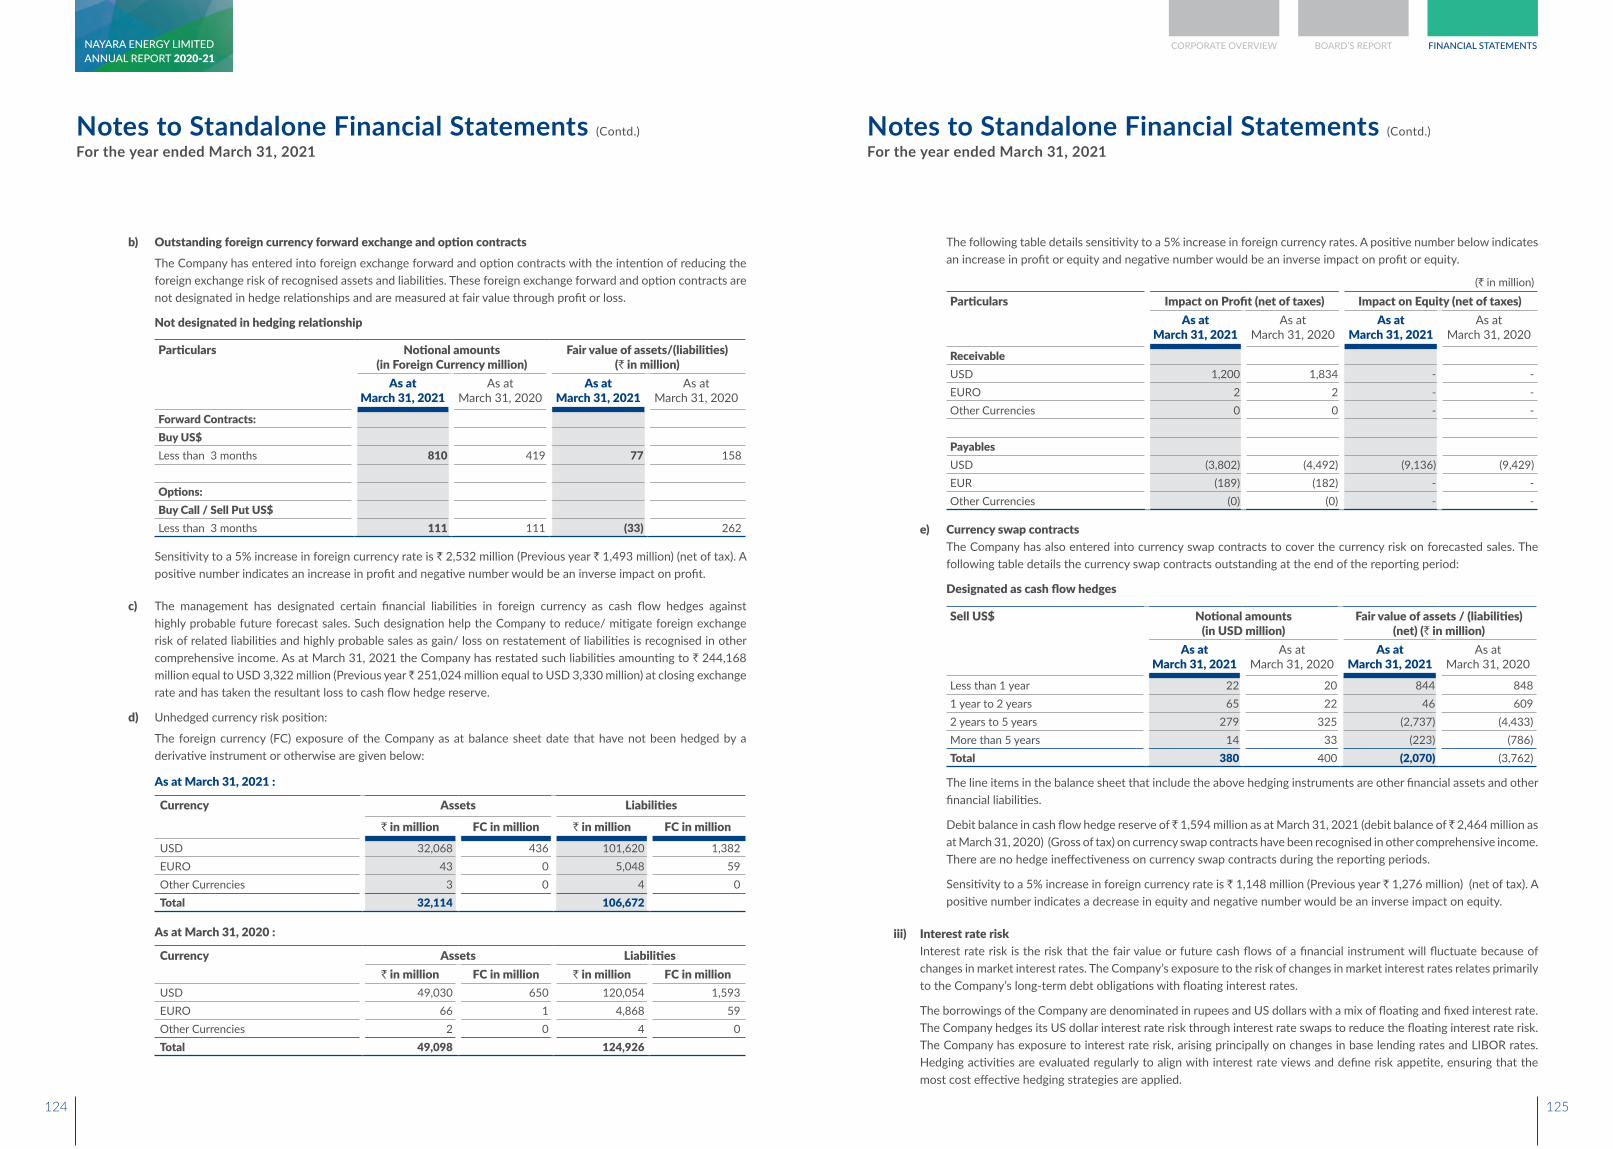
Notes to Standalone Financial Statements (Contd.)
For the year ended March 31, 2021Notes to Standalone Financial Statements (Contd.)
For the year ended March 31, 2021
b) Outstanding foreign currency forward exchange and option contractsThe Company has entered into foreign exchange forward and option contracts with the intention of reducing the foreign exchange risk of recognised assets and liabilities. These foreign exchange forward and option contracts are not designated in hedge relationships and are measured at fair value through profit or loss.
Not designated in hedging relationship
Particulars Notional amounts (in Foreign Currency million)
Fair value of assets/(liabilities) (` in million)
As at March 31, 2021
As at March 31, 2020
As at March 31, 2021
As at March 31, 2020
Forward Contracts:Buy US$Less than 3 months 810 419 77 158
Options:Buy Call / Sell Put US$Less than 3 months 111 111 (33) 262
Sensitivity to a 5% increase in foreign currency rate is ` 2,532 million (Previous year ` 1,493 million) (net of tax). A positive number indicates an increase in profit and negative number would be an inverse impact on profit.
c) The management has designated certain financial liabilities in foreign currency as cash flow hedges against highly probable future forecast sales. Such designation help the Company to reduce/ mitigate foreign exchange risk of related liabilities and highly probable sales as gain/ loss on restatement of liabilities is recognised in other comprehensive income. As at March 31, 2021 the Company has restated such liabilities amounting to ` 244,168 million equal to USD 3,322 million (Previous year ̀ 251,024 million equal to USD 3,330 million) at closing exchange rate and has taken the resultant loss to cash flow hedge reserve.
d) Unhedged currency risk position:
The foreign currency (FC) exposure of the Company as at balance sheet date that have not been hedged by a derivative instrument or otherwise are given below:
As at March 31, 2021 :
Currency Assets Liabilities
` in million FC in million ` in million FC in millionUSD 32,068 436 101,620 1,382 EURO 43 0 5,048 59 Other Currencies 3 0 4 0 Total 32,114 106,672
As at March 31, 2020 :
Currency Assets Liabilities` in million FC in million ` in million FC in million
USD 49,030 650 120,054 1,593 EURO 66 1 4,868 59 Other Currencies 2 0 4 0 Total 49,098 124,926
The following table details sensitivity to a 5% increase in foreign currency rates. A positive number below indicates an increase in profit or equity and negative number would be an inverse impact on profit or equity.
(` in million)
Particulars Impact on Profit (net of taxes) Impact on Equity (net of taxes)As at
March 31, 2021As at
March 31, 2020As at
March 31, 2021As at
March 31, 2020
ReceivableUSD 1,200 1,834 - - EURO 2 2 - - Other Currencies 0 0 - -
PayablesUSD (3,802) (4,492) (9,136) (9,429)EUR (189) (182) - - Other Currencies (0) (0) - -
e) Currency swap contractsThe Company has also entered into currency swap contracts to cover the currency risk on forecasted sales. The following table details the currency swap contracts outstanding at the end of the reporting period:
Designated as cash flow hedges
Sell US$ Notional amounts (in USD million)
Fair value of assets / (liabilities) (net) (` in million)
As at March 31, 2021
As at March 31, 2020
As at March 31, 2021
As at March 31, 2020
Less than 1 year 22 20 844 848 1 year to 2 years 65 22 46 609 2 years to 5 years 279 325 (2,737) (4,433)More than 5 years 14 33 (223) (786)Total 380 400 (2,070) (3,762)
The line items in the balance sheet that include the above hedging instruments are other financial assets and other financial liabilities.
Debit balance in cash flow hedge reserve of ̀ 1,594 million as at March 31, 2021 (debit balance of ̀ 2,464 million as at March 31, 2020) (Gross of tax) on currency swap contracts have been recognised in other comprehensive income. There are no hedge ineffectiveness on currency swap contracts during the reporting periods.
Sensitivity to a 5% increase in foreign currency rate is ` 1,148 million (Previous year ` 1,276 million) (net of tax). A positive number indicates a decrease in equity and negative number would be an inverse impact on equity.
iii) Interest rate riskInterest rate risk is the risk that the fair value or future cash flows of a financial instrument will fluctuate because of changes in market interest rates. The Company’s exposure to the risk of changes in market interest rates relates primarily to the Company’s long-term debt obligations with floating interest rates.
The borrowings of the Company are denominated in rupees and US dollars with a mix of floating and fixed interest rate. The Company hedges its US dollar interest rate risk through interest rate swaps to reduce the floating interest rate risk. The Company has exposure to interest rate risk, arising principally on changes in base lending rates and LIBOR rates. Hedging activities are evaluated regularly to align with interest rate views and define risk appetite, ensuring that the most cost effective hedging strategies are applied.
124 125
CORPORATE OVERVIEW BOARD’S REPORT FINANCIAL STATEMENTSANNUAL REPORT 2020-21NAYARA ENERGY LIMITED
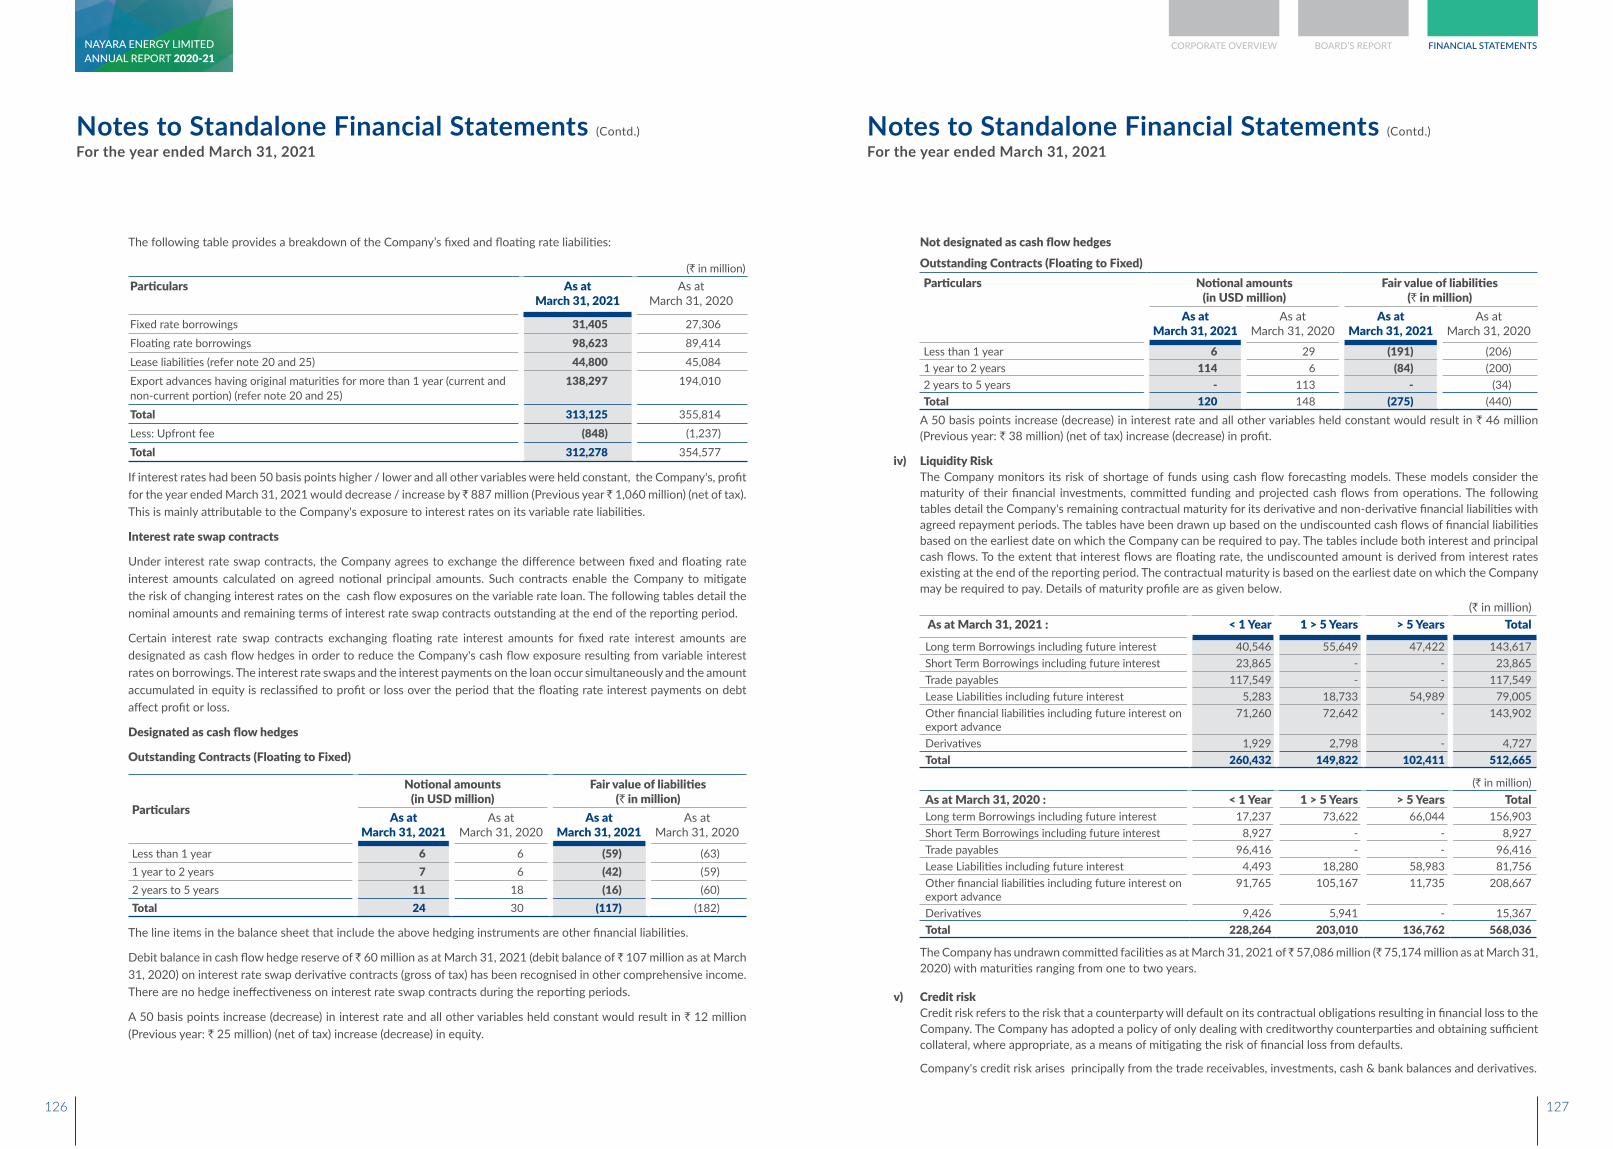
Notes to Standalone Financial Statements (Contd.)
For the year ended March 31, 2021Notes to Standalone Financial Statements (Contd.)
For the year ended March 31, 2021
The following table provides a breakdown of the Company’s fixed and floating rate liabilities:
(` in million)Particulars As at
March 31, 2021As at
March 31, 2020
Fixed rate borrowings 31,405 27,306 Floating rate borrowings 98,623 89,414 Lease liabilities (refer note 20 and 25) 44,800 45,084 Export advances having original maturities for more than 1 year (current and non-current portion) (refer note 20 and 25)
138,297 194,010
Total 313,125 355,814 Less: Upfront fee (848) (1,237)Total 312,278 354,577
If interest rates had been 50 basis points higher / lower and all other variables were held constant, the Company's, profit for the year ended March 31, 2021 would decrease / increase by ̀ 887 million (Previous year ̀ 1,060 million) (net of tax). This is mainly attributable to the Company's exposure to interest rates on its variable rate liabilities.
Interest rate swap contracts
Under interest rate swap contracts, the Company agrees to exchange the difference between fixed and floating rate interest amounts calculated on agreed notional principal amounts. Such contracts enable the Company to mitigate the risk of changing interest rates on the cash flow exposures on the variable rate loan. The following tables detail the nominal amounts and remaining terms of interest rate swap contracts outstanding at the end of the reporting period.
Certain interest rate swap contracts exchanging floating rate interest amounts for fixed rate interest amounts are designated as cash flow hedges in order to reduce the Company's cash flow exposure resulting from variable interest rates on borrowings. The interest rate swaps and the interest payments on the loan occur simultaneously and the amount accumulated in equity is reclassified to profit or loss over the period that the floating rate interest payments on debt affect profit or loss.
Designated as cash flow hedges
Outstanding Contracts (Floating to Fixed)
Particulars
Notional amounts (in USD million)
Fair value of liabilities (` in million)
As at March 31, 2021
As at March 31, 2020
As at March 31, 2021
As at March 31, 2020
Less than 1 year 6 6 (59) (63)1 year to 2 years 7 6 (42) (59)2 years to 5 years 11 18 (16) (60)Total 24 30 (117) (182)
The line items in the balance sheet that include the above hedging instruments are other financial liabilities.
Debit balance in cash flow hedge reserve of ̀ 60 million as at March 31, 2021 (debit balance of ̀ 107 million as at March 31, 2020) on interest rate swap derivative contracts (gross of tax) has been recognised in other comprehensive income. There are no hedge ineffectiveness on interest rate swap contracts during the reporting periods.
A 50 basis points increase (decrease) in interest rate and all other variables held constant would result in ` 12 million (Previous year: ` 25 million) (net of tax) increase (decrease) in equity.
Not designated as cash flow hedges Outstanding Contracts (Floating to Fixed)
Particulars Notional amounts (in USD million)
Fair value of liabilities (` in million)
As at March 31, 2021
As at March 31, 2020
As at March 31, 2021
As at March 31, 2020
Less than 1 year 6 29 (191) (206)1 year to 2 years 114 6 (84) (200)2 years to 5 years - 113 - (34)Total 120 148 (275) (440)
A 50 basis points increase (decrease) in interest rate and all other variables held constant would result in ` 46 million (Previous year: ` 38 million) (net of tax) increase (decrease) in profit.
iv) Liquidity RiskThe Company monitors its risk of shortage of funds using cash flow forecasting models. These models consider the maturity of their financial investments, committed funding and projected cash flows from operations. The following tables detail the Company's remaining contractual maturity for its derivative and non-derivative financial liabilities with agreed repayment periods. The tables have been drawn up based on the undiscounted cash flows of financial liabilities based on the earliest date on which the Company can be required to pay. The tables include both interest and principal cash flows. To the extent that interest flows are floating rate, the undiscounted amount is derived from interest rates existing at the end of the reporting period. The contractual maturity is based on the earliest date on which the Company may be required to pay. Details of maturity profile are as given below.
(` in million) As at March 31, 2021 : < 1 Year 1 > 5 Years > 5 Years Total
Long term Borrowings including future interest 40,546 55,649 47,422 143,617 Short Term Borrowings including future interest 23,865 - - 23,865 Trade payables 117,549 - - 117,549 Lease Liabilities including future interest 5,283 18,733 54,989 79,005 Other financial liabilities including future interest on export advance
71,260 72,642 - 143,902
Derivatives 1,929 2,798 - 4,727 Total 260,432 149,822 102,411 512,665
(` in million)As at March 31, 2020 : < 1 Year 1 > 5 Years > 5 Years TotalLong term Borrowings including future interest 17,237 73,622 66,044 156,903 Short Term Borrowings including future interest 8,927 - - 8,927 Trade payables 96,416 - - 96,416 Lease Liabilities including future interest 4,493 18,280 58,983 81,756 Other financial liabilities including future interest on export advance
91,765 105,167 11,735 208,667
Derivatives 9,426 5,941 - 15,367 Total 228,264 203,010 136,762 568,036
The Company has undrawn committed facilities as at March 31, 2021 of ̀ 57,086 million (` 75,174 million as at March 31, 2020) with maturities ranging from one to two years.
v) Credit riskCredit risk refers to the risk that a counterparty will default on its contractual obligations resulting in financial loss to the Company. The Company has adopted a policy of only dealing with creditworthy counterparties and obtaining sufficient collateral, where appropriate, as a means of mitigating the risk of financial loss from defaults.
Company's credit risk arises principally from the trade receivables, investments, cash & bank balances and derivatives.
126 127
CORPORATE OVERVIEW BOARD’S REPORT FINANCIAL STATEMENTSANNUAL REPORT 2020-21NAYARA ENERGY LIMITED
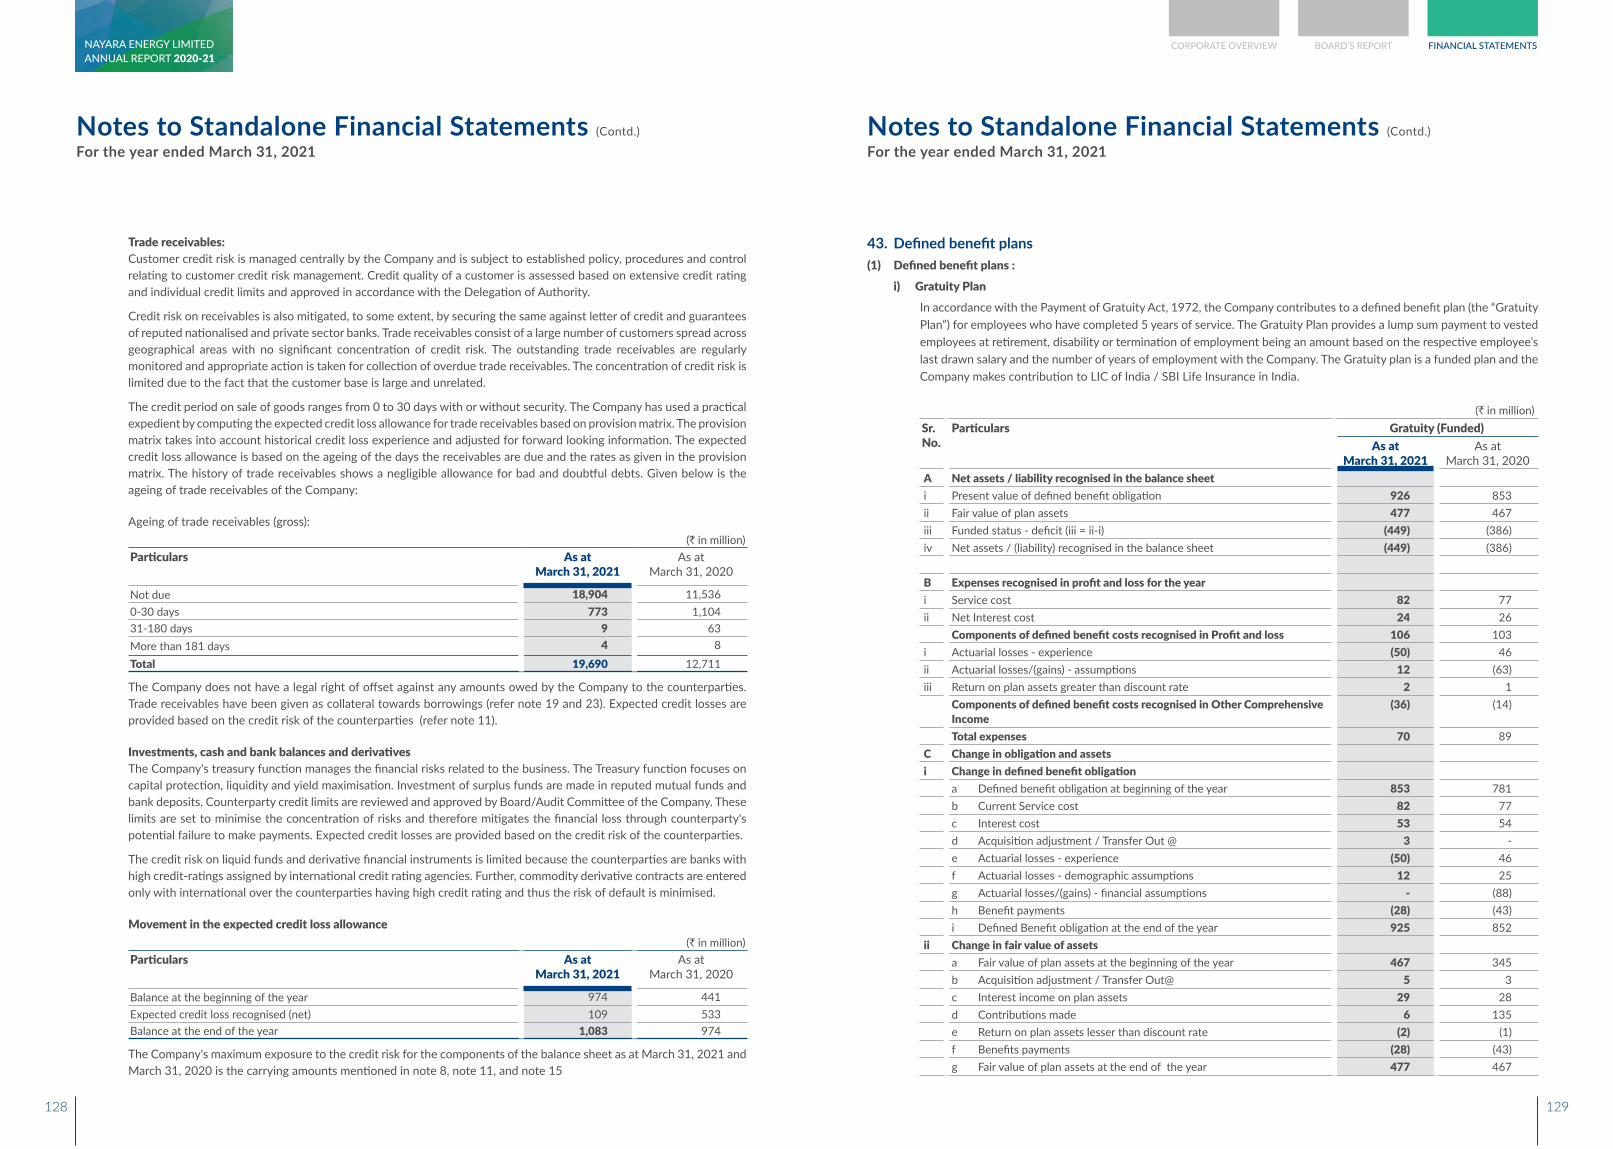
Notes to Standalone Financial Statements (Contd.)
For the year ended March 31, 2021Notes to Standalone Financial Statements (Contd.)
For the year ended March 31, 2021
Trade receivables:Customer credit risk is managed centrally by the Company and is subject to established policy, procedures and control relating to customer credit risk management. Credit quality of a customer is assessed based on extensive credit rating and individual credit limits and approved in accordance with the Delegation of Authority.
Credit risk on receivables is also mitigated, to some extent, by securing the same against letter of credit and guarantees of reputed nationalised and private sector banks. Trade receivables consist of a large number of customers spread across geographical areas with no significant concentration of credit risk. The outstanding trade receivables are regularly monitored and appropriate action is taken for collection of overdue trade receivables. The concentration of credit risk is limited due to the fact that the customer base is large and unrelated.
The credit period on sale of goods ranges from 0 to 30 days with or without security. The Company has used a practical expedient by computing the expected credit loss allowance for trade receivables based on provision matrix. The provision matrix takes into account historical credit loss experience and adjusted for forward looking information. The expected credit loss allowance is based on the ageing of the days the receivables are due and the rates as given in the provision matrix. The history of trade receivables shows a negligible allowance for bad and doubtful debts. Given below is the ageing of trade receivables of the Company:
Ageing of trade receivables (gross):(` in million)
Particulars As at March 31, 2021
As at March 31, 2020
Not due 18,904 11,536 0-30 days 773 1,104 31-180 days 9 63 More than 181 days 4 8 Total 19,690 12,711
The Company does not have a legal right of offset against any amounts owed by the Company to the counterparties. Trade receivables have been given as collateral towards borrowings (refer note 19 and 23). Expected credit losses are provided based on the credit risk of the counterparties (refer note 11).
Investments, cash and bank balances and derivativesThe Company's treasury function manages the financial risks related to the business. The Treasury function focuses on capital protection, liquidity and yield maximisation. Investment of surplus funds are made in reputed mutual funds and bank deposits. Counterparty credit limits are reviewed and approved by Board/Audit Committee of the Company. These limits are set to minimise the concentration of risks and therefore mitigates the financial loss through counterparty's potential failure to make payments. Expected credit losses are provided based on the credit risk of the counterparties.
The credit risk on liquid funds and derivative financial instruments is limited because the counterparties are banks with high credit-ratings assigned by international credit rating agencies. Further, commodity derivative contracts are entered only with international over the counterparties having high credit rating and thus the risk of default is minimised.
Movement in the expected credit loss allowance(` in million)
Particulars As at March 31, 2021
As at March 31, 2020
Balance at the beginning of the year 974 441 Expected credit loss recognised (net) 109 533 Balance at the end of the year 1,083 974
The Company's maximum exposure to the credit risk for the components of the balance sheet as at March 31, 2021 and March 31, 2020 is the carrying amounts mentioned in note 8, note 11, and note 15
43. Defined benefit plans (1) Defined benefit plans : i) Gratuity Plan
In accordance with the Payment of Gratuity Act, 1972, the Company contributes to a defined benefit plan (the “Gratuity Plan”) for employees who have completed 5 years of service. The Gratuity Plan provides a lump sum payment to vested employees at retirement, disability or termination of employment being an amount based on the respective employee’s last drawn salary and the number of years of employment with the Company. The Gratuity plan is a funded plan and the Company makes contribution to LIC of India / SBI Life Insurance in India.
(` in million)Sr. No.
Particulars Gratuity (Funded)As at
March 31, 2021As at
March 31, 2020A Net assets / liability recognised in the balance sheeti Present value of defined benefit obligation 926 853ii Fair value of plan assets 477 467iii Funded status - deficit (iii = ii-i) (449) (386)iv Net assets / (liability) recognised in the balance sheet (449) (386)
B Expenses recognised in profit and loss for the yeari Service cost 82 77ii Net Interest cost 24 26
Components of defined benefit costs recognised in Profit and loss 106 103i Actuarial losses - experience (50) 46ii Actuarial losses/(gains) - assumptions 12 (63)iii Return on plan assets greater than discount rate 2 1
Components of defined benefit costs recognised in Other Comprehensive Income
(36) (14)
Total expenses 70 89C Change in obligation and assetsi Change in defined benefit obligation
a Defined benefit obligation at beginning of the year 853 781b Current Service cost 82 77c Interest cost 53 54d Acquisition adjustment / Transfer Out @ 3 -e Actuarial losses - experience (50) 46f Actuarial losses - demographic assumptions 12 25g Actuarial losses/(gains) - financial assumptions - (88)h Benefit payments (28) (43)i Defined Benefit obligation at the end of the year 925 852
ii Change in fair value of assetsa Fair value of plan assets at the beginning of the year 467 345b Acquisition adjustment / Transfer Out@ 5 3c Interest income on plan assets 29 28d Contributions made 6 135e Return on plan assets lesser than discount rate (2) (1)f Benefits payments (28) (43)g Fair value of plan assets at the end of the year 477 467
128 129
CORPORATE OVERVIEW BOARD’S REPORT FINANCIAL STATEMENTSANNUAL REPORT 2020-21NAYARA ENERGY LIMITED
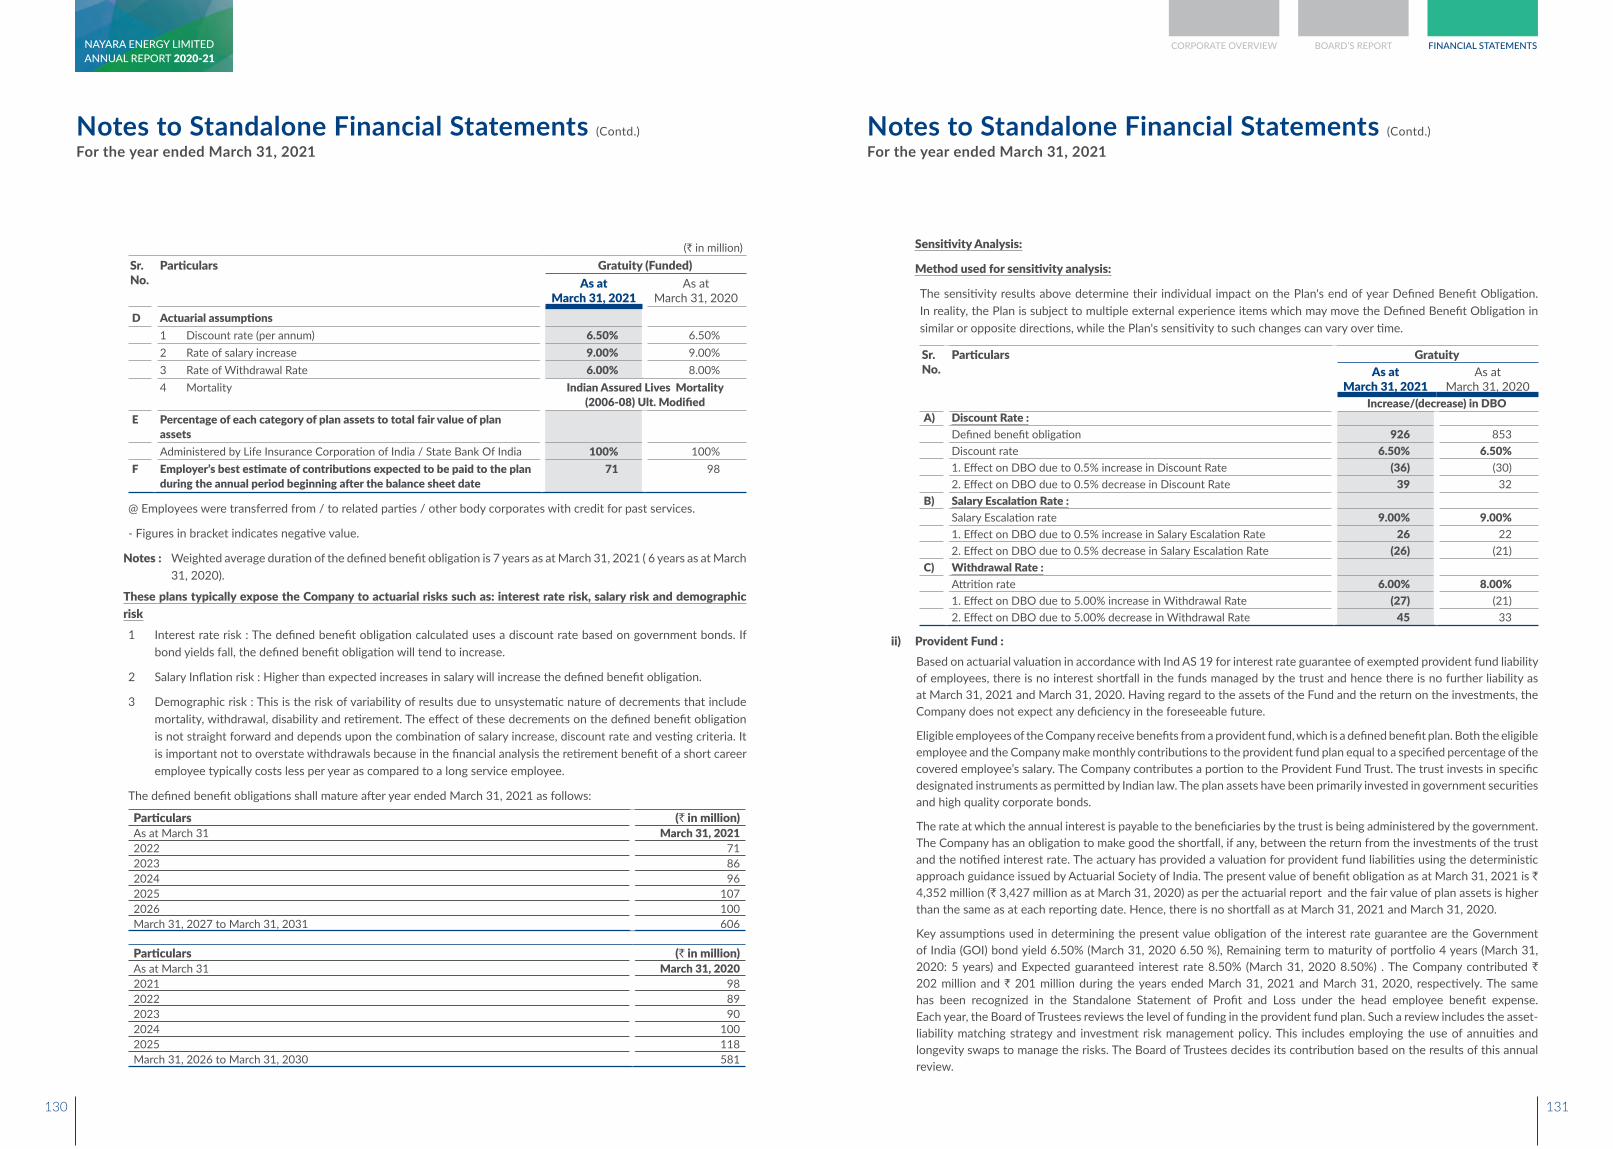
Notes to Standalone Financial Statements (Contd.)
For the year ended March 31, 2021Notes to Standalone Financial Statements (Contd.)
For the year ended March 31, 2021
(` in million)Sr. No.
Particulars Gratuity (Funded)As at
March 31, 2021As at
March 31, 2020D Actuarial assumptions
1 Discount rate (per annum) 6.50% 6.50%2 Rate of salary increase 9.00% 9.00%3 Rate of Withdrawal Rate 6.00% 8.00%4 Mortality Indian Assured Lives Mortality
(2006-08) Ult. ModifiedE Percentage of each category of plan assets to total fair value of plan
assetsAdministered by Life Insurance Corporation of India / State Bank Of India 100% 100%
F Employer’s best estimate of contributions expected to be paid to the plan during the annual period beginning after the balance sheet date
71 98
@ Employees were transferred from / to related parties / other body corporates with credit for past services.
- Figures in bracket indicates negative value.
Notes : Weighted average duration of the defined benefit obligation is 7 years as at March 31, 2021 ( 6 years as at March 31, 2020).
These plans typically expose the Company to actuarial risks such as: interest rate risk, salary risk and demographic risk1 Interest rate risk : The defined benefit obligation calculated uses a discount rate based on government bonds. If
bond yields fall, the defined benefit obligation will tend to increase.
2 Salary Inflation risk : Higher than expected increases in salary will increase the defined benefit obligation.
3 Demographic risk : This is the risk of variability of results due to unsystematic nature of decrements that include mortality, withdrawal, disability and retirement. The effect of these decrements on the defined benefit obligation is not straight forward and depends upon the combination of salary increase, discount rate and vesting criteria. It is important not to overstate withdrawals because in the financial analysis the retirement benefit of a short career employee typically costs less per year as compared to a long service employee.
The defined benefit obligations shall mature after year ended March 31, 2021 as follows:
Particulars (` in million)As at March 31 March 31, 20212022 71 2023 86 2024 96 2025 107 2026 100 March 31, 2027 to March 31, 2031 606
Particulars (` in million)As at March 31 March 31, 20202021 98 2022 89 2023 90 2024 100 2025 118 March 31, 2026 to March 31, 2030 581
Sensitivity Analysis:
Method used for sensitivity analysis:
The sensitivity results above determine their individual impact on the Plan's end of year Defined Benefit Obligation. In reality, the Plan is subject to multiple external experience items which may move the Defined Benefit Obligation in similar or opposite directions, while the Plan's sensitivity to such changes can vary over time.
Sr. No.
Particulars GratuityAs at
March 31, 2021As at
March 31, 2020Increase/(decrease) in DBO
A) Discount Rate :Defined benefit obligation 926 853 Discount rate 6.50% 6.50%1. Effect on DBO due to 0.5% increase in Discount Rate (36) (30)2. Effect on DBO due to 0.5% decrease in Discount Rate 39 32
B) Salary Escalation Rate :Salary Escalation rate 9.00% 9.00%1. Effect on DBO due to 0.5% increase in Salary Escalation Rate 26 22 2. Effect on DBO due to 0.5% decrease in Salary Escalation Rate (26) (21)
C) Withdrawal Rate :Attrition rate 6.00% 8.00%1. Effect on DBO due to 5.00% increase in Withdrawal Rate (27) (21)2. Effect on DBO due to 5.00% decrease in Withdrawal Rate 45 33
ii) Provident Fund : Based on actuarial valuation in accordance with Ind AS 19 for interest rate guarantee of exempted provident fund liability
of employees, there is no interest shortfall in the funds managed by the trust and hence there is no further liability as at March 31, 2021 and March 31, 2020. Having regard to the assets of the Fund and the return on the investments, the Company does not expect any deficiency in the foreseeable future.
Eligible employees of the Company receive benefits from a provident fund, which is a defined benefit plan. Both the eligible employee and the Company make monthly contributions to the provident fund plan equal to a specified percentage of the covered employee’s salary. The Company contributes a portion to the Provident Fund Trust. The trust invests in specific designated instruments as permitted by Indian law. The plan assets have been primarily invested in government securities and high quality corporate bonds.
The rate at which the annual interest is payable to the beneficiaries by the trust is being administered by the government. The Company has an obligation to make good the shortfall, if any, between the return from the investments of the trust and the notified interest rate. The actuary has provided a valuation for provident fund liabilities using the deterministic approach guidance issued by Actuarial Society of India. The present value of benefit obligation as at March 31, 2021 is ` 4,352 million (` 3,427 million as at March 31, 2020) as per the actuarial report and the fair value of plan assets is higher than the same as at each reporting date. Hence, there is no shortfall as at March 31, 2021 and March 31, 2020.
Key assumptions used in determining the present value obligation of the interest rate guarantee are the Government of India (GOI) bond yield 6.50% (March 31, 2020 6.50 %), Remaining term to maturity of portfolio 4 years (March 31, 2020: 5 years) and Expected guaranteed interest rate 8.50% (March 31, 2020 8.50%) . The Company contributed ` 202 million and ` 201 million during the years ended March 31, 2021 and March 31, 2020, respectively. The same has been recognized in the Standalone Statement of Profit and Loss under the head employee benefit expense. Each year, the Board of Trustees reviews the level of funding in the provident fund plan. Such a review includes the asset-liability matching strategy and investment risk management policy. This includes employing the use of annuities and longevity swaps to manage the risks. The Board of Trustees decides its contribution based on the results of this annual review.
130 131
CORPORATE OVERVIEW BOARD’S REPORT FINANCIAL STATEMENTSANNUAL REPORT 2020-21NAYARA ENERGY LIMITED
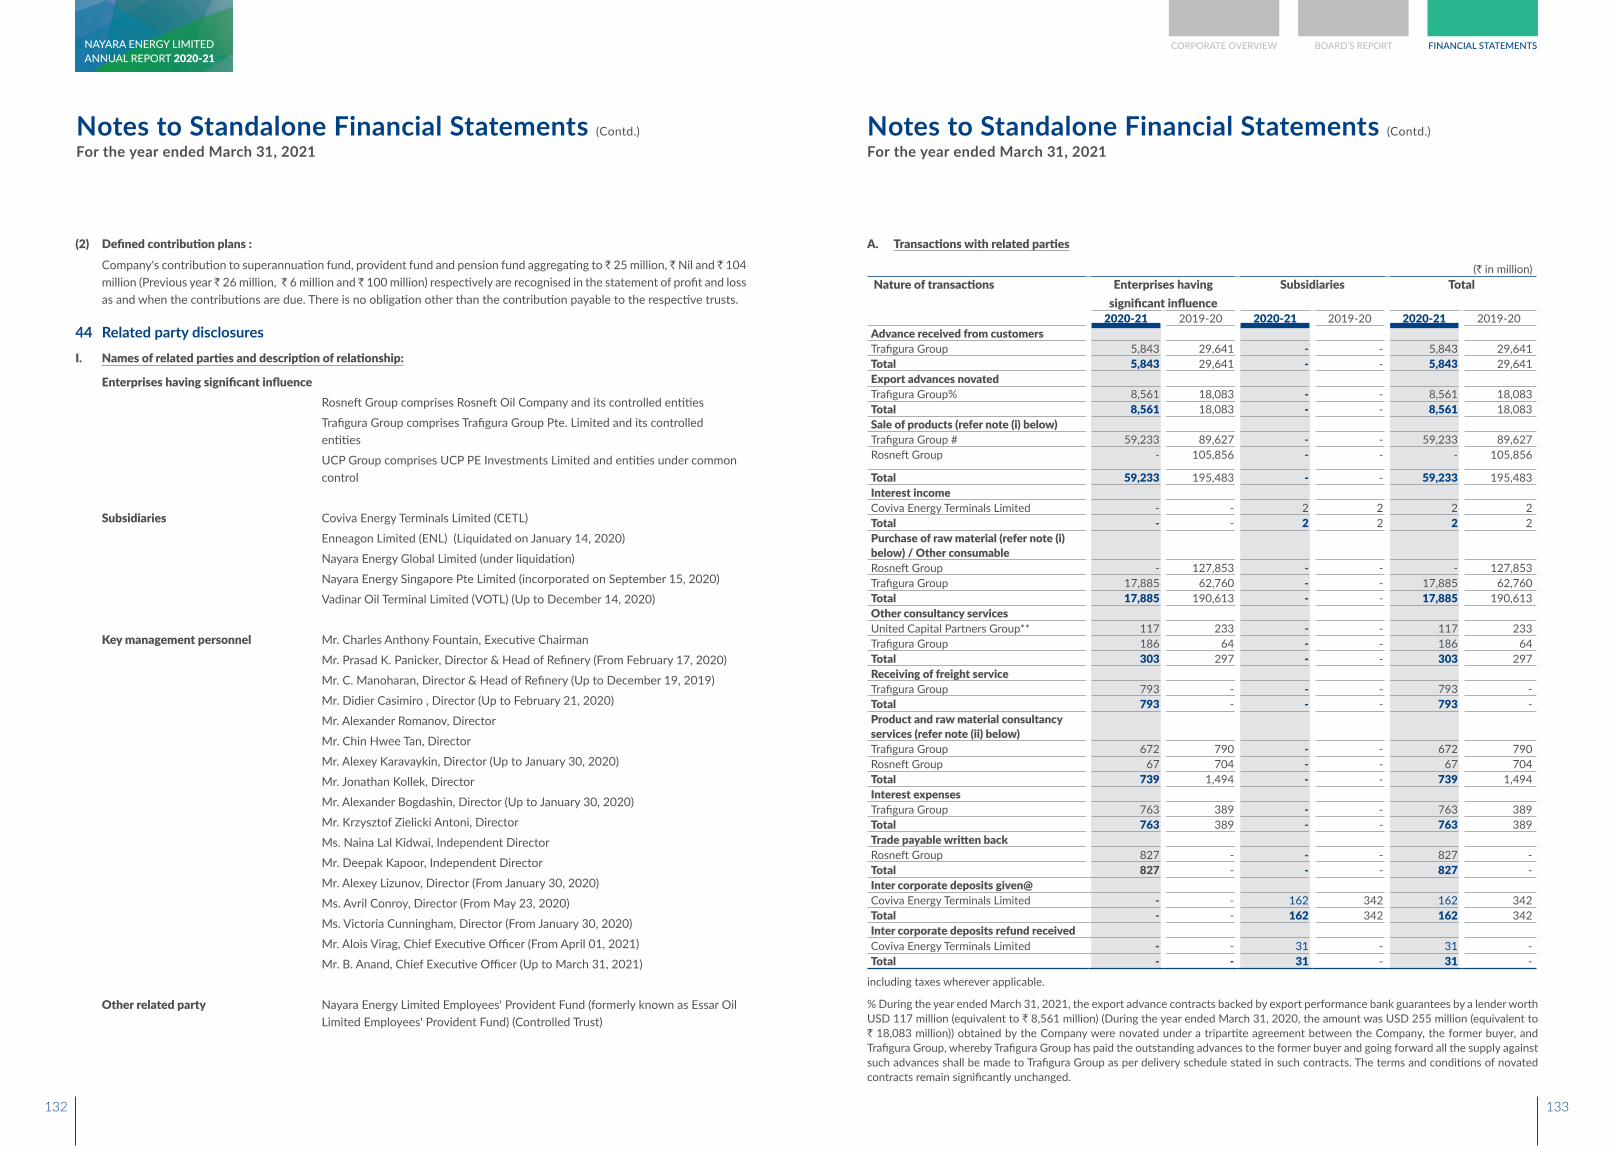
Notes to Standalone Financial Statements (Contd.)
For the year ended March 31, 2021Notes to Standalone Financial Statements (Contd.)
For the year ended March 31, 2021
(2) Defined contribution plans : Company's contribution to superannuation fund, provident fund and pension fund aggregating to ̀ 25 million, ̀ Nil and ̀ 104
million (Previous year ̀ 26 million, ̀ 6 million and ̀ 100 million) respectively are recognised in the statement of profit and loss as and when the contributions are due. There is no obligation other than the contribution payable to the respective trusts.
44 Related party disclosuresI. Names of related parties and description of relationship:
Enterprises having significant influenceRosneft Group comprises Rosneft Oil Company and its controlled entities
Trafigura Group comprises Trafigura Group Pte. Limited and its controlled entities
UCP Group comprises UCP PE Investments Limited and entities under common control
Subsidiaries Coviva Energy Terminals Limited (CETL)
Enneagon Limited (ENL) (Liquidated on January 14, 2020)
Nayara Energy Global Limited (under liquidation)
Nayara Energy Singapore Pte Limited (incorporated on September 15, 2020)
Vadinar Oil Terminal Limited (VOTL) (Up to December 14, 2020)
Key management personnel Mr. Charles Anthony Fountain, Executive Chairman
Mr. Prasad K. Panicker, Director & Head of Refinery (From February 17, 2020)
Mr. C. Manoharan, Director & Head of Refinery (Up to December 19, 2019)
Mr. Didier Casimiro , Director (Up to February 21, 2020)
Mr. Alexander Romanov, Director
Mr. Chin Hwee Tan, Director
Mr. Alexey Karavaykin, Director (Up to January 30, 2020)
Mr. Jonathan Kollek, Director
Mr. Alexander Bogdashin, Director (Up to January 30, 2020)
Mr. Krzysztof Zielicki Antoni, Director
Ms. Naina Lal Kidwai, Independent Director
Mr. Deepak Kapoor, Independent Director
Mr. Alexey Lizunov, Director (From January 30, 2020)
Ms. Avril Conroy, Director (From May 23, 2020)
Ms. Victoria Cunningham, Director (From January 30, 2020)
Mr. Alois Virag, Chief Executive Officer (From April 01, 2021)
Mr. B. Anand, Chief Executive Officer (Up to March 31, 2021)
Other related party Nayara Energy Limited Employees' Provident Fund (formerly known as Essar Oil Limited Employees' Provident Fund) (Controlled Trust)
A. Transactions with related parties
(` in million) Nature of transactions Enterprises having
significant influenceSubsidiaries Total
2020-21 2019-20 2020-21 2019-20 2020-21 2019-20Advance received from customersTrafigura Group 5,843 29,641 - - 5,843 29,641 Total 5,843 29,641 - - 5,843 29,641 Export advances novatedTrafigura Group% 8,561 18,083 - - 8,561 18,083 Total 8,561 18,083 - - 8,561 18,083 Sale of products (refer note (i) below)Trafigura Group # 59,233 89,627 - - 59,233 89,627 Rosneft Group - 105,856 - - - 105,856
Total 59,233 195,483 - - 59,233 195,483 Interest incomeCoviva Energy Terminals Limited - - 2 2 2 2 Total - - 2 2 2 2 Purchase of raw material (refer note (i) below) / Other consumableRosneft Group - 127,853 - - - 127,853 Trafigura Group 17,885 62,760 - - 17,885 62,760 Total 17,885 190,613 - - 17,885 190,613 Other consultancy services United Capital Partners Group** 117 233 - - 117 233 Trafigura Group 186 64 - - 186 64 Total 303 297 - - 303 297 Receiving of freight serviceTrafigura Group 793 - - - 793 - Total 793 - - - 793 - Product and raw material consultancy services (refer note (ii) below)Trafigura Group 672 790 - - 672 790 Rosneft Group 67 704 - - 67 704 Total 739 1,494 - - 739 1,494 Interest expensesTrafigura Group 763 389 - - 763 389 Total 763 389 - - 763 389 Trade payable written backRosneft Group 827 - - - 827 - Total 827 - - - 827 - Inter corporate deposits given@Coviva Energy Terminals Limited - - 162 342 162 342 Total - - 162 342 162 342 Inter corporate deposits refund received Coviva Energy Terminals Limited - - 31 - 31 -Total - - 31 - 31 -
including taxes wherever applicable.
% During the year ended March 31, 2021, the export advance contracts backed by export performance bank guarantees by a lender worth USD 117 million (equivalent to ` 8,561 million) (During the year ended March 31, 2020, the amount was USD 255 million (equivalent to ` 18,083 million)) obtained by the Company were novated under a tripartite agreement between the Company, the former buyer, and Trafigura Group, whereby Trafigura Group has paid the outstanding advances to the former buyer and going forward all the supply against such advances shall be made to Trafigura Group as per delivery schedule stated in such contracts. The terms and conditions of novated contracts remain significantly unchanged.
132 133
CORPORATE OVERVIEW BOARD’S REPORT FINANCIAL STATEMENTSANNUAL REPORT 2020-21NAYARA ENERGY LIMITED
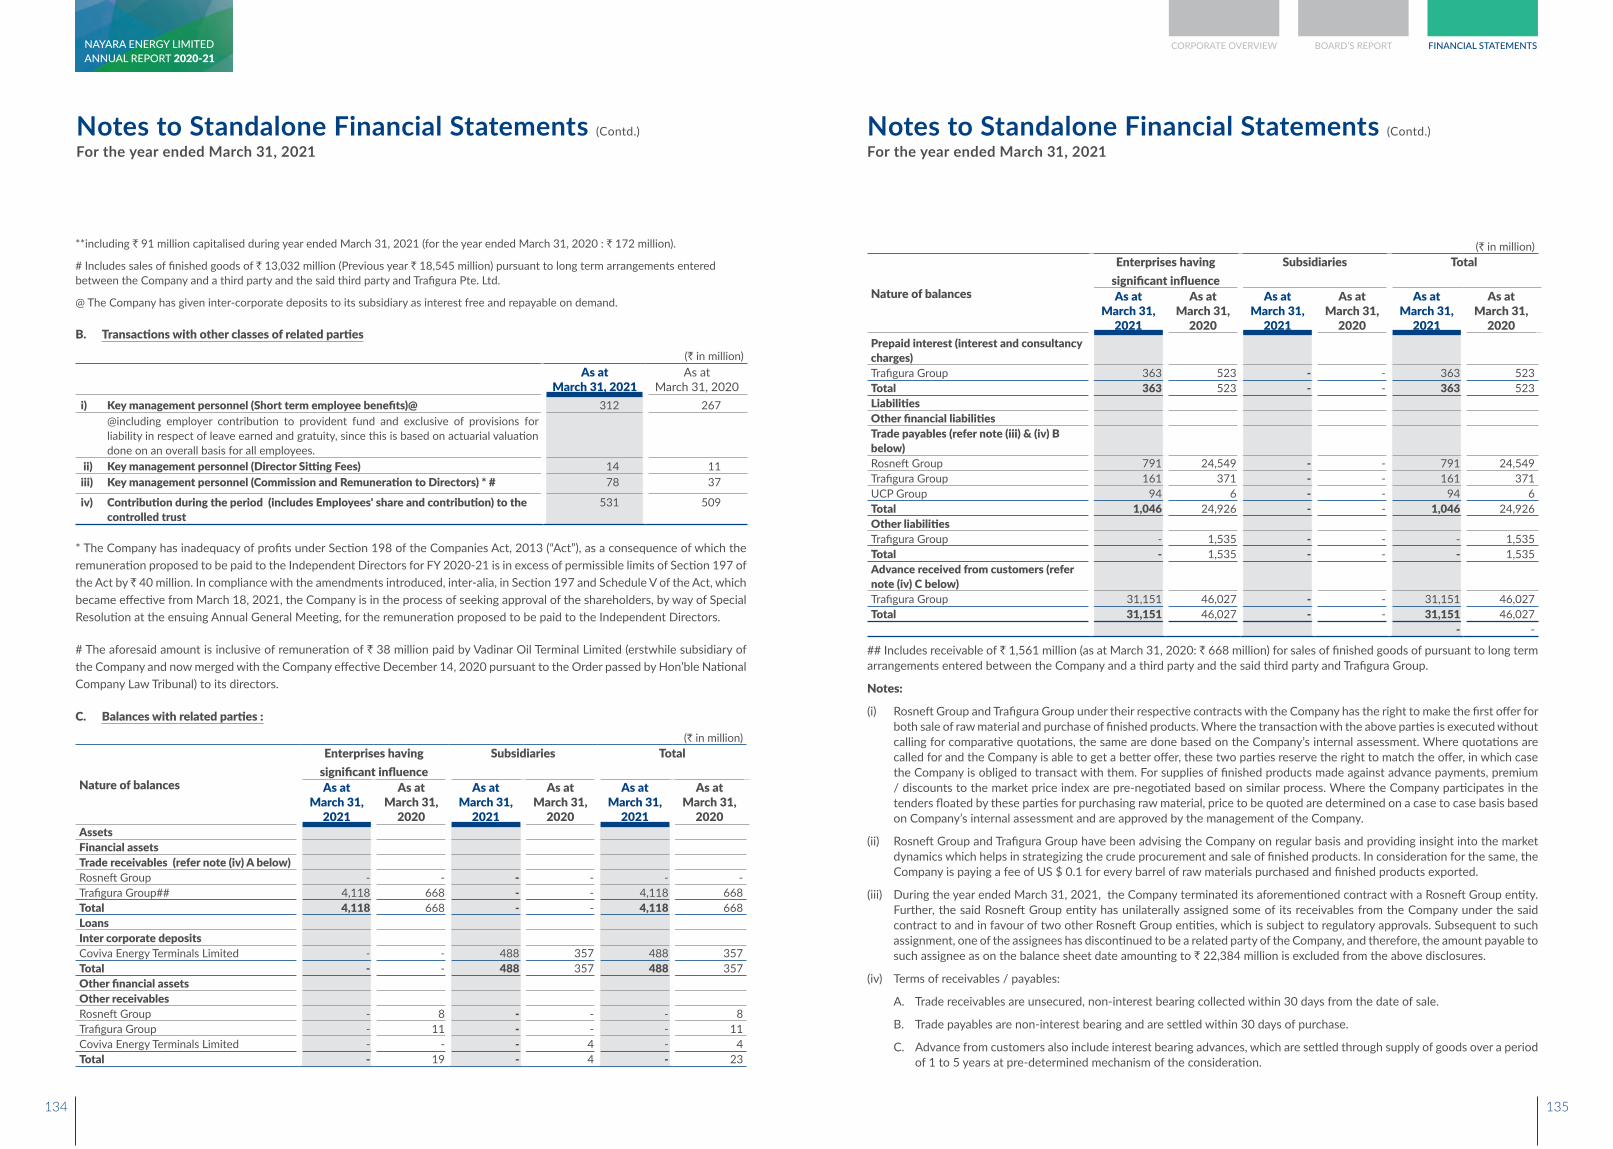
Notes to Standalone Financial Statements (Contd.)
For the year ended March 31, 2021Notes to Standalone Financial Statements (Contd.)
For the year ended March 31, 2021
**including ` 91 million capitalised during year ended March 31, 2021 (for the year ended March 31, 2020 : ` 172 million).
# Includes sales of finished goods of ` 13,032 million (Previous year ` 18,545 million) pursuant to long term arrangements entered between the Company and a third party and the said third party and Trafigura Pte. Ltd.
@ The Company has given inter-corporate deposits to its subsidiary as interest free and repayable on demand. B. Transactions with other classes of related parties
(` in million)As at
March 31, 2021As at
March 31, 2020i) Key management personnel (Short term employee benefits)@ 312 267 @including employer contribution to provident fund and exclusive of provisions for
liability in respect of leave earned and gratuity, since this is based on actuarial valuation done on an overall basis for all employees.
ii) Key management personnel (Director Sitting Fees) 14 11iii) Key management personnel (Commission and Remuneration to Directors) * # 78 37
iv) Contribution during the period (includes Employees' share and contribution) to the controlled trust
531 509
* The Company has inadequacy of profits under Section 198 of the Companies Act, 2013 (“Act”), as a consequence of which the remuneration proposed to be paid to the Independent Directors for FY 2020-21 is in excess of permissible limits of Section 197 of the Act by ` 40 million. In compliance with the amendments introduced, inter-alia, in Section 197 and Schedule V of the Act, which became effective from March 18, 2021, the Company is in the process of seeking approval of the shareholders, by way of Special Resolution at the ensuing Annual General Meeting, for the remuneration proposed to be paid to the Independent Directors.
# The aforesaid amount is inclusive of remuneration of ` 38 million paid by Vadinar Oil Terminal Limited (erstwhile subsidiary of the Company and now merged with the Company effective December 14, 2020 pursuant to the Order passed by Hon’ble National Company Law Tribunal) to its directors.
C. Balances with related parties :
(` in million)
Nature of balances
Enterprises having significant influence
Subsidiaries Total
As at March 31,
2021
As at March 31,
2020
As at March 31,
2021
As at March 31,
2020
As at March 31,
2021
As at March 31,
2020AssetsFinancial assetsTrade receivables (refer note (iv) A below)Rosneft Group - - - - - -Trafigura Group## 4,118 668 - - 4,118 668Total 4,118 668 - - 4,118 668LoansInter corporate depositsCoviva Energy Terminals Limited - - 488 357 488 357Total - - 488 357 488 357Other financial assetsOther receivablesRosneft Group - 8 - - - 8Trafigura Group - 11 - - - 11Coviva Energy Terminals Limited - - - 4 - 4Total - 19 - 4 - 23
(` in million)
Nature of balances
Enterprises having significant influence
Subsidiaries Total
As at March 31,
2021
As at March 31,
2020
As at March 31,
2021
As at March 31,
2020
As at March 31,
2021
As at March 31,
2020Prepaid interest (interest and consultancy charges)Trafigura Group 363 523 - - 363 523Total 363 523 - - 363 523LiabilitiesOther financial liabilitiesTrade payables (refer note (iii) & (iv) B below)Rosneft Group 791 24,549 - - 791 24,549Trafigura Group 161 371 - - 161 371UCP Group 94 6 - - 94 6Total 1,046 24,926 - - 1,046 24,926Other liabilitiesTrafigura Group - 1,535 - - - 1,535Total - 1,535 - - - 1,535Advance received from customers (refer note (iv) C below)Trafigura Group 31,151 46,027 - - 31,151 46,027Total 31,151 46,027 - - 31,151 46,027
- -
## Includes receivable of ` 1,561 million (as at March 31, 2020: ` 668 million) for sales of finished goods of pursuant to long term arrangements entered between the Company and a third party and the said third party and Trafigura Group.
Notes:
(i) Rosneft Group and Trafigura Group under their respective contracts with the Company has the right to make the first offer for both sale of raw material and purchase of finished products. Where the transaction with the above parties is executed without calling for comparative quotations, the same are done based on the Company’s internal assessment. Where quotations are called for and the Company is able to get a better offer, these two parties reserve the right to match the offer, in which case the Company is obliged to transact with them. For supplies of finished products made against advance payments, premium / discounts to the market price index are pre-negotiated based on similar process. Where the Company participates in the tenders floated by these parties for purchasing raw material, price to be quoted are determined on a case to case basis based on Company’s internal assessment and are approved by the management of the Company.
(ii) Rosneft Group and Trafigura Group have been advising the Company on regular basis and providing insight into the market dynamics which helps in strategizing the crude procurement and sale of finished products. In consideration for the same, the Company is paying a fee of US $ 0.1 for every barrel of raw materials purchased and finished products exported.
(iii) During the year ended March 31, 2021, the Company terminated its aforementioned contract with a Rosneft Group entity. Further, the said Rosneft Group entity has unilaterally assigned some of its receivables from the Company under the said contract to and in favour of two other Rosneft Group entities, which is subject to regulatory approvals. Subsequent to such assignment, one of the assignees has discontinued to be a related party of the Company, and therefore, the amount payable to such assignee as on the balance sheet date amounting to ` 22,384 million is excluded from the above disclosures.
(iv) Terms of receivables / payables:
A. Trade receivables are unsecured, non-interest bearing collected within 30 days from the date of sale.
B. Trade payables are non-interest bearing and are settled within 30 days of purchase.
C. Advance from customers also include interest bearing advances, which are settled through supply of goods over a period of 1 to 5 years at pre-determined mechanism of the consideration.
134 135
CORPORATE OVERVIEW BOARD’S REPORT FINANCIAL STATEMENTSANNUAL REPORT 2020-21NAYARA ENERGY LIMITED
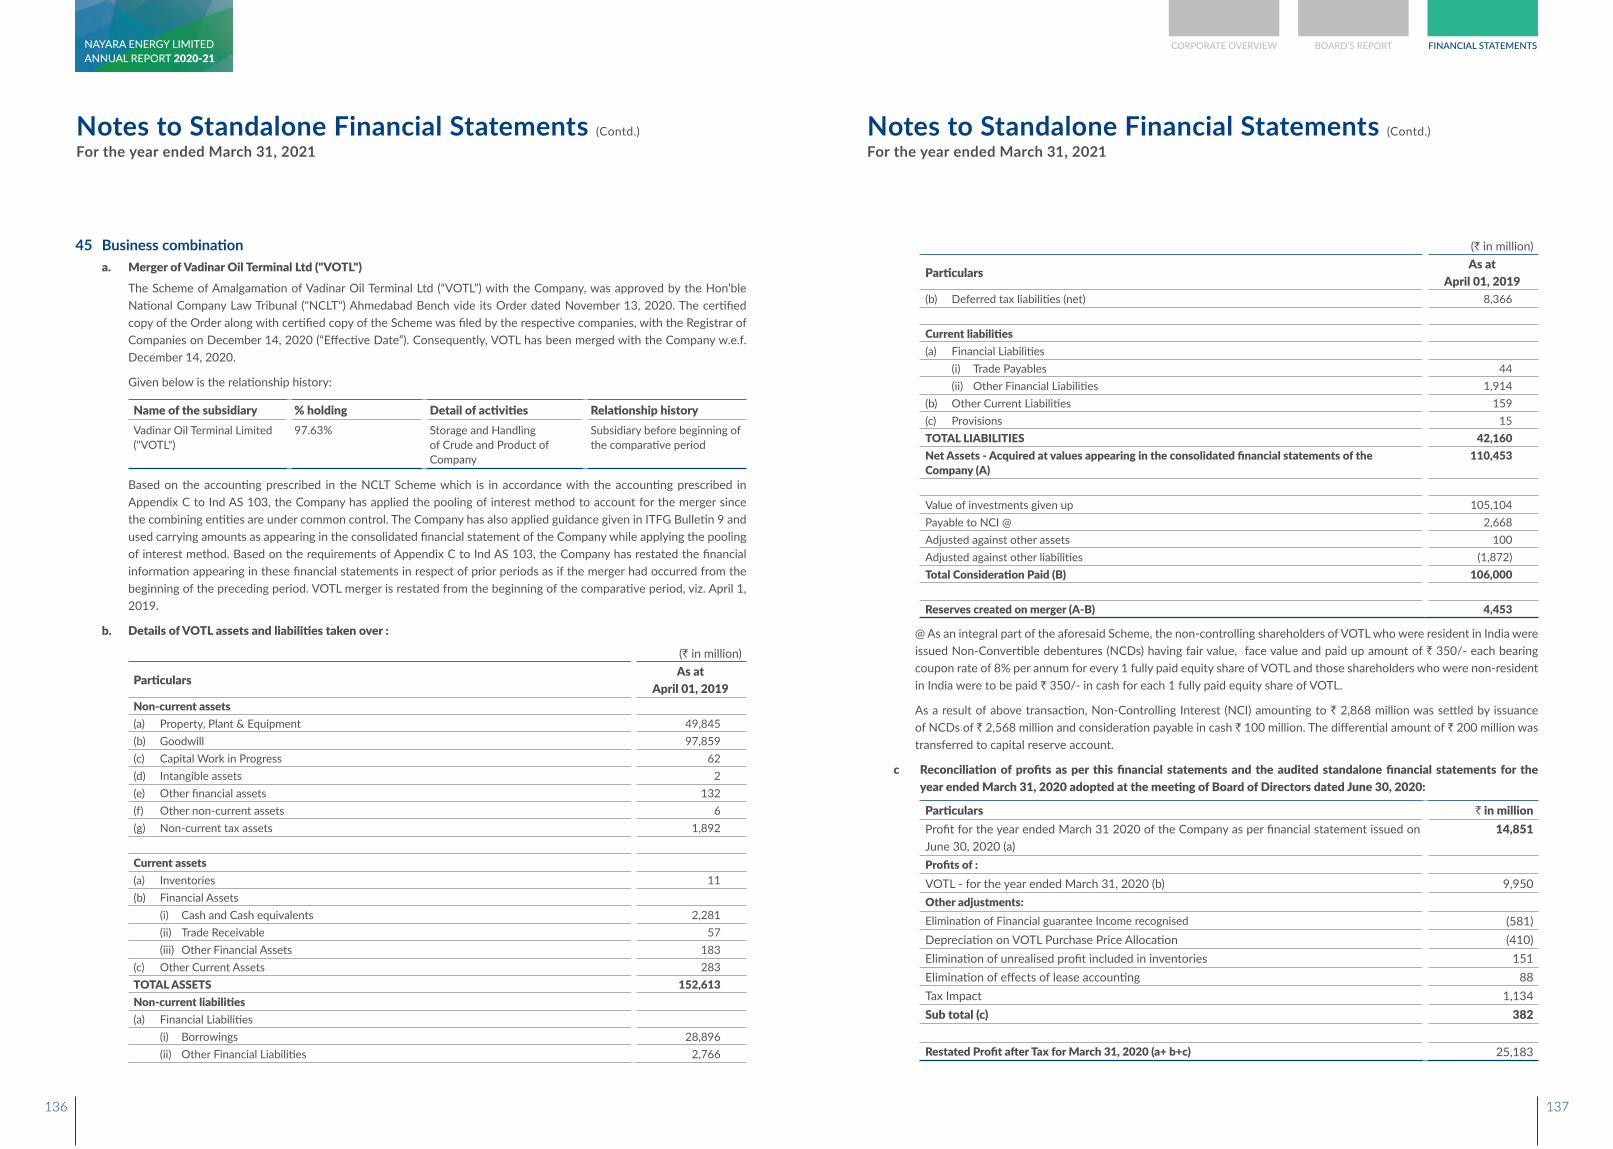
Notes to Standalone Financial Statements (Contd.)
For the year ended March 31, 2021Notes to Standalone Financial Statements (Contd.)
For the year ended March 31, 2021
45 Business combinationa. Merger of Vadinar Oil Terminal Ltd ("VOTL") The Scheme of Amalgamation of Vadinar Oil Terminal Ltd (“VOTL”) with the Company, was approved by the Hon’ble
National Company Law Tribunal ("NCLT") Ahmedabad Bench vide its Order dated November 13, 2020. The certified copy of the Order along with certified copy of the Scheme was filed by the respective companies, with the Registrar of Companies on December 14, 2020 (“Effective Date”). Consequently, VOTL has been merged with the Company w.e.f. December 14, 2020.
Given below is the relationship history:
Name of the subsidiary % holding Detail of activities Relationship historyVadinar Oil Terminal Limited ("VOTL")
97.63% Storage and Handling of Crude and Product of Company
Subsidiary before beginning of the comparative period
Based on the accounting prescribed in the NCLT Scheme which is in accordance with the accounting prescribed in Appendix C to Ind AS 103, the Company has applied the pooling of interest method to account for the merger since the combining entities are under common control. The Company has also applied guidance given in ITFG Bulletin 9 and used carrying amounts as appearing in the consolidated financial statement of the Company while applying the pooling of interest method. Based on the requirements of Appendix C to Ind AS 103, the Company has restated the financial information appearing in these financial statements in respect of prior periods as if the merger had occurred from the beginning of the preceding period. VOTL merger is restated from the beginning of the comparative period, viz. April 1, 2019.
b. Details of VOTL assets and liabilities taken over :
(` in million)
ParticularsAs at
April 01, 2019Non-current assets(a) Property, Plant & Equipment 49,845(b) Goodwill 97,859(c) Capital Work in Progress 62(d) Intangible assets 2(e) Other financial assets 132(f) Other non-current assets 6(g) Non-current tax assets 1,892
Current assets(a) Inventories 11(b) Financial Assets (i) Cash and Cash equivalents 2,281 (ii) Trade Receivable 57 (iii) Other Financial Assets 183(c) Other Current Assets 283TOTAL ASSETS 152,613Non-current liabilities(a) Financial Liabilities (i) Borrowings 28,896 (ii) Other Financial Liabilities 2,766
(` in million)
ParticularsAs at
April 01, 2019(b) Deferred tax liabilities (net) 8,366
Current liabilities(a) Financial Liabilities (i) Trade Payables 44 (ii) Other Financial Liabilities 1,914(b) Other Current Liabilities 159(c) Provisions 15TOTAL LIABILITIES 42,160Net Assets - Acquired at values appearing in the consolidated financial statements of the Company (A)
110,453
Value of investments given up 105,104Payable to NCI @ 2,668Adjusted against other assets 100Adjusted against other liabilities (1,872)Total Consideration Paid (B) 106,000
Reserves created on merger (A-B) 4,453
@ As an integral part of the aforesaid Scheme, the non-controlling shareholders of VOTL who were resident in India were issued Non-Convertible debentures (NCDs) having fair value, face value and paid up amount of ` 350/- each bearing coupon rate of 8% per annum for every 1 fully paid equity share of VOTL and those shareholders who were non-resident in India were to be paid ` 350/- in cash for each 1 fully paid equity share of VOTL.
As a result of above transaction, Non-Controlling Interest (NCI) amounting to ` 2,868 million was settled by issuance of NCDs of ` 2,568 million and consideration payable in cash ` 100 million. The differential amount of ` 200 million was transferred to capital reserve account.
c Reconciliation of profits as per this financial statements and the audited standalone financial statements for the year ended March 31, 2020 adopted at the meeting of Board of Directors dated June 30, 2020:
Particulars ` in millionProfit for the year ended March 31 2020 of the Company as per financial statement issued on June 30, 2020 (a)
14,851
Profits of :VOTL - for the year ended March 31, 2020 (b) 9,950 Other adjustments:Elimination of Financial guarantee Income recognised (581)Depreciation on VOTL Purchase Price Allocation (410)Elimination of unrealised profit included in inventories 151 Elimination of effects of lease accounting 88 Tax Impact 1,134 Sub total (c) 382
Restated Profit after Tax for March 31, 2020 (a+ b+c) 25,183
136 137
CORPORATE OVERVIEW BOARD’S REPORT FINANCIAL STATEMENTSANNUAL REPORT 2020-21NAYARA ENERGY LIMITED
Notes to Standalone Financial Statements (Contd.)
For the year ended March 31, 2021Notes to Standalone Financial Statements (Contd.)
For the year ended March 31, 2021
46 Impairment testing of Goodwill The Company recognised goodwill of ̀ 1,08,184 million arising on the merger of Vadinar Power Company Limited (VPCL), Nayara
Energy Properties Limited (NEPL), and Vadinar Oil Terminal Limited (VOTL) with the Company. The Company has determined that its entire operations fall into single CGU and single operating segment, viz., refining of crude oil and marketing of petroleum products in domestic and overseas market (refining business). Hence, the entire goodwill is allocable to the refining business CGU / segment and the carrying value of the CGU as at the balance sheet date is ̀ 549,071 million [March 31, 2020 (restated): ̀ 557,032 million]. The Company performed its annual impairment test for the financial year ended March 31, 2021 as at year end.
The recoverable amount of the CGU has been determined at ̀ 726,888 (US$ 9,889) million [March 31, 2020: ̀ 635,955 (US$ 8,436) million] based on the value in use calculation using discounted cash flow model {refer note 4(B)(iii)} based on business assumptions approved by management covering a five-year period and is in line with the business plan presented to the Board. The Company has considered forecast consensus, industry reports, economic indicators and general business conditions to make an assessment of the implications of the COVID-19 pandemic upto the date of approval of these financial statements. The Company has performed sensitivity analysis on the assumptions used basis the internal and external information / indicators of future economic conditions. Since the value in use is higher than the carrying amount of the refining business CGU, the Company has not determined the fair value less costs of disposal separately.
Key assumptions used for value in use calculations:The calculation of value in use for the unit is most sensitive to the following assumptions:
Gross Refining Margin (GRM) – The GRM projections, which is a difference between total product revenue and total feedstock cost for the year, are broadly in line with the 5 year business plan of the CGU. The GRMs are estimated to be in the range from US$ 4.7 per bbl to US$ 7.9 per bbl during FY 2021-22 to FY 2025-26 and thereafter they increase at a nominal rate of 2% per annum post the 5 year period. A US$ 0.5 per bbl change in the projected GRM over the forecast period would lead to a change in the recoverable value by ` 41,016 million (US$ 558 million).
Discount rates - Discount rates represent the current market assessment of the risks specific to the CGU, taking into consideration the time value of money and individual risks of the underlying assets that have not been incorporated in the cash flow estimates. The discount rate calculation is based on the specific circumstances of the Company and its operating segments and is derived from its weighted average cost of capital (WACC). The WACC takes into account both debt and equity. The cost of equity is derived from the expected return on investment by the Company. The cost of debt is based on the interest-bearing borrowings the Company is obliged to service. Segment-specific risk is incorporated by applying individual beta factors. The beta factors are evaluated annually based on publicly available market data. Adjustments to the discount rate are made to factor in the specific amount and timing of the future tax flows in order to reflect a pre-tax discount rate. Accordingly, the Company has estimated a discount rate of 10.2%. An increase in the discount rate by 50 basis points leads to decline in the recoverable value by ` 40,942 million (US$ 557 million).
Considering the above, the management has assessed that any reasonable possible change in assumptions will not trigger recognition of impairment.
47 Impact of COVID-19 The outbreak of coronavirus (COVID-19) pandemic globally and in India is having significant impact on the economic activity.
The Company, being in the business of essential commodity i.e. petroleum products, continued operating even during the lockdown period while adhering to the Government regulations on COVID-19 for safety of workforce. The Company’s total revenue from operations and gross refinery margins for the period were impacted due to lower demand for the financial year ended March 31, 2021 as compared to the previous financial year ended March 31, 2020.
The impact assessment of pandemic is a continuing process given the uncertainties associated, the Company has analysed the impact caused by COVID-19 considering the market conditions and other developments upto the date of approval of these financial statements. Among other matters, impact of reduction in the demand and realization has been factored in evaluating the Company’s ability to be a going concern for at least 12 months after the reporting date and impairment of non-financial assets (refer note 46 for impairment analysis). The Company has considered its expected future cash flows, available lines of credit and ability to raise short term funds in arriving at the conclusion that it remains a going concern and has also performed additional sensitivities on some of its key inputs to validate its assumption of going concern. The management believes that COVID-19 impact, if any, is short-term and there will be no medium to long-term impact on the Company or its financial position or financial performance. Despite the volatile market scenario, the Company’s supply network and the risk management action have resulted in protecting the Company’s cash flows significantly in the near future. Basis the above evaluation, the management has concluded that there is no significant impact on the operations or financial position on the Company. However, the impact of the global health pandemic may be different from that estimated at the date of approval of these financial statements and the Company will continue to closely monitor any material changes to future economic conditions and assess its impact on the financial position of the Company.
48 Segment information Segment information has been provided under the Notes to the Consolidated financial statements.
As per our report of even date For and on behalf of the Board of Directors
For S. R. Batliboi & Co. LLP Chartered Accountants Firm Registration No. 301003E/E300005
Charles Anthony Fountain Executive ChairmanDIN : 07719852Sussex, United Kingdom
Prasad K. Panicker DirectorDIN : 06476857Devbhumi Dwarka, India
per Naman Agarwal Partner Membership No. 502405 New Delhi, July 01, 2021
Alois Virag Chief Executive Officer
Mumbai, India
Anup Vikal Chief Financial Officer
Mumbai, India
Mayank Bhargava Company Secretary Thane, India July 01, 2021
138 139
CORPORATE OVERVIEW BOARD’S REPORT FINANCIAL STATEMENTSANNUAL REPORT 2020-21NAYARA ENERGY LIMITED

CONSOLIDATEDFINANCIAL STATEMENTS
140 141140 141
To the Members of Nayara Energy Limited
Report on the Audit of the Consolidated Financial StatementsOpinion
We have audited the accompanying consolidated financial statements of Nayara Energy Limited (hereinafter referred to as “the Holding Company”), and its subsidiaries (the Holding Company and its subsidiaries together referred to as “the Group”) comprising of the consolidated Balance sheet as at March 31, 2021, the consolidated Statement of Profit and Loss, including Other Comprehensive Income and the consolidated Cash Flow Statement and the Consolidated Statement of Changes in Equity for the year then ended, and notes to the consolidated financial statements, including a summary of significant accounting policies and other explanatory information (hereinafter referred to as “the consolidated financial statements”).
In our opinion and to the best of our information and according to the explanations given to us, the aforesaid consolidated financial statements give the information required by the Companies Act, 2013 (“the Act”), as amended, in the manner so required and give a true and fair view in conformity with the accounting principles generally accepted in India, of the consolidated state of affairs of the Group, as at March 31, 2021, their consolidated profit including other comprehensive income, their consolidated cash flows and the consolidated statement of changes in equity for the year ended on that date.
Basis for Opinion
We conducted our audit of the consolidated financial statements in accordance with the Standards on Auditing (SAs), as specified under section 143(10) of the Act. Our responsibilities under those Standards are further described in the ‘Auditor’s Responsibilities for the Audit of the Consolidated Financial Statements’ section of our report. We are independent of the Group, in accordance with the ‘Code of Ethics’ issued by the Institute of Chartered Accountants of India together with the ethical requirements that are relevant to our audit of the financial statements under the provisions of the Act and the Rules thereunder, and we have fulfilled our other ethical responsibilities in accordance with these requirements and the Code of Ethics. We believe that the audit evidence we have obtained is sufficient and appropriate to provide a basis for our audit opinion on the consolidated financial statements.
Other Information
The Holding Company’s Board of Directors is responsible for the other information. The other information comprises the
information included in the Annual Report, but does not include the consolidated financial statements and our auditor’s report thereon.
Our opinion on the consolidated financial statements does not cover the other information and we do not express any form of assurance conclusion thereon.
In connection with our audit of the consolidated financial statements, our responsibility is to read the other information and, in doing so, consider whether such other information is materially inconsistent with the consolidated financial statements or our knowledge obtained in the audit or otherwise appears to be materially misstated. If, based on the work we have performed, we conclude that there is a material misstatement of this other information, we are required to report that fact. We have nothing to report in this regard.
Responsibilities of Management for the Consolidated Financial StatementsThe Holding Company’s Board of Directors is responsible for the preparation and presentation of these consolidated financial statements in terms of the requirements of the Act that give a true and fair view of the consolidated financial position, consolidated financial performance including other comprehensive income, consolidated cash flows and consolidated statement of changes in equity of the Group in accordance with the accounting principles generally accepted in India, including the Companies (Accounting Standards) Rules, 2006 specified under section 133 of the Act, read with the Companies (Accounts) Rules, 2015 (as amended). The respective Board of Directors of the companies included in the Group are responsible for maintenance of adequate accounting records in accordance with the provisions of the Act for safeguarding of the assets of the Group and for preventing and detecting frauds and other irregularities; selection and application of appropriate accounting policies; making judgments and estimates that are reasonable and prudent; and the design, implementation and maintenance of adequate internal financial controls, that were operating effectively for ensuring the accuracy and completeness of the accounting records, relevant to the preparation and presentation of the consolidated financial statements that give a true and fair view and are free from material misstatement, whether due to fraud or error, which have been used for the purpose of preparation of the consolidated financial statements by the Board of Directors of the Holding Company, as aforesaid.
In preparing the consolidated financial statements, the respective Board of Directors of the Companies included in the Group are responsible for assessing the ability of the Group to continue as a going concern, disclosing, as applicable, matters
Independent Auditor’s Report
related to going concern and using the going concern basis of accounting unless management either intends to liquidate the Group or to cease operations, or has no realistic alternative but to do so.
Those Board of Directors of the companies included in the Group are also responsible for overseeing the financial reporting process of the Group.
Auditor’s Responsibilities for the Audit of the Consolidated Financial StatementsOur objectives are to obtain reasonable assurance about whether the consolidated financial statements as a whole are free from material misstatement, whether due to fraud or error, and to issue an auditor’s report that includes our opinion. Reasonable assurance is a high level of assurance but is not a guarantee that an audit conducted in accordance with SAs will always detect a material misstatement when it exists. Misstatements can arise from fraud or error and are considered material if, individually or in the aggregate, they could reasonably be expected to influence the economic decisions of users taken on the basis of these consolidated financial statements.
As part of an audit in accordance with SAs, we exercise professional judgment and maintain professional skepticism throughout the audit. We also:
• Identify and assess the risks of material misstatement of the consolidated financial statements, whether due to fraud or error, design and perform audit procedures responsive to those risks, and obtain audit evidence that is sufficient and appropriate to provide a basis for our opinion. The risk of not detecting a material misstatement resulting from fraud is higher than for one resulting from error, as fraud may involve collusion, forgery, intentional omissions, misrepresentations, or the override of internal control.
• Obtain an understanding of internal control relevant to the audit in order to design audit procedures that are appropriate in the circumstances. Under section 143(3)(i) of the Act, we are also responsible for expressing our opinion on whether the Holding Company has adequate internal financial controls with reference to financial statements in place and the operating effectiveness of such controls.
• Evaluate the appropriateness of accounting policies used and the reasonableness of accounting estimates and related disclosures made by management.
• Conclude on the appropriateness of management’s use of the going concern basis of accounting and, based on the audit evidence obtained, whether a material uncertainty exists related to events or conditions that may cast
significant doubt on the ability of the Group to continue as a going concern. If we conclude that a material uncertainty exists, we are required to draw attention in our auditor’s report to the related disclosures in the consolidated financial statements or, if such disclosures are inadequate, to modify our opinion. Our conclusions are based on the audit evidence obtained up to the date of our auditor’s report. However, future events or conditions may cause the Group to cease to continue as a going concern.
• Evaluate the overall presentation, structure and content of the consolidated financial statements, including the disclosures, and whether the consolidated financial statements represent the underlying transactions and events in a manner that achieves fair presentation.
• Obtain sufficient appropriate audit evidence regarding the financial information of the entities or business activities within the Group of which we are the independent auditors, to express an opinion on the consolidated financial statements. We are responsible for the direction, supervision and performance of the audit of the financial statements of such entities included in the consolidated financial statements of which we are the independent auditors.
We communicate with those charged with governance of the Holding Company and such other entities included in the consolidated financial statements of which we are the independent auditors regarding, among other matters, the planned scope and timing of the audit and significant audit findings, including any significant deficiencies in internal control that we identify during our audit.
We also provide those charged with governance with a statement that we have complied with relevant ethical requirements regarding independence, and to communicate with them all relationships and other matters that may reasonably be thought to bear on our independence, and where applicable, related safeguards.
Other MatterThe accompanying consolidated financial statements include unaudited financial statements and other unaudited financial information in respect of one subsidiary, whose financial statements and other financial information reflect total assets of INR 15 million as at March 31, 2021, total revenues and net cash (inflows) of INR Nil and INR 4 million respectively, for the year ended on that date. These unaudited financial statements and other unaudited financial information have been furnished to us by the management. Our opinion, in so far as it relates amounts and disclosures included in respect of the subsidiary, and our report in terms of sub-sections (3) of Section 143
Independent Auditor’s Report (Contd.)
142 143
CORPORATE OVERVIEW BOARD’S REPORT FINANCIAL STATEMENTSANNUAL REPORT 2020-21NAYARA ENERGY LIMITED
of the Act in so far as it relates to the aforesaid subsidiary, is based solely on such unaudited financial statement and other unaudited financial information. In our opinion and according to the information and explanations given to us by the Management, these financial statements and other financial information are not material to the Group.
Our opinion above on the consolidated financial statements, and our report on Other Legal and Regulatory Requirements below, is not modified in respect of the above matters with respect to our reliance on the financial statements and other financial information certified by the Management.
Report on Other Legal and Regulatory RequirementsAs required by Section 143(3) of the Act, based on our audit, we report, to the extent applicable, that:
(a) We have relied upon have sought and obtained all the information and explanations which to the best of our knowledge and belief were necessary for the purposes of our audit of the aforesaid consolidated financial statements;
(b) In our opinion, proper books of account as required by law relating to preparation of the aforesaid consolidation of the financial statements have been kept so far as it appears from our examination of those books;
(c) The Consolidated Balance Sheet, the Consolidated Statement of Profit and Loss including Consolidated Statement of Other Comprehensive Income, the Consolidated Cash Flow Statement and Consolidated Statement of Changes in Equity dealt with by this Report are in agreement with the books of account maintained for the purpose of preparation of the consolidated financial statements;
(d) In our opinion, the aforesaid consolidated financial statements comply with the Companies (Accounting Standards) Rules, 2006 specified under section 133 of the Act, read with the Companies (Accounts) Rules, 2015 (as amended);
(e) On the basis of the written representations received from the directors of the Holding Company as on March 31, 2021 and the directors of its subsidiary company taken on record by the respective Board of Directors of the Holding Company and subsidiary company, none of the directors of the Group’s companies, incorporated in India is disqualified as on March 31, 2021 from being appointed as a director in terms of Section 164 (2) of the Act;
(f) With respect to the adequacy and the operating effectiveness of the internal financial controls with reference to these consolidated financial statements of the Holding Company and its subsidiary company incorporated in India, refer to our separate Report in “Annexure 1” to this report;
(g) In our opinion, the managerial remuneration for the year ended March 31, 2021 has been paid / provided by the Company to its directors in excess of the amount permissible under the provisions of section 197 read with Schedule V to the Act (refer note 46). As stated in the said note, the Company proposes to obtain necessary shareholder approval in the ensuing annual general meeting;
(h) With respect to the other matters to be included in the Auditor’s Report in accordance with Rule 11 of the Companies (Audit and Auditors) Rules, 2014, as amended, in our opinion and to the best of our information and according to the explanations given to us:
i. The consolidated financial statements disclose the impact of pending litigations on its consolidated financial position of the Group, in its consolidated financial statements – Refer note 35 to the consolidated financial statements;
ii. Provision has been made in the consolidated financial statements, as required under the applicable law or accounting standards, for material foreseeable losses, if any, on long-term contracts including derivative contracts – Refer note 19 and 24 to the consolidated financial statements in respect of such items as it relates to the Group;
iii. There were no amounts which were required to be transferred to the Investor Education and Protection Fund by the Holding Company, its subsidiary incorporated in India during the year ended March 31, 2021.
For S.R. Batliboi & Co. LLP Chartered Accountants
ICAI Firm Registration Number: 301003E/E300005
per Naman Agarwal Partner
Membership Number: 502405 UDIN: 21502405AAAABX3820
Place of Signature: New Delhi Date: July 1, 2021
Independent Auditor’s Report (Contd.)
TO THE INDEPENDENT AUDITOR’S REPORT OF EVEN DATE ON THE CONSOLIDATED FINANCIAL STATEMENTS OF NAYARA ENERGYLIMTED Report on the Internal Financial Controls under Clause (i) of Sub-section 3 of Section 143 of the Companies Act, 2013 (“the Act”)
In conjunction with our audit of the consolidated financial statements of Nayara Energy Limited (hereinafter referred to as the “Holding Company”) as of and for the year ended March 31, 2021, we have audited the internal financial controls with reference to consolidated financial statements of the Holding Company and its subsidiary (the Holding Company and its subsidiary together referred to as “the Group”), which are companies incorporated in India, as of that date.
Management’s Responsibility for Internal Financial Controls
The respective Board of Directors of the companies included in the Group, which are companies incorporated in India, are responsible for establishing and maintaining internal financial controls based on the internal control over financial reporting criteria established by the Holding Company considering the essential components of internal control stated in the Guidance Note on Audit of Internal Financial Controls Over Financial Reporting issued by the Institute of Chartered Accountants of India (ICAI). These responsibilities include the design, implementation and maintenance of adequate internal financial controls that were operating effectively for ensuring the orderly and efficient conduct of its business, including adherence to the respective company’s policies, the safeguarding of its assets, the prevention and detection of frauds and errors, the accuracy and completeness of the accounting records, and the timely preparation of reliable financial information, as required under the Companies Act, 2013.
Auditor’s Responsibility
Our responsibility is to express an opinion on the Holding Company's internal financial controls with reference to consolidated financial statements based on our audit. We conducted our audit in accordance with the Guidance Note on Audit of Internal Financial Controls Over Financial Reporting (the “Guidance Note”) and the Standards on Auditing, specified under section 143(10) of the Act, to the extent applicable to an audit of internal financial controls, both, issued by ICAI. Those Standards and the Guidance Note require that we comply with ethical requirements and plan and perform the audit to
obtain reasonable assurance about whether adequate internal financial controls with reference to consolidated financial statements was established and maintained and if such controls operated effectively in all material respects.
Our audit involves performing procedures to obtain audit evidence about the adequacy of the internal financial controls with reference to consolidated financial statements and their operating effectiveness. Our audit of internal financial controls with reference to consolidated financial statements included obtaining an understanding of internal financial controls with reference to consolidated financial statements, assessing the risk that a material weakness exists, and testing and evaluating the design and operating effectiveness of internal control based on the assessed risk. The procedures selected depend on the auditor’s judgement, including the assessment of the risks of material misstatement of the financial statements, whether due to fraud or error.
We believe that the audit evidence we have obtained is sufficient and appropriate to provide a basis for our audit opinion on the internal financial controls with reference to consolidated financial statements.
Meaning of Internal Financial Controls Over Financial Reporting With Reference to these Consolidated Financial Statements
A company's internal financial control over financial reporting with reference to these consolidated financial statements is a process designed to provide reasonable assurance regarding the reliability of financial reporting and the preparation of financial statements for external purposes in accordance with generally accepted accounting principles. A company's internal financial control over financial reporting with reference to consolidated financial statements includes those policies and procedures that (1) pertain to the maintenance of records that, in reasonable detail, accurately and fairly reflect the transactions and dispositions of the assets of the company; (2) provide reasonable assurance that transactions are recorded as necessary to permit preparation of financial statements in accordance with generally accepted accounting principles, and that receipts and expenditures of the company are being made only in accordance with authorisations of management and directors of the company; and (3) provide reasonable assurance regarding prevention or timely detection of unauthorised acquisition, use, or disposition of the company's assets that could have a material effect on the financial statements.
Annexure 1
144 145
CORPORATE OVERVIEW BOARD’S REPORT FINANCIAL STATEMENTSANNUAL REPORT 2020-21NAYARA ENERGY LIMITED
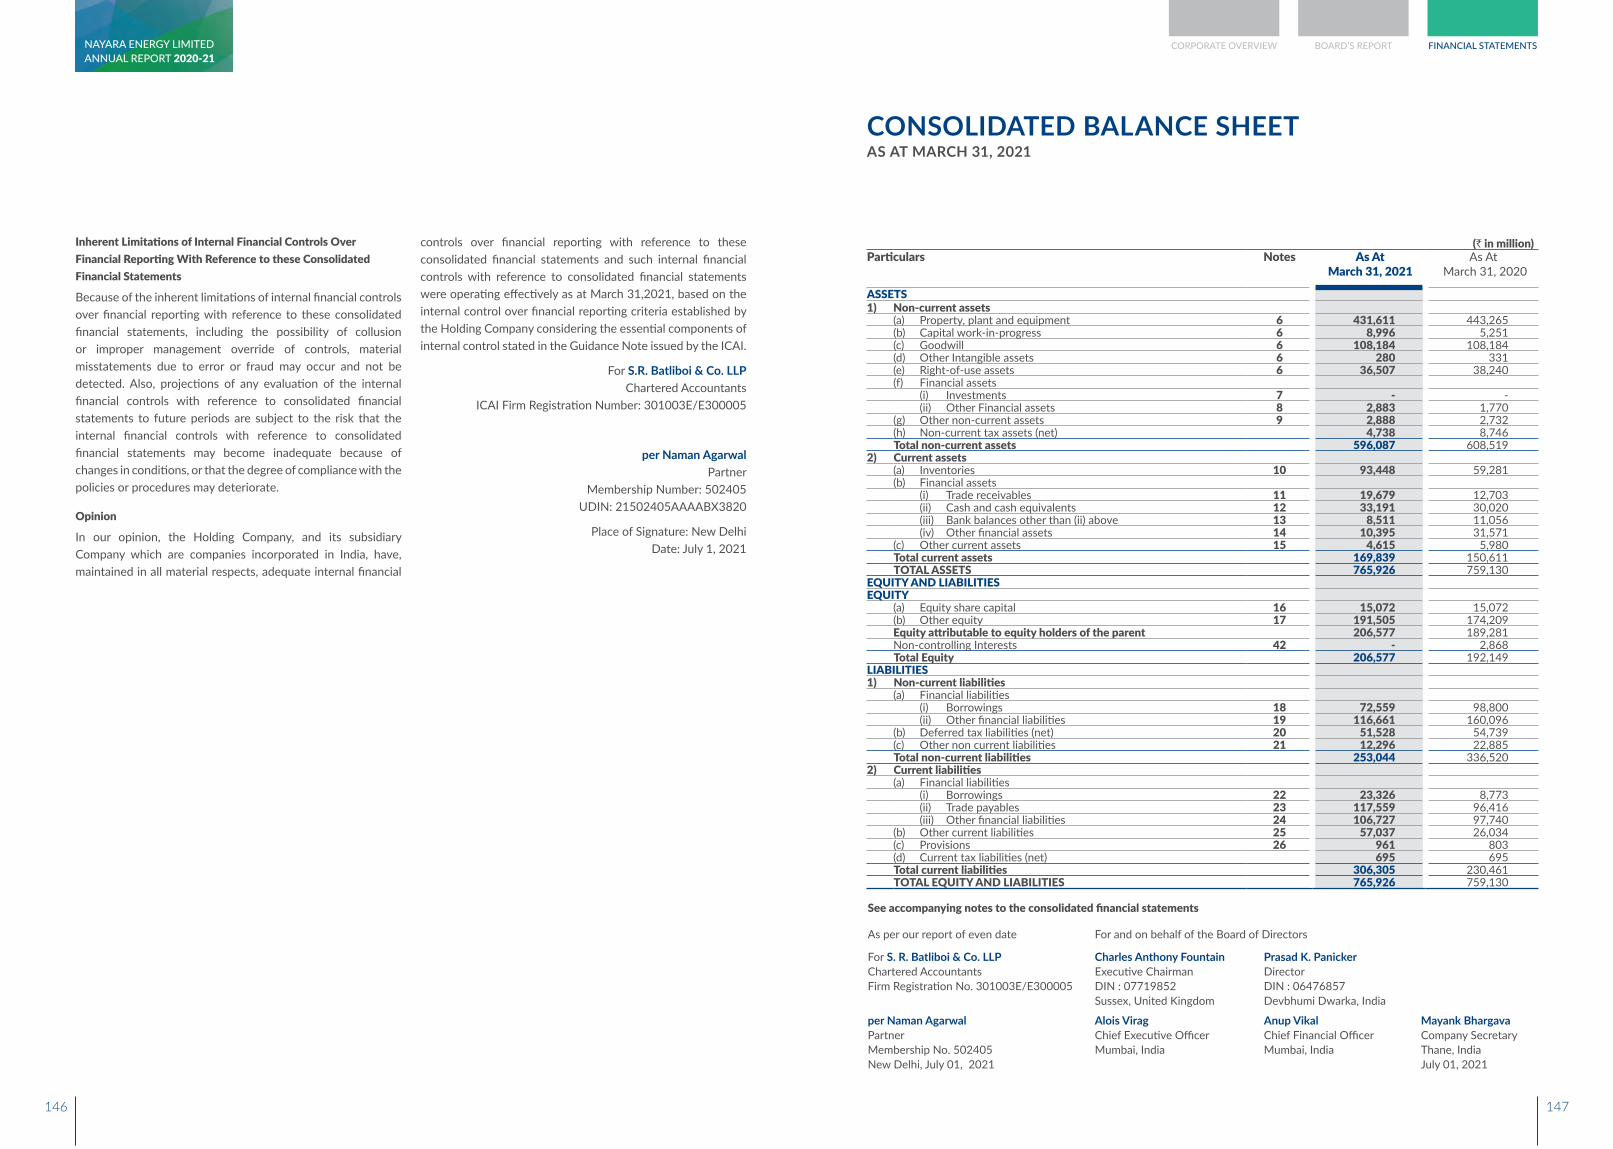
Inherent Limitations of Internal Financial Controls Over Financial Reporting With Reference to these Consolidated Financial Statements
Because of the inherent limitations of internal financial controls over financial reporting with reference to these consolidated financial statements, including the possibility of collusion or improper management override of controls, material misstatements due to error or fraud may occur and not be detected. Also, projections of any evaluation of the internal financial controls with reference to consolidated financial statements to future periods are subject to the risk that the internal financial controls with reference to consolidated financial statements may become inadequate because of changes in conditions, or that the degree of compliance with the policies or procedures may deteriorate.
Opinion
In our opinion, the Holding Company, and its subsidiary Company which are companies incorporated in India, have, maintained in all material respects, adequate internal financial
controls over financial reporting with reference to these consolidated financial statements and such internal financial controls with reference to consolidated financial statements were operating effectively as at March 31,2021, based on the internal control over financial reporting criteria established by the Holding Company considering the essential components of internal control stated in the Guidance Note issued by the ICAI.
For S.R. Batliboi & Co. LLP Chartered Accountants
ICAI Firm Registration Number: 301003E/E300005
per Naman Agarwal Partner
Membership Number: 502405 UDIN: 21502405AAAABX3820
Place of Signature: New Delhi Date: July 1, 2021
CONSOLIDATED BALANCE SHEETAS AT MARCH 31, 2021
(` in million)Particulars Notes As At
March 31, 2021 As At
March 31, 2020
ASSETS1) Non-current assets
(a) Property, plant and equipment 6 431,611 443,265 (b) Capital work-in-progress 6 8,996 5,251 (c) Goodwill 6 108,184 108,184 (d) Other Intangible assets 6 280 331 (e) Right-of-use assets 6 36,507 38,240 (f) Financial assets
(i) Investments 7 - - (ii) Other Financial assets 8 2,883 1,770
(g) Other non-current assets 9 2,888 2,732 (h) Non-current tax assets (net) 4,738 8,746 Total non-current assets 596,087 608,519
2) Current assets(a) Inventories 10 93,448 59,281 (b) Financial assets
(i) Trade receivables 11 19,679 12,703 (ii) Cash and cash equivalents 12 33,191 30,020 (iii) Bank balances other than (ii) above 13 8,511 11,056 (iv) Other financial assets 14 10,395 31,571
(c) Other current assets 15 4,615 5,980 Total current assets 169,839 150,611 TOTAL ASSETS 765,926 759,130
EQUITY AND LIABILITIESEQUITY
(a) Equity share capital 16 15,072 15,072 (b) Other equity 17 191,505 174,209 Equity attributable to equity holders of the parent 206,577 189,281 Non-controlling Interests 42 - 2,868 Total Equity 206,577 192,149
LIABILITIES1) Non-current liabilities
(a) Financial liabilities (i) Borrowings 18 72,559 98,800 (ii) Other financial liabilities 19 116,661 160,096 (b) Deferred tax liabilities (net) 20 51,528 54,739 (c) Other non current liabilities 21 12,296 22,885 Total non-current liabilities 253,044 336,520
2) Current liabilities(a) Financial liabilities (i) Borrowings 22 23,326 8,773 (ii) Trade payables 23 117,559 96,416 (iii) Other financial liabilities 24 106,727 97,740 (b) Other current liabilities 25 57,037 26,034 (c) Provisions 26 961 803 (d) Current tax liabilities (net) 695 695 Total current liabilities 306,305 230,461 TOTAL EQUITY AND LIABILITIES 765,926 759,130
See accompanying notes to the consolidated financial statements
As per our report of even date For and on behalf of the Board of Directors
For S. R. Batliboi & Co. LLP Chartered Accountants Firm Registration No. 301003E/E300005
Charles Anthony Fountain Executive Chairman DIN : 07719852 Sussex, United Kingdom
Prasad K. Panicker Director DIN : 06476857 Devbhumi Dwarka, India
per Naman Agarwal Partner Membership No. 502405 New Delhi, July 01, 2021
Alois Virag Chief Executive Officer Mumbai, India
Anup Vikal Chief Financial Officer Mumbai, India
Mayank Bhargava Company Secretary Thane, India July 01, 2021
146 147
CORPORATE OVERVIEW BOARD’S REPORT FINANCIAL STATEMENTSANNUAL REPORT 2020-21NAYARA ENERGY LIMITED
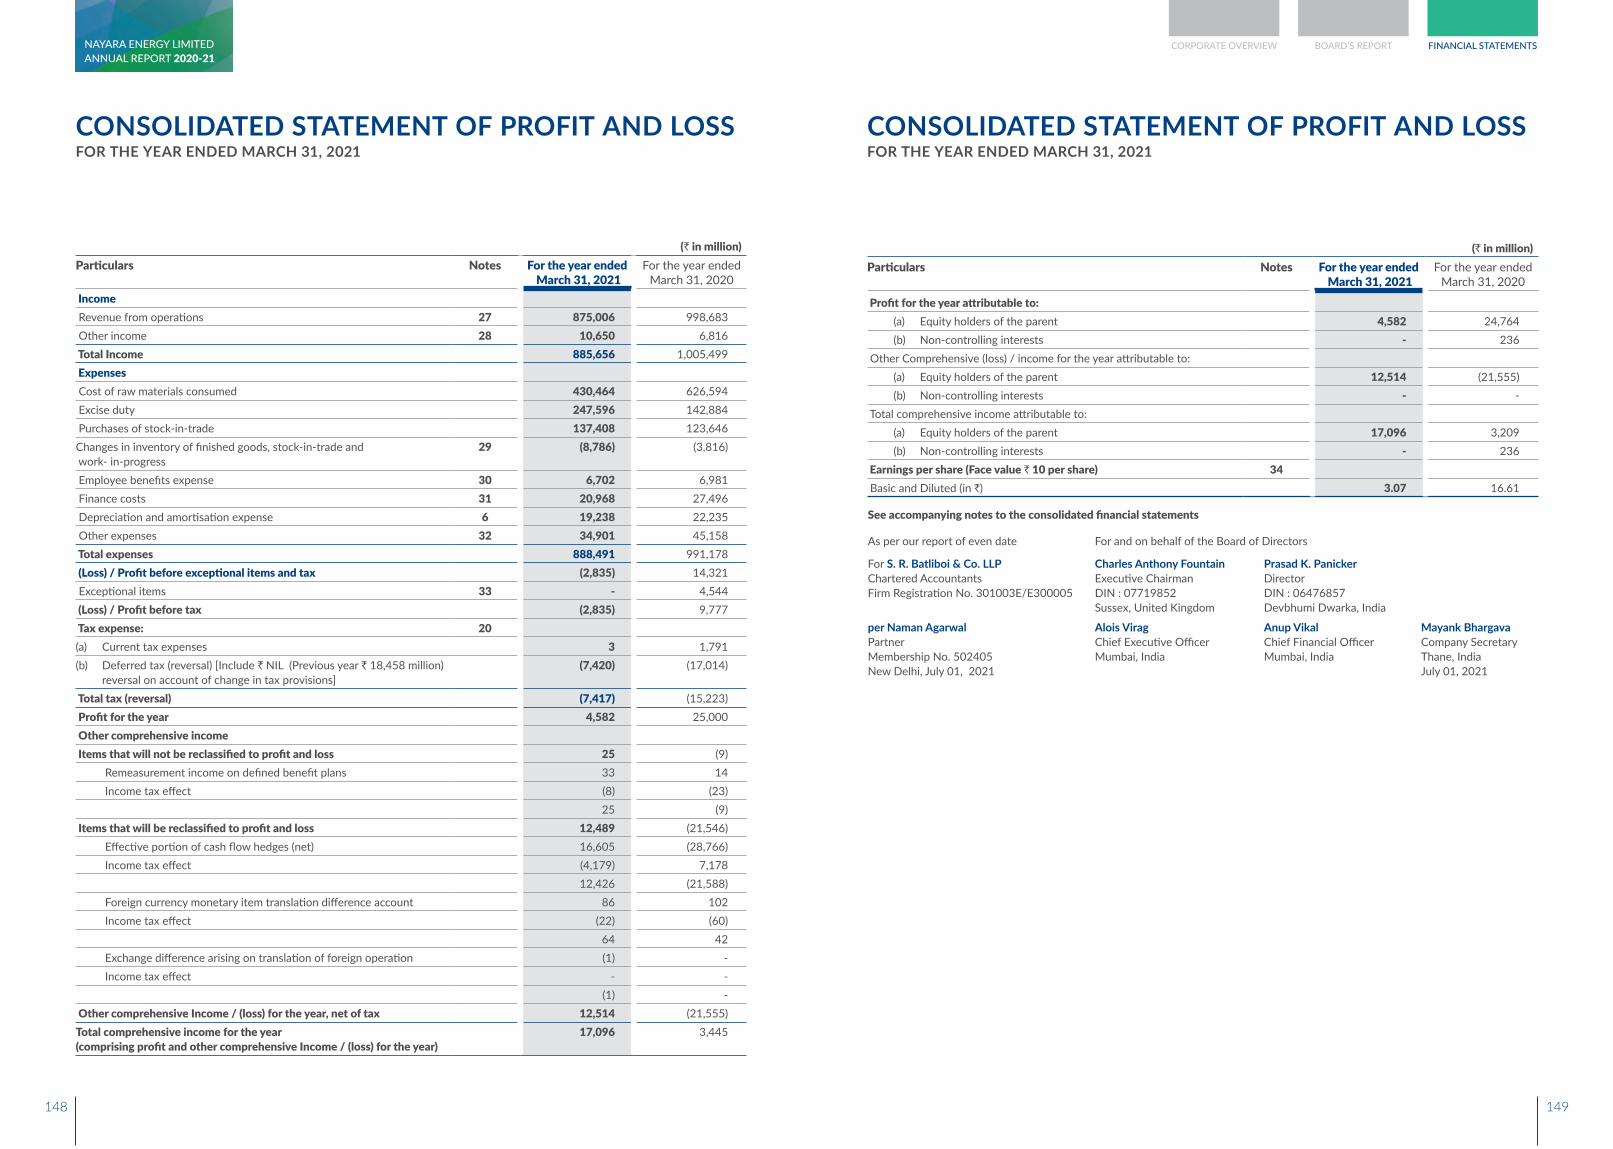
CONSOLIDATED STATEMENT OF PROFIT AND LOSSFOR THE YEAR ENDED MARCH 31, 2021
(` in million)Particulars Notes For the year ended
March 31, 2021For the year ended
March 31, 2020 Income Revenue from operations 27 875,006 998,683 Other income 28 10,650 6,816 Total Income 885,656 1,005,499 Expenses Cost of raw materials consumed 430,464 626,594 Excise duty 247,596 142,884 Purchases of stock-in-trade 137,408 123,646 Changes in inventory of finished goods, stock-in-trade and work- in-progress
29 (8,786) (3,816)
Employee benefits expense 30 6,702 6,981 Finance costs 31 20,968 27,496 Depreciation and amortisation expense 6 19,238 22,235 Other expenses 32 34,901 45,158 Total expenses 888,491 991,178 (Loss) / Profit before exceptional items and tax (2,835) 14,321 Exceptional items 33 - 4,544 (Loss) / Profit before tax (2,835) 9,777 Tax expense: 20(a) Current tax expenses 3 1,791 (b) Deferred tax (reversal) [Include ` NIL (Previous year ` 18,458 million)
reversal on account of change in tax provisions] (7,420) (17,014)
Total tax (reversal) (7,417) (15,223) Profit for the year 4,582 25,000 Other comprehensive income Items that will not be reclassified to profit and loss 25 (9)
Remeasurement income on defined benefit plans 33 14 Income tax effect (8) (23)
25 (9) Items that will be reclassified to profit and loss 12,489 (21,546)
Effective portion of cash flow hedges (net) 16,605 (28,766) Income tax effect (4,179) 7,178
12,426 (21,588) Foreign currency monetary item translation difference account 86 102 Income tax effect (22) (60)
64 42 Exchange difference arising on translation of foreign operation (1) - Income tax effect - -
(1) - Other comprehensive Income / (loss) for the year, net of tax 12,514 (21,555)Total comprehensive income for the year (comprising profit and other comprehensive Income / (loss) for the year)
17,096 3,445
See accompanying notes to the consolidated financial statements
As per our report of even date For and on behalf of the Board of Directors
For S. R. Batliboi & Co. LLP Chartered Accountants Firm Registration No. 301003E/E300005
Charles Anthony Fountain Executive Chairman DIN : 07719852 Sussex, United Kingdom
Prasad K. Panicker Director DIN : 06476857 Devbhumi Dwarka, India
per Naman Agarwal Partner Membership No. 502405 New Delhi, July 01, 2021
Alois Virag Chief Executive Officer Mumbai, India
Anup Vikal Chief Financial Officer Mumbai, India
Mayank Bhargava Company Secretary Thane, India July 01, 2021
CONSOLIDATED STATEMENT OF PROFIT AND LOSSFOR THE YEAR ENDED MARCH 31, 2021
(` in million)Particulars Notes For the year ended
March 31, 2021For the year ended
March 31, 2020
Profit for the year attributable to: (a) Equity holders of the parent 4,582 24,764 (b) Non-controlling interests - 236
Other Comprehensive (loss) / income for the year attributable to: (a) Equity holders of the parent 12,514 (21,555)(b) Non-controlling interests - -
Total comprehensive income attributable to: (a) Equity holders of the parent 17,096 3,209 (b) Non-controlling interests - 236
Earnings per share (Face value ` 10 per share) 34 Basic and Diluted (in `) 3.07 16.61
148 149
CORPORATE OVERVIEW BOARD’S REPORT FINANCIAL STATEMENTSANNUAL REPORT 2020-21NAYARA ENERGY LIMITED
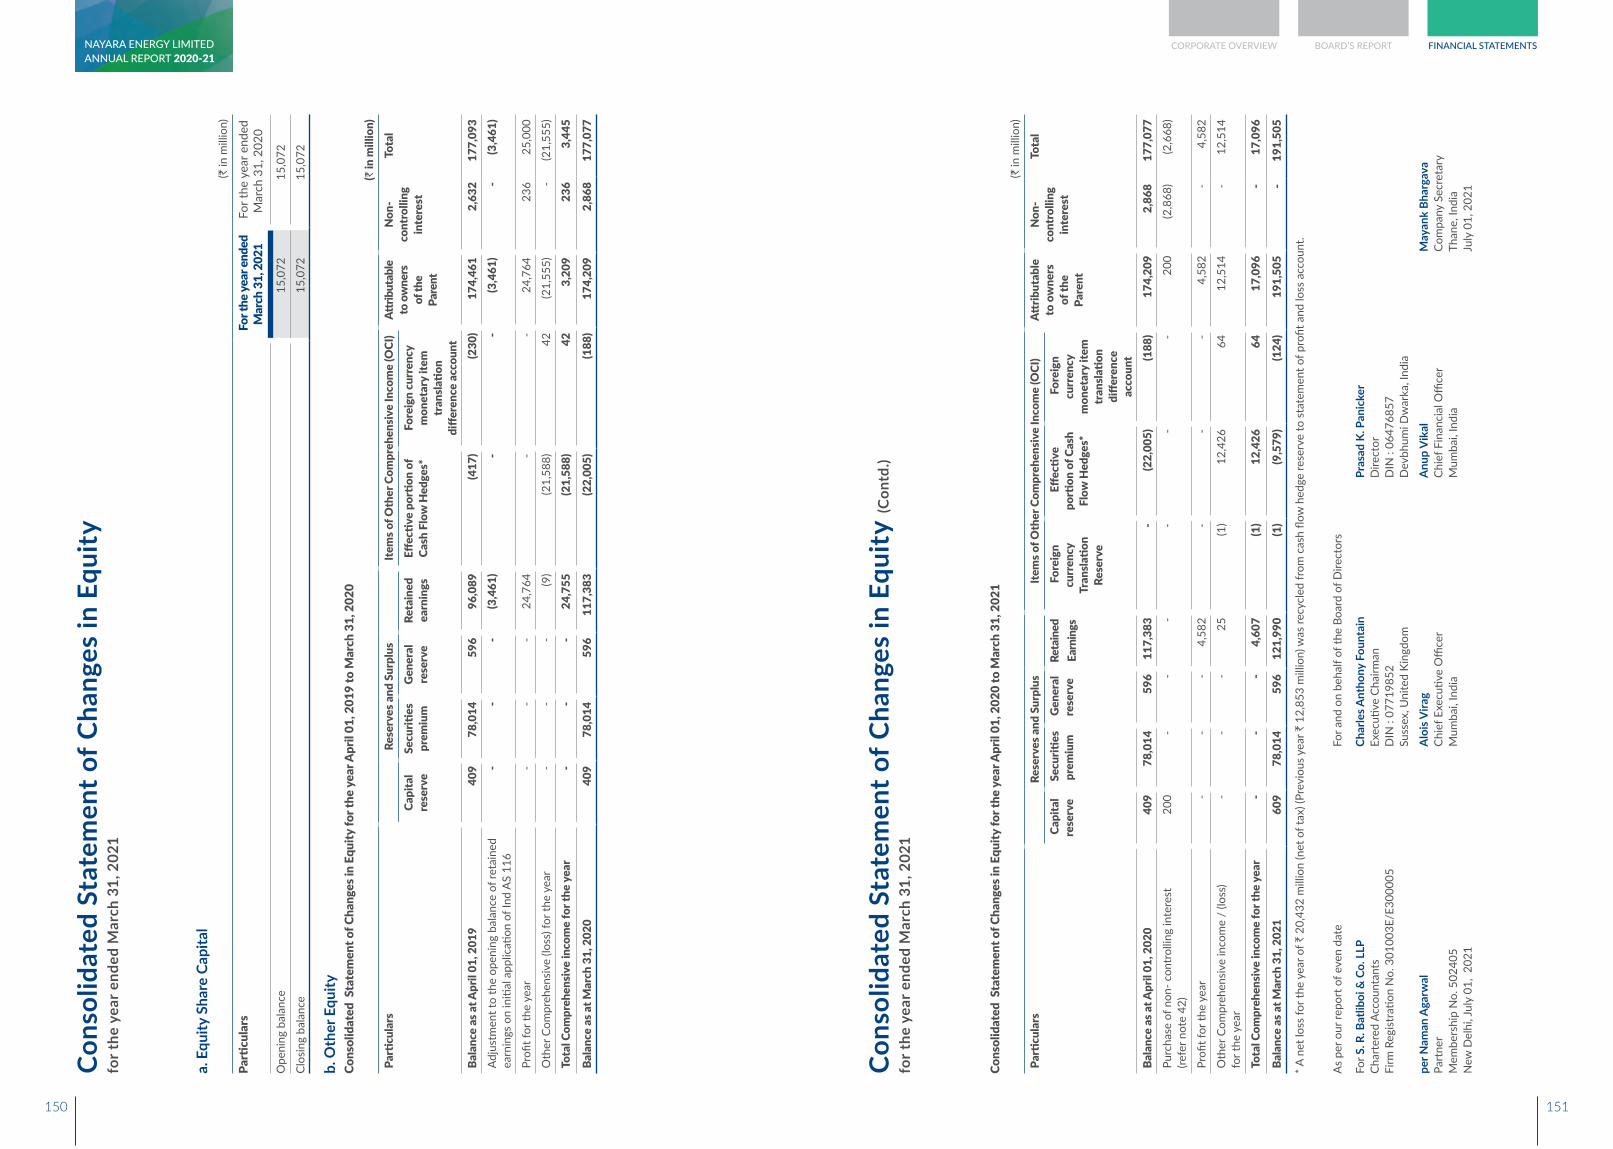
Cons
olid
ated
Sta
tem
ent o
f Cha
nges
in E
quity
for t
he y
ear e
nded
Mar
ch 3
1, 2
021
a. E
quity
Sha
re C
apita
l(`
in m
illio
n)
Parti
cula
rs F
or th
e yea
r end
ed
Mar
ch 3
1, 2
021
For
the
year
end
ed
Mar
ch 3
1, 2
020
Ope
ning
bal
ance
15,
072
15,
072
Clos
ing
bala
nce
15,
072
15,
072
b. O
ther
Equ
ityCo
nsol
idat
ed S
tate
men
t of C
hang
es in
Equ
ity fo
r the
yea
r Apr
il 01
, 201
9 to
Mar
ch 3
1, 2
020
(` in
mill
ion)
Parti
cula
rsRe
serv
es a
nd S
urpl
usIte
ms o
f Oth
er C
ompr
ehen
sive
Inco
me
(OCI
)Att
ribut
able
to
ow
ners
of
the
Pare
nt
Non
-co
ntro
lling
in
tere
st
Tota
lCa
pita
l re
serv
eSe
curiti
es
prem
ium
Gen
eral
re
serv
eRe
tain
ed
earn
ings
Effec
tive
porti
on o
f Ca
sh F
low
Hed
ges*
Fore
ign
curr
ency
m
onet
ary
item
tr
ansla
tion
diffe
renc
e ac
coun
tBa
lanc
e as
at A
pril
01, 2
019
409
7
8,01
4 5
96
96,
089
(417
) (2
30)
174
,461
2
,632
1
77,0
93
Adju
stm
ent t
o th
e op
enin
g ba
lanc
e of
reta
ined
ea
rnin
gs o
n in
itial
app
licati
on o
f Ind
AS
116
- -
- (3
,461
) -
- (3
,461
) -
(3,4
61)
Profi
t for
the
year
- -
- 2
4,76
4 -
- 2
4,76
4 2
36
25,
000
Oth
er C
ompr
ehen
sive
(loss
) for
the
year
- -
- (9
) (2
1,58
8) 4
2 (2
1,55
5) -
(21,
555)
Tota
l Com
preh
ensi
ve in
com
e fo
r the
yea
r -
- -
24,
755
(21,
588)
42
3,2
09
236
3
,445
Bala
nce
as a
t Mar
ch 3
1, 2
020
409
7
8,01
4 5
96
117
,383
(2
2,00
5) (1
88)
174
,209
2
,868
1
77,0
77
Cons
olid
ated
Sta
tem
ent o
f Cha
nges
in E
quity
(Con
td.)
for t
he y
ear e
nded
Mar
ch 3
1, 2
021
Cons
olid
ated
Sta
tem
ent o
f Cha
nges
in E
quity
for t
he y
ear A
pril
01, 2
020
to M
arch
31,
202
1(`
in m
illio
n)
Parti
cula
rsRe
serv
es a
nd S
urpl
usIte
ms o
f Oth
er C
ompr
ehen
sive
Inco
me
(OCI
)Att
ribut
able
to
ow
ners
of
the
Pare
nt
Non
-co
ntro
lling
in
tere
st
Tota
l C
apita
l re
serv
e S
ecur
ities
pr
emiu
m
Gen
eral
re
serv
e Re
tain
ed
Earn
ings
F
orei
gn
curr
ency
Tr
ansla
tion
Rese
rve
Effe
ctive
po
rtion
of C
ash
Flow
Hed
ges*
For
eign
cu
rren
cy
mon
etar
y ite
m
tran
slatio
n di
ffere
nce
acco
unt
Bala
nce
as a
t Apr
il 01
, 202
0 4
09
78,
014
596
1
17,3
83
- (2
2,00
5) (1
88)
174
,209
2
,868
1
77,0
77
Purc
hase
of n
on- c
ontr
ollin
g in
tere
st
(refe
r not
e 42
) 2
00
- -
- -
- -
200
(2
,868
) (2
,668
)
Profi
t for
the
year
- -
- 4
,582
-
- -
4,5
82
- 4
,582
Oth
er C
ompr
ehen
sive
inco
me
/ (lo
ss)
for t
he y
ear
- -
- 2
5 (1
) 1
2,42
6 6
4 1
2,51
4 -
12,
514
Tota
l Com
preh
ensi
ve in
com
e fo
r the
yea
r -
- -
4,6
07
(1)
12,
426
64
17,
096
- 1
7,09
6
Bala
nce
as a
t Mar
ch 3
1, 2
021
609
7
8,01
4 5
96
121
,990
(1
) (9
,579
) (1
24)
191
,505
-
191
,505
* A n
et lo
ss fo
r the
yea
r of `
20,
432
mill
ion
(net
of t
ax) (
Prev
ious
yea
r ` 1
2,85
3 m
illio
n) w
as re
cycl
ed fr
om c
ash
flow
hed
ge re
serv
e to
sta
tem
ent o
f pro
fit a
nd lo
ss a
ccou
nt.
As
per o
ur re
port
of e
ven
date
For a
nd o
n be
half
of th
e Bo
ard
of D
irect
ors
For S
. R. B
atlib
oi &
Co.
LLP
Ch
arte
red
Acco
unta
nts
Firm
Reg
istra
tion
No.
301
003E
/E30
0005
Char
les A
ntho
ny F
ount
ain
Exec
utive
Cha
irman
D
IN :
0771
9852
Su
ssex
, Uni
ted
King
dom
Pras
ad K
. Pan
icke
r D
irect
or
DIN
: 06
4768
57
Dev
bhum
i Dw
arka
, Ind
ia
per N
aman
Aga
rwal
Pa
rtne
r M
embe
rshi
p N
o. 5
0240
5 N
ew D
elhi
, Jul
y 01
, 20
21
Alo
is V
irag
Chie
f Exe
cutiv
e O
ffice
r M
umba
i, In
dia
Anu
p V
ikal
Ch
ief F
inan
cial
Offi
cer
Mum
bai,
Indi
a
May
ank
Bhar
gava
Co
mpa
ny S
ecre
tary
Th
ane,
Indi
a Ju
ly 0
1, 2
021
150 151
CORPORATE OVERVIEW BOARD’S REPORT FINANCIAL STATEMENTSANNUAL REPORT 2020-21NAYARA ENERGY LIMITED
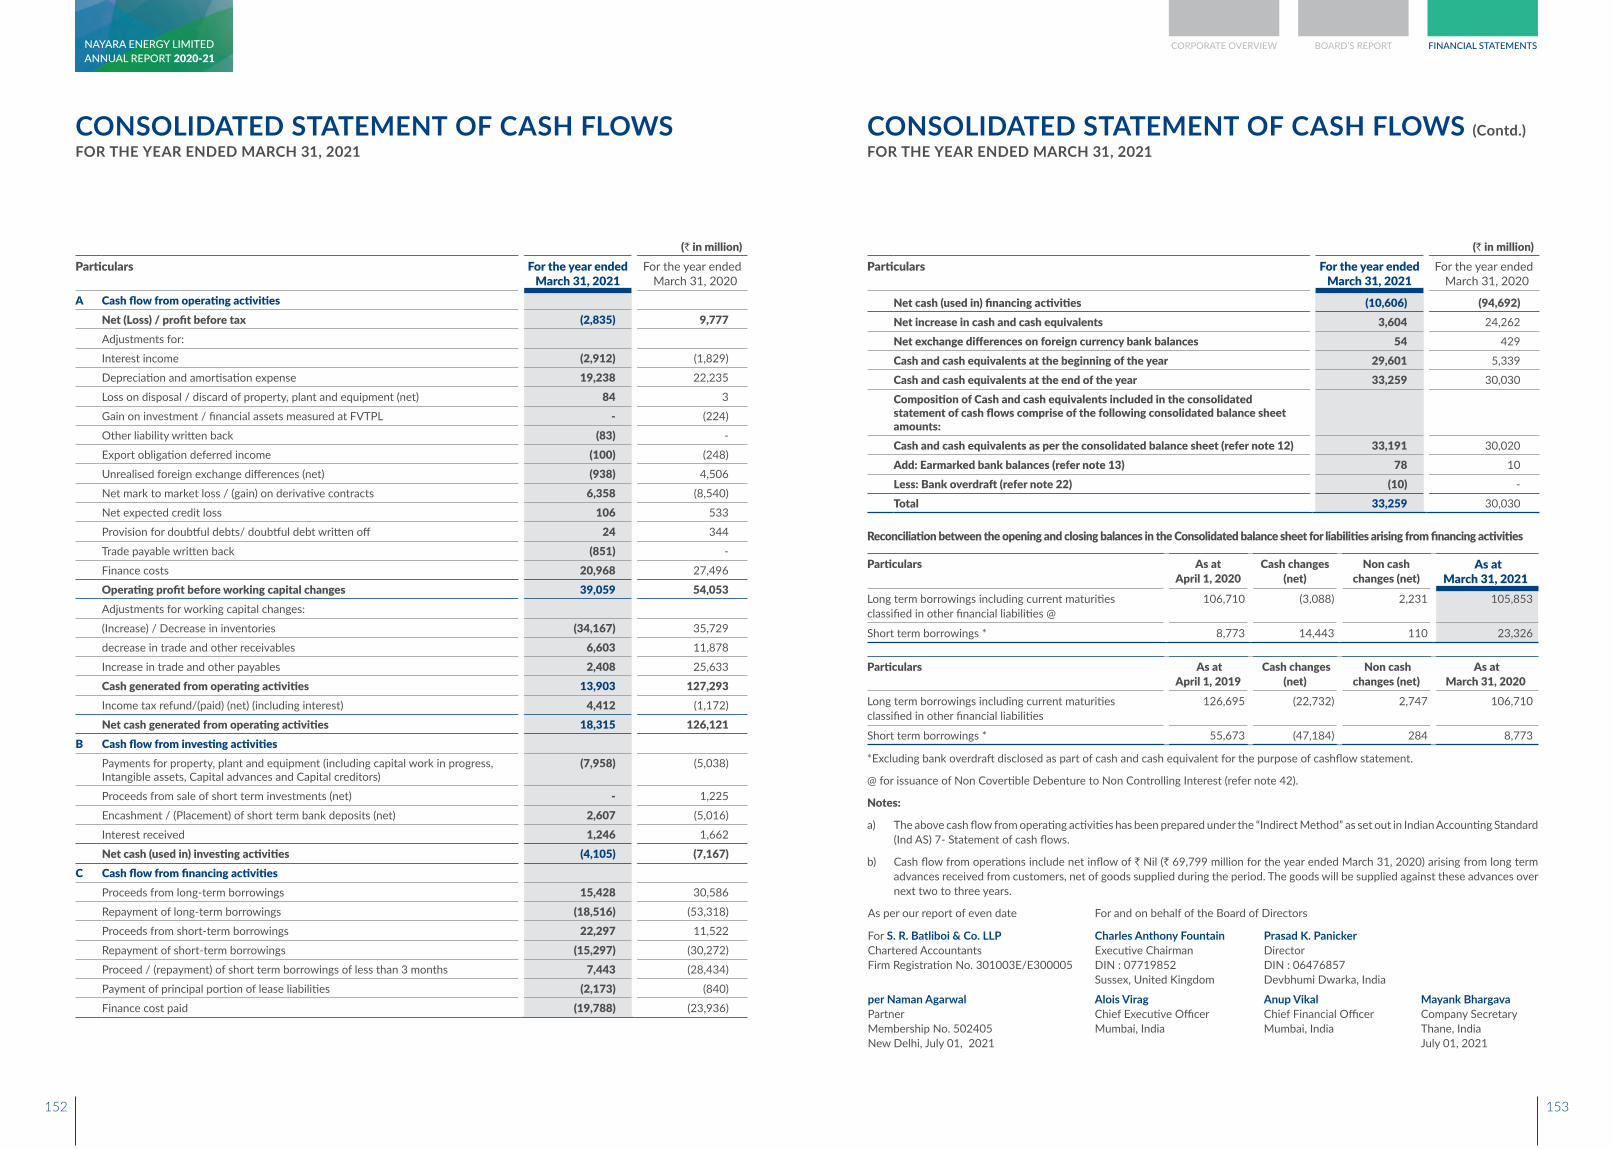
CONSOLIDATED STATEMENT OF CASH FLOWSFOR THE YEAR ENDED MARCH 31, 2021
(` in million)Particulars For the year ended
March 31, 2021For the year ended March 31, 2020
A Cash flow from operating activitiesNet (Loss) / profit before tax (2,835) 9,777 Adjustments for:
Interest income (2,912) (1,829)
Depreciation and amortisation expense 19,238 22,235
Loss on disposal / discard of property, plant and equipment (net) 84 3
Gain on investment / financial assets measured at FVTPL - (224)
Other liability written back (83) -
Export obligation deferred income (100) (248)
Unrealised foreign exchange differences (net) (938) 4,506
Net mark to market loss / (gain) on derivative contracts 6,358 (8,540)
Net expected credit loss 106 533
Provision for doubtful debts/ doubtful debt written off 24 344
Trade payable written back (851) -
Finance costs 20,968 27,496
Operating profit before working capital changes 39,059 54,053 Adjustments for working capital changes:
(Increase) / Decrease in inventories (34,167) 35,729
decrease in trade and other receivables 6,603 11,878
Increase in trade and other payables 2,408 25,633
Cash generated from operating activities 13,903 127,293 Income tax refund/(paid) (net) (including interest) 4,412 (1,172)
Net cash generated from operating activities 18,315 126,121 B Cash flow from investing activities
Payments for property, plant and equipment (including capital work in progress, Intangible assets, Capital advances and Capital creditors)
(7,958) (5,038)
Proceeds from sale of short term investments (net) - 1,225
Encashment / (Placement) of short term bank deposits (net) 2,607 (5,016)
Interest received 1,246 1,662
Net cash (used in) investing activities (4,105) (7,167)C Cash flow from financing activities
Proceeds from long-term borrowings 15,428 30,586
Repayment of long-term borrowings (18,516) (53,318)
Proceeds from short-term borrowings 22,297 11,522
Repayment of short-term borrowings (15,297) (30,272)
Proceed / (repayment) of short term borrowings of less than 3 months 7,443 (28,434)
Payment of principal portion of lease liabilities (2,173) (840)
Finance cost paid (19,788) (23,936)
CONSOLIDATED STATEMENT OF CASH FLOWS (Contd.)FOR THE YEAR ENDED MARCH 31, 2021
(` in million)Particulars For the year ended
March 31, 2021For the year ended March 31, 2020
Net cash (used in) financing activities (10,606) (94,692)Net increase in cash and cash equivalents 3,604 24,262
Net exchange differences on foreign currency bank balances 54 429
Cash and cash equivalents at the beginning of the year 29,601 5,339
Cash and cash equivalents at the end of the year 33,259 30,030
Composition of Cash and cash equivalents included in the consolidated statement of cash flows comprise of the following consolidated balance sheet amounts:Cash and cash equivalents as per the consolidated balance sheet (refer note 12) 33,191 30,020
Add: Earmarked bank balances (refer note 13) 78 10
Less: Bank overdraft (refer note 22) (10) -
Total 33,259 30,030
Reconciliation between the opening and closing balances in the Consolidated balance sheet for liabilities arising from financing activities
Particulars As at April 1, 2020
Cash changes (net)
Non cash changes (net)
As at March 31, 2021
Long term borrowings including current maturities classified in other financial liabilities @
106,710 (3,088) 2,231 105,853
Short term borrowings * 8,773 14,443 110 23,326
Particulars As at April 1, 2019
Cash changes (net)
Non cash changes (net)
As at March 31, 2020
Long term borrowings including current maturities classified in other financial liabilities
126,695 (22,732) 2,747 106,710
Short term borrowings * 55,673 (47,184) 284 8,773
*Excluding bank overdraft disclosed as part of cash and cash equivalent for the purpose of cashflow statement.
@ for issuance of Non Covertible Debenture to Non Controlling Interest (refer note 42).
Notes:
a) The above cash flow from operating activities has been prepared under the “Indirect Method” as set out in Indian Accounting Standard (Ind AS) 7- Statement of cash flows.
b) Cash flow from operations include net inflow of ` Nil (` 69,799 million for the year ended March 31, 2020) arising from long term advances received from customers, net of goods supplied during the period. The goods will be supplied against these advances over next two to three years.
As per our report of even date For and on behalf of the Board of Directors
For S. R. Batliboi & Co. LLP Chartered Accountants Firm Registration No. 301003E/E300005
Charles Anthony Fountain Executive Chairman DIN : 07719852 Sussex, United Kingdom
Prasad K. Panicker Director DIN : 06476857 Devbhumi Dwarka, India
per Naman Agarwal Partner Membership No. 502405 New Delhi, July 01, 2021
Alois Virag Chief Executive Officer Mumbai, India
Anup Vikal Chief Financial Officer Mumbai, India
Mayank Bhargava Company Secretary Thane, India July 01, 2021
152 153
CORPORATE OVERVIEW BOARD’S REPORT FINANCIAL STATEMENTSANNUAL REPORT 2020-21NAYARA ENERGY LIMITED
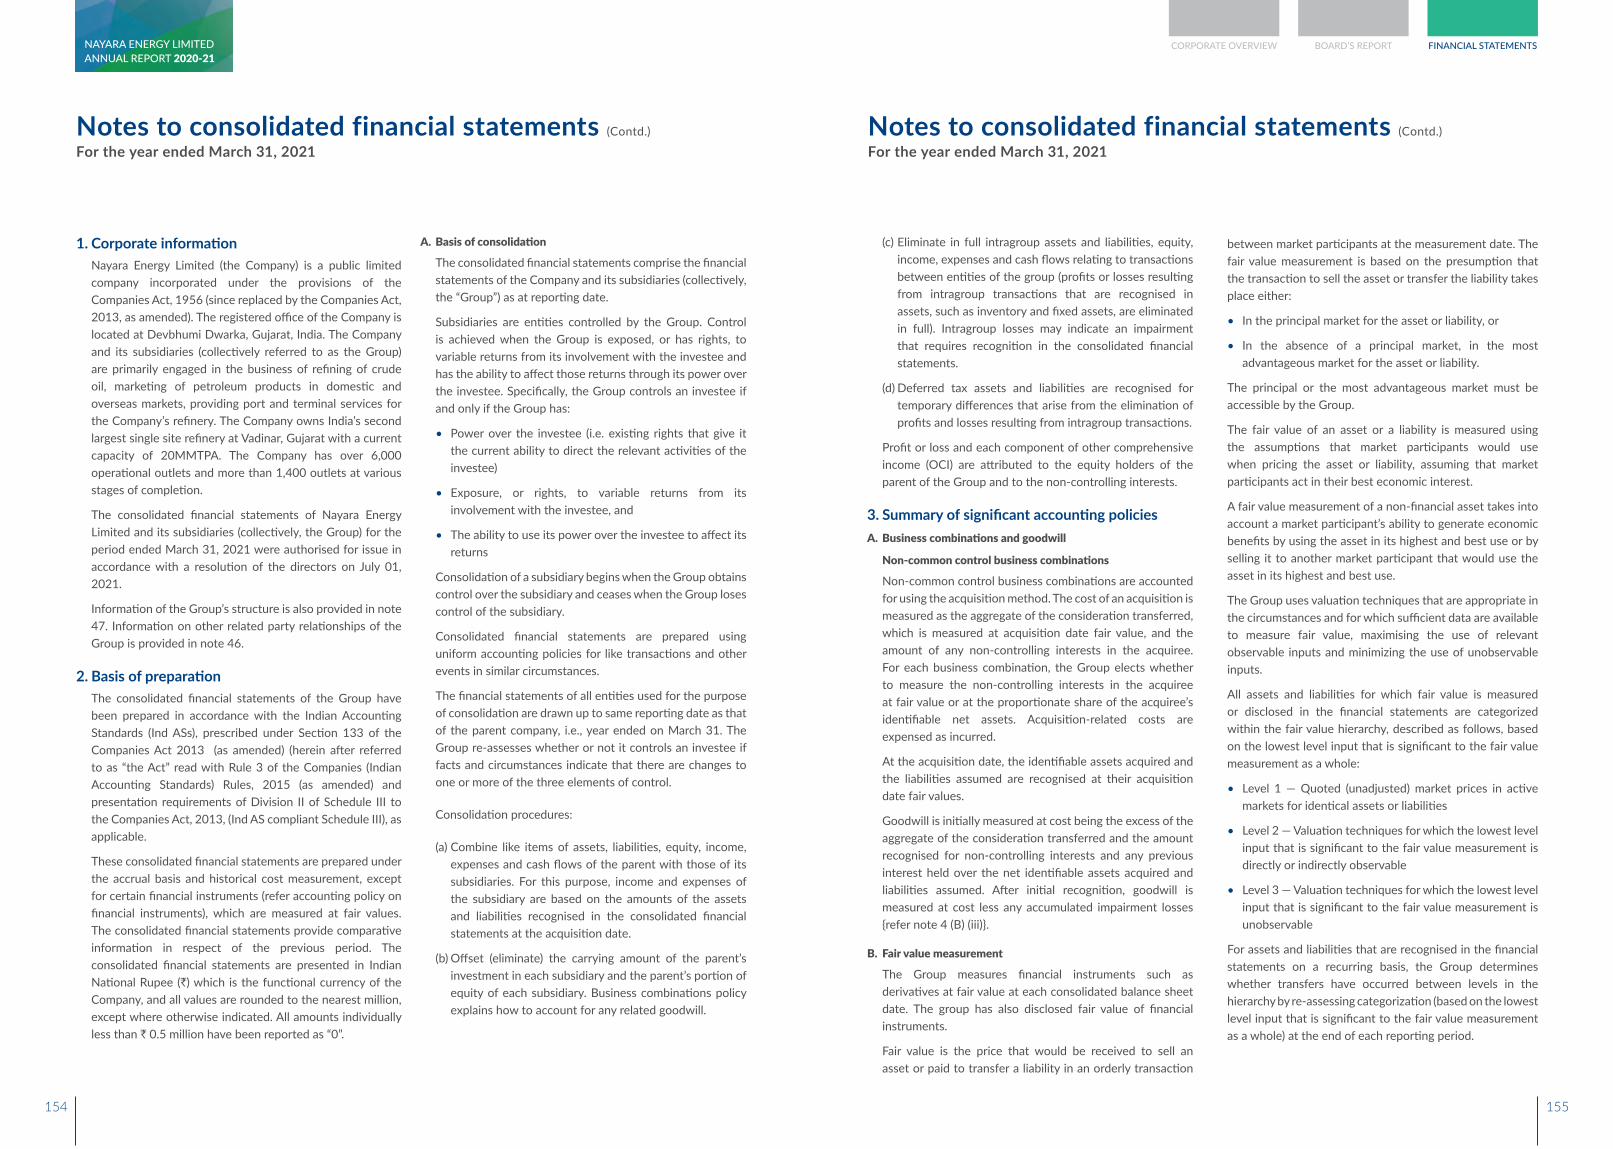
Notes to consolidated financial statements (Contd.)
For the year ended March 31, 2021
1. Corporate informationNayara Energy Limited (the Company) is a public limited company incorporated under the provisions of the Companies Act, 1956 (since replaced by the Companies Act, 2013, as amended). The registered office of the Company is located at Devbhumi Dwarka, Gujarat, India. The Company and its subsidiaries (collectively referred to as the Group) are primarily engaged in the business of refining of crude oil, marketing of petroleum products in domestic and overseas markets, providing port and terminal services for the Company’s refinery. The Company owns India’s second largest single site refinery at Vadinar, Gujarat with a current capacity of 20MMTPA. The Company has over 6,000 operational outlets and more than 1,400 outlets at various stages of completion.
The consolidated financial statements of Nayara Energy Limited and its subsidiaries (collectively, the Group) for the period ended March 31, 2021 were authorised for issue in accordance with a resolution of the directors on July 01, 2021.
Information of the Group’s structure is also provided in note 47. Information on other related party relationships of the Group is provided in note 46.
2. Basis of preparationThe consolidated financial statements of the Group have been prepared in accordance with the Indian Accounting Standards (Ind ASs), prescribed under Section 133 of the Companies Act 2013 (as amended) (herein after referred to as “the Act” read with Rule 3 of the Companies (Indian Accounting Standards) Rules, 2015 (as amended) and presentation requirements of Division II of Schedule III to the Companies Act, 2013, (Ind AS compliant Schedule III), as applicable.
These consolidated financial statements are prepared under the accrual basis and historical cost measurement, except for certain financial instruments (refer accounting policy on financial instruments), which are measured at fair values. The consolidated financial statements provide comparative information in respect of the previous period. The consolidated financial statements are presented in Indian National Rupee (`) which is the functional currency of the Company, and all values are rounded to the nearest million, except where otherwise indicated. All amounts individually less than ` 0.5 million have been reported as “0”.
A. Basis of consolidation
The consolidated financial statements comprise the financial statements of the Company and its subsidiaries (collectively, the “Group”) as at reporting date.
Subsidiaries are entities controlled by the Group. Control is achieved when the Group is exposed, or has rights, to variable returns from its involvement with the investee and has the ability to affect those returns through its power over the investee. Specifically, the Group controls an investee if and only if the Group has:
• Power over the investee (i.e. existing rights that give it the current ability to direct the relevant activities of the investee)
• Exposure, or rights, to variable returns from its involvement with the investee, and
• The ability to use its power over the investee to affect its returns
Consolidation of a subsidiary begins when the Group obtains control over the subsidiary and ceases when the Group loses control of the subsidiary.
Consolidated financial statements are prepared using uniform accounting policies for like transactions and other events in similar circumstances.
The financial statements of all entities used for the purpose of consolidation are drawn up to same reporting date as that of the parent company, i.e., year ended on March 31. The Group re-assesses whether or not it controls an investee if facts and circumstances indicate that there are changes to one or more of the three elements of control.
Consolidation procedures:
(a) Combine like items of assets, liabilities, equity, income, expenses and cash flows of the parent with those of its subsidiaries. For this purpose, income and expenses of the subsidiary are based on the amounts of the assets and liabilities recognised in the consolidated financial statements at the acquisition date.
(b) Offset (eliminate) the carrying amount of the parent’s investment in each subsidiary and the parent’s portion of equity of each subsidiary. Business combinations policy explains how to account for any related goodwill.
Notes to consolidated financial statements (Contd.)
For the year ended March 31, 2021
(c) Eliminate in full intragroup assets and liabilities, equity, income, expenses and cash flows relating to transactions between entities of the group (profits or losses resulting from intragroup transactions that are recognised in assets, such as inventory and fixed assets, are eliminated in full). Intragroup losses may indicate an impairment that requires recognition in the consolidated financial statements.
(d) Deferred tax assets and liabilities are recognised for temporary differences that arise from the elimination of profits and losses resulting from intragroup transactions.
Profit or loss and each component of other comprehensive income (OCI) are attributed to the equity holders of the parent of the Group and to the non-controlling interests.
3. Summary of significant accounting policiesA. Business combinations and goodwill
Non-common control business combinations
Non-common control business combinations are accounted for using the acquisition method. The cost of an acquisition is measured as the aggregate of the consideration transferred, which is measured at acquisition date fair value, and the amount of any non-controlling interests in the acquiree. For each business combination, the Group elects whether to measure the non-controlling interests in the acquiree at fair value or at the proportionate share of the acquiree’s identifiable net assets. Acquisition-related costs are expensed as incurred.
At the acquisition date, the identifiable assets acquired and the liabilities assumed are recognised at their acquisition date fair values.
Goodwill is initially measured at cost being the excess of the aggregate of the consideration transferred and the amount recognised for non-controlling interests and any previous interest held over the net identifiable assets acquired and liabilities assumed. After initial recognition, goodwill is measured at cost less any accumulated impairment losses {refer note 4 (B) (iii)}.
B. Fair value measurement
The Group measures financial instruments such as derivatives at fair value at each consolidated balance sheet date. The group has also disclosed fair value of financial instruments.
Fair value is the price that would be received to sell an asset or paid to transfer a liability in an orderly transaction
between market participants at the measurement date. The fair value measurement is based on the presumption that the transaction to sell the asset or transfer the liability takes place either:
• In the principal market for the asset or liability, or
• In the absence of a principal market, in the most advantageous market for the asset or liability.
The principal or the most advantageous market must be accessible by the Group.
The fair value of an asset or a liability is measured using the assumptions that market participants would use when pricing the asset or liability, assuming that market participants act in their best economic interest.
A fair value measurement of a non-financial asset takes into account a market participant’s ability to generate economic benefits by using the asset in its highest and best use or by selling it to another market participant that would use the asset in its highest and best use.
The Group uses valuation techniques that are appropriate in the circumstances and for which sufficient data are available to measure fair value, maximising the use of relevant observable inputs and minimizing the use of unobservable inputs.
All assets and liabilities for which fair value is measured or disclosed in the financial statements are categorized within the fair value hierarchy, described as follows, based on the lowest level input that is significant to the fair value measurement as a whole:
• Level 1 — Quoted (unadjusted) market prices in active markets for identical assets or liabilities
• Level 2 — Valuation techniques for which the lowest level input that is significant to the fair value measurement is directly or indirectly observable
• Level 3 — Valuation techniques for which the lowest level input that is significant to the fair value measurement is unobservable
For assets and liabilities that are recognised in the financial statements on a recurring basis, the Group determines whether transfers have occurred between levels in the hierarchy by re-assessing categorization (based on the lowest level input that is significant to the fair value measurement as a whole) at the end of each reporting period.
154 155
CORPORATE OVERVIEW BOARD’S REPORT FINANCIAL STATEMENTSANNUAL REPORT 2020-21NAYARA ENERGY LIMITED
External valuers are involved for valuation of significant assets, such as properties and unquoted financial assets, and significant liabilities.
For the purpose of fair value disclosures, the Group has determined classes of assets and liabilities on the basis of the nature, characteristics and risks of the asset or liability and the level of the fair value hierarchy as explained above.
Fair-value related disclosures for financial instruments and non-financial assets that are measured at fair value or where fair values are disclosed, are summarised in the following notes:
• Disclosures for valuation methods, significant estimates and assumptions (refer note 41)
• Quantitative disclosures of fair value measurement hierarchy (refer note 41)
• Financial instruments (including those carried at amortised cost) (refer note 41)
C. Property, Plant and Equipment
Property, plant & equipment (PPE) is recorded at cost of acquisition less accumulated depreciation and impairment loss, if any. Capital work in progress is stated at cost, net of accumulated impairment losses, if any.
Cost of acquisition comprises of all costs incurred to bring the assets to their present location and working condition up to the date the assets are ready for their intended use. Cost also includes the cost of replacing part of the plant and equipment and borrowing costs for long-term construction projects if the recognition criteria are met. When significant parts of plant and equipment are required to be replaced at intervals, the Group depreciates them separately based on their specific useful lives. Likewise, when a major inspection including turnaround and maintenance is performed, its cost is recognised in the carrying amount of the plant and equipment if the recognition criteria are satisfied. Any remaining carrying amount of the cost of the previous inspection (as distinct from physical parts) is derecognised. All other repair and maintenance costs are recognised in the statement of profit and loss as incurred.
Capital Work in Progress is stated at cost which includes direct and indirect cost incurred for construction or procurement of goods incurred during the construction phase of project under development.
Depreciation
Depreciation on PPE is provided, pro-rata for the period of use, using the straight line method, over the estimated useful life given below, which is different than useful life as specified in the Schedule II to the Companies Act, 2013. The estimate of the useful life of these assets has been assessed based on technical advice which considers the nature of the asset, the usage of the asset, expected physical wear and tear, the operating conditions of the asset, anticipated technological changes, manufacturers warranties and maintenance support, etc. Major inspection including turnaround and maintenance cost are depreciated over the next turnaround cycle. The estimated useful life of items of property, plant and equipment is mentioned below:
Particulars Estimated useful life (in years)
Temporary Building 3Building 15-60Plant and machinery * 35-50Catalysts (included within plant & machinery)
2-4
Furniture and fixtures 1-10Office equipment 1-6Vehicles 1-10
* Additionally, there are certain key components identified within plant and machinery having a useful life up to 35 years and are depreciated over such assessed useful life.
The residual values, useful lives and methods of depreciation of property, plant and equipment are reviewed at each financial year end and adjusted prospectively.
De-recognition
An item of property, plant and equipment and any significant part initially recognised is derecognised upon disposal or when no future economic benefits are expected from its use or disposal. Any gain or loss arising on derecognition of the asset (calculated as the difference between the net disposal proceeds and the carrying amount of the asset) is included in the statement of profit and loss when the asset is derecognised.
D. Intangible assets
Intangible assets acquired separately are measured on initial recognition at cost. The cost of intangible assets acquired in a business combination is their fair value at the date of acquisition. Following initial recognition, intangible assets
Notes to consolidated financial statements (Contd.)
For the year ended March 31, 2021
are carried at cost less any accumulated amortisation and accumulated impairment losses.
Intangible assets with finite lives are amortised over the useful economic life and assessed for impairment whenever there is an indication that the intangible asset may be impaired. The amortisation period and the amortisation method for an intangible asset with a finite useful life are reviewed at least at the end of each reporting period, and treated as change in estimate, if any change is required.
The Group has estimated the useful life of software and licenses ranging from 3 - 5 years from the date of acquisition and amortises the same over the said period on a straight line basis.
De-recognition
Gains or losses arising from derecognition of an intangible asset are measured as the difference between the net disposal proceeds and the carrying amount of the asset and are recognised in the statement of profit and loss when the asset is derecognised.
E. Impairment of non-financial assets
The Group assesses, at each reporting date, whether there is an indication that an asset may be impaired. If any indication exists, or when annual impairment testing for an asset is required, the Group estimates the asset’s recoverable amount. An asset’s recoverable amount is the higher of an asset’s or cash-generating unit’s (CGU) fair value less costs of disposal and its value in use. Recoverable amount is determined for an individual asset, unless the asset does not generate cash inflows that are largely independent of those from other assets or groups of assets. When the carrying amount of an asset or CGU exceeds its recoverable amount, the asset is considered impaired and is written down to its recoverable amount.
Impairment losses of continuing operations are recognised in the statement of profit and loss.
For assets excluding goodwill, an assessment is made at each reporting date to determine whether there is an indication that previously recognised impairment losses no longer exist or have decreased. If such indication exists, the Group estimates the asset’s or CGU’s recoverable amount. A previously recognised impairment loss is reversed only if there has been a change in the assumptions used to determine the asset’s recoverable amount since the last impairment loss was recognised. The reversal is limited so that the carrying amount of the asset does not exceed its
recoverable amount, nor exceed the carrying amount that would have been determined, net of depreciation, had no impairment loss been recognised for the asset in prior years. Such reversal is recognised in the statement of profit and loss.
A cash generating unit to which goodwill has been allocated is tested for impairment annually, or more frequently when there is an indication that the unit may be impaired. If the recoverable amount of the cash generating unit is less than its carrying amount, the impairment loss is allocated first to reduce the carrying amount of any goodwill allocated to the unit and then to the other assets of the unit pro rata based on the carrying amount of each asset in the unit. Any impairment loss for goodwill is recognised in statement of profit and loss. An impairment loss recognised for goodwill is not reversed in subsequent periods.
F. Leases
A contract or parts of contracts that conveys the right to control the use of an identified asset for a period of time in exchange for payments to be made to the owners (lessors) are accounted for as leases. Contracts are assessed to determine whether a contract is, or contains, a lease at the inception of a contract or when the terms and conditions of a contract are significantly changed. The lease term is the non-cancellable period of a lease, together with contractual options to extend or to terminate the lease early, where it is reasonably certain that an extension option will be exercised or a termination option will not be exercised.
Group as a lessee
At the commencement of a lease contract, a right-of-use asset and a corresponding lease liability are recognised, unless the lease term is 12 months or less or value of underlying asset is of low value. The commencement date of a lease is the date the underlying asset is made available for use.
Lease liability is measured at an amount equal to the present value of the lease payments during the lease term that are not paid at that date. Lease liability includes contingent rentals and variable lease payments that depend on an index, rate, or where they are fixed payments in substance. The lease liability is remeasured when the contractual cash flows of variable lease payments change due to a change in an index or rate when the lease term changes following a reassessment.
Lease payments are discounted using the interest rate implicit in the lease. If that rate is not readily available, the incremental borrowing rate is applied. The incremental
Notes to consolidated financial statements (Contd.)
For the year ended March 31, 2021
156 157
CORPORATE OVERVIEW BOARD’S REPORT FINANCIAL STATEMENTSANNUAL REPORT 2020-21NAYARA ENERGY LIMITED
borrowing rate reflects the rate of interest that the lessee would have to pay to borrow over a similar term, with a similar security, the funds necessary to obtain an asset of a similar nature and value to the right-of-use asset in a similar economic environment.
In general, a corresponding right-of-use asset is recognised at cost, which comprises the amount of the initial measurement of the lease liability, any lease payments made at or before the commencement date, less any lease incentives received, any initial direct costs incurred by the lessee adjusted for accumulated depreciation, impairment losses and any remeasurement of lease liabilities. The depreciation on right-of-use assets is recognised as expense unless capitalised when the right-of-use asset is used to construct another asset. Right of use assets are depreciated on a straight line basis over the lesser of the assessed useful lives of the asset or the lease period.
In addition, the carrying amount of lease liabilities is remeasured if there is a modification, a change in the lease term, a change in the lease payments (e.g., changes to future payments resulting from a change in an index or rate used to determine such lease payments) or a change in the assessment of an option to purchase the underlying asset.
The Group applies the short-term lease recognition exemption to its short-term leases of plant and machinery and building (i.e., those leases that have a lease term of 12 months or less from the commencement date and do not contain a purchase option). It also applies the lease of low-value assets recognition exemption to leases of plant and machinery and vehicles that are considered to be low value. Lease payments on short-term leases and leases of low-value assets are recognised as expense on a straight-line basis over the lease term.
Impairment of the right-of-use asset
Right-of-use assets are subject to existing impairment requirements as set out in ‘Impairment of non-financials assets’’
G. Inventories
Inventories are valued at the lower of cost and net realisable value.
Cost of inventories comprise of all costs of purchase, costs of conversion and other costs incurred in bringing the inventories to their present location and condition. The cost of crude oil purchased and coal inventory is determined on a
first in first out basis and the cost of all other inventories is determined on a monthly weighted average basis.
Net realisable value is the estimated selling price in the ordinary course of business less the estimated costs of completion and the estimated costs necessary to make the sale.
H. Revenue from contract with customer
(i) Sale of goods
Revenue from contracts with customers is recognised when control of the goods are transferred to the customer at an amount that reflects the consideration to which the Group expects to be entitled in exchange for those goods. The Group has generally concluded that it is the principal in its revenue arrangements, because it typically controls the goods before transferring them to the customer. Revenue from sale of goods is recognised at the point in time when control of the goods is transferred to the customer, generally on delivery of the goods. The recovery of excise duty flows to the Group on its own account, revenue includes excise duty. Revenue does not include other taxes like goods and service tax, value added tax and central sales tax etc.
(ii) Variable consideration
The variable consideration is estimated at contract inception and constrained until it is highly probable that a significant revenue reversal in the amount of cumulative revenue recognised will not occur when the associated uncertainty with the variable consideration is subsequently resolved. The volume rebates give rise to variable consideration. The Group provides retrospective volume rebates to certain customers once the quantity of products purchased during the period exceeds a threshold specified in the contract. Rebates are offset against amounts payable by the customer. The Group applies the requirements on constraining estimates of variable consideration and recognises a refund liability for the expected future rebates.
(iii) Contract Liabilities
A contract liability is recognised if a payment is received or a payment is due (whichever is earlier) from a customer before the Group transfers the related goods or services. Contract liabilities are recognised as revenue when the Group performs under the contract (i.e., transfers control of the related goods or services to the customer).
Notes to consolidated financial statements (Contd.)
For the year ended March 31, 2021
I. Government grants
Government grants are recognised where there is reasonable assurance that the grant will be received and all attached conditions will be complied with.
When the grant relates to an expense item, it is recognised as income on a systematic basis over the periods that the related costs, for which it is intended to compensate, are expensed. When the grant related to an assets, it is recognised as income in equal amount over the expected useful life of the related assets.
J. Retirement and other employee benefits
Contributions to defined contribution plans are recognised as expense on accrual basis when employees have rendered services and as when the contributions are due. These expenses are confined to contribution only.
The Group determines the present value of the defined benefit obligation and fair value of plan assets. The net liability or assets represents the deficit or surplus in the Group’s defined benefit plans. (The surplus is limited to the present value of economic benefits available in the form of refunds from the plans or reductions in future contributions to the plans). The present value of the obligation is determined using the projected unit credit method, with actuarial valuations being carried out at the end of each year.
Remeasurements, comprising of actuarial gains and losses, the effect of the asset ceiling, excluding amounts included in net interest on the net defined benefit liability and the return on plan assets (excluding amounts included in net interest on the net defined benefit liability), are recognised immediately in the consolidated balance sheet with a corresponding debit or credit to retained earnings through OCI in the period in which they occur. Remeasurements are not reclassified to the consolidated statement of profit and loss in subsequent periods.
Past service costs are recognised in the consolidated statement of profit and loss on the earlier of the date of the plan amendment or curtailment, and the date that the Group recognises related restructuring costs. Net interest is calculated by applying the discount rate to the net defined benefit liability or asset. The Group recognises the following changes in the net defined benefit obligation in the consolidated statement of profit and loss:
• Service costs comprising current service costs, past-service costs, gains and losses on curtailments and non-routine settlements as employee benefit expense.
• Net interest expense or income as finance cost/ finance income.
K. Foreign currencies
The Group’s consolidated financial statements are presented in Indian Rupees, which is also the parent company’s functional currency. For each entity the Group determines the functional currency and items included in the financial statements of each entity are measured using that functional currency. The Group uses the direct method of consolidation and on disposal of a foreign operation the gain or loss that is reclassified to the consolidated statement of profit and loss reflects the amount that arises from using this method.
(i) Transaction and balances
Transactions in foreign currencies are initially recorded by the Group’s entities at their respective functional currency spot rates at the date the transaction first qualifies for recognition. At the end of each reporting period, monetary items denominated in foreign currencies are retranslated at the rates prevailing at that date. Differences arising on settlement or translation of monetary items are recognised in the consolidated statement of profit and loss. Non-monetary items carried at fair value that are denominated in Foreign Currencies are retranslated at the rates prevailing at the date when the fair value was determined. Non-monetary items that are measured in terms of historical cost in a foreign currency are not retranslated.
Exchange difference arising on settlement/ restatement of long-term foreign currency monetary items recognized in the financial statements for the year ended March 31, 2016 prepared under previous GAAP, are capitalized as a part of the depreciable fixed assets to which the monetary item relates and depreciated over the remaining useful life of such assets. If such monetary items do not relate to acquisition of depreciable fixed assets, the exchange difference is amortised over the maturity period/ upto the date of settlement of such monetary item, whichever is earlier and charged to the Statement of Profit and Loss. The un-amortised exchange difference is carried under other equity as “Foreign currency monetary item translation difference account” net of tax effect thereon, where applicable. Exchange difference arising on settlement / restatement of other items are charged to statement of profit and loss.
Notes to consolidated financial statements (Contd.)
For the year ended March 31, 2021
158 159
CORPORATE OVERVIEW BOARD’S REPORT FINANCIAL STATEMENTSANNUAL REPORT 2020-21NAYARA ENERGY LIMITED

(ii) Group companies
On consolidation, the assets and liabilities of foreign operations are translated into INR at the rate of exchange prevailing at the reporting date and their statements of profit or loss are translated at exchange rates prevailing at the dates of the transactions. For practical reasons, the group uses an average rate to translate income and expense items, if the average rate approximates the exchange rates at the dates of the transactions. The exchange differences arising on translation for consolidation are recognised in OCI. On disposal of a foreign operation, the component of OCI relating to that particular foreign operation is reclassified in the consolidated statement of profit or loss.
Any goodwill arising on the acquisition/ business combination of a foreign operation and any fair value adjustments to the carrying amounts of assets and liabilities arising on the acquisition are treated as assets and liabilities of the foreign operation and translated at the spot rate of exchange at the reporting date. The restated gain / loss is recognised in OCI.
L. Financial Instruments
A financial instrument is any contract that gives rise to a financial asset of one entity and a financial liability or equity instrument of another entity. Financial instruments comprise of financial assets and financial liabilities. Financial assets primarily comprise of loans and advances, deposits, trade receivables and cash and cash equivalents. Financial liabilities include trade and other payables, loans and borrowings including bank overdrafts, and derivative financial instruments. Derivatives can be financial assets or financial liabilities depending on whether value is positive or negative respectively.
Financial assets and financial liabilities are recognised when an entity becomes a party to the contractual provisions of the instrument.
(i) Financial Assets
a) Initial Recognition and measurement
The Group initially recognises loans and advances, deposits and debt securities issued on the date on which they originate. All other financial instruments (including regular way purchases and sales of financial assets) are recognised on the trade date, which is the date on which the Group becomes a party to the contractual provisions of the instrument. A financial asset is initially measured at fair value plus / minus, for
an item not at fair value through profit or loss (FVTPL), transaction costs that are directly attributable to its acquisition or issue.
b) Classification of financial assets
On initial recognition, a financial asset is classified into one of the following categories:
• Equity instruments at fair value through profit or loss (FVTPL)
• Financial assets other than equity investment at amortised cost
• Financial assets other than equity investment at fair value through other comprehensive income (FVTOCI)
• Financial assets other than equity investment at fair value through profit or loss (FVTPL)
Equity instruments at fair value through profit or loss (FVTPL)
Financial assets at fair value through profit or loss are carried in the statement of financial position at fair value with net changes in fair value recognised in the statement of profit or loss. This category includes equity investments which the Group had not irrevocably elected to classify at fair value through OCI. Dividends on equity investments are recognised as other income in the consolidated statement of profit and loss when the right of payment has been established.
Financial assets other than equity investment measured at amortised cost:
A financial asset is measured at amortised cost if it meets both of the following conditions and is not designated at FVTPL:
• The asset is held within a business model whose objective is to hold assets to collect contractual cash flows, and
• The contractual terms of the financial asset give rise on specified dates to cash flows that are solely payments of principal and interest on the principal amount outstanding.
This category is the most relevant to the Group. After initial measurement, such financial assets are subsequently measured at amortised cost using the effective interest rate (EIR) method. Amortised cost is calculated by taking into account any discount or
Notes to consolidated financial statements (Contd.)
For the year ended March 31, 2021
premium on acquisition and fees or costs that are an integral part of the EIR. The EIR amortisation is included in finance income in the statement of profit and loss. The losses arising from impairment are recognised in the statement of profit and loss. This category generally applies to deposits, advances, trade and other receivables.
Financial assets other than equity investment at FVTOCI:
A debt instrument is classified as FVTOCI only if it meets both of the following conditions and is not designated at FVTPL;
• The asset is held within a business model whose objective is achieved by both collecting contractual cash flows and selling financial assets, and
• The contractual terms of the financial asset give rise on specified dates to cash flows that are solely payments of principal and interest on the principal amount outstanding.
For debt instruments at fair value through OCI, interest income, foreign exchange revaluation and impairment losses or reversals are recognised in the consolidated statement of profit or loss and computed in the same manner as for financial assets measured at amortised cost. The remaining fair value changes are recognised in OCI. Upon derecognition, the cumulative fair value change recognised in OCI is recycled to profit or loss.
Financial assets other than equity investment at FVTPL:
FVTPL is a residual category for financial assets. Any debt instrument, which does not meet the criteria for categorization as at amortized cost or as FVTOCI, is classified as at FVTPL. In addition, the group may elect to designate a debt instrument, which otherwise meets amortized cost or FVTOCI criteria, as at FVTPL. However, such election is allowed only if doing so reduces or eliminates a measurement or recognition inconsistency (referred to as ‘accounting mismatch’).
Debt instruments included within the FVTPL category are measured at fair value with all changes recognized in the consolidated statement of profit and loss.
c) Derecognition of financial assets
The Group derecognises a financial asset when the contractual rights to the cash flows from the asset
expire, or when it transfers the financial asset and substantially all the risks and rewards of ownership of the asset to another party.
On derecognition of a financial asset in its entirety, the difference between the asset’s carrying amount and the sum of the consideration received and receivable and the cumulative gain or loss that had been recognised in other comprehensive income and accumulated in equity is recognised in profit or loss if such gain or loss would have otherwise been recognised in profit or loss on disposal of that financial asset.
d) Impairment of financial assets
In accordance with Ind AS 109, the Group uses ‘Expected Credit Loss’ (ECL) model, for evaluating impairment of financial assets other than those measured at FVTPL. Expected credit losses are measured through a loss allowance at an amount equal to:
• The 12-months expected credit losses (expected credit losses that result from those default events on the financial instrument that are possible within 12 months after the reporting date); or
• For other assets, the Group uses 12 month Expected Credit Loss to provide for impairment loss where there is no significant increase in credit risk. If there is significant increase in credit risk full lifetime Expected Credit Loss is used.
• Full lifetime expected credit losses (expected credit losses that result from all possible default events over the life of the financial instrument).
For trade receivables, the Group applies ‘simplified approach’ which requires expected lifetime losses to be recognised from initial recognition of the receivables. The Group uses historical default rates to determine impairment loss on the portfolio of trade receivables. At every reporting date these historical default rates are reviewed and changes in the forward looking estimates are analysed.
e) Effective interest method
The effective interest method is a method of calculating the amortised cost of a debt instrument and of allocating interest income over the relevant period. The effective interest rate is the rate that exactly discounts estimated future cash receipts (including all fees and points paid or received that form an integral
Notes to consolidated financial statements (Contd.)
For the year ended March 31, 2021
160 161
CORPORATE OVERVIEW BOARD’S REPORT FINANCIAL STATEMENTSANNUAL REPORT 2020-21NAYARA ENERGY LIMITED
part of the effective interest rate, transaction costs and other premiums or discounts) through the expected life of the debt instrument, or, where appropriate, a shorter period, to the net carrying amount on initial recognition.
Income is recognised on an effective interest basis for debt instruments other than those financial assets classified as at FVTPL. Interest income is recognized in the consolidated statement of profit and loss and is included in the ‘Other income’ line item.
(ii) Financial liabilities / debt and equity instruments
a) Classification as financial liability / debt or equity
Debt and equity instruments issued by a Group are classified as either financial liabilities or as equity in accordance with the substance of the contractual arrangements and the definitions of a financial liability and an equity instrument in Ind AS 32.
b) Financial liabilities / debt
Financial liabilities are classified, at initial recognition, as financial liabilities at fair value through profit or loss, loans and borrowings including payables, or as derivatives designated as hedging instruments in an effective hedge, as appropriate.
All financial liabilities are recognised initially at fair value and, in the case of loans and borrowings and payables, plus directly attributable transaction costs.
The Group’s financial liabilities include trade and other payables, loans and borrowings including bank overdrafts, and derivative financial instruments. Derivative can be financial assets or financial liabilities depending on whether value is positive or negative respectively.
c) Supplier’s credit and Buyer’s credit:
The Group enters into an arrangement whereby banks make direct payment to supplier on due date. The banks are subsequently paid by the Group at later date based on the extended credit terms agreed with the banks. Where this arrangement is agreed with supplier and the Group’s legal liability remains towards the supplier only, in such cases the liability is classified as Trade Payable in the balance sheet and in other instances the same is classified as a borrowing.
If the classification of the liability under the above arrangement is a Trade Payable, the Group treats the
payment of the supplier by the financial institution as a non-cash transaction and the other associated cash flows are presented as cash flows from operating activities. In other instances, the associated cash flows are presented as cash flows from financing activities.
Interest expense on these are recognised in the finance cost.
d) Financial liabilities:
The financial liabilities used to minimise accounting mismatch are classified and measured as at FVTPL in accordance with Ind AS 109. All other financial liabilities (including borrowings and trade and other payables) are subsequently measured at amortised cost using the effective interest method. Gains and losses are recognised in the consolidated statement of profit and loss when the liabilities are derecognised as well as through the EIR amortisation process.
e) Derecognition of financial liabilities:
The Group derecognises financial liabilities when, and only when, the Group’s obligations are discharged, cancelled or have expired. An exchange between with a lender of debt instruments with substantially different terms is accounted for as an extinguishment of the original financial liability and the recognition of a new financial liability. Similarly, a substantial modification of the terms of an existing financial liability (whether or not attributable to the financial difficulty of the debtor) is accounted for as an extinguishment of the original financial liability and the recognition of a new financial liability. The difference between the carrying amount of the financial liability derecognised and the new liability recognised plus consideration paid or payable is recognised in the consolidated statement of profit and loss.
M. Derivative financial instruments and hedge accounting
(i) Initial recognition and subsequent measurement of Derivative and embedded derivatives financial instruments
The Group enters into a variety of derivative financial instruments to manage its exposure to interest rate, commodity price and foreign exchange rate risks. These derivatives include foreign exchange forward contracts, foreign exchange options, commodity forward contracts, interest rate swaps and cross / full currency swaps. For risk management objectives refer note 41(C).
Notes to consolidated financial statements (Contd.)
For the year ended March 31, 2021
All derivatives are initially recognised at fair value at the date the derivative contracts are entered into and are subsequently remeasured to their fair value at the end of each reporting period. Derivatives are carried as financial assets when the fair value is positive and as financial liabilities when the fair value is negative.
The resulting gain or loss is recognised in the consolidated statement of profit and loss immediately unless the derivative is designated and effective as a hedging instrument, in which event the timing of the recognition in the consolidated statement of profit and loss or otherwise depends on the nature of the hedge item.
Derivatives embedded in non-derivative host contracts that are not financial assets within the scope of Ind AS 109 ‘Financial Instruments’ are treated as separate derivatives when their risks and characteristics are not closely related to those of the host contracts and the host contracts are not measured at FVTPL.
(ii) Hedge Accounting
For the purpose of hedge accounting, hedges are classified as:
• Fair value hedges when hedging the exposure to changes in the fair value of a recognised asset or liability or an unrecognised firm commitment
• Cash flow hedges when hedging the exposure to variability in cash flows that is either attributable to a particular risk associated with a recognised asset or liability or a highly probable forecast transaction or the foreign currency risk in an unrecognised firm commitment
• Hedges of a net investment in a foreign operation
At the inception of the hedge relationship, the Group documents the relationship between the hedging instrument and the hedged item, along with its risk management objectives and its strategy for undertaking various hedge transactions. Furthermore, at the inception of the hedge and on an ongoing basis, the Group documents whether the hedging instrument is effective in offsetting changes in cash flows of the hedged item attributable to the hedged risk.
(iii) Cash flow hedges
Changes in the fair value of derivatives/ hedging instruments that are designated and qualify as cash flow hedges are deferred in the “Cash Flow Hedge
Reserve”. The gain or loss relating to the ineffective portion is recognised immediately in the statement of profit and loss. Amounts deferred in the Cash Flow Hedge Reserve Account are recycled in the statement of profit and loss in the periods when the hedged item is recognised and affects the statement of profit and loss, in the same line as the hedged item.
Hedge accounting is discontinued when - the hedging instrument expires or is sold, terminated, or exercised, or no longer qualifies for hedge accounting. In case of cash flow hedges, any cumulative gain or loss deferred in the Cash Flow Hedge Reserve Account at that time is retained and is recognised when the forecast transaction is ultimately recognised and affects the statement of profit and loss. When a forecast transaction is no longer expected to occur, the cumulative gain or loss that was deferred is recognised immediately in the statement of profit and loss.
N. Borrowing Costs
Borrowing costs consists of interest and other costs that an entity incurs in connection with the borrowing of funds.
Borrowing cost also includes exchange differences to the extent regarded as an adjustment to the borrowing costs.
Borrowing costs directly attributable to the acquisition, construction or production of qualifying assets, which are assets that necessarily take a substantial period of time to get ready for their intended use, are added to the cost of those assets, until such time as the assets are substantially ready for their intended use. All other borrowing costs are recognised in the Statement of profit and loss in the period in which they are incurred.
O. Taxes
(i) Current Income tax
Current income tax assets and liabilities are measured at the amount expected to be recovered from or paid to the taxation authorities. The tax rates and tax laws used to compute the amount are those that are enacted or substantively enacted, at the reporting date.
Current income tax relating to items recognised outside consolidated statement of profit and loss is recognised outside consolidated statement of profit and loss (either in other comprehensive income or in equity). Current tax items are recognised in correlation to the underlying transaction either in OCI or directly in equity. Management periodically evaluates positions taken
Notes to consolidated financial statements (Contd.)
For the year ended March 31, 2021
162 163
CORPORATE OVERVIEW BOARD’S REPORT FINANCIAL STATEMENTSANNUAL REPORT 2020-21NAYARA ENERGY LIMITED
in the tax returns with respect to situations in which applicable tax regulations are subject to interpretation and establishes provisions where appropriate.
(ii) Deferred tax
Deferred tax is provided using the liability method on temporary differences between the tax bases of assets and liabilities and their carrying amounts for financial reporting purposes at the reporting date.
Deferred tax liabilities are recognised for all taxable temporary differences, except:
• When the deferred tax liability arises from the initial recognition of goodwill or an asset or liability in a transaction that is not a business combination and, at the time of the transaction, affects neither the accounting profit nor taxable profit or loss.
• In respect of taxable temporary differences associated with investments in subsidiaries, when the timing of the reversal of the temporary differences can be controlled and it is probable that the temporary differences will not reverse in the foreseeable future. Deferred tax assets are recognised for all deductible temporary differences, the carry forward of unused tax credits and any unused tax losses. Deferred tax assets are recognised to the extent that it is probable that taxable profit will be available against which the deductible temporary differences, and the carry forward of unused tax credits and unused tax losses can be utilised. However, recognition of deferred tax asset is subject to the following exceptions: When the deferred tax asset relating to the deductible temporary difference arises from the initial recognition of an asset or liability in a transaction that is not a business combination and, at the time of the transaction, affects neither the accounting profit nor taxable profit or loss.
• In respect of deductible temporary differences associated with investments in subsidiaries, deferred tax assets are recognised only to the extent that it is probable that the temporary differences will reverse in the foreseeable future and taxable profit will be available against which the temporary differences can be utilized.
The carrying amount of deferred tax assets is reviewed at each reporting date and reduced to the extent that it is no longer probable that sufficient taxable profit will be available to allow all or part of the deferred tax asset
to be utilised. Unrecognised deferred tax assets are re-assessed at each reporting date and are recognised to the extent that it has become probable that future taxable profits will allow the deferred tax asset to be recovered
Deferred tax assets and liabilities are measured at the tax rates that are expected to apply in the year when the asset is realised or the liability is settled, based on tax rates (and tax laws) that have been enacted or substantively enacted at the reporting date.
Deferred tax relating to items recognised outside statement of profit and loss is recognised outside statement of profit and loss (either in other comprehensive income or in equity). Deferred tax items are recognised in correlation to the underlying transaction either in OCI or directly in equity.
Deferred tax assets and deferred tax liabilities are offset if a legally enforceable right exists to set off current tax assets against current tax liabilities and the deferred taxes relate to income taxes levied by the same taxation authority on the same taxable entity.
(iii) Sales tax (includes value added tax and Goods and services tax)
Expenses and assets are recognised net of the amount of sales tax, except:
• When the sales tax incurred on a purchase of assets or services is not recoverable from the taxation authority, in which case, the tax paid is recognised as part of the cost of acquisition of the asset or as part of the expense item, as applicable
• When receivables and payables are stated with the amount of tax included
The net amount of sales tax recoverable from, or payable to, the taxation authority is included as part of other assets and other liabilities in the consolidated balance sheet.
P. Provisions and Contingent liabilities
A provision is recognised when there is a present obligation as a result of a past event, it is probable that an outflow of resources embodying economic benefits will be required to settle the obligation and a reliable estimate can be made of the amount of the obligation.
A contingent liability is a possible obligation that arises from past events and whose existence will be confirmed only by the occurrence or non-occurrence of one or more uncertain
Notes to consolidated financial statements (Contd.)
For the year ended March 31, 2021
future events not wholly within the control of the Group or a present obligation that is not recognized because it is not probable that an outflow of resources will be required to settle the obligation. A contingent liability also arises in extremely rare cases where there is a liability that cannot be recognized because it cannot be measured reliably. The Group does not recognize a contingent liability but discloses it in the financial statements, unless the possibility of an outflow of resources embodying economic benefits is remote.
Q. Cash and Cash Equivalent
Cash and short-term deposits in the consolidated balance sheet comprise cash at banks and on hand and short-term deposits with an original maturity of three months or less, which are subject to an insignificant risk of changes in value.
For the purpose of the consolidated statement of cash flows, cash and cash equivalents consist of cash and short-term deposits, as defined above, net of outstanding bank overdrafts as they are considered an integral part of the Group’s cash management.
R. Exceptional items
Exceptional items are those items that management considers, by virtue of their size or incidence, should be disclosed separately to ensure that the financial information allows a better understanding of the underlying performance of the business in the year and facilitates more appropriate comparison with prior periods. Exceptional items are adjusted in arriving at profit before tax.
S. Current and Non-Current Classification
The Group presents assets and liabilities in the balance sheet based on current/ non-current classification.
An asset is treated as current when it is:
• Expected to be realised or intended to be sold or consumed in normal operating cycle
• Held primarily for the purpose of trading
• Expected to be realised within twelve months after the reporting period, or
• Cash or cash equivalent unless restricted from being exchanged or used to settle a liability for at least twelve months after the reporting period
• All other assets are classified as non-current.
A liability is current when:
• It is expected to be settled in normal operating cycle
• It is held primarily for the purpose of trading
• It is due to be settled within twelve months after the reporting period, or
• There is no unconditional right to defer the settlement of the liability for at least twelve months after the reporting period
The Group classify all other liabilities as Non Current.
Deferred tax assets and liabilities are classified as Non – current assets and liabilities
The terms of the liability that could, at the option of the counterparty, result in its settlement by the issue of equity instruments do not affect its classification.
4. Critical accounting judgments and key sources of estimation uncertaintyThe preparation of the Group’s consolidated financial statements requires management to make judgements, estimates and assumptions about the reported amounts of assets and liabilities, and, income and expenses and accompanying disclosures, and the disclosure of contingent liabilities. Uncertainty about these assumptions and estimates could result in outcomes that require a material adjustment to the carrying amount of assets or liabilities affected in future periods.
A. Critical accounting judgements
In the process of applying the Group’s accounting policies, the management has made the following judgements, which have the most significant effect on the amounts recognised in the consolidated financial statements:
i) Determination of functional currency
The Management makes judgements in determining the functional currency based on economic substance of the transactions relevant to each entity in the Group. In concluding that Indian Rupees is the functional currency for the parent company, the management considered (i) the currency that mainly influences the sales prices for goods and services, the labour, material and other costs of providing goods and services, and (ii) the effect of the competitive forces and regulations of the country which mainly determine the sales prices of the goods and services. As no single currency was clearly dominant,
Notes to consolidated financial statements (Contd.)
For the year ended March 31, 2021
164 165
CORPORATE OVERVIEW BOARD’S REPORT FINANCIAL STATEMENTSANNUAL REPORT 2020-21NAYARA ENERGY LIMITED
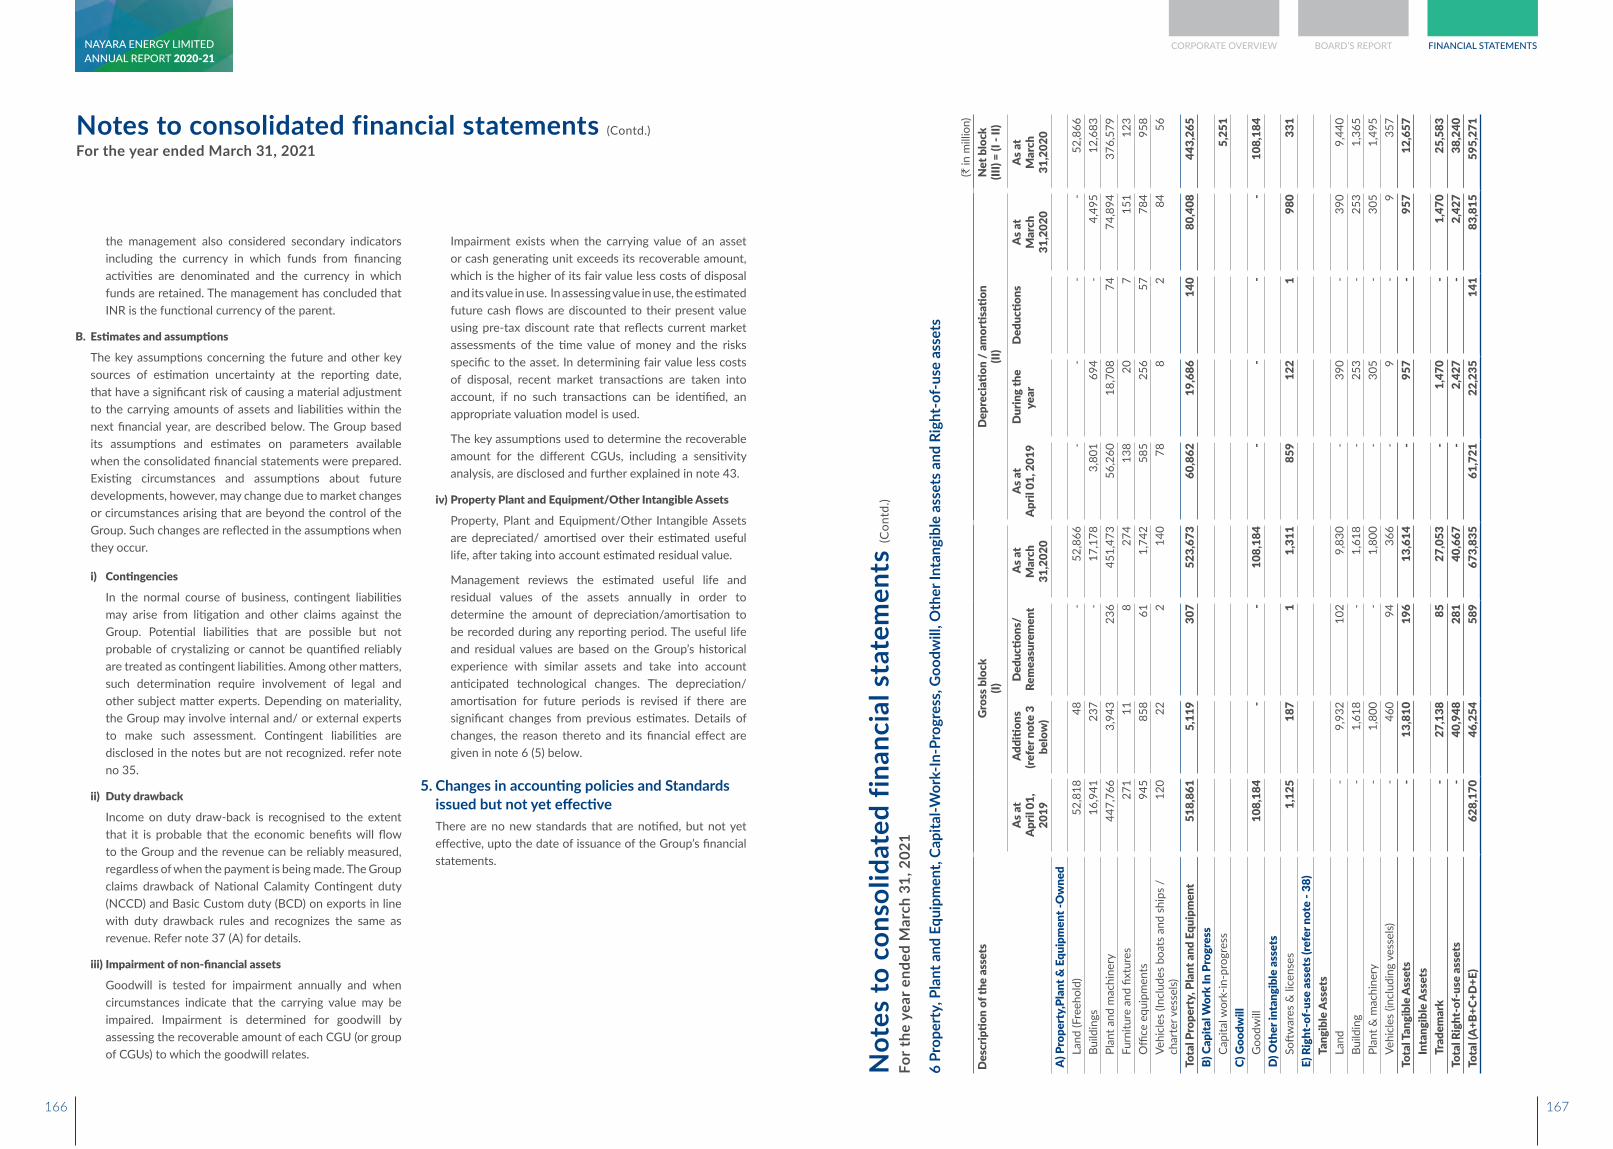
the management also considered secondary indicators including the currency in which funds from financing activities are denominated and the currency in which funds are retained. The management has concluded that INR is the functional currency of the parent.
B. Estimates and assumptions
The key assumptions concerning the future and other key sources of estimation uncertainty at the reporting date, that have a significant risk of causing a material adjustment to the carrying amounts of assets and liabilities within the next financial year, are described below. The Group based its assumptions and estimates on parameters available when the consolidated financial statements were prepared. Existing circumstances and assumptions about future developments, however, may change due to market changes or circumstances arising that are beyond the control of the Group. Such changes are reflected in the assumptions when they occur.
i) Contingencies
In the normal course of business, contingent liabilities may arise from litigation and other claims against the Group. Potential liabilities that are possible but not probable of crystalizing or cannot be quantified reliably are treated as contingent liabilities. Among other matters, such determination require involvement of legal and other subject matter experts. Depending on materiality, the Group may involve internal and/ or external experts to make such assessment. Contingent liabilities are disclosed in the notes but are not recognized. refer note no 35.
ii) Duty drawback
Income on duty draw-back is recognised to the extent that it is probable that the economic benefits will flow to the Group and the revenue can be reliably measured, regardless of when the payment is being made. The Group claims drawback of National Calamity Contingent duty (NCCD) and Basic Custom duty (BCD) on exports in line with duty drawback rules and recognizes the same as revenue. Refer note 37 (A) for details.
iii) Impairment of non-financial assets
Goodwill is tested for impairment annually and when circumstances indicate that the carrying value may be impaired. Impairment is determined for goodwill by assessing the recoverable amount of each CGU (or group of CGUs) to which the goodwill relates.
Impairment exists when the carrying value of an asset or cash generating unit exceeds its recoverable amount, which is the higher of its fair value less costs of disposal and its value in use. In assessing value in use, the estimated future cash flows are discounted to their present value using pre-tax discount rate that reflects current market assessments of the time value of money and the risks specific to the asset. In determining fair value less costs of disposal, recent market transactions are taken into account, if no such transactions can be identified, an appropriate valuation model is used.
The key assumptions used to determine the recoverable amount for the different CGUs, including a sensitivity analysis, are disclosed and further explained in note 43.
iv) Property Plant and Equipment/Other Intangible Assets
Property, Plant and Equipment/Other Intangible Assets are depreciated/ amortised over their estimated useful life, after taking into account estimated residual value.
Management reviews the estimated useful life and residual values of the assets annually in order to determine the amount of depreciation/amortisation to be recorded during any reporting period. The useful life and residual values are based on the Group’s historical experience with similar assets and take into account anticipated technological changes. The depreciation/ amortisation for future periods is revised if there are significant changes from previous estimates. Details of changes, the reason thereto and its financial effect are given in note 6 (5) below.
5. Changes in accounting policies and Standards issued but not yet effectiveThere are no new standards that are notified, but not yet effective, upto the date of issuance of the Group’s financial statements.
Notes to consolidated financial statements (Contd.)
For the year ended March 31, 2021
6 Pr
oper
ty, P
lant
and
Equ
ipm
ent,
Capi
tal-W
ork-
In-P
rogr
ess,
Goo
dwill
, Oth
er In
tang
ible
ass
ets a
nd R
ight
-of-
use
asse
ts
(` in
mill
ion)
Des
crip
tion
of th
e as
sets
G
ross
blo
ck
(I)D
epre
ciati
on /
am
ortis
ation
(II
)N
et b
lock
(II
I) =
(I - I
I)
As a
t A
pril
01,
2019
Add
ition
s (re
fer n
ote
3 be
low
)
Ded
uctio
ns/
Rem
easu
rem
ent
As a
t M
arch
31
,202
0
As a
t A
pril
01, 2
019
Dur
ing
the
year
D
educ
tions
As a
t M
arch
31
,202
0
As a
t M
arch
31
,202
0 A
) Pro
pert
y,Pl
ant &
Equ
ipm
ent -
Ow
ned
La
nd (F
reeh
old)
5
2,81
8 4
8 -
52,
866
- -
- -
52,
866
Bu
ildin
gs
16,
941
237
-
17,
178
3,8
01
694
-
4,4
95
12,
683
Pl
ant a
nd m
achi
nery
4
47,7
66
3,9
43
236
4
51,4
73
56,
260
18,
708
74
74,
894
376
,579
Furn
iture
and
fixt
ures
2
71
11
8
274
1
38
20
7
151
1
23
O
ffice
equ
ipm
ents
9
45
858
6
1 1
,742
5
85
256
5
7 7
84
958
Vehi
cles
(Inc
lude
s bo
ats
and
ship
s /
char
ter v
esse
ls)
120
2
2 2
1
40
78
8
2
84
56
Tota
l Pro
pert
y, P
lant
and
Equ
ipm
ent
518
,861
5
,119
3
07
523
,673
6
0,86
2 1
9,68
6 1
40
80,
408
443
,265
B
) Cap
ital W
ork
In P
rogr
ess
Ca
pita
l wor
k-in
-pro
gres
s 5
,251
C
) Goo
dwill
Goo
dwill
1
08,1
84
- -
108
,184
-
- -
- 1
08,1
84
D) O
ther
inta
ngib
le a
sset
s
Soft
war
es &
lice
nses
1
,125
1
87
1
1,3
11
859
1
22
1
980
3
31
E) R
ight
-of-
use
asse
ts (r
efer
not
e - 3
8)
Ta
ngib
le A
sset
s
Land
-
9,9
32
102
9
,830
-
390
-
390
9
,440
Build
ing
- 1
,618
-
1,6
18
- 2
53
- 2
53
1,3
65
Pl
ant &
mac
hine
ry
- 1
,800
-
1,8
00
- 3
05
- 3
05
1,4
95
Ve
hicl
es (i
nclu
ding
ves
sels)
-
460
9
4 3
66
- 9
-
9
357
To
tal T
angi
ble
Ass
ets
- 1
3,81
0 1
96
13,
614
- 9
57
- 9
57
12,
657
In
tang
ible
Ass
ets
Tr
adem
ark
- 2
7,13
8 8
5 2
7,05
3 -
1,4
70
- 1
,470
2
5,58
3 To
tal R
ight
-of-
use
asse
ts
- 4
0,94
8 2
81
40,
667
- 2
,427
-
2,4
27
38,
240
Tota
l (A
+B+C
+D+E
) 6
28,1
70
46,
254
589
6
73,8
35
61,
721
22,
235
141
8
3,81
5 5
95,2
71
Not
es to
con
solid
ated
fina
ncia
l sta
tem
ents
(Con
td.)
For t
he y
ear e
nded
Mar
ch 3
1, 2
021
166 167
CORPORATE OVERVIEW BOARD’S REPORT FINANCIAL STATEMENTSANNUAL REPORT 2020-21NAYARA ENERGY LIMITED
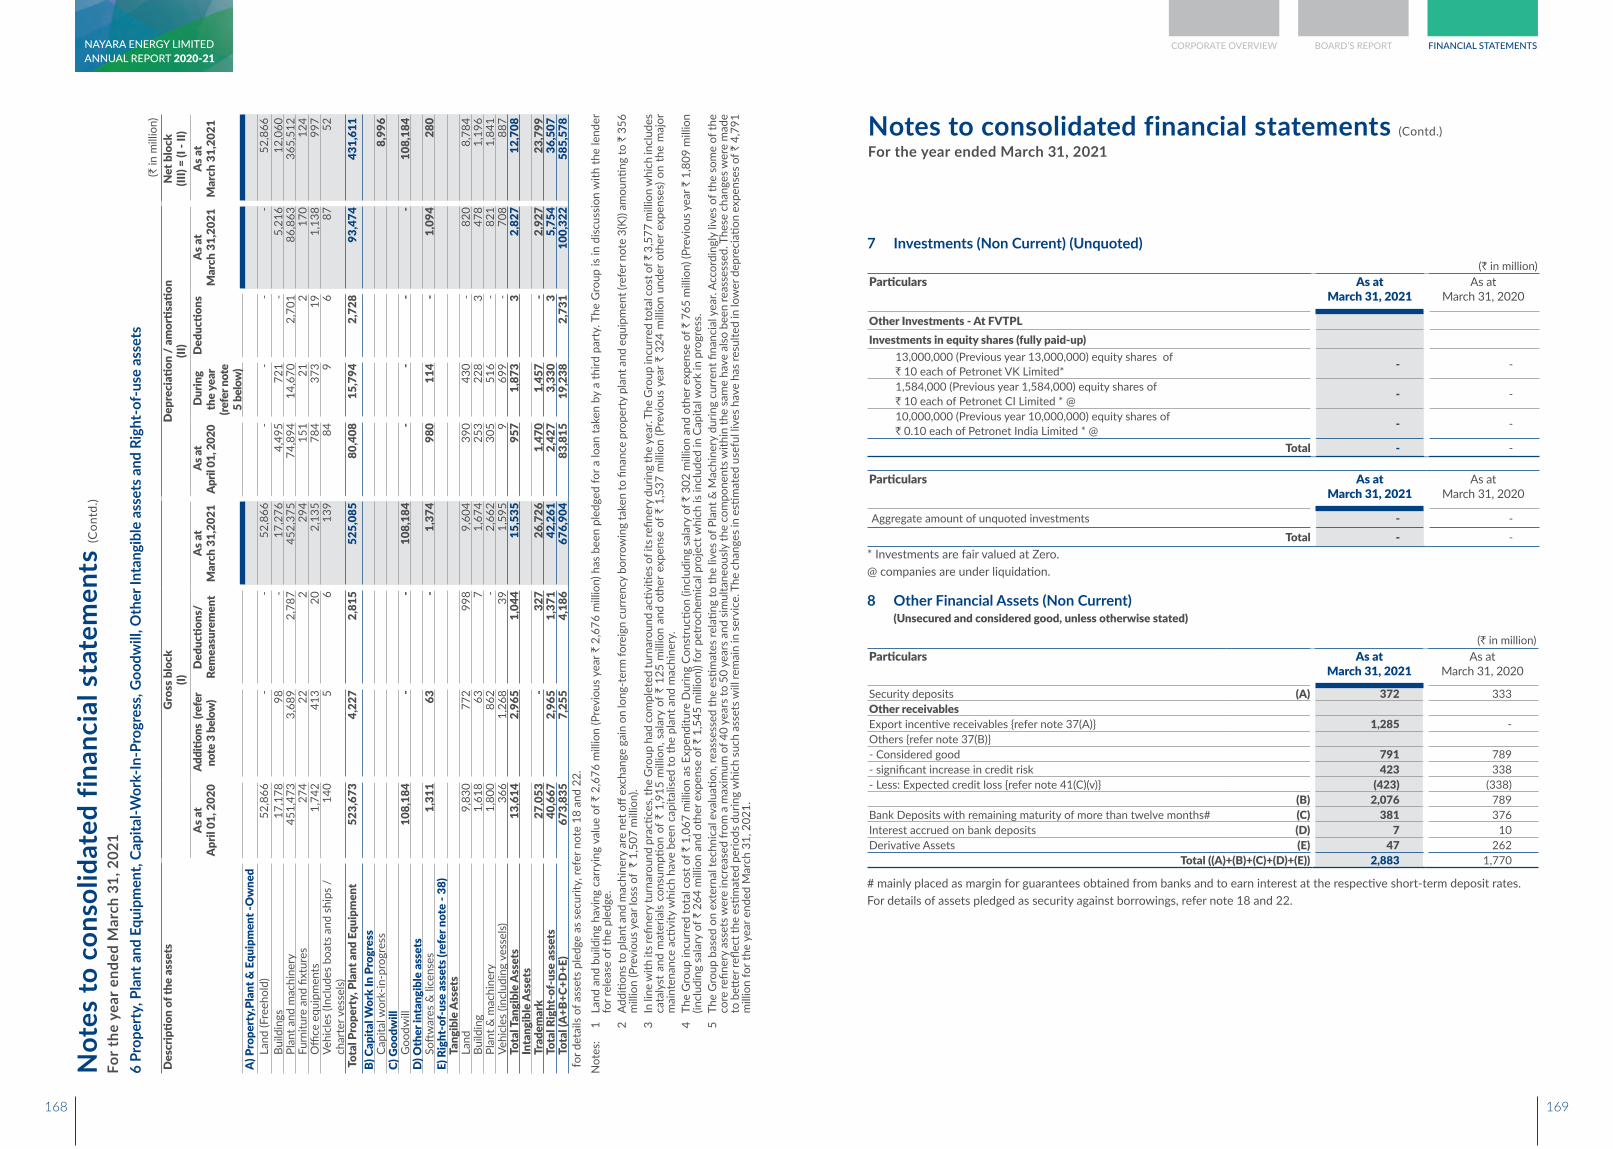
6 Pr
oper
ty, P
lant
and
Equ
ipm
ent,
Capi
tal-W
ork-
In-P
rogr
ess,
Goo
dwill
, Oth
er In
tang
ible
ass
ets a
nd R
ight
-of-
use
asse
ts(`
in m
illio
n)D
escr
iptio
n of
the
asse
ts
Gro
ss b
lock
(I)
Dep
reci
ation
/ a
mor
tisati
on
(II)
Net
blo
ck
(III)
= (I
- II)
As a
t A
pril
01, 2
020
Add
ition
s (re
fer
note
3 b
elow
) D
educ
tions
/ Re
mea
sure
men
tA
s at
Mar
ch 3
1,20
21 A
s at
April
01,
202
0 D
urin
g th
e ye
ar
(refe
r not
e 5
belo
w)
Ded
uctio
nsA
s at
Mar
ch 3
1,20
21A
s at
Mar
ch 3
1,20
21
A) P
rope
rty,
Plan
t & E
quip
men
t -O
wne
d
Land
(Fre
ehol
d)
52,
866
- -
52,
866
- -
- -
52,
866
Bu
ildin
gs
17,
178
98
- 1
7,27
6 4
,495
7
21
- 5
,216
1
2,06
0
Plan
t and
mac
hine
ry
451
,473
3
,689
2
,787
4
52,3
75
74,
894
14,
670
2,7
01
86,
863
365
,512
Furn
iture
and
fixt
ures
2
74
22
2
294
1
51
21
2
170
1
24
O
ffice
equ
ipm
ents
1
,742
4
13
20
2,1
35
784
3
73
19
1,1
38
997
Vehi
cles
(Inc
lude
s bo
ats
and
ship
s /
char
ter v
esse
ls)
140
5
6
1
39
84
9
6
87
52
Tota
l Pro
pert
y, P
lant
and
Equ
ipm
ent
523
,673
4
,227
2
,815
5
25,0
85
80,
408
15,
794
2,7
28
93,
474
431
,611
B)
Cap
ital W
ork
In P
rogr
ess
Ca
pita
l wor
k-in
-pro
gres
s 8
,996
C)
Goo
dwill
Goo
dwill
1
08,1
84
- -
108
,184
-
- -
- 1
08,1
84
D) O
ther
inta
ngib
le a
sset
s
Soft
war
es &
lice
nses
1
,311
6
3 -
1,3
74
980
1
14
- 1
,094
2
80
E) R
ight
-of-
use
asse
ts (r
efer
not
e - 3
8)
Tang
ible
Ass
ets
La
nd
9,8
30
772
9
98
9,6
04
390
4
30
- 8
20
8,7
84
Bu
ildin
g 1
,618
6
3 7
1
,674
2
53
228
3
4
78
1,1
96
Pl
ant &
mac
hine
ry
1,8
00
862
-
2,6
62
305
5
16
- 8
21
1,8
41
Ve
hicl
es (i
nclu
ding
ves
sels)
3
66
1,2
68
39
1,5
95
9
699
-
708
8
87
To
tal T
angi
ble
Ass
ets
13,
614
2,9
65
1,0
44
15,
535
957
1
,873
3
2
,827
1
2,70
8
Inta
ngib
le A
sset
s
Trad
emar
k 2
7,05
3 -
327
2
6,72
6 1
,470
1
,457
-
2,9
27
23,
799
To
tal R
ight
-of-
use
asse
ts
40,
667
2,9
65
1,3
71
42,
261
2,4
27
3,3
30
3
5,7
54
36,
507
To
tal (
A+B
+C+D
+E)
673
,835
7
,255
4
,186
6
76,9
04
83,
815
19,
238
2,7
31
100
,322
5
85,5
78
for
det
ails
of a
sset
s pl
edge
as
secu
rity,
refe
r not
e 18
and
22.
N
otes
: 1
Land
and
bui
ldin
g ha
ving
car
ryin
g va
lue
of `
2,6
76 m
illio
n (P
revi
ous
year
` 2
,676
mill
ion)
has
bee
n pl
edge
d fo
r a lo
an ta
ken
by a
third
par
ty. T
he G
roup
is in
disc
ussio
n w
ith th
e le
nder
fo
r rel
ease
of t
he p
ledg
e.
2
Addi
tions
to p
lant
and
mac
hine
ry a
re n
et o
ff ex
chan
ge g
ain
on lo
ng-t
erm
fore
ign
curr
ency
bor
row
ing
take
n to
fina
nce
prop
erty
pla
nt a
nd e
quip
men
t (re
fer n
ote
3(K)
) am
ounti
ng to
` 3
56
mill
ion
(Pre
viou
s yea
r los
s of
` 1
,507
mill
ion)
.
3 In
line
with
its r
efine
ry tu
rnar
ound
pra
ctice
s, th
e G
roup
had
com
plet
ed tu
rnar
ound
acti
vitie
s of i
ts re
finer
y du
ring
the
year
. The
Gro
up in
curr
ed to
tal c
ost o
f ̀ 3
,577
mill
ion
whi
ch in
clud
es
cata
lyst
and
mat
eria
ls co
nsum
ption
of `
1,9
15 m
illio
n, s
alar
y of
` 1
25 m
illio
n an
d ot
her e
xpen
se o
f ` 1
,537
mill
ion
(Pre
viou
s ye
ar `
324
mill
ion
unde
r oth
er e
xpen
ses)
on
the
maj
or
mai
nten
ance
acti
vity
whi
ch h
ave
been
cap
italis
ed to
the
plan
t and
mac
hine
ry.
4
The
Gro
up in
curr
ed to
tal c
ost o
f ` 1
,067
mill
ion
as E
xpen
ditu
re D
urin
g Co
nstr
uctio
n (in
clud
ing
sala
ry o
f ` 3
02 m
illio
n an
d ot
her e
xpen
se o
f ` 7
65 m
illio
n) (P
revi
ous y
ear `
1,8
09 m
illio
n (in
clud
ing
sala
ry o
f ` 2
64 m
illio
n an
d ot
her e
xpen
se o
f ` 1
,545
mill
ion)
) for
pet
roch
emic
al p
roje
ct w
hich
is in
clud
ed in
Cap
ital w
ork
in p
rogr
ess.
5
The
Gro
up b
ased
on
exte
rnal
tech
nica
l eva
luati
on, r
eass
esse
d th
e es
timat
es re
latin
g to
the
lives
of P
lant
& M
achi
nery
dur
ing
curr
ent fi
nanc
ial y
ear.
Acco
rdin
gly
lives
of t
he s
ome
of th
e co
re re
finer
y as
sets
wer
e in
crea
sed
from
a m
axim
um o
f 40
year
s to
50 y
ears
and
sim
ulta
neou
sly th
e co
mpo
nent
s with
in th
e sa
me
have
also
bee
n re
asse
ssed
. The
se c
hang
es w
ere
mad
e to
bett
er re
flect
the
estim
ated
per
iods
dur
ing
whi
ch su
ch a
sset
s will
rem
ain
in se
rvic
e. T
he c
hang
es in
esti
mat
ed u
sefu
l liv
es h
ave
has r
esul
ted
in lo
wer
dep
reci
ation
exp
ense
s of `
4,7
91
mill
ion
for t
he y
ear e
nded
Mar
ch 3
1, 2
021.
Not
es to
con
solid
ated
fina
ncia
l sta
tem
ents
(Con
td.)
For t
he y
ear e
nded
Mar
ch 3
1, 2
021
7 Investments (Non Current) (Unquoted)(` in million)
Particulars As atMarch 31, 2021
As atMarch 31, 2020
Other Investments - At FVTPLInvestments in equity shares (fully paid-up) 13,000,000 (Previous year 13,000,000) equity shares of
` 10 each of Petronet VK Limited* - -
1,584,000 (Previous year 1,584,000) equity shares of ` 10 each of Petronet CI Limited * @ - -
10,000,000 (Previous year 10,000,000) equity shares of ` 0.10 each of Petronet India Limited * @ - -
Total - -
Particulars As atMarch 31, 2021
As atMarch 31, 2020
Aggregate amount of unquoted investments - - Total - -
* Investments are fair valued at Zero.@ companies are under liquidation.
8 Other Financial Assets (Non Current)(Unsecured and considered good, unless otherwise stated)
(` in million)Particulars As at
March 31, 2021As at
March 31, 2020
Security deposits (A) 372 333 Other receivables Export incentive receivables {refer note 37(A)} 1,285 - Others {refer note 37(B)}- Considered good 791 789 - significant increase in credit risk 423 338 - Less: Expected credit loss {refer note 41(C)(v)} (423) (338)
(B) 2,076 789 Bank Deposits with remaining maturity of more than twelve months# (C) 381 376 Interest accrued on bank deposits (D) 7 10 Derivative Assets (E) 47 262
Total ((A)+(B)+(C)+(D)+(E)) 2,883 1,770
# mainly placed as margin for guarantees obtained from banks and to earn interest at the respective short-term deposit rates.For details of assets pledged as security against borrowings, refer note 18 and 22.
Notes to consolidated financial statements (Contd.)
For the year ended March 31, 2021
168 169
CORPORATE OVERVIEW BOARD’S REPORT FINANCIAL STATEMENTSANNUAL REPORT 2020-21NAYARA ENERGY LIMITED
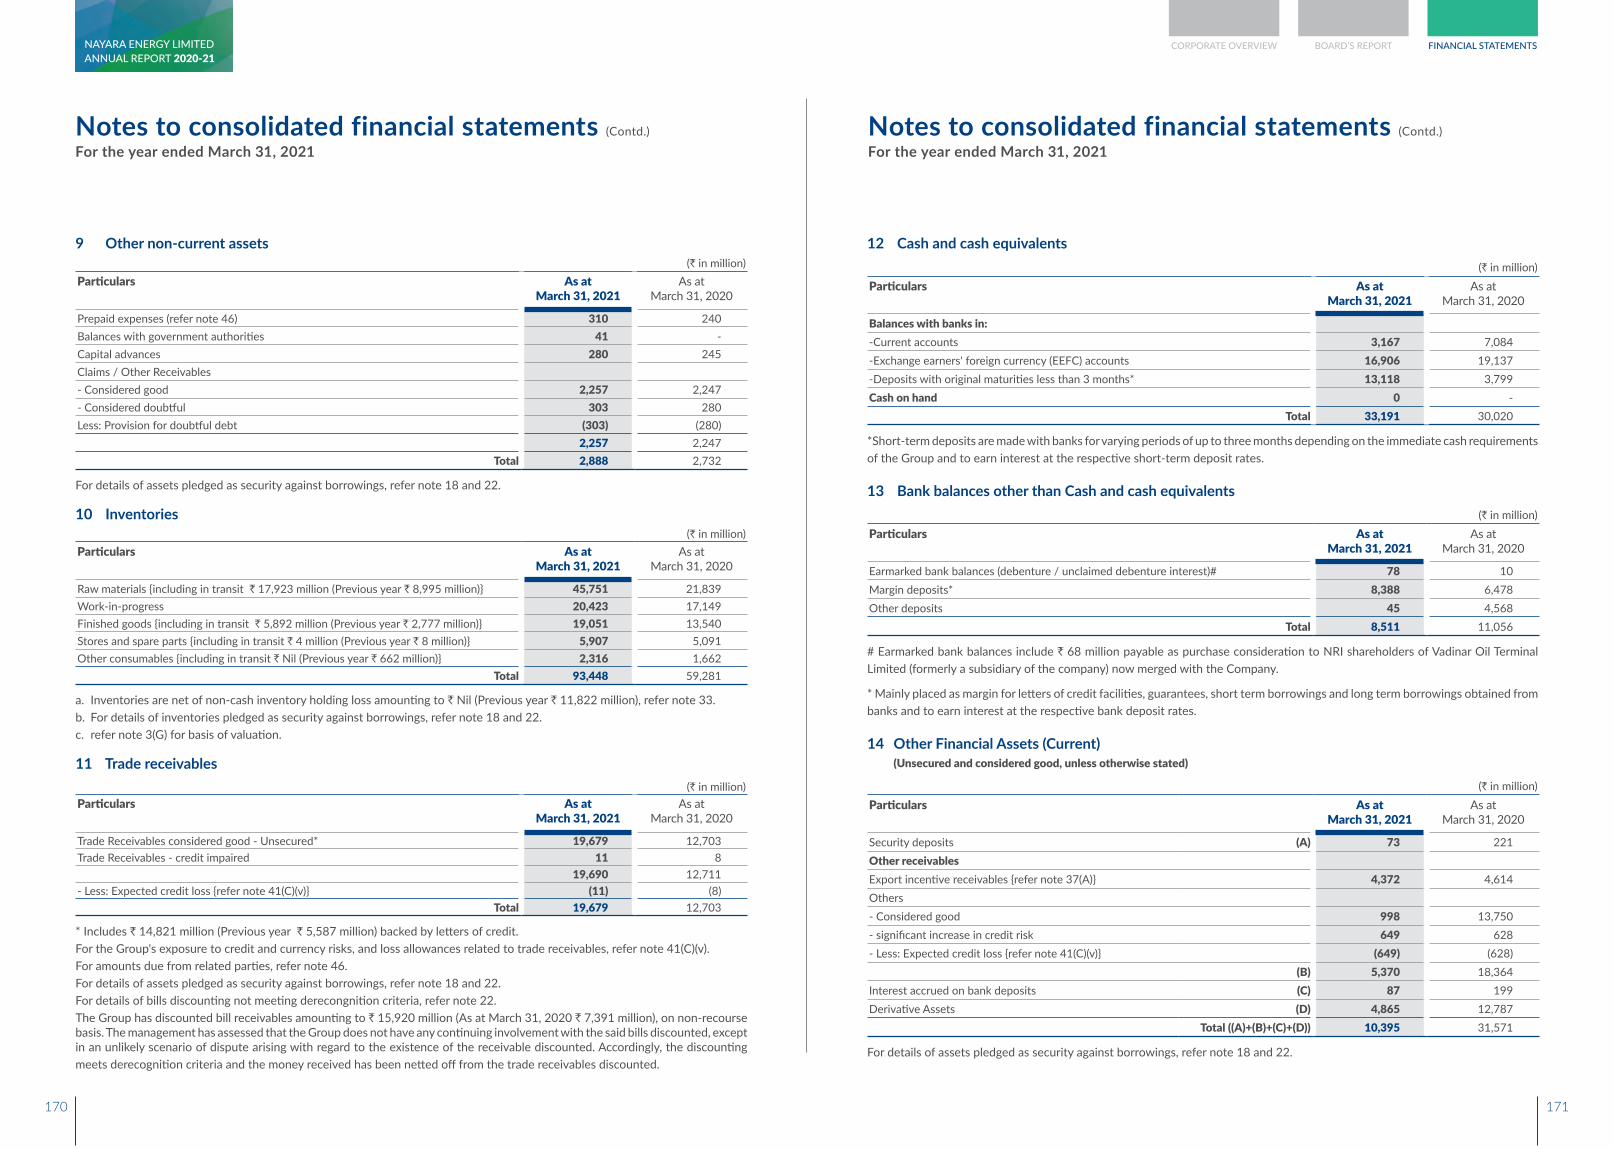
9 Other non-current assets (` in million)
Particulars As atMarch 31, 2021
As atMarch 31, 2020
Prepaid expenses (refer note 46) 310 240 Balances with government authorities 41 - Capital advances 280 245 Claims / Other Receivables- Considered good 2,257 2,247 - Considered doubtful 303 280 Less: Provision for doubtful debt (303) (280)
2,257 2,247 Total 2,888 2,732
For details of assets pledged as security against borrowings, refer note 18 and 22.
10 Inventories(` in million)
Particulars As atMarch 31, 2021
As atMarch 31, 2020
Raw materials {including in transit ` 17,923 million (Previous year ` 8,995 million)} 45,751 21,839 Work-in-progress 20,423 17,149 Finished goods {including in transit ` 5,892 million (Previous year ` 2,777 million)} 19,051 13,540 Stores and spare parts {including in transit ` 4 million (Previous year ` 8 million)} 5,907 5,091 Other consumables {including in transit ` Nil (Previous year ` 662 million)} 2,316 1,662
Total 93,448 59,281
a. Inventories are net of non-cash inventory holding loss amounting to ` Nil (Previous year ` 11,822 million), refer note 33.b. For details of inventories pledged as security against borrowings, refer note 18 and 22.c. refer note 3(G) for basis of valuation.
11 Trade receivables (` in million)
Particulars As atMarch 31, 2021
As atMarch 31, 2020
Trade Receivables considered good - Unsecured* 19,679 12,703 Trade Receivables - credit impaired 11 8
19,690 12,711 - Less: Expected credit loss {refer note 41(C)(v)} (11) (8)
Total 19,679 12,703
* Includes ` 14,821 million (Previous year ` 5,587 million) backed by letters of credit.For the Group's exposure to credit and currency risks, and loss allowances related to trade receivables, refer note 41(C)(v).For amounts due from related parties, refer note 46.For details of assets pledged as security against borrowings, refer note 18 and 22. For details of bills discounting not meeting derecongnition criteria, refer note 22. The Group has discounted bill receivables amounting to ` 15,920 million (As at March 31, 2020 ` 7,391 million), on non-recourse basis. The management has assessed that the Group does not have any continuing involvement with the said bills discounted, except in an unlikely scenario of dispute arising with regard to the existence of the receivable discounted. Accordingly, the discounting meets derecognition criteria and the money received has been netted off from the trade receivables discounted.
Notes to consolidated financial statements (Contd.)
For the year ended March 31, 2021
12 Cash and cash equivalents (` in million)
Particulars As atMarch 31, 2021
As atMarch 31, 2020
Balances with banks in:-Current accounts 3,167 7,084 -Exchange earners' foreign currency (EEFC) accounts 16,906 19,137 -Deposits with original maturities less than 3 months* 13,118 3,799 Cash on hand 0 -
Total 33,191 30,020
*Short-term deposits are made with banks for varying periods of up to three months depending on the immediate cash requirements of the Group and to earn interest at the respective short-term deposit rates.
13 Bank balances other than Cash and cash equivalents (` in million)
Particulars As atMarch 31, 2021
As atMarch 31, 2020
Earmarked bank balances (debenture / unclaimed debenture interest)# 78 10 Margin deposits* 8,388 6,478 Other deposits 45 4,568
Total 8,511 11,056
# Earmarked bank balances include ` 68 million payable as purchase consideration to NRI shareholders of Vadinar Oil Terminal Limited (formerly a subsidiary of the company) now merged with the Company.
* Mainly placed as margin for letters of credit facilities, guarantees, short term borrowings and long term borrowings obtained from banks and to earn interest at the respective bank deposit rates.
14 Other Financial Assets (Current) (Unsecured and considered good, unless otherwise stated)
(` in million)
Particulars As atMarch 31, 2021
As atMarch 31, 2020
Security deposits (A) 73 221 Other receivables Export incentive receivables {refer note 37(A)} 4,372 4,614 Others - Considered good 998 13,750 - significant increase in credit risk 649 628 - Less: Expected credit loss {refer note 41(C)(v)} (649) (628)
(B) 5,370 18,364 Interest accrued on bank deposits (C) 87 199 Derivative Assets (D) 4,865 12,787 Total ((A)+(B)+(C)+(D)) 10,395 31,571
For details of assets pledged as security against borrowings, refer note 18 and 22.
Notes to consolidated financial statements (Contd.)
For the year ended March 31, 2021
170 171
CORPORATE OVERVIEW BOARD’S REPORT FINANCIAL STATEMENTSANNUAL REPORT 2020-21NAYARA ENERGY LIMITED
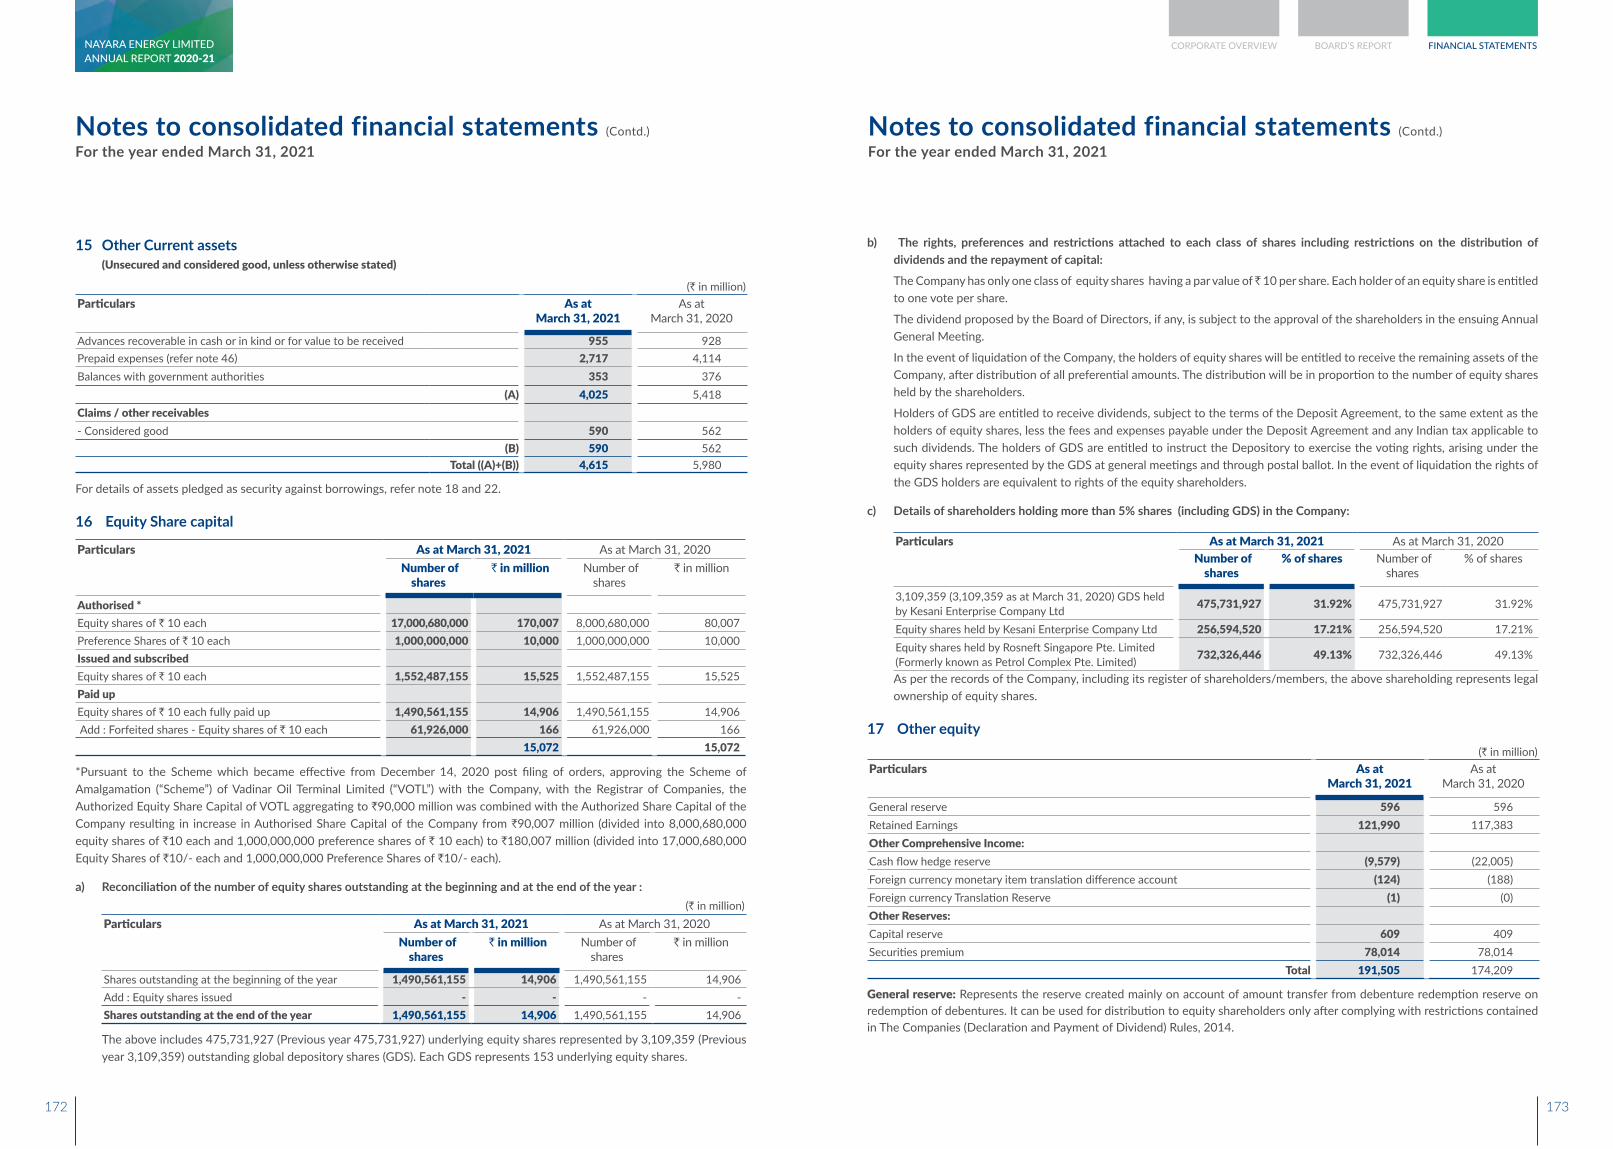
15 Other Current assets(Unsecured and considered good, unless otherwise stated)
(` in million)Particulars As at
March 31, 2021As at
March 31, 2020
Advances recoverable in cash or in kind or for value to be received 955 928 Prepaid expenses (refer note 46) 2,717 4,114 Balances with government authorities 353 376
(A) 4,025 5,418 Claims / other receivables- Considered good 590 562
(B) 590 562 Total ((A)+(B)) 4,615 5,980
For details of assets pledged as security against borrowings, refer note 18 and 22.
16 Equity Share capital
Particulars As at March 31, 2021 As at March 31, 2020 Number of
shares ` in million Number of
shares ` in million
Authorised *Equity shares of ` 10 each 17,000,680,000 170,007 8,000,680,000 80,007 Preference Shares of ` 10 each 1,000,000,000 10,000 1,000,000,000 10,000 Issued and subscribedEquity shares of ` 10 each 1,552,487,155 15,525 1,552,487,155 15,525 Paid upEquity shares of ` 10 each fully paid up 1,490,561,155 14,906 1,490,561,155 14,906 Add : Forfeited shares - Equity shares of ` 10 each 61,926,000 166 61,926,000 166
15,072 15,072
*Pursuant to the Scheme which became effective from December 14, 2020 post filing of orders, approving the Scheme of Amalgamation (“Scheme”) of Vadinar Oil Terminal Limited (“VOTL”) with the Company, with the Registrar of Companies, the Authorized Equity Share Capital of VOTL aggregating to `90,000 million was combined with the Authorized Share Capital of the Company resulting in increase in Authorised Share Capital of the Company from `90,007 million (divided into 8,000,680,000 equity shares of `10 each and 1,000,000,000 preference shares of ` 10 each) to `180,007 million (divided into 17,000,680,000 Equity Shares of `10/- each and 1,000,000,000 Preference Shares of `10/- each).
a) Reconciliation of the number of equity shares outstanding at the beginning and at the end of the year :(` in million)
Particulars As at March 31, 2021 As at March 31, 2020 Number of
shares ` in million Number of
shares ` in million
Shares outstanding at the beginning of the year 1,490,561,155 14,906 1,490,561,155 14,906 Add : Equity shares issued - - - - Shares outstanding at the end of the year 1,490,561,155 14,906 1,490,561,155 14,906
The above includes 475,731,927 (Previous year 475,731,927) underlying equity shares represented by 3,109,359 (Previous year 3,109,359) outstanding global depository shares (GDS). Each GDS represents 153 underlying equity shares.
Notes to consolidated financial statements (Contd.)
For the year ended March 31, 2021
b) The rights, preferences and restrictions attached to each class of shares including restrictions on the distribution of dividends and the repayment of capital:
The Company has only one class of equity shares having a par value of ̀ 10 per share. Each holder of an equity share is entitled to one vote per share.
The dividend proposed by the Board of Directors, if any, is subject to the approval of the shareholders in the ensuing Annual General Meeting.
In the event of liquidation of the Company, the holders of equity shares will be entitled to receive the remaining assets of the Company, after distribution of all preferential amounts. The distribution will be in proportion to the number of equity shares held by the shareholders.
Holders of GDS are entitled to receive dividends, subject to the terms of the Deposit Agreement, to the same extent as the holders of equity shares, less the fees and expenses payable under the Deposit Agreement and any Indian tax applicable to such dividends. The holders of GDS are entitled to instruct the Depository to exercise the voting rights, arising under the equity shares represented by the GDS at general meetings and through postal ballot. In the event of liquidation the rights of the GDS holders are equivalent to rights of the equity shareholders.
c) Details of shareholders holding more than 5% shares (including GDS) in the Company:
Particulars As at March 31, 2021 As at March 31, 2020 Number of
shares % of shares Number of
shares % of shares
3,109,359 (3,109,359 as at March 31, 2020) GDS held by Kesani Enterprise Company Ltd 475,731,927 31.92% 475,731,927 31.92%
Equity shares held by Kesani Enterprise Company Ltd 256,594,520 17.21% 256,594,520 17.21%Equity shares held by Rosneft Singapore Pte. Limited (Formerly known as Petrol Complex Pte. Limited) 732,326,446 49.13% 732,326,446 49.13%
As per the records of the Company, including its register of shareholders/members, the above shareholding represents legal ownership of equity shares.
17 Other equity (` in million)
Particulars As atMarch 31, 2021
As atMarch 31, 2020
General reserve 596 596 Retained Earnings 121,990 117,383 Other Comprehensive Income:Cash flow hedge reserve (9,579) (22,005)Foreign currency monetary item translation difference account (124) (188)Foreign currency Translation Reserve (1) (0)Other Reserves:Capital reserve 609 409 Securities premium 78,014 78,014
Total 191,505 174,209
General reserve: Represents the reserve created mainly on account of amount transfer from debenture redemption reserve on redemption of debentures. It can be used for distribution to equity shareholders only after complying with restrictions contained in The Companies (Declaration and Payment of Dividend) Rules, 2014.
Notes to consolidated financial statements (Contd.)
For the year ended March 31, 2021
172 173
CORPORATE OVERVIEW BOARD’S REPORT FINANCIAL STATEMENTSANNUAL REPORT 2020-21NAYARA ENERGY LIMITED
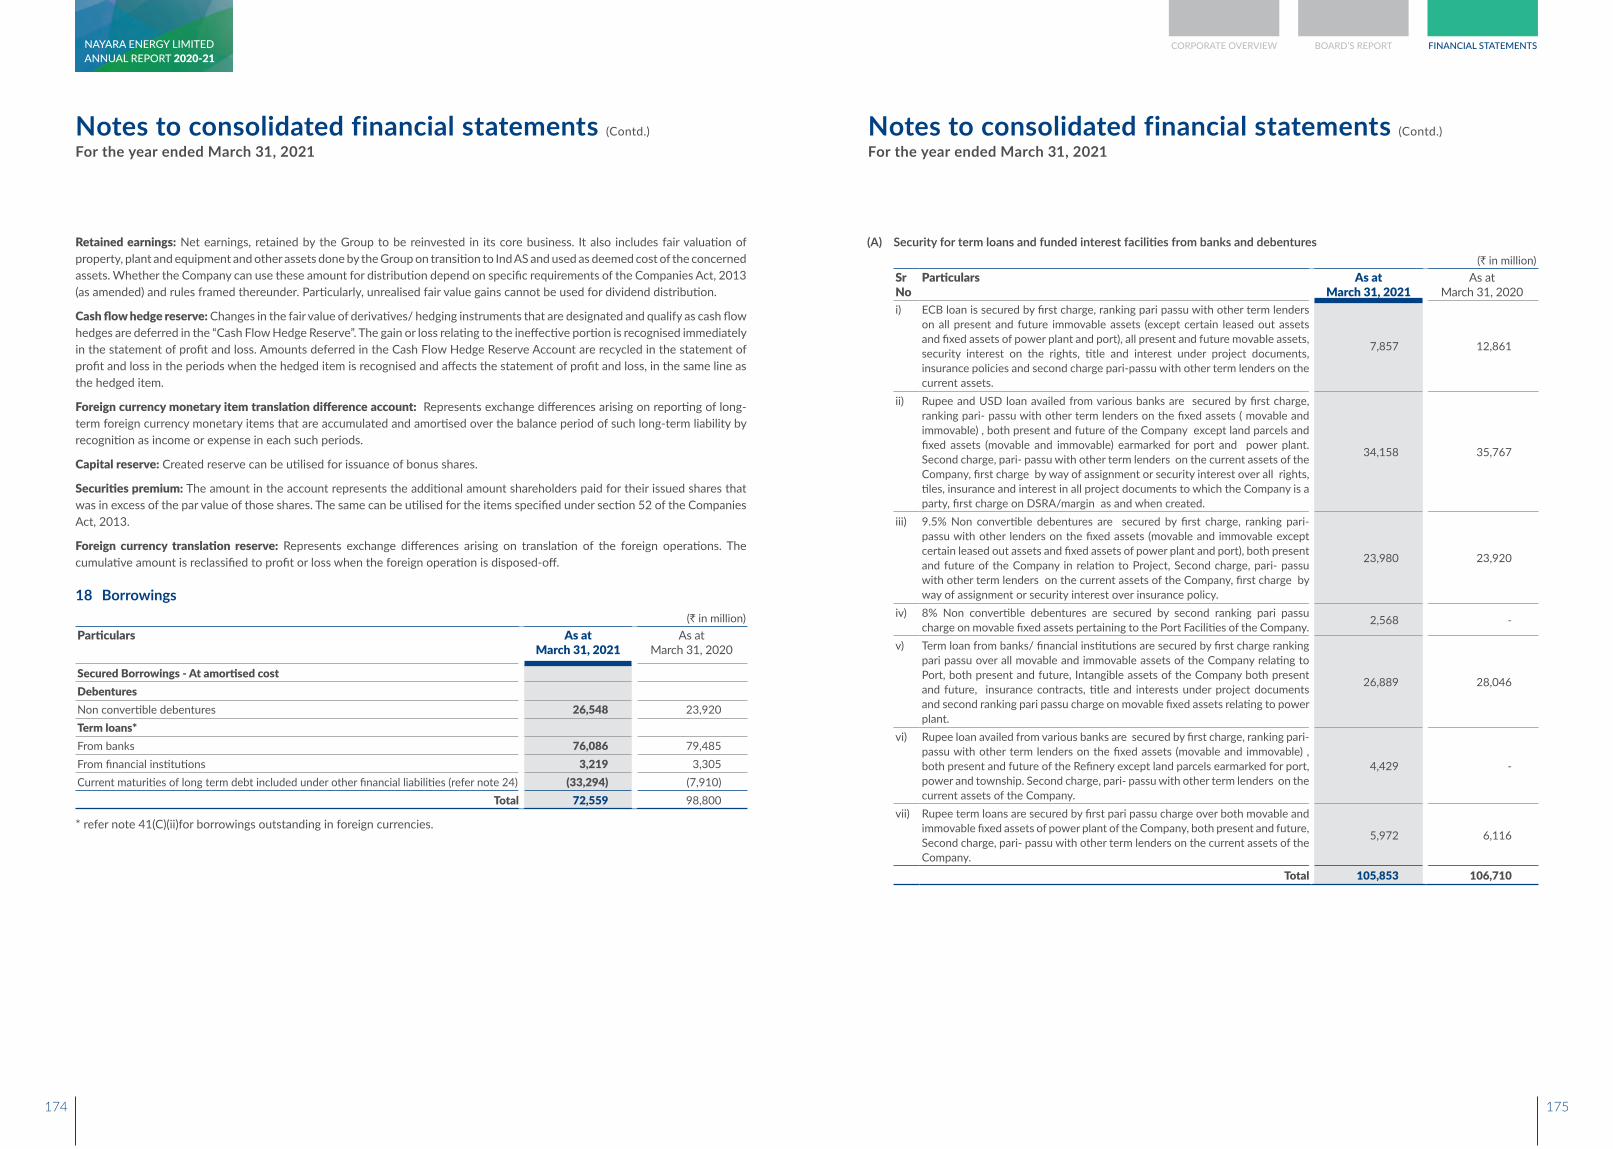
Notes to consolidated financial statements (Contd.)
For the year ended March 31, 2021
Retained earnings: Net earnings, retained by the Group to be reinvested in its core business. It also includes fair valuation of property, plant and equipment and other assets done by the Group on transition to Ind AS and used as deemed cost of the concerned assets. Whether the Company can use these amount for distribution depend on specific requirements of the Companies Act, 2013 (as amended) and rules framed thereunder. Particularly, unrealised fair value gains cannot be used for dividend distribution.
Cash flow hedge reserve: Changes in the fair value of derivatives/ hedging instruments that are designated and qualify as cash flow hedges are deferred in the “Cash Flow Hedge Reserve”. The gain or loss relating to the ineffective portion is recognised immediately in the statement of profit and loss. Amounts deferred in the Cash Flow Hedge Reserve Account are recycled in the statement of profit and loss in the periods when the hedged item is recognised and affects the statement of profit and loss, in the same line as the hedged item.
Foreign currency monetary item translation difference account: Represents exchange differences arising on reporting of long-term foreign currency monetary items that are accumulated and amortised over the balance period of such long-term liability by recognition as income or expense in each such periods.
Capital reserve: Created reserve can be utilised for issuance of bonus shares.
Securities premium: The amount in the account represents the additional amount shareholders paid for their issued shares that was in excess of the par value of those shares. The same can be utilised for the items specified under section 52 of the Companies Act, 2013.
Foreign currency translation reserve: Represents exchange differences arising on translation of the foreign operations. The cumulative amount is reclassified to profit or loss when the foreign operation is disposed-off.
18 Borrowings (` in million)
Particulars As atMarch 31, 2021
As atMarch 31, 2020
Secured Borrowings - At amortised costDebenturesNon convertible debentures 26,548 23,920 Term loans*From banks 76,086 79,485 From financial institutions 3,219 3,305 Current maturities of long term debt included under other financial liabilities (refer note 24) (33,294) (7,910)
Total 72,559 98,800
* refer note 41(C)(ii)for borrowings outstanding in foreign currencies.
(A) Security for term loans and funded interest facilities from banks and debentures(` in million)
Sr No
Particulars As atMarch 31, 2021
As atMarch 31, 2020
i) ECB loan is secured by first charge, ranking pari passu with other term lenders on all present and future immovable assets (except certain leased out assets and fixed assets of power plant and port), all present and future movable assets, security interest on the rights, title and interest under project documents, insurance policies and second charge pari-passu with other term lenders on the current assets.
7,857 12,861
ii) Rupee and USD loan availed from various banks are secured by first charge, ranking pari- passu with other term lenders on the fixed assets ( movable and immovable) , both present and future of the Company except land parcels and fixed assets (movable and immovable) earmarked for port and power plant. Second charge, pari- passu with other term lenders on the current assets of the Company, first charge by way of assignment or security interest over all rights, tiles, insurance and interest in all project documents to which the Company is a party, first charge on DSRA/margin as and when created.
34,158 35,767
iii) 9.5% Non convertible debentures are secured by first charge, ranking pari- passu with other lenders on the fixed assets (movable and immovable except certain leased out assets and fixed assets of power plant and port), both present and future of the Company in relation to Project, Second charge, pari- passu with other term lenders on the current assets of the Company, first charge by way of assignment or security interest over insurance policy.
23,980 23,920
iv) 8% Non convertible debentures are secured by second ranking pari passu charge on movable fixed assets pertaining to the Port Facilities of the Company. 2,568 -
v) Term loan from banks/ financial institutions are secured by first charge ranking pari passu over all movable and immovable assets of the Company relating to Port, both present and future, Intangible assets of the Company both present and future, insurance contracts, title and interests under project documents and second ranking pari passu charge on movable fixed assets relating to power plant.
26,889 28,046
vi) Rupee loan availed from various banks are secured by first charge, ranking pari- passu with other term lenders on the fixed assets (movable and immovable) , both present and future of the Refinery except land parcels earmarked for port, power and township. Second charge, pari- passu with other term lenders on the current assets of the Company.
4,429 -
vii) Rupee term loans are secured by first pari passu charge over both movable and immovable fixed assets of power plant of the Company, both present and future, Second charge, pari- passu with other term lenders on the current assets of the Company.
5,972 6,116
Total 105,853 106,710
Notes to consolidated financial statements (Contd.)
For the year ended March 31, 2021
174 175
CORPORATE OVERVIEW BOARD’S REPORT FINANCIAL STATEMENTSANNUAL REPORT 2020-21NAYARA ENERGY LIMITED
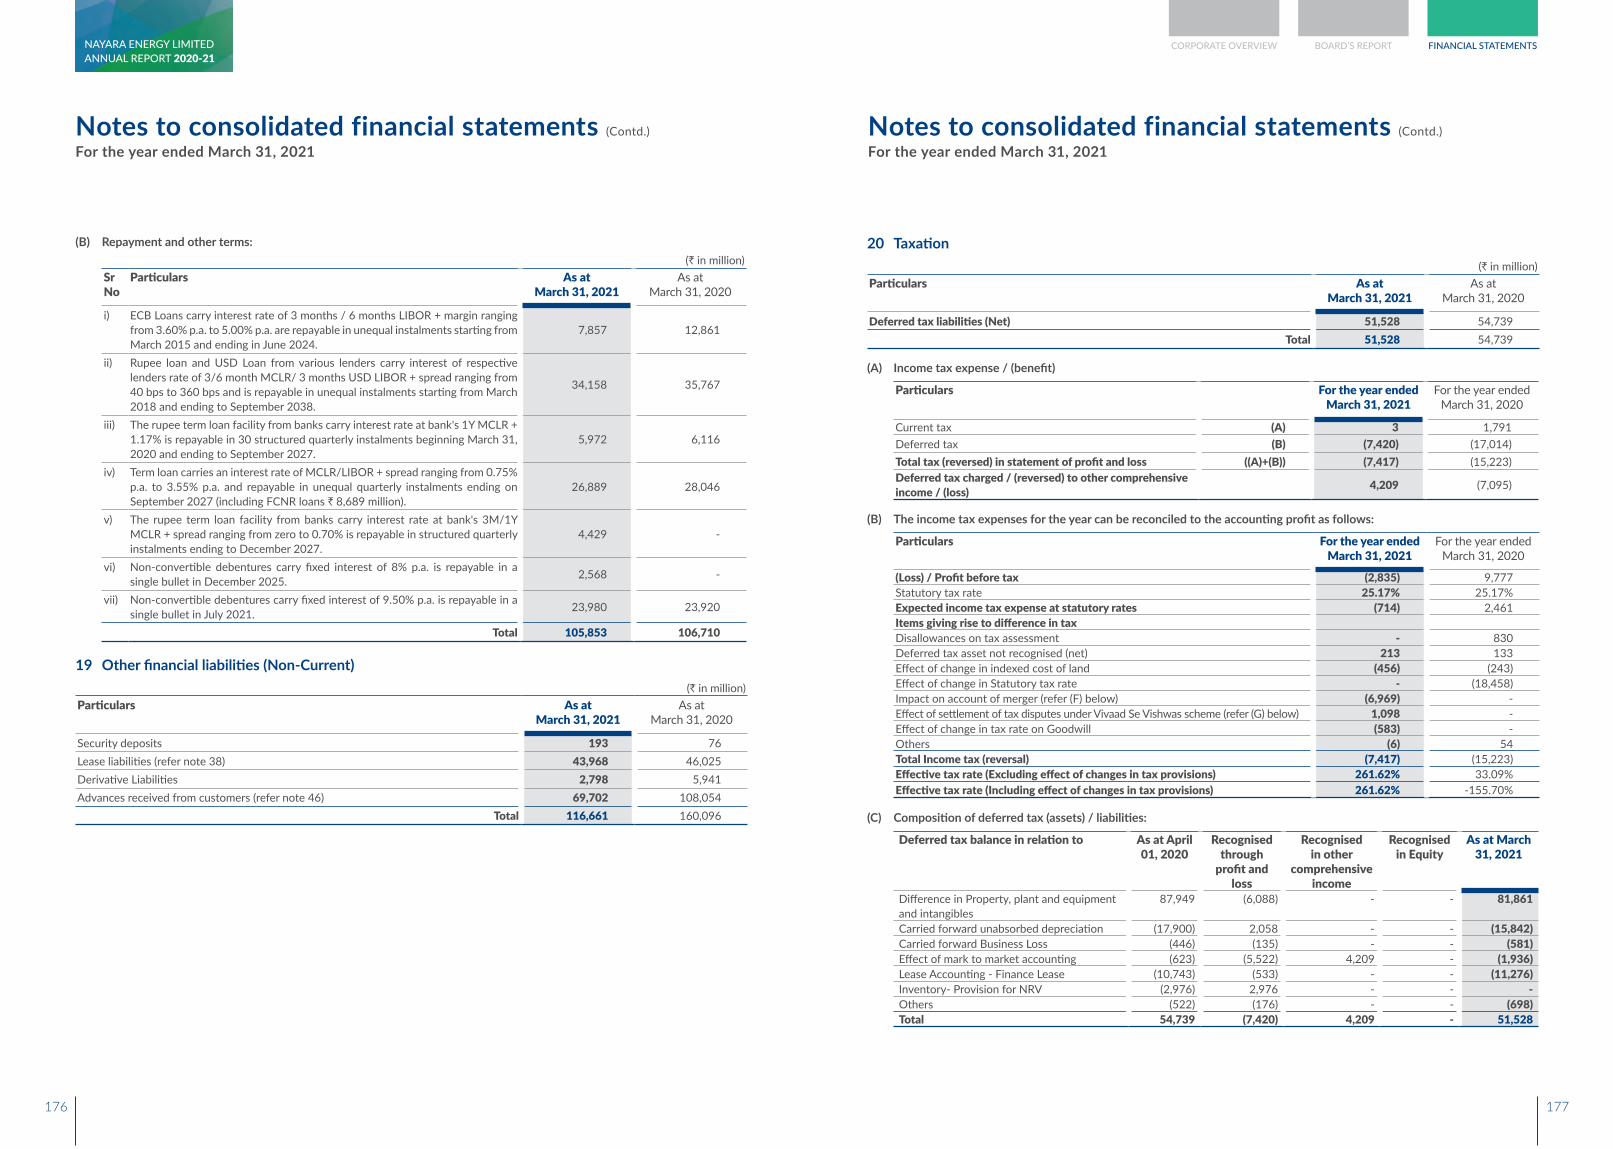
(B) Repayment and other terms:(` in million)
Sr No
Particulars As atMarch 31, 2021
As atMarch 31, 2020
i) ECB Loans carry interest rate of 3 months / 6 months LIBOR + margin ranging from 3.60% p.a. to 5.00% p.a. are repayable in unequal instalments starting from March 2015 and ending in June 2024.
7,857 12,861
ii) Rupee loan and USD Loan from various lenders carry interest of respective lenders rate of 3/6 month MCLR/ 3 months USD LIBOR + spread ranging from 40 bps to 360 bps and is repayable in unequal instalments starting from March 2018 and ending to September 2038.
34,158 35,767
iii) The rupee term loan facility from banks carry interest rate at bank's 1Y MCLR + 1.17% is repayable in 30 structured quarterly instalments beginning March 31, 2020 and ending to September 2027.
5,972 6,116
iv) Term loan carries an interest rate of MCLR/LIBOR + spread ranging from 0.75% p.a. to 3.55% p.a. and repayable in unequal quarterly instalments ending on September 2027 (including FCNR loans ` 8,689 million).
26,889 28,046
v) The rupee term loan facility from banks carry interest rate at bank's 3M/1Y MCLR + spread ranging from zero to 0.70% is repayable in structured quarterly instalments ending to December 2027.
4,429 -
vi) Non-convertible debentures carry fixed interest of 8% p.a. is repayable in a single bullet in December 2025. 2,568 -
vii) Non-convertible debentures carry fixed interest of 9.50% p.a. is repayable in a single bullet in July 2021. 23,980 23,920
Total 105,853 106,710
19 Other financial liabilities (Non-Current) (` in million)
Particulars As atMarch 31, 2021
As atMarch 31, 2020
Security deposits 193 76 Lease liabilities (refer note 38) 43,968 46,025 Derivative Liabilities 2,798 5,941 Advances received from customers (refer note 46) 69,702 108,054
Total 116,661 160,096
Notes to consolidated financial statements (Contd.)
For the year ended March 31, 2021Notes to consolidated financial statements (Contd.)
For the year ended March 31, 2021
20 Taxation(` in million)
Particulars As atMarch 31, 2021
As atMarch 31, 2020
Deferred tax liabilities (Net) 51,528 54,739 Total 51,528 54,739
(A) Income tax expense / (benefit)
Particulars For the year ended March 31, 2021
For the year ended March 31, 2020
Current tax (A) 3 1,791 Deferred tax (B) (7,420) (17,014)Total tax (reversed) in statement of profit and loss ((A)+(B)) (7,417) (15,223)Deferred tax charged / (reversed) to other comprehensive income / (loss) 4,209 (7,095)
(B) The income tax expenses for the year can be reconciled to the accounting profit as follows:
Particulars For the year ended March 31, 2021
For the year ended March 31, 2020
(Loss) / Profit before tax (2,835) 9,777 Statutory tax rate 25.17% 25.17%Expected income tax expense at statutory rates (714) 2,461 Items giving rise to difference in taxDisallowances on tax assessment - 830 Deferred tax asset not recognised (net) 213 133 Effect of change in indexed cost of land (456) (243)Effect of change in Statutory tax rate - (18,458)Impact on account of merger (refer (F) below) (6,969) - Effect of settlement of tax disputes under Vivaad Se Vishwas scheme (refer (G) below) 1,098 - Effect of change in tax rate on Goodwill (583) - Others (6) 54 Total Income tax (reversal) (7,417) (15,223)Effective tax rate (Excluding effect of changes in tax provisions) 261.62% 33.09%Effective tax rate (Including effect of changes in tax provisions) 261.62% -155.70%
(C) Composition of deferred tax (assets) / liabilities:
Deferred tax balance in relation to As at April 01, 2020
Recognised through
profit and loss
Recognised in other
comprehensive income
Recognised in Equity
As at March 31, 2021
Difference in Property, plant and equipment and intangibles
87,949 (6,088) - - 81,861
Carried forward unabsorbed depreciation (17,900) 2,058 - - (15,842)Carried forward Business Loss (446) (135) - - (581)Effect of mark to market accounting (623) (5,522) 4,209 - (1,936)Lease Accounting - Finance Lease (10,743) (533) - - (11,276)Inventory- Provision for NRV (2,976) 2,976 - - - Others (522) (176) - - (698)Total 54,739 (7,420) 4,209 - 51,528
176 177
CORPORATE OVERVIEW BOARD’S REPORT FINANCIAL STATEMENTSANNUAL REPORT 2020-21NAYARA ENERGY LIMITED
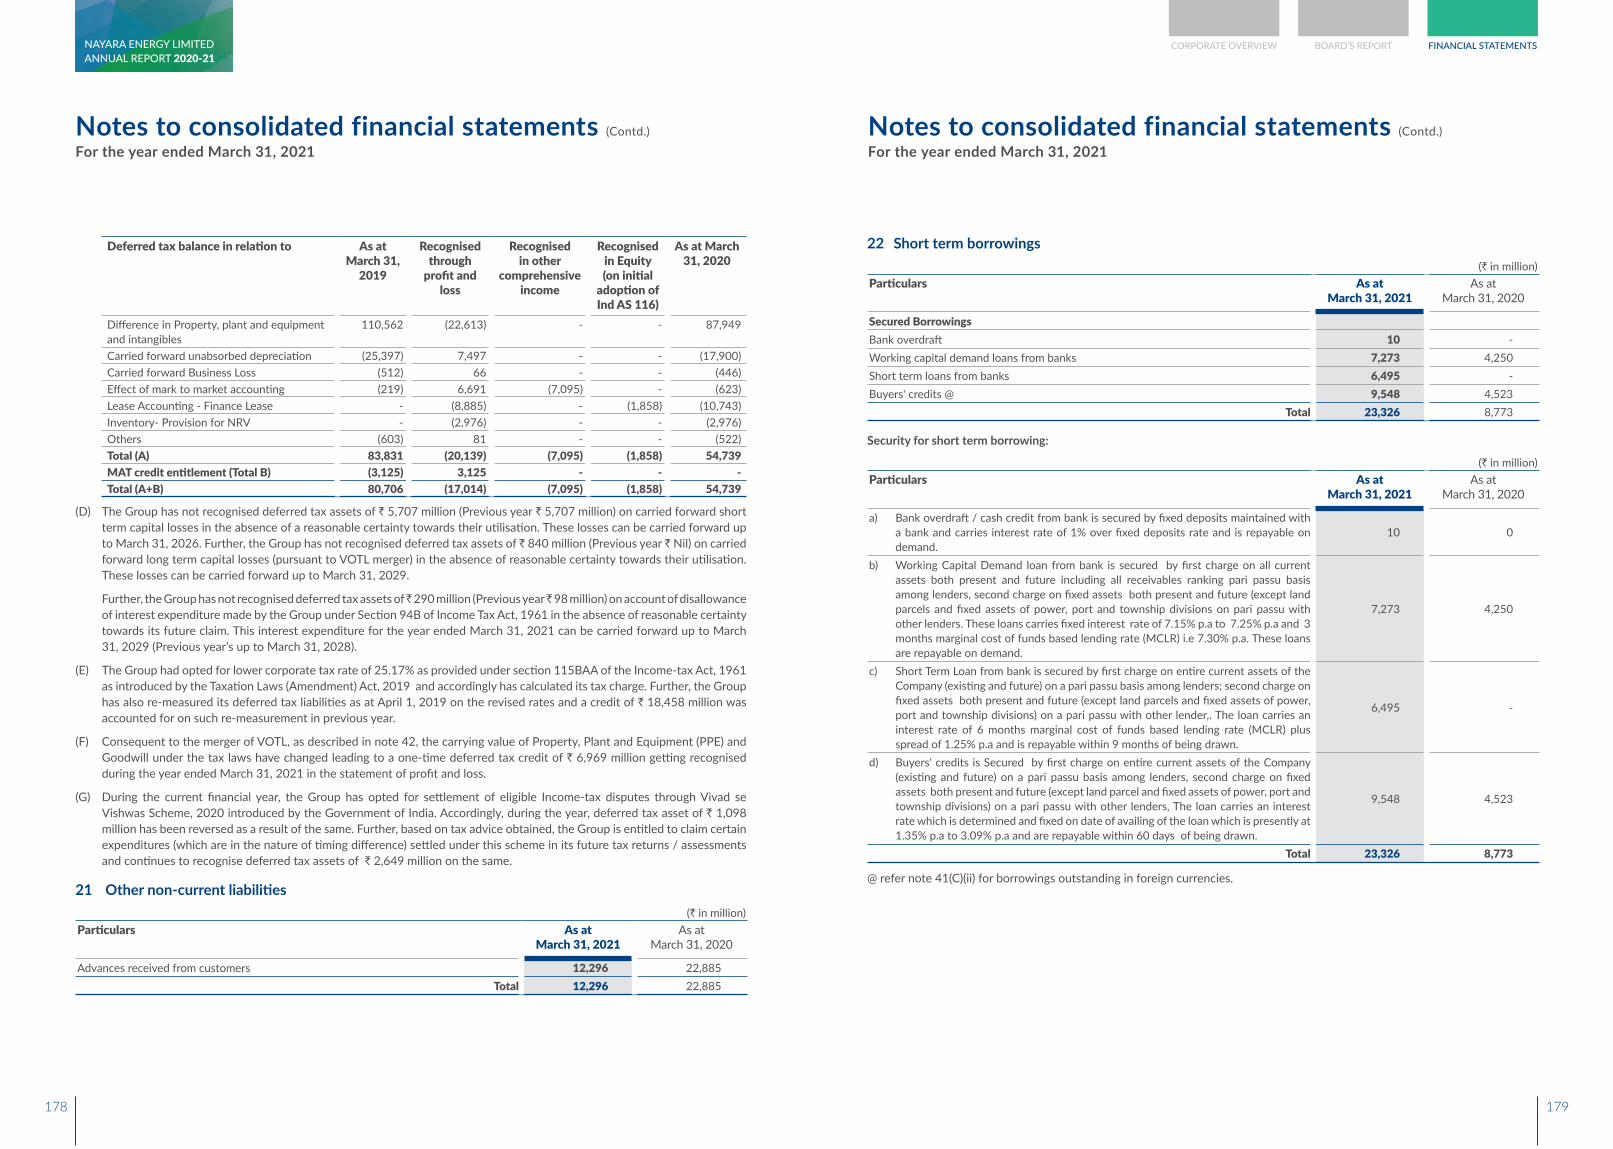
Deferred tax balance in relation to As at March 31,
2019
Recognised through
profit and loss
Recognised in other
comprehensive income
Recognised in Equity (on initial
adoption of Ind AS 116)
As at March 31, 2020
Difference in Property, plant and equipment and intangibles
110,562 (22,613) - - 87,949
Carried forward unabsorbed depreciation (25,397) 7,497 - - (17,900)Carried forward Business Loss (512) 66 - - (446)Effect of mark to market accounting (219) 6,691 (7,095) - (623)Lease Accounting - Finance Lease - (8,885) - (1,858) (10,743)Inventory- Provision for NRV - (2,976) - - (2,976)Others (603) 81 - - (522)Total (A) 83,831 (20,139) (7,095) (1,858) 54,739 MAT credit entitlement (Total B) (3,125) 3,125 - - - Total (A+B) 80,706 (17,014) (7,095) (1,858) 54,739
(D) The Group has not recognised deferred tax assets of ` 5,707 million (Previous year ` 5,707 million) on carried forward short term capital losses in the absence of a reasonable certainty towards their utilisation. These losses can be carried forward up to March 31, 2026. Further, the Group has not recognised deferred tax assets of ` 840 million (Previous year ` Nil) on carried forward long term capital losses (pursuant to VOTL merger) in the absence of reasonable certainty towards their utilisation. These losses can be carried forward up to March 31, 2029.
Further, the Group has not recognised deferred tax assets of ̀ 290 million (Previous year ̀ 98 million) on account of disallowance of interest expenditure made by the Group under Section 94B of Income Tax Act, 1961 in the absence of reasonable certainty towards its future claim. This interest expenditure for the year ended March 31, 2021 can be carried forward up to March 31, 2029 (Previous year’s up to March 31, 2028).
(E) The Group had opted for lower corporate tax rate of 25.17% as provided under section 115BAA of the Income-tax Act, 1961 as introduced by the Taxation Laws (Amendment) Act, 2019 and accordingly has calculated its tax charge. Further, the Group has also re-measured its deferred tax liabilities as at April 1, 2019 on the revised rates and a credit of ` 18,458 million was accounted for on such re-measurement in previous year.
(F) Consequent to the merger of VOTL, as described in note 42, the carrying value of Property, Plant and Equipment (PPE) and Goodwill under the tax laws have changed leading to a one-time deferred tax credit of ` 6,969 million getting recognised during the year ended March 31, 2021 in the statement of profit and loss.
(G) During the current financial year, the Group has opted for settlement of eligible Income-tax disputes through Vivad se Vishwas Scheme, 2020 introduced by the Government of India. Accordingly, during the year, deferred tax asset of ` 1,098 million has been reversed as a result of the same. Further, based on tax advice obtained, the Group is entitled to claim certain expenditures (which are in the nature of timing difference) settled under this scheme in its future tax returns / assessments and continues to recognise deferred tax assets of ` 2,649 million on the same.
21 Other non-current liabilities (` in million)
Particulars As atMarch 31, 2021
As atMarch 31, 2020
Advances received from customers 12,296 22,885 Total 12,296 22,885
Notes to consolidated financial statements (Contd.)
For the year ended March 31, 2021
22 Short term borrowings (` in million)
Particulars As atMarch 31, 2021
As atMarch 31, 2020
Secured BorrowingsBank overdraft 10 - Working capital demand loans from banks 7,273 4,250 Short term loans from banks 6,495 - Buyers' credits @ 9,548 4,523
Total 23,326 8,773
Security for short term borrowing:
(` in million)Particulars As at
March 31, 2021As at
March 31, 2020
a) Bank overdraft / cash credit from bank is secured by fixed deposits maintained with a bank and carries interest rate of 1% over fixed deposits rate and is repayable on demand.
10 0
b) Working Capital Demand loan from bank is secured by first charge on all current assets both present and future including all receivables ranking pari passu basis among lenders, second charge on fixed assets both present and future (except land parcels and fixed assets of power, port and township divisions on pari passu with other lenders. These loans carries fixed interest rate of 7.15% p.a to 7.25% p.a and 3 months marginal cost of funds based lending rate (MCLR) i.e 7.30% p.a. These loans are repayable on demand.
7,273 4,250
c) Short Term Loan from bank is secured by first charge on entire current assets of the Company (existing and future) on a pari passu basis among lenders; second charge on fixed assets both present and future (except land parcels and fixed assets of power, port and township divisions) on a pari passu with other lender,. The loan carries an interest rate of 6 months marginal cost of funds based lending rate (MCLR) plus spread of 1.25% p.a and is repayable within 9 months of being drawn.
6,495 -
d) Buyers' credits is Secured by first charge on entire current assets of the Company (existing and future) on a pari passu basis among lenders, second charge on fixed assets both present and future (except land parcel and fixed assets of power, port and township divisions) on a pari passu with other lenders, The loan carries an interest rate which is determined and fixed on date of availing of the loan which is presently at 1.35% p.a to 3.09% p.a and are repayable within 60 days of being drawn.
9,548 4,523
Total 23,326 8,773
@ refer note 41(C)(ii) for borrowings outstanding in foreign currencies.
Notes to consolidated financial statements (Contd.)
For the year ended March 31, 2021
178 179
CORPORATE OVERVIEW BOARD’S REPORT FINANCIAL STATEMENTSANNUAL REPORT 2020-21NAYARA ENERGY LIMITED
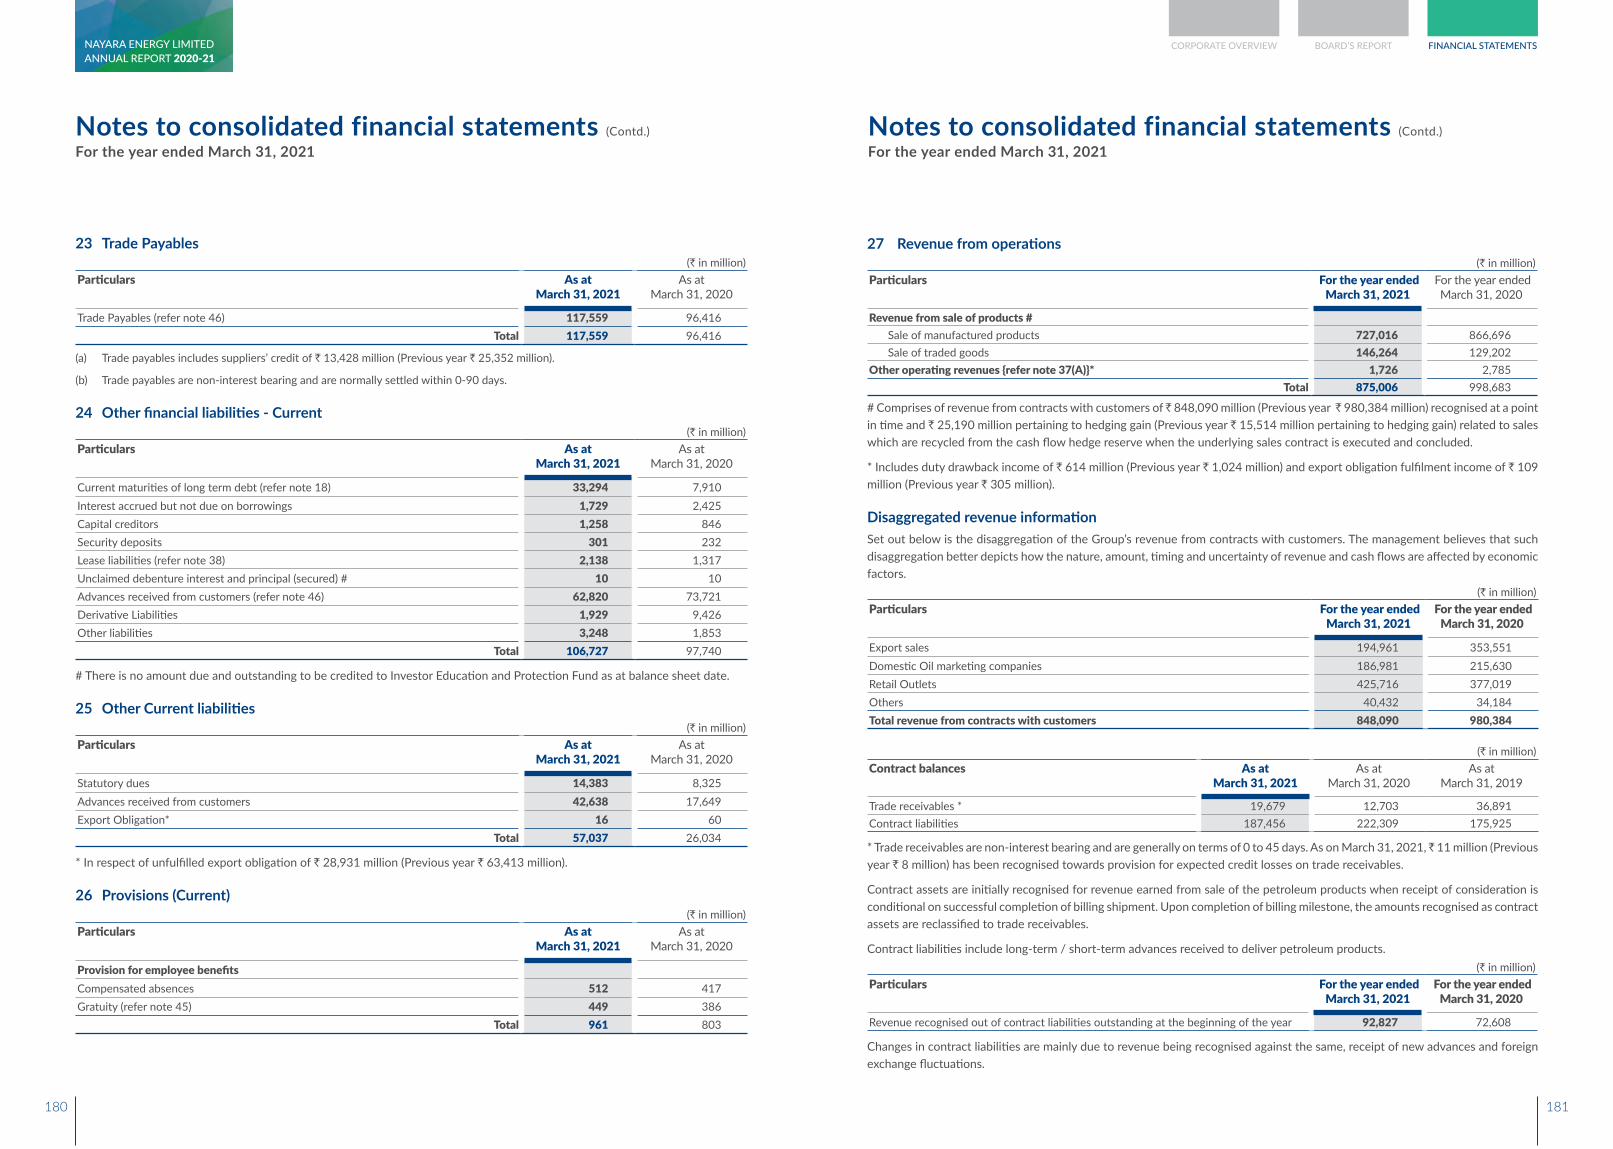
23 Trade Payables (` in million)
Particulars As atMarch 31, 2021
As atMarch 31, 2020
Trade Payables (refer note 46) 117,559 96,416 Total 117,559 96,416
(a) Trade payables includes suppliers’ credit of ` 13,428 million (Previous year ` 25,352 million).
(b) Trade payables are non-interest bearing and are normally settled within 0-90 days.
24 Other financial liabilities - Current(` in million)
Particulars As atMarch 31, 2021
As atMarch 31, 2020
Current maturities of long term debt (refer note 18) 33,294 7,910 Interest accrued but not due on borrowings 1,729 2,425 Capital creditors 1,258 846 Security deposits 301 232 Lease liabilities (refer note 38) 2,138 1,317 Unclaimed debenture interest and principal (secured) # 10 10 Advances received from customers (refer note 46) 62,820 73,721 Derivative Liabilities 1,929 9,426 Other liabilities 3,248 1,853
Total 106,727 97,740
# There is no amount due and outstanding to be credited to Investor Education and Protection Fund as at balance sheet date.
25 Other Current liabilities (` in million)
Particulars As atMarch 31, 2021
As atMarch 31, 2020
Statutory dues 14,383 8,325 Advances received from customers 42,638 17,649 Export Obligation* 16 60
Total 57,037 26,034
* In respect of unfulfilled export obligation of ` 28,931 million (Previous year ` 63,413 million).
26 Provisions (Current) (` in million)
Particulars As atMarch 31, 2021
As atMarch 31, 2020
Provision for employee benefitsCompensated absences 512 417 Gratuity (refer note 45) 449 386
Total 961 803
Notes to consolidated financial statements (Contd.)
For the year ended March 31, 2021
27 Revenue from operations (` in million)
Particulars For the year ended March 31, 2021
For the year ended March 31, 2020
Revenue from sale of products #Sale of manufactured products 727,016 866,696 Sale of traded goods 146,264 129,202
Other operating revenues {refer note 37(A)}* 1,726 2,785 Total 875,006 998,683
# Comprises of revenue from contracts with customers of ̀ 848,090 million (Previous year ̀ 980,384 million) recognised at a point in time and ` 25,190 million pertaining to hedging gain (Previous year ` 15,514 million pertaining to hedging gain) related to sales which are recycled from the cash flow hedge reserve when the underlying sales contract is executed and concluded.
* Includes duty drawback income of ` 614 million (Previous year ` 1,024 million) and export obligation fulfilment income of ` 109 million (Previous year ` 305 million).
Disaggregated revenue information Set out below is the disaggregation of the Group’s revenue from contracts with customers. The management believes that such disaggregation better depicts how the nature, amount, timing and uncertainty of revenue and cash flows are affected by economic factors.
(` in million)Particulars For the year ended
March 31, 2021 For the year ended
March 31, 2020
Export sales 194,961 353,551 Domestic Oil marketing companies 186,981 215,630 Retail Outlets 425,716 377,019 Others 40,432 34,184 Total revenue from contracts with customers 848,090 980,384
(` in million)Contract balances As at
March 31, 2021As at
March 31, 2020As at
March 31, 2019
Trade receivables * 19,679 12,703 36,891 Contract liabilities 187,456 222,309 175,925
* Trade receivables are non-interest bearing and are generally on terms of 0 to 45 days. As on March 31, 2021, ̀ 11 million (Previous year ` 8 million) has been recognised towards provision for expected credit losses on trade receivables.
Contract assets are initially recognised for revenue earned from sale of the petroleum products when receipt of consideration is conditional on successful completion of billing shipment. Upon completion of billing milestone, the amounts recognised as contract assets are reclassified to trade receivables.
Contract liabilities include long-term / short-term advances received to deliver petroleum products.(` in million)
Particulars For the year ended March 31, 2021
For the year ended March 31, 2020
Revenue recognised out of contract liabilities outstanding at the beginning of the year 92,827 72,608
Changes in contract liabilities are mainly due to revenue being recognised against the same, receipt of new advances and foreign exchange fluctuations.
Notes to consolidated financial statements (Contd.)
For the year ended March 31, 2021
180 181
CORPORATE OVERVIEW BOARD’S REPORT FINANCIAL STATEMENTSANNUAL REPORT 2020-21NAYARA ENERGY LIMITED
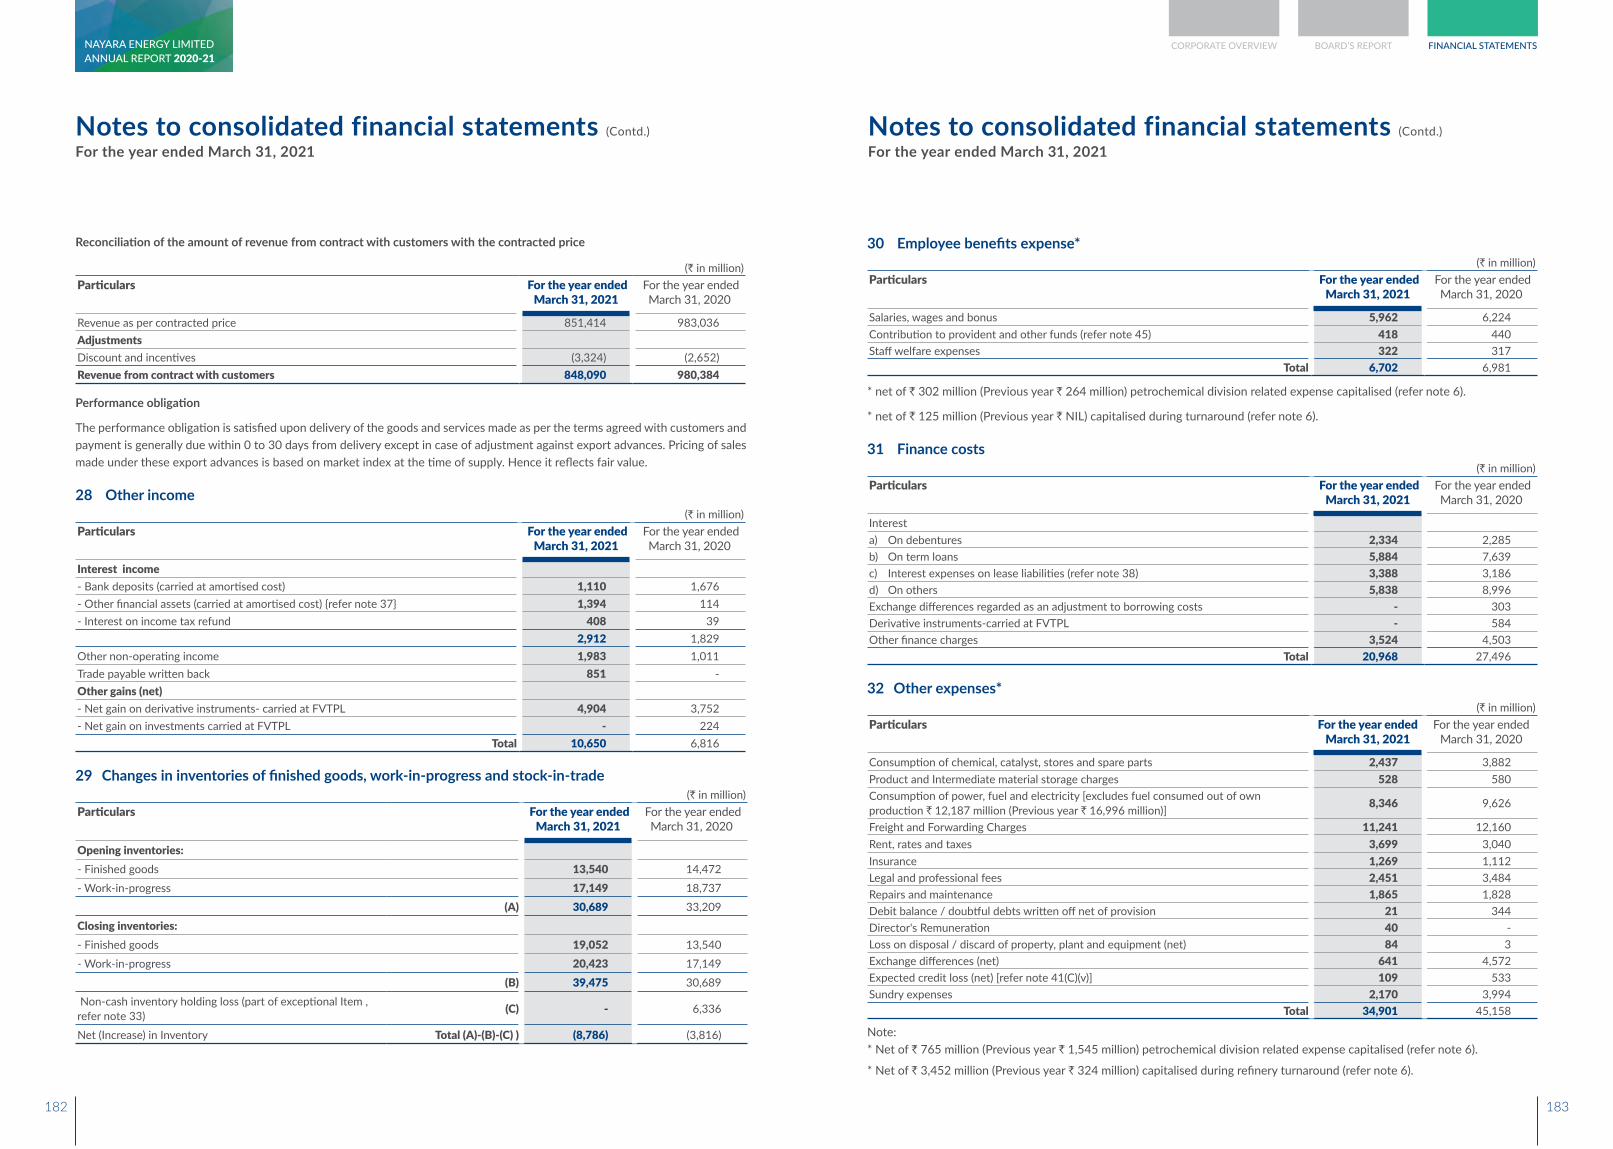
Reconciliation of the amount of revenue from contract with customers with the contracted price
(` in million)Particulars For the year ended
March 31, 2021 For the year ended
March 31, 2020
Revenue as per contracted price 851,414 983,036 AdjustmentsDiscount and incentives (3,324) (2,652)Revenue from contract with customers 848,090 980,384
Performance obligation
The performance obligation is satisfied upon delivery of the goods and services made as per the terms agreed with customers and payment is generally due within 0 to 30 days from delivery except in case of adjustment against export advances. Pricing of sales made under these export advances is based on market index at the time of supply. Hence it reflects fair value.
28 Other income (` in million)
Particulars For the year ended March 31, 2021
For the year ended March 31, 2020
Interest income- Bank deposits (carried at amortised cost) 1,110 1,676 - Other financial assets (carried at amortised cost) {refer note 37} 1,394 114 - Interest on income tax refund 408 39
2,912 1,829 Other non-operating income 1,983 1,011 Trade payable written back 851 - Other gains (net)- Net gain on derivative instruments- carried at FVTPL 4,904 3,752 - Net gain on investments carried at FVTPL - 224
Total 10,650 6,816
29 Changes in inventories of finished goods, work-in-progress and stock-in-trade(` in million)
Particulars For the year ended March 31, 2021
For the year ended March 31, 2020
Opening inventories: - Finished goods 13,540 14,472 - Work-in-progress 17,149 18,737
(A) 30,689 33,209 Closing inventories:- Finished goods 19,052 13,540 - Work-in-progress 20,423 17,149
(B) 39,475 30,689 Non-cash inventory holding loss (part of exceptional Item , refer note 33) (C) - 6,336
Net (Increase) in Inventory Total (A)-(B)-(C) ) (8,786) (3,816)
Notes to consolidated financial statements (Contd.)
For the year ended March 31, 2021
30 Employee benefits expense* (` in million)
Particulars For the year ended March 31, 2021
For the year ended March 31, 2020
Salaries, wages and bonus 5,962 6,224 Contribution to provident and other funds (refer note 45) 418 440 Staff welfare expenses 322 317
Total 6,702 6,981
* net of ` 302 million (Previous year ` 264 million) petrochemical division related expense capitalised (refer note 6).
* net of ` 125 million (Previous year ` NIL) capitalised during turnaround (refer note 6).
31 Finance costs (` in million)
Particulars For the year ended March 31, 2021
For the year ended March 31, 2020
Interesta) On debentures 2,334 2,285 b) On term loans 5,884 7,639 c) Interest expenses on lease liabilities (refer note 38) 3,388 3,186 d) On others 5,838 8,996 Exchange differences regarded as an adjustment to borrowing costs - 303 Derivative instruments-carried at FVTPL - 584 Other finance charges 3,524 4,503
Total 20,968 27,496
32 Other expenses* (` in million)
Particulars For the year ended March 31, 2021
For the year ended March 31, 2020
Consumption of chemical, catalyst, stores and spare parts 2,437 3,882 Product and Intermediate material storage charges 528 580 Consumption of power, fuel and electricity [excludes fuel consumed out of own production ` 12,187 million (Previous year ` 16,996 million)] 8,346 9,626
Freight and Forwarding Charges 11,241 12,160 Rent, rates and taxes 3,699 3,040 Insurance 1,269 1,112 Legal and professional fees 2,451 3,484 Repairs and maintenance 1,865 1,828 Debit balance / doubtful debts written off net of provision 21 344 Director's Remuneration 40 - Loss on disposal / discard of property, plant and equipment (net) 84 3 Exchange differences (net) 641 4,572 Expected credit loss (net) [refer note 41(C)(v)] 109 533 Sundry expenses 2,170 3,994
Total 34,901 45,158
Note:* Net of ` 765 million (Previous year ` 1,545 million) petrochemical division related expense capitalised (refer note 6).
* Net of ` 3,452 million (Previous year ` 324 million) capitalised during refinery turnaround (refer note 6).
Notes to consolidated financial statements (Contd.)
For the year ended March 31, 2021
182 183
CORPORATE OVERVIEW BOARD’S REPORT FINANCIAL STATEMENTSANNUAL REPORT 2020-21NAYARA ENERGY LIMITED
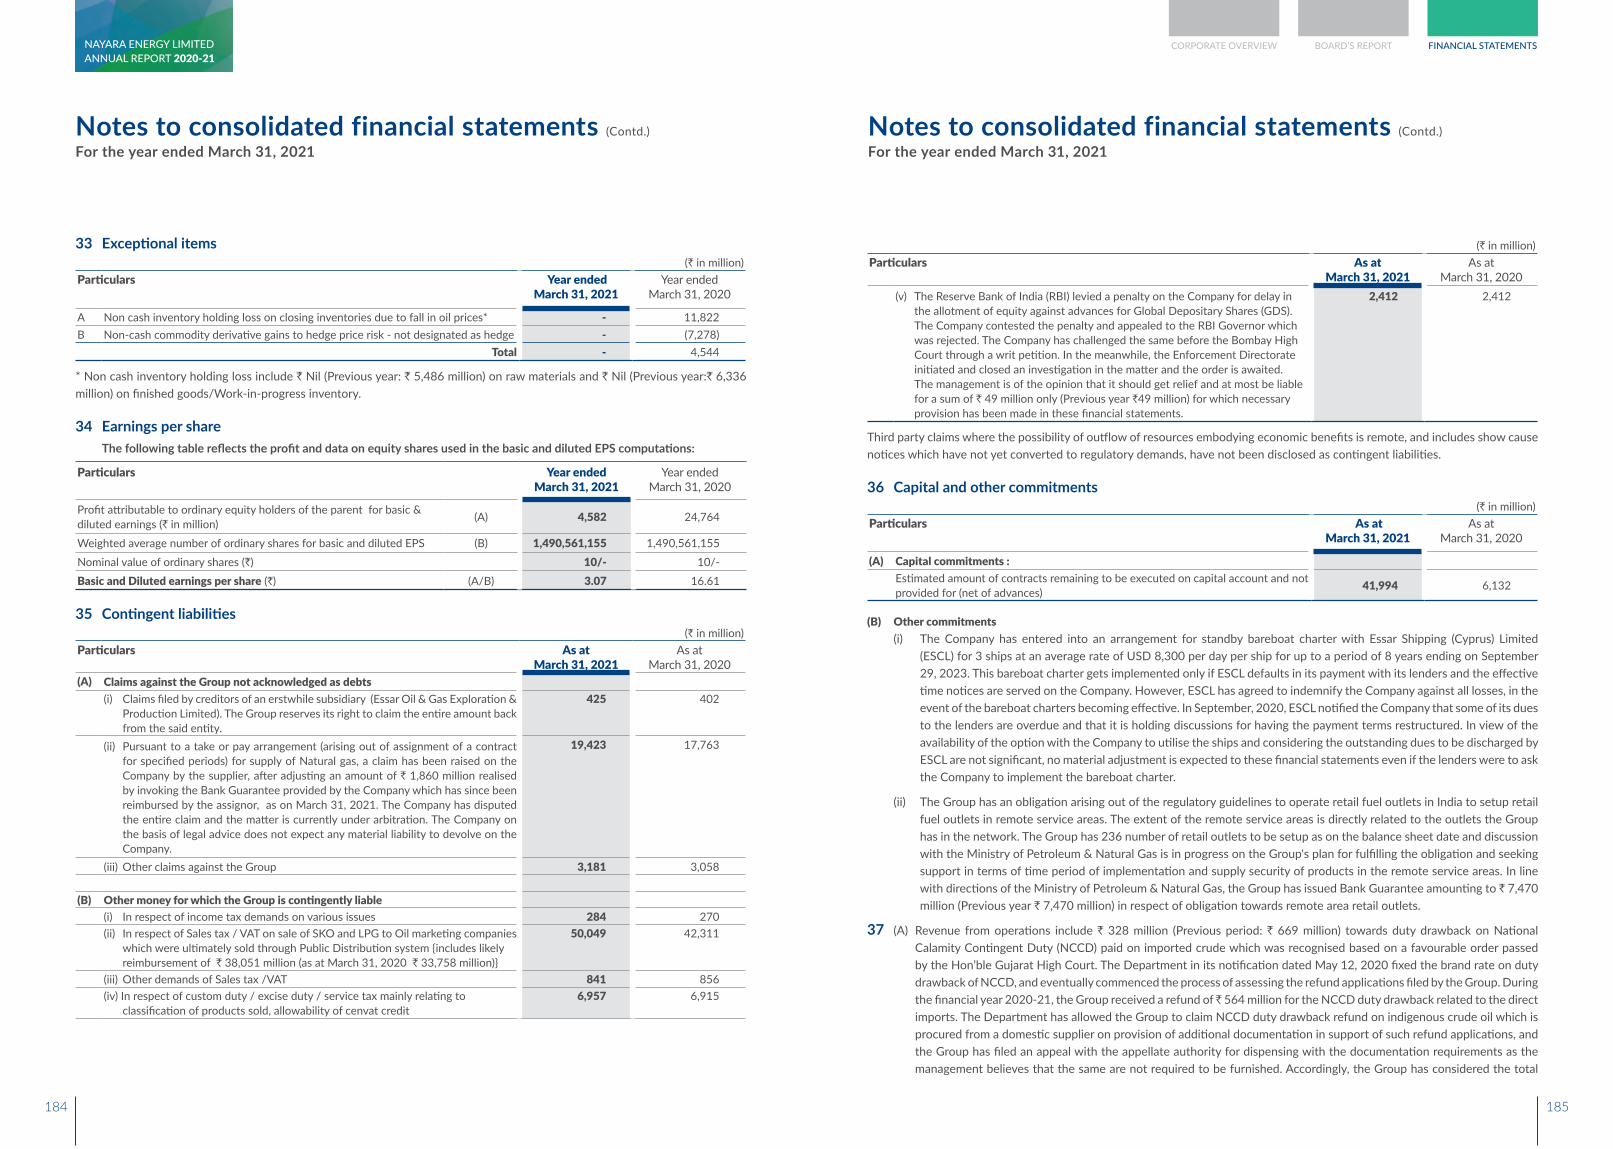
33 Exceptional items(` in million)
Particulars Year ended March 31, 2021
Year ended March 31, 2020
A Non cash inventory holding loss on closing inventories due to fall in oil prices* - 11,822 B Non-cash commodity derivative gains to hedge price risk - not designated as hedge - (7,278)
Total - 4,544
* Non cash inventory holding loss include ` Nil (Previous year: ` 5,486 million) on raw materials and ` Nil (Previous year:` 6,336 million) on finished goods/Work-in-progress inventory.
34 Earnings per share The following table reflects the profit and data on equity shares used in the basic and diluted EPS computations:
Particulars Year ended March 31, 2021
Year ended March 31, 2020
Profit attributable to ordinary equity holders of the parent for basic & diluted earnings (` in million) (A) 4,582 24,764
Weighted average number of ordinary shares for basic and diluted EPS (B) 1,490,561,155 1,490,561,155 Nominal value of ordinary shares (`) 10/- 10/- Basic and Diluted earnings per share (`) (A/B) 3.07 16.61
35 Contingent liabilities(` in million)
Particulars As at March 31, 2021
As at March 31, 2020
(A) Claims against the Group not acknowledged as debts(i) Claims filed by creditors of an erstwhile subsidiary (Essar Oil & Gas Exploration &
Production Limited). The Group reserves its right to claim the entire amount back from the said entity.
425 402
(ii) Pursuant to a take or pay arrangement (arising out of assignment of a contract for specified periods) for supply of Natural gas, a claim has been raised on the Company by the supplier, after adjusting an amount of ` 1,860 million realised by invoking the Bank Guarantee provided by the Company which has since been reimbursed by the assignor, as on March 31, 2021. The Company has disputed the entire claim and the matter is currently under arbitration. The Company on the basis of legal advice does not expect any material liability to devolve on the Company.
19,423 17,763
(iii) Other claims against the Group 3,181 3,058
(B) Other money for which the Group is contingently liable(i) In respect of income tax demands on various issues 284 270 (ii) In respect of Sales tax / VAT on sale of SKO and LPG to Oil marketing companies
which were ultimately sold through Public Distribution system {includes likely reimbursement of ` 38,051 million (as at March 31, 2020 ` 33,758 million)}
50,049 42,311
(iii) Other demands of Sales tax /VAT 841 856 (iv) In respect of custom duty / excise duty / service tax mainly relating to
classification of products sold, allowability of cenvat credit 6,957 6,915
Notes to consolidated financial statements (Contd.)
For the year ended March 31, 2021
(` in million)Particulars As at
March 31, 2021As at
March 31, 2020(v) The Reserve Bank of India (RBI) levied a penalty on the Company for delay in
the allotment of equity against advances for Global Depositary Shares (GDS). The Company contested the penalty and appealed to the RBI Governor which was rejected. The Company has challenged the same before the Bombay High Court through a writ petition. In the meanwhile, the Enforcement Directorate initiated and closed an investigation in the matter and the order is awaited. The management is of the opinion that it should get relief and at most be liable for a sum of ` 49 million only (Previous year `49 million) for which necessary provision has been made in these financial statements.
2,412 2,412
Third party claims where the possibility of outflow of resources embodying economic benefits is remote, and includes show cause notices which have not yet converted to regulatory demands, have not been disclosed as contingent liabilities.
36 Capital and other commitments(` in million)
Particulars As at March 31, 2021
As at March 31, 2020
(A) Capital commitments :Estimated amount of contracts remaining to be executed on capital account and not provided for (net of advances) 41,994 6,132
(B) Other commitments (i) The Company has entered into an arrangement for standby bareboat charter with Essar Shipping (Cyprus) Limited
(ESCL) for 3 ships at an average rate of USD 8,300 per day per ship for up to a period of 8 years ending on September 29, 2023. This bareboat charter gets implemented only if ESCL defaults in its payment with its lenders and the effective time notices are served on the Company. However, ESCL has agreed to indemnify the Company against all losses, in the event of the bareboat charters becoming effective. In September, 2020, ESCL notified the Company that some of its dues to the lenders are overdue and that it is holding discussions for having the payment terms restructured. In view of the availability of the option with the Company to utilise the ships and considering the outstanding dues to be discharged by ESCL are not significant, no material adjustment is expected to these financial statements even if the lenders were to ask the Company to implement the bareboat charter.
(ii) The Group has an obligation arising out of the regulatory guidelines to operate retail fuel outlets in India to setup retail fuel outlets in remote service areas. The extent of the remote service areas is directly related to the outlets the Group has in the network. The Group has 236 number of retail outlets to be setup as on the balance sheet date and discussion with the Ministry of Petroleum & Natural Gas is in progress on the Group's plan for fulfilling the obligation and seeking support in terms of time period of implementation and supply security of products in the remote service areas. In line with directions of the Ministry of Petroleum & Natural Gas, the Group has issued Bank Guarantee amounting to ` 7,470 million (Previous year ` 7,470 million) in respect of obligation towards remote area retail outlets.
37 (A) Revenue from operations include ` 328 million (Previous period: ` 669 million) towards duty drawback on National Calamity Contingent Duty (NCCD) paid on imported crude which was recognised based on a favourable order passed by the Hon’ble Gujarat High Court. The Department in its notification dated May 12, 2020 fixed the brand rate on duty drawback of NCCD, and eventually commenced the process of assessing the refund applications filed by the Group. During the financial year 2020-21, the Group received a refund of ̀ 564 million for the NCCD duty drawback related to the direct imports. The Department has allowed the Group to claim NCCD duty drawback refund on indigenous crude oil which is procured from a domestic supplier on provision of additional documentation in support of such refund applications, and the Group has filed an appeal with the appellate authority for dispensing with the documentation requirements as the management believes that the same are not required to be furnished. Accordingly, the Group has considered the total
Notes to consolidated financial statements (Contd.)
For the year ended March 31, 2021
184 185
CORPORATE OVERVIEW BOARD’S REPORT FINANCIAL STATEMENTSANNUAL REPORT 2020-21NAYARA ENERGY LIMITED
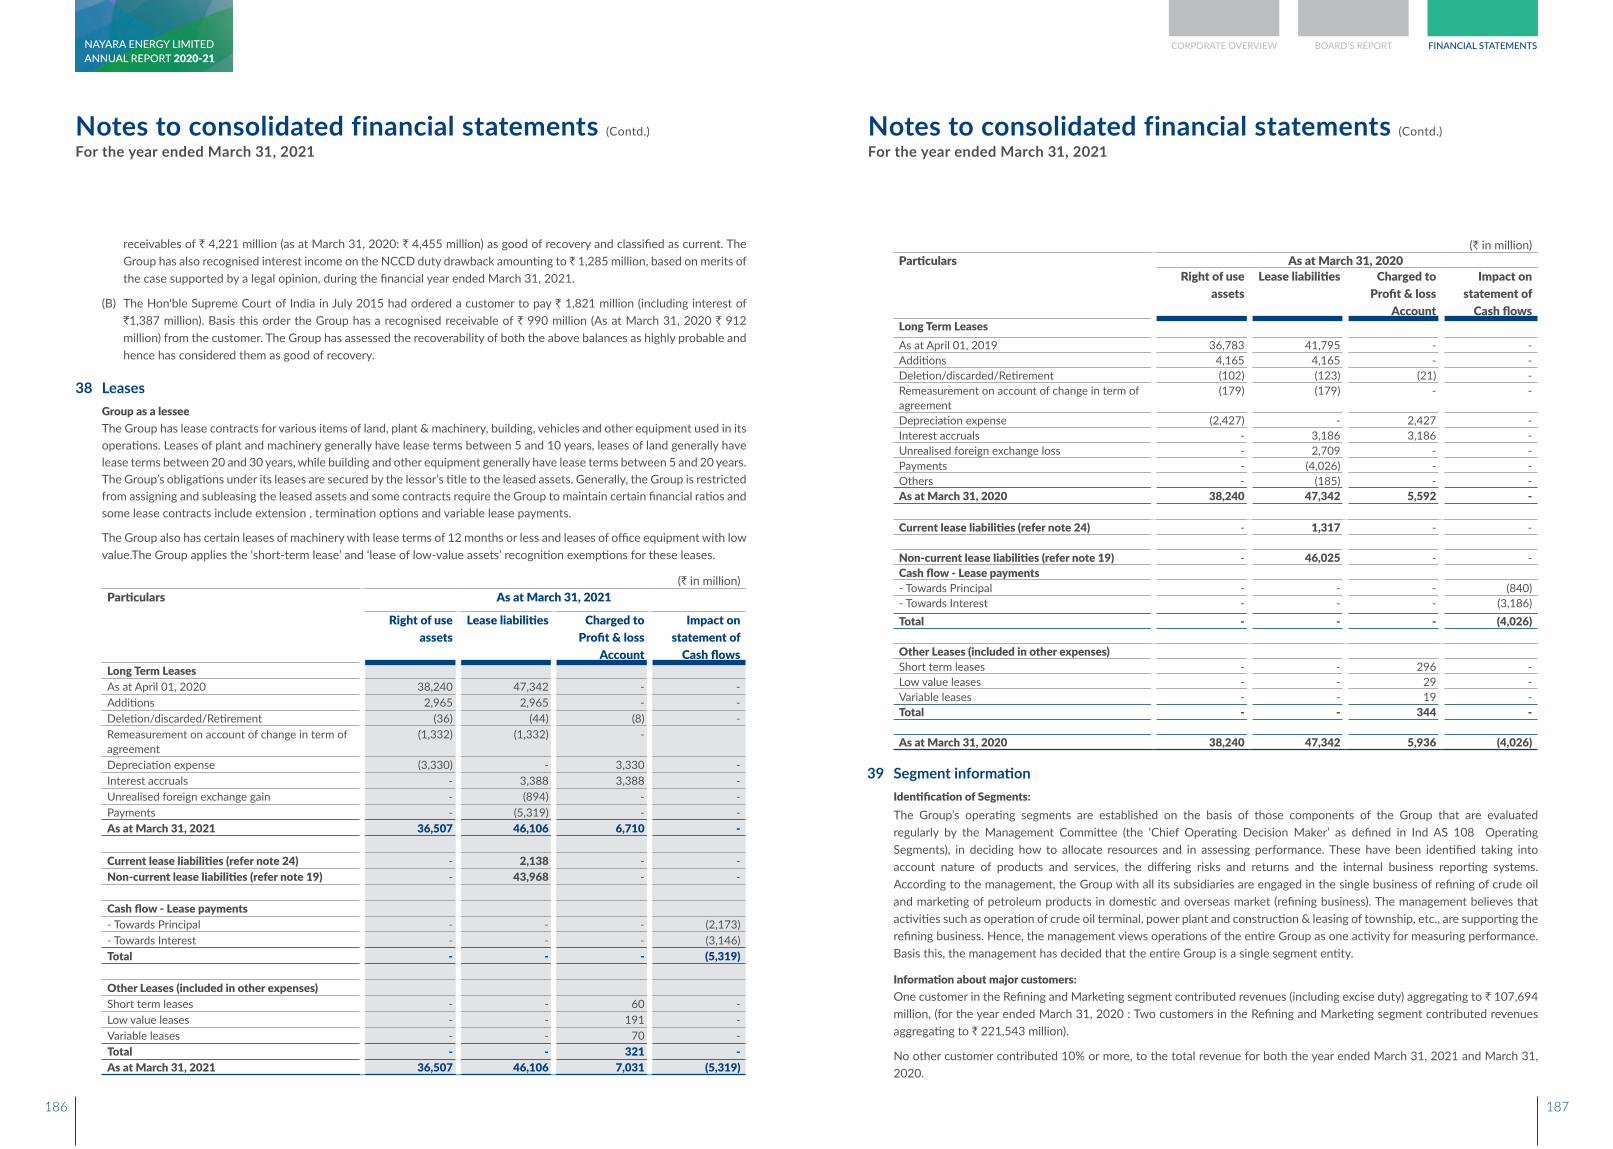
receivables of ` 4,221 million (as at March 31, 2020: ` 4,455 million) as good of recovery and classified as current. The Group has also recognised interest income on the NCCD duty drawback amounting to ̀ 1,285 million, based on merits of the case supported by a legal opinion, during the financial year ended March 31, 2021.
(B) The Hon'ble Supreme Court of India in July 2015 had ordered a customer to pay ` 1,821 million (including interest of `1,387 million). Basis this order the Group has a recognised receivable of ` 990 million (As at March 31, 2020 ` 912 million) from the customer. The Group has assessed the recoverability of both the above balances as highly probable and hence has considered them as good of recovery.
38 Leases Group as a lessee The Group has lease contracts for various items of land, plant & machinery, building, vehicles and other equipment used in its
operations. Leases of plant and machinery generally have lease terms between 5 and 10 years, leases of land generally have lease terms between 20 and 30 years, while building and other equipment generally have lease terms between 5 and 20 years. The Group’s obligations under its leases are secured by the lessor’s title to the leased assets. Generally, the Group is restricted from assigning and subleasing the leased assets and some contracts require the Group to maintain certain financial ratios and some lease contracts include extension , termination options and variable lease payments.
The Group also has certain leases of machinery with lease terms of 12 months or less and leases of office equipment with low value.The Group applies the ‘short-term lease’ and ‘lease of low-value assets’ recognition exemptions for these leases.
(` in million)Particulars As at March 31, 2021
Right of use assets
Lease liabilities Charged to Profit & loss
Account
Impact on statement of
Cash flowsLong Term LeasesAs at April 01, 2020 38,240 47,342 - -Additions 2,965 2,965 - -Deletion/discarded/Retirement (36) (44) (8) -Remeasurement on account of change in term of agreement
(1,332) (1,332) -
Depreciation expense (3,330) - 3,330 -Interest accruals - 3,388 3,388 -Unrealised foreign exchange gain - (894) - -Payments - (5,319) - -As at March 31, 2021 36,507 46,106 6,710 -
Current lease liabilities (refer note 24) - 2,138 - -Non-current lease liabilities (refer note 19) - 43,968 - -
Cash flow - Lease payments- Towards Principal - - - (2,173)- Towards Interest - - - (3,146)Total - - - (5,319)
Other Leases (included in other expenses)Short term leases - - 60 -Low value leases - - 191 -Variable leases - - 70 -Total - - 321 -As at March 31, 2021 36,507 46,106 7,031 (5,319)
Notes to consolidated financial statements (Contd.)
For the year ended March 31, 2021
(` in million)Particulars As at March 31, 2020
Right of use assets
Lease liabilities Charged to Profit & loss
Account
Impact on statement of
Cash flows Long Term LeasesAs at April 01, 2019 36,783 41,795 - - Additions 4,165 4,165 - - Deletion/discarded/Retirement (102) (123) (21) - Remeasurement on account of change in term of agreement
(179) (179) - -
Depreciation expense (2,427) - 2,427 - Interest accruals - 3,186 3,186 - Unrealised foreign exchange loss - 2,709 - - Payments - (4,026) - - Others - (185) - - As at March 31, 2020 38,240 47,342 5,592 -
Current lease liabilities (refer note 24) - 1,317 - -
Non-current lease liabilities (refer note 19) - 46,025 - - Cash flow - Lease payments- Towards Principal - - - (840)- Towards Interest - - - (3,186)Total - - - (4,026)
Other Leases (included in other expenses)Short term leases - - 296 - Low value leases - - 29 - Variable leases - - 19 - Total - - 344 -
As at March 31, 2020 38,240 47,342 5,936 (4,026)
39 Segment information Identification of Segments: The Group’s operating segments are established on the basis of those components of the Group that are evaluated
regularly by the Management Committee (the ‘Chief Operating Decision Maker’ as defined in Ind AS 108 Operating Segments), in deciding how to allocate resources and in assessing performance. These have been identified taking into account nature of products and services, the differing risks and returns and the internal business reporting systems. According to the management, the Group with all its subsidiaries are engaged in the single business of refining of crude oil and marketing of petroleum products in domestic and overseas market (refining business). The management believes that activities such as operation of crude oil terminal, power plant and construction & leasing of township, etc., are supporting the refining business. Hence, the management views operations of the entire Group as one activity for measuring performance. Basis this, the management has decided that the entire Group is a single segment entity.
Information about major customers: One customer in the Refining and Marketing segment contributed revenues (including excise duty) aggregating to ` 107,694
million, (for the year ended March 31, 2020 : Two customers in the Refining and Marketing segment contributed revenues aggregating to ` 221,543 million).
No other customer contributed 10% or more, to the total revenue for both the year ended March 31, 2021 and March 31, 2020.
Notes to consolidated financial statements (Contd.)
For the year ended March 31, 2021
186 187
CORPORATE OVERVIEW BOARD’S REPORT FINANCIAL STATEMENTSANNUAL REPORT 2020-21NAYARA ENERGY LIMITED
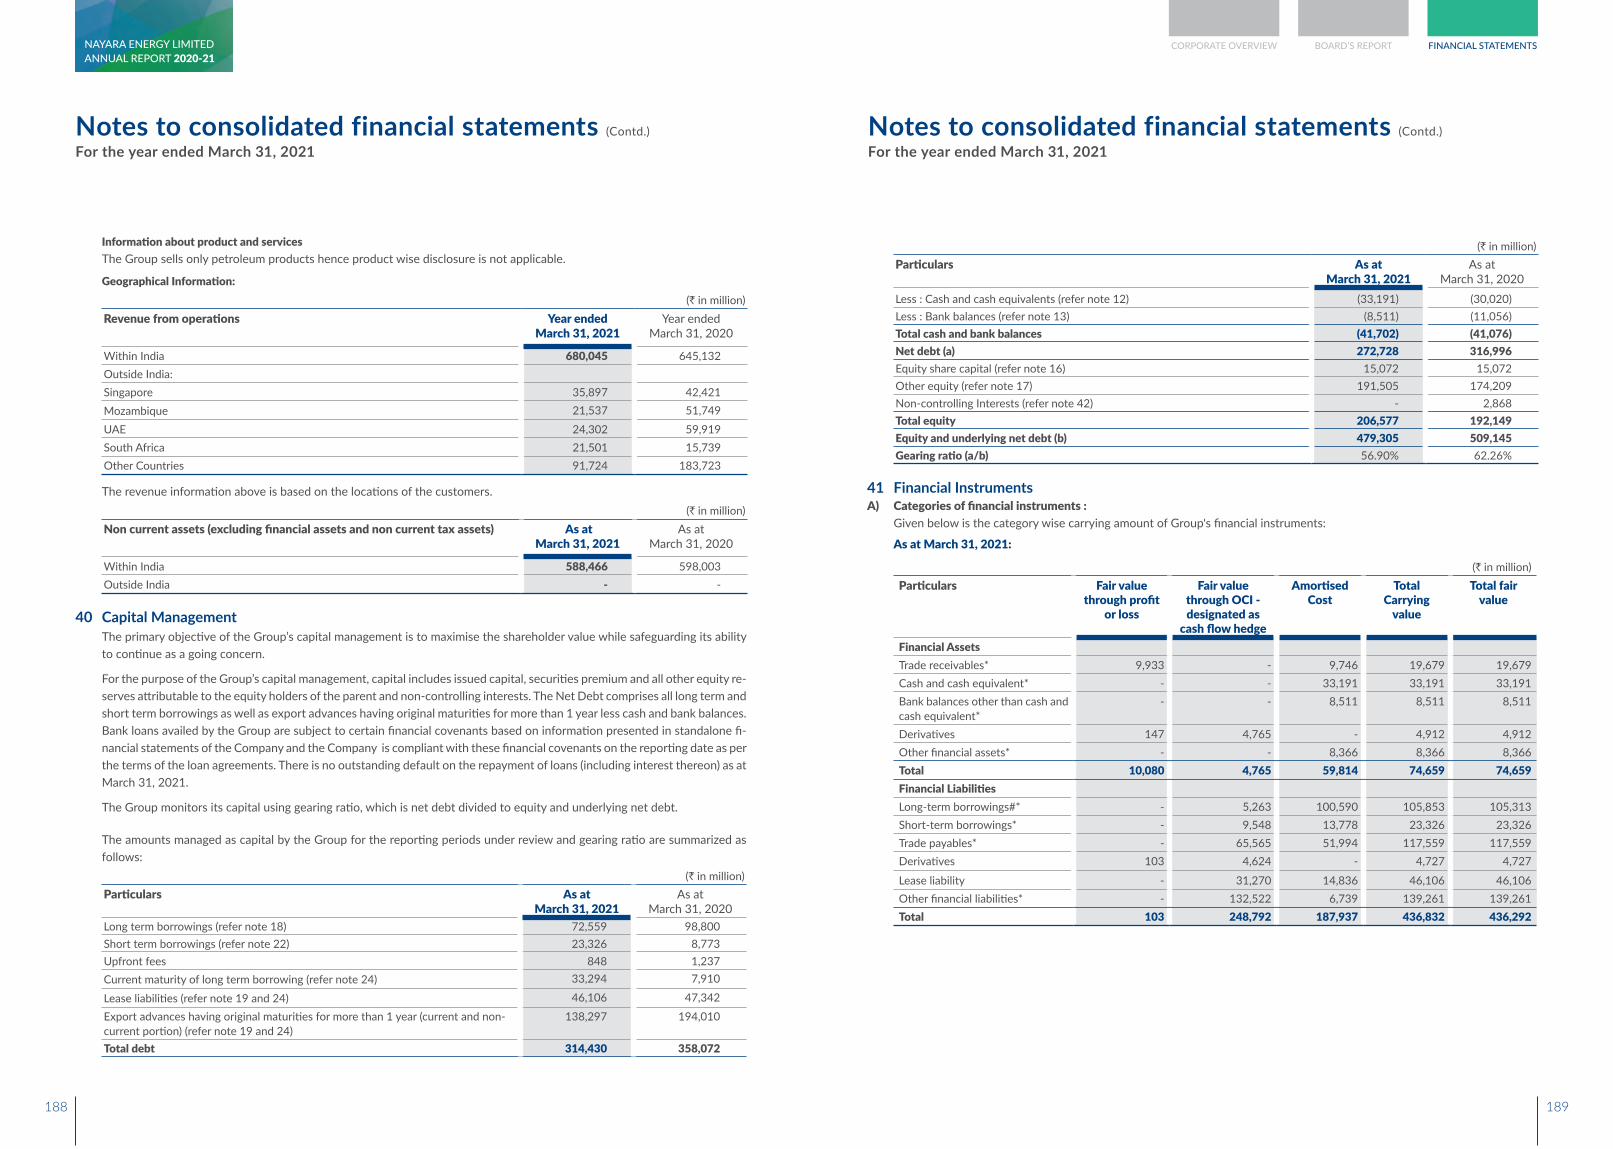
Information about product and services The Group sells only petroleum products hence product wise disclosure is not applicable.
Geographical Information:(` in million)
Revenue from operations Year ended March 31, 2021
Year ended March 31, 2020
Within India 680,045 645,132 Outside India:Singapore 35,897 42,421 Mozambique 21,537 51,749 UAE 24,302 59,919 South Africa 21,501 15,739 Other Countries 91,724 183,723
The revenue information above is based on the locations of the customers. (` in million)
Non current assets (excluding financial assets and non current tax assets) As at March 31, 2021
As at March 31, 2020
Within India 588,466 598,003 Outside India - -
40 Capital Management The primary objective of the Group’s capital management is to maximise the shareholder value while safeguarding its ability
to continue as a going concern.
For the purpose of the Group’s capital management, capital includes issued capital, securities premium and all other equity re-serves attributable to the equity holders of the parent and non-controlling interests. The Net Debt comprises all long term and short term borrowings as well as export advances having original maturities for more than 1 year less cash and bank balances. Bank loans availed by the Group are subject to certain financial covenants based on information presented in standalone fi-nancial statements of the Company and the Company is compliant with these financial covenants on the reporting date as per the terms of the loan agreements. There is no outstanding default on the repayment of loans (including interest thereon) as at March 31, 2021.
The Group monitors its capital using gearing ratio, which is net debt divided to equity and underlying net debt.
The amounts managed as capital by the Group for the reporting periods under review and gearing ratio are summarized as follows:
(` in million)Particulars As at
March 31, 2021As at
March 31, 2020Long term borrowings (refer note 18) 72,559 98,800 Short term borrowings (refer note 22) 23,326 8,773 Upfront fees 848 1,237 Current maturity of long term borrowing (refer note 24) 33,294 7,910
Lease liabilities (refer note 19 and 24) 46,106 47,342 Export advances having original maturities for more than 1 year (current and non-current portion) (refer note 19 and 24)
138,297 194,010
Total debt 314,430 358,072
Notes to consolidated financial statements (Contd.)
For the year ended March 31, 2021
(` in million)Particulars As at
March 31, 2021As at
March 31, 2020Less : Cash and cash equivalents (refer note 12) (33,191) (30,020)Less : Bank balances (refer note 13) (8,511) (11,056)Total cash and bank balances (41,702) (41,076)Net debt (a) 272,728 316,996 Equity share capital (refer note 16) 15,072 15,072 Other equity (refer note 17) 191,505 174,209 Non-controlling Interests (refer note 42) - 2,868 Total equity 206,577 192,149 Equity and underlying net debt (b) 479,305 509,145 Gearing ratio (a/b) 56.90% 62.26%
41 Financial InstrumentsA) Categories of financial instruments : Given below is the category wise carrying amount of Group's financial instruments:
As at March 31, 2021:
(` in million)Particulars Fair value
through profit or loss
Fair value through OCI - designated as
cash flow hedge
Amortised Cost
Total Carrying
value
Total fair value
Financial AssetsTrade receivables* 9,933 - 9,746 19,679 19,679 Cash and cash equivalent* - - 33,191 33,191 33,191 Bank balances other than cash and cash equivalent*
- - 8,511 8,511 8,511
Derivatives 147 4,765 - 4,912 4,912 Other financial assets* - - 8,366 8,366 8,366 Total 10,080 4,765 59,814 74,659 74,659 Financial LiabilitiesLong-term borrowings#* - 5,263 100,590 105,853 105,313 Short-term borrowings* - 9,548 13,778 23,326 23,326 Trade payables* - 65,565 51,994 117,559 117,559 Derivatives 103 4,624 - 4,727 4,727
Lease liability - 31,270 14,836 46,106 46,106 Other financial liabilities* - 132,522 6,739 139,261 139,261 Total 103 248,792 187,937 436,832 436,292
Notes to consolidated financial statements (Contd.)
For the year ended March 31, 2021
188 189
CORPORATE OVERVIEW BOARD’S REPORT FINANCIAL STATEMENTSANNUAL REPORT 2020-21NAYARA ENERGY LIMITED
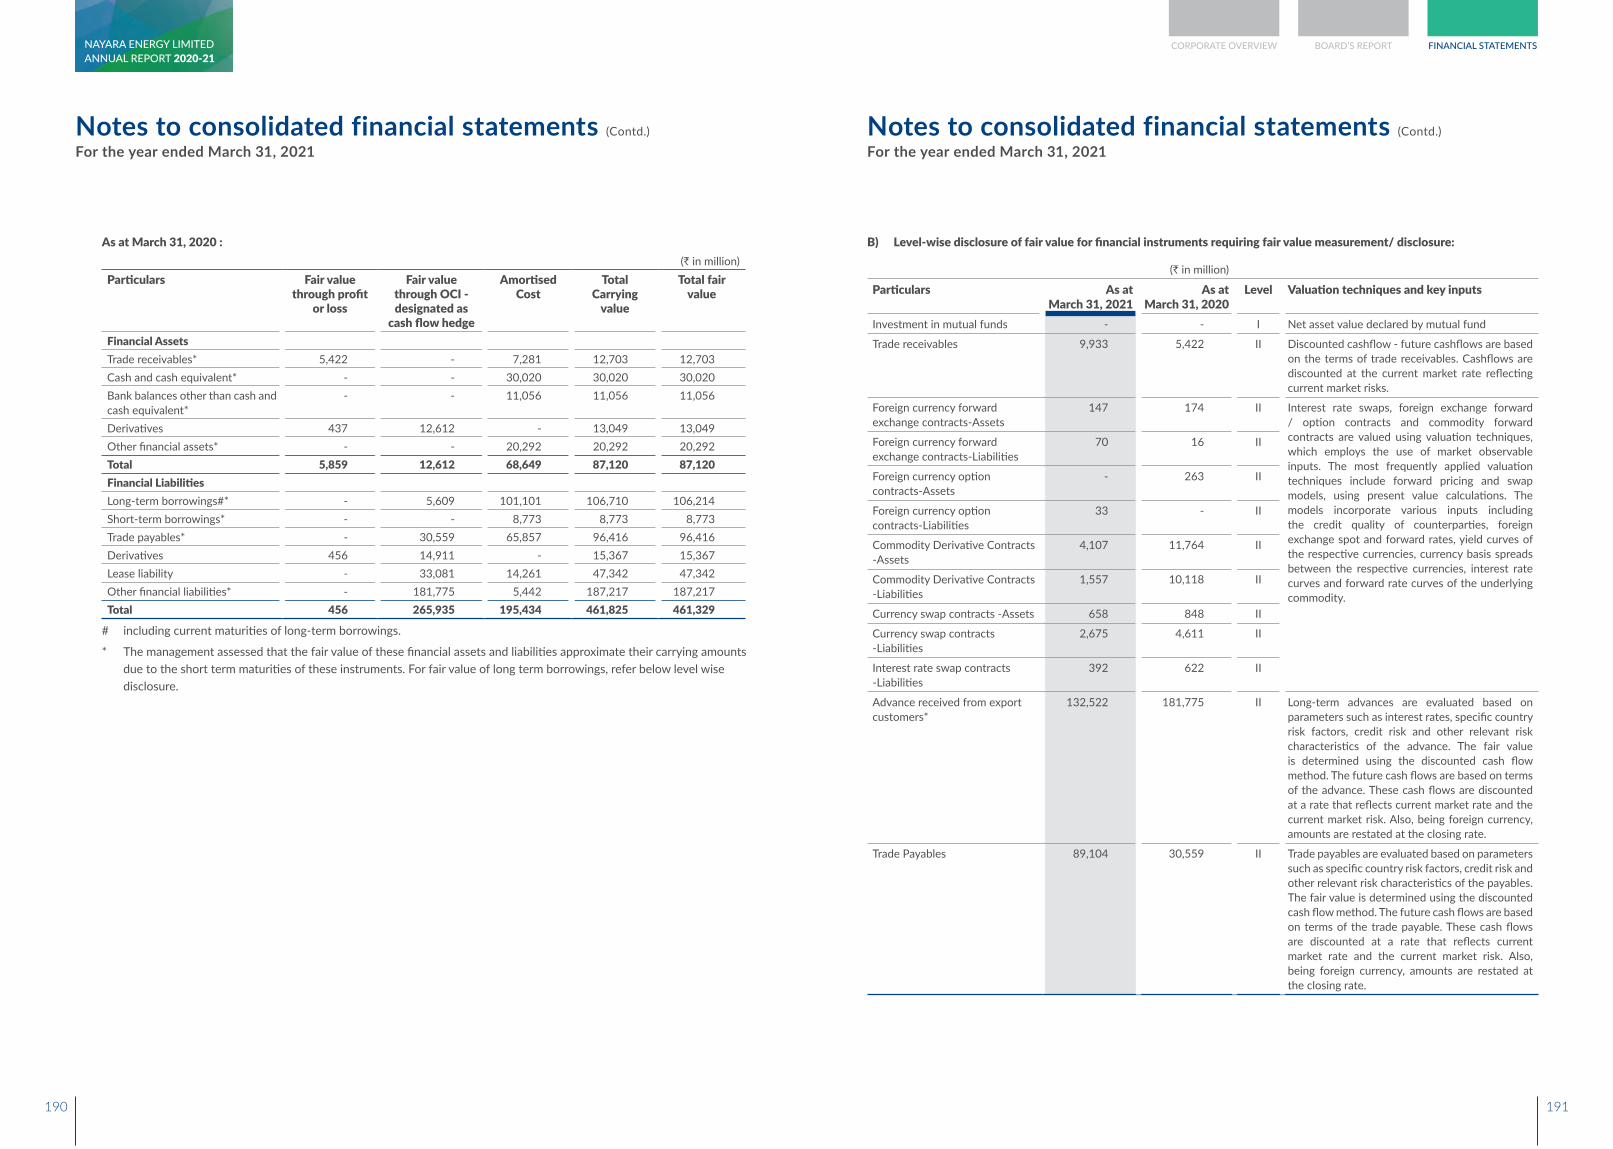
As at March 31, 2020 :(` in million)
Particulars Fair value through profit
or loss
Fair value through OCI - designated as
cash flow hedge
Amortised Cost
Total Carrying
value
Total fair value
Financial AssetsTrade receivables* 5,422 - 7,281 12,703 12,703 Cash and cash equivalent* - - 30,020 30,020 30,020 Bank balances other than cash and cash equivalent*
- - 11,056 11,056 11,056
Derivatives 437 12,612 - 13,049 13,049 Other financial assets* - - 20,292 20,292 20,292 Total 5,859 12,612 68,649 87,120 87,120 Financial LiabilitiesLong-term borrowings#* - 5,609 101,101 106,710 106,214 Short-term borrowings* - - 8,773 8,773 8,773 Trade payables* - 30,559 65,857 96,416 96,416 Derivatives 456 14,911 - 15,367 15,367 Lease liability - 33,081 14,261 47,342 47,342 Other financial liabilities* - 181,775 5,442 187,217 187,217 Total 456 265,935 195,434 461,825 461,329
# including current maturities of long-term borrowings.
* The management assessed that the fair value of these financial assets and liabilities approximate their carrying amounts due to the short term maturities of these instruments. For fair value of long term borrowings, refer below level wise disclosure.
Notes to consolidated financial statements (Contd.)
For the year ended March 31, 2021Notes to consolidated financial statements (Contd.)
For the year ended March 31, 2021
B) Level-wise disclosure of fair value for financial instruments requiring fair value measurement/ disclosure:
(` in million)
Particulars As at March 31, 2021
As at March 31, 2020
Level Valuation techniques and key inputs
Investment in mutual funds - - I Net asset value declared by mutual fund
Trade receivables 9,933 5,422 II Discounted cashflow - future cashflows are based on the terms of trade receivables. Cashflows are discounted at the current market rate reflecting current market risks.
Foreign currency forward exchange contracts-Assets
147 174 II Interest rate swaps, foreign exchange forward / option contracts and commodity forward contracts are valued using valuation techniques, which employs the use of market observable inputs. The most frequently applied valuation techniques include forward pricing and swap models, using present value calculations. The models incorporate various inputs including the credit quality of counterparties, foreign exchange spot and forward rates, yield curves of the respective currencies, currency basis spreads between the respective currencies, interest rate curves and forward rate curves of the underlying commodity.
Foreign currency forward exchange contracts-Liabilities
70 16 II
Foreign currency option contracts-Assets
- 263 II
Foreign currency option contracts-Liabilities
33 - II
Commodity Derivative Contracts -Assets
4,107 11,764 II
Commodity Derivative Contracts -Liabilities
1,557 10,118 II
Currency swap contracts -Assets 658 848 II
Currency swap contracts -Liabilities
2,675 4,611 II
Interest rate swap contracts -Liabilities
392 622 II
Advance received from export customers*
132,522 181,775 II Long-term advances are evaluated based on parameters such as interest rates, specific country risk factors, credit risk and other relevant risk characteristics of the advance. The fair value is determined using the discounted cash flow method. The future cash flows are based on terms of the advance. These cash flows are discounted at a rate that reflects current market rate and the current market risk. Also, being foreign currency, amounts are restated at the closing rate.
Trade Payables 89,104 30,559 II Trade payables are evaluated based on parameters such as specific country risk factors, credit risk and other relevant risk characteristics of the payables. The fair value is determined using the discounted cash flow method. The future cash flows are based on terms of the trade payable. These cash flows are discounted at a rate that reflects current market rate and the current market risk. Also, being foreign currency, amounts are restated at the closing rate.
190 191
CORPORATE OVERVIEW BOARD’S REPORT FINANCIAL STATEMENTSANNUAL REPORT 2020-21NAYARA ENERGY LIMITED
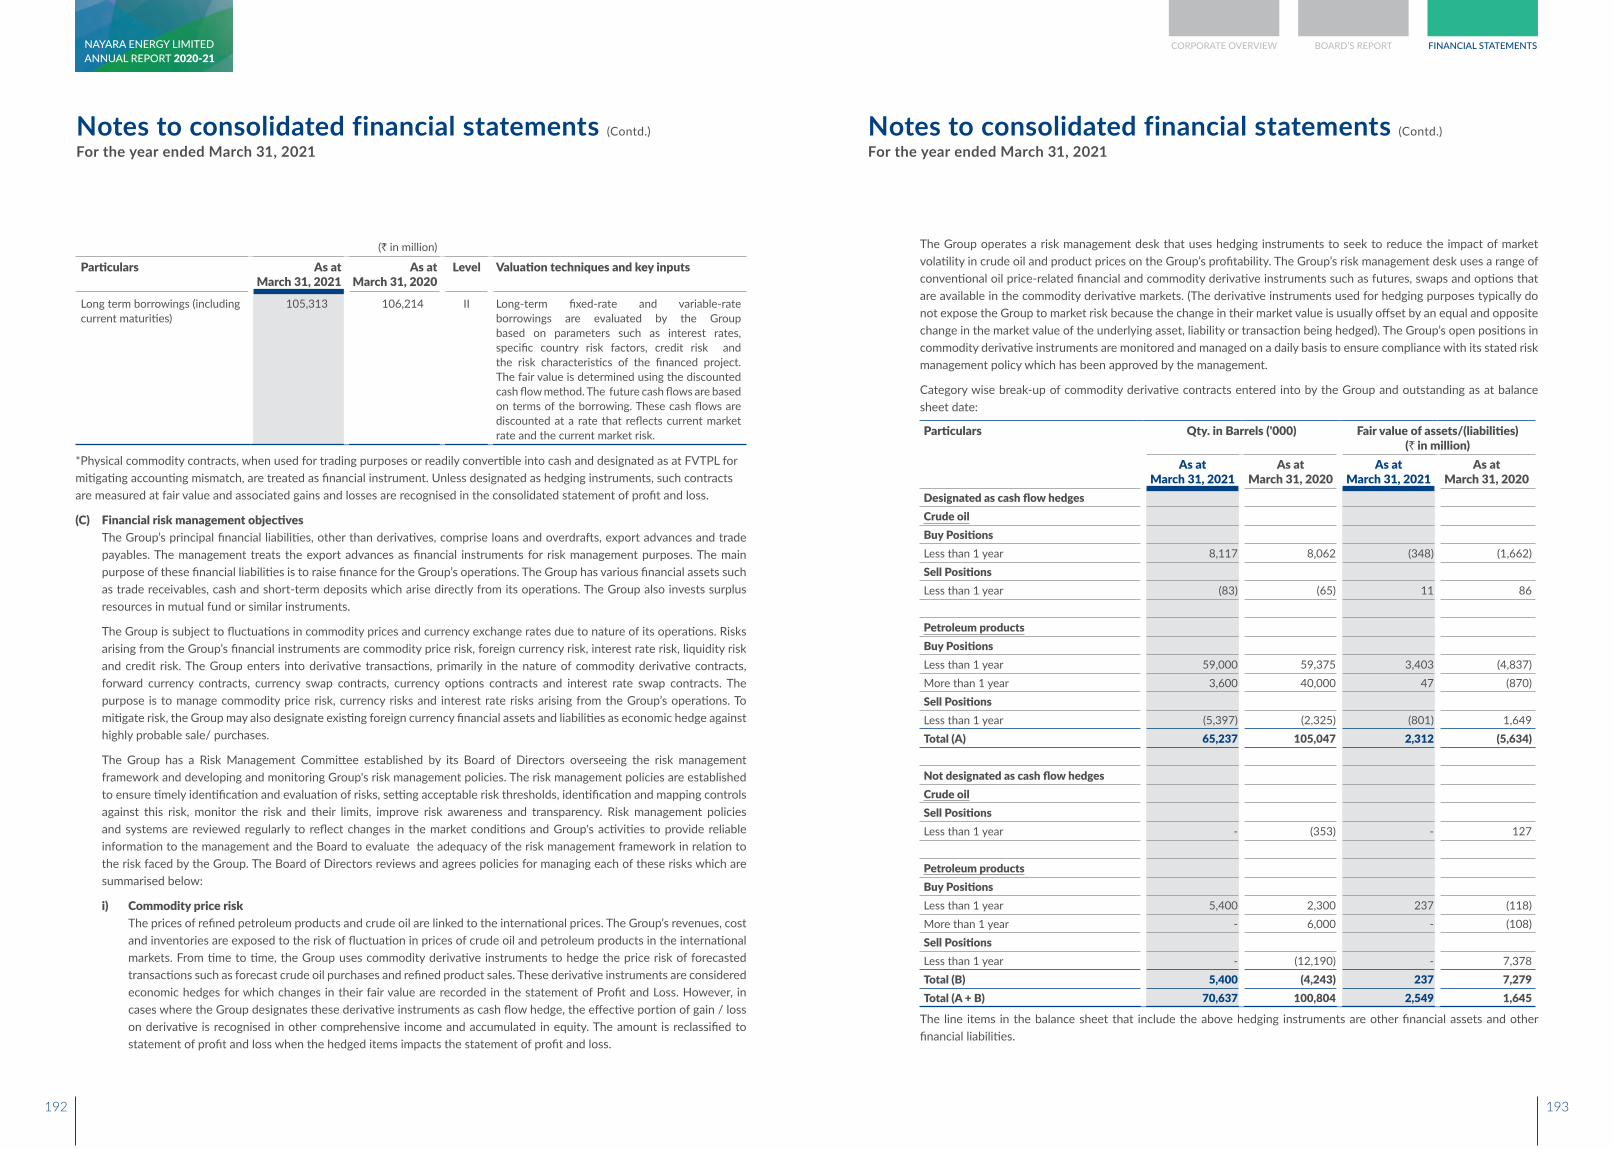
(` in million)
Particulars As at March 31, 2021
As at March 31, 2020
Level Valuation techniques and key inputs
Long term borrowings (including current maturities)
105,313 106,214 II Long-term fixed-rate and variable-rate borrowings are evaluated by the Group based on parameters such as interest rates, specific country risk factors, credit risk and the risk characteristics of the financed project. The fair value is determined using the discounted cash flow method. The future cash flows are based on terms of the borrowing. These cash flows are discounted at a rate that reflects current market rate and the current market risk.
*Physical commodity contracts, when used for trading purposes or readily convertible into cash and designated as at FVTPL for mitigating accounting mismatch, are treated as financial instrument. Unless designated as hedging instruments, such contracts are measured at fair value and associated gains and losses are recognised in the consolidated statement of profit and loss.
(C) Financial risk management objectives The Group’s principal financial liabilities, other than derivatives, comprise loans and overdrafts, export advances and trade
payables. The management treats the export advances as financial instruments for risk management purposes. The main purpose of these financial liabilities is to raise finance for the Group’s operations. The Group has various financial assets such as trade receivables, cash and short-term deposits which arise directly from its operations. The Group also invests surplus resources in mutual fund or similar instruments.
The Group is subject to fluctuations in commodity prices and currency exchange rates due to nature of its operations. Risks arising from the Group’s financial instruments are commodity price risk, foreign currency risk, interest rate risk, liquidity risk and credit risk. The Group enters into derivative transactions, primarily in the nature of commodity derivative contracts, forward currency contracts, currency swap contracts, currency options contracts and interest rate swap contracts. The purpose is to manage commodity price risk, currency risks and interest rate risks arising from the Group’s operations. To mitigate risk, the Group may also designate existing foreign currency financial assets and liabilities as economic hedge against highly probable sale/ purchases.
The Group has a Risk Management Committee established by its Board of Directors overseeing the risk management framework and developing and monitoring Group's risk management policies. The risk management policies are established to ensure timely identification and evaluation of risks, setting acceptable risk thresholds, identification and mapping controls against this risk, monitor the risk and their limits, improve risk awareness and transparency. Risk management policies and systems are reviewed regularly to reflect changes in the market conditions and Group's activities to provide reliable information to the management and the Board to evaluate the adequacy of the risk management framework in relation to the risk faced by the Group. The Board of Directors reviews and agrees policies for managing each of these risks which are summarised below:
i) Commodity price risk The prices of refined petroleum products and crude oil are linked to the international prices. The Group’s revenues, cost
and inventories are exposed to the risk of fluctuation in prices of crude oil and petroleum products in the international markets. From time to time, the Group uses commodity derivative instruments to hedge the price risk of forecasted transactions such as forecast crude oil purchases and refined product sales. These derivative instruments are considered economic hedges for which changes in their fair value are recorded in the statement of Profit and Loss. However, in cases where the Group designates these derivative instruments as cash flow hedge, the effective portion of gain / loss on derivative is recognised in other comprehensive income and accumulated in equity. The amount is reclassified to statement of profit and loss when the hedged items impacts the statement of profit and loss.
The Group operates a risk management desk that uses hedging instruments to seek to reduce the impact of market volatility in crude oil and product prices on the Group’s profitability. The Group’s risk management desk uses a range of conventional oil price-related financial and commodity derivative instruments such as futures, swaps and options that are available in the commodity derivative markets. (The derivative instruments used for hedging purposes typically do not expose the Group to market risk because the change in their market value is usually offset by an equal and opposite change in the market value of the underlying asset, liability or transaction being hedged). The Group’s open positions in commodity derivative instruments are monitored and managed on a daily basis to ensure compliance with its stated risk management policy which has been approved by the management.
Category wise break-up of commodity derivative contracts entered into by the Group and outstanding as at balance sheet date:
Particulars Qty. in Barrels ('000) Fair value of assets/(liabilities) (` in million)
As at March 31, 2021
As at March 31, 2020
As at March 31, 2021
As at March 31, 2020
Designated as cash flow hedgesCrude oilBuy PositionsLess than 1 year 8,117 8,062 (348) (1,662)Sell PositionsLess than 1 year (83) (65) 11 86
Petroleum productsBuy PositionsLess than 1 year 59,000 59,375 3,403 (4,837)More than 1 year 3,600 40,000 47 (870)Sell PositionsLess than 1 year (5,397) (2,325) (801) 1,649 Total (A) 65,237 105,047 2,312 (5,634)
Not designated as cash flow hedgesCrude oilSell PositionsLess than 1 year - (353) - 127
Petroleum productsBuy PositionsLess than 1 year 5,400 2,300 237 (118)More than 1 year - 6,000 - (108)Sell PositionsLess than 1 year - (12,190) - 7,378 Total (B) 5,400 (4,243) 237 7,279 Total (A + B) 70,637 100,804 2,549 1,645
The line items in the balance sheet that include the above hedging instruments are other financial assets and other financial liabilities.
Notes to consolidated financial statements (Contd.)
For the year ended March 31, 2021Notes to consolidated financial statements (Contd.)
For the year ended March 31, 2021
192 193
CORPORATE OVERVIEW BOARD’S REPORT FINANCIAL STATEMENTSANNUAL REPORT 2020-21NAYARA ENERGY LIMITED
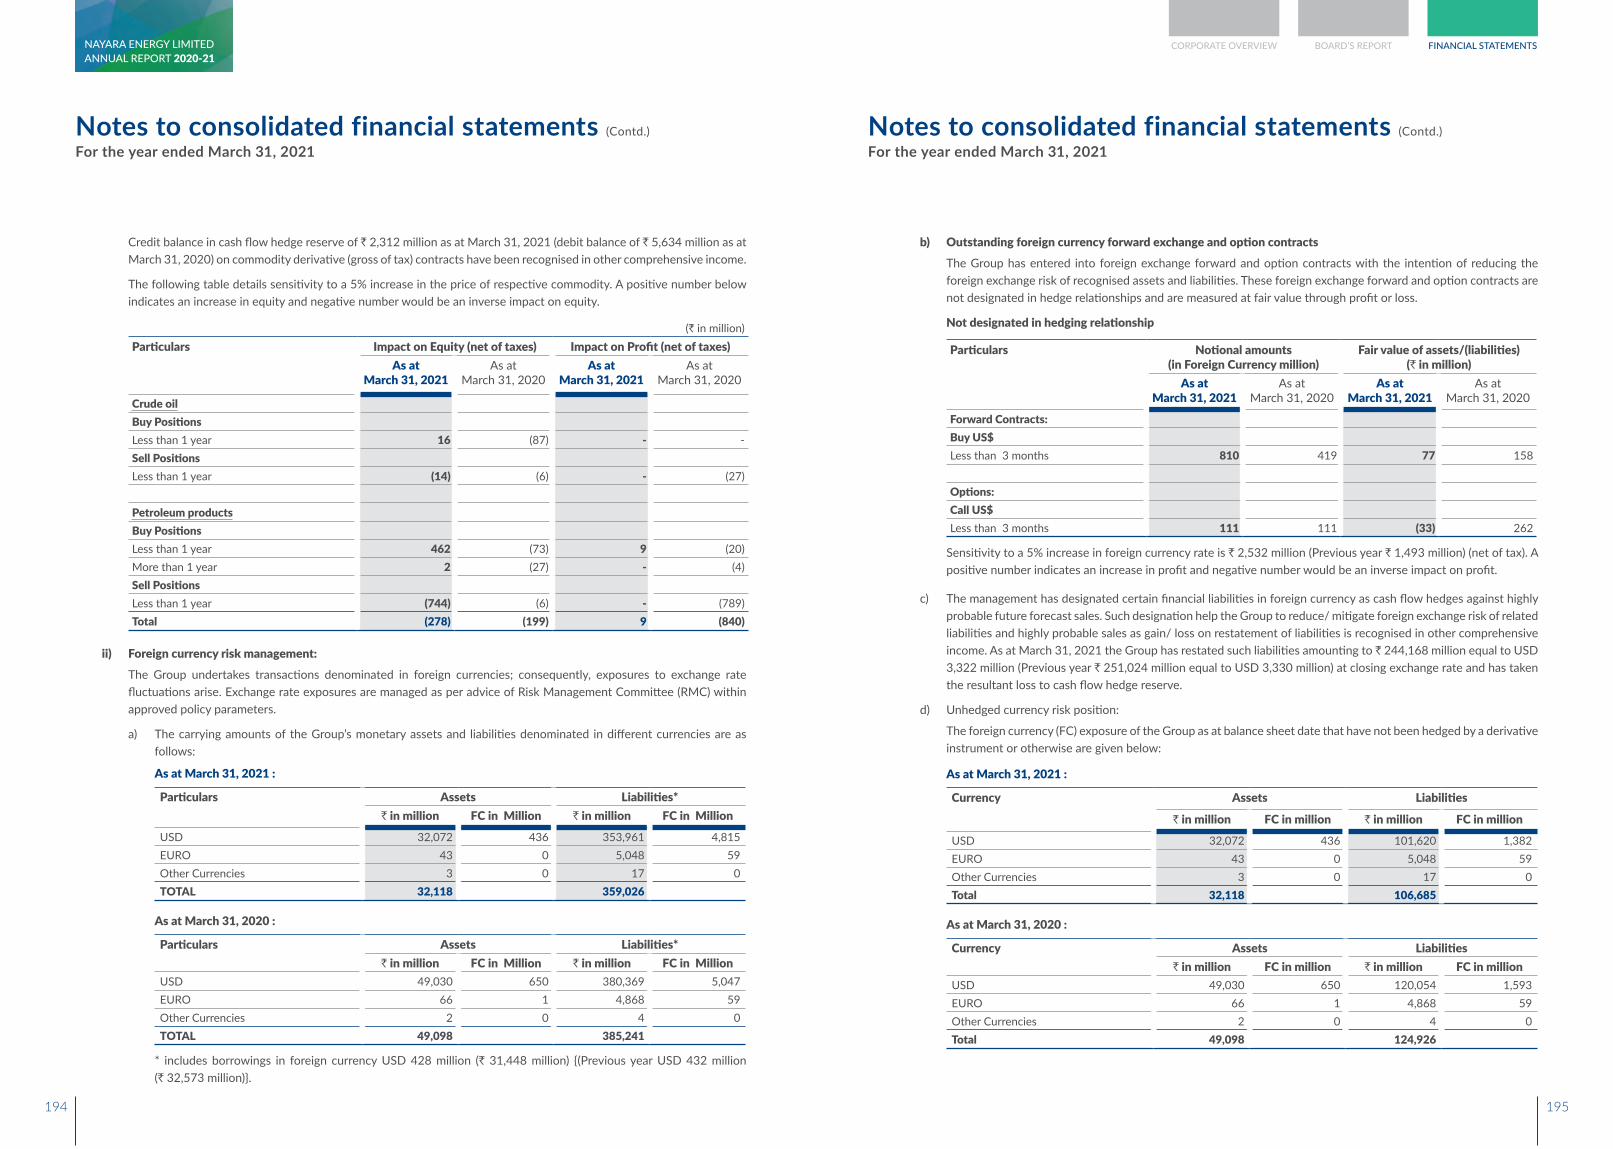
Credit balance in cash flow hedge reserve of ` 2,312 million as at March 31, 2021 (debit balance of ` 5,634 million as at March 31, 2020) on commodity derivative (gross of tax) contracts have been recognised in other comprehensive income.
The following table details sensitivity to a 5% increase in the price of respective commodity. A positive number below indicates an increase in equity and negative number would be an inverse impact on equity.
(` in million)Particulars Impact on Equity (net of taxes) Impact on Profit (net of taxes)
As at March 31, 2021
As at March 31, 2020
As at March 31, 2021
As at March 31, 2020
Crude oilBuy PositionsLess than 1 year 16 (87) - -Sell PositionsLess than 1 year (14) (6) - (27)
Petroleum productsBuy PositionsLess than 1 year 462 (73) 9 (20)More than 1 year 2 (27) - (4)Sell PositionsLess than 1 year (744) (6) - (789)Total (278) (199) 9 (840)
ii) Foreign currency risk management: The Group undertakes transactions denominated in foreign currencies; consequently, exposures to exchange rate
fluctuations arise. Exchange rate exposures are managed as per advice of Risk Management Committee (RMC) within approved policy parameters.
a) The carrying amounts of the Group’s monetary assets and liabilities denominated in different currencies are as follows:
As at March 31, 2021 :
Particulars Assets Liabilities*` in million FC in Million ` in million FC in Million
USD 32,072 436 353,961 4,815 EURO 43 0 5,048 59 Other Currencies 3 0 17 0 TOTAL 32,118 359,026
As at March 31, 2020 :
Particulars Assets Liabilities*` in million FC in Million ` in million FC in Million
USD 49,030 650 380,369 5,047 EURO 66 1 4,868 59 Other Currencies 2 0 4 0 TOTAL 49,098 385,241
* includes borrowings in foreign currency USD 428 million (` 31,448 million) {(Previous year USD 432 million (` 32,573 million)}.
Notes to consolidated financial statements (Contd.)
For the year ended March 31, 2021
b) Outstanding foreign currency forward exchange and option contractsThe Group has entered into foreign exchange forward and option contracts with the intention of reducing the foreign exchange risk of recognised assets and liabilities. These foreign exchange forward and option contracts are not designated in hedge relationships and are measured at fair value through profit or loss.
Not designated in hedging relationship
Particulars Notional amounts (in Foreign Currency million)
Fair value of assets/(liabilities) (` in million)
As at March 31, 2021
As at March 31, 2020
As at March 31, 2021
As at March 31, 2020
Forward Contracts:Buy US$Less than 3 months 810 419 77 158
Options:Call US$Less than 3 months 111 111 (33) 262
Sensitivity to a 5% increase in foreign currency rate is ` 2,532 million (Previous year ` 1,493 million) (net of tax). A positive number indicates an increase in profit and negative number would be an inverse impact on profit.
c) The management has designated certain financial liabilities in foreign currency as cash flow hedges against highly probable future forecast sales. Such designation help the Group to reduce/ mitigate foreign exchange risk of related liabilities and highly probable sales as gain/ loss on restatement of liabilities is recognised in other comprehensive income. As at March 31, 2021 the Group has restated such liabilities amounting to ` 244,168 million equal to USD 3,322 million (Previous year ` 251,024 million equal to USD 3,330 million) at closing exchange rate and has taken the resultant loss to cash flow hedge reserve.
d) Unhedged currency risk position:
The foreign currency (FC) exposure of the Group as at balance sheet date that have not been hedged by a derivative instrument or otherwise are given below:
As at March 31, 2021 :
Currency Assets Liabilities
` in million FC in million ` in million FC in millionUSD 32,072 436 101,620 1,382 EURO 43 0 5,048 59 Other Currencies 3 0 17 0 Total 32,118 106,685
As at March 31, 2020 :
Currency Assets Liabilities` in million FC in million ` in million FC in million
USD 49,030 650 120,054 1,593 EURO 66 1 4,868 59 Other Currencies 2 0 4 0 Total 49,098 124,926
Notes to consolidated financial statements (Contd.)
For the year ended March 31, 2021
194 195
CORPORATE OVERVIEW BOARD’S REPORT FINANCIAL STATEMENTSANNUAL REPORT 2020-21NAYARA ENERGY LIMITED
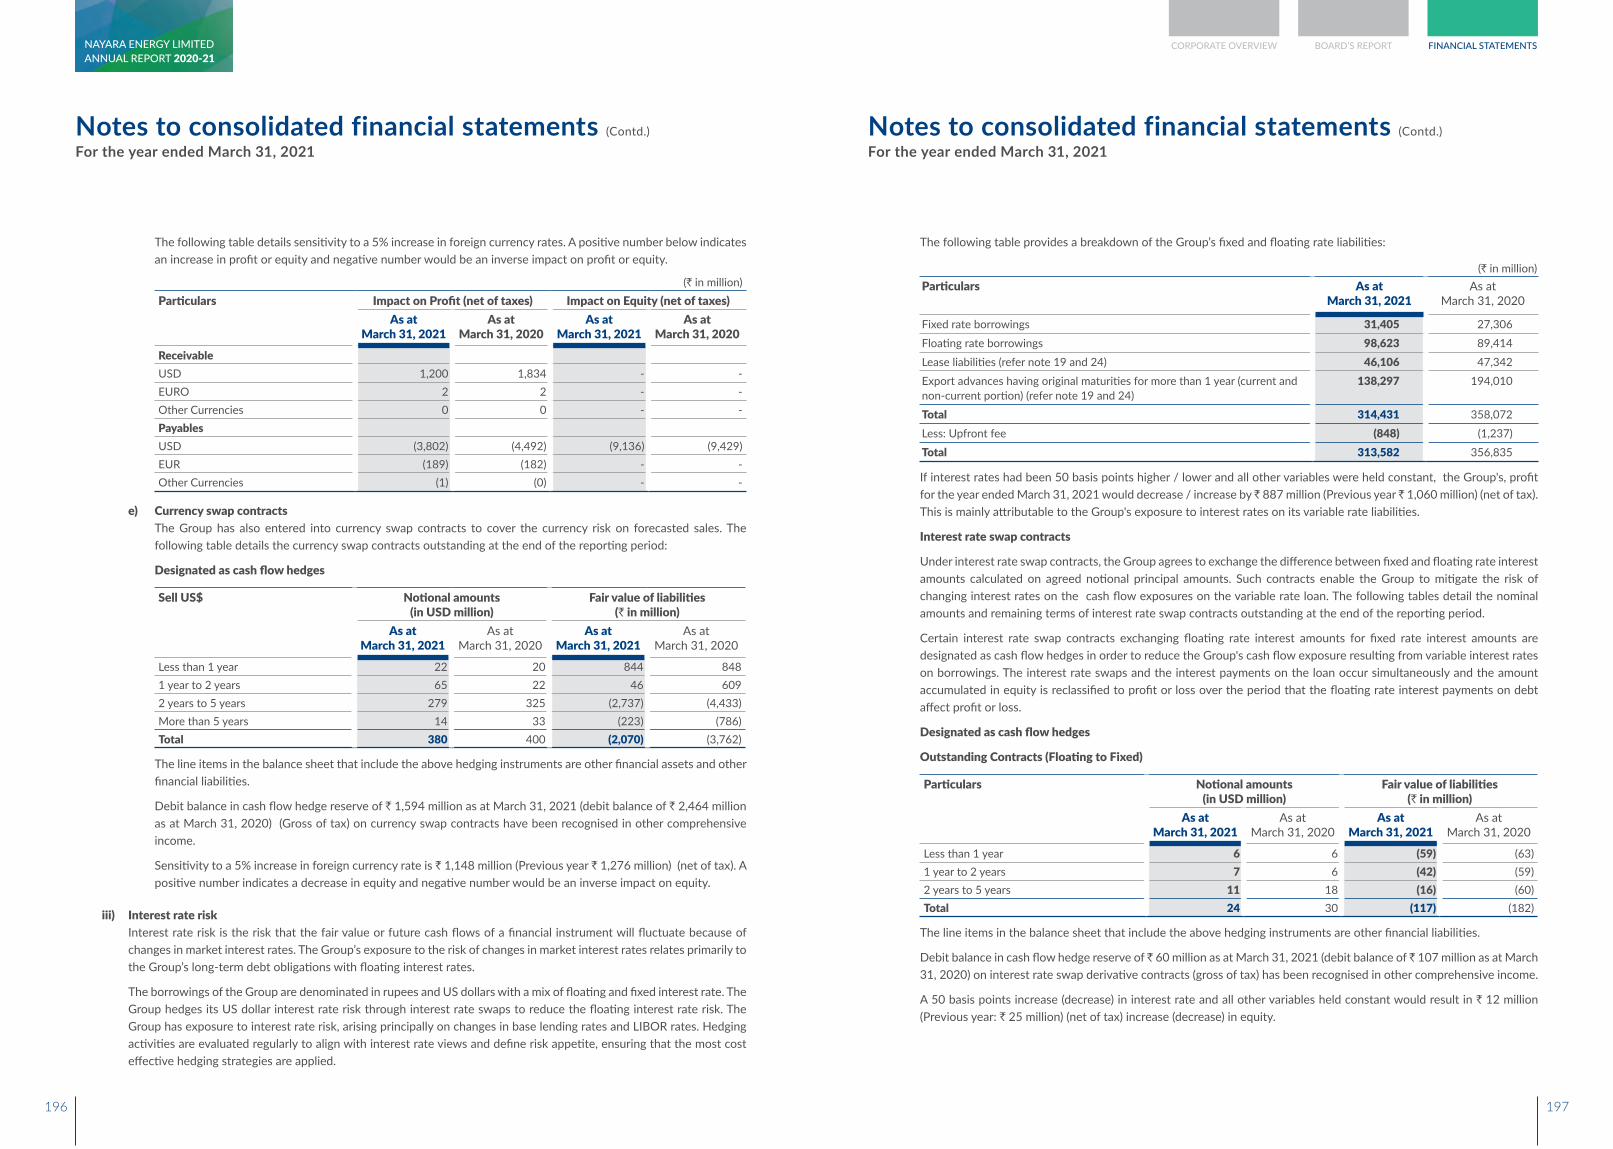
The following table details sensitivity to a 5% increase in foreign currency rates. A positive number below indicates an increase in profit or equity and negative number would be an inverse impact on profit or equity.
(` in million)Particulars Impact on Profit (net of taxes) Impact on Equity (net of taxes)
As at March 31, 2021
As at March 31, 2020
As at March 31, 2021
As at March 31, 2020
ReceivableUSD 1,200 1,834 - - EURO 2 2 - - Other Currencies 0 0 - - PayablesUSD (3,802) (4,492) (9,136) (9,429)EUR (189) (182) - - Other Currencies (1) (0) - -
e) Currency swap contractsThe Group has also entered into currency swap contracts to cover the currency risk on forecasted sales. The following table details the currency swap contracts outstanding at the end of the reporting period:
Designated as cash flow hedges
Sell US$ Notional amounts (in USD million)
Fair value of liabilities (` in million)
As at March 31, 2021
As at March 31, 2020
As at March 31, 2021
As at March 31, 2020
Less than 1 year 22 20 844 848 1 year to 2 years 65 22 46 609 2 years to 5 years 279 325 (2,737) (4,433)More than 5 years 14 33 (223) (786)Total 380 400 (2,070) (3,762)
The line items in the balance sheet that include the above hedging instruments are other financial assets and other financial liabilities.
Debit balance in cash flow hedge reserve of ` 1,594 million as at March 31, 2021 (debit balance of ` 2,464 million as at March 31, 2020) (Gross of tax) on currency swap contracts have been recognised in other comprehensive income.
Sensitivity to a 5% increase in foreign currency rate is ` 1,148 million (Previous year ` 1,276 million) (net of tax). A positive number indicates a decrease in equity and negative number would be an inverse impact on equity.
iii) Interest rate riskInterest rate risk is the risk that the fair value or future cash flows of a financial instrument will fluctuate because of changes in market interest rates. The Group’s exposure to the risk of changes in market interest rates relates primarily to the Group’s long-term debt obligations with floating interest rates.
The borrowings of the Group are denominated in rupees and US dollars with a mix of floating and fixed interest rate. The Group hedges its US dollar interest rate risk through interest rate swaps to reduce the floating interest rate risk. The Group has exposure to interest rate risk, arising principally on changes in base lending rates and LIBOR rates. Hedging activities are evaluated regularly to align with interest rate views and define risk appetite, ensuring that the most cost effective hedging strategies are applied.
Notes to consolidated financial statements (Contd.)
For the year ended March 31, 2021
The following table provides a breakdown of the Group’s fixed and floating rate liabilities:
(` in million)Particulars As at
March 31, 2021As at
March 31, 2020
Fixed rate borrowings 31,405 27,306 Floating rate borrowings 98,623 89,414 Lease liabilities (refer note 19 and 24) 46,106 47,342 Export advances having original maturities for more than 1 year (current and non-current portion) (refer note 19 and 24)
138,297 194,010
Total 314,431 358,072 Less: Upfront fee (848) (1,237)Total 313,582 356,835
If interest rates had been 50 basis points higher / lower and all other variables were held constant, the Group's, profit for the year ended March 31, 2021 would decrease / increase by ̀ 887 million (Previous year ̀ 1,060 million) (net of tax). This is mainly attributable to the Group's exposure to interest rates on its variable rate liabilities.
Interest rate swap contracts
Under interest rate swap contracts, the Group agrees to exchange the difference between fixed and floating rate interest amounts calculated on agreed notional principal amounts. Such contracts enable the Group to mitigate the risk of changing interest rates on the cash flow exposures on the variable rate loan. The following tables detail the nominal amounts and remaining terms of interest rate swap contracts outstanding at the end of the reporting period.
Certain interest rate swap contracts exchanging floating rate interest amounts for fixed rate interest amounts are designated as cash flow hedges in order to reduce the Group's cash flow exposure resulting from variable interest rates on borrowings. The interest rate swaps and the interest payments on the loan occur simultaneously and the amount accumulated in equity is reclassified to profit or loss over the period that the floating rate interest payments on debt affect profit or loss.
Designated as cash flow hedges
Outstanding Contracts (Floating to Fixed)
Particulars Notional amounts (in USD million)
Fair value of liabilities (` in million)
As at March 31, 2021
As at March 31, 2020
As at March 31, 2021
As at March 31, 2020
Less than 1 year 6 6 (59) (63)1 year to 2 years 7 6 (42) (59)2 years to 5 years 11 18 (16) (60)Total 24 30 (117) (182)
The line items in the balance sheet that include the above hedging instruments are other financial liabilities.
Debit balance in cash flow hedge reserve of ̀ 60 million as at March 31, 2021 (debit balance of ̀ 107 million as at March 31, 2020) on interest rate swap derivative contracts (gross of tax) has been recognised in other comprehensive income.
A 50 basis points increase (decrease) in interest rate and all other variables held constant would result in ` 12 million (Previous year: ` 25 million) (net of tax) increase (decrease) in equity.
Notes to consolidated financial statements (Contd.)
For the year ended March 31, 2021
196 197
CORPORATE OVERVIEW BOARD’S REPORT FINANCIAL STATEMENTSANNUAL REPORT 2020-21NAYARA ENERGY LIMITED
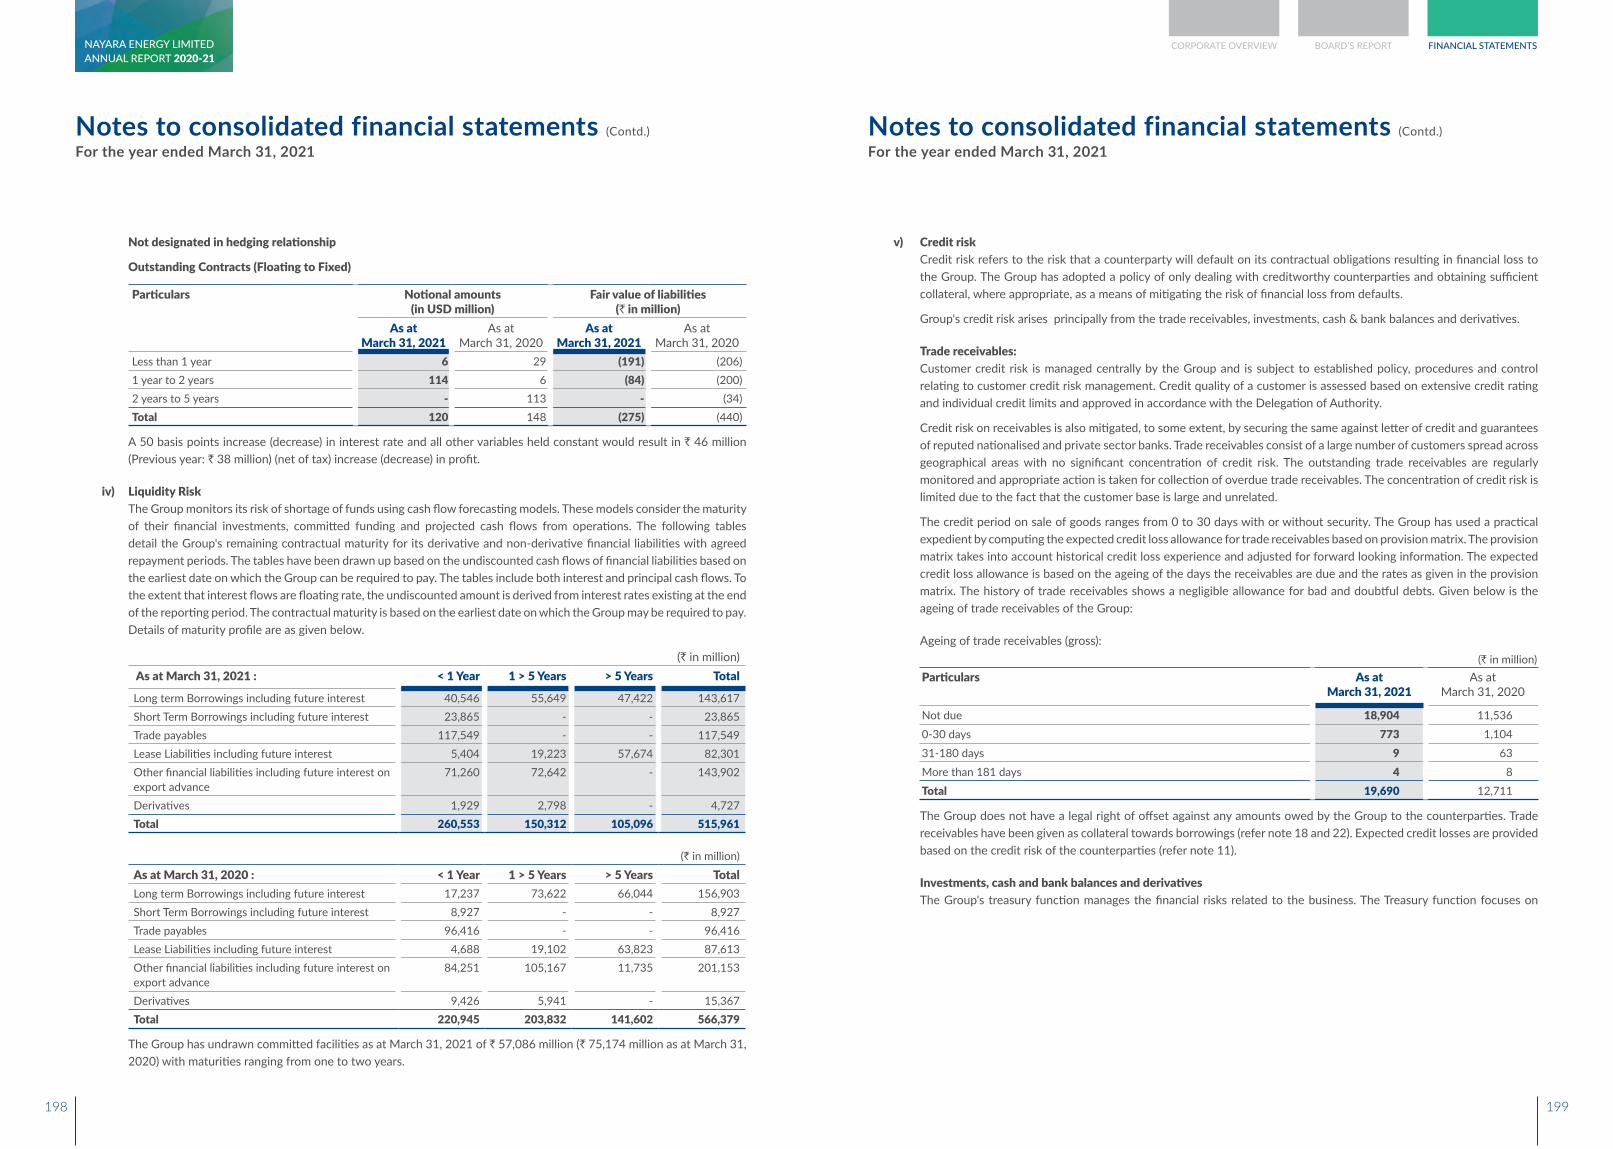
Not designated in hedging relationship
Outstanding Contracts (Floating to Fixed)
Particulars Notional amounts (in USD million)
Fair value of liabilities (` in million)
As at March 31, 2021
As at March 31, 2020
As at March 31, 2021
As at March 31, 2020
Less than 1 year 6 29 (191) (206)1 year to 2 years 114 6 (84) (200)2 years to 5 years - 113 - (34)Total 120 148 (275) (440)
A 50 basis points increase (decrease) in interest rate and all other variables held constant would result in ` 46 million (Previous year: ` 38 million) (net of tax) increase (decrease) in profit.
iv) Liquidity RiskThe Group monitors its risk of shortage of funds using cash flow forecasting models. These models consider the maturity of their financial investments, committed funding and projected cash flows from operations. The following tables detail the Group's remaining contractual maturity for its derivative and non-derivative financial liabilities with agreed repayment periods. The tables have been drawn up based on the undiscounted cash flows of financial liabilities based on the earliest date on which the Group can be required to pay. The tables include both interest and principal cash flows. To the extent that interest flows are floating rate, the undiscounted amount is derived from interest rates existing at the end of the reporting period. The contractual maturity is based on the earliest date on which the Group may be required to pay. Details of maturity profile are as given below.
(` in million) As at March 31, 2021 : < 1 Year 1 > 5 Years > 5 Years Total
Long term Borrowings including future interest 40,546 55,649 47,422 143,617 Short Term Borrowings including future interest 23,865 - - 23,865 Trade payables 117,549 - - 117,549 Lease Liabilities including future interest 5,404 19,223 57,674 82,301 Other financial liabilities including future interest on export advance
71,260 72,642 - 143,902
Derivatives 1,929 2,798 - 4,727 Total 260,553 150,312 105,096 515,961
(` in million)
As at March 31, 2020 : < 1 Year 1 > 5 Years > 5 Years TotalLong term Borrowings including future interest 17,237 73,622 66,044 156,903 Short Term Borrowings including future interest 8,927 - - 8,927 Trade payables 96,416 - - 96,416 Lease Liabilities including future interest 4,688 19,102 63,823 87,613 Other financial liabilities including future interest on export advance
84,251 105,167 11,735 201,153
Derivatives 9,426 5,941 - 15,367 Total 220,945 203,832 141,602 566,379
The Group has undrawn committed facilities as at March 31, 2021 of ` 57,086 million (` 75,174 million as at March 31, 2020) with maturities ranging from one to two years.
Notes to consolidated financial statements (Contd.)
For the year ended March 31, 2021
v) Credit riskCredit risk refers to the risk that a counterparty will default on its contractual obligations resulting in financial loss to the Group. The Group has adopted a policy of only dealing with creditworthy counterparties and obtaining sufficient collateral, where appropriate, as a means of mitigating the risk of financial loss from defaults.
Group's credit risk arises principally from the trade receivables, investments, cash & bank balances and derivatives.
Trade receivables:Customer credit risk is managed centrally by the Group and is subject to established policy, procedures and control relating to customer credit risk management. Credit quality of a customer is assessed based on extensive credit rating and individual credit limits and approved in accordance with the Delegation of Authority.
Credit risk on receivables is also mitigated, to some extent, by securing the same against letter of credit and guarantees of reputed nationalised and private sector banks. Trade receivables consist of a large number of customers spread across geographical areas with no significant concentration of credit risk. The outstanding trade receivables are regularly monitored and appropriate action is taken for collection of overdue trade receivables. The concentration of credit risk is limited due to the fact that the customer base is large and unrelated.
The credit period on sale of goods ranges from 0 to 30 days with or without security. The Group has used a practical expedient by computing the expected credit loss allowance for trade receivables based on provision matrix. The provision matrix takes into account historical credit loss experience and adjusted for forward looking information. The expected credit loss allowance is based on the ageing of the days the receivables are due and the rates as given in the provision matrix. The history of trade receivables shows a negligible allowance for bad and doubtful debts. Given below is the ageing of trade receivables of the Group:
Ageing of trade receivables (gross):(` in million)
Particulars As at March 31, 2021
As at March 31, 2020
Not due 18,904 11,536 0-30 days 773 1,104 31-180 days 9 63 More than 181 days 4 8 Total 19,690 12,711
The Group does not have a legal right of offset against any amounts owed by the Group to the counterparties. Trade receivables have been given as collateral towards borrowings (refer note 18 and 22). Expected credit losses are provided based on the credit risk of the counterparties (refer note 11).
Investments, cash and bank balances and derivativesThe Group's treasury function manages the financial risks related to the business. The Treasury function focuses on
Notes to consolidated financial statements (Contd.)
For the year ended March 31, 2021
198 199
CORPORATE OVERVIEW BOARD’S REPORT FINANCIAL STATEMENTSANNUAL REPORT 2020-21NAYARA ENERGY LIMITED
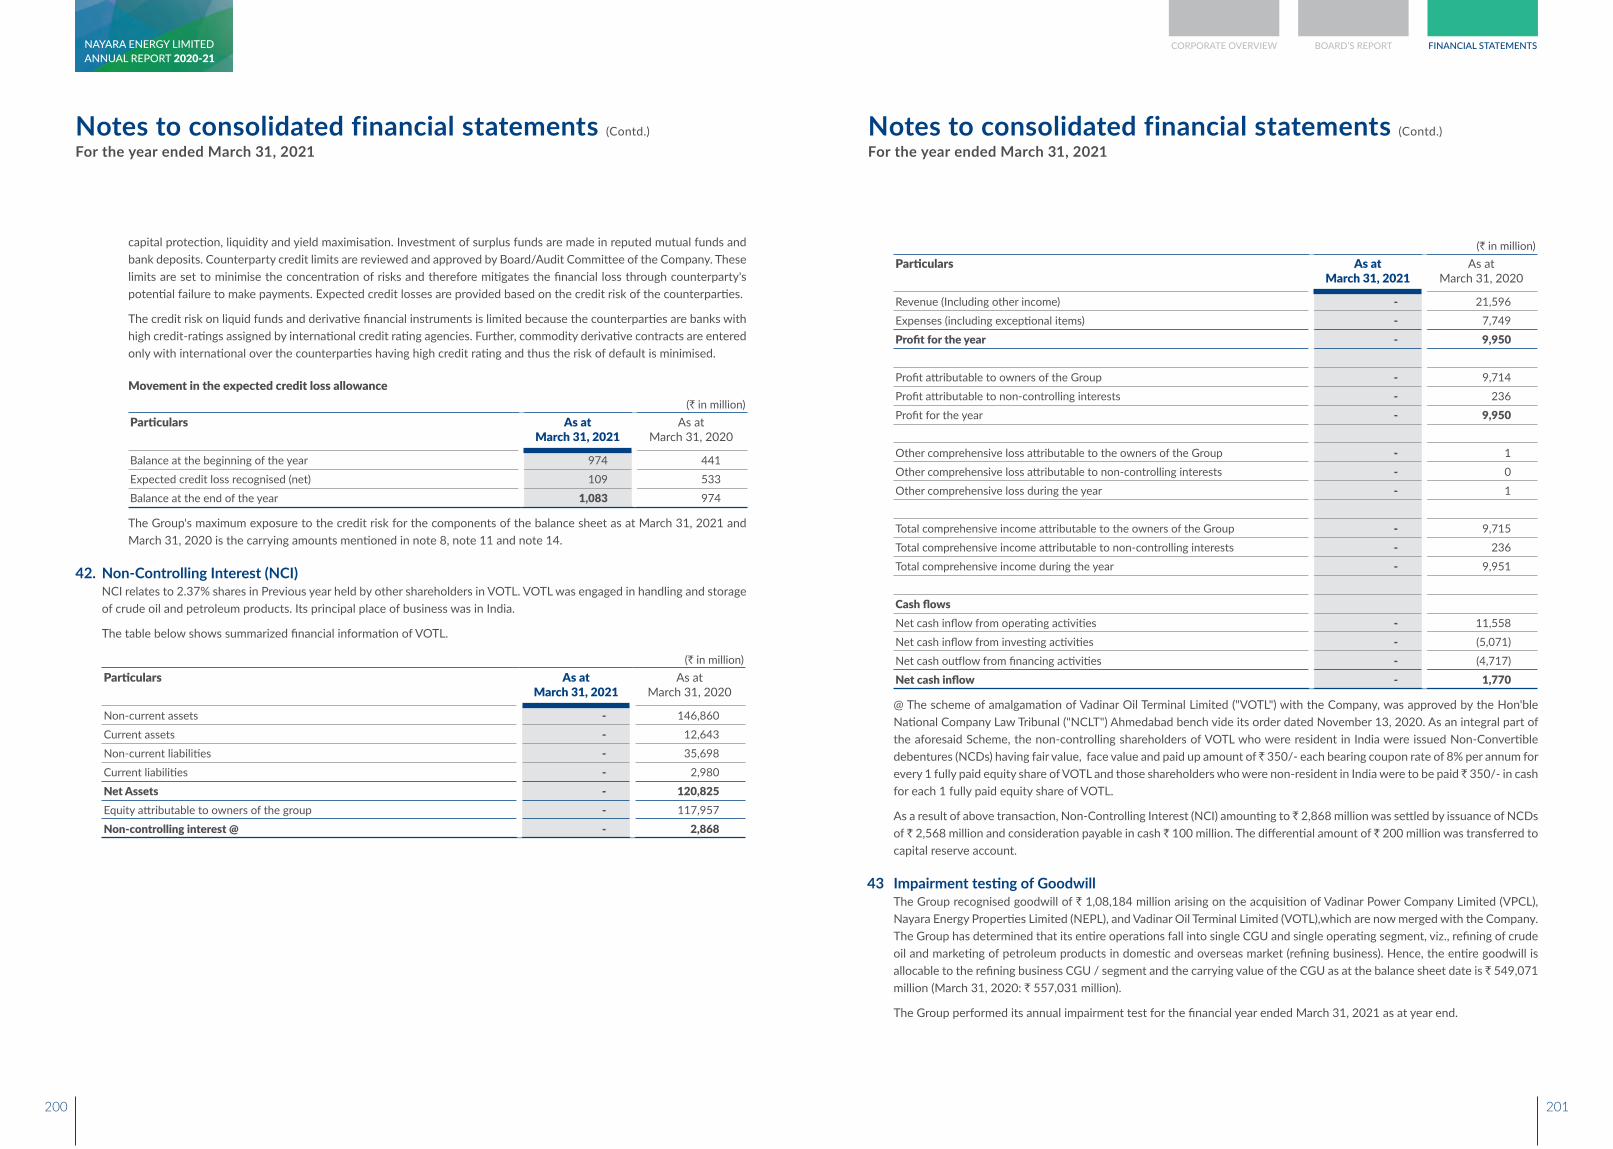
capital protection, liquidity and yield maximisation. Investment of surplus funds are made in reputed mutual funds and bank deposits. Counterparty credit limits are reviewed and approved by Board/Audit Committee of the Company. These limits are set to minimise the concentration of risks and therefore mitigates the financial loss through counterparty's potential failure to make payments. Expected credit losses are provided based on the credit risk of the counterparties.
The credit risk on liquid funds and derivative financial instruments is limited because the counterparties are banks with high credit-ratings assigned by international credit rating agencies. Further, commodity derivative contracts are entered only with international over the counterparties having high credit rating and thus the risk of default is minimised.
Movement in the expected credit loss allowance(` in million)
Particulars As at March 31, 2021
As at March 31, 2020
Balance at the beginning of the year 974 441 Expected credit loss recognised (net) 109 533 Balance at the end of the year 1,083 974
The Group's maximum exposure to the credit risk for the components of the balance sheet as at March 31, 2021 and March 31, 2020 is the carrying amounts mentioned in note 8, note 11 and note 14.
42. Non-Controlling Interest (NCI) NCI relates to 2.37% shares in Previous year held by other shareholders in VOTL. VOTL was engaged in handling and storage
of crude oil and petroleum products. Its principal place of business was in India.
The table below shows summarized financial information of VOTL.
(` in million)Particulars As at
March 31, 2021As at
March 31, 2020
Non-current assets - 146,860 Current assets - 12,643 Non-current liabilities - 35,698 Current liabilities - 2,980 Net Assets - 120,825 Equity attributable to owners of the group - 117,957 Non-controlling interest @ - 2,868
Notes to consolidated financial statements (Contd.)
For the year ended March 31, 2021
(` in million)Particulars As at
March 31, 2021As at
March 31, 2020
Revenue (Including other income) - 21,596 Expenses (including exceptional items) - 7,749 Profit for the year - 9,950
Profit attributable to owners of the Group - 9,714 Profit attributable to non-controlling interests - 236 Profit for the year - 9,950
Other comprehensive loss attributable to the owners of the Group - 1 Other comprehensive loss attributable to non-controlling interests - 0 Other comprehensive loss during the year - 1
Total comprehensive income attributable to the owners of the Group - 9,715 Total comprehensive income attributable to non-controlling interests - 236 Total comprehensive income during the year - 9,951
Cash flowsNet cash inflow from operating activities - 11,558 Net cash inflow from investing activities - (5,071)Net cash outflow from financing activities - (4,717)Net cash inflow - 1,770
@ The scheme of amalgamation of Vadinar Oil Terminal Limited ("VOTL") with the Company, was approved by the Hon'ble National Company Law Tribunal ("NCLT") Ahmedabad bench vide its order dated November 13, 2020. As an integral part of the aforesaid Scheme, the non-controlling shareholders of VOTL who were resident in India were issued Non-Convertible debentures (NCDs) having fair value, face value and paid up amount of ̀ 350/- each bearing coupon rate of 8% per annum for every 1 fully paid equity share of VOTL and those shareholders who were non-resident in India were to be paid ̀ 350/- in cash for each 1 fully paid equity share of VOTL.
As a result of above transaction, Non-Controlling Interest (NCI) amounting to ̀ 2,868 million was settled by issuance of NCDs of ` 2,568 million and consideration payable in cash ` 100 million. The differential amount of ` 200 million was transferred to capital reserve account.
43 Impairment testing of Goodwill The Group recognised goodwill of ` 1,08,184 million arising on the acquisition of Vadinar Power Company Limited (VPCL),
Nayara Energy Properties Limited (NEPL), and Vadinar Oil Terminal Limited (VOTL),which are now merged with the Company. The Group has determined that its entire operations fall into single CGU and single operating segment, viz., refining of crude oil and marketing of petroleum products in domestic and overseas market (refining business). Hence, the entire goodwill is allocable to the refining business CGU / segment and the carrying value of the CGU as at the balance sheet date is ` 549,071 million (March 31, 2020: ` 557,031 million).
The Group performed its annual impairment test for the financial year ended March 31, 2021 as at year end.
Notes to consolidated financial statements (Contd.)
For the year ended March 31, 2021
200 201
CORPORATE OVERVIEW BOARD’S REPORT FINANCIAL STATEMENTSANNUAL REPORT 2020-21NAYARA ENERGY LIMITED
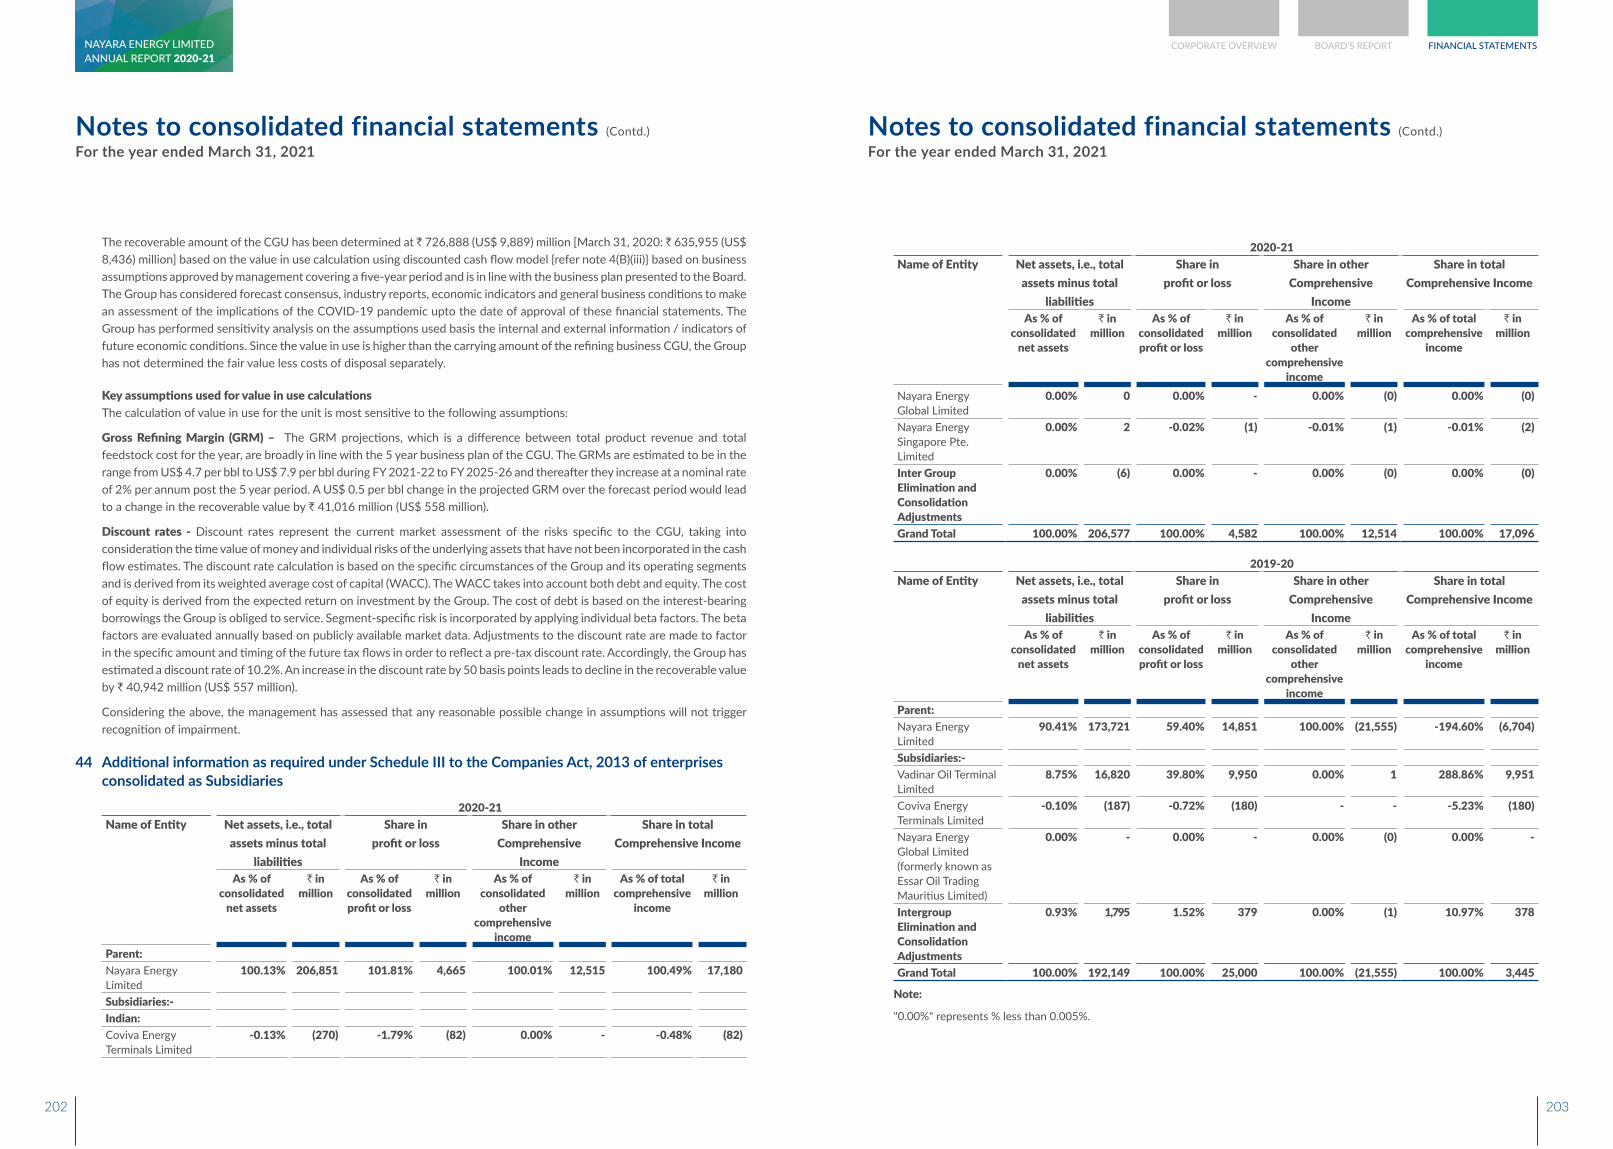
The recoverable amount of the CGU has been determined at ̀ 726,888 (US$ 9,889) million [March 31, 2020: ̀ 635,955 (US$ 8,436) million] based on the value in use calculation using discounted cash flow model {refer note 4(B)(iii)} based on business assumptions approved by management covering a five-year period and is in line with the business plan presented to the Board. The Group has considered forecast consensus, industry reports, economic indicators and general business conditions to make an assessment of the implications of the COVID-19 pandemic upto the date of approval of these financial statements. The Group has performed sensitivity analysis on the assumptions used basis the internal and external information / indicators of future economic conditions. Since the value in use is higher than the carrying amount of the refining business CGU, the Group has not determined the fair value less costs of disposal separately.
Key assumptions used for value in use calculations The calculation of value in use for the unit is most sensitive to the following assumptions:
Gross Refining Margin (GRM) – The GRM projections, which is a difference between total product revenue and total feedstock cost for the year, are broadly in line with the 5 year business plan of the CGU. The GRMs are estimated to be in the range from US$ 4.7 per bbl to US$ 7.9 per bbl during FY 2021-22 to FY 2025-26 and thereafter they increase at a nominal rate of 2% per annum post the 5 year period. A US$ 0.5 per bbl change in the projected GRM over the forecast period would lead to a change in the recoverable value by ` 41,016 million (US$ 558 million).
Discount rates - Discount rates represent the current market assessment of the risks specific to the CGU, taking into consideration the time value of money and individual risks of the underlying assets that have not been incorporated in the cash flow estimates. The discount rate calculation is based on the specific circumstances of the Group and its operating segments and is derived from its weighted average cost of capital (WACC). The WACC takes into account both debt and equity. The cost of equity is derived from the expected return on investment by the Group. The cost of debt is based on the interest-bearing borrowings the Group is obliged to service. Segment-specific risk is incorporated by applying individual beta factors. The beta factors are evaluated annually based on publicly available market data. Adjustments to the discount rate are made to factor in the specific amount and timing of the future tax flows in order to reflect a pre-tax discount rate. Accordingly, the Group has estimated a discount rate of 10.2%. An increase in the discount rate by 50 basis points leads to decline in the recoverable value by ` 40,942 million (US$ 557 million).
Considering the above, the management has assessed that any reasonable possible change in assumptions will not trigger recognition of impairment.
44 Additional information as required under Schedule III to the Companies Act, 2013 of enterprises consolidated as Subsidiaries
2020-21Name of Entity Net assets, i.e., total
assets minus total liabilities
Share in profit or loss
Share in other Comprehensive
Income
Share in total Comprehensive Income
As % of consolidated
net assets
` in million
As % of consolidated profit or loss
` in million
As % of consolidated
other comprehensive
income
` in million
As % of total comprehensive
income
` in million
Parent:Nayara Energy Limited
100.13% 206,851 101.81% 4,665 100.01% 12,515 100.49% 17,180
Subsidiaries:-Indian:Coviva Energy Terminals Limited
-0.13% (270) -1.79% (82) 0.00% - -0.48% (82)
Notes to consolidated financial statements (Contd.)
For the year ended March 31, 2021Notes to consolidated financial statements (Contd.)
For the year ended March 31, 2021
2020-21Name of Entity Net assets, i.e., total
assets minus total liabilities
Share in profit or loss
Share in other Comprehensive
Income
Share in total Comprehensive Income
As % of consolidated
net assets
` in million
As % of consolidated profit or loss
` in million
As % of consolidated
other comprehensive
income
` in million
As % of total comprehensive
income
` in million
Nayara Energy Global Limited
0.00% 0 0.00% - 0.00% (0) 0.00% (0)
Nayara Energy Singapore Pte. Limited
0.00% 2 -0.02% (1) -0.01% (1) -0.01% (2)
Inter Group Elimination and Consolidation Adjustments
0.00% (6) 0.00% - 0.00% (0) 0.00% (0)
Grand Total 100.00% 206,577 100.00% 4,582 100.00% 12,514 100.00% 17,096
2019-20Name of Entity Net assets, i.e., total
assets minus total liabilities
Share in profit or loss
Share in other Comprehensive
Income
Share in total Comprehensive Income
As % of consolidated
net assets
` in million
As % of consolidated profit or loss
` in million
As % of consolidated
other comprehensive
income
` in million
As % of total comprehensive
income
` in million
Parent:Nayara Energy Limited
90.41% 173,721 59.40% 14,851 100.00% (21,555) -194.60% (6,704)
Subsidiaries:-Vadinar Oil Terminal Limited
8.75% 16,820 39.80% 9,950 0.00% 1 288.86% 9,951
Coviva Energy Terminals Limited
-0.10% (187) -0.72% (180) - - -5.23% (180)
Nayara Energy Global Limited (formerly known as Essar Oil Trading Mauritius Limited)
0.00% - 0.00% - 0.00% (0) 0.00% -
Intergroup Elimination and Consolidation Adjustments
0.93% 1,795 1.52% 379 0.00% (1) 10.97% 378
Grand Total 100.00% 192,149 100.00% 25,000 100.00% (21,555) 100.00% 3,445
Note:
"0.00%" represents % less than 0.005%.
202 203
CORPORATE OVERVIEW BOARD’S REPORT FINANCIAL STATEMENTSANNUAL REPORT 2020-21NAYARA ENERGY LIMITED
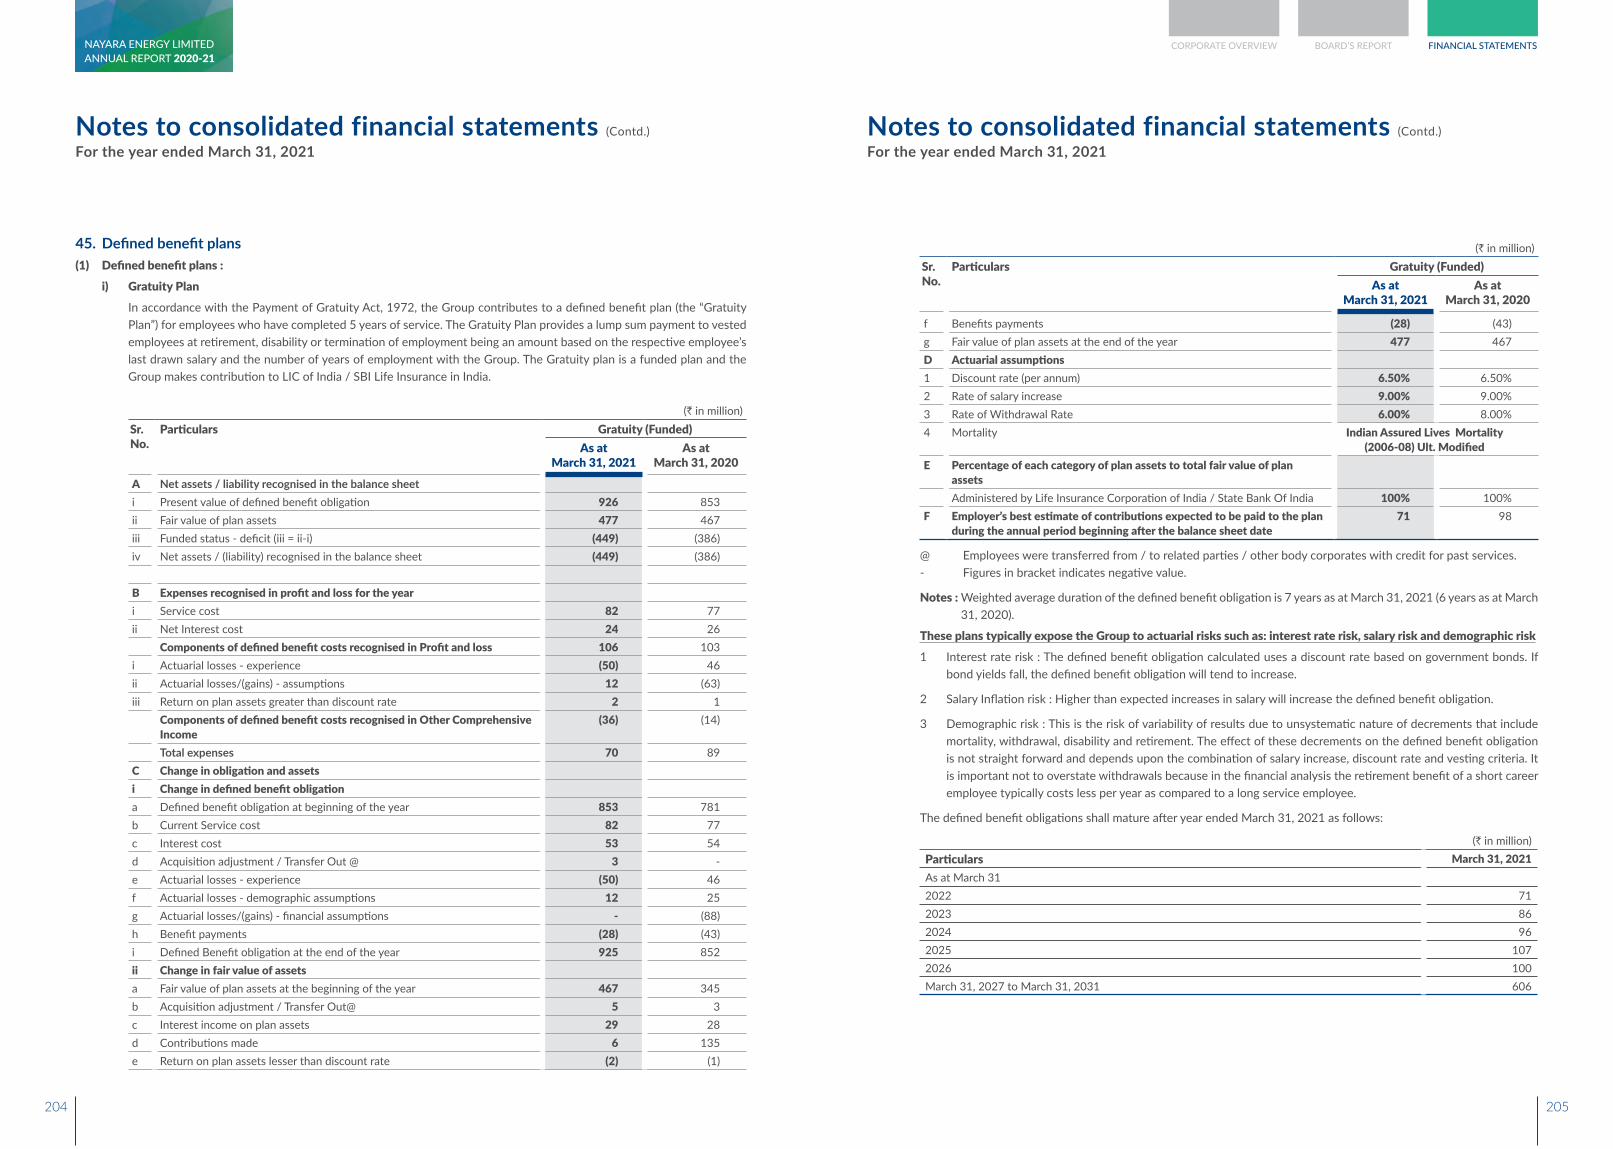
45. Defined benefit plans (1) Defined benefit plans : i) Gratuity Plan
In accordance with the Payment of Gratuity Act, 1972, the Group contributes to a defined benefit plan (the “Gratuity Plan”) for employees who have completed 5 years of service. The Gratuity Plan provides a lump sum payment to vested employees at retirement, disability or termination of employment being an amount based on the respective employee’s last drawn salary and the number of years of employment with the Group. The Gratuity plan is a funded plan and the Group makes contribution to LIC of India / SBI Life Insurance in India.
(` in million)Sr. No.
Particulars Gratuity (Funded)As at
March 31, 2021As at
March 31, 2020A Net assets / liability recognised in the balance sheeti Present value of defined benefit obligation 926 853 ii Fair value of plan assets 477 467 iii Funded status - deficit (iii = ii-i) (449) (386)iv Net assets / (liability) recognised in the balance sheet (449) (386)
B Expenses recognised in profit and loss for the yeari Service cost 82 77 ii Net Interest cost 24 26
Components of defined benefit costs recognised in Profit and loss 106 103 i Actuarial losses - experience (50) 46 ii Actuarial losses/(gains) - assumptions 12 (63)iii Return on plan assets greater than discount rate 2 1
Components of defined benefit costs recognised in Other Comprehensive Income
(36) (14)
Total expenses 70 89 C Change in obligation and assetsi Change in defined benefit obligationa Defined benefit obligation at beginning of the year 853 781 b Current Service cost 82 77 c Interest cost 53 54 d Acquisition adjustment / Transfer Out @ 3 - e Actuarial losses - experience (50) 46 f Actuarial losses - demographic assumptions 12 25 g Actuarial losses/(gains) - financial assumptions - (88)h Benefit payments (28) (43)i Defined Benefit obligation at the end of the year 925 852 ii Change in fair value of assetsa Fair value of plan assets at the beginning of the year 467 345 b Acquisition adjustment / Transfer Out@ 5 3 c Interest income on plan assets 29 28 d Contributions made 6 135 e Return on plan assets lesser than discount rate (2) (1)
Notes to consolidated financial statements (Contd.)
For the year ended March 31, 2021
(` in million)Sr. No.
Particulars Gratuity (Funded)As at
March 31, 2021As at
March 31, 2020
f Benefits payments (28) (43)g Fair value of plan assets at the end of the year 477 467 D Actuarial assumptions1 Discount rate (per annum) 6.50% 6.50%2 Rate of salary increase 9.00% 9.00%3 Rate of Withdrawal Rate 6.00% 8.00%4 Mortality Indian Assured Lives Mortality
(2006-08) Ult. ModifiedE Percentage of each category of plan assets to total fair value of plan
assetsAdministered by Life Insurance Corporation of India / State Bank Of India 100% 100%
F Employer’s best estimate of contributions expected to be paid to the plan during the annual period beginning after the balance sheet date
71 98
@ Employees were transferred from / to related parties / other body corporates with credit for past services. - Figures in bracket indicates negative value.
Notes : Weighted average duration of the defined benefit obligation is 7 years as at March 31, 2021 (6 years as at March 31, 2020).
These plans typically expose the Group to actuarial risks such as: interest rate risk, salary risk and demographic risk1 Interest rate risk : The defined benefit obligation calculated uses a discount rate based on government bonds. If
bond yields fall, the defined benefit obligation will tend to increase.
2 Salary Inflation risk : Higher than expected increases in salary will increase the defined benefit obligation.
3 Demographic risk : This is the risk of variability of results due to unsystematic nature of decrements that include mortality, withdrawal, disability and retirement. The effect of these decrements on the defined benefit obligation is not straight forward and depends upon the combination of salary increase, discount rate and vesting criteria. It is important not to overstate withdrawals because in the financial analysis the retirement benefit of a short career employee typically costs less per year as compared to a long service employee.
The defined benefit obligations shall mature after year ended March 31, 2021 as follows:
(` in million)Particulars March 31, 2021As at March 312022 71 2023 86 2024 96 2025 107 2026 100 March 31, 2027 to March 31, 2031 606
Notes to consolidated financial statements (Contd.)
For the year ended March 31, 2021
204 205
CORPORATE OVERVIEW BOARD’S REPORT FINANCIAL STATEMENTSANNUAL REPORT 2020-21NAYARA ENERGY LIMITED
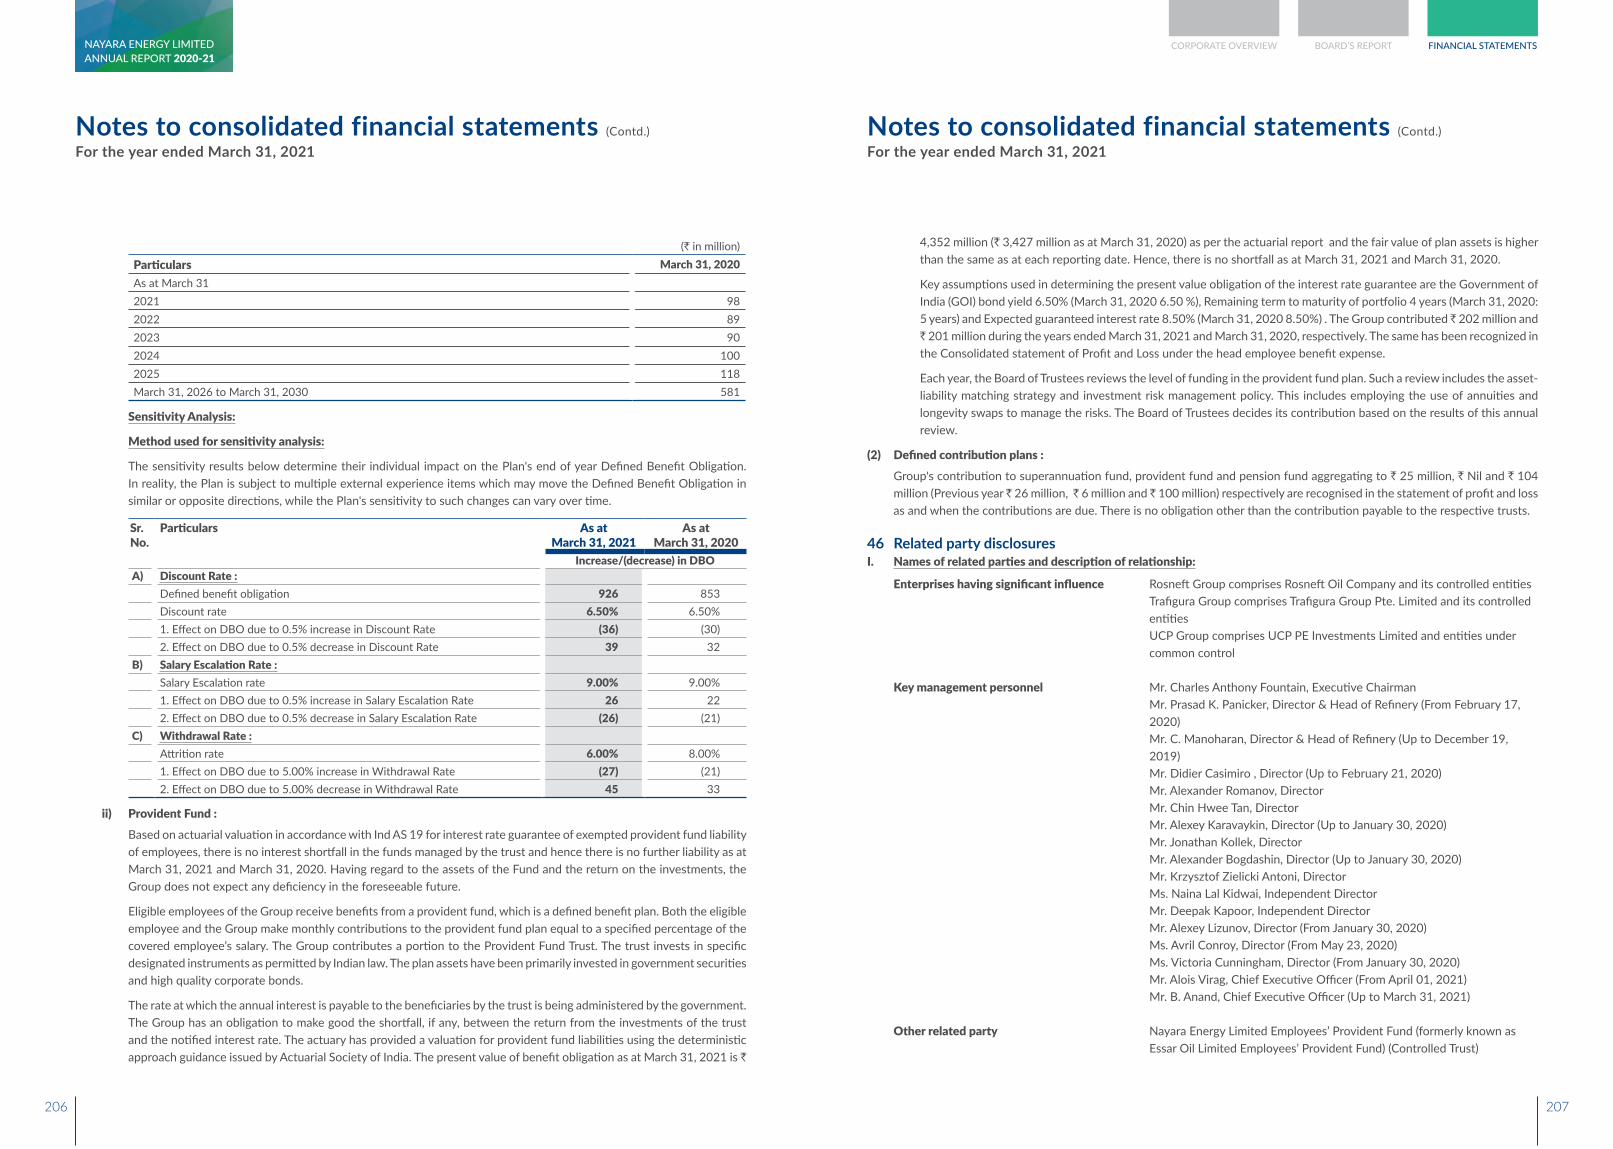
(` in million)Particulars March 31, 2020As at March 312021 98 2022 89 2023 90 2024 100 2025 118 March 31, 2026 to March 31, 2030 581
Sensitivity Analysis:
Method used for sensitivity analysis:
The sensitivity results below determine their individual impact on the Plan's end of year Defined Benefit Obligation. In reality, the Plan is subject to multiple external experience items which may move the Defined Benefit Obligation in similar or opposite directions, while the Plan's sensitivity to such changes can vary over time.
Sr. No.
Particulars As at March 31, 2021
As at March 31, 2020
Increase/(decrease) in DBOA) Discount Rate :
Defined benefit obligation 926 853 Discount rate 6.50% 6.50%1. Effect on DBO due to 0.5% increase in Discount Rate (36) (30)2. Effect on DBO due to 0.5% decrease in Discount Rate 39 32
B) Salary Escalation Rate :Salary Escalation rate 9.00% 9.00%1. Effect on DBO due to 0.5% increase in Salary Escalation Rate 26 22 2. Effect on DBO due to 0.5% decrease in Salary Escalation Rate (26) (21)
C) Withdrawal Rate :Attrition rate 6.00% 8.00%1. Effect on DBO due to 5.00% increase in Withdrawal Rate (27) (21)2. Effect on DBO due to 5.00% decrease in Withdrawal Rate 45 33
ii) Provident Fund : Based on actuarial valuation in accordance with Ind AS 19 for interest rate guarantee of exempted provident fund liability
of employees, there is no interest shortfall in the funds managed by the trust and hence there is no further liability as at March 31, 2021 and March 31, 2020. Having regard to the assets of the Fund and the return on the investments, the Group does not expect any deficiency in the foreseeable future.
Eligible employees of the Group receive benefits from a provident fund, which is a defined benefit plan. Both the eligible employee and the Group make monthly contributions to the provident fund plan equal to a specified percentage of the covered employee’s salary. The Group contributes a portion to the Provident Fund Trust. The trust invests in specific designated instruments as permitted by Indian law. The plan assets have been primarily invested in government securities and high quality corporate bonds.
The rate at which the annual interest is payable to the beneficiaries by the trust is being administered by the government. The Group has an obligation to make good the shortfall, if any, between the return from the investments of the trust and the notified interest rate. The actuary has provided a valuation for provident fund liabilities using the deterministic approach guidance issued by Actuarial Society of India. The present value of benefit obligation as at March 31, 2021 is `
Notes to consolidated financial statements (Contd.)
For the year ended March 31, 2021
4,352 million (` 3,427 million as at March 31, 2020) as per the actuarial report and the fair value of plan assets is higher than the same as at each reporting date. Hence, there is no shortfall as at March 31, 2021 and March 31, 2020.
Key assumptions used in determining the present value obligation of the interest rate guarantee are the Government of India (GOI) bond yield 6.50% (March 31, 2020 6.50 %), Remaining term to maturity of portfolio 4 years (March 31, 2020: 5 years) and Expected guaranteed interest rate 8.50% (March 31, 2020 8.50%) . The Group contributed ̀ 202 million and ` 201 million during the years ended March 31, 2021 and March 31, 2020, respectively. The same has been recognized in the Consolidated statement of Profit and Loss under the head employee benefit expense.
Each year, the Board of Trustees reviews the level of funding in the provident fund plan. Such a review includes the asset-liability matching strategy and investment risk management policy. This includes employing the use of annuities and longevity swaps to manage the risks. The Board of Trustees decides its contribution based on the results of this annual review.
(2) Defined contribution plans : Group's contribution to superannuation fund, provident fund and pension fund aggregating to ` 25 million, ` Nil and ` 104
million (Previous year ̀ 26 million, ̀ 6 million and ̀ 100 million) respectively are recognised in the statement of profit and loss as and when the contributions are due. There is no obligation other than the contribution payable to the respective trusts.
46 Related party disclosuresI. Names of related parties and description of relationship:
Enterprises having significant influence Rosneft Group comprises Rosneft Oil Company and its controlled entitiesTrafigura Group comprises Trafigura Group Pte. Limited and its controlled entitiesUCP Group comprises UCP PE Investments Limited and entities under common control
Key management personnel Mr. Charles Anthony Fountain, Executive ChairmanMr. Prasad K. Panicker, Director & Head of Refinery (From February 17, 2020)Mr. C. Manoharan, Director & Head of Refinery (Up to December 19, 2019)Mr. Didier Casimiro , Director (Up to February 21, 2020)Mr. Alexander Romanov, DirectorMr. Chin Hwee Tan, DirectorMr. Alexey Karavaykin, Director (Up to January 30, 2020)Mr. Jonathan Kollek, DirectorMr. Alexander Bogdashin, Director (Up to January 30, 2020)Mr. Krzysztof Zielicki Antoni, DirectorMs. Naina Lal Kidwai, Independent DirectorMr. Deepak Kapoor, Independent DirectorMr. Alexey Lizunov, Director (From January 30, 2020)Ms. Avril Conroy, Director (From May 23, 2020)Ms. Victoria Cunningham, Director (From January 30, 2020)Mr. Alois Virag, Chief Executive Officer (From April 01, 2021)Mr. B. Anand, Chief Executive Officer (Up to March 31, 2021)
Other related party Nayara Energy Limited Employees’ Provident Fund (formerly known as Essar Oil Limited Employees’ Provident Fund) (Controlled Trust)
Notes to consolidated financial statements (Contd.)
For the year ended March 31, 2021
206 207
CORPORATE OVERVIEW BOARD’S REPORT FINANCIAL STATEMENTSANNUAL REPORT 2020-21NAYARA ENERGY LIMITED
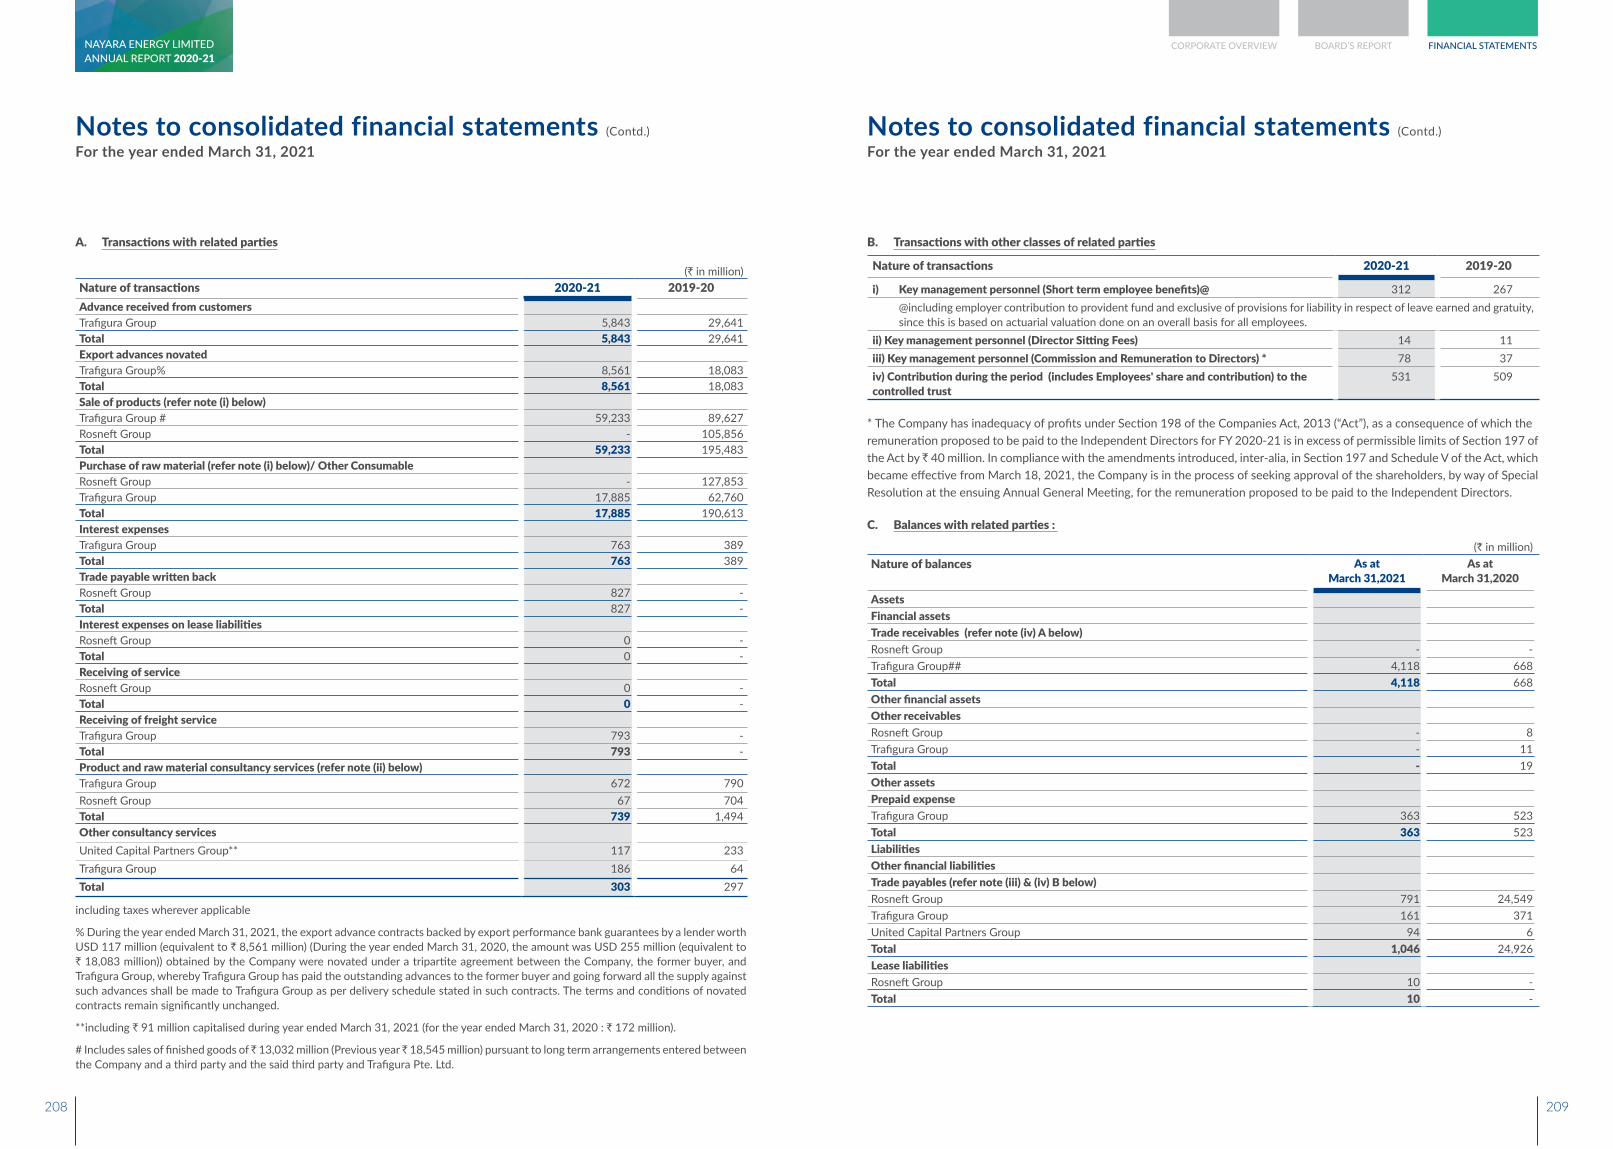
A. Transactions with related parties
(` in million)Nature of transactions 2020-21 2019-20Advance received from customersTrafigura Group 5,843 29,641Total 5,843 29,641Export advances novatedTrafigura Group% 8,561 18,083Total 8,561 18,083Sale of products (refer note (i) below)Trafigura Group # 59,233 89,627Rosneft Group - 105,856Total 59,233 195,483Purchase of raw material (refer note (i) below)/ Other ConsumableRosneft Group - 127,853Trafigura Group 17,885 62,760Total 17,885 190,613Interest expensesTrafigura Group 763 389Total 763 389Trade payable written backRosneft Group 827 -Total 827 -Interest expenses on lease liabilitiesRosneft Group 0 -Total 0 -Receiving of serviceRosneft Group 0 -Total 0 -Receiving of freight serviceTrafigura Group 793 -Total 793 -Product and raw material consultancy services (refer note (ii) below)Trafigura Group 672 790Rosneft Group 67 704Total 739 1,494Other consultancy servicesUnited Capital Partners Group** 117 233Trafigura Group 186 64Total 303 297
including taxes wherever applicable
% During the year ended March 31, 2021, the export advance contracts backed by export performance bank guarantees by a lender worth USD 117 million (equivalent to ` 8,561 million) (During the year ended March 31, 2020, the amount was USD 255 million (equivalent to ` 18,083 million)) obtained by the Company were novated under a tripartite agreement between the Company, the former buyer, and Trafigura Group, whereby Trafigura Group has paid the outstanding advances to the former buyer and going forward all the supply against such advances shall be made to Trafigura Group as per delivery schedule stated in such contracts. The terms and conditions of novated contracts remain significantly unchanged.
**including ` 91 million capitalised during year ended March 31, 2021 (for the year ended March 31, 2020 : ` 172 million).
# Includes sales of finished goods of ̀ 13,032 million (Previous year ̀ 18,545 million) pursuant to long term arrangements entered between the Company and a third party and the said third party and Trafigura Pte. Ltd.
Notes to consolidated financial statements (Contd.)
For the year ended March 31, 2021
B. Transactions with other classes of related parties
Nature of transactions 2020-21 2019-20
i) Key management personnel (Short term employee benefits)@ 312 267 @including employer contribution to provident fund and exclusive of provisions for liability in respect of leave earned and gratuity,
since this is based on actuarial valuation done on an overall basis for all employees. ii) Key management personnel (Director Sitting Fees) 14 11 iii) Key management personnel (Commission and Remuneration to Directors) * 78 37 iv) Contribution during the period (includes Employees' share and contribution) to the controlled trust
531 509
* The Company has inadequacy of profits under Section 198 of the Companies Act, 2013 (“Act”), as a consequence of which the remuneration proposed to be paid to the Independent Directors for FY 2020-21 is in excess of permissible limits of Section 197 of the Act by ` 40 million. In compliance with the amendments introduced, inter-alia, in Section 197 and Schedule V of the Act, which became effective from March 18, 2021, the Company is in the process of seeking approval of the shareholders, by way of Special Resolution at the ensuing Annual General Meeting, for the remuneration proposed to be paid to the Independent Directors.
C. Balances with related parties :
(` in million)Nature of balances As at
March 31,2021As at
March 31,2020
AssetsFinancial assetsTrade receivables (refer note (iv) A below)Rosneft Group - - Trafigura Group## 4,118 668 Total 4,118 668 Other financial assets Other receivables Rosneft Group - 8 Trafigura Group - 11 Total - 19 Other assets Prepaid expenseTrafigura Group 363 523 Total 363 523 LiabilitiesOther financial liabilitiesTrade payables (refer note (iii) & (iv) B below)Rosneft Group 791 24,549 Trafigura Group 161 371 United Capital Partners Group 94 6 Total 1,046 24,926 Lease liabilitiesRosneft Group 10 - Total 10 -
Notes to consolidated financial statements (Contd.)
For the year ended March 31, 2021
208 209
CORPORATE OVERVIEW BOARD’S REPORT FINANCIAL STATEMENTSANNUAL REPORT 2020-21NAYARA ENERGY LIMITED
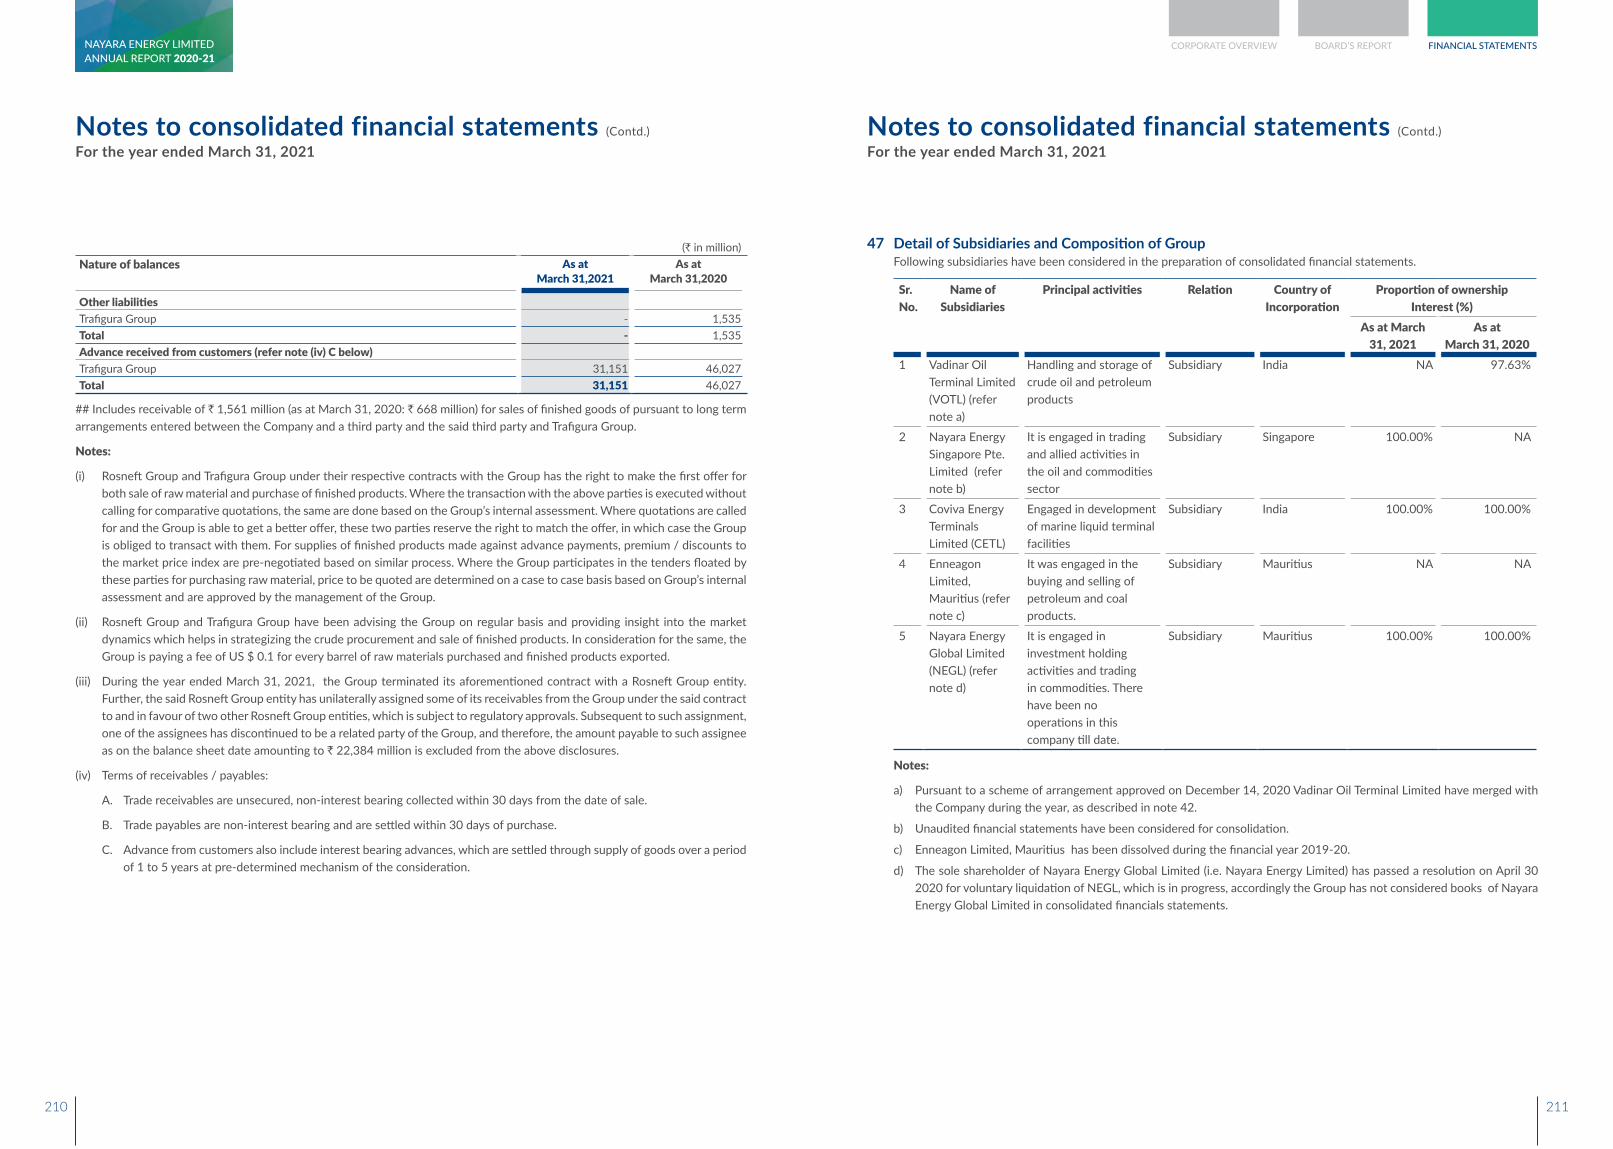
Notes to consolidated financial statements (Contd.)
For the year ended March 31, 2021
(` in million)Nature of balances As at
March 31,2021As at
March 31,2020
Other liabilitiesTrafigura Group - 1,535 Total - 1,535 Advance received from customers (refer note (iv) C below)Trafigura Group 31,151 46,027 Total 31,151 46,027
## Includes receivable of ` 1,561 million (as at March 31, 2020: ` 668 million) for sales of finished goods of pursuant to long term arrangements entered between the Company and a third party and the said third party and Trafigura Group.
Notes:
(i) Rosneft Group and Trafigura Group under their respective contracts with the Group has the right to make the first offer for both sale of raw material and purchase of finished products. Where the transaction with the above parties is executed without calling for comparative quotations, the same are done based on the Group’s internal assessment. Where quotations are called for and the Group is able to get a better offer, these two parties reserve the right to match the offer, in which case the Group is obliged to transact with them. For supplies of finished products made against advance payments, premium / discounts to the market price index are pre-negotiated based on similar process. Where the Group participates in the tenders floated by these parties for purchasing raw material, price to be quoted are determined on a case to case basis based on Group’s internal assessment and are approved by the management of the Group.
(ii) Rosneft Group and Trafigura Group have been advising the Group on regular basis and providing insight into the market dynamics which helps in strategizing the crude procurement and sale of finished products. In consideration for the same, the Group is paying a fee of US $ 0.1 for every barrel of raw materials purchased and finished products exported.
(iii) During the year ended March 31, 2021, the Group terminated its aforementioned contract with a Rosneft Group entity. Further, the said Rosneft Group entity has unilaterally assigned some of its receivables from the Group under the said contract to and in favour of two other Rosneft Group entities, which is subject to regulatory approvals. Subsequent to such assignment, one of the assignees has discontinued to be a related party of the Group, and therefore, the amount payable to such assignee as on the balance sheet date amounting to ` 22,384 million is excluded from the above disclosures.
(iv) Terms of receivables / payables:
A. Trade receivables are unsecured, non-interest bearing collected within 30 days from the date of sale.
B. Trade payables are non-interest bearing and are settled within 30 days of purchase.
C. Advance from customers also include interest bearing advances, which are settled through supply of goods over a period of 1 to 5 years at pre-determined mechanism of the consideration.
Notes to consolidated financial statements (Contd.)
For the year ended March 31, 2021
47 Detail of Subsidiaries and Composition of Group Following subsidiaries have been considered in the preparation of consolidated financial statements.
Sr. No.
Name of Subsidiaries
Principal activities Relation Country of Incorporation
Proportion of ownership Interest (%)
As at March 31, 2021
As at March 31, 2020
1 Vadinar Oil Terminal Limited (VOTL) (refer note a)
Handling and storage of crude oil and petroleum products
Subsidiary India NA 97.63%
2 Nayara Energy Singapore Pte. Limited (refer note b)
It is engaged in trading and allied activities in the oil and commodities sector
Subsidiary Singapore 100.00% NA
3 Coviva Energy Terminals Limited (CETL)
Engaged in development of marine liquid terminal facilities
Subsidiary India 100.00% 100.00%
4 Enneagon Limited, Mauritius (refer note c)
It was engaged in the buying and selling of petroleum and coal products.
Subsidiary Mauritius NA NA
5 Nayara Energy Global Limited (NEGL) (refer note d)
It is engaged in investment holding activities and trading in commodities. There have been no operations in this company till date.
Subsidiary Mauritius 100.00% 100.00%
Notes:
a) Pursuant to a scheme of arrangement approved on December 14, 2020 Vadinar Oil Terminal Limited have merged with the Company during the year, as described in note 42.
b) Unaudited financial statements have been considered for consolidation.
c) Enneagon Limited, Mauritius has been dissolved during the financial year 2019-20.
d) The sole shareholder of Nayara Energy Global Limited (i.e. Nayara Energy Limited) has passed a resolution on April 30 2020 for voluntary liquidation of NEGL, which is in progress, accordingly the Group has not considered books of Nayara Energy Global Limited in consolidated financials statements.
210 211
CORPORATE OVERVIEW BOARD’S REPORT FINANCIAL STATEMENTSANNUAL REPORT 2020-21NAYARA ENERGY LIMITED
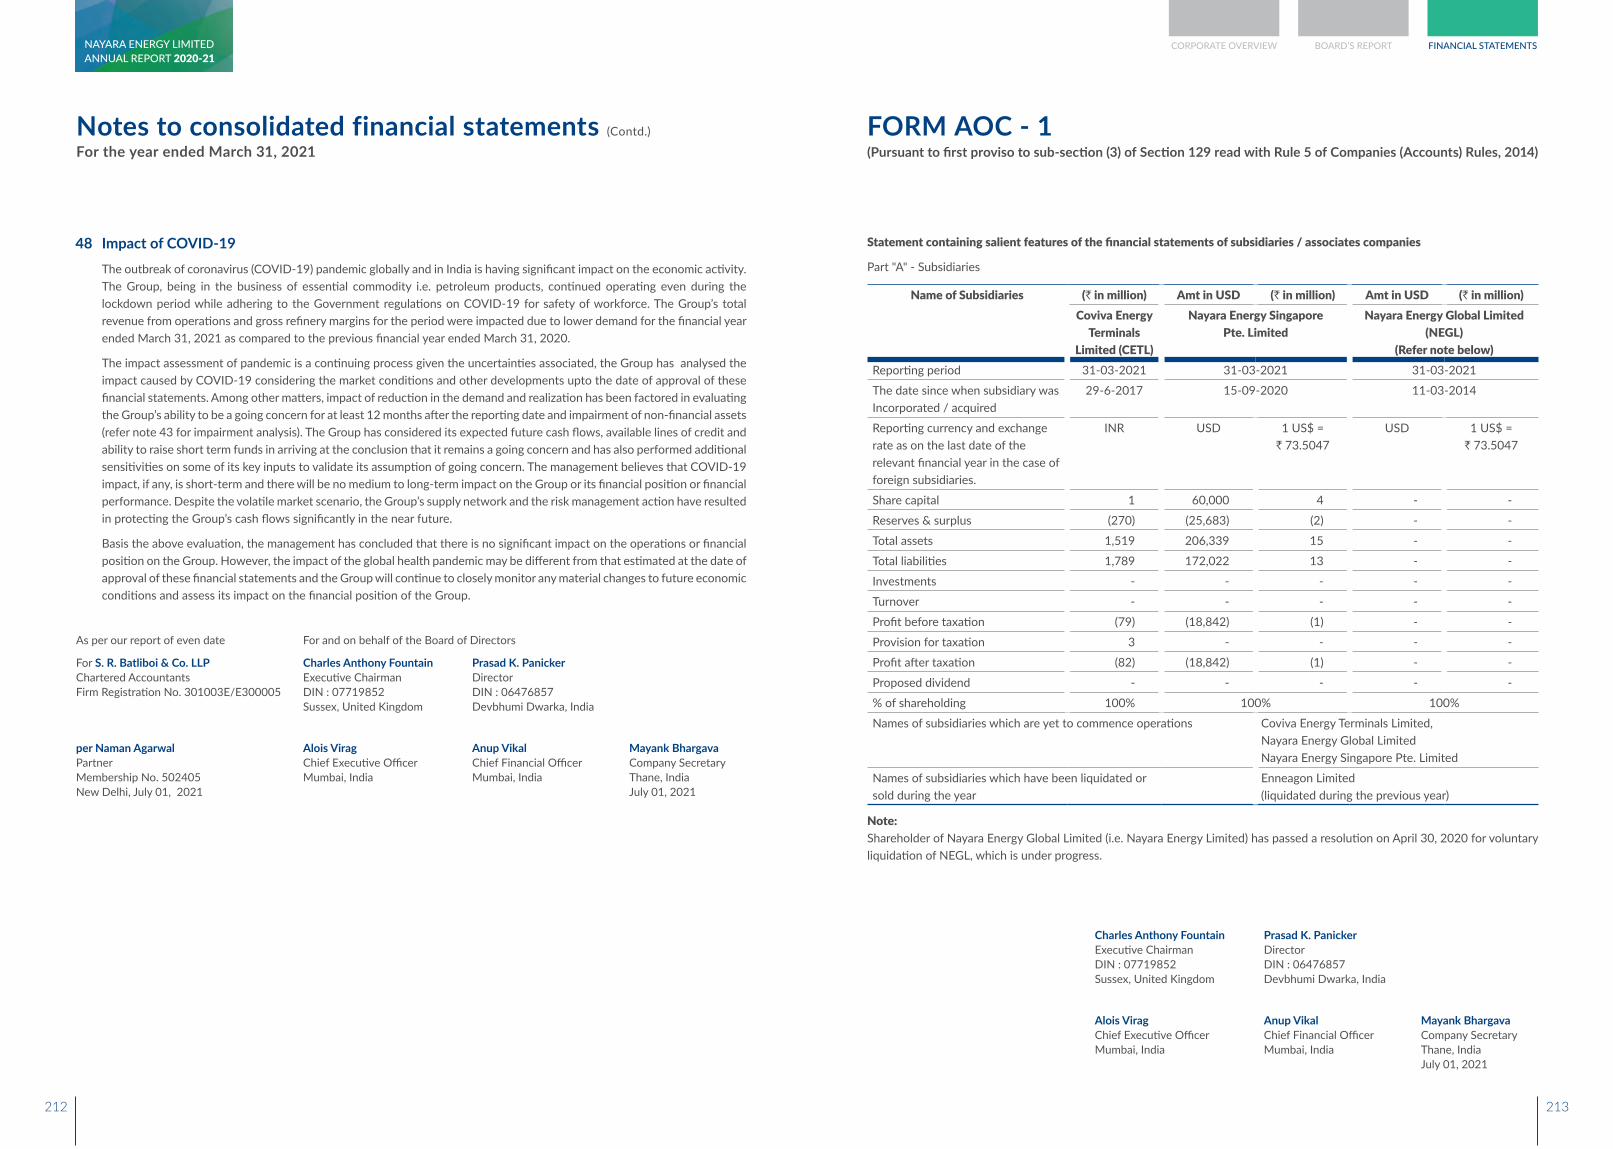
Notes to consolidated financial statements (Contd.)
For the year ended March 31, 2021
48 Impact of COVID-19 The outbreak of coronavirus (COVID-19) pandemic globally and in India is having significant impact on the economic activity.
The Group, being in the business of essential commodity i.e. petroleum products, continued operating even during the lockdown period while adhering to the Government regulations on COVID-19 for safety of workforce. The Group’s total revenue from operations and gross refinery margins for the period were impacted due to lower demand for the financial year ended March 31, 2021 as compared to the previous financial year ended March 31, 2020.
The impact assessment of pandemic is a continuing process given the uncertainties associated, the Group has analysed the impact caused by COVID-19 considering the market conditions and other developments upto the date of approval of these financial statements. Among other matters, impact of reduction in the demand and realization has been factored in evaluating the Group’s ability to be a going concern for at least 12 months after the reporting date and impairment of non-financial assets (refer note 43 for impairment analysis). The Group has considered its expected future cash flows, available lines of credit and ability to raise short term funds in arriving at the conclusion that it remains a going concern and has also performed additional sensitivities on some of its key inputs to validate its assumption of going concern. The management believes that COVID-19 impact, if any, is short-term and there will be no medium to long-term impact on the Group or its financial position or financial performance. Despite the volatile market scenario, the Group’s supply network and the risk management action have resulted in protecting the Group’s cash flows significantly in the near future.
Basis the above evaluation, the management has concluded that there is no significant impact on the operations or financial position on the Group. However, the impact of the global health pandemic may be different from that estimated at the date of approval of these financial statements and the Group will continue to closely monitor any material changes to future economic conditions and assess its impact on the financial position of the Group.
As per our report of even date For and on behalf of the Board of Directors
For S. R. Batliboi & Co. LLP Chartered Accountants Firm Registration No. 301003E/E300005
Charles Anthony FountainExecutive ChairmanDIN : 07719852Sussex, United Kingdom
Prasad K. PanickerDirectorDIN : 06476857Devbhumi Dwarka, India
per Naman Agarwal Partner Membership No. 502405 New Delhi, July 01, 2021
Alois Virag Chief Executive OfficerMumbai, India
Anup Vikal Chief Financial OfficerMumbai, India
Mayank Bhargava Company Secretary Thane, India July 01, 2021
FORM AOC - 1(Pursuant to first proviso to sub-section (3) of Section 129 read with Rule 5 of Companies (Accounts) Rules, 2014)
Statement containing salient features of the financial statements of subsidiaries / associates companies
Part "A" - Subsidiaries
Name of Subsidiaries (` in million) Amt in USD (` in million) Amt in USD (` in million)Coviva Energy
Terminals Limited (CETL)
Nayara Energy Singapore Pte. Limited
Nayara Energy Global Limited (NEGL)
(Refer note below)Reporting period 31-03-2021 31-03-2021 31-03-2021
The date since when subsidiary was Incorporated / acquired
29-6-2017 15-09-2020 11-03-2014
Reporting currency and exchange rate as on the last date of the relevant financial year in the case of foreign subsidiaries.
INR USD 1 US$ = ` 73.5047
USD 1 US$ = ` 73.5047
Share capital 1 60,000 4 - -
Reserves & surplus (270) (25,683) (2) - -
Total assets 1,519 206,339 15 - -
Total liabilities 1,789 172,022 13 - -
Investments - - - - -
Turnover - - - - -
Profit before taxation (79) (18,842) (1) - -
Provision for taxation 3 - - - -
Profit after taxation (82) (18,842) (1) - -
Proposed dividend - - - - -
% of shareholding 100% 100% 100%
Names of subsidiaries which are yet to commence operations Coviva Energy Terminals Limited, Nayara Energy Global Limited Nayara Energy Singapore Pte. Limited
Names of subsidiaries which have been liquidated or sold during the year
Enneagon Limited (liquidated during the previous year)
Note:Shareholder of Nayara Energy Global Limited (i.e. Nayara Energy Limited) has passed a resolution on April 30, 2020 for voluntary liquidation of NEGL, which is under progress.
Charles Anthony FountainExecutive ChairmanDIN : 07719852Sussex, United Kingdom
Prasad K. PanickerDirectorDIN : 06476857Devbhumi Dwarka, India
Alois Virag Chief Executive OfficerMumbai, India
Anup Vikal Chief Financial OfficerMumbai, India
Mayank Bhargava Company Secretary Thane, India July 01, 2021
212 213
CORPORATE OVERVIEW BOARD’S REPORT FINANCIAL STATEMENTSANNUAL REPORT 2020-21NAYARA ENERGY LIMITED
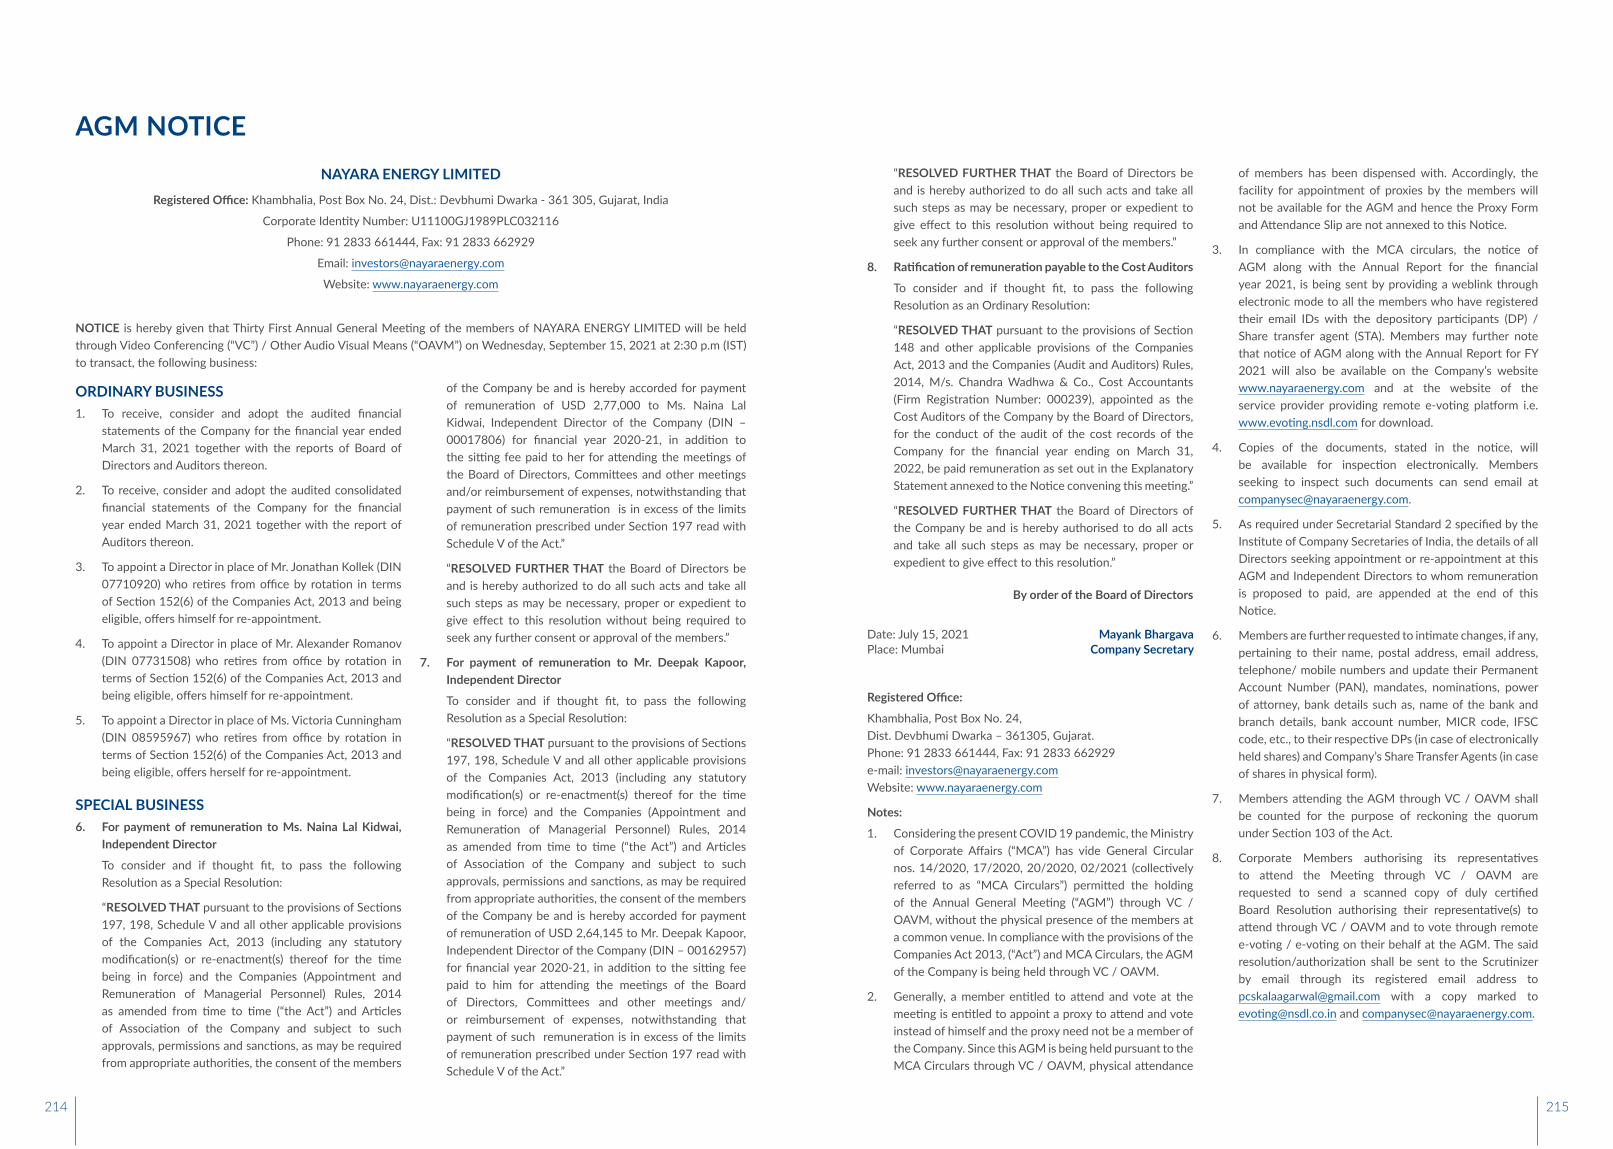
AGM NOTICENAYARA ENERGY LIMITED
Registered Office: Khambhalia, Post Box No. 24, Dist.: Devbhumi Dwarka - 361 305, Gujarat, India
Corporate Identity Number: U11100GJ1989PLC032116
Phone: 91 2833 661444, Fax: 91 2833 662929
Email: [email protected]
Website: www.nayaraenergy.com
NOTICE is hereby given that Thirty First Annual General Meeting of the members of NAYARA ENERGY LIMITED will be held through Video Conferencing (“VC”) / Other Audio Visual Means (“OAVM”) on Wednesday, September 15, 2021 at 2:30 p.m (IST) to transact, the following business:
of the Company be and is hereby accorded for payment of remuneration of USD 2,77,000 to Ms. Naina Lal Kidwai, Independent Director of the Company (DIN – 00017806) for financial year 2020-21, in addition to the sitting fee paid to her for attending the meetings of the Board of Directors, Committees and other meetings and/or reimbursement of expenses, notwithstanding that payment of such remuneration is in excess of the limits of remuneration prescribed under Section 197 read with Schedule V of the Act.”
“RESOLVED FURTHER THAT the Board of Directors be and is hereby authorized to do all such acts and take all such steps as may be necessary, proper or expedient to give effect to this resolution without being required to seek any further consent or approval of the members.”
7. For payment of remuneration to Mr. Deepak Kapoor, Independent Director
To consider and if thought fit, to pass the following Resolution as a Special Resolution:
“RESOLVED THAT pursuant to the provisions of Sections 197, 198, Schedule V and all other applicable provisions of the Companies Act, 2013 (including any statutory modification(s) or re-enactment(s) thereof for the time being in force) and the Companies (Appointment and Remuneration of Managerial Personnel) Rules, 2014 as amended from time to time (“the Act”) and Articles of Association of the Company and subject to such approvals, permissions and sanctions, as may be required from appropriate authorities, the consent of the members of the Company be and is hereby accorded for payment of remuneration of USD 2,64,145 to Mr. Deepak Kapoor, Independent Director of the Company (DIN – 00162957) for financial year 2020-21, in addition to the sitting fee paid to him for attending the meetings of the Board of Directors, Committees and other meetings and/or reimbursement of expenses, notwithstanding that payment of such remuneration is in excess of the limits of remuneration prescribed under Section 197 read with Schedule V of the Act.”
“RESOLVED FURTHER THAT the Board of Directors be and is hereby authorized to do all such acts and take all such steps as may be necessary, proper or expedient to give effect to this resolution without being required to seek any further consent or approval of the members.”
8. Ratification of remuneration payable to the Cost Auditors
To consider and if thought fit, to pass the following Resolution as an Ordinary Resolution:
“RESOLVED THAT pursuant to the provisions of Section 148 and other applicable provisions of the Companies Act, 2013 and the Companies (Audit and Auditors) Rules, 2014, M/s. Chandra Wadhwa & Co., Cost Accountants (Firm Registration Number: 000239), appointed as the Cost Auditors of the Company by the Board of Directors, for the conduct of the audit of the cost records of the Company for the financial year ending on March 31, 2022, be paid remuneration as set out in the Explanatory Statement annexed to the Notice convening this meeting.”
“RESOLVED FURTHER THAT the Board of Directors of the Company be and is hereby authorised to do all acts and take all such steps as may be necessary, proper or expedient to give effect to this resolution.”
By order of the Board of Directors
Date: July 15, 2021 Mayank BhargavaPlace: Mumbai Company Secretary
Registered Office:
Khambhalia, Post Box No. 24,Dist. Devbhumi Dwarka – 361305, Gujarat.Phone: 91 2833 661444, Fax: 91 2833 662929e-mail: [email protected]: www.nayaraenergy.com
Notes:
1. Considering the present COVID 19 pandemic, the Ministry of Corporate Affairs (“MCA”) has vide General Circular nos. 14/2020, 17/2020, 20/2020, 02/2021 (collectively referred to as “MCA Circulars”) permitted the holding of the Annual General Meeting (“AGM”) through VC / OAVM, without the physical presence of the members at a common venue. In compliance with the provisions of the Companies Act 2013, (“Act”) and MCA Circulars, the AGM of the Company is being held through VC / OAVM.
2. Generally, a member entitled to attend and vote at the meeting is entitled to appoint a proxy to attend and vote instead of himself and the proxy need not be a member of the Company. Since this AGM is being held pursuant to the MCA Circulars through VC / OAVM, physical attendance
of members has been dispensed with. Accordingly, the facility for appointment of proxies by the members will not be available for the AGM and hence the Proxy Form and Attendance Slip are not annexed to this Notice.
3. In compliance with the MCA circulars, the notice of AGM along with the Annual Report for the financial year 2021, is being sent by providing a weblink through electronic mode to all the members who have registered their email IDs with the depository participants (DP) / Share transfer agent (STA). Members may further note that notice of AGM along with the Annual Report for FY 2021 will also be available on the Company’s website www.nayaraenergy.com and at the website of the service provider providing remote e-voting platform i.e. www.evoting.nsdl.com for download.
4. Copies of the documents, stated in the notice, will be available for inspection electronically. Members seeking to inspect such documents can send email at [email protected].
5. As required under Secretarial Standard 2 specified by the Institute of Company Secretaries of India, the details of all Directors seeking appointment or re-appointment at this AGM and Independent Directors to whom remuneration is proposed to paid, are appended at the end of this Notice.
6. Members are further requested to intimate changes, if any, pertaining to their name, postal address, email address, telephone/ mobile numbers and update their Permanent Account Number (PAN), mandates, nominations, power of attorney, bank details such as, name of the bank and branch details, bank account number, MICR code, IFSC code, etc., to their respective DPs (in case of electronically held shares) and Company’s Share Transfer Agents (in case of shares in physical form).
7. Members attending the AGM through VC / OAVM shall be counted for the purpose of reckoning the quorum under Section 103 of the Act.
8. Corporate Members authorising its representatives to attend the Meeting through VC / OAVM are requested to send a scanned copy of duly certified Board Resolution authorising their representative(s) to attend through VC / OAVM and to vote through remote e-voting / e-voting on their behalf at the AGM. The said resolution/authorization shall be sent to the Scrutinizer by email through its registered email address to [email protected] with a copy marked to [email protected] and [email protected].
ORDINARY BUSINESS1. To receive, consider and adopt the audited financial
statements of the Company for the financial year ended March 31, 2021 together with the reports of Board of Directors and Auditors thereon.
2. To receive, consider and adopt the audited consolidated financial statements of the Company for the financial year ended March 31, 2021 together with the report of Auditors thereon.
3. To appoint a Director in place of Mr. Jonathan Kollek (DIN 07710920) who retires from office by rotation in terms of Section 152(6) of the Companies Act, 2013 and being eligible, offers himself for re-appointment.
4. To appoint a Director in place of Mr. Alexander Romanov (DIN 07731508) who retires from office by rotation in terms of Section 152(6) of the Companies Act, 2013 and being eligible, offers himself for re-appointment.
5. To appoint a Director in place of Ms. Victoria Cunningham (DIN 08595967) who retires from office by rotation in terms of Section 152(6) of the Companies Act, 2013 and being eligible, offers herself for re-appointment.
SPECIAL BUSINESS6. For payment of remuneration to Ms. Naina Lal Kidwai,
Independent Director
To consider and if thought fit, to pass the following Resolution as a Special Resolution:
“RESOLVED THAT pursuant to the provisions of Sections 197, 198, Schedule V and all other applicable provisions of the Companies Act, 2013 (including any statutory modification(s) or re-enactment(s) thereof for the time being in force) and the Companies (Appointment and Remuneration of Managerial Personnel) Rules, 2014 as amended from time to time (“the Act”) and Articles of Association of the Company and subject to such approvals, permissions and sanctions, as may be required from appropriate authorities, the consent of the members
214 215
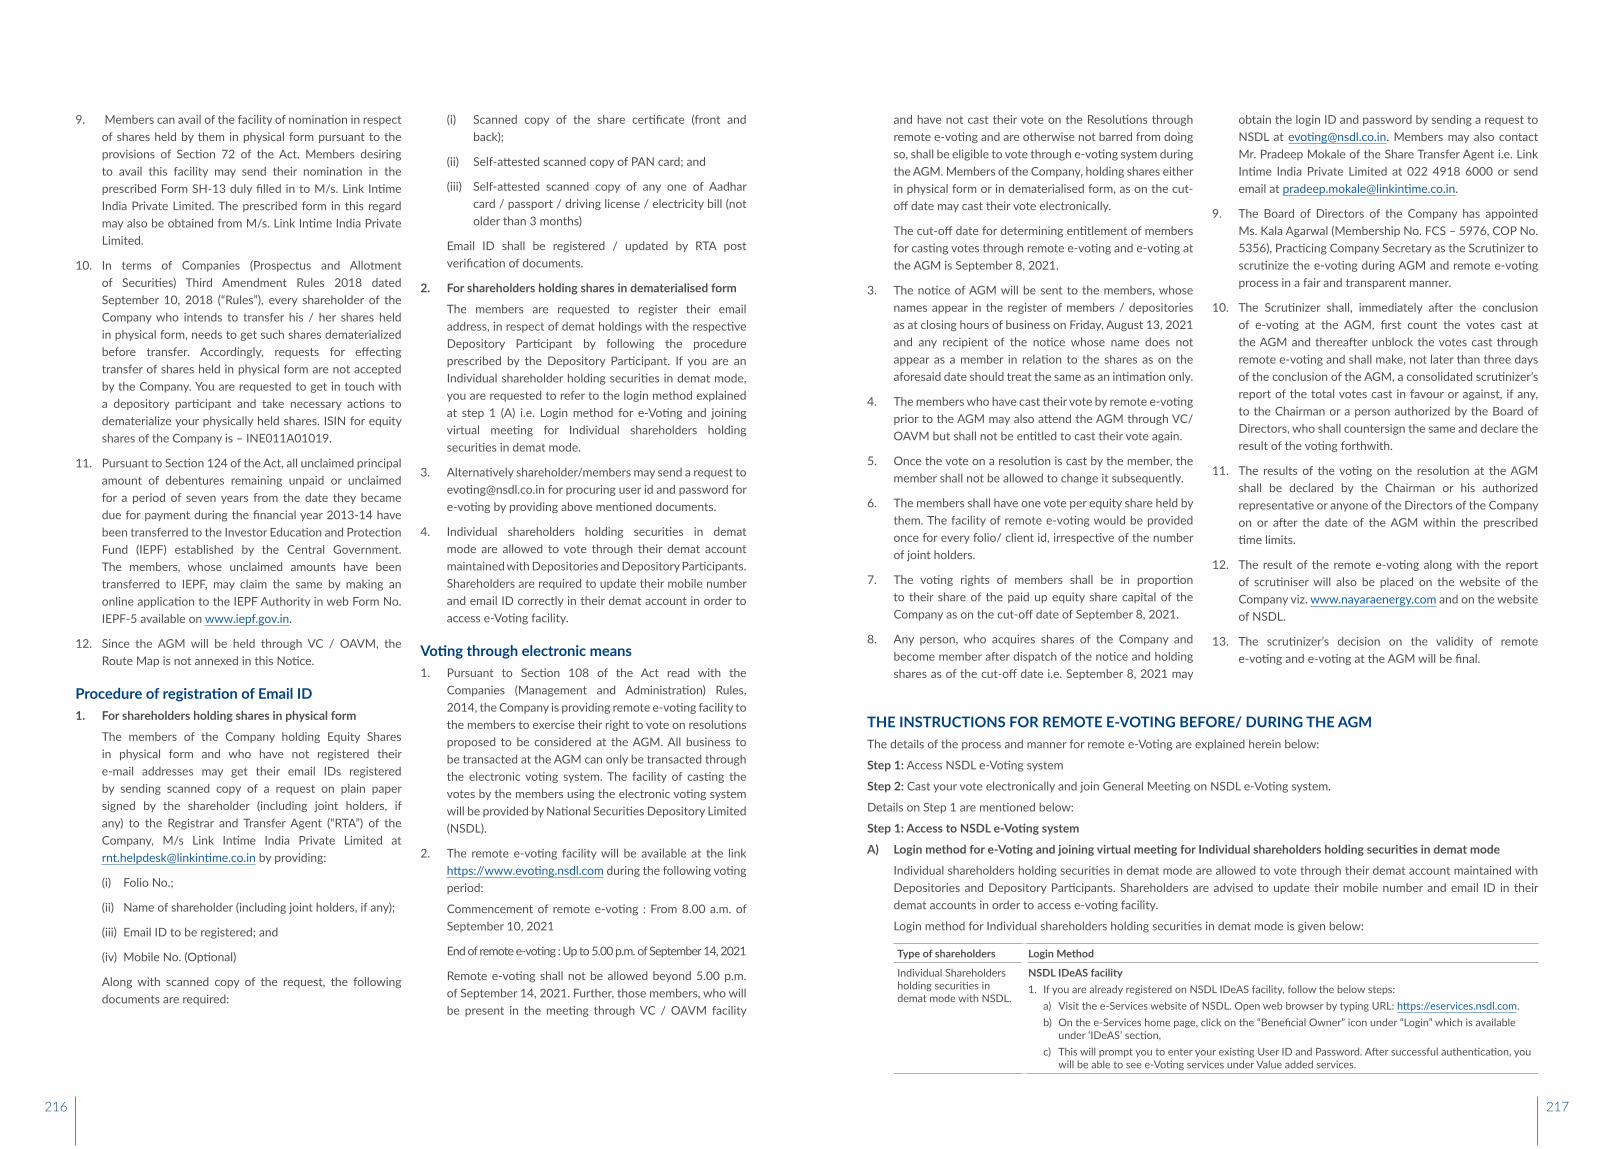
9. Members can avail of the facility of nomination in respect of shares held by them in physical form pursuant to the provisions of Section 72 of the Act. Members desiring to avail this facility may send their nomination in the prescribed Form SH-13 duly filled in to M/s. Link Intime India Private Limited. The prescribed form in this regard may also be obtained from M/s. Link Intime India Private Limited.
10. In terms of Companies (Prospectus and Allotment of Securities) Third Amendment Rules 2018 dated September 10, 2018 (“Rules”), every shareholder of the Company who intends to transfer his / her shares held in physical form, needs to get such shares dematerialized before transfer. Accordingly, requests for effecting transfer of shares held in physical form are not accepted by the Company. You are requested to get in touch with a depository participant and take necessary actions to dematerialize your physically held shares. ISIN for equity shares of the Company is – INE011A01019.
11. Pursuant to Section 124 of the Act, all unclaimed principal amount of debentures remaining unpaid or unclaimed for a period of seven years from the date they became due for payment during the financial year 2013-14 have been transferred to the Investor Education and Protection Fund (IEPF) established by the Central Government. The members, whose unclaimed amounts have been transferred to IEPF, may claim the same by making an online application to the IEPF Authority in web Form No. IEPF-5 available on www.iepf.gov.in.
12. Since the AGM will be held through VC / OAVM, the Route Map is not annexed in this Notice.
Procedure of registration of Email ID1. For shareholders holding shares in physical form
The members of the Company holding Equity Shares in physical form and who have not registered their e-mail addresses may get their email IDs registered by sending scanned copy of a request on plain paper signed by the shareholder (including joint holders, if any) to the Registrar and Transfer Agent (“RTA”) of the Company, M/s Link Intime India Private Limited at [email protected] by providing:
(i) Folio No.;
(ii) Name of shareholder (including joint holders, if any);
(iii) Email ID to be registered; and
(iv) Mobile No. (Optional)
Along with scanned copy of the request, the following documents are required:
(i) Scanned copy of the share certificate (front and back);
(ii) Self-attested scanned copy of PAN card; and
(iii) Self-attested scanned copy of any one of Aadhar card / passport / driving license / electricity bill (not older than 3 months)
Email ID shall be registered / updated by RTA post verification of documents.
2. For shareholders holding shares in dematerialised form
The members are requested to register their email address, in respect of demat holdings with the respective Depository Participant by following the procedure prescribed by the Depository Participant. If you are an Individual shareholder holding securities in demat mode, you are requested to refer to the login method explained at step 1 (A) i.e. Login method for e-Voting and joining virtual meeting for Individual shareholders holding securities in demat mode.
3. Alternatively shareholder/members may send a request to [email protected] for procuring user id and password for e-voting by providing above mentioned documents.
4. Individual shareholders holding securities in demat mode are allowed to vote through their demat account maintained with Depositories and Depository Participants. Shareholders are required to update their mobile number and email ID correctly in their demat account in order to access e-Voting facility.
Voting through electronic means1. Pursuant to Section 108 of the Act read with the
Companies (Management and Administration) Rules, 2014, the Company is providing remote e-voting facility to the members to exercise their right to vote on resolutions proposed to be considered at the AGM. All business to be transacted at the AGM can only be transacted through the electronic voting system. The facility of casting the votes by the members using the electronic voting system will be provided by National Securities Depository Limited (NSDL).
2. The remote e-voting facility will be available at the link https://www.evoting.nsdl.com during the following voting period:
Commencement of remote e-voting : From 8.00 a.m. of September 10, 2021
End of remote e-voting : Up to 5.00 p.m. of September 14, 2021
Remote e-voting shall not be allowed beyond 5.00 p.m. of September 14, 2021. Further, those members, who will be present in the meeting through VC / OAVM facility
and have not cast their vote on the Resolutions through remote e-voting and are otherwise not barred from doing so, shall be eligible to vote through e-voting system during the AGM. Members of the Company, holding shares either in physical form or in dematerialised form, as on the cut-off date may cast their vote electronically.
The cut-off date for determining entitlement of members for casting votes through remote e-voting and e-voting at the AGM is September 8, 2021.
3. The notice of AGM will be sent to the members, whose names appear in the register of members / depositories as at closing hours of business on Friday, August 13, 2021 and any recipient of the notice whose name does not appear as a member in relation to the shares as on the aforesaid date should treat the same as an intimation only.
4. The members who have cast their vote by remote e-voting prior to the AGM may also attend the AGM through VC/OAVM but shall not be entitled to cast their vote again.
5. Once the vote on a resolution is cast by the member, the member shall not be allowed to change it subsequently.
6. The members shall have one vote per equity share held by them. The facility of remote e-voting would be provided once for every folio/ client id, irrespective of the number of joint holders.
7. The voting rights of members shall be in proportion to their share of the paid up equity share capital of the Company as on the cut-off date of September 8, 2021.
8. Any person, who acquires shares of the Company and become member after dispatch of the notice and holding shares as of the cut-off date i.e. September 8, 2021 may
obtain the login ID and password by sending a request to NSDL at [email protected]. Members may also contact Mr. Pradeep Mokale of the Share Transfer Agent i.e. Link Intime India Private Limited at 022 4918 6000 or send email at [email protected].
9. The Board of Directors of the Company has appointed Ms. Kala Agarwal (Membership No. FCS – 5976, COP No. 5356), Practicing Company Secretary as the Scrutinizer to scrutinize the e-voting during AGM and remote e-voting process in a fair and transparent manner.
10. The Scrutinizer shall, immediately after the conclusion of e-voting at the AGM, first count the votes cast at the AGM and thereafter unblock the votes cast through remote e-voting and shall make, not later than three days of the conclusion of the AGM, a consolidated scrutinizer’s report of the total votes cast in favour or against, if any, to the Chairman or a person authorized by the Board of Directors, who shall countersign the same and declare the result of the voting forthwith.
11. The results of the voting on the resolution at the AGM shall be declared by the Chairman or his authorized representative or anyone of the Directors of the Company on or after the date of the AGM within the prescribed time limits.
12. The result of the remote e-voting along with the report of scrutiniser will also be placed on the website of the Company viz. www.nayaraenergy.com and on the website of NSDL.
13. The scrutinizer’s decision on the validity of remote e-voting and e-voting at the AGM will be final.
THE INSTRUCTIONS FOR REMOTE E-VOTING BEFORE/ DURING THE AGMThe details of the process and manner for remote e-Voting are explained herein below:
Step 1: Access NSDL e-Voting system
Step 2: Cast your vote electronically and join General Meeting on NSDL e-Voting system.
Details on Step 1 are mentioned below:
Step 1: Access to NSDL e-Voting system
A) Login method for e-Voting and joining virtual meeting for Individual shareholders holding securities in demat mode
Individual shareholders holding securities in demat mode are allowed to vote through their demat account maintained with Depositories and Depository Participants. Shareholders are advised to update their mobile number and email ID in their demat accounts in order to access e-voting facility.
Login method for Individual shareholders holding securities in demat mode is given below:
Type of shareholders Login Method
Individual Shareholders holding securities in demat mode with NSDL.
NSDL IDeAS facility1. If you are already registered on NSDL IDeAS facility, follow the below steps:
a) Visit the e-Services website of NSDL. Open web browser by typing URL: https://eservices.nsdl.com. b) On the e-Services home page, click on the “Beneficial Owner” icon under “Login” which is available
under ‘IDeAS’ section, c) This will prompt you to enter your existing User ID and Password. After successful authentication, you
will be able to see e-Voting services under Value added services.
216 217
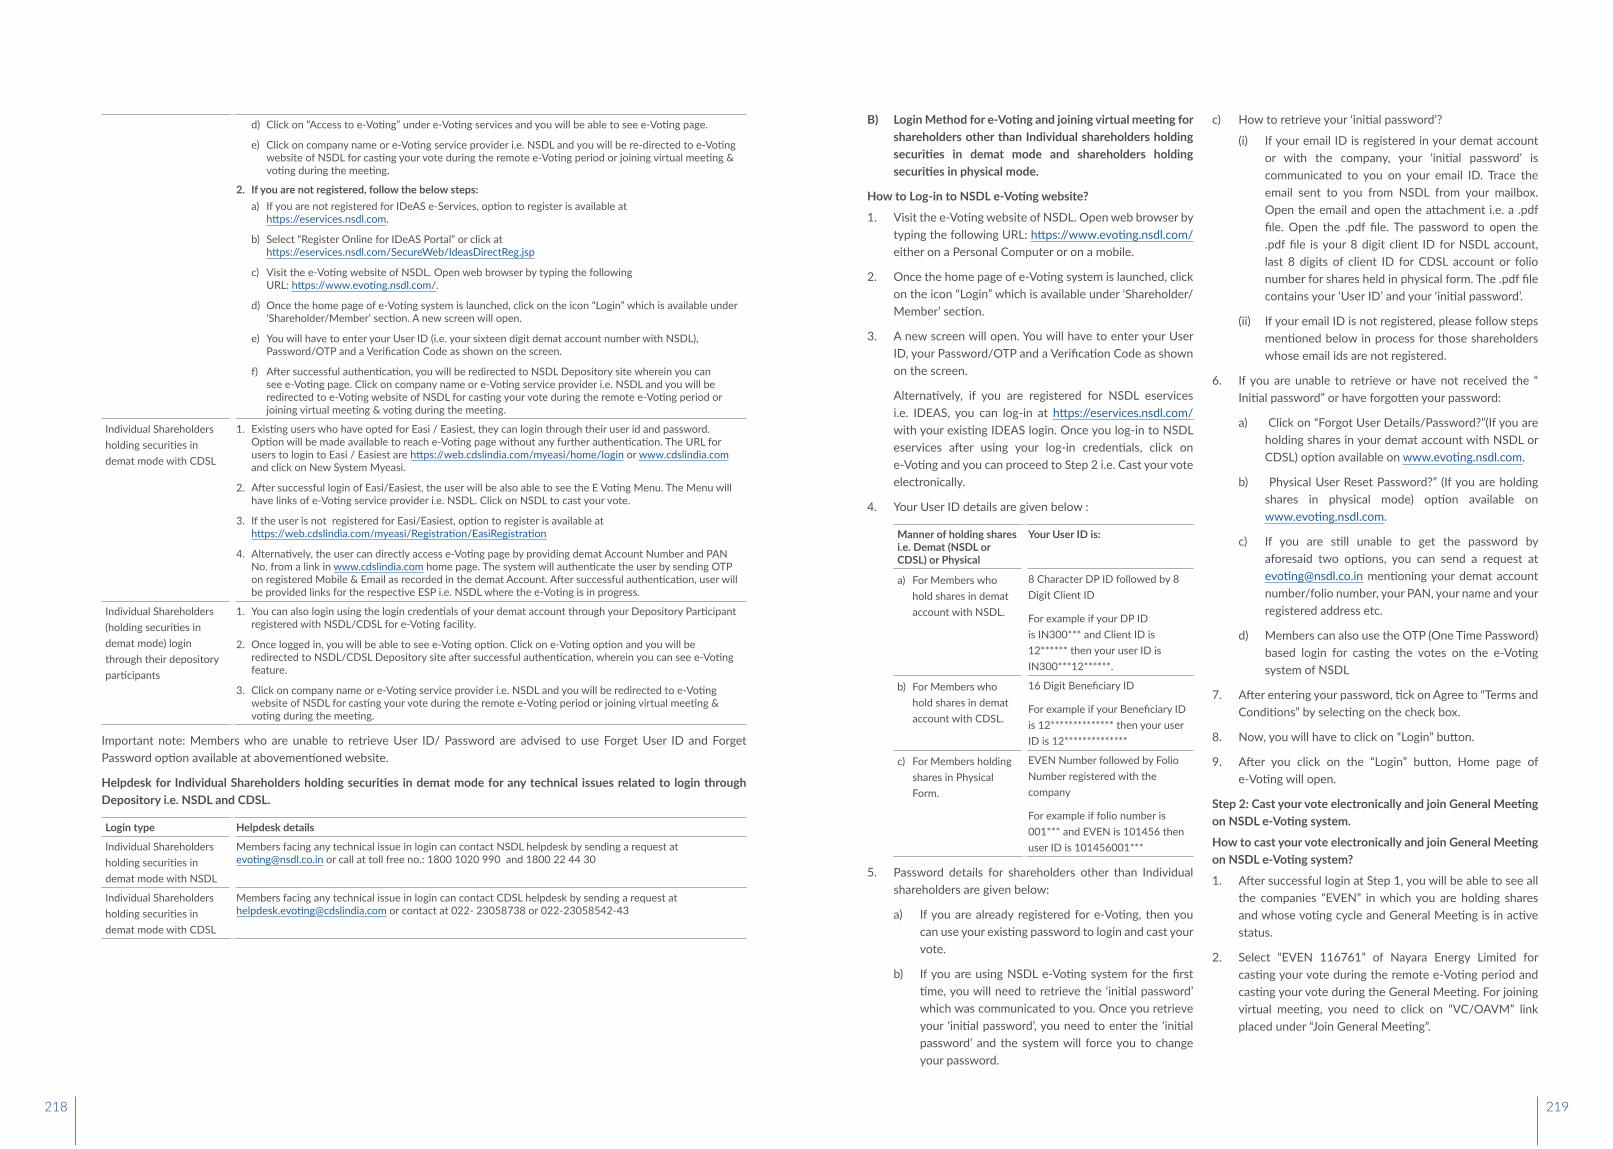
d) Click on “Access to e-Voting” under e-Voting services and you will be able to see e-Voting page.
e) Click on company name or e-Voting service provider i.e. NSDL and you will be re-directed to e-Voting website of NSDL for casting your vote during the remote e-Voting period or joining virtual meeting & voting during the meeting.
2. If you are not registered, follow the below steps:a) If you are not registered for IDeAS e-Services, option to register is available at
https://eservices.nsdl.com.
b) Select “Register Online for IDeAS Portal” or click at https://eservices.nsdl.com/SecureWeb/IdeasDirectReg.jsp
c) Visit the e-Voting website of NSDL. Open web browser by typing the following URL: https://www.evoting.nsdl.com/.
d) Once the home page of e-Voting system is launched, click on the icon “Login” which is available under ‘Shareholder/Member’ section. A new screen will open.
e) You will have to enter your User ID (i.e. your sixteen digit demat account number with NSDL), Password/OTP and a Verification Code as shown on the screen.
f) After successful authentication, you will be redirected to NSDL Depository site wherein you can see e-Voting page. Click on company name or e-Voting service provider i.e. NSDL and you will be redirected to e-Voting website of NSDL for casting your vote during the remote e-Voting period or joining virtual meeting & voting during the meeting.
Individual Shareholders holding securities in demat mode with CDSL
1. Existing users who have opted for Easi / Easiest, they can login through their user id and password. Option will be made available to reach e-Voting page without any further authentication. The URL for users to login to Easi / Easiest are https://web.cdslindia.com/myeasi/home/login or www.cdslindia.com and click on New System Myeasi.
2. After successful login of Easi/Easiest, the user will be also able to see the E Voting Menu. The Menu will have links of e-Voting service provider i.e. NSDL. Click on NSDL to cast your vote.
3. If the user is not registered for Easi/Easiest, option to register is available at https://web.cdslindia.com/myeasi/Registration/EasiRegistration
4. Alternatively, the user can directly access e-Voting page by providing demat Account Number and PAN No. from a link in www.cdslindia.com home page. The system will authenticate the user by sending OTP on registered Mobile & Email as recorded in the demat Account. After successful authentication, user will be provided links for the respective ESP i.e. NSDL where the e-Voting is in progress.
Individual Shareholders (holding securities in demat mode) login through their depository participants
1. You can also login using the login credentials of your demat account through your Depository Participant registered with NSDL/CDSL for e-Voting facility.
2. Once logged in, you will be able to see e-Voting option. Click on e-Voting option and you will be redirected to NSDL/CDSL Depository site after successful authentication, wherein you can see e-Voting feature.
3. Click on company name or e-Voting service provider i.e. NSDL and you will be redirected to e-Voting website of NSDL for casting your vote during the remote e-Voting period or joining virtual meeting & voting during the meeting.
Important note: Members who are unable to retrieve User ID/ Password are advised to use Forget User ID and Forget Password option available at abovementioned website.
Helpdesk for Individual Shareholders holding securities in demat mode for any technical issues related to login through Depository i.e. NSDL and CDSL.
Login type Helpdesk details
Individual Shareholders holding securities in demat mode with NSDL
Members facing any technical issue in login can contact NSDL helpdesk by sending a request at [email protected] or call at toll free no.: 1800 1020 990 and 1800 22 44 30
Individual Shareholders holding securities in demat mode with CDSL
Members facing any technical issue in login can contact CDSL helpdesk by sending a request at [email protected] or contact at 022- 23058738 or 022-23058542-43
B) Login Method for e-Voting and joining virtual meeting for shareholders other than Individual shareholders holding securities in demat mode and shareholders holding securities in physical mode.
How to Log-in to NSDL e-Voting website?
1. Visit the e-Voting website of NSDL. Open web browser by typing the following URL: https://www.evoting.nsdl.com/ either on a Personal Computer or on a mobile.
2. Once the home page of e-Voting system is launched, click on the icon “Login” which is available under ‘Shareholder/Member’ section.
3. A new screen will open. You will have to enter your User ID, your Password/OTP and a Verification Code as shown on the screen.
Alternatively, if you are registered for NSDL eservices i.e. IDEAS, you can log-in at https://eservices.nsdl.com/ with your existing IDEAS login. Once you log-in to NSDL eservices after using your log-in credentials, click on e-Voting and you can proceed to Step 2 i.e. Cast your vote electronically.
4. Your User ID details are given below :
Manner of holding shares i.e. Demat (NSDL or CDSL) or Physical
Your User ID is:
a) For Members who hold shares in demat account with NSDL.
8 Character DP ID followed by 8 Digit Client ID
For example if your DP ID is IN300*** and Client ID is 12****** then your user ID is IN300***12******.
b) For Members who hold shares in demat account with CDSL.
16 Digit Beneficiary ID
For example if your Beneficiary ID is 12************** then your user ID is 12**************
c) For Members holding shares in Physical Form.
EVEN Number followed by Folio Number registered with the company
For example if folio number is 001*** and EVEN is 101456 then user ID is 101456001***
5. Password details for shareholders other than Individual shareholders are given below:
a) If you are already registered for e-Voting, then you can use your existing password to login and cast your vote.
b) If you are using NSDL e-Voting system for the first time, you will need to retrieve the ‘initial password’ which was communicated to you. Once you retrieve your ‘initial password’, you need to enter the ‘initial password’ and the system will force you to change your password.
c) How to retrieve your ‘initial password’?
(i) If your email ID is registered in your demat account or with the company, your ‘initial password’ is communicated to you on your email ID. Trace the email sent to you from NSDL from your mailbox. Open the email and open the attachment i.e. a .pdf file. Open the .pdf file. The password to open the .pdf file is your 8 digit client ID for NSDL account, last 8 digits of client ID for CDSL account or folio number for shares held in physical form. The .pdf file contains your ‘User ID’ and your ‘initial password’.
(ii) If your email ID is not registered, please follow steps mentioned below in process for those shareholders whose email ids are not registered.
6. If you are unable to retrieve or have not received the “ Initial password” or have forgotten your password:
a) Click on “Forgot User Details/Password?”(If you are holding shares in your demat account with NSDL or CDSL) option available on www.evoting.nsdl.com.
b) Physical User Reset Password?” (If you are holding shares in physical mode) option available on www.evoting.nsdl.com.
c) If you are still unable to get the password by aforesaid two options, you can send a request at [email protected] mentioning your demat account number/folio number, your PAN, your name and your registered address etc.
d) Members can also use the OTP (One Time Password) based login for casting the votes on the e-Voting system of NSDL
7. After entering your password, tick on Agree to “Terms and Conditions” by selecting on the check box.
8. Now, you will have to click on “Login” button.
9. After you click on the “Login” button, Home page of e-Voting will open.
Step 2: Cast your vote electronically and join General Meeting on NSDL e-Voting system.
How to cast your vote electronically and join General Meeting on NSDL e-Voting system?
1. After successful login at Step 1, you will be able to see all the companies “EVEN” in which you are holding shares and whose voting cycle and General Meeting is in active status.
2. Select “EVEN 116761” of Nayara Energy Limited for casting your vote during the remote e-Voting period and casting your vote during the General Meeting. For joining virtual meeting, you need to click on “VC/OAVM” link placed under “Join General Meeting”.
218 219
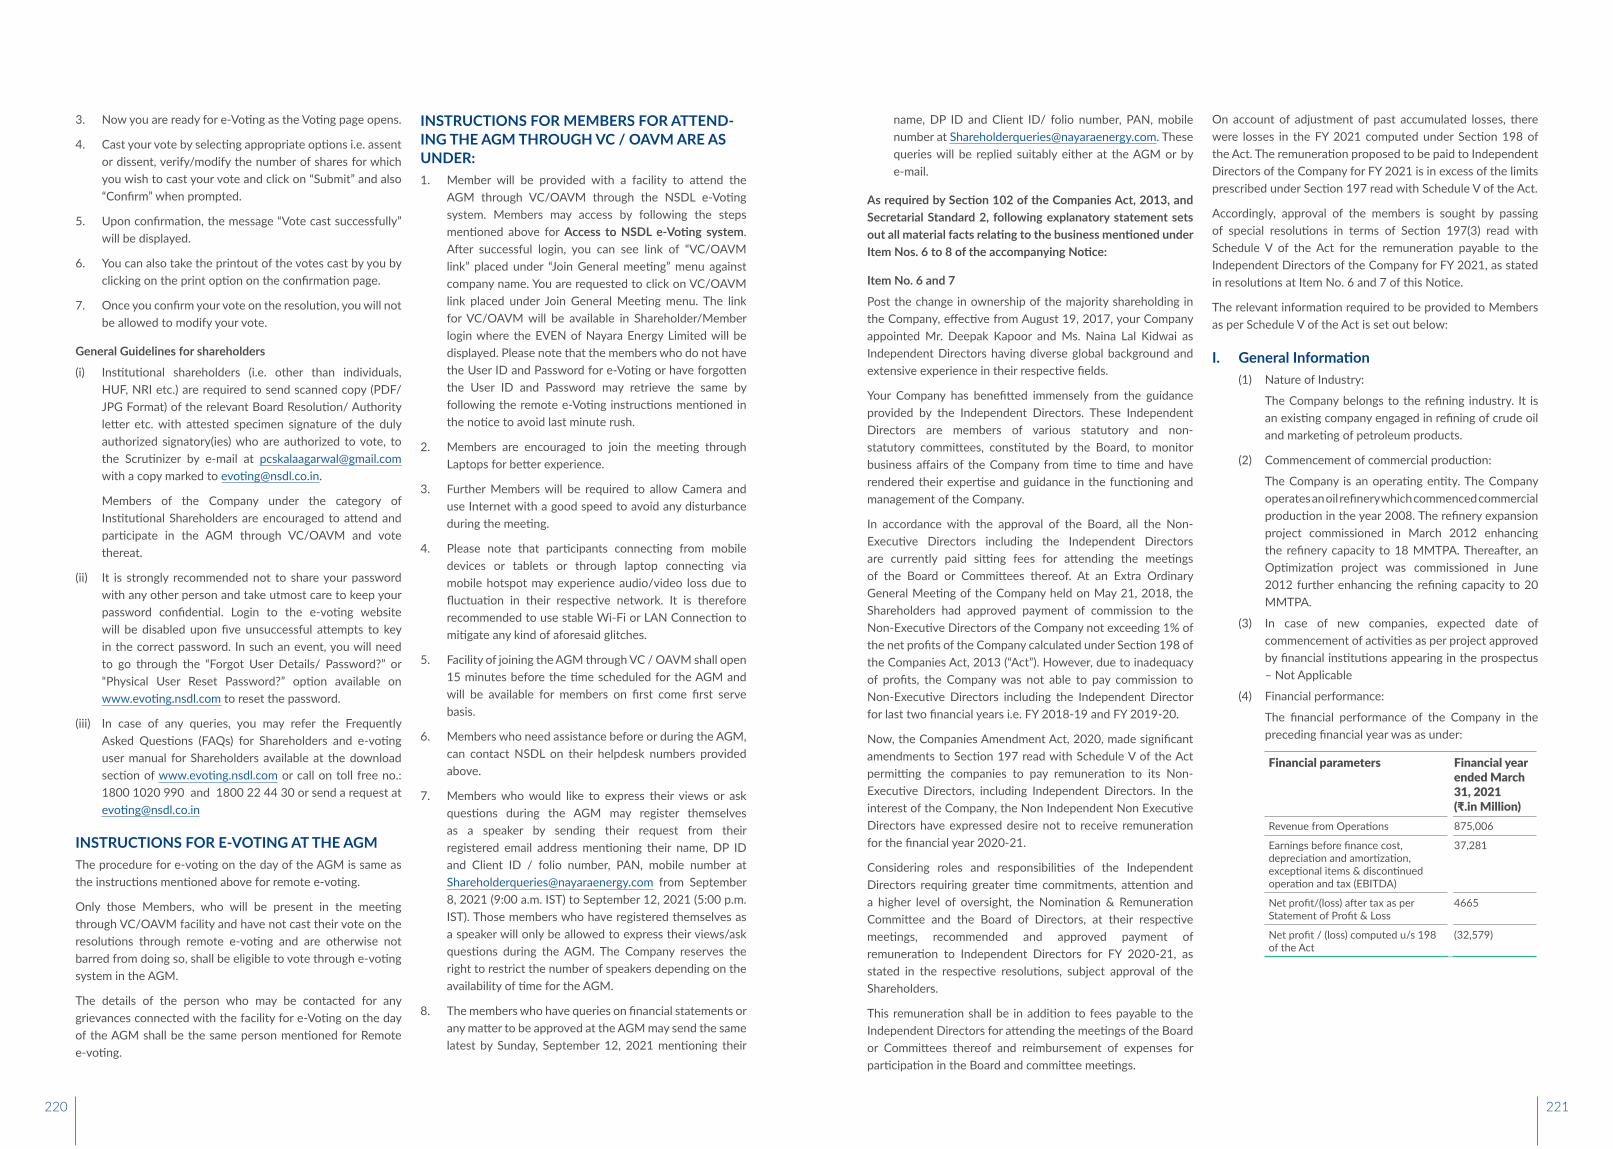
3. Now you are ready for e-Voting as the Voting page opens.
4. Cast your vote by selecting appropriate options i.e. assent or dissent, verify/modify the number of shares for which you wish to cast your vote and click on “Submit” and also “Confirm” when prompted.
5. Upon confirmation, the message “Vote cast successfully” will be displayed.
6. You can also take the printout of the votes cast by you by clicking on the print option on the confirmation page.
7. Once you confirm your vote on the resolution, you will not be allowed to modify your vote.
General Guidelines for shareholders
(i) Institutional shareholders (i.e. other than individuals, HUF, NRI etc.) are required to send scanned copy (PDF/ JPG Format) of the relevant Board Resolution/ Authority letter etc. with attested specimen signature of the duly authorized signatory(ies) who are authorized to vote, to the Scrutinizer by e-mail at [email protected] with a copy marked to [email protected].
Members of the Company under the category of Institutional Shareholders are encouraged to attend and participate in the AGM through VC/OAVM and vote thereat.
(ii) It is strongly recommended not to share your password with any other person and take utmost care to keep your password confidential. Login to the e-voting website will be disabled upon five unsuccessful attempts to key in the correct password. In such an event, you will need to go through the “Forgot User Details/ Password?” or “Physical User Reset Password?” option available on www.evoting.nsdl.com to reset the password.
(iii) In case of any queries, you may refer the Frequently Asked Questions (FAQs) for Shareholders and e-voting user manual for Shareholders available at the download section of www.evoting.nsdl.com or call on toll free no.: 1800 1020 990 and 1800 22 44 30 or send a request at [email protected]
INSTRUCTIONS FOR E-VOTING AT THE AGMThe procedure for e-voting on the day of the AGM is same as the instructions mentioned above for remote e-voting.
Only those Members, who will be present in the meeting through VC/OAVM facility and have not cast their vote on the resolutions through remote e-voting and are otherwise not barred from doing so, shall be eligible to vote through e-voting system in the AGM.
The details of the person who may be contacted for any grievances connected with the facility for e-Voting on the day of the AGM shall be the same person mentioned for Remote e-voting.
INSTRUCTIONS FOR MEMBERS FOR ATTEND-ING THE AGM THROUGH VC / OAVM ARE AS UNDER:1. Member will be provided with a facility to attend the
AGM through VC/OAVM through the NSDL e-Voting system. Members may access by following the steps mentioned above for Access to NSDL e-Voting system. After successful login, you can see link of “VC/OAVM link” placed under “Join General meeting” menu against company name. You are requested to click on VC/OAVM link placed under Join General Meeting menu. The link for VC/OAVM will be available in Shareholder/Member login where the EVEN of Nayara Energy Limited will be displayed. Please note that the members who do not have the User ID and Password for e-Voting or have forgotten the User ID and Password may retrieve the same by following the remote e-Voting instructions mentioned in the notice to avoid last minute rush.
2. Members are encouraged to join the meeting through Laptops for better experience.
3. Further Members will be required to allow Camera and use Internet with a good speed to avoid any disturbance during the meeting.
4. Please note that participants connecting from mobile devices or tablets or through laptop connecting via mobile hotspot may experience audio/video loss due to fluctuation in their respective network. It is therefore recommended to use stable Wi-Fi or LAN Connection to mitigate any kind of aforesaid glitches.
5. Facility of joining the AGM through VC / OAVM shall open 15 minutes before the time scheduled for the AGM and will be available for members on first come first serve basis.
6. Members who need assistance before or during the AGM, can contact NSDL on their helpdesk numbers provided above.
7. Members who would like to express their views or ask questions during the AGM may register themselves as a speaker by sending their request from their registered email address mentioning their name, DP ID and Client ID / folio number, PAN, mobile number at [email protected] from September 8, 2021 (9:00 a.m. IST) to September 12, 2021 (5:00 p.m. IST). Those members who have registered themselves as a speaker will only be allowed to express their views/ask questions during the AGM. The Company reserves the right to restrict the number of speakers depending on the availability of time for the AGM.
8. The members who have queries on financial statements or any matter to be approved at the AGM may send the same latest by Sunday, September 12, 2021 mentioning their
name, DP ID and Client ID/ folio number, PAN, mobile number at [email protected]. These queries will be replied suitably either at the AGM or by e-mail.
As required by Section 102 of the Companies Act, 2013, and Secretarial Standard 2, following explanatory statement sets out all material facts relating to the business mentioned under Item Nos. 6 to 8 of the accompanying Notice:
Item No. 6 and 7
Post the change in ownership of the majority shareholding in the Company, effective from August 19, 2017, your Company appointed Mr. Deepak Kapoor and Ms. Naina Lal Kidwai as Independent Directors having diverse global background and extensive experience in their respective fields.
Your Company has benefitted immensely from the guidance provided by the Independent Directors. These Independent Directors are members of various statutory and non-statutory committees, constituted by the Board, to monitor business affairs of the Company from time to time and have rendered their expertise and guidance in the functioning and management of the Company.
In accordance with the approval of the Board, all the Non-Executive Directors including the Independent Directors are currently paid sitting fees for attending the meetings of the Board or Committees thereof. At an Extra Ordinary General Meeting of the Company held on May 21, 2018, the Shareholders had approved payment of commission to the Non-Executive Directors of the Company not exceeding 1% of the net profits of the Company calculated under Section 198 of the Companies Act, 2013 (“Act”). However, due to inadequacy of profits, the Company was not able to pay commission to Non-Executive Directors including the Independent Director for last two financial years i.e. FY 2018-19 and FY 2019-20.
Now, the Companies Amendment Act, 2020, made significant amendments to Section 197 read with Schedule V of the Act permitting the companies to pay remuneration to its Non-Executive Directors, including Independent Directors. In the interest of the Company, the Non Independent Non Executive Directors have expressed desire not to receive remuneration for the financial year 2020-21.
Considering roles and responsibilities of the Independent Directors requiring greater time commitments, attention and a higher level of oversight, the Nomination & Remuneration Committee and the Board of Directors, at their respective meetings, recommended and approved payment of remuneration to Independent Directors for FY 2020-21, as stated in the respective resolutions, subject approval of the Shareholders.
This remuneration shall be in addition to fees payable to the Independent Directors for attending the meetings of the Board or Committees thereof and reimbursement of expenses for participation in the Board and committee meetings.
On account of adjustment of past accumulated losses, there were losses in the FY 2021 computed under Section 198 of the Act. The remuneration proposed to be paid to Independent Directors of the Company for FY 2021 is in excess of the limits prescribed under Section 197 read with Schedule V of the Act.
Accordingly, approval of the members is sought by passing of special resolutions in terms of Section 197(3) read with Schedule V of the Act for the remuneration payable to the Independent Directors of the Company for FY 2021, as stated in resolutions at Item No. 6 and 7 of this Notice.
The relevant information required to be provided to Members as per Schedule V of the Act is set out below:
I. General Information(1) Nature of Industry:
The Company belongs to the refining industry. It is an existing company engaged in refining of crude oil and marketing of petroleum products.
(2) Commencement of commercial production:
The Company is an operating entity. The Company operates an oil refinery which commenced commercial production in the year 2008. The refinery expansion project commissioned in March 2012 enhancing the refinery capacity to 18 MMTPA. Thereafter, an Optimization project was commissioned in June 2012 further enhancing the refining capacity to 20 MMTPA.
(3) In case of new companies, expected date of commencement of activities as per project approved by financial institutions appearing in the prospectus – Not Applicable
(4) Financial performance:
The financial performance of the Company in the preceding financial year was as under:
Financial parameters Financial year ended March 31, 2021 (₹.in Million)
Revenue from Operations 875,006
Earnings before finance cost, depreciation and amortization, exceptional items & discontinued operation and tax (EBITDA)
37,281
Net profit/(loss) after tax as per Statement of Profit & Loss
4665
Net profit / (loss) computed u/s 198 of the Act
(32,579)
220 221
(5) Foreign investments and collaborations, if any:
Prior to August 18, 2017, Essar Energy Holdings Ltd., erstwhile foreign promoter company along with a Promoter group entity were holding 98.26% stake in the Company in the form of Equity Shares and Global Depository Shares. On August 18, 2017, in accordance with two separate Share Purchase Agreements, both dated October 15, 2016, the entire stake held by Essar Energy Holdings Ltd and its associates was acquired by two Shareholders namely, Rosneft Singapore Pte Limited, Singapore (subsidiary of PJSC Rosneft Oil Company, Russia) taking 49.13% stake and Kesani Enterprises Company Limited, Cyprus (a consortium led by Trafigura Pte Limited and UCP PE Investments Limited) acquiring another 49.13% stake in share capital of the Company.
II. Information about Independent Director entitled to remuneration1. Background details, Past remuneration, Recognition
or awards and Job profile and their suitability etc.
A) Naina Lal Kidwai
Ms. Naina Lal Kidwai, aged 64 years old and holds a Bachelor of Arts degree in Economics (Honours) from Lady Shri Ram College, Delhi. She also holds a degree in Masters in Business Administration from Harvard Business School.
Ms. Naina Lal Kidwai has rich experience in the Financial Services sector. She has been closely associated with large fund managers, MNCs and Indian corporates. She has worked with PwC, ANZ Grindlays Bank PLC (Standard Chartered Bank), Morgan Stanley & HSBC She has overseen mergers and acquisitions of numerous entities.
During FY 2021, Ms. Naina Lal Kidwai received sitting fees of Rs.24,00,000 from Nayara Energy Limited for attending meeting of the Board and committees of which she is a member. Ms. Naina Lal Kidwai also received a commission of Rs.2,00,00,000 in capacity of Independent Director of Vadinar Oil Terminal Limited, erstwhile subsidiary of the Company which is now merged with the Company.
B) Deepak Kapoor
Mr. Deepak Kapoor aged 62 years, is a meritorious commerce graduate from Delhi University (third rank holder). Mr. Kapoor is a Fellow Member of Institute of Chartered Accountants of India, Fellow Member of Institute of Company Secretaries of India and a member of Institute of Certified Fraud Examiners, USA.
Mr. Deepak Kapoor, former Chairman of PwC India, was associated with PwC for over 30 years and worked as its partner since 1991 and as its Managing Director from 2007 to 2016. As member of PwC’s India Leadership Team, he handled various leadership roles, leading deals and working in the Telecom, Entertainment and Media domain. Mr. Kapoor has extensive experience in Audit as well as Business advisory function.
During FY 2021, Mr. Deepak Kapoor received sitting fees of Rs.20,00,000 from Nayara Energy Limited for attending meeting of the Board and committees of which he is a member. Mr. Deepak Kapoor also received a commission of Rs.1,80,00,000 in capacity of Independent Director of Vadinar Oil Terminal Limited, erstwhile subsidiary of the Company which is now merged with the Company.
2. Remuneration proposed to be paid:
It is proposed to pay remuneration to Independent Directors, as stated at Item No. 6 and 7 of this Notice, for FY 2021.
The remuneration shall be paid in Indian Rupees represented by the value in United States Dollars to Independent Directors at exchange rate prevailing on the date of payment of the remuneration.
On account of loss or inadequacy of profits in FY 2021, in accordance with the provisions of Section 198 of the Act, approval of the members is sought for payment of remuneration, to Independent Directors, as stated in the respective resolutions, by passing of these special resolutions under Section 197(3) read with Schedule V of the Act. In the opinion of the Board, the remuneration proposed to be paid to the Independent Directors is comparable with the remuneration being paid for similar assignments in the industry.
We confirm that both the Independent Directors:
a) have been associated with the Company in professional capacity and do not have any interest in the capital of the Company or any of its subsidiaries directly or indirectly or through any other statutory structures;
b) do not have any direct or indirect interest or not been related to any of the Directors of the Company or any of its subsidiaries at any time during the last two years before or on or after the date of their respective appointments. Post their appointment on the Board of Nayara Energy Limited, Mr. Deepak
Kapoor and Ms. Naina Lal Kidwai were appointed as Independent Directors on the Board of Vadinar Oil Terminal Limited (erstwhile subsidiary of the Company which is now merged with the Company w.e.f. December 14, 2020 pursuant to the order passed by the Hon’ble National Company Law Tribunal) w.e.f. August 5, 2019 till December 14, 2020;
c) possesses post graduate level qualification with expertise and specialized knowledge in the field in which the Company operates;
d) do not have any direct or indirect pecuniary relationship with the Company or the managerial personnel other than getting remuneration from the Company;
e) not related to any Director or any other key managerial personnel of the Company;
III. Other information(1) Reasons for inadequacy of profit, if any:
The Company earned profits of ₹4,665 million as per the statement of profit and loss for the FY 2021. However, on account of adjustment of past accumulated losses, as necessitated by the amendments introduced by the Companies (Amendment) Act, 2017 notified on September 12, 2018, there was inadequacy of profits computed under section 198 of the Act, as a consequence of which the remuneration paid to the managerial personnel together with the remuneration proposed to be paid to Independent Directors in the financial year ended March 31, 2021 exceeded the limits prescribed under Section 197 read with Schedule V of the Act.
(2) Steps taken or proposed to be taken for improvement and expected increase in productivity and profits in measurable terms:
As stated above, the Company generated EBITDA and PAT of ₹37,281 million and ₹4,665 million, respectively, in the FY 2021. There was inadequacy of profits as computed under Section 198 of the Act on account of past accumulated losses which were incurred prior to change in control and change in Board of Directors of the Company.
The Company has taken continuous steps in the past to optimise the costs and to enhance the operational efficiency and productivity that maximise the profits. These steps have resulted in improving the Company’s profitability in the past and which shall continue to be carried in the future. The Company’s strategy towards product security and supply chain stability including increasing the supplies through
own network of retail outlets, complemented by an effective risk management system to cover risks related to commodity and currency, along with sustained and safe refinery operations are the factors that enable the Company to achieve robust results.
The operations of the Company in FY 2021 were satisfactory with the plant working above industry standards above 85% capacity despite COVID-19 pandemic induced restrictions in movements impacting reduction on offtake of petroleum products in the country. The Company is expanding its country-wide chain of franchisee operated retail outlets and as of March 31, 2021 has over 6,000 operational retail outlets which enhance the supply chain stability and enable the Company to improve its profitability. During the FY 2021, the Company has also merged its subsidiary, Vadinar Oil Terminal Limited with itself to have synergies of operations, which is primarily designed to optimise the operations and thereupon the cost. Your Company is also considering various expansion opportunities which are in primary stage as of now.
A combination of the above would help in reducing operating costs and improvement in the performance of the Company in coming years. The Company has not committed any default in repayment of any of its debts (including public deposits) or debentures or interest payable thereon in the FY 2021.
The aforesaid Independent Directors are deemed to be concerned or interested in the respective resolution for payment of remuneration to them. Except for this, none of the Directors or key managerial personnel of the Company or their relatives are in any way, concerned or interested, financially or otherwise, in the resolutions set out at Item No. 6 and 7 of the Notice.
The Board of Directors is of the opinion that the payment of remuneration to the aforesaid Independent Directors for FY 2021 would be in the interest of the Company.
Accordingly, the Board of Directors recommend the resolutions set forth in Item No. 6 and 7 of the Notice for the approval of the Members of the Company by Special Resolution.
Item No. 8
The Board of Directors, on the recommendation of the Audit Committee, has approved the appointment of M/s. Chandra Wadhwa & Co., Cost Accountants, as Cost Auditors of the Company for the financial year ending on March 31, 2022 and the Cost Audit fees has been fixed at ₹1 million including XBRL filing of cost audit report and excluding out-of-pocket expenses and applicable taxes.
222 223
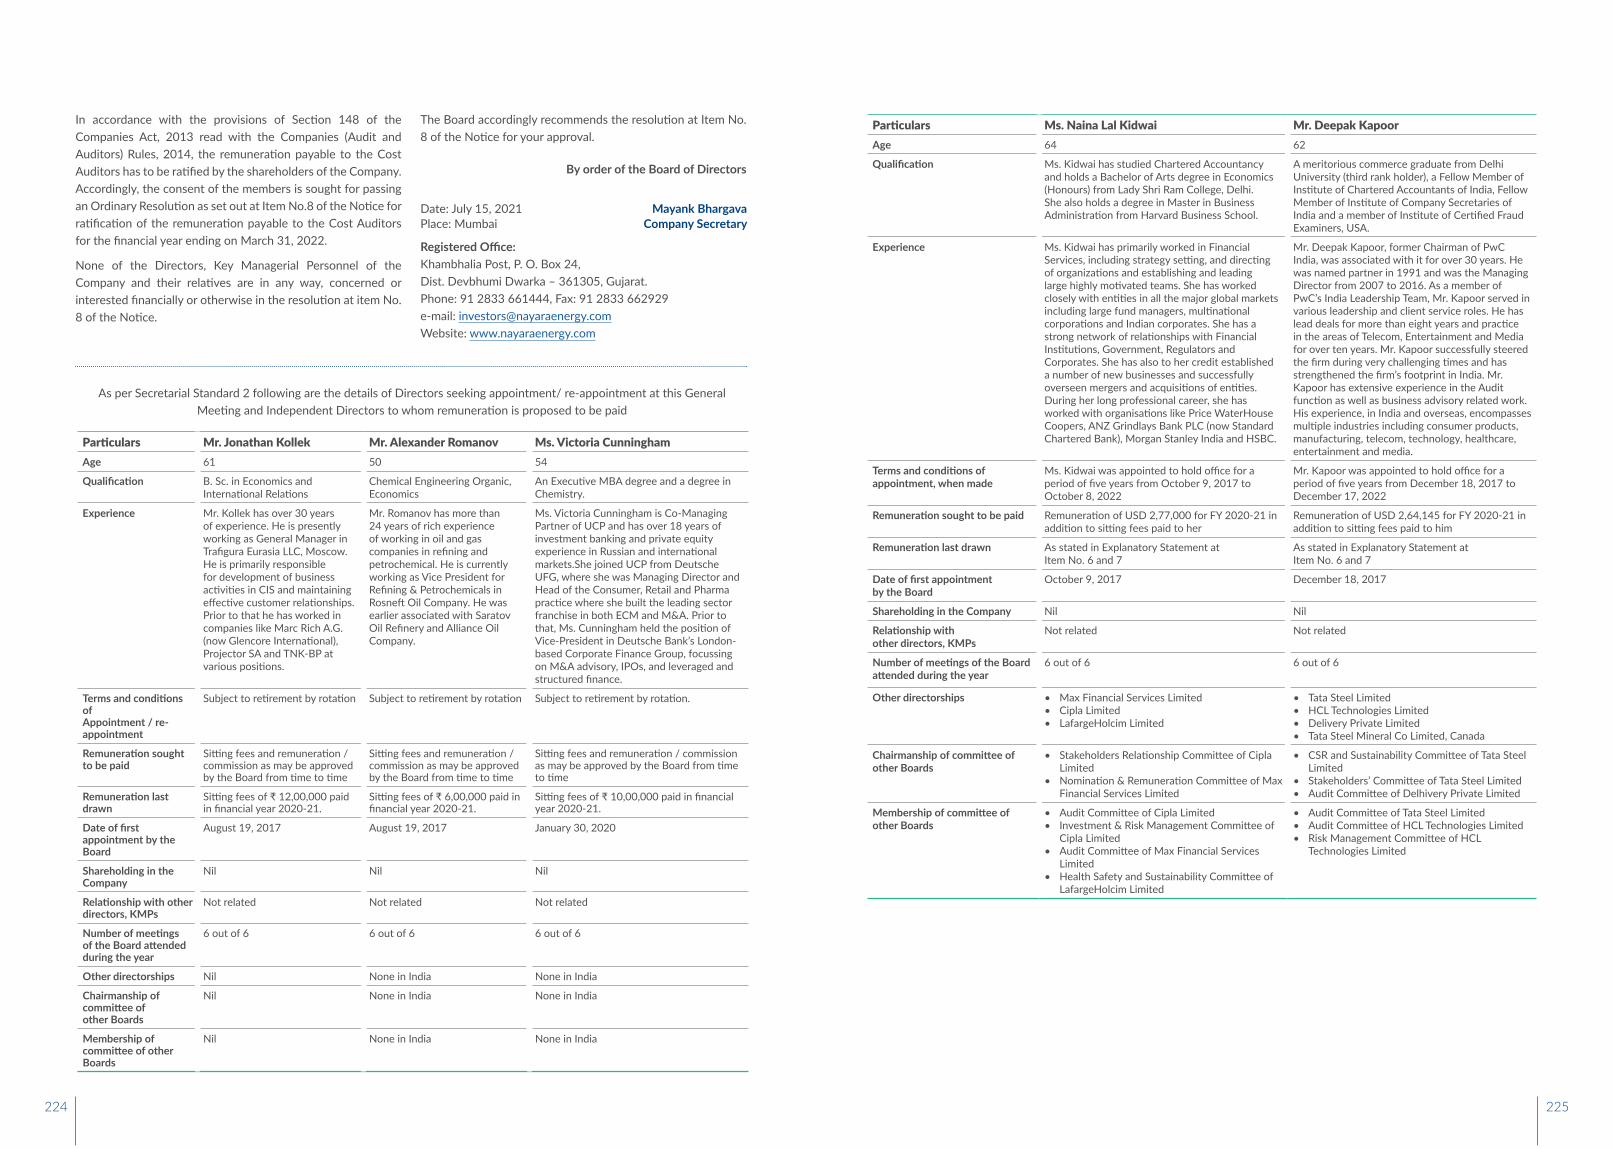
In accordance with the provisions of Section 148 of the Companies Act, 2013 read with the Companies (Audit and Auditors) Rules, 2014, the remuneration payable to the Cost Auditors has to be ratified by the shareholders of the Company. Accordingly, the consent of the members is sought for passing an Ordinary Resolution as set out at Item No.8 of the Notice for ratification of the remuneration payable to the Cost Auditors for the financial year ending on March 31, 2022.
None of the Directors, Key Managerial Personnel of the Company and their relatives are in any way, concerned or interested financially or otherwise in the resolution at item No. 8 of the Notice.
The Board accordingly recommends the resolution at Item No. 8 of the Notice for your approval.
By order of the Board of Directors
Date: July 15, 2021 Mayank BhargavaPlace: Mumbai Company Secretary
Registered Office:Khambhalia Post, P. O. Box 24,Dist. Devbhumi Dwarka – 361305, Gujarat.Phone: 91 2833 661444, Fax: 91 2833 662929e-mail: [email protected] Website: www.nayaraenergy.com
As per Secretarial Standard 2 following are the details of Directors seeking appointment/ re-appointment at this General Meeting and Independent Directors to whom remuneration is proposed to be paid
Particulars Mr. Jonathan Kollek Mr. Alexander Romanov Ms. Victoria CunninghamAge 61 50 54
Qualification B. Sc. in Economics and International Relations
Chemical Engineering Organic, Economics
An Executive MBA degree and a degree in Chemistry.
Experience Mr. Kollek has over 30 years of experience. He is presently working as General Manager in Trafigura Eurasia LLC, Moscow. He is primarily responsible for development of business activities in CIS and maintaining effective customer relationships. Prior to that he has worked in companies like Marc Rich A.G. (now Glencore International), Projector SA and TNK-BP at various positions.
Mr. Romanov has more than 24 years of rich experience of working in oil and gas companies in refining and petrochemical. He is currently working as Vice President for Refining & Petrochemicals in Rosneft Oil Company. He was earlier associated with Saratov Oil Refinery and Alliance Oil Company.
Ms. Victoria Cunningham is Co-Managing Partner of UCP and has over 18 years of investment banking and private equity experience in Russian and international markets.She joined UCP from Deutsche UFG, where she was Managing Director and Head of the Consumer, Retail and Pharma practice where she built the leading sector franchise in both ECM and M&A. Prior to that, Ms. Cunningham held the position of Vice-President in Deutsche Bank’s London-based Corporate Finance Group, focussing on M&A advisory, IPOs, and leveraged and structured finance.
Terms and conditions ofAppointment / re-appointment
Subject to retirement by rotation Subject to retirement by rotation Subject to retirement by rotation.
Remuneration sought to be paid
Sitting fees and remuneration / commission as may be approved by the Board from time to time
Sitting fees and remuneration / commission as may be approved by the Board from time to time
Sitting fees and remuneration / commission as may be approved by the Board from time to time
Remuneration last drawn
Sitting fees of ₹ 12,00,000 paid in financial year 2020-21.
Sitting fees of ₹ 6,00,000 paid in financial year 2020-21.
Sitting fees of ₹ 10,00,000 paid in financial year 2020-21.
Date of first appointment by the Board
August 19, 2017 August 19, 2017 January 30, 2020
Shareholding in the Company
Nil Nil Nil
Relationship with other directors, KMPs
Not related Not related Not related
Number of meetings of the Board attended during the year
6 out of 6 6 out of 6 6 out of 6
Other directorships Nil None in India None in India
Chairmanship of committee ofother Boards
Nil None in India None in India
Membership of committee of other Boards
Nil None in India None in India
Particulars Ms. Naina Lal Kidwai Mr. Deepak KapoorAge 64 62
Qualification Ms. Kidwai has studied Chartered Accountancy and holds a Bachelor of Arts degree in Economics (Honours) from Lady Shri Ram College, Delhi. She also holds a degree in Master in Business Administration from Harvard Business School.
A meritorious commerce graduate from Delhi University (third rank holder), a Fellow Member of Institute of Chartered Accountants of India, Fellow Member of Institute of Company Secretaries of India and a member of Institute of Certified Fraud Examiners, USA.
Experience Ms. Kidwai has primarily worked in Financial Services, including strategy setting, and directing of organizations and establishing and leading large highly motivated teams. She has worked closely with entities in all the major global markets including large fund managers, multinational corporations and Indian corporates. She has a strong network of relationships with Financial Institutions, Government, Regulators and Corporates. She has also to her credit established a number of new businesses and successfully overseen mergers and acquisitions of entities. During her long professional career, she has worked with organisations like Price WaterHouse Coopers, ANZ Grindlays Bank PLC (now Standard Chartered Bank), Morgan Stanley India and HSBC.
Mr. Deepak Kapoor, former Chairman of PwC India, was associated with it for over 30 years. He was named partner in 1991 and was the Managing Director from 2007 to 2016. As a member of PwC’s India Leadership Team, Mr. Kapoor served in various leadership and client service roles. He has lead deals for more than eight years and practice in the areas of Telecom, Entertainment and Media for over ten years. Mr. Kapoor successfully steered the firm during very challenging times and has strengthened the firm’s footprint in India. Mr. Kapoor has extensive experience in the Audit function as well as business advisory related work. His experience, in India and overseas, encompasses multiple industries including consumer products, manufacturing, telecom, technology, healthcare, entertainment and media.
Terms and conditions of appointment, when made
Ms. Kidwai was appointed to hold office for a period of five years from October 9, 2017 to October 8, 2022
Mr. Kapoor was appointed to hold office for a period of five years from December 18, 2017 to December 17, 2022
Remuneration sought to be paid Remuneration of USD 2,77,000 for FY 2020-21 in addition to sitting fees paid to her
Remuneration of USD 2,64,145 for FY 2020-21 in addition to sitting fees paid to him
Remuneration last drawn As stated in Explanatory Statement at Item No. 6 and 7
As stated in Explanatory Statement at Item No. 6 and 7
Date of first appointment by the Board
October 9, 2017 December 18, 2017
Shareholding in the Company Nil Nil
Relationship with other directors, KMPs
Not related Not related
Number of meetings of the Board attended during the year
6 out of 6 6 out of 6
Other directorships • Max Financial Services Limited• Cipla Limited• LafargeHolcim Limited
• Tata Steel Limited• HCL Technologies Limited• Delivery Private Limited• Tata Steel Mineral Co Limited, Canada
Chairmanship of committee of other Boards
• Stakeholders Relationship Committee of Cipla Limited
• Nomination & Remuneration Committee of Max Financial Services Limited
• CSR and Sustainability Committee of Tata Steel Limited
• Stakeholders’ Committee of Tata Steel Limited• Audit Committee of Delhivery Private Limited
Membership of committee of other Boards
• Audit Committee of Cipla Limited• Investment & Risk Management Committee of
Cipla Limited• Audit Committee of Max Financial Services
Limited• Health Safety and Sustainability Committee of
LafargeHolcim Limited
• Audit Committee of Tata Steel Limited• Audit Committee of HCL Technologies Limited• Risk Management Committee of HCL
Technologies Limited
224 225
Corporate Information
This Pag
e is In
tentionally Le
ft Blank
Registered OfficeKhambhalia, Post Box No. 24,
District Devbhumi Dwarka,
Gujarat 361305, India
T +91 2833 661444 I F +91 2833 662929
Email: [email protected]
Website: www.nayaraenergy.com
/Nayara Energy
Corporate Identity NumberU11100GJ1989PLC032116
Equity ISININE011A01019
Statutory Auditors M/s S. R. Batliboi & Co. LLP
Share Transfer AgentsM/s Link Intime India Private Limited,
Unit: Nayara Energy Limited, C-101, 247 Park,
L.B.S. Marg, Vikhroli (West), Mumbai - 400083,
Tel: +91-22-49186000, Fax: +91-22-49186060,
Email: [email protected]
BankersState Bank of India
ICICI Bank Limited
Axis Bank Limited
Union Bank of India
IDFC First Bank
Yes Bank Limited
Central Bank of India
SBM Bank (India) Limited
Federal Bank Limited
CSB Bank Limited
Karnataka Bank
India Infradebt Limited
IDBI Bank
Indusind Bank Limited
J P Morgan
Citi Bank
SMBC Bank
Deutsche Bank
HDFC Bank Limited
India Exim Bank
Corporate Office5th Floor, Jet Airways Godrej BKC, Plot No. C-68,
G-Block, Bandra Kurla Complex, Bandra East,
Mumbai - 400051, Maharashtra, India
T: +91-22-66121800 | F : +91-22-26530264
226 227

ww
w.d
icke
nson
wor
ld.c
om
Related Documents