Friends of the Earth (England, Wales and Northern Ireland) Residual Waste Research June 2007 Status : Final EnviroCentre Craighall Business Park Eagle Street Glasgow G4 9XA t 0141 341 5040 f 0141 341 5045 w www.envirocentre.co.uk e [email protected] Offices Glasgow Belfast Stonehaven Daresbury Proposal No : 40139p Copy No : 1 Rev. No : 01

Welcome message from author
This document is posted to help you gain knowledge. Please leave a comment to let me know what you think about it! Share it to your friends and learn new things together.
Transcript

Friends of the Earth(England, Wales andNorthern Ireland)
Residual Waste Research
June 2007
Status : Final
EnviroCentreCraighall Business Park
Eagle Street
Glasgow
G4 9XA
t 0141 341 5040f 0141 341 5045
w www.envirocentre.co.uk e [email protected]
Offices
Glasgow
Belfast
Stonehaven
Daresbury
Proposal No : 40139pCopy No : 1Rev. No : 01


Friends of the EarthResidual Waste Research June 2007
EXECUTIVE SUMMARY
The UK consumes more than its fair share of the world's resources, creating environmental and
social problems across the world, particularly in developing countries. Many of these resources
are literally wasted through the mainly linear process of material use in our economies.
Materials are extracted, used or further processed into products where they are used and then
disposed of to landfill and incinerators. There is a clear need to improve UK and EU resource
efficiency and reduce climate impacts, through promoting waste prevention, reuse, recycling
and composting and by phasing out residual waste.
England and the three devolved administrations now have separate waste strategies, all of
which have a stated objective of reducing the amount of residual waste going to disposal. The
Waste Strategy for England 2007 also commits the government to setting targets for local
government on residual waste, that which is not reused, recycled or composted.
Even with an excellent doorstep collection of recyclable materials and products for households,
provision of civic amenity sites and bulky waste collections, there are still residual wastes
arising from households. The development of policies to remove these materials and products
from the waste stream needs to be underpinned by research which provides a robust evidence
base for these policies, both in terms of accuracy of data and the effectiveness (or not) of the
various policy options. This research is the first phase of a two part programme the first stage
of which is the identification of what materials and products end up as residual waste and in
what quantities, with the second stage focusing on what policy measures could be used to
phase out residual wastes and what the environmental impacts would be.
The tonnage and composition of household residual waste was estimated based on two
scenarios, hypothetical and practical. The decision to base the estimates on two scenarios
was based on the researcher’s knowledge of the sensitivity of residual waste estimates to
starting assumptions on waste quantities and composition and collection system capture rates.
Waste streams were categorised into collected household bin waste (i.e. including recycling,
composting and residual waste uplifts), bulky household waste collections and civic amenity site
waste.
Each scenario was based on a range of assumptions, boundaries and data sources and these
are specified both in the main report and the accompanying spreadsheets. Data sources for
each waste stream and category are specified. The spreadsheets provide a basic model which
will allow the estimates to be easily updated should improved data on the composition of the
household waste stream and capture rates become available.
The results of the research has produced estimates of the total quantity of residual waste
arisings of between 5,364,000 and 10,188,000 tonnes for the hypothetical and practical
scenarios respectively, from the most recent waste arisings data for each region of the UK.
i

Friends of the EarthResidual Waste Research June 2007
The estimates are broken down by waste/material type and by source to identify the most
significant wastes types in tonnage terms.
The hypothetical scenario identified a range of significant residual waste/material types, the
principal components of which were other paper and card (1,264,077 tonnes), disposable
nappies (922,817 tonnes), other miscellaneous combustibles (507,563 tonnes), other organic
wastes (482,007 tonnes), construction and demolition waste (450,737 tonnes), other
packaging (366,619 tonnes), packaging film (321,167) and mixed bagged waste (18,955). The
source of these waste/material streams varied, with most of the other paper and card and
disposable nappies arising from the household collected waste source, with construction and
demolition waste and mixed bagged waste arising from civic amenity sites and furniture arising
from bulky waste collections.
The practical scenario identified a range of significant residual waste/material types, the
principal components of which were other paper and card (1,264,077 tonnes), disposable
nappies (922,817 tonnes), kitchen waste (640,200 tonnes), construction and demolition waste
(588,599 tonnes), other miscellaneous combustibles (568,168 tonnes), furniture (500,876
tonnes), other organic wastes (482,007), newspapers and magazines (446,917 tonnes), other
packaging (442,926 tonnes), cardboard boxes/containers (434,889 tonnes), mixed bagged
waste (387,099 tonnes), packaging film (386,098 tonnes) and packaging glass (351,050). The
source of these waste/material streams varied, with most of the kitchen waste, other paper
and card, disposable nappies, cardboard boxes/containers, garden waste and packaging glass
arising from the household collected waste source, with construction and demolition waste and
mixed bagged waste arising from civic amenity sites and furniture arising from bulky waste
collections.
The difference between residual waste arisings in the hypothetical and practical scenarios
demonstrates the potential reduction in residual wastes that could be achieved by improving
capture rates. The practical scenario highlights those wastes that currently end up in the
residual waste stream such as paper/card and plastic packaging which could be removed with
improved capture rates and emphasis on segregation to prevent contamination.
Data issues/limitations were highlighted as a particular area of concern in terms of the
robustness and accuracy of the estimates of waste quantities and composition. Recent research
by the Open University into the composition of municipal solid waste has drawn attention to the
limited nature of previous surveys of household waste composition, none of which have
addressed the entire household waste stream in a systematic manner, resulting in there
currently being no reliable estimates of the total composition of municipal solid waste for any
part of the UK.
The report makes recommendations on a number of areas for additional research including a
review of waste compositional analysis work carried out in the UK over the last 5 years, the
commissioning of a representative national survey of the full range of household wastes
arisings (household collected, civic amenity site and bulky wastes), integration of
waste/product/material classification systems and a review of capture rates research to date,
with a view to making recommendations on future research and data needs.
ii

Friends of the EarthResidual Waste Research June 2007
Table of Contents
1. Introduction ........................................................................................................ 5
1.1 UK Resource Use ................................................................................................................. 5
1.2 What is Residual Waste? ....................................................................................................... 5
1.3 Policy Context ...................................................................................................................... 5
1.3.1 EU Policy Context ......................................................................................................... 5 1.3.2 UK Waste Policy ........................................................................................................... 6 1.3.3 Waste Strategy for England 2007 ................................................................................... 6
1.4 Objectives ........................................................................................................................... 7
2. Methodology ....................................................................................................... 7
2.1 Introduction ........................................................................................................................ 7
2.2 Assumptions and Waste Streams ............................................................................................ 8
2.3 Review and Collation of Compositional Waste Analysis Data ...................................................... 8
2.4 Estimated Capture Rates for Hypothetical and Practical Scenarios for Collected Household, Civic
Amenity and Bulky Waste Components ....................................................................................... 10
2.4.1 Hypothetical Capture Rates .......................................................................................... 10 2.4.2 Practical Capture Rates ............................................................................................... 10
2.5 Collection of Household Waste Arisings Data .......................................................................... 11
2.6 Estimation of UK Household Residual Wastes Arisings .............................................................. 12
3. Results .............................................................................................................. 13
3.1 Compositional Waste Analysis Data ...................................................................................... 13
3.2 Estimated Capture Rates for Hypothetical and Practical Scenarios for Collected Household, Civic
Amenity and Bulky Waste Components ....................................................................................... 14
3.2.1 Hypothetical Residual Waste Capture Rates ................................................................... 14 3.2.2 Practical Residual Waste Capture Rates ......................................................................... 15
3.3 UK Household Waste Arisings Data ....................................................................................... 16
3.4 Estimated Household Residual Waste Arisings Within the UK .................................................... 16
3.4.1 Hypothetical Residual Waste Arisings ............................................................................ 16 3.4.2 Practical Residual Waste Arisings .................................................................................. 18
4. Discussion ......................................................................................................... 20
4.1 Hypothetical Household Residual Waste Arisings ..................................................................... 20
4.2 Practical Residual Waste Arisings .......................................................................................... 21
4.3 Comparison of hypothetical and practical scenarios ................................................................. 22
4.4 Data Issues/ Limitations ...................................................................................................... 22
4.4.1 Compositional Waste Analysis Data .............................................................................. 22 4.4.2 Capture Rates ............................................................................................................ 22
5. Conclusions and Recomendations ...................................................................... 23
5.1 Conclusions ....................................................................................................................... 23
5.2 Recommendations .............................................................................................................. 23
iii

Friends of the EarthResidual Waste Research June 2007
6. References ........................................................................................................ 24
List of Tables
Table 1: Percentage Breakdown of Household by Collection Method.......................11
Table 2: Percentage Composition of Household Wastes Arising from Household
Collected, Civic Amenity Site and Bulky Uplift Wastes (from Burnley et al. 2006)....13
Table 3: Estimated Hypothetical Material Capture Rates for Household Waste........14
Table 4: Estimated Practical Material Capture Rates for Household Waste..............15
Table 5: Estimated Tonnage of Household Waste Arisings in the UK in 2004/05.....16
Table 6: Estimated Hypothetical Percentage Residual Wastes Arising from Household
Sources.................................................................................................................16
Table 7: Estimated Hypothetical Tonnage of Residual Waste Arising by Waste
Category and Waste Stream..................................................................................17
Table 8: Estimated Practical Percentage Residual Wastes Arisings from Household
Sources.................................................................................................................18
Table 9: Estimated Practical Tonnage of Residual Waste Arising by Waste Category
and Waste Stream.................................................................................................19
Table 10: Description of Materials Included within Household Waste Categories....27
Table 11: Estimated Tonnage of Household Waste Arising by Waste Category and
Waste Stream in the UK.........................................................................................30
iv

Friends of the EarthResidual Waste Research June 2007
1.INTRODUCTION
1.1UK Resource Use
The UK consumes more than its fair share of the world's resources, creating environmental and
social problems across the world, particularly in developing countries. The current model of
development based on the erosion of natural resources and capital is unsustainable. One
means of measuring the impact of resource consumption is the Ecological Footprint and if
everyone in the world consumed as much as the UK population it would take the resources of
over three planets to support them.
Many of these resources are literally wasted through the mainly linear process of material use
in our economies. Materials are extracted, used or further processed into products where they
are then disposed of to landfill and incinerators after use. The aim of Friends of the Earth’s
Reduce Resource Use campaign is to improve UK and EU resource efficiency and reduce
climate impacts, through promoting waste prevention, reuse, recycling and composting and by
phasing out residual waste.
1.2What is Residual Waste?
Not all materials and products are able to be reused, recycled or composted and these are the
materials that end up in residual waste and drive the need for disposal technologies such as
landfill and incineration. Even with an excellent doorstep collection of recyclable materials and
products for households, provision of civic amenity sites and bulky waste collections, there are
still residual wastes arising from households. A strategy to remove these materials and
products from the waste stream needs to be underpinned by research, the first stage of which
is the identification of what materials and products end up as residual waste and in what
quantities.
1.3Policy Context
A range of policies at European, national and regional levels provide the policy context for
residual waste production and prevention and these are described below.
1.3.1EU Policy Context
The EU has adopted a range of thematic strategies under the 6th Environmental Action
programme, the Thematic Strategies on ‘Sustainable Use of Natural Resources’ and ‘Prevention
and Recycling of Waste’ set the policy context for residual wastes. While the Thematic Strategy
on Sustainable Use of Natural Resources does not refer specifically to residual wastes, it does
set out as its overall objective ‘to reduce the negative environmental impacts generated by the
use of natural resources in a growing economy – a concept referred to as decoupling’.
The Thematic Strategy on Prevention and Recycling of Waste refers to the potential of EU
waste policy to contribute to reducing the overall negative environmental impact of resource
use and states that the basic objectives of current EU waste policy – to prevent waste and
promote re-use, recycling and recovery so as to reduce the negative environmental impact –
5

Friends of the EarthResidual Waste Research June 2007
are still valid and will be supported by this impact-based approach. The strategy recognises
that this requires a combination of measures to promote waste prevention, recycling and re-
use in such a way as to produce the optimum reduction in the accumulated impact over the life
cycle of resources. Of the seven actions identified within the strategy, of particular relevance to
this research is the introduction of life-cycle thinking into waste policy. The strategy states that
‘by applying the life-cycle approach, priorities can be identified more easily and policies can be
targeted more effectively so that the maximum benefit for the environment is achieved relative
to the effort expended.’ Recommendations set out in Section 5 which relate to the impacts of
such an approach for this research.
1.3.2UK Waste Policy
With the publication of Waste Strategy for England 2007, England and the three devolved
administrations now have separate waste strategies. ‘Wise about Waste: The National Waste
Strategy for Wales’ published in 2002 identified a range of potential mechanisms to increase
participation in recycling schemes, including direct charging for the quantity of residual waste
collected with segregated recyclables being collected for free or at a lower rate.
Scotland adopted a national strategy, the ‘National Waste Plan’ in 2003, which states that
‘treatment technologies for residual mixed wastes that further boost recycling and composting
outputs and thereafter reduce the final amount of material going to landfill, are the preferred
way forward.’
‘Towards Resource Management. The Northern Ireland Waste Management Strategy 2006 –
2020’, refers to household waste stating ‘waste prevention will help us to meet our targets by
reducing the amount of residual waste requiring recycling and recovery’, and sets out the
following activities as examples of those that can reduce the amount of waste entering the
collected waste stream:
• avoiding waste generation;
• reducing the quantity and hazardous nature of waste at source; and
• reusing products before they enter the waste stream.
1.3.3Waste Strategy for England 2007
The strategy sets out the following objectives and targets:
• Decouple waste growth (in all sectors) from economic growth and put more emphasis
on waste prevention and re-use.
• Meet and exceed the Landfill Directive diversion targets for biodegradable municipal
waste in 2010, 2013 and 2020.
• Increase diversion from landfill of non-municipal waste and secure better integration of
treatment for municipal and non-municipal waste.
• Secure the investment in infrastructure needed to divert waste from landfill and for the
management of hazardous waste.
• Get the most environmental benefit from that investment, through increased recycling of
resources and recovery of energy from residual waste using a mix of technologies.
6

Friends of the EarthResidual Waste Research June 2007
The strategy goes on to say that, due to lower than predicted levels of waste growth, the
Government expects lower levels of residual waste than were previously assumed to be
produced.
The Strategy identifies incentives as one of its key proposals for action, and within this,
proposes to consult on removing the ban on local authorities introducing household financial
incentives for waste reduction and recycling, through early legislative change. Local
government would be free to introduce schemes where householders who recycle their waste
receive payments funded by householders who do not recycle. The strategy states that this
incentive could reduce the amount of annual residual waste landfilled by up to 15%, equivalent
to 1.5 million tonnes or 130kg per household. The strategy also commits the government to
setting targets for local government on residual waste, that which is not reused, recycled and
composted.
1.4Objectives
This research is the first phase of a two-part research programme with the following objectives:
• Phase 1 – Identifying residual waste
The first stage of the process is to identify the materials and products from households that
ultimately become residual waste and to estimate the quantities of these waste arisings.
• Research Phase 2 – What policy measures could be used to phase out this
residual waste, and what would be the environmental impacts?
Phase 2 of the research will be developed in detail once Phase 1 is complete, and therefore is
not addressed in this report in detail.
2.METHODOLOGY
2.1Introduction
The methodology used to estimate the quantities of materials and products from households
that will end up in the residual waste stream, comprised of the following stages:
1. Definition of assumptions and boundaries.
2. Review and collation of compositional waste analysis data.
3. Estimates of hypothetical and practical capture rates for collected household, civic
amenity and bulky waste components.
4. Collection of waste arisings data.
5. Estimation of the quantities of residual waste by component for the collected
household, civic amenity and bulky waste streams.
The tonnage and composition of household residual waste has been estimated based on two
scenarios, hypothetical and practical. Estimating the composition of the residual household
waste stream is at its most basic, a product of the starting composition of the waste streams,
7

Friends of the EarthResidual Waste Research June 2007
and the estimated capture rates for the collection systems, which will vary depending on the
material and collection system. Although data has been improving in recent years, through
research carried out by Defra and Wrap, there is a lack of peer reviewed research on the
performance of collection systems for recycling and composting. The research team has
therefore has therefore chosen to apply two capture scenarios (hypothetical and practical) to
illustrate the sensitivity of these assumptions on the estimates of residual waste composition
and arisings. The estimates of residual waste arisings both scenarios are contained in the two
accompanying spreadsheets to the report:
• Residual waste estimates_hypothetical
• Residual waste estimates_practical
The spreadsheets also specify the assumptions and data sources for each waste category and
waste stream. Recommendations on which estimates should be adopted for Phase 2 of the
research are set out in Section 4.
2.2Assumptions and Waste Streams
The following assumptions and boundaries were used in the analysis:
• Waste streams included in the research were collected household bin waste (i.e.
including recycling, composting and residual waste uplifts), bulky household waste
collections and civic amenity site waste.
• The research covered the whole of the UK (i.e. England, Wales, Scotland and Northern
Ireland).
• Residual wastes were defined as the wastes arising which cannot be recovered by
recycling and composting systems and end up in the ‘black bag’ or wheeled bin.
• Good quality recycling and composting schemes are in place and that these are
operating according to two scenarios: Hypothetical and Practical.
• The recycling and composting schemes can recycle or compost the following materials*:
-Newspaper, magazines, white paper, junk mail, cardboard
-Steel cans, aluminium cans;
-All colours of glass (but not window glass, pyrex glass, broken glass etc)
-PET, HDPE, PVC
-Food waste, garden waste
-Electronic equipment (once the WEEE Directive comes in)
-Batteries
*The methodology applied assumed that the recycling and composting schemes collected all
materials which are potentially recoverable from the household waste stream.
2.3Review and Collation of Compositional Waste Analysis Data
A literature review of published compositional data for household, bulky and CA site waste
streams was carried out to identify the most appropriate data set(s) for use in this analysis.
Data on the compositional breakdown of household wastes is notoriously poor and the majority
of the waste compositional analysis studies which have been carried out have been limited to
collected household bin waste.
8
Friends of the EarthResidual Waste Research June 2007
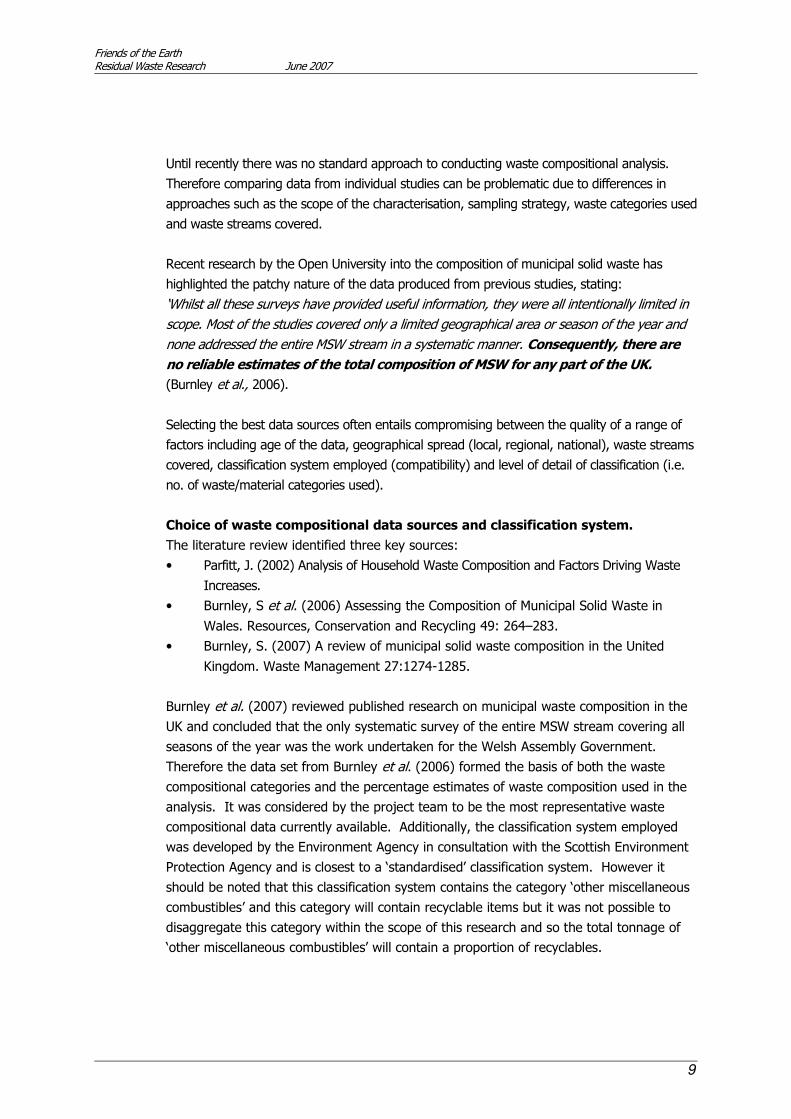
Until recently there was no standard approach to conducting waste compositional analysis.
Therefore comparing data from individual studies can be problematic due to differences in
approaches such as the scope of the characterisation, sampling strategy, waste categories used
and waste streams covered.
Recent research by the Open University into the composition of municipal solid waste has
highlighted the patchy nature of the data produced from previous studies, stating:
‘Whilst all these surveys have provided useful information, they were all intentionally limited in
scope. Most of the studies covered only a limited geographical area or season of the year and
none addressed the entire MSW stream in a systematic manner. Consequently, there are
no reliable estimates of the total composition of MSW for any part of the UK.
(Burnley et al., 2006).
Selecting the best data sources often entails compromising between the quality of a range of
factors including age of the data, geographical spread (local, regional, national), waste streams
covered, classification system employed (compatibility) and level of detail of classification (i.e.
no. of waste/material categories used).
Choice of waste compositional data sources and classification system.
The literature review identified three key sources:
• Parfitt, J. (2002) Analysis of Household Waste Composition and Factors Driving Waste
Increases.
• Burnley, S et al. (2006) Assessing the Composition of Municipal Solid Waste in
Wales. Resources, Conservation and Recycling 49: 264–283.
• Burnley, S. (2007) A review of municipal solid waste composition in the United
Kingdom. Waste Management 27:1274-1285.
Burnley et al. (2007) reviewed published research on municipal waste composition in the
UK and concluded that the only systematic survey of the entire MSW stream covering all
seasons of the year was the work undertaken for the Welsh Assembly Government.
Therefore the data set from Burnley et al. (2006) formed the basis of both the waste
compositional categories and the percentage estimates of waste composition used in the
analysis. It was considered by the project team to be the most representative waste
compositional data currently available. Additionally, the classification system employed
was developed by the Environment Agency in consultation with the Scottish Environment
Protection Agency and is closest to a ‘standardised’ classification system. However it
should be noted that this classification system contains the category ‘other miscellaneous
combustibles’ and this category will contain recyclable items but it was not possible to
disaggregate this category within the scope of this research and so the total tonnage of
‘other miscellaneous combustibles’ will contain a proportion of recyclables.
9

Friends of the EarthResidual Waste Research June 2007
2.4Estimated Capture Rates for Hypothetical and Practical Scenarios for Collected Household, Civic Amenity and Bulky Waste Components
Capture rate estimates for each waste stream component have been assigned, drawing on a
range of sources and based on two scenarios, hypothetical and practical. All assumptions
made are specified in the accompanying spreadsheets.
2.4.1Hypothetical Capture Rates
The hypothetical capture rate scenario assumes that the highest theoretical capture rates are
achieved for all recyclable and compostable materials. The assumptions underpinning the
capture rates are outlined below:
1. For all household collected, civic amenity site and bulky wastes, it has been assumed
the best available recycling and composting schemes are in place and these collection systems
operate at their theoretical optimum (see Section 2.2 for further details of these materials). In
estimating the capture rate of household collected wastes, a presumption in favour of 100%
capture rates has been applied except where, in the judgement of the project team, recovery
of 100% of this material is not theoretically possible.
2. For all civic amenity sites and bulky uplift collected wastes, the estimated capture rates
are based on the hypothetical rates in Defra (2004) National Assessment of Civic Amenity Sites
- Future Challenges for CA Sites in the UK.
3. For waste categories where no capture rate data was available, capture rates were
estimated by the project team. This mainly applied to the household waste stream, in
particular the categories:
• Other paper and card
• Packaging film
• Other plastic film
• Other packaging
• Carpet and underlay
• Other miscellaneous combustibles
These have been highlighted here and in the accompanying spreadsheet to ensure
transparency, and as capture rate data becomes available the uncertainty in the estimates of
tonnage of residual waste from households can be reduced.
2.4.2Practical Capture Rates
The practical capture rate scenario assumes that the highest practical capture rates are
achieved for recyclable and compostable materials. The assumptions underpinning the capture
rates are outlined below:
1. For all household collected, civic amenity site and bulky wastes uplifted, it has been
assumed that a good recycling and composting scheme are in place and that these are well
used (see Section 2.2 for further details of these materials).
2. In estimating the capture rate of household collected wastes, reports from Norfolk
Waste Partnership, Paisley University and Merseyside Waste Disposal Authority were reviewed.
10

Friends of the EarthResidual Waste Research June 2007
Capture rates were allocated based on the rationale ‘maximum captures possible based on the
most advantageous set of circumstances’. For wastes where no capture rate data were
available, capture rates were estimated by the project team based on capture rates for similar
materials.
3. For all civic amenity sites and bulky uplift collected wastes, the estimated capture rates
are based on the national capture rates in Defra (2004) National Assessment of Civic Amenity
Sites - Future Challenges for CA Sites in the UK.
2.5Collection of Household Waste Arisings Data
The next stage in estimating the household residual waste arisings in the UK was to establish
the total household waste arisings within the UK. Total waste arisings data for England, Wales,
Scotland and Northern Ireland were collected from the following publications, for the year
2004/05:
• Department of Environment and Rural Affairs. Municipal and Household Waste Statistics.
Available at: http://www.defra.gov.uk/environment/statistics/waste/wrmunicipal.htm
• Northern Ireland Environment & Heritage Service. December 2005. Municipal Waste
Management Northern Ireland 2004/05 Summary Report. Available at:
http://www.ehsni.gov.uk/summaryreport211205.pdf
• Scottish Environment Protection Agency. Waste Data Digest 6. Available at:
http://www.sepa.org.uk/pdf/publications/wds/wdd_6.pdf
• Welsh Assembly Government. Municipal Waste Management Survey. Available at:
http://new.wales.gov.uk/topics/environmentcountryside/epq/waste_recycling/Municipal_
waste_mngmnt_survey?lang=en
Household waste arisings for each region of the UK were summed to produce headline figures
for UK household waste arisings of household bin waste, bulky household waste collections and
households collected at civic amenity sites. Data for Scotland and Northern Ireland were not
split into these categories, therefore the headline figures for these regions were split using the
proportions shown in Table 1.
Table 1: Percentage Breakdown of Household by Collection Method
Household Collected
Waste
Civic Amenity
Site Waste Bulky/Other Waste
Breakdown by
collection method 81% 15% 4%
Source: Parfitt, J. (2002) Analysis of household waste composition and factors driving waste
increases. Defra Strategy Unit.
11

Friends of the EarthResidual Waste Research June 2007
2.6Estimation of UK Household Residual Wastes Arisings
The following calculations were undertaken to estimate the residual household wastes arising
in the UK:
1. For each waste category, the percentage of residual waste arisings was calculated:
Percentage of Household Residual Waste Arising = Compositional Waste Analysis Percentage -
(Percentage Material Capture Rate*Compositional Waste Analysis Percentage)
2. For each waste category, the estimated tonnage of residual waste arising from
household sources then was calculated:
Estimated Tonnage of Residual Waste Arising = Estimated Tonnage of Household Waste
Arisings - (Estimated Tonnage of Household Waste Arisings*Material Capture Rate)
The calculations are contained in the accompanying spreadsheets. Given the sensitivity of the
analysis to estimates of waste composition and capture rates, and the project teams
reservations regarding the quality of much of this data, the spreadsheets have been structured
to enable them to be used as a basic dynamic model, which can be easily updated as more
reliable data becomes available. The project team has made a number of recommendations on
improvements to waste compositional data, and these are set out in Section 5.
12

Friends of the EarthResidual Waste Research June 2007
3.RESULTS
3.1Compositional Waste Analysis Data
The waste compositional estimates for household collected, civic amenity and bulky waste are
set out in Table 2.
Table 2: Percentage Composition of Household Wastes Arising from Household Collected,
Civic Amenity Site and Bulky Uplift Wastes (from Burnley et al. 2006)
Waste arising type (% composition by weight)
Waste CategoryHousehold
Collected WasteCivic AmenitySite Waste Bulky Waste
Newspapers and magazines 9.38% 2.40% 0%
Recyclable paper 2.02% 0.63% 0%
Cardboard boxes/containers 6.07% 2.34% 0.50%
Other paper and card 6.15% 1.73% 0%
Refuse sacks and carrier bags 1.92% 0.13% 0%
Packaging film 1.87% 0.07% 0%
Other plastic film 0.22% 0.16% 0%
Dense plastic bottles 2.48% 0.12% 0%
Other packaging 2.13% 0.31% 0.05%
Other dense plastic 1.53% 1.81% 1.20%
Textiles 2.42% 1.96% 0.25%
Shoes 0.58% 0.23% 0%
Disposable nappies 3.60% 0.01% 0%
Wood 1.11% 12.53% 5.40%
Carpet and underlay 0.75% 4.90% 6.50%
Furniture 0.06% 5.68% 37.15%
Other miscellaneous combustibles 2.10% 2.59% 8.55%
Packaging glass 6.70% 1.19% 0.30%
Non-packaging glass 0.45% 0.92% 0.30%
Garden waste 8.32% 17.18% 0.45%
Kitchen waste 24.96% 0.33% 0%
Other organic wastes 1.83% 0.33% 0%
Ferrous metal food/beverage cans 2.51% 0.13% 0%
Other ferrous metal 1.09% 5.59% 4.35%
Non-ferrous food and beverage cans 0.51% 0.03% 0%
Other non-ferrous metal 0.53% 0.81% 0.25%
White goods 0.08% 3.03% 22.65%
Large electronic goods 0.09% 0.69% 0.15%
TVs and monitors 0.01% 1.45% 2.70%
Other WEEE 0.55% 1.45% 4.20%
Lead/acid batteries 0.08% 0.63% 0%
Oil 0.04% 0.11% 0%
Identifiable clinical waste 0.23% 0.05% 0.00%
Other potentially hazardous 0.27% 0.61% 0.15%
Construction and demolition waste 1.64% 16.83% 0.30%
Other non-combustible material 1.13% 1.40% 1.80%
Fines 4.55% 0.40% 0%
Mixed bagged waste - 9.28% 1.35%
TOTAL 100.0% 100.0% 98.6%*
*Bulky waste percentages do not add to 100% due to rounding
13

Friends of the EarthResidual Waste Research June 2007
Appendix 1 provides a detailed description of materials included in each of the above waste
categories.
3.2Estimated Capture Rates for Hypothetical and Practical Scenarios for Collected Household, Civic Amenity and Bulky Waste Components
3.2.1Hypothetical Residual Waste Capture Rates
The estimates of the hypothetical capture rates for each element of the household waste
stream by waste category are set out in Table 3.
Table 3: Estimated Hypothetical Material Capture Rates for Household Waste
Hypothetical Material Capture Rates
Waste Category Household Collected Waste Civic Amenity Site Waste Bulky Waste
Newspapers and magazines 100% 95% 95%
Recyclable paper 100% 95% 95%
Cardboard boxes/containers 100% 95% 95%
Other paper and card 20% 95% 95%
Refuse sacks and carrier bags 100% 95% 95%
Packaging film 33% 95% 95%
Other plastic film 33% 95% 95%
Dense plastic bottles 100% 95% 95%
Other packaging 33% 95% 95%
Other dense plastic 100% 95% 95%
Textiles 100% 80% 80%
Shoes 100% 80% 80%
Disposable nappies 0% 0% 0%
Wood 100% 98% 98%
Carpet and underlay 80% 80% 80%
Furniture 100% 80% 80%
Other miscellaneous combustibles 33% 33% 33%
Packaging glass 100% 95% 95%
Non-packaging glass 0% 95% 95%
Garden waste 100% 98% 98%
Kitchen waste 100% 98% 98%
Other organic wastes 0% 0% 0%
Ferrous metal food/beverage cans 100% 98% 98%
Other ferrous metal 100% 98% 98%
Non-ferrous food and beverage cans 100% 98% 98%
Other non-ferrous metal 100% 98% 98%
White goods 100% 95% 95%
Large electronic goods 100% 95% 95%
TVs and monitors 100% 95% 95%
Other WEEE 100% 95% 95%
Lead/acid batteries 100% 95% 95%
Oil 100% 95% 95%
Identifiable clinical waste 0% 95% 95%
Other potentially hazardous 0% 95% 95%
14

Friends of the EarthResidual Waste Research June 2007
Construction and demolition waste 100% 33% 33%
Other non-combustible material 33% 98% 98%
Fines 100% 33% 33%
Mixed bagged waste 0% 45% 45%
The sources for the capture rates of each material are contained in the spreadsheet and where
these have been estimated by the project team, the assumptions and rationale are described
fully.
3.2.2Practical Residual Waste Capture Rates
The estimates for practical capture rates for each element of the household waste stream by
waste category are shown below (Table 4).
Table 4: Estimated Practical Material Capture Rates for Household Waste
Practical Material Capture Rates
Waste Category Household Collected Waste Civic Amenity Site Waste Bulky Waste
Newspapers and magazines 82% 85% 85%
Recyclable paper 82% 85% 85%
Cardboard boxes/containers 73% 85% 85%
Other paper and card 20% 85% 85%
Refuse sacks and carrier bags 33% 0% 0%
Packaging film 20% 0% 0%
Other plastic film 20% 0% 0%
Dense plastic bottles 73% 67% 67%
Other packaging 20% 67% 0%
Other dense plastic 33% 67% 0%
Textiles 95% 40% 40%
Shoes 95% 40% 40%
Disposable nappies 0% 0% 0%
Wood 90% 80% 80%
Carpet and underlay 50% 50% 50%
Furniture 33% 33% 33%
Other miscellaneous combustibles 25% 25% 25%
Packaging glass 80% 85% 85%
Non-packaging glass 0% 85% 85%
Garden waste 90% 95% 95%
Kitchen waste 90% 95% 95%
Other organic wastes 0% 0% 0%
Ferrous metal food/beverage cans 78% 95% 95%
Other ferrous metal 78% 95% 95%
Non-ferrous food and beverage cans 78% 95% 95%
Other non-ferrous metal 78% 95% 95%
White goods 90% 90% 90%
Large electronic goods 90% 90% 90%
TVs and monitors 90% 90% 90%
Other WEEE 90% 90% 90%
Lead/acid batteries 80% 80% 8%
Oil 80% 80% 8%
Identifiable clinical waste 0% 80% 80%
15

Friends of the EarthResidual Waste Research June 2007
Other potentially hazardous 0% 80% 80%
Construction and demolition waste 80% 25 25
Other non-combustible material 25% 95% 9%
Fines 80% 25% 25%
Mixed bagged waste 0% 0% 0%
3.3UK Household Waste Arisings Data
Data for household bin waste, bulky household waste collections and household waste
collected at civic amenity sites were summed to produce headline figures for UK household
waste arisings. The 2004/05 reporting year was chosen as this was the most recent reporting
period common to each region of the UK and the estimated household waste arisings are
shown below (Table 5).
Table 5: Estimated Tonnage of Household Waste Arisings in the UK in 2004/05
Estimated Tonnage of Household Waste Arising by Source in the UK
Region of the UK Household CollectedWaste
Civic Amenity SiteWaste
BulkyWaste
TOTAL
England 21,255,000 3,198,000 1,205,000 25,658,000
Wales 1,357,326 217,482 9,830 1,584,638
Scotland 2,265,913 419,613 111,897 2,797,423
Northern Ireland 744,527 137,875 36,767 919,169
Total Household Waste Arisings in the UK
25,622,766 3,972,971 1,363,494 30,959,230
Appendix 2 provides further detail on the estimated tonnage of household waste arisings by
waste category and waste stream for the UK.
3.4Estimated Household Residual Waste Arisings Within the UK
The estimates for percentage waste composition and capture rates (hypothetical and practical)
were combined to provide estimates of the percentage composition of the residual waste
stream.
3.4.1Hypothetical Residual Waste Arisings
Using the hypothetical material capture rates (Table 3) and the household compositional waste
analysis percentages (Table 2), an estimate of the hypothetical percentage of residual waste
arisings for each element of the household waste stream by waste category was calculated
(Table 6).
Table 6: Estimated Hypothetical Percentage Residual Wastes Arising from Household
Sources
Hypothetical Residual Waste Arising from Household Sources (%)
16

Friends of the EarthResidual Waste Research June 2007
Waste Category Household Collected Waste Civic Amenity Site Waste Bulky Waste
Newspapers and magazines 0.00 0.12 0.00
Recyclable paper 0.00 0.03 0.00
Cardboard boxes/containers 0.00 0.12 0.03
Other paper and card 4.92 0.09 0.00
Refuse sacks and carrier bags 0.00 0.01 0.00
Packaging film 1.25 0.00 0.00
Other plastic film 0.15 0.01 0.00
Dense plastic bottles 0.00 0.01 0.00
Other packaging 1.43 0.02 0.00
Other dense plastic 0.00 0.09 0.06
Textiles 0.00 0.39 0.05
Shoes 0.00 0.05 0.00
Disposable nappies 3.60 0.01 0.00
Wood 0.00 0.25 0.11
Carpet and underlay 0.15 0.98 1.30
Furniture 0.00 1.14 7.43
Other miscellaneous combustibles 1.41 1.74 5.73
Packaging glass 0.00 0.06 0.02
Non-packaging glass 0.45 0.05 0.02
Garden waste 0.00 0.34 0.01
Kitchen waste 0.00 0.01 0.00
Other organic wastes 1.83 0.33 0.00
Ferrous metal food/beverage cans 0.00 0.00 0.00
Other ferrous metal 0.00 0.11 0.09
Non-ferrous food and beverage cans 0.00 0.00 0.00
Other non-ferrous metal 0.00 0.02 0.01
White goods 0.00 0.15 1.13
Large electronic goods 0.00 0.03 0.01
TVs and monitors 0.00 0.07 0.14
Other WEEE 0.00 0.07 0.21
Lead/acid batteries 0.00 0.03 0.00
Oil 0.00 0.01 0.00
Identifiable clinical waste 0.23 0.00 0.00
Other potentially hazardous 0.27 0.03 0.01
Construction and demolition waste 0.00 11.28 0.20
Other non-combustible material 0.76 0.03 0.04
Fines 0.00 0.27 0.00
Mixed bagged waste 0.00 5.10 0.74
The estimated tonnage of residual waste arisings was then calculated (Table 7).
Table 7: Estimated Hypothetical Tonnage of Residual Waste Arising by Waste Category
and Waste Stream
Estimated Hypothetical Tonnage of Residual Waste Arising from Household Sources
Household Collected Waste
Civic Amenity Site Waste Bulky Waste
Estimated Total Tonnage of Residual
Waste
Estimated waste arisings inthe UK 4,212,767 914,932 236,287 5,363,985
Waste Category
17

Friends of the EarthResidual Waste Research June 2007
Other paper and card 1,260,640 3,437 0 1,264,077
Disposable nappies 922,420 397 0 922,817
Other miscellaneous combustibles 360,512 68,943 78,108 507,563
Other organic wastes 468,897 13,111 0 482,007
Construction and demolition
waste
0 447,996 2,741 450,737
Other packaging 365,662 616 341 366,619
Packaging film 321,028 139 0 321,167
Mixed bagged waste 0 202,780 10,124 212,904
Other non-combustible material 193,990 1,112 491 195,593
Furniture 0 45,133 101,308 146,441
Non-packaging glass 115,302 1,828 205 117,335
Carpet and underlay 38,434 38,935 17,725 95,095
Other potentially hazardous 69,181 1,212 102 70,495
Identifiable clinical waste 58,932 99 0 59,032
Other plastic film 37,768 318 0 38,086
White goods 0 6,019 15,442 21,461
Textiles 0 15,574 682 16,256
Garden waste 0 13,651 123 13,774
Wood 0 9,956 1,473 11,429
Fines 0 10,648 0 10,648
Other WEEE 0 2,880 2,863 5,744
Other ferrous metal 0 4,442 1,186 5,628
Cardboard boxes/containers 0 4,648 341 4,989
Newspapers and magazines 0 4,768 0 4,768
TVs and monitors 0 2,880 1,841 4,721
Other dense plastic 0 3,596 818 4,414
Packaging glass 0 2,364 205 2,568
Shoes 0 1,828 0 1,828
Large electronic goods 0 1,371 102 1,473
Recyclable paper 0 1,251 0 1,251
Lead/acid batteries 0 1,251 0 1,251
Other non-ferrous metal 0 644 68 712
Kitchen waste 0 262 0 262
Refuse sacks and carrier bags 0 258 0 258
Dense plastic bottles 0 238 0 238
Oil 0 219 0 219
Ferrous metal food/beverage cans 0 103 0 103
Non-ferrous food and beverage
cans
0 24 0 24
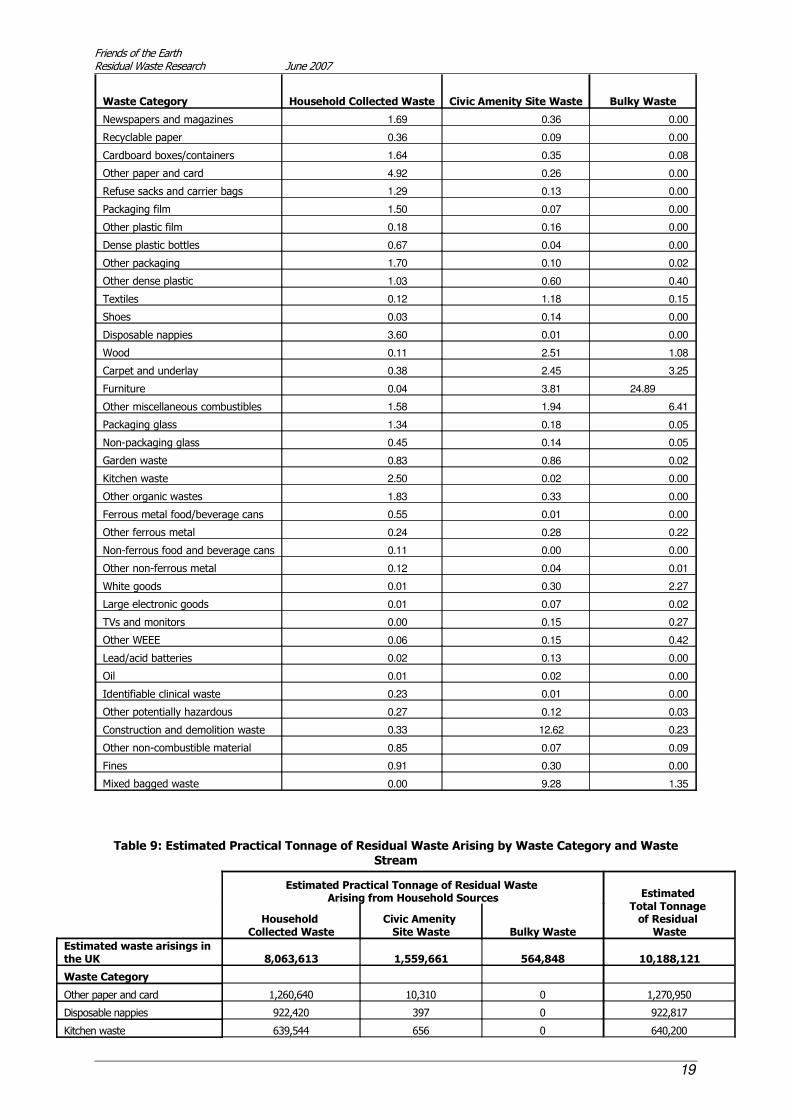
3.4.2Practical Residual Waste Arisings
Using the ‘practical material capture rates’ (Table 4) and the household compositional waste
analysis percentages (Table 2), an estimate of the percentage of residual waste arisings for
each element of the household waste stream by waste category was calculated (Table 8). The
estimated tonnage of residual waste arisings was then calculated (Table 9).
Table 8: Estimated Practical Percentage Residual Wastes Arisings from Household
Sources
Practical Residual Waste Arisings from Household Sources (%)
18
Friends of the EarthResidual Waste Research June 2007
Waste Category Household Collected Waste Civic Amenity Site Waste Bulky Waste
Newspapers and magazines 1.69 0.36 0.00
Recyclable paper 0.36 0.09 0.00
Cardboard boxes/containers 1.64 0.35 0.08
Other paper and card 4.92 0.26 0.00
Refuse sacks and carrier bags 1.29 0.13 0.00
Packaging film 1.50 0.07 0.00
Other plastic film 0.18 0.16 0.00
Dense plastic bottles 0.67 0.04 0.00
Other packaging 1.70 0.10 0.02
Other dense plastic 1.03 0.60 0.40
Textiles 0.12 1.18 0.15
Shoes 0.03 0.14 0.00
Disposable nappies 3.60 0.01 0.00
Wood 0.11 2.51 1.08
Carpet and underlay 0.38 2.45 3.25
Furniture 0.04 3.81 24.89
Other miscellaneous combustibles 1.58 1.94 6.41
Packaging glass 1.34 0.18 0.05
Non-packaging glass 0.45 0.14 0.05
Garden waste 0.83 0.86 0.02
Kitchen waste 2.50 0.02 0.00
Other organic wastes 1.83 0.33 0.00
Ferrous metal food/beverage cans 0.55 0.01 0.00
Other ferrous metal 0.24 0.28 0.22
Non-ferrous food and beverage cans 0.11 0.00 0.00
Other non-ferrous metal 0.12 0.04 0.01
White goods 0.01 0.30 2.27
Large electronic goods 0.01 0.07 0.02
TVs and monitors 0.00 0.15 0.27
Other WEEE 0.06 0.15 0.42
Lead/acid batteries 0.02 0.13 0.00
Oil 0.01 0.02 0.00
Identifiable clinical waste 0.23 0.01 0.00
Other potentially hazardous 0.27 0.12 0.03
Construction and demolition waste 0.33 12.62 0.23
Other non-combustible material 0.85 0.07 0.09
Fines 0.91 0.30 0.00
Mixed bagged waste 0.00 9.28 1.35
Table 9: Estimated Practical Tonnage of Residual Waste Arising by Waste Category and Waste
Stream
Estimated Practical Tonnage of Residual Waste Arising from Household Sources
Household Collected Waste
Civic Amenity Site Waste Bulky Waste
Estimated Total Tonnage of Residual
Waste
Estimated waste arisings inthe UK 8,063,613 1,559,661 564,848 10,188,121
Waste Category
Other paper and card 1,260,640 10,310 0 1,270,950
Disposable nappies 922,420 397 0 922,817
Kitchen waste 639,544 656 0 640,200
19

Friends of the EarthResidual Waste Research June 2007
Construction and demolition
waste 84,043 501,488 3,068 588,599
Other miscellaneous combustibles 403,559 77,175 87,434 568,168
Furniture 10,300 151,195 339,380 500,876
Other organic wastes 468,897 13,111 0 482,007
Newspapers and magazines 432,615 14,303 0 446,917
Other packaging 436,612 4,064 2,250 442,926
Cardboard boxes/containers 419,932 13,945 1,023 434,899
Mixed bagged waste 0 368,692 18,407 387,099
Packaging film 383,317 2,781 0 386,098
Packaging glass 343,345 7,092 614 351,050
Refuse sacks and carrier bags 329,611 5,165 0 334,776
Other dense plastic 262,659 23,731 5,399 291,789
Garden waste 213,181 34,128 307 247,616
Fines 233,167 11,919 0 245,086
Carpet and underlay 96,085 97,338 44,314 237,737
Other non-combustible material 217,153 2,781 1,227 221,161
Dense plastic bottles 171,570 1,573 0 173,143
Wood 28,441 99,563 14,726 142,730
Ferrous metal food/beverage cans 141,489 258 0 141,747
Non-packaging glass 115,302 5,483 614 121,399
Recyclable paper 93,164 3,754 0 96,919
Textiles 31,004 46,722 2,045 79,771
Other ferrous metal 61,443 11,104 2,966 75,513
Other potentially hazardous 69,181 4,847 409 74,438
Identifiable clinical waste 58,932 397 0 59,330
Other plastic film 45,096 6,357 0 51,453
White goods 2,050 12,038 30,883 44,971
Other non-ferrous metal 29,876 1,609 170 31,656
Non-ferrous food and beverage
cans 28,749 60 0 28,808
Other WEEE 14,093 5,761 5,727 25,580
Shoes 7,431 5,483 0 12,913
TVs and monitors 256 5,761 3,681 9,698
Lead/acid batteries 4,100 5,006 0 9,106
Large electronic goods 2,306 2,741 205 5,252
Oil 2,050 874 0 2,924
4.DISCUSSION
4.1Hypothetical Household Residual Waste Arisings
The hypothetical household residual waste arisings were estimated to be approximately
5,364,000 tonnes, with the majority arising from household collected wastes. Table 7 ranks
the waste categories in tonnage terms with 11 categories containing over 100,000 tonnes of
residual waste.
Household Collected Wastes
The most significant waste arisings from the household collected source is other paper and
card, followed by disposable nappies. Other paper and card consists of wallpaper removed
from walls, photos, facial and toilet tissues and kitchen paper. Other significant wastes include
other miscellaneous combustibles, other organic wastes, packaging film and other packaging.
20

Friends of the EarthResidual Waste Research June 2007
In addition, it should be noted that hazardous waste arisings from both identifiable clinical
waste and other potentially hazardous waste were significant in tonnage terms (>100,000
tonnes), and most of the material arose from the household collected wastes. If this material
was un-segregated it would contaminate other wastes coming into contact, which could
compromise the ability to further segregate residual waste arisings for recovery.
Civic Amenity Site Waste
The most significant waste arisings from the civic amenity site collected source are construction
and demolition wastes and mixed bagged wastes and these form approximately 70% of all the
wastes arising from this source. However, these waste types could potentially be reduced by
introducing better segregation at the site to ensure that all recyclable/ compostable
components are recovered from the mixed bagged waste and to further segregate construction
and demolition wastes. Other waste streams that could be reduced arising from this source
were wood, carpet and underlay, furniture, other miscellaneous combustibles, garden
waste and textiles.
Bulky Waste
The most significant category of residual waste arisings from this source was furniture.
Furniture could potentially be reduced by introducing better segregation to ensure that all
reusable/ recyclable furniture is recovered (See Section 5 for specific recommendations). Other
significant waste streams arising from this source were carpet and underlay, other
miscellaneous combustibles and white goods.
4.2Practical Residual Waste Arisings
Practical household residual waste arisings were estimated to be approximately 10,188,000
tonnes and Table 9 ranks ranks the waste categories in terms of tonnage with 23 waste
categories containing over 100,000 tonnes of residual waste.
Household Collected Wastes
Similar to the hypothetical scenario the largest residual waste streams were other paper and
card and disposable nappies. Paper/card and plastic based waste categories make up
approximately 53% of residual wastes from this source (approximately 4,270,000 tonnes) i.e.
newspapers and magazines, recyclable paper, cardboard boxes/containers, other paper
and card, refuse sacks and carrier bags, packaging film, dense plastic bottles, other
packaging, other dense plastic. Other significant types of residual waste arisings from the
household collected source were garden, kitchen and other organic wastes. These waste types
made up approximately 16% (1,320,000 tonnes) of the residual waste arisings from this
source.
In addition, it should be noted that although hazardous waste arisings were not significant in
tonnage terms, most of the material arose from the household collected wastes. If this material
was un-segregated it could contaminate other wastes coming into contact, which could
compromise the ability to further segregate residual waste arisings for recovery.
Civic Amenity Site Waste
21

Friends of the EarthResidual Waste Research June 2007
Approximately 32% (501,488 tonnes) of residual wastes arising from civic amenity site sources
are construction and demolition wastes. The capture rate of these materials for reuse/recycling
could be improved upon by increasing segregation of these waste types. Mixed bagged wastes
form approximately 24% the significant residual waste streams arising from the civic amenity
site source. However, this waste type could potentially be reduced by introducing better
segregation at the site to ensure that all recyclable/compostable components are recovered.
The other significant wastes also included: furniture, wood, carpet and underlay and garden
waste. There may be potential for further increase the capture rate of these materials as there
are existing markets for them.
Bulky Waste
The most significant residual waste arising was furniture which comprised 60% of residual
wastes from this source (339,000 tonnes). However, these waste types could potentially be
reduced by introducing better segregation at the site to ensure that all reusable/ recyclable
furniture is recovered. Other significant waste streams arising from this source were: other
miscellaneous combustibles and carpet and underlay and white goods.
4.3Comparison of hypothetical and practical scenarios
The difference between residual waste arisings in the hypothetical and practical scenarios
demonstrates the potential reduction in residual wastes that could be achieved by improving
capture rates. The practical scenario highlights those wastes that currently end up in the
residual waste stream such as paper/card and plastic packaging which could be removed with
improved capture rates and emphasis on segregation to prevent contamination.
4.4Data Issues/ Limitations
4.4.1 Compositional Waste Analysis Data
As set out in Section 3, no reliable estimates of the total composition of municipal solid waste
for any part of the UK currently exist. As these compositional estimates form the starting point
for the estimation of the quantity and composition of household residual wastes, the outputs of
this research are reliant upon the accuracy of these estimates. The sources chosen for the
analysis constitute, in the view of the project team, the best available data. However, as the
accuracy of the estimates of residual waste composition is sensitive to the accuracy of the data,
the project team has made a series of recommendations on improvements to waste
compositional data in Section 5.
4.4.2Capture Rates
The decision to present the estimates by hypothetical and practical capture rates reflects the
reality that no collection systems ever operates at 100% efficiency, while recognising that it is
not the responsibility of this research project to ‘second-guess’ the design and operation of the
collection systems. As set out in Section 2, the rationale for this approach was to illustrate the
influence of the assumptions of capture rates on the final residual waste estimates. However, a
decision must then be made on which set of estimates are to be used for Phase 2 of the
research. While outputs of both scenarios are presented and discussed in this report, it is the
22

Friends of the EarthResidual Waste Research June 2007
view of the project team that, as the practical residual waste estimates are based on published
research on the performance of recycling and composting collection systems, that these should
be used in any further analysis of residual waste arisings. The hypothetical residual waste
estimates identifies those materials and products that would end up in the residual waste
stream even with effective collection systems and may be more appropriate for use in
identifying upstream policy interventions.
5.CONCLUSIONS AND RECOMENDATIONS
5.1Conclusions
The research has provided estimates of the quantities and composition of residual waste
arisings in the UK based on two capture rate scenarios. This produces estimates of the total
quantity of residual waste arisings of between 5,346,400 and 10,188,000 tonnes. The
methodological description and accompanying spreadsheets set out the assumptions and
calculations that form the basis of these estimates, and additionally, provide a basic model
which will allow the estimates to be easily updated should improved data on the composition of
the household waste stream and capture rates become available. The research has highlighted
a number of areas for additional research and recommendations on these are set out below.
5.2Recommendations
As set out in Section 2, the research has demonstrated a clear need for accurate and
comprehensive data on the composition of all of the household waste stream (household
collected, CA site and bulky waste). Defra has published the Defra/WAG waste data
strategy for waste streams across the UK, however this strategy does not address the
issue of household waste compositional data. Waste compositional data collection is currently
carried out in a piecemeal fashion, with no centralized coordination and analysis.
Recommendation 1: Review of current state of knowledge.
It is recommended that a review of waste compositional analysis work carried out in the UK
over the last 5 years be carried out with a view to making recommendations on future
compositional data needs.
Recommendation 2: National waste compositional analysis programme.
In order to obtain reliable estimates of the composition of all household wastes, there is a need
to undertaken a representative national survey of the full range of household wastes arisings
(household collected, CA site and bulky wastes). Such a study would need to address the
following issues in the design of the sample methodology to ensure it was representative:
• Seasonal variation;
• Geographical spread (local, regional, national);
• Waste collection systems covered (e.g. household recycling, composting and residual
waste collections; civic amenity sites; bring recycling points; bulky uplifts);
• Level of detail of classification (i.e. no. of waste/material categories used); and
• Classification system employed (compatibility of classification systems for different waste
streams).
Recommendation 3: Waste/Product/Material classification systems.
23

Friends of the EarthResidual Waste Research June 2007
The current classification systems used for household waste have developed on an ad-hoc
basis over a number of years and were originally based on the classification system developed
as part of the UK National Household Waste Analysis Project (NHWAP). The introduction of
life-cycle thinking into waste policy, as set out in the thematic strategy on the prevention and
recycling of waste, will require an integrated approach in terms of the classification systems
applied along the supply chain to the products and materials that eventually become residual
waste. Such an integrated approach would be facilitated by a classification system which was
compatible with the materials and product classification system, as this would enable the
residual waste categories to be more easily linked to policy levers for materials and products.
In Phase 2 of this research, in order to gain a more detailed understanding of the materials and
products that become residual waste, it is recommended that the waste categories used within
Phase 1 could be mapped to the appropriate PRODCOM product categories.
Recommendation 4: Capture rates.
The decision to present the estimates based on two scenarios of hypothetical and practical was
included to demonstrate the impacts on the assumptions made in recovery system capture
rates. As in the case of compositional data for household waste, there is a need for further
research which provides a robust evidence base for projections on hypothetical capture rates
i.e. the capture rates that are achievable when a complete range of collection systems are in
place and these systems operate at their theoretical optimum. It is recommended that a
review of capture rates research to date be carried out, with a view to making
recommendations on future research and data needs.
6.REFERENCES
Burnley, S. (2007) A review of municipal solid waste composition in the United Kingdom.
Waste Management 27:1274-1285.
Burnley, S.J., J.C. Ellis, R. Flowerdew, A.J. Poll, H. Prosser. Assessing the Composition of
Municipal Solid Waste in Wales. (2007) Resources, Conservation and Recycling 49 (2007) 264–
283
Commission of the European Communities. Taking sustainable use of resources forward: A
Thematic Strategy on the prevention and recycling of waste. (2005).
Commission of the European Communities. Thematic Strategy on the sustainable use of natural
resources. (2005).
Department of Environment and Rural Affairs. Waste Strategy for England 2007 HMSO:
ID5528954 05/07 19585 369088. Available at:
http://www.defra.gov.uk/environment/waste/strategy/
Department of Environment and Rural Affairs Civic Amenity Sites: Overcoming Barriers to
Improve Performance and Assessing the Cost Benefits of Investment
Department of Environment and Rural Affairs. Municipal and Household Waste Statistics.
Available at: http://www.defra.gov.uk/environment/statistics/waste/wrmunicipal.htm
Department of Environment and Rural Affairs. Waste Compositional Analysis: Guidance for
Local Authorities (2004).
24

Friends of the EarthResidual Waste Research June 2007
Department of Environment and Rural Affairs. National Assessment of Civic Amenity Sites -
Future Challenges for CA Sites in the UK. (2004)
Department of Environment and Rural Affairs. Future West and Network Recycling. National
Assessment of Civic Amenity Sites: A guide to increasing recycling rates at your civic amenity
sites – Toolkit. (2004)
Department of Environment and Rural Affairs, formerly the Department of the Environment,
Transport and the Regions: London. Guidance on Municipal Waste Management Strategies.
(March 2001)
East Sussex County Council and the Borough and Districts of Eastbourne, Hastings, Lewes,
Rother and Wealden. Headline Municipal Waste Management Strategy: Draft for Public
Consultation.
Merseyside Waste Disposal Authority. Household Waste Composition Analysis Final Report.
(July 2006)
Norfolk Waste Partnership. Joint Municipal Waste Management Strategy for Norfolk. (December
2006)
Northern Ireland Environment & Heritage Service. Municipal Waste Management Northern
Ireland 2005/06 Summary Report. (December 2006) Available at:
http://www.ehsni.gov.uk/2005-06summaryreportmar07.pdf
Northern Ireland Environment & Heritage Service. Municipal Waste Management Northern
Ireland 2004/05 Summary Report. (December 2005) Available at:
http://www.ehsni.gov.uk/summaryreport211205.pdf
Parfitt, J . A Review of the United Kingdom Household Waste Arisings and Compositional Data.
(1996)
Parfitt, J . Analysis of Household Waste Composition and Factors Driving Waste Increases.
(2002)
Scottish Environment Protection Agency. Waste Data Digest 6. Available at:
http://www.sepa.org.uk/pdf/publications/wds/wdd_6.pdf
Scottish Environment Protection Agency. Consultation on a National Municipal Waste Analysis
Methodology. (2004) Available At:
http://www.sepa.org.uk/pdf/consultation/closed/2004/msw_method/msw_methodology.pdf
South Gloucestershire Council. A Study of Household Residual Waste Composition in South
Gloucestershire. (March 2005)
The Onyx Environmental Trust. Developing Integrated Waste Management Strategies:
Information Needs and the Role of Locally Based Data. (October 2003)
University of Paisley. Model Forecasts of Participation Rates and Capture Rates in Possible
Future Recycling Scenarios. (July 2002) Available at:
http://www.paisley.ac.uk/environment/recycling_participation.pdf
Welsh Assembly Government. Municipal Waste Management Survey. Available at:
http://new.wales.gov.uk/topics/environmentcountryside/epq/waste_recycling/Municipal_waste
_mngmnt_survey?lang=en
Waste and Resources Action Programme. Improving the Performance of Waste Diversion
Schemes: A Good Practice Guide to Monitoring and Evaluation. (2006).
25

Friends of the EarthResidual Waste Research June 2007
Appendix 1: Description of
Household Waste Categories
26

Friends of the EarthResidual Waste Research June 2007
Table 10: Description of Materials Included within Household Waste Categories
Waste Category Description of materials included
Newspapers and magazines Newspapers, Exchange & Mart, glossy magazines, telephone
directories, yellow pages, catalogues, travel, brochures.
Recyclable paper Unused wall paper, paper bags, paper packaging, mail in anenvelope, diaries, envelopes, letters, posters, writing, paper,
computer paper, books, travel tickets, loose leaf, paper,photocopies, non-glossy pamphlets.
Cardboard boxes/containers Boxes and packets for: cereal, washing powder, eggs, tissues,powdered milks, washing soda, biscuits, ice cream, fruit juice, milk,fabric conditioner. Corrugated card, greetings cards, postcards, beer
mats, files.
Other paper and card Wall paper removed from walls, photos, facial and toilet tissues,
kitchen paper.
Refuse sacks and carrier bags Plastic refuse bags and carrier sacks
Packaging film Cling film, sandwich bags, frozen food packets and biscuit wrappers
Other plastic film Bin liners and cellotape
Dense plastic bottles PET Bottles for fizzy soft drink, mineral water, squash, fruit juices,spirit miniatures, beer, cider. HDPE Bottles for milk, bleach, fruitjuice. LDPE Bottles for squeezy bottles including detergent bottles.
PVC Bottles for mineral water in coolers. PP Bottles for shampoobottles
Other packaging Other including: expanded polystyrene, margarine tubs, freezer
containers, yoghurt pots, clear egg boxes, cosmetic packaging,cassette boxes, and bottle crates.
Other dense plastic Baths, drainage pipes, spectacles & lenses, curtain rail fittings, rollerskate wheels, compact discs, decorative laminates, tableware,
ashtrays, kitchenware, toys, food storage containers records, watchstraps, washing up bowls, disposable cups, toys, toothbrushes and
any items that cannot be identified to any of the above groups.
Textiles Clothing and other or natural fibres.
Shoes Old shoes
Disposable nappies Disposable nappies
Wood Wooden boxes, pallets, cork packaging, wood from DIY, wood
fencing.
Furniture All furniture excluding kitchen units and work-tops
Carpet and underlay Carpet and underlay
Other miscellaneous combustibles Combustible flooring, combustible tiles, other sanitary products,
combustible items that do not fall easily into any of the abovecategories.
Packaging glass Brown glass: bottles and packaging. Green glass: bottles and
packaging. Clear glass: bottles and packaging.
Non-packaging glass Mirrors, reinforced glass, non-fluorescent light bulbs etc.
Garden waste Grass cuttings, weeds, flowers, prunings, tree branches, hedgetrimmings.
Kitchen waste Meat Excluded: Vegetable peelings & trimmings, fruit, including
cooked vegetables etc. (excluded at source). Meat Included:kitchen waste that contains or is potentially contaminated with meat
/ meat products.
Other organic wastes Pet excrement, bones (non-catering), dead animals.
Ferrous metal food/beverage cans Cans for beer, cola, pet food, food.
Other ferrous metal Keys, cutlery, bike locks, ring pulls, paper clips, safety pins, tools,
car parts, oil filters, biscuit tins, radiators, metal shelving units,perfume, hairspray.
Non-ferrous food and beverage cans Beer / cola, aerosols, ring pulls
Other non-ferrous metal Foil: aluminium foil, milk bottle tops, yoghurt tops; DIY non-ferrous
metal: copper pipe, stainless steel sink unit, saucepans, bike parts.
27

Friends of the EarthResidual Waste Research June 2007
White goods Refrigerators, freezers, washing machines, clothes dryers, dishwashing machines, electric stoves.
Large electronic goods Microwaves, electric heating, appliances, electric radiators, electric
fans, air conditioner appliances
TVs and monitors Television sets and computer screens
Other WEEE Small Household Appliances: vacuum cleaners, carpet sweepers, appliances for sewing, knitting, weaving and processing for
textiles, irons, toasters, fryers, grinders, coffee machines electricknives, hair dryers, toothbrushes, shavers, massage and other body
care appliances, clocks, watches. IT and TelecommunicationsEquipment: mainframes, printers, personal computers, laptops andaccessories (CPU, mouse, and keyboard included), copying
equipment, electrical and electronic typewriters, calculators, faxmachines, telex, telephones (including cordless & cellular),
answering machines. Consumer Equipment: radio sets, videocameras, video recorders, Hi-fi systems, audio amplifiers, musicalinstruments (electric, e.g. keyboards); Lighting Equipment: straight
& compact fluorescent lamps, other lighting or equipment for thepurpose of shedding or controlling light with the exception of
filament bulbs; Electrical & Electronic Tools: drills, saws,equipment for turning, milling, sanding, grinding, sawing, cutting,
shearing, drilling, making holes, punching, folding, bending; toolsfor riveting, nailing, screwing or removing rivets, nails, screws orsimilar uses; tools for welding, soldering or similar uses, tools for
mowing & other gardening activities. Toys, Leisure & SportsEquipment: electric trains, car racing sets, hand-held video games
& consoles; video games, computers for biking, running, rowing etc.sports related electronic equipment. Monitoring & ControlInstruments: smoke detectors, thermostats.
Lead/acid batteries Lead-acid batteries (including car batteries, other lead-acid
batteries)
Oil Engine/lubricating oil contained within a bottle or a can.
Identifiable clinical waste Syringes / sharps, medicinal products, potentially infectedhealthcare waste.
Other potentially hazardous Paint cans: with or without paint contained; other batteries(including household batteries, household rechargeable batteries);Pesticides: items containing pesticides, liquid or solid;
Other: Asbestos, fluorescent light bulbs, other householdhazardous waste, identifiable hazardous items that do not
fall readily into the above categories.
Construction and demolition waste DIY rubble (bricks etc), sand, gravel, non-combustible tiles, ceramic
toilets, ceramic wash basins, kitchen units and worktops, stones.
Other non-combustible material Crockery, flowerpots, cinder and soil.
Fines <10mm fines. i.e. material less that 10mm in particle size, not hand-sorted but classified as fines irrespective of composition. In generalthe material will be an ‘organic rich’ fraction.
Mixed bagged waste Mixed household wastes presented for Bulky Uplift and at Civic
Amenity Sites.
28

Friends of the EarthResidual Waste Research June 2007
Appendix 2: Estimated Tonnage
of Household Waste Arising by
Waste Category and Waste
Stream
29

Friends of the EarthResidual Waste Research June 2007
Table 11: Estimated Tonnage of Household Waste Arising by Waste Category and Waste
Stream in the UK
Estimated Tonnage of Waste Arising fromHousehold Sources
Estimated Total Tonnageof Household Waste
HouseholdCollected Waste
Civic AmenitySite Waste
BulkyWaste
Estimated household wastearisings in the UK 25,622,766 3,972,971 1,363,494 30,959,230
Waste Category
Newspapers and magazines 2,403,415 95,351 0 2,498,767
Recyclable paper 517,580 25,030 0 542,610
Cardboard boxes/containers 1,555,302 92,968 6,817 1,655,087
Other paper and card 1,575,800 68,732 0 1,644,532
Refuse sacks and carrier bags 491,957 5,165 0 497,122
Packaging film 479,146 2,781 0 481,927
Other plastic film 56,370 6,357 0 62,727
Dense plastic bottles 635,445 4,768 0 640,212
Other packaging 545,765 12,316 6,817 564,899
Other dense plastic 392,028 71,911 16,362 480,301
Textiles 620,071 77,870 3,409 701,350
Shoes 148,612 9,138 0 157,750
Disposable nappies 922,420 397 0 922,817
Wood 284,413 497,813 73,629 855,855
Carpet and underlay 192,171 194,676 88,627 475,473
Furniture 15,374 225,665 506,538 747,576
Other miscellaneouscombustibles 538,078 102,900 116,579 757,557
Packaging glass 1,716,725 47,278 4,090 1,768,094
Non-packaging glass 115,302 36,551 4,090 155,944
Garden waste 2,131,814 682,556 6,136 2,820,506
Kitchen waste 6,395,442 13,111 0 6,408,553
Other organic wastes 468,897 13,111 0 482,007
Ferrous metal food/beveragecans 643,131 5,165 0 648,296
Other ferrous metal 279,288 222,089 59,312 560,689
Non-ferrous food and beveragecans 130,676 1,192 0 131,868
Other non-ferrous metal 135,801 32,181 3,409 171,390
White goods 20,498 120,381 308,831 449,711
Large electronic goods 23,060 27,413 2,045 52,519
TVs and monitors 2,562 57,608 36,814 96,985
Other WEEE 140,925 57,608 57,267 255,800
Lead/acid batteries 20,498 25,030 0 45,528
Oil 10,249 4,370 0 14,619
Identifiable clinical waste 58,932 1,986 0 60,919
Other potentially hazardous 69,181 24,235 2,045 95,462
Construction and demolitionwaste 420,213 668,651 4,090 1,092,955
Other non-combustible material 289,537 55,622 24,543 369,702
Fines 1,165,836 15,892 0 1,181,728
Mixed bagged waste 0 368,692 18,407 387,099
PLEASE NOTE: The figures within each column do not add up to the total, this is due to the percentage split
data not adding up to 100%.
30
Related Documents