carterjonas.co.uk 1 SUMMER 2015

Residential-View-Spring-2015
Aug 14, 2015
Welcome message from author
This document is posted to help you gain knowledge. Please leave a comment to let me know what you think about it! Share it to your friends and learn new things together.
Transcript

carterjonas.co.uk 1
SUMMER 2015

2 © Carter Jonas 2015

carterjonas.co.uk 3
Rory O’Neill Partner, Head of Residential [email protected] 519705
WELCOME TO OUR LATEST EDITION OF RESIDENTIAL VIEW: YOUR INDISPENSABLE GUIDE TO THE UK’S RESIDENTIAL PROPERTY MARKET FOR SUMMER 2015
It has been a fascinating first half of the year as the country adjusts to the unexpected result of the General Election and the appointment of a new government. Now, with a Conservative majority, the approach is likely to be a continuation of what we have seen over the last five years. The country should now be entering a period of market stability and expect some assertive action from the government in terms of addressing the current undersupply of new homes.
In this issue of Residential View we consider the London markets: Super Prime, Prime Central London and Outer Prime; three areas where we are reporting differing capital values and rates of rental growth. Outside of London, comment on the farmhouse and country house markets is provided to demonstrate key trends which are evident within the market.
We take a closer look in our ‘areas of interest’ section at the UK Government’s Help-to-Buy scheme, questioning whether or not the Equity Loan element has in fact boosted new home supply. The other features at the end of this report explore the reasoning behind buyer preference for apartments rather than houses in Prime Central London and discuss the introduction of the Cities Devolution Bill and the implications for the residential property market over the next six months. We do hope you enjoy reading our latest research and features. Should you require any further information or advice on your property asset, please get in touch with the residential team or one of our research specialists, whose details can be found at the back of this report. We would be delighted to help you.
WE SHOULD NOW BE ENTERING A PERIOD OF MARKET STABILITY AND EXPECT SOME ASSERTIVE ACTION FROM THE GOVERNMENT IN TERMS OF ADDRESSING THE CURRENT UNDERSUPPLY OF NEW HOMES

4 © Carter Jonas 2015
of England. However, after a seven-year period of disparity within the market, 2015 looks set to be the year that the capital value performance of most national regions realign with London. This levelling has the potential to release pent-up demand from London households who have previously been hesitant to relocate while their London asset hugely outperformed any property acquired outside of the capital. Due to a number of years of double digit growth in most areas of London, record differentials between the price of London property compared with values in the regions are evident, boosting outward moving households’ buying power significantly.
AFFORDABILITYAffordability remains a serious issue at the lower end of the market. The Nationwide first-time buyer house price to earnings ratios at the end of 2014 showed the average first-time buyer now requires five times their average wage to purchase a property, a ratio not witnessed since just before the 2008 crash. As you would expect, the issue is most prevalent in London and the surrounding metropolitan area where ratios are currently at record levels. Affordability is also becoming a major issue for employers in areas such as Cambridge, Oxford and London, as high living costs are making it increasingly difficult to attract new talent and relocate existing staff. One consequence of this imbalance is a growing number of cash-rich, knowledge-intensive private limited companies exploring the option of acquiring large swathes of residential property in which to house their staff and future-proof their organisations. Although this does not yet signal a return to the company towns of the Industrial Revolution, it does highlight how seriously big business views the threat of a mounting housing crisis.
The year 2014 was another one of differing fortunes in the national housing market. The main indicators of house price inflation recorded nationwide annual growth of between 7 and 10% (average 8.2%), although great variations exist between regions, counties and even urban and rural locations. Although these variations have narrowed slightly to date in 2015, both agents and the data continue to tell the story of a fractured national housing market.
ECONOMIC MARKET
ECONOMIC OVERVIEWAlthough GDP growth slowed to 0.3% (q/q) during the first quarter of 2015, the annual growth figure stands at a healthy 2.6%. Due in part to low oil prices and the continuing retail price war, CPI inflation looks set to remain at around zero for at least the next six months meaning that a rise in the Bank of England (BoE) base rate appears unlikely during 2015. The labour market also continues to strengthen, with both the employment rate and vacancy levels continuing to rise. This trend should result in the currently modest real earnings growth becoming stronger towards the second half of 2015. The outright Conservative majority achieved in the General Election has also provided much needed clarity regarding the economy, and significantly the fiscal squeezes expected in the coming year. However with such a slender majority, the implementation of ambitious plans to eliminate the overall deficit by 2018/19 may prove difficult.
NATIONAL MARKET COMMENTARY
MARKETS WITHIN MARKETS, WITHIN MARKETSNowhere is this gap more evident than between the London and the North West markets. The December 2014 Land Registry figures recorded annual capital value growth in London of 16.3%, while this figure was just 1.5% in the North West

carterjonas.co.uk 5
POLICYThe recent Conservative majority has provided the continuity which is important to a stable housing market and should result in a more assertive approach to housing. We now expect the government’s focus to switch from the populist policies aimed at wooing home buyers, to the more long-sighted and contentious issue of how and where we are to deliver the 200,000–250,000 new homes required every year. Whilst policies such as the recent Help-to-Buy ISA and Equity Loan are generally welcomed, they must operate in tandem with an aggressive approach to delivering more homes, or risk becoming part of the problem they are aiming to address.
CHANGES TO STAMP DUTYPerhaps the most important event of 2014 was the unexpected change to the method stamp duty is calculated on the purchase of residential property. Announced during the Chancellor of the Exchequer’s Autumn Statement, the method in which the tax is charged has moved from a slab system, to a more fluid marginal system (similar to the way in which income tax is calculated). The welcomed new marginal method will, generally speaking, result in purchasers over £1m being charged a higher figure than previously with most purchasers under £1m experiencing significant savings. During his statement,
the Chancellor stated that the new system will equate to a £1bn give-away, although we forecast that rising house prices, increased transaction volumes (aided in part by the changes) and a continued trend in increasing receipt contributions from sales above £1m (this accounted for just under 30% of total receipts during 2013–14) will ensure that this fall in revenue should be overstated. However the compounding effect of further falls in PCL transaction levels, coupled with the new calculation method relying heavily on £1m+ sales, may result in a significant dent in projected receipts. This possible outcome will not have gone unnoticed at 11 Downing Street.
THE DEREGULATION BILL The Deregulation Bill gained Royal Assent on 26 March to become the Deregulation Act 2015. With the act containing a number of legislative changes relating to residential lettings, we have highlighted below some key areas where tenants and landlords should pay special attention. Keys points include:
1. Landlords no longer have to re-protect a deposit when a tenancy agreement reverts to a periodic tenancy at the end of the initial fixed term
2. Energy Performance Certificates need to be issued to prospective tenants at the point of enquiry to ensure that the contents of the certificates form part of the tenant’s decision-making process
3. Retaliatory evictions. Landlords are now unable to issue section 21 notices to quit for six months following the receipt of an improvement notice against a property. This does not affect the rights of landlords serving section 8 notices due to the tenant breaking the terms of the contract
4. London short-letting. The act removes the need to obtain change of use planning permission should a property be let for a period of less than 90 days. Owners of property within the 32 London boroughs will now be able to let their properties out for short periods providing they do not exceed 90 nights in one calendar year
ECONOMIC MARKET
Index Published 2014 house price inflation
ONS 9.8% (UK)
Nationwide 8.3% (UK)
Halifax 7.8% (UK)
Land Registry 7.0% (England and Wales)
6 © Carter Jonas 2015
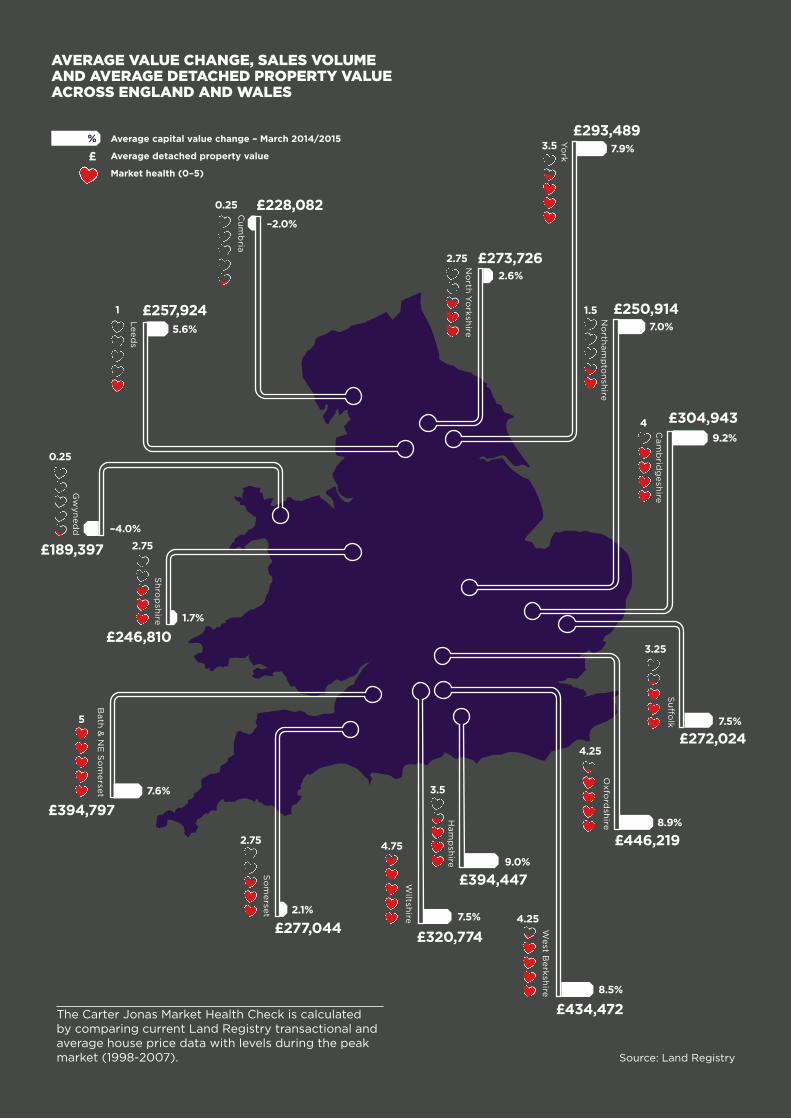
Average capital value change – March 2014/2015
Average detached property value
Market health (0–5)
AVERAGE VALUE CHANGE, SALES VOLUME AND AVERAGE DETACHED PROPERTY VALUE ACROSS ENGLAND AND WALES
%7.9%3.5
4
5
2.75
3.5
3.25
2.6%
7.0%
–2.0%
–4.0%
9.2%
9.0%
1.7%
5.6%
7.5%
7.5%
8.9%
2.1%
8.5%
7.6%
£
Source: Land Registry
Cu
mb
ria
No
rth Yo
rkshire
Le
ed
s
Yo
rk
No
rtham
pto
nsh
ire
Sh
rop
shire
Cam
brid
gesh
ireS
uff
olk
Oxfo
rdsh
ireHam
psh
ire
West B
erksh
ire
Wiltsh
ire
So
me
rset
Bath &
NE
So
me
rset
Gw
yne
dd
£228,082
£189,397
£246,810
£250,914
£304,943
£272,024
£446,219
£434,472
£394,447
£277,044
£394,797
£320,774
£273,726
£257,924
£293,489
1.5
4.25
4.25
4.752.75
0.25
1
0.25
2.75
The Carter Jonas Market Health Check is calculated by comparing current Land Registry transactional and average house price data with levels during the peak market (1998-2007).

carterjonas.co.uk 7
OVERVIEWAlthough Land Registry figures at the end of Q1 2015 showed average annual house prices in England and Wales close to eclipsing their 2007 peak, this data is heavily skewed by the rapid house price inflation recorded in London. Outside of London, only two other regions (the South East and East) have surpassed their previous peak, with average values in the Northern regions still 16–24% below the highs witnessed in late 2007/early 2008. Although less exaggerated, this geographical split can also be applied to transaction levels, where sales in Northern regions remain 29–33% below the peak market annual average, whilst this figure is just 15–17% below in Southern and Eastern areas.
TOWN/CITY MARKETOnce again, house price inflation in prime regional city/town markets outstripped their surrounding country markets due to the trend of semi-urban/urban living gathering pace. The previous 12 months have also witnessed this trend starting to draw larger scale investment away from London and
the major regional conurbations to smaller, more affluent towns and cities. This shift has been highlighted recently with the property investment arm of M&G agreeing a deal with Crest Nicholson to build 97 homes at Bath Riverside, specifically for the private rented market. Whilst it is too early to state if larger scale institutional investment in smaller, regional Private Rented Sector (PRS) markets will become commonplace, this investment in Bath, although relatively small in scale, may possibly be an indication of a future trend. Moving forward, this outperformance pattern is forecast to continue over the short and medium term as supply fails to meet demand. This will be compounded by an increase in households exiting London to take advantage of record differentials in home values between London and the rest of the country.
FARMHOUSE AND COUNTRY HOUSE MARKETWhilst early year activity from both purchasers and vendors was muted at the top end of the market, a post-election calm has resulted in a return to more natural levels of new instructions, viewings and most importantly, transactional levels. Due to the absence of the mansion tax threat, this pre-election trend was certainly not felt in the mid-lower end of the market, where strong demand was witnessed both before and after the General Election. Moving into the latter part of 2015, we expect an increase in the number of families exiting the London market to boost demand. Differentials between the capital and the country markets look to have reached the peak point of this cycle, which should result in a release of pent-up demand from outward moving London households. Values of £1m+ country houses are expected to hold firm for the coming months, beginning to rise circa 5% during 2016.
THE MARKETS
Average house prices Q1 2015 compared with the 2007/2008 peak market
35302520151050
–5–10–15
–20–25
Lond
on
So
uth
Eas
t
Eas
t
So
uth
Wes
t
Eas
t M
idla
nds
Wes
t M
idla
nds
Wal
es
York
s &
Hum
ber
No
rth
Wes
t
No
rth
Eas
t
8 © Carter Jonas 2015
2.5%
2.0%
1.5%
1.0%
0.5%
0.0%
60
50
40
30
20
10
0
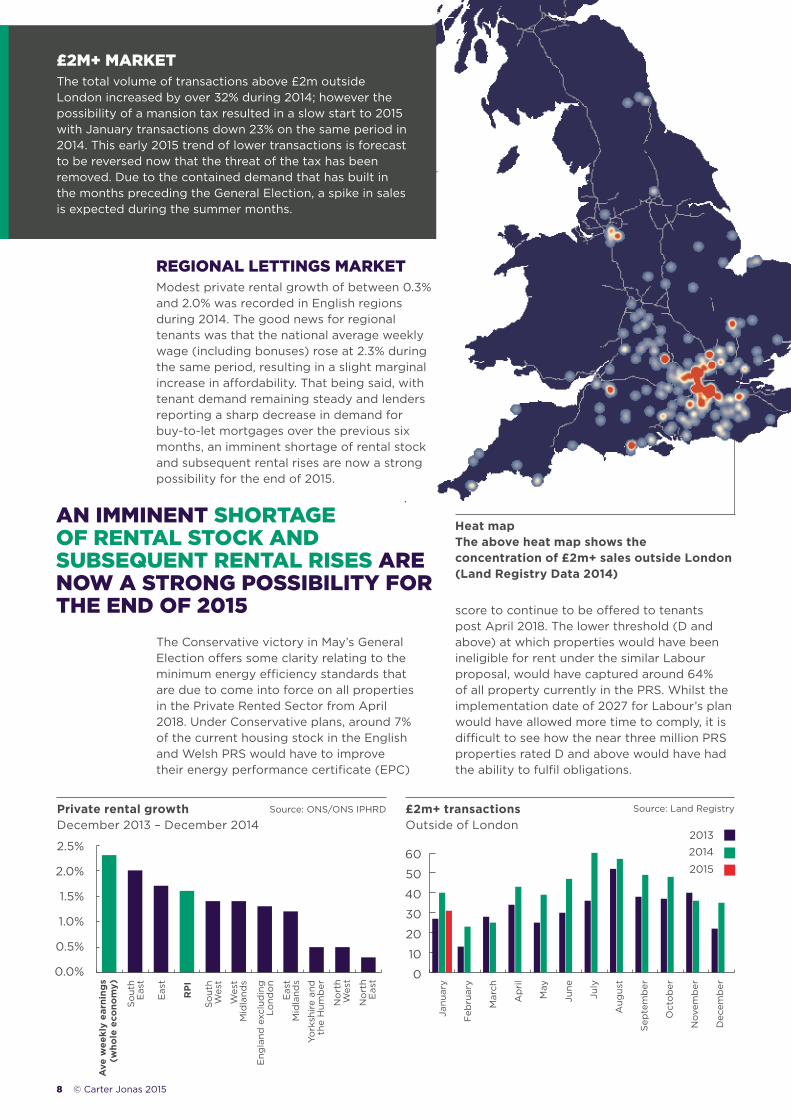
Private rental growth December 2013 – December 2014
£2m+ transactions Outside of London
Heat map The above heat map shows the concentration of £2m+ sales outside London (Land Registry Data 2014)
Ave
wee
kly
earn
ing
s (w
hole
eco
nom
y)
So
uth
Eas
t
So
uth
Wes
t
Wes
t M
idla
nds
Eng
land
exc
lud
ing
Lo
ndo
n
Eas
t M
idla
nds
York
shir
e an
d
the
Hum
ber
No
rth
Wes
t
No
rth
Eas
t
Janu
ary
Feb
ruar
y
Mar
ch
Ap
ril
May
June
July
Aug
ust
Sep
tem
ber
Oct
ob
er
Nov
emb
er
Dec
emb
er
Eas
t
RP
I
REGIONAL LETTINGS MARKETModest private rental growth of between 0.3% and 2.0% was recorded in English regions during 2014. The good news for regional tenants was that the national average weekly wage (including bonuses) rose at 2.3% during the same period, resulting in a slight marginal increase in affordability. That being said, with tenant demand remaining steady and lenders reporting a sharp decrease in demand for buy-to-let mortgages over the previous six months, an imminent shortage of rental stock and subsequent rental rises are now a strong possibility for the end of 2015.
The Conservative victory in May’s General Election offers some clarity relating to the minimum energy efficiency standards that are due to come into force on all properties in the Private Rented Sector from April 2018. Under Conservative plans, around 7% of the current housing stock in the English and Welsh PRS would have to improve their energy performance certificate (EPC)
score to continue to be offered to tenants post April 2018. The lower threshold (D and above) at which properties would have been ineligible for rent under the similar Labour proposal, would have captured around 64% of all property currently in the PRS. Whilst the implementation date of 2027 for Labour’s plan would have allowed more time to comply, it is difficult to see how the near three million PRS properties rated D and above would have had the ability to fulfil obligations.
£2M+ MARKETThe total volume of transactions above £2m outside London increased by over 32% during 2014; however the possibility of a mansion tax resulted in a slow start to 2015 with January transactions down 23% on the same period in 2014. This early 2015 trend of lower transactions is forecast to be reversed now that the threat of the tax has been removed. Due to the contained demand that has built in the months preceding the General Election, a spike in sales is expected during the summer months.
AN IMMINENT SHORTAGE OF RENTAL STOCK AND SUBSEQUENT RENTAL RISES ARE NOW A STRONG POSSIBILITY FOR THE END OF 2015
2013
2014
2015
Source: Land RegistrySource: ONS/ONS IPHRD

carterjonas.co.uk 9
1 Oxfordshire Woodstock Offers invited for a 20-year lease
2 Hampshire Newbury Hill, Penton Mewsey Guide price £1,395,000
3 North Yorkshire Skipton On Swale Guide price £895,000
1
2
3

10 © Carter Jonas 2015
Carter Jonas London index Capital values: Jan 2014–Mar 2015
120.00
115.00
110.00
105.00
100.00
95.00
90.00
85.00
80.00
Jan
14
Feb
14
Mar
14
Ap
r 14
May
14
Jun
14
Jul 1
4
Aug
14
Sep
14
Oct
14
Nov
14
Dec
14
Jan
15
Feb
15
Mar
15
Capital value performance March 2014–March 2015
Gross rental yield as of Q1 2015
CAPITAL VALUE PERFORMANCE AND RENTAL YIELD IN PRIME AND OUTER PRIME LONDON
%%
3.1%
11.1%
3.8%
9.5%
17.5%
11.8%2.0%
9.3%
11.4%
2.8%
3.1%
4.1%
4.0%
3.9%
3.6%2.9%
2.2%
3.3%
Source: Carter Jonas
Wandsworth
Mayfair
Knightsbridge
Chelsea
Barnes Fulham
Holland Park & Notting Hill
Hyde Park & Bayswater
Marylebone
Wandsworth
Fulham
Marylebone
Holland Park
Barnes & East Sheen
Knightsbridge
Hyde Park & Bayswater
Mayfair
Chelsea
PCL Super Prime (£10m+)
Source: Carter Jonas Research
carterjonas.co.uk 11
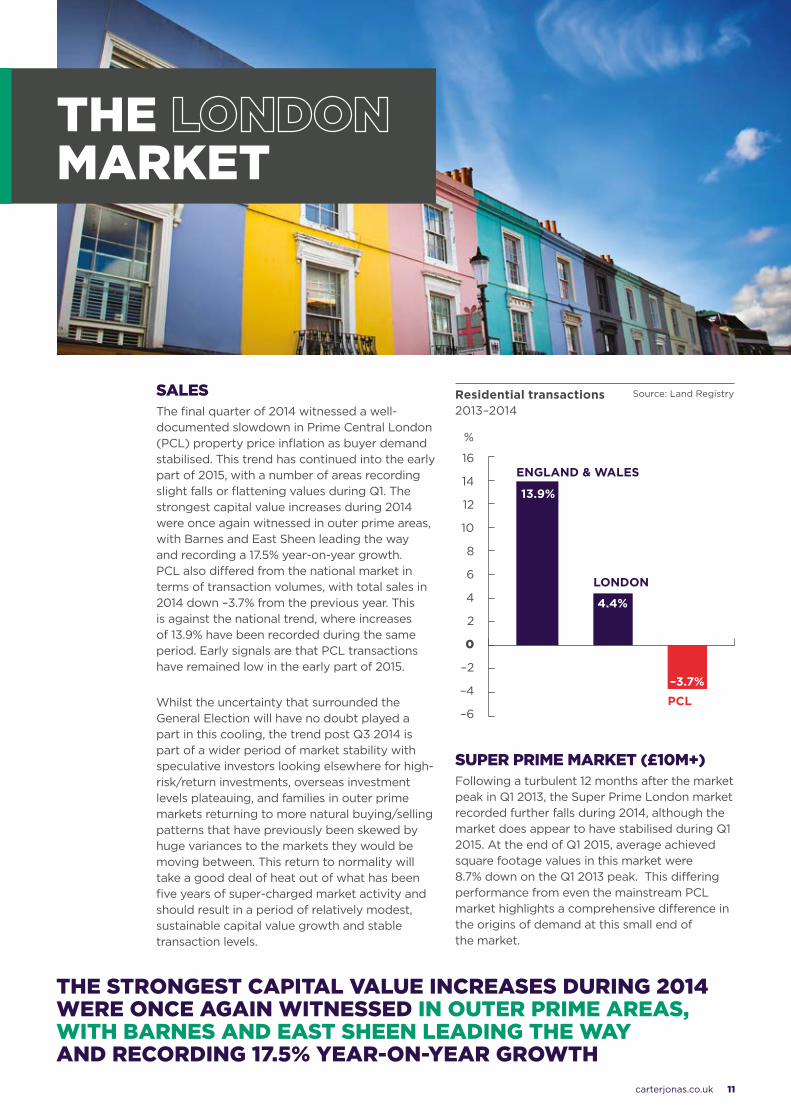
Residential transactions 2013–2014
16
14
12
10
8
6
4
2
0
–2
–4
–6
ENGLAND & WALES
LONDON
PCL
13.9%
4.4%
–3.7%
SALESThe final quarter of 2014 witnessed a well-documented slowdown in Prime Central London (PCL) property price inflation as buyer demand stabilised. This trend has continued into the early part of 2015, with a number of areas recording slight falls or flattening values during Q1. The strongest capital value increases during 2014 were once again witnessed in outer prime areas, with Barnes and East Sheen leading the way and recording a 17.5% year-on-year growth. PCL also differed from the national market in terms of transaction volumes, with total sales in 2014 down –3.7% from the previous year. This is against the national trend, where increases of 13.9% have been recorded during the same period. Early signals are that PCL transactions have remained low in the early part of 2015.
Whilst the uncertainty that surrounded the General Election will have no doubt played a part in this cooling, the trend post Q3 2014 is part of a wider period of market stability with speculative investors looking elsewhere for high-risk/return investments, overseas investment levels plateauing, and families in outer prime markets returning to more natural buying/selling patterns that have previously been skewed by huge variances to the markets they would be moving between. This return to normality will take a good deal of heat out of what has been five years of super-charged market activity and should result in a period of relatively modest, sustainable capital value growth and stable transaction levels.
THE MARKET
THE STRONGEST CAPITAL VALUE INCREASES DURING 2014 WERE ONCE AGAIN WITNESSED IN OUTER PRIME AREAS, WITH BARNES AND EAST SHEEN LEADING THE WAY AND RECORDING 17.5% YEAR-ON-YEAR GROWTH
Source: Land Registry
%
SUPER PRIME MARKET (£10M+)Following a turbulent 12 months after the market peak in Q1 2013, the Super Prime London market recorded further falls during 2014, although the market does appear to have stabilised during Q1 2015. At the end of Q1 2015, average achieved square footage values in this market were 8.7% down on the Q1 2013 peak. This differing performance from even the mainstream PCL market highlights a comprehensive difference in the origins of demand at this small end of the market.
12 © Carter Jonas 2015
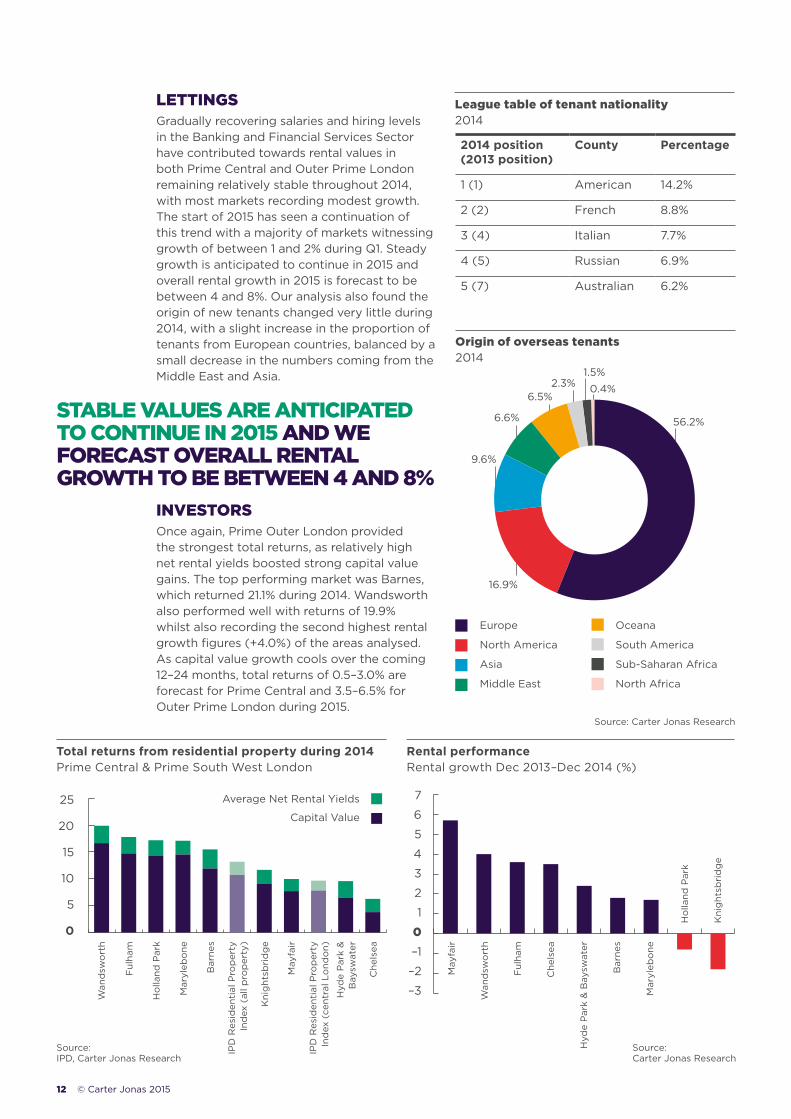
LETTINGSGradually recovering salaries and hiring levels in the Banking and Financial Services Sector have contributed towards rental values in both Prime Central and Outer Prime London remaining relatively stable throughout 2014, with most markets recording modest growth. The start of 2015 has seen a continuation of this trend with a majority of markets witnessing growth of between 1 and 2% during Q1. Steady growth is anticipated to continue in 2015 and overall rental growth in 2015 is forecast to be between 4 and 8%. Our analysis also found the origin of new tenants changed very little during 2014, with a slight increase in the proportion of tenants from European countries, balanced by a small decrease in the numbers coming from the Middle East and Asia.
INVESTORSOnce again, Prime Outer London provided the strongest total returns, as relatively high net rental yields boosted strong capital value gains. The top performing market was Barnes, which returned 21.1% during 2014. Wandsworth also performed well with returns of 19.9% whilst also recording the second highest rental growth figures (+4.0%) of the areas analysed. As capital value growth cools over the coming 12–24 months, total returns of 0.5–3.0% are forecast for Prime Central and 3.5–6.5% for Outer Prime London during 2015.
Europe
North America
Asia
Middle East
Oceana
South America
Sub-Saharan Africa
North Africa
2014 position (2013 position)
County Percentage
1 (1) American 14.2%
2 (2) French 8.8%
3 (4) Italian 7.7%
4 (5) Russian 6.9%
5 (7) Australian 6.2%
Origin of overseas tenants 2014
League table of tenant nationality 2014
56.2%
1.5%2.3%
6.5%
6.6%
9.6%
16.9%
0.4%
Rental performance Rental growth Dec 2013–Dec 2014 (%)
7
6
5
4
3
2
1
0–1
–2
–3
May
fair
Wan
dsw
ort
h
Ful
ham
Che
lsea
Hyd
e P
ark
& B
aysw
ater
Bar
nes
Mar
yleb
one
Ho
lland
Par
k
Kni
ght
sbri
dg
e
STABLE VALUES ARE ANTICIPATED TO CONTINUE IN 2015 AND WE FORECAST OVERALL RENTAL GROWTH TO BE BETWEEN 4 AND 8%
Total returns from residential property during 2014 Prime Central & Prime South West London
25
20
15
10
5
0
Wan
dsw
ort
h
Ful
ham
Ho
lland
Par
k
Mar
yleb
one
Bar
nes
IPD
Res
iden
tial
Pro
per
ty
Ind
ex (
all p
rop
erty
)
Kni
ght
sbri
dg
e
May
fair
IPD
Res
iden
tial
Pro
per
ty
Ind
ex (
cent
ral L
ond
on)
Hyd
e P
ark
&
Bay
swat
er
Che
lsea
Average Net Rental Yields
Capital Value
Source: Carter Jonas Research
Source: Carter Jonas Research
Source: IPD, Carter Jonas Research

carterjonas.co.uk 13
1 Bayswater Lancaster Gate, W2 £995 per week / £4,310 per month
2 Wandsworth Wiseton Road, SW17 £1,000 per week / £4,320 per month
3 Paddington Westbourne Terrace, W2 Guide price £3,500,000
1
2
3

14 © Carter Jonas 2015
Home construction Rental growth Dec 2013–Dec 2014 (%)
Whilst the rate at which new homes are delivered continues to increase, there remains significant obstacles in the way of balancing supply with the need of a growing, and geographically shifting, population. Below we look at some of the significant hurdles other than the well-documented planning and land use issues.
MATERIALSAlthough a 17% increase in brick production during 2014 (see graph below) looks to have halted the decline in stocks, levels remain historically very low. In response to this shortage, five previously mothballed plants have recently been reopened and European imports have been significantly increased which, at worst should lead to a steadying of stock levels. Moving forward, the government’s very public pledges regarding new home delivery should also provide the assurance major UK brick manufacturers need when committing large levels of investment towards increased output.
LABOURWith the shortage of labour and materials now at critical levels, the next 5–10 years may signal the emergence of industrial scale prefabricated, flat-pack homes. Ever since its modern reincarnation, this method of construction has witnessed less than expected popularity and growth, but advances in engineering technology and increasing labour and material shortages are beginning to build a stronger case for roll-out on a large scale. Another positive consequence would be the stability of employment this method provides to our construction workforce. Contracted employment, fixed place of work and secure order pipelines would all lead to creating an attractive environment for bringing in new and retaining existing workers.
PROJECTIONSIf the Conservative Government is successful in its plan to deliver new home completions of 200,000 per annum, it would require a significant period of increased construction. Our best case scenario projections (see graph below) show that the stated 200,000 figure would only be achieved in the last year of this new parliament, and would require a further four years of prolonged growth until the actual number of homes required (250,000 per annum) could be delivered. The cumulative shortfall accrued during this nine-year period would amount to approximately 400,000–450,000 homes, meaning that we would require a sustained period of oversupply in the years following 2022–2023 to the rebalance the preceding years’ undersupply.
196
9-7
019
70-7
119
71-7
219
72-7
319
73-7
419
74-7
519
75-7
619
76-7
719
77-7
819
78-7
919
79-8
019
80
-81
198
1-8
219
82-
83
198
3-8
419
84
-85
198
5-8
619
86
-87
1987
-88
198
8-8
919
89-9
019
90
-91
199
1-9
219
92-
93
199
3-9
419
94
-95
199
5-9
619
96
-97
1997
-98
199
8-9
919
99
-00
200
0-0
120
01-
02
200
2-0
320
03-
04
200
4-0
520
05-
06
200
6-0
720
07-
08
200
8-0
920
09
-10
2010
-11
2011
-12
2012
-13
2013
-14
2014
-15
2015
-16
2016
-17
2017
-18
2018
-19
2019
-20
2020
-21
2021
-22
2022
-23
400,000
350,000
300,000
250,000
200,000
150,000
100,000
50,000
0
800700600500400300200100
0
Brick stocks & production
UK completions
Brick stocks
Best case scenario projected completions
Brick production
Number of new homes required per year Government target
HOMES
Source: Department for Communities and Local Government/Carter Jonas
Source: Department for Business Innovation and Skills
Q1
2011
Q2
2011
Q3
2011
Q4
20
11
Q1
2012
Q2
2012
Q3
2012
Q4
20
12
Q1
2013
Q2
2013
Q3
2013
Q4
20
13
Q1
2014
Q2
2014
Q3
2014
Q4
20
14
Mill
ion

carterjonas.co.uk 15
SOLD
1 Cambridgeshire Swallow Gardens, Chesterton Guide price £445,000
2 Oxfordshire Alchester Park, Green Lane Prices from £280,000
3 Wiltshire Badelynge Yard, Urchfont Prices from £245,000
1
2
3
16 © Carter Jonas 2015
AREAS
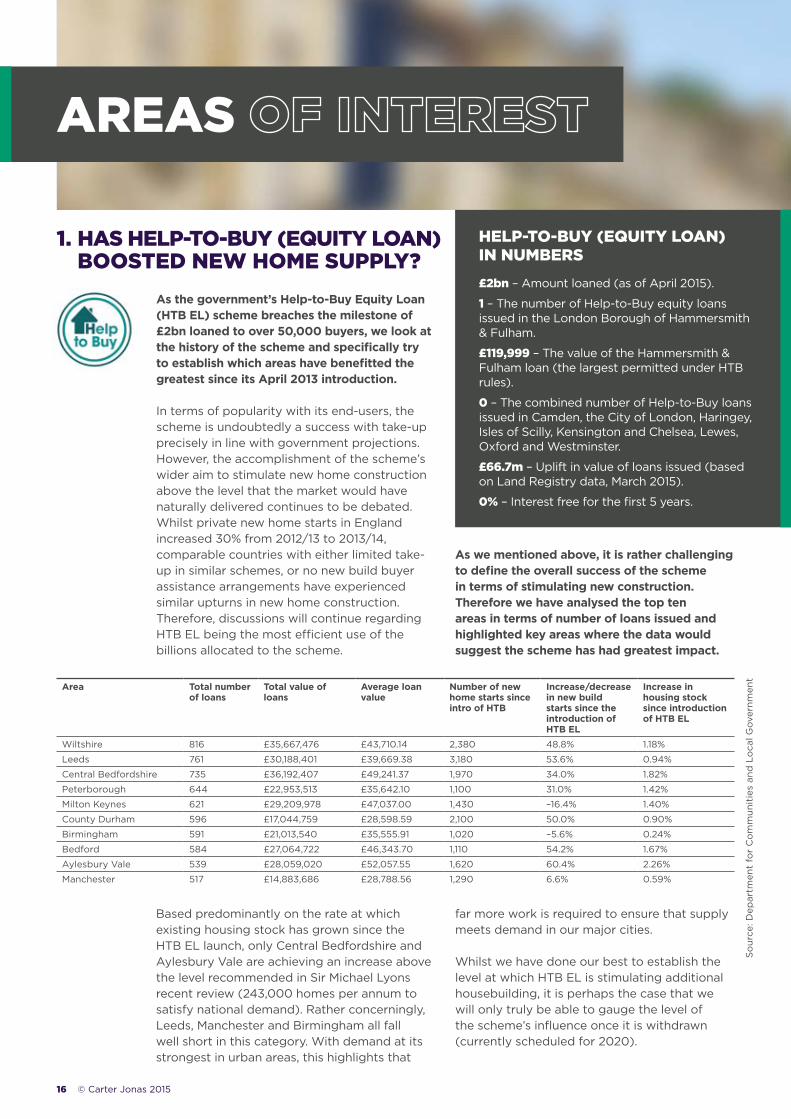
As the government’s Help-to-Buy Equity Loan (HTB EL) scheme breaches the milestone of £2bn loaned to over 50,000 buyers, we look at the history of the scheme and specifically try to establish which areas have benefitted the greatest since its April 2013 introduction. In terms of popularity with its end-users, the scheme is undoubtedly a success with take-up precisely in line with government projections. However, the accomplishment of the scheme’s wider aim to stimulate new home construction above the level that the market would have naturally delivered continues to be debated. Whilst private new home starts in England increased 30% from 2012/13 to 2013/14, comparable countries with either limited take-up in similar schemes, or no new build buyer assistance arrangements have experienced similar upturns in new home construction. Therefore, discussions will continue regarding HTB EL being the most efficient use of the billions allocated to the scheme.
1. HAS HELP-TO-BUY (EQUITY LOAN) BOOSTED NEW HOME SUPPLY?
£2bn – Amount loaned (as of April 2015).
1 – The number of Help-to-Buy equity loans issued in the London Borough of Hammersmith & Fulham.
£119,999 – The value of the Hammersmith & Fulham loan (the largest permitted under HTB rules).
0 – The combined number of Help-to-Buy loans issued in Camden, the City of London, Haringey, Isles of Scilly, Kensington and Chelsea, Lewes, Oxford and Westminster.
£66.7m – Uplift in value of loans issued (based on Land Registry data, March 2015).
0% – Interest free for the first 5 years.
As we mentioned above, it is rather challenging to define the overall success of the scheme in terms of stimulating new construction. Therefore we have analysed the top ten areas in terms of number of loans issued and highlighted key areas where the data would suggest the scheme has had greatest impact.
HELP-TO-BUY (EQUITY LOAN) IN NUMBERS
Area Total number of loans
Total value of loans
Average loan value
Number of new home starts since intro of HTB
Increase/decrease in new build starts since the introduction of HTB EL
Increase in housing stock since introduction of HTB EL
Wiltshire 816 £35,667,476 £43,710.14 2,380 48.8% 1.18%
Leeds 761 £30,188,401 £39,669.38 3,180 53.6% 0.94%
Central Bedfordshire 735 £36,192,407 £49,241.37 1,970 34.0% 1.82%
Peterborough 644 £22,953,513 £35,642.10 1,100 31.0% 1.42%
Milton Keynes 621 £29,209,978 £47,037.00 1,430 –16.4% 1.40%
County Durham 596 £17,044,759 £28,598.59 2,100 50.0% 0.90%
Birmingham 591 £21,013,540 £35,555.91 1,020 –5.6% 0.24%
Bedford 584 £27,064,722 £46,343.70 1,110 54.2% 1.67%
Aylesbury Vale 539 £28,059,020 £52,057.55 1,620 60.4% 2.26%
Manchester 517 £14,883,686 £28,788.56 1,290 6.6% 0.59%
Based predominantly on the rate at which existing housing stock has grown since the HTB EL launch, only Central Bedfordshire and Aylesbury Vale are achieving an increase above the level recommended in Sir Michael Lyons recent review (243,000 homes per annum to satisfy national demand). Rather concerningly, Leeds, Manchester and Birmingham all fall well short in this category. With demand at its strongest in urban areas, this highlights that
far more work is required to ensure that supply meets demand in our major cities.
Whilst we have done our best to establish the level at which HTB EL is stimulating additional housebuilding, it is perhaps the case that we will only truly be able to gauge the level of the scheme’s influence once it is withdrawn (currently scheduled for 2020).
So
urce
: Dep
artm
ent
for
Co
mm
unit
ies
and
Lo
cal G
over
nmen
t

carterjonas.co.uk 17
In response to anecdotal reports of a growing buyer preference for flats over houses, we investigated this potential trend to establish if demand had translated into values and what the possible drivers are for this development in the market.
In an attempt to make as close a like-for-like comparison as possible, we set the below parameters:
• Property size between 1,000 and 5,000 sq ft
• Properties sold between January 2013 and December 2014
• Properties located within Mayfair, St James’s, Knightsbridge and Belgravia
• All flats with sub-80 year leases excluded
The results of our analysis found that, based on average achieved square footage values, flats within the above parameters achieved a premium of just under 20% over comparable houses, or in monetary terms, an average of over £390 per square foot more.
2. WHY HAVE WE FALLEN OUT OF LOVE WITH HOUSES IN PRIME CENTRAL LONDON?
£0
APARTMENTS
HOUSES
Source: Carter Jonas Research
On the face of it, the lower running costs (no service charge or ground rent), the comfort offered by ultimate ownership, the increased privacy and greater individualism of houses should ensure a premium is achieved over flats; but it is apparent from the above graph that this is not the case. We hypothesise about the key drivers leading to the continuing buyer preference towards flats in the box opposite.
POSSIBLE REASONS FOR THE TREND
1. Overseas owners’ attitude Contrary to popular belief, large scale overseas investment in PCL residential property is not a new thing, but the preference for leasehold property (usually flats) is. Due to the perceived lack of actual ownership of leasehold property, overseas investors historically preferred to buy freehold property (usually houses). This trend, along with the dominant nationalities of modern overseas investors, has changed significantly over the previous decade. Foreign owners have a limited appetite for direct involvement with their investments and now opt for flats in professionally managed developments with a low administrative burden.
2. Recent lifestyle trends Current trends are also playing a part in the growing popularity of the flat. Lateral living is proving particularly popular at the moment, with a number of newer developments and conversions now starting to reflect this style. Alongside this, occupants of PCL property are becoming increasingly cash rich/time poor. People are becoming increasingly unwilling to take ownership of the issues related to the upkeep and maintenance of houses, such as gardening and structural repairs.
3. Security awareness Whilst it may not statistically be the case that we are more at risk of suffering from crime or anti-social behaviour, our collective perception of how secure we are has certainly become heightened in recent years. Flats, specifically in portered blocks, offer far greater security than houses, providing occupiers with the sanctuary they desire.
4. Investor trend The preference for flat living is not only confined to the owner-occupier market. With a majority of PCL tenants calling ‘home’ somewhere other than the UK, periods of non-occupation during the holiday seasons are widespread, ensuring that secure, managed developments of flats are highly sought-after. This demand has filtered through into investor returns, with flats generally benefitting from higher rental yields than comparable houses.
Average £ per sq ft achieved 2013 – 2014
£2,500£2,000£1,500£1,000£500

18 © Carter Jonas 2015
3. WHAT COULD DEVO MET MEAN FOR RESIDENTIAL PROPERTY MARKETS?
Arguably the most exciting prospect for the English residential property market in the medium-to-long term is the introduction of a Cities Devolution Bill, which will essentially hand powers regarding housing (amongst other things) to cities who have chosen to elect a mayor. Whilst it is early days to predict the actual powers that will be devolved, we have speculated as to how the innovation and competitiveness that city devolution could bring will alter the wider housing environment and change the public’s collective attitude towards housing.
THE WIDER HOUSING ENVIRONMENTAs competition heats up between cities looking to attract new business to their regions, the availability of affordable housing will come to the fore. This is a subject that is beginning to creep its way up the agenda of many major employers looking to future-proof their interests, and will no doubt strongly influence strategic decisions made regarding relocation and expansion. It will therefore become increasingly important for devolved cities to address this issue directly or risk losing out on both attracting new business and retaining businesses currently in the area. In the age of an increasingly mobile workforce, employers will not wish to make significant investments in cities, only to lose their talent because of decreasing local housing affordability.
AS COMPETITION HEATS UP BETWEEN CITIES LOOKING TO ATTRACT NEW BUSINESS TO THEIR REGIONS, THE AVAILABILITY OF AFFORDABLE HOUSING WILL COME TO THE FORE
COMMENTWe feel the real benefit to housing that city devolution will bring, will be an accelerated period of learning in terms of how best to deliver suitable and affordable housing. The country will effectively be running numerous simultaneous experiments with subsequent analysis and comparison, enabling cities to replicate and adapt approaches to best suit their markets. Cities that successfully strike the balance between maintaining affordability levels, whilst also creating an attractive environment for investment, will be held up as shining examples of the way forward. Cities that do not pay close attention to housing run the risk of becoming victims of their own success, with a lack of affordable accommodation eventually leading to a stall in growth.
THE PUBLIC’S ATTITUDEFor a long time, prolonged periods of above wage inflation and house value rises were viewed as a net positive. We feel that city devolution will bring with it a re-education of what constitutes sustainable growth and how it can be achieved without negatively impacting affordability levels. As housing affordability will form a major part of the prospectuses of cities looking to attract business to their region, we foresee awareness regarding the long-term sustainability of markets and the relationship between house price and wage inflation creeping into the local population’s collective consciousness. This should lead to and informed and more considered debate regarding local new home construction.

carterjonas.co.uk 19

20 © Carter Jonas 2015
Lisa Simon Partner, Head of Lettings 020 7518 3200 | 07976 761721 [email protected]
Catherine Penman Head of Research 01604 608203 | 07799 347200 [email protected]
Rory O’Neill Partner, Head of Residential 01672 519705 | 07801 666120 [email protected]
Lee Layton Research Analyst 01604 608212 | 07768 308737 [email protected]
© Carter Jonas 2015. The information given in this publication is believed to be correct at the time of going to press. We do not however accept any liability for any decisions taken following this newsletter. We recommend that professional advice is taken. Carter Jonas LLP uses the information it holds about you for marketing purposes and to administer, support, improve and develop our business. We may send them by post, telephone or fax, email or SMS. If you would rather NOT receive further information by any particular format, or at all, or if your details need updating, please contact [email protected]. We will not disclose personal information to any third parties without your permission to do so, unless we believe that we should do so to comply with the law.
To find out how Carter Jonas can help you with the sale or let of your property, or to book a complimentary market appraisal, please get in touch.
020 7518 3200One Chapel Place, London W1G 0BGcarterjonas.co.uk
DAY IN DAY OUT, OUR EXPERTS USE THEIR MARKET KNOWLEDGE, EXPERTISE AND COMPLETE LOVE OF PROPERTY TO DRIVE THEM TO GIVE THEIR CLIENTS THE VERY BEST POSSIBLE ADVICE.From selling your house or letting it, to conducting valuations or simply giving you professional advice based around your circumstances, we can help you.
35 OFFICES ACROSS THE COUNTRY, INCLUDING 12 IN CENTRAL LONDON
Bangor
Basingstoke
Bath
Boroughbridge
Cambridge South
Cambridge North
Cambridge Central
Cambridge - Sawston
Edinburgh
Harrogate
Kendal
Leeds
Marlborough
Newbury
Newbury - Sutton Griffin
Northampton
Oxford
Peterborough
Shrewsbury
Suffolk
Wells
Winchester
York
National HQ One Chapel Place
Barnes
Barnes Village
Fulham Bishop’s Park
Fulham Parsons Green
Holland Park & Notting Hill
Hyde Park & Bayswater
Knightsbridge & Chelsea
Marylebone & Regent’s Park
Mayfair & St James’s
Wandsworth Common
Waterloo
WESTMINSTER
KENSINGTON &CHELSEA
HAMMERSMITH
WANDSWORTH
RICHMOND UPON THAMES
LAMBETH
Related Documents