Residential energy demand in Brazil by income classes Issues for the energy sector Gilberto De Martino Jannuzzi Due to the lack of reliable statistical information, the majority of analyses concerning the structure of the residen- tial energy market of developing coun- tries do not disaggregate the demand by income classes. This component offers important strategies for energy planning in these countries, by making it possible to quantify the portions of society which have not entered the energy market and are more affected by internal energy price rises. This approach also emphasizes that the bulk of energy is consumed by a small fraction of the population, while a signi- ficant proportion of households do not benefit from energy services. Issues such as energy conservation, pricing and energy distribution, and the impact of technological changes must be dealt with differently in developing countries, including the characteristics of the structure of their energy markets according to Income classes. Keywords: Residential energy demand; Income; Energy market Gilberto De Martino Jannuzzi is with the Departamento de Energia, Faculdade de Engenharia, Universidade Estadual de Campinas-UNICAMP, CP 6122, 13081 Campinas, S&o Paulo, Brazil. The paper was written while the author was Technical Adviser to the S&o Paulo State Energy Council. 1Nearly 68% of the country's petrol corres- ponds to household use either for private transportation (52%) or for professional continued on page 255 Residential energy use in Brazil accounts for approximately 23% of total commercial energy demand, or 22% of the country's electricity and 29% of oil demand if petrol and alcohol for private transportation 1 is included (8% if only LPG and city gas are counted). If fuelwood is also included, the energy consumed by households corresponds to 42% of the country's final demand. 2 Nevertheless, nearly 20% of the 30 million households in the country do not consume electricity or cooking gas and more than 75% are not rich enough to afford vehicles. The scarce information available on the residential consumer has not provided correct assessments of the energy requirements of a large share of the population which has low consumption patterns or is not yet reached by the energy services. The future expansion of the electricity and LPG distribution systems, in particular, will have to contemplate the income characteristics of new customers, since it is important to know not only how much they will cost to the electric system, for example, but also how much they will be able to pay for the services provided and how much energy they will require. One of the characteristics of residential energy demand in developing countries is a large concentration amongst a small fraction of the population, giving misleading 'average' consumption figures and 'aver- age' energy profiles which hide the unevenness in the distribution of residential energy in Brazil, 3"4"5 a problem which is less crucial in industrialized countries. 6 The penetration levels of fuels and electricity in the household sector Historically the penetration of fuels and electricity in the Brazilian residential sector has increased since 1960 as shown in Table 1. In 1960 only 4% of households consumed petrol, while in 1985 this figure reached 25%. The low penetration shown in 1960 was partially due to 254 0301-4215/89/030254-10503.00 © 1989 Butterworth & Co (Publishers) Ltd

Welcome message from author
This document is posted to help you gain knowledge. Please leave a comment to let me know what you think about it! Share it to your friends and learn new things together.
Transcript
Residential energy demand in Brazil by income classes
Issues for the energy sector
Gilberto De Martino Jannuzzi
Due to the lack of reliable statistical information, the majority of analyses concerning the structure of the residen- tial energy market of developing coun- tries do not disaggregate the demand by income classes. This component offers important strategies for energy planning in these countries, by making it possible to quantify the portions of society which have not entered the energy market and are more affected by internal energy price rises. This approach also emphasizes that the bulk of energy is consumed by a small fraction of the population, while a signi- ficant proportion of households do not benefit from energy services. Issues such as energy conservation, pricing and energy distribution, and the impact of technological changes must be dealt with differently in developing countries, including the characteristics of the structure of their energy markets according to Income classes.
Keywords: Residential energy demand; Income; Energy market
Gilberto De Martino Jannuzzi is with the Departamento de Energia, Faculdade de Engenharia, Universidade Estadual de Campinas-UNICAMP, CP 6122, 13081 Campinas, S&o Paulo, Brazil. The paper was written while the author was Technical Adviser to the S&o Paulo State Energy Council.
1Nearly 68% of the country's petrol corres- ponds to household use either for private transportation (52%) or for professional
continued on page 255
Residential energy use in Brazil accounts for approximately 23% of total commercial energy demand, or 22% of the country's electricity and 29% of oil demand if petrol and alcohol for private transportation 1 is included (8% if only LPG and city gas are counted). If fuelwood is also included, the energy consumed by households corresponds to 42% of the country's final demand. 2 Nevertheless, nearly 20% of the 30 million households in the country do not consume electricity or cooking gas and more than 75% are not rich enough to afford vehicles.
The scarce information available on the residential consumer has not provided correct assessments of the energy requirements of a large share of the population which has low consumption patterns or is not yet reached by the energy services. The future expansion of the electricity and LPG distribution systems, in particular, will have to contemplate the income characteristics of new customers, since it is important to know not only how much they will cost to the electric system, for example, but also how much they will be able to pay for the services provided and how much energy they will require.
One of the characteristics of residential energy demand in developing countries is a large concentration amongst a small fraction of the population, giving misleading 'average' consumption figures and 'aver- age' energy profiles which hide the unevenness in the distribution of residential energy in Brazil, 3"4"5 a problem which is less crucial in industrialized countries. 6
The penetration levels of fuels and electricity in the household sector
Historically the penetration of fuels and electricity in the Brazilian residential sector has increased since 1960 as shown in Table 1. In 1960 only 4% of households consumed petrol, while in 1985 this figure reached 25%. The low penetration shown in 1960 was partially due to
254 0301-4215/89/030254-10503.00 © 1989 Butterworth & Co (Publishers) Ltd
aAuthor's estimates bin 1960, 3% of households used kerosene for cooking, in 1970 it dropped to 0.5%, and since 1980 this figure has been negligible (see G. De M. Jannuzzi, The Structure and Development of Personal Demand for Fuels and Electricity in Brazil, 1960-1982, PhD dissertation, University of Cambridge, Cambridge, UK, 1985). Penetra- tion levels were estimated assuming average annual consumption of 3.15 G J/household (Fun- daq&o Instituto Brasileiro de Geografia e Estatis- tica, Tabula~des Especiais do PNAD-79, FIBGE, Rio de Janeiro, Brazil, 1983) for 1980 and 1985, 4.07 G J/household for 1970 (Minister- io das Minas e Energia, Conselho Nacional do Petroleo, Anuario Estatistico, Ministerio das Minas e Energia, Brasilia, Brazil) and 5.00 G J/household for 1960 (authors estimate).
Sources: Funda~:&o instituto Brasileiro de Geog- rafia e Estatistica (FIBGE), Anuarios Estatisticos, FIBGE, Rio de Janeiro, Brazil; FIBGE, VII Re- censeamento Geral do Brasil 1960, Vol I, Serie Regional, Vol 1.1, Nos I-XlX, FIBGE, Rio de Janeiro, Brazil, 1963; FIBGE, VIII Recen- seamento Geral do Brasil 1970, Vol I, Nos I-XXlV, FIBGE, Rio de Janeiro, Brazil, 1973; FIBGE, IX Recenseamento Geral do Brasi11980, Censo DemogrMico: Familias e Domicilios, Vol I, Livro 6, No 1, FIBGE, Rio de Janeiro, Brazil, 1983.
continued from page 254 purposes (16%), ie petrol use in taxis and delivery vans privately owned. These fi- gures refer to the year 1979 and probably today's values are higher for household use due to the greater use of diesel for commercial transportation. 2Minist6rio das Minas e Energia, Balan~o Energetico Nacional 1985, Ministerio das Minas e Energia, Brasilia, Brazil, 1986. 3j. Goldemberg, 'Energy issues and poli- cies in Brazil', Annual Review of Energy, Vol 7, 1982, pp 139-174. 4G. Graga, T. Imenani and G. De M. Jannuzzi, 'O perfil do consumo pessoal de energia - Brasil 1979', Anais III Congresso Brasileiro de Energia, Outubro 1983. SA.C. Boa Nova, Energia e Classes Sociais no Brasil, Loyola, S&o Paulo, Brazil, 1985. 6L. Schipper and A. Ketoff, 'Home energy use in nine OECD countries: 1960-1980', Energy Policy, Vol 11, No 2, June 1983, pp 131-147; and L. Schipper, A. Ketoff and A. Kahane, 'Explaining residential energy use by international bottom-up comparisons', Annual Review of Energy, Vol 10, 1985, pp 341-405. 7United Nations Department of Internation- al and Economic Affairs, Statistical Year- book 1980, UN, New York, USA, 1981. 8Minimum Wage (M.W.) is the official unit of monthly salary, and is re-adjusted periodically. In 1979 1 M.W. = US$84.41/ month.
Residential energy demand in Brazil by income classes
Table 1. The penetration levels of fuels and electricity in Brazil's residential sector, 1960-85 (%).
Fuel 1960 1970 1980 1985 Petrol 4 9 22 25 a LPG and city gas 18 43 63 78 Electricity 38 47 68 80 Fuelwood 61 45 31 28 a Charcoal 5 4 6 4 a Kerosene b 20 20 14 7 Total number of households (millions) 13 18 25 30 % urban 47 58 70 76
the recent installation of foreign car manufacturers in the country at that time, a process which was only concluded in the mid-1960s, Ownership figures are still very low when compared with those of industrialized countries. For example, in 1979 Brazil had 60 passenger cars for every thousand people, while the UK had four times as many, Italy five times,
7 France six times and the USA ten times as many. The use of LPG has become more widespread in the country,
together with electricity. In 1960 only 18% and 38% of households consumed LPG and electricity respectively. These figures increased progressively up to 78% and 80% respectively in 1985. At the same time, the penetrat ion levels of fuelwood and kerosene declined as they were replaced by gas for cooking and electricity for lighting. The penetration of charcoal fluctuated over the period 1960-85 and its use has been restricted to a few urban areas in the country. The penetration of petrol (and alcohol) lags behind electricity and LPG since it is associated with the purchase of cars, an expensive item by Brazilian standards and not so essential an element in the household as cooking and lighting.
LPG penetration in the household sector was eased by a pricing policy adopted during the 1970s and early 1980s. It has been subject to subsidies which maintained its price practically stable in real terms (about US$350/ton, 1980 prices) over this period, making it more accessible to the population at large. Residential electricity rates also showed the same trend in the past of stable and even declining prices (US$50/MWh, in 1980), and in certain urban areas connection charges were eased for low-income households.
Penetration levels of fuels and electricity by income classes
If we consider the penetration levels of fuels by income classes, we note that these figures vary a great deal from the averages discussed above. The information displayed in Table 2 refers to the disaggregation of the household sector according to income classes delimited by multiples of the minimum salary unit (M.W.) for the year 1979. 8 Petrol consumption is strongly associated with income since its use depends on the ownership of cars. Thus, only the upper-income classes show a significant proport ion of households consuming petrol. About 90% of householders with monthly incomes higher than 20 M.W. (about US$1 600 in 1979) consumed this fuel, and this level drops rapidly as incomes decrease. The case of LPG and electricity is different, since both have more homogeneous penetration levels across income classes, with the exception of the lowest classes. Households with incomes ranging from 2 to 5 M.W. already show penetration levels of nearly 80% for LPG and electricity, which is high in a relatively low-income class. This results from the fact that they are more concentrated in urban areas
ENERGY POLICY June 1989 255
Residential energy demand in Brazil by income classes
Table 2. The penetration levels of modern fuels in the residential sector of Brazil by income class, 1979 (%).
aM.W. = Minimum Wage unit; 1 M.W. = US$84.41/month (1979) bAuthor's estimate based on FIBGE, Tabu/acOes Especiais do PNAD-79 and IX Recenseamento Geral do Brasi/1980, Censo DemogrMico : Fami- /ias e Domicilios, Vol 1, Livro 6, No 1, FIBGE, Rio de Janeiro, Brazil, 1983. CTotal number of households = 22.287 x 10⁶ (70% urban), population = 116.206 x 10⁶ (1979). Sources: Funda(;&o Instituto Brasileiro de Geog- rafia e Estatistica (FIBGE) Tabu/a~es Especiais do PNAD-79, FIBGE, Rio de Janeiro, Brazil, 1983; FIBGE, Pesquisa Naciona/ por Amostra de Domicilios - PNAD-1979, Vol 4, t l -8, FIBGE, Rio de Janeiro, Brazil, 1981.
Income classes (M.W.) a Average <2 2-5 5-10 10-20 >20 Total Urban Rural
Petrol 3 16 44 72 90 24 29 11 LPG and city gas 39 79 92 98 98 67 84 27 Electricity 58 79 94 98 99 71 90 24 Fuelwood b 74 44 22 12 6 31 11 77 Households by income class as % of total c 37 33 17 9 4
of the country (76% of them live in urban areas) where energy services are more readily available. This is not the case with households earning less than 2 M.W., which show penetration levels of 39% and 58% for LPG and electricity respectively and live mostly in rural areas (51% of them). 9 The penetration level of LPG and electricity is practically saturated in upper-income classes (>10 M.W.). Fuelwood is largely consumed by low-income classes and rural areas. Its penetration level drops sharply with the rise in income and while 77% of rural households consumed fuelwood only 11% of those living in urban areas used this fuel.
Location of households is partially responsible for the low penetration levels of modern fuels among the low-income classes. The information available for the rural and urban areas of the country permits the identification of some of the problems that will have to be faced by energy planners. Figure 1 shows the penetration levels of petrol, LPG and electricity in the country as a whole and in six different regions. There is a sharp contrast between the penetration of LPG and electricity in the rural and urban areas. While the presence of these fuels is more widespread in the urban areas, reaching saturation levels rapidly, in the rural areas a systematically worse situation is found throughout the whole country. The higher distribution costs and lack of transport facilities are the main causes of these low figures, and have maintained a large share of the rural population on the fringes of the commercial energy market.
9Fundac~o Instituto Brasileiro de Geografi- ca e Estatistica (FIBGE), 'Tabula(;oes especials do PNAD-79', Rio de Janeiro, Brazil, 1983. I°A.C. Pinheiro, 'Sobre a lSieseliza(;&o da Frota Brasileira de caminh6es', texto para Discuss&o Grupo de Energia No XVII, Instituto de Planejamento Econ6mico e Social, 1983. 111bid; G. De M. Jannuzzi, 'O consumo de gasolina e ~ilcool automotivo no Brasil: 1960-1985' Ci~ncia e Cultura, Vol 38, No 11, 1986, pp 1789-1796 (S~o Paulo, Brazil).
The demand for energy in the household sector
Energy demand has increased since 1960 as is shown in Table 3. Petrol and LPG showed higher annual growth rates during the decade 1960-70, while electricity registered a greater increase in the following decade, lowering during 1980-85. The decline in petrol demand (plus alcohol) from 8.2% in the 1960s to 4.4% in the 1970s and -0 .4% during 1980-85 was the result of the large price rises (from US$0.23/1 in 1973 to US$0.67/1 in 1980, 1980 dollars), technical improvements in cars and structural changes in the vehicle fleet, replacing Otto vehicles by diesel vehicles in commercial transport, l°'H The consumption of alcohol started in 1975 in blends with petrol (gasohol) and later, from 1980, directly in cars adapted to this fuel. In 1985 alcohol consumption represented 35% of passenger vehicle energy demand. The expansion of LPG use during the decade 1960-70 at an annual rate of 13.1% was caused by an intense process of urbanization and associated fuel substitution. The consumption of city gas by the residential sector represented only 4% of total LPG in 1985, and historically has showed lower rates of growth (5.3%/year since 1960) compared to LPG (9.4%).
256 E N E R G Y P O L I C Y June 1989
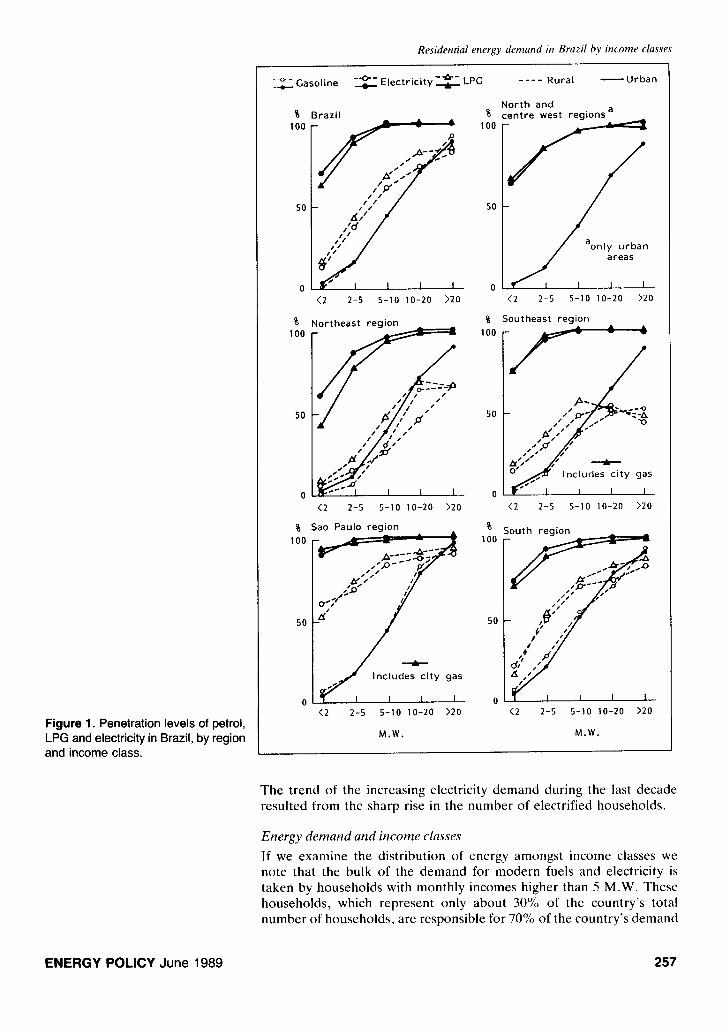
Figure 1. Penetration levels of petrol, LPG and electricity in Brazil, by region and income class.
Residential energy demand in Brazil by income classes
- ' ~ - Gasoline ~ E l e c t r i c i t y - ~ ' - LPG
1o0
50
0
100
50
100
50
Brazi l - ~ I00
p j l >.:::f " . ,#::7
~ - f l l I I o <2 2-5 5- I0 I0-20 ) 2 0
Northeast region ~o -- 100
50
~ ; , , , 0 <2 2-5 5-10 10-20 ) 2 0
Sao Paulo region ~o
- ~ . ~ _ _ 2 . ~ _ ~ 100
,,~<::'~ ,,/U ~,;'/ /__~ 50
<2 2-5 5- I0 I0-20 >20
.... Rural Urban
North and :entre west regions a
J , , 7 , <2 2 - 5 5 - 1 0 1 0 - 2 0 ) 2 0
Southeast region
S
<2 2-5 5- I0 I0-20 >20
South region
l /g ~" YII/ 'i ,/ j ,
Y . 1 t I I I
<2 2-5 5-10 I0-20 )20
M.W. M.W.
The trend of the increasing electricity demand during the last decade resulted from the sharp rise in the number of electrified households.
Energy demand and income classes
If we examine the distribution of energy amongst income classes we note that the bulk of the demand for modern fuels and electricity is taken by households with monthly incomes higher than 5 M.W. These households, which represent only about 30% of the country's total number of households, are responsible for 70% of the country's demand
ENERGY POLICY June 1989 257
Residential energy demand in Brazil by income classes
aThese figures refer to total consumption, see Ref 1. Table 3. The evolution of the demand for fuels and electricity in Brazil 's domest ic sector,
1960-85. Sources: Ministerio das Minas e Energia, Con- selho Nacional do PetrOleo, Anuario Estatistico, Ministerio das Minas e Energia, Brasilia, Brazil, annually since 1979; Ministerio das Minas e Energia, BalanGo Energetico Nacional, Minister- io das Minas e Energia, Brasilia, Brazil, annually since 1970; G. De M. Jannuzzi, The Structure and Development of Personal Demand for Fuels and Electricity in Brazil (1960-1982), PhD dis- sertation, University of Cambridge, Cambridge, UK, 1985; Funda~:Ao Instituto Brasileiro de Geografia e Estatistica (FIBGE), IX Recen- seamento Geral do Brasil 1980, Vol 1, Livro 6, No 2, 4, 7, 8--22, 25, 26, FIBGE, Rio de Janeiro, Brazil, 1983.
Energy demand (PJ) Annual growth rates (%) 1960 1970 1980 1985 60--70 70-80 80-85
Petrol and alcohoP 150 329 505 494 8.2 4.4 -0.4 LPG and city gas 19 65 137 178 13.1 7.7 5.4 Electricity 14 30 83 117 7.9 10.7 7.1 Fuelwood 432 583 452 410 3.0 -2.5 -1.9 Charcoal 11 11 23 20 0.0 7.6 -1.9 Kerosene 13 15 14 7 1.4 0.7 -12.9
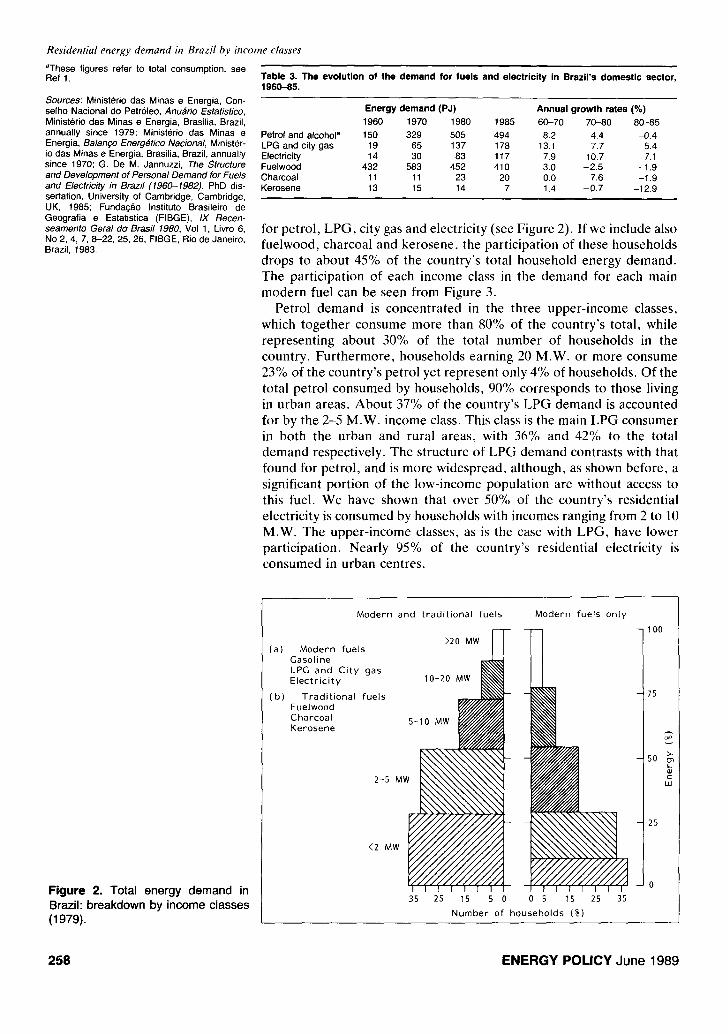
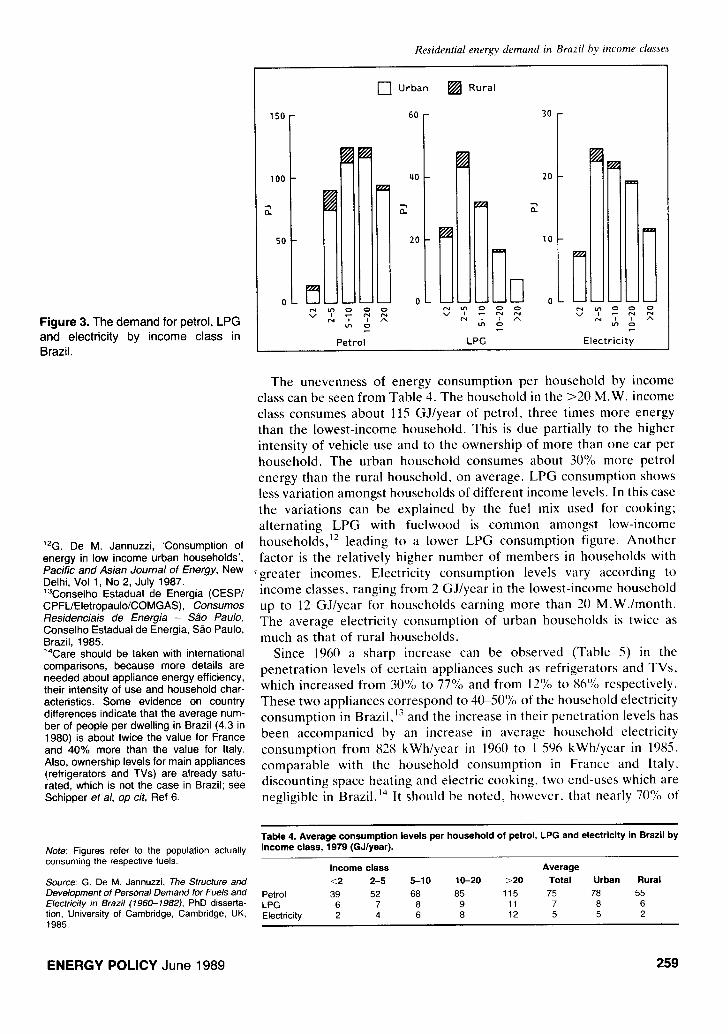
for petrol, LPG, city gas and electricity (see Figure 2). If we include also fuelwood, charcoal and kerosene, the participation of these households drops to about 45% of the country's total household energy demand. The participation of each income class in the demand for each main modern fuel can be seen from Figure 3.
Petrol demand is concentrated in the three upper-income classes, which together consume more than 80% of the country's total, while representing about 30% of the total number of households in the country. Furthermore, households earning 20 M.W. or more consume 23% of the country's petrol yet represent only 4% of households. Of the total petrol consumed by households, 90% corresponds to those living in urban areas. About 37% of the country's LPG demand is accounted for by the 2-5 M.W. income class. This class is the main LPG consumer in both the urban and rural areas, with 36% and 42% to the total demand respectively. The structure of LPG demand contrasts with that found for petrol, and is more widespread, although, as shown before, a significant portion of the low-income population are without access to this fuel. We have shown that over 50% of the country's residential electricity is consumed by households with incomes ranging from 2 to 10 M.W. The upper-income classes, as is the case with LPG, have lower participation. Nearly 95% of the country's residential electricity is consumed in urban centres.
Figure 2. Total energy demand in Brazil: breakdown by income classes (1979).
(a)
[b)
Modern and t rad i t iona l fuels
Modern fuels >20 M W ~ - r - Gasoline LPG and Ci ty gas E lec t r ic i ty 10-20 M~
Trad i t iona l fuels Fuelwood Charcoal 5-10 MW Vl l l l i l l i l l lA Kerosene
2-5 MW
<2 MW ~ I I I I I ] I I
35 25 15 5 0
Modern fuels only
I I I I I I I I 0 5 I 5 25 35
Number of households {%)
100
75
so
,F,
25
258 ENERGY POLICY June 1989
Residential energy demand in Brazil by income classes
Figure 3. The demand for petrol, LPG and electricity by income class in Brazil.
12G. De M. Jannuzzi, 'Consumption of energy in low income urban households', Pacific and Asian Journal of Energy, New Delhi, Vol 1, No 2, July 1987. 13Conselho Estadual de Energia (CESP/ CPFL/Eletropaulo/COMGAS), Consumos Residenciais de Energia - Sdo Paulo, Conselho Estadual de Energia, S&o Paulo, Brazil, 1985. 14Care should be taken with international comparisons, because more details are needed about appliance energy efficiency, their intensity of use and household char- acteristics. Some evidence on country differences indicate that the average num- ber of people per dwelling in Brazil (4.3 in 1980) is about twice the value for France and 40% more than the value for Italy. Also, ownership levels for main appliances (refrigerators and TVs) are already satu- rated, which is not the case in Brazil; see Schipper et al, op cit, Ref 6.
150
100
50
0
] Urban [ ] Rural
60 30 -
40 2 0 -
20 - 10
- - 0 - - - - 0 - -
Petrol LPG Electr ici ty
The unevenness of energy consumption per household by income class can be seen from Table 4. The household in the >20 M.W. income class consumes about 115 GJ/year of petrol, three times more energy than the lowest-income household. This is due partially to the higher intensity of vehicle use and to the ownership of more than one car per household. The urban household consumes about 30% more petrol energy than the rural household, on average. LPG consumption shows less variation amongst households of different income levels. In this case the variations can be explained by the fuel mix used for cooking; alternating LPG with fuelwood is common amongst low-income households, 12 leading to a lower LPG consumption figure. Another factor is the relatively higher number of members in households with
• greater incomes. Electricity consumption levels vary according to income classes, ranging from 2 G J/year in the lowest-income household up to 12 GJ/year for households earning more than 20 M.W./month. The average electricity consumption of urban households is twice as much as that of rural households.
Since 1960 a sharp increase can be observed (Table 5) in the penetrat ion levels of certain appliances such as refrigerators and TVs, which increased from 30% to 77% and from 12% to 86% respectively. These two appliances correspond to 40-50% of the household electricity consumption in Brazil, 13 and the increase in their penetrat ion levels has been accompanied by an increase in average household electricity consumption from 828 kWh/year in 1960 to 1 596 kWh/year in 1985, comparable with the household consumption in France and Italy, discounting space heating and electric cooking, two end-uses which are negligible in Brazil.14 It should be noted, however, that nearly 70% of
Note: Figures refer to the population actualty consuming the respective fuels.
Source: G. De M. Jannuzzi, The Structure and Development of Persona/Demand for Fuels and Electricity in Brazil (1960-1982), PhD disserta- tion, University of Cambridge, Cambridge, UK, 1985.
Table 4. Average consumption levels per household of petrol, LPG and electricity in Brazil by income class, 1979 (GJ/year).
Income class Average <2 2-5 5-10 10-20 >20 Total Urban Rural
Petrol 39 52 68 85 115 75 78 55 LPG 6 7 8 9 11 7 8 6 Electricity 2 4 6 8 12 5 5 2
ENERGY POLICY June 1989 259
Residential energy demand in Brazil by income classes
Sources: G. De M. Jannuzzi, The Structure and Development of Personal Demand for Fuels and Electricity in Brazil (1960-1982), PhD disserta- tion, University of Cambridge, Cambridge, UK, 1985; Funda(~&o Instituto Brasileiro de Geografia e Estatistica (FIBGE), Pesquisa Nacional por Amostra de Domicilios - PNAD-1985, FIBGE, Rio de Janeiro, Brazil, 1986.
Table 5. The penetration of selected appliances in electrified households in Brazil, 1960-85 (%).
1960 1970 1980 1985 Refrigerators 30 55 73 77 TV 12 51 82 86 Average kWh/yeadhousehold 828 1 140 1 542 1 596
Brazilian households consume less than the national average and that 4% have consumption levels 2.5 times as much.
Energy expenditure and income classes
Another relatively unknown factor is the proportion of household expenditure devoted to energy in relation to income. On average, the Brazilian household spends 0.8% of its monthly income on LPG and 1.5% on electricity. The rural household spends relatively more compared to the urban - 1.8% on LPG and 1.4% on electricity, against 0.8% and 1.2% respectively spent by the urban household. Considering the disaggregation in income classes, we note that lower-income households tend to have a larger share of their incomes commited to pay their energy bill, in spite of having lower consumption levels. LPG energy expenditures vary from 2.5% for the <2 M.W. income household to only 0.2% at the other extreme. For electricity the range is somewhat narrower, varying from 2.0% to 0.6% across the income classes studied (Table 6). Price rises will tend to have more impact on consumers with already low consumption levels and with less investment capacity for new and more efficient appliances.
Residential electricity rates in Brazil already incorporate discounts inversely proportional to the household monthly consumption. Thus the price of a 1-30 kWh/month consumer is 15% of that paid by a 400 kWh/month consumer (Table 7). Unlike industrialized countries, which take into account 'economies of scale' in their residential tariffs, these discounts serve as cross-subsidies to low-income households, which frequently have low consumption levels and present higher distribution costs. This helps to reduce the weight of the electricity bill on their budgets.
Some implications for the energy sector
The disaggregation of energy demand by income classes in Brazil is useful because it permits the consideration of important energy policies, such as conservation and pricing, enabling its impact and efficacy on the population to be assessed. In an urbanizing society with uneven income distribution there is a wide range of levels of energy consumption, reflecting also different lifestyles, housing characteristics, family sizes, appliance ownership and use. Future planning of the energy sector should take into account these differences in order to promote a more efficient use of energy, incorporate new consumers who are today outside this market, and provide for the requirements of those who have
Source: G. De M. Jannuzzi, The Structure and Development of Personal Demand for Fuels and Electricity in Brazil (1960-1982), PhD disserta- tion, University of Cambridge, Cambridge, UK, 1985.
Table 6. Estimated energy expenditure as % of monthly income in Brazil, LPG and electricity by income class, 1979.
Income class (M.W.) Average <2 2-5 5-10 10-20 >20 Total Urban Rural
LPG 2.5 1.5 0.8 0.4 0.2 0.8 0.8 1.8 Electricity 2.0 t .9 1.4 0.8 0.6 1.5 1.2 1.4
260 ENERGY POLICY June 1989
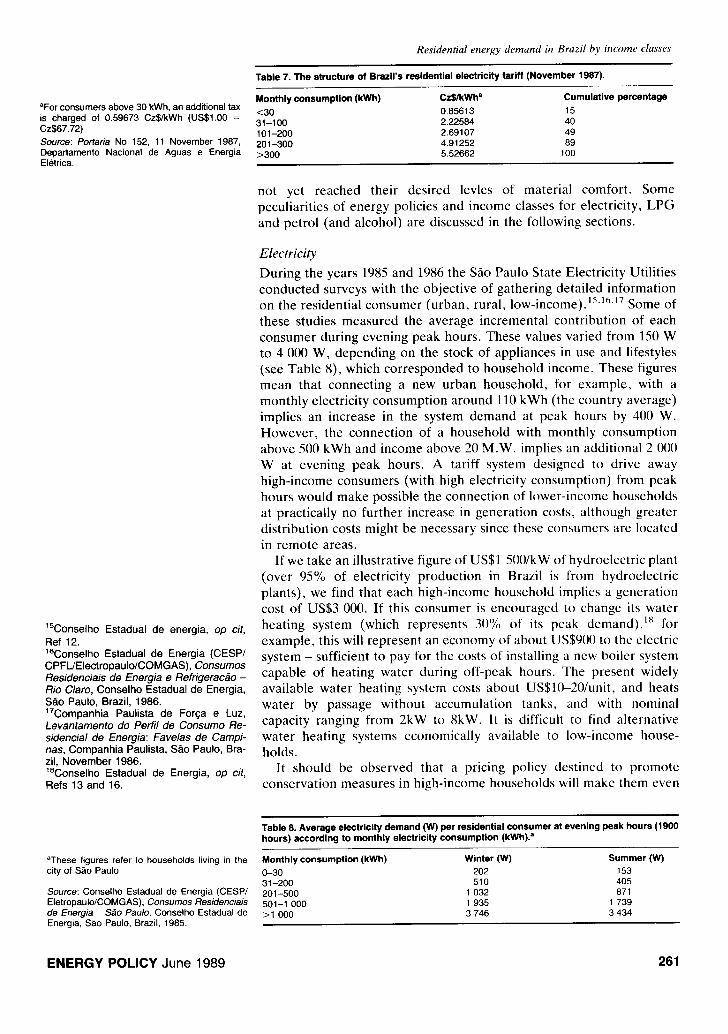
aFor consumers above 30 kWh, an additional tax is charged of 0.59673 Cz$/kWh (US$1.00 = Cz$67.72) Source: Portaria No 152, 11 November 1987, Departamento Nacional de Aguas e Energia Eletrica.
15Conselho Estadual de energia, op cit, Ref 12. lSConselho Estadual de Energia (CESP/ CPFL/Electropaulo/COMGAS), Consumos Residenciais de Energia e Refrigeracdo - Rio Claro, Conselho Estadual de Energia, S&o Paulo, Brazil, 1986. lZCompanhia Paulista de Forqa e Luz, Levantamento do Perfil de Consumo Re- sidencial de Energia: Favelas de Campi- nas, Companhia Paulista, S&o Paulo, Bra- zil, November 1986. ~SConselho Estadual de Energia, op cit, Refs 13 and 16.
Residential energy demand in Brazil by income classes
Table 7. The structure of Brazil's residential electricity tariff (November 1987).
Monthly consumption (kWh) Cz$/kWh" Cumulative percentage <30 0.85613 15 31-100 2.22584 40 101-200 2.69107 49 201-300 4.91252 89 >300 5.52662 100
not yet reached their desired levies of material comfort. Some peculiarities of energy policies and income classes for electricity, LPG and petrol (and alcohol) are discussed in the following sections.
Electricity
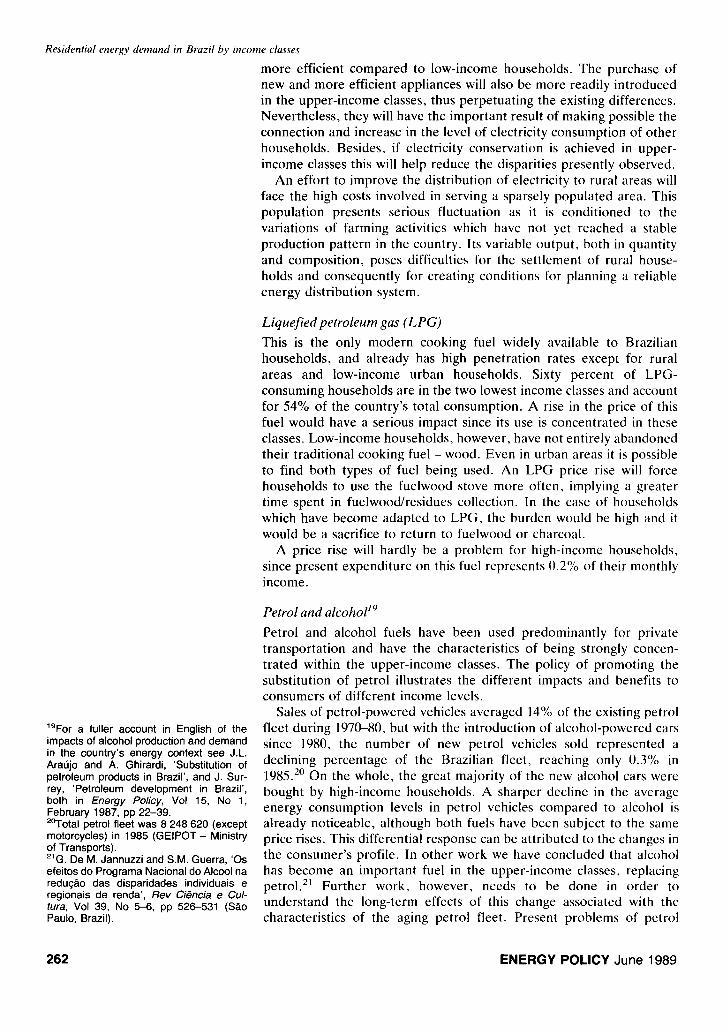
During the years 1985 and 1986 the Silo Paulo State Electricity Utilities conducted surveys with the objective of gathering detailed information on the residential consumer (urban, rural, low-income). 15,16,17 Some of these studies measured the average incremental contribution of each consumer during evening peak hours. These values varied from 150 W to 4 000 W, depending on the stock of appliances in use and lifestyles (see Table 8), which corresponded to household income. These figures mean that connecting a new urban household, for example, with a monthly electricity consumption around 110 kWh (the country average) implies an increase in the system demand at peak hours by 400 W. However, the connection of a household with monthly consumption above 500 kWh and income above 20 M.W. implies an additional 2 000 W at evening peak hours. A tariff system designed to drive away high-income consumers (with high electricity consumption) from peak hours would make possible the connection of lower-income households at practically no further increase in generation costs, although greater distribution costs might be necessary since these consumers are located in remote areas.
If we take an illustrative figure of US$1 500/kW of hydroelectric plant (over 95% of electricity production in Brazil is from hydroelectric plants), we find that each high-income household implies a generation cost of US$3 000. If this consumer is encouraged to change its water heating system (which represents 30% of its peak demand), TM for example, this will represent an economy of about US$900 to the electric system - sufficient to pay for the costs of installing a new boiler system capable of heating water during off-peak hours. The present widely available water heating system costs about US$10-20/unit, and heats water by passage without accumulation tanks, and with nominal capacity ranging from 2kW to 8kW. It is difficult to find alternative water heating systems economically available to low-income house- holds.
It should be observed that a pricing policy destined to promote conservation measures in high-income households will make them even
"These figures refer to households living in the city of S,ao Paulo.
Source: Conselho Estadual de Energia (CESP/ Eletropaulo/COMGAS), Consumos Residenciais de Energia - S~o Paulo, Conselho Estadual de Energia, S&o Paulo, Brazil, 1985.
Table 8. Average electricity demand (W) per residential consumer at evening peak hours (1900 hours) according to monthly electricity consumption (kWh)."
Monthly consumption (kWh) Winter (W) Summer (W) 0-30 202 153 31-200 510 405 201-500 1 032 871 501-1 000 1 935 1 739 >1 000 3 746 3 434
ENERGY POLICY June 1989 261
Residential energy demand in Brazil by income classes
more efficient compared to low-income households. The purchase of new and more efficient appliances will also be more readily introduced in the upper-income classes, thus perpetuating the existing differences. Nevertheless, they will have the important result of making possible the connection and increase in the level of electricity consumption of other households. Besides, if electricity conservation is achieved in upper- income classes this will help reduce the disparities presently observed.
An effort to improve the distribution of electricity to rural areas will face the high costs involved in serving a sparsely populated area. This population presents serious fluctuation as it is conditioned to the variations of farming activities which have not yet reached a stable production pattern in the country. Its variable output, both in quantity and composition, poses difficulties for the settlement of rural house- holds and consequently for creating conditions for planning a reliable energy distribution system.
Liquefied petroleum gas (LPG)
This is the only modern cooking fuel widely available to Brazilian households, and already has high penetration rates except for rural areas and low-income urban households. Sixty percent of LPG- consuming households are in the two lowest income classes and account for 54% of the country's total consumption. A rise in the price of this fuel would have a serious impact since its use is concentrated in these classes. Low-income households, however, have not entirely abandoned their traditional cooking fuel - wood. Even in urban areas it is possible to find both types of fuel being used. An LPG price rise will force households to use the fuelwood stove more often, implying a greater time spent in fuelwood/residues collection. In the case of households which have become adapted to LPG, the burden would be high and it would be a sacrifice to return to fuelwood or charcoal.
A price rise will hardly be a problem for high-income households, since present expenditure on this fuel represents 0.2% of their monthly income.
19For a fuller account in English of the impacts of alcohol production and demand in the country's energy context see J.L. Ara0jo and A. Ghirardi, 'Substitution of petroleum products in Brazil', and J. Sur- rey, 'Petroleum development in Brazil', both in Energy Policy, Vol 15, No 1, February 1987, pp 22-39. 2°Total petrol fleet was 8 248 620 (except motorcycles) in 1985 (GEIPOT- Ministry of Transports). 21G. De M. Jannuzzi and S.M. Guerra, 'Os efeitos do Programa Nacional do Alcool na redu(;&o das disparidades individuais e regionais de renda', Rev Ciencia e Cul- tura, Vol 39, No 5-6, pp 526-531 (S~.o Paulo, Brazil).
Petrol and alcohol t9
Petrol and alcohol fuels have been used predominantly for private transportation and have the characteristics of being strongly concen- trated within the upper-income classes. The policy of promoting the substitution of petrol illustrates the different impacts and benefits to consumers of different income levels.
Sales of petrol-powered vehicles averaged 14% of the existing petrol fleet during 1970--80, but with the introduction of alcohol-powered cars since 1980, the number of new petrol vehicles sold represented a declining percentage of the Brazilian fleet, reaching only 0.3% in 1985. 20 On the whole, the great majority of the new alcohol cars were bought by high-income households. A sharper decline in the average energy consumption levels in petrol vehicles compared to alcohol is already noticeable, although both fuels have been subject to the same price rises. This differential response can be attributed to the changes in the consumer's profile. In other work we have concluded that alcohol has become an important fuel in the upper-income classes, replacing petrol. 2~ Further work, however, needs to be done in order to understand the long-term effects of this change associated with the characteristics of the aging petrol fleet. Present problems of petrol
262 ENERGY POLICY June 1989
22Ara0jo and Ghirardi, op cit, Ref 19.
Residential energy demand m Brazil by income classes
surpluses 22 tend to be aggravated, however, as the prices are pegged to alCohol and alcohol vehicles predominate in the sales of new vehicles.
Concluding remarks Factual evidence has been presented on the wide variation of energy demand patterns associated with household income and place of residence (urban or rural). For LPG and electricity, the penetration levels in rural areas are much lower than in the urban ones for the same income class. Petrol presents similar penetration levels for urban and rural sectors, thus showing that, in this case, income is the most important parameter determining the use of petrol (and alcohol). The penetration of petrol rises sharply with income and nearly saturates in the upper-income classes.
The average energy consumption is very much determined by the household's income since it is associated with the purchase of energy consuming equipment. However , there is still the need to supply a fraction of the population which is outside the commercial energy market. As these services are expanded and households are able to improve their income levels they can become progressively a larger share of the residential energy market. Plans to make modern fuels more accessible to the population in general are an important component of future energy policies in Brazil and other developing countries.
We conclude by noting that the differing potential for energy conservation among income classes combined with a consistent pricing policy can help reduce today's disparities provided also that care is taken by local utilities and public authorities in order to supply good information and reliable services to consumers.
ENERGY POLICY June 1989 263
Related Documents