Petroleum & Coal ISSN 1337-702 Available online at www.vurup.sk/petroleum-coal Petroleum & Coal 55 (2) 119-127, 2013 RESERVOIR EVALUATION OF “DANNA” FIELD NIGER DELTA USING PETROPHYSICAL ANALYSIS AND 3D SEISMIC INTERPRETATION J. O. Amigun 1 and N. O. Bakare 1 1 Department of Applied Geophysics, Federal University of Technology, Akure, Nigeria Corresponding author E-mail: [email protected] Received February 25, 2013, Accepted April 22, 2013 Abstract Danna field is an oil field located in Niger Delta, Nigeria and the study was aimed at reservoir evaluation of the field using 3D seismic interpretation and petrophysical analysis. Five wells were correlated across the field to delineate the lithology and establish the continuity of reservoir sands as well as the general stratigraphy of the area. The petrophysical analysis carried out on the sand bodies indicates three sand units that are hydrocarbon bearing reservoirs (Sand J, Sand M and Sand P). These sand units were further evaluated using seismic interpretation. Time and depth structural maps were generated from seismic data to study the field’s subsurface structures serving as traps to hydrocarbon and estimate the prospect area of the reservoirs in acres. Parameters such as net pay, water saturation and porosity i.e. derived from well logs together with estimated prospect area as obtained from seismic interpretation were used to compute the field’s hydrocarbon reserve. Its gas reserve was estimated to be 225,997 bbl/ft 3 while the oil reserve for the three reservoirs (Sand J, Sand M and Sand P) is computed as 6,566,089.09bb/acre, 14,006,716bbl/acre and 42,746, 580bb/acre respectively. Keywords: seismic interpretation; hydrocarbon prospect; reservoir evaluation; petrophysical; analysis; Niger delta. 1. Introduction The uncertainty in the quantification of hydrocarbon reserve due to inadequate and poor definition of reservoir properties has been a major challenge in the oil industry. From exploration stage through to development and exploitation of hydrocarbon, 3D seismic interpretation and well log analysis are employed to provide information of oil field’s reservoir characterization for economic viability and cost effectiveness [1] . The application of petrophysical analysis and 3D seismic interpretation in this study is aimed primarily to identify and characterize the various reservoir units within the Danna field. The Danna field is an onshore oil field located in the Niger Delta region of southern Nigeria (Fig.1). The Niger Delta is known oil and gas rich province situated in the gulf of guinea and extends throughout the region as described by [2] . Petroleum in the Niger Delta is produced from sandstones and unconsolidated sands predominantly in the Agbada Formation. Recognized known reservoir rocks are of Eocene to Pliocene in age, and are often stacked, ranging in thickness from less than 15 meters to 10% having greater than 45 meters thickness [3] . Based on reservoir geometry and quality, the lateral variation in reservoirs thickness is strongly controlled by growth faults; with the reservoirs thickening towards the fault within the down- thrown block [4] . In order to achieve the aim of this study, the following were utilize; a base map, a suite of well logs of six wells comprising lithologic, resistivity and porosity logs, 3D seismic data in SEG Y format and check shot data of the study area. The results of this study were subsequently used to estimate the field’s hydrocarbon reserve which would aid in economic decision for further hydrocarbon exploration.

Welcome message from author
This document is posted to help you gain knowledge. Please leave a comment to let me know what you think about it! Share it to your friends and learn new things together.
Transcript
Petroleum & Coal ISSN 1337-702
Available online at www.vurup.sk/petroleum-coal Petroleum & Coal 55 (2) 119-127, 2013
RESERVOIR EVALUATION OF “DANNA” FIELD NIGER DELTA USING
PETROPHYSICAL ANALYSIS AND 3D SEISMIC INTERPRETATION
J. O. Amigun1 and N. O. Bakare1
1Department of Applied Geophysics, Federal University of Technology, Akure, Nigeria Corresponding author E-mail: [email protected]
Received February 25, 2013, Accepted April 22, 2013
Abstract
Danna field is an oil field located in Niger Delta, Nigeria and the study was aimed at reservoir evaluation of the field using 3D seismic interpretation and petrophysical analysis. Five wells were correlated across the field to delineate the lithology and establish the continuity of reservoir sands as well as the general stratigraphy of the area. The petrophysical analysis carried out on the sand bodies indicates three sand units that are hydrocarbon bearing reservoirs (Sand J, Sand M and Sand P). These sand units were further evaluated using seismic interpretation. Time and depth structural maps were generated from seismic data to study the field’s subsurface structures serving as traps to hydrocarbon and estimate the prospect area of the reservoirs in acres. Parameters such as net pay, water saturation and porosity i.e. derived from well logs together with estimated prospect area as obtained from seismic interpretation were used to compute the field’s hydrocarbon reserve. Its gas reserve was estimated to be 225,997 bbl/ft3 while the oil reserve for the three reservoirs (Sand J, Sand M and Sand P) is computed as 6,566,089.09bb/acre, 14,006,716bbl/acre and 42,746, 580bb/acre respectively. Keywords: seismic interpretation; hydrocarbon prospect; reservoir evaluation; petrophysical; analysis; Niger delta.
1. Introduction
The uncertainty in the quantification of hydrocarbon reserve due to inadequate and poor definition of reservoir properties has been a major challenge in the oil industry. From exploration stage through to development and exploitation of hydrocarbon, 3D seismic interpretation and well log analysis are employed to provide information of oil field’s reservoir characterization for economic viability and cost effectiveness [1]. The application of petrophysical analysis and 3D seismic interpretation in this study is aimed primarily to identify and characterize the various reservoir units within the Danna field.
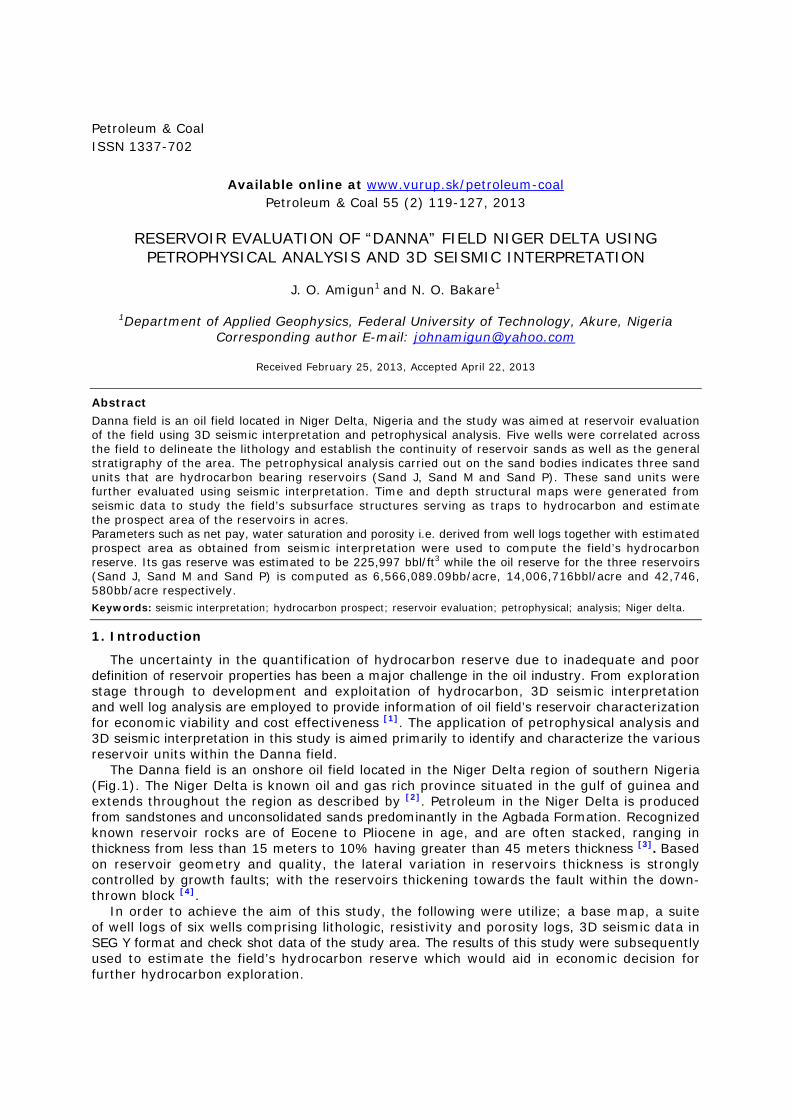
The Danna field is an onshore oil field located in the Niger Delta region of southern Nigeria (Fig.1). The Niger Delta is known oil and gas rich province situated in the gulf of guinea and extends throughout the region as described by [2]. Petroleum in the Niger Delta is produced from sandstones and unconsolidated sands predominantly in the Agbada Formation. Recognized known reservoir rocks are of Eocene to Pliocene in age, and are often stacked, ranging in thickness from less than 15 meters to 10% having greater than 45 meters thickness [3]. Based on reservoir geometry and quality, the lateral variation in reservoirs thickness is strongly controlled by growth faults; with the reservoirs thickening towards the fault within the down-thrown block [4].
In order to achieve the aim of this study, the following were utilize; a base map, a suite of well logs of six wells comprising lithologic, resistivity and porosity logs, 3D seismic data in SEG Y format and check shot data of the study area. The results of this study were subsequently used to estimate the field’s hydrocarbon reserve which would aid in economic decision for further hydrocarbon exploration.
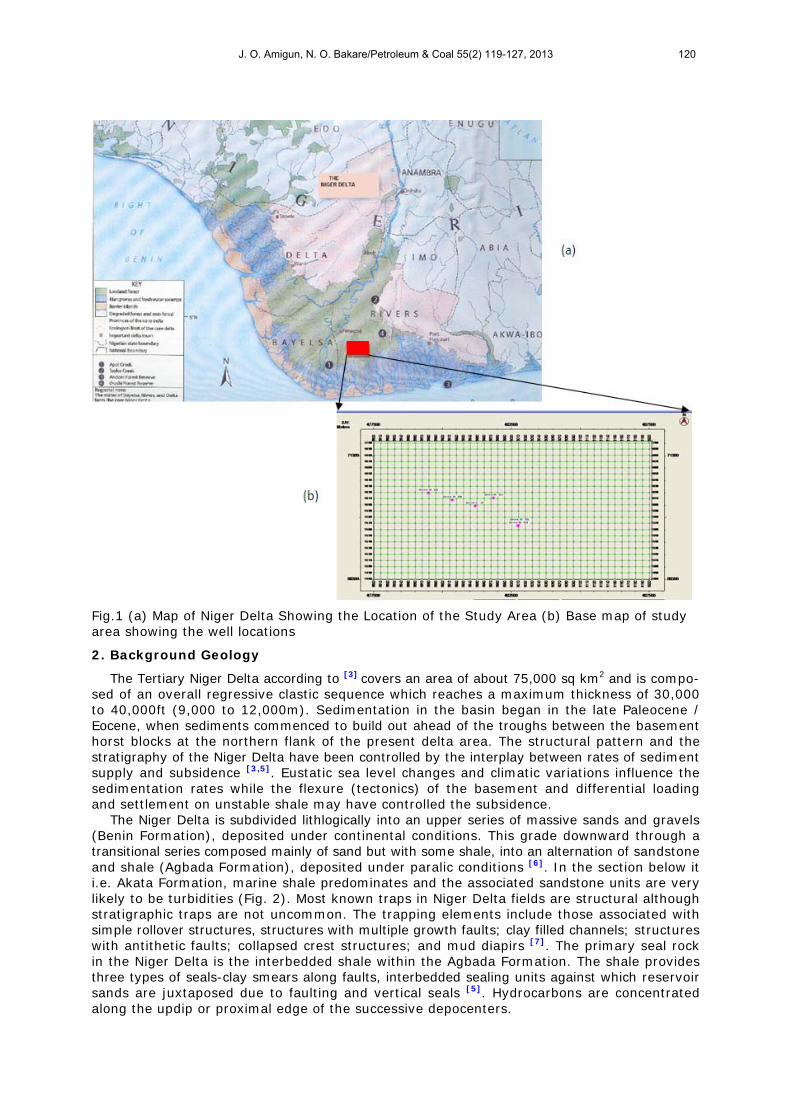
Fig.1 (a) Map of Niger Delta Showing the Location of the Study Area (b) Base map of study area showing the well locations
2. Background Geology
The Tertiary Niger Delta according to [3] covers an area of about 75,000 sq km2 and is compo-sed of an overall regressive clastic sequence which reaches a maximum thickness of 30,000 to 40,000ft (9,000 to 12,000m). Sedimentation in the basin began in the late Paleocene / Eocene, when sediments commenced to build out ahead of the troughs between the basement horst blocks at the northern flank of the present delta area. The structural pattern and the stratigraphy of the Niger Delta have been controlled by the interplay between rates of sediment supply and subsidence [3,5]. Eustatic sea level changes and climatic variations influence the sedimentation rates while the flexure (tectonics) of the basement and differential loading and settlement on unstable shale may have controlled the subsidence.
The Niger Delta is subdivided lithlogically into an upper series of massive sands and gravels (Benin Formation), deposited under continental conditions. This grade downward through a transitional series composed mainly of sand but with some shale, into an alternation of sandstone and shale (Agbada Formation), deposited under paralic conditions [6]. In the section below it i.e. Akata Formation, marine shale predominates and the associated sandstone units are very likely to be turbidities (Fig. 2). Most known traps in Niger Delta fields are structural although stratigraphic traps are not uncommon. The trapping elements include those associated with simple rollover structures, structures with multiple growth faults; clay filled channels; structures with antithetic faults; collapsed crest structures; and mud diapirs [7]. The primary seal rock in the Niger Delta is the interbedded shale within the Agbada Formation. The shale provides three types of seals-clay smears along faults, interbedded sealing units against which reservoir sands are juxtaposed due to faulting and vertical seals [5]. Hydrocarbons are concentrated along the updip or proximal edge of the successive depocenters.
J. O. Amigun, N. O. Bakare/Petroleum & Coal 55(2) 119-127, 2013 120
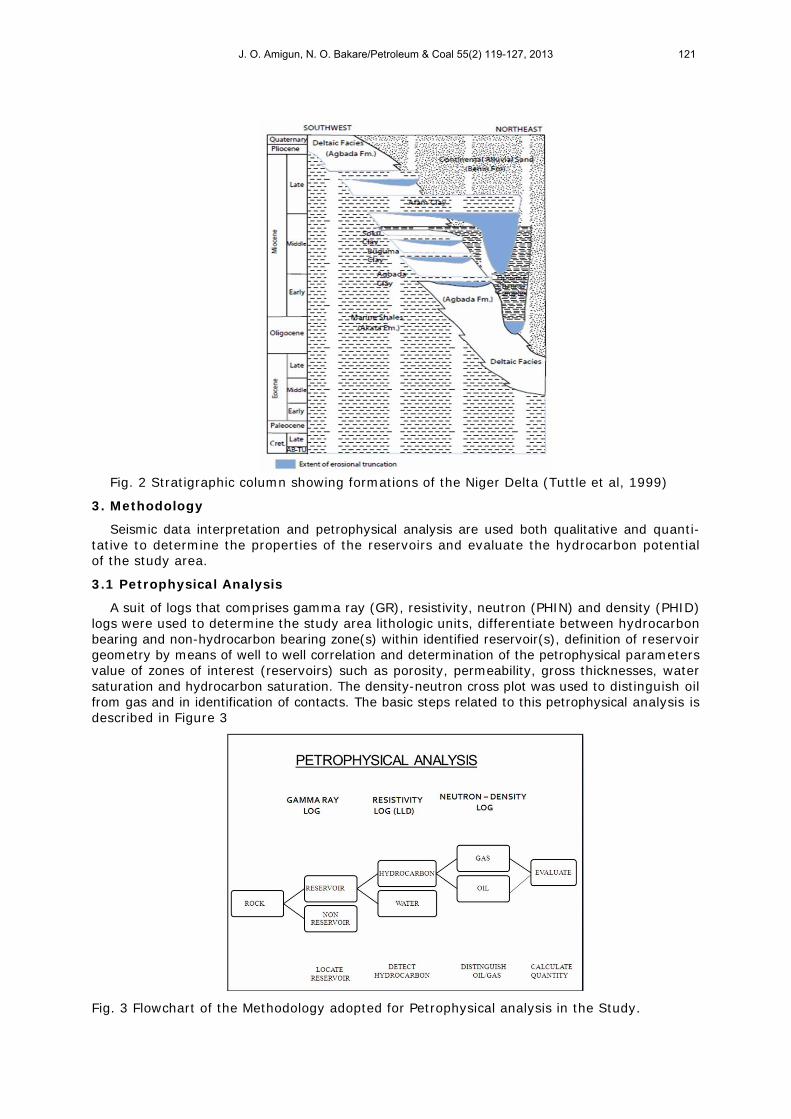
Fig. 2 Stratigraphic column showing formations of the Niger Delta (Tuttle et al, 1999)
3. Methodology
Seismic data interpretation and petrophysical analysis are used both qualitative and quanti-tative to determine the properties of the reservoirs and evaluate the hydrocarbon potential of the study area.
3.1 Petrophysical Analysis
A suit of logs that comprises gamma ray (GR), resistivity, neutron (PHIN) and density (PHID) logs were used to determine the study area lithologic units, differentiate between hydrocarbon bearing and non-hydrocarbon bearing zone(s) within identified reservoir(s), definition of reservoir geometry by means of well to well correlation and determination of the petrophysical parameters value of zones of interest (reservoirs) such as porosity, permeability, gross thicknesses, water saturation and hydrocarbon saturation. The density-neutron cross plot was used to distinguish oil from gas and in identification of contacts. The basic steps related to this petrophysical analysis is described in Figure 3
Fig. 3 Flowchart of the Methodology adopted for Petrophysical analysis in the Study.
J. O. Amigun, N. O. Bakare/Petroleum & Coal 55(2) 119-127, 2013 121
3.2 Seismic Interpretation
3D seismic reflection data was used in this study to map the subsurface structural features, infers geologic information and estimate the areas (in acres) of identified reservoirs from well logs. This method is known to provide a structural picture of the subsurface which is comparable to what could be obtained from a number of boreholes in close proximity [8].
3.2.1 Fault Picking
Faults which are displacement of rocks are easily identified and picked on the inlines (dip lines) of the seismic section by selecting across points where the seismic events truncates or at points of discontinuity. The faults picked were digitized from time surfaces on the 3D window.
3.2.2. Horizon Mapping
A horizon is a reflecting surface that appears on seismic sections and is recognized as coherent reflection event. For this study, the horizons were picked based on the prospective zones identified from petrophysical analysis of well logs. Three prospective zones specifically Horizon J, M and P were identified and the well to seismic tie was done using the check shot data. Time and the respective prospect area for each zone were identified and estimated respectively on the depth maps.
4. Results and Discussion
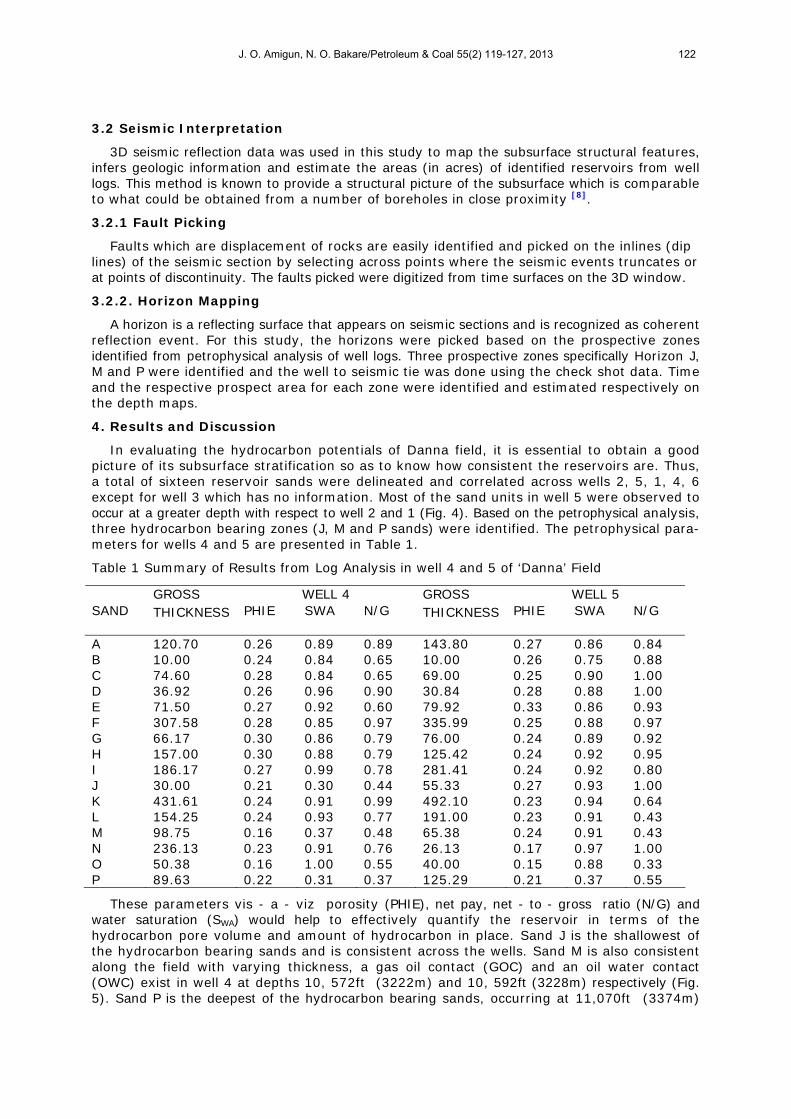
In evaluating the hydrocarbon potentials of Danna field, it is essential to obtain a good picture of its subsurface stratification so as to know how consistent the reservoirs are. Thus, a total of sixteen reservoir sands were delineated and correlated across wells 2, 5, 1, 4, 6 except for well 3 which has no information. Most of the sand units in well 5 were observed to occur at a greater depth with respect to well 2 and 1 (Fig. 4). Based on the petrophysical analysis, three hydrocarbon bearing zones (J, M and P sands) were identified. The petrophysical para-meters for wells 4 and 5 are presented in Table 1.
Table 1 Summary of Results from Log Analysis in well 4 and 5 of ‘Danna’ Field
WELL 4 WELL 5 SAND
GROSS THICKNESS PHIE SWA N/G
GROSS THICKNESS PHIE SWA N/G
A 120.70 0.26 0.89 0.89 143.80 0.27 0.86 0.84 B 10.00 0.24 0.84 0.65 10.00 0.26 0.75 0.88 C 74.60 0.28 0.84 0.65 69.00 0.25 0.90 1.00 D 36.92 0.26 0.96 0.90 30.84 0.28 0.88 1.00 E 71.50 0.27 0.92 0.60 79.92 0.33 0.86 0.93 F 307.58 0.28 0.85 0.97 335.99 0.25 0.88 0.97 G 66.17 0.30 0.86 0.79 76.00 0.24 0.89 0.92 H 157.00 0.30 0.88 0.79 125.42 0.24 0.92 0.95 I 186.17 0.27 0.99 0.78 281.41 0.24 0.92 0.80 J 30.00 0.21 0.30 0.44 55.33 0.27 0.93 1.00 K 431.61 0.24 0.91 0.99 492.10 0.23 0.94 0.64 L 154.25 0.24 0.93 0.77 191.00 0.23 0.91 0.43 M 98.75 0.16 0.37 0.48 65.38 0.24 0.91 0.43 N 236.13 0.23 0.91 0.76 26.13 0.17 0.97 1.00 O 50.38 0.16 1.00 0.55 40.00 0.15 0.88 0.33 P 89.63 0.22 0.31 0.37 125.29 0.21 0.37 0.55
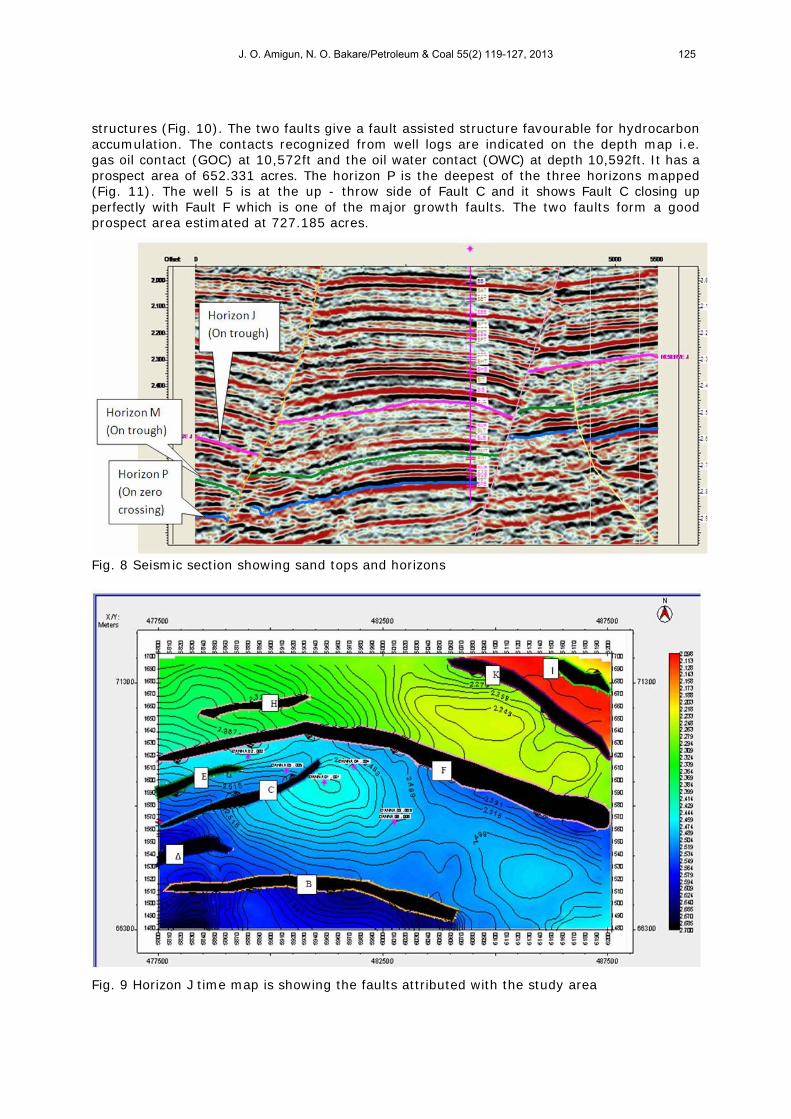
These parameters vis - a - viz porosity (PHIE), net pay, net - to - gross ratio (N/G) and water saturation (SWA) would help to effectively quantify the reservoir in terms of the hydrocarbon pore volume and amount of hydrocarbon in place. Sand J is the shallowest of the hydrocarbon bearing sands and is consistent across the wells. Sand M is also consistent along the field with varying thickness, a gas oil contact (GOC) and an oil water contact (OWC) exist in well 4 at depths 10, 572ft (3222m) and 10, 592ft (3228m) respectively (Fig. 5). Sand P is the deepest of the hydrocarbon bearing sands, occurring at 11,070ft (3374m)
J. O. Amigun, N. O. Bakare/Petroleum & Coal 55(2) 119-127, 2013 122
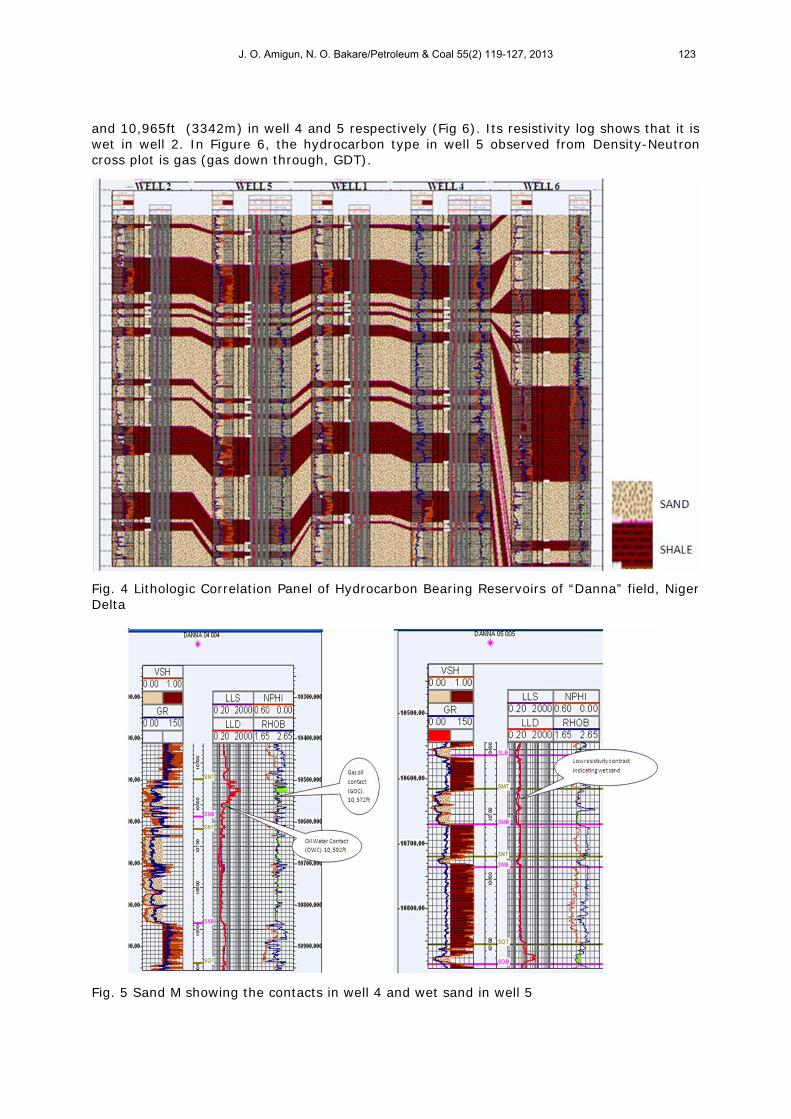
and 10,965ft (3342m) in well 4 and 5 respectively (Fig 6). Its resistivity log shows that it is wet in well 2. In Figure 6, the hydrocarbon type in well 5 observed from Density-Neutron cross plot is gas (gas down through, GDT).
Fig. 4 Lithologic Correlation Panel of Hydrocarbon Bearing Reservoirs of “Danna” field, Niger Delta
Fig. 5 Sand M showing the contacts in well 4 and wet sand in well 5
J. O. Amigun, N. O. Bakare/Petroleum & Coal 55(2) 119-127, 2013 123
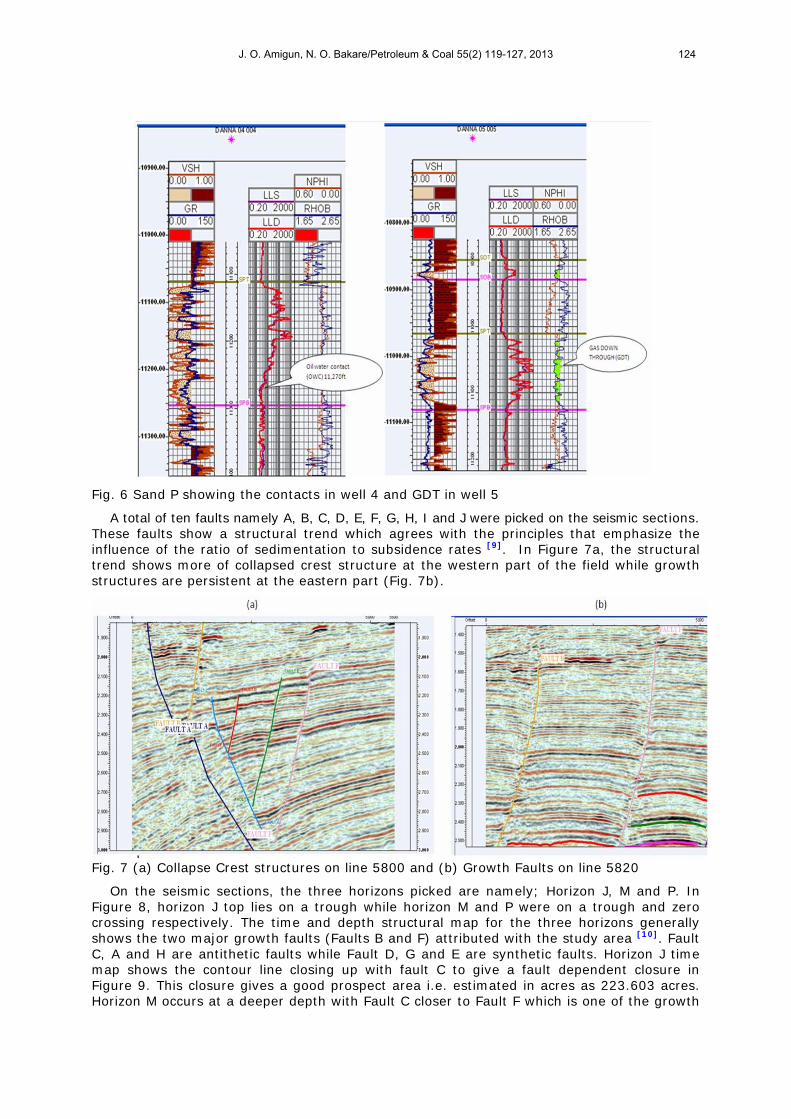
Fig. 6 Sand P showing the contacts in well 4 and GDT in well 5
A total of ten faults namely A, B, C, D, E, F, G, H, I and J were picked on the seismic sections. These faults show a structural trend which agrees with the principles that emphasize the influence of the ratio of sedimentation to subsidence rates [9]. In Figure 7a, the structural trend shows more of collapsed crest structure at the western part of the field while growth structures are persistent at the eastern part (Fig. 7b).
Fig. 7 (a) Collapse Crest structures on line 5800 and (b) Growth Faults on line 5820
On the seismic sections, the three horizons picked are namely; Horizon J, M and P. In Figure 8, horizon J top lies on a trough while horizon M and P were on a trough and zero crossing respectively. The time and depth structural map for the three horizons generally shows the two major growth faults (Faults B and F) attributed with the study area [10]. Fault C, A and H are antithetic faults while Fault D, G and E are synthetic faults. Horizon J time map shows the contour line closing up with fault C to give a fault dependent closure in Figure 9. This closure gives a good prospect area i.e. estimated in acres as 223.603 acres. Horizon M occurs at a deeper depth with Fault C closer to Fault F which is one of the growth
J. O. Amigun, N. O. Bakare/Petroleum & Coal 55(2) 119-127, 2013 124
structures (Fig. 10). The two faults give a fault assisted structure favourable for hydrocarbon accumulation. The contacts recognized from well logs are indicated on the depth map i.e. gas oil contact (GOC) at 10,572ft and the oil water contact (OWC) at depth 10,592ft. It has a prospect area of 652.331 acres. The horizon P is the deepest of the three horizons mapped (Fig. 11). The well 5 is at the up - throw side of Fault C and it shows Fault C closing up perfectly with Fault F which is one of the major growth faults. The two faults form a good prospect area estimated at 727.185 acres.
Fig. 8 Seismic section showing sand tops and horizons
Fig. 9 Horizon J time map is showing the faults attributed with the study area
J. O. Amigun, N. O. Bakare/Petroleum & Coal 55(2) 119-127, 2013 125
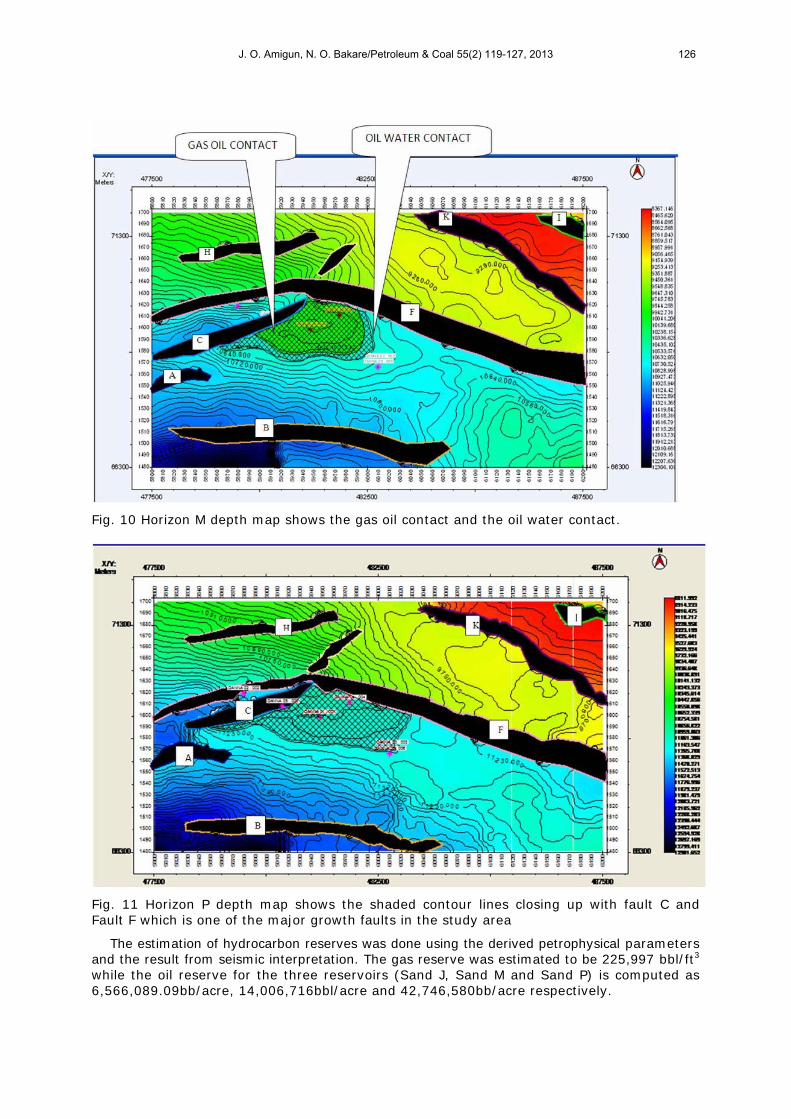
Fig. 10 Horizon M depth map shows the gas oil contact and the oil water contact.
Fig. 11 Horizon P depth map shows the shaded contour lines closing up with fault C and Fault F which is one of the major growth faults in the study area
The estimation of hydrocarbon reserves was done using the derived petrophysical parameters and the result from seismic interpretation. The gas reserve was estimated to be 225,997 bbl/ft3 while the oil reserve for the three reservoirs (Sand J, Sand M and Sand P) is computed as 6,566,089.09bb/acre, 14,006,716bbl/acre and 42,746,580bb/acre respectively.
J. O. Amigun, N. O. Bakare/Petroleum & Coal 55(2) 119-127, 2013 126
5. Conclusions
In this study, sixteen lithological units were identified in Danna field within the formation of interest (i.e. the Agbada Formation). Observation made from the correlation of the same lithologic unit shows that they vary in thickness and depth from one location to another within the field. Three hydrocarbon bearing sand units namely Sand J, M and P which lies within depths 9500ft (2896m) and11,080ft (3377m) were identified. Though varying in thickness and shale content, each of the sand unit is consistent across the field. They possess minimum hydrocarbon saturation of 50%; their porosity was estimated as ranging between 0.16 to 0.27 and therefore can be considered as hydrocarbon reservoirs.
The hydrocarbon bearing sand units were further evaluated using 3D seismic interpretation. The horizons picked for the three sand units were used to generate time and depth contour maps where the closures were delineated and estimated in acres. The result of the seismic interpretation and petrophysical analysis shows that the reservoirs under consideration have good hydrocarbon prospect.
6. Acknowledgements
We would like to thank Department of Petroleum Resource (DPR), a subsidiary of Nigerian National Petroleum Corporation (NNPC) for providing the dataset and Seismic Micro– Technology, Inc; USA and Schlumberger Nigeria Limited for the use of donated software Kingdom SuiteTM and PetrelTM respectively to the department of Applied Geophysics, Federal University of Technology, Akure.
References
[1] El-Mowafy, H. and Marfurt , K. (2008): Structural Interpretation of the Middle Frio Formation using 3D Seismic and Well logs: An Example from the Gulf Coast of the United State. The Leading Edge, vol. 27, No 7, p 840 – 848.
[2] Klett, T.R., Al brandt, T.S., Schmoker, J.W. and Dolton, J.L. (1997): Ranking of the world’s oil and gas provinces by known petroleum volumes: U.S. Geological Survey Open-file Report-97-463, CD-ROM.
[3] Evamy, B. D., Haremboure J., Kimberling R., Knaap W.A. and Molloy, F.A. (1978): Hydrocarbon habitat of tertiary Niger Delta, Nigeria, AAPG Bulletin, vol. 62: 1-39.
[4] Weber, K. J., and Daukoru, E. M. (1975): Petroleum geology of the Niger Delta: Proceedings of the Ninth World Petroleum Congress, volume 2, Geology: London, Applied Science Publishers, Ltd., p. 210-221.
[5] Doust, H. and Omatsola, O. (1990): Niger Delta; In Divergent and Passive margin Basin (Edwards J.D. Santoyrossi P.A. Eds.) American Association of Petroleum Geologists. Memoir 48, 191-248.
[6] Turtle L. W., Brownfield M.E, and Charpentier R.R. (1999): The Niger Delta petroleum system: Niger Delta Province, Nigeria Cameroon and Equatorial Guinea, Africa open-file Report 99-50-H.p. 7-38.
[7] Beka, F. T., and Oti, M. N. (1995): The offshore Niger Delta: frontier (16) 2, 112- 156 [8] Dobrin, M.B. and Savit, C.H. (1988), Introduction to Geophysical Prospecting,
McGraw Hill Book Co., Inc. New York, 78-113, 202-213, 286-327. [9] Curtis, D. M., (1970): Miocene deltaic sedimentation, Louisiana Gulf Coast. [In:] J. P.
Morgan (Ed.): Deltaic sedimentation - modern and ancient. SEPM Special Publication 15, 293-308.
[10] Koledoye A.B., Aydin A. and May E. (2000): Three – dimensional Visualization of Normal fault Segmentation and its Implication for fault Growth. The Leading Edge, vol. 19, No 7, p 692 – 701.
J. O. Amigun, N. O. Bakare/Petroleum & Coal 55(2) 119-127, 2013 127
Related Documents