RESERVOIR AND CULTURE-BASED FISHERIES: BIOLOGY AND MANAGEMENT Proceedings of an International Workshop held in Bangkok, Thailand from 15–18 February 2000 Editor: Sena S. De Silva Australian Centre for International Agricultural Research Canberra, 2001

Welcome message from author
This document is posted to help you gain knowledge. Please leave a comment to let me know what you think about it! Share it to your friends and learn new things together.
Transcript
1
RESERVOIR AND CULTURE-BASED FISHERIES: BIOLOGY AND
MANAGEMENT
Proceedings of an International Workshop held inBangkok, Thailand from 15–18 February 2000
Editor: Sena S. De Silva
Australian Centre for International Agricultural ResearchCanberra, 2001

The Australian Centre for International Agricultural Research (ACIAR) was establishedin June 1982 by an Act of the Australian Parliament. Its mandate is to help identifyagricultural problems in developing countries and to commission collaborative researchbetween Australian and developing country researchers in fields where Australia has aspecial research competence.
Where trade names are used this constitutes neither endorsement of nor discriminationagainst any product by the Centre.
© Australian Centre for International Agricultural Research, GPO Box 1571,Canberra, ACT 2601 http://www.aciar.gov.au/publications
Sena S. De Silva, ed. 2001. Reservoir and culture-based fisheries: biology and management.Proceedings of an International Workshop held in Bangkok, Thailand from 15–18 February 2000.ACIAR Proceedings No. 98. 384pp.
ISBN 0 642 45694 1 (printed)ISBN 0 642 45695 X (electronic)
Editorial management: P.W. LynchProduction editing: PK Editorial Services, BrisbaneTypesetting, page layout and illustrations: Sun Photoset Pty Ltd, BrisbanePrinting: Watson Ferguson & Co., Brisbane
ACIAR PROCEEDINGS
This series of publications includes the full proceedings of researchworkshops or symposia organised or supported by ACIAR. Numbersin this series are distributed internationally to selected individuals andscientific institutions.
3
CONTENTSForeword
Barney Smith 5Reservoir Fisheries: Broad Strategies for Enhancing Yields
Sena S. De Silva 7Fish Resources in Chinese Reservoirs and Their Utilisation
Daoming Huang, Jiashou Liu and Chuanlin Hu 16The Impact of Large Reservoirs on Fish Biodiversity and Fisheries in China
Li Sifa 22Status of Reservoir Fisheries in Vietnam
Ngo Sy Van and Le Thanh Luu 29Status and Potential of Reservoir Fisheries in Dak Lak Province, Vietnam
Phan Dinh Phuc and J.D. Sollows 36Inventory of Reservoir Fishery Resources in Thailand
Cherdsak Virapat and Niklas S. Mattson 43Changes in Fisheries Yield and Catch Composition at the Nam Ngum Reservoir, Lao PDR
N.S. Mattson, V. Balavong, H. Nilsson, S. Phounsavath and W.D. Hartmann 48The Role of Reservoir and Lacustrine Fisheries in Rural Development: Comparative Evidence from Sri Lanka,
Thailand and the PhilippinesD. Simon, C. de Jesus, P. Boonchuwong and K. Mohottala 56
Characteristics and Status of the Lake Tegano FisheryE. Oreihaka 66
Is Lak Lake Overfished?Thai Ngoc Chien, J.D. Sollows, Nguyen Quoc An, Phan Dihn Phuc, Nguyen Quoc Nghi and Truong Ha Phuong 71
An Assessment of the Fisheries of Four Stocked Reservoirs in the Central Highlands of VietnamTran Thanh Viet, Do Tinh Loi, Nguyen Ngoc Vihn, Phan Dinh Phuc, Phan Thuong Huy, Thai Ngoc Chien, Nguyen Quoc An and J.D. Sollows 81
Effect of Hydrological Regimes on Fish Yields in Reservoirs of Sri LankaC. Nissanka and U.S. Amarasinghe 93
Fluctuations in Water Level in Shallow Irrigation Reservoirs: Implications for Fish Yield Estimates and Fisheries ManagementU.S. Amarasinghe, C. Nissanka and Sena S. De Silva 101
Human Factor: the Fourth Dimension of Reservoir Limnology in the TropicsE.I.L. Silva and F. Schiemer 111
Water Quality Study of Some Selected Oxbow Lakes with Special Emphasis on Chlorophyll-aM.R. Hasan, M.A.W. Mondal, M.I. Miah and M.G. Kibria 126
Role of Oreochromis Hybrids in Controlling Microcystis aeruginosa Blooms in the Kotmale ReservoirSwarna Piyasiri and Nishanthi Perera 137
Growth of Indian Major and Chinese Carps in Oxbow Lakes Based on Length–frequency Distribution AnalysisM.R. Hasan, Nityananda Bala and Hans A.J. Middendorp 149
Carrying Capacity for Small Pelagic Fish in Three Asian ReservoirsJ. Vijverberg, P.B. Amarasinghe, M.G. Ariyaratna and W.L.T. van Densen 153
Chenderoh Reservoir, Malaysia: Fish Community and Artisanal Fishery of a Small Mesotrophic Tropical ReservoirKong Kah-Wai and Ahyaudin B. Ali 167
Growth Rates of Transplanted Large Icefish (Protosalanx hyalocranius) in Daoguanhe Reservoir, ChinaHongjuan Wu and Musheng Xu 179
Estimation of the New Icefish Neolsalanx taihuensis Yield in Zhanghe Reservoir, ChinaJiashou Liu, Jianhua Peng, Fuhu Yu, Jie Jiang, Xianquin Yao and Yuanhong Yi 183
4
Population Dynamics of Potential Fish Species for Exploitation in Presently Underdeveloped Fisheries of Some Perennial Reservoirs in Sri LankaM.J.S. Wijeyaratne and W.M.D.S.K. Perera 188
Trophic Relationships and Possible Evolution of the Production under Various Fisheries Management Strategies in a Sri Lankan ReservoirJ. Moreau, M.C. Villanueva, U.S. Amarasinghe and F. Schiemer 201
Ecosystem Structure and Dynamics—A Management Basis for Asian Reservoirs and LakesF. Schiemer, U.S. Amarasinghe, J. Frouzova, B. Sricharoendham and E.I.L. Silva 215
Developing Fisheries Enhancement in Small Waterbodies: Lessons from Lao PDR and Northeast ThailandC. Garaway, K. Lorenzen and B. Chamsingh 227
Effectiveness of Stocking in Reservoirs in VietnamNguyen Quoc An 235
Investigation of the Fisheries in Farmer-Managed Small Reservoirs in Thainguyen and Yenbai Provinces, Northern VietnamNguyen Hai Son, Bui The Anh and Nguyen T.T. Thuy 246
Using Population Models to Assess Culture-based Fisheries: A Brief Review with an Application to the Analaysis of Stocking ExperimentsK. Lorenzen 257
Community-based Freshwater Fish Culture in Sri LankaK.B.C. Pushpalatha 266
Status of Culture-based Fisheries in Small Reservoirs in IndiaV.V. Sugunan 274
Livestock–Fish Integrated Systems and Their ApplicationShenggui Wu, Chuanlin Hu and Youchun Chen 281
Fisheries Marketing Systems in Sri Lanka and Their Relevance to Local Reservoir Fishery DevelopmentF.J. Murray, S. Koddithuwakku and D.C. Little 287
Socio-economic Status of River Sprat (Clupeichthys aesarnensis, Wongratana 1983) Lift-net Fishers in Sirinthorn Reservoir, ThailandT. Jutagate, Sena S. De Silva and N.S. Mattson 309
Fisheries Co-management in Two Large Reservoirs — Problems and ChallengesH. Nilsson, S. Phonsavath, M. Khumsri, W.D. Hartmann 314
Some Imperatives for Co-management of the Fishery in Ea Soup ReservoirTruong Ha Phuong, Nguyen Thi Nhung, Mercedes Logarta, J.D. Sollows, Nguyen Thi Bich and Ho Ngoc Dan 321
Cage Culture of Finfish in Australian Lakes and Reservoirs: A Pilot-scale Case Study of Biological, Environmental and Economic ViabilityG.J. Gooley, Sena S. De Silva, B.A. Ingram, L.J. McKinnon, F.M. Gavine and W. Dalton 328
Cage Rearing of Fry to Fingerling of Carp Species in Large Reservois in Northern VietnamBui T. Anh and Nguyen H. Son 347
Performance of Cage-reared Fingerlings of Commonly Cultured Fish Species in Response to Different FeedsM.H.S. Ariyaratne 359
Cage Fish Trials in Ea Soup Reservoir, VietnamPhan Thuong Huy, Phan Dinh Phuc, Nguyen Ngoc Vinh and J.D. Sollows 367
Abstracts of other papers presentedThe Biology and Fishery of Indigenous Gobies of Mainit Lake, Philippines
A.M. Calicia Jr and N.A. Lopez 375Dam and Fish Diversity: Case Study of the Pak Mun, Thailand
C. Vidthayanon and S. Premcharoen 376Workshop Issues and Recommendations 377Participants 382
5
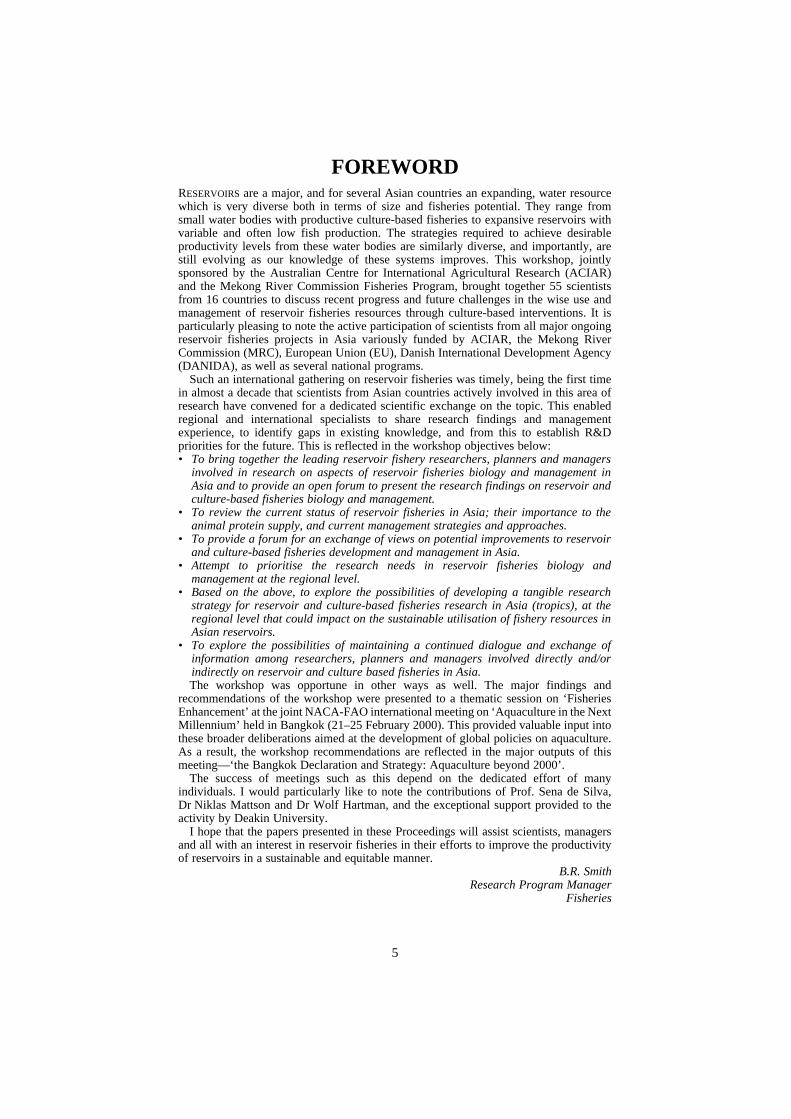
FOREWORDRESERVOIRS are a major, and for several Asian countries an expanding, water resourcewhich is very diverse both in terms of size and fisheries potential. They range fromsmall water bodies with productive culture-based fisheries to expansive reservoirs withvariable and often low fish production. The strategies required to achieve desirableproductivity levels from these water bodies are similarly diverse, and importantly, arestill evolving as our knowledge of these systems improves. This workshop, jointlysponsored by the Australian Centre for International Agricultural Research (ACIAR)and the Mekong River Commission Fisheries Program, brought together 55 scientistsfrom 16 countries to discuss recent progress and future challenges in the wise use andmanagement of reservoir fisheries resources through culture-based interventions. It isparticularly pleasing to note the active participation of scientists from all major ongoingreservoir fisheries projects in Asia variously funded by ACIAR, the Mekong RiverCommission (MRC), European Union (EU), Danish International Development Agency(DANIDA), as well as several national programs.
Such an international gathering on reservoir fisheries was timely, being the first timein almost a decade that scientists from Asian countries actively involved in this area ofresearch have convened for a dedicated scientific exchange on the topic. This enabledregional and international specialists to share research findings and managementexperience, to identify gaps in existing knowledge, and from this to establish R&Dpriorities for the future. This is reflected in the workshop objectives below:• To bring together the leading reservoir fishery researchers, planners and managers
involved in research on aspects of reservoir fisheries biology and management inAsia and to provide an open forum to present the research findings on reservoir andculture-based fisheries biology and management.
• To review the current status of reservoir fisheries in Asia; their importance to theanimal protein supply, and current management strategies and approaches.
• To provide a forum for an exchange of views on potential improvements to reservoirand culture-based fisheries development and management in Asia.
• Attempt to prioritise the research needs in reservoir fisheries biology andmanagement at the regional level.
• Based on the above, to explore the possibilities of developing a tangible researchstrategy for reservoir and culture-based fisheries research in Asia (tropics), at theregional level that could impact on the sustainable utilisation of fishery resources inAsian reservoirs.
• To explore the possibilities of maintaining a continued dialogue and exchange ofinformation among researchers, planners and managers involved directly and/orindirectly on reservoir and culture based fisheries in Asia.The workshop was opportune in other ways as well. The major findings and
recommendations of the workshop were presented to a thematic session on ‘FisheriesEnhancement’ at the joint NACA-FAO international meeting on ‘Aquaculture in the NextMillennium’ held in Bangkok (21–25 February 2000). This provided valuable input intothese broader deliberations aimed at the development of global policies on aquaculture.As a result, the workshop recommendations are reflected in the major outputs of thismeeting—‘the Bangkok Declaration and Strategy: Aquaculture beyond 2000’.
The success of meetings such as this depend on the dedicated effort of manyindividuals. I would particularly like to note the contributions of Prof. Sena de Silva,Dr Niklas Mattson and Dr Wolf Hartman, and the exceptional support provided to theactivity by Deakin University.
I hope that the papers presented in these Proceedings will assist scientists, managersand all with an interest in reservoir fisheries in their efforts to improve the productivityof reservoirs in a sustainable and equitable manner.
B.R. SmithResearch Program Manager
Fisheries

7
Reservoir Fisheries: Broad Strategies for Enhancing Yields
Sena S. De Silva*
Abstract
Reservoirs are an important water resource in Asia. Inland fisheries in the world account forabout 9% of total fish production, and of these, Asia accounts for nearly 60% of world production.In the light of stabilising marine fish catches, inland fisheries, in particular reservoir fisherypotential, need to be exploited. The reservoir resource is diverse and therefore the strategies to beadopted for optimising yields are also different. In small reservoirs, culture-based fisheries havebeen very effective, particularly in the case of China, with a current production of 1 165 075 Mt(from a total area of 1 567 971 ha), amounting to 743 kg/ha/yr. The reasons for this success arediscussed. Fish production in large reservoirs is very variable and there is very little information onstocking, the cost-effectiveness of which has not been demonstrated adequately.
RESERVOIRS and fisheries thereof are not new to Asia.Long before the modern era of dam building andreservoir impounding, in the period after WorldWar II last century, reservoirs were an integral com-ponent of certain Asian cultures, dating back 4000years or more. From a fisheries view point, it isimportant and relevant to note that the reservoirfishery resources were harnessed and, more impor-tantly, there is documentation, dating back more than1000 years, to indicate that certain regulatorymeasures were in place with regard to its exploitation.The greatest expansion in reservoir acreage was wit-nessed in the post-war period, and the expansion isbest exemplified in the case of mainland China, whenthe reservoir acreage increased to about 2.47 × 10⁶ hafrom 1949 (Lu 1986). In spite of concerns of varyinglobby groups, often headed by environmentalists,reservoir impoundment, particularly in developingcountries, goes on almost unbridled.
Reservoirs are never impounded for fisherydevelopment per se. But fisheries are beginning to berecognised as an important secondary user ofreservoir water resources. In certain instances, it isreported that the income from the fishery exceeds thatfrom the intended primary function of the reservoir,such as for example in Ubolratana reservoir, Thailand
(Fernando 1980). Indeed, fishery aspects did not andstill hardly command a consideration during theplanning of reservoir impoundment, perhaps with afew exceptions in the region. Of the latter, thesituation in China is the most significant exception,when a hatchery and associated facilities (such as fryand fingerling rearing ponds) were provided forbelow the dam of almost every medium and largereservoir (De Silva et al. 1991), the reservoir bed wasprepared to facilitate harvesting, and associatedmanagement aspects put in place. One other aspectwitnessed in the recent years is the incorporation offish ladders as seen in some recently constructedreservoirs in Thailand, such as Sirinthorn, which in allprobability satisfies the concerns of environmentalistsand conservationists, even though there is a dearth ofscientific information showing the efficacy of fishladders in the tropics.
In the light of increasing human populationgrowth, reservoirs are becoming increasinglyimportant in the current millennium as an importantprovider of animal protein and employment oppor-tunities, particularly to poorer sectors of the com-munity, which also often happens to be rural. Unlikein the past, reservoir fishery activities are considereda significant avenue for resettling displaced persons,particularly exemplified in the case of Saguling andJatinuhur reservoirs in Indonesia (Costa-Pierce andSoemarwoto 1990).
This paper deals with the reservoir resource ofAsia and its fisheries, in relation to the global capture
*School of Ecology and Environment, Deakin University,Warrnambool, Victoria Australia 3280 (Email: [email protected]; Fax: (61) (03) 5563 3462)
8
fishery and fish as a food resource. It also highlightsissues related to increasing fish yield from reservoirsand the potential advantages of a more holisticapproach to reservoir fisheries management. Anattempt is made to highlight ensuing problems asso-ciated with increasing reservoir fish production inthe region, and to suggest plausible strategiestowards that end.
Reservoir Resource
The extent of the reservoir resource in Asia has beendocumented previously and was reviewed by DeSilva (1996). According to those estimates thereservoir acreage was 5 376 618 ha in Asia and waspredicted to reach 16 798 000 ha by 2010 (Costa-Pierce 1991), which is tantamount to a 212%increase in reservoir acreage in approximately 25years or so. According to Avakyan and Iakoleva(1998) in the post-World War II phase whenreservoir impoundment proliferated, the number ofreservoirs of capacity exceeding 0.1 km3 grew five-fold worldwide, and their volume 12-fold. Moreimportantly, this increase was most evident in LatinAmerica (40-fold) and in Africa and Asia (100-fold).
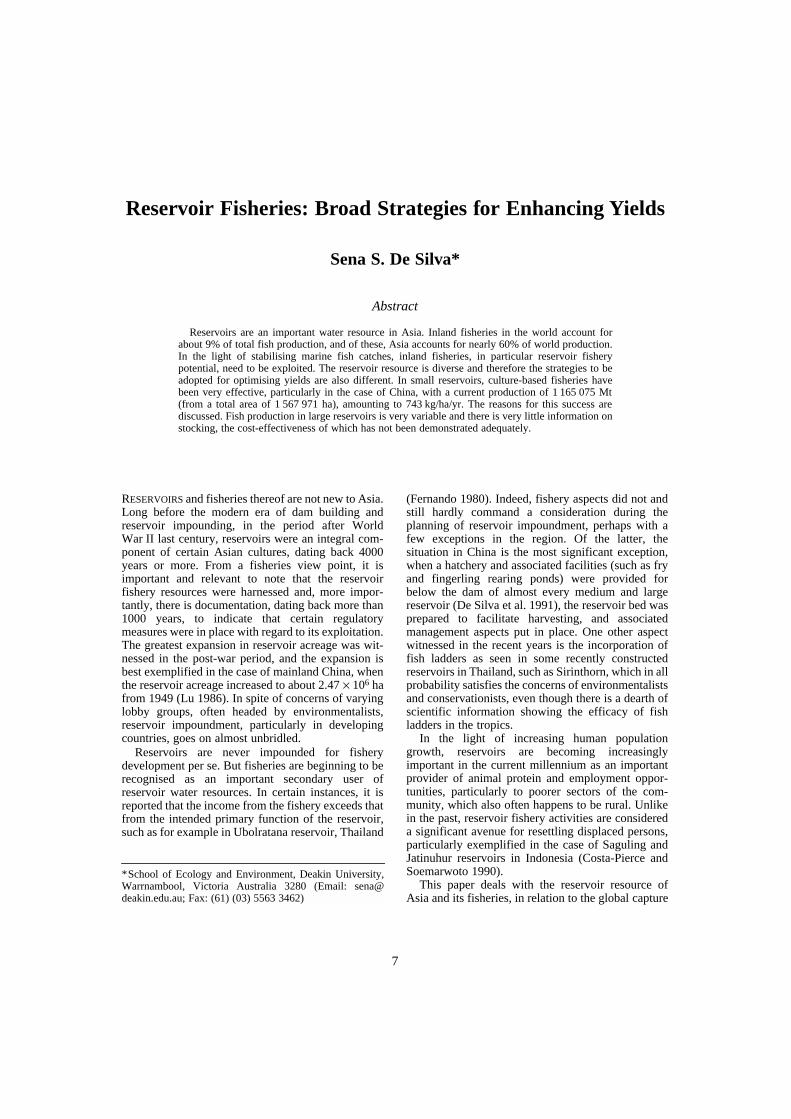
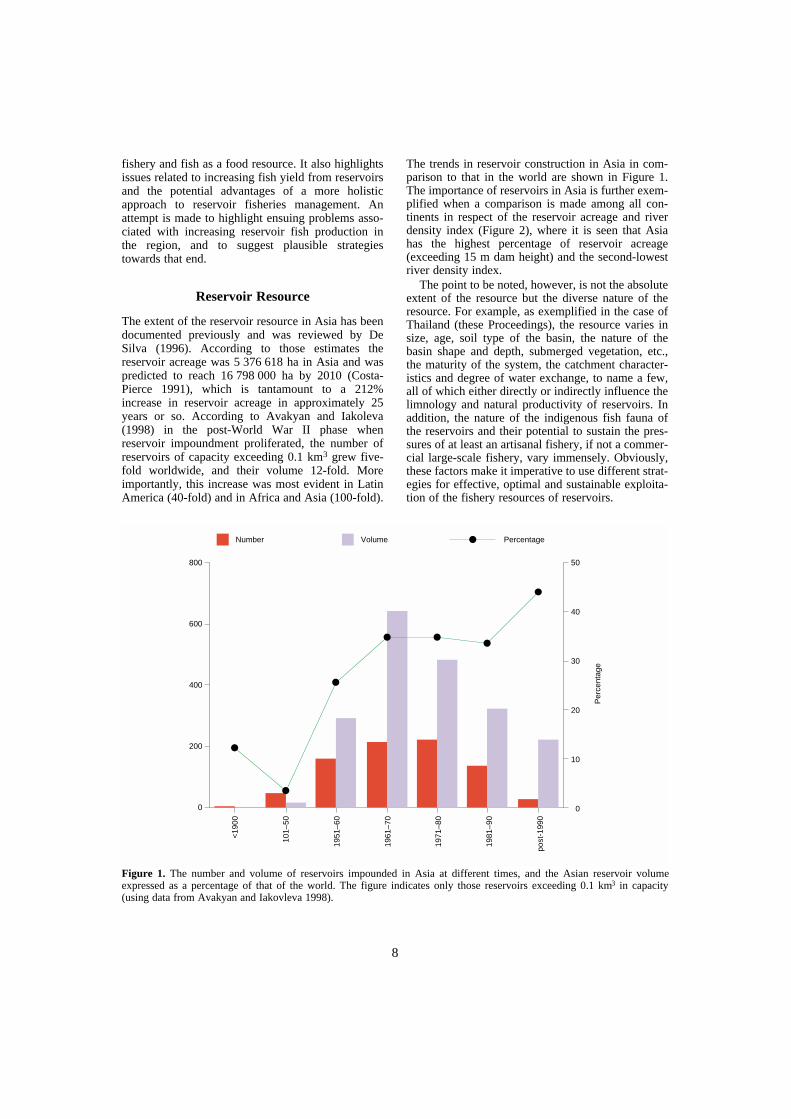
The trends in reservoir construction in Asia in com-parison to that in the world are shown in Figure 1.The importance of reservoirs in Asia is further exem-plified when a comparison is made among all con-tinents in respect of the reservoir acreage and riverdensity index (Figure 2), where it is seen that Asiahas the highest percentage of reservoir acreage(exceeding 15 m dam height) and the second-lowestriver density index.
The point to be noted, however, is not the absoluteextent of the resource but the diverse nature of theresource. For example, as exemplified in the case ofThailand (these Proceedings), the resource varies insize, age, soil type of the basin, the nature of thebasin shape and depth, submerged vegetation, etc.,the maturity of the system, the catchment character-istics and degree of water exchange, to name a few,all of which either directly or indirectly influence thelimnology and natural productivity of reservoirs. Inaddition, the nature of the indigenous fish fauna ofthe reservoirs and their potential to sustain the pres-sures of at least an artisanal fishery, if not a commer-cial large-scale fishery, vary immensely. Obviously,these factors make it imperative to use different strat-egies for effective, optimal and sustainable exploita-tion of the fishery resources of reservoirs.
Figure 1. The number and volume of reservoirs impounded in Asia at different times, and the Asian reservoir volumeexpressed as a percentage of that of the world. The figure indicates only those reservoirs exceeding 0.1 km3 in capacity(using data from Avakyan and Iakovleva 1998).
800
600
400
200
0
Number Volume Percentage
50
40
30
20
10
0
Per
cent
age
<19
00
101–
50
1951
–60
1961
–70
1971
–80
1981
–90
post
-199
0
9
Fish as a food source
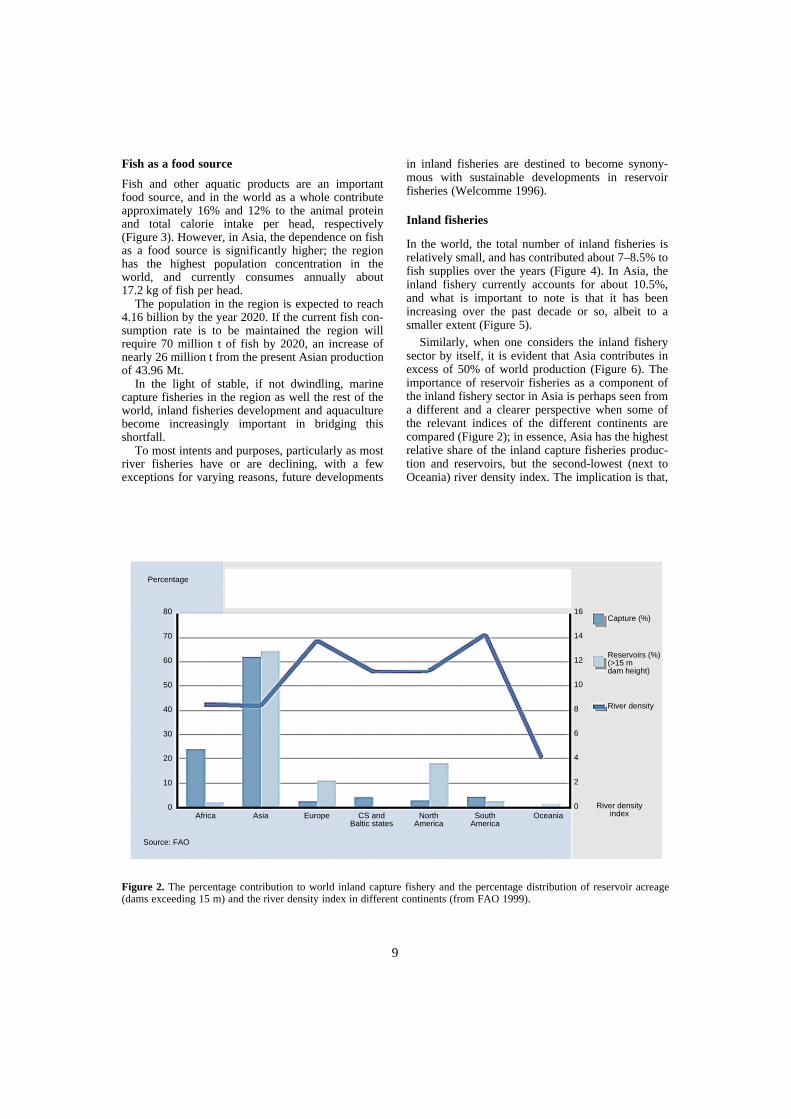
Fish and other aquatic products are an importantfood source, and in the world as a whole contributeapproximately 16% and 12% to the animal proteinand total calorie intake per head, respectively(Figure 3). However, in Asia, the dependence on fishas a food source is significantly higher; the regionhas the highest population concentration in theworld, and currently consumes annually about17.2 kg of fish per head.
The population in the region is expected to reach4.16 billion by the year 2020. If the current fish con-sumption rate is to be maintained the region willrequire 70 million t of fish by 2020, an increase ofnearly 26 million t from the present Asian productionof 43.96 Mt.
In the light of stable, if not dwindling, marinecapture fisheries in the region as well the rest of theworld, inland fisheries development and aquaculturebecome increasingly important in bridging thisshortfall.
To most intents and purposes, particularly as mostriver fisheries have or are declining, with a fewexceptions for varying reasons, future developments
in inland fisheries are destined to become synony-mous with sustainable developments in reservoirfisheries (Welcomme 1996).
Inland fisheries
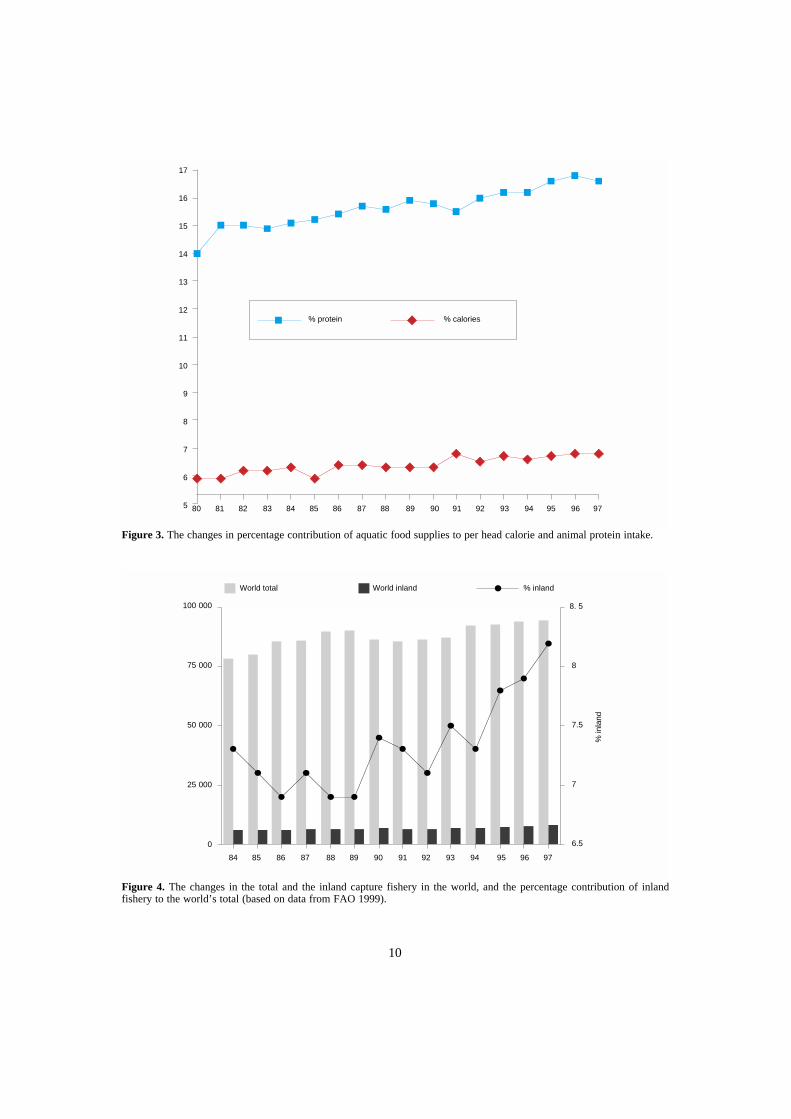
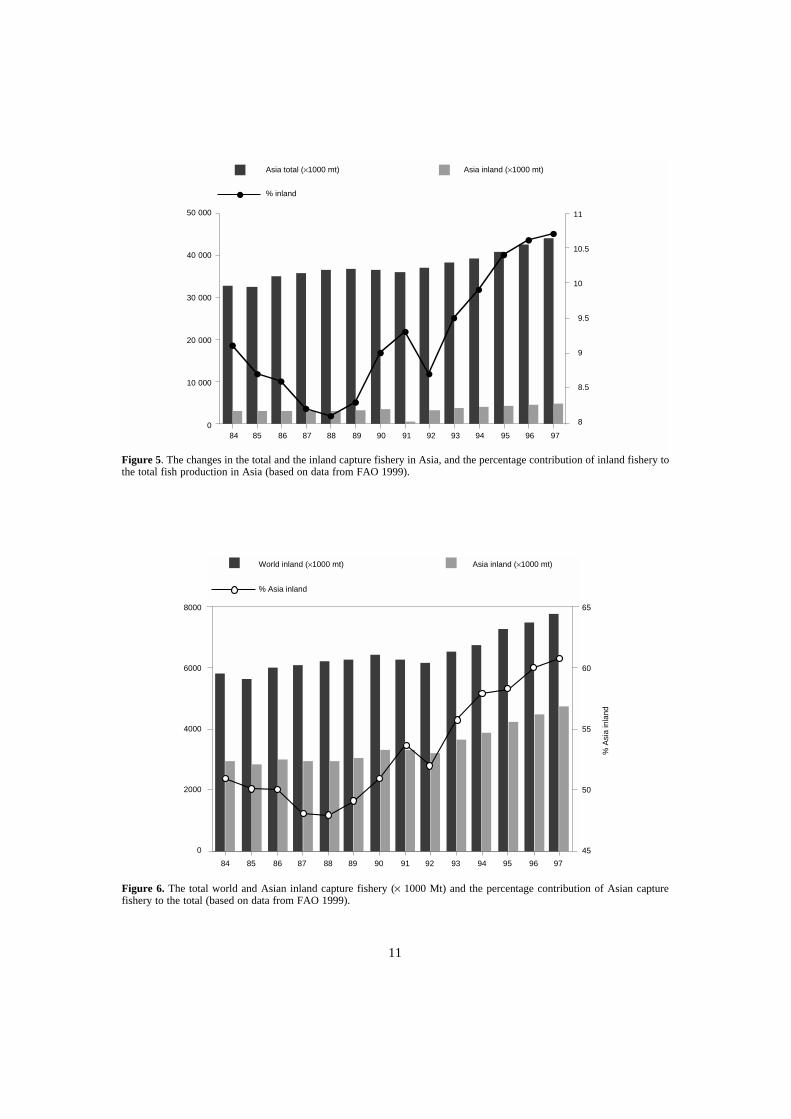
In the world, the total number of inland fisheries isrelatively small, and has contributed about 7–8.5% tofish supplies over the years (Figure 4). In Asia, theinland fishery currently accounts for about 10.5%,and what is important to note is that it has beenincreasing over the past decade or so, albeit to asmaller extent (Figure 5).
Similarly, when one considers the inland fisherysector by itself, it is evident that Asia contributes inexcess of 50% of world production (Figure 6). Theimportance of reservoir fisheries as a component ofthe inland fishery sector in Asia is perhaps seen froma different and a clearer perspective when some ofthe relevant indices of the different continents arecompared (Figure 2); in essence, Asia has the highestrelative share of the inland capture fisheries produc-tion and reservoirs, but the second-lowest (next toOceania) river density index. The implication is that,
Figure 2. The percentage contribution to world inland capture fishery and the percentage distribution of reservoir acreage(dams exceeding 15 m) and the river density index in different continents (from FAO 1999).
Percentage
80
70
60
50
40
30
20
10
0
16
14
12
10
8
6
4
2
0
Capture (%)
Reservoirs (%)(>15 mdam height)
River density
River densityindexAfrica Asia Europe CS and
Baltic statesNorth
AmericaSouth
AmericaOceania
Source: FAO
10
Figure 3. The changes in percentage contribution of aquatic food supplies to per head calorie and animal protein intake.
Figure 4. The changes in the total and the inland capture fishery in the world, and the percentage contribution of inlandfishery to the world’s total (based on data from FAO 1999).
17
16
15
14
13
12
11
10
9
8
7
6
5 80 81 82 83 84 85 86 87 88 89 90 91 92 93 94 95 96 97
% protein % calories
100 000
75 000
50 000
25 000
0
8. 5
8
7.5
7
6.5
84 85 86 87 88 89 90 91 92 93 94 95 96 97
% in
land
World total World inland % inland
11
Figure 5. The changes in the total and the inland capture fishery in Asia, and the percentage contribution of inland fishery tothe total fish production in Asia (based on data from FAO 1999).
Figure 6. The total world and Asian inland capture fishery (× 1000 Mt) and the percentage contribution of Asian capturefishery to the total (based on data from FAO 1999).
50 000
40 000
30 000
20 000
10 000
0
11
10.5
10
9.5
9
8.5
8
Asia total (×1000 mt) Asia inland (×1000 mt)
% inland
84 85 86 87 88 89 90 91 92 93 94 95 96 97
84 85 86 87 88 89 90 91 92 93 94 95 96 97
8000
6000
4000
2000
0
65
60
55
50
45
World inland (×1000 mt) Asia inland (×1000 mt)
% Asia inland
% A
sia
inla
nd
12
in Asia, reservoirs make a significant contribution tothe former.
From a species point of view, two species groups,Cyprinids and tilapias, contribute most to the Asianinland production. Of the cyprinids, the five speciescaught in largest quantity are common carp, silvercarp and Java barb in Asia, freshwater bream inEurope, and silver cyprinid in Africa.
Reservoir Production
Reservoirs are a very diverse resource, and strategiesto enhance fish production differ significantly. Onemain difficulty that confronts fishery scientists is thedifferent classification of reservoirs adopted by dif-ferent nations.
For example, in India (Srivastava et al. 1985)reservoirs are classified as small (<1000 ha), medium(1000 to 5000 ha) and large (>5000 ha), whereas inChina the classification is based on capacity (DeSilva et al. 1991) when small, medium and largereservoirs refer to capacities of less than 10 × 106,10–100 × 106 and less than 100 × 106 m3, respec-tively. In Sri Lanka reservoirs are classified asperennial and non-perennial (= seasonal tanks), andgenerally the latter rarely exceed 20 ha.
Small reservoirs
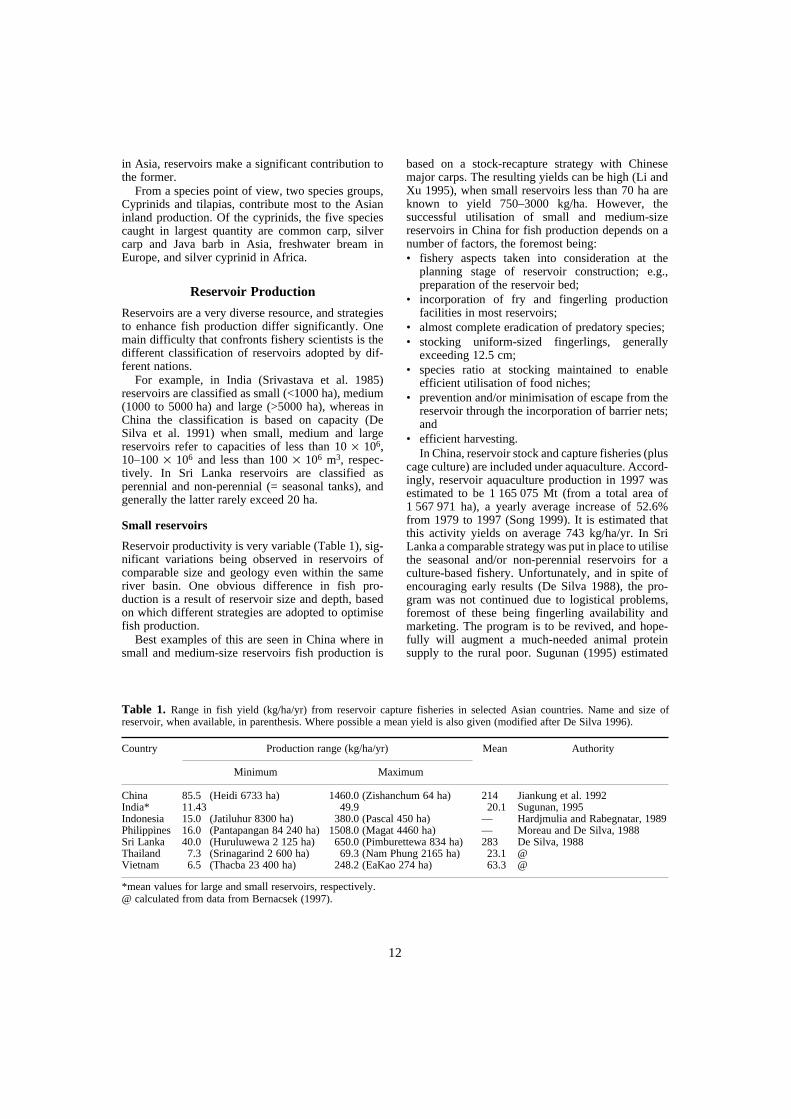
Reservoir productivity is very variable (Table 1), sig-nificant variations being observed in reservoirs ofcomparable size and geology even within the sameriver basin. One obvious difference in fish pro-duction is a result of reservoir size and depth, basedon which different strategies are adopted to optimisefish production.
Best examples of this are seen in China where insmall and medium-size reservoirs fish production is
based on a stock-recapture strategy with Chinesemajor carps. The resulting yields can be high (Li andXu 1995), when small reservoirs less than 70 ha areknown to yield 750–3000 kg/ha. However, thesuccessful utilisation of small and medium-sizereservoirs in China for fish production depends on anumber of factors, the foremost being:• fishery aspects taken into consideration at the
planning stage of reservoir construction; e.g.,preparation of the reservoir bed;
• incorporation of fry and fingerling productionfacilities in most reservoirs;
• almost complete eradication of predatory species;• stocking uniform-sized fingerlings, generally
exceeding 12.5 cm;• species ratio at stocking maintained to enable
efficient utilisation of food niches;• prevention and/or minimisation of escape from the
reservoir through the incorporation of barrier nets;and
• efficient harvesting.In China, reservoir stock and capture fisheries (plus
cage culture) are included under aquaculture. Accord-ingly, reservoir aquaculture production in 1997 wasestimated to be 1 165 075 Mt (from a total area of1 567 971 ha), a yearly average increase of 52.6%from 1979 to 1997 (Song 1999). It is estimated thatthis activity yields on average 743 kg/ha/yr. In SriLanka a comparable strategy was put in place to utilisethe seasonal and/or non-perennial reservoirs for aculture-based fishery. Unfortunately, and in spite ofencouraging early results (De Silva 1988), the pro-gram was not continued due to logistical problems,foremost of these being fingerling availability andmarketing. The program is to be revived, and hope-fully will augment a much-needed animal proteinsupply to the rural poor. Sugunan (1995) estimated
*mean values for large and small reservoirs, respectively.@ calculated from data from Bernacsek (1997).
Table 1. Range in fish yield (kg/ha/yr) from reservoir capture fisheries in selected Asian countries. Name and size ofreservoir, when available, in parenthesis. Where possible a mean yield is also given (modified after De Silva 1996).
Country Production range (kg/ha/yr) Mean Authority
Minimum Maximum
China 85.5 (Heidi 6733 ha) 1460.0 (Zishanchum 64 ha) 214 Jiankung et al. 1992India* 11.43 49.9 20.1 Sugunan, 1995Indonesia 15.0 (Jatiluhur 8300 ha) 380.0 (Pascal 450 ha) — Hardjmulia and Rabegnatar, 1989Philippines 16.0 (Pantapangan 84 240 ha) 1508.0 (Magat 4460 ha) — Moreau and De Silva, 1988Sri Lanka 40.0 (Huruluwewa 2 125 ha) 650.0 (Pimburettewa 834 ha) 283 De Silva, 1988Thailand 7.3 (Srinagarind 2 600 ha) 69.3 (Nam Phung 2165 ha) 23.1 @Vietnam 6.5 (Thacba 23 400 ha) 248.2 (EaKao 274 ha) 63.3 @
13
that 1 485 557 ha of small reservoirs in India currentlyyield on average 49.9 kg/ha.yr and suggested thatyields could be easily doubled by introducing appro-priate management measures. In essence, apart fromChina, the smaller productive reservoirs in most coun-tries are utilised sub-optimally for fish production, andsuitable strategies, perhaps developed regionally, mayfacilitate such development.
Stock and recapture or culture-based fisheriesyield best results with smaller reservoirs, generallyless than 50 ha. However, a fishery based on a mix-ture of stocked and self-recruiting populations is alsoa possibility, particularly in medium-size reservoirs(100–300 ha), such as Ea Kao Reservoir in Vietnam(Phan and De Silva 2000).
Large reservoirs
As shown in Table 1, reservoir fish productivitydiffers markedly. However, not all differences can beaccounted for by climatic, geographic and/or edaphicdifferences. This obviously raises the possibility ofincreasing fish production in large reservoirs throughthe adoption of appropriate managerial measures.
One major characteristic of Asian reservoirs andfisheries is that the fisheries are basically dependenton colonisation of the reservoirs by riverineindigenous species which do not spawn in lacustrinewaters, such as, for example, Indian major carps andChinese major carps. Of these cyprinid species thereis only one documentation, yet to be confirmed, ofthe spawning of a major carp in the main stream of areservoir, viz. silver carp, Hypophthalamichthysmolitrix, in the Gobindsagar in Himachal Pradesh,India (Kumar 1989).
Consequently, the fisheries have developedaround suitable exotic species which have estab-lished self-recruiting populations, such as in the caseof Sri Lanka, and/or regular stocking of appropriatecarp species to augment natural recruitment from therivers. In addition, other indigenous species, particu-larly carnivorous species such as catfish and ophice-phalids are known to breed in reservoirs andaugment most fisheries.
Also, in a few reservoirs in Asia, particularly inThailand and Lao PDR, fisheries have developedaround pelagic clupeids such as Clupeichthysaesarnensis (Thai river sprat). Indigenous fishspecies, such as for example Notopterus notopterus,Cyclochelichthys armatus, Hampala macrolepidota,and Mystus nemurus are known to dominate thefishery in a number of reservoirs in Thailand andLao PDR. Data available for reservoirs in theMekong Basin in Thailand suggest that in 15 out of19 reservoirs the fishery was based on indigenousspecies, when these accounted for over 80% of the
catch (Bernacsek 1997). However, the situation issomewhat different in Indian reservoirs (Sugunan1995).
It can be generalised that in Asian reservoirfisheries exploitation is confined to a few speciesonly. This may be a reflection of market demand(s).However, there is an increasing trend to exploitsmall-sized pelagic fish resources, a resource whichcan be fairly substantial (De Silva and Sirisena1989), for other than human consumption, as a feedingredient (Ariyaratne, these Proceedings).
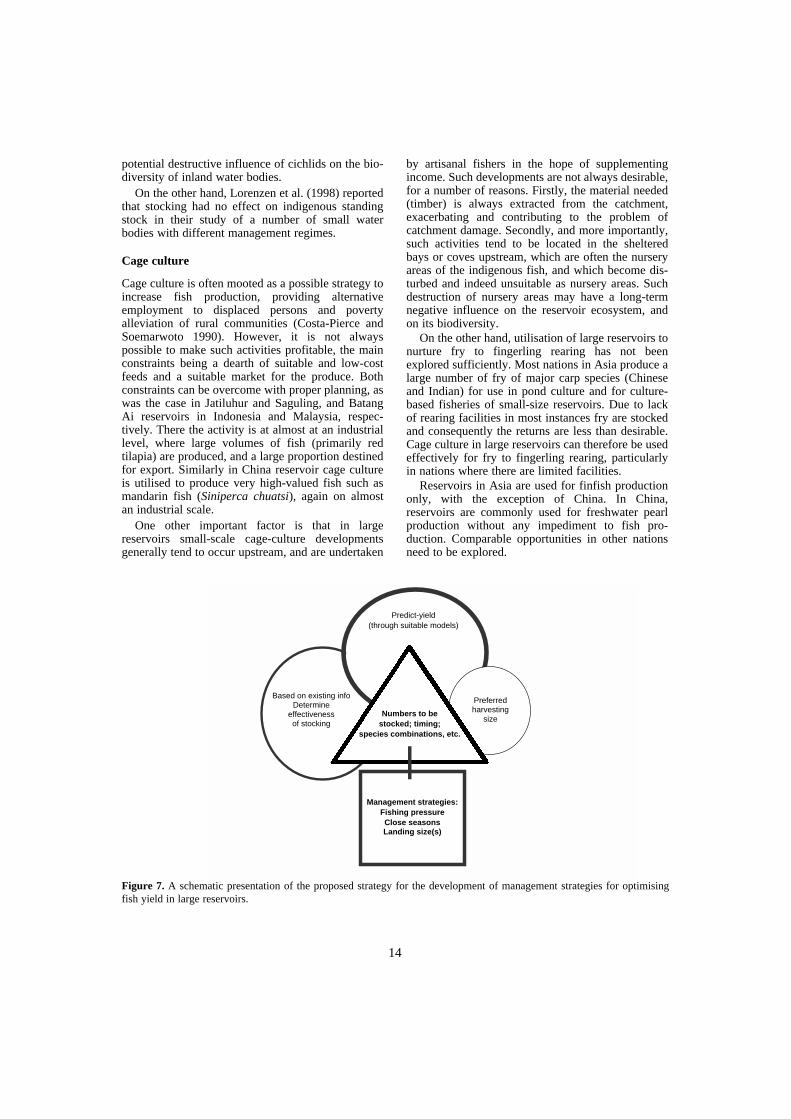
There have been few cost-benefit analyses ofstocking in large reservoirs in Asia (Bhukaswan1989). In contrast, in small to medium-sizedreservoirs the benefits of stocking have been evalu-ated in China (Li 1988; De Silva et al. 1991) and anumber of general principles such as these onstocking efficiency (Li 1988; Lorenzen 1995;Lorenzen and Garaway 1997) developed. In respectof large reservoirs, therefore, much needs to be done.A possible approach is represented schematically inFigure 7. Accordingly, it is suggested that anystocking strategy should be based on the potentialyield, predicted through the use of an appropriateempirical model. This information should be linkedto the preferred harvest size, and previous experienceof stock-recapture data, if available.
In effect, the data available on reservoirs have notbeen analysed in detail with a view to developingsuitable management models. This is a priority areaof research into reservoir fisheries in the region.
Role of introduced species
It was mentioned previously that in some instancesintroduced species, in particular tilapias, have estab-lished self-recruiting populations sufficiently large tosustain artisanal fisheries in reservoirs. A case inpoint is the reservoir fishery of Sri Lanka, almostentirely based on the introduced cichlids Oreo-chromis mossambicus and O. niloticus (De Silva1988). It has been argued that the success of tilapiasis a result of the lack of truly lacustrine species in theregion (Fernando and Holcik 1982). This in all prob-ability is too simplistic an interpretation. A closerexamination of data from Thailand, India and LaosPDR suggests that exotic cichlids, and indeed exoticspecies, are not the mainstay of fisheries in reser-voirs that exceed 10 000 ha or so. The reasons forthis may be many; perhaps one important one is thelimitation of nesting sites in large reservoirs, whichgenerally tend to have steep banks and limit the areaavailable for nesting. In large reservoirs the landingsize of cichlids tends to be much higher. A detailedanalysis of data may help to counteract fears of the
14
potential destructive influence of cichlids on the bio-diversity of inland water bodies.
On the other hand, Lorenzen et al. (1998) reportedthat stocking had no effect on indigenous standingstock in their study of a number of small waterbodies with different management regimes.
Cage culture
Cage culture is often mooted as a possible strategy toincrease fish production, providing alternativeemployment to displaced persons and povertyalleviation of rural communities (Costa-Pierce andSoemarwoto 1990). However, it is not alwayspossible to make such activities profitable, the mainconstraints being a dearth of suitable and low-costfeeds and a suitable market for the produce. Bothconstraints can be overcome with proper planning, aswas the case in Jatiluhur and Saguling, and BatangAi reservoirs in Indonesia and Malaysia, respec-tively. There the activity is at almost at an industriallevel, where large volumes of fish (primarily redtilapia) are produced, and a large proportion destinedfor export. Similarly in China reservoir cage cultureis utilised to produce very high-valued fish such asmandarin fish (Siniperca chuatsi), again on almostan industrial scale.
One other important factor is that in largereservoirs small-scale cage-culture developmentsgenerally tend to occur upstream, and are undertaken
by artisanal fishers in the hope of supplementingincome. Such developments are not always desirable,for a number of reasons. Firstly, the material needed(timber) is always extracted from the catchment,exacerbating and contributing to the problem ofcatchment damage. Secondly, and more importantly,such activities tend to be located in the shelteredbays or coves upstream, which are often the nurseryareas of the indigenous fish, and which become dis-turbed and indeed unsuitable as nursery areas. Suchdestruction of nursery areas may have a long-termnegative influence on the reservoir ecosystem, andon its biodiversity.
On the other hand, utilisation of large reservoirs tonurture fry to fingerling rearing has not beenexplored sufficiently. Most nations in Asia produce alarge number of fry of major carp species (Chineseand Indian) for use in pond culture and for culture-based fisheries of small-size reservoirs. Due to lackof rearing facilities in most instances fry are stockedand consequently the returns are less than desirable.Cage culture in large reservoirs can therefore be usedeffectively for fry to fingerling rearing, particularlyin nations where there are limited facilities.
Reservoirs in Asia are used for finfish productiononly, with the exception of China. In China,reservoirs are commonly used for freshwater pearlproduction without any impediment to fish pro-duction. Comparable opportunities in other nationsneed to be explored.
Figure 7. A schematic presentation of the proposed strategy for the development of management strategies for optimisingfish yield in large reservoirs.
Predict-yield(through suitable models)
Numbers to bestocked; timing;
species combinations, etc.
Management strategies:Fishing pressureClose seasonsLanding size(s)
Based on existing infoDetermine
effectivenessof stocking
Preferredharvesting
size
15
Conclusion
Asia has a large reservoir resource very diverse innature. Its inland fishery makes a significant contri-bution to world fish supply. In view of its diversenature, strategies to be adopted to optimise fishproduction are variable. In smaller-size reservoirs aculture-based fishery is most suitable, and practicesin China enable production exceeding one millionmt. In large reservoirs the economic viability ofstocking has not been proven. There is a need toanalyse available data for existing fisheries and todevelop suitable management strategies to optimiseyields.
ReferencesAvakyan, A.B. and Iakovleva V.B. 1998. Status of global
reservoirs: the position in the late twentieth century.Lakes and Reservoirs: Research and Management,3: 45–52.
Bhukaswan, T. 1989. Use of cyprinids in fisheries manage-ment of the larger inland water bodies in Thailand. FAOFisheries Report 405 (suppl.), 142–150.
Bernacsek, G.M. 1997. Large farm dam fisheries of thelower Mekong countries: review and assessment. Data-base. MKG/R. 97023, Vol. II, 145 p. Mekong RiverCommission, Phnom Penh, Cambodia.
Costa-Pierce, B.A. 1991. Small water bodies for sustainablefisheries production. NAGA, The ICLARM Quarterly,14: 3–5.
Costa-Pierce, B.A. and Soemarwoto, O. ed. 1990. ReservoirFisheries and Aquaculture Development for Resettlementin Indonesia. ICLARM Technical Report 23, 378 p.
De Silva, S.S. 1988. Reservoirs of Sri Lanka and TheirFisheries. FAO Fisheries Technical Paper 298, 128 p.
—— 1996. The Asian inland fishery with special referenceto reservoir fisheries: a reappraisal. In: Schiemer, F. andBoland, K.T. ed. Perspectives in Tropical Limnology,SPB Academic Publishing, Amsterdam, 321–332.
De Silva, S.S. and Sirisena, H.K.G. 1989. New fish resourcesof reservoirs in Sri Lanka 3. Results of commercial-scaletrials and yield estimates of a gillnet fishery for minorcyprinids. Fisheries Research, 7: 279–287.
De Silva, S.S., Zhitang, Y. and Lin-Hu, X. 1991. A briefreview of the status and practices of the reservoir fisheryin mainland China. Aquaculture and Fisheries Manage-ment, 22: 73–84.
FAO 1999. The State of World Fisheries and Aquaculture.FAO, Rome, Italy, 112 p.
Fernando, C.H. 1980. Tropical man-made lakes. Africanfish and cheap protein. ICLARM Newsletter, 3: 15–18.
Fernando, C.H. and Holcik, J. 1982. The nature of fishcommunities: a factor influencing the fishery potentialand yields of tropical lakes and reservoirs. Hydro-biologia, 76: 127–140.
Kumar, K. 1989. Gobindasagar Reservoir: a case study onthe use of carp stocking for fisheries enhancement. FAOFisheries Report 405 (Suppl.), 47–69.
Li, S. 1988. The principles and strategies of fish culture inChinese reservoirs. In: De Silva, S.S. ed. ReservoirFishery Management and Development in Asia, Inter-national Development Research Centre, Ottawa, Canada,214–223.
Li, S. and Xu, X. 1995. Culture and Capture of Fish inChinese Reservoirs. IDRC, Ottawa, Canada, 128 p.
Lorenzen, K. 1995. Population dynamics and managementof culture-based fisheries. Fisheries Management andEcology, 2: 61–73.
Lorenzen, K. and Garaway, C.J. 1997. How predictable isthe outcome of stocking. FAO Fisheries Technical Paper374, 133–152.
Lorenzen, K., Garaway, C.J., Chamsingh, B. and Warren,T.J. 1998. Effect of access restrictions and stocking insmall waterbody fisheries in Laos. Journal of FishBiology 53 (Suppl. A), 345–357.
Lu, X. 1986. A review on reservoir fisheries in China. FAOFisheries Circular 803, 37 p.
Moreau, J. and De Silva, S.S. 1991. Predictive Fish YieldModels for Lakes and Reservoirs in the Philippines,Thailand and Sri Lanka. FAO Fisheries Technical Paper319, 42 p.
Phan, P.D and De Silva, S.S. 2000. The fishery of Ea KaoReservoir, Southern Vietnam; a fishery based on a com-bination of stock and recapture and self-recruiting popu-lations. Fisheries Management and Ecology, 7: 251-264.
Song, Z. 1999. Rural Aquaculture in China. RAP Publication1999/22. RAPA, FAO, Bangkok, 71 p.
Srivastava, T.K., Srinivasan, K., Seth, G.K., Rao, M.P. andRao, V.D. 1985. Inland Fish Marketing in India. Vol. 4.Reservoir Fisheries. Concept Publishing Co., New Delhi,1184 p.
Sugunan, V.V. 1995. Reservoir Fisheries of India. FAOFisheries Technical Paper 345, 420 p.
Welcomme, R.L. 1996. Stocking as a technique forenhancement of fisheries. FAO Aquaculture Newsletter,14: 8–14.
16
Fish Resources in Chinese Reservoirs and Their Utilisation
Daoming Huang, Jiashou Liu and Chuanlin Hu*
Abstract
China has more than 86 000 reservoirs. The diversity of the landscape, water resources andclimate in the reservoir catchments provides a variety of habitats for fish, resulting in a diversity offish species. More than 1020 species of fish have been found in Chinese freshwaters, most ofwhich also occur in reservoirs. However, the lotic species move to the upper reaches of rivers andthe migratory species gradually disappear because of the dams. The economically valuable fish inreservoirs are the lacustrine fish and these species prefer slow-flowing waters. About 100 suchspecies are commonly found in reservoirs in China. The species of most economic value inChinese reservoirs are cyprinids. Typical species include Hypophthalmichthys molitrix, Aristi-chthys nobilis, Cyprinus carpio, Carassius auratus, Ctenopharyngodon idellus, Mylopharyngodonpiceus, Megalobrama terminalis, Cirrhina molitorella, Erythroculter mongolicus and E. ilishae-formis. The composition of fish fauna in Chinese reservoirs is complicated and differs in differentregions. Almost all reservoirs in China are used for fish enhancement or culture-based fisheries.The 1998 fish yield in Chinese reservoirs was 1 294 000 t, of which more than 60% was silver carpand bighead carp. A series of strategies such as artificial stocking, transplantation, domestication,control of predatory fish, protection of spawning grounds of economically valued species, andextensive, culture-based fisheries in the small and medium-sized reservoirs is adopted to improveyields. About 30 species of fish are stocked or transplanted into reservoirs.
CHINA is a country rich in reservoirs. The cultivablesurface area of reservoirs is more than 2 × 10⁶ ha(Liu and He 1992), amounting to 40% of the totalcultivable freshwater surface area. Fisheries yield inChinese reservoirs in 1998 was 1 294 000 tons with amean yield of 810 kg/ha (FBCMA 1998). Reservoirfisheries are a major component of freshwaterfisheries. The diversity of the landscape, waterresources and climate in the reservoir catchmentsprovides a variety of living and reproductive habitatsfor fish, resulting in a diversity of fish species. Therich fish resources provide huge potential forreservoir fisheries development.
Number and distribution of reservoirs
More than 86 000 reservoirs have been constructedwith a total storage of 4 × 10¹¹ m3 (Table 1) (Liu and
He 1992). Reservoirs in 29 provinces, autonomousregions and municipalities come directly under thejurisdiction of the Central Government in China,with the exceptions of Shanghai and Tibet. Thereservoirs are located between 18°9′N and 35°26′N.Most are distributed in the main seven river systems,including the Changjiang, the Huanghe, the Huaihe,the Hai-luan, the Zhujiang, the Songhuajiang and theLiaohe rivers, amounting to 77% of total storage(Liu and He 1992).
The Changjiang River system has the mostreservoirs of the main seven river systems, in whichthe large and medium-sized reservoirs amount to36.7%, and the small-sized reservoirs 56.5% of thetotal number in the same size ranges across main-land China (Table 2). According to the Chineseclassification system, a reservoir exceeding 677 ha isranked as large, 66.7–677 ha as medium-sized, andless than 66.7 ha, small (Wu 1998). There are alsosome plain reservoirs in Xinjiang and InnerMongolia. Most reservoirs in China are medium orsmall, and most large-sized reservoirs have surfaceareas ranging 10–50 km2.
*Institute of Reservoir Fisheries, the Chinese Ministry ofWater Resources and the Chinese Academy of Sciences,Zhuo Dao Quan, Wuhan 430079, PR China
17
The origin and succession of fish resources
The fish resources in reservoirs originate from theimpounded river. Reservoirs in different districts ofChina normally maintain their own fish faunalcharacteristics. For example, the mud carp Cirrhinamolitorella occurs only in reservoirs of SouthernChina, Schizopygopsis only in reservoirs of theNorthwestern Plateau, and Brachymstax lenok onlyin reservoirs of the northeast.
After the impoundment of reservoirs, the flowdecreases, the surface area widens, the water columndeepens, the transparency increases, nutrients accu-mulate, and fisheries production potential increases.Especially, some large and medium-sized reservoirsshare the characteristics of both lotic and lenticwaters. The fish species in these reservoirs are sig-nificantly more diverse than in the original rivers.The obvious changes of fish resources are the move-ment of lotic species upstream. The migratoryspecies gradually disappear because of obstructionfrom dams. The economically valuable fish are thelacustrine fish, and these species prefer slow-flowingwaters.
In the early years of impoundment, many plantsand agricultural lands are immersed, and piscivorousfish, except the demersal snakehead, do not exist ingreat number. Snakehead fish spawn on aquaticplants. Furthermore, lower water levels at this stageinterfere with the life of pelagic piscivores, but theair-breathing snakehead is less affected (Liu and
Huang 1998). Economically valuable species growquickly and their yield increases rapidly at this stage.Later, water levels are raised, nutrients are lostbecause of the high water exchange rate, and mostaquatic plants disappear. Pelagic piscivorous fishgradually develop and become dominant. Predationfrom piscivorous fish and capture pressure oneconomically valuable fish are strengthened at thisstage. The development of economically valuablefish is prohibited, and the trash fish populations withhigh rates of reproduction grows quickly to compen-sate for losses from predation. Since trash fish have alow market value and are hard to capture, their rapiddevelopment decreases the production potential ofreservoirs.
Piscivorous fish play a very important role in thesuccession of fish resources. Their succession inreservoirs of the middle and lower reaches of theChangjiang River shows an obvious succession:demersal piscivorous fish (Channa and Silurus) →pelagic Culter → pelagic Elopichthys bambusa →Culter again after heavy human control of E. bam-busa (Chen et al. 1978).
In some reservoirs of Northern China, piscivorousniches are vacant. Trash fish dominate in such reser-voirs and fish resources are small. Fish assemblageis simple in these reservoirs, and only a few fishspecies are found in some reservoirs, resulting in lowfish yield.
Fish composition is heavily affected by humanbeings. Since fish culture in Chinese reservoirs iscomparatively intensive, natural fish yield amountsto a very small proportion of the total fish yield; inthe medium and small-sized reservoirs, it is less than5% of total yield.
Fish composition and distribution characteristics
China is one of the richest countries in the world infreshwater fish resources; 1020 species of freshwaterfish have been recorded. These fish belong to 266genera, 46 families and 18 orders. Among them, 750
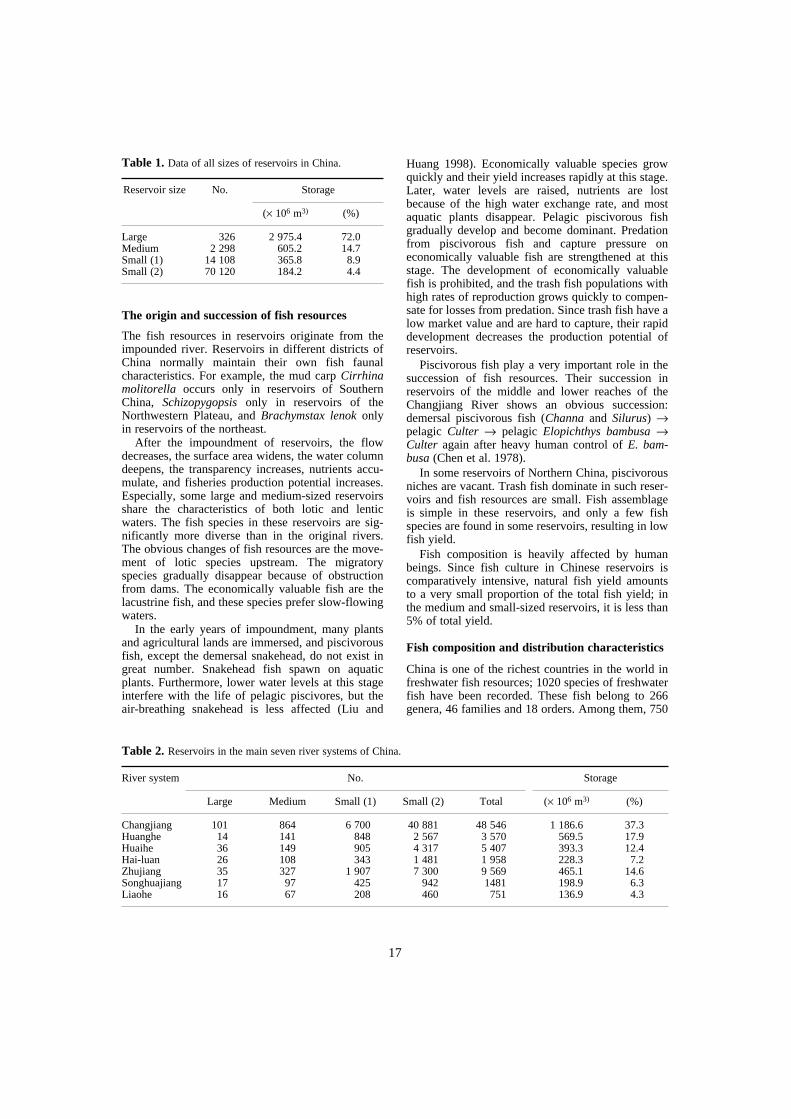
Table 1. Data of all sizes of reservoirs in China.
Reservoir size No. Storage
(× 106 m3) (%)
Large 326 2 975.4 72.0Medium 2 298 605.2 14.7Small (1) 14 108 365.8 8.9Small (2) 70 120 184.2 4.4
Table 2. Reservoirs in the main seven river systems of China.
River system No. Storage
Large Medium Small (1) Small (2) Total (× 106 m3) (%)
Changjiang 101 864 6 700 40 881 48 546 1 186.6 37.3Huanghe 14 141 848 2 567 3 570 569.5 17.9Huaihe 36 149 905 4 317 5 407 393.3 12.4Hai-luan 26 108 343 1 481 1 958 228.3 7.2Zhujiang 35 327 1 907 7 300 9 569 465.1 14.6Songhuajiang 17 97 425 942 1481 198.9 6.3Liaohe 16 67 208 460 751 136.9 4.3

18
are Cypriniformes, 109 Siluriformes, 70 Perciformes,39 Salmoniformes, and nine Acipenseriformes.Cypriniformes account for 73.5% of the total.Among them, 530 species are Cyprinidae, 145Cobitidae and 72 Homalopteridae. Moreover, themain economic fish in Chinese reservoirs areCyprinidae (Yue 1995).
Reservoirs in China are widely distributed andtheir characteristics differ from place to place. Mostreservoirs in Eastern China are normally plain-typed,and some are valley or river-typed. Their economiccharacteristics are similar to those of lakes. Reser-voirs in Southern China have natural conditions suit-able for tropical fish, and in Northern China, suitablefor cold-water fish. Reservoirs in Qinghai, Tibet,Inner Mongolia and Xinjiang have ecological charac-teristics of plateau areas. The ecological diversity inChinese reservoirs results in a diversity of fishspecies. In fact, it is very hard to distinguish clearlyreservoir fish from river and lake fish. Almost allfreshwater fish in China can be found in reservoirs.
Of the cyprinids, about 100 species are ofeconomic value. The four major domestic fish, silvercarp Hypophthalmichthys molitrix, bighead carpAristichthys nobilis, grass carp Ctenopharyngodonidellus and black carp Mylopharyngodon piceus, areindigenous to China. Bighead carp and silver carpespecially play a very important role in Chinesereservoir fisheries. Their yields amount to more than60% of the total. The common carp Cyprinus carpioand the goldfish Carassius auratus have the widestdistribution. Their yields amount to about 20% of thetotal in non-stocked reservoirs. In some reservoirs inNortheastern China, their yield may amount to morethan 50% of the total (HFI 1985). Parabramis,Megalobrama, Cirrhina and Xenocypris also have ahigh yield in non-stocked reservoirs. These fish feedmainly on aquatic grasses, periphyton and organicdetritus. Culter, Silurus, Channa and Siniperca aremild predators and are widely distributed in Chinesereservoirs. They are higher-valued in markets andplay an important role in controlling trash fish (Liuand He 1992).
The composition of the fish fauna in Chinesereservoirs is complicated and is different in differentregions. Fish species in reservoirs of the East ChinaPlain Region are very rich. Normally, 40–50 fishspecies can be found in large and medium-sizedreservoirs. For example, there are 68 species inDanjiangkou Reservoir (Yuan and Huang 1989). Thespecies mainly comprise river and plain fish. Fishoriginating from the Tertiary come second. Fish ofthe Indian plain species also have an important role.Fish of the Sino-Indian Plateau species can also befound in the upstream of reservoirs. The East ChinaPlain Subregion is the most important base of
reservoir fisheries. Almost all reservoirs in China areused for fish enhancement or culture-based fisheries.Main species include silver carp, bighead carp, grasscarp, Parabramis, Megalobrama, Silurus, Siniperca,Culter, Channa, Protosalanx, Neosalanx, andElopichthys (Li 1981; Chen 1990; Liu and He 1992).
South China is also rich in fish species. Normally,30–40 species can be found in its reservoirs. Theregion is affected by a warm air flow. It has a longsummer and no distinct winter. Its fish compositionis close to that of the Oriental region. Proportions ofthe Indian plain species and Sino-China plateauspecies obviously increase. Fish originating from theTertiary and the river and plain species can also befound in this region, which is another important areaof reservoir fisheries. There are some endemicspecies in this region, e.g. mud carp Cirrhina molito-rella, large-scale silver carp H. harmandi sauvage,the ratmouth barbel Ptychidio jordani, Channaasiatica, some species of Barbinae and introducedtropical tilapias (Li 1981; Lin 1987; Liu and He1992). For example, the yield of the mud carpamounts to 70% of the total in Songtao Reservoir,Hainan Province.
Reservoirs in North China have about 20 fishspecies, characterised by cold-water fish, such as thenorthern plain fish, northern plateau fish and NorthPole fish. In reservoirs of the Heilongjiang River (theAmur River) system, there are some river and plainfish and fish originating from the Tertiary. Thespecies peculiar to this region include the minnowsPhoxinus phoxinus, the silver crussian carp Carassiusgibelio, the Atlantic salmon Salmo salar, the blackcrussian carp, the roach Rutilus rutilus, the sculpinCottus gobio and the pikes Esocidae (Li 1981). It hasthe lowest reservoir number and fish species in theWest China Region. The common species are fishof the genera Schizothoracinae, Barbinae andNemachilinae. Typical species include Gymnocyprisand Schizopygopsis (Liu and He 1992).
Fish Resources Protection and Development
Status of reservoir fisheries in China
China has a long history in freshwater aquaculture.In 1995, the yield of land-based aquatic productsamounted to 51.3% of the world’s total. Comparedwith pond and lake fisheries, reservoir fisheries havea later beginning, but a more rapid development anda greater potential. Reservoir fisheries began in the1950s. With the construction of many reservoirs inthe 1960s and 1970s, and the success of the artificialpropagation of domestic silver carp, bighead carp,grass carp and black carp, reservoir fisheries devel-oped fast. The application of Joint Capture Methods,
19
which use driving-nets, bar-nets, gill-nets and stake-nets, has enabled the effective harvesting of pelagicfish (Li and Xu 1995).
Stocking with big-sized fingerlings and the appli-cation of protective devices to prevent escape accel-erated the development of reservoir fisheries. After1979, the administrative responsibility was moved tothe Chinese Ministry of Water Resources in theChinese Ministry of Agriculture. More fisheriesequipment was built. Technical aid for pond cultureand lake culture and the ecological characteristics ofreservoirs were considered. Reservoir fisheriesdeveloped from extensive culture to semi-intensiveand intensive culture.
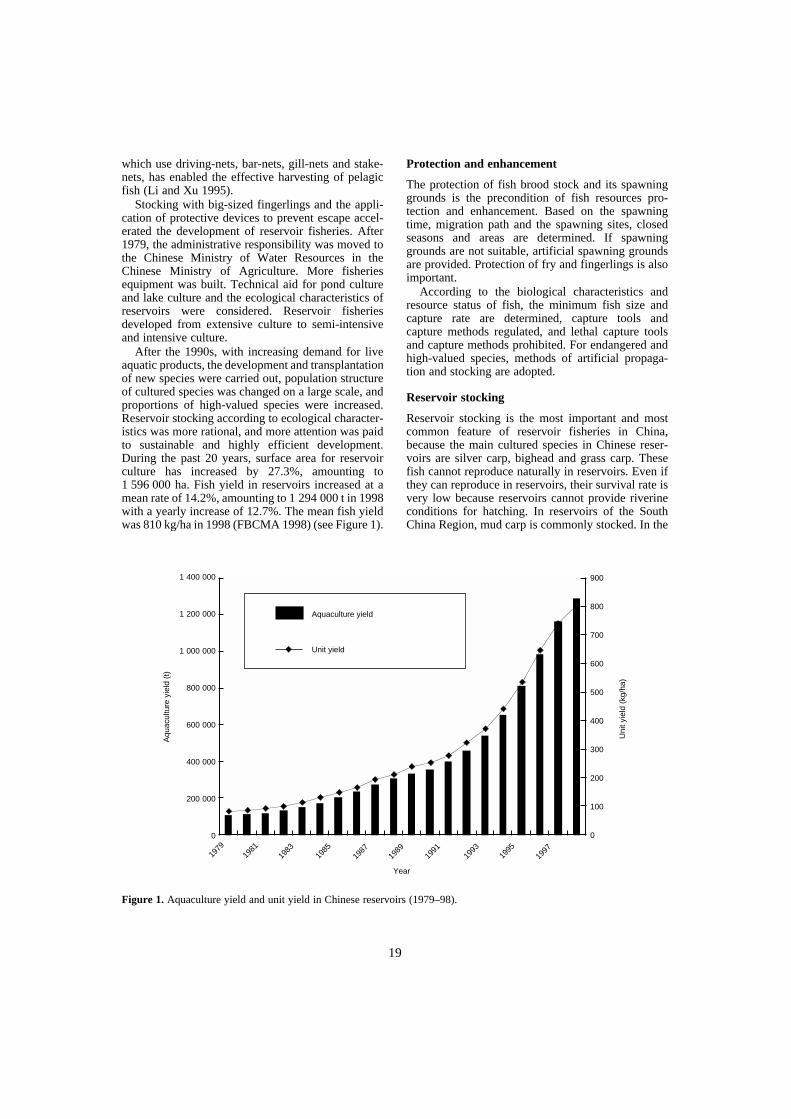
After the 1990s, with increasing demand for liveaquatic products, the development and transplantationof new species were carried out, population structureof cultured species was changed on a large scale, andproportions of high-valued species were increased.Reservoir stocking according to ecological character-istics was more rational, and more attention was paidto sustainable and highly efficient development.During the past 20 years, surface area for reservoirculture has increased by 27.3%, amounting to1 596 000 ha. Fish yield in reservoirs increased at amean rate of 14.2%, amounting to 1 294 000 t in 1998with a yearly increase of 12.7%. The mean fish yieldwas 810 kg/ha in 1998 (FBCMA 1998) (see Figure 1).
Protection and enhancement
The protection of fish brood stock and its spawninggrounds is the precondition of fish resources pro-tection and enhancement. Based on the spawningtime, migration path and the spawning sites, closedseasons and areas are determined. If spawninggrounds are not suitable, artificial spawning groundsare provided. Protection of fry and fingerlings is alsoimportant.
According to the biological characteristics andresource status of fish, the minimum fish size andcapture rate are determined, capture tools andcapture methods regulated, and lethal capture toolsand capture methods prohibited. For endangered andhigh-valued species, methods of artificial propaga-tion and stocking are adopted.
Reservoir stocking
Reservoir stocking is the most important and mostcommon feature of reservoir fisheries in China,because the main cultured species in Chinese reser-voirs are silver carp, bighead and grass carp. Thesefish cannot reproduce naturally in reservoirs. Even ifthey can reproduce in reservoirs, their survival rate isvery low because reservoirs cannot provide riverineconditions for hatching. In reservoirs of the SouthChina Region, mud carp is commonly stocked. In the
Figure 1. Aquaculture yield and unit yield in Chinese reservoirs (1979–98).
1 400 000
1 200 000
1 000 000
800 000
600 000
400 000
200 000
0
Aqu
acul
ture
yie
ld (
t)
900
800
700
600
500
400
300
200
100
0
Aquaculture yield
Unit yield
1979
1981
1983
1985
1987
1989
1991
1993
1995
1997
Year
Uni
t yie
ld (
kg/h
a)
20
shallow reservoirs of the East China Region, themandarin fish Siniperca chuatsi is also stocked tocontrol trash fish. Most stocked fish in reservoirs usenatural feeds which result in high yield and goodeconomic returns. Two types of stocking can be dis-tinguished according to the main species stocked:type of silver carp and bighead carp, and type ofcommon carp and goldfish.
Silver carp and bighead carp: these are thetraditional species cultured in China. They are plank-tivorous, have very high adaptability and their foodconversion efficiency is high, showing a rapidgrowth rate from the southern Hainan Province to thenorthern Heilongjiang and Xinjiang provinces. Inreservoirs with silver carp and bighead carp, theiryields normally amount to more than 80% of thetotal. The stocking efficiency is normally 3–7. In alarge-sized reservoir of Northern China, DahuofangReservoir, with a surface area of more than 5000 ha,the yield reached 300 kg/ha. In a medium-sizedreservoir of Hubei Province, Meichuan Reservoir,the yield is as high as 1000 kg/ha. This type ofstocking is also adopted even in some huge reser-voirs, for example, Xinanjiang Reservoir, with a sur-face area of 27 000 ha (Li 1994).
Common carp and goldfish: reservoirs inNorthern China are mainly stocked with commoncarp and goldfish because of the cold weather, asthey grow better than silver carp and bighead carp incold water. Goldfish have been stocked in WuyiReservoir, Heilongjiang Province, and the meanyield in that reservoir is 375 kg/ha.
Transplantation and domestication
Transplantation and domestication of fish began inthe 1950s in China. The silver carp, bighead carp andgrass carp were the first to be transplanted into reser-voirs. After the 1960s, the work of transplantationand domestication of fish rapidly developed. Somecold water species were transplanted into reservoirsof Northern China, e.g. the peled Coregonus peled,the pace Leuciscus leuciscus, the roach R. rutilus andthe tench Tinca tinca. Xenocypris, Megalobrama andwhite goldfish were transplanted into reservoirs ofEastern China. The tilapias, mud carp, walking cat-fish Clarias batrachus and the round spadefishEphippus orbis were transplanted into reservoirs ofSouthern China (Wang 1987).
In the past 10 years, fish transplantation wasstrengthened with the adjustment of species structurein reservoirs. So far, about 30 species have beenintroduced into reservoirs. Large-scale fish trans-plantation not only enriches fish resources, but alsocontributes to increasing fish yield. Some introducedfish have become the dominant species and the main
contributor to fish yield, showing both goodeconomic efficiency and ecological efficiency.Typical transplanted species include the pond smeltHypomesus olidus, the large icefish Protosalanxhyalocranius and the new icefish Neosalanxtaihuensis.
In the late 1980s, most reservoirs in NorthwesternChina, Beijing and Northern China were transplantedwith pond smelt, resulting in a yearly yield of 3000 t.In the past few years, icefish have been transplantedinto reservoirs on a large scale all over China. Theicefish yield was about 10 000 t, of which half theyield was from reservoirs. In Shandong Province,95% of large-sized reservoirs and more than 150small-sized reservoirs with a total surface area of73 300 ha were stocked with large icefish eggs. Morethan 70% of reservoirs so stocked have yielded fish;in reservoirs of Shandong Province, 820 t in 1997.The new icefish was mainly introduced into reser-voirs of Southern China, to Dianchi Lake, YunnanProvince. Now the new icefish have been introducedinto almost all reservoirs in the province. Its yieldwas 1000 t in reservoirs of Yunnan Province, about60 kg/ha (Hu et al. 1998).
Intensive fish culture in reservoirs
Intensive fish culture is carried out in some mediumand small-sized reservoirs, in some large andmedium-sized reservoirs, and in ponds belowreservoir dams. The cultured species differs fromplace to place, but includes almost all freshwaterspecies cultured in China. It is an important culturemethod in reservoirs, characterised by heavy invest-ment, high yield and good economic returns.
Intensive culture in medium and small-sized reservoirs and coves
The poly-culture method from the traditional pondculture of China was adopted in some medium andsmall-sized reservoirs and coves. These water bodiesare stocked with artificially reared fingerlings;manure or supplemental feeds are added. In someplaces, the integrated fish culture method has beenadopted including forests, fruit trees and livestock.Yields of this culture method may be as high as7500 kg/ha (Li 1994).
Cage culture
This culture method began in the 1970s. It was firstused for rearing fingerlings of silver carp and big-head carp without feeding. Later, adult fish were alsocultured in cages with different species and differentculture methods, including about 20 species, e.g. thecommon carp, tilapias and long-snout catfishLeiocassis longgirostris, fed with formulated feeds,
21
and the mandarin fish and southern catfish Silurusmeridionalis fed with fish. The mean yield of fishculture in cages is 300 kg/m3 (Wang 1989).
Fish culture in flowing water or slowly flowing water below dams
Normally, high-valued species are cultured inflowing water below reservoir dams taking advan-tage of the good water quality, sufficient dissolvedoxygen and different water temperatures at differentwater levels. These species include the rainbow troutSalmo gairdneri, sturgeons, the long-snout catfishand eels. The mean fish yield is about 45 kg/m2
(Yang et al. 1993) in flowing water and about4.5 kg/m2 in slowly flowing water (Sheng et al.1993).
Acknowledgments
We wish to thank Dr S.S. De Silva at Deakin Uni-versity, Australia, for strictly checking the manu-script and making good suggestions, and we are alsograteful to Professor Yue Peiqi at the Institute ofHydrobiology, the Chinese Academy of Sciences, forproviding information.
ReferencesChen, M. 1990. Fish resources in the Qingtangyiang River,
Shanghai. Shanghai Science Press (in Chinese).Chen, J., Lin, Y. and Wu, Z. 1978 Regulations of succes-
sion of predatory fish population in reservoirs of themiddle and lower Changjiang Valley, with a discussionof the methods of population control. Oceanogica etLimnologica Sinica, 9: 49–58 (in Chinese).
FBCMA (Fisheries Bureau of the Chinese Ministry ofAgriculture) 1979–98. Yearbook of Fisheries in China.Beijing: Agriculture Science (in Chinese).
HFI (Heilongjiang Fisheries Institute) 1985. FreshwaterFisheries Resources in Heilongjiang Province. Haerbin:Korean Press (in Chinese).
Hu, C., Chen, W. and Liu, J. 1998. Status of transplantationand enhancement of icefish in China and their develop-ment strategies. Reservoir Fisheries, 1998(2): 3–7 (inChinese).
Li, S. 1981. Studies on Zoogeographical Divisions forFresh Water Fish in China. Beijing: Science Press (inChinese).
Li, S. and Xu, S. 1995. Culture and Capture of Fish inChinese Reservoirs. Southbound: International Develop-ment Research Center.
Li, Y. 1994. On the status and development strategies ofreservoir fisheries in China. Reservoir Fisheries,1994(3): 3–5 (in Chinese).
Lin, Y. 1987. Assessment of the fisheries productivityreservoirs in Guangdong Province and strategies forincreasing fish yield. Reservoir Fisheries, 1987(4): 29–33(in Chinese).
Liu, J. and He, B. 1992. Cultivation of Freshwater Fish inChina (Third edition). Beijing: Science Press (inChinese).
Liu, J and Huang, Y. 1998. Fisheries and fish culturepractices in Fuqiaohe Reservoir, China. Intern. Rev.Hydrobiol., 83 (Special): 569–576.
Sheng, H. et al. 1993. The energy conversion efficiency offish culture in the slowly flowing water below reservoirdams. Reservoir Fisheries, 1993(3): 19–22 (in Chinese).
Wang, L. 1987. Transplantation and domestication of fish.Reservoir Fisheries, 1987(1): 4–5 (in Chinese).
Wang, L. 1989. Review of reservoir fisheries in China.Reservoir Fisheries, 1989(4): 2–7 (in Chinese).
Wu, J. 1998. Reservoir fisheries in China. Intern. Rev.Hydrobiol., 83 (Special): 611–618.
Yang, L. et al. 1993. Techniques of rainbow trout culture inMiyun Reservoir. Reservoir Fisheries, 1993(2): 48–50(in Chinese).
Yuang, F. and Huang, D. 1989. Fish resources and com-position in the Danjiangkou Reservoir. ResearchFisheries, 1989(2): 35–36 (in Chinese).
Yue, P. 1995. Analysis on the reason that some freshwaterfish are endangered. Lake Science, 7(3): 271–275 (inChinese).
22
The Impact of Large Reservoirs on Fish Biodiversity and Fisheries in China
Li Sifa*
Abstract
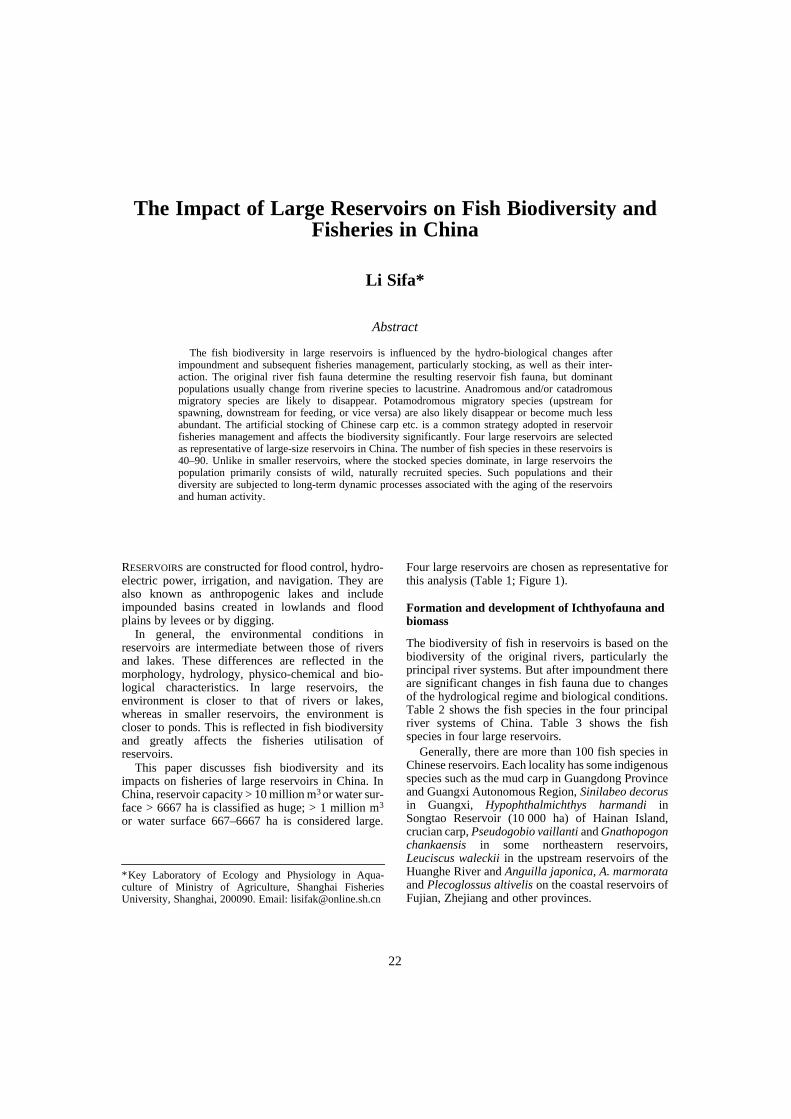
The fish biodiversity in large reservoirs is influenced by the hydro-biological changes afterimpoundment and subsequent fisheries management, particularly stocking, as well as their inter-action. The original river fish fauna determine the resulting reservoir fish fauna, but dominantpopulations usually change from riverine species to lacustrine. Anadromous and/or catadromousmigratory species are likely to disappear. Potamodromous migratory species (upstream forspawning, downstream for feeding, or vice versa) are also likely disappear or become much lessabundant. The artificial stocking of Chinese carp etc. is a common strategy adopted in reservoirfisheries management and affects the biodiversity significantly. Four large reservoirs are selectedas representative of large-size reservoirs in China. The number of fish species in these reservoirs is40–90. Unlike in smaller reservoirs, where the stocked species dominate, in large reservoirs thepopulation primarily consists of wild, naturally recruited species. Such populations and theirdiversity are subjected to long-term dynamic processes associated with the aging of the reservoirsand human activity.
RESERVOIRS are constructed for flood control, hydro-electric power, irrigation, and navigation. They arealso known as anthropogenic lakes and includeimpounded basins created in lowlands and floodplains by levees or by digging.
In general, the environmental conditions inreservoirs are intermediate between those of riversand lakes. These differences are reflected in themorphology, hydrology, physico-chemical and bio-logical characteristics. In large reservoirs, theenvironment is closer to that of rivers or lakes,whereas in smaller reservoirs, the environment iscloser to ponds. This is reflected in fish biodiversityand greatly affects the fisheries utilisation ofreservoirs.
This paper discusses fish biodiversity and itsimpacts on fisheries of large reservoirs in China. InChina, reservoir capacity > 10 million m3 or water sur-face > 6667 ha is classified as huge; > 1 million m3
or water surface 667–6667 ha is considered large.
Four large reservoirs are chosen as representative forthis analysis (Table 1; Figure 1).
Formation and development of Ichthyofauna and biomass
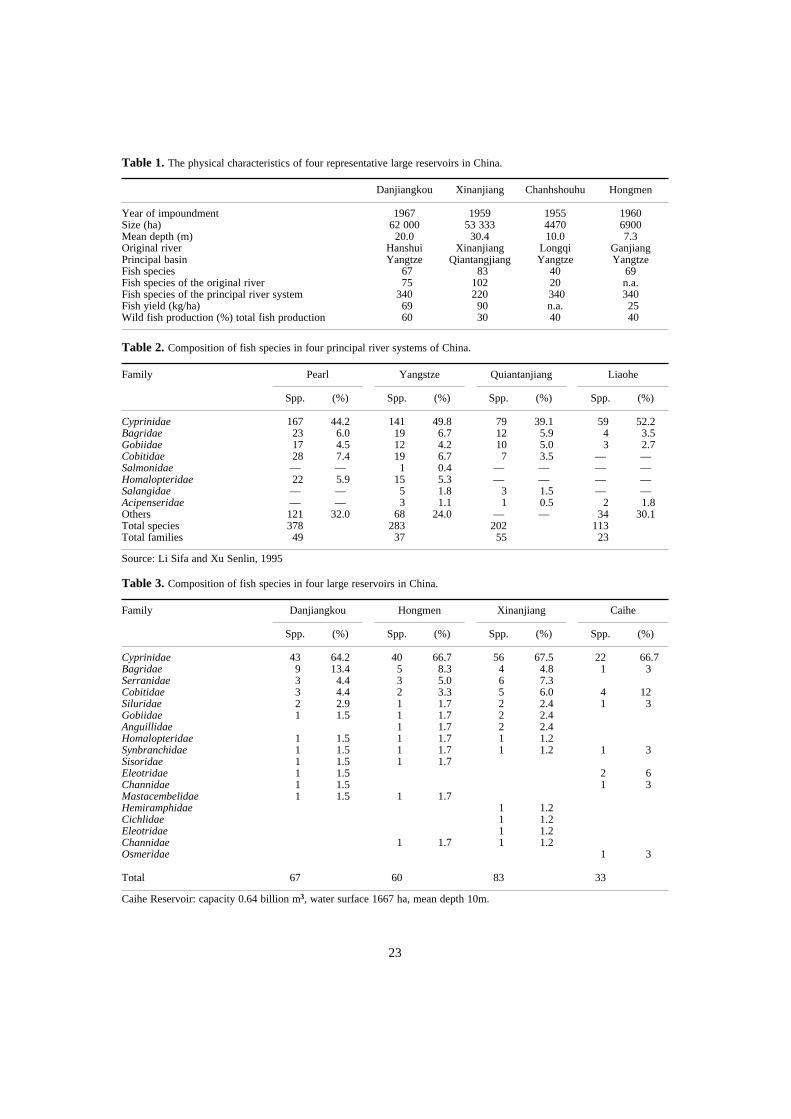
The biodiversity of fish in reservoirs is based on thebiodiversity of the original rivers, particularly theprincipal river systems. But after impoundment thereare significant changes in fish fauna due to changesof the hydrological regime and biological conditions.Table 2 shows the fish species in the four principalriver systems of China. Table 3 shows the fishspecies in four large reservoirs.
Generally, there are more than 100 fish species inChinese reservoirs. Each locality has some indigenousspecies such as the mud carp in Guangdong Provinceand Guangxi Autonomous Region, Sinilabeo decorusin Guangxi, Hypophthalmichthys harmandi inSongtao Reservoir (10 000 ha) of Hainan Island,crucian carp, Pseudogobio vaillanti and Gnathopogonchankaensis in some northeastern reservoirs,Leuciscus waleckii in the upstream reservoirs of theHuanghe River and Anguilla japonica, A. marmorataand Plecoglossus altivelis on the coastal reservoirs ofFujian, Zhejiang and other provinces.
*Key Laboratory of Ecology and Physiology in Aqua-culture of Ministry of Agriculture, Shanghai FisheriesUniversity, Shanghai, 200090. Email: [email protected]
23
Source: Li Sifa and Xu Senlin, 1995
Caihe Reservoir: capacity 0.64 billion m3, water surface 1667 ha, mean depth 10m.
Table 1. The physical characteristics of four representative large reservoirs in China.
Danjiangkou Xinanjiang Chanhshouhu Hongmen
Year of impoundment 1967 1959 1955 1960Size (ha) 62 000 53 333 4470 6900Mean depth (m) 20.0 30.4 10.0 7.3Original river Hanshui Xinanjiang Longqi GanjiangPrincipal basin Yangtze Qiantangjiang Yangtze YangtzeFish species 67 83 40 69Fish species of the original river 75 102 20 n.a.Fish species of the principal river system 340 220 340 340Fish yield (kg/ha) 69 90 n.a. 25Wild fish production (%) total fish production 60 30 40 40
Table 2. Composition of fish species in four principal river systems of China.
Family Pearl Yangstze Quiantanjiang Liaohe
Spp. (%) Spp. (%) Spp. (%) Spp. (%)
Cyprinidae 167 44.2 141 49.8 79 39.1 59 52.2Bagridae 23 6.0 19 6.7 12 5.9 4 3.5Gobiidae 17 4.5 12 4.2 10 5.0 3 2.7Cobitidae 28 7.4 19 6.7 7 3.5 — —Salmonidae — — 1 0.4 — — — —Homalopteridae 22 5.9 15 5.3 — — — —Salangidae — — 5 1.8 3 1.5 — —Acipenseridae — — 3 1.1 1 0.5 2 1.8Others 121 32.0 68 24.0 — — 34 30.1Total species 378 283 202 113Total families 49 37 55 23
Table 3. Composition of fish species in four large reservoirs in China.
Family Danjiangkou Hongmen Xinanjiang Caihe
Spp. (%) Spp. (%) Spp. (%) Spp. (%)
Cyprinidae 43 64.2 40 66.7 56 67.5 22 66.7Bagridae 9 13.4 5 8.3 4 4.8 1 3Serranidae 3 4.4 3 5.0 6 7.3Cobitidae 3 4.4 2 3.3 5 6.0 4 12Siluridae 2 2.9 1 1.7 2 2.4 1 3Gobiidae 1 1.5 1 1.7 2 2.4Anguillidae 1 1.7 2 2.4Homalopteridae 1 1.5 1 1.7 1 1.2Synbranchidae 1 1.5 1 1.7 1 1.2 1 3Sisoridae 1 1.5 1 1.7Eleotridae 1 1.5 2 6Channidae 1 1.5 1 3Mastacembelidae 1 1.5 1 1.7Hemiramphidae 1 1.2Cichlidae 1 1.2Eleotridae 1 1.2Channidae 1 1.7 1 1.2Osmeridae 1 3
Total 67 60 83 33
24
Changes in fish diversity after impoundment
The post-impoundment fish diversity of reservoirschanges and remains dynamic. Generally, enlarge-ment of the water surface and artificial stockingmake the fish diversity richer.
Riverine fish
As the original rivers disappeared and water flowbecame almost static in newly impounded reservoirs,riverine fishes such as Varicorhinus (Onychostoma)spp. are forced to move upstream and may eventu-ally disappear.
Lacustrine fish
The newly created open water environment provideslacustrine fish with a favourable habitat to live in andspawn as well as an adequate food source, therebyincreasing their abundance.
Soon after impoundment, the large number of sub-merged plants serve as spawning substrate forspecies such as common carp, crucian carp andHemiculter leucisculus. Due to the large watervolume, low initial fish population density, limitedinterspecific and intraspecific competition and fewerpredators, the offspring of these fish usually have ahigh survival rate; they grow fast and the populationincreases rapidly. In many reservoirs, this is themajor reason why populations formed at the earlyimpoundment stage can be continually harvested fora number of years.
For example, in Shuifeng Reservoir (impoundedin 1942), common carp was continuously captureduntil 1962. After a few years of impoundment, whenthe submerged plants decayed and the frequent fluc-tuation in water level causes big changes of draw-down area, a new macrophytes population is notformed or is less developed. Consequently, most
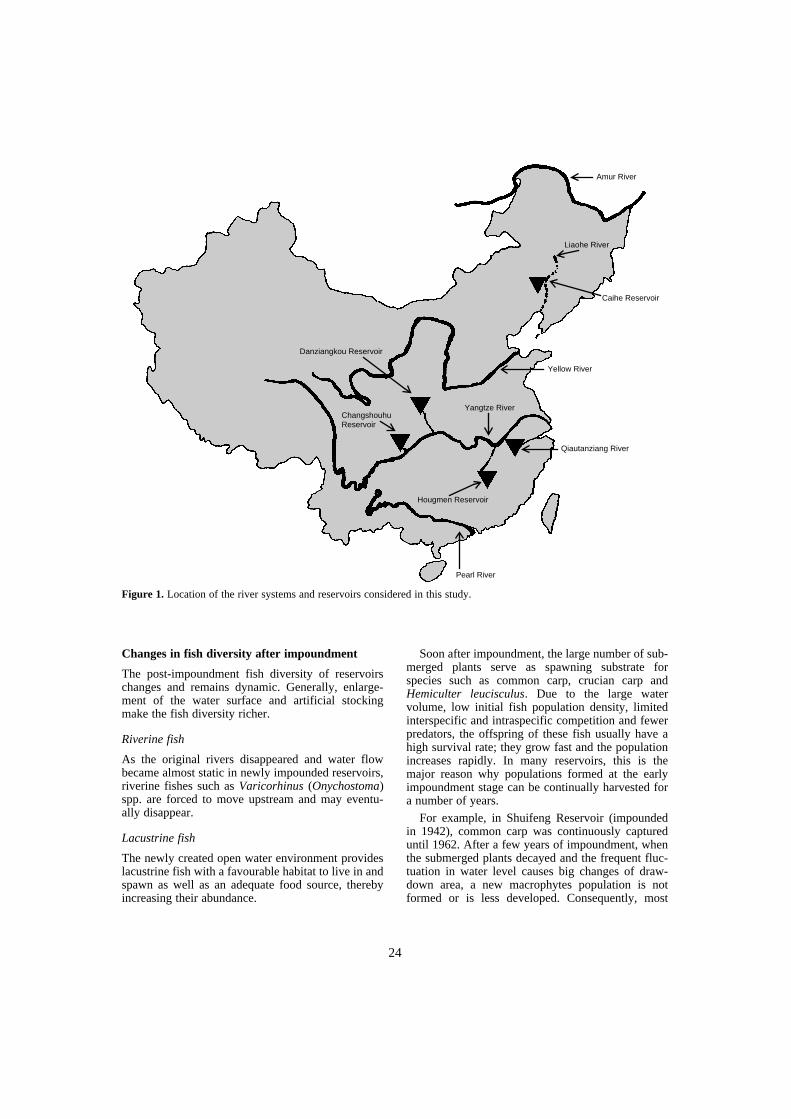
Figure 1. Location of the river systems and reservoirs considered in this study.
Amur River
Liaohe River
Caihe Reservoir
Yellow River
Yangtze River
Qiautanziang River
Pearl River
Hougmen Reservoir
ChangshouhuReservoir
Danziangkou Reservoir
25
phytopholous fish have difficulty finding suitablespawning grounds and suitable feeding areas for thelarvae. Except in the years when rainfall is abundantand water level fluctuations are minimal, spawningtakes place readily. However, when dry conditionsare present, spawning is not common. This may bethe main reason why the populations of commoncarp and crucian carp increase in the early stages ofimpoundment but decrease afterwards, and thegenerations produced in subsequent years are lessabundant. However, some fish like H. leucisculusand Pseudolaubuca sinensis which are not highlyspecific in their spawning conditions usually sustaina viable fishery.
In the case of common lacustrine predators suchas Erythroculter ilishaeformis, E. mongolicus,Elopichthys bambusa, Parasilurus asotus (catfish),Ophicephalus argus (snakehead), Siniperca chuatsi(mandarin fish) and Esox reicherti (pike), spawningconditions improve after impoundment, their popula-tions develop and are established rapidly.
Migratory fish
Catadromous species such as eel (Anguillajaponica), and anadromus species such as river shad(Hilsa reevesii), sturgeon (Acipenser sinensis), andCoilia spp. cannot in most instances migrate acrossdams, thus leading to a dramatic decrease in theirpopulation numbers and eventual extinction.
For the potamodromous (upstream for spawning,downstream for feeding) species such as silver, big-head and grass carps, they also cannot migratebecause of damming. The remainder left in the sub-merged zone after impoundment will not spawnnaturally even though they may reach maturity phys-iologically. In addition, the flow rate of water is notadequate for hatching and survival of post-larvae. Asa result, such species may disappear if no furtherstocking is done.
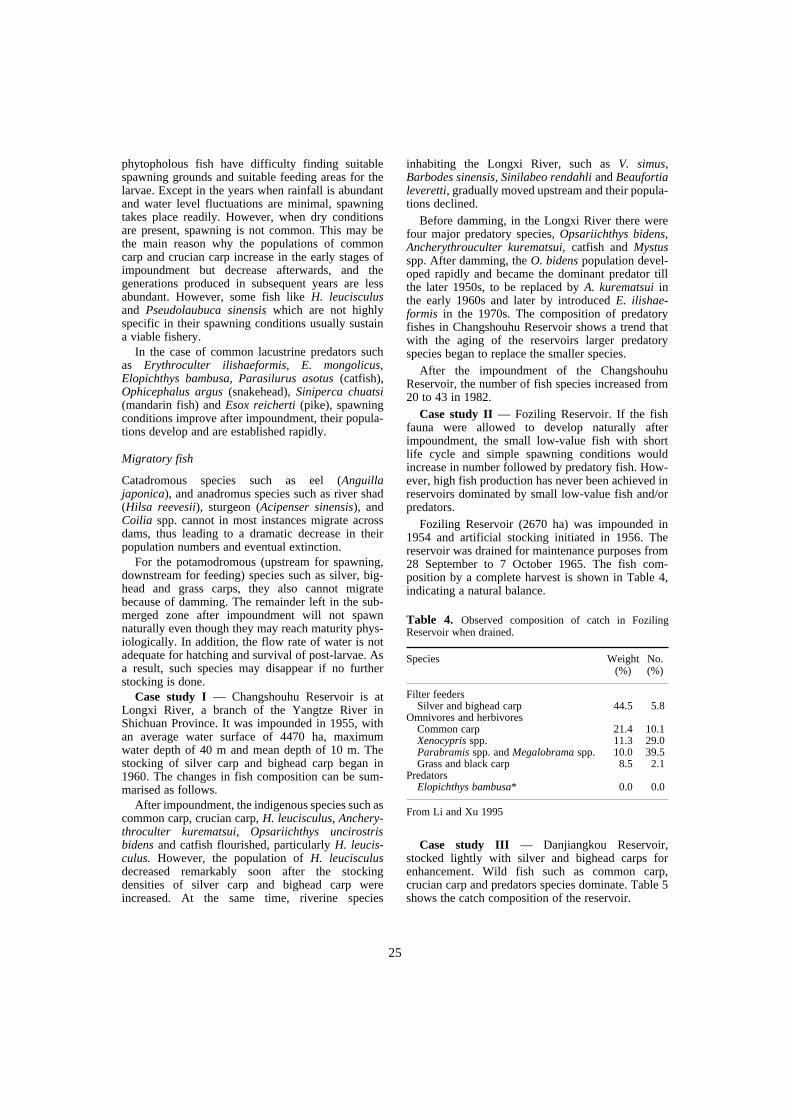
Case study I — Changshouhu Reservoir is atLongxi River, a branch of the Yangtze River inShichuan Province. It was impounded in 1955, withan average water surface of 4470 ha, maximumwater depth of 40 m and mean depth of 10 m. Thestocking of silver carp and bighead carp began in1960. The changes in fish composition can be sum-marised as follows.
After impoundment, the indigenous species such ascommon carp, crucian carp, H. leucisculus, Anchery-throculter kurematsui, Opsariichthys uncirostrisbidens and catfish flourished, particularly H. leucis-culus. However, the population of H. leucisculusdecreased remarkably soon after the stockingdensities of silver carp and bighead carp wereincreased. At the same time, riverine species
inhabiting the Longxi River, such as V. simus,Barbodes sinensis, Sinilabeo rendahli and Beaufortialeveretti, gradually moved upstream and their popula-tions declined.
Before damming, in the Longxi River there werefour major predatory species, Opsariichthys bidens,Ancherythrouculter kurematsui, catfish and Mystusspp. After damming, the O. bidens population devel-oped rapidly and became the dominant predator tillthe later 1950s, to be replaced by A. kurematsui inthe early 1960s and later by introduced E. ilishae-formis in the 1970s. The composition of predatoryfishes in Changshouhu Reservoir shows a trend thatwith the aging of the reservoirs larger predatoryspecies began to replace the smaller species.
After the impoundment of the ChangshouhuReservoir, the number of fish species increased from20 to 43 in 1982.
Case study II — Foziling Reservoir. If the fishfauna were allowed to develop naturally afterimpoundment, the small low-value fish with shortlife cycle and simple spawning conditions wouldincrease in number followed by predatory fish. How-ever, high fish production has never been achieved inreservoirs dominated by small low-value fish and/orpredators.
Foziling Reservoir (2670 ha) was impounded in1954 and artificial stocking initiated in 1956. Thereservoir was drained for maintenance purposes from28 September to 7 October 1965. The fish com-position by a complete harvest is shown in Table 4,indicating a natural balance.
From Li and Xu 1995
Case study III — Danjiangkou Reservoir,stocked lightly with silver and bighead carps forenhancement. Wild fish such as common carp,crucian carp and predators species dominate. Table 5shows the catch composition of the reservoir.
Table 4. Observed composition of catch in FozilingReservoir when drained.
Species Weight (%)
No. (%)
Filter feedersSilver and bighead carp 44.5 5.8
Omnivores and herbivoresCommon carp 21.4 10.1Xenocypris spp. 11.3 29.0Parabramis spp. and Megalobrama spp. 10.0 39.5 Grass and black carp 8.5 2.1
PredatorsElopichthys bambusa* 0.0 0.0
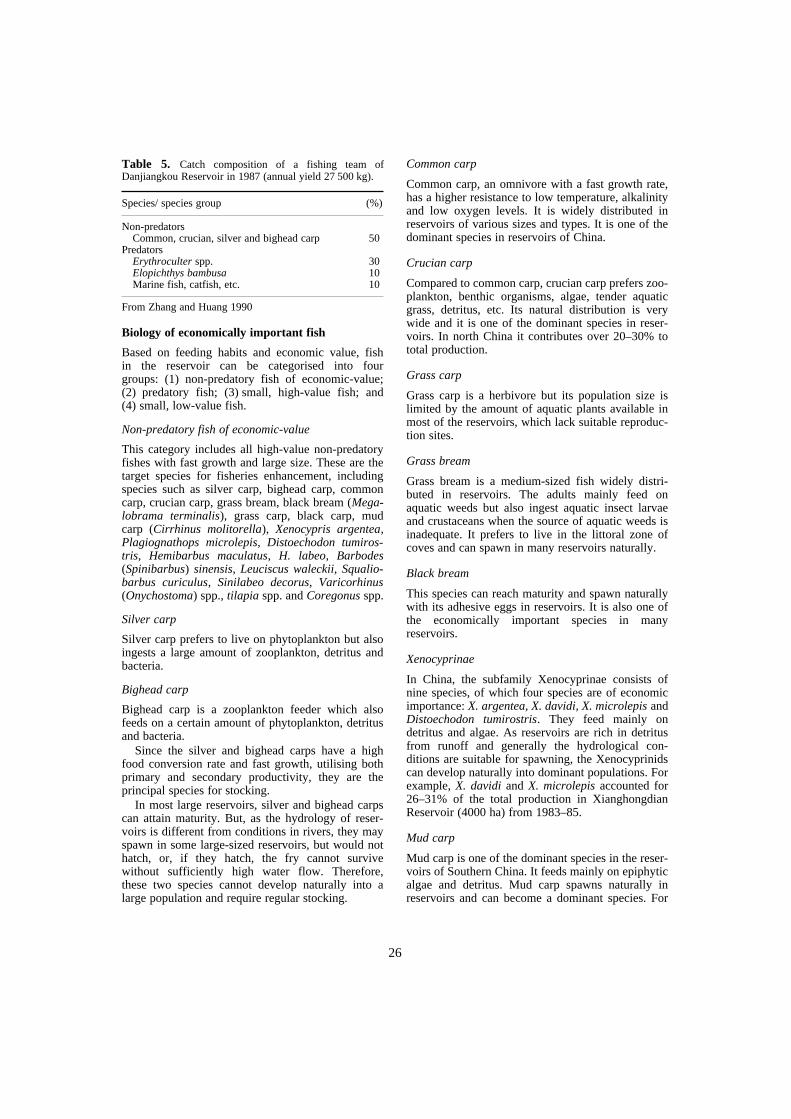
26
From Zhang and Huang 1990
Biology of economically important fish
Based on feeding habits and economic value, fishin the reservoir can be categorised into fourgroups: (1) non-predatory fish of economic-value;(2) predatory fish; (3) small, high-value fish; and(4) small, low-value fish.
Non-predatory fish of economic-value
This category includes all high-value non-predatoryfishes with fast growth and large size. These are thetarget species for fisheries enhancement, includingspecies such as silver carp, bighead carp, commoncarp, crucian carp, grass bream, black bream (Mega-lobrama terminalis), grass carp, black carp, mudcarp (Cirrhinus molitorella), Xenocypris argentea,Plagiognathops microlepis, Distoechodon tumiros-tris, Hemibarbus maculatus, H. labeo, Barbodes(Spinibarbus) sinensis, Leuciscus waleckii, Squalio-barbus curiculus, Sinilabeo decorus, Varicorhinus(Onychostoma) spp., tilapia spp. and Coregonus spp.
Silver carp
Silver carp prefers to live on phytoplankton but alsoingests a large amount of zooplankton, detritus andbacteria.
Bighead carp
Bighead carp is a zooplankton feeder which alsofeeds on a certain amount of phytoplankton, detritusand bacteria.
Since the silver and bighead carps have a highfood conversion rate and fast growth, utilising bothprimary and secondary productivity, they are theprincipal species for stocking.
In most large reservoirs, silver and bighead carpscan attain maturity. But, as the hydrology of reser-voirs is different from conditions in rivers, they mayspawn in some large-sized reservoirs, but would nothatch, or, if they hatch, the fry cannot survivewithout sufficiently high water flow. Therefore,these two species cannot develop naturally into alarge population and require regular stocking.
Common carp
Common carp, an omnivore with a fast growth rate,has a higher resistance to low temperature, alkalinityand low oxygen levels. It is widely distributed inreservoirs of various sizes and types. It is one of thedominant species in reservoirs of China.
Crucian carp
Compared to common carp, crucian carp prefers zoo-plankton, benthic organisms, algae, tender aquaticgrass, detritus, etc. Its natural distribution is verywide and it is one of the dominant species in reser-voirs. In north China it contributes over 20–30% tototal production.
Grass carp
Grass carp is a herbivore but its population size islimited by the amount of aquatic plants available inmost of the reservoirs, which lack suitable reproduc-tion sites.
Grass bream
Grass bream is a medium-sized fish widely distri-buted in reservoirs. The adults mainly feed onaquatic weeds but also ingest aquatic insect larvaeand crustaceans when the source of aquatic weeds isinadequate. It prefers to live in the littoral zone ofcoves and can spawn in many reservoirs naturally.
Black bream
This species can reach maturity and spawn naturallywith its adhesive eggs in reservoirs. It is also one ofthe economically important species in manyreservoirs.
Xenocyprinae
In China, the subfamily Xenocyprinae consists ofnine species, of which four species are of economicimportance: X. argentea, X. davidi, X. microlepis andDistoechodon tumirostris. They feed mainly ondetritus and algae. As reservoirs are rich in detritusfrom runoff and generally the hydrological con-ditions are suitable for spawning, the Xenocyprinidscan develop naturally into dominant populations. Forexample, X. davidi and X. microlepis accounted for26–31% of the total production in XianghongdianReservoir (4000 ha) from 1983–85.
Mud carp
Mud carp is one of the dominant species in the reser-voirs of Southern China. It feeds mainly on epiphyticalgae and detritus. Mud carp spawns naturally inreservoirs and can become a dominant species. For
Table 5. Catch composition of a fishing team ofDanjiangkou Reservoir in 1987 (annual yield 27 500 kg).
Species/ species group (%)
Non-predatorsCommon, crucian, silver and bighead carp 50
PredatorsErythroculter spp. 30Elopichthys bambusa 10 Marine fish, catfish, etc. 10
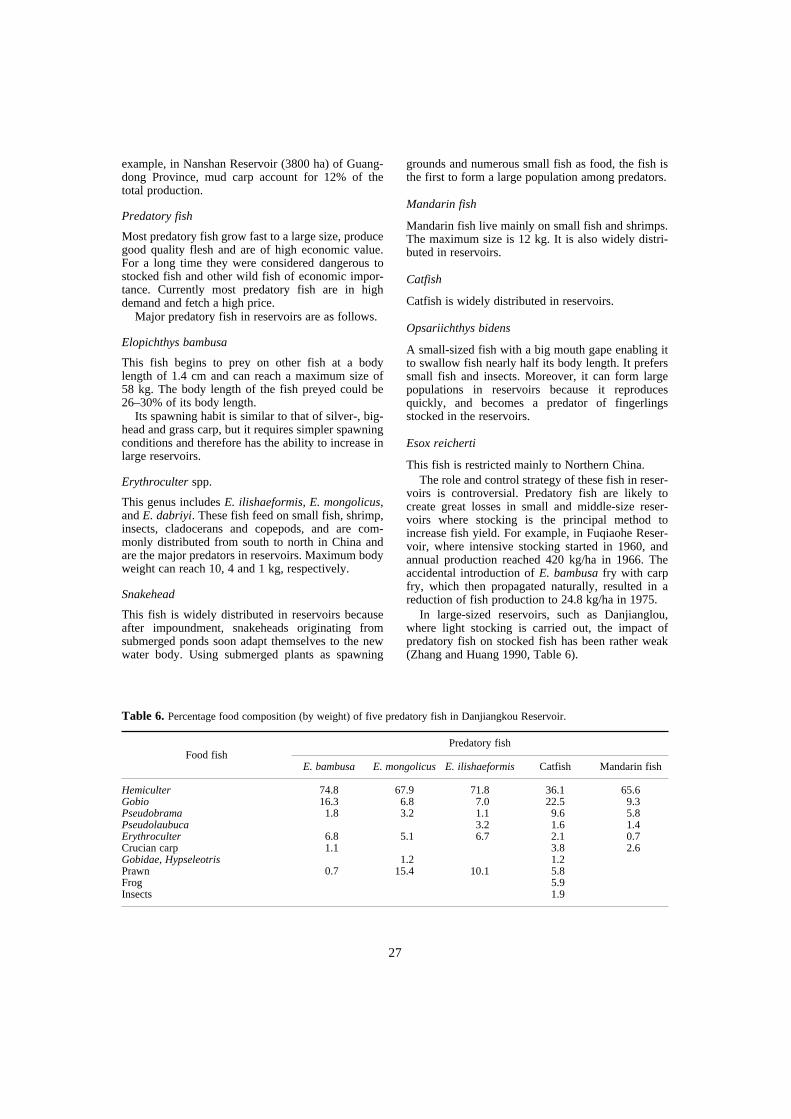
27
example, in Nanshan Reservoir (3800 ha) of Guang-dong Province, mud carp account for 12% of thetotal production.
Predatory fish
Most predatory fish grow fast to a large size, producegood quality flesh and are of high economic value.For a long time they were considered dangerous tostocked fish and other wild fish of economic impor-tance. Currently most predatory fish are in highdemand and fetch a high price.
Major predatory fish in reservoirs are as follows.
Elopichthys bambusa
This fish begins to prey on other fish at a bodylength of 1.4 cm and can reach a maximum size of58 kg. The body length of the fish preyed could be26–30% of its body length.
Its spawning habit is similar to that of silver-, big-head and grass carp, but it requires simpler spawningconditions and therefore has the ability to increase inlarge reservoirs.
Erythroculter spp.
This genus includes E. ilishaeformis, E. mongolicus,and E. dabriyi. These fish feed on small fish, shrimp,insects, cladocerans and copepods, and are com-monly distributed from south to north in China andare the major predators in reservoirs. Maximum bodyweight can reach 10, 4 and 1 kg, respectively.
Snakehead
This fish is widely distributed in reservoirs becauseafter impoundment, snakeheads originating fromsubmerged ponds soon adapt themselves to the newwater body. Using submerged plants as spawning
grounds and numerous small fish as food, the fish isthe first to form a large population among predators.
Mandarin fish
Mandarin fish live mainly on small fish and shrimps.The maximum size is 12 kg. It is also widely distri-buted in reservoirs.
Catfish
Catfish is widely distributed in reservoirs.
Opsariichthys bidens
A small-sized fish with a big mouth gape enabling itto swallow fish nearly half its body length. It preferssmall fish and insects. Moreover, it can form largepopulations in reservoirs because it reproducesquickly, and becomes a predator of fingerlingsstocked in the reservoirs.
Esox reicherti
This fish is restricted mainly to Northern China. The role and control strategy of these fish in reser-
voirs is controversial. Predatory fish are likely tocreate great losses in small and middle-size reser-voirs where stocking is the principal method toincrease fish yield. For example, in Fuqiaohe Reser-voir, where intensive stocking started in 1960, andannual production reached 420 kg/ha in 1966. Theaccidental introduction of E. bambusa fry with carpfry, which then propagated naturally, resulted in areduction of fish production to 24.8 kg/ha in 1975.
In large-sized reservoirs, such as Danjianglou,where light stocking is carried out, the impact ofpredatory fish on stocked fish has been rather weak(Zhang and Huang 1990, Table 6).
Table 6. Percentage food composition (by weight) of five predatory fish in Danjiangkou Reservoir.
Food fishPredatory fish
E. bambusa E. mongolicus E. ilishaeformis Catfish Mandarin fish
Hemiculter 74.8 67.9 71.8 36.1 65.6Gobio 16.3 6.8 7.0 22.5 9.3 Pseudobrama 1.8 3.2 1.1 9.6 5.8 Pseudolaubuca 3.2 1.6 1.4 Erythroculter 6.8 5.1 6.7 2.1 0.7 Crucian carp 1.1 3.8 2.6 Gobidae, Hypseleotris 1.2 1.2 Prawn 0.7 15.4 10.1 5.8Frog 5.9 Insects 1.9
28
Fish production in Xianghongdian Reservoirreached 27 kg/ha only in 1983, of which the predatorspecies Erythroculter spp., E. bambusa and mandarinfish were 38.25%, 15.02% and 6.91%, respectively.
Small, low-value fish
Most low-value fish compete for food with theeconomically important fish and some may even pre-date on the eggs and fry of other species. However,they also serve as forage fish for the predators and playa role in keeping the balance of the aquatic ecosystem.
The main small, low-value fish in reservoirs areH. leucisculus, P. sinensis, Toxabramis swinhonis,Coilia brachygnathus, Saurogobio dabryi, P. fulvi-draco, Rhodeus spp., Sarcocheilichthys sinensis,Hypseleotris swinhonis, Rhinogobius giurinus,Pseudorasbora parva, Gnathopagon spp., Macro-podus chinensis and Sinibrama macrops.
Small, high-value fish
The ice fish (Hemisalanx branchyrostralis) andHypomesus olidus are the major small species ofhigh value.
Impacts on fish biodiversity by super reservoir construction
There are 92 freshwater fish species listed in the‘China Red Data Book of Endangered Animals —Fishes’. They cover nine orders, 24 families, 78genera and 92 species, belonging to the category ofEx (Extinct), Et (Extinct in China), E (Endangered),V (Vulnerable) and R (Rare). Unfortunately, there isno specific study on the relationship between theconstruction of reservoirs and subsequent fish bio-diversity changes. The super reservoirs constructedon the major channels of principal rivers are likely toaffect fish biodiversity seriously.
The construction of the Three Gorges 175 m Damwill form a river-like reservoir of 600 km in lengthand 39.3 billion m3 capacity.
Impacts on the local indigenous fish
In the upper stream above the dam, there are 196 fishspecies, of which 90 species are indigenous, suchas Coreius guichenoti, Rhinogobio cylindricus,Chinese-ink carp (Procypris rabaudi), Leptobatia
elongata, Schizothoras chongi, Cetcobitis sinensisand Hemimyzon sinensis. They live in fast-flowingwaters. It is estimated that the Three Gorges Damwill reduce 1⁄5–1⁄4 habitat areas of indigenous fish.Some are likely to disappear.
Small low-value fish are usually ignored infisheries management, but are very important in bio-diversity issue.
Impacts on Chinese carp spawning
In the 600 km stretch upstream of the dam, there areeight middle-sized spawning grounds of about 20carp species, mainly silver, bighead, grass and blackcarp (Yi et al. 1988). After impoundment, thesespecies will probably decline or even disappear.
Impacts on the rare aquatic animals
The negative impact on sturgeons, Psephurusgladius and A. sinensis needs to be studied. Theywill not only disappear from upstream (reservoir),but will also be affected by changing habitats down-stream of the dam.
References
Li Sifa 1998. The Fisheries and Aquaculture in the YangtzeRiver Basin. Suisanzoshuoku, 46(3): 354–460.
Li Sifa and Xu Senlin 1995. Culture and Capture of Fish inChinese Reservoirs. Southbound, International Develop-ment Research Centre, 140 p.
Yi Belu, Yu Zhitang and Liang Zhishen 1988. GezhoubaWater Control Project and Four Famous Fishes inYangtze River. Hubei Science and Technology Press,Wuhan China, 112 p.
Yuan, F.X. and Huang, D.M. 1989. Fisheries resources andcomposition analysis of the Dangjiangkou Reservoir.Reservoir Fisheries, 2: 35–36.
Yue Peiqi Chen Yiyu, 1998. China Red Data Book ofEndangered Animals–Pisces. Science Press, Beijing,247 p.
Zhang, J.P. and Huang, X.C. 1990. On the control and utili-sation of predator fishes in Dangjiangkou Reservoir.Reservoir Fisheries, 2: 27–31.
Zhang, P.S. and Yang, T.X. 1994. Status, development andutilisation of Chaihe Reservoir. Reservoir Fisheries,2: 22–26.
Zhou, S.X., Xu, M.X., Zhang, C.R and Xu, X.H. 1995.Survey report on the Fisheries resources of HongmenReservoir. Reservoir Fisheries, 3: 28–30.
29
Status of Reservoir Fisheries in Vietnam
Ngo Sy Van and Le Thanh Luu*
Abstract
The overview describes reservoir systems in Vietnam and their role in industry, agriculture andfishery sectors. It also deals with management issues of water resources and inter-relationshipsamong reservoir users. The paper views development stages of reservoir fisheries before and afterreformations in the agriculture sector with a wider perspective of socioeconomic and managementaspects. The long-term development strategies of reservoir fisheries for 2000–2010 are alsodescribed. Data on fish production, stock-enhancement strategies, management schemes, andpolicies for different reservoir types are presented with a view to identifying development trendsand the constraints thereof. Based on the analysis, and factors influencing the fisheries, the over-view also proposes approaches — technological, management and policy — needed to achieve thetargeted social, environmental and production objectives of the development strategies.
Reservoir Systems in Vietnam MOST reservoirs in Vietnam were impounded after1954 for different purposes such as irrigation, hydro-electricity, flood control and water supply fordomestic consumption and industry. There are about4000 community reservoirs (Hoi 1999) of which 460are medium or large in size, with a water volume ofmore than a million m3 (Trong 1994). The reservoirsare usually located in hilly or mountain areas. Mostare in the north and central midlands and highlands.Based on size, the reservoirs may be classified aslarge, which have more than 10 000 ha of water sur-face, medium, of 1000 ha to 10 000 ha, and small,those of less than 1000 ha. The country has very fewlarge reservoirs; Hoa Binh (19 000 ha), Thac Ba(18 000 ha), and Tri An (32 400 ha), Thac Mo(10 600 ha) and Dau Tieng (18 000 ha). Most aremedium (about 460 ha) and small. There is anunaccounted number of reservoirs of less than 1–2 haconstructed under private funding resources.Depending on their function, reservoirs may also beclassified for irrigation, hydro-electricity, floodcontrol and industry and drinking uses. However,most are constructed to serve several purposes.
Fishery Resources in ReservoirsFish fauna
Fish fauna of any reservoir depends on its geograph-ical location and exploitation and protection of itsresources. It is noted that biodiversity of fish fauna inmost existing reservoirs in Vietnam is deteriorating.
In the northern mountain regions, 79 species havebeen recorded in reservoirs; in central Vietnam andthe Central Plateau, 53 species (Luu 1994). Therecorded number of fish species from reservoirs inboth regions is a little higher than from natural lakes(53 and 47 respectively), and probably, some Viet-namese (common carp), Chinese (silver carp, bighead carp, grass carp) and Indian carps (rohu,mrigal) have been introduced. Cyprinids are stilldominant among species inhabiting the reservoirs inVietnam.
Recent information (Tuan 1999) on fish fauna ofHoa Binh Reservoir indicate a poor species profile.According to sources, there are only 21 species,while before the reservoir was constructed, 80species were recorded in the basin and another 28species found in the springs and creeks. Sources alsoconfirm that many migratory fish species have notbeen found in this reservoir. Similar situations areknown for fish fauna in Thac Ba and Nui Coc reser-voirs. Nguyen VH (1994) recorded 96 species in thenewly built Thac Ba reservoir. Presently, only 76species are found (Vu 1999). A recent inventory ofthe existing species of two reservoirs in the north isgiven in Table 1.
*Research Institute for Aquaculture No. 1, Dinh Bang,Tu San, Bac Ninh, Vietnam. Email: [email protected]
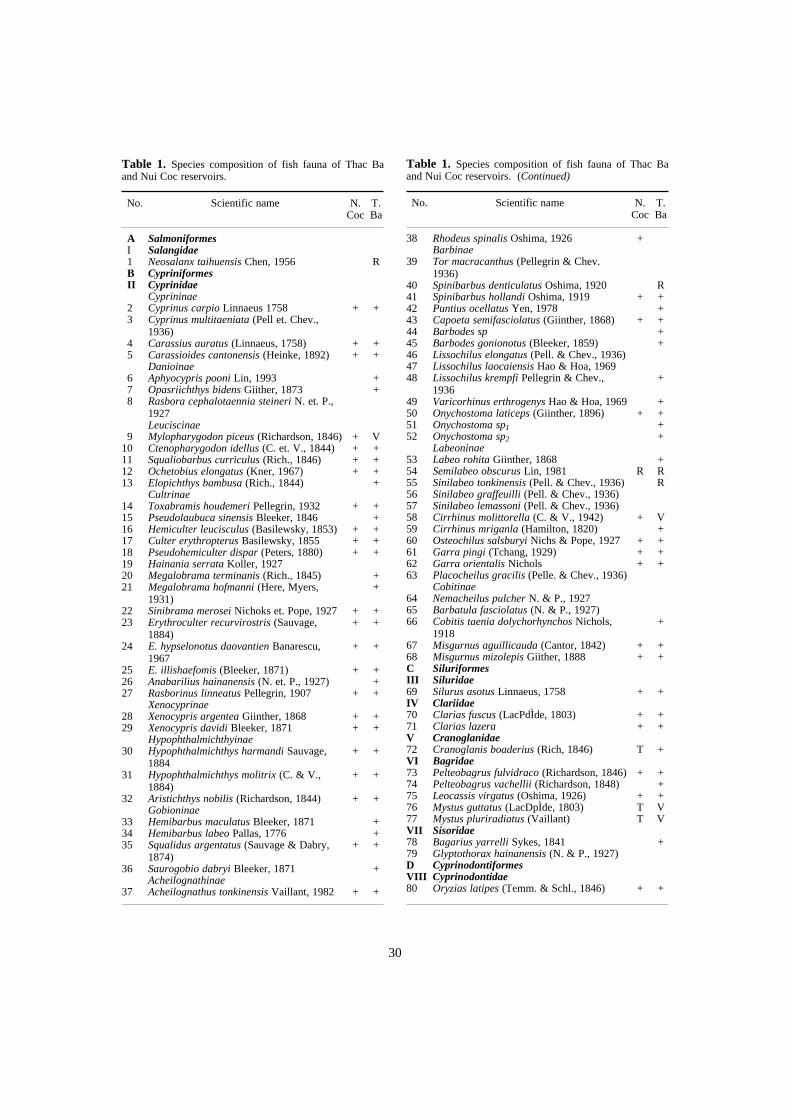
30
Table 1. Species composition of fish fauna of Thac Baand Nui Coc reservoirs.
No. Scientific name N. Coc
T. Ba
A SalmoniformesI Salangidae1 Neosalanx taihuensis Chen, 1956 RB CypriniformesII Cyprinidae
Cyprininae2 Cyprinus carpio Linnaeus 1758 + +3 Cyprinus multitaeniata (Pell et. Chev.,
1936)4 Carassius auratus (Linnaeus, 1758) + +5 Carassioides cantonensis (Heinke, 1892) + +
Danioinae6 Aphyocypris pooni Lin, 1993 +7 Opasriichthys bidens Giither, 1873 +8 Rasbora cephalotaennia steineri N. et. P.,
1927Leuciscinae
9 Mylopharygodon piceus (Richardson, 1846) + V10 Ctenopharygodon idellus (C. et. V., 1844) + +11 Squaliobarbus curriculus (Rich., 1846) + +12 Ochetobius elongatus (Kner, 1967) + +13 Elopichthys bambusa (Rich., 1844) +
Cultrinae14 Toxabramis houdemeri Pellegrin, 1932 + +15 Pseudolaubuca sinensis Bleeker, 1846 +16 Hemiculter leucisculus (Basilewsky, 1853) + +17 Culter erythropterus Basilewsky, 1855 + +18 Pseudohemiculter dispar (Peters, 1880) + +19 Hainania serrata Koller, 192720 Megalobrama terminanis (Rich., 1845) +21 Megalobrama hofmanni (Here, Myers,
1931)+
22 Sinibrama merosei Nichoks et. Pope, 1927 + +23 Erythroculter recurvirostris (Sauvage,
1884)+ +
24 E. hypselonotus daovantien Banarescu, 1967
+ +
25 E. illishaefomis (Bleeker, 1871) + +26 Anabarilius hainanensis (N. et. P., 1927) +27 Rasborinus linneatus Pellegrin, 1907 + +
Xenocyprinae28 Xenocypris argentea Giinther, 1868 + +29 Xenocypris davidi Bleeker, 1871 + +
Hypophthalmichthyinae30 Hypophthalmichthys harmandi Sauvage,
1884+ +
31 Hypophthalmichthys molitrix (C. & V., 1884)
+ +
32 Aristichthys nobilis (Richardson, 1844) + +Gobioninae
33 Hemibarbus maculatus Bleeker, 1871 +34 Hemibarbus labeo Pallas, 1776 +35 Squalidus argentatus (Sauvage & Dabry,
1874)+ +
36 Saurogobio dabryi Bleeker, 1871 +Acheilognathinae
37 Acheilognathus tonkinensis Vaillant, 1982 + +
38 Rhodeus spinalis Oshima, 1926 +Barbinae
39 Tor macracanthus (Pellegrin & Chev. 1936)
40 Spinibarbus denticulatus Oshima, 1920 R41 Spinibarbus hollandi Oshima, 1919 + +42 Puntius ocellatus Yen, 1978 +43 Capoeta semifasciolatus (Giinther, 1868) + +44 Barbodes sp +45 Barbodes gonionotus (Bleeker, 1859) +46 Lissochilus elongatus (Pell. & Chev., 1936)47 Lissochilus laocaiensis Hao & Hoa, 196948 Lissochilus krempfi Pellegrin & Chev.,
1936+
49 Varicorhinus erthrogenys Hao & Hoa, 1969 +50 Onychostoma laticeps (Giinther, 1896) + +51 Onychostoma sp1 +52 Onychostoma sp2 +
Labeoninae53 Labeo rohita Giinther, 1868 +54 Semilabeo obscurus Lin, 1981 R R55 Sinilabeo tonkinensis (Pell. & Chev., 1936) R56 Sinilabeo graffeuilli (Pell. & Chev., 1936)57 Sinilabeo lemassoni (Pell. & Chev., 1936)58 Cirrhinus molittorella (C. & V., 1942) + V59 Cirrhinus mriganla (Hamilton, 1820) +60 Osteochilus salsburyi Nichs & Pope, 1927 + +61 Garra pingi (Tchang, 1929) + +62 Garra orientalis Nichols + +63 Placocheilus gracilis (Pelle. & Chev., 1936)
Cobitinae64 Nemacheilus pulcher N. & P., 192765 Barbatula fasciolatus (N. & P., 1927)66 Cobitis taenia dolychorhynchos Nichols,
1918+
67 Misgurnus aguillicauda (Cantor, 1842) + +68 Misgurnus mizolepis Giither, 1888 + +C SiluriformesIII Siluridae69 Silurus asotus Linnaeus, 1758 + +IV Clariidae70 Clarias fuscus (LacPdÌde, 1803) + +71 Clarias lazera + +V Cranoglanidae72 Cranoglanis boaderius (Rich, 1846) T +VI Bagridae73 Pelteobagrus fulvidraco (Richardson, 1846) + +74 Pelteobagrus vachellii (Richardson, 1848) +75 Leocassis virgatus (Oshima, 1926) + +76 Mystus guttatus (LacDpÌde, 1803) T V77 Mystus pluriradiatus (Vaillant) T VVII Sisoridae78 Bagarius yarrelli Sykes, 1841 +79 Glyptothorax hainanensis (N. & P., 1927)D CyprinodontiformesVIII Cyprinodontidae80 Oryzias latipes (Temm. & Schl., 1846) + +
Table 1. Species composition of fish fauna of Thac Baand Nui Coc reservoirs. (Continued)
No. Scientific name N. Coc
T. Ba
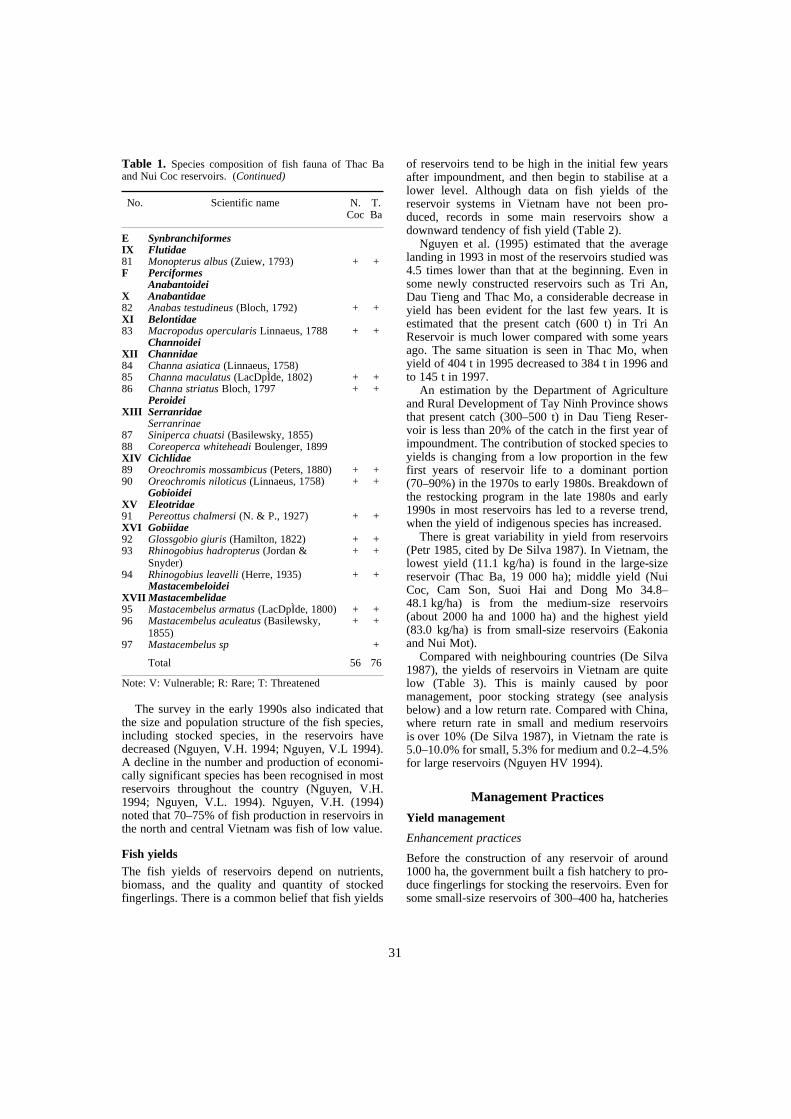
31
Note: V: Vulnerable; R: Rare; T: Threatened
The survey in the early 1990s also indicated thatthe size and population structure of the fish species,including stocked species, in the reservoirs havedecreased (Nguyen, V.H. 1994; Nguyen, V.L 1994).A decline in the number and production of economi-cally significant species has been recognised in mostreservoirs throughout the country (Nguyen, V.H.1994; Nguyen, V.L. 1994). Nguyen, V.H. (1994)noted that 70–75% of fish production in reservoirs inthe north and central Vietnam was fish of low value.
Fish yieldsThe fish yields of reservoirs depend on nutrients,biomass, and the quality and quantity of stockedfingerlings. There is a common belief that fish yields
of reservoirs tend to be high in the initial few yearsafter impoundment, and then begin to stabilise at alower level. Although data on fish yields of thereservoir systems in Vietnam have not been pro-duced, records in some main reservoirs show adownward tendency of fish yield (Table 2).
Nguyen et al. (1995) estimated that the averagelanding in 1993 in most of the reservoirs studied was4.5 times lower than that at the beginning. Even insome newly constructed reservoirs such as Tri An,Dau Tieng and Thac Mo, a considerable decrease inyield has been evident for the last few years. It isestimated that the present catch (600 t) in Tri AnReservoir is much lower compared with some yearsago. The same situation is seen in Thac Mo, whenyield of 404 t in 1995 decreased to 384 t in 1996 andto 145 t in 1997.
An estimation by the Department of Agricultureand Rural Development of Tay Ninh Province showsthat present catch (300–500 t) in Dau Tieng Reser-voir is less than 20% of the catch in the first year ofimpoundment. The contribution of stocked species toyields is changing from a low proportion in the fewfirst years of reservoir life to a dominant portion(70–90%) in the 1970s to early 1980s. Breakdown ofthe restocking program in the late 1980s and early1990s in most reservoirs has led to a reverse trend,when the yield of indigenous species has increased.
There is great variability in yield from reservoirs(Petr 1985, cited by De Silva 1987). In Vietnam, thelowest yield (11.1 kg/ha) is found in the large-sizereservoir (Thac Ba, 19 000 ha); middle yield (NuiCoc, Cam Son, Suoi Hai and Dong Mo 34.8–48.1 kg/ha) is from the medium-size reservoirs(about 2000 ha and 1000 ha) and the highest yield(83.0 kg/ha) is from small-size reservoirs (Eakoniaand Nui Mot).
Compared with neighbouring countries (De Silva1987), the yields of reservoirs in Vietnam are quitelow (Table 3). This is mainly caused by poormanagement, poor stocking strategy (see analysisbelow) and a low return rate. Compared with China,where return rate in small and medium reservoirsis over 10% (De Silva 1987), in Vietnam the rate is5.0–10.0% for small, 5.3% for medium and 0.2–4.5%for large reservoirs (Nguyen HV 1994).
Management Practices
Yield management
Enhancement practices
Before the construction of any reservoir of around1000 ha, the government built a fish hatchery to pro-duce fingerlings for stocking the reservoirs. Even forsome small-size reservoirs of 300–400 ha, hatcheries
E SynbranchiformesIX Flutidae81 Monopterus albus (Zuiew, 1793) + +F Perciformes
AnabantoideiX Anabantidae82 Anabas testudineus (Bloch, 1792) + +XI Belontidae83 Macropodus opercularis Linnaeus, 1788 + +
ChannoideiXII Channidae84 Channa asiatica (Linnaeus, 1758)85 Channa maculatus (LacDpÌde, 1802) + +86 Channa striatus Bloch, 1797 + +
PeroideiXIII Serranridae
Serranrinae87 Siniperca chuatsi (Basilewsky, 1855)88 Coreoperca whiteheadi Boulenger, 1899XIV Cichlidae89 Oreochromis mossambicus (Peters, 1880) + +90 Oreochromis niloticus (Linnaeus, 1758) + +
GobioideiXV Eleotridae91 Pereottus chalmersi (N. & P., 1927) + +XVI Gobiidae92 Glossgobio giuris (Hamilton, 1822) + +93 Rhinogobius hadropterus (Jordan &
Snyder)+ +
94 Rhinogobius leavelli (Herre, 1935) + +Mastacembeloidei
XVII Mastacembelidae95 Mastacembelus armatus (LacDpÌde, 1800) + +96 Mastacembelus aculeatus (Basilewsky,
1855)+ +
97 Mastacembelus sp +
Total 56 76
Table 1. Species composition of fish fauna of Thac Baand Nui Coc reservoirs. (Continued)
No. Scientific name N. Coc
T. Ba
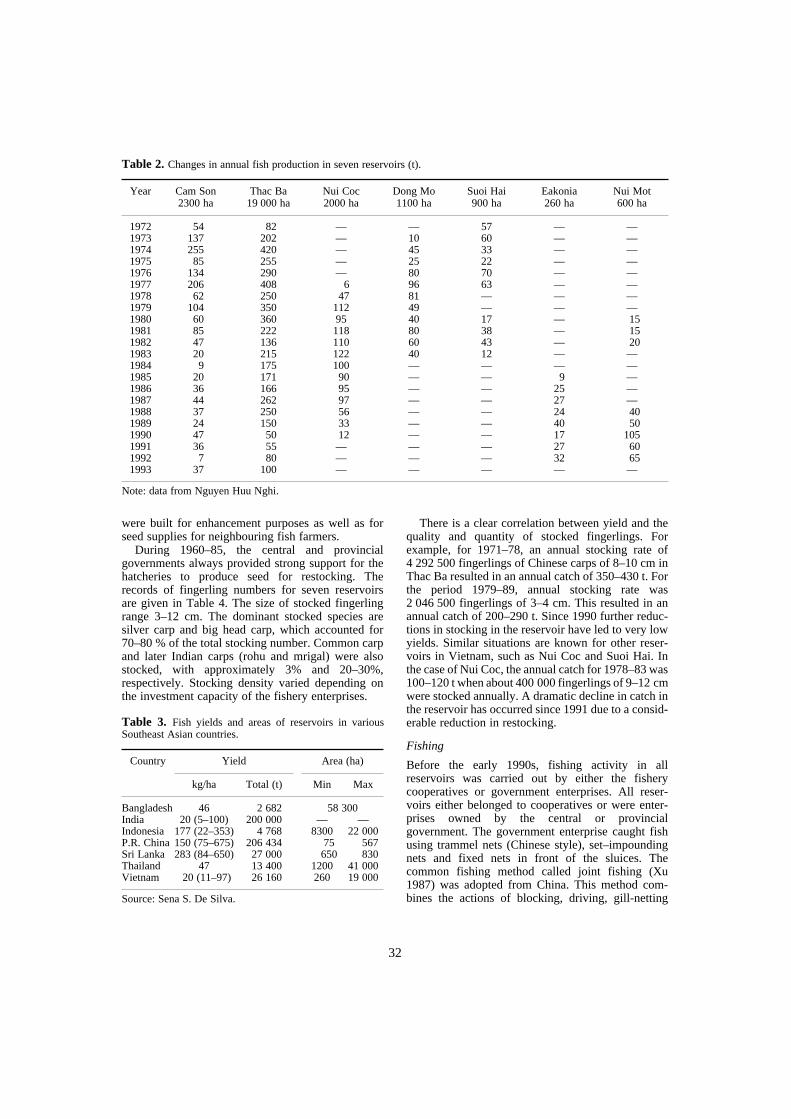
32
were built for enhancement purposes as well as forseed supplies for neighbouring fish farmers.
During 1960–85, the central and provincialgovernments always provided strong support for thehatcheries to produce seed for restocking. Therecords of fingerling numbers for seven reservoirsare given in Table 4. The size of stocked fingerlingrange 3–12 cm. The dominant stocked species aresilver carp and big head carp, which accounted for70–80 % of the total stocking number. Common carpand later Indian carps (rohu and mrigal) were alsostocked, with approximately 3% and 20–30%,respectively. Stocking density varied depending onthe investment capacity of the fishery enterprises.
Source: Sena S. De Silva.
There is a clear correlation between yield and thequality and quantity of stocked fingerlings. Forexample, for 1971–78, an annual stocking rate of4 292 500 fingerlings of Chinese carps of 8–10 cm inThac Ba resulted in an annual catch of 350–430 t. Forthe period 1979–89, annual stocking rate was2 046 500 fingerlings of 3–4 cm. This resulted in anannual catch of 200–290 t. Since 1990 further reduc-tions in stocking in the reservoir have led to very lowyields. Similar situations are known for other reser-voirs in Vietnam, such as Nui Coc and Suoi Hai. Inthe case of Nui Coc, the annual catch for 1978–83 was100–120 t when about 400 000 fingerlings of 9–12 cmwere stocked annually. A dramatic decline in catch inthe reservoir has occurred since 1991 due to a consid-erable reduction in restocking.
Fishing
Before the early 1990s, fishing activity in allreservoirs was carried out by either the fisherycooperatives or government enterprises. All reser-voirs either belonged to cooperatives or were enter-prises owned by the central or provincialgovernment. The government enterprise caught fishusing trammel nets (Chinese style), set–impoundingnets and fixed nets in front of the sluices. Thecommon fishing method called joint fishing (Xu1987) was adopted from China. This method com-bines the actions of blocking, driving, gill-netting
Table 3. Fish yields and areas of reservoirs in variousSoutheast Asian countries.
Country Yield Area (ha)
kg/ha Total (t) Min Max
Bangladesh 46 2 682 58 300India 20 (5–100) 200 000 — —Indonesia 177 (22–353) 4 768 8300 22 000P.R. China 150 (75–675) 206 434 75 567Sri Lanka 283 (84–650) 27 000 650 830Thailand 47 13 400 1200 41 000Vietnam 20 (11–97) 26 160 260 19 000
Note: data from Nguyen Huu Nghi.
Table 2. Changes in annual fish production in seven reservoirs (t).
Year Cam Son2300 ha
Thac Ba19 000 ha
Nui Coc2000 ha
Dong Mo1100 ha
Suoi Hai900 ha
Eakonia260 ha
Nui Mot600 ha
1972 54 82 — — 57 — —1973 137 202 — 10 60 — —1974 255 420 — 45 33 — —1975 85 255 — 25 22 — —1976 134 290 — 80 70 — —1977 206 408 6 96 63 — —1978 62 250 47 81 — — —1979 104 350 112 49 — — —1980 60 360 95 40 17 — 151981 85 222 118 80 38 — 151982 47 136 110 60 43 — 201983 20 215 122 40 12 — —1984 9 175 100 — — — —1985 20 171 90 — — 9 —1986 36 166 95 — — 25 —1987 44 262 97 — — 27 —1988 37 250 56 — — 24 401989 24 150 33 — — 40 501990 47 50 12 — — 17 1051991 36 55 — — — 27 601992 7 80 — — — 32 651993 37 100 — — — — —
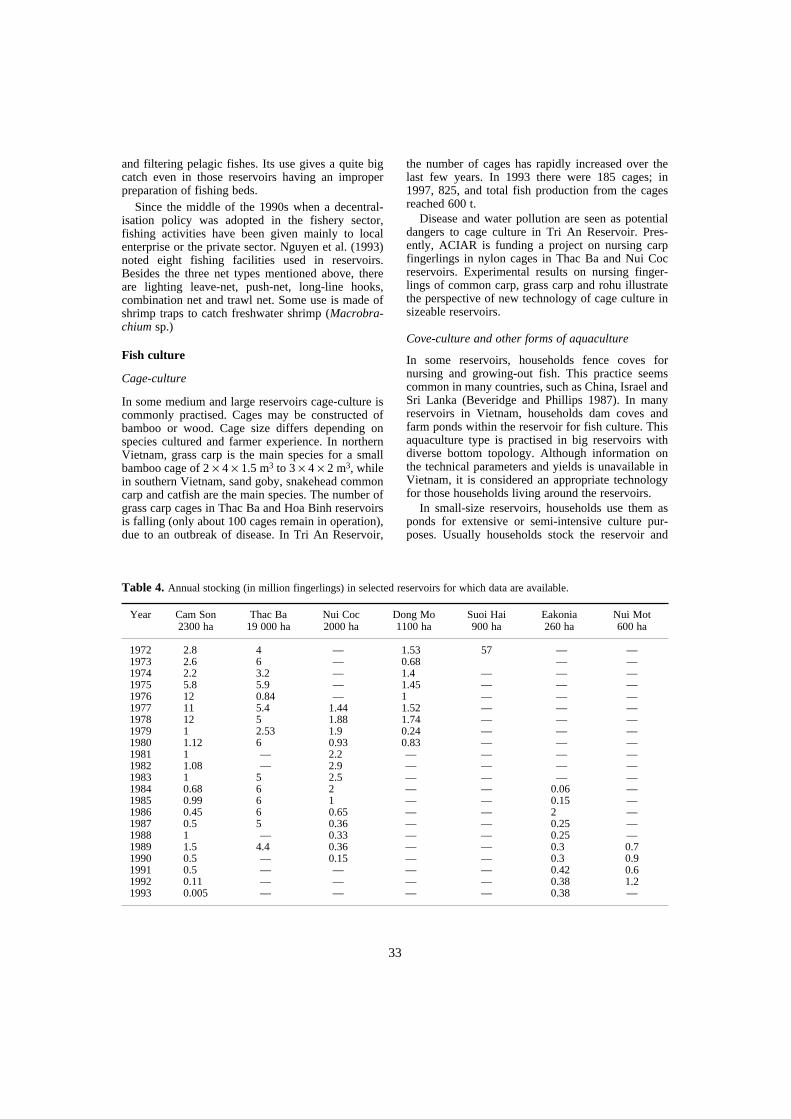
33
and filtering pelagic fishes. Its use gives a quite bigcatch even in those reservoirs having an improperpreparation of fishing beds.
Since the middle of the 1990s when a decentral-isation policy was adopted in the fishery sector,fishing activities have been given mainly to localenterprise or the private sector. Nguyen et al. (1993)noted eight fishing facilities used in reservoirs.Besides the three net types mentioned above, thereare lighting leave-net, push-net, long-line hooks,combination net and trawl net. Some use is made ofshrimp traps to catch freshwater shrimp (Macrobra-chium sp.)
Fish culture
Cage-culture
In some medium and large reservoirs cage-culture iscommonly practised. Cages may be constructed ofbamboo or wood. Cage size differs depending onspecies cultured and farmer experience. In northernVietnam, grass carp is the main species for a smallbamboo cage of 2 × 4 × 1.5 m3 to 3 × 4 × 2 m3, whilein southern Vietnam, sand goby, snakehead commoncarp and catfish are the main species. The number ofgrass carp cages in Thac Ba and Hoa Binh reservoirsis falling (only about 100 cages remain in operation),due to an outbreak of disease. In Tri An Reservoir,
the number of cages has rapidly increased over thelast few years. In 1993 there were 185 cages; in1997, 825, and total fish production from the cagesreached 600 t.
Disease and water pollution are seen as potentialdangers to cage culture in Tri An Reservoir. Pres-ently, ACIAR is funding a project on nursing carpfingerlings in nylon cages in Thac Ba and Nui Cocreservoirs. Experimental results on nursing finger-lings of common carp, grass carp and rohu illustratethe perspective of new technology of cage culture insizeable reservoirs.
Cove-culture and other forms of aquaculture
In some reservoirs, households fence coves fornursing and growing-out fish. This practice seemscommon in many countries, such as China, Israel andSri Lanka (Beveridge and Phillips 1987). In manyreservoirs in Vietnam, households dam coves andfarm ponds within the reservoir for fish culture. Thisaquaculture type is practised in big reservoirs withdiverse bottom topology. Although information onthe technical parameters and yields is unavailable inVietnam, it is considered an appropriate technologyfor those households living around the reservoirs.
In small-size reservoirs, households use them asponds for extensive or semi-intensive culture pur-poses. Usually households stock the reservoir and
Table 4. Annual stocking (in million fingerlings) in selected reservoirs for which data are available.
Year Cam Son2300 ha
Thac Ba19 000 ha
Nui Coc2000 ha
Dong Mo1100 ha
Suoi Hai900 ha
Eakonia260 ha
Nui Mot600 ha
1972 2.8 4 — 1.53 57 — —1973 2.6 6 — 0.68 — —1974 2.2 3.2 — 1.4 — — —1975 5.8 5.9 — 1.45 — — —1976 12 0.84 — 1 — — —1977 11 5.4 1.44 1.52 — — —1978 12 5 1.88 1.74 — — —1979 1 2.53 1.9 0.24 — — —1980 1.12 6 0.93 0.83 — — —1981 1 — 2.2 — — — —1982 1.08 — 2.9 — — — —1983 1 5 2.5 — — — —1984 0.68 6 2 — — 0.06 —1985 0.99 6 1 — — 0.15 —1986 0.45 6 0.65 — — 2 —1987 0.5 5 0.36 — — 0.25 —1988 1 — 0.33 — — 0.25 —1989 1.5 4.4 0.36 — — 0.3 0.71990 0.5 — 0.15 — — 0.3 0.91991 0.5 — — — — 0.42 0.61992 0.11 — — — — 0.38 1.21993 0.005 — — — — 0.38 —

34
harvest fish using nets, and at the end of the year,when water is not required, the reservoir is emptiedfor a complete harvest. Such small reservoirs areconsidered as ponds although these are used forwater supply to irrigate small areas of paddies.
Ownership and administrative management of reservoir fisheries
Ownership of reservoir fisheries changes over timeand by region. There is a government fishery enter-prise in each reservoir of medium and large size,responsible for running the hatchery and producingseed for stocking the reservoir, as well as capturingfish. Distribution of captured fish is the responsi-bility of the trade enterprise in collaboration with thefishery enterprise. In fact, the enterprise is orientedmore to production than management. CentralFishery Department (independently) or later InlandFisheries Department under the Central AgricultureCommittee was made responsible for overallmanagement and planning of these reservoir fisheryactivities.
In the smaller sized reservoirs owned by coopera-tives, the cooperatives were responsible for allactivities including restocking and harvesting.
There was no strong link between different stake-holders; for example, irrigation users or industry hadno connection with fisheries people.
Since the mid-1990s, the production role of fisheryenterprises has either been reduced or completelychanged towards resource management. The mainreason is that the government was unable to providefunding support to cover production activities,including staff salary and production costs.
Government line management
(i) Provincial fishery enterprise of the reservoir isstill responsible for enhancement of fisheryproduction by restocking fingerlings to reser-voir and harvesting. This is the old scheme ofoperation. An example can be seen in Tri AnReservoir, in Dong Nai Province. The advan-tage of this management pattern is that theenterprise officially owns the fish resources.Production plan is initiated by the enterprisedepending on its investment capacity, availa-bility of financial resources and marketing. Itsdisadvantage is controlling illegal fishing. Thisis one of the biggest social issues in reservoirfisheries. In fact, during reservoir constructionsome local inhabitants are displaced. The dis-placed population often resettles around reser-voirs to earn a living. Although government hasgranted necessary facilities and subsidies tosustain their livelihoods, nevertheless a living is
still needed from fishing. Property-sharing infishery resources between government owner-ship and the private sector seems to be inconflict.
(ii) Enterprise of Water Supply for Agriculture. Anexample of this can be seen in Ba KhoangReservoir, Lai Chau Province. A unit under theenterprise is responsible for running all activitiesrelating to fisheries including stocking, cap-turing and marketing. The conflict situationbetween the displaced population and enterprisein using fishery resources is a serious issue,while a similar conflict between irrigation andfisheries has disappeared.
(iii) Reservoir Fishery enterprise in Nui Coc Reser-voir, under the provincial Department of Agri-culture and Rural Development. The enterprisesells licences to the fishers depending on theirfishing facilities. This income pays for staffsalaries, running costs, and taxes, and pur-chasing fingerlings for restocking. This way,the enterprise acts for the benefit of thesurrounding population whose lives depend onfishery resources in the reservoir. However,there is still potential conflict between differentwater users, especially between tourists andfishers and irrigation. Controlling illegal fishingremains an issue.
(iv) Fishery Centre in Yen Bai province. This is oneof the biggest reservoirs in Vietnam. The centrehas wide responsibility for aquaculture andfisheries development in the whole Province.Relating to reservoir fisheries, the centre isresponsible for: a) restocking (funding from theprovincial government); b) navigation registryof fishing boats at a fee; c) overall control offishing activities; and d) extension services forthe aquaculture households. Meantime, com-mune authorities are authorised to collectfishing fees from fishers living in the com-mune, depending on their fishing facilities. Apart of the income is given to the communityand a part to the provincial government in theform of tax. In turn, the provincial governmentwill fund the centre to cover staff salaries,restocking, and other extension activities. Thisway, the role of the centre is more oriented tomanagement and administration.
Cooperative line management
This management approach is seen in small reser-voirs where individual households are unable toinvest and the reservoir is owned by a cooperative. Agroup of members form a small production unit
35
responsible for running the business, includingstocking of fingerlings, harvesting and marketingtable-fish. The members of the group work togetherto decide investment and planning, and to shareresponsibility and income. Usually under thismanagement system, fish production is much greatercompared with medium and large reservoirs, due tohigher investment in stocking.
Private sector line management
There are a number of very small reservoirs ownedby individual households. In many cases, the house-holds also get a mid-term contract to use the com-munal reservoir for fish culture. In both, thereservoir is considered as a big pond, and the house-holds culture fish based on their investment capacityand experience.
Policy Constraints
The central government is expected to improve thesituation of reservoir fisheries, clearly stated in the10-year development plan, in which the Ministry ofFisheries expects to get from the reservoirs about50 000 t fish by the year 2010. However, to date, noclear policies and strategies on reservoir fisherieshave been issued. Nor has an action plan beeninitiated.
Human resources in the field of reservoir fisheriesare inadequate. Obviously, reservoir fisheries cover abroad front of environmental, social, biological andtechnological fields. Certainly there is a challengefor development, but also the issue of humancapacity to undertake research and developmentresponsibility remains inadequately addressed.
The last point is the rational structure of reservoirfisheries. There is no doubt that decentralisedpolicies of management are reasonable. But the dif-ferences in organisation structure between provincesaffect the implementation of appropriate manage-ment practices.
Acknowledgment
The authors would like to express sincere thanks toProfessor Sena De Silva for his full support andencouragement. They would also like to expressgreat gratitude to the Australian Centre for Inter-national Agriculture Research (ACIAR) for its finan-cial support to survey reservoir fisheries and for
participation in this workshop. Lastly, the authorsacknowledge the Research Institute for Aquaculture–1 and Scientific Committee for their comments onthis paper, as well as Mr Nguyen Van Tu for infor-mation on the reservoirs of Southern Vietnam.
References
Beveridge M. and Phillips M. 1987. Aquaculture in reser-voirs. Reservoir Fishery Management and Developmentin Asia. Proceedings of Workshop. Kathmandu, Nepal23–28 Nov. 1987, 234–243.
De Silva, S. 1987. The reservoir fisheries of Asia. ReservoirFishery Management and Development in Asia. Proceed-ings of Workshop, Kathmandu, Nepal 23–28 Nov. 1987,19–28.
Luu Le Thanh, 1994. Inland fisheries in Vietnam underenvironmental constraints. Country Report at the sixthsession of IPFC Working Party of Experts on InlandFisheries, Bangkok, Thailand 17–21 Oct. 1994, 185–192.
Ngo Sy Van, 1999. Status of fish fauna of Thacba Reser-voir. Abstract of MSc. thesis, Hanoi, 1999.
Nguyen Chu Hoi, 1999. Overview environmental situationsof rural, mountain and coastal areas in Vietnam. Pro-ceedings of the National Environmental Conference1998. Ministry of Science Technology and Environment.Hanoi, 1999. 204–210.
Nguyen Dinh Trong, 1994. Reservoirs in Vietnam: presentstatus and the scientific problems to be considered in thefuture. Report from the National Workshop on IntegratedManagement of Reservoirs in Vietnam, Hanoi 5–6 Oct.,1994, 23 p.
Nguyen Van Hao, 1994. Fishery development in the reser-voirs of Vietnam. Report from the National Workshopon Integrated Management of Reservoirs in Vietnam,Hanoi 5–6 Oct. 1994, 20 p.
——1995. Environmental aspects and aquatic resources inreservoirs of Vietnam. Proceedings of the NationalWorkshop on Environment and Aquaculture Develop-ment. Hai Phong, Vietnam, 17–19 May 1994, 42–431.
Nguyen Van Hao, Pham Xuan Am, and Nguyen Huu Nghi,1995. Results of survey on reservoir fishery status.Institution Report. 42 p.
Nguyen Van Lam, 1994. Development trend of fisheries inThac Ba Reservoir. Report of the Second Workshop onReservoir Fisheries in Vietnam, 64–70.
Tuan Vu Van, 1999. Environmental impact assessment ofHoa Binh Reservoir. Proceedings of the NationalEnvironmental Conference 1998. Ministry of ScienceTechnology and Environment, Hanoi, 1999, 486–508.
Xu Senlin, 1987. Fishing techniques in Chinese reservoirs.Reservoir Fishery Management and Development in Asia.Proceedings of Workshop. Kathmandu, Nepal 23–28 Nov.1987, 169–175.

36
Status and Potential of Reservoir Fisheries in Dak Lak Province, Vietnam
Phan Dinh Phuc and J.D. Sollows*
Abstract
Dak Lak is the largest of the four provinces in the Central Highlands of Vietnam (19 535 km2,and elevation of 515 m). It has a population of 1.75 million in its 17 districts and one city. Dak Lakhas an estimated 377 reservoirs (about 6900 ha), constructed mainly for irrigation. Most reservoirswere stocked with fingerlings but only a few have had a good recovery. With good monitoring andannual stocking, fish yields can range 350–700 kg/ha in reservoirs of 10–300 ha. Yields can reach1000 kg/ha in reservoirs of less than 10 ha. Fish yields from unstocked reservoirs range 30–230 kg/ha. Reservoir fisheries are managed by: a) State agencies; b) State agencies cooperating with othereconomic units; c) local government (commune, district); and d) individuals or groups. Dak Lakhas five hatcheries, which produce 253 million fry annually. Most are shipped south for nursingnear Ho Chi Minh City and the Mekong Delta because of a local lack of modern equipment andnursery area. Annually, 22 t of fingerlings (16 million) are produced locally and another 67 t(53 million) are transferred back to Dak Lak for stocking in reservoirs and/or ponds. In Dak Lak,about 4000 t of fish a year are produced, which supplies only 3.3 kg/person. Given an averagenational fish consumption of 15 kg/yr it is not enough, so the province depends on a large quantityof marine fish. Problems faced by reservoir fisheries in Dak Lak include lack of appropriatemanagement, reliable fingerling supply, and capital for hatcheries and stocking. To develop thepotential of reservoir fisheries, a comprehensive fisheries strategy is needed, one which includesthe development of reservoir fisheries.
DAK LAK is the largest of the provinces of theCentral Highlands of Vietnam. The population of theprovince grew from about 350 000 in 1975 to about1.2 million in 1994. Current estimates put it at about1.5 million. Much of this increase is due to immigra-tion from the north. Soils in most of the province arevery fertile, and agriculture is expanding rapidly.Coffee has been a particularly lucrative crop. In1979, about 18 000 ha were under coffee; an esti-mate by Dak Lak Department of Agriculture andRural Development in early 1999 put the area at175 000 ha.
Fish is the most important, and lowest-cost, sourceof animal protein for the residents of the Central
Highlands. Good estimates of local production arenot available, but the best recent guess is that about4000 t are harvested annually. This is far too little forlocal demand, and imports of marine fish make upthe bulk of fish marketed in the province.
Expansion of the irrigated area in the provincedepends largely on irrigation, of which reservoirs area major source. Reservoir construction is continuing,in response to the growing demand for water forcrops. This water area can usually be used second-arily for fisheries.
The project ‘Management of Reservoir Fisheries’has worked in Dak Lak since 1996, with an ultimateobjective of ‘sustained, high yields of fish achievedfrom reservoirs managed under local communityagreement with government’. Work during the initialphase of the project included intensive surveys of sixwater bodies in the province. This, combined withother information collected, has given someindication of the potential of and constraints to thedevelopment of reservoir fisheries in the area.
*Management of Reservoir Fisheries Project, 68 Le HongPhong Street, Buon Me Thuot City, Vietnam. E-mail:[email protected]
05RF_Phuc_Sollows Page 36 Friday, May 4, 2001 11:15 AM
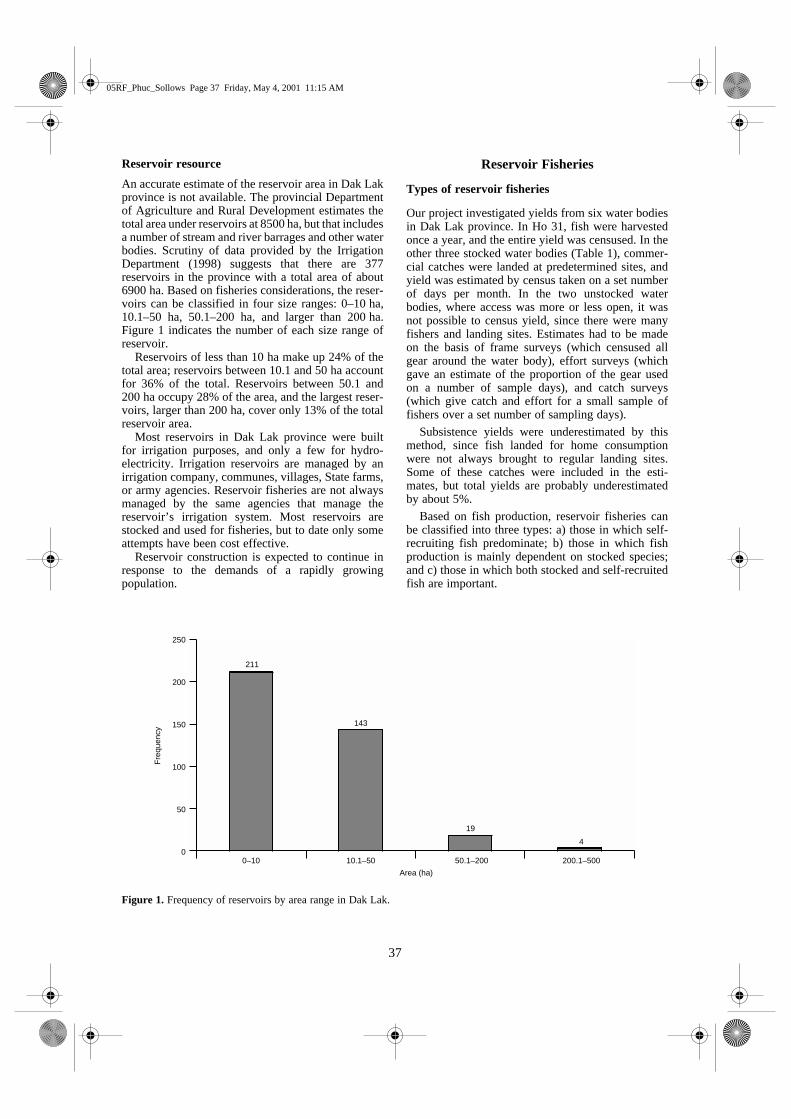
37
Reservoir resource
An accurate estimate of the reservoir area in Dak Lakprovince is not available. The provincial Departmentof Agriculture and Rural Development estimates thetotal area under reservoirs at 8500 ha, but that includesa number of stream and river barrages and other waterbodies. Scrutiny of data provided by the IrrigationDepartment (1998) suggests that there are 377reservoirs in the province with a total area of about6900 ha. Based on fisheries considerations, the reser-voirs can be classified in four size ranges: 0–10 ha,10.1–50 ha, 50.1–200 ha, and larger than 200 ha.Figure 1 indicates the number of each size range ofreservoir.
Reservoirs of less than 10 ha make up 24% of thetotal area; reservoirs between 10.1 and 50 ha accountfor 36% of the total. Reservoirs between 50.1 and200 ha occupy 28% of the area, and the largest reser-voirs, larger than 200 ha, cover only 13% of the totalreservoir area.
Most reservoirs in Dak Lak province were builtfor irrigation purposes, and only a few for hydro-electricity. Irrigation reservoirs are managed by anirrigation company, communes, villages, State farms,or army agencies. Reservoir fisheries are not alwaysmanaged by the same agencies that manage thereservoir’s irrigation system. Most reservoirs arestocked and used for fisheries, but to date only someattempts have been cost effective.
Reservoir construction is expected to continue inresponse to the demands of a rapidly growingpopulation.
Reservoir Fisheries
Types of reservoir fisheries
Our project investigated yields from six water bodiesin Dak Lak province. In Ho 31, fish were harvestedonce a year, and the entire yield was censused. In theother three stocked water bodies (Table 1), commer-cial catches were landed at predetermined sites, andyield was estimated by census taken on a set numberof days per month. In the two unstocked waterbodies, where access was more or less open, it wasnot possible to census yield, since there were manyfishers and landing sites. Estimates had to be madeon the basis of frame surveys (which censused allgear around the water body), effort surveys (whichgave an estimate of the proportion of the gear usedon a number of sample days), and catch surveys(which give catch and effort for a small sample offishers over a set number of sampling days).
Subsistence yields were underestimated by thismethod, since fish landed for home consumptionwere not always brought to regular landing sites.Some of these catches were included in the esti-mates, but total yields are probably underestimatedby about 5%.
Based on fish production, reservoir fisheries canbe classified into three types: a) those in which self-recruiting fish predominate; b) those in which fishproduction is mainly dependent on stocked species;and c) those in which both stocked and self-recruitedfish are important.
Figure 1. Frequency of reservoirs by area range in Dak Lak.
250
200
150
100
50
0
Fre
quen
cy
211
143
19
4
0–10 10.1–50 50.1–200 200.1–500
Area (ha)
05RF_Phuc_Sollows Page 37 Friday, May 4, 2001 11:15 AM
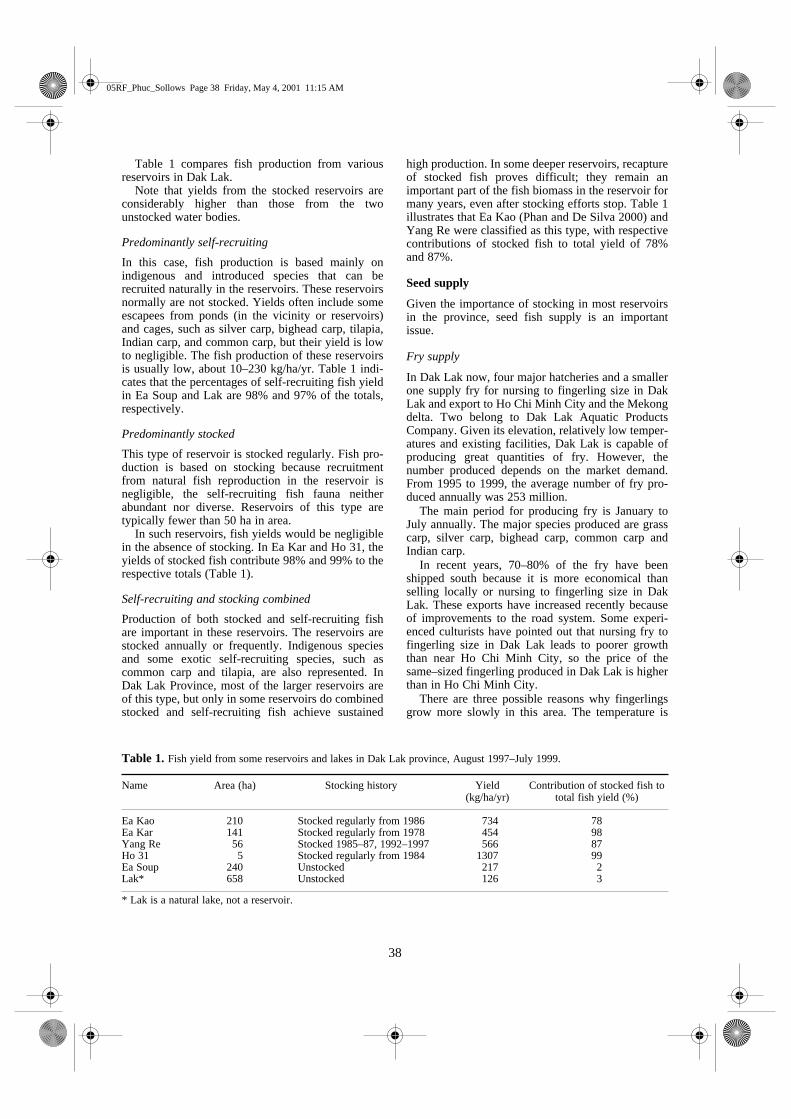
38
Table 1 compares fish production from variousreservoirs in Dak Lak.
Note that yields from the stocked reservoirs areconsiderably higher than those from the twounstocked water bodies.
Predominantly self-recruiting
In this case, fish production is based mainly onindigenous and introduced species that can berecruited naturally in the reservoirs. These reservoirsnormally are not stocked. Yields often include someescapees from ponds (in the vicinity or reservoirs)and cages, such as silver carp, bighead carp, tilapia,Indian carp, and common carp, but their yield is lowto negligible. The fish production of these reservoirsis usually low, about 10–230 kg/ha/yr. Table 1 indi-cates that the percentages of self-recruiting fish yieldin Ea Soup and Lak are 98% and 97% of the totals,respectively.
Predominantly stocked
This type of reservoir is stocked regularly. Fish pro-duction is based on stocking because recruitmentfrom natural fish reproduction in the reservoir isnegligible, the self-recruiting fish fauna neitherabundant nor diverse. Reservoirs of this type aretypically fewer than 50 ha in area.
In such reservoirs, fish yields would be negligiblein the absence of stocking. In Ea Kar and Ho 31, theyields of stocked fish contribute 98% and 99% to therespective totals (Table 1).
Self-recruiting and stocking combined
Production of both stocked and self-recruiting fishare important in these reservoirs. The reservoirs arestocked annually or frequently. Indigenous speciesand some exotic self-recruiting species, such ascommon carp and tilapia, are also represented. InDak Lak Province, most of the larger reservoirs areof this type, but only in some reservoirs do combinedstocked and self-recruiting fish achieve sustained
high production. In some deeper reservoirs, recaptureof stocked fish proves difficult; they remain animportant part of the fish biomass in the reservoir formany years, even after stocking efforts stop. Table 1illustrates that Ea Kao (Phan and De Silva 2000) andYang Re were classified as this type, with respectivecontributions of stocked fish to total yield of 78%and 87%.
Seed supply
Given the importance of stocking in most reservoirsin the province, seed fish supply is an importantissue.
Fry supply
In Dak Lak now, four major hatcheries and a smallerone supply fry for nursing to fingerling size in DakLak and export to Ho Chi Minh City and the Mekongdelta. Two belong to Dak Lak Aquatic ProductsCompany. Given its elevation, relatively low temper-atures and existing facilities, Dak Lak is capable ofproducing great quantities of fry. However, thenumber produced depends on the market demand.From 1995 to 1999, the average number of fry pro-duced annually was 253 million.
The main period for producing fry is January toJuly annually. The major species produced are grasscarp, silver carp, bighead carp, common carp andIndian carp.
In recent years, 70–80% of the fry have beenshipped south because it is more economical thanselling locally or nursing to fingerling size in DakLak. These exports have increased recently becauseof improvements to the road system. Some experi-enced culturists have pointed out that nursing fry tofingerling size in Dak Lak leads to poorer growththan near Ho Chi Minh City, so the price of thesame–sized fingerling produced in Dak Lak is higherthan in Ho Chi Minh City.
There are three possible reasons why fingerlingsgrow more slowly in this area. The temperature is
* Lak is a natural lake, not a reservoir.
Table 1. Fish yield from some reservoirs and lakes in Dak Lak province, August 1997–July 1999.
Name Area (ha) Stocking history Yield(kg/ha/yr)
Contribution of stocked fish to total fish yield (%)
Ea Kao 210 Stocked regularly from 1986 734 78Ea Kar 141 Stocked regularly from 1978 454 98Yang Re 56 Stocked 1985–87, 1992–1997 566 87Ho 31 5 Stocked regularly from 1984 1307 99Ea Soup 240 Unstocked 217 2Lak* 658 Unstocked 126 3
05RF_Phuc_Sollows Page 38 Friday, May 4, 2001 11:15 AM
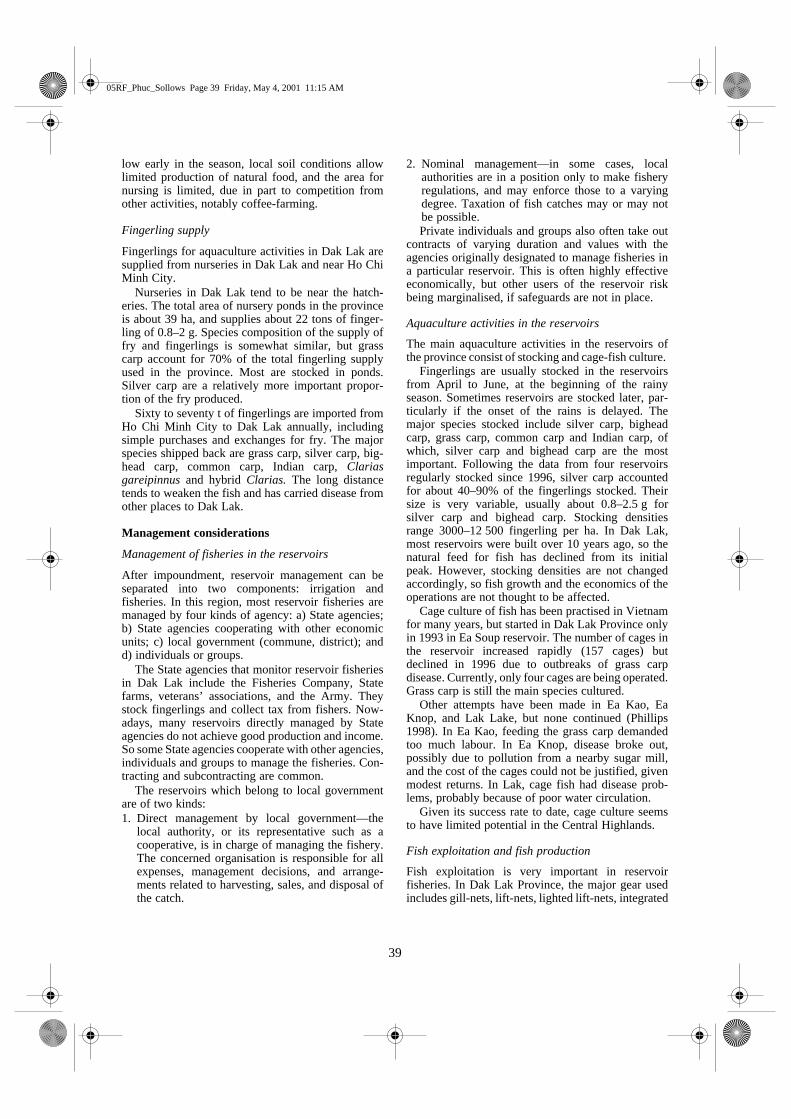
39
low early in the season, local soil conditions allowlimited production of natural food, and the area fornursing is limited, due in part to competition fromother activities, notably coffee-farming.
Fingerling supply
Fingerlings for aquaculture activities in Dak Lak aresupplied from nurseries in Dak Lak and near Ho ChiMinh City.
Nurseries in Dak Lak tend to be near the hatch-eries. The total area of nursery ponds in the provinceis about 39 ha, and supplies about 22 tons of finger-ling of 0.8–2 g. Species composition of the supply offry and fingerlings is somewhat similar, but grasscarp account for 70% of the total fingerling supplyused in the province. Most are stocked in ponds.Silver carp are a relatively more important propor-tion of the fry produced.
Sixty to seventy t of fingerlings are imported fromHo Chi Minh City to Dak Lak annually, includingsimple purchases and exchanges for fry. The majorspecies shipped back are grass carp, silver carp, big-head carp, common carp, Indian carp, Clariasgareipinnus and hybrid Clarias. The long distancetends to weaken the fish and has carried disease fromother places to Dak Lak.
Management considerations
Management of fisheries in the reservoirs
After impoundment, reservoir management can beseparated into two components: irrigation andfisheries. In this region, most reservoir fisheries aremanaged by four kinds of agency: a) State agencies;b) State agencies cooperating with other economicunits; c) local government (commune, district); andd) individuals or groups.
The State agencies that monitor reservoir fisheriesin Dak Lak include the Fisheries Company, Statefarms, veterans’ associations, and the Army. Theystock fingerlings and collect tax from fishers. Now-adays, many reservoirs directly managed by Stateagencies do not achieve good production and income.So some State agencies cooperate with other agencies,individuals and groups to manage the fisheries. Con-tracting and subcontracting are common.
The reservoirs which belong to local governmentare of two kinds: 1. Direct management by local government—the
local authority, or its representative such as acooperative, is in charge of managing the fishery.The concerned organisation is responsible for allexpenses, management decisions, and arrange-ments related to harvesting, sales, and disposal ofthe catch.
2. Nominal management—in some cases, localauthorities are in a position only to make fisheryregulations, and may enforce those to a varyingdegree. Taxation of fish catches may or may notbe possible. Private individuals and groups also often take out
contracts of varying duration and values with theagencies originally designated to manage fisheries ina particular reservoir. This is often highly effectiveeconomically, but other users of the reservoir riskbeing marginalised, if safeguards are not in place.
Aquaculture activities in the reservoirs
The main aquaculture activities in the reservoirs ofthe province consist of stocking and cage-fish culture.
Fingerlings are usually stocked in the reservoirsfrom April to June, at the beginning of the rainyseason. Sometimes reservoirs are stocked later, par-ticularly if the onset of the rains is delayed. Themajor species stocked include silver carp, bigheadcarp, grass carp, common carp and Indian carp, ofwhich, silver carp and bighead carp are the mostimportant. Following the data from four reservoirsregularly stocked since 1996, silver carp accountedfor about 40–90% of the fingerlings stocked. Theirsize is very variable, usually about 0.8–2.5 g forsilver carp and bighead carp. Stocking densitiesrange 3000–12 500 fingerling per ha. In Dak Lak,most reservoirs were built over 10 years ago, so thenatural feed for fish has declined from its initialpeak. However, stocking densities are not changedaccordingly, so fish growth and the economics of theoperations are not thought to be affected.
Cage culture of fish has been practised in Vietnamfor many years, but started in Dak Lak Province onlyin 1993 in Ea Soup reservoir. The number of cages inthe reservoir increased rapidly (157 cages) butdeclined in 1996 due to outbreaks of grass carpdisease. Currently, only four cages are being operated.Grass carp is still the main species cultured.
Other attempts have been made in Ea Kao, EaKnop, and Lak Lake, but none continued (Phillips1998). In Ea Kao, feeding the grass carp demandedtoo much labour. In Ea Knop, disease broke out,possibly due to pollution from a nearby sugar mill,and the cost of the cages could not be justified, givenmodest returns. In Lak, cage fish had disease prob-lems, probably because of poor water circulation.
Given its success rate to date, cage culture seemsto have limited potential in the Central Highlands.
Fish exploitation and fish production
Fish exploitation is very important in reservoirfisheries. In Dak Lak Province, the major gear usedincludes gill-nets, lift-nets, lighted lift-nets, integrated
05RF_Phuc_Sollows Page 39 Friday, May 4, 2001 11:15 AM
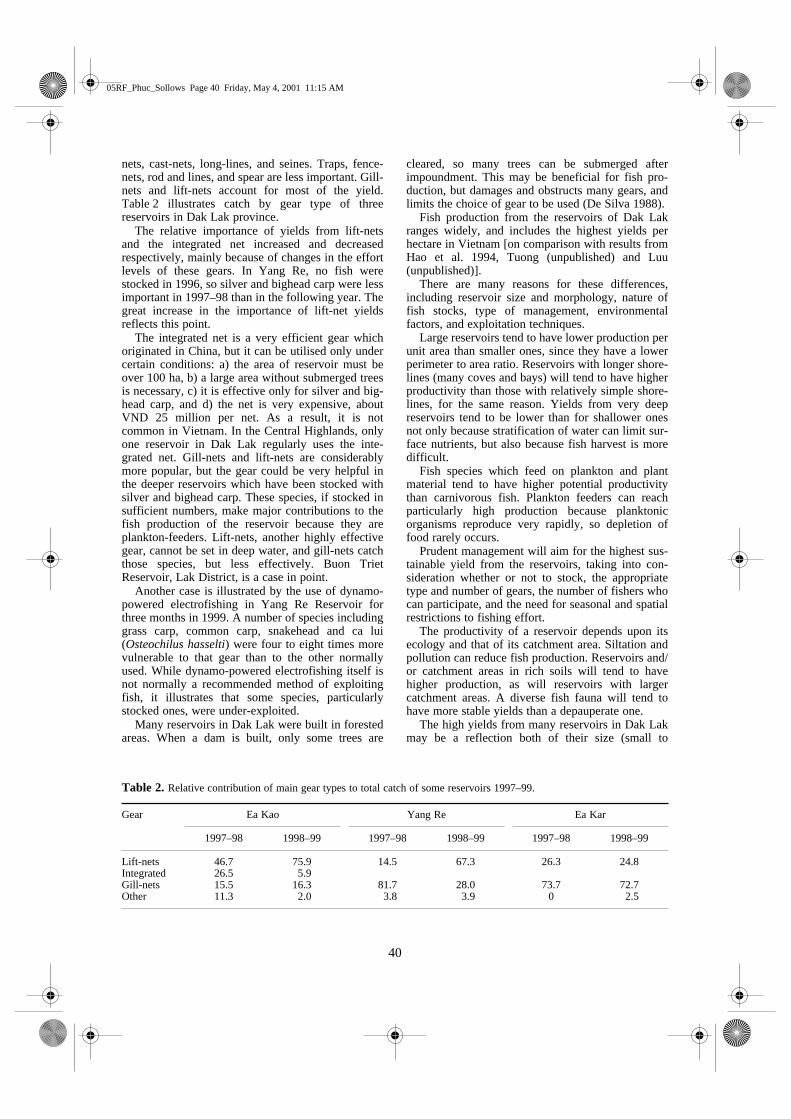
40
nets, cast-nets, long-lines, and seines. Traps, fence-nets, rod and lines, and spear are less important. Gill-nets and lift-nets account for most of the yield.Table 2 illustrates catch by gear type of threereservoirs in Dak Lak province.
The relative importance of yields from lift-netsand the integrated net increased and decreasedrespectively, mainly because of changes in the effortlevels of these gears. In Yang Re, no fish werestocked in 1996, so silver and bighead carp were lessimportant in 1997–98 than in the following year. Thegreat increase in the importance of lift-net yieldsreflects this point.
The integrated net is a very efficient gear whichoriginated in China, but it can be utilised only undercertain conditions: a) the area of reservoir must beover 100 ha, b) a large area without submerged treesis necessary, c) it is effective only for silver and big-head carp, and d) the net is very expensive, aboutVND 25 million per net. As a result, it is notcommon in Vietnam. In the Central Highlands, onlyone reservoir in Dak Lak regularly uses the inte-grated net. Gill-nets and lift-nets are considerablymore popular, but the gear could be very helpful inthe deeper reservoirs which have been stocked withsilver and bighead carp. These species, if stocked insufficient numbers, make major contributions to thefish production of the reservoir because they areplankton-feeders. Lift-nets, another highly effectivegear, cannot be set in deep water, and gill-nets catchthose species, but less effectively. Buon TrietReservoir, Lak District, is a case in point.
Another case is illustrated by the use of dynamo-powered electrofishing in Yang Re Reservoir forthree months in 1999. A number of species includinggrass carp, common carp, snakehead and ca lui(Osteochilus hasselti) were four to eight times morevulnerable to that gear than to the other normallyused. While dynamo-powered electrofishing itself isnot normally a recommended method of exploitingfish, it illustrates that some species, particularlystocked ones, were under-exploited.
Many reservoirs in Dak Lak were built in forestedareas. When a dam is built, only some trees are
cleared, so many trees can be submerged afterimpoundment. This may be beneficial for fish pro-duction, but damages and obstructs many gears, andlimits the choice of gear to be used (De Silva 1988).
Fish production from the reservoirs of Dak Lakranges widely, and includes the highest yields perhectare in Vietnam [on comparison with results fromHao et al. 1994, Tuong (unpublished) and Luu(unpublished)].
There are many reasons for these differences,including reservoir size and morphology, nature offish stocks, type of management, environmentalfactors, and exploitation techniques.
Large reservoirs tend to have lower production perunit area than smaller ones, since they have a lowerperimeter to area ratio. Reservoirs with longer shore-lines (many coves and bays) will tend to have higherproductivity than those with relatively simple shore-lines, for the same reason. Yields from very deepreservoirs tend to be lower than for shallower onesnot only because stratification of water can limit sur-face nutrients, but also because fish harvest is moredifficult.
Fish species which feed on plankton and plantmaterial tend to have higher potential productivitythan carnivorous fish. Plankton feeders can reachparticularly high production because planktonicorganisms reproduce very rapidly, so depletion offood rarely occurs.
Prudent management will aim for the highest sus-tainable yield from the reservoirs, taking into con-sideration whether or not to stock, the appropriatetype and number of gears, the number of fishers whocan participate, and the need for seasonal and spatialrestrictions to fishing effort.
The productivity of a reservoir depends upon itsecology and that of its catchment area. Siltation andpollution can reduce fish production. Reservoirs and/or catchment areas in rich soils will tend to havehigher production, as will reservoirs with largercatchment areas. A diverse fish fauna will tend tohave more stable yields than a depauperate one.
The high yields from many reservoirs in Dak Lakmay be a reflection both of their size (small to
Table 2. Relative contribution of main gear types to total catch of some reservoirs 1997–99.
Gear Ea Kao Yang Re Ea Kar
1997–98 1998–99 1997–98 1998–99 1997–98 1998–99
Lift-nets 46.7 75.9 14.5 67.3 26.3 24.8Integrated 26.5 5.9Gill-nets 15.5 16.3 81.7 28.0 73.7 72.7Other 11.3 2.0 3.8 3.9 0 2.5
05RF_Phuc_Sollows Page 40 Friday, May 4, 2001 11:15 AM
41
medium), and the rich soil of most. Stocking,predominantly with plankton-feeders, allows thispotential to be exploited, in many cases, and the lownumber of predators leads to relatively high recap-ture rates, particularly for silver carp.
Marketing
The Central Highlands is the third-poorest region ofVietnam’s seven regions so many people have inade-quate protein nutrition. In Dak Lak, about 4000 t offish a year are produced, which supplies only 3.3 kg/person. Given an average national fish consumptionof 15 kg/year, it is not enough, so the provincedepends on a large quantity of marine fish. So, themarket for fish produced in Dak Lak is very large,including all the districts in the province and neigh-bouring landlocked areas.
Yield potential
Based on the surveys of the project, 15 completeyears of harvest data are now available for the sixwater bodies. On the basis of recorded reservoirareas and fish yields, the following regression equa-tion best fits the data:
P = –176.84 ln(A) + 1334.6 (1)where P = Annual fish yield per ha, and
A = Reservoir area in ha.On the basis of data given earlier, the following
table can be constructed.
This implies that about 5000 t of fish could beproduced from reservoirs in Dak Lak. Of this, about40% would come from reservoirs in the 10–50 hasize range, and slightly over 30% of the total fromreservoirs under 10 ha. A further 20% of the pro-duction could come from reservoirs between 50 and200 ha, and the largest reservoirs of 200–500 ha.would contribute only about 7%.
The 4000 t estimate of fresh water fish productionfor Dak Lak given earlier may well be an under-estimate. A 1997 estimate by Dak Lak AquaticProducts Company suggests that about 70% of that
comes from ponds. On this basis, there is consider-able room for increasing fish yields from reservoirsin the province.
Ultimately, yield potential is reservoir-specific,and the projection is valid only if the sample of sixreservoirs studied by the project is representative ofthe potential of all reservoirs in the province.
Other issues
For stocking to be successful, a strong, effectivemanagement system is needed. The individual orgroup that is responsible for stocking must recoverthe investment, if stocking is to continue. In mostcases, therefore, management of stocked reservoirs ishighly centralised and distribution of benefits fromthe fisheries is often highly skewed.
Good management systems are also advisable forunstocked reservoirs, if stocks are to withstand thepressures of a growing population.
Access to the fishery by those dependent on thereservoir is also necessary in order to sustain theirlivelihoods. Economic and nutritional needs of thereservoir-dependent community need to be balancedagainst the need to maximise production andeconomic output. A decentralised managementsetup, broadly representative of the communitydependent on the fishery and given a clear mandateand a well-defined term of sufficient length, couldalso succeed, and needs to be tested.
Recommendations and Conclusions
Research needs
In reservoir fisheries, environment is crucial to fishproduction. Limnological parameters can limit fishyields, and pollution and toxic chemicals can lead tofish kills or make fish unsafe for human consump-tion. Through related studies, managers can assessthe natural food situation, as well as hazards, andmake decisions regarding fisheries. In Dak Lak, fewstudies of these aspects have been conducted, exceptsome occasional studies from Fisheries University.
As De Silva and Amarsinghe (1996) point out,empirical models for predicting fish yields in reser-voirs could be considered as the first step toward theadoption of a more scientific approach to manage-ment. In Vietnam, models for predicting fish yieldhave never been applied. Therefore, available modelsshould be applied, or appropriate models for pre-dicting fish yield developed.
In Vietnam, surveys of reservoir areas are very dif-ficult, because irrigation departments are interestedmainly in the volume of reservoirs; area is rarelymeasured and data are inconsistent. It will be veryconvenient if geographical information systems
Table 3. Estimated yield from Dak Lak reservoirs on thebasis of reservoir area.
Reservoir size (ha)
Frequency Total estimated area (ha)
Mean area (ha)
Total annual
production potential (t)
<10 211 1656 7.85 160710.1–50 143 2484 17.4 206050.1–200 19 1932 102 998200.1–500 4 897 224 339Total 377 6969 18.5 5004
05RF_Phuc_Sollows Page 41 Friday, May 4, 2001 11:15 AM
42
(GIS) can be utilised to estimate areas of reservoirsand lakes.
The reservoir fisheries in Dak Lak depend on avery limited number of species, most of which areregularly stocked or naturally recruited cyprinids.The biology of some exotic species is well known,but there is little information regarding nativespecies. Further studies are needed on mean size andage at first maturity, fecundity, growth rate, spawningseason, and spawning area for specific reservoirs.Such studies should also include gear selectivity witheach important species. This knowledge will helpmanagers make appropriate fishery regulations.
As indicated earlier, stocking is popular in DakLak reservoirs, but in most cases could be mademore effective. Its effectiveness is influenced bymany factors, including stocking size, stockingdensity, quality of fingerlings, nature of existing fishstocks and limnological characteristics. Data aresometimes not available to assess stocking effective-ness because the managers do not always record. Infuture, longer-term accurate data series are neededfrom reservoir fisheries to predict appropriatestocking densities and sizes.
The management system of reservoirs, includingfisheries and irrigation, is very complicated. Cur-rently in Dak Lak, some reservoirs not only achievevery high fish yield but also get good income fromfisheries. But these systems do not share responsi-bilities for managing the reservoir with, and dis-tribute benefits equitably to, the fishing communities.Addressing this issue will be a major task of theproject ‘Management of Reservoir Fisheries.’
Expertise in reservoir fisheries is being developed;however, in the long term, Vietnam has very limitedresources to sustain such research. Should anotherfisheries project unrelated to reservoirs appear on thehorizon, staff trained in reservoir fisheries may wellbe assigned to it, should they be the most suitable.This further puts the sustainability of research pro-grams into question.
Conclusion
Irrigation is the main use of reservoirs in Dak Lak.After impoundment, most reservoirs are stocked, but
only some achieve high production and goodincome.
The potential of reservoir fisheries is high, con-sidering potential area, seed and fingerling supply,and market. Some limitations affecting the fisheriesinclude limited appropriate gear, high stockingdensities, low stocking sizes, variable fingerlingquality, and management system issues, mainlyrelated to distribution of benefits from the fishery.Stocking can increase fish yield and economic outputin many reservoirs.
The need for increased output should be balancedagainst the needs of the local community.
Most reservoirs were built more than 10 yearsago, so the natural feed for fish has declined from itsinitial peak. Stocking densities should be consideredin this light.
ReferencesDe Silva, S.S. 1988. Reservoir bed preparation in relation
to fisheries development. In: De Silva, S.S. ed. ReservoirFishery Management and Development in Asia, 121–130IDRC, Ottawa, Canada.
De Silva, S.S. and Amarsinghe, U.S. 1996. ReservoirFisheries in Asia. In: De Silva, S.S. ed. Perspectives inAsian Fisheries, a Volume to Commemorate the 10thAnniversary of the Asian Fisheries Society. AsianFisheries Society, Manila, 497 p.
Nguyen Van Hao, Nguyen Huu Nghi, Pham Xuan Am. 1994.Ket qua dieu tra hien trang nghe ca ho chua vung khuV-Tay Nguyen. In: The Second Workshop on Reservoirfisheries in Vietnam. Ha Bac Province: Ministry ofFisheries, 15–24.
Nguyen Huu Tuong. Unpublished. Nghe ca ho chua va bienphap bao ve nguon loi thuy san. Lecture notes fortraining course in fish culture and reservoir fisheries.MRFP, Vietnam.
Phan, P.D.and De Silva, S.S. 2000. The fishery of the EalKao reservoir, Southern Vietnam: a fishery based on acombination of stock and recapture, and self-recruitingpopulations. Fisheries Management and Ecology, 7:251–264.
Phillips, M. 1998. Freshwater Cage Culture Developmentin the Reservoirs of the Central Highlands of Vietnam.NACA. Bangkok, 120 p.
Tran Truong Luu. Unpublished. Nguon loi thuy san trongcac ho chua nuoc Vietnam. Lecture notes for trainingcourse in Factors Affecting Fish Production in Reser-voirs. MRFP, Vietnam.
05RF_Phuc_Sollows Page 42 Friday, May 4, 2001 11:15 AM

43
Inventory of Reservoir Fishery Resources in Thailand
Cherdsak Virapat1 and Niklas S. Mattson2
Abstract
Inland capture fisheries show an increasing trend from 1988 to 1995 with a 1995 value of 4601million baht (about 127 million US dollars). About 872 000 labour households earned their livingfrom both agriculture and inland fisheries. Among these, 47 000 households earned their living oninland fisheries only. More than 80% of the total households that rely on agriculture and/or inlandfisheries are living in the Mekong River Basin. A database of physico-chemical parameters,fisheries statistics and fisheries management was assembled for 463 reservoirs with a total area of5118 km2 in 22 provinces in the Mekong River Basin of Thailand, based mainly on publishedreports. The primary use of these reservoirs can be classified as irrigation (302 reservoirs),domestic water supply (157), electricity generation (5) and fisheries (2). There were only 40 reser-voirs where records were kept of fish catches. In 1996, the Thai Department of Fisheries (DOF)collected statistics of 27 799 inland waters in Thailand with surface areas ranging from 0.01 ha to41 000 ha. The waters were categorised as reservoirs, public waters (communal reservoirs) andvillage fish ponds with the total numbers of 3241, 18 109 and 6449, respectively. The estimatedtotal annual fish production of these inland waters was about 78 711 t. There were 1872 reservoirslocated in the Mekong River Basin with a total surface area of 2120 km2 and an estimated total fishcatch of 25 428 t. Estimation of fish catch was not carried out for individual reservoirs, and it wasnot possible to analyse these two sources of data to check reliability of information, etc. It issuggested that DOF should plan to collect and record reservoir fisheries data on an individualwater body basis.
INLAND capture fisheries in Thailand usually operatein major rivers and their floodplains, canals,swamps, wetlands, paddy fields, lakes and reser-voirs. They are mainly subsistence, with smallnumbers of commercial fishers. Figure 1 shows theincrease of the total inland capture fisheries fromreservoirs, swamps, rivers and river flood plains asrecorded by the Fisheries Statistics and InformationTechnology Sub-Division production from 1980 to1995. It can be noted that production was maintainedat about 100 000 t from 1980 to 1988. It thenincreased from 1989 to reach 200 000 Mt in 1994and 1995.
Inland capture fisheries are based mainly onindigenous species (80–90%). Introduced speciesinclude tilapia and Indian carps (rohu and mrigal),and account for 10–20% of the catches. Fishingfleets include an equal share of motorised boats andunmotorised boats (3–5 m). Main gear types are fewand unspecialised. The most common fishing gearsare gill-nets, cast-nets, lift-nets, bamboo traps andhooks and lines.
There are about 18 000 commercial fishers whofish in 20 multi-purpose reservoirs. There were about872 000 labour households of which 47 000 earnedtheir living on inland fishing only, and 825 000households that earned their living from both agri-culture and inland fisheries. More than 80% of thesehouseholds, i.e. almost 700 000, live in the MekongRiver Basin (National Statistical Office 1995). Mostcatches are for local household consumption.
Due to the large number of reservoirs in Thailandit is necessary to establish an inventory of reservoirfishery resources in an integrated database system.
1Chief, Small-holder Aquaculture and Fishery ManagementResearch and Development, Fishery Engineering Division,Department of Fisheries, Phaholyothin Road, Chatuchak,Bangkok 10900, Thailand. E-mail: [email protected] of Reservoir Fisheries in the Mekong Basin,Mekong River Commission, PO Box 7035, Vientiane, LaoPDR. E-mail: [email protected]

44
This paper analyses two major sources of data onreservoir fishery resources in the Mekong RiverBasin. Finally, some suggestions are given toimprove the Thai Department of Fisheries databasesystem of reservoir fishery resources.
Materials and Methods
Reservoir database
The data used in this study are from two sources:
(i) Virapat et al. (1999)
Data were compiled from reports of existing andplanned dam and reservoir projects in Thailand inthe Mekong Basin, available at the various govern-ment and provincial departments in Thailand, withthe MRC Documentation Centre, and other sources.Data were entered in MS Excel. These includegeographic coordinates of the reservoirs, status ofproject, dam specifications and functions, fisheries,socioeconomic status of the fisheries, former orpresent management activities (effort management,stocking, cage or pen culture, etc.), uses of the reser-voir other than for fisheries, management authorities
responsible for the reservoir and reservoir fisheriesmanagement, reservoir morphology and physical andchemical status, and fisheries management issues.The data presented from this study include reservoirslarger than 100 ha. A list of fields for the reservoirdatabase is given in Table 1.
(ii) Statistics on Thai (not only Mekong Basin) reservoirs, public waters and village fish ponds by Fisheries Economic Division (1996).
Results
(i) Virapat et al. (1999)
Most larger Thai Mekong Basin reservoirs are usedfor irrigation (299) and domestic water supply (156).There are very few reservoirs used primarily for fish-eries (2) and hydro-electric generation (6). Most arestate-owned (375), communally owned (82) andparastatals (6). There are no privately owned reser-voirs. There were only 40 reservoirs where recordswere kept of fish catches. The total fish catch of thesereservoirs was estimated at 26 794 mt. A total of 67fish species was registered in 463 reservoirs. Data onphysico-chemical parameters were very limited.
Figure 1. Annual production in quantity and value of inland capture fisheries from reservoirs, swamps, rivers and riverfloodplains of Thailand, 1980–95 (Fisheries Statistics and Information Technology Sub-Division).
300
250
200
150
100
50
0
Land
ings
(10
00 m
t)
1980
1981
1982
1983
1984
1985
1986
1987
1988
1989
1990
1991
1992
1993
1994
1995
6000
5000
4000
3000
2000
1000
0
Val
ue (
mill
ion
Bah
t)
Landings
Value

45
Table 1. List of fields for reservoir database.
No. Name Description
1 ID ID number2 Name Name of reservoir3 Country Name of country4 Province Name of province5 District Name of one or more districts associated with the water body6 Coord North Geographic coordinates North. Format: dd°mm′ss″ (example: 15°04′30″ N)7 Coord East Geographic coordinates East. Format: dd°mm′ss″ E (example: 102°10′45″ E)8 Map Scale, number and/or code of the map used9 Village Name of the nearest village(s) marked on the map, particularly smaller reservoirs
10 Town Name, direction and distance to the closest major town (e.g. provincial capital)11 Basin Name of river basin (e.g. Mekong)12 Primary use The main use of the reservoir, coded as follows:
1 = Domestic water supply2 = Irrigation3 = Livestock watering4 = Municipal water supply5 = Industry6 = Fishing7 = Hydro-electricity generation8 = Other main use
13 Domestic water supply Water body used as domestic water supply (including main use, if relevant) (yes/no)14 Irrigation Water body used for irrigation (including main use, if relevant) (yes/no)15 Livestock watering Water body used for livestock watering (including main use, if relevant) (yes/no)16 Municipal water supply Water body used as municipal water supply (including main use, if relevant) (yes/no)17 Industry Water body used for industrial purposes (including main use, if relevant) (yes/no)18 Fishing Water body used for fishing (including main use, if relevant) (yes/no)19 Hydro-electric Water body used for hydropower generation (including main use, if relevant) (yes/no)20 Owner Name of (dominant) owner21 Owner type Type of owner (if more than one, the dominant owner), coded as follows:
1 = State2 = Private3 = Communal4 = Parastatal5 = Other
22 Capacity Hydroelectric capacity, if applicable (MW)23 Turbine Turbine type, e.g. Kaplan (relevant for fish mortality when passing turbine during
sown-stream migration, and also the level of the intake from the reservoir, which affects downstream water quality, e.g. oxygen concentration)
24 Irrigation Area Area irrigated by reservoir, if applicable (ha)25 Year The year when the reservoir dam was closed, or when a prospective dam or a dam under
construction is planned to be closed26 Height Dam wall height (m)27 Length Dam wall length (m)28 Crest The elevation of the dam crest above sea level (m, asl)29 Out River Name of the effluent river below the dam30 Discharge The average volume of water that flows out of the dam per year (106 m3)31 NUSL Normal Upper Storage Level. The elevation above sea level of the water surface when the
reservoir is full (m, asl)32 Area The area of the reservoir at NUSL (km2)33 Vol The volume of the reservoir at NUSL (m3)34 D-down The mean maximum draw-down of the reservoir (m), i.e. mean of (NUSL-minimum
elevation) (m)35 M-Depth The mean depth of the reservoir at NUSL (m)36 Max-Depth The maximum depth of the reservoir at NUSL (m)37 Length The length of the reservoir, measured as the longest straight line (km)38 Width The width of the reservoir, measured as the longest straight line perpendicular to the length
(km)39 Shoreline The length of the shoreline, including shoreline of major islands (km)40 In rivers Name(s) of the affluent rivers (flowing into the reservoir)

46
41 Catchm The area of the catchment (km2)42 Catchm rain The average annual rainfall of the catchment (mm)43 Affl inflow The volume of water that flows into the reservoir annually (106 m3)44 Temp-max The mean maximum water temperature at the surface (°C)45 Temp-min The mean minimum water temperature at the surface (°C)46 Transp The mean Secchi disk transparency (m)47 Cond The mean conductivity of the water (µS/cm3)48 TDS Total dissolved solids (mg/L)49 MEI C The Morphoedaphic Index = conductivity/mean depth50 MEI T The Morphoedaphic Index = TDS/mean depth51 Alk Alkalinity (mg/L)52 Hard Hardness (mg CaCO3 equiv./L)53 pH The pH54 Na Sodium (mg/L)55 K Potassium (mg/L) 56 Ca Calcium (mg/L)57 Mg Magnesium (mg/L) 58 HCO3 Carbonate (mg/L)59 CI Chloride (mg/L) 60 SO4 Sulphate (mg/L)61 P205 Phosphorous (mg/L)62 No3-N Nitrate nitrogen (mg/L)63 Fish taxa Presence of invertebrate taxa of direct interest for capture fisheries (e.g. Macrobrachium)
(yes/no)64 Fish pass The presence of a fish pass, e.g. a fish ladder (yes/no)65 Inv taxa The mean annual catch over several years, after the reservoir stabilised (t)66 Catch The mean annual catch over several years, after the reservoir stabilised (t)67 Stocked Indicate whether the reservoir was ever stocked (yes/no)68 Exotics Indicate if exotic species (non-indigenous), stocked or otherwise introduced, have
established self-maintaining populations in the reservoir (yes/no)69 F-t fishers Number of full-time fishers (fishing 16 days or more per month)70 P-t fishers Number of part-time fishers (fishing 1–15 days per month)71 Traps Number of traps (if present but number not known, set to 1)72 Seines Number of seine nets (if present but number not known, set to 1)73 Gillnets Number of gill-nets (if present but number not known, set to 1)74 Long-Lines Number of long-lines (if present but number not known set to 1)75 Other gear List other gear in use76 Boats w. motor Give total number of motorised boats or canoes77 Boats w/o motor Give total number of non-motorised boats or canoes78 Manage Indicate if local communities are involved in Natural Resource Management (e.g. fisheries,
forestry or watershed management) (yes/no)79 C-Policy Indicate if local communities are involved in policy and/or decision-making (e.g. defining
problems, setting long-term objectives, education, research) (yes/no)80 G-Policy Indicate if local government is involved in policy and/or decision-making (e.g. defining
problems, setting long-term objectives, education, research) (yes/no)81 C-Data Indicate if communities are involved in data-gathering and/or analysis (yes/no)82 G-Data Indicate if government is involved in data-gathering and/or analysis (yes/no)83 C-Access Indicate if communities are involved in regulating access to the fishery (fishing seasons,
fishing areas, gears and vessels) (yes/no)84 G-Access Indicate if government is involved in regulating access to the fishery (fishing seasons,
fishing areas, gears and vessels) (yes/no)85 C-Harvest Indicate if communities are involved in regulating the harvest (through quotas) (yes/no)86 G-Harvest Indicate if government is involved in regulating the harvest (through quotas) (yes/no)87 C-Enforce Indicate if communities are involved in rule enforcement (yes/no)88 G-Enforce Indicate if government is involved in rule enforcement (yes/no)89 C-Habitat Indicate if communities are involved in habitat/resource protection and/or enhancement
(including monitoring, stocking and resource use coordination) (yes/no)90 G-Habitat Indicate if government is involved in habitat/resource protection and/or enhancement
(including monitoring, stocking and resource use coordination) (yes/no)91 C-Benefit-max Indicate if communities are involved in benefit maximisation (supply, quality, product
diversification) (yes/no)
Table 1. List of fields for reservoir database. (Continued)
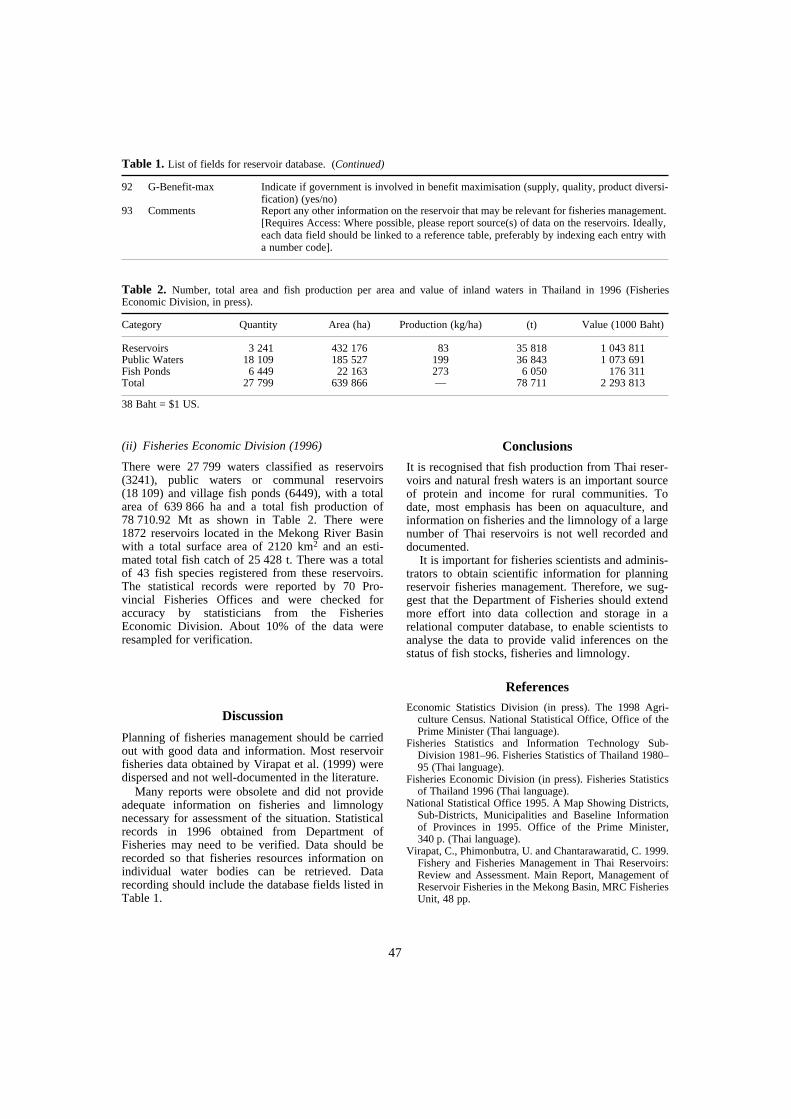
47
38 Baht = $1 US.
(ii) Fisheries Economic Division (1996)
There were 27 799 waters classified as reservoirs(3241), public waters or communal reservoirs(18 109) and village fish ponds (6449), with a totalarea of 639 866 ha and a total fish production of78 710.92 Mt as shown in Table 2. There were1872 reservoirs located in the Mekong River Basinwith a total surface area of 2120 km2 and an esti-mated total fish catch of 25 428 t. There was a totalof 43 fish species registered from these reservoirs.The statistical records were reported by 70 Pro-vincial Fisheries Offices and were checked foraccuracy by statisticians from the FisheriesEconomic Division. About 10% of the data wereresampled for verification.
Discussion
Planning of fisheries management should be carriedout with good data and information. Most reservoirfisheries data obtained by Virapat et al. (1999) weredispersed and not well-documented in the literature.
Many reports were obsolete and did not provideadequate information on fisheries and limnologynecessary for assessment of the situation. Statisticalrecords in 1996 obtained from Department ofFisheries may need to be verified. Data should berecorded so that fisheries resources information onindividual water bodies can be retrieved. Datarecording should include the database fields listed inTable 1.
Conclusions
It is recognised that fish production from Thai reser-voirs and natural fresh waters is an important sourceof protein and income for rural communities. Todate, most emphasis has been on aquaculture, andinformation on fisheries and the limnology of a largenumber of Thai reservoirs is not well recorded anddocumented.
It is important for fisheries scientists and adminis-trators to obtain scientific information for planningreservoir fisheries management. Therefore, we sug-gest that the Department of Fisheries should extendmore effort into data collection and storage in arelational computer database, to enable scientists toanalyse the data to provide valid inferences on thestatus of fish stocks, fisheries and limnology.
ReferencesEconomic Statistics Division (in press). The 1998 Agri-
culture Census. National Statistical Office, Office of thePrime Minister (Thai language).
Fisheries Statistics and Information Technology Sub-Division 1981–96. Fisheries Statistics of Thailand 1980–95 (Thai language).
Fisheries Economic Division (in press). Fisheries Statisticsof Thailand 1996 (Thai language).
National Statistical Office 1995. A Map Showing Districts,Sub-Districts, Municipalities and Baseline Informationof Provinces in 1995. Office of the Prime Minister,340 p. (Thai language).
Virapat, C., Phimonbutra, U. and Chantarawaratid, C. 1999.Fishery and Fisheries Management in Thai Reservoirs:Review and Assessment. Main Report, Management ofReservoir Fisheries in the Mekong Basin, MRC FisheriesUnit, 48 pp.
92 G-Benefit-max Indicate if government is involved in benefit maximisation (supply, quality, product diversi-fication) (yes/no)
93 Comments Report any other information on the reservoir that may be relevant for fisheries management. [Requires Access: Where possible, please report source(s) of data on the reservoirs. Ideally, each data field should be linked to a reference table, preferably by indexing each entry with a number code].
Table 2. Number, total area and fish production per area and value of inland waters in Thailand in 1996 (FisheriesEconomic Division, in press).
Category Quantity Area (ha) Production (kg/ha) (t) Value (1000 Baht)
Reservoirs 3 241 432 176 83 35 818 1 043 811Public Waters 18 109 185 527 199 36 843 1 073 691Fish Ponds 6 449 22 163 273 6 050 176 311Total 27 799 639 866 — 78 711 2 293 813
Table 1. List of fields for reservoir database. (Continued)
48
Changes in Fisheries Yield and Catch Composition at the Nam Ngum Reservoir, Lao PDR
N.S. Mattson, V. Balavong, H. Nilsson, S. Phounsavath and W.D. Hartmann*
Abstract
THE Nam Ngum hydropower reservoir covers 370 km2 at full supply level. It supports a diversefish fauna of more than 55, mainly indigenous, species. The dominating fishing methods aregill-nets, light fishing (for the small clupeid Clupeichthys aesarnensis), and long-lines. In 1982, theannual catch was estimated at 1470 metric tons (mt), of which 3.2% (47 mt) was by light fishing.By 1998, the total estimated landings increased to 6833 mt. The fisheries yield has thus increasedfrom 40 to 185 kg/ha/yr, which is largely explained by an increase in fishing effort. The contributionfrom light fishing has increased to 28% (1937 mt). The dramatic increase in C. aesarnensis catchis assumed to be linked to a high fishing pressure on the large predatory species such as Hampalamacrolepidota, and ensuing reduction in predation pressure on C. aesarnensis. Managementoptions are discussed.
THE Nam Ngum 1 hydropower reservoir is 90 kmnorth of Vientiane, Lao PDR. The dam was con-structed in two phases, with the first was completedin 1971. In 1977, following additional constructionthat raised the dam to its present level (212 m asl),the dam was closed for the second time. At normalupper storage level (NUSL), it covers an area ofapproximately 370 km2 and has a catchment of8460 km2.
The reservoir adjoins Vientiane Province andSaysomboun special zone, and involves five districts.The reservoir is relatively dendritic and deep, with amean depth of 19 m at NUSL, and a maximum depthof about 60 m. The reservoir basin was not cleared ofvegetation prior to the closing of the dam, and sub-merged trees are assumed to contribute significantlyto the primary production of the reservoir byincreasing the surface area available for epiphyticperiphyton. Thermal stratification is present during alarge part of the year, when anoxic conditions prevailin the hypolimnion, below about 10 m depth.
Effectively, Nam Ngum has a large pelagic zone;the area of the reservoir where depth exceeds 10 m isabout 275 km2 at NUSL. The annual drawdown of thereservoir is up to 16 m. Two water diversion schemes,which increase the amount of water available forhydropower, have been constructed. One of these ispart of another hydropower installation on the NamLeuk River, East of Nam Ngum. There are 30 villagesaround the reservoir, with a total population of about16 600. A significant fishery exists, which suppliesVientiane and other markets with fresh and processedfish. The dominating fishing methods in terms oflandings are gill-nets and light fishing. The lattercatches almost exclusively Pa Keo (Clupeichthysaesarnensis) (note that this species was previouslymisidentified as C. goniognathus, pers. comm., M.Kottelat). Gill-net catches are more varied, but aredominated by Pa Sagang (Puntioplites falcifer). Thereservoir supports a diverse, mainly indigenous, fishfauna. A total of 55 indigenous fish species is knownto appear more or less regularly among the catch offishers. In addition, exotics have been stocked,including Nile tilapia (Oreochromis niloticus), grasscarp (Ctenopharyngodon idella), rohu carp (Labeorohita), and common carp (Cyprinus carpio). Of theintroduced species, only O. niloticus is caughtregularly, although in relatively small quantities.
*Management of Reservoir Fisheries in the Mekong Basin,Mekong River Commission, PO Box 7035, Vientiane, LaoPDR. Email: [email protected]
49
The area where the Nam Ngum River enters thereservoir, Keng Noi, has been identified as crucialfor the recruitment of the mainly riverine fish fauna.At the onset of the wet season, adults of many fishspecies congregate below Keng Noi, and as the riverflow increases with the rains, spawning takes placein Keng Noi and upstream areas. Keng Noi is also animportant nursery area for fish fry.
In recent years, fishers have been complaining ofdeclining catches, and one output of the present studyis a quantitative and qualitative assessment of thecatches. Previous studies of the Nam Ngum Reservoirhave been reported by the Mekong Secretariat (1984),and Schouten (1998a) reviewed more recent studies.This paper is based on a report in preparation byManagement of Reservoir Fisheries in the MekongBasin, an MRC Fisheries Program Component.
Materials and Methods
Catch per unit effort surveys
Gill-nets
Ten gill-net fishers were randomly selected in each ofthe three villages Ban Xai Udom, Ban Phonsavat andBan Pha Koup. The three villages were selected torepresent different areas of the reservoir in terms offishery catch. Xai Udom is located near the estuary,where the Nam Ngum River enters the reservoir, andis considered the most productive area. Phonsavat hasintermediate catches, and Pha Koup, far from theNam Ngum inlet, is the least productive area. Thefishers of each village were first divided into part-and full-time fishers. The proportion of each wasdetermined and used to set the number to be selectedfrom each category. The selected gill-net fishers wereasked to meet the project staff in the morning onceweekly at the landing site of the village. The catcheswere enumerated on pre-designed forms, recordingnumbers and total weight by species, mesh size andeffort. The data were subsequently entered intoPASGEAR (Kolding 1999), a customised fisheriesdatabase, for further analysis. The catch per uniteffort (CPUE) data presented in this paper werecollected between January and December 1998.
The mesh sizes used by the fishers in the surveywere between 30 and 120 mm stretched mesh, and thetwine was mono-filament nylon. Note that the CPUEwas calculated per net, and not by net-area. All netssold at the reservoir are 90 m long when mounted ata hanging ratio of 50. The nets are either 30 or 50meshes deep, and the net area varies between 58 m2
for a 25 mm net to 374 m2 for a 160 mm net. The mostcommon mesh size, 80 mm, is thus either 187 or312 m2, depending on the number of meshes deep.
Gill-nets are deployed in two different ways. Themost common use is the traditional setting at duskand lifting at dawn. However, an alternative approachis what is called beat-netting, where the nets are setin a circular fashion during daytime, and the fish arechased into the net by beating the water inside thearea encircled by the net. Beat-netting was notincluded in the sampling of gill-net CPUEs, butinformation on the CPUE was obtained via aquestionnaire at the same time as the frame survey(see below).
The CPUE by mesh size was estimated usingPASGEAR. For most mesh sizes, the sample wasamenable to estimation of mean and confidenceintervals using a standard parametric approach. Formesh sizes with few samples and non-normal, asym-metric distributions, the mean CPUE and confidenceintervals were estimated using the Bootstrap methodon the Pennington estimator (Kolding 1999) (Table1). The Index of Relative Importance (IRI) (Kolding1989) was also calculated:
%IRI=100*[(%Wi+%Ni)%Fi]/[∑((%Wj+%Nj)%Fj)]
where %W and %N are the percentage weight andnumber of each species i in the total catch, %F is thepercentage of occurrence of each species in the totalnumber of settings (samples), and the denominator isthe total of all species j (Figure 2). For mesh sizeswhere the CPUE was unknown (not among samples),it was interpolated from adjacent meshes. Generally,the effort for these meshes was small, and hence thisapproximation does not seriously affect the catchestimates.
Pa Keo Lamps
Pa Keo are caught at night using paraffin-poweredpressure lamps to attract the fish that are sub-sequently caught using hand lift-nets. Fishing takesplace during the dark period, before and after thenew (dark) moon. In any given month, fishing maybe carried out for about two weeks, and sometimeslonger when it is overcast. The catch consists of 99%Pa Keo; the remaining 1% consists mainly ofPseudambassis notatus (Pa Capcawn).
CPUE data for Pa Keo light fishing were collectedin one village, Ban Sook Pa Keo. During the firstperiod (January 1998), samples were collected everynight, but later the sampling interval was increasedso that seven samples (each composed of the catchesof five fishers) were collected each fishing perioduntil December 1998. Sampling started on the lastquarter of the moon and stopped on the first quarterof the moon.
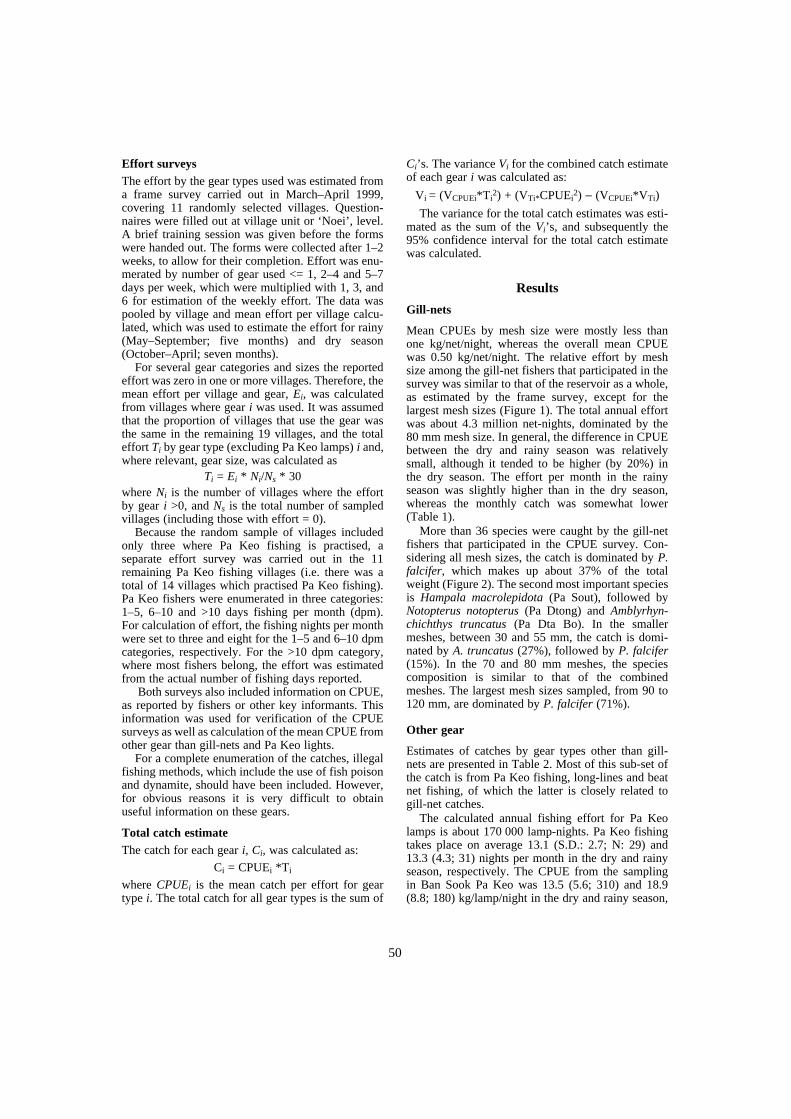
50
Effort surveysThe effort by the gear types used was estimated froma frame survey carried out in March–April 1999,covering 11 randomly selected villages. Question-naires were filled out at village unit or ‘Noei’, level.A brief training session was given before the formswere handed out. The forms were collected after 1–2weeks, to allow for their completion. Effort was enu-merated by number of gear used <= 1, 2–4 and 5–7days per week, which were multiplied with 1, 3, and6 for estimation of the weekly effort. The data waspooled by village and mean effort per village calcu-lated, which was used to estimate the effort for rainy(May–September; five months) and dry season(October–April; seven months).
For several gear categories and sizes the reportedeffort was zero in one or more villages. Therefore, themean effort per village and gear, Ei, was calculatedfrom villages where gear i was used. It was assumedthat the proportion of villages that use the gear wasthe same in the remaining 19 villages, and the totaleffort Ti by gear type (excluding Pa Keo lamps) i and,where relevant, gear size, was calculated as
Ti = Ei * Ni/Ns * 30where Ni is the number of villages where the effortby gear i >0, and Ns is the total number of sampledvillages (including those with effort = 0).
Because the random sample of villages includedonly three where Pa Keo fishing is practised, aseparate effort survey was carried out in the 11remaining Pa Keo fishing villages (i.e. there was atotal of 14 villages which practised Pa Keo fishing).Pa Keo fishers were enumerated in three categories:1–5, 6–10 and >10 days fishing per month (dpm).For calculation of effort, the fishing nights per monthwere set to three and eight for the 1–5 and 6–10 dpmcategories, respectively. For the >10 dpm category,where most fishers belong, the effort was estimatedfrom the actual number of fishing days reported.
Both surveys also included information on CPUE,as reported by fishers or other key informants. Thisinformation was used for verification of the CPUEsurveys as well as calculation of the mean CPUE fromother gear than gill-nets and Pa Keo lights.
For a complete enumeration of the catches, illegalfishing methods, which include the use of fish poisonand dynamite, should have been included. However,for obvious reasons it is very difficult to obtainuseful information on these gears.
Total catch estimateThe catch for each gear i, Ci, was calculated as:
Ci = CPUEi *Ti
where CPUEi is the mean catch per effort for geartype i. The total catch for all gear types is the sum of
Ci’s. The variance Vi for the combined catch estimateof each gear i was calculated as:
Vi = (VCPUEi*Ti
2) + (VTi*CPUEi2) − (VCPUEi*VTi)
The variance for the total catch estimates was esti-mated as the sum of the Vi’s, and subsequently the95% confidence interval for the total catch estimatewas calculated.
Results
Gill-nets
Mean CPUEs by mesh size were mostly less thanone kg/net/night, whereas the overall mean CPUEwas 0.50 kg/net/night. The relative effort by meshsize among the gill-net fishers that participated in thesurvey was similar to that of the reservoir as a whole,as estimated by the frame survey, except for thelargest mesh sizes (Figure 1). The total annual effortwas about 4.3 million net-nights, dominated by the80 mm mesh size. In general, the difference in CPUEbetween the dry and rainy season was relativelysmall, although it tended to be higher (by 20%) inthe dry season. The effort per month in the rainyseason was slightly higher than in the dry season,whereas the monthly catch was somewhat lower(Table 1).
More than 36 species were caught by the gill-netfishers that participated in the CPUE survey. Con-sidering all mesh sizes, the catch is dominated by P.falcifer, which makes up about 37% of the totalweight (Figure 2). The second most important speciesis Hampala macrolepidota (Pa Sout), followed byNotopterus notopterus (Pa Dtong) and Amblyrhyn-chichthys truncatus (Pa Dta Bo). In the smallermeshes, between 30 and 55 mm, the catch is domi-nated by A. truncatus (27%), followed by P. falcifer(15%). In the 70 and 80 mm meshes, the speciescomposition is similar to that of the combinedmeshes. The largest mesh sizes sampled, from 90 to120 mm, are dominated by P. falcifer (71%).
Other gear
Estimates of catches by gear types other than gill-nets are presented in Table 2. Most of this sub-set ofthe catch is from Pa Keo fishing, long-lines and beatnet fishing, of which the latter is closely related togill-net catches.
The calculated annual fishing effort for Pa Keolamps is about 170 000 lamp-nights. Pa Keo fishingtakes place on average 13.1 (S.D.: 2.7; N: 29) and13.3 (4.3; 31) nights per month in the dry and rainyseason, respectively. The CPUE from the samplingin Ban Sook Pa Keo was 13.5 (5.6; 310) and 18.9(8.8; 180) kg/lamp/night in the dry and rainy season,

51
respectively. However, the results of the question-naire of Pa Keo fishers indicated that the overallCPUE was 9.1 and 14.3 kg lamp/night in the dry andrainy season respectively. The somewhat lower esti-mates from the latter study may reflect a lower abun-dance of Pa Keo in other areas of the reservoir, and itwas decided to use the lower estimate for the calcu-lation of the catch (Table 2). The total estimated Pa
Keo catch, 1918 metric tons (mt), corresponds to ayield of 52 kg/ha for this species alone.
Estimation of landings and yield
The total estimated annual landings are 6833 mt(Table 3), which gives a yield of 185 kg/ha/yr andlandings of 18.7 mt/day.
Table 1. Calculation of total catch (kg) by gill-nets at Nam Ngum Reservoir in 1998. The mesh size is mm stretched mesh.Effort (Ti) is in (net-nights/season) and CPUE is in (kg/net/night). SEM is the standard error of the mean, Ni is the numberof villages (of a total of 11) where effort>0, and N is the number of CPUE samples. See text for further explanations.
Mesh size Effort NI SEM CPUE N SEM Catch
Dry season
15 2 727 1 0.49 1 33620 26 030 2 9 659 0.49 12 75525 55 862 4 6 241 0.49 27 37230 187 006 9 7 654 0.49 6 0.03 91 63335 131 805 8 10 725 0.47 61 94840 239 645 9 27 239 0.46 78 0.02 110 23745 130 731 7 11 550 0.95 25 0.29 124 19450 28 592 3 3 564 0.64 113 0.07 18 29955 12 395 1 0.30 3 71960 19 585 1 0.36 7 05170 465 408 9 32 602 0.38 212 0.01 176 85580 890 985 11 70 559 0.61 319 0.04 543 50190 31 402 4 5 804 1.13 22 0.11 35 484
100 76 852 1 0.76 58 407120 59 168 3 20 080 0.19 11 242140 2 810 3 810 0.19 534160 0180 0200 0
Subtotal1 284 567
Rainy season
15 020 025 23 969 2 1 140 0.31 7 43030 174 527 10 11 562 0.31 27 0.02 54 10335 78 771 8 9 848 0.30 23 63140 141 030 10 10 872 0.30 54 0.01 42 30945 108 421 9 7 269 0.25 23 0.02 27 10550 15 506 3 2 882 0.50 32 0.05 7 75355 8 877 1 0.43 3 81760 22 252 1 0.43 9 56970 374 798 9 27 426 0.36 171 0.01 134 92780 678 993 11 46 983 0.68 259 0.03 461 71590 31 781 3 5 402 0.72 22 882
100 44 386 1 0.69 5 0.29 30 627120 59 063 4 14 838 0.19 11 222140 78 357 4 10 668 0.19 14 888160 47 405 4 3 181 0.19 9 007180 15 091 1 0.19 2 867200 11 422 1 0.19 2 170
Subtotal 866 024
Total 2 150 591
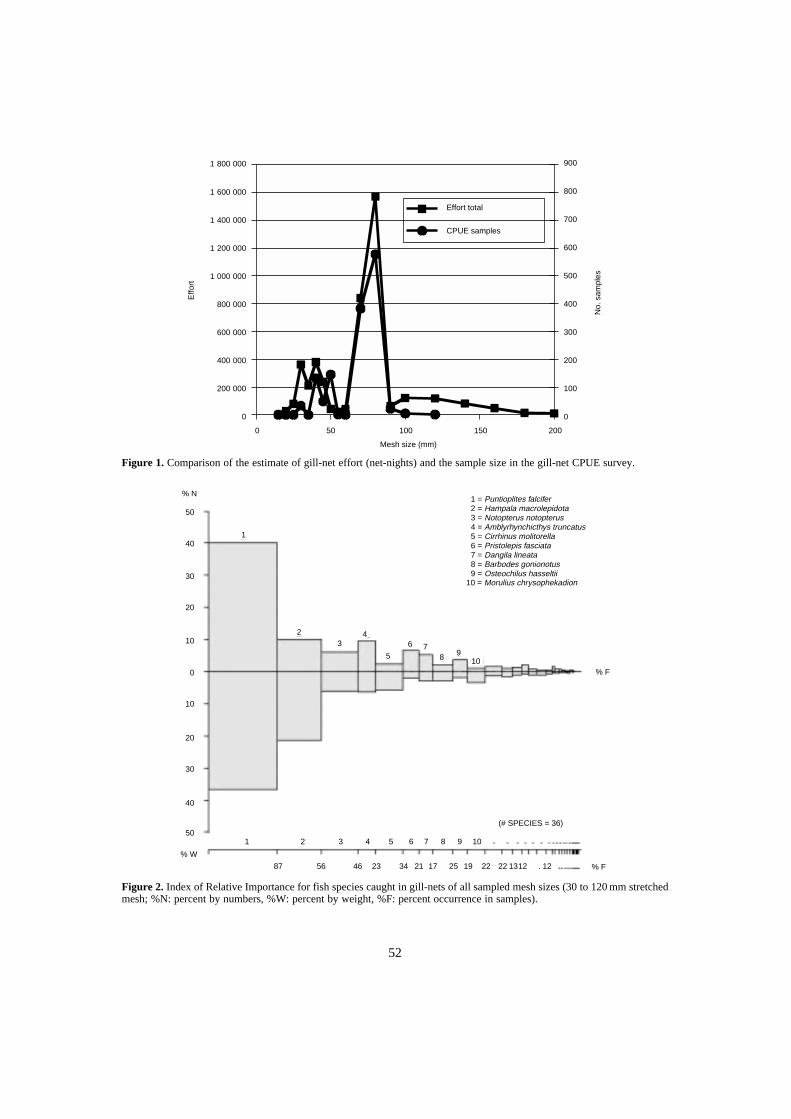
52
Figure 1. Comparison of the estimate of gill-net effort (net-nights) and the sample size in the gill-net CPUE survey.
Figure 2. Index of Relative Importance for fish species caught in gill-nets of all sampled mesh sizes (30 to 120 mm stretchedmesh; %N: percent by numbers, %W: percent by weight, %F: percent occurrence in samples).
0
1 800 000
1 600 000
1 400 000
1 200 000
1 000 000
800 000
600 000
400 000
200 000
0
Effo
rt
900
800
700
600
500
400
300
200
100
0
No.
sam
ples
Effort total
CPUE samples
50 100 150 200
Mesh size (mm)
1 = Puntioplites falcifer2 = Hampala macrolepidota3 = Notopterus notopterus4 = Amblyrhynchicthys truncatus5 = Cirrhinus molitorella6 = Pristolepis fasciata7 = Dangila lineata8 = Barbodes gonionotus9 = Osteochilus hasseltii
10 = Morulius chrysophekadion
% N
40
30
20
10
0
10
20
30
40
50
% W
50
1
23
4
5
6 78 9
10
1 2 3 4 5 6 7 8 9 10
87 56 46 23 34 21 17 25 19 22 22 1312 . 12
% F
(# SPECIES = 36)
% F
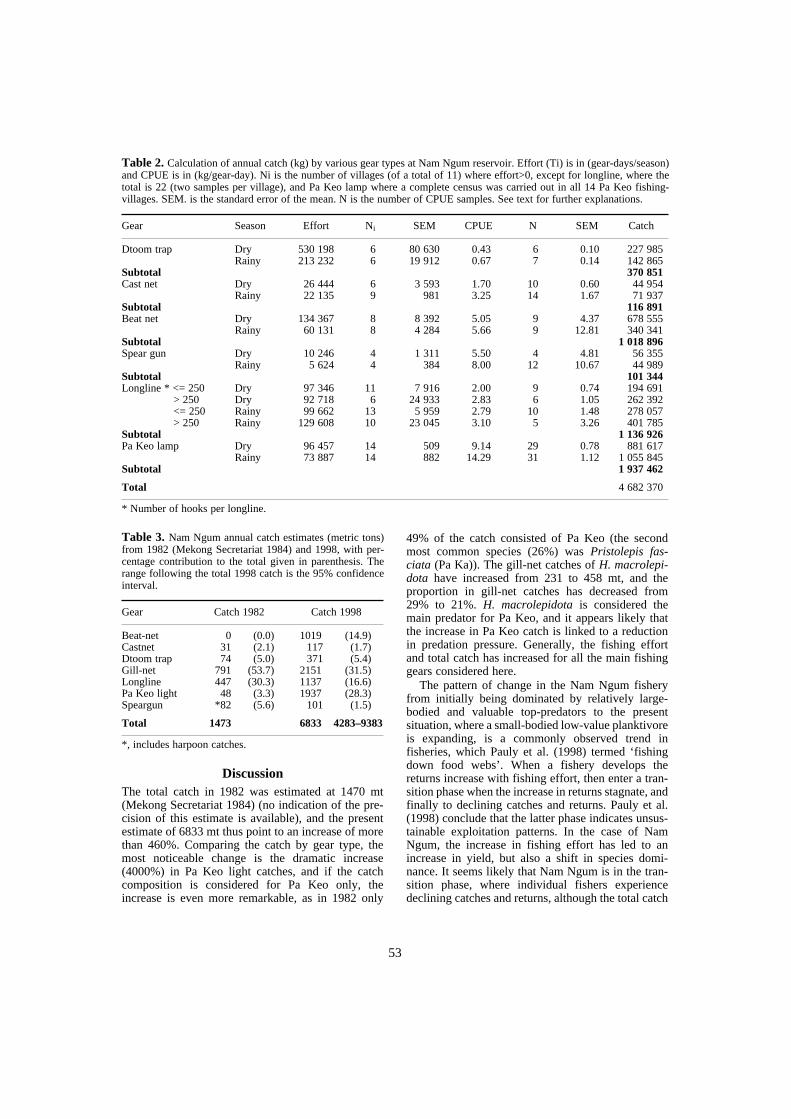
53
*, includes harpoon catches.
DiscussionThe total catch in 1982 was estimated at 1470 mt(Mekong Secretariat 1984) (no indication of the pre-cision of this estimate is available), and the presentestimate of 6833 mt thus point to an increase of morethan 460%. Comparing the catch by gear type, themost noticeable change is the dramatic increase(4000%) in Pa Keo light catches, and if the catchcomposition is considered for Pa Keo only, theincrease is even more remarkable, as in 1982 only
49% of the catch consisted of Pa Keo (the secondmost common species (26%) was Pristolepis fas-ciata (Pa Ka)). The gill-net catches of H. macrolepi-dota have increased from 231 to 458 mt, and theproportion in gill-net catches has decreased from29% to 21%. H. macrolepidota is considered themain predator for Pa Keo, and it appears likely thatthe increase in Pa Keo catch is linked to a reductionin predation pressure. Generally, the fishing effortand total catch has increased for all the main fishinggears considered here.
The pattern of change in the Nam Ngum fisheryfrom initially being dominated by relatively large-bodied and valuable top-predators to the presentsituation, where a small-bodied low-value planktivoreis expanding, is a commonly observed trend infisheries, which Pauly et al. (1998) termed ‘fishingdown food webs’. When a fishery develops thereturns increase with fishing effort, then enter a tran-sition phase when the increase in returns stagnate, andfinally to declining catches and returns. Pauly et al.(1998) conclude that the latter phase indicates unsus-tainable exploitation patterns. In the case of NamNgum, the increase in fishing effort has led to anincrease in yield, but also a shift in species domi-nance. It seems likely that Nam Ngum is in the tran-sition phase, where individual fishers experiencedeclining catches and returns, although the total catch
Table 3. Nam Ngum annual catch estimates (metric tons)from 1982 (Mekong Secretariat 1984) and 1998, with per-centage contribution to the total given in parenthesis. Therange following the total 1998 catch is the 95% confidenceinterval.
Gear Catch 1982 Catch 1998
Beat-net 0 (0.0) 1019 (14.9)Castnet 31 (2.1) 117 (1.7)Dtoom trap 74 (5.0) 371 (5.4)Gill-net 791 (53.7) 2151 (31.5)Longline 447 (30.3) 1137 (16.6)Pa Keo light 48 (3.3) 1937 (28.3)Speargun *82 (5.6) 101 (1.5)
Total 1473 6833 4283–9383
* Number of hooks per longline.
Table 2. Calculation of annual catch (kg) by various gear types at Nam Ngum reservoir. Effort (Ti) is in (gear-days/season)and CPUE is in (kg/gear-day). Ni is the number of villages (of a total of 11) where effort>0, except for longline, where thetotal is 22 (two samples per village), and Pa Keo lamp where a complete census was carried out in all 14 Pa Keo fishing-villages. SEM. is the standard error of the mean. N is the number of CPUE samples. See text for further explanations.
Gear Season Effort Ni SEM CPUE N SEM Catch
Dtoom trap Dry 530 198 6 80 630 0.43 6 0.10 227 985Rainy 213 232 6 19 912 0.67 7 0.14 142 865
Subtotal 370 851Cast net Dry 26 444 6 3 593 1.70 10 0.60 44 954
Rainy 22 135 9 981 3.25 14 1.67 71 937Subtotal 116 891Beat net Dry 134 367 8 8 392 5.05 9 4.37 678 555
Rainy 60 131 8 4 284 5.66 9 12.81 340 341Subtotal 1 018 896Spear gun Dry 10 246 4 1 311 5.50 4 4.81 56 355
Rainy 5 624 4 384 8.00 12 10.67 44 989Subtotal 101 344Longline * <= 250 Dry 97 346 11 7 916 2.00 9 0.74 194 691
> 250 Dry 92 718 6 24 933 2.83 6 1.05 262 392<= 250 Rainy 99 662 13 5 959 2.79 10 1.48 278 057> 250 Rainy 129 608 10 23 045 3.10 5 3.26 401 785
Subtotal 1 136 926Pa Keo lamp Dry 96 457 14 509 9.14 29 0.78 881 617
Rainy 73 887 14 882 14.29 31 1.12 1 055 845Subtotal 1 937 462
Total 4 682 370
54
is higher than before. A further increase in fishingeffort will probably shift the fish stocks even moretoward small fast-growing species that feed low in thefood chain, such as Pa Keo. Although the catch andits value in 1998 were higher than in 1982 due to ahigher fishing effort, further increases in fishing effortare unlikely to bring more profits to individual fishersor the fishery as a whole.
The total number of fishers at Nam Ngum is esti-mated at 3300, of which about 1500 are full-timefishers (i.e. fishing five days or more per week)(MRF, in prep.). This would indicate that fisherscatch on average 2.1 mt/fisher/yr, or if only full-timefishers are considered, 4.6 mt/fisher/yr. Moreau andDe Silva (1991) showed by empirical modellingusing data from Thai reservoirs, that the expectedcatches at fishing efforts of 9 and 4 fishers/km are1.2 and 1.7 mt/fisher/yr, respectively. Generally, thedata available for Thai reservoir fisheries arecollected from the catch of full-time fishers at mainlanding sites and via fish traders, and it may beassumed that the catch in most instances is under-estimated. The number of full-time fishers in 1982was 1352 (Mekong Secretariat 1982) and hence theiraverage catch was 1.1 mt/fisher/yr, which is con-siderably lower than the present estimate.
The apparent gill-net effort in 1982 was one-quarter of the effort in 1998 (not counting the effortby beat-nets). In addition, in 1982, the fishers wereusing multi-filament gill-nets whereas today prac-tically all nets in use are made from mono-filamenttwine, which has a higher catchability coefficient, sothat the effective effort is even higher. The CPUE in1982 was on average 0.85 kg/net/night, compared to0.5 kg/net/night in 1998. This helps explain thereports by fishers that the catches are declining,because each fisher needs to expend a higher effortto catch the same amount of fish. However, thisstudy cannot corroborate the reported decline in thetotal landings in recent years, and there is no obviousreason that this would be the case. In addition to theincrease in gill-net effort, beat-netting contributes15% of the total catch. The number of motorisedboats have increased from 563 in 1982 (MekongSecretariat 1982) to 1286 in 1998.
A yield of 185 kg/ha/yr for a reservoir of the sizeof Nam Ngum must be considered as relatively high,and few yields in this range have been reported fromreservoirs in the region. Among the Asian lakes andreservoirs listed by Moreau and De Silva (1991), onlythe Philippine lakes have comparable yields. Therelatively long and convoluted shoreline as well asthe large catchment means that allochthonous mattermay provide considerable amounts of nutrients. Itmay also be assumed that the surface area of sub-merged trees further augments the autochthonous
production by providing substratum for epiphyticperiphyton. An often-stated reason for low reservoirfish yields is an impoverished fish fauna. This is notthe case with Nam Ngum reservoir, where 55 indige-nous species are known from the catches. Taki (1974)reported 32 species in Nam Ngum River at the damsite prior to impoundment, and a total of 98 speciesfor several sampling sites on the Nam Ngum River.Thus, the indigenous fish fauna has adapted remark-ably well to the reservoir environment. Furtherevidence of the rich and well-adapted indigenous fishfauna is the failure of attempts to introduce exoticsinto the reservoir.
According to the official statistics for the NamNgum annual fisheries trade, which stem from themonopolist fish trader, the total for 1997 amountedto 774 mt, including both fresh and processed fishtrade, and adding an estimated 695 mt in local con-sumption, Schouten (1998a and 1998b) reasoned thetotal catch to be 1496 mt. Assuming that the effortand catch estimates in this study are reasonable, thecause for the large discrepancy between the findingsof this study and the official statistics may bebecause of under-reporting due to fear of increasedtaxes, as well as widespread marketing throughunofficial channels. In addition, the local consump-tion of fish is higher than previously reported, esti-mated at over 60 kg/person/yr, i.e. about 1000 mt(MRF, in prep.). Another possibility is obviously thatthe effort survey has produced too high estimates ofeffort and CPUE. However, CPUE estimates for PaKeo from the effort survey were lower than thoseactually measured in the CPUE survey, whereas theeffort survey over-estimated gill-net CPUEs. There-fore, there do not seem to be systematic errors in thequestionnaire-based effort survey.
Under-reporting of catches from reservoirs andother inland fisheries in Southeast Asia and else-where appears to be a general problem that affectsthe ability to evaluate and manage these fisheries.Important uses of accurate yield estimates frominland waters include quantitative and qualitativeprediction of effects of river regulation on fisheries,and setting of appropriate priorities when decidingamong alternative resource uses.
There appear to be at least two main options forthe management of the Nam Ngum fishery, whichwill need to be discussed with the Nam Ngum stake-holders in general, and the fishers in particular. Anobvious option is to leave the fishery as it is, whichmay produce the maximum amount of fish protein,but with a sub-optimal value. An alternative is toattempt to enhance the recruitment of larger andmore valuable species such as H. macrolepidota.This process would probably include the identifi-cation and protection of spawning and nursery areas,
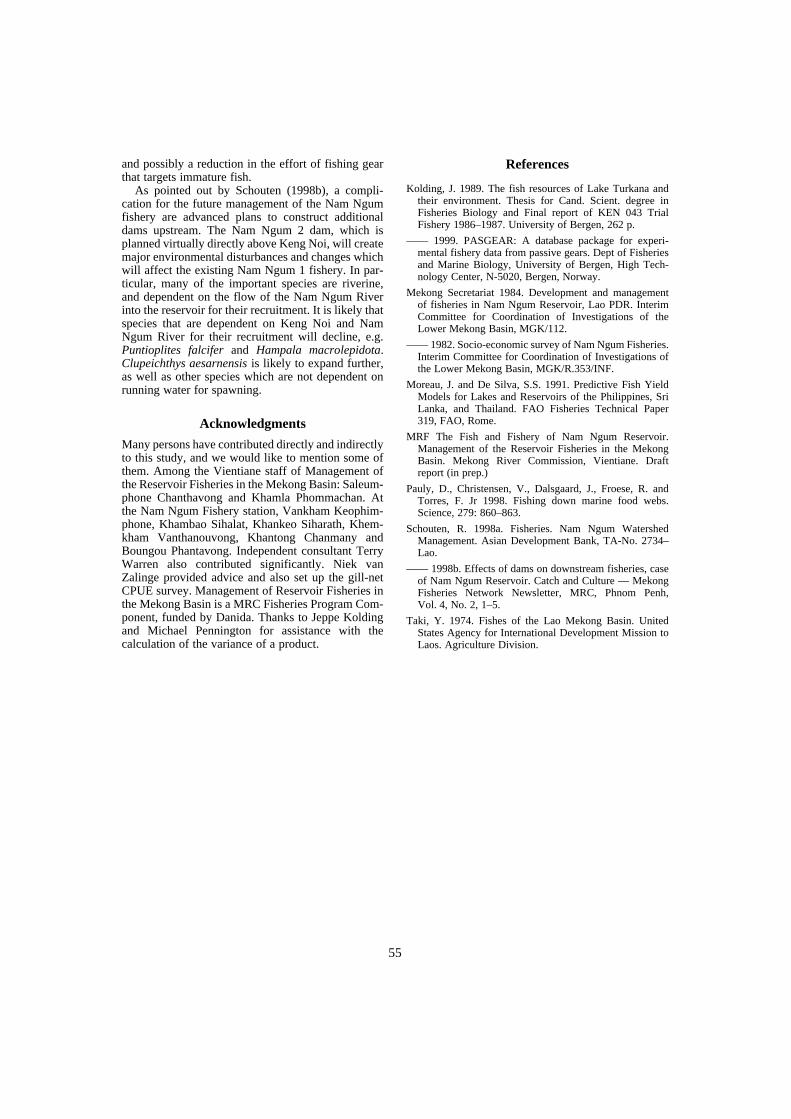
55
and possibly a reduction in the effort of fishing gearthat targets immature fish.
As pointed out by Schouten (1998b), a compli-cation for the future management of the Nam Ngumfishery are advanced plans to construct additionaldams upstream. The Nam Ngum 2 dam, which isplanned virtually directly above Keng Noi, will createmajor environmental disturbances and changes whichwill affect the existing Nam Ngum 1 fishery. In par-ticular, many of the important species are riverine,and dependent on the flow of the Nam Ngum Riverinto the reservoir for their recruitment. It is likely thatspecies that are dependent on Keng Noi and NamNgum River for their recruitment will decline, e.g.Puntioplites falcifer and Hampala macrolepidota.Clupeichthys aesarnensis is likely to expand further,as well as other species which are not dependent onrunning water for spawning.
Acknowledgments
Many persons have contributed directly and indirectlyto this study, and we would like to mention some ofthem. Among the Vientiane staff of Management ofthe Reservoir Fisheries in the Mekong Basin: Saleum-phone Chanthavong and Khamla Phommachan. Atthe Nam Ngum Fishery station, Vankham Keophim-phone, Khambao Sihalat, Khankeo Siharath, Khem-kham Vanthanouvong, Khantong Chanmany andBoungou Phantavong. Independent consultant TerryWarren also contributed significantly. Niek vanZalinge provided advice and also set up the gill-netCPUE survey. Management of Reservoir Fisheries inthe Mekong Basin is a MRC Fisheries Program Com-ponent, funded by Danida. Thanks to Jeppe Koldingand Michael Pennington for assistance with thecalculation of the variance of a product.
References
Kolding, J. 1989. The fish resources of Lake Turkana andtheir environment. Thesis for Cand. Scient. degree inFisheries Biology and Final report of KEN 043 TrialFishery 1986–1987. University of Bergen, 262 p.
—— 1999. PASGEAR: A database package for experi-mental fishery data from passive gears. Dept of Fisheriesand Marine Biology, University of Bergen, High Tech-nology Center, N-5020, Bergen, Norway.
Mekong Secretariat 1984. Development and managementof fisheries in Nam Ngum Reservoir, Lao PDR. InterimCommittee for Coordination of Investigations of theLower Mekong Basin, MGK/112.
—— 1982. Socio-economic survey of Nam Ngum Fisheries.Interim Committee for Coordination of Investigations ofthe Lower Mekong Basin, MGK/R.353/INF.
Moreau, J. and De Silva, S.S. 1991. Predictive Fish YieldModels for Lakes and Reservoirs of the Philippines, SriLanka, and Thailand. FAO Fisheries Technical Paper319, FAO, Rome.
MRF The Fish and Fishery of Nam Ngum Reservoir.Management of the Reservoir Fisheries in the MekongBasin. Mekong River Commission, Vientiane. Draftreport (in prep.)
Pauly, D., Christensen, V., Dalsgaard, J., Froese, R. andTorres, F. Jr 1998. Fishing down marine food webs.Science, 279: 860–863.
Schouten, R. 1998a. Fisheries. Nam Ngum WatershedManagement. Asian Development Bank, TA-No. 2734–Lao.
—— 1998b. Effects of dams on downstream fisheries, caseof Nam Ngum Reservoir. Catch and Culture — MekongFisheries Network Newsletter, MRC, Phnom Penh,Vol. 4, No. 2, 1–5.
Taki, Y. 1974. Fishes of the Lao Mekong Basin. UnitedStates Agency for International Development Mission toLaos. Agriculture Division.

56
The Role of Reservoir and Lacustrine Fisheries in Rural Development: Comparative Evidence from Sri Lanka,
Thailand and the Philippines
D. Simon1, C. de Jesus2, P. Boonchuwong3 and K. Mohottala4
Abstract
The EU-funded FISHSTRAT project is producing an integrated, holistic approach to fisheriesdevelopment in at least two principal respects. Firstly, it is intentionally multidisciplinary, seekingto integrate limnological, ecological and socio-economic approaches in order to generate moreholistic perspectives on, and strategies for, sustainable rural and resource development and manage-ment. Secondly, this is a comparative study of five water bodies in Sri Lanka, Thailand and thePhilippines, in order to enhance our ability to distinguish local contingency from more generalisablefeatures and processes. This paper offers preliminary insights into the diversity of social andeconomic conditions prevailing among the littoral communities, the importance of freshwatercapture fisheries and aquaculture to them, fishing and marketing strategies, and the potential forsocially, economically and environmentally sustainable development of this key resource.Particular attention is devoted to community profiles, fishing strategies and methods, and therelationship between subsistence and commercial fishing.
THIS paper explains a multidisciplinary researchproject on freshwater fisheries development in Asia,and presents some preliminary results of the socio-economic survey work now approaching completion.
FISHSTRAT is a 42-month research projectfunded under the European Union’s INCO-DCprogram of scientific collaboration with developingcountries. It began on 1 January 1998 and the mainresearch phase is now ending. Arising out of long-standing collaboration among a group of limnologistsand fish biologists, this multi-disciplinary projectrepresents an innovative approach to freshwaterfisheries development by integrating limnology, fish
biology, ecology and socio-economics within aholistic framework (Amarasinghe et al. in press). Inkeeping with current donor policies on best practicein development co-operation and partnership, theresearch team comprises scientists from fiveEuropean countries (the UK, Austria, CzechRepublic, France, the Netherlands) and three in southand Southeast Asia (the Philippines, Sri Lanka andThailand).
Whereas virtually all published interdisciplinaryresearch has in the past focused on a single waterbody, or at best has compared several within onecountry, this project incorporates a second, and quiteambitious, innovative element, namely an inter-national comparative framework. Altogether, fivewater bodies, comprising four reservoirs (Minneriya,Udawalawe and Victoria in Sri Lanka, and Ubolra-tana in Thailand’s Khon Kaen province) and thenatural Lake Taal in Batangas province, on thesouthern tip of Luzon Island in the Philippines, arebeing studied. We anticipate that this will provide uswith a manageable cross-section of reservoir andlacustrine conditions in different parts of tropicalAsia to enable the drawing of distinctions betweenlocal specificities and more generic conditions and
1Centre for Developing Areas Research, Dept. of Geography,Royal Holloway, University of London, Egham, SurreyTW20 0EX, UK2Philippine Council for Aquatic and Marine Research andDevelopment, Dept. of Science and Technology, LosBaños, Laguna, The Philippines3Fisheries Economics Division, Dept. of Fisheries, Ministryof Agriculture and Co-operatives, Phaholyothin Rd.,Chatuchak, Bangkok 10900, Thailand4Dept. of Economics, Kelaniya University, Kelaniya 11600,Sri Lanka
57
Figure 1. Flow diagram of FISHTRAT Project activities.
FISHSTRAT PROJECTFundamental scientific studies on the trophic
status of tropical lakes and reservoirs
Implications forthe sustainablemanagement ofcapture fisheries
Implications forsustainableAquaculture
(Cage/Pen culture)
Increased sustainablefish yields in tropicallakes and reservoirs
Increased supply ofcheap animal proteinfor rural and urban
markets
MARKET
Implications ofthe project for
enhanced ruraldevelopment
Mutual benefits of the project onenhanced rural development and
increased market benefits
R
U
R
A
L
D
E
V
E
L
O
P
M
E
N
T
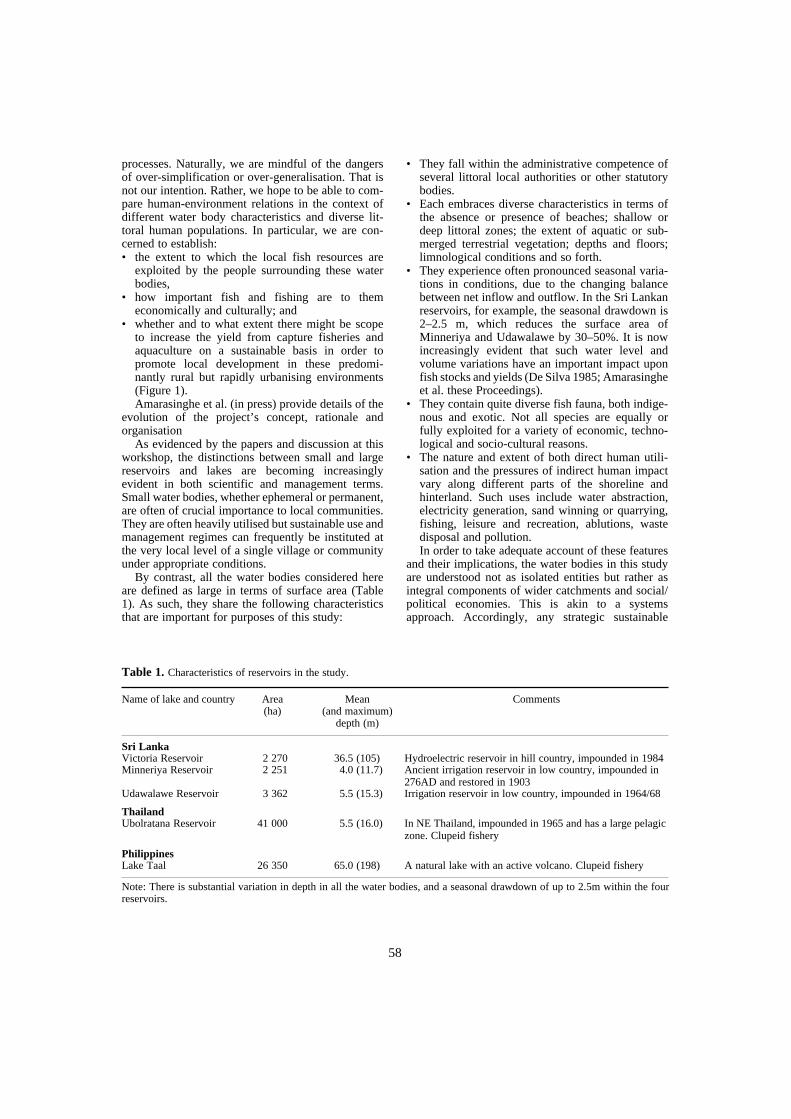
58
processes. Naturally, we are mindful of the dangersof over-simplification or over-generalisation. That isnot our intention. Rather, we hope to be able to com-pare human-environment relations in the context ofdifferent water body characteristics and diverse lit-toral human populations. In particular, we are con-cerned to establish:• the extent to which the local fish resources are
exploited by the people surrounding these waterbodies,
• how important fish and fishing are to themeconomically and culturally; and
• whether and to what extent there might be scopeto increase the yield from capture fisheries andaquaculture on a sustainable basis in order topromote local development in these predomi-nantly rural but rapidly urbanising environments(Figure 1).Amarasinghe et al. (in press) provide details of the
evolution of the project’s concept, rationale andorganisation
As evidenced by the papers and discussion at thisworkshop, the distinctions between small and largereservoirs and lakes are becoming increasinglyevident in both scientific and management terms.Small water bodies, whether ephemeral or permanent,are often of crucial importance to local communities.They are often heavily utilised but sustainable use andmanagement regimes can frequently be instituted atthe very local level of a single village or communityunder appropriate conditions.
By contrast, all the water bodies considered hereare defined as large in terms of surface area (Table1). As such, they share the following characteristicsthat are important for purposes of this study:
• They fall within the administrative competence ofseveral littoral local authorities or other statutorybodies.
• Each embraces diverse characteristics in terms ofthe absence or presence of beaches; shallow ordeep littoral zones; the extent of aquatic or sub-merged terrestrial vegetation; depths and floors;limnological conditions and so forth.
• They experience often pronounced seasonal varia-tions in conditions, due to the changing balancebetween net inflow and outflow. In the Sri Lankanreservoirs, for example, the seasonal drawdown is2–2.5 m, which reduces the surface area ofMinneriya and Udawalawe by 30–50%. It is nowincreasingly evident that such water level andvolume variations have an important impact uponfish stocks and yields (De Silva 1985; Amarasingheet al. these Proceedings).
• They contain quite diverse fish fauna, both indige-nous and exotic. Not all species are equally orfully exploited for a variety of economic, techno-logical and socio-cultural reasons.
• The nature and extent of both direct human utili-sation and the pressures of indirect human impactvary along different parts of the shoreline andhinterland. Such uses include water abstraction,electricity generation, sand winning or quarrying,fishing, leisure and recreation, ablutions, wastedisposal and pollution.In order to take adequate account of these features
and their implications, the water bodies in this studyare understood not as isolated entities but rather asintegral components of wider catchments and social/political economies. This is akin to a systemsapproach. Accordingly, any strategic sustainable
Note: There is substantial variation in depth in all the water bodies, and a seasonal drawdown of up to 2.5m within the fourreservoirs.
Table 1. Characteristics of reservoirs in the study.
Name of lake and country Area(ha)
Mean(and maximum)
depth (m)
Comments
Sri LankaVictoria Reservoir 2 270 36.5 (105) Hydroelectric reservoir in hill country, impounded in 1984Minneriya Reservoir 2 251 4.0 (11.7) Ancient irrigation reservoir in low country, impounded in
276AD and restored in 1903Udawalawe Reservoir 3 362 5.5 (15.3) Irrigation reservoir in low country, impounded in 1964/68
ThailandUbolratana Reservoir 41 000 5.5 (16.0) In NE Thailand, impounded in 1965 and has a large pelagic
zone. Clupeid fishery
PhilippinesLake Taal 26 350 65.0 (198) A natural lake with an active volcano. Clupeid fishery
59
development and management approach that is likelyto be advocated as an outcome of this project willneed to be integrated at the catchment or watershedscale.
One implication of the limnological and biologicaldiversity is that single summary statistics, such asmean depth, surface area and fish yield (kg/ha/yr) aresomewhat misleading. As with all average data, theyconceal significant internal variation, between littoraland deeper water, between areas of high and low bio-logical productivity, and so forth. Fishing effort andyields are also not uniformly distributed across thewater bodies, but are concentrated in particular zonesin specific seasons:• where fishing has the greatest prospect of success; • where specific species are known to concentrate;
and/or • where particular fishing gear can be utilised.
Ideally, we should be able to disaggregate suchstatistics by habitat or sub-area. In practice, this isextremely difficult and costly to achieve in largewater bodies. We have had to rely largely on fishcatches recorded at the various landing sites aroundthe shores, although complemented by experimentalfishing in different habitats to ascertain fish stockcomposition. This check is very important, because itenables distinctions to be made between what peoplecatch and what exists. The two cannot be assumed tobe synonymous, especially since we know that cer-tain plentiful species, like the minor cyprinids in SriLankan reservoirs, are not exploited to a significantextent.
By the end of this project, we hope to be able tooffer explanations for such socio-cultural prefer-ences, and to have examined the potential forenhanced but sustainable fish resource exploitationthrough utilisation of such species. In Sri Lanka, thecapture fishery is based very heavily on the exotictilapia species (Oreochromis mossambicus). InUbolratana and Lake Taal, this forms the backboneof the aquaculture industry but also constitutes asignificant part of the capture fisheries’ harvest.However, the tilapia coexist in the relevant habitatswith indigenous species, which do not appear to bebeing displaced (De Silva, these Proceedings).
Two other papers in these Proceedings (Schiemer;Vijverberg et al.) report preliminary limnologicaland fish biological/ecological findings from FISH-STRAT; this paper focuses on the socio-economicdimensions. Because of the provisional nature of ourdata, in some cases still based on a sub-sample orincomplete survey, and therefore the inferencesbeing drawn, we have avoided comparisons withpublished literature at this stage, seeking to elucidatethe potential of our approach for the audience at thisworkshop and the published Proceedings.
Socio-economic characteristics of littoral communities
The communities surrounding the water bodies rangein number from a few thousand in Sri Lanka to some280 000 (or 50 500 households) in the case of LakeTaal. In order to ascertain the extent of utilisation ofthe water bodies, and the relative importance of fishand fishing in the respective national and socio-economic settings, three related surveys have beenundertaken for each water body:• Baseline socio-economic surveys, incorporating a
representative sample of both fishing and non-fishing households in the villages and townsaround each water body. This has been the largestsurvey in each case. However, in view of the verydifferent resident population sizes, differentsample sizes and sampling proportions have hadto be used.
• Fish marketing surveys, undertaken among tradersand merchants who purchase the fishers’ catchand then either wholesale or retail it onward. Byconcentrating on the small number of fish landingsites in the four reservoirs, it has been possible tocover a high proportion of the traders purchasingdirectly from the fishers. Although the scale ofoperation on Lake Taal is far greater, even here amodest number of major landing sites is used,enabling high survey coverage.
• Aquaculture surveys, undertaken among fish cageculturists. There is no aquaculture in Victoria andUdawalawe, and only a small experimentalventure in Minneriya; similarly, Ubolratana hasonly a single area of relatively recent cages,although these are of high quality and the aqua-culture is being carefully monitored by the feedcompany that supplies many of the resources.Complete coverage was obtained in our survey. InLake Taal, the vast scale of aquaculture—over8000 cages in several distinct areas—has necessi-tated a sampling strategy. One hundred cageoperators were selected proportionately across the10 coastal municipalities.
Sri Lanka
For logistical reasons, the surveys in Sri Lankabegan only in late 1999, a year behind the other twocountries. However, since the surveys are smaller,they were due for completion by the end of April2000. Accordingly, only impressionistic preliminaryevidence on the extent of fishing is presented (Table2). On each reservoir, there are some 250–300 activefishers, although seasonal migrants from the coastare also important in Minneriya. The capture fisheryin Sri Lanka is based very largely on tilapia. Forreasons related to increased fishing pressure, not

60
least from unorganised fishers who do not belong tothe respective local fishery co-operative society, theuse of certain fishing methods like small mesh sizesand water beating, catches have been declining inrecent years. Problems of siltation and poor fishreproductive rates are also reported from Minneriyaand Victoria, respectively. Nets snagging on sub-merged vegetation, theft, and also contamination ofthe water by refuse are regarded as problematic byfishers.
Ubolratana
A total sample of 543 households was drawn fromthe 101 villages surrounding Ubolratana reservoir;the target had been 550 out of the total of 4621enumerated. The government statistical base wasextremely good, with recent and reliable data avail-able on the population of each village.
The differences in age of the household heads asbetween fishing and non-fishing households in dif-ferent parts of the reservoir were not significant(mean 44.9 years; range 42.5–48.3). The same is trueof household size (mean 4.5; range 4.3–4.9).
Occupational structure and incomes
Among households that undertake some fishing, thisrepresented the principal occupation in 31% of casesin the area around Lam Choen Main Stream, in 45%of cases around Nam Pong Main Stream, and in 48%around the remainder of the reservoir (Figure 2). Inthe first area, labouring was marginally more impor-tant as the principal occupation, followed by ricefield cultivation; in the other two areas, fishing wasby far the most widespread main occupation, fol-lowed in each case by rice cultivation and then, some
way behind, by labouring. Among non-fishinghouseholds, rice cultivation and labouring also repre-sented the most important main occupations. Amongfishing and non-fishing households alike, only ahandful engaged in each of government service,small business, livestock rearing, cultivating fruitorchards and miscellaneous other jobs.
The most significant preliminary results relate tothe distribution of incomes (Table 3). In each of thethree areas, non-fishing households earned more thandouble the income of their fishing counterparts inrespect of the main income source; for sub-income 1non-fishing households also earned somewhat more.However, for sub-incomes 2–4, the picture wasvaried. In aggregate household income terms, non-fishing households around Lam Choen earned 128%more than fishing households; in the Nam Pong areathe figure was over 79%, and elsewhere around thereservoir 57%. The average was 87% more for non-fishing households.
There is a total gender division of labour, with allfishing being done by males and females havingalmost exclusive responsibility for cleaning andprocessing of fish at landing sites and elsewhere.Some of these women are the spouses or familymembers of fishermen or fish traders; however, fishcleaning provides an important source of employ-ment for poor local women of all ages. By contrast,fish trading is not gender-specific although womenoutnumber men by 3:1. Some fishermen and/or theirspouses also trade. Our preliminary work suggeststhat client-patron relations between traders and‘their’ fishermen are widespread. Provision of credit(especially towards the cost of fishing gear) repre-sents the main source of such attachment, in returnfor a secure outlet for fish catches.
Note: FCS = fishery co-operative society
Table 2. Fisheries in the three Sri Lankan reservoirs.
Udawalawa Victoria Minneriya
Total FCS members 264 (200 active) 133 (100 active) 150 (60 active)
Total active fishers 300 250 300 + 90 migrants
Main problems Depletion of fishery, plant damage to nets
Growth of plants that snag nets, net thieves
Refuse washed into reservoir by rain
Other uses of reservoir Grazing, recreation,fuel wood collection
HEP generation Fuel wood collection
Reasons for decliningfishery
Use of small mesh nets, water beating system, increasing no. of fishermen and net types, unprotected spillway
Competition from unorganised fishermen (60), use of small mesh nets, poor fish breeding
Use of small mesh nets,sedimentation of watershed, increased catches of small fish for drying

61
Figure 2. Ubolratana Reservoir, Khon Kaen Province, Thailand.
0 20 kmSi Bun Ruang District
Non Sang District
Dam
Ubolratana District
FisheriesSubstation
Phu Wiang District
Sampling station
Fish landing site
Nong Rua District
StudyArea
N
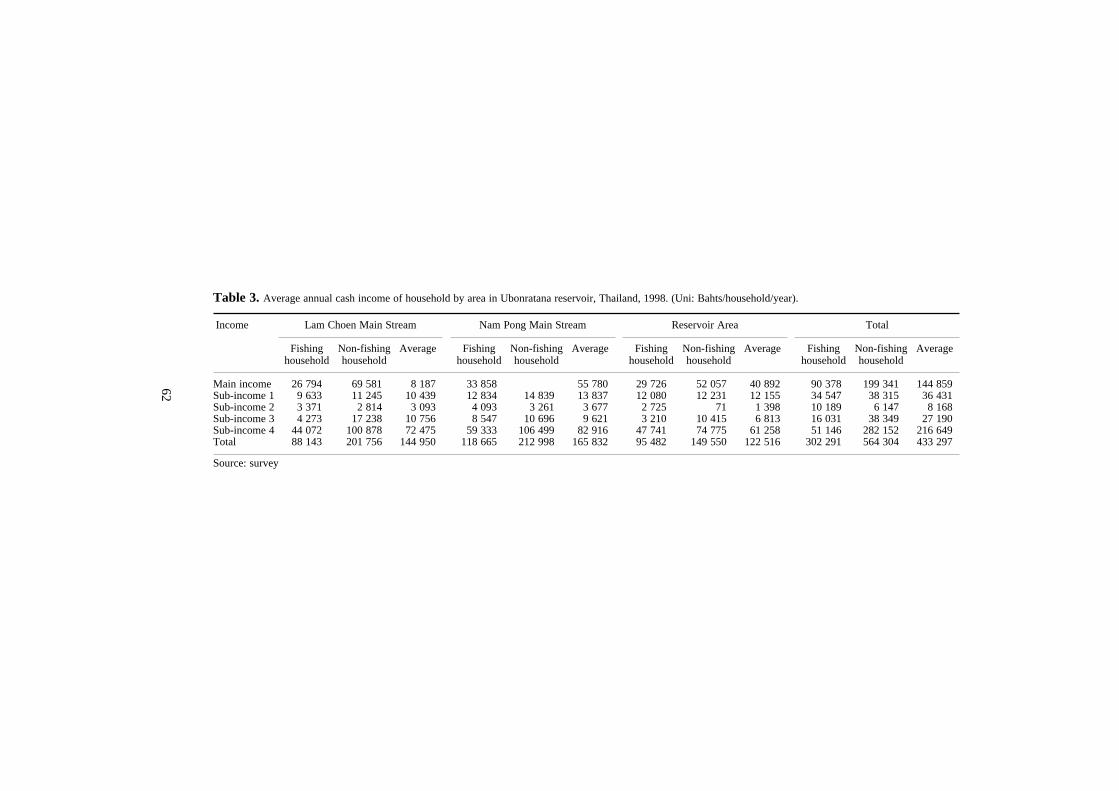
62
Source: survey
Table 3. Average annual cash income of household by area in Ubonratana reservoir, Thailand, 1998. (Uni: Bahts/household/year).
Income
Lam Choen Main Stream Nam Pong Main Stream Reservoir Area Total
Fishinghousehold
Non-fishinghousehold
Average
Fishinghousehold
Non-fishinghousehold
Average
Fishinghousehold
Non-fishinghousehold
Average
Fishinghousehold
Non-fishinghousehold
Average
Main income 26 794 69 581 8 187 33 858 55 780 29 726 52 057 40 892 90 378 199 341 144 859 Sub-income 1 9 633 11 245 10 439 12 834 14 839 13 837 12 080 12 231 12 155 34 547 38 315 36 431 Sub-income 2 3 371 2 814 3 093 4 093 3 261 3 677 2 725 71 1 398 10 189 6 147 8 168 Sub-income 3 4 273 17 238 10 756 8 547 10 696 9 621 3 210 10 415 6 813 16 031 38 349 27 190 Sub-income 4 44 072 100 878 72 475 59 333 106 499 82 916 47 741 74 775 61 258 51 146 282 152 216 649 Total 88 143 201 756 144 950 118 665 212 998 165 832 95 482 149 550 122 516 302 291 564 304 433 297
63
Although further analysis of the data must still becompleted, it appears that there might be a socialequity argument for focusing attention on incomeenhancement for fishing households, which aregenerally poorer than non-fishing households.Nevertheless, there is also significant socio-economicdifferentiation among fishing households; they do notrepresent a homogeneous group. For example, 70% offishing households possessed a boat powered by anoutboard motor (although they did not necessarilyown it outright); 13% an unpowered boat, and 17%no boat. The range of gross daily incomes reported byfishermen interviewed on the reservoir during 1999was Bt70–2000. A moot point at this stage is whetherany such equity promotion strategy would most appro-priately aim at increasing incomes from fishing ornon-fishing livelihoods, or a combination of the two.
We also found evidence of the responsiveness ofsome people to changing economic conditions. InFebruary 1999, a group of 14 migrant fisher familiesfrom Lam Pae reservoir some 100 km east ofUbolratana was living in temporary shelters alongthe reservoir shore at Landing Site 2 (Ban Talad). Inprevious years, they had migrated to Bangkok asconstruction workers during the dry season, but onaccount of the paucity of such jobs since the onset ofthe Asian economic crisis and their consequentinability to find work in 1998, they had decided toexperiment with dry season fishing at Ubolratana.They had transported their boats by road and wereusing cast-net and trap fishing methods. Althoughtheir daily incomes from fishing were lower thanthose of local fishermen using similar gear in thesame locality, something they attributed to their lackof familiarity with local conditions, they expressedprovisional satisfaction with their decision andexpected to return in 2000. We found no evidence oftension between them and local fisher folk. Theywere also supplementing their incomes by makingrattan fish traps for sale locally.
Lake Taal
This lake illustrates particularly well the complexinteractions between a water body and its catchment.Because the lake lies in a large extinct volcaniccaldera, the porous rocks and steep slopes act asready conduits for rainfall runoff and waste waterfrom the rapidly expanding industrial, residential andrecreational developments. Tourism is concentratedparticularly along the northern and western shoresand along the steep northern caldera ridge atTagaytay City. There is little piped sewerage systemin the area, so a substantial proportion of wasteproducts will contaminate aquifers and/or reach thelake. To date, however, Taal has enjoyed cleaner
water than many other Philippine lakes. The activevolcano island in the middle of the lake is inhabitedillegally by several hundred predominantly poorpeople, who practise subsistence agriculture andoperate tourist boats and provide mule rides up thesteep slope to the volcano crater lip. Localisedenvironmental degradation, including along the mulepath, is evident.
Finally, the 12 km Pansipit River provides theonly outlet to the sea. This represents an importantfish migratory route for spawning and immaturegrowth stages of many marine and lacustrine species.However, illegal trapping and penning along theriver is reportedly having a significant effect on fishstock recruitment and yields, although it is difficultto quantify. Efforts to demolish illegal structures,and cages on the lake, have been intensified since1998 but reconstruction follows rapidly. Two recentfisheries modernisation and conservation measureshave great relevance to the exploitation of Lake Taal:• The Agriculture and Fisheries Modernisation Act
of 1997 (Republic Act 8435), and the regulationspursuant to it. It defines a micro-enterprise ashaving assets (other than land) valued at less thanP1.5 million, and small farmers and fisher folk as‘natural persons dependent on small-scale sub-sistence farming and fishing activities as theirprimary source of income’. These definitionsembrace most capture fishing activities on thelake, since the ubiquitious pumpboats are cheaperthan that. Even the smaller aquaculturists wouldqualify as micro-enterprises and therefore be ableto benefit from the available support provisions. Adifferent section of the Act addresses watershedconservation.
• The Philippine Fisheries Code of 1998 (RepublicAct 8550), which provides for the development,management and conservation of fisheries andaquatic resources and seeks to integrate existinglegislation to that end. It seeks to promote rationaland sustainable development of the resources inline with principles of integrated coastal areamanagement, protect the rights of fisher folk,especially local communities and municipal fisherfolk (i.e. small-scale local fishers registered withtheir municipality). Its provisions are in tune withcurrent international best practice on sustainabledevelopment, such as local agenda 21. By the endof this project, we anticipate being able to assessthe extent to which the measures are being imple-mented on Lake Taal.
Occupational structure
Given the size of the local population, the baselineand fishing surveys here have been far larger than in
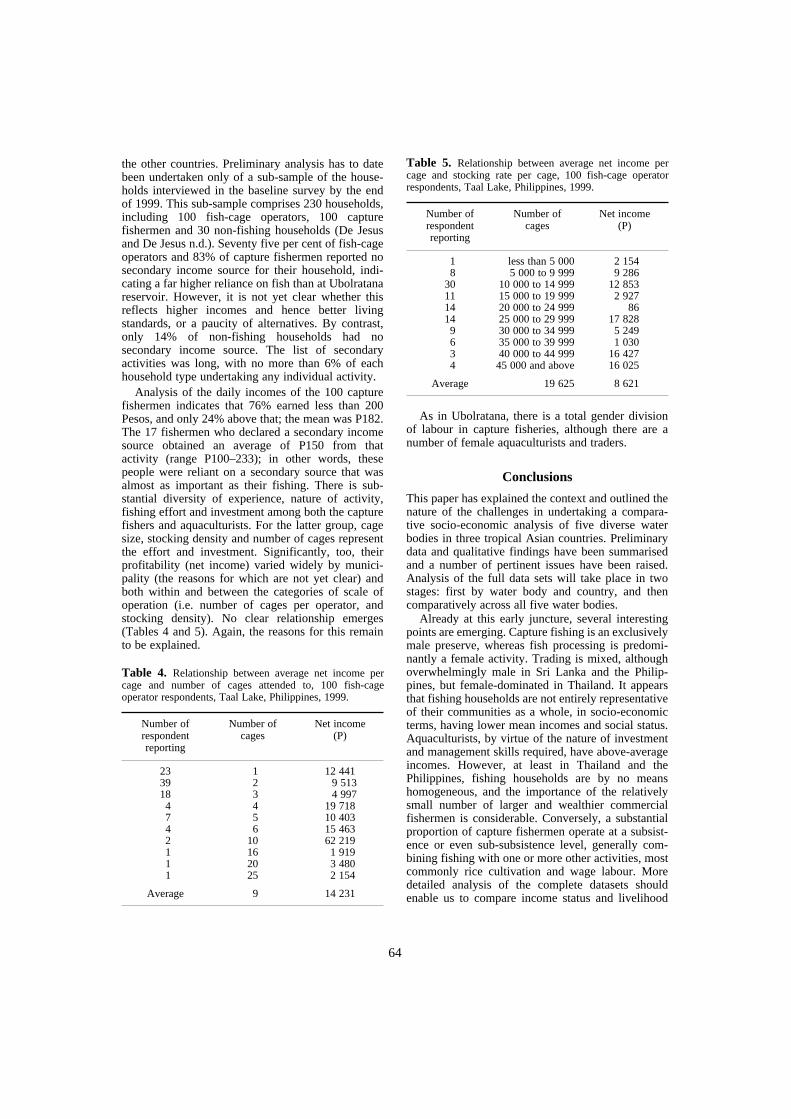
64
the other countries. Preliminary analysis has to datebeen undertaken only of a sub-sample of the house-holds interviewed in the baseline survey by the endof 1999. This sub-sample comprises 230 households,including 100 fish-cage operators, 100 capturefishermen and 30 non-fishing households (De Jesusand De Jesus n.d.). Seventy five per cent of fish-cageoperators and 83% of capture fishermen reported nosecondary income source for their household, indi-cating a far higher reliance on fish than at Ubolratanareservoir. However, it is not yet clear whether thisreflects higher incomes and hence better livingstandards, or a paucity of alternatives. By contrast,only 14% of non-fishing households had nosecondary income source. The list of secondaryactivities was long, with no more than 6% of eachhousehold type undertaking any individual activity.
Analysis of the daily incomes of the 100 capturefishermen indicates that 76% earned less than 200Pesos, and only 24% above that; the mean was P182.The 17 fishermen who declared a secondary incomesource obtained an average of P150 from thatactivity (range P100–233); in other words, thesepeople were reliant on a secondary source that wasalmost as important as their fishing. There is sub-stantial diversity of experience, nature of activity,fishing effort and investment among both the capturefishers and aquaculturists. For the latter group, cagesize, stocking density and number of cages representthe effort and investment. Significantly, too, theirprofitability (net income) varied widely by munici-pality (the reasons for which are not yet clear) andboth within and between the categories of scale ofoperation (i.e. number of cages per operator, andstocking density). No clear relationship emerges(Tables 4 and 5). Again, the reasons for this remainto be explained.
As in Ubolratana, there is a total gender divisionof labour in capture fisheries, although there are anumber of female aquaculturists and traders.
Conclusions
This paper has explained the context and outlined thenature of the challenges in undertaking a compara-tive socio-economic analysis of five diverse waterbodies in three tropical Asian countries. Preliminarydata and qualitative findings have been summarisedand a number of pertinent issues have been raised.Analysis of the full data sets will take place in twostages: first by water body and country, and thencomparatively across all five water bodies.
Already at this early juncture, several interestingpoints are emerging. Capture fishing is an exclusivelymale preserve, whereas fish processing is predomi-nantly a female activity. Trading is mixed, althoughoverwhelmingly male in Sri Lanka and the Philip-pines, but female-dominated in Thailand. It appearsthat fishing households are not entirely representativeof their communities as a whole, in socio-economicterms, having lower mean incomes and social status.Aquaculturists, by virtue of the nature of investmentand management skills required, have above-averageincomes. However, at least in Thailand and thePhilippines, fishing households are by no meanshomogeneous, and the importance of the relativelysmall number of larger and wealthier commercialfishermen is considerable. Conversely, a substantialproportion of capture fishermen operate at a subsist-ence or even sub-subsistence level, generally com-bining fishing with one or more other activities, mostcommonly rice cultivation and wage labour. Moredetailed analysis of the complete datasets shouldenable us to compare income status and livelihood
Table 4. Relationship between average net income percage and number of cages attended to, 100 fish-cageoperator respondents, Taal Lake, Philippines, 1999.
Number of respondent reporting
Number ofcages
Net income(P)
23 1 12 44139 2 9 51318 3 4 9974 4 19 7187 5 10 4034 6 15 4632 10 62 2191 16 1 9191 20 3 4801 25 2 154
Average 9 14 231
Table 5. Relationship between average net income percage and stocking rate per cage, 100 fish-cage operatorrespondents, Taal Lake, Philippines, 1999.
Number of respondent reporting
Number ofcages
Net income(P)
1 less than 5 000 2 1548 5 000 to 9 999 9 286
30 10 000 to 14 999 12 85311 15 000 to 19 999 2 92714 20 000 to 24 999 8614 25 000 to 29 999 17 8289 30 000 to 34 999 5 2496 35 000 to 39 999 1 0303 40 000 to 44 999 16 4274 45 000 and above 16 025
Average 19 625 8 621

65
strategies with fishing effort, types and quantity offishing gear, fish species exploited, in order to com-pile a more nuanced and disaggregated picture ofcapture fishing in each water body. Where appli-cable, the equivalent will be done for aquaculture.
This work has both academic and practicalmanagement implications, especially when related tofish ecology and stock assessment data. It wouldmake little sense to recommend poor (or any other)fisher folk to change gear or adopt new fishing prac-tices with the intention of increasing their catch perunit effort and total catch, if the favoured species arealready being exploited close to or beyond theirmaximum sustainable yield.
Conversely, the exploitation of un- or under-exploited species may hold significant potentialunder certain conditions. On the other hand, it maybe that the most appropriate strategies under otherconditions would be to promote income and liveli-hood security through diversification, i.e. combiningfishing and non-fishing activities in and around thewater body concerned, or through collective actionby fishermen (e.g. by forming a co-operative).Equally, the needs of both men and women in fishinghouseholds need to be considered, taking intoaccount existing gendered roles and the potential forlivelihood enhancement through greater value-addedfishing and fish processing and marketing activitiesby the household as a whole. In addition, the com-patibility of fishing with other uses, and the impactof pollution and eutrophication on fishing, need to beconsidered.
It is through such efforts that we aim to demon-strate that the integration of socio-economic, limno-logical and biological perspectives holds the greatestpromise for promoting sustainable and participatory
management of tropical freshwater fish, an importantrenewable natural resource in all the countriescovered by this study.
References
Amarasinghe, U.S., Duncan, A., Moreau, J., Schiemer, F.,Simon, D. and Vijverberg, J (in press). Promotion ofsustainable capture fisheries and aquaculture in Asianreservoirs and lakes. Hydrobiologia, special issue.
Amarasinghe, U.S., Nissanka, C. and De Silva, S.S. Fluctu-ations in water level in shallow, irrigation reservoirs:implications on field yield estimates and fisheriesmanagement. Paper presented at the Workshop onReservoir Fisheries Biology and Management, Bangkok,Thailand, 14–18 February.
De Jesus, C.C. and De Jesus, M.T.R. (n.d.). PhilippineFISHSTRAT Socio-economic component: some prelimi-nary findings and implications for developing sustainablemanagement strategies for Taal Lake. Los Baños:PCAMRD.
De Silva, S.S. 1985. Observations on the abundance of theexotic cichlid Oreochromis Mossambicus (Peters) inrelation to fluctuations in the water level in a man-madelake in Sri Lanka. Aquaculture and Fisheries Manage-ment, 16: 265–272.
De Silva, S.S. Asian reservoir fisheries: broad strategies forenhancing yields. Paper presented at the Workshop onReservoir Fisheries Biology and Management, Bangkok,Thailand, 14–18 February.
Schiemer, F. Ecosystem structure and dynamics as manage-ment basis for Asian reservoirs and lakes. Paper pre-sented at the Workshop on Reservoir Fisheries Biologyand Management, Bangkok, Thailand, 14–18 February.
Vijverberg, J., Amarasinghe, B. and Ariyaratna, M.G.Biology and ecology of small pelagic fish species inSoutheast Asian lakes and reservoirs. Paper presented atthe Workshop on Reservoir Fisheries Biology andManagement, Bangkok, Thailand, 14–18 February.

66
Characteristics and Status of the Lake Tegano Fishery
E. Oreihaka*
Abstract
Where accessibility to sea is restricted, access to marine fisheries resources becomes limited.Rennell Island, on which Lake Tegano is situated, is an uplifted coral atoll surrounded by lime-stone cliffs of up to 150 m, such that the presence of inhabitable sites along the sea coast is limited.Much of the population, therefore, lives inland, making it difficult to engage in sea-fishingactivities. Mozambique tilapia (Oreochromis mossambicus, Cichlidae) introduced into the lake inthe 1950s has grown to become the most important source of protein food for the four villagecommunities of 600 people that live along the lake shore. Realising the importance of tilapia, theRennell and Bellona Provincial Government seeks the possibility of introducing a new tilapiaspecies, Nile tilapia (O. niloticus, Cichlidae) to the lake. With current tilapia already providing asufficient source of protein, coupled with the island’s recent inclusion under the World Heritagelisting as a conservation site, caution must be taken in any further developments. Information onthe fishery, water quality parameters and the physical environment of Lake Tegano were collectedto describe the characteristics and status of the lake fishery.
LAKE TEGANO, reportedly the largest uplifted coralatoll in the world, Rennell Island, Solomon Islands(Figure 1), is believed to be the largest brackish waterlake in the insular Pacific, covering an area of about15 500 ha (Leary 1994). Located at the eastern end ofthe island at 11°46′ S and 160°27′ E (Figure 2), itsbrackish water is continually being replenished byfresh water through underground springs. There isbelieved to be a one-kilometre underground channelthat connects the sea with the lake. It is estimated thatthe lake rarely exceeds 40 m in depth. Shielding theshores of the lake and its 200 islands is a mixture ofmangroves and untouched lowland forests. Theaquatic fauna of the lake has been well studied andsummarised by Wolff (1970). Some 77 species wererecorded from the lake including species endemic tothe lake. The lake also supports a large number ofwaterbirds and waterfowl.
Mozambique tilapia were introduced into LakeTegano in the late 1950s and have now grown tobecome the most important source of protein, withminor supplementaries from freshwater eels (Anguillaobscura, Anguillidae) and prawns (Macrobrachium
spp.) Most catches were for subsistence use, butoccasional selling does occur when there is a surplus.With the completion of the road linking the lake tothe rest of the island, including the main seaport andairstrip, trade in fish has potential.
In 1986, however, there were reported incidents oftilapia dying in large numbers in the lake. Therewere also concerns about the abundance and size oftilapia, which were believed to be declining. Theseconcerns stirred the province to consider farmingtilapia in and around the lake, which led to the con-sideration of alternative species that could be intro-duced. In suggesting Nile tilapia as an alternativespecies, the Fisheries Division opted to undertake animpact study before any introduction.
This paper, based on preliminary work undertakenby the Fisheries Division, Department of Agricultureand Fisheries, summarises the characteristics andstatus of the Lake Tegano Fishery, as a lead-up todeveloping a more comprehensive project proposalfor a proposed ‘Introduction Impact Study’.
Materials and Method
The data and information used were collected fromfour surveys undertaken on the lake by the ResearchSection of the Fisheries Division, Department ofAgriculture and Fisheries.
*Fisheries Division, Department of Agriculture andFisheries, Ministry of Lands, Agriculture and Fisheries,Honiara, Solomon Islands
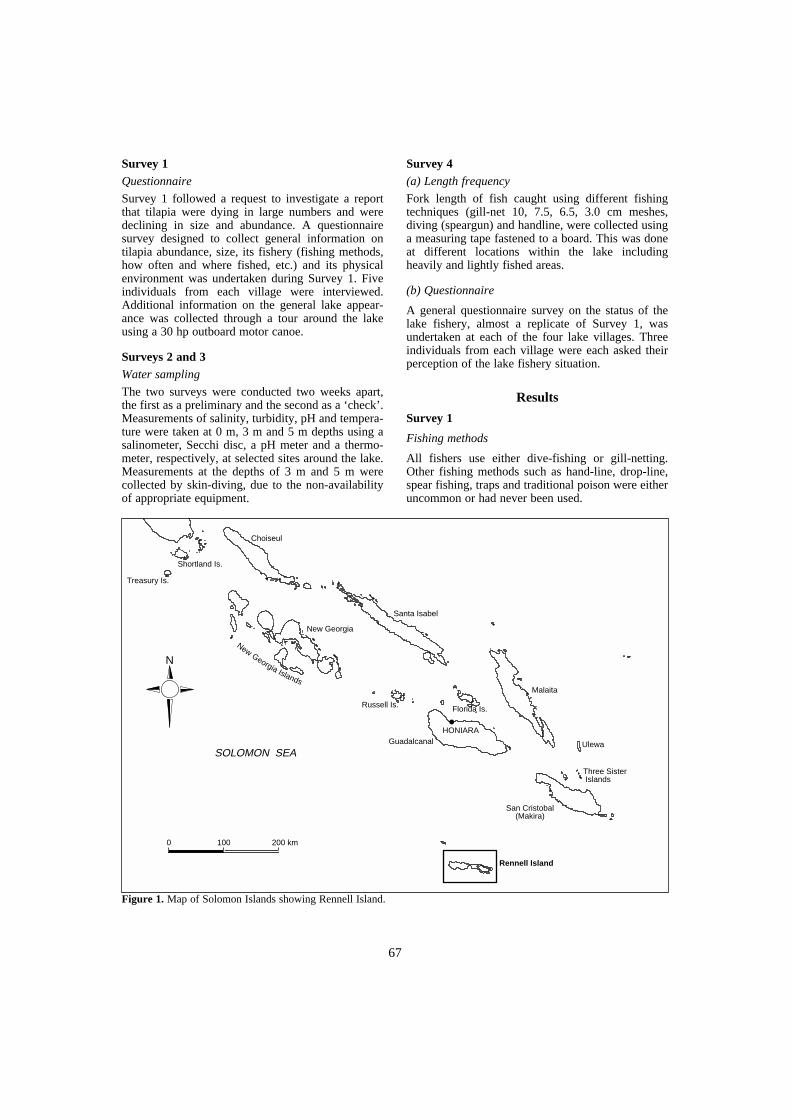
67
Survey 1Questionnaire
Survey 1 followed a request to investigate a reportthat tilapia were dying in large numbers and weredeclining in size and abundance. A questionnairesurvey designed to collect general information ontilapia abundance, size, its fishery (fishing methods,how often and where fished, etc.) and its physicalenvironment was undertaken during Survey 1. Fiveindividuals from each village were interviewed.Additional information on the general lake appear-ance was collected through a tour around the lakeusing a 30 hp outboard motor canoe.
Surveys 2 and 3Water sampling
The two surveys were conducted two weeks apart,the first as a preliminary and the second as a ‘check’.Measurements of salinity, turbidity, pH and tempera-ture were taken at 0 m, 3 m and 5 m depths using asalinometer, Secchi disc, a pH meter and a thermo-meter, respectively, at selected sites around the lake.Measurements at the depths of 3 m and 5 m werecollected by skin-diving, due to the non-availabilityof appropriate equipment.
Survey 4(a) Length frequency
Fork length of fish caught using different fishingtechniques (gill-net 10, 7.5, 6.5, 3.0 cm meshes,diving (speargun) and handline, were collected usinga measuring tape fastened to a board. This was doneat different locations within the lake includingheavily and lightly fished areas.
(b) Questionnaire
A general questionnaire survey on the status of thelake fishery, almost a replicate of Survey 1, wasundertaken at each of the four lake villages. Threeindividuals from each village were each asked theirperception of the lake fishery situation.
Results
Survey 1
Fishing methods
All fishers use either dive-fishing or gill-netting.Other fishing methods such as hand-line, drop-line,spear fishing, traps and traditional poison were eitheruncommon or had never been used.
Figure 1. Map of Solomon Islands showing Rennell Island.
Rennell Island
San Cristobal(Makira)
Three Sister Islands
Ulewa
Malaita
Santa Isabel
Choiseul
Treasury Is.
Shortland Is.
New Georgia
Guadalcanal
Russell Is. Florida Is.
HONIARA
NewGeorgia Islands
SOLOMON SEA
0 200 km100
N
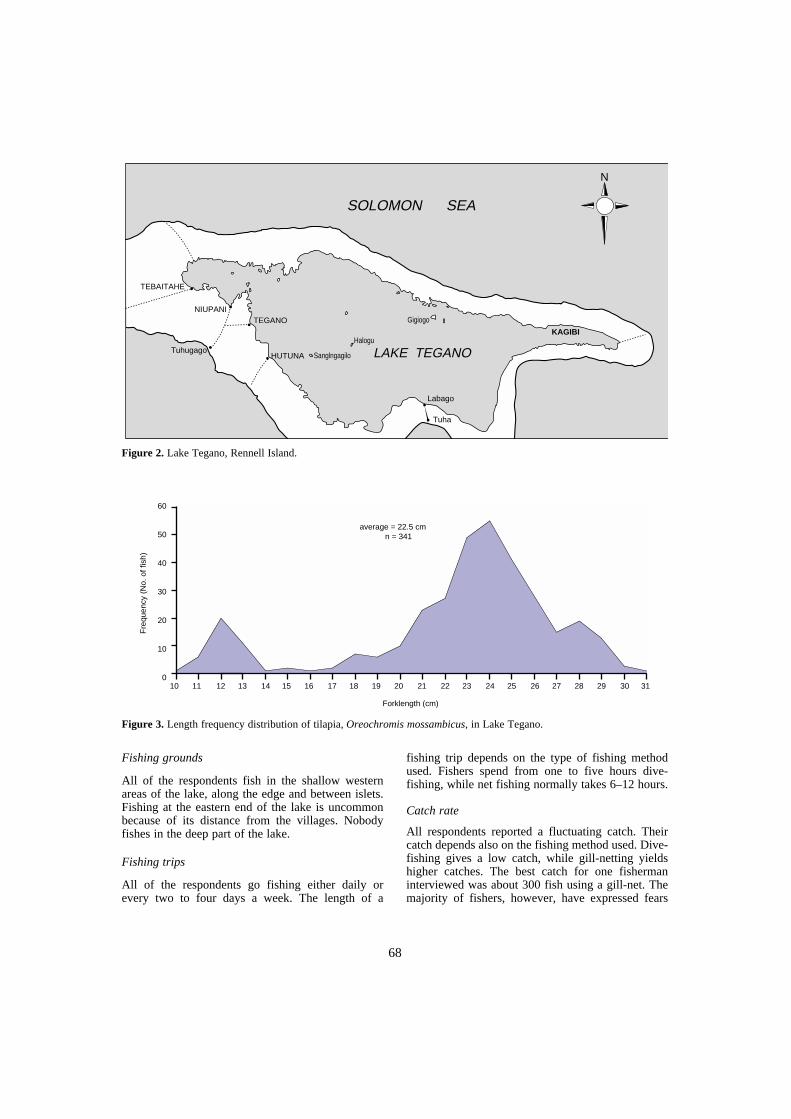
68
Fishing grounds
All of the respondents fish in the shallow westernareas of the lake, along the edge and between islets.Fishing at the eastern end of the lake is uncommonbecause of its distance from the villages. Nobodyfishes in the deep part of the lake.
Fishing trips
All of the respondents go fishing either daily orevery two to four days a week. The length of a
fishing trip depends on the type of fishing methodused. Fishers spend from one to five hours dive-fishing, while net fishing normally takes 6–12 hours.
Catch rate
All respondents reported a fluctuating catch. Theircatch depends also on the fishing method used. Dive-fishing gives a low catch, while gill-netting yieldshigher catches. The best catch for one fishermaninterviewed was about 300 fish using a gill-net. Themajority of fishers, however, have expressed fears
Figure 2. Lake Tegano, Rennell Island.
Figure 3. Length frequency distribution of tilapia, Oreochromis mossambicus, in Lake Tegano.
LAKE TEGANO
SOLOMON SEA
HUTUNA
Labago
Tuhugago
Tuha
TEGANO
KAGIBI
NIUPANI
TEBAITAHE
Sanglngagilo
Halogu
Gigiogo
N
60
50
40
30
20
10
0
Fre
quen
cy (
No.
of f
ish)
10 11 12 13 14 15 16 17 18 19 20 21 22 23 24 25 26 27 28 29 30 31
Forklength (cm)
average = 22.5 cmn = 341

69
that fishing effort has increased a great deal in pastyears.
Stock and size
Seventy-seven per cent of fishers believed that thetilapia stock abundance was declining. Thirteen percent thought it was increasing. Ten per cent saidthere was no change in the stock abundance. Ninety-seven per cent claimed the average size of tilapia tobe decreasing, while only three per cent believedthere was no size change.
Problems
People interviewed perceived the following as con-tributing factors to the problem:(a) overfishing resulting from the use of too many
gill-nets with small mesh sizes;(b) increased predation by birds, notably the great
cormorant;(c) pollution related to human activities, including
increased use of outboard motor canoes;(d) lack of food as a result of competition. Tilapia is
a fast breeder and as the population within thelake increases, is competing for the same foodresources;
Surveys 2 and 3
The two surveys found the water to be fresher thansaline, with an average salinity of 5.5 ppt. Thewestern end of the lake is found to be colder with awater temperature of 22.9oC, and the rest rangingfrom 29.1o to 31.3oC. Likewise, the pH reading forthe western end recorded the lowest of 7.9, whileother parts ranged 8.4 to 8.6, more alkaline. This isnormal due to the nature of the substrata of the lakeand island (Lam 1996) (unpubl.). An average clarityof 6.9 m was measured for the lake.
Survey 4
(a) Length frequency
The length frequency of 341 tilapia were measuredand the distribution is presented in Figure 3. Theaverage length is 22.5 cm.
(b) Questionnaire
Fishing methods
Eighty-three per cent of the respondents use dive-fishing and 17% use nets. Hand-lining is sometimesused but very occasionally.
Fishing grounds
All respondents use the western shallow lake edgesand between islands to fish.
Fishing trips
Fifty-seven per cent of the respondents go out fishingdaily, 33% go four to six times a week, and 10% oneto three times a week. The length of fishing tripsdepends largely on the type of fishing method used.Fishers normally spend between one to three hoursdive-fishing, while net fishing normally takes 6–12hours, normally overnight.
Catch rate
Ninety-two per cent of respondents reported a fluctu-ating catch, which depends also on the fishingmethod used. Dive-fishing gives a low catch, from20–30 fish per hour, while nets yield higher catches.The majority of fishers, however, have expressedfears that fishing effort has increased a great dealduring recent years.
Stock and size
Seventy per cent of the respondents observed thestock abundance to have increased since Survey 1,while 13% thought it was decreasing. All except onerespondent thought size had improved a bit sinceSurvey 1.
Problems
Above 90% of the respondents claimed overfishing,particularly the increasing use of gill-net, to be themost serious contributing factor to stock and sizedecline of tilapia in the lake. Water birds and waterfowls also contribute to stock decline. The increaseduse of outboard motor canoe contributes to pollution.
Management measures
There are currently no management measures inplace for Lake Tegano in regards to fishing.Although fishing is of open access to all lake com-munities, commonsense is encouraged to play animportant part.
Support for introduction of alternative species
Although with some caution, all respondents supportthe idea of introducing an alternative species into thelake. This does not necessarily have to be tilapia.
Trade and market
Fishing for sale is very rare and infrequent. None ofthe respondents fish primarily for sale except forcommunity fundraising events. Only surplus fish arenormally sold.
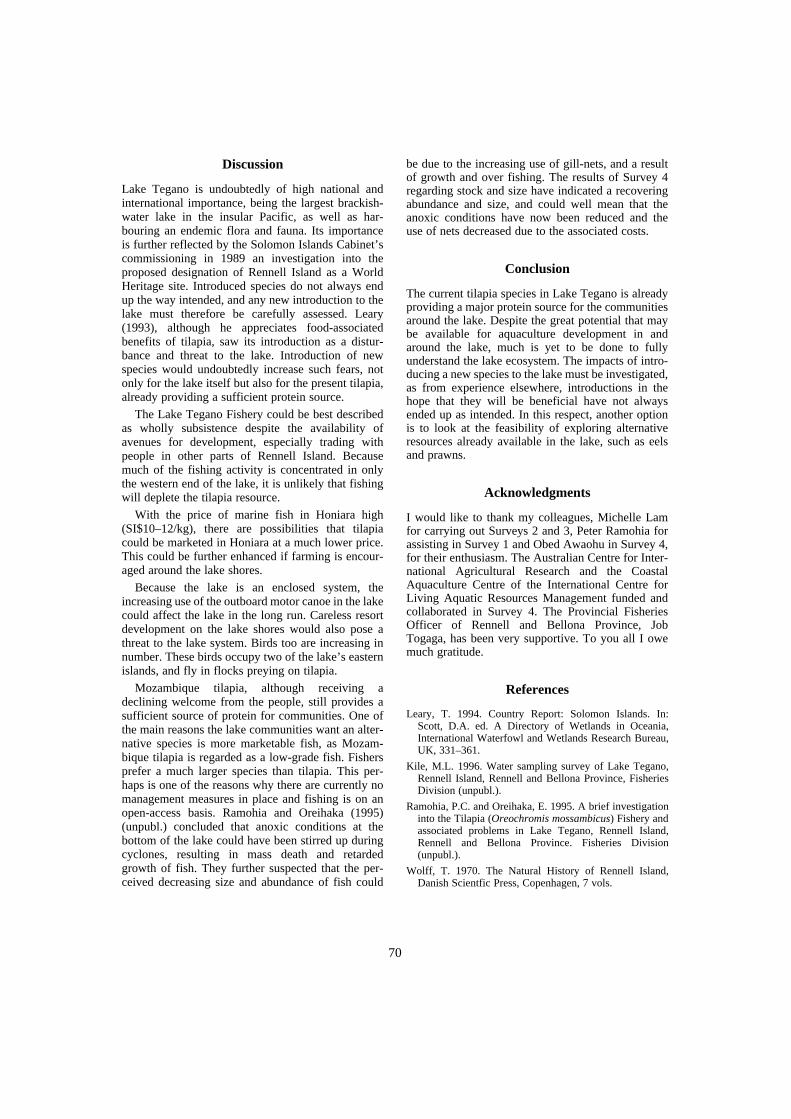
70
Discussion
Lake Tegano is undoubtedly of high national andinternational importance, being the largest brackish-water lake in the insular Pacific, as well as har-bouring an endemic flora and fauna. Its importanceis further reflected by the Solomon Islands Cabinet’scommissioning in 1989 an investigation into theproposed designation of Rennell Island as a WorldHeritage site. Introduced species do not always endup the way intended, and any new introduction to thelake must therefore be carefully assessed. Leary(1993), although he appreciates food-associatedbenefits of tilapia, saw its introduction as a distur-bance and threat to the lake. Introduction of newspecies would undoubtedly increase such fears, notonly for the lake itself but also for the present tilapia,already providing a sufficient protein source.
The Lake Tegano Fishery could be best describedas wholly subsistence despite the availability ofavenues for development, especially trading withpeople in other parts of Rennell Island. Becausemuch of the fishing activity is concentrated in onlythe western end of the lake, it is unlikely that fishingwill deplete the tilapia resource.
With the price of marine fish in Honiara high(SI$10–12/kg), there are possibilities that tilapiacould be marketed in Honiara at a much lower price.This could be further enhanced if farming is encour-aged around the lake shores.
Because the lake is an enclosed system, theincreasing use of the outboard motor canoe in the lakecould affect the lake in the long run. Careless resortdevelopment on the lake shores would also pose athreat to the lake system. Birds too are increasing innumber. These birds occupy two of the lake’s easternislands, and fly in flocks preying on tilapia.
Mozambique tilapia, although receiving adeclining welcome from the people, still provides asufficient source of protein for communities. One ofthe main reasons the lake communities want an alter-native species is more marketable fish, as Mozam-bique tilapia is regarded as a low-grade fish. Fishersprefer a much larger species than tilapia. This per-haps is one of the reasons why there are currently nomanagement measures in place and fishing is on anopen-access basis. Ramohia and Oreihaka (1995)(unpubl.) concluded that anoxic conditions at thebottom of the lake could have been stirred up duringcyclones, resulting in mass death and retardedgrowth of fish. They further suspected that the per-ceived decreasing size and abundance of fish could
be due to the increasing use of gill-nets, and a resultof growth and over fishing. The results of Survey 4regarding stock and size have indicated a recoveringabundance and size, and could well mean that theanoxic conditions have now been reduced and theuse of nets decreased due to the associated costs.
Conclusion
The current tilapia species in Lake Tegano is alreadyproviding a major protein source for the communitiesaround the lake. Despite the great potential that maybe available for aquaculture development in andaround the lake, much is yet to be done to fullyunderstand the lake ecosystem. The impacts of intro-ducing a new species to the lake must be investigated,as from experience elsewhere, introductions in thehope that they will be beneficial have not alwaysended up as intended. In this respect, another optionis to look at the feasibility of exploring alternativeresources already available in the lake, such as eelsand prawns.
Acknowledgments
I would like to thank my colleagues, Michelle Lamfor carrying out Surveys 2 and 3, Peter Ramohia forassisting in Survey 1 and Obed Awaohu in Survey 4,for their enthusiasm. The Australian Centre for Inter-national Agricultural Research and the CoastalAquaculture Centre of the International Centre forLiving Aquatic Resources Management funded andcollaborated in Survey 4. The Provincial FisheriesOfficer of Rennell and Bellona Province, JobTogaga, has been very supportive. To you all I owemuch gratitude.
References
Leary, T. 1994. Country Report: Solomon Islands. In:Scott, D.A. ed. A Directory of Wetlands in Oceania,International Waterfowl and Wetlands Research Bureau,UK, 331–361.
Kile, M.L. 1996. Water sampling survey of Lake Tegano,Rennell Island, Rennell and Bellona Province, FisheriesDivision (unpubl.).
Ramohia, P.C. and Oreihaka, E. 1995. A brief investigationinto the Tilapia (Oreochromis mossambicus) Fishery andassociated problems in Lake Tegano, Rennell Island,Rennell and Bellona Province. Fisheries Division(unpubl.).
Wolff, T. 1970. The Natural History of Rennell Island,Danish Scientfic Press, Copenhagen, 7 vols.

71
Is Lak Lake Overfished?
Thai Ngoc Chien, J.D. Sollows, Nguyen Quoc An, Phan Dinh Phuc, Nguyen Quoc Nghi and Truong Ha Phuong
Abstract
Fish yields from Lak Lake increased by 2.3% between August 1997 and July 1999, and landedvalue by 14.1%. However, the status of the Lak fishery is highly species-specific, amounting to anestimated annual yield of 126–130 kg/ha. Over two years of surveys, the study has identified 40 fishspecies from catches in the lake. Fourteen major species accounted for an estimated 89.2% of thetotal yield over the two years. Six major gears account for most of the catch from Lak: fence-nets,gill-nets, long-lines, lift-nets, shrimp traps, and electrofishing gear. Data on the effects of electro-fishing have not been possible to collect, as electrofishing is now banned. Gill-nets and fence-netsaccounted for a total of 84% of the entire recorded yield, and probably put excessive pressure onsome species. While overall yield and landed value from the lake have not declined, species diversityand the abundance of native fish species appear to be reduced. Restrictions on increases in fence-and gill-netting, especially the use of small mesh sizes, appear advisable. Electrofishing, which ishighly non-selective, should be discouraged, and efforts made to encourage the cooperation of thefishing community in adopting measures to assure yield sustainability.
LAK LAKE has a reported area of 658 ha, the largeststanding natural water body of Dak Lak Province,Vietnam. There is roughly 1 m difference betweennormal high and low water levels. Lak is shallow,with maximum depth of about 3 m at times of highwater. Long-time fishers report that the lake isbecoming increasingly shallow, and deforestationand landslides add to natural siltation. Thesephenomena represent the greatest threat to the lakeand its fishery.
The stream draining the lake flows about 3 kmthrough flat country to the Krong Ana River, themain tributary of Srepok. Every year or two, at timesof high flood, the Krong Ana flows back into Lak. Atsuch times, the catchment area of the lake increasesfrom 108 km2 to 3370 km2. This backflow adds tothe sediment load of the lake, but in the short termpositively affects fish production. Flooded land liber-ates nutrients, and gives fish increased area forgrowth and reproduction.
The study has identified 40 fish species from LakLake as of November, 1999. The high species
diversity can be explained by several factors: it is anatural lake, with fauna already adapted to lacustrineconditions; an abundant growth of macrophytesprovides refuges, substrates, and feed to differentspecies; occasional back-flooding by the Krong AnaRiver also recharges some components of the lake’sfauna.
The original human inhabitants of the area belongto the M’nong ethnic group, who have fished thelake with a variety of traps, spears, long-lines, scoopnets, and since the 1950s, gill-nets. With increasingimmigration through the 1980s, the use of gill-netsand lift-nets increased substantially. Seining com-menced in the early 1990s, and from 1994, when thedistrict police took over licensing, up to 15 small-mesh seines were permitted to operate. In early 1997,when the Board for the Preservation of History,Culture and Environment of Lak took over manage-ment, seining was banned.
Fishers noticed an increase in the abundance ofshrimp from the mid-1990s, possibly because of thedecline in predatory species. Fence-nets were intro-duced in 1994, and have become very popular.Shrimp traps, a more selective gear, were introducedin 1995; they are less common than fence-nets andremain important.
Management of Reservoir Fisheries, 69 Le Hong Phong,Ban Me Thuat, Vietnam. Email [email protected]
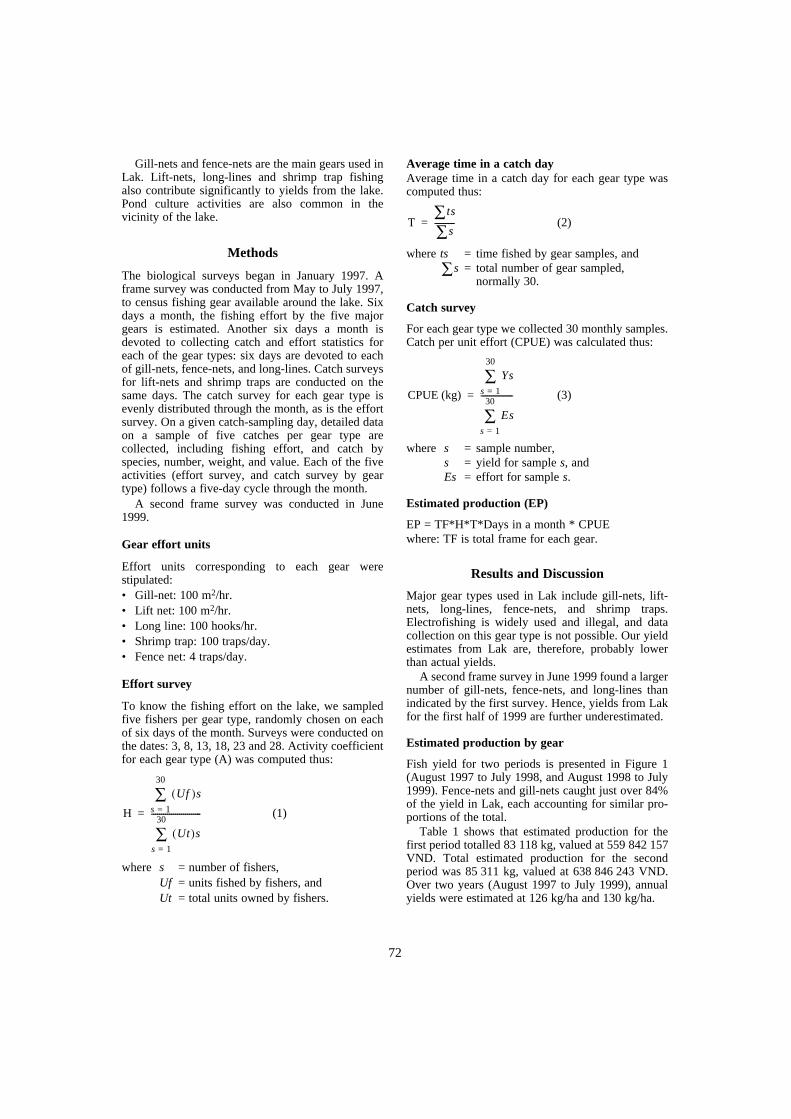
72
Gill-nets and fence-nets are the main gears used inLak. Lift-nets, long-lines and shrimp trap fishingalso contribute significantly to yields from the lake.Pond culture activities are also common in thevicinity of the lake.
Methods
The biological surveys began in January 1997. Aframe survey was conducted from May to July 1997,to census fishing gear available around the lake. Sixdays a month, the fishing effort by the five majorgears is estimated. Another six days a month isdevoted to collecting catch and effort statistics foreach of the gear types: six days are devoted to eachof gill-nets, fence-nets, and long-lines. Catch surveysfor lift-nets and shrimp traps are conducted on thesame days. The catch survey for each gear type isevenly distributed through the month, as is the effortsurvey. On a given catch-sampling day, detailed dataon a sample of five catches per gear type arecollected, including fishing effort, and catch byspecies, number, weight, and value. Each of the fiveactivities (effort survey, and catch survey by geartype) follows a five-day cycle through the month.
A second frame survey was conducted in June1999.
Gear effort units
Effort units corresponding to each gear werestipulated:• Gill-net: 100 m2/hr.• Lift net: 100 m2/hr.• Long line: 100 hooks/hr.• Shrimp trap: 100 traps/day.• Fence net: 4 traps/day.
Effort survey
To know the fishing effort on the lake, we sampledfive fishers per gear type, randomly chosen on eachof six days of the month. Surveys were conducted onthe dates: 3, 8, 13, 18, 23 and 28. Activity coefficientfor each gear type (A) was computed thus:
(1)
where s = number of fishers,Uf = units fished by fishers, andUt = total units owned by fishers.
Average time in a catch dayAverage time in a catch day for each gear type wascomputed thus:
(2)
where ts = time fished by gear samples, and= total number of gear sampled,
normally 30.
Catch survey
For each gear type we collected 30 monthly samples.Catch per unit effort (CPUE) was calculated thus:
(3)
where s = sample number,s = yield for sample s, andEs = effort for sample s.
Estimated production (EP)
EP = TF*H*T*Days in a month * CPUEwhere: TF is total frame for each gear.
Results and Discussion
Major gear types used in Lak include gill-nets, lift-nets, long-lines, fence-nets, and shrimp traps.Electrofishing is widely used and illegal, and datacollection on this gear type is not possible. Our yieldestimates from Lak are, therefore, probably lowerthan actual yields.
A second frame survey in June 1999 found a largernumber of gill-nets, fence-nets, and long-lines thanindicated by the first survey. Hence, yields from Lakfor the first half of 1999 are further underestimated.
Estimated production by gear
Fish yield for two periods is presented in Figure 1(August 1997 to July 1998, and August 1998 to July1999). Fence-nets and gill-nets caught just over 84%of the yield in Lak, each accounting for similar pro-portions of the total.
Table 1 shows that estimated production for thefirst period totalled 83 118 kg, valued at 559 842 157VND. Total estimated production for the secondperiod was 85 311 kg, valued at 638 846 243 VND.Over two years (August 1997 to July 1999), annualyields were estimated at 126 kg/ha and 130 kg/ha.
H
Uf( )ss 1=
30
∑
Ut( )ss 1=
30
∑-------------------------=
Tts∑s∑
----------=
s∑
CPUE (kg)
Yss 1=
30
∑
Ess 1=
30
∑----------------=

73
Note: 1USD = 13 000 VND on average.
Figure 1. Estimated production by gear over two periods, August 1997–September 1999.
Table 1. Production trends for two 12-month periods.
Parameters Year (Aug–July) Yield/value % of total Changes (%)
Total production (kg) Production (kg) 1997–98 83 118.00 100 +2.31998–99 85 311.00 100
Values (VND) 1997–98 559 842 157.00 100 +14.01998–99 638 846 243.00 100
Stocked fish Production (kg) 1997–98 947.20. 1.14 +393.01998–99 4 672.00 5.48
Values (VND) 1997–98 9 513 800.00 1.70 +323.01998–99 40 212 000.00 6.29
Introduced fish (self-recruiting) Production (kg) 1997–98 14 387.07 17.31 +7.71998–99 15 501.20 18.17
Values (VND) 1997–98 95 669 733.33 17.09 +36.01998–99 130 536 900.00 20.43
Shrimp Production (kg) 1997–98 18 746.00 22.55 +36.01998–99 25 510.00 29.90
Values (VND) 1997–98 179 352 367.00 32.04 +46.01998–99 261 406 733.00 40.92
Native fish Production (kg) 1997–98 49 037.39 59.00 −19.01998–99 39 627.55 46.45
Value (VND) 1997–98 275 306 256.67 49.18 −25.01998–99 206 690 610.00 32.35
8/97–7/98 8/98–7/99
kg
100 000
80 000
60 000
40 000
20 000
0
Gill nets Fence nets Lift nets Shrimp traps Long lines Total
8/97–7/98
8/98–7/99
37 404
30 875
31 382
42 178
7095
3001
3897
6251
3339
3005
83 118
85 311

74
Estimated yields increased by 2.3% between thetwo periods, and estimated landed value by 14.1%. Asmall portion of this increase, beginning in July1999, is thought to be due to the application of theresults of a new frame survey. However, it isstrongly suspected that any increases are due mainlyto the heavy flooding of November 1998.
The performances of various species differgreatly. Yields of all commonly cultured speciesaround the lake (which includes the stocked andintroduced species) were higher for the later period:the November 1998 flooding allowed culturedspecies to escape from ponds around the lake.Annual catch per unit effort (CPUE) for thesespecies increased by 35.8% between the two yearsunder consideration (Figure 2).
Yield of shrimp, which has a high price, rose36.0% from 18 746 kg to 25 509 kg. Yields of nativespecies dropped by about 19.0%, from 49 036 kg to39 628 kg. Many lift-nets were damaged by the floodof November 1998. Some fishers were discouragedfrom using shrimp traps by their high price, shortlifetime and high labour demand.
The changes in CPUE suggest that economic pres-sure may discourage further increases in fishingeffort by gill-nets and long-lines (Table 2). The majorspecies which showed decline in abundance were allnative: Osteochilus hasselti, Notopterus notopterus,O. schlengeli, Hampala macrolepidota, Rasbora sp.,Ompok bimaculatus and Mystus nemurus (Table 3).Examination of CPUE trends and catch–effortrelationship for the gears to which these species aremost vulnerable sheds more light on the situation. Itwould be desirable to have a longer time-series ofdata on which to base the following discussion.
Nevertheless, the data suggest some managementdirections.
Featherback (Notopterus notopterus)
Annual estimated yields of featherback declinedabout 6.4% from 8239 kg to 7708 kg over the reportperiod. Nevertheless, it ranked second in landedvolume during the second year considered here.While the species has been reported from all majorgears except shrimp traps, 52.1% of the yield isreported from gill-nets, 35.6% from long-lines, and10.5% from fence-nets. Hence the effects of all thesegears require some consideration.
Catch per unit effort trends (Figure 3) indicate asimilar phenomenon: overall CPUE for gill-nets andfence-nets dropped by 16.4% and 33%, respectively,between the two gears, that for long-lines dropped by41%. Mean harvested weight over the period forlong-lines, gill-nets, and fence-nets were 65 g, 52 gand 47g, respectively. Harvested sizes appear to bedeclining slowly, at least for long-lines.
Table 2. Fishing effort and CPUE trends for the twoperiods.
Gears Change in effort (%).
Change in CPUE (%).
Fence-nets +27.8 +5.2Gill-nets +19.0 −30.6Shrimp traps –0.9 +61.9Long-lines +52.0 −40.8Lift-nets –63.6 +16.3
Figure 2. Yields of commonly cultured fish species in Lak, August 1997–July 1999.
Yie
ld (
kg)
1200
1000
800
600
400
200
0
Common Carp
Silver Carp
Grass Carp
Aug
-97
Sep
-97
Oct
-97
Nov
-97
Dec
-97
Jan-
98
Feb
-98
Mar
-98
Apr
-98
May
-98
Jun-
98
Jul-9
8
Aug
-98
Sep
-98
Oct
-98
Nov
-98
Dec
-98
Jan-
99
Feb
-99
Mar
-99
Apr
-99
May
-99
Jun-
99
Jul-9
9
Month
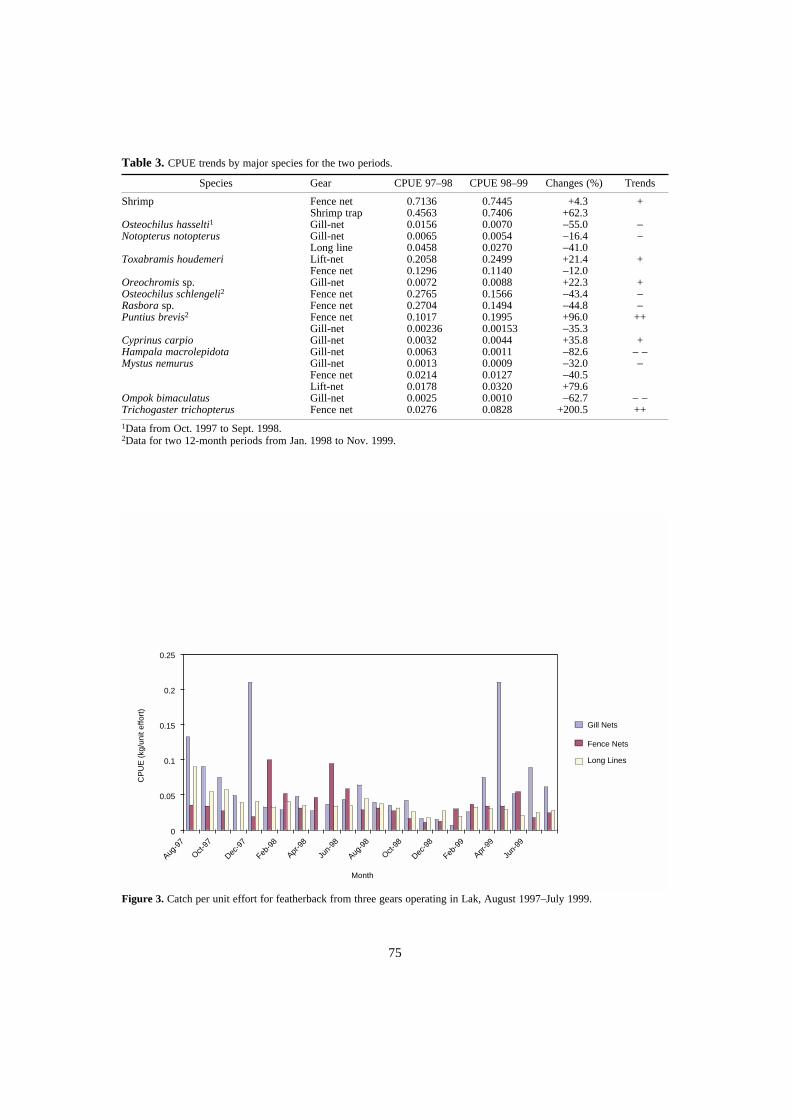
75
1Data from Oct. 1997 to Sept. 1998.2Data for two 12-month periods from Jan. 1998 to Nov. 1999.
Figure 3. Catch per unit effort for featherback from three gears operating in Lak, August 1997–July 1999.
Table 3. CPUE trends by major species for the two periods.
Species Gear CPUE 97–98 CPUE 98–99 Changes (%) Trends
Shrimp Fence net 0.7136 0.7445 +4.3 +Shrimp trap 0.4563 0.7406 +62.3
Osteochilus hasselti1 Gill-net 0.0156 0.0070 −55.0 −Notopterus notopterus Gill-net 0.0065 0.0054 −16.4 −
Long line 0.0458 0.0270 −41.0Toxabramis houdemeri Lift-net 0.2058 0.2499 +21.4 +
Fence net 0.1296 0.1140 −12.0Oreochromis sp. Gill-net 0.0072 0.0088 +22.3 +Osteochilus schlengeli2 Fence net 0.2765 0.1566 −43.4 −Rasbora sp. Fence net 0.2704 0.1494 −44.8 −Puntius brevis2 Fence net 0.1017 0.1995 +96.0 ++
Gill-net 0.00236 0.00153 −35.3Cyprinus carpio Gill-net 0.0032 0.0044 +35.8 +Hampala macrolepidota Gill-net 0.0063 0.0011 −82.6 − −Mystus nemurus Gill-net 0.0013 0.0009 −32.0 −
Fence net 0.0214 0.0127 −40.5Lift-net 0.0178 0.0320 +79.6
Ompok bimaculatus Gill-net 0.0025 0.0010 −62.7 − −Trichogaster trichopterus Fence net 0.0276 0.0828 +200.5 ++
Gill Nets
Fence Nets
Long Lines
0.25
0.2
0.15
0.1
0.05
0
CP
UE
(kg
/uni
t effo
rt)
Aug-9
7
Oct-97
Dec-9
7
Feb-9
8
Apr-9
8
Jun-
98
Aug-9
8
Oct-98
Dec-9
8
Feb-9
9
Apr-9
9
Jun-
99
Month
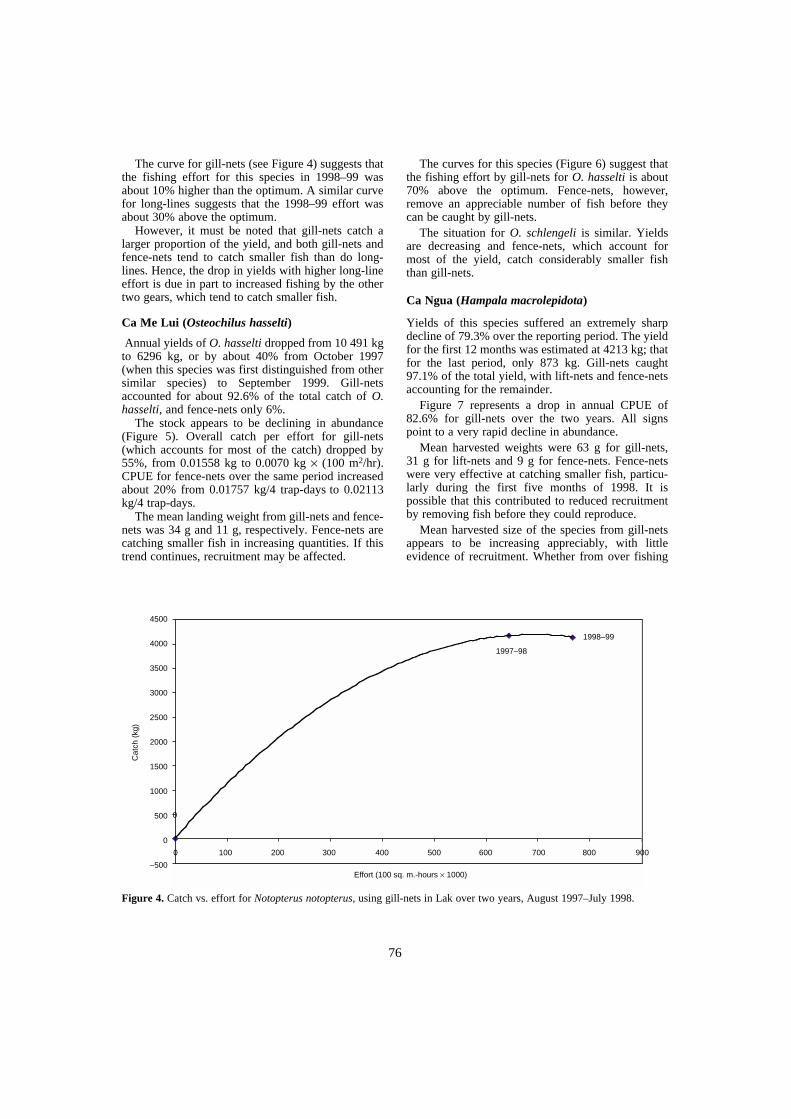
76
The curve for gill-nets (see Figure 4) suggests thatthe fishing effort for this species in 1998–99 wasabout 10% higher than the optimum. A similar curvefor long-lines suggests that the 1998–99 effort wasabout 30% above the optimum.
However, it must be noted that gill-nets catch alarger proportion of the yield, and both gill-nets andfence-nets tend to catch smaller fish than do long-lines. Hence, the drop in yields with higher long-lineeffort is due in part to increased fishing by the othertwo gears, which tend to catch smaller fish.
Ca Me Lui (Osteochilus hasselti)
Annual yields of O. hasselti dropped from 10 491 kgto 6296 kg, or by about 40% from October 1997(when this species was first distinguished from othersimilar species) to September 1999. Gill-netsaccounted for about 92.6% of the total catch of O.hasselti, and fence-nets only 6%.
The stock appears to be declining in abundance(Figure 5). Overall catch per effort for gill-nets(which accounts for most of the catch) dropped by55%, from 0.01558 kg to 0.0070 kg × (100 m2/hr).CPUE for fence-nets over the same period increasedabout 20% from 0.01757 kg/4 trap-days to 0.02113kg/4 trap-days.
The mean landing weight from gill-nets and fence-nets was 34 g and 11 g, respectively. Fence-nets arecatching smaller fish in increasing quantities. If thistrend continues, recruitment may be affected.
The curves for this species (Figure 6) suggest thatthe fishing effort by gill-nets for O. hasselti is about70% above the optimum. Fence-nets, however,remove an appreciable number of fish before theycan be caught by gill-nets.
The situation for O. schlengeli is similar. Yieldsare decreasing and fence-nets, which account formost of the yield, catch considerably smaller fishthan gill-nets.
Ca Ngua (Hampala macrolepidota)
Yields of this species suffered an extremely sharpdecline of 79.3% over the reporting period. The yieldfor the first 12 months was estimated at 4213 kg; thatfor the last period, only 873 kg. Gill-nets caught97.1% of the total yield, with lift-nets and fence-netsaccounting for the remainder.
Figure 7 represents a drop in annual CPUE of82.6% for gill-nets over the two years. All signspoint to a very rapid decline in abundance.
Mean harvested weights were 63 g for gill-nets,31 g for lift-nets and 9 g for fence-nets. Fence-netswere very effective at catching smaller fish, particu-larly during the first five months of 1998. It ispossible that this contributed to reduced recruitmentby removing fish before they could reproduce.
Mean harvested size of the species from gill-netsappears to be increasing appreciably, with littleevidence of recruitment. Whether from over fishing
Figure 4. Catch vs. effort for Notopterus notopterus, using gill-nets in Lak over two years, August 1997–July 1998.
100
4500
4000
3500
3000
2500
2000
1500
1000
500
0
−500
Cat
ch (
kg)
200 300 400 500 600 700 800 9000
0
1997–98
1998–99
Effort (100 sq. m.-hours × 1000)
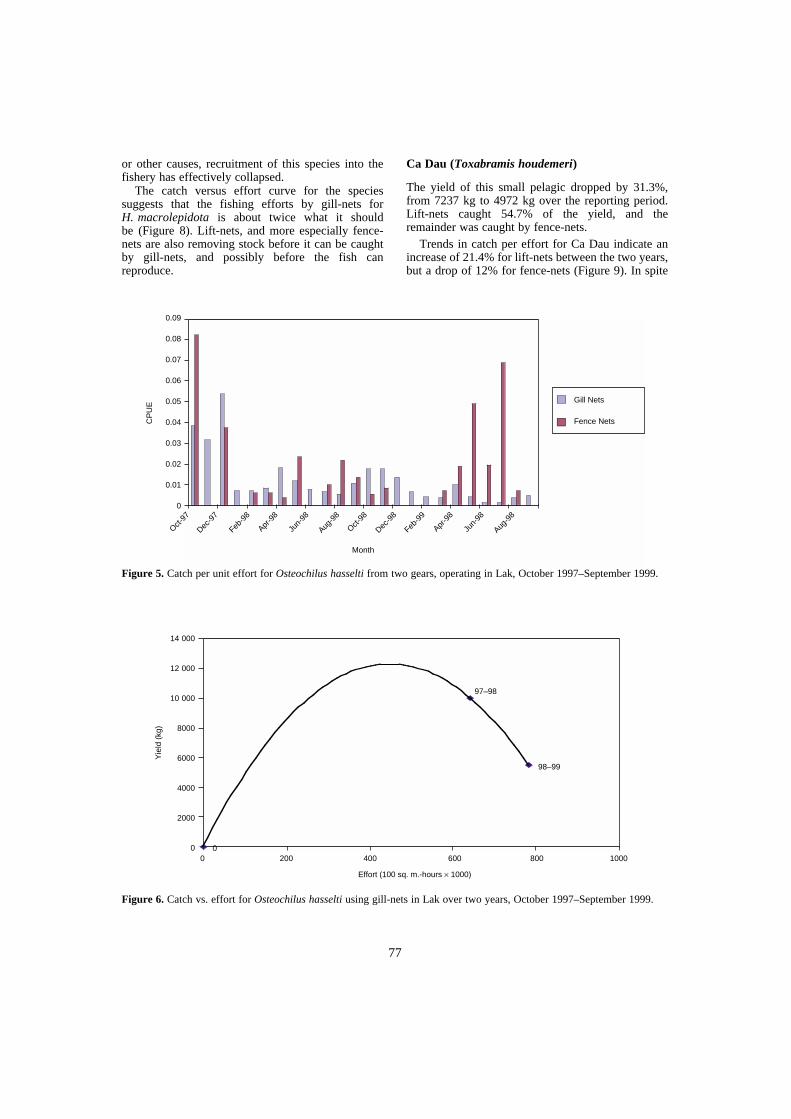
77
or other causes, recruitment of this species into thefishery has effectively collapsed.
The catch versus effort curve for the speciessuggests that the fishing efforts by gill-nets forH. macrolepidota is about twice what it shouldbe (Figure 8). Lift-nets, and more especially fence-nets are also removing stock before it can be caughtby gill-nets, and possibly before the fish canreproduce.
Ca Dau (Toxabramis houdemeri)
The yield of this small pelagic dropped by 31.3%,from 7237 kg to 4972 kg over the reporting period.Lift-nets caught 54.7% of the yield, and theremainder was caught by fence-nets.
Trends in catch per effort for Ca Dau indicate anincrease of 21.4% for lift-nets between the two years,but a drop of 12% for fence-nets (Figure 9). In spite
Figure 5. Catch per unit effort for Osteochilus hasselti from two gears, operating in Lak, October 1997–September 1999.
Figure 6. Catch vs. effort for Osteochilus hasselti using gill-nets in Lak over two years, October 1997–September 1999.
Gill Nets
Fence Nets
0.09
0.08
0.07
0.06
0.05
0.04
0.03
0.02
0.01
0
CP
UE
Oct-97
Dec-9
7
Feb-9
8
Apr-9
8
Jun-
98
Aug-9
8
Oct-98
Dec-9
8
Feb-9
9
Apr-9
8
Jun-
98
Aug-9
8
Month
00
200 400 600 800 1000
14 000
12 000
10 000
8000
6000
4000
2000
0
Yie
ld (
kg)
Effort (100 sq. m.-hours × 1000)
97–98
98–99
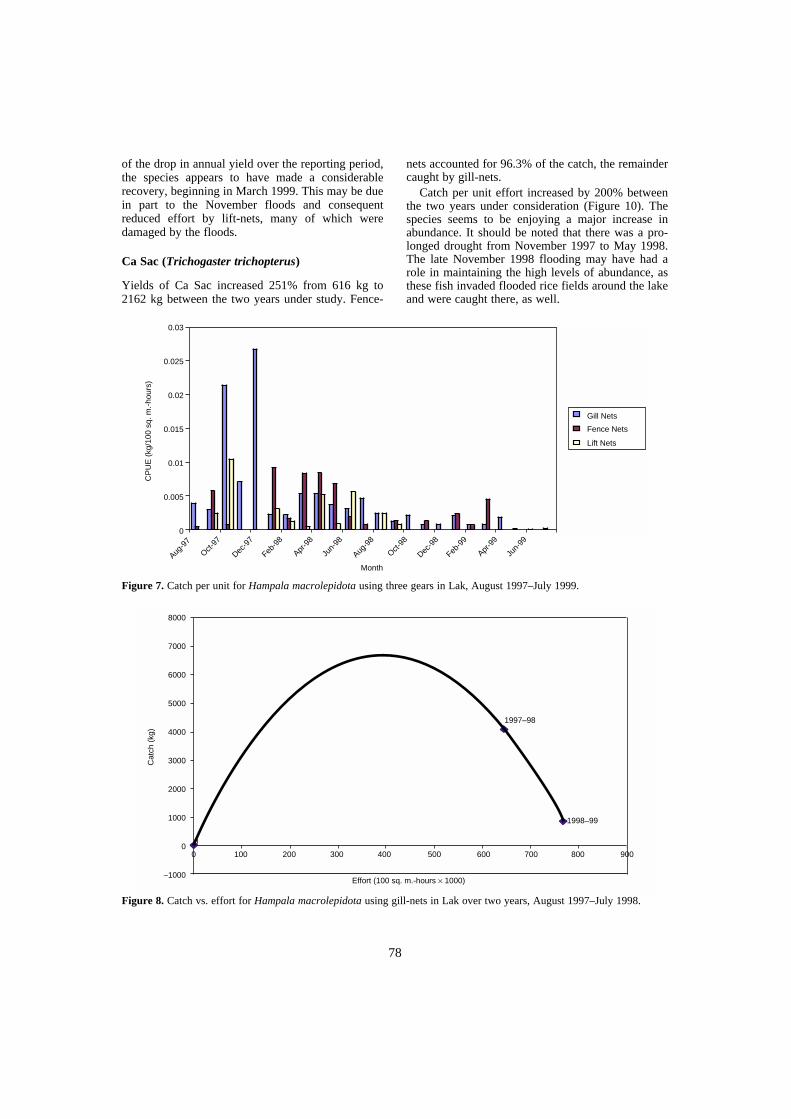
78
of the drop in annual yield over the reporting period,the species appears to have made a considerablerecovery, beginning in March 1999. This may be duein part to the November floods and consequentreduced effort by lift-nets, many of which weredamaged by the floods.
Ca Sac (Trichogaster trichopterus)
Yields of Ca Sac increased 251% from 616 kg to2162 kg between the two years under study. Fence-
nets accounted for 96.3% of the catch, the remaindercaught by gill-nets.
Catch per unit effort increased by 200% betweenthe two years under consideration (Figure 10). Thespecies seems to be enjoying a major increase inabundance. It should be noted that there was a pro-longed drought from November 1997 to May 1998.The late November 1998 flooding may have had arole in maintaining the high levels of abundance, asthese fish invaded flooded rice fields around the lakeand were caught there, as well.
Figure 7. Catch per unit for Hampala macrolepidota using three gears in Lak, August 1997–July 1999.
Figure 8. Catch vs. effort for Hampala macrolepidota using gill-nets in Lak over two years, August 1997–July 1998.
Gill Nets
Fence Nets
Lift Nets
0.03
0.025
0.02
0.015
0.01
0.005
0
CP
UE
(kg
/100
sq.
m.-
hour
s)
Aug-9
7
Oct-97
Dec-9
7
Feb-9
8
Apr-9
8
Jun-
98
Aug-9
8
Oct-98
Dec-9
8
Feb-9
9
Apr-9
9
Jun-
99
Month
800 9007006005004003002001000
8000
7000
6000
5000
4000
3000
2000
1000
0
−1000Effort (100 sq. m.-hours × 1000)
Cat
ch (
kg)
1997–98
1998–99
0
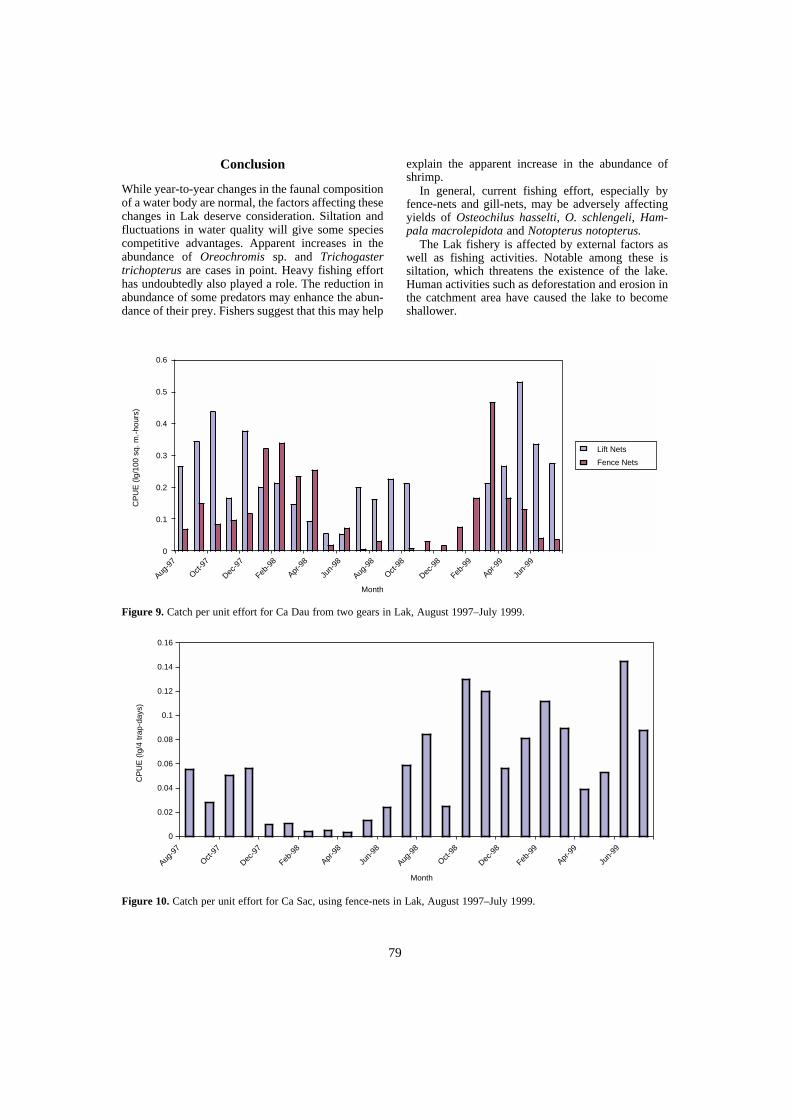
79
Conclusion
While year-to-year changes in the faunal compositionof a water body are normal, the factors affecting thesechanges in Lak deserve consideration. Siltation andfluctuations in water quality will give some speciescompetitive advantages. Apparent increases in theabundance of Oreochromis sp. and Trichogastertrichopterus are cases in point. Heavy fishing efforthas undoubtedly also played a role. The reduction inabundance of some predators may enhance the abun-dance of their prey. Fishers suggest that this may help
explain the apparent increase in the abundance ofshrimp.
In general, current fishing effort, especially byfence-nets and gill-nets, may be adversely affectingyields of Osteochilus hasselti, O. schlengeli, Ham-pala macrolepidota and Notopterus notopterus.
The Lak fishery is affected by external factors aswell as fishing activities. Notable among these issiltation, which threatens the existence of the lake.Human activities such as deforestation and erosion inthe catchment area have caused the lake to becomeshallower.
Figure 9. Catch per unit effort for Ca Dau from two gears in Lak, August 1997–July 1999.
Figure 10. Catch per unit effort for Ca Sac, using fence-nets in Lak, August 1997–July 1999.
Lift Nets
Fence Nets
CP
UE
(lg
/100
sq.
m.-
hour
s)
0.6
0.5
0.4
0.3
0.2
0.1
0
Aug-9
7
Oct-97
Dec-9
7
Feb-9
8
Apr-9
8
Jun-
98
Aug-9
8
Oct-98
Dec-9
8
Feb-9
9
Apr-9
9
Jun-
99
Month
CP
UE
(lg
/4 tr
ap-d
ays)
0.16
0.14
0.12
0.1
0.08
0.06
0.04
0.02
0
Aug-9
7
Oct-97
Dec-9
7
Feb-9
8
Apr-9
8
Jun-
98
Aug-9
8
Oct-98
Dec-9
8
Feb-9
9
Apr-9
9
Jun-
99
Month
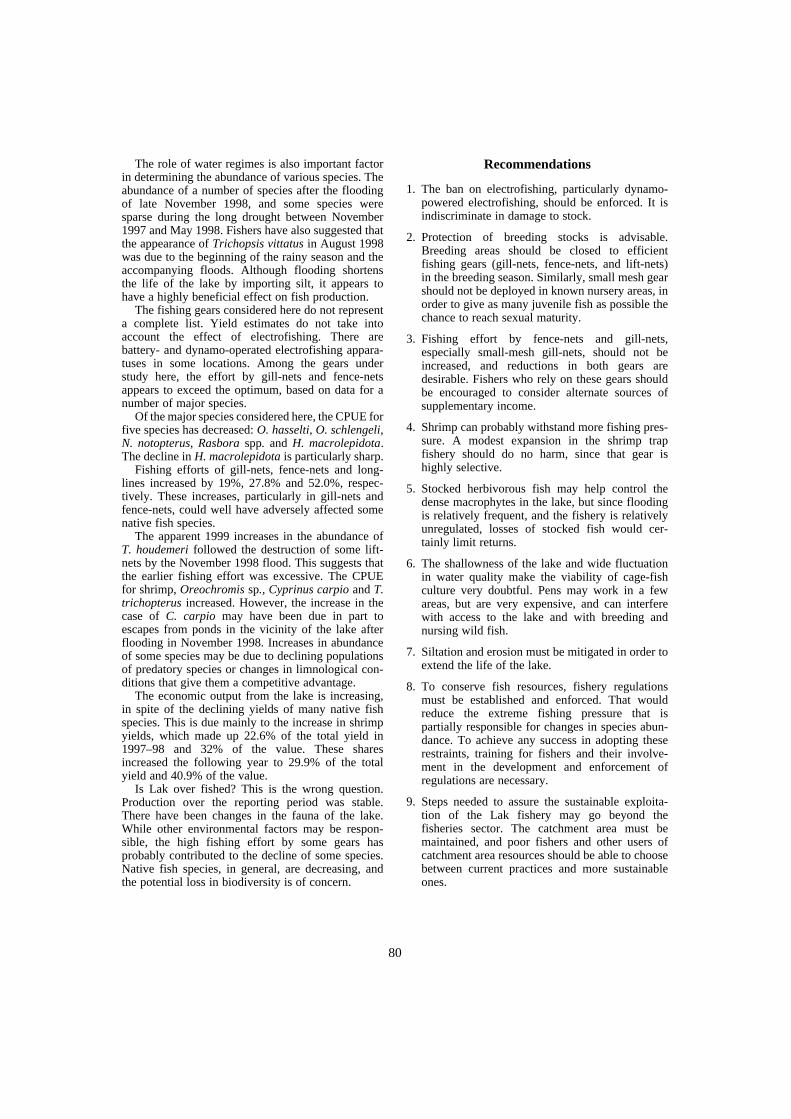
80
The role of water regimes is also important factorin determining the abundance of various species. Theabundance of a number of species after the floodingof late November 1998, and some species weresparse during the long drought between November1997 and May 1998. Fishers have also suggested thatthe appearance of Trichopsis vittatus in August 1998was due to the beginning of the rainy season and theaccompanying floods. Although flooding shortensthe life of the lake by importing silt, it appears tohave a highly beneficial effect on fish production.
The fishing gears considered here do not representa complete list. Yield estimates do not take intoaccount the effect of electrofishing. There arebattery- and dynamo-operated electrofishing appara-tuses in some locations. Among the gears understudy here, the effort by gill-nets and fence-netsappears to exceed the optimum, based on data for anumber of major species.
Of the major species considered here, the CPUE forfive species has decreased: O. hasselti, O. schlengeli,N. notopterus, Rasbora spp. and H. macrolepidota.The decline in H. macrolepidota is particularly sharp.
Fishing efforts of gill-nets, fence-nets and long-lines increased by 19%, 27.8% and 52.0%, respec-tively. These increases, particularly in gill-nets andfence-nets, could well have adversely affected somenative fish species.
The apparent 1999 increases in the abundance ofT. houdemeri followed the destruction of some lift-nets by the November 1998 flood. This suggests thatthe earlier fishing effort was excessive. The CPUEfor shrimp, Oreochromis sp., Cyprinus carpio and T.trichopterus increased. However, the increase in thecase of C. carpio may have been due in part toescapes from ponds in the vicinity of the lake afterflooding in November 1998. Increases in abundanceof some species may be due to declining populationsof predatory species or changes in limnological con-ditions that give them a competitive advantage.
The economic output from the lake is increasing,in spite of the declining yields of many native fishspecies. This is due mainly to the increase in shrimpyields, which made up 22.6% of the total yield in1997–98 and 32% of the value. These sharesincreased the following year to 29.9% of the totalyield and 40.9% of the value.
Is Lak over fished? This is the wrong question.Production over the reporting period was stable.There have been changes in the fauna of the lake.While other environmental factors may be respon-sible, the high fishing effort by some gears hasprobably contributed to the decline of some species.Native fish species, in general, are decreasing, andthe potential loss in biodiversity is of concern.
Recommendations
1. The ban on electrofishing, particularly dynamo-powered electrofishing, should be enforced. It isindiscriminate in damage to stock.
2. Protection of breeding stocks is advisable.Breeding areas should be closed to efficientfishing gears (gill-nets, fence-nets, and lift-nets)in the breeding season. Similarly, small mesh gearshould not be deployed in known nursery areas, inorder to give as many juvenile fish as possible thechance to reach sexual maturity.
3. Fishing effort by fence-nets and gill-nets,especially small-mesh gill-nets, should not beincreased, and reductions in both gears aredesirable. Fishers who rely on these gears shouldbe encouraged to consider alternate sources ofsupplementary income.
4. Shrimp can probably withstand more fishing pres-sure. A modest expansion in the shrimp trapfishery should do no harm, since that gear ishighly selective.
5. Stocked herbivorous fish may help control thedense macrophytes in the lake, but since floodingis relatively frequent, and the fishery is relativelyunregulated, losses of stocked fish would cer-tainly limit returns.
6. The shallowness of the lake and wide fluctuationin water quality make the viability of cage-fishculture very doubtful. Pens may work in a fewareas, but are very expensive, and can interferewith access to the lake and with breeding andnursing wild fish.
7. Siltation and erosion must be mitigated in order toextend the life of the lake.
8. To conserve fish resources, fishery regulationsmust be established and enforced. That wouldreduce the extreme fishing pressure that ispartially responsible for changes in species abun-dance. To achieve any success in adopting theserestraints, training for fishers and their involve-ment in the development and enforcement ofregulations are necessary.
9. Steps needed to assure the sustainable exploita-tion of the Lak fishery may go beyond thefisheries sector. The catchment area must bemaintained, and poor fishers and other users ofcatchment area resources should be able to choosebetween current practices and more sustainableones.

81
An Assessment of the Fisheries of Four Stocked Reservoirs in the Central Highlands of Vietnam
Tran Thanh Viet, Do Tinh Loi, Nguyen Ngoc Vinh, Phan Dinh Phuc,Phan Thuong Huy, Thai Ngoc Chien, Nguyen Quoc An and
J.D. Sollows*
Abstract
Stocking and capture results are considered for four reservoirs ranging in area from 5.37 to210 ha in Dak Lak Province, in the Central Highlands of Vietnam. In all reservoirs, the fish yieldis dominated by regularly stocked species, which make up 71.9–99.8% of the total yield over theeight reservoir harvesting years considered. Stocking proved highly cost-effective in most cases.Returns for silver carp were particularly high. Preliminary recommendations with respect tostocking density and size are given, to the extent possible. Every reservoir is unique, and the mostappropriate recommendations are therefore reservoir-specific. In general, smaller reservoirs havehigher carrying capacity per hectare than larger ones, but other factors also affect the recom-mendations. The importance and composition of self-recruiting species are cases in point. Theuniqueness of each reservoir was brought out by a study of catch versus effort, which indicated thatcaution is needed in making broad recommendations. The apparent optimal effort suggested bydata combined from three reservoirs could be inapplicable in particular water bodies. Further datafrom continued surveys are needed to generate robust recommendations with regard to stockingand appropriate effort levels for particular reservoirs.
THE Central Highlands of Vietnam have rich soil andtwo seasons, rainy and dry, annually. The highlandregion has about 500 reservoirs, most built after 1975,ranging in acreage from one to 6400 ha (MoF 1995).
The indigenous freshwater fish fauna consist ofabout 150 species (similar to Mekong and Red Riverfish fauna) and include mainly riverine and marsh-dwelling forms. A report of the Ministry of Fisheries(1995) identified 47 species in reservoirs, but theactual number is greater. The inland reservoirfisheries of the Central Highlands have developedrelatively recently and depend largely on exoticspecies. Seven species have been introduced into thereservoirs, including silver carp, bighead carp, grasscarp, common carp, tilapia, rohu and mrigal. Theestablishment and the success of the exotic specieshave been considered a major reason for the develop-ment of inland fishery in the Central Highlands. But
fish yields and catch composition from differentwater bodies are quite different, depending onvarious factors including geological history, catch-ment, water resource management, exploitation andstocking density.
The project for management of reservoir fisherieshas been conducting studies in six water bodies inDak Lak Province in the Central Highlands. Fieldactivities began in 1996, and all were covered bymid-1997. Physical data on the water bodies areshown in Table 1.
The figures are based on data from Dak LakWater Resource Scheme and SWAP in Dak LakProvince. All water bodies have similar geographicaland climate regimes. Ea Kao, Yang Re, Ea Kar andHo 31 are regularly stocked. Stocking data for thereservoirs are given in Table 2.
Fingerlings for these reservoirs were suppliedfrom hatcheries in Dak Lak and Ho Chi Minh City(about 400 km away). Managers of reservoirs haveto choose species and density for stocking reservoirs,considering the cost of fingerlings, fish availabilityand recapture rate.
*Management of Reservoir Fisheries, 68 Le Hong Phong,Ban Me Thuot, Vietnam. Email: [email protected]
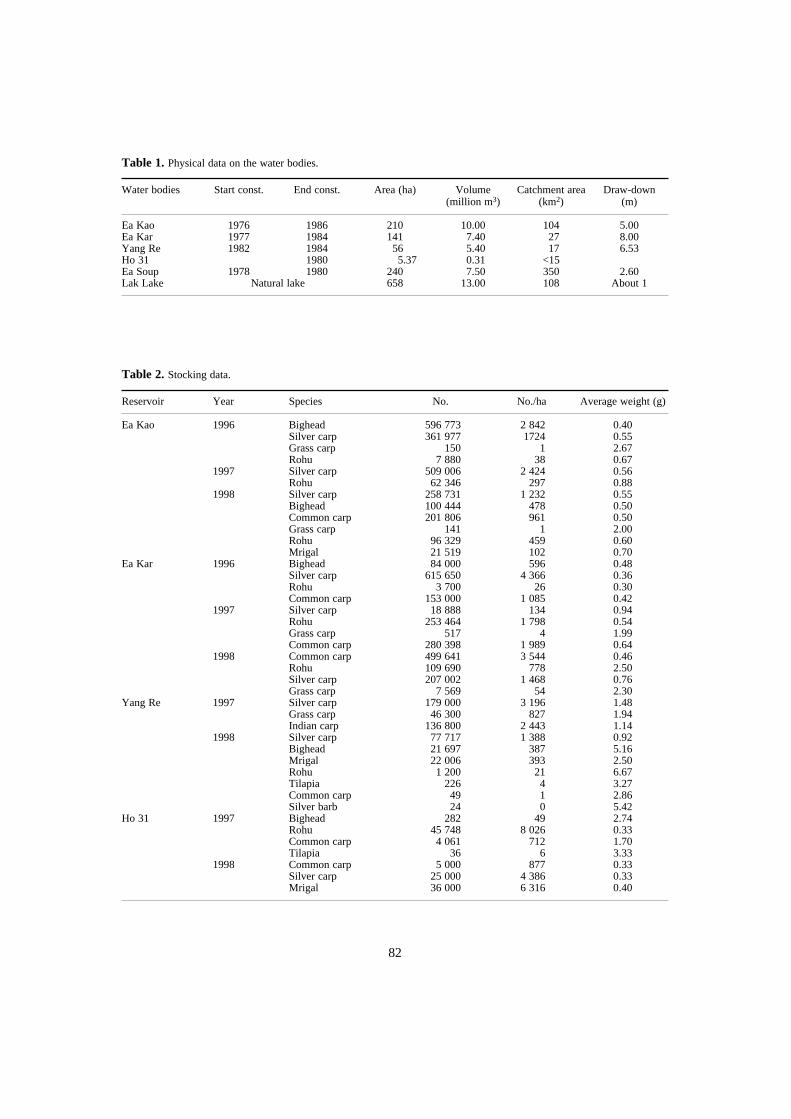
82
Table 1. Physical data on the water bodies.
Water bodies Start const. End const. Area (ha) Volume(million m3)
Catchment area (km2)
Draw-down(m)
Ea Kao 1976 1986 210 10.00 104 5.00Ea Kar 1977 1984 141 7.40 27 8.00Yang Re 1982 1984 56 5.40 17 6.53Ho 31 1980 5.37 0.31 <15Ea Soup 1978 1980 240 7.50 350 2.60Lak Lake Natural lake 658 13.00 108 About 1
Table 2. Stocking data.
Reservoir Year Species No. No./ha Average weight (g)
Ea Kao 1996 Bighead 596 773 2 842 0.40Silver carp 361 977 1724 0.55Grass carp 150 1 2.67Rohu 7 880 38 0.67
1997 Silver carp 509 006 2 424 0.56Rohu 62 346 297 0.88
1998 Silver carp 258 731 1 232 0.55Bighead 100 444 478 0.50Common carp 201 806 961 0.50Grass carp 141 1 2.00Rohu 96 329 459 0.60Mrigal 21 519 102 0.70
Ea Kar 1996 Bighead 84 000 596 0.48Silver carp 615 650 4 366 0.36Rohu 3 700 26 0.30Common carp 153 000 1 085 0.42
1997 Silver carp 18 888 134 0.94Rohu 253 464 1 798 0.54Grass carp 517 4 1.99Common carp 280 398 1 989 0.64
1998 Common carp 499 641 3 544 0.46Rohu 109 690 778 2.50Silver carp 207 002 1 468 0.76Grass carp 7 569 54 2.30
Yang Re 1997 Silver carp 179 000 3 196 1.48Grass carp 46 300 827 1.94Indian carp 136 800 2 443 1.14
1998 Silver carp 77 717 1 388 0.92Bighead 21 697 387 5.16Mrigal 22 006 393 2.50Rohu 1 200 21 6.67Tilapia 226 4 3.27Common carp 49 1 2.86Silver barb 24 0 5.42
Ho 31 1997 Bighead 282 49 2.74Rohu 45 748 8 026 0.33Common carp 4 061 712 1.70Tilapia 36 6 3.33
1998 Common carp 5 000 877 0.33Silver carp 25 000 4 386 0.33Mrigal 36 000 6 316 0.40
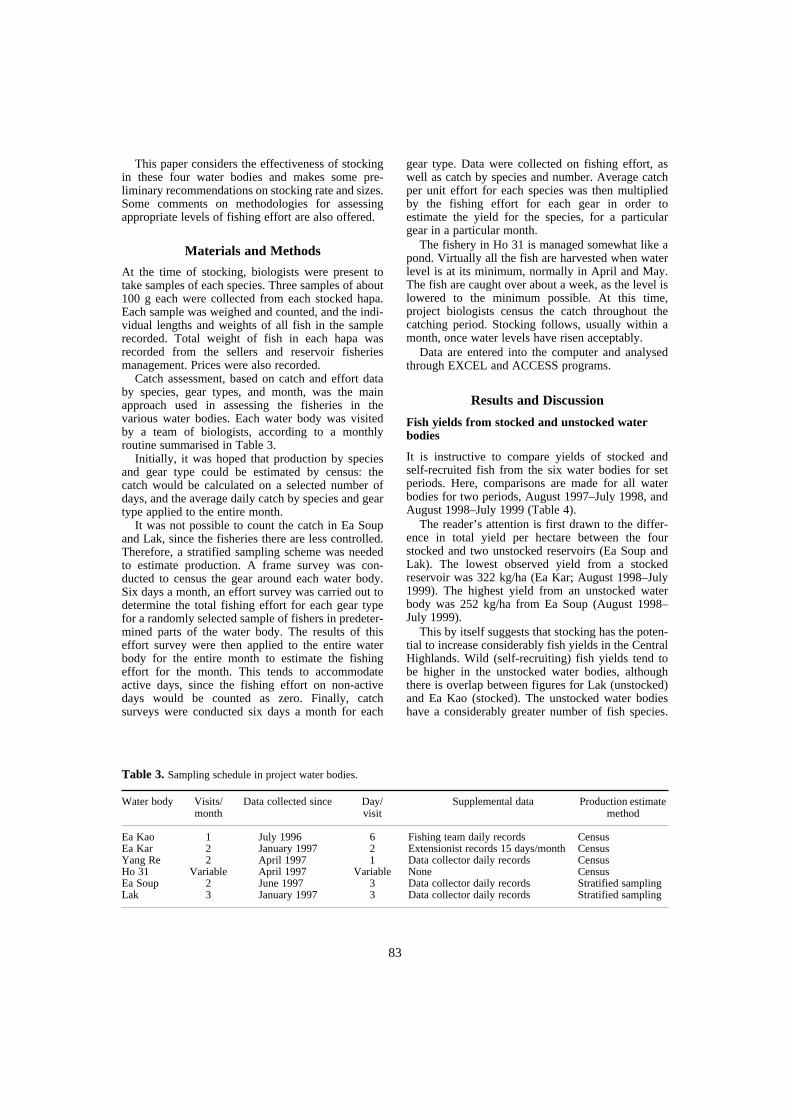
83
This paper considers the effectiveness of stockingin these four water bodies and makes some pre-liminary recommendations on stocking rate and sizes.Some comments on methodologies for assessingappropriate levels of fishing effort are also offered.
Materials and Methods
At the time of stocking, biologists were present totake samples of each species. Three samples of about100 g each were collected from each stocked hapa.Each sample was weighed and counted, and the indi-vidual lengths and weights of all fish in the samplerecorded. Total weight of fish in each hapa wasrecorded from the sellers and reservoir fisheriesmanagement. Prices were also recorded.
Catch assessment, based on catch and effort databy species, gear types, and month, was the mainapproach used in assessing the fisheries in thevarious water bodies. Each water body was visitedby a team of biologists, according to a monthlyroutine summarised in Table 3.
Initially, it was hoped that production by speciesand gear type could be estimated by census: thecatch would be calculated on a selected number ofdays, and the average daily catch by species and geartype applied to the entire month.
It was not possible to count the catch in Ea Soupand Lak, since the fisheries there are less controlled.Therefore, a stratified sampling scheme was neededto estimate production. A frame survey was con-ducted to census the gear around each water body.Six days a month, an effort survey was carried out todetermine the total fishing effort for each gear typefor a randomly selected sample of fishers in predeter-mined parts of the water body. The results of thiseffort survey were then applied to the entire waterbody for the entire month to estimate the fishingeffort for the month. This tends to accommodateactive days, since the fishing effort on non-activedays would be counted as zero. Finally, catchsurveys were conducted six days a month for each
gear type. Data were collected on fishing effort, aswell as catch by species and number. Average catchper unit effort for each species was then multipliedby the fishing effort for each gear in order toestimate the yield for the species, for a particulargear in a particular month.
The fishery in Ho 31 is managed somewhat like apond. Virtually all the fish are harvested when waterlevel is at its minimum, normally in April and May.The fish are caught over about a week, as the level islowered to the minimum possible. At this time,project biologists census the catch throughout thecatching period. Stocking follows, usually within amonth, once water levels have risen acceptably.
Data are entered into the computer and analysedthrough EXCEL and ACCESS programs.
Results and Discussion
Fish yields from stocked and unstocked water bodies
It is instructive to compare yields of stocked andself-recruited fish from the six water bodies for setperiods. Here, comparisons are made for all waterbodies for two periods, August 1997–July 1998, andAugust 1998–July 1999 (Table 4).
The reader’s attention is first drawn to the differ-ence in total yield per hectare between the fourstocked and two unstocked reservoirs (Ea Soup andLak). The lowest observed yield from a stockedreservoir was 322 kg/ha (Ea Kar; August 1998–July1999). The highest yield from an unstocked waterbody was 252 kg/ha from Ea Soup (August 1998–July 1999).
This by itself suggests that stocking has the poten-tial to increase considerably fish yields in the CentralHighlands. Wild (self-recruiting) fish yields tend tobe higher in the unstocked water bodies, althoughthere is overlap between figures for Lak (unstocked)and Ea Kao (stocked). The unstocked water bodieshave a considerably greater number of fish species.
Table 3. Sampling schedule in project water bodies.
Water body Visits/month
Data collected since Day/visit
Supplemental data Production estimate method
Ea Kao 1 July 1996 6 Fishing team daily records CensusEa Kar 2 January 1997 2 Extensionist records 15 days/month CensusYang Re 2 April 1997 1 Data collector daily records CensusHo 31 Variable April 1997 Variable None CensusEa Soup 2 June 1997 3 Data collector daily records Stratified samplingLak 3 January 1997 3 Data collector daily records Stratified sampling
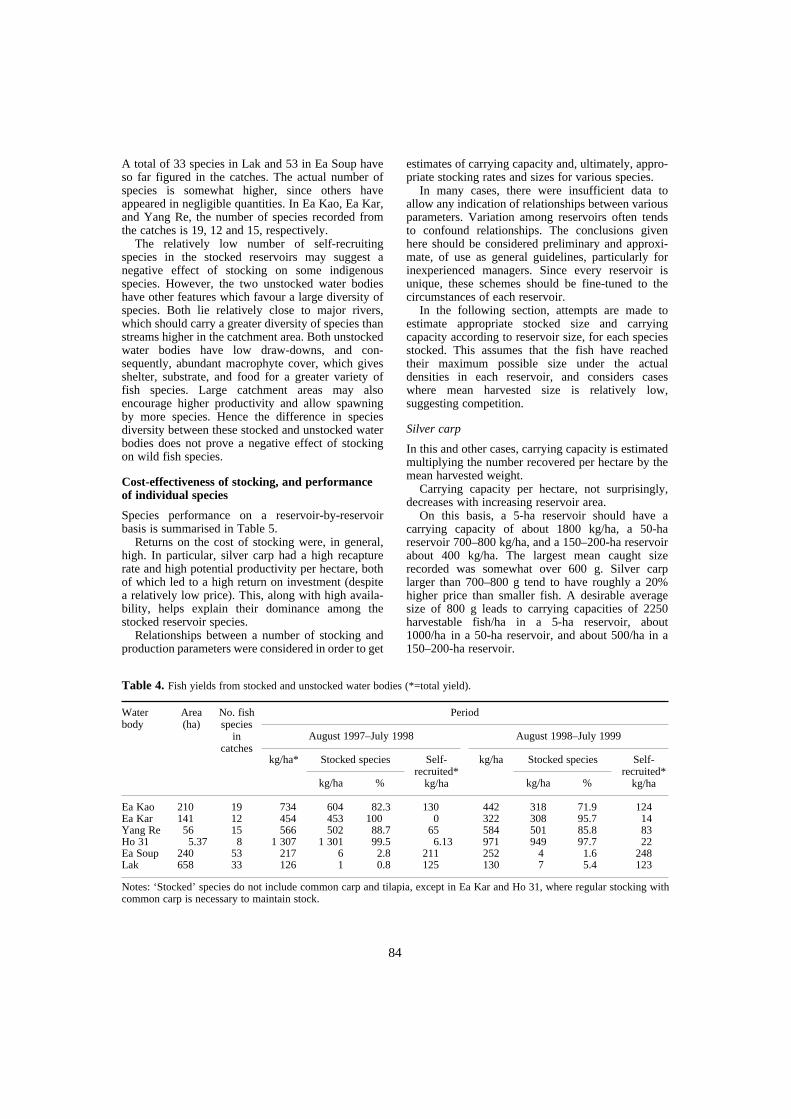
84
A total of 33 species in Lak and 53 in Ea Soup haveso far figured in the catches. The actual number ofspecies is somewhat higher, since others haveappeared in negligible quantities. In Ea Kao, Ea Kar,and Yang Re, the number of species recorded fromthe catches is 19, 12 and 15, respectively.
The relatively low number of self-recruitingspecies in the stocked reservoirs may suggest anegative effect of stocking on some indigenousspecies. However, the two unstocked water bodieshave other features which favour a large diversity ofspecies. Both lie relatively close to major rivers,which should carry a greater diversity of species thanstreams higher in the catchment area. Both unstockedwater bodies have low draw-downs, and con-sequently, abundant macrophyte cover, which givesshelter, substrate, and food for a greater variety offish species. Large catchment areas may alsoencourage higher productivity and allow spawningby more species. Hence the difference in speciesdiversity between these stocked and unstocked waterbodies does not prove a negative effect of stockingon wild fish species.
Cost-effectiveness of stocking, and performance of individual species
Species performance on a reservoir-by-reservoirbasis is summarised in Table 5.
Returns on the cost of stocking were, in general,high. In particular, silver carp had a high recapturerate and high potential productivity per hectare, bothof which led to a high return on investment (despitea relatively low price). This, along with high availa-bility, helps explain their dominance among thestocked reservoir species.
Relationships between a number of stocking andproduction parameters were considered in order to get
estimates of carrying capacity and, ultimately, appro-priate stocking rates and sizes for various species.
In many cases, there were insufficient data toallow any indication of relationships between variousparameters. Variation among reservoirs often tendsto confound relationships. The conclusions givenhere should be considered preliminary and approxi-mate, of use as general guidelines, particularly forinexperienced managers. Since every reservoir isunique, these schemes should be fine-tuned to thecircumstances of each reservoir.
In the following section, attempts are made toestimate appropriate stocked size and carryingcapacity according to reservoir size, for each speciesstocked. This assumes that the fish have reachedtheir maximum possible size under the actualdensities in each reservoir, and considers caseswhere mean harvested size is relatively low,suggesting competition.
Silver carp
In this and other cases, carrying capacity is estimatedmultiplying the number recovered per hectare by themean harvested weight.
Carrying capacity per hectare, not surprisingly,decreases with increasing reservoir area.
On this basis, a 5-ha reservoir should have acarrying capacity of about 1800 kg/ha, a 50-hareservoir 700–800 kg/ha, and a 150–200-ha reservoirabout 400 kg/ha. The largest mean caught sizerecorded was somewhat over 600 g. Silver carplarger than 700–800 g tend to have roughly a 20%higher price than smaller fish. A desirable averagesize of 800 g leads to carrying capacities of 2250harvestable fish/ha in a 5-ha reservoir, about1000/ha in a 50-ha reservoir, and about 500/ha in a150–200-ha reservoir.
Notes: ‘Stocked’ species do not include common carp and tilapia, except in Ea Kar and Ho 31, where regular stocking withcommon carp is necessary to maintain stock.
Table 4. Fish yields from stocked and unstocked water bodies (*=total yield).
Water body
Area (ha)
No. fish species
in catches
Period
August 1997–July 1998 August 1998–July 1999
kg/ha* Stocked species Self-recruited*
kg/ha
kg/ha Stocked species Self-recruited*
kg/hakg/ha % kg/ha %
Ea Kao 210 19 734 604 82.3 130 442 318 71.9 124Ea Kar 141 12 454 453 100 0 322 308 95.7 14Yang Re 56 15 566 502 88.7 65 584 501 85.8 83Ho 31 5.37 8 1 307 1 301 99.5 6.13 971 949 97.7 22Ea Soup 240 53 217 6 2.8 211 252 4 1.6 248Lak 658 33 126 1 0.8 125 130 7 5.4 123
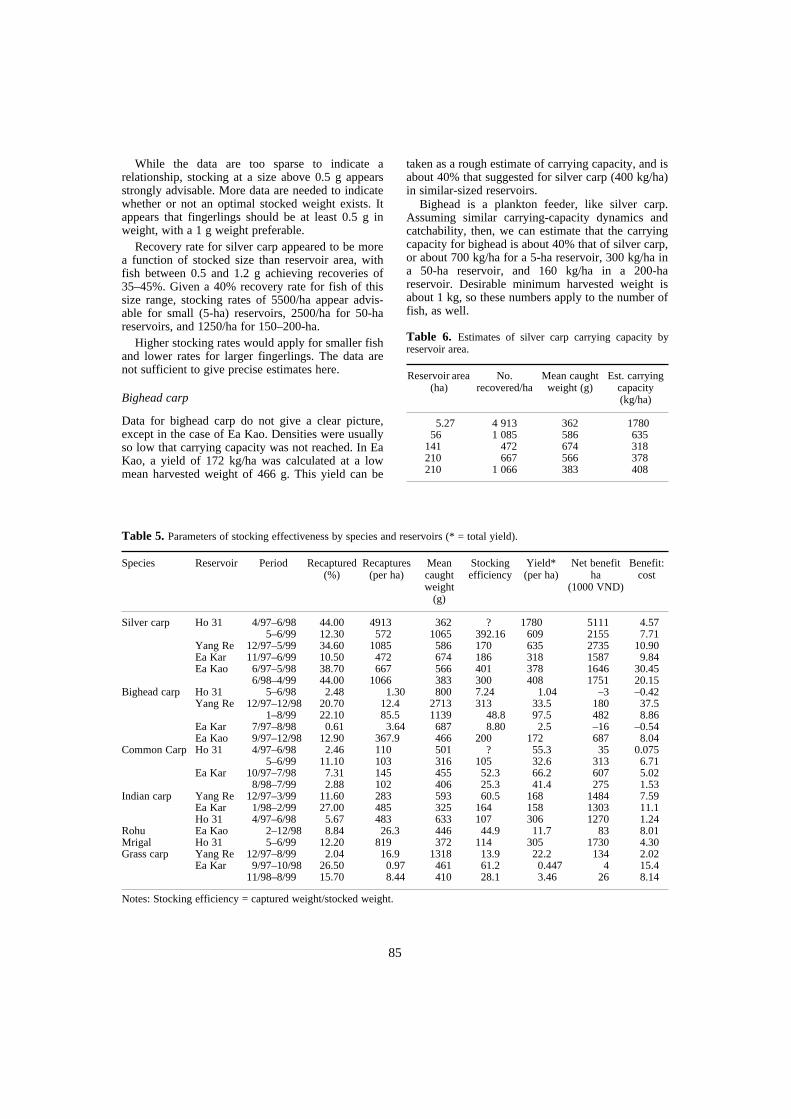
85
While the data are too sparse to indicate arelationship, stocking at a size above 0.5 g appearsstrongly advisable. More data are needed to indicatewhether or not an optimal stocked weight exists. Itappears that fingerlings should be at least 0.5 g inweight, with a 1 g weight preferable.
Recovery rate for silver carp appeared to be morea function of stocked size than reservoir area, withfish between 0.5 and 1.2 g achieving recoveries of35–45%. Given a 40% recovery rate for fish of thissize range, stocking rates of 5500/ha appear advis-able for small (5-ha) reservoirs, 2500/ha for 50-hareservoirs, and 1250/ha for 150–200-ha.
Higher stocking rates would apply for smaller fishand lower rates for larger fingerlings. The data arenot sufficient to give precise estimates here.
Bighead carp
Data for bighead carp do not give a clear picture,except in the case of Ea Kao. Densities were usuallyso low that carrying capacity was not reached. In EaKao, a yield of 172 kg/ha was calculated at a lowmean harvested weight of 466 g. This yield can be
taken as a rough estimate of carrying capacity, and isabout 40% that suggested for silver carp (400 kg/ha)in similar-sized reservoirs.
Bighead is a plankton feeder, like silver carp.Assuming similar carrying-capacity dynamics andcatchability, then, we can estimate that the carryingcapacity for bighead is about 40% that of silver carp,or about 700 kg/ha for a 5-ha reservoir, 300 kg/ha ina 50-ha reservoir, and 160 kg/ha in a 200-hareservoir. Desirable minimum harvested weight isabout 1 kg, so these numbers apply to the number offish, as well.
Table 6. Estimates of silver carp carrying capacity byreservoir area.
Reservoir area (ha)
No. recovered/ha
Mean caught weight (g)
Est. carrying capacity (kg/ha)
5.27 4 913 362 178056 1 085 586 635
141 472 674 318210 667 566 378210 1 066 383 408
Notes: Stocking efficiency = captured weight/stocked weight.
Table 5. Parameters of stocking effectiveness by species and reservoirs (* = total yield).
Species Reservoir Period Recaptured(%)
Recaptures (per ha)
Mean caught weight
(g)
Stocking efficiency
Yield* (per ha)
Net benefit ha
(1000 VND)
Benefit: cost
Silver carp Ho 31 4/97–6/98 44.00 4913 362 ? 1780 5111 4.575–6/99 12.30 572 1065 392.16 609 2155 7.71
Yang Re 12/97–5/99 34.60 1085 586 170 635 2735 10.90Ea Kar 11/97–6/99 10.50 472 674 186 318 1587 9.84Ea Kao 6/97–5/98 38.70 667 566 401 378 1646 30.45
6/98–4/99 44.00 1066 383 300 408 1751 20.15Bighead carp Ho 31 5–6/98 2.48 1.30 800 7.24 1.04 –3 –0.42
Yang Re 12/97–12/98 20.70 12.4 2713 313 33.5 180 37.51–8/99 22.10 85.5 1139 48.8 97.5 482 8.86
Ea Kar 7/97–8/98 0.61 3.64 687 8.80 2.5 –16 –0.54Ea Kao 9/97–12/98 12.90 367.9 466 200 172 687 8.04
Common Carp Ho 31 4/97–6/98 2.46 110 501 ? 55.3 35 0.0755–6/99 11.10 103 316 105 32.6 313 6.71
Ea Kar 10/97–7/98 7.31 145 455 52.3 66.2 607 5.028/98–7/99 2.88 102 406 25.3 41.4 275 1.53
Indian carp Yang Re 12/97–3/99 11.60 283 593 60.5 168 1484 7.59Ea Kar 1/98–2/99 27.00 485 325 164 158 1303 11.1Ho 31 4/97–6/98 5.67 483 633 107 306 1270 1.24
Rohu Ea Kao 2–12/98 8.84 26.3 446 44.9 11.7 83 8.01Mrigal Ho 31 5–6/99 12.20 819 372 114 305 1730 4.30Grass carp Yang Re 12/97–8/99 2.04 16.9 1318 13.9 22.2 134 2.02
Ea Kar 9/97–10/98 26.50 0.97 461 61.2 0.447 4 15.411/98–8/99 15.70 8.44 410 28.1 3.46 26 8.14
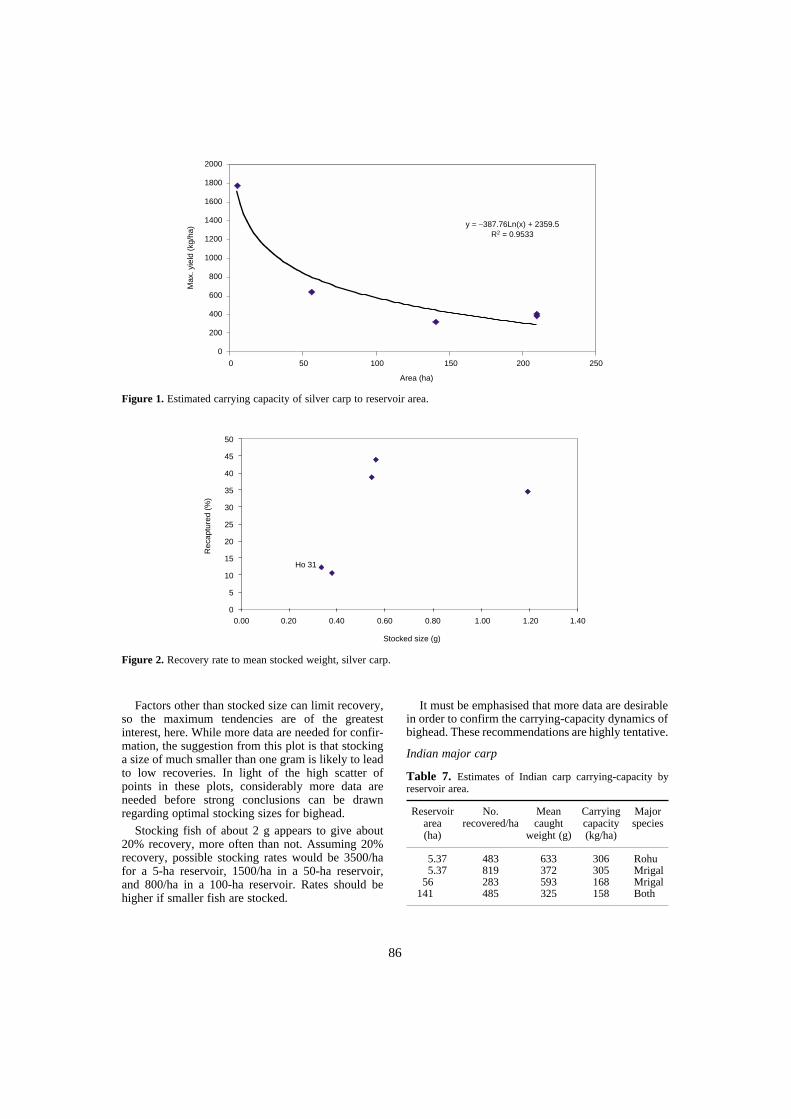
86
Factors other than stocked size can limit recovery,so the maximum tendencies are of the greatestinterest, here. While more data are needed for confir-mation, the suggestion from this plot is that stockinga size of much smaller than one gram is likely to leadto low recoveries. In light of the high scatter ofpoints in these plots, considerably more data areneeded before strong conclusions can be drawnregarding optimal stocking sizes for bighead.
Stocking fish of about 2 g appears to give about20% recovery, more often than not. Assuming 20%recovery, possible stocking rates would be 3500/hafor a 5-ha reservoir, 1500/ha in a 50-ha reservoir,and 800/ha in a 100-ha reservoir. Rates should behigher if smaller fish are stocked.
It must be emphasised that more data are desirablein order to confirm the carrying-capacity dynamics ofbighead. These recommendations are highly tentative.
Indian major carp
Table 7. Estimates of Indian carp carrying-capacity byreservoir area.
Reservoir area(ha)
No. recovered/ha
Mean caught
weight (g)
Carrying capacity (kg/ha)
Major species
5.37 483 633 306 Rohu5.37 819 372 305 Mrigal
56 283 593 168 Mrigal141 485 325 158 Both
Figure 1. Estimated carrying capacity of silver carp to reservoir area.
Figure 2. Recovery rate to mean stocked weight, silver carp.
0 50 100 150 200 250
Area (ha)
Max
. yie
ld (
kg/h
a)
2000
1800
1600
1400
1200
1000
800
600
400
200
0
y = −387.76Ln(x) + 2359.5R2 = 0.9533
50
45
40
35
30
25
20
15
10
5
0
Rec
aptu
red
(%)
0.00 0.20 0.40 0.60 0.80 1.00 1.20 1.40
Stocked size (g)
Ho 31
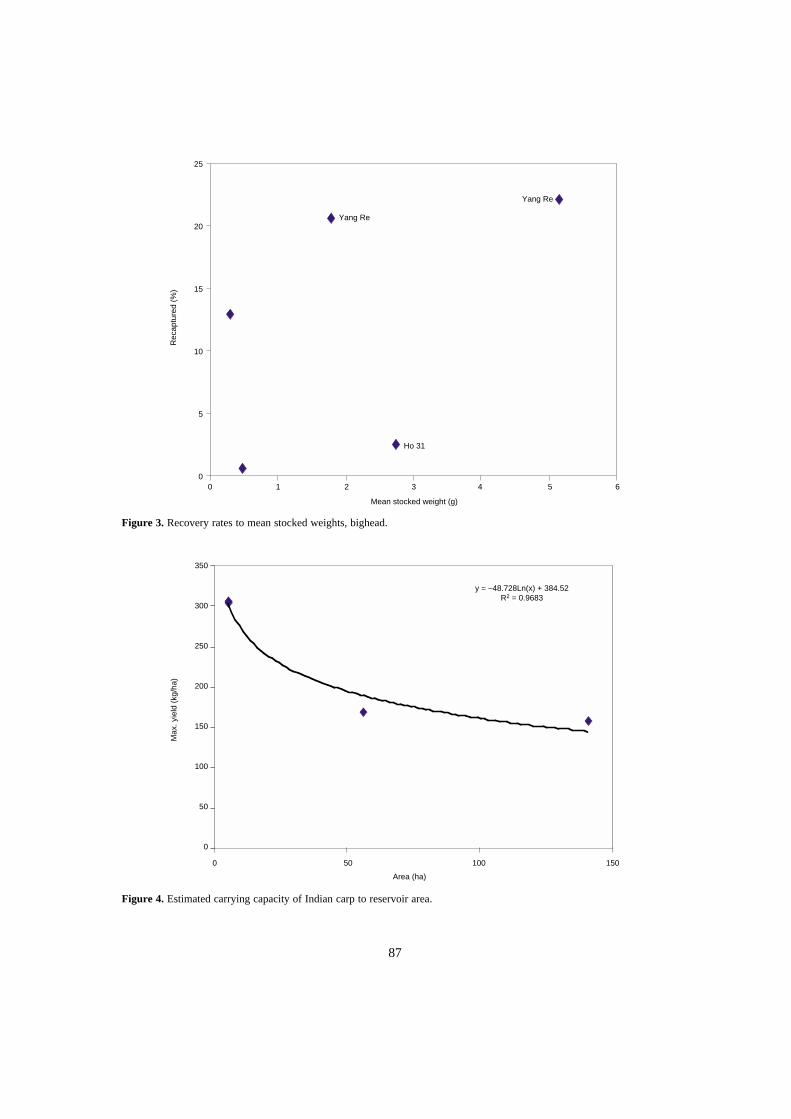
87
Figure 3. Recovery rates to mean stocked weights, bighead.
Figure 4. Estimated carrying capacity of Indian carp to reservoir area.
Rec
aptu
red
(%)
25
20
15
10
5
00 1 2 3 4 5 6
Mean stocked weight (g)
Ho 31
Yang Re
Yang Re
350
300
250
200
150
100
50
0
Max
. yie
ld (
kg/h
a)
0 50 100 150
Area (ha)
y = −48.728Ln(x) + 384.52R2 = 0.9683

88
The paucity of available data makes this plot not veryhelpful. The smallest mean harvested weight wasabout 325 g (Table 7). If this is taken to representcarrying-capacity of the reservoir in question, then150–200 ha reservoirs can be taken to have a carryingcapacity of about 150 kg/ha. Fish caught in Yang Reaveraged considerably larger (593 g) and a carryingcapacity of 200 kg/ha for 50-ha reservoirs is a reason-able first guess, on that basis. A capacity of 300 kg/haappears to apply in 5-ha reservoirs like Ho 31, at leastfor mrigal. That for rohu may be slightly higher. If amean caught size of 500 g is preferred, then thenumber of fish recovered should not exceed 300/hafor larger reservoirs, 400/ha for 50-ha reservoirs, and500/ha for 5-ha reservoirs.
The data indicated no relationship betweenrecovery rate and stocked size. Given an averageobserved recovery rate of about 15%, a stocking rateof 2000/ha for larger reservoirs seems advised,assuming a stocking size in the 0.5–1 g range.Stocking rates of up to 4000/ha should be workablein smaller reservoirs.
Two factors confound these analyses.It would be desirable to partition this stocking rate
between rohu and mrigal, but there are insufficientdata to allow it and the two species are sometimesnot distinguished at stocking. This stocking rateshould be considered applicable to a combination ofboth species, with an advisable rate for either speciesalone at half to three-quarters this level.
The presence of common carp also appears toaffect the carrying capacity of the reservoir for
Indian carp, especially mrigal. When common carpand mrigal are both present in high densities, growthof both species tends to suffer. Common carp tendsto have a higher price and is usually self-recruiting.Hence, if it is an important species in the reservoir,mrigal should be stocked only incidentally.
The presence of substantial numbers of tilapia orindigenous species could similarly affect appropriatestocking levels for Indian major carp.
Common carp
Common carp were stocked in only two of thereservoirs under study, Ho 31 and Ea Kar. In Ea Kar,natural recruitment is also strongly suspected of con-tributing to production. Very low water levels inearly 1998 might have had adverse effects on recruit-ment of the Ea Kar 1988–99 cohort. Competitionwith Indian major carp, especially mrigal, probablyalso has an effect on growth and production of thatspecies. Rohu dominated the Indian carp catch in thefirst year under consideration, for both reservoirs. Inthe second year, mrigal were predominant. Hence,the reduced growth and production of common carpobserved in the second year in both reservoirs areprobably due in part to competition with mrigal.
Recoveries of common carp tended to be low, butso were stocking sizes. Stocking sizes of at least onegram should be tested.
Grass carp
This species is sporadically stocked, typically at verylow densities. The three larger reservoirs have very
Table 8. Catch by gear type.
Gear type Ea Kao Ea Kar Yang Re
Period4/97–3/98
(%) Period4/98–3/99
(%) Period4/97–3/98
(%) Period4/98–3/99
(%) Period4/97–3/98
(%) Period4/98–3/99
(%)
Bottom covered 248 0.16 1 807 1.49Integrated 39 948 26.53 7 090 5.85Trap catch 56 0.04 0 0 22 0.25 47 0.10Cast net 838 0.56 0 0Lighted net 0 0 295 0.24 12 0.03 1 389 2.55Long–line 0 0 172 0.14 215 2.49Rod and line 25 0.02 0 0 38 0.44Trammel net 131 0.09 0 0 1 527 3.28Seine net 15 615 10.37 3 358 2.77 223 0.48Fence-net 54 0.04 0 0Gill–net 23 288 15.47 16 457 13.58 34 503 73.67 39 607 72.66 7 050 81.68 13 389 28.77Lift–net 70 374 46.74 91 962 75.91 12 322 26.31 13 514 24.79 1 252 14.50 31 351 67.37Electrofishing 55 0.64
Total 150 577 100.00 121 140 100.00 46 837 100.00 54 510 100.00 8 632 100.00 46 536 100.00
89
limited macrophyte growth, probably the result ofhigh draw-down, so carrying capacity for this specieswas very limited.
Different gear types vary in terms of versatilityand species selectivity, so gear types differ fromreservoir to reservoir. For instance, Ea Kao reservoiris more diverse in terms of species and fishers andhas a clear bottom, so the number of gear types usedis 12. Ea Kar, with few species and fishers, has onlythree gear types (Table 8).
Ho 31 is seined when water level is at its annualminimum. No other gear is used.
Gill-nets and lift-nets are important gear in allthree reservoirs. Table 9 indicates their relative con-tributions to the three fisheries.
Gill-nets tend to catch a great variety of species,while lift-nets are most effective on pelagicschooling fish (Table 10).
Fish production by lift-net in different periodsdepends on fishing effort by this and other gear, thenumber of fish stocked, and the weather. In the threereservoirs, silver carp accounted for 71% to 86% ofthe lift-net yield. Catch composition is, in general,more uniform than for gill-nets.
The fit between catch and effort for lift-nets(Table 11) strongly suggests that an effort level ofabout 380 000 m2hr/ha/yr tends to achieve optimalyield in these reservoirs (Figure 5). However, thecase of Ea Kar shows that this relationship cannot beapplied well to individual reservoirs.
In Ea Kar, an optimal effort of about 16 000m2hr/ha/yr is suggested, considerably lower than thegeneral case.
When fishing effort increased, effort cost alsoincreased and the effort needed for maximumeconomic yield appeared to be about 80% of theeffort level needed for maximum ‘sustainable’ yield(it should be noted that since the lift-net fisherydepends almost entirely on stocked species, the ques-tion of maximum sustainable yield is not particularlyrelevant). However, the results of this exercise willbe more applicable separately for individualreservoirs.
Similar exercises with gill-nets led to similar con-clusions. When gill-net catch and effort data werecombined for three reservoirs, an optimal effort levelof about 400 000 m2hr/ha/yr was suggested. How-ever, the situation with common carp in Ea Kaoagain showed that this level can not be safely appliedto individual reservoirs.
Common carp is the most important self-recruitedspecies in Ea Kao. Gill-nets caught just under 80%of the total yield, and common carp made up about41% of the total gill-net yield. While the number ofpoints is too low to give a firm indication of optimalfishing effort, catch vs effort data suggest an optimaleffort level of about 30 000 m2hr/ha/yr, or muchlower than the general case.
An exercise comparing maximum sustainable yieldto maximum economic yield for gill-nets suggeststhat the effort level needed to achieve maximum
Effort(2) = 100m2/hr
Table 9. Yield percentages caught by gill-nets and lift-nets in three reservoirs.
Ea Kao Yang Re Ea Kar
1997–98 1998–99 1997–98 1998–99 1997–98 1998–99
Gill-nets 15.5 16.3 81.7 28.0 73.7 72.7Lift-nets 46.7 75.9 14.5 77.3 26.3 24.8Other 27.8 10.5 3.8 3.9 0.0 2.5
Table 10. Catch, effort and catch per unit effort by lift-net.
Lift-net Yang Re Ea Kar Ea Kao
4/97–3/98 4/98–3/99 4/97–3/98 4/98–3/99 4/97–3/98 4/98–3/99
Catch (kg) 1251.95 31 350.9 12 322 13 514 70 373.5 91 961.6Effort (2) 0.0029 0.27473 0.01619 0.02719 0.24286 0.36524CPUE 0.43142 0.11412 0.7611 0.49694 0.28977 0.25179

90
economic yield is about 60% of that needed formaximum sustainable yield. The fit of the data to theresponse curves was, however, very poor (Figure 6).These data are best analysed on a reservoir-specificbasis, and are not yet sufficient to allow such anexercise.
Conclusions
The data given in Tables 4 and 5 give compellingarguments for stocking in most Central Highlandsreservoirs. (1) In the absence of stocking, yieldwould be low to negligible in most cases. (2)Stocking is cost-effective, especially for silver carp.
Stocking may be debatable in water bodies withhigher yields and diverse, self-recruiting stocks.Such species cost nothing to stock, and are a depend-able source of fish, should stocking prove impos-sible. A diverse stock also tends to be a stable one, interms of production. The extent to which stocking
can complement these species still deserves investi-gation. Species which cannot reproduce in thereservoirs should pose few or no long-term risks toexisting stocks.
Table 12 summarises our preliminary stockingrecommendations.
*Mrigal should not be stocked at high densities if commoncarp are present.
Table 12. Preliminary stocking recommendations.
Reservoir size 150–200 ha 50 ha 5 ha Stocking size(g)Species No./ha
Silver carp 1250 2500 4500 0.5–1Bighead 800 1500 3500 1–2Indian carp* 2000 2000 4000 ?Common carp 1000 ? 1000 ? 1000 ? ≥ 1Grass carp Depends Depends Depends ≥ 1
Figure 5. Catch versus effort tendencies by lift-net.
Table 11. Effort and catch value for lift-nets.
Yang Re Ea Kar Ea Kao
Eff val/ha (VND) 15 693.43 1 485 836 34 776 58 414 350 258 526 754Catch val/ha (VND) 126 861.58 3 177 078 495 937 543 913 1 901 761 2 485 151(Catch val–effort val)/ha 111 168.15 1 691 242 461 162 485 499 1 551 503 1 958 397
700
600
500
400
300
200
100
0
Cat
ch/h
a
0 1000 2000 3000 4000 5000 6000
Effort/ha
Yang 98–99
Ekao 98–99
Ekao 97–98
Ekar 98–99Ekar 97–98
Yang 97–98
y = −4E−05x2 + 0.3061x + 32.27R2 = 0.9952
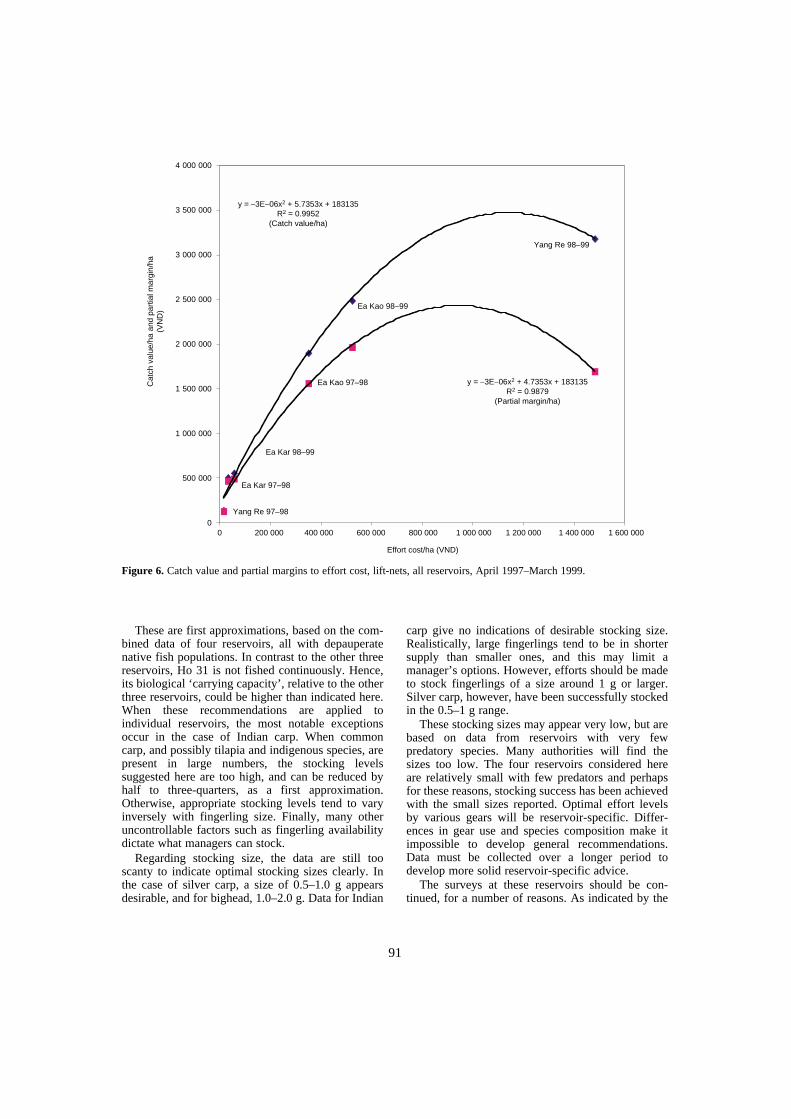
91
These are first approximations, based on the com-bined data of four reservoirs, all with depauperatenative fish populations. In contrast to the other threereservoirs, Ho 31 is not fished continuously. Hence,its biological ‘carrying capacity’, relative to the otherthree reservoirs, could be higher than indicated here.When these recommendations are applied toindividual reservoirs, the most notable exceptionsoccur in the case of Indian carp. When commoncarp, and possibly tilapia and indigenous species, arepresent in large numbers, the stocking levelssuggested here are too high, and can be reduced byhalf to three-quarters, as a first approximation.Otherwise, appropriate stocking levels tend to varyinversely with fingerling size. Finally, many otheruncontrollable factors such as fingerling availabilitydictate what managers can stock.
Regarding stocking size, the data are still tooscanty to indicate optimal stocking sizes clearly. Inthe case of silver carp, a size of 0.5–1.0 g appearsdesirable, and for bighead, 1.0–2.0 g. Data for Indian
carp give no indications of desirable stocking size.Realistically, large fingerlings tend to be in shortersupply than smaller ones, and this may limit amanager’s options. However, efforts should be madeto stock fingerlings of a size around 1 g or larger.Silver carp, however, have been successfully stockedin the 0.5–1 g range.
These stocking sizes may appear very low, but arebased on data from reservoirs with very fewpredatory species. Many authorities will find thesizes too low. The four reservoirs considered hereare relatively small with few predators and perhapsfor these reasons, stocking success has been achievedwith the small sizes reported. Optimal effort levelsby various gears will be reservoir-specific. Differ-ences in gear use and species composition make itimpossible to develop general recommendations.Data must be collected over a longer period todevelop more solid reservoir-specific advice.
The surveys at these reservoirs should be con-tinued, for a number of reasons. As indicated by the
Figure 6. Catch value and partial margins to effort cost, lift-nets, all reservoirs, April 1997–March 1999.
Cat
ch v
alue
/ha
and
part
ial m
argi
n/ha
4 000 000
3 500 000
3 000 000
2 500 000
2 000 000
1 500 000
1 000 000
500 000
0
(VN
D)
0 200 000 400 000 600 000 800 000 1 000 000 1 200 000 1 400 000 1 600 000
Effort cost/ha (VND)
y = −3E−06x2 + 5.7353x + 183135R2 = 0.9952
(Catch value/ha)
Yang Re 98–99
Ea Kao 98–99
Ea Kao 97–98
Ea Kar 98–99
Ea Kar 97–98
Yang Re 97–98
y = −3E−06x2 + 4.7353x + 183135R2 = 0.9879
(Partial margin/ha)

92
catch vs effort data, a longer period will allow forenhanced understanding of the dynamics of thevarious fish stocks in this sample of reservoirs, theeffects of the fisheries on these stocks, and whatlessons can be applied more broadly to other reser-voirs in the region. Stocking is expected to continueto be an important means of enhancing reservoir fishyields in the area, and more robust data are needed to
make appropriate recommendations. Continuousassessment of the extent to which indigenous andstocked species can coexist is also highly desirable.
Reference
Ministry of Fisheries 1995. Hôi Nghi Nghê Cá Hô ChûaLân Thû Hai, Hanoi. MoF, 79 p.
93
Effect of Hydrological Regimes on Fish Yields in Reservoirs of Sri Lanka
C. Nissanka* and U.S. Amarasinghe*
Abstract
The need for empirical models for predicting fish yields in lakes and reservoirs, both in tropicaland temperate regions, has long been recognised because investigation of the fisheries of individualwater bodies for management purposes is prohibitive. In a previous study, morphological andedaphic factors, including extents of catchment areas in reservoirs of Sri Lanka, were found toinfluence fish yields. Hydraulic retention time is reported to be another factor influencing fishyields in tropical reservoirs. This paper attempts to investigate the effect of hydrological regimeson fish yields in irrigation reservoirs of Sri Lanka. Daily catch and effort data were collected from10 shallow irrigation reservoirs from December 1997 to September 1999. Nitrate, phosphate andchlorophyll-a content in each reservoir were determined once in two months. Hypsographic curves(i.e. area-water depth relationships) and monthly mean data on reservoir capacity, water level,reservoir area and total outflow volume were obtained from the Department of Irrigation. Flushingrate (outflow/reservoir capacity) had little influence on water nutrients, chlorophyll-a and fishyields in reservoirs. As irrigation authorities control the hydrological regimes of these reservoirs,strong co-ordination between fisheries and irrigation authorities is useful for augmenting fish yieldsin the reservoirs of Sri Lanka.
FISH production in reservoirs is affected by abioticfactors such as physico-chemical parameters andhydrology. But their importance relative to bioticinteractions is not fully understood. However,scientists have attempted to relate fish yields in lakesand reservoirs to different biotic and abiotic factors.One of the earliest empirical approaches (Rawson1952) demonstrated that it was possible to estimatefish yield from the reservoir mean depth. Severalindices such as morpho-edaphic index (Ryder 1965;Henderson and Welcomme 1974), primary pro-ductivity and phytoplankton standing crop (Oglesby1977) are found to be powerful yield predictors bothin temperate and tropical lakes and reservoirs.
Hydraulic retention time is reported to be anotherfactor influencing fish yield in tropical reservoirs(Marshall 1984). In irrigation reservoirs of SriLanka, management of water output for cultivationof two crops of rice per year in the dry zone
(<190 cm of rainfall per year) of the country issuperimposed upon the climatic patterns. Therefore,highly variable retention times and water levelfluctuations characterise almost all irrigationreservoirs in the dry zone of Sri Lanka.
Fishing effort is a major determinant of fish yieldsin reservoirs (Bayley 1988). Sri Lanka is no excep-tion (De Silva 1985; De Silva et al. 1991). Alterna-tively, physico-chemical and biological parameterswere also shown to influence fish yields in SriLankan reservoirs (Moreau and De Silva 1991). In aprevious study, morphological and edaphic factors,including extent of catchment areas in reservoirs ofSri Lanka were also found to influence fish yields(Nissanka et al. 2000). Furthermore, it can beexpected that flushing rates and the extent of draw-down area in reservoirs, which are brought about bydemand for irrigation water in the command areas,might have negative and positive effects, respec-tively on nutrient status and fish yields. This paperattempts to investigate the effect of hydrologicalregimes on fish yields in irrigation reservoirs ofSri Lanka.
*Department of Zoology, University of Kelaniya, Klelaniya11600, Sri Lanka
94
Materials and Methods
The study was carried out in 10 shallow irrigationalreservoirs of Sri Lanka from December 1997 toSeptember 1999. The fishery data were collected byfield assistants for at least 20 days in the month forthat period, and included the number of craftsoperating per day and the total catch by weight,landed by each craft. Locations of the 10 reservoirsinvestigated and details of the sampling procedureare given by Amarasinghe et al. (these Proceedings).Hypsographic curves (i.e. relationships of reservoirarea to water level) and monthly mean data ofreservoir water level, capacity, reservoir area andtotal outflow volume of individual reservoirs wereobtained from the Department of Irrigation for thestudy period.
Usually, the area at full supply level (FSL) is usedfor calculating fish yield (Y in kg/ha/yr) inreservoirs. In this study, both the reservoir area atFSL (AFSL) and the actual reservoir area as deter-mined from the hypsographic curves (AMEAN) wereused to calculate Y in reservoirs (for details seeAmarasinghe et al. these Proceedings).
Nitrate, phosphate, alkalinity, and electrical con-ductivity in each reservoir were determined once intwo months. The chlorophyll-a content (Chl-a) wasalso determined at the same time intervals.
Morpho-edaphic indices were derived as MEIc(= conductivity/mean depth) and MEIa (= alkalinity/mean depth). In Sri Lanka, it has already been foundthat MEIc, MEIa and Chl-a are positively correlatedto catchment area (Nissanka et al. 2000), indicatingthat allochthonous input of nutrients is important togovern the trophic status of reservoirs. In the presentstudy, other factors influencing trophic status wereexplored. For this purpose, annual flushing rates ofindividual reservoirs were estimated as the ratio oftotal annual outflow (in million cubic metres orMCM) to mean reservoir capacity (in MC). Draw-down area of each reservoir was estimated as thedifference between reservoir area at FSL and thereservoir area at minimum water level during thestudy period, the latter determined from the hypso-graphic curves. The draw-down area was thenexpressed as a percentage of the reservoir area atFSL (%DDA).
Flushing rates (FR) and %DDA of individualreservoirs were related to nutrients (NO3 and PO4),MEIa, MEIc and Chl-a. These two parameters werealso related to Y. Here both estimates of Y in eachreservoir, which were based on reservoir area at FSL(AFSL) and the mean reservoir area (AMEAN), wereused to relate to FR. As Y is found to be related toreservoir area (A) according to a negative exponentialcurve (Amarasinghe et al., these Proceedings), a
multiple regression analysis was attempted to relate A(in ha) and the independent variable(s) which is/aresignificantly related to Y.
Results
Reservoir area and capacity at FSL, FSL ofreservoirs, mean annual reservoir area and capacity,water level at FSL, DDA, %DDA, total annual out-flow, flushing rates and fish yields estimated on thebasis of FSL and mean monthly reservoir area aregiven in Table 1. The scatter plots of various indicesof trophic status of reservoirs (total phosphorus,dissolved phosphorus, MEIa, MEIc and Chl-a)against FR are shown in Figure 1. The scatter plotsof the same indices against %DDA are shown inFigure 2. None of these relationships are significant(P > 0.05).
The scatter plots of fish yields in individualreservoirs against total annual flushing rates areshown in Figures 3a and 3b for yield estimated basedon reservoir area at FSL and those based on meanmonthly reservoir area, respectively. These relation-ships are also not significant at 5% levels. Howeverlog-log relationships were evident between fishyields (Y) estimated by both methods and %DDAwhich are described by the following equations(Figures 4a and 4b).
For Y estimates based on area at FSL: ln Y = 0.1638 + 1.1132 ln (%DDA) (r = 0.858;P<0.01).
For Y estimates based on mean monthly area: ln Y = -0.9412 + 1.4732 ln (%DDA) (r = 0.846;P<0.01).
The ln (%DDA) and A are multiply correlated toln Y according to the following equations. In thesemultiple regression analyses, however, data fromChandrikawewa were not used because of low fishyields perhaps due to different limnological con-ditions (Amarasinghe et al. these Proceedings).
For estimates based on area at FSL: ln Y = 1.598 + 0.875 ln (%DDA) − 0.00023 A(r = 0.82; P<0.02).
For those based on mean monthly area: ln Y = −1.215 + 1.688 ln (%DDA) − 0.00047 A(r = 0.94; P<0.001).
Discussion
It is obvious that water release from multipurposereservoirs causes loss of nutrients from the reservoirecosystems. It has been reported that the hydraulicretention time, which is equal to the reciprocal offlushing rate, has a positive affect on fish yields inreservoirs (Marshall 1984). However, in smallshallow reservoirs this may not necessarily be true

95
because allochthonous input of nutrients into thereservoir is more pronounced when compared tonutrient loss with outflow. As Moreau and De Silva(1991) mentioned, reservoir beds themselves inshallow irrigation reservoirs in Sri Lanka may releasenutrients, which might compensate for nutrient lossesto an extent. The non-significant relationshipsbetween flushing rate and various indices of nutrientstatus in reservoirs (Figure 1), and %DDA and thesame indices (Figure 2) are indications of thepresence of another set of predictor variables fortrophic status, which needs to be identified.
Fish yield is also not related to flushing rate. It isunlikely that flushing rate, which has no effect onnutrient status, can have a significant effect on ahigher trophic level. On the other hand, in spite ofthe non-significant relationships between %DDAand indices of nutrient status (Figure 2), fish yieldsare positively influenced by %DDA according to alog-log relationship. Draw-down area might there-fore be contributing to the reservoir productivity in away that is less related to the energy flow in theecosystem through the pathway based on phyto-plankton. In reservoirs, detrital pathways are moredominant than grazing pathways with regard to
energy flow (Wetzel 1983). However this aspect hasnot been adequately addressed in trophic studies inreservoirs. Studies by McLachlan (1971, 1981) ofthe biological consequences of fluctuations in waterlevel indicate the importance of draw-down area forreservoir productivity.
Possible reasons for the positive relationshipbetween fish yield and %DDA are numerous.Increased food supply for young fish in the form ofbenthic and epiphytic algae due to inundation ofperipheral areas might bring about enhanced growthof fish. Duncan and Kubecka (1995), who havetermed the draw-down areas of reservoirs as land–water ecotones, have indicated that there is a positiveaffect of draw-down areas of reservoirs on fish popu-lations due to the increased food supply for youngfish. As the fisheries of the reservoirs studied aremainly dependent on the exotic cichlids Oreo-chromis mossambicus and O. niloticus, which con-struct nests in shallow peripheral areas, extent ofdraw-down area perhaps reflects the extent of nest-site availability, as shown by De Silva and Sirisena(1988). Draw-down area may therefore play a signif-icant role in recruitment of cichlids to the fishery.Amarasinghe and Upasena (1985) have shown that
Table 1. Reservoir area (ha) and capacity (million cubic metres or MCM) at full supply level (FSL) and monthly means,water level at FSL, draw-down area (DDA) and DDA as percentage of reservoir area at FSL (%DDA), flushing rate(= annual outflow/mean reservoir capacity) and fish yields in 10 Sri Lankan reservoirs. I = yield estimates based on FSL;II = yield estimates based on mean monthly reservoir area (for details see Amarasinghe et. al., these Proceedings).
Reservoir Reservoir area (ha)
Reservoir capacity (MCM)
Water level (m) at FSL
DDA (ha)
%DDA Total annual outflow (MCM)
Flushing rate
Yield (kg/ha/yr)
At FSL Monthly mean
At FSL Monthly mean
I II
Badagirya 486 229.4 ±28.16
11.44 5.64±0.83
4.28 456.4 95.83 19.703 3.493 229.6 579.6
Chandrikawewa 439 407.2±4.18
28.78 24.42±0.45
8.3 76.1 17.09 27.139 1.111 25.7 27.9
Kaudulla 2713 1880.2±132.72
127.92 75.71±7.79
9.14 2127.8 78.43 150.953 1.994 183.5 285.9
Mahawilachchiya 972 741.1±14.7
39.58 23.97±1.39
6.71 610.2 62.83 41.360 1.725 214.3 262.0
Minneriya 2551 1824.9±125.2
135.3 77.54±2.94
11.67 1670.6 65.5 324.713 4.188 92.9 128.4
Muthukandiya 386 280.3±42.59
30.17 16.70±4.69
11.28 202.0 51.92 24.176 1.448 157.8 240.6
Nachchaduwa 1785 1399.1±91.96
57.07 33.32±7.19
7.62 1417.6 79.47 89.707 2.692 115.8 193.2
Nuwarawewa 1199 863.2±106.66
44.34 26.59±10.37
7.01 817.9 68.37 36.693 1.380 126.7 185.5
Parakrama Samudra 2662 2229.3±42.62
142.24 10.37±101.68
7.62 1274.0 47.86 343.093 3.374 69.4 66.7
Udawalawe 3415 2852.8±4.69
267.53 212.95±6.92
15.24 15.24 76.69 46.840 0.220 98.9 123.8
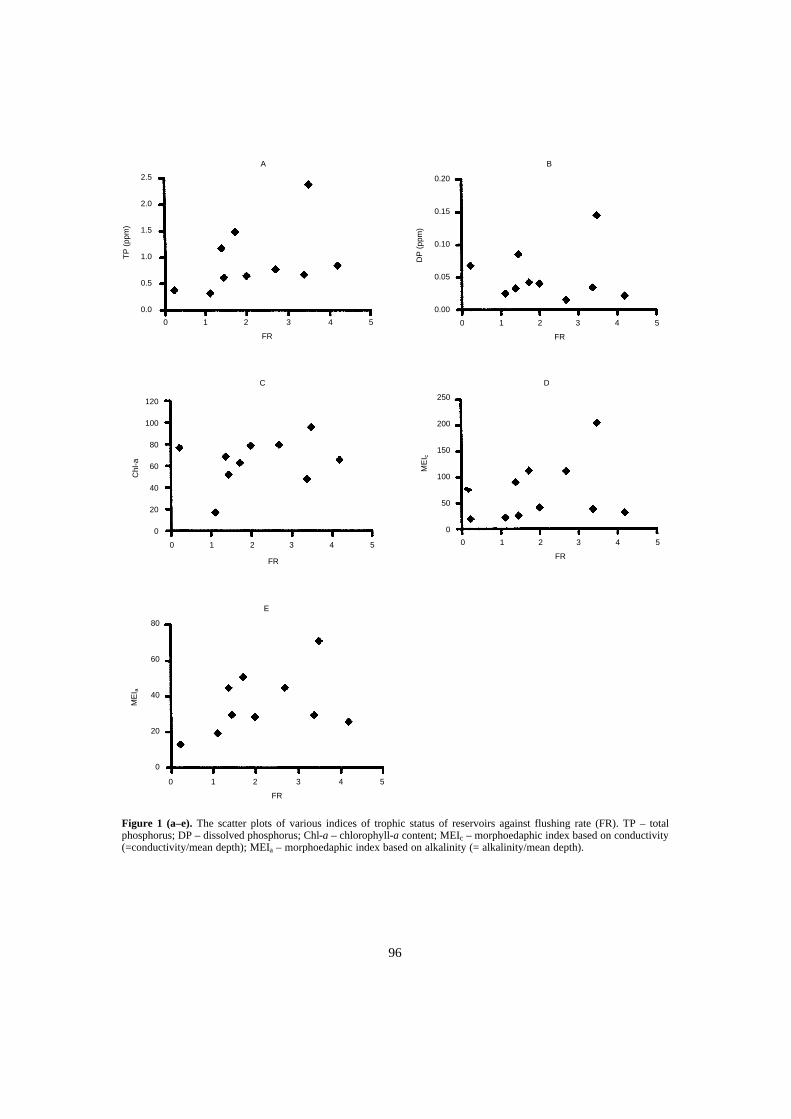
96
Figure 1 (a–e). The scatter plots of various indices of trophic status of reservoirs against flushing rate (FR). TP – totalphosphorus; DP – dissolved phosphorus; Chl-a – chlorophyll-a content; MEIc – morphoedaphic index based on conductivity(=conductivity/mean depth); MEIa – morphoedaphic index based on alkalinity (= alkalinity/mean depth).
A B
C D
E
0.20
0.15
0.10
0.05
0.00
2.5
2.0
1.5
1.0
0.5
0.0
120
100
80
60
40
20
0
250
200
150
100
50
0
80
60
40
20
0
FR
TP
(pp
m)
DP
(pp
m)
0 1 2 3 4 5
FR
0 1 2 3 4 5
FR
0 1 2 3 4 5
FR
0 1 2 3 4 5
FR
0 1 2 3 4 5
Chl
-a
ME
I c
ME
I a
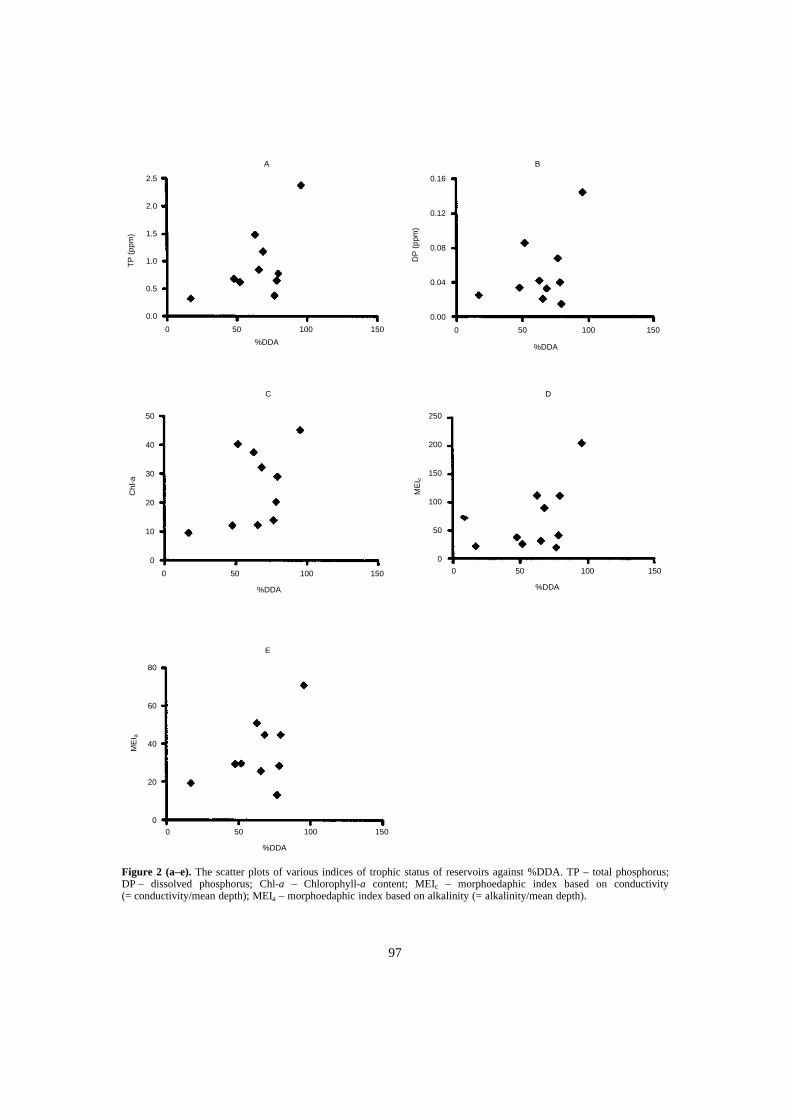
97
Figure 2 (a–e). The scatter plots of various indices of trophic status of reservoirs against %DDA. TP – total phosphorus;DP – dissolved phosphorus; Chl-a – Chlorophyll-a content; MEIc – morphoedaphic index based on conductivity(= conductivity/mean depth); MEIa – morphoedaphic index based on alkalinity (= alkalinity/mean depth).
0 50 100 150
%DDA
0.16
0.12
0.08
0.04
0.00
2.5
2.0
1.5
1.0
0.5
0.0
A B
C D
E
0 50 100 150
%DDA%DDA
0 50 100 150
0 50 100 150
%DDA
0 50 100 150
%DDA
DP
(pp
m)
50
40
30
20
10
0
250
200
150
100
50
0
80
60
40
20
0
TP
(pp
m)
Chl
-a
ME
I c
ME
I a
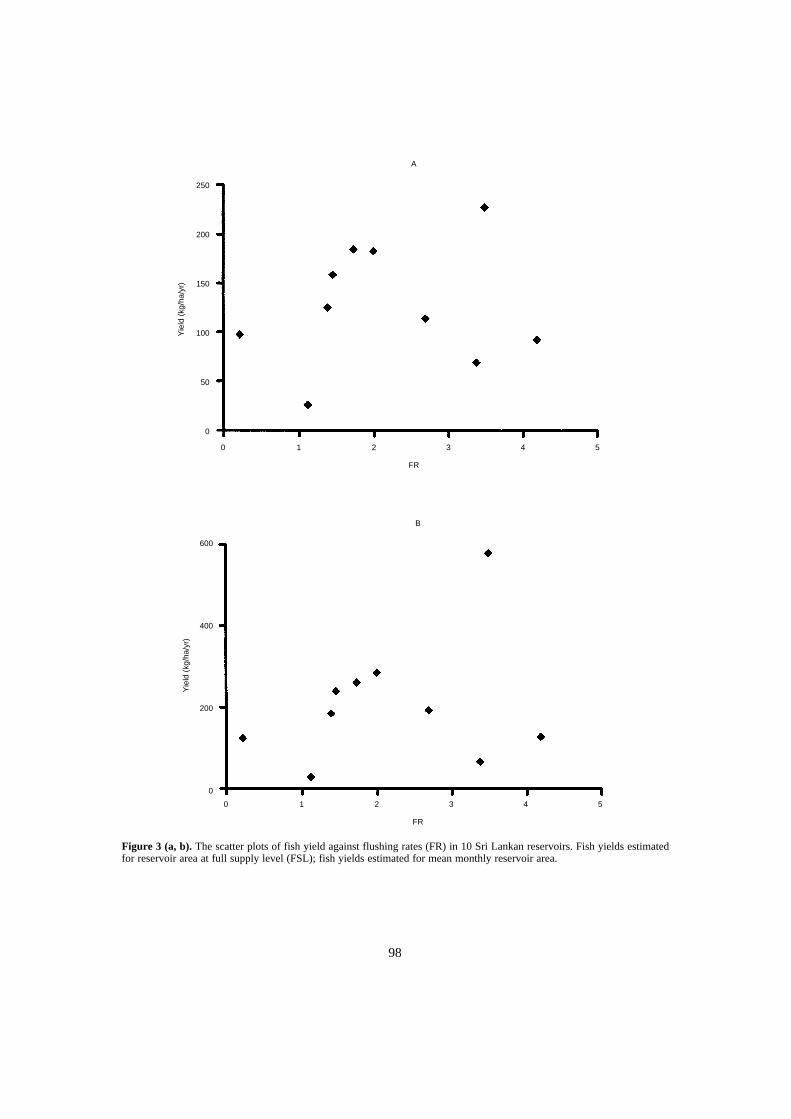
98
Figure 3 (a, b). The scatter plots of fish yield against flushing rates (FR) in 10 Sri Lankan reservoirs. Fish yields estimatedfor reservoir area at full supply level (FSL); fish yields estimated for mean monthly reservoir area.
A
0 1 2 3 4 5
0 1 2 3 4 5
B
FR
FR
250
200
150
100
50
0
Yie
ld (
kg/h
a/yr
)Y
ield
(kg
/ha/
yr)
600
400
200
0

99
Figure 4(a, b). The relationships between Ln fish yield (Ln Y) and Ln (%DDA) in 10 Sri Lankan reservoirs. Fish yieldsestimated for reservoir area at full supply level (FSL); fish yields estimated for mean monthly reservoir area.
A
6.0
5.5
5.0
4.5
4.0
3.5
3.0
Ln Y
Ln Y = 1.1132 Ln (%DDA) + 0.1638(r = 0.858; p<0.01)
2.5 3.0 3.5 4.0 4.5 5.0
Ln (%DDA)
B
6.0
5.5
5.0
4.5
4.0
3.5
3.0
Ln Y
Ln Y = 1.4732 Ln (%DDA) − 0.9412(r = 0.846; p<0.01)
2.5 3.0 3.5 4.0 4.5 5.0
Ln (%DDA)
100
morphometry of a Sri Lankan reservoir is an impor-tant factor influencing recruitment to the cichlidfishery.
As evident from the multiple regression relation-ship between ln Y, ln (%DDA) and reservoir area,yield is negatively influenced by reservoir area. Thismay perhaps substantiate the opinion put forward byMoreau and De Silva (1991) that, due to theirshallowness, reservoir beds in Sri Lankan reservoirsserve as a major source of nutrient release. Naturallyin larger reservoirs the dilution effect is more pro-nounced than in small reservoirs, which justifies thereason for the negative influence of reservoir area onfish yield.
In Sri Lankan irrigation reservoirs, irrigationauthorities, depending on the requirements in the com-mand area, solely control water regimes. Fisheriesaspects are rarely or never considered during waterregime management. However, the present studyindicates that the extent of draw-down area and meanreservoir area, both of which are dependent on thebathymetry of reservoirs, have positive and negativeeffects respectively on fish yields. As such, it appearsthat through strong coordination between fisheries andirrigation authorities, fish yields could be augmentedin shallow, irrigation reservoirs.
Acknowledgments
This study was carried out as part of research project9440, funded by the Australian Centre for Inter-national Agricultural Research.
ReferencesAmarasinghe, U.S. and Upasena, T. 1985. Morphometry of
a man-made lake in Sri Lanka: a factor influencingrecruitment to cichlid fishery. Journal of the NationalAquatic Resources Agency (Sri Lanka), 32: 121–129.
Bayley, P.B. 1988. Accounting for effort when comparingtropical fisheries in lakes, river-floodplains and lagoons.Limnology and Oceanography, 33: 963–972.
De Silva, S.S. 1985. Observations on the abundance of theexotic cichlid Sarotherodon mossambicus (Peters) inrelation to fluctuations in the water-level in a man-madelake in Sri Lanka. Aquaculture and Fisheries Manage-ment, 16: 265–272.
De Silva, S.S. and Sirisena, H.G.K. 1988. Observations onthe nesting habits of Oreochromis mossambicus (Peters)(Pisces: Cichlidae) in Sri Lankan reservoirs. Journal ofFish Biology, 33(5): 689–696.
De Silva, S.S., Moreau, J., Amarasinghe, U.S., Chookajorn,T. and Guerrero, R.D. 1991. A comparative assessmentof the fisheries in lacustrine inland waters in three Asiancountries based on catch and effort data. FisheriesResearch, 11: 177–189.
Duncan, A. and Kubecka, J. 1995. Land/water ecotoneeffects in reservoirs on the fish fauna. Hydrobiologia,303: 11–30.
Henderson, H.F. and Welcomme, R.L. 1974. The Relation-ship of Yield to Morphoedaphic Index and Numbers ofFishermen in African Inland Waters. CIFA OccasionalPaper 1, 19 p.
Marshall, B.E. 1984. Small Pelagic Fishes and Fisheries inAfrican Inland Waters. CIFA Technical Paper 14, 25 p.
McLachlan, A.J. 1971. The rate of nutrient release fromgrass and dung following immersion in lake water.Hydrobiologia, 37: 521–530.
—— 1981. Biological consequences of fluctuations in lakelevel. CIFA Technical Paper 8: 225–231.
Moreau, J. and De Silva, S.S. 1991. Predictive Fish YieldModels for Lakes and Reservoirs of the Philippines, SriLanka and Thailand. FAO Fisheries Technical Paper319, 42 p.
Nissanka, C., Amarasinghe, U.S. and De Silva, S.S. 2000.Yield Predictive Models for the Sri Lankan ReservoirFishery. Fisheries Management and Ecology 7: 425–436.
Oglesby, R.T. 1977. Relationship of fish yield to lakephytoplankton standing crop, production and morpho-edaphic factors. Journal of Fisheries Research Board ofCanada, 34: 2271–2279.
Rawson, D.S. 1952. Mean depth and fish production inlarge lakes. Ecology, 33: 513–521.
Ryder, R.A. 1965. A method for estimating the potentialfish production of north-temperate lakes. Transactions ofAmerican Fisheries Society, 94: 214–218.
Wetzel, R.G. 1983. Limnology (2nd edn). Philadelphia:Saunders College Publishing, 767 p.
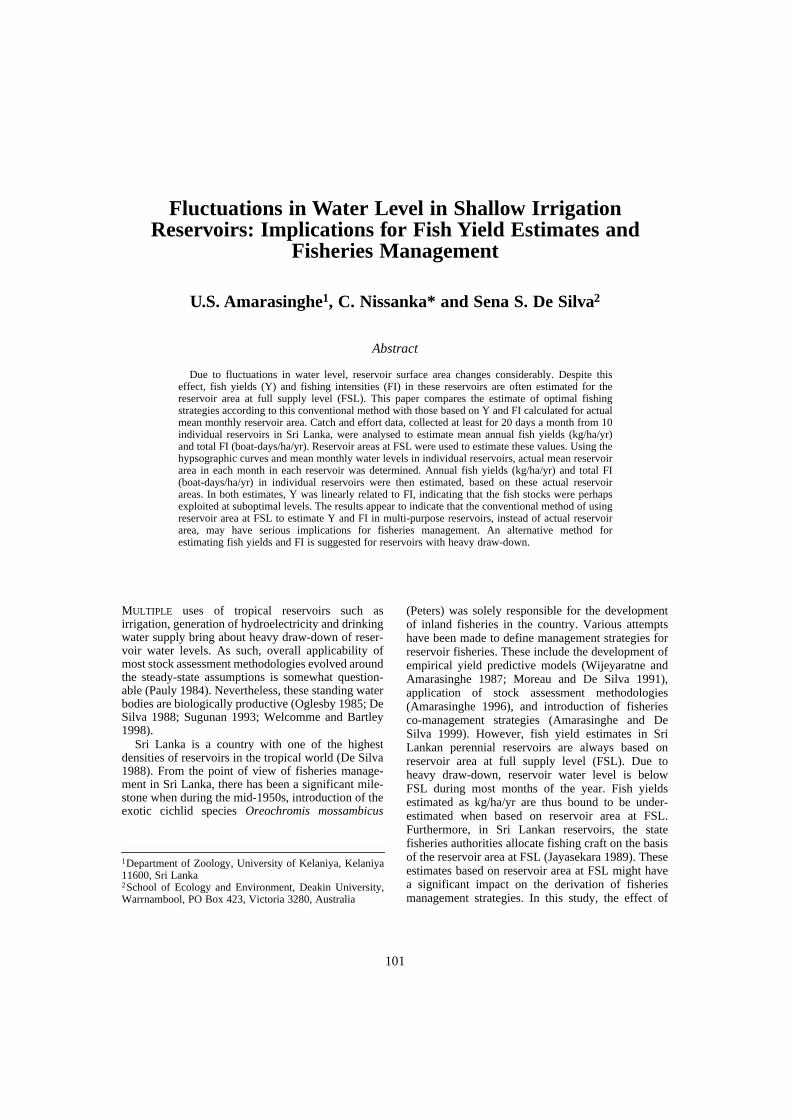
101
Fluctuations in Water Level in Shallow Irrigation Reservoirs: Implications for Fish Yield Estimates and
Fisheries Management
U.S. Amarasinghe1, C. Nissanka* and Sena S. De Silva2
Abstract
Due to fluctuations in water level, reservoir surface area changes considerably. Despite thiseffect, fish yields (Y) and fishing intensities (FI) in these reservoirs are often estimated for thereservoir area at full supply level (FSL). This paper compares the estimate of optimal fishingstrategies according to this conventional method with those based on Y and FI calculated for actualmean monthly reservoir area. Catch and effort data, collected at least for 20 days a month from 10individual reservoirs in Sri Lanka, were analysed to estimate mean annual fish yields (kg/ha/yr)and total FI (boat-days/ha/yr). Reservoir areas at FSL were used to estimate these values. Using thehypsographic curves and mean monthly water levels in individual reservoirs, actual mean reservoirarea in each month in each reservoir was determined. Annual fish yields (kg/ha/yr) and total FI(boat-days/ha/yr) in individual reservoirs were then estimated, based on these actual reservoirareas. In both estimates, Y was linearly related to FI, indicating that the fish stocks were perhapsexploited at suboptimal levels. The results appear to indicate that the conventional method of usingreservoir area at FSL to estimate Y and FI in multi-purpose reservoirs, instead of actual reservoirarea, may have serious implications for fisheries management. An alternative method forestimating fish yields and FI is suggested for reservoirs with heavy draw-down.
MULTIPLE uses of tropical reservoirs such asirrigation, generation of hydroelectricity and drinkingwater supply bring about heavy draw-down of reser-voir water levels. As such, overall applicability ofmost stock assessment methodologies evolved aroundthe steady-state assumptions is somewhat question-able (Pauly 1984). Nevertheless, these standing waterbodies are biologically productive (Oglesby 1985; DeSilva 1988; Sugunan 1993; Welcomme and Bartley1998).
Sri Lanka is a country with one of the highestdensities of reservoirs in the tropical world (De Silva1988). From the point of view of fisheries manage-ment in Sri Lanka, there has been a significant mile-stone when during the mid-1950s, introduction of theexotic cichlid species Oreochromis mossambicus
(Peters) was solely responsible for the developmentof inland fisheries in the country. Various attemptshave been made to define management strategies forreservoir fisheries. These include the development ofempirical yield predictive models (Wijeyaratne andAmarasinghe 1987; Moreau and De Silva 1991),application of stock assessment methodologies(Amarasinghe 1996), and introduction of fisheriesco-management strategies (Amarasinghe and DeSilva 1999). However, fish yield estimates in SriLankan perennial reservoirs are always based onreservoir area at full supply level (FSL). Due toheavy draw-down, reservoir water level is belowFSL during most months of the year. Fish yieldsestimated as kg/ha/yr are thus bound to be under-estimated when based on reservoir area at FSL.Furthermore, in Sri Lankan reservoirs, the statefisheries authorities allocate fishing craft on the basisof the reservoir area at FSL (Jayasekara 1989). Theseestimates based on reservoir area at FSL might havea significant impact on the derivation of fisheriesmanagement strategies. In this study, the effect of
1Department of Zoology, University of Kelaniya, Kelaniya11600, Sri Lanka2School of Ecology and Environment, Deakin University,Warrnambool, PO Box 423, Victoria 3280, Australia
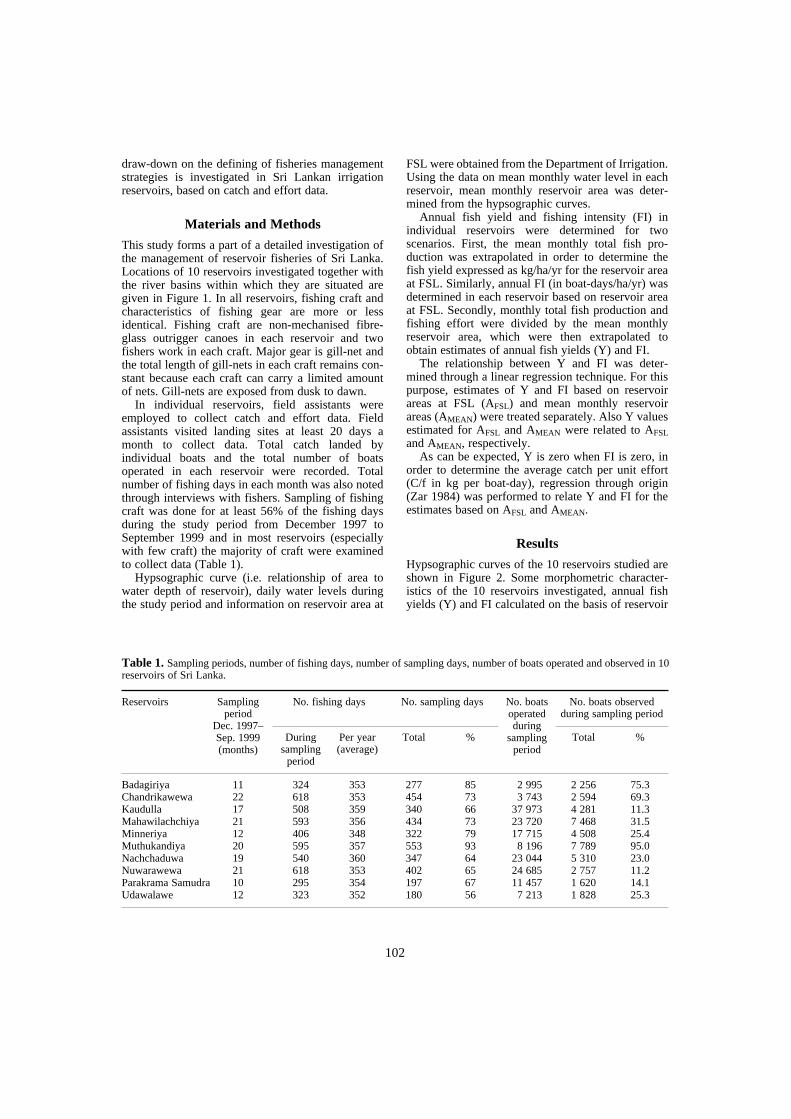
102
draw-down on the defining of fisheries managementstrategies is investigated in Sri Lankan irrigationreservoirs, based on catch and effort data.
Materials and Methods
This study forms a part of a detailed investigation ofthe management of reservoir fisheries of Sri Lanka.Locations of 10 reservoirs investigated together withthe river basins within which they are situated aregiven in Figure 1. In all reservoirs, fishing craft andcharacteristics of fishing gear are more or lessidentical. Fishing craft are non-mechanised fibre-glass outrigger canoes in each reservoir and twofishers work in each craft. Major gear is gill-net andthe total length of gill-nets in each craft remains con-stant because each craft can carry a limited amountof nets. Gill-nets are exposed from dusk to dawn.
In individual reservoirs, field assistants wereemployed to collect catch and effort data. Fieldassistants visited landing sites at least 20 days amonth to collect data. Total catch landed byindividual boats and the total number of boatsoperated in each reservoir were recorded. Totalnumber of fishing days in each month was also notedthrough interviews with fishers. Sampling of fishingcraft was done for at least 56% of the fishing daysduring the study period from December 1997 toSeptember 1999 and in most reservoirs (especiallywith few craft) the majority of craft were examinedto collect data (Table 1).
Hypsographic curve (i.e. relationship of area towater depth of reservoir), daily water levels duringthe study period and information on reservoir area at
FSL were obtained from the Department of Irrigation.Using the data on mean monthly water level in eachreservoir, mean monthly reservoir area was deter-mined from the hypsographic curves.
Annual fish yield and fishing intensity (FI) inindividual reservoirs were determined for twoscenarios. First, the mean monthly total fish pro-duction was extrapolated in order to determine thefish yield expressed as kg/ha/yr for the reservoir areaat FSL. Similarly, annual FI (in boat-days/ha/yr) wasdetermined in each reservoir based on reservoir areaat FSL. Secondly, monthly total fish production andfishing effort were divided by the mean monthlyreservoir area, which were then extrapolated toobtain estimates of annual fish yields (Y) and FI.
The relationship between Y and FI was deter-mined through a linear regression technique. For thispurpose, estimates of Y and FI based on reservoirareas at FSL (AFSL) and mean monthly reservoirareas (AMEAN) were treated separately. Also Y valuesestimated for AFSL and AMEAN were related to AFSLand AMEAN, respectively.
As can be expected, Y is zero when FI is zero, inorder to determine the average catch per unit effort(C/f in kg per boat-day), regression through origin(Zar 1984) was performed to relate Y and FI for theestimates based on AFSL and AMEAN.
Results
Hypsographic curves of the 10 reservoirs studied areshown in Figure 2. Some morphometric character-istics of the 10 reservoirs investigated, annual fishyields (Y) and FI calculated on the basis of reservoir
Table 1. Sampling periods, number of fishing days, number of sampling days, number of boats operated and observed in 10reservoirs of Sri Lanka.
Reservoirs Sampling period
Dec. 1997–Sep. 1999(months)
No. fishing days No. sampling days No. boats operated during
sampling period
No. boats observed during sampling period
During sampling
period
Per year (average)
Total % Total %
BadagiriyaChandrikawewaKaudullaMahawilachchiyaMinneriyaMuthukandiyaNachchaduwaNuwarawewaParakrama SamudraUdawalawe
11221721122019211012
324618508593406595540618295323
353353359356348357360353354352
277454340434322553347402197180
85736673799364656756
2 9953 743
37 97323 72017 7158 196
23 04424 68511 4577 213
2 2562 5944 2817 4684 5087 7895 3102 7571 6201 828
75.369.311.331.525.495.023.011.214.125.3
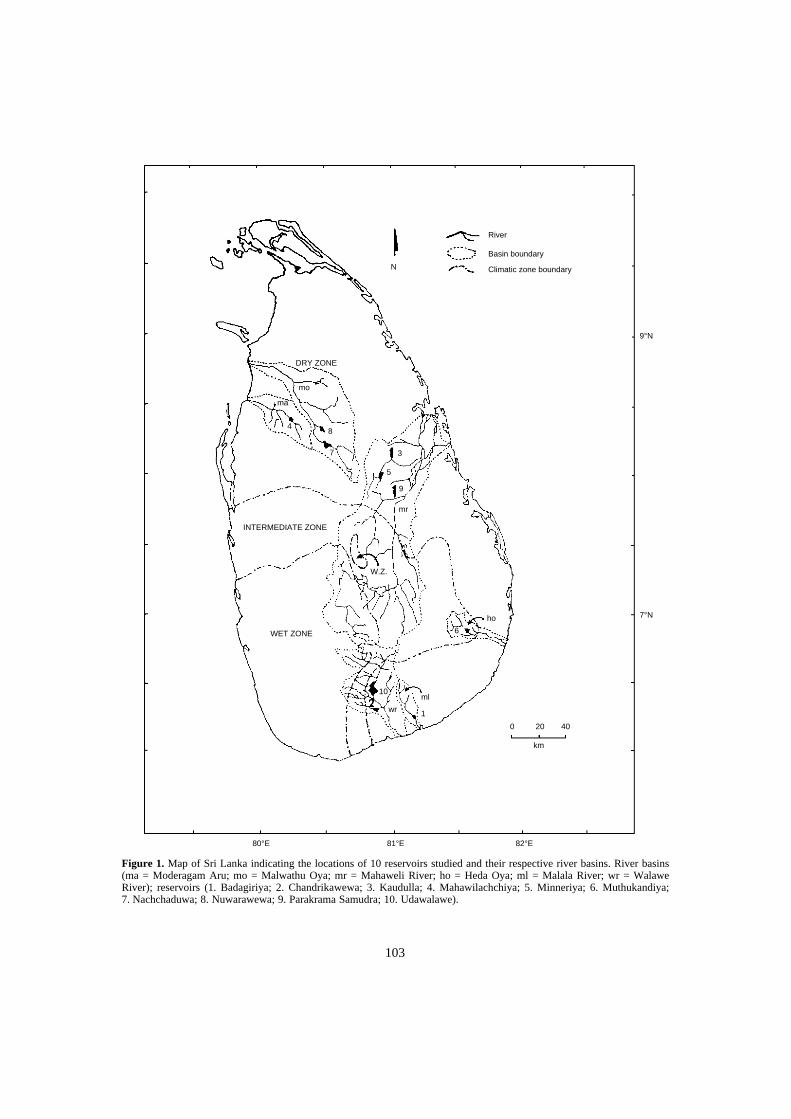
103
Figure 1. Map of Sri Lanka indicating the locations of 10 reservoirs studied and their respective river basins. River basins(ma = Moderagam Aru; mo = Malwathu Oya; mr = Mahaweli River; ho = Heda Oya; ml = Malala River; wr = WalaweRiver); reservoirs (1. Badagiriya; 2. Chandrikawewa; 3. Kaudulla; 4. Mahawilachchiya; 5. Minneriya; 6. Muthukandiya;7. Nachchaduwa; 8. Nuwarawewa; 9. Parakrama Samudra; 10. Udawalawe).
River
Basin boundary
Climatic zone boundaryN
9°N
7°N
80°E 81°E 82°E
km
0 20 40
10
DRY ZONE
INTERMEDIATE ZONE
WET ZONE
W.Z.
mr
ma
mo
ho
ml
wr
48
7 3
5
9
6
1
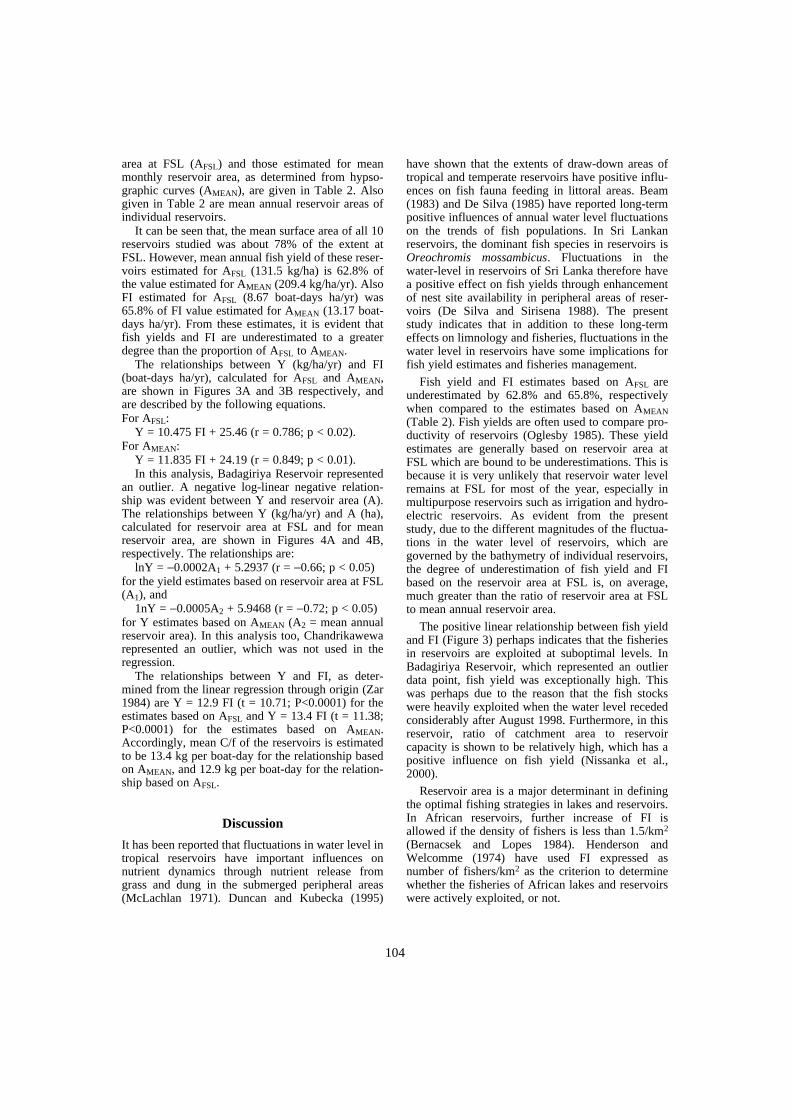
104
area at FSL (AFSL) and those estimated for meanmonthly reservoir area, as determined from hypso-graphic curves (AMEAN), are given in Table 2. Alsogiven in Table 2 are mean annual reservoir areas ofindividual reservoirs.
It can be seen that, the mean surface area of all 10reservoirs studied was about 78% of the extent atFSL. However, mean annual fish yield of these reser-voirs estimated for AFSL (131.5 kg/ha) is 62.8% ofthe value estimated for AMEAN (209.4 kg/ha/yr). AlsoFI estimated for AFSL (8.67 boat-days ha/yr) was65.8% of FI value estimated for AMEAN (13.17 boat-days ha/yr). From these estimates, it is evident thatfish yields and FI are underestimated to a greaterdegree than the proportion of AFSL to AMEAN.
The relationships between Y (kg/ha/yr) and FI(boat-days ha/yr), calculated for AFSL and AMEAN,are shown in Figures 3A and 3B respectively, andare described by the following equations.For AFSL:
Y = 10.475 FI + 25.46 (r = 0.786; p < 0.02).For AMEAN:
Y = 11.835 FI + 24.19 (r = 0.849; p < 0.01).In this analysis, Badagiriya Reservoir represented
an outlier. A negative log-linear negative relation-ship was evident between Y and reservoir area (A).The relationships between Y (kg/ha/yr) and A (ha),calculated for reservoir area at FSL and for meanreservoir area, are shown in Figures 4A and 4B,respectively. The relationships are:
lnY = −0.0002A1 + 5.2937 (r = −0.66; p < 0.05) for the yield estimates based on reservoir area at FSL(A1), and
1nY = −0.0005A2 + 5.9468 (r = −0.72; p < 0.05) for Y estimates based on AMEAN (A2 = mean annualreservoir area). In this analysis too, Chandrikawewarepresented an outlier, which was not used in theregression.
The relationships between Y and FI, as deter-mined from the linear regression through origin (Zar1984) are Y = 12.9 FI (t = 10.71; P<0.0001) for theestimates based on AFSL and Y = 13.4 FI (t = 11.38;P<0.0001) for the estimates based on AMEAN.Accordingly, mean C/f of the reservoirs is estimatedto be 13.4 kg per boat-day for the relationship basedon AMEAN, and 12.9 kg per boat-day for the relation-ship based on AFSL.
Discussion
It has been reported that fluctuations in water level intropical reservoirs have important influences onnutrient dynamics through nutrient release fromgrass and dung in the submerged peripheral areas(McLachlan 1971). Duncan and Kubecka (1995)
have shown that the extents of draw-down areas oftropical and temperate reservoirs have positive influ-ences on fish fauna feeding in littoral areas. Beam(1983) and De Silva (1985) have reported long-termpositive influences of annual water level fluctuationson the trends of fish populations. In Sri Lankanreservoirs, the dominant fish species in reservoirs isOreochromis mossambicus. Fluctuations in thewater-level in reservoirs of Sri Lanka therefore havea positive effect on fish yields through enhancementof nest site availability in peripheral areas of reser-voirs (De Silva and Sirisena 1988). The presentstudy indicates that in addition to these long-termeffects on limnology and fisheries, fluctuations in thewater level in reservoirs have some implications forfish yield estimates and fisheries management.
Fish yield and FI estimates based on AFSL areunderestimated by 62.8% and 65.8%, respectivelywhen compared to the estimates based on AMEAN(Table 2). Fish yields are often used to compare pro-ductivity of reservoirs (Oglesby 1985). These yieldestimates are generally based on reservoir area atFSL which are bound to be underestimations. This isbecause it is very unlikely that reservoir water levelremains at FSL for most of the year, especially inmultipurpose reservoirs such as irrigation and hydro-electric reservoirs. As evident from the presentstudy, due to the different magnitudes of the fluctua-tions in the water level of reservoirs, which aregoverned by the bathymetry of individual reservoirs,the degree of underestimation of fish yield and FIbased on the reservoir area at FSL is, on average,much greater than the ratio of reservoir area at FSLto mean annual reservoir area.
The positive linear relationship between fish yieldand FI (Figure 3) perhaps indicates that the fisheriesin reservoirs are exploited at suboptimal levels. InBadagiriya Reservoir, which represented an outlierdata point, fish yield was exceptionally high. Thiswas perhaps due to the reason that the fish stockswere heavily exploited when the water level recededconsiderably after August 1998. Furthermore, in thisreservoir, ratio of catchment area to reservoircapacity is shown to be relatively high, which has apositive influence on fish yield (Nissanka et al.,2000).
Reservoir area is a major determinant in definingthe optimal fishing strategies in lakes and reservoirs.In African reservoirs, further increase of FI isallowed if the density of fishers is less than 1.5/km2
(Bernacsek and Lopes 1984). Henderson andWelcomme (1974) have used FI expressed asnumber of fishers/km2 as the criterion to determinewhether the fisheries of African lakes and reservoirswere actively exploited, or not.
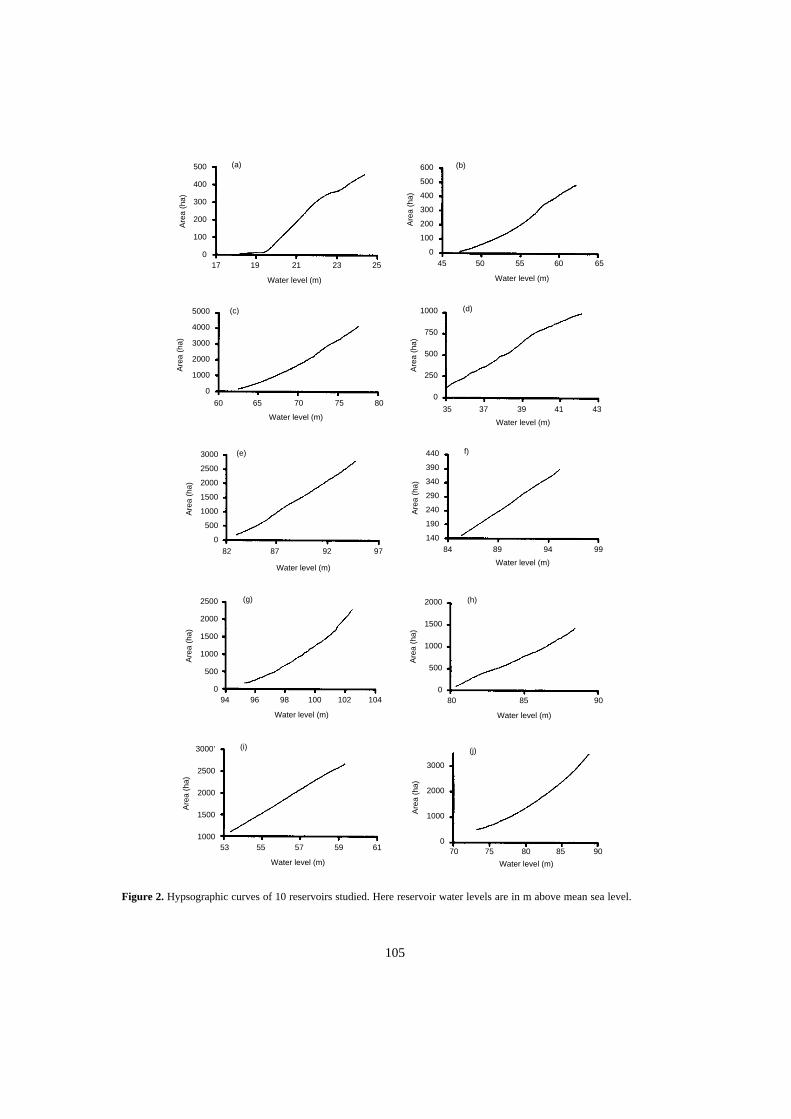
105
Figure 2. Hypsographic curves of 10 reservoirs studied. Here reservoir water levels are in m above mean sea level.
(a)500
400
300
200
100
017 19 21 23 25
Water level (m)
Are
a (h
a)
(c)5000
4000
3000
2000
1000
0
60 65 70 75 80
Water level (m)
Are
a (h
a)
(b)600
500
400
300
200
100
045 50 55 60 65
Water level (m)
Are
a (h
a)
(d)1000
750
500
250
0
35 37 39 41 43
Water level (m)A
rea
(ha)
(e)3000
2500
2000
1500
1000
500
0
82 87 92 97
Water level (m)
Are
a (h
a)
f)440
390
340
290
240
190
14084 89 94 99
Water level (m)
Are
a (h
a)
(g)2500
2000
1500
1000
500
094 96 98 100 102
Water level (m)
Are
a (h
a)
(h)2000
1500
1000
500
080 85 90
Water level (m)
Are
a (h
a)
104
(i)3000’
2500
2000
1500
100053 57 61
Water level (m)
Are
a (h
a)
(j)
3000
2000
1000
070 80 90
Water level (m)
Are
a (h
a)
55 59 75 85
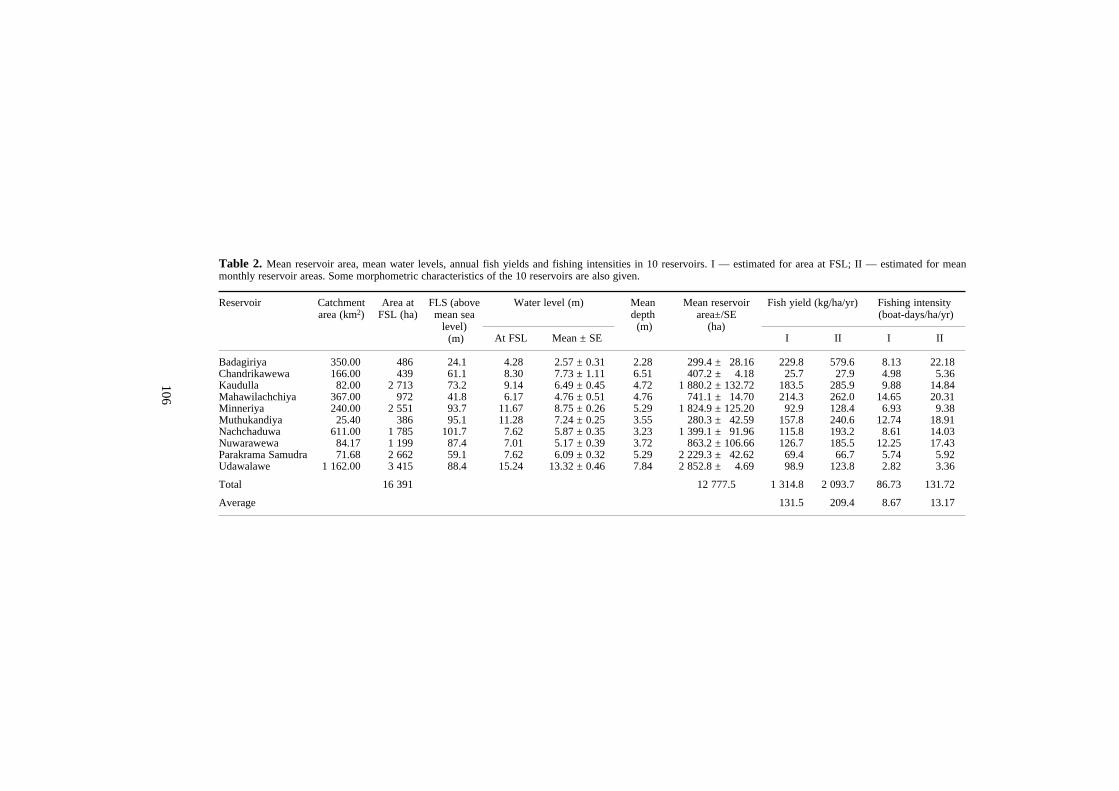
106
Table 2. Mean reservoir area, mean water levels, annual fish yields and fishing intensities in 10 reservoirs. I — estimated for area at FSL; II — estimated for meanmonthly reservoir areas. Some morphometric characteristics of the 10 reservoirs are also given.
Reservoir Catchment area (km2)
Area at FSL (ha)
FLS (above mean sea
level) (m)
Water level (m) Mean depth (m)
Mean reservoir area±/SE
(ha)
Fish yield (kg/ha/yr) Fishing intensity (boat-days/ha/yr)
At FSL Mean ± SE I II I II
Badagiriya 350.00 486 24.1 4.28 2.57 ± 0.31 2.28 299.4 ± 28.16 229.8 579.6 8.13 22.18Chandrikawewa 166.00 439 61.1 8.30 7.73 ± 1.11 6.51 407.2 ± 4.18 25.7 27.9 4.98 5.36Kaudulla 82.00 2 713 73.2 9.14 6.49 ± 0.45 4.72 1 880.2 ± 132.72 183.5 285.9 9.88 14.84Mahawilachchiya 367.00 972 41.8 6.17 4.76 ± 0.51 4.76 741.1 ± 14.70 214.3 262.0 14.65 20.31Minneriya 240.00 2 551 93.7 11.67 8.75 ± 0.26 5.29 1 824.9 ± 125.20 92.9 128.4 6.93 9.38Muthukandiya 25.40 386 95.1 11.28 7.24 ± 0.25 3.55 280.3 ± 42.59 157.8 240.6 12.74 18.91Nachchaduwa 611.00 1 785 101.7 7.62 5.87 ± 0.35 3.23 1 399.1 ± 91.96 115.8 193.2 8.61 14.03Nuwarawewa 84.17 1 199 87.4 7.01 5.17 ± 0.39 3.72 863.2 ± 106.66 126.7 185.5 12.25 17.43Parakrama Samudra 71.68 2 662 59.1 7.62 6.09 ± 0.32 5.29 2 229.3 ± 42.62 69.4 66.7 5.74 5.92Udawalawe 1 162.00 3 415 88.4 15.24 13.32 ± 0.46 7.84 2 852.8 ± 4.69 98.9 123.8 2.82 3.36
Total 16 391 12 777.5 1 314.8 2 093.7 86.73 131.72
Average 131.5 209.4 8.67 13.17
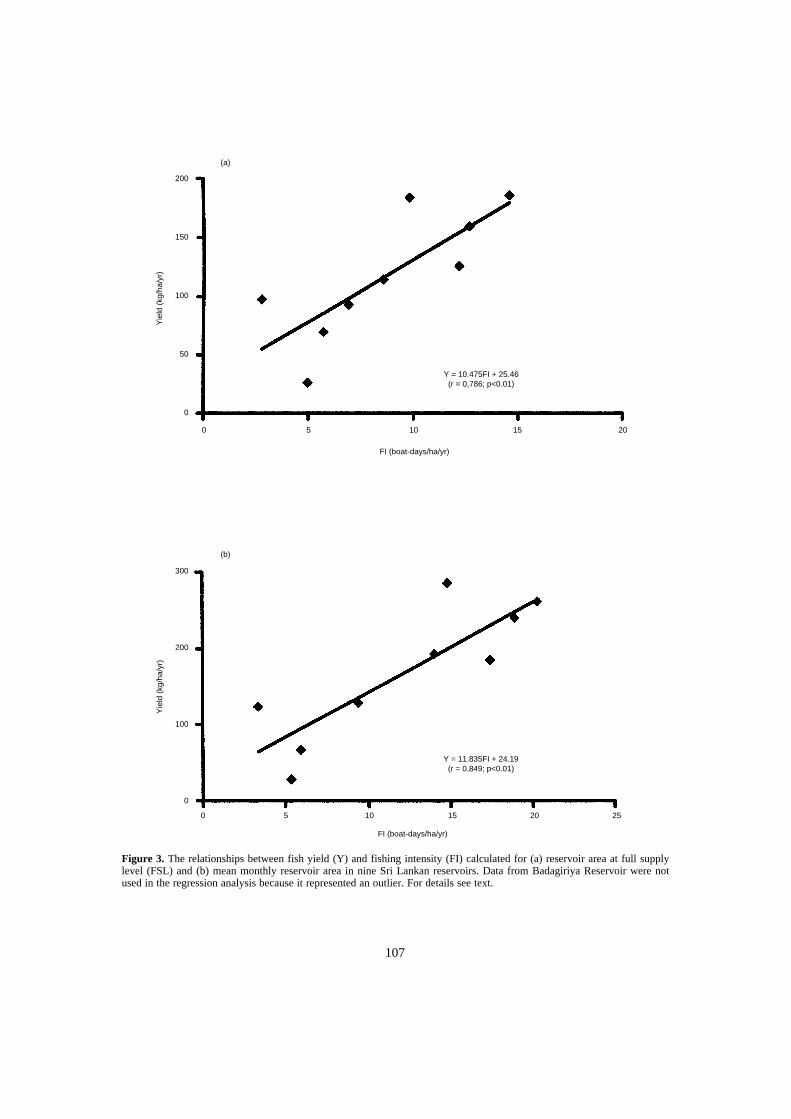
107
Figure 3. The relationships between fish yield (Y) and fishing intensity (FI) calculated for (a) reservoir area at full supplylevel (FSL) and (b) mean monthly reservoir area in nine Sri Lankan reservoirs. Data from Badagiriya Reservoir were notused in the regression analysis because it represented an outlier. For details see text.
(a)
200
150
100
50
0
Yie
ld (
kg/h
a/yr
)Y
ield
(kg
/ha/
yr)
0 5 10 15 20
Y = 10.475FI + 25.46(r = 0,786; p<0.01)
FI (boat-days/ha/yr)
0 5 10 15 20
Y = 11.835FI + 24.19(r = 0,849; p<0.01)
FI (boat-days/ha/yr)
(b)
300
200
100
0
25
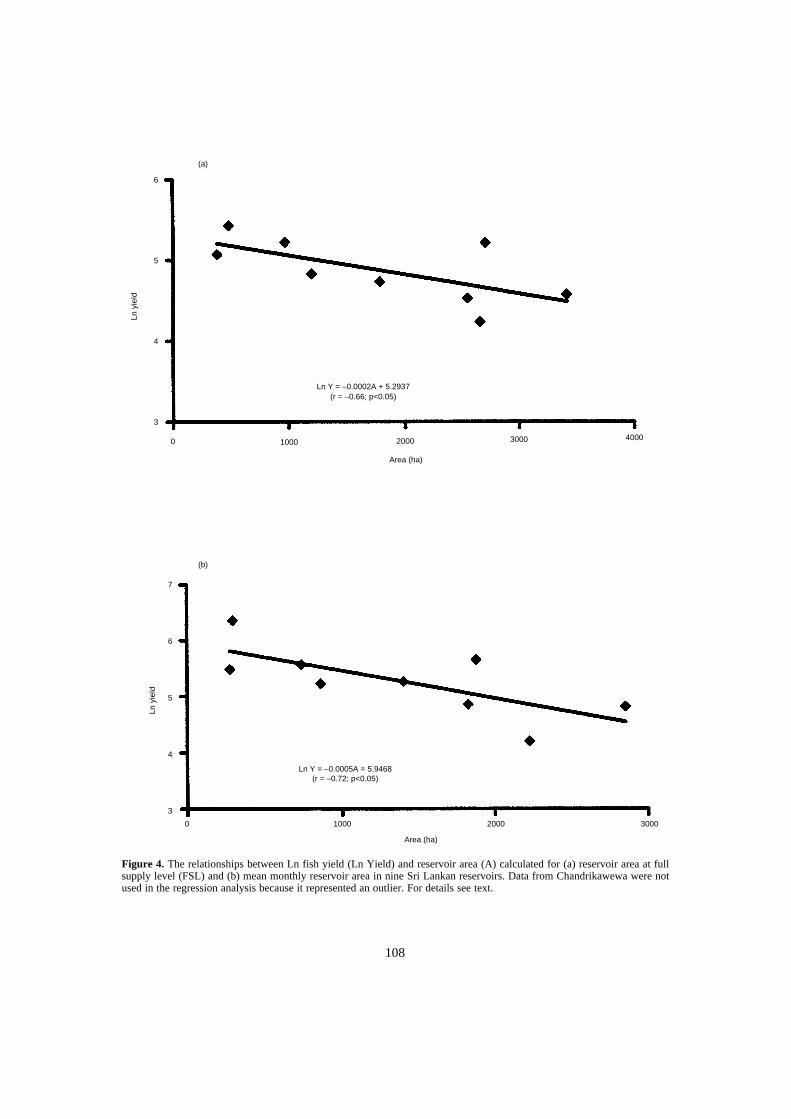
108
Figure 4. The relationships between Ln fish yield (Ln Yield) and reservoir area (A) calculated for (a) reservoir area at fullsupply level (FSL) and (b) mean monthly reservoir area in nine Sri Lankan reservoirs. Data from Chandrikawewa were notused in the regression analysis because it represented an outlier. For details see text.
(a)
(b)
6
5
4
3
Ln y
ield
0 1000 2000 3000 4000
Area (ha)
Ln Y = −0.0002A + 5.2937(r = −0.66; p<0.05)
7
6
5
4
3
Ln y
ield
0 1000 2000 3000
Area (ha)
Ln Y = −0.0005A = 5.9468(r = −0.72; p<0.05)
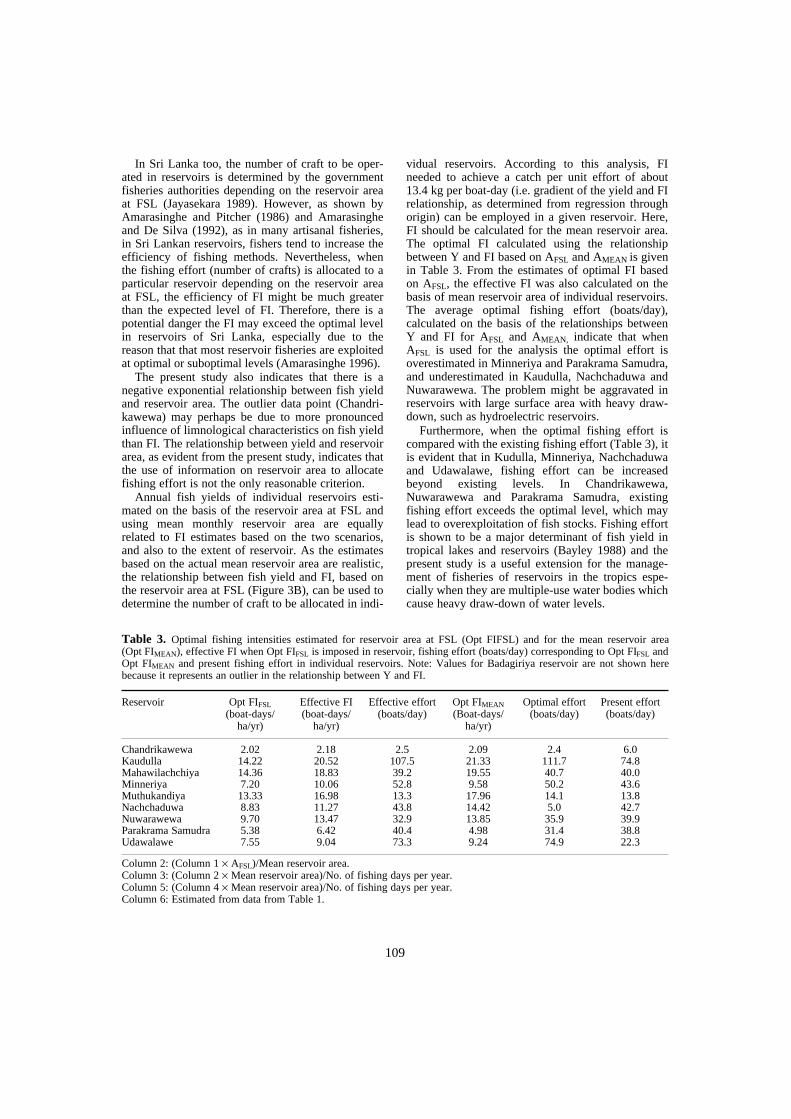
109
In Sri Lanka too, the number of craft to be oper-ated in reservoirs is determined by the governmentfisheries authorities depending on the reservoir areaat FSL (Jayasekara 1989). However, as shown byAmarasinghe and Pitcher (1986) and Amarasingheand De Silva (1992), as in many artisanal fisheries,in Sri Lankan reservoirs, fishers tend to increase theefficiency of fishing methods. Nevertheless, whenthe fishing effort (number of crafts) is allocated to aparticular reservoir depending on the reservoir areaat FSL, the efficiency of FI might be much greaterthan the expected level of FI. Therefore, there is apotential danger the FI may exceed the optimal levelin reservoirs of Sri Lanka, especially due to thereason that that most reservoir fisheries are exploitedat optimal or suboptimal levels (Amarasinghe 1996).
The present study also indicates that there is anegative exponential relationship between fish yieldand reservoir area. The outlier data point (Chandri-kawewa) may perhaps be due to more pronouncedinfluence of limnological characteristics on fish yieldthan FI. The relationship between yield and reservoirarea, as evident from the present study, indicates thatthe use of information on reservoir area to allocatefishing effort is not the only reasonable criterion.
Annual fish yields of individual reservoirs esti-mated on the basis of the reservoir area at FSL andusing mean monthly reservoir area are equallyrelated to FI estimates based on the two scenarios,and also to the extent of reservoir. As the estimatesbased on the actual mean reservoir area are realistic,the relationship between fish yield and FI, based onthe reservoir area at FSL (Figure 3B), can be used todetermine the number of craft to be allocated in indi-
vidual reservoirs. According to this analysis, FIneeded to achieve a catch per unit effort of about13.4 kg per boat-day (i.e. gradient of the yield and FIrelationship, as determined from regression throughorigin) can be employed in a given reservoir. Here,FI should be calculated for the mean reservoir area.The optimal FI calculated using the relationshipbetween Y and FI based on AFSL and AMEAN is givenin Table 3. From the estimates of optimal FI basedon AFSL, the effective FI was also calculated on thebasis of mean reservoir area of individual reservoirs.The average optimal fishing effort (boats/day),calculated on the basis of the relationships betweenY and FI for AFSL and AMEAN, indicate that whenAFSL is used for the analysis the optimal effort isoverestimated in Minneriya and Parakrama Samudra,and underestimated in Kaudulla, Nachchaduwa andNuwarawewa. The problem might be aggravated inreservoirs with large surface area with heavy draw-down, such as hydroelectric reservoirs.
Furthermore, when the optimal fishing effort iscompared with the existing fishing effort (Table 3), itis evident that in Kudulla, Minneriya, Nachchaduwaand Udawalawe, fishing effort can be increasedbeyond existing levels. In Chandrikawewa,Nuwarawewa and Parakrama Samudra, existingfishing effort exceeds the optimal level, which maylead to overexploitation of fish stocks. Fishing effortis shown to be a major determinant of fish yield intropical lakes and reservoirs (Bayley 1988) and thepresent study is a useful extension for the manage-ment of fisheries of reservoirs in the tropics espe-cially when they are multiple-use water bodies whichcause heavy draw-down of water levels.
Column 2: (Column 1 × AFSL)/Mean reservoir area.Column 3: (Column 2 × Mean reservoir area)/No. of fishing days per year.Column 5: (Column 4 × Mean reservoir area)/No. of fishing days per year.Column 6: Estimated from data from Table 1.
Table 3. Optimal fishing intensities estimated for reservoir area at FSL (Opt FIFSL) and for the mean reservoir area(Opt FIMEAN), effective FI when Opt FIFSL is imposed in reservoir, fishing effort (boats/day) corresponding to Opt FIFSL andOpt FIMEAN and present fishing effort in individual reservoirs. Note: Values for Badagiriya reservoir are not shown herebecause it represents an outlier in the relationship between Y and FI.
Reservoir Opt FIFSL(boat-days/
ha/yr)
Effective FI(boat-days/
ha/yr)
Effective effort (boats/day)
Opt FIMEAN(Boat-days/
ha/yr)
Optimal effort(boats/day)
Present effort(boats/day)
Chandrikawewa 2.02 2.18 2.5 2.09 2.4 6.0Kaudulla 14.22 20.52 107.5 21.33 111.7 74.8Mahawilachchiya 14.36 18.83 39.2 19.55 40.7 40.0Minneriya 7.20 10.06 52.8 9.58 50.2 43.6Muthukandiya 13.33 16.98 13.3 17.96 14.1 13.8Nachchaduwa 8.83 11.27 43.8 14.42 5.0 42.7Nuwarawewa 9.70 13.47 32.9 13.85 35.9 39.9Parakrama Samudra 5.38 6.42 40.4 4.98 31.4 38.8Udawalawe 7.55 9.04 73.3 9.24 74.9 22.3
110
Acknowledgment
This study was carried out as part of a researchproject funded by the Australian Centre for Inter-national Agricultural Research (ACIAR ProjectNo. 9440).
ReferencesAmarasinghe, U.S. 1996. Stock assessment in Sri Lankan
reservoir fisheries: a review. In: Cowx, I.G. ed. StockAssessment in Inland Fisheries, Fishing News Books,Blackwell Science Ltd, Oxford, 345–356.
Amarasinghe, U.S. and De Silva, S.S. 1992. Empiricalapproaches for evaluating the efficiencies of differentfishing methods in tropical shallow reservoirs: a SriLankan case study. In: De Silva, S.S. ed. ReservoirFisheries of Asia, International Development ResearchCentre, Ottawa, Canada, 217–227.
—— 1999. The Sri Lankan reservoir fishery: a case forintroduction of a co-management strategy. FisheriesManagement and Ecology, 6: 387–399.
Amarasinghe, U.S. and Pitcher, T.J. 1986. Assessment offishing effort in Parakrama Samudra, an ancient man-made lake in Sri Lanka. Fisheries Research, 4: 271–282.
Bayley, P.B. 1988. Accounting for effort when comparingtropical fisheries in lakes, river-floodplains and lagoons.Limnology and Oceanography, 33: 963–972.
Beam, J.H. 1983. The effect of annual water level manage-ment on population trends of white crappie in Elk CityReservoir, Kansas. North American Journal of FisheriesManagement, 3(1): 34–40.
Bernacsek, G.M. and Lopes, S. 1984. Cahora Bassa(Mozambique). In: Kapetsky, J.M. and Petr, T. ed. Statusof African Reservoir Fisheries, CIFA Technical PaperNo. 10, FAO, Rome, 21–42.
De Silva, S.S. 1985. Observations on the abundance of theexotic cichlid Sarotherodon mossambicus (Peters) inrelation to fluctuations in the water-level in a man-madelake in Sri Lanka. Aquaculture and Fisheries Manage-ment, 16: 265–272.
—— 1988. Reservoirs of Sri Lanka and Their Fisheries.FAO Fisheries Technical Paper No. 298, 128 p.
De Silva, S.S. and Sirisena, H.K.G. 1988. Observations onthe nesting habits of Oreochromis mossambicus (Peters)(Pisces: Cichlidae) in Sri Lankan reservoirs. Journal ofFish Biology, 33(5): 689–696.
Duncan, A. and Kubecka, J. 1995. Land/water ecotoneeffects in reservoirs on the fish fauna. Hydrobiologia,303:11–30.
Henderson, H.F. and Welcomme, R.L. 1974. The Relation-ship of Yield to Morphoedaphic Index and Numbers ofFishermen in African Inland Waters. CIFA OccasionalPaper No. 1, FAO, Rome, 19 p.
Jayasekara, A.M. 1989. The status of freshwater capturefisheries in Sri Lanka. In: Indo-Pacific Fishery Commis-sion papers contributed to Workshop on the Use ofCyprinids in the Fisheries Management of Larger InlandWater Bodies of the Indo-Pacific, Kathmandu, Nepal,8–10 September 1988, and country reports presented atthe Fourth Session of the Indo-Pacific Fishery Com-mission Working Party of Experts on Inland Fisheries,Kathmandu, Nepal, 8–14 September 1988, Petr, T. ed.FAO Fisheries Report, No. 405 Supplement. FAO,Rome, 169–179.
McLachlan, A.J. 1971. The rate of nutrient release fromgrass and dung following immersion in lake water.Hydrobiologia, 37: 521–530.
Moreau, J. and De Silva, S.S. 1991. Predictive Fish YieldModels for Lakes and Reservoirs of the Philippines, SriLanka and Thailand. FAO Fisheries Technical PaperNo. 319, 42 p.
Nissanka, C., Amarasinghe, U.S. and De Silva, S.S. Yieldpredictive models for the Sri Lankan reservoir fishery.Fisheries Management and Ecology, 7: 425–436.
Oglesby, R.T. 1985. Management of lacustrine fisheries inthe tropics. Fisheries, 10: 16–19.
Pauly, D. 1984. Recent developments in the methodologyavailable for the assessment of exploited fish stocks inreservoirs. In: Kapetsky, J.M. and Petr, T. ed. Status ofAfrican Reservoir Fisheries, CIFA Technical PaperNo. 10, FAO, Rome, 321–326.
Sugunan, V.V. 1993. Reservoir Fisheries of India. FAOFisheries Technical Paper No. 345, 423 p.
Welcomme, R.L. and Bartley, D.M. 1998. Currentapproaches to the enhancement of fisheries. FisheriesManagement and Ecology, 5: 351–382.
Wijeyaratne, M.J.S. and Amarasinghe, U.S. 1987. Estima-tion of maximum sustainable fish yield and stockingdensities of fingerlings in freshwater lakes and reservoirs.Archiv für Hydrobiologie, 28: 305–308.
Zar, J.H. 1984. Biostatistical Analysis, 2nd edn. Prentice-Hall, Englewood Cliffs, New Jersey, 718 p.

111
Human Factor: the Fourth Dimension of Reservoir Limnology in the Tropics
E.I.L. Silva1 and F. Schiemer2
Abstract
Hydro-geochemistry, morphometry and geographic position are the three fundamental determi-nants of limnological processes and dynamics of lake ecosystems. Reservoirs, man-made inlandwater bodies constructed for a variety of human benefits, have resulted in manifold environmentalimpacts changing the ecosystem continuum at different levels. Trophic characteristics such asnutrients, abundance and species dominance of planktonic algae and chlorophyll-a were examinedat 32 reservoirs (e.g. irrigation, hydropower) in eight river basins in Sri Lanka. Similar parameterswere examined monthly in a man-made aesthetic water body (Kandy Lake) for two years. Theprimary objective of this comparative cross-section and time series study at the Kandy Lake was todetermine the impact of human manipulation of water budget on trophic characteristics of reservoirecosystems. The abundance and species dominance of planktonic algae varied from reservoir toreservoir. Aulacoseira granulata was the dominant phytoplankton in a majority of reservoirs whileMicrocystis aeruginosa was the most important cyanobacterium in hypertrophic reservoirs.Trophic status changed from mesotrophic to hypertrophic but the majority of reservoirs wereeutrophic. M. granulata and Pediastrum simplex were oscillating in the Kandy Lake. Althoughnitrate-nitrogen concentration was relatively low in remote irrigation reservoirs, phosphorus playsa significant role with respect to hyper-eutrophication of the Kandy Lake. The concentration ofmajor nutrients (i.e. nitrate and total phosphorus) did not show a statistically significant correlationwith chlorophyll-a content. The abundance and species dominance of planktonic algae varied fromreservoir to reservoir. A. granulata was the dominant phytoplankton in a majority of reservoirswhile M. aeruginosa was the most important cyanobaterium in hypertrophic reservoirs. Trophicstatus changed from mesotrophic to hypertrophic but the majority of reservoirs were eutrophic.The comparison of the age of reservoirs with respective chlorophyll-a content revealed that thetrophic evolution is essentially not a time-dependent phenomenon. An outbreak of M. aeruginosabloom occurred in the Kandy Lake in 1999 for the first time with the onset of the southwestmonsoon as a result of the changes in the hydraulic balance during the dry period. Therefore, therole of man in the water balance of the reservoirs must be considered as an important issue insustainable management of tropical reservoir ecosystems.
HUMANITY has tinkered with inland waters for thou-sands of years. Dams are among the biggest andmost spectacular structures ever built by mankind.The earliest dam that history records was built inEgypt about 4500 years ago. The off-cited rationalesfor building dams for creating reservoirs, impound-ment, barrages etc., throughout the world are mainly
for human benefit (e.g. irrigation, hydropower gener-ation, flood control, storage, drinking water supply,recreation and transport). Contribution of these man-made inland water bodies to societal uplifting andimproving the quality of life is unprecedented. It ismore predominant in developing nations blessedwith few material resources and altered dramaticallyby devastating natural hazards such as floods. Theuse of these artificial inland water bodies forfisheries and aquaculture development, especially indeveloping countries, is one of the gratifying aspectsof reservoir building. Sri Lanka used to obtain about20% of its national fish production until the recent
1Institute of Fundamental Studies, Hantana Road, Kandy,Sri Lanka. Fax: 94-8-232131, email: [email protected] of Limnology, Institute of Zoology, Universityof Vienna, Althanstrabe 14, A-1090, Wien, Austria

112
past exclusively from man-made inland water bodies(De Silva 1988; De Silva and Amarasinghe 1996).Nevertheless, manifold impacts resulting from reser-voir building have changed the ecosystem continuumat various levels even in the tropics (Baxter 1977;Davies 1980; Obeng 1981; Rudd et al. 1993).
These intermittent lotic-lentic ecosystems aremore riverine when they are built by arresting head-water streams or fast-flowing rivers. A lacustrinenature is predominant when reservoirs are built in thelowlands inundating shallow basins channellingdiverted water. Limnnology of these man-made waterbodies is also primarily determined by three funda-mental determinants, namely: hydro-geochemistry ofthe drainage basin, landscape of the inundated areaand the geographical position of the water body.Therefore, it is assumed that ecological processes anddynamics of these reservoirs are more or less similarto those of natural lakes in the tropics, as describedby several authors (Ganf and Viner 1973; Ashton1985; Talling 1966, 1969, 1986, 1990, 1992; Tallingand Lemoalle 1998; Lewis 1973, 1974, 1978, 1996;Kalff 1983, 1991; Kalff and Brumelis 1993; Kalffand Watson 1986; Melack 1979, 1996). However,many of the differences between reservoirs and lakesare less obvious. Indeed, reservoirs are limnologi-cally quite different from natural lakes, with respectto their larger shoreline, basin shape, shorter reten-tion time and impulsive draw-down (Pielou 1998).
Tropical reservoirs are poorly studied compared tothe present density of man-made water bodiesthroughout the tropics (Melack 1996; Talling andLemoalle 1998). Fernando (1980) pointed out twomajor reasons for the poor knowledge of Asianlimnology: the low density of natural lakes in theregion and poor development of inland fisheries tillquite recently, but lack of expertise seems to be amajor factor. Besides, the available information haslittle deviation from conventional limnologicalstudies (Sreenivasan 1965, 1974; Coche 1974;Tundisi et al. 1978; Kannan and Job 1980; Latif1984). The limnological study of Parakrama Samudra(Sri Lanka), an ancient man-made lake in the tropics(Schiemer 1983) highlighted the role of operationactivities in limnological processes. Consequently,various aspects of reservoir limnology in the tropicshave been studied (Silva and Davies 1986, 1987;Silva 1991; Piyasiri 1995; Branco and Senna 1994,1996; Boland 1996; Boland and Griffiths 1996; Hart1996; Townsend 1996; Townsend et al. 1996).Limnological studies of reservoirs are also becomingan increasingly important issue since inland watersglobally are being subjected not only to gallopingeutrophication and pollution but also there isevidence of catastrophic collapse of reservoir eco-systems. Nevertheless, the knowledge of one of the
important human activities, manipulation ofhydraulic balance on limnological processes anddynamics of tropical reservoirs is poorly understood.The trophic discrepancies of different reservoirs inSri Lanka are first compared in this paper and theimpact of the man-influenced changes in hydraulicbalance or trophic characteristics of reservoir eco-systems is then highlighted.
Materials and Methods
Study site
Sri Lanka (6°–10° N; 80°–82° E) has no natural lakes.The permanent standing water bodies are essentiallyman-made. Three distinct forms of perennial waterbodies are in the country (i.e. ancient irrigation tankswhich are restored, tanks and reservoirs built duringthe recent past, and newly built hydropower, irriga-tion and storage reservoirs under the River Develop-ment Projects. In addition to the major inland waterbodies, there are thousands of medium-scale per-ennial and seasonal tanks in the lowland drainagebasins. Today, these man-made water bodies withtheir canals and channel systems have formed a some-what sophisticated and complicated hydrological net-work in the country. Limnologically, these reservoirsdiffer fundamentally in their basin and catchmentmorphology, depth, flow-through regime and nutrientstatus, underwater light regime and consequently,their biological productivity (Duncan et al. 1993).The V-shape mountain basins of the upland reservoirshave small areas of littoral zone and a greatly reducedextent of bottom sediment compared to those shallowirrigation reservoirs in the lowland dry zone (Duncanet al. 1993).
The present study was carried out at 29 irrigationreservoirs in the north central lowland, three hydro-power reservoirs and a man-made aesthetic waterbody (Kandy Lake) in the central highlands (Figure1). The reservoirs under study are in eight riverbasins between 10 m and 600 m above mean sealevel within a wider geoclimatic range (Figure 1 andTable 1). Of the eight rivers, only the Mahaweli, thelongest and the largest in the country, has a perennialflow. The Mahaweli River has been diverted to feedthe downstream reservoirs in seasonal river basinsfor irrigation purposes. Three hydropower reservoirsand the Kandy Lake are located in the Central High-land. Table 1 also shows basic physical features (i.e.altitude, catchment area, mean and maximum depthsand surface area) with respective ages (number ofyears since their construction or restoration to year2000) and some limnological characteristics. TheKandy Lake (19.17 ha), an aesthetic water body inthe hill capital (Kandy), 510 m altitude, is about
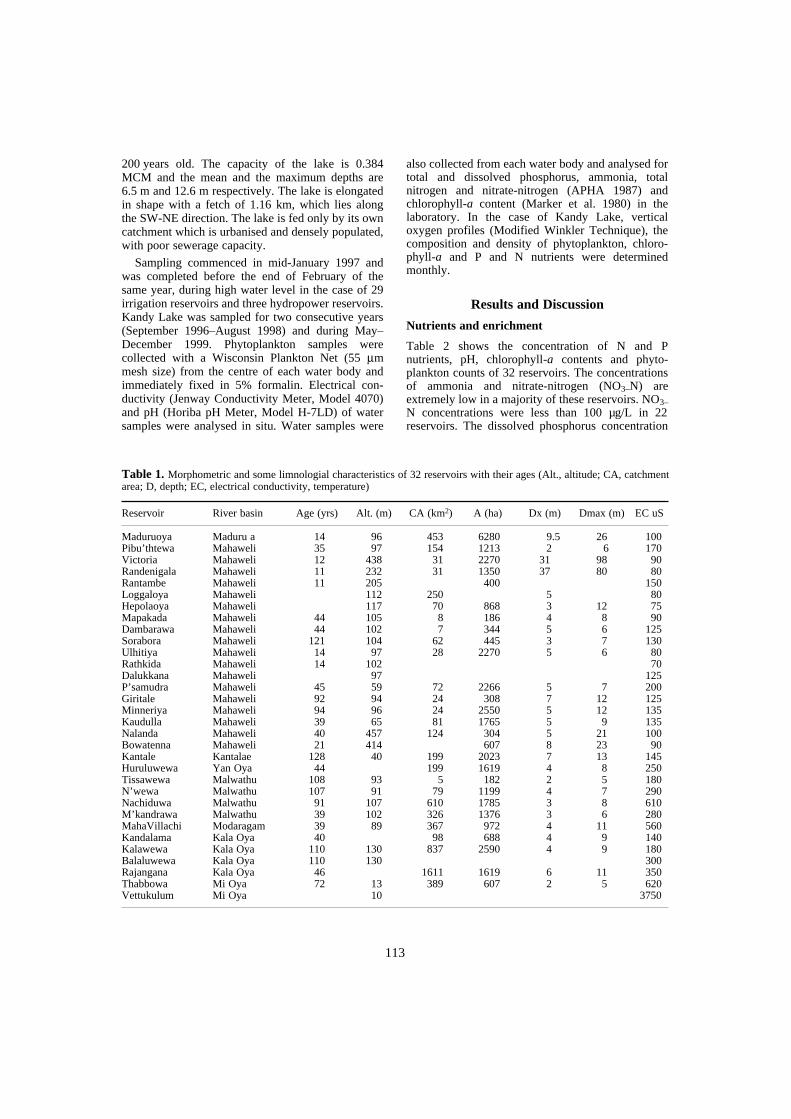
113
200 years old. The capacity of the lake is 0.384MCM and the mean and the maximum depths are6.5 m and 12.6 m respectively. The lake is elongatedin shape with a fetch of 1.16 km, which lies alongthe SW-NE direction. The lake is fed only by its owncatchment which is urbanised and densely populated,with poor sewerage capacity.
Sampling commenced in mid-January 1997 andwas completed before the end of February of thesame year, during high water level in the case of 29irrigation reservoirs and three hydropower reservoirs.Kandy Lake was sampled for two consecutive years(September 1996–August 1998) and during May–December 1999. Phytoplankton samples werecollected with a Wisconsin Plankton Net (55 µmmesh size) from the centre of each water body andimmediately fixed in 5% formalin. Electrical con-ductivity (Jenway Conductivity Meter, Model 4070)and pH (Horiba pH Meter, Model H-7LD) of watersamples were analysed in situ. Water samples were
also collected from each water body and analysed fortotal and dissolved phosphorus, ammonia, totalnitrogen and nitrate-nitrogen (APHA 1987) andchlorophyll-a content (Marker et al. 1980) in thelaboratory. In the case of Kandy Lake, verticaloxygen profiles (Modified Winkler Technique), thecomposition and density of phytoplankton, chloro-phyll-a and P and N nutrients were determinedmonthly.
Results and Discussion
Nutrients and enrichment
Table 2 shows the concentration of N and Pnutrients, pH, chlorophyll-a contents and phyto-plankton counts of 32 reservoirs. The concentrationsof ammonia and nitrate-nitrogen (NO3–N) areextremely low in a majority of these reservoirs. NO3–N concentrations were less than 100 µg/L in 22reservoirs. The dissolved phosphorus concentration
Table 1. Morphometric and some limnologial characteristics of 32 reservoirs with their ages (Alt., altitude; CA, catchmentarea; D, depth; EC, electrical conductivity, temperature)
Reservoir River basin Age (yrs) Alt. (m) CA (km2) A (ha) Dx (m) Dmax (m) EC uS
Maduruoya Maduru a 14 96 453 6280 9.5 26 100Pibu’thtewa Mahaweli 35 97 154 1213 2 6 170Victoria Mahaweli 12 438 31 2270 31 98 90Randenigala Mahaweli 11 232 31 1350 37 80 80Rantambe Mahaweli 11 205 400 150Loggaloya Mahaweli 112 250 5 80Hepolaoya Mahaweli 117 70 868 3 12 75Mapakada Mahaweli 44 105 8 186 4 8 90Dambarawa Mahaweli 44 102 7 344 5 6 125Sorabora Mahaweli 121 104 62 445 3 7 130Ulhitiya Mahaweli 14 97 28 2270 5 6 80Rathkida Mahaweli 14 102 70Dalukkana Mahaweli 97 125P’samudra Mahaweli 45 59 72 2266 5 7 200Giritale Mahaweli 92 94 24 308 7 12 125Minneriya Mahaweli 94 96 24 2550 5 12 135Kaudulla Mahaweli 39 65 81 1765 5 9 135Nalanda Mahaweli 40 457 124 304 5 21 100Bowatenna Mahaweli 21 414 607 8 23 90Kantale Kantalae 128 40 199 2023 7 13 145Huruluwewa Yan Oya 44 199 1619 4 8 250Tissawewa Malwathu 108 93 5 182 2 5 180N’wewa Malwathu 107 91 79 1199 4 7 290Nachiduwa Malwathu 91 107 610 1785 3 8 610M’kandrawa Malwathu 39 102 326 1376 3 6 280MahaVillachi Modaragam 39 89 367 972 4 11 560Kandalama Kala Oya 40 98 688 4 9 140Kalawewa Kala Oya 110 130 837 2590 4 9 180Balaluwewa Kala Oya 110 130 300Rajangana Kala Oya 46 1611 1619 6 11 350Thabbowa Mi Oya 72 13 389 607 2 5 620Vettukulum Mi Oya 10 3750
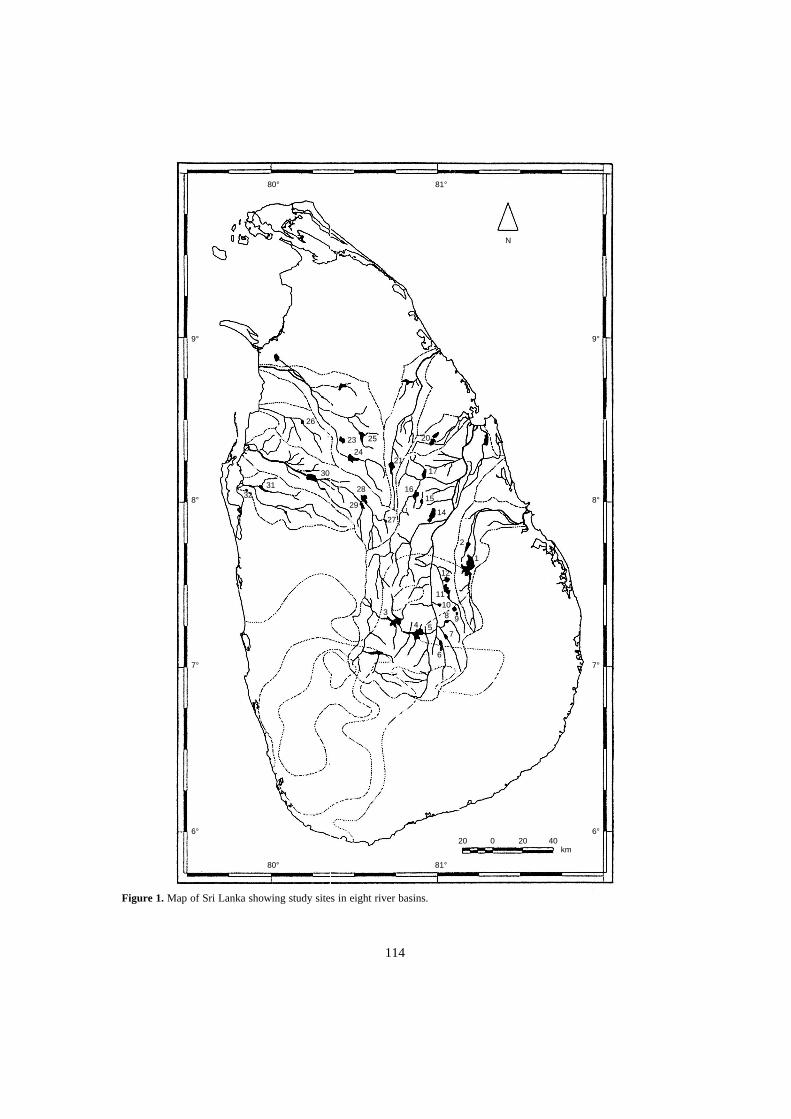
114
Figure 1. Map of Sri Lanka showing study sites in eight river basins.
N
80° 81°
9°
8°
7°
6°
9°
8°
7°
6°
80° 81°
km20 0 20 40
26
23 25
24
30
3231
29
28
21
20
17
27
1615
14
2
1
12
1110
98
7
6
54
3

115
ranged 3–40 µg/L but it was less than 10 µg/L in 25reservoirs and 3–5 µg/L in 13 reservoirs (Table 2).The concentration of total phosphorus was less than50 µg/L in 27 reservoirs and the lowest was 8 µg/Lin the Ulhitiya reservoir. Figure 2 is the scatter dia-grams of nutrients and chlorophyll-a. No significantrelationships were found for chlorophyll-a contentversus NO3–N and D-P or T-P. Dillon and Riggler(1980) found statistically significant positivecorrelation for log chlorophyll-a content and logphosphorus for temperate lakes. Values for Parak-rama Samudra (Sri Lanka) were close to the Dillon-Riggler line during the period of no flushing in 1982.However, they were well below in 1979, due to highflushing of algal biomass and in 1980, due to loss ofalgal biomass through combination of herbivorousfish grazing and flushing, even though the T-P levelshad increased (Duncan et al. 1993).
The long-term variations of N and P nutrients insurface and bottom waters of the Kandy Lake are
shown in Table 3. NH4–N and NO3–N concentrationsof the Kandy Lake in both surface and bottom waterswere extremely high compared to those irrigationand hydropower reservoirs. However, changes inNH4–N and NO3–N did not show a marked seasonalpattern. The concentrations of NH4–N and NO3–Nwere always higher in the bottom waters comparedto the surface water in the Kandy Lake. The NH4-Nconcentration in the surface water ranged 12–774 µg/L and it was between 421 µg/L and 2711µg/L for the bottom waters. In contrast, NO3–N con-centration in the bottom water were relatively lowcompared to the surface water. The highest concen-tration of NO3–N in the surface water rangedbetween 37 µg/L and 1277 µg/L and it rangedbetween non-detectable level (ND) to 353 µg/L inbottom waters. The concentrations of D-P rangedbetween ND and 22 µg/L in the surface water andthe range was between ND and 19 µg/L in thebottom water. The concentrations of T-P were high
Anab, Anabeaonopsis sp.; Anbb, Anabeana sp.; Aulc. Aulacoseira granulata; Cos. Cosmarium; Cymb. Cymbella sp.;Micr. Microsystis aeruginosa; Navi, Navicula sp.; Pedi, Pediastrum sim; Peri, Peridinium; Scen, Scenedesmus sp.; Stra,Staurastrum sp.
Table 2. Occurrence of major groups of phytoplankton and their counts (per 100 mL) in 32 reservoirs.
Reservoir Rank 1 Family Rank 2 Rank 3 Rank 4 Counts
Maduruoya Micr Cyanophyceae Anab Aucl Anabena 3571Pibu’thtewa Micr Cyanophyceae Anab Melo Anab 3400Victoria Stra Zygenemaphyceae Aulc Pedi Cosm 261Randenigala Aulc Diatomophyceae Pedi Stra Micr 222Rantambe Stra Diatomophyceae Anab Cymb Aulc 232Loggaloya Peri Diophyceae Stra Cymb Navi 432Hepolaoya Peri Diophyceae Stra Micr Pedi 330Mapakada Aulc Diatomophyceae Pedi Cymb Stra 1056Dambarawa Aulc Diatomophyceae Micr Pedi Peri 1490Sorabora Micr Cyanophyceae Melo Anab Pedi 472Ulhitiya Aulc Diatomophyceae Pedi Cymb Anab 748Rathkida Cymb Diatomophyceae Aulc Stra Pedi 1002Dalukkana Aulc Diatomophyceae Anab Cymb Pedi 308P’samudra Aulc Diatomophyceae Pedi Anab Micr 412Giritale Micr Cyanophyceae Aulc Anab Pedi 3871Minneriya Micro Cyanophyceae Aulc Pedi Anab 651Kaudulla Aulc Diatomophyceae Moug Pedi Peri 543Nalanda Micr Cyanophyceae Aulc Pedi Peri 1080Bowatenna Aulc Diatomophyceae Pedi Micr Stra 990Kantale Micr Cyanophyceae Aulc Pedi Anab 3321Huruluwewa Aulc Diatomophyceae Micr Pedi Anab 494Tissawewa Aulc Diatomophyceae Anab Micr Pedi 232N’wewa Anab Cyanophyceae Aulc Pedi Micr 194Nachiduwa Aulc Diatomophyceae Micr Anab Pedi 674M’kandrawa Aulc Diatomophyceae Micr Pedi Anab 2004MahaVillachi Anab Cyanophyceae Aulc Pedi Micr 260Kandalama Aulc Diatomophyceae Pedi Micr Anab 1936Kalawewa Aulc Diatomophyceae Pedi Micr Anab 2474Balaluwewa Aulc Diatomophyceae Anab Micr Pedi 948Rajangana Anab Diatomophyceae Micr Aulc Pedi 2510Thabbowa Aulc Diatomophyceae Pedi Anab Peri 1464Vettukulum Scen Zygenemaphyceae Aulc Pedi Micr 882
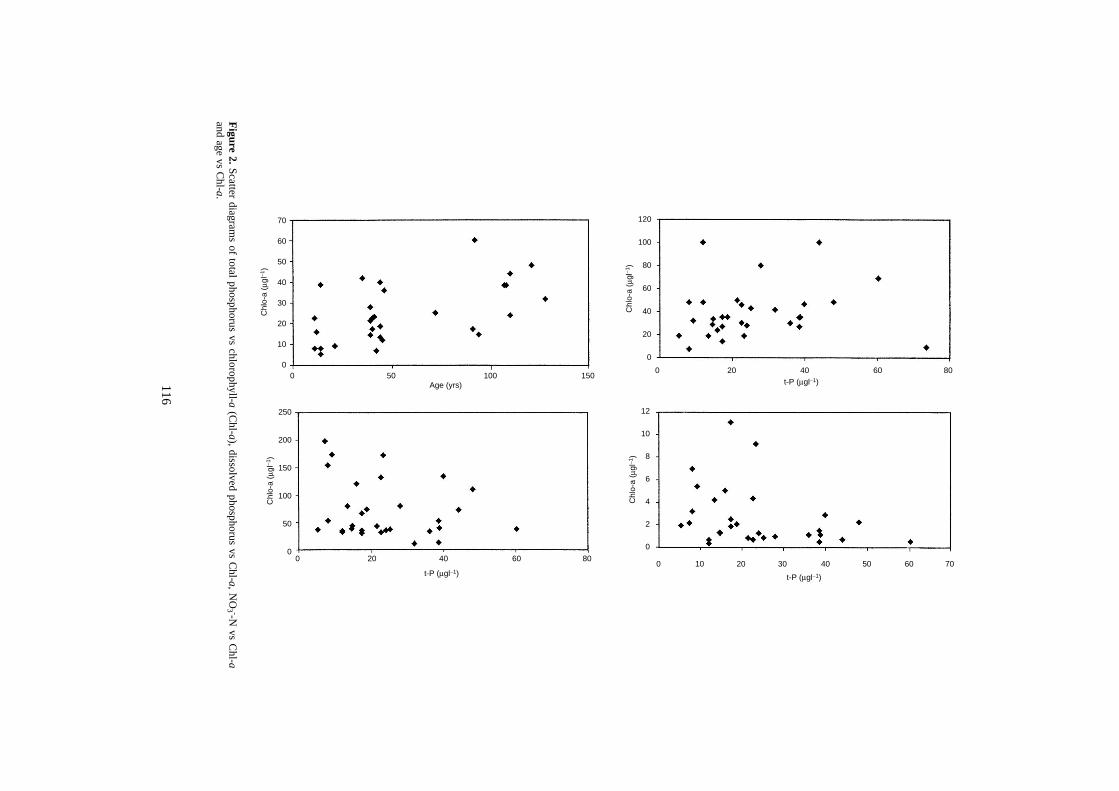
116
Figure 2. Scatter diagram
s of total phosphorus vs chlorophyll-a (Chl-a), dissolved phosphorus vs C
hl-a, NO
3 --N vs C
hl-aand age vs C
hl-a.
70
806040200
6050403020100
120
100
80
60
40
20
0
12
10
8
6
4
2
0
Chl
o-a
(µgl
−1)
t-P (µgl−1)
t-P (µgl−1)
Chl
o-a
(µgl
−1)
150100500
70
60
50
40
30
20
10
0
Chl
o-a
(µgl
−1)
Age (yrs)
806040200
250
200
150
100
50
0
Chl
o-a
(µgl
−1)
t-P (µgl−1)
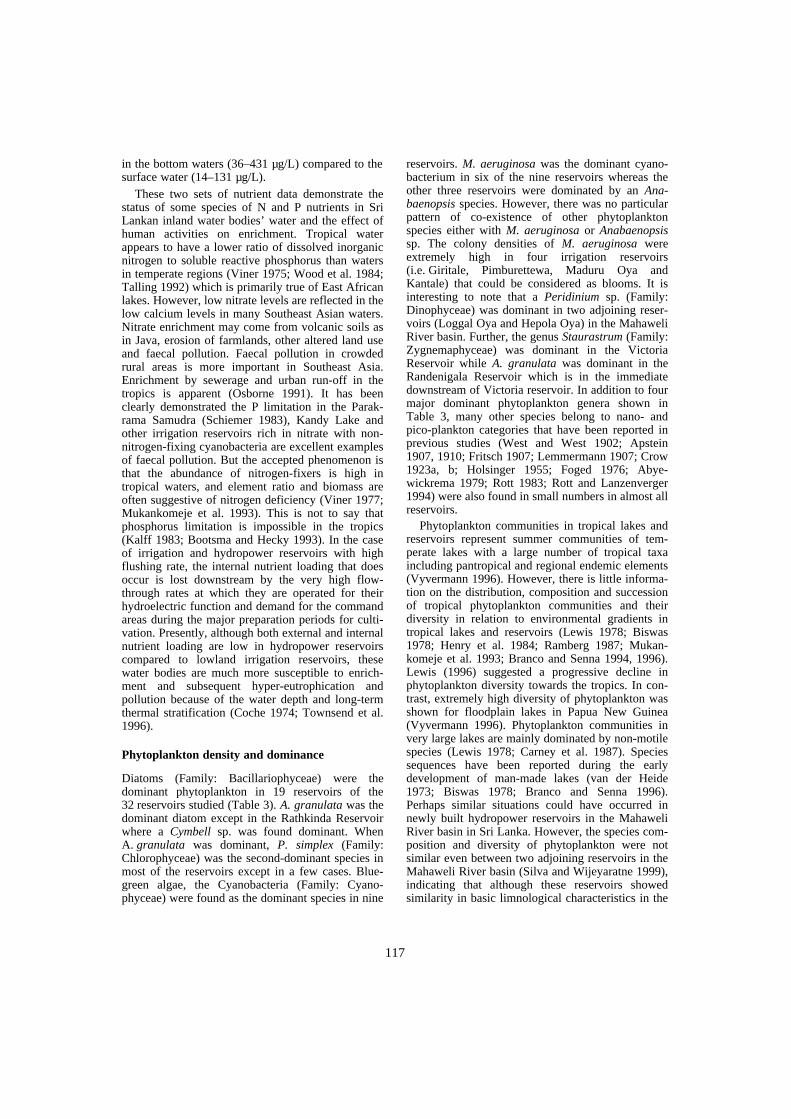
117
in the bottom waters (36–431 µg/L) compared to thesurface water (14–131 µg/L).
These two sets of nutrient data demonstrate thestatus of some species of N and P nutrients in SriLankan inland water bodies’ water and the effect ofhuman activities on enrichment. Tropical waterappears to have a lower ratio of dissolved inorganicnitrogen to soluble reactive phosphorus than watersin temperate regions (Viner 1975; Wood et al. 1984;Talling 1992) which is primarily true of East Africanlakes. However, low nitrate levels are reflected in thelow calcium levels in many Southeast Asian waters.Nitrate enrichment may come from volcanic soils asin Java, erosion of farmlands, other altered land useand faecal pollution. Faecal pollution in crowdedrural areas is more important in Southeast Asia.Enrichment by sewerage and urban run-off in thetropics is apparent (Osborne 1991). It has beenclearly demonstrated the P limitation in the Parak-rama Samudra (Schiemer 1983), Kandy Lake andother irrigation reservoirs rich in nitrate with non-nitrogen-fixing cyanobacteria are excellent examplesof faecal pollution. But the accepted phenomenon isthat the abundance of nitrogen-fixers is high intropical waters, and element ratio and biomass areoften suggestive of nitrogen deficiency (Viner 1977;Mukankomeje et al. 1993). This is not to say thatphosphorus limitation is impossible in the tropics(Kalff 1983; Bootsma and Hecky 1993). In the caseof irrigation and hydropower reservoirs with highflushing rate, the internal nutrient loading that doesoccur is lost downstream by the very high flow-through rates at which they are operated for theirhydroelectric function and demand for the commandareas during the major preparation periods for culti-vation. Presently, although both external and internalnutrient loading are low in hydropower reservoirscompared to lowland irrigation reservoirs, thesewater bodies are much more susceptible to enrich-ment and subsequent hyper-eutrophication andpollution because of the water depth and long-termthermal stratification (Coche 1974; Townsend et al.1996).
Phytoplankton density and dominance
Diatoms (Family: Bacillariophyceae) were thedominant phytoplankton in 19 reservoirs of the32 reservoirs studied (Table 3). A. granulata was thedominant diatom except in the Rathkinda Reservoirwhere a Cymbell sp. was found dominant. WhenA. granulata was dominant, P. simplex (Family:Chlorophyceae) was the second-dominant species inmost of the reservoirs except in a few cases. Blue-green algae, the Cyanobacteria (Family: Cyano-phyceae) were found as the dominant species in nine
reservoirs. M. aeruginosa was the dominant cyano-bacterium in six of the nine reservoirs whereas theother three reservoirs were dominated by an Ana-baenopsis species. However, there was no particularpattern of co-existence of other phytoplanktonspecies either with M. aeruginosa or Anabaenopsissp. The colony densities of M. aeruginosa wereextremely high in four irrigation reservoirs(i.e. Giritale, Pimburettewa, Maduru Oya andKantale) that could be considered as blooms. It isinteresting to note that a Peridinium sp. (Family:Dinophyceae) was dominant in two adjoining reser-voirs (Loggal Oya and Hepola Oya) in the MahaweliRiver basin. Further, the genus Staurastrum (Family:Zygnemaphyceae) was dominant in the VictoriaReservoir while A. granulata was dominant in theRandenigala Reservoir which is in the immediatedownstream of Victoria reservoir. In addition to fourmajor dominant phytoplankton genera shown inTable 3, many other species belong to nano- andpico-plankton categories that have been reported inprevious studies (West and West 1902; Apstein1907, 1910; Fritsch 1907; Lemmermann 1907; Crow1923a, b; Holsinger 1955; Foged 1976; Abye-wickrema 1979; Rott 1983; Rott and Lanzenverger1994) were also found in small numbers in almost allreservoirs.
Phytoplankton communities in tropical lakes andreservoirs represent summer communities of tem-perate lakes with a large number of tropical taxaincluding pantropical and regional endemic elements(Vyvermann 1996). However, there is little informa-tion on the distribution, composition and successionof tropical phytoplankton communities and theirdiversity in relation to environmental gradients intropical lakes and reservoirs (Lewis 1978; Biswas1978; Henry et al. 1984; Ramberg 1987; Mukan-komeje et al. 1993; Branco and Senna 1994, 1996).Lewis (1996) suggested a progressive decline inphytoplankton diversity towards the tropics. In con-trast, extremely high diversity of phytoplankton wasshown for floodplain lakes in Papua New Guinea(Vyvermann 1996). Phytoplankton communities invery large lakes are mainly dominated by non-motilespecies (Lewis 1978; Carney et al. 1987). Speciessequences have been reported during the earlydevelopment of man-made lakes (van der Heide1973; Biswas 1978; Branco and Senna 1996).Perhaps similar situations could have occurred innewly built hydropower reservoirs in the MahaweliRiver basin in Sri Lanka. However, the species com-position and diversity of phytoplankton were notsimilar even between two adjoining reservoirs in theMahaweli River basin (Silva and Wijeyaratne 1999),indicating that although these reservoirs showedsimilarity in basic limnological characteristics in the
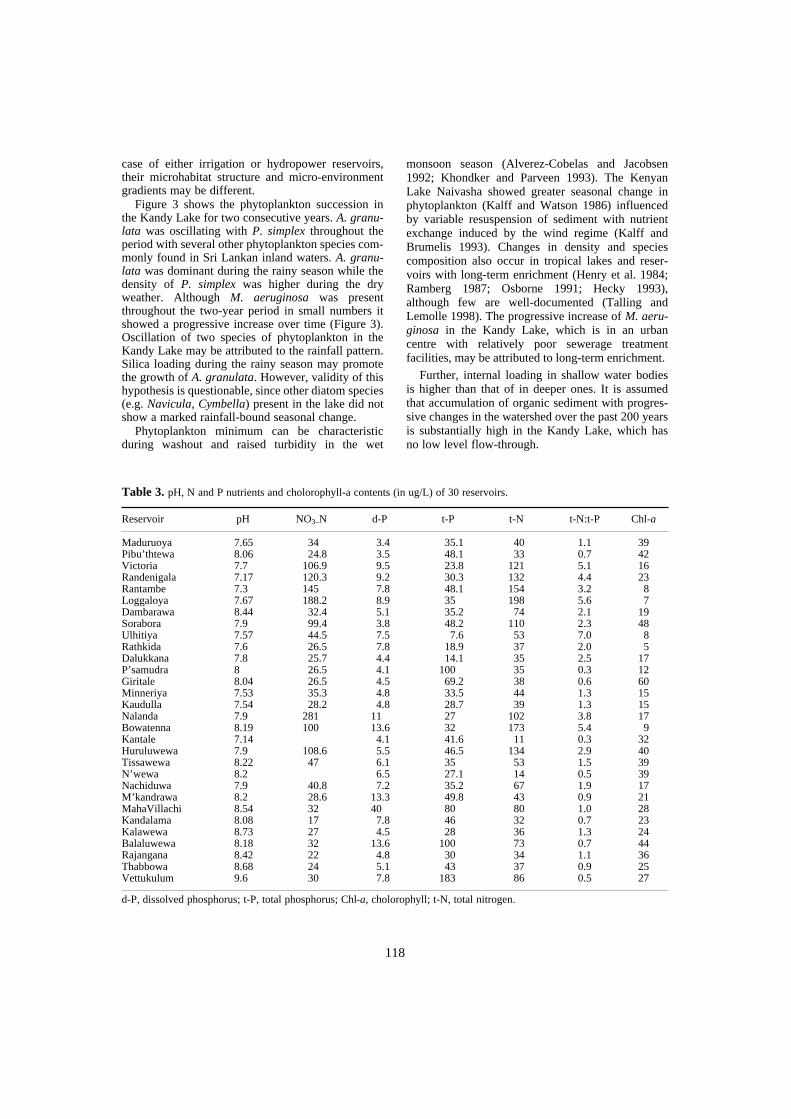
118
case of either irrigation or hydropower reservoirs,their microhabitat structure and micro-environmentgradients may be different.
Figure 3 shows the phytoplankton succession inthe Kandy Lake for two consecutive years. A. granu-lata was oscillating with P. simplex throughout theperiod with several other phytoplankton species com-monly found in Sri Lankan inland waters. A. granu-lata was dominant during the rainy season while thedensity of P. simplex was higher during the dryweather. Although M. aeruginosa was presentthroughout the two-year period in small numbers itshowed a progressive increase over time (Figure 3).Oscillation of two species of phytoplankton in theKandy Lake may be attributed to the rainfall pattern.Silica loading during the rainy season may promotethe growth of A. granulata. However, validity of thishypothesis is questionable, since other diatom species(e.g. Navicula, Cymbella) present in the lake did notshow a marked rainfall-bound seasonal change.
Phytoplankton minimum can be characteristicduring washout and raised turbidity in the wet
monsoon season (Alverez-Cobelas and Jacobsen1992; Khondker and Parveen 1993). The KenyanLake Naivasha showed greater seasonal change inphytoplankton (Kalff and Watson 1986) influencedby variable resuspension of sediment with nutrientexchange induced by the wind regime (Kalff andBrumelis 1993). Changes in density and speciescomposition also occur in tropical lakes and reser-voirs with long-term enrichment (Henry et al. 1984;Ramberg 1987; Osborne 1991; Hecky 1993),although few are well-documented (Talling andLemolle 1998). The progressive increase of M. aeru-ginosa in the Kandy Lake, which is in an urbancentre with relatively poor sewerage treatmentfacilities, may be attributed to long-term enrichment.
Further, internal loading in shallow water bodiesis higher than that of in deeper ones. It is assumedthat accumulation of organic sediment with progres-sive changes in the watershed over the past 200 yearsis substantially high in the Kandy Lake, which hasno low level flow-through.
d-P, dissolved phosphorus; t-P, total phosphorus; Chl-a, cholorophyll; t-N, total nitrogen.
Table 3. pH, N and P nutrients and cholorophyll-a contents (in ug/L) of 30 reservoirs.
Reservoir pH NO3–N d-P t-P t-N t-N:t-P Chl-a
Maduruoya 7.65 34 3.4 35.1 40 1.1 39Pibu’thtewa 8.06 24.8 3.5 48.1 33 0.7 42Victoria 7.7 106.9 9.5 23.8 121 5.1 16Randenigala 7.17 120.3 9.2 30.3 132 4.4 23Rantambe 7.3 145 7.8 48.1 154 3.2 8Loggaloya 7.67 188.2 8.9 35 198 5.6 7Dambarawa 8.44 32.4 5.1 35.2 74 2.1 19Sorabora 7.9 99.4 3.8 48.2 110 2.3 48Ulhitiya 7.57 44.5 7.5 7.6 53 7.0 8Rathkida 7.6 26.5 7.8 18.9 37 2.0 5Dalukkana 7.8 25.7 4.4 14.1 35 2.5 17P’samudra 8 26.5 4.1 100 35 0.3 12Giritale 8.04 26.5 4.5 69.2 38 0.6 60Minneriya 7.53 35.3 4.8 33.5 44 1.3 15Kaudulla 7.54 28.2 4.8 28.7 39 1.3 15Nalanda 7.9 281 11 27 102 3.8 17Bowatenna 8.19 100 13.6 32 173 5.4 9Kantale 7.14 4.1 41.6 11 0.3 32Huruluwewa 7.9 108.6 5.5 46.5 134 2.9 40Tissawewa 8.22 47 6.1 35 53 1.5 39N’wewa 8.2 6.5 27.1 14 0.5 39Nachiduwa 7.9 40.8 7.2 35.2 67 1.9 17M’kandrawa 8.2 28.6 13.3 49.8 43 0.9 21MahaVillachi 8.54 32 40 80 80 1.0 28Kandalama 8.08 17 7.8 46 32 0.7 23Kalawewa 8.73 27 4.5 28 36 1.3 24Balaluwewa 8.18 32 13.6 100 73 0.7 44Rajangana 8.42 22 4.8 30 34 1.1 36Thabbowa 8.68 24 5.1 43 37 0.9 25Vettukulum 9.6 30 7.8 183 86 0.5 27
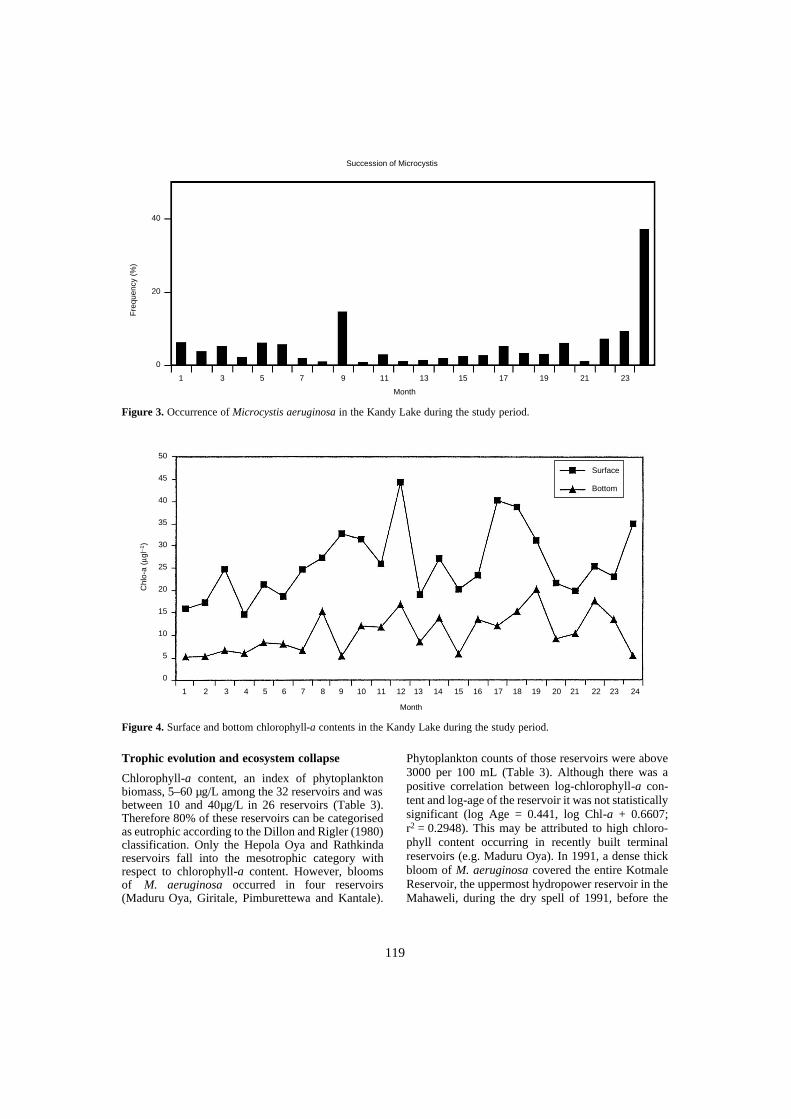
119
Trophic evolution and ecosystem collapse
Chlorophyll-a content, an index of phytoplanktonbiomass, 5–60 µg/L among the 32 reservoirs and wasbetween 10 and 40µg/L in 26 reservoirs (Table 3).Therefore 80% of these reservoirs can be categorisedas eutrophic according to the Dillon and Rigler (1980)classification. Only the Hepola Oya and Rathkindareservoirs fall into the mesotrophic category withrespect to chlorophyll-a content. However, bloomsof M. aeruginosa occurred in four reservoirs(Maduru Oya, Giritale, Pimburettewa and Kantale).
Phytoplankton counts of those reservoirs were above3000 per 100 mL (Table 3). Although there was apositive correlation between log-chlorophyll-a con-tent and log-age of the reservoir it was not statisticallysignificant (log Age = 0.441, log Chl-a + 0.6607;r2 = 0.2948). This may be attributed to high chloro-phyll content occurring in recently built terminalreservoirs (e.g. Maduru Oya). In 1991, a dense thickbloom of M. aeruginosa covered the entire KotmaleReservoir, the uppermost hydropower reservoir in theMahaweli, during the dry spell of 1991, before the
Figure 3. Occurrence of Microcystis aeruginosa in the Kandy Lake during the study period.
Figure 4. Surface and bottom chlorophyll-a contents in the Kandy Lake during the study period.
Succession of Microcystis
1 3 5 7 9 11 13 15 17 19 21 23
Month
40
20
0
Fre
quen
cy (
%)
1 242 9 10 2011 12 13 14 15 16 17 18 19 21 22 233 4 5 6 7 8
50
45
40
35
30
25
20
15
10
5
0
Month
Chl
o-a
(µgl
−1)
Surface
Bottom

120
reservoir reached its 10 years since commission(Piyasiri 1995). This bloom disappeared graduallywith the increasing water levels during the northeastmonsoonal rain. In contrast, a scum of Anabenaaphanizomenoids was scattered in the northern basinof the Parakrama Samudra during the high water levelin 1993 and it disappeared with the release of surfacewater to the command (pers. comm. Dr WolfgangDittus). The occurrence of temporary cyanobacteriablooms, especially M. aeruginosa, is not uncommonin Sri Lankan reservoirs (Silva and Wijeyaratne1999). Therefore, it is evident that eutrophication andecosystem collapse in the tropics are not necessarilyage-dependent phenomena. They can occur suddenlywhen hydraulic balance stimulated by man is optimaland is matched with certain limnological factors (e.g.high nutrients and alkalinity) and such prevailingclimatic factors as wind and irradiance.
On the other hand, all four water bodies whichhad cyanobacteria (M. aeruginosa) blooms wereterminal reservoirs. Silva (1991) showed nutrientenrichment and subsequent hyper-eutrophication interminal reservoirs resulting from high allochthonousinput and reduced flushing rate. The lowland irriga-tion reservoirs are maintained at high water levelsand have high flow-through rates from November toApril. The unique feature when water level is high isthat there is no turbulent mixing due to windless con-ditions especially during November and earlyDecember, and moderate turbulence mixing fromlate December to February resulting from the north-east monsoon and stable hydraulic balance. As aresult, the external nutrient loading becomes pre-dominant and highly convective forces mediate sedi-ment erosion, but the magnitude of the erosion iscomparatively less. The deeper light penetration witheuphotic depths of more than 5 m ensures higherturnover rates of algal biomass, but this is subject toboth dilution and some loss through relatively highand balanced flushing rates (Duncan et al. 1993).The apparent predominance of phosphorus in man-induced eutrophication of temperate lakes is notnecessarily matched in the tropics where natural N:Pconcentration is often higher (Schiemer 1983).
Therefore, hyper-eutrophication or formation ofalgal bloom in these reservoirs may occur toward theend of February. The decreasing water level may beattributed to sudden draw-down resulting fromrelease of water to meet the irrigation demand of thecommand areas. The irrigation demand in the com-mand areas varying from reservoir to reservoir is theprincipal determinant of water balance of the reser-voir ecosystem controlled by man. Similarly powerdemand determines the retention time of the hydro-power reservoirs.
Figure 3 and Table 4 show the changes of chloro-phyll-a in the Kandy Lake of 24 months (September1996–August 1998). The chlorophyll-a content inboth surface and bottom waters fluctuated within aneutrophic range during this period. The lowestchlorophyll-a content was 15 µg/L in December1996 (rainy season) and the highest was 44 µg/L inAugust 1997 (dry season). Chlorophyll-a in thebottom waters (12 m deep) also fluctuated in thesame manner but in lower concentrations. It wasshown that there was an oscillation of A. granulataand P. simplex with progressive increase of M. aeru-ginosa in the Kandy Lake during this period. Theoscillation of a diatom and a green algae is an indica-tion of trophic stability, while the progressiveincrease of M. aeruginosa could be consideredtrophic evolution Kandy Lake is one of the oldestwater bodies in Sri Lanka with continuous water forabout 200 years, but an outbreak of an algal bloomhad not been reported until May 1999. There ismarked stratification with a notable micro-thermocline in Kandy Lake. De-oxygenation ofdeeper layers was not seasonal as it was in manytropical reservoirs (Talling and Lemolle 1998), butcontinual (van der Heide 1978; Matsumara-Tundisiet al. 1991), often with an accumulation of ammoniaand H2S near the bottom.
Table 4. Nutrient concentration (µg/L) of the Kandy Lakeover two years.
Month DP TP NO3–N NH3–N
Surf. Bott. Surf. Bott. Surf. Bott. Surf. Bott.
Sep 96 4 2 23 143 37 78 172 453Oct 96 1 1 56 66 166 60 170 219Nov 96 14 0 39 352 681 105 24 1055Dec 96 22 5 54 349 559 968 490 840Jan 97 5 4 14 34 156 246 168 300Feb 97 0 5 28 36 816 306 32.2 450Mar 97 9 10 51 109 389 53 62 1478Apr 97 0 0 47 178 271 64 15 2083May 97 0 2 43 36 84 153 77 2711Jun 97 5 9 137 431 39 11 12 1682Jul 97 3 1 72 160 43 3 321 2231Aug 97 1 3 42 101 538 43 229 1469Sep 97 5 2 49 82 245 267 392 443Oct 97 5 4 79 130 340 103 125 1693Nov 97 7 0 28 156 1277 0 293 2492Dec 97 0 0 58 212 230 80 774 961Jan 98 3 3 43 156 334 280 316 421Feb 98 0 0 50 198 191 353 50 501Mar 98 0 1 41 37 126 6 67 1449Apr 98 11 10 38 48 89 2 113 1733May 98 9 19 25 126 33 6 501 1832Jun 98 0 1 30 88 78 153 568 569Jul 98 10 1 52 80 94 200 497 557Aug 98 5 11 40 72 376 93 176 727
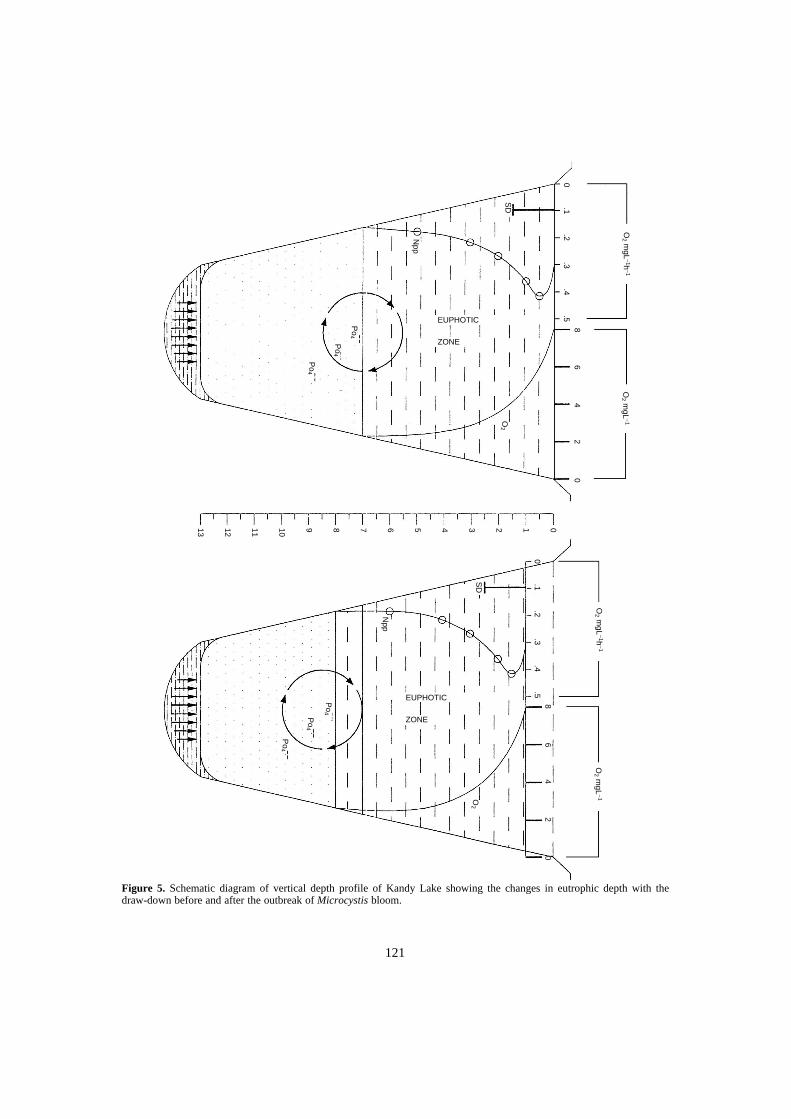
121
Figure 5. Schematic diagram of vertical depth profile of Kandy Lake showing the changes in eutrophic depth with thedraw-down before and after the outbreak of Microcystis bloom.
Npp
EUPHOTIC
ZONE
SD
SD
Npp
EUPHOTIC
ZONE
0.1
.2.3
.4.5
86
42
0
O2 m
gL−1h
−1O
2 mgL
−1
0.1
.2.3
.4.5
86
42
0
O2 m
gL−1h
−1O
2 mgL
−1
O2
O2
Po
4
Po
4
Po
4
Po
4P
o4
Po
4
012345678910111213
122
The chlorophyll content in Kandy Lake increasedup to 80 µg/L in May 1999 following a drop of waterlevel about 1 m to construct a low-level sluice gate,and M. aeruginosa out-competed A. granulata and P.simplex which had been dominant since 1996. Thisoutbreak of cyanobacteria (M. aeruginosa) occurredin the Kandy Lake during the dry spell in 1999, anexcellent example to demonstrate trophic evolutionand ecosystem collapse taking place due to humanactivities in the watershed as well as in the waterbody, respectively. The bloom-forming cyano-bacteria drifted toward the northeast corner of thelake with the onset of the southwest monsoonal wind(May–Sept) which blows along the fetch of the lake.The dead scum of the cyanobacteria blooms wasremoved manually while increasing the water levelto full supply level. Subsequently, the density of theM. aeruginosa colonies decreased with increasingwater level and reversing of the wind direction fromsouthwest to northeast. Figure 5 is a schematicdiagram to demonstrate the ecosystem collapse ofthe Kandy Lake due to sudden draw-down matchedwith prevailing environmental conditions (e.g. wind,irradiance) and the eco-physiological behaviour ofM. aeruginosa. When the water level dropped inApril 1999, the euphotic depth and bottom-dwellingcyanobacteria dropped, reaching the lower layersrich in soluble reactive phosphate due to anoxic con-ditions in the bottom. This water body is rich innitrates and the outbreak of non-nitrogen-fixingcyanobacteria suggests phosphorus limitation. On theother hand, availability of chlorophyll-a in the entirewater column was indicative of rotation of phyto-plankton with the convective currents. The reservepotential of tropical phytoplankton to uptakeadditional nutrients is very high in an absolute sense,and the response of the water body to hyper-eutrophication of tropical latitude may therefore bestronger than it is for temperate areas, and the mixlayer is more dynamic in a tropical setting than in atemperate area (Lewis 1996). The diel cycle oftemperature/density stratification can have largeeffects on the vertical distribution of blue-greenalgae (cyanobacteria) with varying positive ornegative buoyancy. Day-to-day variation of windspeed was positively related through turbulence andre-suspension to the abundance of diatom Aulaco-seira italika in a shallow Brazilian reservoir (deLima et al. 1983). Phytoplankton is inherently sus-ceptible to both the radiation/temperature and waterbalance complexes of environmental factors. Its ownreaction upon the physical and specially the chemicalenvironment can also be profound, and often cyclicalbiotic interactions that include grazing and caninclude further temporal changes.
Conclusion
Heterogeneity of trophic characteristics between andamong inter- and intra-basin tropical reservoirs isapparent. The generally accepted phenomenon is thata majority of tropical water bodies are eutrophic dueto enrichment by external and internal loading andhyper-eutrophication or the occurrence of algalblooms is also not uncommon.
Eutrophication and subsequent hyper-eutrophica-tion do not necessarily centre on long-term nutrientloading and enrichment. It is associated with thermalstratification and wind-driven convective forces andinternal loading to a greater extent. Therefore,sewerage and fertiliser leaching from the watershedare also not the only indicators of hyper-eutrophica-tion in the tropical inland water bodies. Humanactivities associated with hydraulic balance (draw-down), and introduction of exotics vs over-fishingare directly or indirectly linked with the impulsiveemergence of algal blooms in eutrophic tropicalreservoirs when reservoir ecosystems and localclimate are favourable to growth and the sustenanceof bloom-forming phytoplankton.
The role of bio-turbation and grazing pressure onimpulsive emergence of algal blooms in cichlid-dominant tropical reservoirs needs more study. Moreattention should be paid to eutrophic and hyper-trophic waters in the tropics, since more than half ofthe bloom-forming cyanobacterium strains are toxic,and organic compounds found in eutrophic watersform some carcinogenic compounds during theprocess of chlorinating.
Acknowledgments
We wish to thank the Director, IFS for facilitiesprovided. We also greatly appreciate the assistance ofMr N. Athukorale and Mr S. Wijeyamohan in thefield sampling and laboratory analysis. Ms I. Tumpelahelped during the examination of phytoplankton andpreparation of the manuscript. Ms S. Nathanael readthe manuscript in draft.
References
Abeywickrema, B.A. 1979. The genera of the freshwateralgae of Sri Lanka. Part 1 — UNSECO Man and theBiosphere National Committee for Sri Lanka, SpecialPublication 6. National Science Council Sri Lanka,Colombo, 103 p.
Alvarez-Cobelas, M. and Jacobsen, B. 1992. Hypertrophicphytoplankton: An overview. Freshwater BiologicalAssociation. Freshwater Forum, 2: 184–199.

123
APHA. 1987. Standard Methods; Water and Wastewater,17th Edition, American Public Health Association.
Apstein, C. 1907. Das Plankton in Colombo-See auf Ceylon.Zoologische Jahrbuecher Abteilung Fuer Systematik,Oekologie und Geographie der Tiere, 25: 201–244.
—— 1910. Das Plankton des Gregory-Sees auf Ceylon.Zoologische Jahrbuecher Abteilun fur Systematik,Oekologie und Geographie der Tiere, 29: 661–679.
Ashton, P.J. 1985. Nitrogen transformations and thenitrogen budget of a hypertrophic impoundment (Hart-beespoort Dam, South Africa). Journal of LimnologicalSociety, South Africa, 11: 32–42.
Baxter, R.M. 1977. Environmental effects of dams andimpoundment. Annual Review of Ecology and System-atics, 8: 253–83.
Biswas, S. 1978. Observations on phytoplankton andprimary productivity in Volta. Lake. Ghana. Verhand-lungen. Internationale Vereinigung Limnologie, 20:1672–1676.
Boland, K.T. 1996. Some effects on water quality of rapiddraw-down in a small, tropical reservoir, Manton RiverReservoir, Northern Territory, Australia. In: Schiemer, F.and Boland, K.T. ed. Perspectives in Tropical Limnology,SPB Academic Publishing, Amsterdam, 77–88.
Boland, K.T. and Griffiths, D.J. 1996. Water columnstability as a major determinant of shifts in phyto-plankton dominance: evidence from two tropical lakes innorthern Australia. In: Schiemer, F. and Boland, K.T. ed.Perspectives in Tropical Limnology, SPB AcademicPublishing, Amsterdam, 89–99.
Bootsma, H.A. and Hecky, R.E. 1993. Conservation of theAfrican Great Lakes: a limnological perspective. Conser-vation Biology, 7: 1–13.
Branco, C.W.C. and Senna, P.A.C. 1994. Factors influ-encing the development of Cylindrospermopsis raci-borskii and Microcystis aeruginosa in the ParanoaReservoir, Brasilia, Brazil. Archive für HydrobiologieSupplement, 105 (Algological Studies) 75: 85–96.
—— 1996. Phytoplankton composition, community struc-ture and seasonal changes in a tropical reservoir (ParanoaReservoir, Brazil). Archive für Hydrobiologie Supple-ment 114, 69–84.
Carney, H.J., Richerson, P.J. and Eloranta, P. 1987. LakeTiticaca (Peru/Bolivia) Phytoplankton: species composi-tion and structural composition with other tropical andtemperate lakes. Archive für Hydrobiologie, 110: 365–85.
Coche, A.G. 1974. Limnological study of a tropical reser-voir, Part 1. In: Balon, E.K. and Coche, A.G. ed. LakeKariba, Manmade Tropical Ecosystem in Central Africa,Monographie Biologicae 24. The Hague: Junk, 1–248.
Crow, W.B. 1923a. The taxonomy and variation of thegenus Microcystis in Ceylon. New Phytologist, 21: 59–68
—— 1923b. Freshwater plankton algae from Ceylon. Journalof Botany, London, 61: 110–114, 138–145, 164–171.
Davies, B.R. 1980. Stream regulation in Africa: a review.In: Ward, J.W. and. Stanford, J.A. ed. The Ecology ofRegulated Streams. New York: Plenum, 113–142.
De Lima, W.C., Marins, M. deA. and Tundisi, J.G. 1983.Influence of wind on the standing stock of Melosiraindica (Ehr.) Kutz. Revta. Bras. Bioliologie, 43: 317–20.
De Silva, S.S. 1988. The reservoir fishery in Asia, In: DeSilva, S.S. ed. Reservoir Fishery Management and
Development in Asia. Proceedings of a Workshop heldin Kathmandu, Nepal. 23–28 November 1987, Ottawa,Canada, International Development Research Center19–28.
De Silva, S.S. and Amarasinghe, U.S. 1996. ReservoirFisheries in Asia. Perspective. In: De Silva, S.S. ed.Asian Fisheries. A volume to commemorate the 110thanniversary of the Asian Fisheries Society. AsianFisheries Society Manila, 189–216.
Dillon, P. and Rigler, R.H. 1980. A test of a simple nutrientmodel prediction, the phosphorus concentration in lakewater. Journal of Fisheries Research Board, Canada, 31:,1771–1778.
Duncan, A., Gunatilaka, A. and Sciemer, F. 1993. Limno-logical aspects of landscape management in Sri Lanka.In: Erldele, W., Preu, C., Ishwaran, N. and MaddumaBandara, C.M. ed. Proceedings of the International andInterdisciplinary Symposium on Ecology and LandscapeManagement in Sri Lanka, Margraf Scientific Books,Weikensheim, 381–395.
Fernando, C.H. 1980. Reservoirs and lakes of Southeast Asia(oriental region). In: Taub, F.B. ed. Ecosystems of theWorld. 23. Lakes and Reservoirs. Amsterdam: Elsevier,411–446.
Foged, N. 1976. Freshwater diatoms in Sri Lanka (Ceylon).Bibliothera Phycology, 23: 1–100.
Fritsch, F.E. 1907. A general consideration of the sub-aerialand freshwater algal flora of Ceylon. A contribution tothe study of tropical algal ecology. Part 1 — Sub-aerialalgae and algae of the inland fresh-waters. Proceedingsof the Royal Society of London. Series B. 79: 197–254.
Ganf, G.G. and Viner, A.B. 1973. Ecological stability in ashallow equatorial lake (Lake George, Uganda). Pro-ceedings of the Royal Society (B) 184: 321–46.
Hart, R.C. 1996. Comparative ecology of plankton in cas-cading warm-water reservoirs: aspects of relevance totropical limnology. In: Schiemer, F. and Boland, K.T. ed.Perspectives in Tropical Limnology, SPB AcademicPublishing, Amsterdam, 113–130.
Hecky, R.E. 1993. The eutrophication of Lake Victoria.Verhandlungen Internationale. Vereinigung Limnologie,25: 39–48.
Henry, R., Tundisi, J.G. and Curi, P.R. 1984. Effects ofphosphorus and nitrogen enrichment on the phyto-plankton in a tropical reservoir (Lobo Reservoir, Brazil),Hydrobiologia, 118: 177–185.
Holsinger, E.C.T. 1955. The plankton algae of three Ceylonlakes, Hydrobiologia, 7: 8–24.
Kalff, J. 1983. Phosphorus limitation in some tropicalAfrican lakes. Hydrobiologia, 100: 102–112.
—— 1991. The utility of latitude and other environmentalfactors as predictors of nutrients, biomass and productionin lakes worldwide: Problems and alternatives. Verhand-lungen Internationale, Vereinigung Limnologie, 24:1235–1239.
Kalff, J. and Brumelis, D. 1993. Nutrient loading, windspeed and phytoplankton in a tropical African lake.Verhandlungen Internationale, Vereinigung Limnologie,25: 860.
Kalff, J. and Watson, S. 1986. Phytoplankton and itsdynamics in two tropical lakes: a tropical and temperatezone comparison. Hydrobiologia, 138: 161–176.
124
Kannan, V. and Job, S.V. 1980. Diurnal, seasonal andvertical study of primary production in Sathiar Reservoir.Hydrobiologia, 70: 103–117.
Khondker, M. and Parveen, L. 1993. Daily rate of primaryproductivity in hypertrophic Dhamondi Lake. In: Tilzer,M.M. and Khondker, M. ed. Hypertrophic and PollutedFreshwater Ecosystems: ecological bases for waterresources management. Bangaladesh Department ofBotany, University of Dhaka, 181–191.
Latif, A.F.A. 1984. Lake Nasser — the new man-made lakein Egypt (with reference to Lake Nubia), In: Taub, F.B.ed. Ecosystems of the World. 23. Lakes and Reservoirs,Elsevier, Amsterdam, 411–446.
Lemmermann, E. 1907. Protophyten-plannton von Ceylon.Zoologische Jahrbuecher Abteilung Fuer Systematik,Oekologie und Geographie der Tiere, 25: 263–268.
Lewis, W.M. 1973. The thermal regime of Lake Lanao(Philippines) and its theoretical implications for tropicallakes. Limnology and. Oceanography, 18: 2000–2017.
—— 1974. Primary production in the plankton communityof a tropical lake. Ecological Monograph 44, 377–409.
—— 1978. Dynamics and succession of the phytoplanktonin a tropical lake; Lake Lanao, Philippines, Journal of.Ecology, 66: 849–880.
—— 1996. Tropical lakes: how latitude makes a difference.In: Schiemer, F. and Boland, K.T. ed. Perspective inTropical Limnology, SPB Academic Publishing,Amsterdam, 43–64.
Marker, A.F.H., Crowther, C.A. and Gunn, R.J.M. 1980.Methanol and acetone as solvent for estimating chloro-phyll-a and phaeopigments by spectrophotometry.Archive für Hydrobiologie (Supplement) 14, 52–69.
Matsumura-Tundisi, T., Tundisi, J.G., Saggio, A., OliveiraNeto, A.L. and Espindola, E.G. 1991. Limnology ofSamuel Reservoir (Brazil, Rondonia) in the filling phase.Verhandlungen Internationale, Vereinigung Limnologie,24: 1482–1488
Melack, J.M. 1979. Temporal variability of phytoplanktonin tropical lakes. Oecologica, 44: 1–7.
—— 1996. Recent developments in tropical limnology.Verhandlungen Internationale, Vereinigung Limnologie,26: 211–217.
Mukankomeje, R.R, Plisnier, P.D., Descy, J.P. andMassault, L. 1993. Lake Muzahi, Rwanda: Limonologicalfeatures and phytoplankton production. Hydrobiologia,257: 107–120.
Obeng, L.E. 1981. Man’s impact on tropical rivers. In:Lock, M.A. and Williams, D.D. ed. Perspective inRunning Water Ecology, New York: Plenum, 265–288.
Osborne, P.L. 1991. Seasonality in nutrients and phyto-plankton production in two shallow lakes: Waigani lake,Papua New Guinea, and Barton Broad, Norfolk, England.Internationale Revue der Gesamten Hydrobiologie, 76:105–112.
Pielou. 1998. Freshwater University Chicago Press, 275 p.Piyasiri, S. 1995. Eutrophication and bluegreen algal
problem in Kotmale Reservoir in Sri Lanka. In: Thomas,K.H. and Golthenboth, F. ed. Tropical Limnology, SatyaWacana Christian University, Indonesia. Volume 2.161–169.
Ramberg, L. 1987. Phytoplankton succession in the SanyatiBasin, Lake Kariba. Hydrobiologia, 153: 193–202.
Rott, E. 1983. A contribution to the phytoplankton speciescomposition of Parakrama Samudra. In: Schiemer, F. ed.Limnology of Parakrama Samudra — a case study of anancient manmade lake in Sri Lanka. The Hague Junk,209–226.
Rott, E. and Lenzenweger, R. 1994. Some rare and inter-esting plankton algae from Sri Lanka. Biologia, Bratis-lava, 49/4, 497–500.
Rudd, J.M.W. Harris, R., Kelly, C.A. and Hecky, K.E.1993. Are hydroelectric reservoirs significant sources ofgreenhouse gases? AMBIO, 22: 46–48.
Schiemer, F. ed. 1983. Limnology of Parakrama Samudra,Sri Lanka: A case study of an ancient man-made lake inthe tropics. The Hague Junk.
Silva, E.I.L. 1991. Limnology and fish yields of newlybuilt standing water bodies in the Mahaweli River Basin,Sri Lanka. Verhandlungen Internationale VereinigungLimnologie, 24: 1425–1429.
Silva, E.I.L. and Davies, R.W. 1986. Primary productivityand related parameters in three different types of inlandwaters in Sri Lanka. Hydrobiologia, 137: 239–349.
—— 1987. The seasonality of monsoonal primary produc-tivity in Sri Lanka. Hydrobiologia, 150: 165–175.
Silva, E.I.L. and Wijeyaratne, M.J.S. 1999. The occurrenceof cyanobacteria in the Reservoirs of the Mahaweli RiverBasin in Sri Lanka. Sri Lanka Journal of AquaticScience, 4: 51–60.
Sreenivasan, A. 1965. Limnology of tropical impoundments.111. Limnology and productivity of Amarawathy Reser-voir (Madras State), India. Hydrobiologia, 26: 510–516.
—— 1974. Limnological features of a tropical impound-ment. Bhavanisagar Reservoir (Tamil Nadu), India.Internationale Revue der Gesamten Hydrobiologie, 59:327–342.
Talling, J.F. 1966. The annual cycle of stratification andphytoplankton growth in Lake Victoria (East Africa).Internationale Revue der Gesamten Hydrobiologie, 51:545–621.
—— 1969. The incidence of vertical mixing, and some bio-logical and chemical consequences, in tropical Africanlakes. Verhandlungen Internationale, Vereinigung Limno-logie, 17: 998–1012.
—— 1986. The seasonality of phytoplankton in Africanlakes. Hydrobiologia, 138: 139–160.
—— 1990. Diel and seasonal energy transfer, storage andstratification in African reservoirs and lakes. Archive furHydrobiologie. Beih. Ergebn. Limnologie, 33: 651–660.
—— 1992. Environmental regulation in African shallowlakes and wetlands. Rev. Hydrobiol. Trop., 25: 229–256.
Talling, J.F. and Lemolle, J. 1998. Ecological Dynamics ofTropical Inland Waters. Cambridge University Press.441 p.
Townsend, S.A. 1996. Metalimnetic and hypolimneticdeoxygenation in an Australian tropical reservoir of lowtrophic status. In: Schiemer, F. and Boland, K.T. ed.Perspective in Tropical Limnology, SPB AcademicPublishing, Amsterdam, 151–160.
Townsend, S.A., Luong–Van, J.T. and Boland, K.T. 1996.Retention time as a primary determination of colour andlight attenuation in two tropical Australian reservoirs.Freshwater Biology, 36: 57–69.

125
Tundisi, J.G., Gentil, J.G. and Dirickson, M.C. 1978.Seasonal cycle of primary production of nanno andmicrophytoplankton in a shallow tropical reservoir.Review in Brasilian Botany, 1: 35–9.
Van der Heide, J. 1973. Plankton development during thefirst years of inundation of the Van Blomestein (Broko-pondo) Reservoir in Suriname, Verhandlungen Inter-nationale .Vereinigung Limnologie, 24: 1171–1173.
Viner, A.B. 1975. The supply of minerals to tropical riversand lakes (Uganda). In: Hasler, A.D. ed. Couplingof Land and Water Systems, New York: Springer,227–261.
—— 1977. Relationships of nitrogen and phosphorus to atropical phytoplankton population. Hydrobiologia, 52:185–196.
Vyvermann, W. 1996. The Indo-Malaysian North-AustralianPhycogeographical Region Revised. In: Kristiansen, J.ed.. Developments in Hydrobiology, 118. Biogeographyof Freshwater Algae, 107–120.
West, W. and West, G.S. 1902. A contribution to the fresh-water algae of Ceylon — Trans Linnen Society 2nd
Series Botany 6, 123–215.Wood, R.B. Baxter, R.M. and Prosser, M.V. 1984. Seasonal
and cooperative thermal stratification in some tropicalcrater lakes, Ethiopia. Freshwater Biology, 14: 551–573.
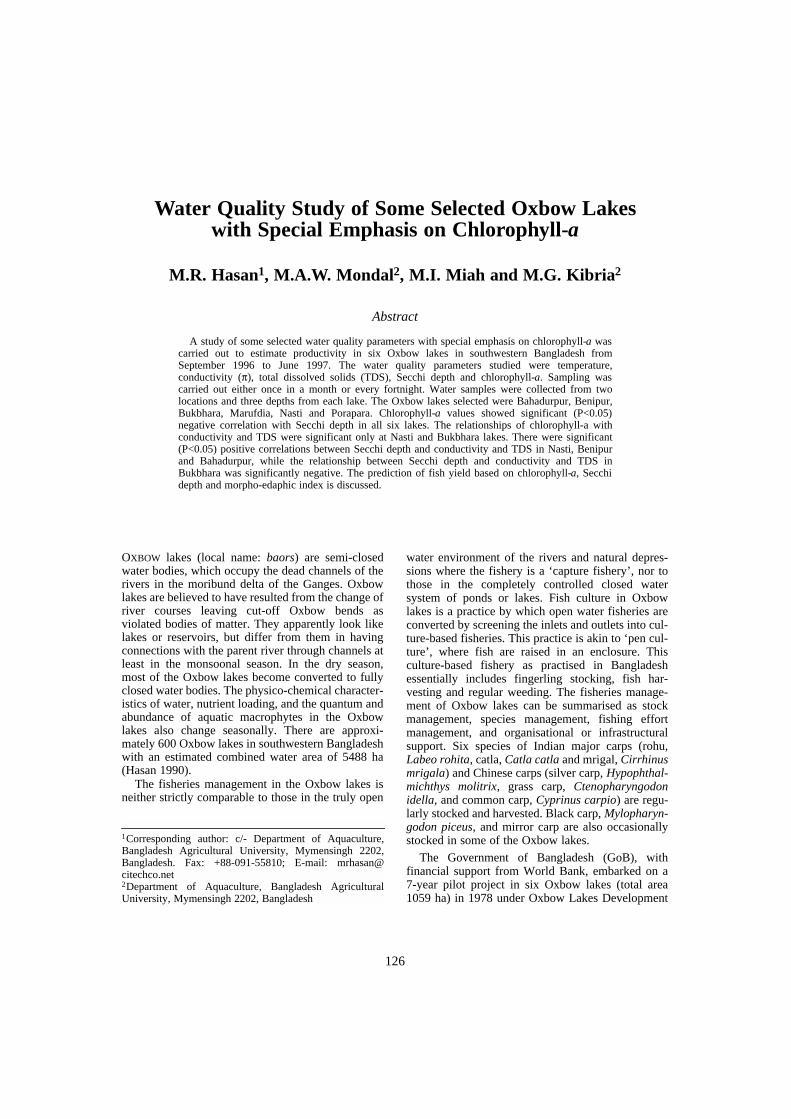
126
Water Quality Study of Some Selected Oxbow Lakeswith Special Emphasis on Chlorophyll-a
M.R. Hasan1, M.A.W. Mondal2, M.I. Miah and M.G. Kibria2
Abstract
A study of some selected water quality parameters with special emphasis on chlorophyll-a wascarried out to estimate productivity in six Oxbow lakes in southwestern Bangladesh fromSeptember 1996 to June 1997. The water quality parameters studied were temperature,conductivity (π), total dissolved solids (TDS), Secchi depth and chlorophyll-a. Sampling wascarried out either once in a month or every fortnight. Water samples were collected from twolocations and three depths from each lake. The Oxbow lakes selected were Bahadurpur, Benipur,Bukbhara, Marufdia, Nasti and Porapara. Chlorophyll-a values showed significant (P<0.05)negative correlation with Secchi depth in all six lakes. The relationships of chlorophyll-a withconductivity and TDS were significant only at Nasti and Bukbhara lakes. There were significant(P<0.05) positive correlations between Secchi depth and conductivity and TDS in Nasti, Benipurand Bahadurpur, while the relationship between Secchi depth and conductivity and TDS inBukbhara was significantly negative. The prediction of fish yield based on chlorophyll-a, Secchidepth and morpho-edaphic index is discussed.
OXBOW lakes (local name: baors) are semi-closedwater bodies, which occupy the dead channels of therivers in the moribund delta of the Ganges. Oxbowlakes are believed to have resulted from the change ofriver courses leaving cut-off Oxbow bends asviolated bodies of matter. They apparently look likelakes or reservoirs, but differ from them in havingconnections with the parent river through channels atleast in the monsoonal season. In the dry season,most of the Oxbow lakes become converted to fullyclosed water bodies. The physico-chemical character-istics of water, nutrient loading, and the quantum andabundance of aquatic macrophytes in the Oxbowlakes also change seasonally. There are approxi-mately 600 Oxbow lakes in southwestern Bangladeshwith an estimated combined water area of 5488 ha(Hasan 1990).
The fisheries management in the Oxbow lakes isneither strictly comparable to those in the truly open
water environment of the rivers and natural depres-sions where the fishery is a ‘capture fishery’, nor tothose in the completely controlled closed watersystem of ponds or lakes. Fish culture in Oxbowlakes is a practice by which open water fisheries areconverted by screening the inlets and outlets into cul-ture-based fisheries. This practice is akin to ‘pen cul-ture’, where fish are raised in an enclosure. Thisculture-based fishery as practised in Bangladeshessentially includes fingerling stocking, fish har-vesting and regular weeding. The fisheries manage-ment of Oxbow lakes can be summarised as stockmanagement, species management, fishing effortmanagement, and organisational or infrastructuralsupport. Six species of Indian major carps (rohu,Labeo rohita, catla, Catla catla and mrigal, Cirrhinusmrigala) and Chinese carps (silver carp, Hypophthal-michthys molitrix, grass carp, Ctenopharyngodonidella, and common carp, Cyprinus carpio) are regu-larly stocked and harvested. Black carp, Mylopharyn-godon piceus, and mirror carp are also occasionallystocked in some of the Oxbow lakes.
The Government of Bangladesh (GoB), withfinancial support from World Bank, embarked on a7-year pilot project in six Oxbow lakes (total area1059 ha) in 1978 under Oxbow Lakes Development
1Corresponding author: c/- Department of Aquaculture,Bangladesh Agricultural University, Mymensingh 2202,Bangladesh. Fax: +88-091-55810; E-mail: [email protected] of Aquaculture, Bangladesh AgriculturalUniversity, Mymensingh 2202, Bangladesh

127
Project (OLP-I). These six lakes in southwesternBangladesh were brought under culture-basedfisheries management and are presently managedunder direct supervision of the Department ofFisheries (DoF) of GoB. In 1991, the second phaseof Oxbow Lakes Project (Oxbow Lakes Small ScaleFishermen Project, OLP-II) was initiated by GoBwith funding from International Fund for Agricul-tural Development (IFAD) and with technical assist-ance from Danish International DevelopmentAgency (Danida). A further 22 lakes (total area 1143ha) in five districts of southwestern Bangladesh werebrought under culture-based fisheries managementthrough OLP-II (Hasan and Middendorp 1998).
The Oxbow Lakes Project conducted biologicalstudies in 20 Oxbow lakes 1994–1997. As a result ofthis study, a yield prediction model was developed topredict fish yield based on the relationship betweenSecchi depth (water transparency) and stockingdensity (Hasan and Middendorp 1998; Hasan et al.1999). However, Secchi depth is an indirect indicatorof productivity and may not be always acceptable asa measure of primary productivity. In manyinstances, it has been reported that turbidity in watermay give lower water visibility, hence providinginaccurate estimation of primary productivity. Thechlorophyll-a is a green pigment-bearing agent,which is directly related to photosynthesis andtherefore provides an accurate measure of primaryproductivity.
The objective of this study was to verify thereliability of Secchi depth data as a measure ofproductivity by establishing their relationship withsome selected water quality parameters with specialemphasis on chlorophyll-a.
Materials and Methods
Study area and period
The research study was conducted in six selectedOxbow lakes under Oxbow Lakes Project (OLP-II).The selected lakes were Nasti, Porapara, Benipur,Marufdia, Bukbhara and Bahadurpur (Table 1). Theyare in three districts (Jessore, Chuadanga andJhenaidah) of southwestern Bangladesh. The studywas carried out from September 1996 to June 1997.
Sampling procedure and collection of water samples
Water quality parameters studied were temperature,conductivity (π), total dissolved solids (TDS), Secchidepth and chlorophyll-a. Sampling was carried outeither once a month or every fortnight. However, dueto some logistic difficulties, sampling could not bedone during March and April 1997. Water sampleswere collected from two fixed sites marked by abamboo pole (middle and near the inlet) and threedepths (surface, middle and bottom) from each lake.Water samples were collected between 0900 and1030 hrs and water quality parameters were sub-sequently analysed. Water samples from the middleand bottom were collected by Kamerar-type watersampler. Surface water samples were collecteddirectly using a plastic bottle.
Data collection
The water area referred to in this text is the measuredwater area (standard water area, SWA) (ha) of eachOxbow lake under water on 31 December 1994based on a field survey conducted in early 1995
Table 1. Mean and range (within parentheses) of different water quality parameters of six Oxbow lakes.
Oxbowlakes
Area(ha)
Depth(cm)
Temperature(0C)
Conductivity(µΩ/cm)
TDS(mg/L)
Secchi depth (cm)
Chlorophyll–a(µg/L)
MEI
Nasti 54 220 (120–291)
28.6(21.7–35.2)
253(200–286)
127(100–142)
52(25–88)
35.9(2.6–86.3)
64.6(46.3–98.4)
Porapara 88 190 (97–268)
28.8(21.7–36.5)
243(220–267)
123(110–138)
58(14–113)
39.7(12.1–95.5)
68.9(41.0–85.7)
Benipur 45 209 (137–301)
27.7(22.4–32.8)
336(266–402)
167(133–201)
69(43–85)
37.0(18.4–76.2)
89.0(59.4–103.8)
Marufdia 25 221 (180–263)
28.4(21.1–33.9)
340(220–410)
170(110–206)
74(63–105)
30.3(12.8–42.0)
77.9(58.2–95.4)
Bukbhara 138 287 (168–417)
28.1(20.7–33.5)
301(249–356)
155(124–182)
74(44–104)
22.3(10.2–46.2)
66.5(31.6–102.9)
Bahadurpur 110 297 (156–383)
28.1(22.1–34.6)
225(172–260)
113(86–130)
204(143–279)
7.7(2.6–15.8)
38.9(33.1–47.9)
128
(Oxbow Lakes Project II 1995). Water depth fluctua-tion data were collected from Baor BiologicalStudies Annual Report (July 1996–June 1997)(Oxbow Lakes Project II 1997).
Water transparency (Secchi depth) was measuredat each sampling site to the nearest cm by loweringa Secchi disk to the point of disappearance. Watertemperature (0C), conductivity (µmhos/cm) andtotal dissolved solids (mg/L) were measured in situfrom the collected water samples by a combinedtemperature/conductivity/TDS meter (Ciba-Corning)for each site and depth.
Water samples for chlorophyll-a analysis werefiltered using a membrane filter (Millipore micro-filter, 47 mm diam; 45 µm) and the filtrates werefrozen until analysed. The phytoplankton pigmentsin the filtrate were extracted in acetone and the con-centration of chlorophyll-a was determined spectro-photometrically at 665 nm and 750 nm. Theconcentration was calculated from the followingequation after Vollenweider (1969):
Chlorophyll-a (µg/L) = 11.9 (A665 – A750) V/L ×1000/Swhere A665 = the absorbance at 665 nm,
A750 = the absorbance at 750 nm,L = the length of light path in the spectro-
photometer in cm, andS = volume (mL) of water sample filtered,V = volume of extract (ìL).
Morpho-edaphic index was calculated using thefollowing formula after Ryder (1965):
MEI = TDS/Zwhere MEI = morpho-edaphic index,
TDS = total dissolved solids (mg/L), andZ = mean water depth (m).
Statistical analysisData collected from two sites and three depths ofeach lake were subsequently averaged and were sub-jected to statistical analysis. Correlation and regres-sion analyses were done to establish relationshipsbetween different water quality parameters collectedfrom each Oxbow lake. All analyses were carried outby Microsoft Excel 2000 on a microcomputer.
ResultsMean and range values of different water qualityparameters of six Oxbow lakes during the periodSeptember 1996 to June 1997 are presented in Table1. Data of water area and water depth fluctuations ofeach lake are also given.
Each Oxbow lake was sampled 12 times in eightmonths. Firstly, we have attempted to establishrelationships between Secchi depth, chlorophyll-aconcentration, conductivity, total dissolved solids
(TDS), temperature and morpho-edaphic index(MEI) of each lake. Correlation matrix between fivewater quality parameters is presented in Tables 2–7.Chlorophyll-a concentration was negativelycorrelated (P<0.05) with Secchi depth in all sixlakes. Although there appears to be a significantrelationship between conductivity/TDS and Secchidepth in four Oxbow lakes, the relationship was notclear enough to derive any definite conclusion. Sig-nificant (P<0.01/0.05) positive correlation wasrecorded at Nasti (P<0.01), Benipur (P<0.01) andBahadurpur (P<0.05) lakes, while the relationshipwas negative in the case of Bukbhara. Similarly,chlorophyll-a concentration was negatively (P<0.01)correlated with conductivity/TDS at Nasti, while therelationship was positive at Bukbhara Lake.However, when the relationships between MEI andchlorophyll-a and Secchi depth were examined,definite trends in relationship were recorded,although the relationship was not significant in alllakes (Tables 2–7). Significant (P<0.001) positiverelationship between MEI and chlorophyll-a wasrecorded in two lakes (Nasti and Bukbhara) and sig-nificant (P<0.001) negative relationship betweenMEI and Secchi depth was recorded in four lakes(Nasti, Porapara, Bukbhara and Benipur).
Further, chlorophyll-a concentration and Secchidepth measured during the total sampling period(varying between 285 and 290 days) for each Oxbowlake were plotted graphically in Figures 1–4 tovisualise their seasonal trends and the relationships.In general, in all Oxbow lakes, chlorophyll-a con-centration was lowest during January–February andthe concentration started increasing towards the endof the sampling period (May–June), with the rise inwater temperature. In the case of Secchi depth, ageneral reverse trend was recorded in all lakes.
Since chlorophyll-a concentration and Secchidepth were found to be significantly correlated in allsix lakes (r values varied 0.587 to 0.798), the regres-sion equation between these two parameters wascalculated for all six lakes (Table 8). The values of aand b were significant (P<0.05) in all lakes.
Further, chlorophyll-a, Secchi depth, temperature,conductivity, TDS and MEI values of all lakes werepooled, and a correlation matrix between thesevariables established (Table 9); (P<0.000) negativecorrelation existed between chlorophyll-a and Secchidepth, and no significant positive or negativecorrelation was observed between conductivity/TDSand chlorophyll-a/Secchi depth. In contrast to con-ductivity/TDS values, MEI values showed signifi-cant (P<0.000) relationships with chlorophyll-a/Secchi depth. The relationship between MEI andchlorophyll-a was positive, while that between MEIand Secchi depth was negative.
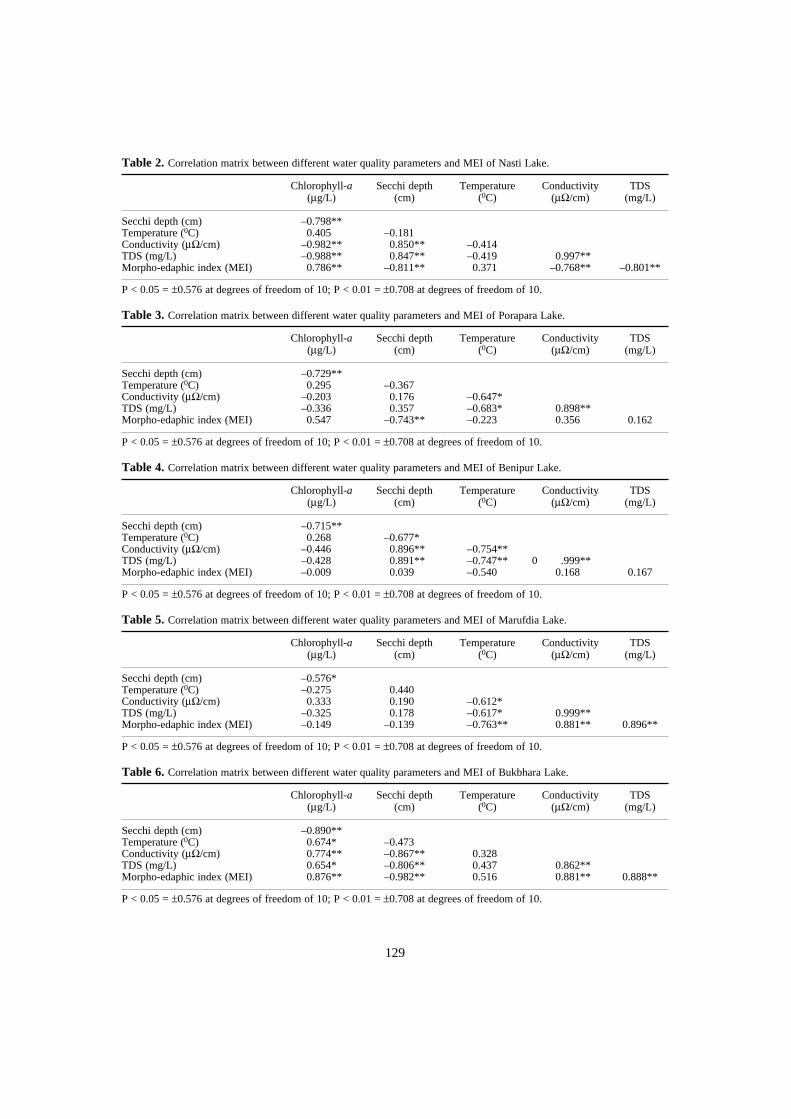
129
P < 0.05 = ±0.576 at degrees of freedom of 10; P < 0.01 = ±0.708 at degrees of freedom of 10.
P < 0.05 = ±0.576 at degrees of freedom of 10; P < 0.01 = ±0.708 at degrees of freedom of 10.
P < 0.05 = ±0.576 at degrees of freedom of 10; P < 0.01 = ±0.708 at degrees of freedom of 10.
P < 0.05 = ±0.576 at degrees of freedom of 10; P < 0.01 = ±0.708 at degrees of freedom of 10.
P < 0.05 = ±0.576 at degrees of freedom of 10; P < 0.01 = ±0.708 at degrees of freedom of 10.
Table 2. Correlation matrix between different water quality parameters and MEI of Nasti Lake.
Chlorophyll-a(µg/L)
Secchi depth (cm)
Temperature(0C)
Conductivity(µΩ/cm)
TDS(mg/L)
Secchi depth (cm) –0.798**Temperature (0C) 0.405 –0.181Conductivity (µΩ/cm) –0.982** 0.850** –0.414TDS (mg/L) –0.988** 0.847** –0.419 0.997**Morpho-edaphic index (MEI) 0.786** –0.811** 0.371 –0.768** –0.801**
Table 3. Correlation matrix between different water quality parameters and MEI of Porapara Lake.
Chlorophyll-a(µg/L)
Secchi depth(cm)
Temperature(0C)
Conductivity(µΩ/cm)
TDS(mg/L)
Secchi depth (cm) –0.729**Temperature (0C) 0.295 –0.367Conductivity (µΩ/cm) –0.203 0.176 –0.647*TDS (mg/L) –0.336 0.357 –0.683* 0.898**Morpho-edaphic index (MEI) 0.547 –0.743** –0.223 0.356 0.162
Table 4. Correlation matrix between different water quality parameters and MEI of Benipur Lake.
Chlorophyll-a(µg/L)
Secchi depth(cm)
Temperature(0C)
Conductivity(µΩ/cm)
TDS(mg/L)
Secchi depth (cm) –0.715**Temperature (0C) 0.268 –0.677*Conductivity (µΩ/cm) –0.446 0.896** –0.754**TDS (mg/L) –0.428 0.891** –0.747** 0 .999**Morpho-edaphic index (MEI) –0.009 0.039 –0.540 0.168 0.167
Table 5. Correlation matrix between different water quality parameters and MEI of Marufdia Lake.
Chlorophyll-a(µg/L)
Secchi depth(cm)
Temperature(0C)
Conductivity(µΩ/cm)
TDS(mg/L)
Secchi depth (cm) –0.576*Temperature (0C) –0.275 0.440Conductivity (µΩ/cm) 0.333 0.190 –0.612*TDS (mg/L) –0.325 0.178 –0.617* 0.999**Morpho-edaphic index (MEI) –0.149 –0.139 –0.763** 0.881** 0.896**
Table 6. Correlation matrix between different water quality parameters and MEI of Bukbhara Lake.
Chlorophyll-a(µg/L)
Secchi depth(cm)
Temperature(0C)
Conductivity(µΩ/cm)
TDS(mg/L)
Secchi depth (cm) –0.890**Temperature (0C) 0.674* –0.473Conductivity (µΩ/cm) 0.774** –0.867** 0.328TDS (mg/L) 0.654* –0.806** 0.437 0.862**Morpho-edaphic index (MEI) 0.876** –0.982** 0.516 0.881** 0.888**
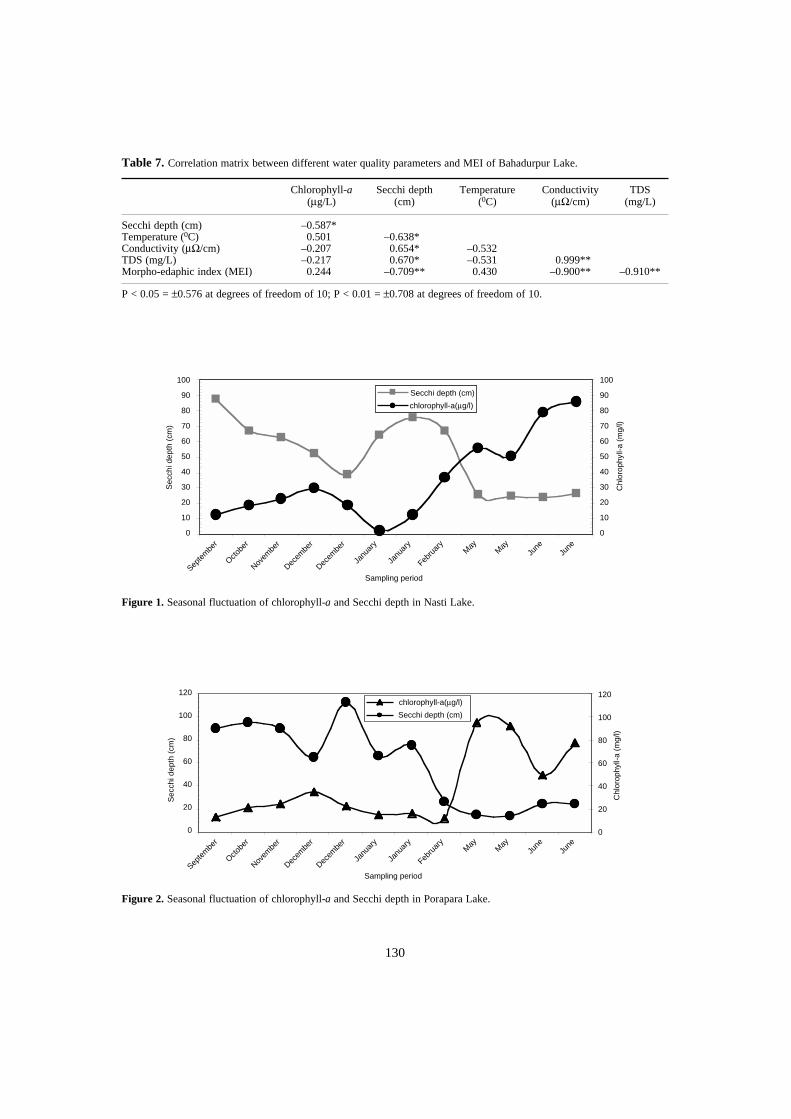
130
P < 0.05 = ±0.576 at degrees of freedom of 10; P < 0.01 = ±0.708 at degrees of freedom of 10.
Figure 1. Seasonal fluctuation of chlorophyll-a and Secchi depth in Nasti Lake.
Figure 2. Seasonal fluctuation of chlorophyll-a and Secchi depth in Porapara Lake.
Table 7. Correlation matrix between different water quality parameters and MEI of Bahadurpur Lake.
Chlorophyll-a(µg/L)
Secchi depth(cm)
Temperature(0C)
Conductivity(µΩ/cm)
TDS(mg/L)
Secchi depth (cm) –0.587*Temperature (0C) 0.501 –0.638*Conductivity (µΩ/cm) –0.207 0.654* –0.532TDS (mg/L) –0.217 0.670* –0.531 0.999**Morpho-edaphic index (MEI) 0.244 –0.709** 0.430 –0.900** –0.910**
100
90
80
70
60
50
40
30
20
10
0
100
90
80
70
60
50
40
30
20
10
0
Secchi depth (cm)
chlorophyll-a(µg/l)
Sec
chi d
epth
(cm
)
Chl
orop
hyll-
a (m
g/l)
Sampling periodSep
tem
ber
Octobe
r
Novem
ber
Decem
ber
Decem
ber
Janu
ary
Janu
ary
Febru
ary
May
May
June
June
Sampling periodSep
tem
ber
Octobe
r
Novem
ber
Decem
ber
Decem
ber
Janu
ary
Janu
ary
Febru
ary
May
May
June
June
120
100
80
60
40
20
0
Sec
chi d
epth
(cm
)
120
100
80
60
40
20
0
Chl
orop
hyll-
a (m
g/l)
Secchi depth (cm)
chlorophyll-a(µg/l)
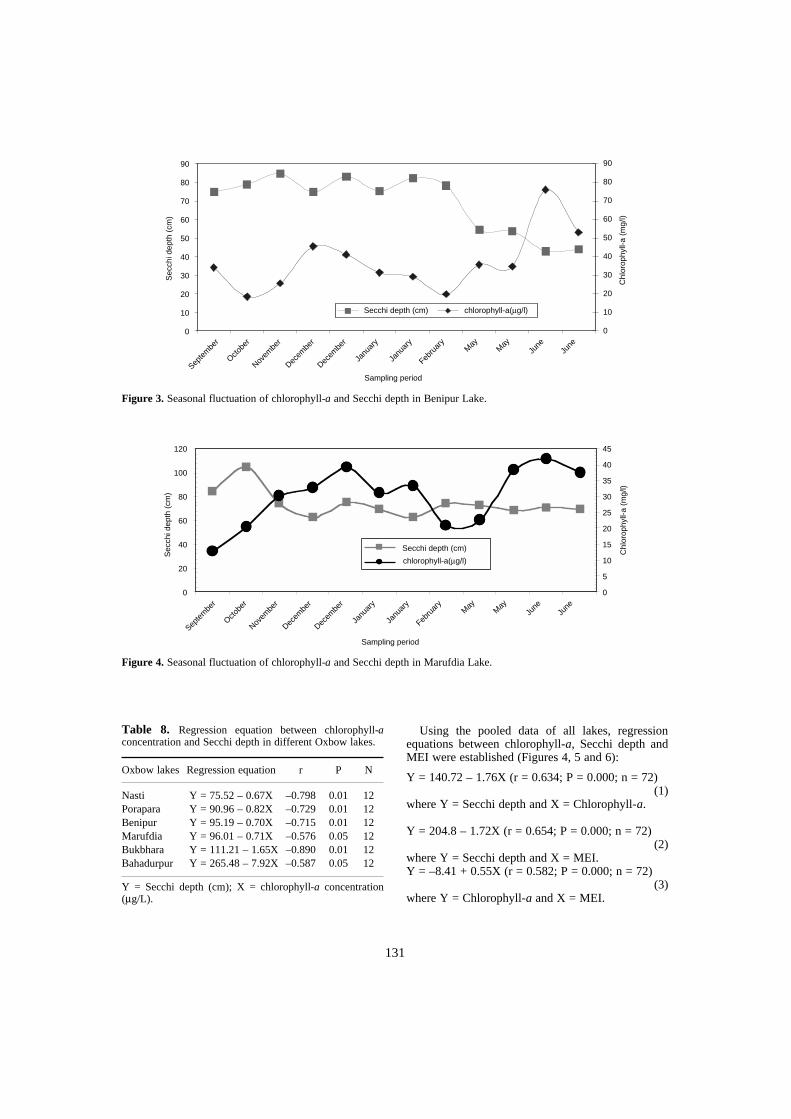
131
Y = Secchi depth (cm); X = chlorophyll-a concentration(µg/L).
Using the pooled data of all lakes, regressionequations between chlorophyll-a, Secchi depth andMEI were established (Figures 4, 5 and 6):
Y = 140.72 – 1.76X (r = 0.634; P = 0.000; n = 72)(1)
where Y = Secchi depth and X = Chlorophyll-a.
Y = 204.8 – 1.72X (r = 0.654; P = 0.000; n = 72)(2)
where Y = Secchi depth and X = MEI.Y = –8.41 + 0.55X (r = 0.582; P = 0.000; n = 72)
(3)where Y = Chlorophyll-a and X = MEI.
Table 8. Regression equation between chlorophyll-aconcentration and Secchi depth in different Oxbow lakes.
Oxbow lakes Regression equation r P N
Nasti Y = 75.52 – 0.67X –0.798 0.01 12Porapara Y = 90.96 – 0.82X –0.729 0.01 12Benipur Y = 95.19 – 0.70X –0.715 0.01 12Marufdia Y = 96.01 – 0.71X –0.576 0.05 12Bukbhara Y = 111.21 – 1.65X –0.890 0.01 12Bahadurpur Y = 265.48 – 7.92X –0.587 0.05 12
Figure 3. Seasonal fluctuation of chlorophyll-a and Secchi depth in Benipur Lake.
Figure 4. Seasonal fluctuation of chlorophyll-a and Secchi depth in Marufdia Lake.
Septe
mbe
r
Octobe
r
Novem
ber
Decem
ber
Decem
ber
Janu
ary
Janu
ary
Febru
ary
May
May
June
June
90
80
70
60
50
40
30
20
10
0
90
80
70
60
50
40
30
20
10
0
Sec
chi d
epth
(cm
)
Chl
orop
hyll-
a (m
g/l)
Sampling period
Secchi depth (cm) chlorophyll-a(µg/l)
Septe
mbe
r
Octobe
r
Novem
ber
Decem
ber
Decem
ber
Janu
ary
Janu
ary
Febru
ary
May
May
June
June
Sampling period
120
100
80
60
40
20
0
Sec
chi d
epth
(cm
)
45
40
35
30
25
20
15
10
5
0
Chl
orop
hyll-
a (m
g/l)
Secchi depth (cm)
chlorophyll-a(µg/l)
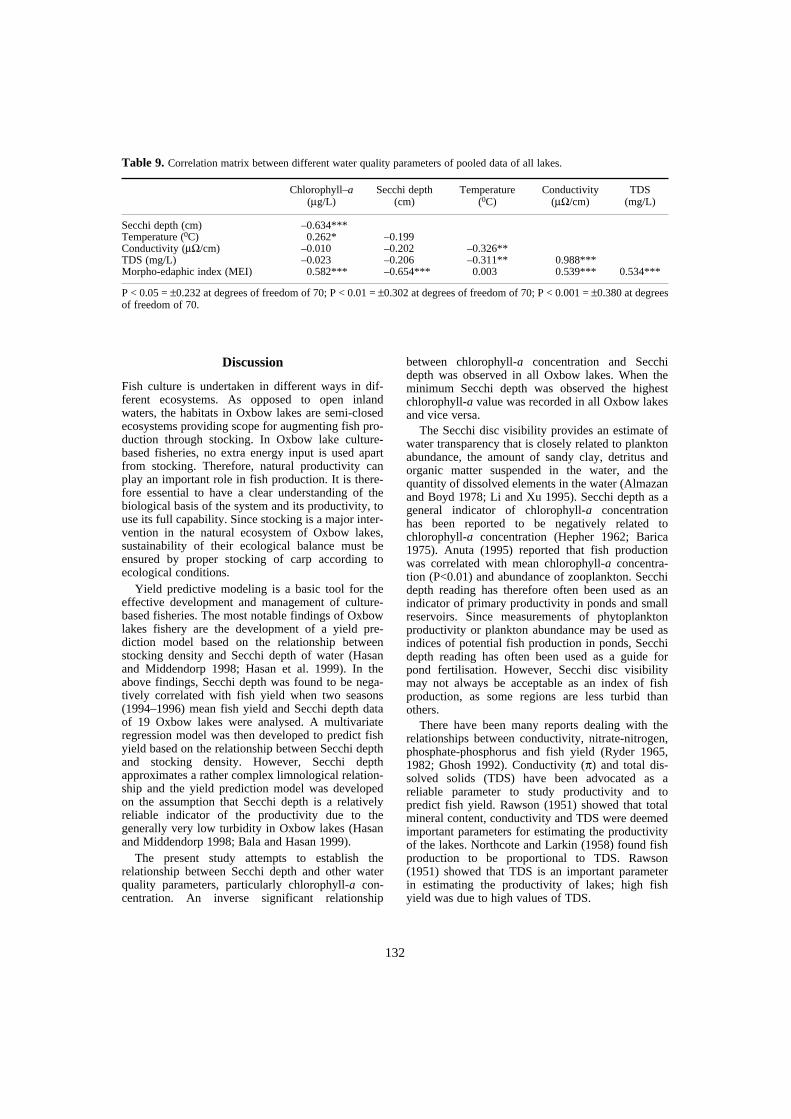
132
Discussion
Fish culture is undertaken in different ways in dif-ferent ecosystems. As opposed to open inlandwaters, the habitats in Oxbow lakes are semi-closedecosystems providing scope for augmenting fish pro-duction through stocking. In Oxbow lake culture-based fisheries, no extra energy input is used apartfrom stocking. Therefore, natural productivity canplay an important role in fish production. It is there-fore essential to have a clear understanding of thebiological basis of the system and its productivity, touse its full capability. Since stocking is a major inter-vention in the natural ecosystem of Oxbow lakes,sustainability of their ecological balance must beensured by proper stocking of carp according toecological conditions.
Yield predictive modeling is a basic tool for theeffective development and management of culture-based fisheries. The most notable findings of Oxbowlakes fishery are the development of a yield pre-diction model based on the relationship betweenstocking density and Secchi depth of water (Hasanand Middendorp 1998; Hasan et al. 1999). In theabove findings, Secchi depth was found to be nega-tively correlated with fish yield when two seasons(1994–1996) mean fish yield and Secchi depth dataof 19 Oxbow lakes were analysed. A multivariateregression model was then developed to predict fishyield based on the relationship between Secchi depthand stocking density. However, Secchi depthapproximates a rather complex limnological relation-ship and the yield prediction model was developedon the assumption that Secchi depth is a relativelyreliable indicator of the productivity due to thegenerally very low turbidity in Oxbow lakes (Hasanand Middendorp 1998; Bala and Hasan 1999).
The present study attempts to establish therelationship between Secchi depth and other waterquality parameters, particularly chlorophyll-a con-centration. An inverse significant relationship
between chlorophyll-a concentration and Secchidepth was observed in all Oxbow lakes. When theminimum Secchi depth was observed the highestchlorophyll-a value was recorded in all Oxbow lakesand vice versa.
The Secchi disc visibility provides an estimate ofwater transparency that is closely related to planktonabundance, the amount of sandy clay, detritus andorganic matter suspended in the water, and thequantity of dissolved elements in the water (Almazanand Boyd 1978; Li and Xu 1995). Secchi depth as ageneral indicator of chlorophyll-a concentrationhas been reported to be negatively related tochlorophyll-a concentration (Hepher 1962; Barica1975). Anuta (1995) reported that fish productionwas correlated with mean chlorophyll-a concentra-tion (P<0.01) and abundance of zooplankton. Secchidepth reading has therefore often been used as anindicator of primary productivity in ponds and smallreservoirs. Since measurements of phytoplanktonproductivity or plankton abundance may be used asindices of potential fish production in ponds, Secchidepth reading has often been used as a guide forpond fertilisation. However, Secchi disc visibilitymay not always be acceptable as an index of fishproduction, as some regions are less turbid thanothers.
There have been many reports dealing with therelationships between conductivity, nitrate-nitrogen,phosphate-phosphorus and fish yield (Ryder 1965,1982; Ghosh 1992). Conductivity (π) and total dis-solved solids (TDS) have been advocated as areliable parameter to study productivity and topredict fish yield. Rawson (1951) showed that totalmineral content, conductivity and TDS were deemedimportant parameters for estimating the productivityof the lakes. Northcote and Larkin (1958) found fishproduction to be proportional to TDS. Rawson(1951) showed that TDS is an important parameterin estimating the productivity of lakes; high fishyield was due to high values of TDS.
P < 0.05 = ±0.232 at degrees of freedom of 70; P < 0.01 = ±0.302 at degrees of freedom of 70; P < 0.001 = ±0.380 at degreesof freedom of 70.
Table 9. Correlation matrix between different water quality parameters of pooled data of all lakes.
Chlorophyll–a(µg/L)
Secchi depth(cm)
Temperature(0C)
Conductivity(µΩ/cm)
TDS(mg/L)
Secchi depth (cm) –0.634***Temperature (0C) 0.262* –0.199Conductivity (µΩ/cm) –0.010 –0.202 –0.326**TDS (mg/L) –0.023 –0.206 –0.311** 0.988***Morpho-edaphic index (MEI) 0.582*** –0.654*** 0.003 0.539*** 0.534***

133
Figure 5. Seasonal fluctuation of chlorophyll-a and Secchi depth in Bukbhara Lake.
Figure 6. Seasonal fluctuation of chlorophyll-a and Secchi depth in Bahadurpur Lake.
Figure 7. Relationship between Secchi depth and chlorophyll-a using pooled data of all lakes.
120
100
80
60
40
20
0
Sec
chi d
epth
(cm
)45
40
35
30
25
20
15
10
5
0
Chl
orop
hyll-
a (m
g/l)
Septe
mbe
r
Octobe
r
Novem
ber
Decem
ber
Decem
ber
Janu
ary
Janu
ary
Febru
ary
May
May
June
June
Sampling period
Secchi depth (cm)
chlorophyll-a (µg/l)
300
250
200
150
100
50
0
Sec
chi d
epth
(cm
)
18
16
14
12
10
8
6
4
2
0
Chl
orop
hyll-
a (m
g/l)
Secchi depth (cm)
chlorophyll-a (µg/l)
Sampling periodSep
tem
ber
Octobe
r
Novem
ber
Decem
ber
Decem
ber
Janu
ary
Janu
ary
Febru
ary
May
May
June
June
300
250
200
150
100
50
0
Sec
chi d
epth
(cm
)
0 20 40 60 80 100Chlorophyll-a (mg/l)
y = –1.7625x + 139.47
R2 = 0.4027
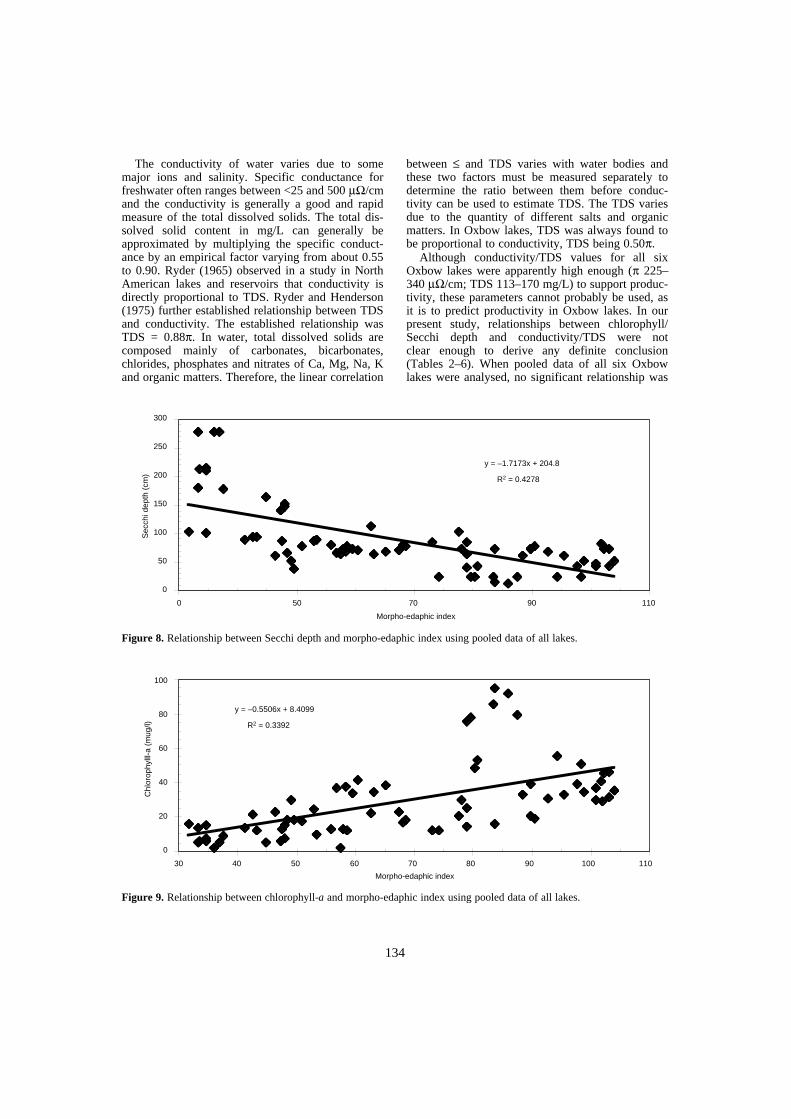
134
The conductivity of water varies due to somemajor ions and salinity. Specific conductance forfreshwater often ranges between <25 and 500 µΩ/cmand the conductivity is generally a good and rapidmeasure of the total dissolved solids. The total dis-solved solid content in mg/L can generally beapproximated by multiplying the specific conduct-ance by an empirical factor varying from about 0.55to 0.90. Ryder (1965) observed in a study in NorthAmerican lakes and reservoirs that conductivity isdirectly proportional to TDS. Ryder and Henderson(1975) further established relationship between TDSand conductivity. The established relationship wasTDS = 0.88π. In water, total dissolved solids arecomposed mainly of carbonates, bicarbonates,chlorides, phosphates and nitrates of Ca, Mg, Na, Kand organic matters. Therefore, the linear correlation
between ≤ and TDS varies with water bodies andthese two factors must be measured separately todetermine the ratio between them before conduc-tivity can be used to estimate TDS. The TDS variesdue to the quantity of different salts and organicmatters. In Oxbow lakes, TDS was always found tobe proportional to conductivity, TDS being 0.50π.
Although conductivity/TDS values for all sixOxbow lakes were apparently high enough (π 225–340 µΩ/cm; TDS 113–170 mg/L) to support produc-tivity, these parameters cannot probably be used, asit is to predict productivity in Oxbow lakes. In ourpresent study, relationships between chlorophyll/Secchi depth and conductivity/TDS were notclear enough to derive any definite conclusion(Tables 2–6). When pooled data of all six Oxbowlakes were analysed, no significant relationship was
Figure 8. Relationship between Secchi depth and morpho-edaphic index using pooled data of all lakes.
Figure 9. Relationship between chlorophyll-a and morpho-edaphic index using pooled data of all lakes.
300
250
200
150
100
50
0
Sec
chi d
epth
(cm
)
0 50 70 90 110
Morpho-edaphic index
y = –1.7173x + 204.8
R2 = 0.4278
y = –0.5506x + 8.4099
R2 = 0.3392
100
80
60
40
20
0
Chl
orop
hylll
-a (
mug
/l)
30 40 50 60 70 80 90 100 110
Morpho-edaphic index
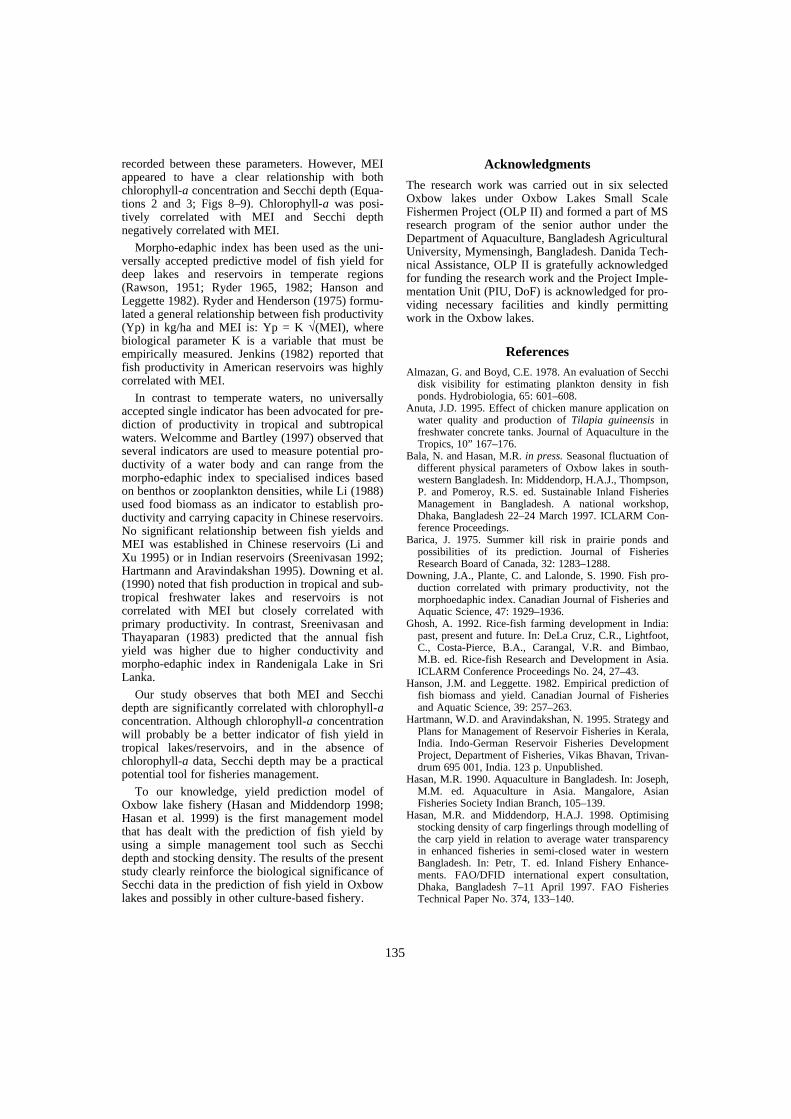
135
recorded between these parameters. However, MEIappeared to have a clear relationship with bothchlorophyll-a concentration and Secchi depth (Equa-tions 2 and 3; Figs 8–9). Chlorophyll-a was posi-tively correlated with MEI and Secchi depthnegatively correlated with MEI.
Morpho-edaphic index has been used as the uni-versally accepted predictive model of fish yield fordeep lakes and reservoirs in temperate regions(Rawson, 1951; Ryder 1965, 1982; Hanson andLeggette 1982). Ryder and Henderson (1975) formu-lated a general relationship between fish productivity(Yp) in kg/ha and MEI is: Yp = K √(MEI), wherebiological parameter K is a variable that must beempirically measured. Jenkins (1982) reported thatfish productivity in American reservoirs was highlycorrelated with MEI.
In contrast to temperate waters, no universallyaccepted single indicator has been advocated for pre-diction of productivity in tropical and subtropicalwaters. Welcomme and Bartley (1997) observed thatseveral indicators are used to measure potential pro-ductivity of a water body and can range from themorpho-edaphic index to specialised indices basedon benthos or zooplankton densities, while Li (1988)used food biomass as an indicator to establish pro-ductivity and carrying capacity in Chinese reservoirs.No significant relationship between fish yields andMEI was established in Chinese reservoirs (Li andXu 1995) or in Indian reservoirs (Sreenivasan 1992;Hartmann and Aravindakshan 1995). Downing et al.(1990) noted that fish production in tropical and sub-tropical freshwater lakes and reservoirs is notcorrelated with MEI but closely correlated withprimary productivity. In contrast, Sreenivasan andThayaparan (1983) predicted that the annual fishyield was higher due to higher conductivity andmorpho-edaphic index in Randenigala Lake in SriLanka.
Our study observes that both MEI and Secchidepth are significantly correlated with chlorophyll-aconcentration. Although chlorophyll-a concentrationwill probably be a better indicator of fish yield intropical lakes/reservoirs, and in the absence ofchlorophyll-a data, Secchi depth may be a practicalpotential tool for fisheries management.
To our knowledge, yield prediction model ofOxbow lake fishery (Hasan and Middendorp 1998;Hasan et al. 1999) is the first management modelthat has dealt with the prediction of fish yield byusing a simple management tool such as Secchidepth and stocking density. The results of the presentstudy clearly reinforce the biological significance ofSecchi data in the prediction of fish yield in Oxbowlakes and possibly in other culture-based fishery.
Acknowledgments
The research work was carried out in six selectedOxbow lakes under Oxbow Lakes Small ScaleFishermen Project (OLP II) and formed a part of MSresearch program of the senior author under theDepartment of Aquaculture, Bangladesh AgriculturalUniversity, Mymensingh, Bangladesh. Danida Tech-nical Assistance, OLP II is gratefully acknowledgedfor funding the research work and the Project Imple-mentation Unit (PIU, DoF) is acknowledged for pro-viding necessary facilities and kindly permittingwork in the Oxbow lakes.
ReferencesAlmazan, G. and Boyd, C.E. 1978. An evaluation of Secchi
disk visibility for estimating plankton density in fishponds. Hydrobiologia, 65: 601–608.
Anuta, J.D. 1995. Effect of chicken manure application onwater quality and production of Tilapia guineensis infreshwater concrete tanks. Journal of Aquaculture in theTropics, 10” 167–176.
Bala, N. and Hasan, M.R. in press. Seasonal fluctuation ofdifferent physical parameters of Oxbow lakes in south-western Bangladesh. In: Middendorp, H.A.J., Thompson,P. and Pomeroy, R.S. ed. Sustainable Inland FisheriesManagement in Bangladesh. A national workshop,Dhaka, Bangladesh 22–24 March 1997. ICLARM Con-ference Proceedings.
Barica, J. 1975. Summer kill risk in prairie ponds andpossibilities of its prediction. Journal of FisheriesResearch Board of Canada, 32: 1283–1288.
Downing, J.A., Plante, C. and Lalonde, S. 1990. Fish pro-duction correlated with primary productivity, not themorphoedaphic index. Canadian Journal of Fisheries andAquatic Science, 47: 1929–1936.
Ghosh, A. 1992. Rice-fish farming development in India:past, present and future. In: DeLa Cruz, C.R., Lightfoot,C., Costa-Pierce, B.A., Carangal, V.R. and Bimbao,M.B. ed. Rice-fish Research and Development in Asia.ICLARM Conference Proceedings No. 24, 27–43.
Hanson, J.M. and Leggette. 1982. Empirical prediction offish biomass and yield. Canadian Journal of Fisheriesand Aquatic Science, 39: 257–263.
Hartmann, W.D. and Aravindakshan, N. 1995. Strategy andPlans for Management of Reservoir Fisheries in Kerala,India. Indo-German Reservoir Fisheries DevelopmentProject, Department of Fisheries, Vikas Bhavan, Trivan-drum 695 001, India. 123 p. Unpublished.
Hasan, M.R. 1990. Aquaculture in Bangladesh. In: Joseph,M.M. ed. Aquaculture in Asia. Mangalore, AsianFisheries Society Indian Branch, 105–139.
Hasan, M.R. and Middendorp, H.A.J. 1998. Optimisingstocking density of carp fingerlings through modelling ofthe carp yield in relation to average water transparencyin enhanced fisheries in semi-closed water in westernBangladesh. In: Petr, T. ed. Inland Fishery Enhance-ments. FAO/DFID international expert consultation,Dhaka, Bangladesh 7–11 April 1997. FAO FisheriesTechnical Paper No. 374, 133–140.

136
Hasan, M.R., Bala, N. and Middendorp, A.J. 1999. Secchidisc as a tool to determine stocking density and predictfish yield in culture-based fisheries. In: Middendorp,H.A.J., Thompson, P. and Pomeroy, R.S. ed. SustainableInland Fisheries Management in Bangladesh. A nationalworkshop, Dhaka, Bangladesh 22–24 March 1997.ICLARM Conference Proceedings 58, Manila, Philip-pines, 144–140.
Hepher, B. 1962. Primary production in fish ponds and itsapplication to fertilisation experiments. Limnology andOceanography, 7: 131–135.
Jenkins, R.M. 1982. The morpho-edaphic index and reser-voir fish production. Transaction of American FisheriesSociety, 111: 133–140.
Li, S. 1988. The principles and strategies of fish culture inChinese reservoirs. In: De Silva, S.S. ed. ReservoirFishery Management and Development in Asia. Aregional workshop, Kathmandu, Nepal 23–28 November1987. IDRC Proceedings, 214–223.
Li, S. and Xu, S. 1995. Culture and Capture of Fish inChinese Reservoirs. Penang, Southbound and Ottawa,International Development Research Centre, 128 p.
Northcote, T.G. and Larkin, P.A. 1958. Indices of produc-tivity in British Columbia lakes. Journal of FisheriesResearch Board of Canada, 13: 515–540.
Oxbow Lakes Project II. 1995. Baor Survey: water areaand water volume of OLP II baors at various waterlevels. Jessore, Bangladesh, PIU/BRAC/DTA, 142 p.Unpublished.
——1997. Baor Biological Studies Annual Report (July1996–June 1997), Volume I, Studies and Research
Report No. 27, Jessore, Bangladesh, PIU/BRAC/DTA,67 p. Unpublished.
Rawson, D.S. 1951. The total mineral content of lakewater. Ecology, 32: 660–672.
Ryder, R.A. 1965. A method for estimating the potentialfish production of north-temperate lakes. Transaction ofAmerican Fisheries Society, 94: 214–218.
——1982. The morpho-edaphic index — use, abuse andfundamental concepts. Transaction of American FisheriesSociety, 111: 154–164.
Ryder, R.A. and Henderson, H.F. 1975. Estimations ofpotential fish yield for the Nasser reservoir, ArabRepublic of Egypt. Journal of Fisheries Research Boardof Canada, 32: 3127–3151.
Sreenivasan, A. 1992. Limnology and fishery of somesouth Indian reservoirs. In: De Silva, S.S. ed. ReservoirFisheries of Asia. Second Asian Reservoir FisheriesWorkshop, Beijing, China, 15–19 October 1990. IDRCProceedings, 23–37.
Sreenivasan, A. and Thayaparan, K. 1983. Fisheries devel-opment in the Mahaweli River systems. Journal of InlandFisheries, 2: 34–39.
Vollenweider, R.A. 1969. A Manual on Methods forMeasuring Primary Production in Aquatic Environments.IBP Handbook No. 12, F.A. Davis Co.
Welcomme, R.L. and Bartley, D.M. 1997. An evaluationof present techniques for the enhancement of fisheries.In: Petr, T. ed. Inland Fishery Enhancements.FAO/DFID international expert consultation, Dhaka,Bangladesh 7–11 April 1997. FAO Fisheries TechnicalPaper No. 374, 1–36.
137
Role of Oreochromis Hybrids in Controlling Microcystisaeruginosa Blooms in the Kotmale Reservoir
Swarna Piyasiri1 and Nishanthi Perera2
Abstract
Kotmale Reservoir (surface area 6.5 km2, maximum depth 90 m, mean depth 26.8 m, volume174 mcm, maximum length 6.8 km, maximum width 1.41 km and hydrology catchment area550 km2) is highly sensitive to eutrophication and blooming. In the latter part of 1990, the reservoirwas covered with a thick bloom of Microcystis aeruginosa, causing severe environmentalproblems. The objective of the present study was to evaluate whether M. aeruginosa blooms canbe controlled by using Oreochromis hybrids. Previous investigations indicated that top-down con-trol of eutrophication by the use of filter-feeding fish has good potential in tropical countries. Thestudy dealt with feeding habits of fish, digestibility of food items, diurnal feeding rhythms, changeof pH during the passage of food in the gut, and the feeding rates. The reservoir fish populationwas dominated by hybrids of Oreochromis niloticus and O. mossambicus, which contributed morethan 80% of the total commercial fish catch. As pure O. niloticus or O. mossambicus are not avail-able in the reservoir, the fish types present are considered to be Oreochromis hybrids. From gutcontent analysis, it was found that the fish is an opportunistic feeder. It has a central position in thefood web of the reservoir. The fry feed mainly on larger zooplankton such as Ceriodaphniaspecies, while the adults prefer detritus and sedimented diatoms in most months. However, whensuspended plankton like Peridinium cinctum or M. aeruginosa increase during low water levels,the fish switch from diatoms to these forms. The intensive feeding hours of the fish occurredbetween 1200 and 1800 hrs, and most fish consumed over 3% of their body weight during thattime. Stomach pH values of the fish dropped below 2, especially during 1800–0000 hrs. Highamounts of digested plankton in the stomach during this period indicated that low pH levels help indigesting the plankton, even though most stomachs were empty during the 0600 hr catch, but thehindgut contained food, thoroughly digested. Oreochromis hybrids filter the plankton, convertingthem directly into fish flesh, which can be readily harvested out from the water body. This shortphytoplankton–herbivorous food chain is one of the most productive ways to get rid of excessnutrients.
KOTMALE Reservoir is the uppermost impoundmentof the interconnected Mahaweli Reservoir chain ofSri Lanka. It was impounded in 1985, for the mainpurpose of hydroelectric power generation. Limno-logical data of the water body have been gatheredsince 1987, and the findings indicated that the reser-voir is sensitive to eutrophication. In 1991, a thickMicrocystis aeruginosa bloom covered the reservoirand further investigations have shown that the
Kotmale Oya carries large quantities of nutrients tothe reservoir via surface runoff of the upper Kotmalecatchment (Anon. 1994; Chandrananda 1995;Piyasiri, 1991, 1992, 1995).
Improvements in the water quality are usuallyattempted by reducing external nutrient loading tothe lake. However, reduction of nutrient input via thecatchment of Kotmale Reservoir is not an immedi-ately available option for eutrophication control(Lammens 1990; Carvalho 1994).
Manipulation of excessive plankton growth withthe use of fish has been studied recently in responseto eutrophication. The ‘classical’ approach in thismethod is the reduction of phytoplankton abundancevia an increase in zooplankton grazing pressure,
1Dept of Zoology, University of Sri Jayewardenapura,Nugegoda, Sri Lanka2Planning Division, Ministry of Forestry and Environment,Sri Lanka

138
resulting from the control of planktivorous fishpopulation (Starling and Rocha 1990; Opuzynski andShireman 1993).
Unlike temperate countries, it is impossible tocontrol huge algal blooms using zooplankton intropical reservoirs, as the size and number of zoo-plankton are much smaller compared to the phyto-plankton (Fernando 1994). Therefore, as stated byChrisman and Beaves (1990), if biomanipulation isto be successful in the tropics, emphasis should beshifted from zooplankton to the role played by filter-feeding phytophagous fish.
The present investigation commenced in 1994with the objective of finding possibilities to controlthe bloom with Oreochromis hybrids during inten-sive bloom.
Materials and Methods
Food habits and selectivity
Fish samples were collected between April 1994 andApril 1996 using gill, cast and mosquito nets once amonth, and for this purpose, fishers were employed.The catches from gill and cast net were anaesthe-tised, using ethyl-4-aminobenzoate, and identified.Morphological features such as total length, standardlength, body width and weight were determined inmore than 25 fish each time.
The fish collected were then dissected for gutcontent analysis. The gut contents were preserved in5% formalin and stored in plastic containers. In thelaboratory, they were diluted with a known volumeof water. Then observations under the microscopewere conducted and the types of food consumed bythe fish determined. If the fish had eaten plankton,the type, number and size were recorded, and for thedetermination of selectivity, electivity index (Ivelv1961) was used.
D = r − p/r + p − 2rp
where D is the electivity index and p and r are therelative abundance of plankton in fish gut and thereservoir. P (the percentage composition of indi-vidual plankton component) was determined byusing number and point methods of Hynes (1950);r was calculated by using data obtained by monthlyplankton sampling done parallel with fish sampling.
Digestibility of Microcystis and other plankton
Microscopic analysis of culture
Modified Chu media with excess nitrates and phos-phates (Chu 1942) were prepared in a sterilised formand stored in plastic bottles. Fish were dissected inthe field and 1 g of stomach, mid-gut and hind-gutcontents introduced to this media. After two days, a
known volume of the sample was observed under themicroscope to find the growth status of Microcystisand other planktonic forms. Then the remainder ofthe sample was kept aside for about a week andobserved again under the microscope.
pH method
According to Moriarty (1973), when the stomach pHof pure O. niloticus is below 2, the possibility ofMicrocystis digestion is very much higher. The pHof the stomach was measured using integratedJohnson (1–14) and Watman (1–4) pH papers.
Feeding intensity
Diurnal feeding habits of Oreochromis hybrids
Fish were caught at six-hourly intervals usinghorizontally placed gill-nets. These nets were set for24 hours, and every six hours were checked for fishand the fish caught removed. During the two finaldiurnal investigations (December 1995 and April1996), as fishing was prohibited in the reservoir, thefish were caught every six hours by drawing the netsaround the shallow areas of the reservoir and bybeating the water around the net.
Immediately after capture, the fish were anaesthe-tised using ammonium benzoate powder. The fishwere then dissected, the stomach and intestines ofthe fish separated and the stomach with its contentsthen weighed to the nearest 0.01 g (Mettler 2000 gmx). Then the empty stomach was weighed, after itscontents were washed out. The difference in weightbetween the full and empty stomach gives the wetweight of the stomach contents (Getachew 1989).
Daily food consumption and the feeding perio-dicity of the fish were estimated using the followingparameters.
Point method, which is a visual estimation ofstomach fullness, was estimated using the classifica-tion given by Ball (1961). According to that method0–10 points were given to a stomach according to itsfullness. The number of points per stomach (fullnessindex) was determined for each sample taken at6-hourly intervals.
Percentage (%) empty stomachs of the fish werecalculated using the following formula:
% Empty stomachs =
Percentage (%) stomach fullness (W) was calcu-lated using the following formula used in Getachew(1989):
W = wet weight of the stomach contents/bodyweight of the fish × 100.
No. of stomachs without foodTotal number of fish in the sample----------------------------------------------------------------------------------- 100×
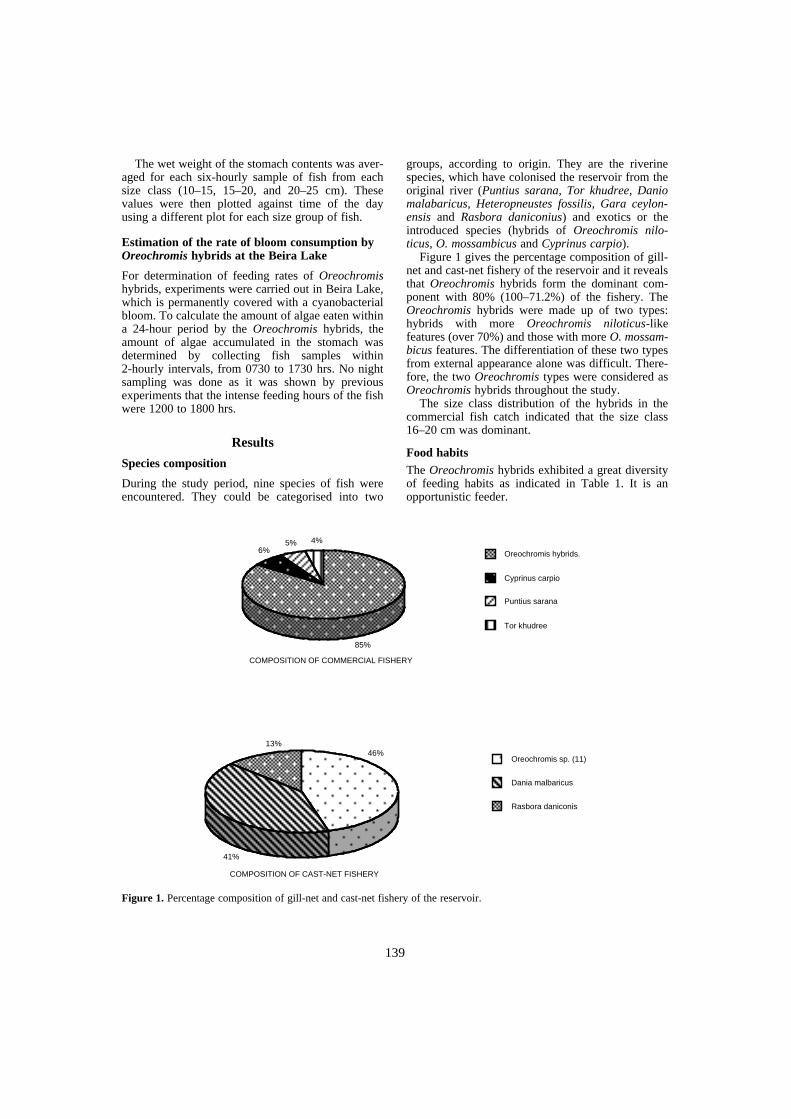
139
The wet weight of the stomach contents was aver-aged for each six-hourly sample of fish from eachsize class (10–15, 15–20, and 20–25 cm). Thesevalues were then plotted against time of the dayusing a different plot for each size group of fish.
Estimation of the rate of bloom consumption by Oreochromis hybrids at the Beira Lake
For determination of feeding rates of Oreochromishybrids, experiments were carried out in Beira Lake,which is permanently covered with a cyanobacterialbloom. To calculate the amount of algae eaten withina 24-hour period by the Oreochromis hybrids, theamount of algae accumulated in the stomach wasdetermined by collecting fish samples within2-hourly intervals, from 0730 to 1730 hrs. No nightsampling was done as it was shown by previousexperiments that the intense feeding hours of the fishwere 1200 to 1800 hrs.
Results
Species composition
During the study period, nine species of fish wereencountered. They could be categorised into two
groups, according to origin. They are the riverinespecies, which have colonised the reservoir from theoriginal river (Puntius sarana, Tor khudree, Daniomalabaricus, Heteropneustes fossilis, Gara ceylon-ensis and Rasbora daniconius) and exotics or theintroduced species (hybrids of Oreochromis nilo-ticus, O. mossambicus and Cyprinus carpio).
Figure 1 gives the percentage composition of gill-net and cast-net fishery of the reservoir and it revealsthat Oreochromis hybrids form the dominant com-ponent with 80% (100–71.2%) of the fishery. TheOreochromis hybrids were made up of two types:hybrids with more Oreochromis niloticus-likefeatures (over 70%) and those with more O. mossam-bicus features. The differentiation of these two typesfrom external appearance alone was difficult. There-fore, the two Oreochromis types were considered asOreochromis hybrids throughout the study.
The size class distribution of the hybrids in thecommercial fish catch indicated that the size class16–20 cm was dominant.
Food habitsThe Oreochromis hybrids exhibited a great diversityof feeding habits as indicated in Table 1. It is anopportunistic feeder.
Figure 1. Percentage composition of gill-net and cast-net fishery of the reservoir.
4%5%6%
85%
46%13%
Oreochromis hybrids.
Cyprinus carpio
Puntius sarana
Tor khudree
Oreochromis sp. (11)
Dania malbaricus
Rasbora daniconis
COMPOSITION OF COMMERCIAL FISHERY
COMPOSITION OF CAST-NET FISHERY
41%
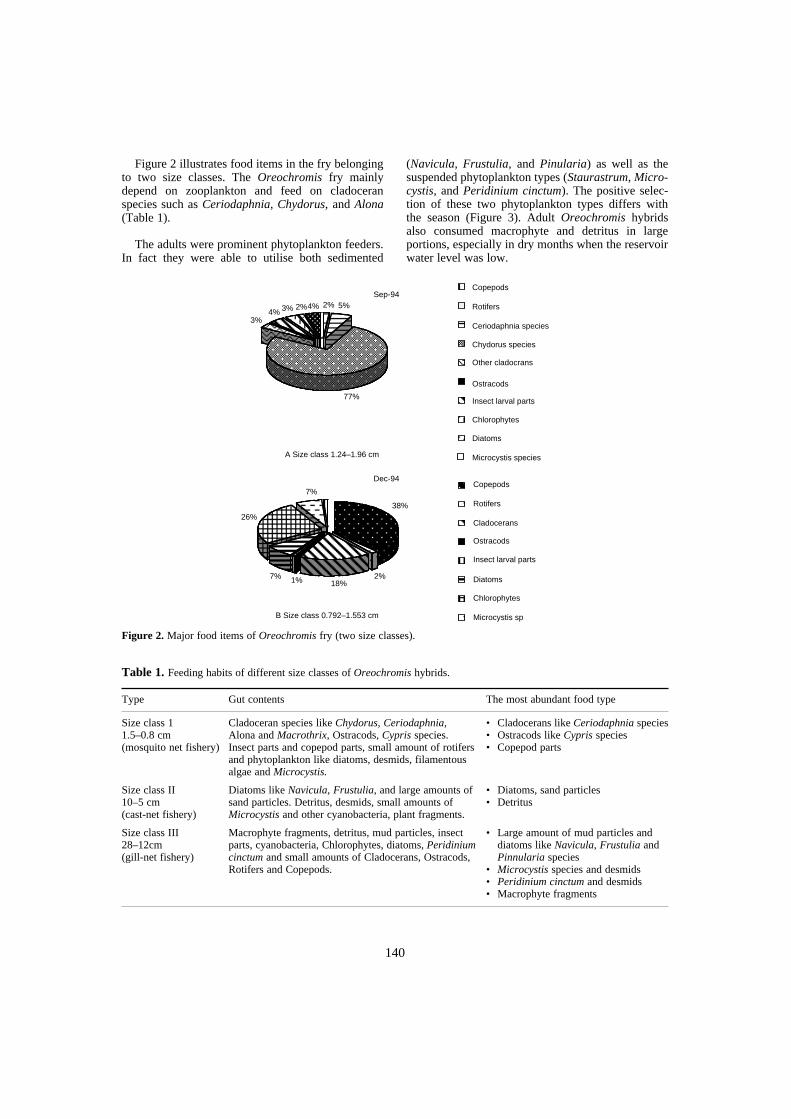
140
Figure 2 illustrates food items in the fry belongingto two size classes. The Oreochromis fry mainlydepend on zooplankton and feed on cladoceranspecies such as Ceriodaphnia, Chydorus, and Alona(Table 1).
The adults were prominent phytoplankton feeders.In fact they were able to utilise both sedimented
(Navicula, Frustulia, and Pinularia) as well as thesuspended phytoplankton types (Staurastrum, Micro-cystis, and Peridinium cinctum). The positive selec-tion of these two phytoplankton types differs withthe season (Figure 3). Adult Oreochromis hybridsalso consumed macrophyte and detritus in largeportions, especially in dry months when the reservoirwater level was low.
Figure 2. Major food items of Oreochromis fry (two size classes).
Table 1. Feeding habits of different size classes of Oreochromis hybrids.
Type Gut contents The most abundant food type
Size class 11.5–0.8 cm(mosquito net fishery)
Cladoceran species like Chydorus, Ceriodaphnia, Alona and Macrothrix, Ostracods, Cypris species.Insect parts and copepod parts, small amount of rotifers and phytoplankton like diatoms, desmids, filamentous algae and Microcystis.
• Cladocerans like Ceriodaphnia species• Ostracods like Cypris species• Copepod parts
Size class II10–5 cm(cast-net fishery)
Diatoms like Navicula, Frustulia, and large amounts of sand particles. Detritus, desmids, small amounts of Microcystis and other cyanobacteria, plant fragments.
• Diatoms, sand particles• Detritus
Size class III28–12cm(gill-net fishery)
Macrophyte fragments, detritus, mud particles, insect parts, cyanobacteria, Chlorophytes, diatoms, Peridiniumcinctum and small amounts of Cladocerans, Ostracods, Rotifers and Copepods.
• Large amount of mud particles and diatoms like Navicula, Frustulia and Pinnularia species
• Microcystis species and desmids• Peridinium cinctum and desmids• Macrophyte fragments
Copepods
Rotifers
Ceriodaphnia species
Chydorus species
Other cladocrans
Ostracods
Insect larval parts
Chlorophytes
Diatoms
Microcystis species
Copepods
Rotifers
Cladocerans
Ostracods
Insect larval parts
Diatoms
Chlorophytes
Microcystis sp
5%2%4%3% 2%4%
77%
3%
18%
38%
7%
26%
7% 1% 2%
Dec-94
Sep-94
A Size class 1.24–1.96 cm
B Size class 0.792–1.553 cm
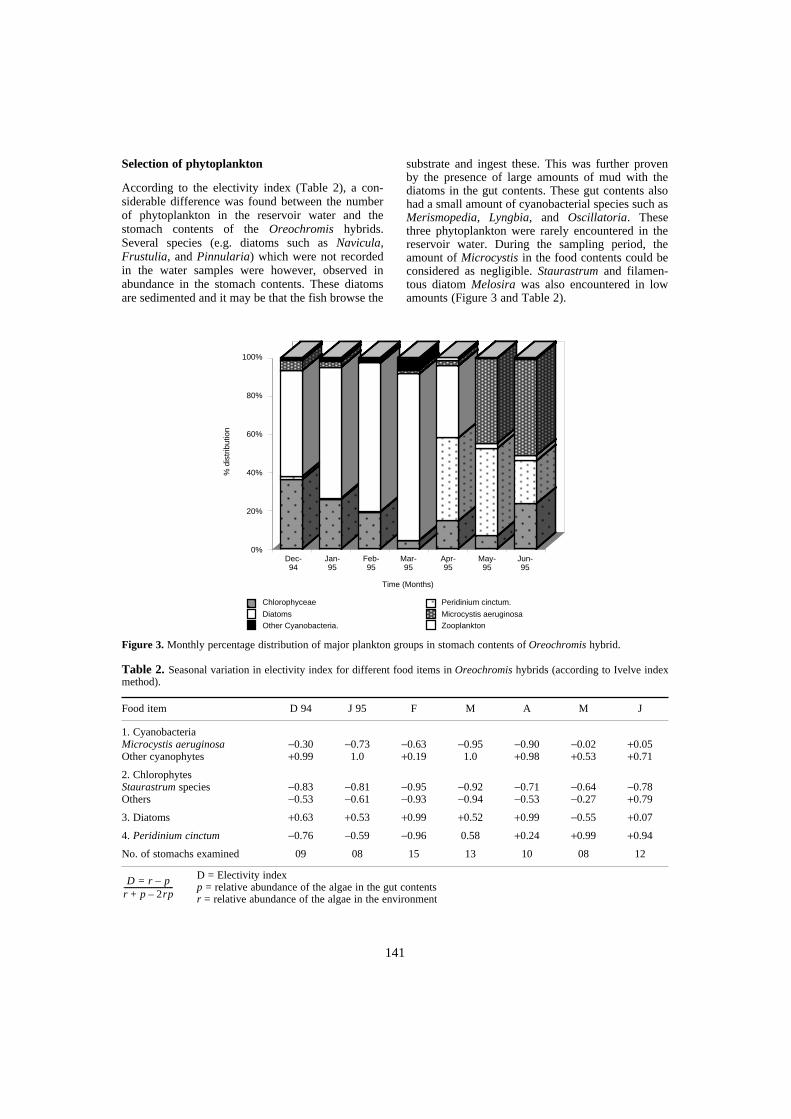
141
Selection of phytoplankton
According to the electivity index (Table 2), a con-siderable difference was found between the numberof phytoplankton in the reservoir water and thestomach contents of the Oreochromis hybrids.Several species (e.g. diatoms such as Navicula,Frustulia, and Pinnularia) which were not recordedin the water samples were however, observed inabundance in the stomach contents. These diatomsare sedimented and it may be that the fish browse the
substrate and ingest these. This was further provenby the presence of large amounts of mud with thediatoms in the gut contents. These gut contents alsohad a small amount of cyanobacterial species such asMerismopedia, Lyngbia, and Oscillatoria. Thesethree phytoplankton were rarely encountered in thereservoir water. During the sampling period, theamount of Microcystis in the food contents could beconsidered as negligible. Staurastrum and filamen-tous diatom Melosira was also encountered in lowamounts (Figure 3 and Table 2).
Figure 3. Monthly percentage distribution of major plankton groups in stomach contents of Oreochromis hybrid.
D = Electivity indexp = relative abundance of the algae in the gut contentsr = relative abundance of the algae in the environment
Table 2. Seasonal variation in electivity index for different food items in Oreochromis hybrids (according to Ivelve indexmethod).
Food item D 94 J 95 F M A M J
1. CyanobacteriaMicrocystis aeruginosaOther cyanophytes
−0.30+0.99
−0.731.0
−0.63+0.19
−0.951.0
−0.90+0.98
−0.02+0.53
+0.05+0.71
2. ChlorophytesStaurastrum speciesOthers
−0.83−0.53
−0.81−0.61
−0.95−0.93
−0.92−0.94
−0.71−0.53
−0.64−0.27
−0.78+0.79
3. Diatoms +0.63 +0.53 +0.99 +0.52 +0.99 −0.55 +0.07
4. Peridinium cinctum −0.76 –0.59 −0.96 0.58 +0.24 +0.99 +0.94
No. of stomachs examined 09 08 15 13 10 08 12
Dec-94
Time (Months)
100%
80%
60%
40%
20%
0%Jan-95
Feb-95
Mar-95
Apr-95
May-95
Jun-95
Chlorophyceae
DiatomsOther Cyanobacteria.
Peridinium cinctum.
Microcystis aeruginosaZooplankton
% d
istr
ibut
ion
D r p–=r p 2rp–+---------------------------
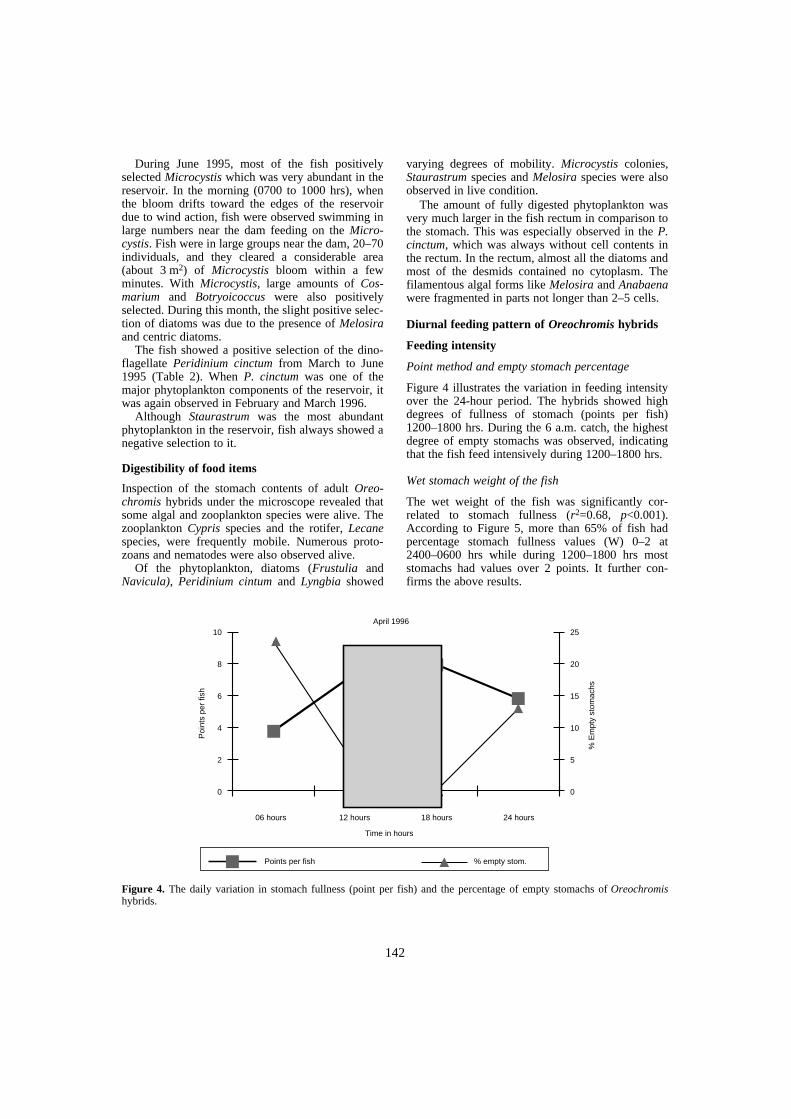
142
During June 1995, most of the fish positivelyselected Microcystis which was very abundant in thereservoir. In the morning (0700 to 1000 hrs), whenthe bloom drifts toward the edges of the reservoirdue to wind action, fish were observed swimming inlarge numbers near the dam feeding on the Micro-cystis. Fish were in large groups near the dam, 20–70individuals, and they cleared a considerable area(about 3 m2) of Microcystis bloom within a fewminutes. With Microcystis, large amounts of Cos-marium and Botryoicoccus were also positivelyselected. During this month, the slight positive selec-tion of diatoms was due to the presence of Melosiraand centric diatoms.
The fish showed a positive selection of the dino-flagellate Peridinium cinctum from March to June1995 (Table 2). When P. cinctum was one of themajor phytoplankton components of the reservoir, itwas again observed in February and March 1996.
Although Staurastrum was the most abundantphytoplankton in the reservoir, fish always showed anegative selection to it.
Digestibility of food items
Inspection of the stomach contents of adult Oreo-chromis hybrids under the microscope revealed thatsome algal and zooplankton species were alive. Thezooplankton Cypris species and the rotifer, Lecanespecies, were frequently mobile. Numerous proto-zoans and nematodes were also observed alive.
Of the phytoplankton, diatoms (Frustulia andNavicula), Peridinium cintum and Lyngbia showed
varying degrees of mobility. Microcystis colonies,Staurastrum species and Melosira species were alsoobserved in live condition.
The amount of fully digested phytoplankton wasvery much larger in the fish rectum in comparison tothe stomach. This was especially observed in the P.cinctum, which was always without cell contents inthe rectum. In the rectum, almost all the diatoms andmost of the desmids contained no cytoplasm. Thefilamentous algal forms like Melosira and Anabaenawere fragmented in parts not longer than 2–5 cells.
Diurnal feeding pattern of Oreochromis hybrids
Feeding intensity
Point method and empty stomach percentage
Figure 4 illustrates the variation in feeding intensityover the 24-hour period. The hybrids showed highdegrees of fullness of stomach (points per fish)1200–1800 hrs. During the 6 a.m. catch, the highestdegree of empty stomachs was observed, indicatingthat the fish feed intensively during 1200–1800 hrs.
Wet stomach weight of the fish
The wet weight of the fish was significantly cor-related to stomach fullness (r2=0.68, p<0.001).According to Figure 5, more than 65% of fish hadpercentage stomach fullness values (W) 0–2 at2400–0600 hrs while during 1200–1800 hrs moststomachs had values over 2 points. It further con-firms the above results.
Figure 4. The daily variation in stomach fullness (point per fish) and the percentage of empty stomachs of Oreochromishybrids.
10
8
6
4
2
0
25
20
15
10
5
0
Poi
nts
per
fish
% E
mpt
y st
omac
hs
06 hours 12 hours 18 hours 24 hours
Points per fish % empty stom.
Time in hours
April 1996
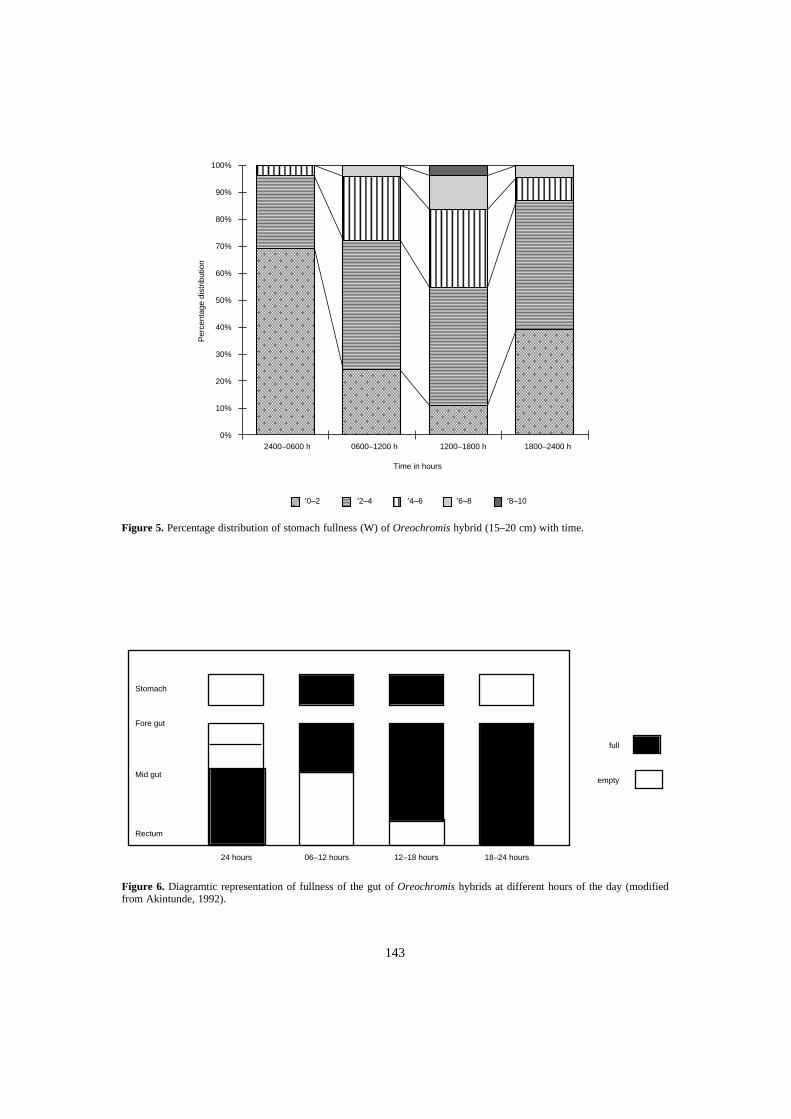
143
Figure 5. Percentage distribution of stomach fullness (W) of Oreochromis hybrid (15–20 cm) with time.
Figure 6. Diagramtic representation of fullness of the gut of Oreochromis hybrids at different hours of the day (modifiedfrom Akintunde, 1992).
2400–0600 h
100%
90%
80%
70%
60%
50%
40%
30%
20%
10%
0%
Per
cent
age
dist
ribut
ion
Time in hours
0600–1200 h 1200–1800 h 1800–2400 h
′0–2 ′2–4 ′4–6 ′6–8 ′8–10
Stomach
Fore gut
Mid gut
Rectum
24 hours 06–12 hours 12–18 hours 18–24 hours
full
empty
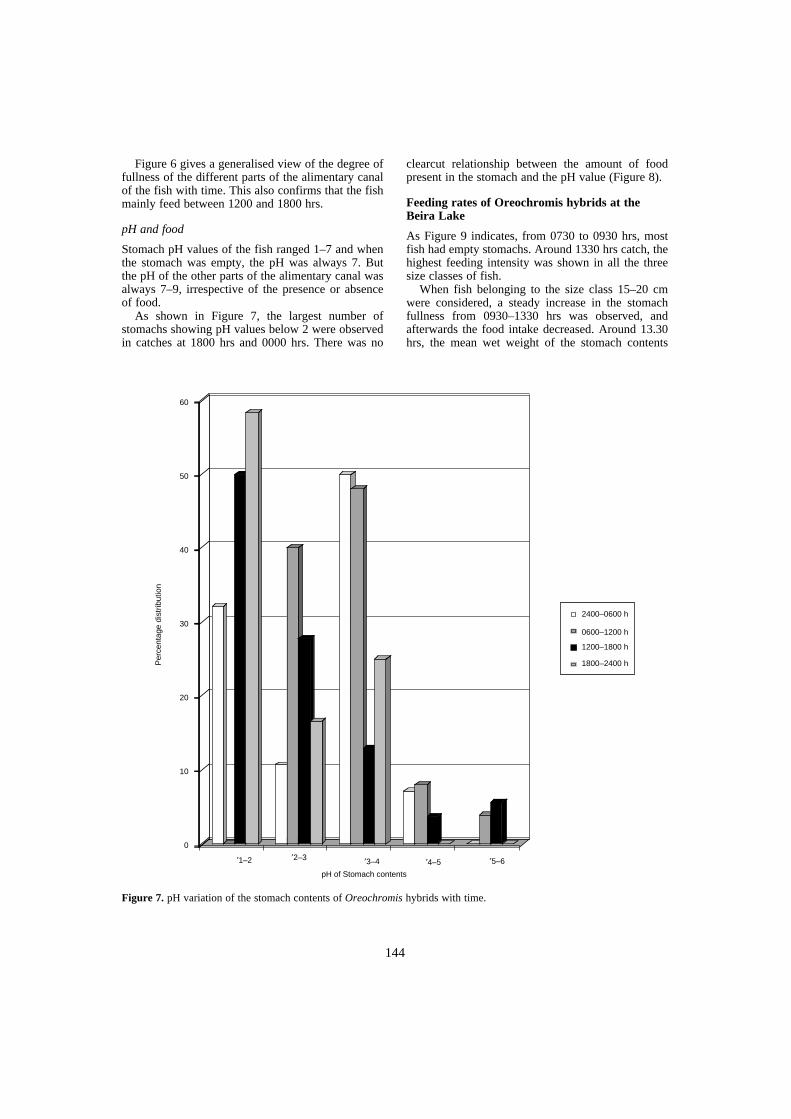
144
Figure 6 gives a generalised view of the degree offullness of the different parts of the alimentary canalof the fish with time. This also confirms that the fishmainly feed between 1200 and 1800 hrs.
pH and food
Stomach pH values of the fish ranged 1–7 and whenthe stomach was empty, the pH was always 7. Butthe pH of the other parts of the alimentary canal wasalways 7–9, irrespective of the presence or absenceof food.
As shown in Figure 7, the largest number ofstomachs showing pH values below 2 were observedin catches at 1800 hrs and 0000 hrs. There was no
clearcut relationship between the amount of foodpresent in the stomach and the pH value (Figure 8).
Feeding rates of Oreochromis hybrids at the Beira Lake
As Figure 9 indicates, from 0730 to 0930 hrs, mostfish had empty stomachs. Around 1330 hrs catch, thehighest feeding intensity was shown in all the threesize classes of fish.
When fish belonging to the size class 15–20 cmwere considered, a steady increase in the stomachfullness from 0930–1330 hrs was observed, andafterwards the food intake decreased. Around 13.30hrs, the mean wet weight of the stomach contents
Figure 7. pH variation of the stomach contents of Oreochromis hybrids with time.
Per
cent
age
dist
ribut
ion
60
50
40
30
20
10
0
′1–2 ′2–3 ′3–4 ′4–5 ′5–6
pH of Stomach contents
2400–0600 h
0600–1200 h
1200–1800 h
1800–2400 h
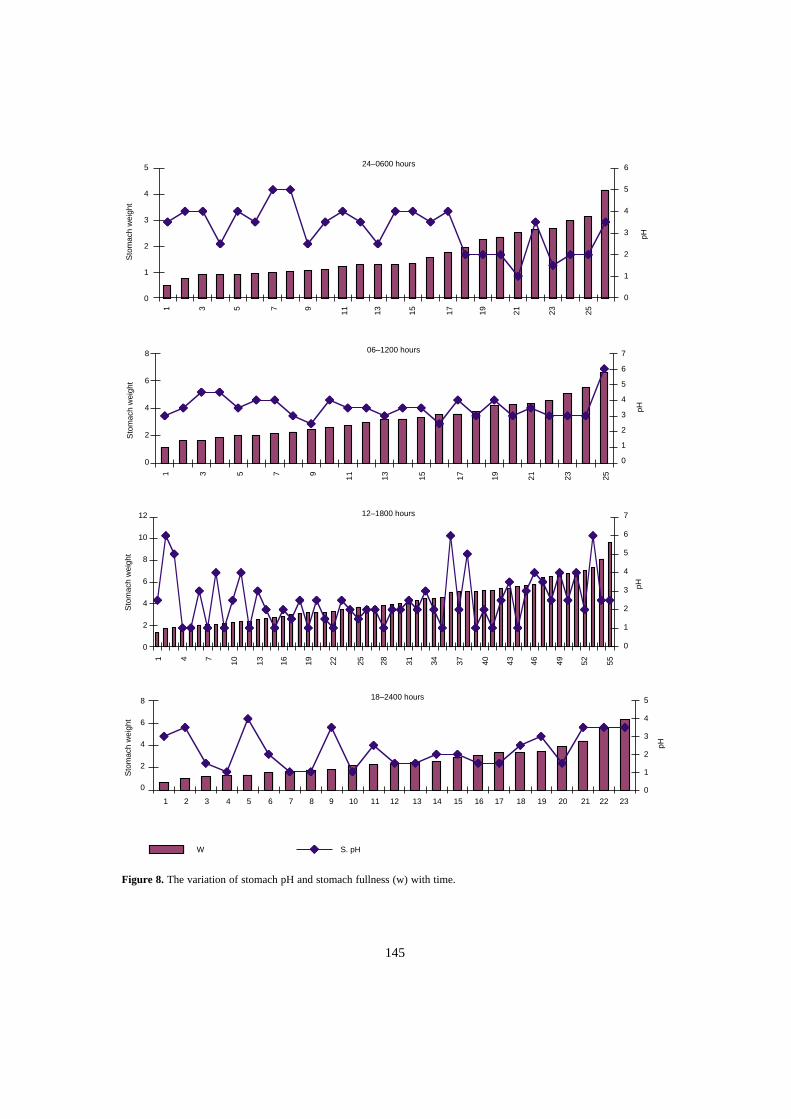
145
Figure 8. The variation of stomach pH and stomach fullness (w) with time.
24–0600 hours5
4
3
2
1
0
6
5
4
3
2
1
0
pH
Sto
mac
h w
eigh
t
1 3 5 7 9 11 13 15 17 19 21 23 25
06–1200 hours8
6
4
2
0
pH
Sto
mac
h w
eigh
t
7
6
5
4
3
2
1
0
1 3 5 7 9 11 13 15 17 19 21 23 25
pH
7
6
5
4
3
2
1
0
12
10
8
6
4
2
0
Sto
mac
h w
eigh
t
1 4 7 10 13 16 19 22 25 28 31 34 37 40 43 46 49 52 55
12–1800 hours
18–2400 hours8
6
4
2
0
Sto
mac
h w
eigh
t
5
4
3
2
1
0
pH
1 23222120191817161514131211102 3 4 5 6 7 8 9
W S. pH
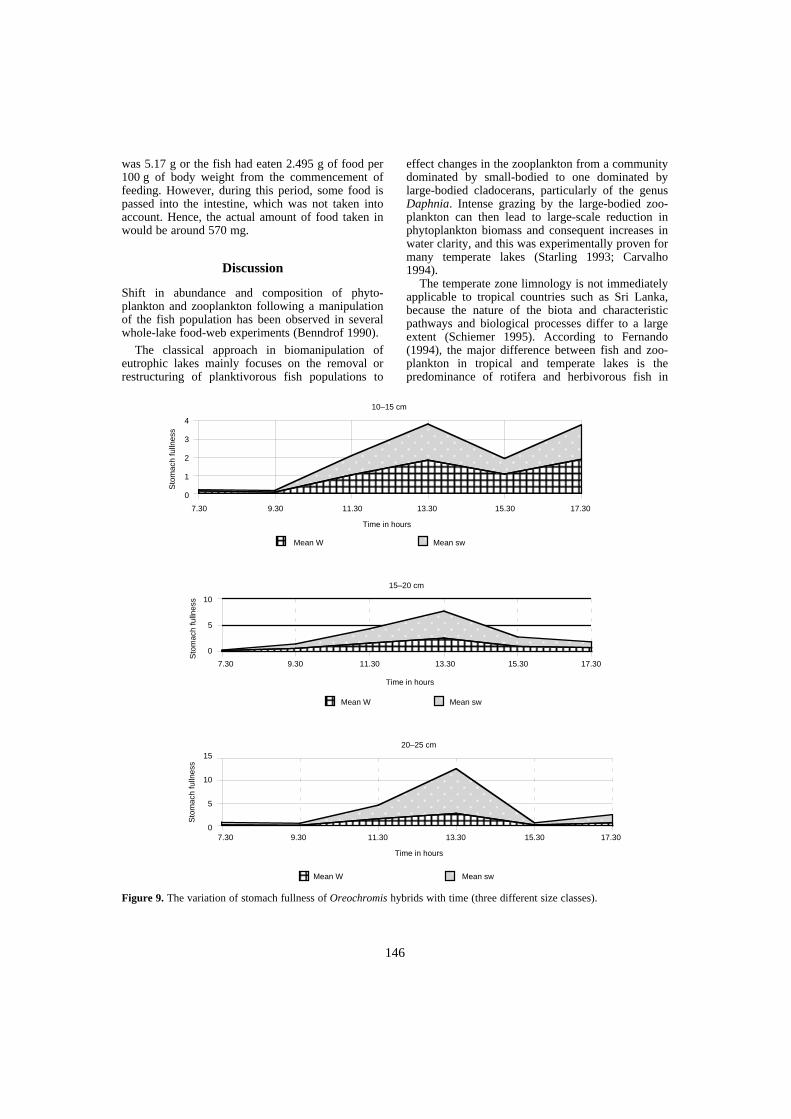
146
was 5.17 g or the fish had eaten 2.495 g of food per100 g of body weight from the commencement offeeding. However, during this period, some food ispassed into the intestine, which was not taken intoaccount. Hence, the actual amount of food taken inwould be around 570 mg.
Discussion
Shift in abundance and composition of phyto-plankton and zooplankton following a manipulationof the fish population has been observed in severalwhole-lake food-web experiments (Benndrof 1990).
The classical approach in biomanipulation ofeutrophic lakes mainly focuses on the removal orrestructuring of planktivorous fish populations to
effect changes in the zooplankton from a communitydominated by small-bodied to one dominated bylarge-bodied cladocerans, particularly of the genusDaphnia. Intense grazing by the large-bodied zoo-plankton can then lead to large-scale reduction inphytoplankton biomass and consequent increases inwater clarity, and this was experimentally proven formany temperate lakes (Starling 1993; Carvalho1994).
The temperate zone limnology is not immediatelyapplicable to tropical countries such as Sri Lanka,because the nature of the biota and characteristicpathways and biological processes differ to a largeextent (Schiemer 1995). According to Fernando(1994), the major difference between fish and zoo-plankton in tropical and temperate lakes is thepredominance of rotifera and herbivorous fish in
Figure 9. The variation of stomach fullness of Oreochromis hybrids with time (three different size classes).
10–15 cm
15–20 cm
20–25 cm
4
3
2
1
0
Sto
mac
h fu
llnes
s
7.30 9.30 11.30 13.30 15.30 17.30
7.30 9.30 11.30 13.30 15.30 17.30
7.30 9.30 11.30 13.30 15.30 17.30
Time in hours
Mean W Mean sw
Time in hours
Mean W Mean sw
Time in hours
Mean W Mean sw
10
5
0
Sto
mac
h fu
llnes
s
15
10
5
0
Sto
mac
h fu
llnes
s

147
tropical lakes versus crustacea and non-herbivorousfish in temperate lakes. The relative biomass of zoo-plankton/phytoplankton is low in the tropics andtherefore, unlike in temperate lakes, zooplanktondoes not control phytoplankton biomass in thetropics.
In the Kotmale Reservoir, the zooplankton com-munity was dominated by small-bodied forms suchas nauplii larvae of the copepods and rotifers, andformed less than 1% of the total plankton population(Chandrananda 1995; Perera and Piyasiri 1998). Thefish population was dominated by Oreochromishybrids, an opportunistic feeder.
The larvae and early juvenile tilapias feed espe-cially on small crustaceans such as Ceriodaphniacornuta and Chydorus species and, as recorded byBowen (1976) and Moriarty (1973), the transitionfrom an invertebrate diet to the typical adult diet(herbivorous and detritivores) was usually abrupt.
Blue-green and green algae, diatoms, macrophytesand amorphus detritus are all common constituentsof adult tilapia diets (Bowen 1982; De Silva et al.1984). In the Kotmale Reservoir, tilapias obtain theirfood from diverse substrata such as the lake bottom(sedimented diatoms and detritus), from suspension(especially the green algae and M. aeruginosa), andmacrophytes.
Diel feeding rhythms in tilapias appear to varyaccording to environmental conditions, but moststudies have shown that intense feeding activity isalmost entirely restricted to daytime (Moriarty andMoriarty 1973; Akentunde 1982; Getachew 1989). Asobserved by Getachew (1989), in the Oreochromishybrids of the Kotmale Reservoir, the proportion ofempty stomachs was highest 2400–0600 hrs.
It is now well-established that Sarotherodon andOreochromis species lyse the cell walls of algae andbacteria by copious acid secretion in the stomach,thereby making the contents of algae vulnerable todigestive enzymes (Moriarty 1973; Bowen 1976;Lobel 1981). As reported by Akintunde (1982),food in the stomach of Oreochromis hybrids acts asa stimulus for the secretion of acid, and thelowest pH values in the stomach were observed at1800–2400 hrs. Also, stomach pH values below 2were recorded during 1200–2400 hrs, which helps tolyse the plankton cell walls. Observation of thecultured gut contents under the microscope revealedthe digestibility of the plankton. According toMoriarty and Moriarty (1973), 70% of the ingestedM. aeruginosa was digested by O. niloticus.
Assessments of consumption of algae by tilapiahave been obtained using two approaches: gut contentanalysis of fish from field populations (Moriarty andMoriarty 1973; Hofer and Schiemer 1983; De Silvaet al. 1984; Maitipe and De Silva 1985; Getachew
1989) and direct quantification of algal ingestion byfish in the laboratory (Demster et al. 1993; Kesha-vanth et al. 1994; Demster et al. 1995).
Getachew (1989) has recorded a feeding rate of6 mg/g fish body weight/day for O. niloticus feedingon Botryococcus spp. and Oscillatoria spp. in LakeAwasa. During the present study 24.95 mg/g fishbody weight (wet weight) was observed duringintense feeding hours for Oreochromis hybrids (sizeclass 15–20 cm) in the Beira Lake and fed on cyano-bacterial Spirulina sp. and M. aeruginosa. Thehigher value can be due to the fact that the amount ofwater ingested with food was not taken into accountand only the data of the intense feeding hours(1330 hrs catch) were considered.
According to Van Rijin and Schilo (1989), somefish ponds of Israel which were heavily stocked withtilapia showed shifts from cyanobacterial dominanceto the dominance of chlorophyta and/or Chryso-phtya. They assumed that the heavy grazing on thephytoplankton exerted by tilapia caused a decrease inoverall phytoplankton and nitrogen assimilation, andthus the amount of inorganic nitrogen concentrationin the water column increased. These conditionswere unfavourable for cyanobacteria. As recorded inMiura (1990), reduction of Microcystis as a result ofincreased grazing pressure by the Oreochromishybrids enhances the green algal biomass of thereservoir, resulting in an increasing food supplythrough a food chain that connects the green algae toother fish via the zooplankton.
Conclusion
Oreochromis hybrids which feed upon Microcystisfilter out the plankton, converting the planktondirectly into fish flesh, which can be readilyharvested from the water body. This short phyto-plankton-herbivorous food chain is one of the mostproductive ways to get rid of the excess nutrients orthe top-down control of the bloom. As reservoirfishery depends on stocking and retrieving fish, forthe top-down control of Microcystis bloom to beefficient, a more scientific control of reservoirfishery is a must.
References
Akintunde, E.A. 1982. Feeding rhythm in relation tochanging patterns of pH in the gut of Sarotherodongilaeus (Artedi) of Lake Kaingi, Nigeria. Hydrobiologia,97: 179–184.
Anon. 1994. Upper Kotmale Hydropower Project. EIAReport, Vol. 1 (main report) Ceylon Electricity Board,Ministry of Power and Energy, Sri Lanka, 10–120.

148
Ball, J.N. 1961. On the food of the brown trout of Llyntegid. Proceedings of the Zoological Society of London,134: 1–41.
Benndrof, J. 1990. Conditions for effective biomanipula-tion; conclusions derived from whole-lake experimentsin eutrope. Hydrobiologia, 200/201.
Bowen, S.H. 1976. Mechanism for digestion and growth-quantitative considerations. In: Pullin, R.S.V. andMcConnell, R.M. ed. Biology and Culture of Tilapias,International Center for Living Aquatic ResourcesManagement, Philippines, 141–156.
—— 1982. Feeding, digestion and growth-qualititative con-siderations. In: Pullin, R.S.V. and McConnell, R.M. ed.The Biology and Culture of Tilapias. Published byICLARM Manila, 141–156.
Carvalho, L. 1994. Top-down control of phytoplankton in ashallow hypertrophic lake, Little Mere (England). Hydro-biologia, 275/276, 53–63.
Chandrananda, W.P.N. 1995. Limnology of the KotmaleReservoir and fish plankton interactions. PhD dissertation,University of Sri Jayewardenapura, Sri Lanka, 12–122.
Chrisman, T.L. and Beaves, J.R. 1990. Applicability ofplanktonic biomanipulation for managing eutrophicationin subtropics. Hydrobiolgia, 200/201, 177–185.
Chu, S.P. 1942. The influence of the material compositionof the medium on the growth of planktonic algae 1.Methods and culture media. Journal of Ecology, 30:284–325.
Demster, P.W., Beveridge, M.C.M. and Baird, D.J. 1993.Herbivory in the tilapia Oreochromis niloticus; a com-parison of feeding rates on phytoplankton and peri-phyton. Journal of Fish Biology, 43: 385–392.
Demster, P.W., Baird, D.J. and Beveridge, M.C.M. 1995.Can fish survive by filter-feeding on microparticles?Energy balance in tilapia grazing on algal suspensions.Journal of Fish Biology, 47: 7–17.
De Silva, S.S., Perera, M.K. and Maitipe, P. 1984. Thecomposition, nutritional status and digestiblity of thediets of Sarotherodon mossambicus from nine man-madelakes in Sri Lanka. Environmental Biology of Fishes,11: 205–219.
Fernando, C.H. 1994. Zooplankton, fish and fisheries intropical freshwaters. In: Dumount, H.I., Green, J. andMasundire, H. ed. Studies on the ecology of tropical zoo-plankton. Hydrobiologia, 272: 105–123.
Getachew, T. 1989. Stomach pH, feeding rhythms and inges-tion rate in Oreochromis niloticus L (Pisces; Cichlidae) inLake Awasa, Ethiopia. Hydrobiologia, 174: 38–43.
Hofer, R. and Schiemer, F. 1983. Feeding ecology, assimi-lation efficiencies and energetics of two herbivorous fish:Sarotherodon (Tilapia) mossambicus (Peters) andPuntius filamentosus (Cuv. et al.) In: Schiemer, F. ed.Limnology of Parakrama Samudra, Sri Lanka, TheHague, Dr W. Junk, 155–164.
Hynes, H.B.N. 1950. The food of fresh water Stickleback(Gasterosteus aculentans and Pygosteus pungitias) witha review of methods used in studies of the food of fishes.Journal of Animal Ecology, 19: 35–38.
Ivelve, V.S. 1961. Experimental Ecology of the FeedingFishes. New Heaven, Yale University Press, 302 p.
Keshavanth, P., Beveridge, M.C.M., Baird, D.J., Lawton,N.A. and Codd, G.A. 1994. The functional grazing
response of a phytoplanktivorous fish Oreochromis nilo-ticus to mixtures of toxic and non-toxic strains of thecyanobacterium Microcystis aeruginosa. Journal of FishBiology, 45: 123–129.
Lammens, Eddy H.R.R. 1990. Relations of biotic andabiotic interactions to eutrophication in Tjeukemeer, theNetherlands. Hydrobiologia, 200/201: 29–37.
Lobel, P.S. 1981. Trophic biology of herbivorous reef fish:alimentary pH and digestive capabilities. Journal of FishBiology, 19: 365–397.
Maitipe, P. and De Silva, S.S. 1985. Switches between zoo-phagy, phytophagy and detritivory of Sarothrodendronmossamicus (Peters) populations in 12 man-made SriLankan lakes. Journal of Fish Biology, 26: 49–61.
Miura, T. 1990. The effects of planktivorous fish on theplankton community in a eutrophic lake. Hydrobiologia,200/201: 567–579.
Moirarty, D.J.W. 1973. The physiology of digestion ofblue-green algae in the cichlid fish Tilapia nilotica.Journal of Zoology, London, 171: 25–39.
Moriarty, C.M. and Moriarty, D.J.W. 1973. Quantitativeestimation of the daily ingestion of phytoplankton byTilapia nilotica and Haplochromis nigripinnis in LakeGeorge, Uganda. Journal of Zoology London, 171: 15–23.
Opuszynski, K. and Shireman, J.V. 1993. Food habits,feeding behaviour, and impact of tropical bighead carp,Hapophthalmicthys nobilis, in experimental pond.Journal of Fish Biology, 42: 517–530.
Perera, N. and Piyasiri, S. 1998. Community dynamics ofplankton in the Kotmale Reservoir. Research Sessions ofthe Faculty of Graduate Studies, University of Sri Jaye-wardenapura, Sri Lanka, 133–153.
Piyarsiri, S. 1991. Limnology project at Mahaweli reser-voirs. Some physical properties of Kotmale, Victoria andRandenigala reservoirs. Vidyodaya Journal of Science,Vol. 3, No. 1, 45–61.
—— 1992. Limnology project at Mahaweli Reservoirs.Some physical properties of Kotmale, Victoria andRandenigala reservoirs. Vidyodaya Journal of Science,Vol. 4, No. 1, 155–166.
—— 1995. Eutrophication and blue-green algal problem inKotmale Reservoir in Sri Lanka. In: Timotius, K.H. andGolthenboth, F. ed. Tropical Limnology 2, SatyaWacanan Christian University, Indonesia, 161–169.
Schiemer, F. 1995. Bottom-up vs. top-down control intropical reservoir management. In: Timotius, K.H. andGolthenboth, F. ed. Tropical Limnology 1, SatyaWacanan Christian University, Indonesia, 57–67.
Rijin, Jaap and Shilo, M. 1989. Environmental factors infish culture systems. In: Shilo, M. and Sarig, S. ed. FishCulture in Warm Water Systems. CRC Press, USA,164–174.
Starling, F.L. and Rocha, R.M. 1990. Experimental study ofthe impacts of planktivorous fishes on plankton com-munity and eutrophication of a tropical Brazilian reser-voir. Hydropbiologia, 200/201: 581–591.
Starling, F.L, deReso Monteiro 1993. Control of eutrophica-tion by silver carp (Hapophthalmicthys militrix) in thetropical Paranoa Reservoir (Brazilia, Brazil): Mesocomexperiment. Hydrobiologia, 257: 143–152.

149
Growth of Indian Major and Chinese Carps in Oxbow Lakes Based on Length–frequency Distribution Analysis
M.R. Hasan1, Nityananda Bala2 and Hans A.J. Middendorp2
Abstract
Six species of major carp (Indian rohu, catla, and mrigal, Chinese silver carp, grass carp andcommon carp) are regularly stocked and harvested in oxbow lakes in southwestern Bangladeshunder culture-based fisheries management. Age and growth rates were calculated by using length–frequency distribution analysis and length–weight relationships were established for these carpspecies from six selected oxbow lakes during the period February 1995 to June 1996. Five agegroups (0+ to IV) were identified, although not all age groups were found from all oxbow lakes forall species. Mean growth for six different species was calculated by combining the data for all theoxbow lakes. Age groups ranging 0+ to III years were harvested for all six species. Age group IVwas found for common carp and rohu only.In oxbow lakes, Chinese carps appear to have grownbetter than Indian major carps in the first and second years. In the third year, grass carp grew betterthan the other two Chinese carps and among major carps, catla grew better than rohu and mrigal.In the third year, growth of rohu was comparable to that of silver carp. However, in the context ofoverall age group, growth of Chinese carps was better than local carp. Correlation coefficientbetween length and weight for all carp species for all six lakes was highly significant (P = 0.000).The slope of the regression equations for most of the species in all six lakes was above 3.
THE PRINCIPLES of culture-based fisheries in oxbowlakes (local name baors) are: (1) large-size fingerlingstocking; (2) staggered harvesting; and (3) regularweeding of water hyacinth. Three Indian major carps(rohu, Labeo rohita, catla, Catla catla and mrigal,Cirrhinus mrigala) and three Chinese carps (silvercarp, Hypophthalmichthys molitrix, grass carps,Ctenopharyngodon idella and common carp,Cyprinus carpio) are regularly stocked and harvestedafter a specific period. Growth of stocked fish playsan important role in the culture system in the oxbowlake. The objective of this study is a better under-standing of the age, growth and conditions of stockedfish in oxbow lakes so that an appropriate harvestingstrategy can be developed for better management.
Materials and Methods
Study area
The paper reports the growth studies of six carpscarried out by length–frequency distribution analysisin six selected oxbow lakes under Oxbow LakesProject II (OLP II). The selected oxbow lakes wereNasti, Porapara, Benipur, Marufdia, Bukbhara andBahadurpur. They are in three districts (Jessore, Chua-danga and Jhenaidah) of southwestern Bangladesh.Selection was based on their location and physico-biological characters.
Sampling procedure and data collection
Data collection took place from February to April1995, November–December 1995 and March–June1996. Data were collected during the fishing season(November–June). Data collection period was not thesame for all lakes because the harvesting periodduring the fishing season was not the same for alllakes. Both marketable and undersized fish weretaken randomly from the catch. The total length (cm)and body weight (g) data of three Indian major carps,
1c/- Department of Aquaculture, Bangladesh AgriculturalUniversity, Mymensingh 2202, Bangladesh. Fax: +88-091-55810; email: [email protected] Barguna Aquaculture Extension Project, Patua-khali, Bangladesh
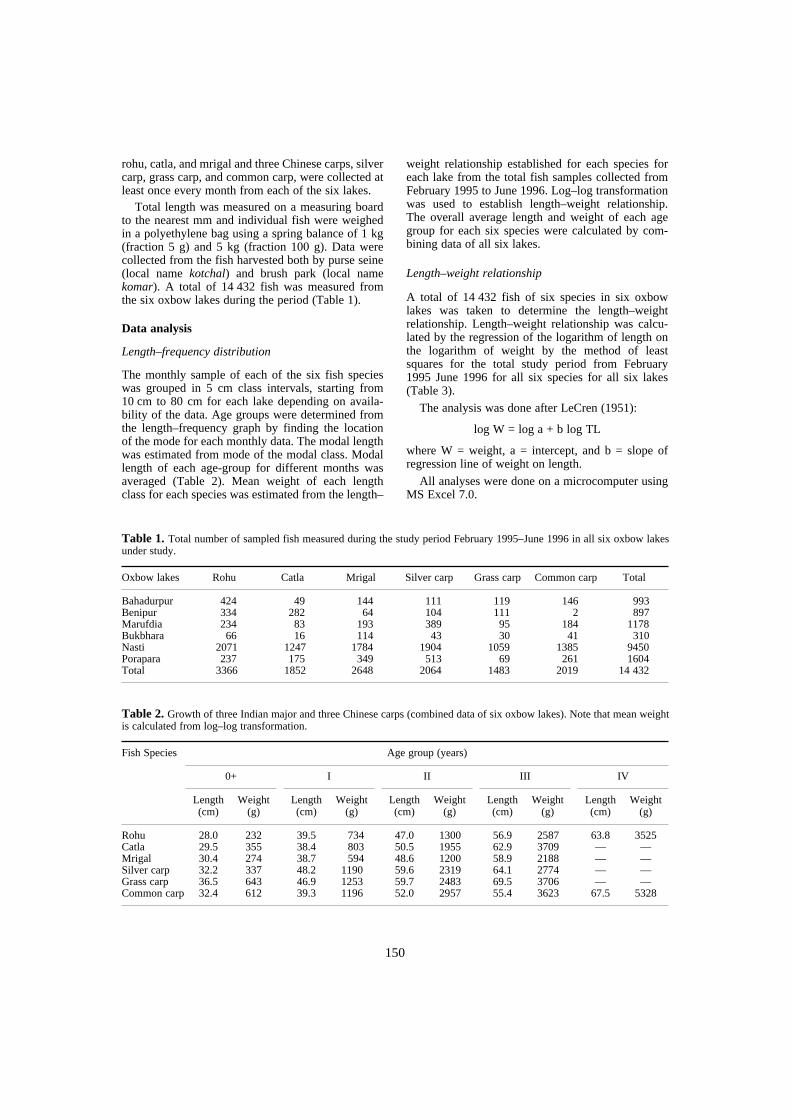
150
rohu, catla, and mrigal and three Chinese carps, silvercarp, grass carp, and common carp, were collected atleast once every month from each of the six lakes.
Total length was measured on a measuring boardto the nearest mm and individual fish were weighedin a polyethylene bag using a spring balance of 1 kg(fraction 5 g) and 5 kg (fraction 100 g). Data werecollected from the fish harvested both by purse seine(local name kotchal) and brush park (local namekomar). A total of 14 432 fish was measured fromthe six oxbow lakes during the period (Table 1).
Data analysis
Length–frequency distribution
The monthly sample of each of the six fish specieswas grouped in 5 cm class intervals, starting from10 cm to 80 cm for each lake depending on availa-bility of the data. Age groups were determined fromthe length–frequency graph by finding the locationof the mode for each monthly data. The modal lengthwas estimated from mode of the modal class. Modallength of each age-group for different months wasaveraged (Table 2). Mean weight of each lengthclass for each species was estimated from the length–
weight relationship established for each species foreach lake from the total fish samples collected fromFebruary 1995 to June 1996. Log–log transformationwas used to establish length–weight relationship.The overall average length and weight of each agegroup for each six species were calculated by com-bining data of all six lakes.
Length–weight relationship
A total of 14 432 fish of six species in six oxbowlakes was taken to determine the length–weightrelationship. Length–weight relationship was calcu-lated by the regression of the logarithm of length onthe logarithm of weight by the method of leastsquares for the total study period from February1995 June 1996 for all six species for all six lakes(Table 3).
The analysis was done after LeCren (1951):
log W = log a + b log TL
where W = weight, a = intercept, and b = slope ofregression line of weight on length.
All analyses were done on a microcomputer usingMS Excel 7.0.
Table 1. Total number of sampled fish measured during the study period February 1995–June 1996 in all six oxbow lakesunder study.
Oxbow lakes Rohu Catla Mrigal Silver carp Grass carp Common carp Total
Bahadurpur 424 49 144 111 119 146 993Benipur 334 282 64 104 111 2 897Marufdia 234 83 193 389 95 184 1178Bukbhara 66 16 114 43 30 41 310Nasti 2071 1247 1784 1904 1059 1385 9450Porapara 237 175 349 513 69 261 1604Total 3366 1852 2648 2064 1483 2019 14 432
Table 2. Growth of three Indian major and three Chinese carps (combined data of six oxbow lakes). Note that mean weightis calculated from log–log transformation.
Fish Species Age group (years)
0+ I II III IV
Length(cm)
Weight(g)
Length(cm)
Weight(g)
Length(cm)
Weight(g)
Length(cm)
Weight(g)
Length(cm)
Weight(g)
Rohu 28.0 232 39.5 734 47.0 1300 56.9 2587 63.8 3525Catla 29.5 355 38.4 803 50.5 1955 62.9 3709 — —Mrigal 30.4 274 38.7 594 48.6 1200 58.9 2188 — —Silver carp 32.2 337 48.2 1190 59.6 2319 64.1 2774 — —Grass carp 36.5 643 46.9 1253 59.7 2483 69.5 3706 — —Common carp 32.4 612 39.3 1196 52.0 2957 55.4 3623 67.5 5328
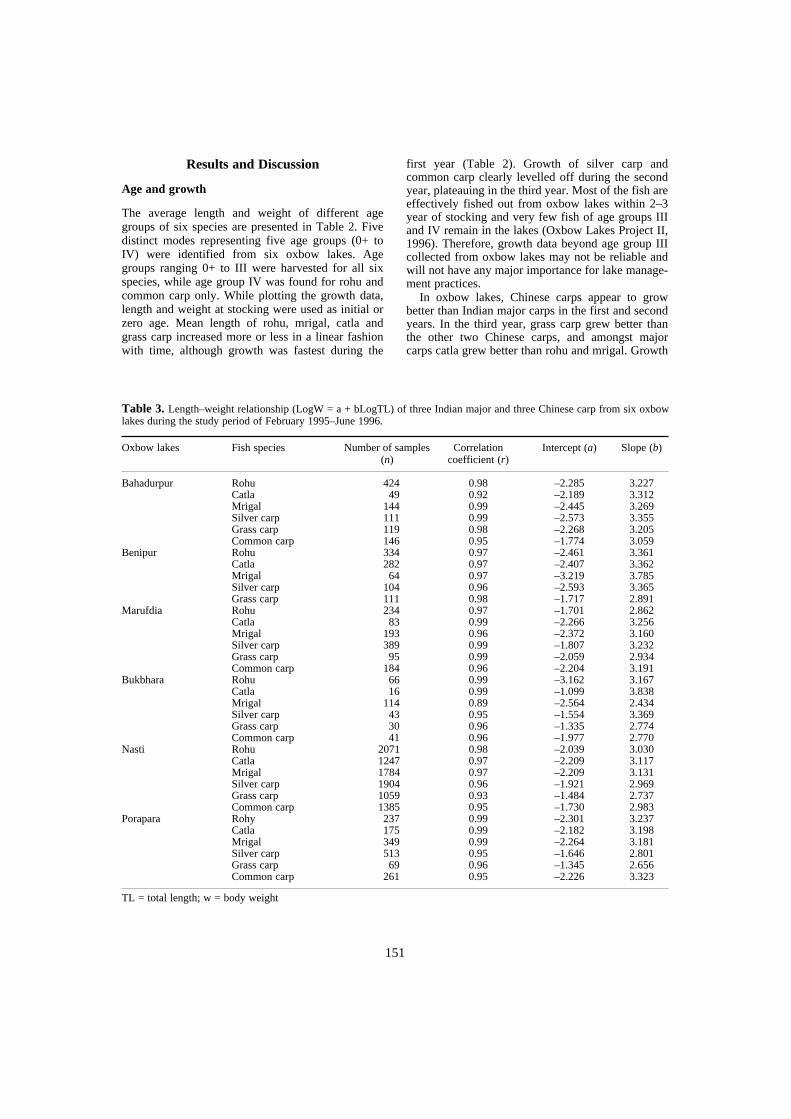
151
Results and Discussion
Age and growth
The average length and weight of different agegroups of six species are presented in Table 2. Fivedistinct modes representing five age groups (0+ toIV) were identified from six oxbow lakes. Agegroups ranging 0+ to III were harvested for all sixspecies, while age group IV was found for rohu andcommon carp only. While plotting the growth data,length and weight at stocking were used as initial orzero age. Mean length of rohu, mrigal, catla andgrass carp increased more or less in a linear fashionwith time, although growth was fastest during the
first year (Table 2). Growth of silver carp andcommon carp clearly levelled off during the secondyear, plateauing in the third year. Most of the fish areeffectively fished out from oxbow lakes within 2–3year of stocking and very few fish of age groups IIIand IV remain in the lakes (Oxbow Lakes Project II,1996). Therefore, growth data beyond age group IIIcollected from oxbow lakes may not be reliable andwill not have any major importance for lake manage-ment practices.
In oxbow lakes, Chinese carps appear to growbetter than Indian major carps in the first and secondyears. In the third year, grass carp grew better thanthe other two Chinese carps, and amongst majorcarps catla grew better than rohu and mrigal. Growth
TL = total length; w = body weight
Table 3. Length–weight relationship (LogW = a + bLogTL) of three Indian major and three Chinese carp from six oxbowlakes during the study period of February 1995–June 1996.
Oxbow lakes Fish species Number of samples (n)
Correlationcoefficient (r)
Intercept (a) Slope (b)
Bahadurpur Rohu 424 0.98 –2.285 3.227Catla 49 0.92 –2.189 3.312Mrigal 144 0.99 –2.445 3.269Silver carp 111 0.99 –2.573 3.355Grass carp 119 0.98 –2.268 3.205Common carp 146 0.95 –1.774 3.059
Benipur Rohu 334 0.97 –2.461 3.361Catla 282 0.97 –2.407 3.362Mrigal 64 0.97 –3.219 3.785Silver carp 104 0.96 –2.593 3.365Grass carp 111 0.98 –1.717 2.891
Marufdia Rohu 234 0.97 –1.701 2.862Catla 83 0.99 –2.266 3.256Mrigal 193 0.96 –2.372 3.160Silver carp 389 0.99 –1.807 3.232Grass carp 95 0.99 –2.059 2.934Common carp 184 0.96 –2.204 3.191
Bukbhara Rohu 66 0.99 –3.162 3.167Catla 16 0.99 –1.099 3.838Mrigal 114 0.89 –2.564 2.434Silver carp 43 0.95 –1.554 3.369Grass carp 30 0.96 –1.335 2.774Common carp 41 0.96 –1.977 2.770
Nasti Rohu 2071 0.98 –2.039 3.030Catla 1247 0.97 –2.209 3.117Mrigal 1784 0.97 –2.209 3.131Silver carp 1904 0.96 –1.921 2.969Grass carp 1059 0.93 –1.484 2.737Common carp 1385 0.95 –1.730 2.983
Porapara Rohy 237 0.99 –2.301 3.237Catla 175 0.99 –2.182 3.198Mrigal 349 0.99 –2.264 3.181Silver carp 513 0.95 –1.646 2.801Grass carp 69 0.96 –1.345 2.656Common carp 261 0.95 –2.226 3.323

152
of rohu was comparable to that of silver carp in itsthird year. However, in the context of overall agegroup, growth of Chinese carps is better than localcarp. Of two filter feeders, growth of silver carp wasbetter than catla in age groups I and II; catla,however, performed better in age group III.
It is generally assumed that the modal length repre-sents the probable age group (Balan 1967; Goeden1978). In this study, a total of 14 432 individuals ofsix species was measured representing four empiricalage groups in catla, mrigal, silver carp and grass carpand five age groups in rohu and common carp. It isgenerally agreed that modal value gives a moreaccurate result of probable age group than that of mid-values (Ibrahim 1962; Rao 1967). In this study, modallengths were considered for identification of probableage group. Nevertheless, determination of growthbased on modal length frequently leads to slight over-estimation, which has to be taken into account. How-ever, the growth in terms of weight was estimated bytaking the weight from the log-transformed length–weight relationship rather than taking correspondingweight of the calculated modal length.
Length–weight relationship
Length–weight relationships of six major and exoticcarps of six selected oxbow lakes were calculatedfrom length and weight data collected over February1995 to June 1996 (Table 3). Correlation coefficientbetween length and weight for all fish species for alllakes was highly significant (P = 0.000) except forcommon carp in Benipur Lake. Relationship in thiscase could not be established due to inadequatesamples (n = 2). Indian major and Chinese carpspecies showed isometric growth when their ‘b’values ranged 2.860 to 3.099 (Hardjamulia et al.1988). Carp species giving >b = values less or morethan these values appeared to have allometricgrowth. With the exception of common carp inBahadurpur Lake, grass carp in Marufdia Lake, androhu and silver carp in Nasti Lake, all the speciesshowed allometric growth in oxbow lakes. Thisindicates that fish growth is not uniform in oxbowlakes, but probably varies with season depending onthe availability of food.
It is known to all that a b value greater than 3 indi-cates the robustness of fish, and less than 3 indicatesleanness. Although growth is in general allometric,b values of most of the species are above 3,indicating that the fish harvested from lakes arehealthy, but growth is allometric.
Conclusions(a) Chinese carps grow better than Indian major
carps in semi-enclosed water bodies such as
oxbow lakes. Growth of all three Chinese carpswas similar in the first year, but in the secondand third years, common carp grew best followedby grass carp and silver carp. Among Indianmajor carps, catla performed better than rohu andmrigal in all three age groups, and the growth ofrohu and mrigal was similar.
(b) In oxbow lakes, growth rates of stocked carp forthe first 2–3 years should be used only, as mostof the fish are effectively fished out within thisperiod.
(c) Length–weight relationship of six carp speciesshowed that fish harvested from the oxbow lakesare generally healthy.
Acknowledgments
The Oxbow Lakes Small Scale Fishermen Project II(1991–97) was executed jointly by the Departmentof Fisheries, the Bangladesh Rural Advance Com-mittee (BRAC) and Danida Technical Assistance(DTA). The Oxbow Lakes Project II was fundedthrough a loan to the Government of Bangladeshfrom the International Fund for Agricultural Devel-opment (IFAD) and through a grant from the DanishInternational Development Agency (Danida).
References
Balan, V. 1967. Biology of the silver belly, Leiognathusbindus (Val.) of the Culicut coast. Indian Journal ofFisheries, 10: 118–134.
Goeden, G. 1978. A Monograph of the Coral Trout.Research Bulletin of Fisheries Service, Queensland,No. 1, 42 p.
Hardjamulia, A. and Suwignyo, P. 1988. The present statusof the reservoir fishery in Indonesia. In: De Silva, S.S.ed. Reservoir Fishery Management and Development inAsia. A regional workshop, Kathmandu, Nepal 23–28November 1987. IDRC Proceedings, 8–13.
Ibrahim, K.H. 1962. Observation of the fishery and biologyof the freshwater prawn, Macrobrachium malcomsoniiMilne Edwards of River Godavari. Indian Journal ofFisheries 9, 433–467.
LeCren, E.D. 1951. The length–weight relationship andseasonal cycle in gonad weight and condition in theperch. Journal of Animal Ecology, 20: 219.
Oxbow Lakes Project II. 1996. Summary Report on Growthand Gear Efficiency Studies of Indian Major and ChineseCarp by Length–Frequency Distribution Analysis in SixSelected Oxbow Lakes. Jessore, Bangladesh, PIU/BRAC/DTA, 244 p (unpublished).
Rao, R. M. 1967. Studies on the biology of Macrobrachiumrosenbergii (De Man) of Hoogly Estuary with notes onits fishery. Proceedings of National Institute of ScienceIndia, 33B, 242–279.
153
Carrying Capacity for Small Pelagic Fish in Three Asian Reservoirs
J. Vijverberg1, P.B. Amarasinghe2, M.G. Ariyaratna2 and W.L.T. van Densen3
Abstract
On the basis of information from the literature and our own observations, the carrying capacityfor small pelagics in Southeast Asian reservoirs was reviewed, and their selective feeding behaviourcompared with information from NW Europe. Most information is based on limnological andfishery research carried out in reservoirs in Sri Lanka, Thailand and The Netherlands. There are nolarge differences in the performances of small pelagics in Southeast Asia and N. Europe, with theexception that small pelagic seston feeders are lacking in Europe. In both regions, most of the zoo-planktivorous small pelagics are immigrants from the sea or are of marine origin. Although notmuch data are available on zooplankton production and the production of small pelagics in South-east Asian reservoirs, the productions seem higher than previously suggested. In Sri Lanka, Ambly-pharyngodon melettinus, a small pelagic cyprinid feeding on seston, often dominates the fish faunaand is able to realise a very high biological production of 3240 kg fresh weight/ha/year(Tissawewa). The biological production of the zooplanktivorous small pelagics (90–360 kg freshweight/ha/year) and their yield (50 kg fresh weight/ha/year of Clupeichthys aesarnensis) is muchlower than those of the seston feeders, but not much lower than could be expected on the basis ofthe realised primary and secondary production levels. As a group, clupeids are the most successfulzooplanktivores, but in Sri Lanka Rasbora daniconius, a small cyprinid of riverine origin, is assuccessful.
IN THE temperate region, zooplanktivorous fishgenerally dominate the pelagic zones of lakes andreservoirs and play an important role in the foodchain. It is generally assumed that most reservoirs inSoutheast Asia support only very limited numbers ofpelagic zooplanktivores. Most reservoirs are pur-ported to have a riverine fish fauna that inhabits thelittoral zone, leaving a large pelagic zone mainlyunoccupied (Fernando and Holcik 1982; Sarnita1987; Fernando 1994).
The reason for this is not clear. It may be the resultof the small-bodied zooplankton species dominating
the zooplankton community in tropical lacustrineenvironments. Because they represent a small particlesize, it is possible that they cannot be handled effi-ciently by the fish inhabiting the reservoirs and resultin a poor food conversion efficiency. If this is true,zooplankton production in these reservoirs is noteffectively used, and there may be a vacant niche fora pelagic zooplanktivorous fish. Another possibleexplanation is the nature of the fish communities inSoutheast Asia, where most water bodies are man-made and natural lakes are almost absent.
Most of these reservoirs have a riverine faunal com-position which generally inhabits the littoral zone, andwhich may be poorly adapted to feeding on zoo-plankton. Also, in this case, zooplankton productionmay be inefficiently utilised. It is also possible thatthe quantity of the zooplankton production itself islimiting zooplanktivorous fish abundance. It is notunlikely that, because of high respiration rates as theresult of high water temperatures, net zooplankton
1Netherlands Institute of Ecology, Centre for Limnology,PO Box 1299, 3600 BG Maarssen, The Netherlands; E-mail:[email protected] of Fisheries, Ruhuna University, Matara, SriLanka3Fish Culture and Fisheries Group, Wageningen Agricul-tural University, PO Box 338, 6700 AH Wageningen, TheNetherlands

154
production in the tropics is relatively low (Lehman1988). This would mean that in the tropics, in contrastwith the temperate region, the carrying capacity forzooplanktivorous fish would be relatively low.
In this paper, we address the following questions:1) Is it true that in most Southeast Asian reservoirssmall pelagics are of minor importance? 2) If so,what may be the reason for this? Is the production ofthe zooplankton relatively low, and is the low foodavailability limiting the abundance of the smallpelagics? 3) Is the zooplankton production in thepelagic zone largely unutilised by predators, and isthere a vacant niche available for zooplanktivorousfish? We attempt to answer the questions by com-paring the production of small pelagics with thequantity and quality of the resource base (zoo-plankton) and by studying its feeding efficiency onsmall and large food organisms.
Material and Methods
The present review is not exhaustive and is mainlybased on information from three countries, SriLanka, Thailand and The Netherlands (NW Europe).For Southeast Asia, it is based mainly on threesources: 1) results from the Austrian–Sri Lankanecosystem study in Parakrama Samudra from 1979to 1982; 2) the results from The Netherlands–SriLankan team which carried out a limnological, fishcommunity and fisheries study in Tissawewa from1989 to 1992; and 3) the ongoing project ‘Strategiesfor partitioning the productivity of Asian reservoirsand lakes between capture fisheries and aquaculturefor social benefit and local market without negativeenvironmental impact’ (FISHSTRAT 1998–2001).FISHSTRAT is a project financed by the EuropeanUnion in which researchers of three countries (Thai-land, Sri Lanka, Philippines) work together. Forcomparison, information is presented from TheNetherlands, where the Netherlands Institute ofEcology and Centre for Limnology studied aquaticfood webs for many years (Vijverberg et al. 1993).For the physical characteristics of the reservoirsstudied, see Table 1.
Selective feeding of small zooplanktivorouspelagics was studied in four Sri Lankan and one Thaireservoir and results compared with the feedingbehaviour of a small pelagic from NW Europe (TheNetherlands). The observations of Ehirava fluviatilis(Clupeidae) in Parakrama Samudra (Sri Lanka) werecarried out previously by Duncan (1999). Obser-vations of the other four tropical reservoirs werecarried out within the framework of the FISHSTRATproject. Fish for gut content analysis were generallycaught at dusk, when the feeding activity of the fishis often at a maximum. Fish were caught with mono-filament gill-nets with mesh of 4, 5, 8 and 10 mm.Exposure time was two hours. The size range (totallength) of fish used for the gut analysis was: Clu-peichthys aesarnensis (Clupeidae), 3.0–3.9 cm(mean 3.6 cm), Hemiramphus gaimardi (Hemiram-phidae), 9.8–11.7 cm (mean: 11.1), Osmerus eper-lanus (Osmeridae), 2.1–5.9 (mean: 3.5) and Rasboradaniconius (Cyprinidae), 6.1–8.7 cm (mean: 7.8).Body size and species composition of zooplankton inguts of the zooplanktivorous fish species were com-pared with those in the environment. Zooplankton inthe water column was quantitatively sampled with aPatalas (Schindler) sampler of 3 L and a net attachedof 100 µm mesh. The selective feeding on size andspecies by zooplanktivorous fish on microcrustaceanzooplankton was studied by comparing zooplanktonin the environment with that in the fish guts. Tostudy size selection, food organisms were dividedinto three size classes, defined for all fishspecies–reservoir–sampling time combinations sepa-rately. The range of the smallest to the largest foodorganism was found from the gut analysis. Thisrange was divided into three equal parts: small,medium and large. The electivity index E accordingto Ivlev (1961) was used:
E = (ri – pi)/(ri + pi) (Eqn 1)where ri is the relative abundance (%) of a specificfood item in the gut or stomach and pi the relativeabundance of the same food item in the environment.Values range from +1 (strong positive selection) viazero (no selection) to –1 (strong negative selection oravoidance).
Table 1. Physical characteristics of the waterbodies studied.
Waterbody Country Surface area(km2)
Mean depth(m)
Max. depth(m)
Impounded Trophic state
Minneriya MI Sri Lanka 22.5 5.3 11.7 276 AD EutrophicParakrama Samudra PS Sri Lanka 11.7 2.8 4.0 386 AD EutrophicTissawewa TW Sri Lanka 2.0 1.2 3.5 35 AD EutrophicTjeukemeer TJ Netherlands 21 1.5 2.5 Ca. 1600 HypertrophicUbolratana UR Thailand 401 5.50 15.0 1965 Eutrophic Udawalawe UD Sri Lanka 33.6 7.8 15.3 1968 Meso/EutrophicVictoria VI Sri Lanka 22.7 10.5 30.5 1984 Meso/Eutrophic
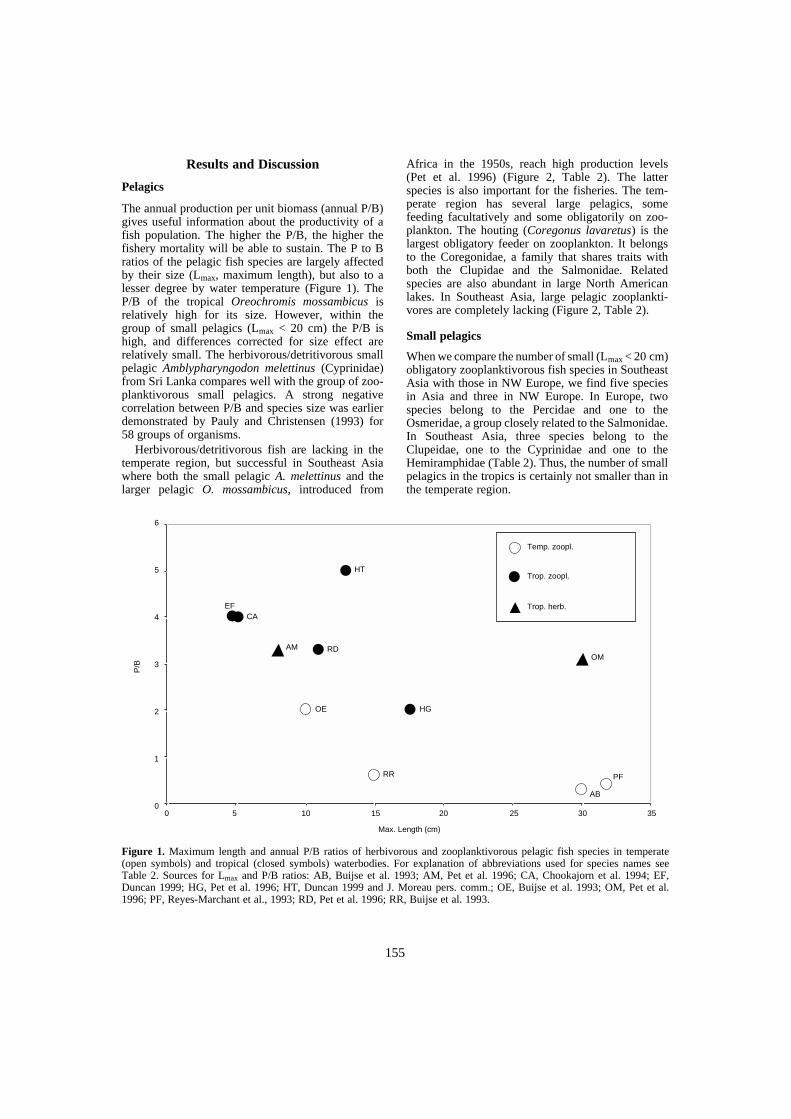
155
Results and Discussion
Pelagics
The annual production per unit biomass (annual P/B)gives useful information about the productivity of afish population. The higher the P/B, the higher thefishery mortality will be able to sustain. The P to Bratios of the pelagic fish species are largely affectedby their size (Lmax, maximum length), but also to alesser degree by water temperature (Figure 1). TheP/B of the tropical Oreochromis mossambicus isrelatively high for its size. However, within thegroup of small pelagics (Lmax < 20 cm) the P/B ishigh, and differences corrected for size effect arerelatively small. The herbivorous/detritivorous smallpelagic Amblypharyngodon melettinus (Cyprinidae)from Sri Lanka compares well with the group of zoo-planktivorous small pelagics. A strong negativecorrelation between P/B and species size was earlierdemonstrated by Pauly and Christensen (1993) for58 groups of organisms.
Herbivorous/detritivorous fish are lacking in thetemperate region, but successful in Southeast Asiawhere both the small pelagic A. melettinus and thelarger pelagic O. mossambicus, introduced from
Africa in the 1950s, reach high production levels(Pet et al. 1996) (Figure 2, Table 2). The latterspecies is also important for the fisheries. The tem-perate region has several large pelagics, somefeeding facultatively and some obligatorily on zoo-plankton. The houting (Coregonus lavaretus) is thelargest obligatory feeder on zooplankton. It belongsto the Coregonidae, a family that shares traits withboth the Clupidae and the Salmonidae. Relatedspecies are also abundant in large North Americanlakes. In Southeast Asia, large pelagic zooplankti-vores are completely lacking (Figure 2, Table 2).
Small pelagics
When we compare the number of small (Lmax < 20 cm)obligatory zooplanktivorous fish species in SoutheastAsia with those in NW Europe, we find five speciesin Asia and three in NW Europe. In Europe, twospecies belong to the Percidae and one to theOsmeridae, a group closely related to the Salmonidae.In Southeast Asia, three species belong to theClupeidae, one to the Cyprinidae and one to theHemiramphidae (Table 2). Thus, the number of smallpelagics in the tropics is certainly not smaller than inthe temperate region.
Figure 1. Maximum length and annual P/B ratios of herbivorous and zooplanktivorous pelagic fish species in temperate(open symbols) and tropical (closed symbols) waterbodies. For explanation of abbreviations used for species names seeTable 2. Sources for Lmax and P/B ratios: AB, Buijse et al. 1993; AM, Pet et al. 1996; CA, Chookajorn et al. 1994; EF,Duncan 1999; HG, Pet et al. 1996; HT, Duncan 1999 and J. Moreau pers. comm.; OE, Buijse et al. 1993; OM, Pet et al.1996; PF, Reyes-Marchant et al., 1993; RD, Pet et al. 1996; RR, Buijse et al. 1993.
0 5 10 15 20 25 30 35
Max. Length (cm)
P/B
Temp. zoopl.
Trop. zoopl.
Trop. herb.
HT
CAEF
AM RD
OE
RR
HG
OM
AB
PF
6
5
4
3
2
1
0
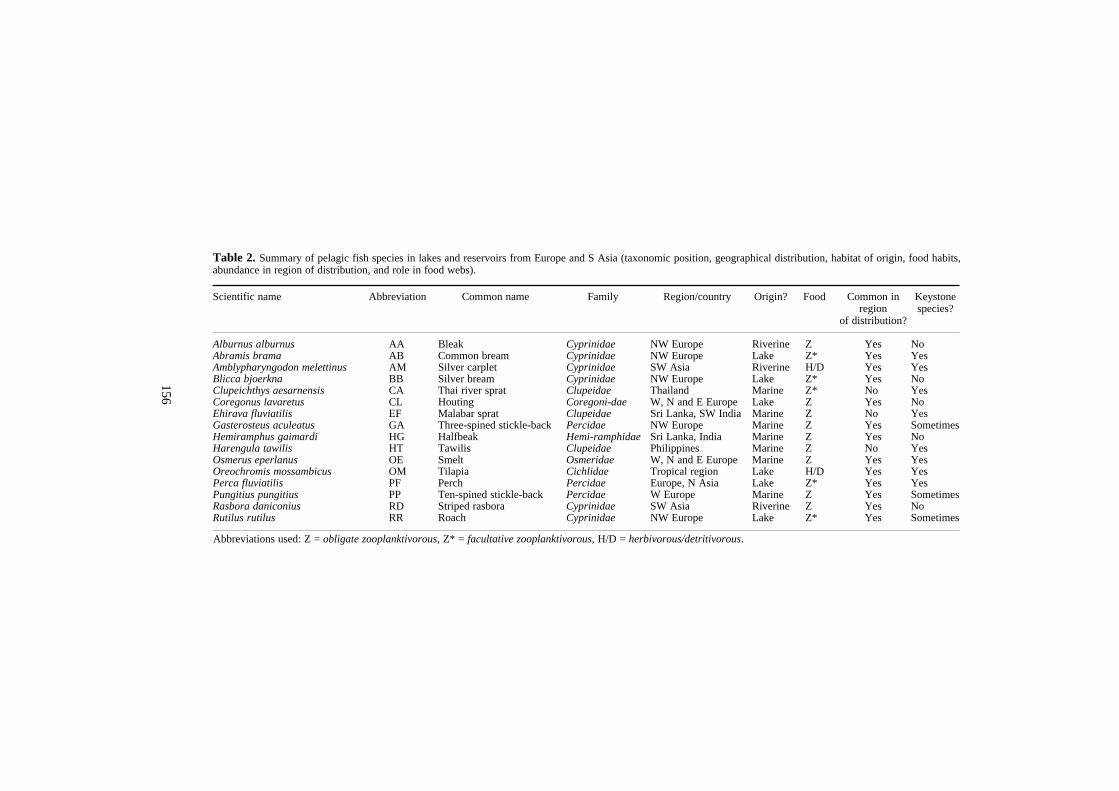
156
Abbreviations used: Z = obligate zooplanktivorous, Z* = facultative zooplanktivorous, H/D = herbivorous/detritivorous.
Table 2. Summary of pelagic fish species in lakes and reservoirs from Europe and S Asia (taxonomic position, geographical distribution, habitat of origin, food habits,abundance in region of distribution, and role in food webs).
Scientific name Abbreviation Common name Family Region/country Origin? Food Common in region
of distribution?
Keystonespecies?
Alburnus alburnus AA Bleak Cyprinidae NW Europe Riverine Z Yes NoAbramis brama AB Common bream Cyprinidae NW Europe Lake Z* Yes YesAmblypharyngodon melettinus AM Silver carplet Cyprinidae SW Asia Riverine H/D Yes YesBlicca bjoerkna BB Silver bream Cyprinidae NW Europe Lake Z* Yes NoClupeichthys aesarnensis CA Thai river sprat Clupeidae Thailand Marine Z* No YesCoregonus lavaretus CL Houting Coregoni-dae W, N and E Europe Lake Z Yes NoEhirava fluviatilis EF Malabar sprat Clupeidae Sri Lanka, SW India Marine Z No YesGasterosteus aculeatus GA Three-spined stickle-back Percidae NW Europe Marine Z Yes SometimesHemiramphus gaimardi HG Halfbeak Hemi-ramphidae Sri Lanka, India Marine Z Yes NoHarengula tawilis HT Tawilis Clupeidae Philippines Marine Z No YesOsmerus eperlanus OE Smelt Osmeridae W, N and E Europe Marine Z Yes YesOreochromis mossambicus OM Tilapia Cichlidae Tropical region Lake H/D Yes YesPerca fluviatilis PF Perch Percidae Europe, N Asia Lake Z* Yes YesPungitius pungitius PP Ten-spined stickle-back Percidae W Europe Marine Z Yes SometimesRasbora daniconius RD Striped rasbora Cyprinidae SW Asia Riverine Z Yes NoRutilus rutilus RR Roach Cyprinidae NW Europe Lake Z* Yes Sometimes
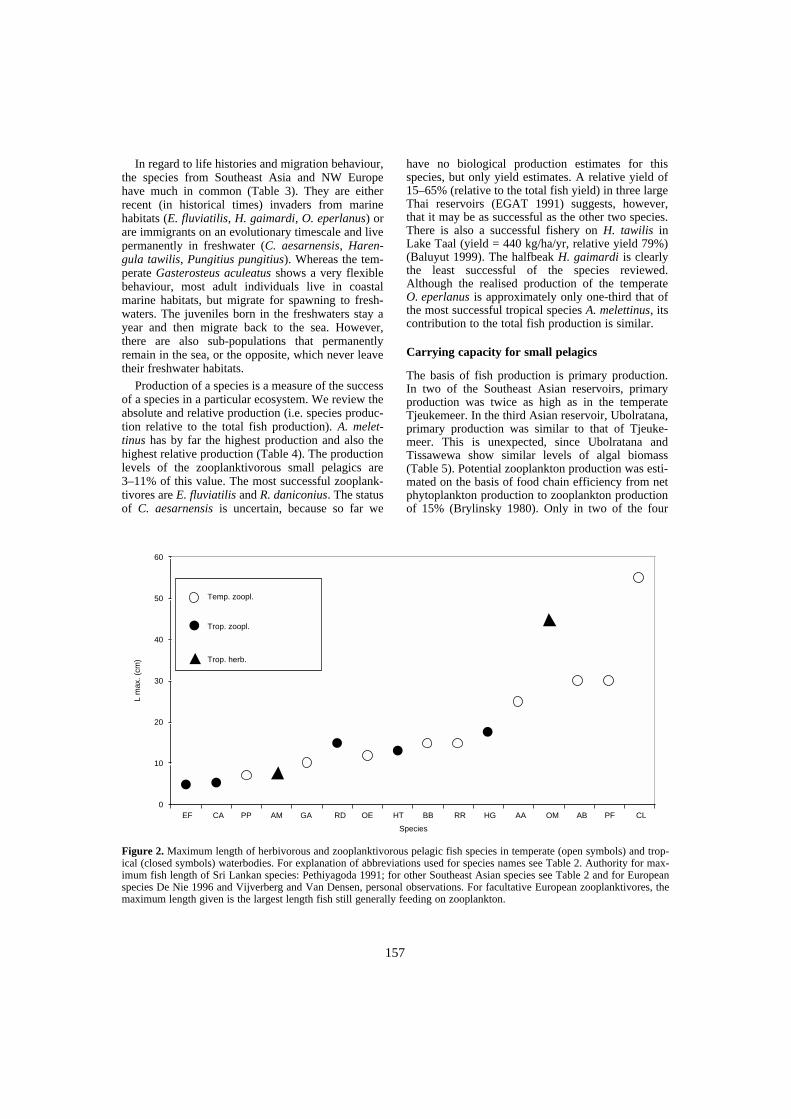
157
In regard to life histories and migration behaviour,the species from Southeast Asia and NW Europehave much in common (Table 3). They are eitherrecent (in historical times) invaders from marinehabitats (E. fluviatilis, H. gaimardi, O. eperlanus) orare immigrants on an evolutionary timescale and livepermanently in freshwater (C. aesarnensis, Haren-gula tawilis, Pungitius pungitius). Whereas the tem-perate Gasterosteus aculeatus shows a very flexiblebehaviour, most adult individuals live in coastalmarine habitats, but migrate for spawning to fresh-waters. The juveniles born in the freshwaters stay ayear and then migrate back to the sea. However,there are also sub-populations that permanentlyremain in the sea, or the opposite, which never leavetheir freshwater habitats.
Production of a species is a measure of the successof a species in a particular ecosystem. We review theabsolute and relative production (i.e. species produc-tion relative to the total fish production). A. melet-tinus has by far the highest production and also thehighest relative production (Table 4). The productionlevels of the zooplanktivorous small pelagics are3–11% of this value. The most successful zooplank-tivores are E. fluviatilis and R. daniconius. The statusof C. aesarnensis is uncertain, because so far we
have no biological production estimates for thisspecies, but only yield estimates. A relative yield of15–65% (relative to the total fish yield) in three largeThai reservoirs (EGAT 1991) suggests, however,that it may be as successful as the other two species.There is also a successful fishery on H. tawilis inLake Taal (yield = 440 kg/ha/yr, relative yield 79%)(Baluyut 1999). The halfbeak H. gaimardi is clearlythe least successful of the species reviewed.Although the realised production of the temperateO. eperlanus is approximately only one-third that ofthe most successful tropical species A. melettinus, itscontribution to the total fish production is similar.
Carrying capacity for small pelagics
The basis of fish production is primary production.In two of the Southeast Asian reservoirs, primaryproduction was twice as high as in the temperateTjeukemeer. In the third Asian reservoir, Ubolratana,primary production was similar to that of Tjeuke-meer. This is unexpected, since Ubolratana andTissawewa show similar levels of algal biomass(Table 5). Potential zooplankton production was esti-mated on the basis of food chain efficiency from netphytoplankton production to zooplankton productionof 15% (Brylinsky 1980). Only in two of the four
Figure 2. Maximum length of herbivorous and zooplanktivorous pelagic fish species in temperate (open symbols) and trop-ical (closed symbols) waterbodies. For explanation of abbreviations used for species names see Table 2. Authority for max-imum fish length of Sri Lankan species: Pethiyagoda 1991; for other Southeast Asian species see Table 2 and for Europeanspecies De Nie 1996 and Vijverberg and Van Densen, personal observations. For facultative European zooplanktivores, themaximum length given is the largest length fish still generally feeding on zooplankton.
Temp. zoopl.
Trop. zoopl.
Trop. herb.
EF CA PP AM GA RD OE HT BB RR HG AA OM AB PF CL
Species
L m
ax. (
cm)
60
50
40
30
20
10
0
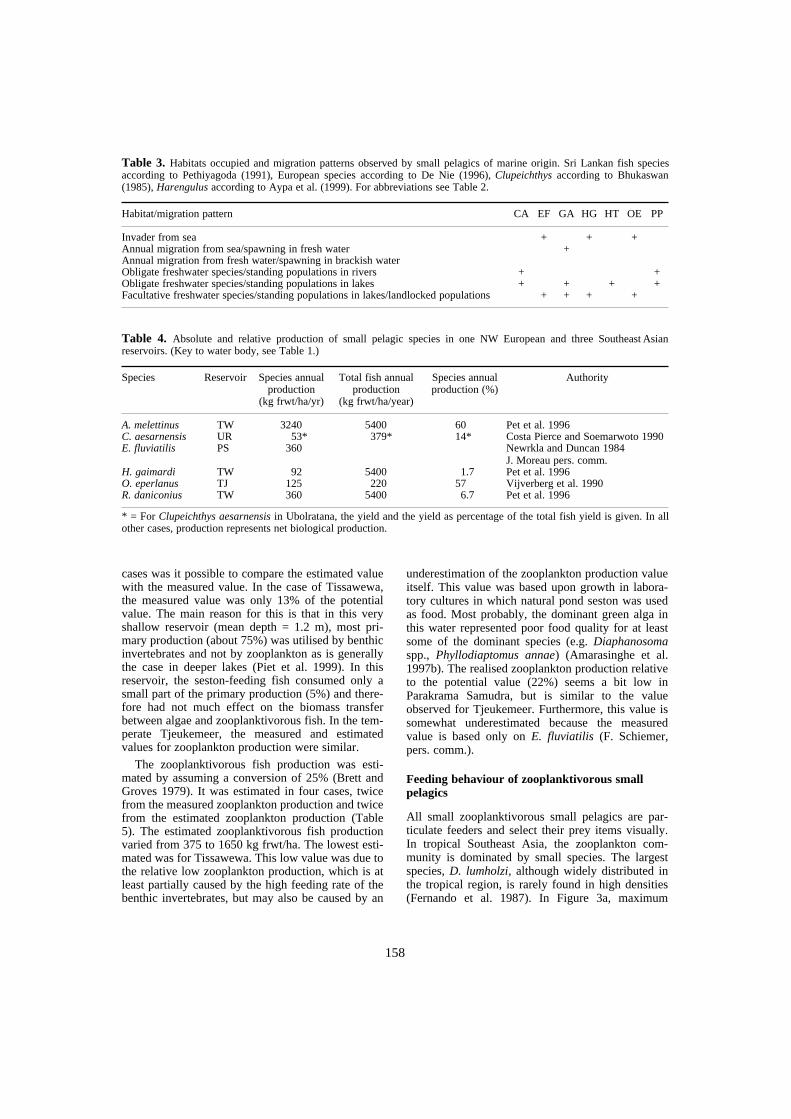
158
cases was it possible to compare the estimated valuewith the measured value. In the case of Tissawewa,the measured value was only 13% of the potentialvalue. The main reason for this is that in this veryshallow reservoir (mean depth = 1.2 m), most pri-mary production (about 75%) was utilised by benthicinvertebrates and not by zooplankton as is generallythe case in deeper lakes (Piet et al. 1999). In thisreservoir, the seston-feeding fish consumed only asmall part of the primary production (5%) and there-fore had not much effect on the biomass transferbetween algae and zooplanktivorous fish. In the tem-perate Tjeukemeer, the measured and estimatedvalues for zooplankton production were similar.
The zooplanktivorous fish production was esti-mated by assuming a conversion of 25% (Brett andGroves 1979). It was estimated in four cases, twicefrom the measured zooplankton production and twicefrom the estimated zooplankton production (Table5). The estimated zooplanktivorous fish productionvaried from 375 to 1650 kg frwt/ha. The lowest esti-mated was for Tissawewa. This low value was due tothe relative low zooplankton production, which is atleast partially caused by the high feeding rate of thebenthic invertebrates, but may also be caused by an
underestimation of the zooplankton production valueitself. This value was based upon growth in labora-tory cultures in which natural pond seston was usedas food. Most probably, the dominant green alga inthis water represented poor food quality for at leastsome of the dominant species (e.g. Diaphanosomaspp., Phyllodiaptomus annae) (Amarasinghe et al.1997b). The realised zooplankton production relativeto the potential value (22%) seems a bit low inParakrama Samudra, but is similar to the valueobserved for Tjeukemeer. Furthermore, this value issomewhat underestimated because the measuredvalue is based only on E. fluviatilis (F. Schiemer,pers. comm.).
Feeding behaviour of zooplanktivorous small pelagics
All small zooplanktivorous small pelagics are par-ticulate feeders and select their prey items visually.In tropical Southeast Asia, the zooplankton com-munity is dominated by small species. The largestspecies, D. lumholzi, although widely distributed inthe tropical region, is rarely found in high densities(Fernando et al. 1987). In Figure 3a, maximum
* = For Clupeichthys aesarnensis in Ubolratana, the yield and the yield as percentage of the total fish yield is given. In allother cases, production represents net biological production.
Table 3. Habitats occupied and migration patterns observed by small pelagics of marine origin. Sri Lankan fish speciesaccording to Pethiyagoda (1991), European species according to De Nie (1996), Clupeichthys according to Bhukaswan(1985), Harengulus according to Aypa et al. (1999). For abbreviations see Table 2.
Habitat/migration pattern CA EF GA HG HT OE PP
Invader from sea + + +Annual migration from sea/spawning in fresh water +Annual migration from fresh water/spawning in brackish waterObligate freshwater species/standing populations in rivers + +Obligate freshwater species/standing populations in lakes + + + +Facultative freshwater species/standing populations in lakes/landlocked populations + + + +
Table 4. Absolute and relative production of small pelagic species in one NW European and three Southeast Asianreservoirs. (Key to water body, see Table 1.)
Species Reservoir Species annual production
(kg frwt/ha/yr)
Total fish annual production
(kg frwt/ha/year)
Species annual production (%)
Authority
A. melettinus TW 3240 5400 60 Pet et al. 1996C. aesarnensis UR 53* 379* 14* Costa Pierce and Soemarwoto 1990E. fluviatilis PS 360 Newrkla and Duncan 1984
J. Moreau pers. comm.H. gaimardi TW 92 5400 1.7 Pet et al. 1996O. eperlanus TJ 125 220 57 Vijverberg et al. 1990R. daniconius TW 360 5400 6.7 Pet et al. 1996
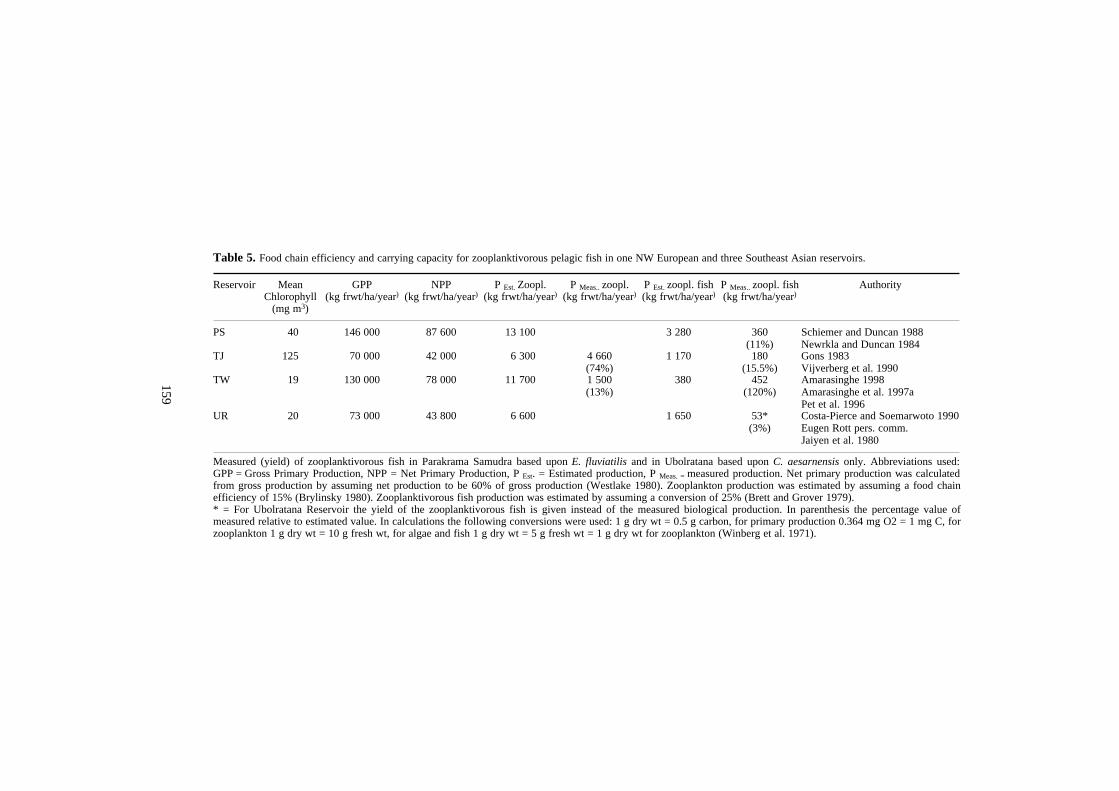
159
Measured (yield) of zooplanktivorous fish in Parakrama Samudra based upon E. fluviatilis and in Ubolratana based upon C. aesarnensis only. Abbreviations used:GPP = Gross Primary Production, NPP = Net Primary Production, P Est. = Estimated production, P Meas. = measured production. Net primary production was calculatedfrom gross production by assuming net production to be 60% of gross production (Westlake 1980). Zooplankton production was estimated by assuming a food chainefficiency of 15% (Brylinsky 1980). Zooplanktivorous fish production was estimated by assuming a conversion of 25% (Brett and Grover 1979).* = For Ubolratana Reservoir the yield of the zooplanktivorous fish is given instead of the measured biological production. In parenthesis the percentage value ofmeasured relative to estimated value. In calculations the following conversions were used: 1 g dry wt = 0.5 g carbon, for primary production 0.364 mg O2 = 1 mg C, forzooplankton 1 g dry wt = 10 g fresh wt, for algae and fish 1 g dry wt = 5 g fresh wt = 1 g dry wt for zooplankton (Winberg et al. 1971).
Table 5. Food chain efficiency and carrying capacity for zooplanktivorous pelagic fish in one NW European and three Southeast Asian reservoirs.
Reservoir Mean Chlorophyll
(mg m3)
GPP(kg frwt/ha/year)
NPP(kg frwt/ha/year)
P Est. Zoopl.(kg frwt/ha/year)
P Meas.. zoopl.(kg frwt/ha/year)
P Est. zoopl. fish(kg frwt/ha/year)
P Meas.. zoopl. fish(kg frwt/ha/year)
Authority
PS 40 146 000 87 600 13 100 3 280 360(11%)
Schiemer and Duncan 1988Newrkla and Duncan 1984
TJ 125 70 000 42 000 6 300 4 660(74%)
1 170 180(15.5%)
Gons 1983Vijverberg et al. 1990
TW 19 130 000 78 000 11 700 1 500(13%)
380 452(120%)
Amarasinghe 1998Amarasinghe et al. 1997aPet et al. 1996
UR 20 73 000 43 800 6 600 1 650 53*(3%)
Costa-Pierce and Soemarwoto 1990Eugen Rott pers. comm.Jaiyen et al. 1980
160
lengths are given for the common zooplanktonspecies, based on culture results and only rarelyobserved under field conditions. Southeast Asianzooplankton is generally smaller than 1.0 mm, largerindividuals present only in low densities. In contrast,in the temperate region, Daphnia galeata or otherclosely related Daphnia spp. from D. longispinagroup are both larger than 1.0 mm and abundant. Inthe temperate region, very large zooplankton(Leptodora) or opossum shrimps (Neomysis) areoften present in low densities, but are lacking in thetropics (Figure 3b). To some extent, this is compen-sated in the tropics by surface-floating adult insects(mainly chironomids), Chaoborus larvae (phantommidge), and chironomid larvae and pupae. All theseorganisms are mainly available during the night.Chironomid larvae and pupae and Chaoborus larvaeare often present in the water column during thenight, whereas they inhabit the bottom substratesduring the day. Chaoborus, like Leptodora, is trans-parent and may be difficult to see for the zooplankti-vores during the day.
Compared to the food conditions in the temperateregion, particle size of available food organisms in theenvironment is generally small for small pelagic zoo-planktivores in Southeast Asia (Figure 4). There are,however, exceptions. C. aesarnensis in Ubolratana ina station near the dam during the night has access toadult flying insects floating on the surface (Ca-2), andin a station during the day near the inlet of the LamChoen Tributary D. lumholzi is abundant in the watercolumn (Ca-3). E. fluviatilis in Parakrama Samudra isexperiencing exceptional food conditions too. In thisreservoir, microcrustacean zooplankton were totallylacking and only small rotifers were available as food(Figures 4 and 5). With the exception of E. fluviatilis,all fish species showed a positive size-selectivefeeding behaviour, although in most cases selectivitywas weak and mean particle size in the diet was onlyslightly larger than in the environment (Figures 4 and5). Only under conditions where large (Daphnia) orvery large (adult insects) food items are available astrong positive size-selective feeding behaviour isobserved (Figures 4, 5 and 6). The tropical speciesbehave in this respect the same as do the temperateO. eperlanus.
Selection of food species was mainly the effect ofsize selection, large and very large items highlysought (Figure 7). In the tropics, species of inter-mediate size (e.g. Diaphanosoma, Moina) are alsooften positively selected; smaller food organisms(e.g. Bosminopsis, Ceriodaphnia) are either weaklypositively selected or avoided. The very smallcopepod nauplii is always strongly avoided. Theavoidance of the relatively large calanoid copepodsshows that besides size also prey behaviour affects
selectivity of predation. Calanoid copepods show astrong swimming speed and will swim against watercurrents. Cyclopod copepods are next, andcladocerans show the lowest swimming speed. Thefish catches prey by sucking it in one by one, andtherefore calanoid copepods, followed by cyclopodcopepods, have the best chance of escaping predation(Drenner and McComas 1984). In the temperateregion, O. eperlanus shows a very clear pattern, ahigh positive selection for the large cladocerans(D. galeata, Leptodora), no selection for cyclopodcopepods, and strong avoidance of small-bodiedcladocerans.
General Discussion and Conclusions
The zooplanktivorous fish were generally feedingsize-selectively. The degree of selectivity dependedon the availability of large and very large organismsin the water column or on the water surface. Allsmall pelagic species seem to be adapted to the avail-able size distribution of food organisms. If largerfood items were available, a strong positive selectionon the larger food items took place. If larger foodorganisms were lacking, size-selective predation wasgenerally weak. Usually, the large (1.0–1.5 mm) andvery large (> 4 mm) food organisms seem to bemissing in the tropics and therefore a weak positiveselection of the slightly larger food organisms(0.5–0.7) seems to be the rule.
Strong selection for somewhat larger food items(0.7–1.0) which are scarce and only a little bit largerthan the more abundant food particles was notobserved. At first glance, this seems to be in contrastwith the temperate region where usually large (D.galeata) and very large (Leptodora, Neomysis) foodorganisms are available, resulting in strong positiveselection for larger food items and a strong avoid-ance of small-bodied cladocerans. The observedfeeding behaviour of both tropical and temperatesmall pelagics is, however, in agreement with theoptimal foraging theory (Bence and Murdoch 1986).This theory predicts that it is only worthwhile toselect for somewhat larger food items if they arepresent in substantial densities (e.g Daphnia). Selec-tion of larger particles only a little larger but scarce(e.g. the largest Diaphanosoma) is energetically nota good strategy because the increased profits perparticle eaten will not compensate for increasedsearch time. Selection of much larger particles (e.g.Leptodora, insects) is still a good strategy at muchlower prey densities because the profitability pereaten particle is much larger than for common muchsmaller particles.

161
Figure 3. Maximum prey size (mm) of food species (taxa) available in the environment for small zooplanktivorous pelagicsin Southeast Asian (closed symbols) and North European (open symbols) reservoirs. Upper panel herbivorous zooplankton,lower panel herbivorous zooplankton with macrofauna and predatory cladoceran (LK). For explanation of abbreviations usedfor names of food organisms see Figure 5.
0.0 0.5 1.0 1.5 2.0 2.5
Max. prey size (mm)
DG
DAL
CACA
DIACY
CY
MM
BACS
CCBD
RO
Environment: Zooplankton
Max
. pre
y si
ze (
mm
)
2.5
2.0
1.5
1.0
0.5
0.0
NEOM
LK
CHI
CHA
AFI
Environment: Food Species
Max
. pre
y si
ze (
mm
)
Max. prey size (mm)
0.0 2.0 4.0 6.0 8.0 10.0 12.0 14.0 16.0
16.0
14.0
12.0
10.0
8.0
6.0
4.0
2.0
0.0
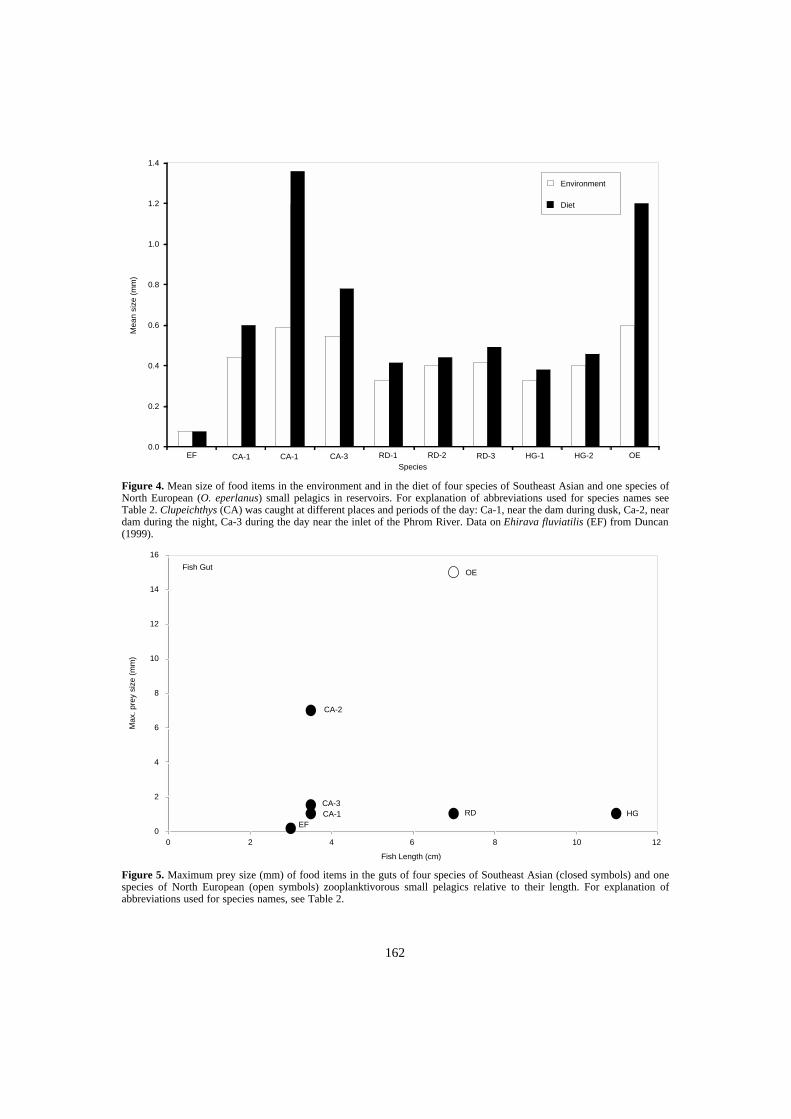
162
Figure 4. Mean size of food items in the environment and in the diet of four species of Southeast Asian and one species ofNorth European (O. eperlanus) small pelagics in reservoirs. For explanation of abbreviations used for species names seeTable 2. Clupeichthys (CA) was caught at different places and periods of the day: Ca-1, near the dam during dusk, Ca-2, neardam during the night, Ca-3 during the day near the inlet of the Phrom River. Data on Ehirava fluviatilis (EF) from Duncan(1999).
Figure 5. Maximum prey size (mm) of food items in the guts of four species of Southeast Asian (closed symbols) and onespecies of North European (open symbols) zooplanktivorous small pelagics relative to their length. For explanation ofabbreviations used for species names, see Table 2.
Environment
Diet
Species
EF CA-1 CA-1 CA-3 RD-1 RD-2 RD-3 HG-1 HG-2 OE
Mea
n si
ze (
mm
)
1.4
1.2
1.0
0.8
0.6
0.4
0.2
0.0
OE
CA-2
CA-3CA-1
EF
RD HG
0
Fish Length (cm)
Fish Gut
Max
. pre
y si
ze (
mm
)
16
14
12
10
8
6
4
2
02 4 6 8 10 12

163
Therefore, under the same food conditions tropicaland temperate small planktivores show the sameselective feeding behaviour.
Small-bodied clupeids were most often thesuccessful zooplanktivores in Southeast Asian waterbodies. They showed an amazing flexibility infeeding behaviour, feeding exclusively on smallrotifers if larger food items were not available (E.fluviatilis in Parakrama Samudra), strongly selectingDaphnia when available (C. aesarnensis in Ubolra-tana near inlet of the Lam Choen Tributary),switching from an 100% cyclopoid copepod dietduring the day-time to an 80% (biomass) diet offloating insects (C. aesarnensis in Ubolratana near thedam). Such an opportunistic feeding behaviour of C.aesarnensis in Ubolratana Reservoir was previouslyreported by Sirimongkonthaworn and Fernando(1994). It was therefore expected that clupeids wouldbe always more successful than cyprinids fromriverine origin. However, this was not the case. R.daniconius in an Sri Lankan lowland reservoirrealised the same high level of production than theclupeid E. fluviatilis in an other Sri Lankan lowlandreservoir with a similar level of primary production.Catch statistics from the 12 largest reservoirs inThailand show that in only three of these reservoirs
C. aesarnensis yields are substantially contributing tothe total fish catch, i.e. Sirindhorn (65%), Sirikit(30%), Ubolratana (15% of total catch) (EGAT1991). It is possible that selective overexploitation ofthe large predatory fish, resulting in a decreasing pre-dation mortality for C. aesarnensis, is the cause of itsabundance in these three reservoirs (BoonsongSricharoendham pers. comm.). Mattson et al. (theseProceedings) suggested the same cause to explain thedramatic increase of C. aesarnensis catch in the NamNgum Reservoir in Lao PDR.
Studies of primary and secondary zooplankton pro-duction showed that Southeast Asian reservoirs areable to support significant populations of zooplank-tivorous small pelagics (90–360 kg/ha/population/yr).A much larger production is not possible, at least notin shallow reservoirs, where a substantial part of theprimary production is channelled into benthic inver-tebrate production.
Primary production in the tropics is higher than inthe temperate region, mainly because of more light,resulting in a higher production per unit of chloro-phyll (Lemoalle et al. 1981). Because of the gener-ally higher primary production in the tropical regionas compared with the temperate region, the realisedzooplanktivorous fish production in Southeast Asian
Figure 6. Size-selective feeding of four species of Southeast Asian and one species of North European small pelagics onthree size classes of food particles in three Sri Lankan and one Thai reservoir. Selection index according to Ivlev (1961:equation 1). Abbreviations used, size: S = small, M = medium, L = large. For explanation of abbreviations used for speciesnames, see Table 2 and legend Figure 3. Data on Ehirava fluviatilis (EF) from Duncan (1999).
Small
Medium
Large
EF
Species
Sel
ectiv
ity o
n si
ze
CA-1CA-2
RD-1 RD-2 OERD-3
HG-1 HG-2CA-3
1.0
0.8
0.6
0.4
0.2
0.0
−0.2
−0.4
−0.6
−0.8
−1.0
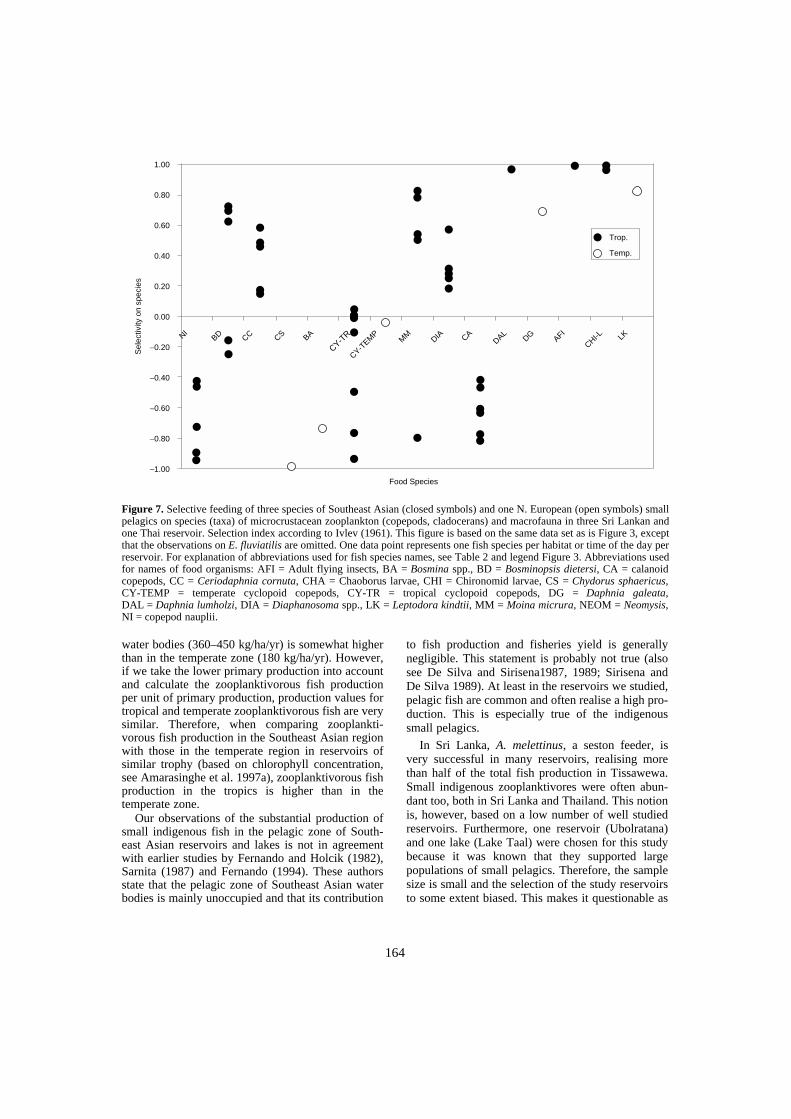
164
water bodies (360–450 kg/ha/yr) is somewhat higherthan in the temperate zone (180 kg/ha/yr). However,if we take the lower primary production into accountand calculate the zooplanktivorous fish productionper unit of primary production, production values fortropical and temperate zooplanktivorous fish are verysimilar. Therefore, when comparing zooplankti-vorous fish production in the Southeast Asian regionwith those in the temperate region in reservoirs ofsimilar trophy (based on chlorophyll concentration,see Amarasinghe et al. 1997a), zooplanktivorous fishproduction in the tropics is higher than in thetemperate zone.
Our observations of the substantial production ofsmall indigenous fish in the pelagic zone of South-east Asian reservoirs and lakes is not in agreementwith earlier studies by Fernando and Holcik (1982),Sarnita (1987) and Fernando (1994). These authorsstate that the pelagic zone of Southeast Asian waterbodies is mainly unoccupied and that its contribution
to fish production and fisheries yield is generallynegligible. This statement is probably not true (alsosee De Silva and Sirisena1987, 1989; Sirisena andDe Silva 1989). At least in the reservoirs we studied,pelagic fish are common and often realise a high pro-duction. This is especially true of the indigenoussmall pelagics.
In Sri Lanka, A. melettinus, a seston feeder, isvery successful in many reservoirs, realising morethan half of the total fish production in Tissawewa.Small indigenous zooplanktivores were often abun-dant too, both in Sri Lanka and Thailand. This notionis, however, based on a low number of well studiedreservoirs. Furthermore, one reservoir (Ubolratana)and one lake (Lake Taal) were chosen for this studybecause it was known that they supported largepopulations of small pelagics. Therefore, the samplesize is small and the selection of the study reservoirsto some extent biased. This makes it questionable as
Figure 7. Selective feeding of three species of Southeast Asian (closed symbols) and one N. European (open symbols) smallpelagics on species (taxa) of microcrustacean zooplankton (copepods, cladocerans) and macrofauna in three Sri Lankan andone Thai reservoir. Selection index according to Ivlev (1961). This figure is based on the same data set as is Figure 3, exceptthat the observations on E. fluviatilis are omitted. One data point represents one fish species per habitat or time of the day perreservoir. For explanation of abbreviations used for fish species names, see Table 2 and legend Figure 3. Abbreviations usedfor names of food organisms: AFI = Adult flying insects, BA = Bosmina spp., BD = Bosminopsis dietersi, CA = calanoidcopepods, CC = Ceriodaphnia cornuta, CHA = Chaoborus larvae, CHI = Chironomid larvae, CS = Chydorus sphaericus,CY-TEMP = temperate cyclopoid copepods, CY-TR = tropical cyclopoid copepods, DG = Daphnia galeata,DAL = Daphnia lumholzi, DIA = Diaphanosoma spp., LK = Leptodora kindtii, MM = Moina micrura, NEOM = Neomysis,NI = copepod nauplii.
Trop.
Temp.
Food Species
Sel
ectiv
ity o
n sp
ecie
s
NIBD CC CS BA
CY-TR
CY-TEM
PM
MDIA CA
DALDG AFI
CHI-L LK
1.00
0.80
0.60
0.40
0.20
0.00
−0.20
−0.40
−0.60
−0.80
−1.00
165
to what extent the information can be generalised forother areas within the Southeast Asian region.
Our findings, however, are in strong contrast withthe statement by Fernando and Holcik (1982),Sarnita (1987) and Fernando (1994). Consequently,that statement should be regarded as a hypothesiswhich needs to be tested, not a proven fact.
As a result of the research carried out within thecurrent FISHSTRAT project, during the next threeyears more information will become available on pri-mary production, zooplankton production and theproduction and feeding behaviour of small pelagics.A comparison of food webs in reservoirs with a highproduction of small pelagics with food webs in reser-voirs with a much lower production of small pelagicsmay provide insight into factors regulating thesuccess of small pelagic fishes in Southeast Asiantropical reservoirs.
Acknowledgments
This research was carried out within the frame workof the project ‘Strategies for partitioning the produc-tivity of Asian reservoirs and lakes between capturefisheries and aquaculture for social benefit and localmarket without negative environmental impact(FISHSTRAT)’ which is financed by the EuropeanCommittee DG12-CDPE (INCO-DC contract NoERBIC18-CT97-0190). We thank our FISHSTRATcolleagues, especially, Nan Duncan (Royal HollowayInst., University of London), Upali Amarasinghe(Dept of Zoology, University of Kelaniya), FritzSchiemer (Dept. of Limnology, University ofVienna), and Boonsong Sricharoendham (NationalInland Fisheries Institute of Thailand, NIFI) forstimulating discussions and interest. We are thankfulto Suchart Ingthamjitr (NIFI), Montarop. Kakkaew(NIFI), Deeka Ratanachamnong (NIFI), TanapornChittapalapong (NIFI), Jacques Moreau (Inst. Nat.Polytechnique de Toulouse, ENSAT), James O.Villaneuva (Aquaculture Division, Bureau ofFisheries and Aquatic Resources, Philippines) andEugen Rott (Dept. Hydrobotany, Univ. Innsbruck)for unpublished results. The research in Sri Lanka byBandu Amarasinghe and Mr. M.G. Ariyaratne on thefeeding behaviour of the zooplanktivorous smallpelagics was supported by the Vijverhof Fonds andthe Beijerinck-Poppingfonds. We acknowledge GuusPostema for help with the graphics.
References
Amarasinghe, P.B. 1998. The population dynamics andproduction of microcrustacean zooplankton in three SESri Lankan reservoirs. PhD thesis, Ruhuna University,Sri Lanka.
Amarasinghe, P.B, Vijverberg, J. and Boersma, M. 1997a.Production biology of copepods and cladocerans in threesouth-east Sri Lankan low-land reservoirs and its com-parison to other tropical freshwater bodies. Hydro-biologia, 350: 145–162.
Amarasinghe, P.B., Boersma, M. and Vijverberg, J. 1997b.The effect of temperature, and food quantity and qualityon the growth and development rates in laboratory-cultured copepods and cladocerans from a Sri Lankanreservoir. Hydrobiologia, 350: 131–144.
Aypa, S.M., Galicia, A.M. and Lapasaran, E.S. 1999. Thereproduction biology and life cycle of freshwater pelagicsardine Harengula (Sardinella) tawilis (Clupeidae) in thevolcanic Lake Taal, Philippines. In: van Densen, W.L.T.and Morris, M.J. ed. Fish and Fisheries of Lakes andReservoirs in Southeast Asia and Africa. WestburyPublishing, Otley, 245–258.
Baluyut, E.A., 1999. Introduction and fish stocking in lakesand reservoirs in Southeast Asia: a review. In: vanDensen, W.L.T. and Morris, M.J. ed. Fish and Fisheriesof Lakes and Reservoirs in Southeast Asia and Africa,117–141. Westbury Publishing, Otley.
Bence, J.R. and Murdoch, W.W. 1986. Prey size selectionby the mosquito fish: relation to optimal foraging.Ecology, 67: 324–336.
Bhukaswan, T. 1985. The Nam Pong Basin (Thailand). In:Petr, T. ed. Inland fisheries in multiple-purpose riverbasin planning and development in tropical Asiancountries. Three case studies. FAO Fisheries, TechnicalPaper 265. FAO, Rome, 55–90.
Brett, J.R. and Groves, T.D.D. 1979. Physiologicalenergetics. In: Hoar, W.S., Randall, D.J. and Brett, J.R.ed. Fish Physiology, Vol. 8, Academic Press, New York,279–352.
Brylinsky, M. 1980. Estimating the productivity of lakesand reservoirs. In: Le Cren, E.D. and Low-McConnelR.H. ed. The Functioning of Freshwater Ecosystems,IBP 22. Cambridge University Press, Cambridge, UK,393–410.
Buijse, A.D., van Eerden, M.R., Dekker, W. and vanDensen, W.L.T. 1993. Elements of a trophic model forIJsselmeer (The Netherlands), a shallow eutrophic lake.ICLARM Conference Proceedings, 26: 90–94.
Chookajorn, T., Leenanond, Y., Moreau, J. and Sricha-roendham, B. 1994. Evolution of trophic relationships inUbolratana Reservoir (Tailand) as described using amultispecies trophic model. Asian Fisheries Science,7: 201–213.
Costa-Pierce, B.A. and Soemarwoto, O. 1990. Biotechnicalfeasibility studies on the importation of Clupeichthysaesarnensis Wongratana, 1983 from Northeastern Thai-land to the Saguling Reservoir, West Java, Indonesia. In:Costa-Pierce, B.A. and Soemarwoto, O. ed. ReservoirFisheries and Aquaculture Development for Resettle-ment in Indonesia, ICLARM Tech. Rep. 23: 329–363.
De Nie, H.W. 1996. Freshwater fishes from The Netherlands.Media Publishing International, Wageningen. 128 p (inDutch).
De Silva, S.S. and Sirisena, H.K. 1987. New Fish resourcesof reservoirs in Sri Lanka: feasibility of introduction of asubsidiary sill-net fishery for minor cyprinids. FisheriesResearch, 6: 17–34.

166
De Silva, S.S. and Sirisena, H.K. 1989. New fish resourcesof reservoirs in Sri Lanka III: results of commercial-scaletrials and yield estimates of a gill-net fishery for minorcyprinids. Fisheries Research, 7: 279–287.
Drenner, R.W. and McComas, S.R. 1984. The role of zoo-plankton escape ability and fish size selectivity in theselective feeding and impact of planktivorous fish. In:Taub, F.B. ed. Lakes and Reservoirs. Ecosystems of theworld. Elsevier Amsterdam, 587–593.
Duncan, A. 1999. Pelagic fish and fisheries in Asian andAfrican lakes and reservoirs. In: van Densen, W.L.T. andMorris, M.J. ed. Fish and Fisheries of Lakes and Reser-voirs in Southeast Asia and Africa. Westbury Publishing,Otley, UK, 347–382.
EGAT, 1991. Fisheries statistical report of EGAT reservoirs,for fiscal year 1990 (in Thai). Chemical and AnalysisDepartment, Electricity Generating Authority of Thai-land, 26 p.
Fernando, C.H. 1994. Zooplankton, fish and fisheries intropical fresh waters. Hydrobiologia, 272: 105–123.
Fernando, C.H. and Holcik, J. 1982. The nature of fish: afactor influencing the fishery potential and yields oftropical lakes and reservoirs. Hydrobiologia, 97: 127–140.
Fernando, C.H, Paggi, J.C. and Rajapaksa, R. 1987.Daphnia in tropical lowlands. Memorie della IstituteIdrobiologia, 45: 107–141.
Gons, H.J. 1983. The carbon cycle in three Dutch lakes. In:Parma, S., van Emden, H.M. and Castelein, J. ed.Ecology of Lakes and Small Water Bodies. BiologischeRaad Reeks. PUDOC, Wageningen (in Dutch), 85–119.
Ivlev, V.S. 1961. Experimental ecology of the feeding offishes. Yale University Press, New Haven. 302 p.
Jaiyen, K., Sihapitukgiat, P. and Leelapatra, W. 1980.Plankton. Nam Pong Environmental ManagementResearch Project. Working Document No. 13. MekongSecretariat.
Lehman, J.T. 1988. Ecological principles affecting com-munity structure and secondary production by zoo-plankton in marine and freshwater environments.Limnolgy and Oceanography, 33: 931–945.
Lemoalle, J., Adeniji, A., Compere, P. Ganf, G.G. andTalling, J.F. 1981. Phytoplankton. In: Symoens, J.J.,Burgis, M.J. and Gaudet, J.J. ed. The ecology and utilis-ation of African inland waters. United Nations Environ-mental Program. UNEP Reports and Proceeding Series1. Nairobi, Kenya, 37–50.
Newrkla, P. and Duncan, A. 1984. The biology and densityof Ehirava fluviatilis (clupeiod) in Parakrama Samudra,Sri Lanka. Verhandlungen internationale Vereinigung furLimnologie, 22: 1572–1578.
Pauly, D. and Christensen, V. 1993. Graphical representa-tion of steady-state trophic ecosystem models. ICLARMConference Proceedings, 26: 20–28.
Pet, J.S., Gevers, G.J.M., van Densen, W.L.T. and Vijver-berg, J. 1996. Management options for a more completeutilisation of the biological fish production in Sri Lankanreservoirs. Ecology of Freshwater Fish, 5: 1–14.
Pethiyagoda, R. 1991. Freshwater fish of Sri Lanka. Wild-life Heritage Trust of Sri Lanka, 362 p.
Piet, G.J., Vijverberg, J. and van Densen, W.L.T. 1999.Food web structure of a Sri Lankan reservoir. In: vanDensen, W.L.T. and Morris, M.J. ed. Fish and Fisheriesof Lakes and Reservoirs in Southeast Asia and Africa,Westbury Publishing, Otley, UK, 187–205.
Reyes-Marchant, P., Jamet, J.L., Lair, N., Taleb, H. andPalomares, M.L.D. 1993. A preliminary ecosystemmodel for a eutrophic lake (Lake Aydat, France).ICLARM Conference Proceedings, 26: 95–102.
Sarnita, A.S. 1987. Introduction and stocking of fish inlakes and reservoirs in Southeast Asian countries, withspecial reference to Indonesia. FAO Fish. Rep., No. 371,193–198.
Schiemer, F. and Duncan, A. 1988. The significance of theecosystem approach for reservoir management. In: DeSilva S.S. ed. Reservoir Fishery Management andDevelopment in Asia, IDRC, Ottawa, Canada, 183–194.
Sirimongkonthaworn, R. and Fernando, C.H. 1994. Biologyof Clupeichthys aesarnensis (Clupeidae) in UbolratanaReservoir, Thailand, with special reference to food andfeeding habits. Internationale Revue geselschaft furHydrobiologie, 79: 95–112.
Srirsena, H.K. and De Silva, S.S. 1989. New fish resourcesof reservoirs in Sri Lanka II: Further studies on a fill-netfishery for minor cyprinids. Fisheries Research, 7: 19–28.
Vijverberg, J., Boersma, M., van Densen, W.L.T, Hoogen-boezem, W., Lammens, E.H.R.R. and Mooij, W.M.1990. Seasonal variation in interactions between pisci-vorous fish, planktivorous fish and zooplankton in ashallow eutrophic lake. Hydrobiologia, 207: 279–286.
Vijverberg, J., Gulati, R.D. and Mooij W.M. 1993. Food-web studies in shallow eutrophic lakes by the Nether-lands Institute of Ecology. Main results, knowledge gapsand new perspectives. Netherlands Journal of AquaticEcology, 27: 35–49.
Westlake, D.F. 1980. Primary production. In: Le Cren, E.D.and Low-McConnel, R.H. ed. The Functioning of Fresh-water Ecosystems, IBP 22. Cambridge University Press,Cambridge, UK, 141–246.
Winberg, G.G. and collaborators, 1971. Symbols, Units andConversion Factors in Studies of Freshwater Productivity.IBP Central Office London, 23 p.
167
Chenderoh Reservoir, Malaysia:Fish Community and Artisanal Fishery of a
Small Mesotrophic Tropical Reservoir
Kong Kah-Wai and Ahyaudin B. Ali*
Abstract
A study on the fish community and the status of the fishery of Chenderoh Reservoir was carriedout using experimental fishing and creel survey. A total of 27 fish species from 8 families was notedduring the study. Experimental fishing with gill nets indicated the domination of small-sized andnon-economic species such as Cyclocheilichthys apogon, Osteochilus hasselti, Chela anomalura,and Barbodes schwanenfeldii. Although valuable species such as Puntioplites bulu, Thynnichthysthynnoides, Chitala lopis, Oxyeleotris marmoratus, and Mystus nemurus are present, their catchesare not commercially significant. The estimated production was 6.67 kg/ha/year with an annuallanding of 13.74 tonnes. The drop in the yield could be due to both the decline in fish stock or toreduced fishing effort.
CHENDEROH RESERVOIR, located on the Perak River,Peninsular Malaysia (5o01’ 40o56’ N and 100o55’101o00’ E), is the oldest reservoir in Malaysia, beingcommissioned for hydroelectric generation in 1930(Dahlen 1993). Three newer reservoirs, namely theKenering (1984), Bersia (1993) and Temenggor(1974), are located upstream, thus modifying theflow and water level regime of the Chenderoh Reser-voir (Dahlen 1993). The morphometric and limno-logical characteristics of the mesotrophic 67-year-oldreservoir have been described in detail by Ali (1996).Fish communities in the reservoir are subjected tovarying degrees of environmental manipulation anddegradation, such as water level management andfluctuation, riparian land development and home-steading (Ali 1995, 1996). Thus, a change in fishspecies composition has occurred following the con-version from a lotic to a lentic ecosystem, water levelregulation and anthropogenic effects due to develop-ment pressure along the reservoir shoreline (Yap1992a; Ali 1996).
Following impoundment, the artisanal fishery thatonce thrived in the original lotic ecosystem evolvedto adapt to the newly created reservoir fishery. In
Malaysia, this type of artisanal fishery that alsoinvolves variations of aquaculture, such as floatingcage culture and littoral corral culture, is very impor-tant to the economy and well-being of the local com-munities (Yap 1992a; Costa-Pierce 1992; Ali andLee 1996). Therefore, management for sustainableexploitation is very important (Khoo et al. 1987; Yap1988).
Studies by Ali and Lee (1995) showed that in theChenderoh Reservoir artisanal fishery is important tothe local population in providing both protein andsupplementary income. The fishery is multi-speciesand multi-gear in nature with the dominant gearbeing multi-filament gill nets with stretched-mesh of5.7, 10.2 and 11.4 cm (Ali and Lee 1995). At thetime of that study, there was no official fisheryregulation, and community-based management of thefishery was practised by the local people themselves(Ali and Lee 1995; Ali 1996). Subsequently, inlandfishery rules and regulations enacted by the PerakState Government in the late 1980s and was imple-mented State wide in order to protect the fishery(Zakariah and Ali 1996).
The objective of the study was to characterise thepresent status of the Chenderoh Reservoir fishery.The reservoir has been and is being studied exten-sively as part of the monitoring program on thedevelopment and fate of artisanal inland tropical
*School of Biological Sciences, Universiti Sains Malaysia,11800 Minden, Penang, Malaysia
168
fisheries (Lee and Ali 1989; Ali and Lee 1995; Ali1996; Ali and Kadir 1996; Zakariah and Ali 1996).Therefore, this study compares the current status ofChenderoh Reservoir fishery to previous studieswithin the context of conservation and managementof small-scale, multi-gear and multi-species artisanalfisheries.
Materials and Methods
The equatorial location of Chenderoh Reservoir pre-cludes the occurrence of distinct temperature, photo-period or rainfall cycles, thus allowing for fish tospawn all year round (Hails and Abdullah 1982).Since seasonality is absent and to reduce costs,sampling was carried out from July 1994 to January1995. Two sampling sites located about 2 km on theopposite sides of the Perak River were selected(Figure 1). These sites are the main fishing groundsfor the local population. Each site is essentially anembayment and has riparian homestead and thusreceived varying amount of anthropogenic effluents(Ali 1996). Part of Site B (i.e. B2) was studied inten-sively about five years before with respect to itsartisanal fishery (Ali and Lee 1995).
During the study, the sampling techniques usedfollowed closely the practice of the local fishers andwere also used in previous studies (Ali and Lee1995). Experimental fishing was conducted usingpanels of gill nets 208 m long and 3 to 5 m deep anda stretch-mesh of 2.5, 5.1, 7.6, and 10.2 cm respec-tively. The nets were fished (soak time) day andnight at a ratio of 12:12. Nets were set at 1800 h andchecked the next day at 0600 h for the night catchwith a second check conducted subsequently on thenext 1800 h and noted as the day catch. Fishinginterval and gear used is the same to that of the localfishery and thus each day or night catch is con-sidered as a unit of fishing effort and the CPUE isexpressed as kg/fisher/day. All fish caught wereseparated based on mesh sizes, and weighed (g), andmeasured (standard and total length in cm), respec-tively. For each species caught, five specimen were
preserved in 10% formalin to be further identified inthe laboratory using standard taxonomic keys avail-able (Inger and Chin, 1962; Mohsin and Ambak1992; Ng et al. 1992). Creel surveys and Rapid RuralAppraisal (Khon Kaen University 1987) were con-ducted at the two main fish landing sites, i.e. TebokKelantan and Cangkat Duku Village (Figure 1).Species caught and biomass landed were recorded.The number of active fishers and middlemeninvolved in the fishery was noted.
Fish community analysis involved the use ofShannon-Wiener Diversity (Poole 1974), evenness(Poule 1975) and dominant indices (Zar 1984).Non-parametric statistics of Mann-Whitney U-testand Wilcoxon test were used to compare betweensamples because of their independence of normaldistribution (Zar 1984) and small sample sizesobtained (Fowler and Cohen 1990). Water qualityparameters of pH and temperature (Orion ResearchSA250), conductivity (Hanna 18333), dissolvedoxygen (YSI 58), and Secchi Disk visibility weremeasured before 1200 h during sampling and meansof three readings were obtained.
Results
Generally, there were no differences in water qualityparameters between the two sites (Table 1). Meansurface temperature at Site A and B were 27.4 + 0.4and 28.1 + 0.6oC, respectively. The mean pH anddissolved oxygen were 6.44 + 0.19 and 6.66 + 0.58,and 5.01 + 0.50 and 5.05 + 0.69 mg/L for sites A andB, respectively. The conductivity for the two siteswere 38.15 + 10.53 and 40.00 + 10.00 uS/cmwhereas the Secchi Disk visibility readings werewithin the mesotrophic range of 0.8 + 0.4 and 1.1 +0.2 m, respectively.
Forty two species from 13 families were observed(Table 2) in contrast to 63 species observed sevenyears earlier (Lee 1989; Ali 1996). Only 27 speciesfrom 8 families, however, were caught in experi-mental fishing. A total of 18 species were sampled insite A in contrast to site B which yielded 21 species
Table 1. Water quality parameters at the two study sites of Chenderoh Reservoir, Perak, Malaysia.
Sites Temperature(oC)
pH Conductivity(uS/cm)
D.O.(mg/L)
Secchi Disk(m)
A ±0.4(26.8 – 27.9)
±0.19(6.81 – 6.14)
±10.53(24.20 – 54.70)
±0.50(3.91 – 6.72)
±0.4(0.6 – 1.7)
B ±0.6(27.2 – 29.4)
±0.58(5.98 – 6.85)
±10.00(27.00 – 66.20)
±0.69(3.91 – 6.20)
±0.2(0.6 – 1.7)
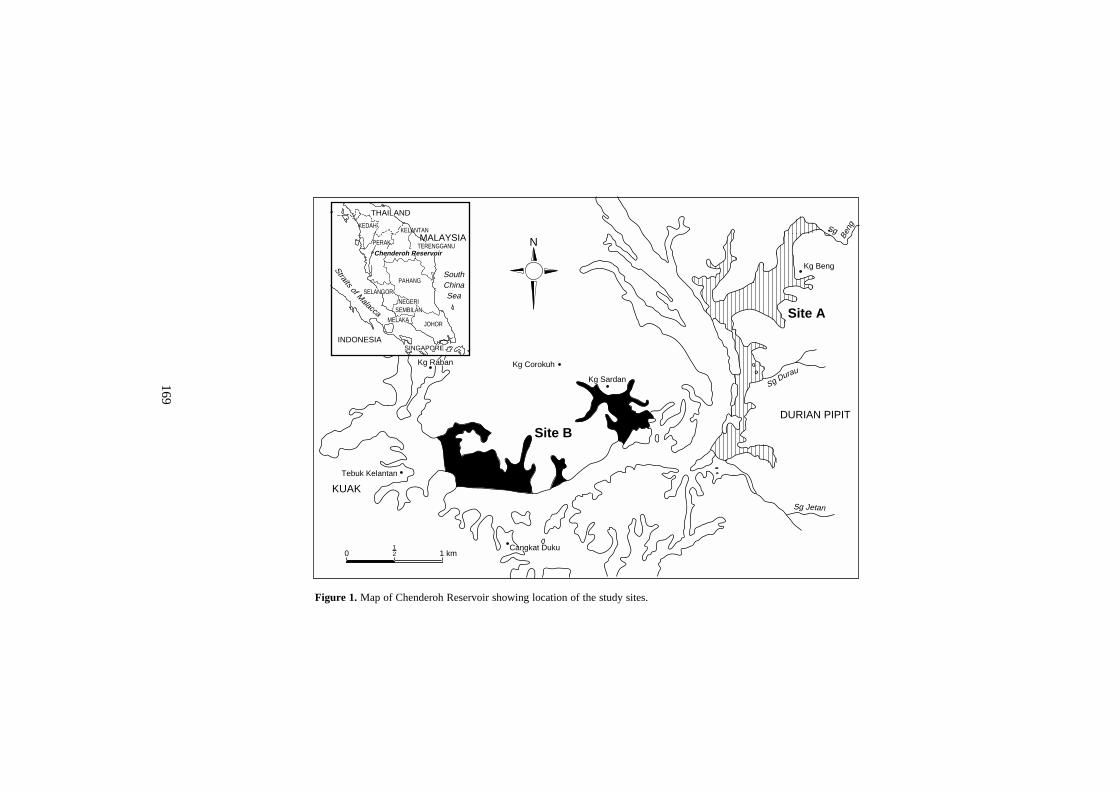
169
Figure 1. Map of Chenderoh Reservoir showing location of the study sites.
Site B
Site A
DURIAN PIPIT
KUAK
Kg Corokuh
Tebuk Kelantan
Kg Sardan
Kg Beng
Sg
Beng
Sg Durau
Sg Jetan
Kg Raban
Cangkat Duku0 1 km
12
N
INDONESIA
MALAYSIA
SINGAPORE
KEDAH
PERAK
PAHANG
MELAKA
NEGERISEMBILAN
KELANTAN
Chenderoh Reservoir
Straitsof M
alacca
SouthChinaSea
TERENGGANU
JOHOR
SELANGOR
THAILAND
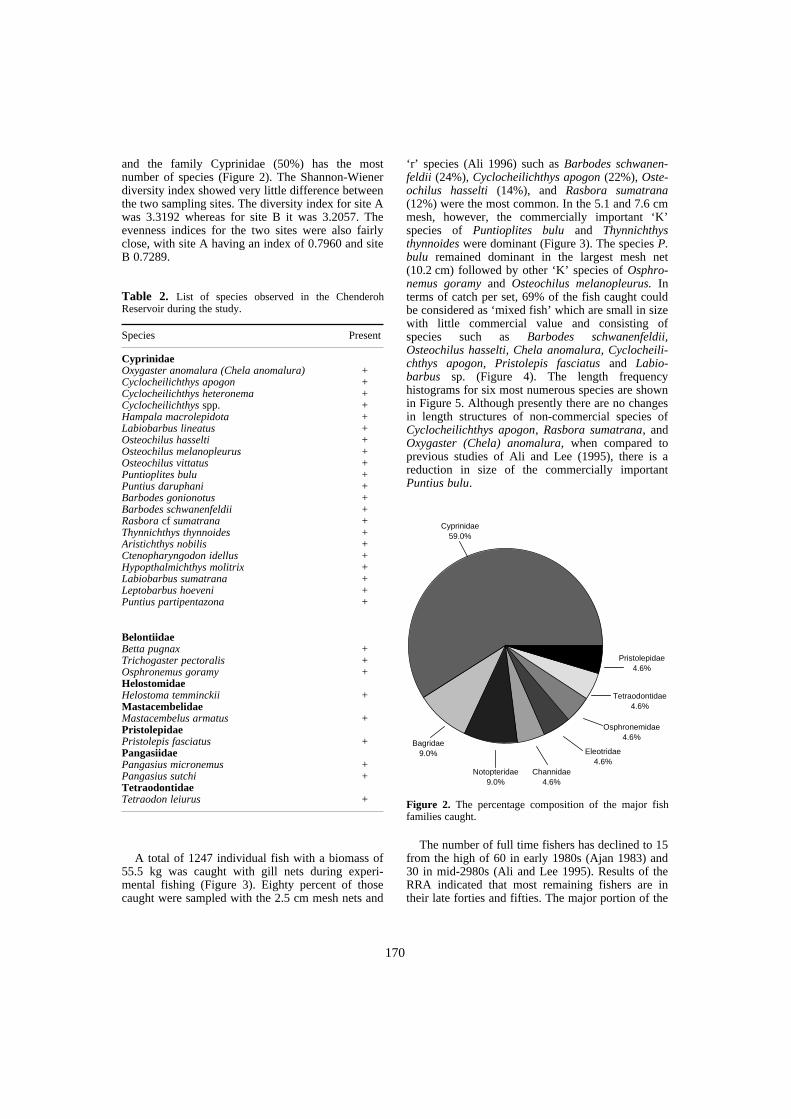
170
and the family Cyprinidae (50%) has the mostnumber of species (Figure 2). The Shannon-Wienerdiversity index showed very little difference betweenthe two sampling sites. The diversity index for site Awas 3.3192 whereas for site B it was 3.2057. Theevenness indices for the two sites were also fairlyclose, with site A having an index of 0.7960 and siteB 0.7289.
A total of 1247 individual fish with a biomass of55.5 kg was caught with gill nets during experi-mental fishing (Figure 3). Eighty percent of thosecaught were sampled with the 2.5 cm mesh nets and
‘r’ species (Ali 1996) such as Barbodes schwanen-feldii (24%), Cyclocheilichthys apogon (22%), Oste-ochilus hasselti (14%), and Rasbora sumatrana(12%) were the most common. In the 5.1 and 7.6 cmmesh, however, the commercially important ‘K’species of Puntioplites bulu and Thynnichthysthynnoides were dominant (Figure 3). The species P.bulu remained dominant in the largest mesh net(10.2 cm) followed by other ‘K’ species of Osphro-nemus goramy and Osteochilus melanopleurus. Interms of catch per set, 69% of the fish caught couldbe considered as ‘mixed fish’ which are small in sizewith little commercial value and consisting ofspecies such as Barbodes schwanenfeldii,Osteochilus hasselti, Chela anomalura, Cyclocheili-chthys apogon, Pristolepis fasciatus and Labio-barbus sp. (Figure 4). The length frequencyhistograms for six most numerous species are shownin Figure 5. Although presently there are no changesin length structures of non-commercial species ofCyclocheilichthys apogon, Rasbora sumatrana, andOxygaster (Chela) anomalura, when compared toprevious studies of Ali and Lee (1995), there is areduction in size of the commercially importantPuntius bulu.
Figure 2. The percentage composition of the major fishfamilies caught.
The number of full time fishers has declined to 15from the high of 60 in early 1980s (Ajan 1983) and30 in mid-2980s (Ali and Lee 1995). Results of theRRA indicated that most remaining fishers are intheir late forties and fifties. The major portion of the
Table 2. List of species observed in the ChenderohReservoir during the study.
Species Present
CyprinidaeOxygaster anomalura (Chela anomalura) +Cyclocheilichthys apogon +Cyclocheilichthys heteronema +Cyclocheilichthys spp. +Hampala macrolepidota +Labiobarbus lineatus +Osteochilus hasselti +Osteochilus melanopleurus +Osteochilus vittatus +Puntioplites bulu +Puntius daruphani +Barbodes gonionotus +Barbodes schwanenfeldii +Rasbora cf sumatrana +Thynnichthys thynnoides +Aristichthys nobilis +Ctenopharyngodon idellus +Hypopthalmichthys molitrix +Labiobarbus sumatrana +Leptobarbus hoeveni +Puntius partipentazona +
BelontiidaeBetta pugnax +Trichogaster pectoralis +Osphronemus goramy +HelostomidaeHelostoma temminckii +MastacembelidaeMastacembelus armatus +PristolepidaePristolepis fasciatus +PangasiidaePangasius micronemus +Pangasius sutchi +TetraodontidaeTetraodon leiurus +
Cyprinidae59.0%
Pristolepidae4.6%
Tetraodontidae4.6%
Osphronemidae4.6%
Eleotridae4.6%
Channidae4.6%
Notopteridae9.0%
Bagridae9.0%

171
commercial landings consisted of mixed fish(33.4%) (Figure 6). Among the commercial speciesthe highest catch was for P. bulu (14.1%), Mystus sp.(10.0%), T. Thynnoides (8.8%) and the snakeheads(5.7%). The average daily CPUE of both commercialand experimental catches is strongly related (Figure7). The values for both catches range between 1.2 to3.6 and 1.7 to 2.9, respectively; however, both thesevalues are lower but more stable than the highlyfluctuating values obtained in 1988/1989 studies (Aliand Lee 1995).
1 (column %/row %)
1 (column %/row %)t – < 1%
Table 3. Number and percentages (in parentheses)1 of fish caught and percentages of empty catches during experimentalfishing with different mesh-size gill nets at Chenderoh Reservoir, Malaysia.
2.5 cm mesh 5.2 cm mesh 7.6 cm mesh 10.2 cm mesh Total fish caught
Mixed catch 802 (81/93) 55 (29/ 6) 5 (13/ 1) 0 ( 0/ 0) 862 (100)Commercial catch 194 (19/50) 135 (71/35) 34 (87/ 9) 22 (100/ 6) 385 (100)
Total fish caught 996 (80) 190 (15) 39 ( 3) 22 ( 2) 1247Empty catch (11) (16) (30) (43)
Table 4. Number and percentages (in parentheses)1 of different species of fish caught during experimental fishing withdifferent mesh-size gill nets at Chenderoh Reservoir, Malaysia.
Species 2.5 cm mesh 5.1 cm mesh 7.6 cm mesh 10.2 cm mesh Total fish caught
Barbodes gonionotus – – – 1 (5/100) 1Barbodes schwanenfeldii 236 (24/93) 17 (9/7) 1 (3/t) – 254Channa micropeltis 4 ( t/100) – – – 4Chela anomalura 113 (11/100) – – – 113Chitala lopis – – – 2 (9/100) 2Cyclocheilichthys apogon 216 (2/100) – – – 216Cyclocheilichthys heteronema 44 (4/100) – – – 44Hampala macrolepidota 20 (2/71) 7 (4/25) 1 (3/4) – 28Labiobarbus lineatus 27 (3/77) 7 (4/20) 1 (3/3) – 35Mystus negriceps 18 (2/100) – – – 18Mystus nemurus 1 (t/50) – – 1 (5/50) 2Notopterus notopterus – 2 ( 1/100) – – 2Oshphronemus goramy 2 (t/40) – – 3 (14/60) 5Osteochilus hasselti 139 (14/83) 27(14/16) 1 (3/t) – 167Osteochilus melanopleurus – 1 (t/11) 2 (5/22) 6 (27/67) 9Osteochilus vittatus 6
t/100)– – – 6
Oxyeleotris marmoratus 7 (t/54) 6 (3/46) – – 13Pristolepis fasciatus 4 (t/50) 2 (1/25) 2 (5/25) – 8Puntioplites bulu 36 (4/23) 87 (46/57) 22 (56/14) 9 (41/6) 154Rasbora sumatrana 121 (12/100) – – – 121Tetraodon leiurus 1 (t/100) – – – 1Thynnichthys thynnoides 1 (t/2) 34 (18/77) 9 (23/21) – 44
Total 996 190 39 22 1247
Table 5. Comparison in yearly production and catch perha between the present studies and previous studies onChenderoh Reservoir, Malaysia.
Studies No. of activefishers
Yearlyproduction(tonnes/yr)
Catchper ha
(kg/ha/yr)
1983 (Ajan 1983) 60 166.62 66.601989 (Ali and Lee 1995) 30 25.71 10.281995 (This study) 15 13.85 6.76
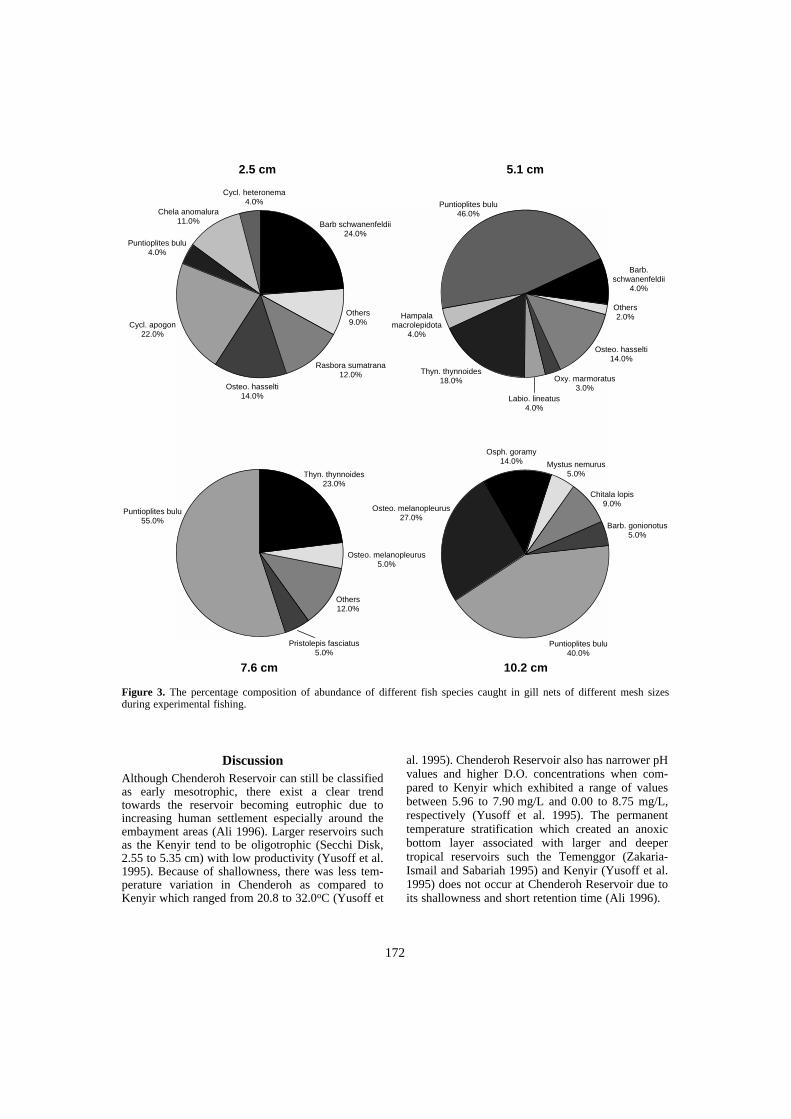
172
DiscussionAlthough Chenderoh Reservoir can still be classifiedas early mesotrophic, there exist a clear trendtowards the reservoir becoming eutrophic due toincreasing human settlement especially around theembayment areas (Ali 1996). Larger reservoirs suchas the Kenyir tend to be oligotrophic (Secchi Disk,2.55 to 5.35 cm) with low productivity (Yusoff et al.1995). Because of shallowness, there was less tem-perature variation in Chenderoh as compared toKenyir which ranged from 20.8 to 32.0oC (Yusoff et
al. 1995). Chenderoh Reservoir also has narrower pHvalues and higher D.O. concentrations when com-pared to Kenyir which exhibited a range of valuesbetween 5.96 to 7.90 mg/L and 0.00 to 8.75 mg/L,respectively (Yusoff et al. 1995). The permanenttemperature stratification which created an anoxicbottom layer associated with larger and deepertropical reservoirs such the Temenggor (Zakaria-Ismail and Sabariah 1995) and Kenyir (Yusoff et al.1995) does not occur at Chenderoh Reservoir due toits shallowness and short retention time (Ali 1996).
Figure 3. The percentage composition of abundance of different fish species caught in gill nets of different mesh sizesduring experimental fishing.
Cycl. heteronema4.0%
Barb schwanenfeldii24.0%
Chela anomalura11.0%
Puntioplites bulu4.0%
Others9.0%
Rasbora sumatrana12.0%
Osteo. hasselti14.0%
Cycl. apogon22.0%
2.5 cm 5.1 cm
Puntioplites bulu46.0%
Others2.0%
Osteo. hasselti14.0%
Oxy. marmoratus3.0%
Labio. lineatus4.0%
Thyn. thynnoides18.0%
Hampalamacrolepidota
4.0%
Barb.schwanenfeldii
4.0%
Thyn. thynnoides23.0%
Osteo. melanopleurus5.0%
Others12.0%
Pristolepis fasciatus5.0%
Puntioplites bulu55.0%
Osteo. melanopleurus27.0%
Osph. goramy14.0% Mystus nemurus
5.0%
Chitala lopis9.0%
Barb. gonionotus5.0%
Puntioplites bulu40.0%
10.2 cm7.6 cm
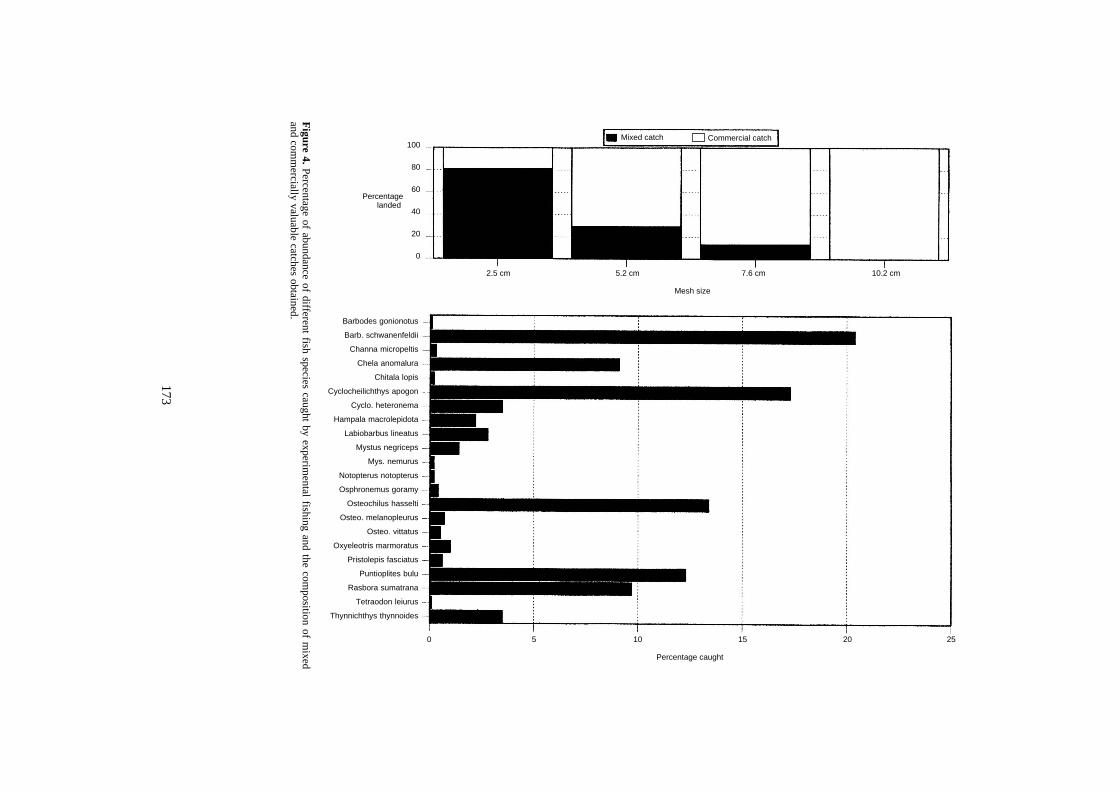
173
Figure 4. Percentage of abundance of different fish species caught by experim
ental fishing and the composition of m
ixedand com
mercially valuable catches obtained.
Barbodes gonionotus
Barb. schwanenfeldii
Channa micropeltis
Chela anomalura
Chitala lopis
Cyclocheilichthys apogon
Cyclo. heteronema
Hampala macrolepidota
Labiobarbus lineatus
Mystus negriceps
Mys. nemurus
Notopterus notopterus
Osphronemus goramy
Osteochilus hasselti
Osteo. melanopleurus
Osteo. vittatus
Oxyeleotris marmoratus
Pristolepis fasciatus
Puntioplites bulu
Rasbora sumatrana
Tetraodon leiurus
Thynnichthys thynnoides
2520151050
Percentage caught
10.2 cm
Mesh size
7.6 cm5.2 cm2.5 cm
Mixed catch Commercial catch100
80
60
40
20
0
Percentagelanded
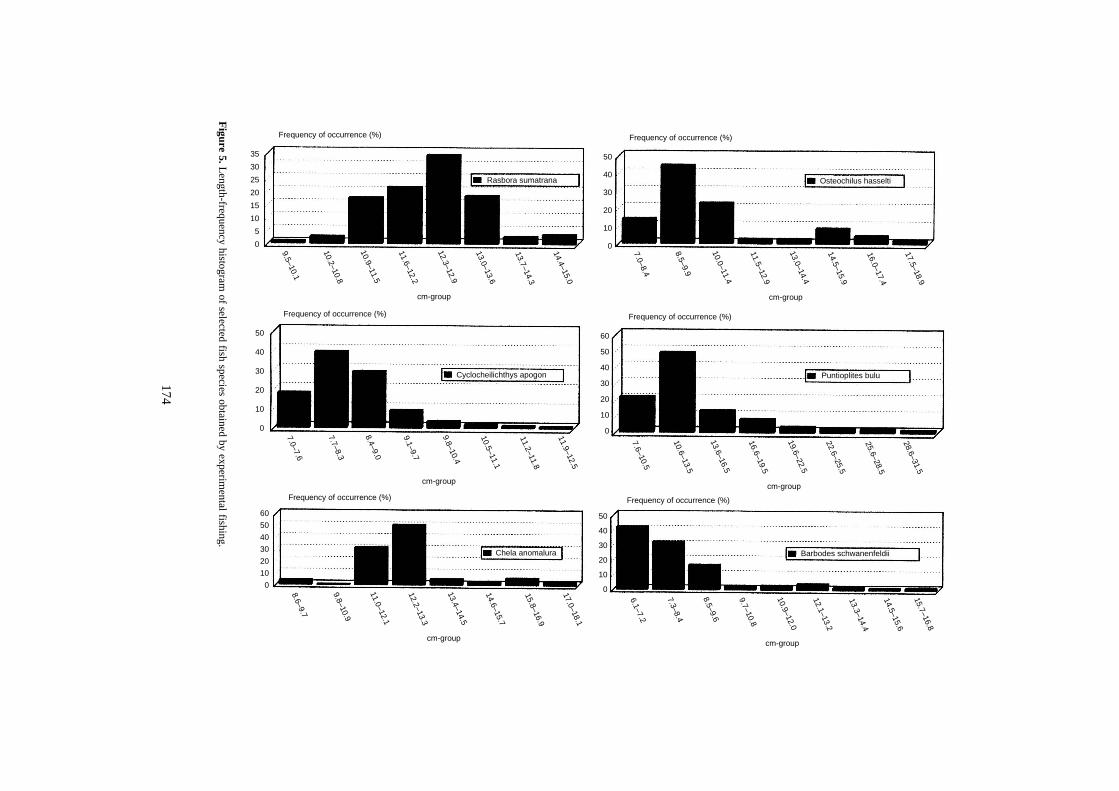
174
Figure 5. L
ength-frequency histogram of selected fish species obtained by experim
ental fishing.
Frequency of occurrence (%)
Rasbora sumatrana
35
30
25
20
15
10
5
0
9.5–10.1
10.2–10.8
10.9–11.5
11.6–12.2
12.3–12.9
13.0–13.6
13.7–14.3
14.4–15.0
cm-group
Frequency of occurrence (%)
Cyclocheilichthys apogon
50
40
30
20
10
0
7.0–7.6
7.7–8.3
8.4–9.0
9.1–9.7
9.8–10.4
10.5–11.1
11.2–11.8
11.9–12.5
cm-group
Frequency of occurrence (%)
Chela anomalura
60
50
40
30
20
10
0
8.6–9.7
9.8–10.9
11.0–12.1
12.2–13.3
13.4–14.5
14.6–15.7
15.8–16.9
17.0–18.1
cm-group
Frequency of occurrence (%)
Osteochilus hasselti
50
40
30
20
10
0
7.0–8.4
8.5–9.9
10.0–11.4
11.5–12.9
13.0–14.4
14.5–15.9
16.0–17.4
17.5–18.9
cm-group
Frequency of occurrence (%)
Puntioplites bulu
60
50
40
30
20
10
0
7.6–10.5
10.6–13.5
13.6–16.5
16.6–19.5
19.6–22.5
22.6–25.5
25.6–28.5
28.6–31.5
cm-group
Frequency of occurrence (%)
Barbodes schwanenfeldii
50
40
30
20
10
0
6.1–7.2
7.3–8.4
8.5–9.6
9.7–10.8
10.9–12.0
12.1–13.2
13.3–14.4
14.5–15.6
cm-group
15.7–16.8
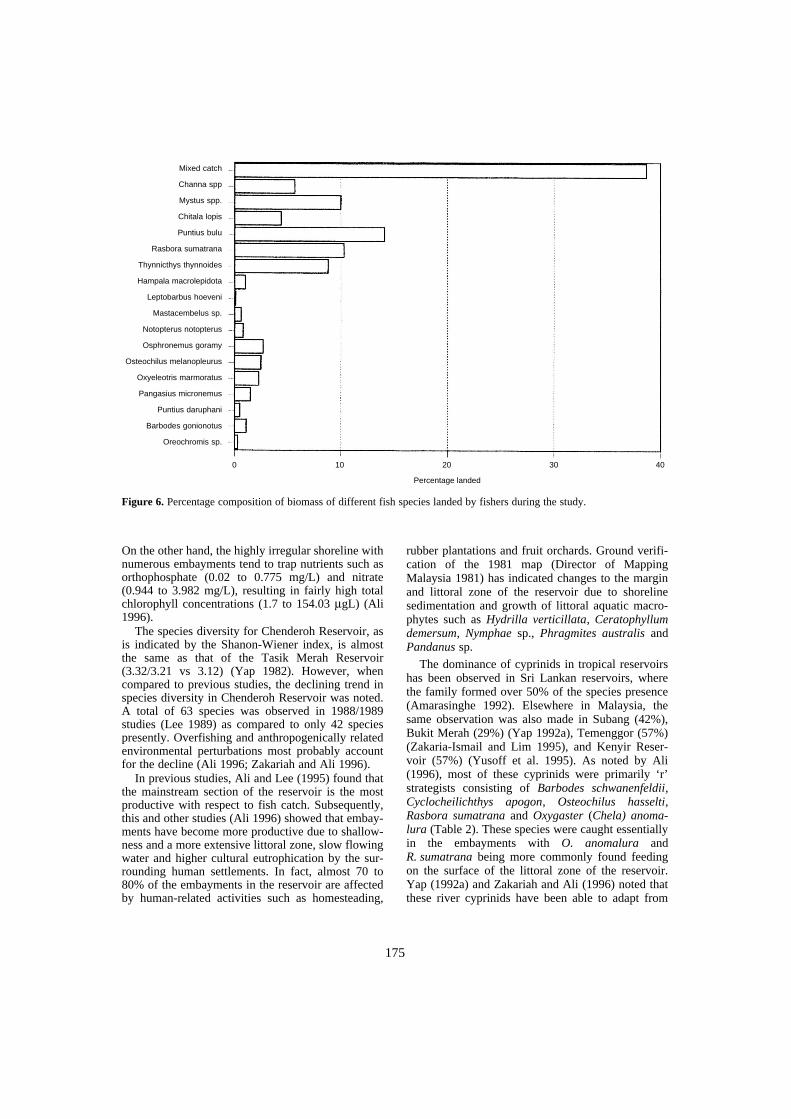
175
On the other hand, the highly irregular shoreline withnumerous embayments tend to trap nutrients such asorthophosphate (0.02 to 0.775 mg/L) and nitrate(0.944 to 3.982 mg/L), resulting in fairly high totalchlorophyll concentrations (1.7 to 154.03 µgL) (Ali1996).
The species diversity for Chenderoh Reservoir, asis indicated by the Shanon-Wiener index, is almostthe same as that of the Tasik Merah Reservoir(3.32/3.21 vs 3.12) (Yap 1982). However, whencompared to previous studies, the declining trend inspecies diversity in Chenderoh Reservoir was noted.A total of 63 species was observed in 1988/1989studies (Lee 1989) as compared to only 42 speciespresently. Overfishing and anthropogenically relatedenvironmental perturbations most probably accountfor the decline (Ali 1996; Zakariah and Ali 1996).
In previous studies, Ali and Lee (1995) found thatthe mainstream section of the reservoir is the mostproductive with respect to fish catch. Subsequently,this and other studies (Ali 1996) showed that embay-ments have become more productive due to shallow-ness and a more extensive littoral zone, slow flowingwater and higher cultural eutrophication by the sur-rounding human settlements. In fact, almost 70 to80% of the embayments in the reservoir are affectedby human-related activities such as homesteading,
rubber plantations and fruit orchards. Ground verifi-cation of the 1981 map (Director of MappingMalaysia 1981) has indicated changes to the marginand littoral zone of the reservoir due to shorelinesedimentation and growth of littoral aquatic macro-phytes such as Hydrilla verticillata, Ceratophyllumdemersum, Nymphae sp., Phragmites australis andPandanus sp.
The dominance of cyprinids in tropical reservoirshas been observed in Sri Lankan reservoirs, wherethe family formed over 50% of the species presence(Amarasinghe 1992). Elsewhere in Malaysia, thesame observation was also made in Subang (42%),Bukit Merah (29%) (Yap 1992a), Temenggor (57%)(Zakaria-Ismail and Lim 1995), and Kenyir Reser-voir (57%) (Yusoff et al. 1995). As noted by Ali(1996), most of these cyprinids were primarily ‘r’strategists consisting of Barbodes schwanenfeldii,Cyclocheilichthys apogon, Osteochilus hasselti,Rasbora sumatrana and Oxygaster (Chela) anoma-lura (Table 2). These species were caught essentiallyin the embayments with O. anomalura andR. sumatrana being more commonly found feedingon the surface of the littoral zone of the reservoir.Yap (1992a) and Zakariah and Ali (1996) noted thatthese river cyprinids have been able to adapt from
Figure 6. Percentage composition of biomass of different fish species landed by fishers during the study.
Mixed catch
Channa spp
Mystus spp.
Chitala lopis
Puntius bulu
Rasbora sumatrana
Thynnicthys thynnoides
Hampala macrolepidota
Leptobarbus hoeveni
Mastacembelus sp.
Notopterus notopterus
Osphronemus goramy
Osteochilus melanopleurus
Oxyeleotris marmoratus
Pangasius micronemus
Puntius daruphani
Barbodes gonionotus
Oreochromis sp.
0 10 20 30 40
Percentage landed
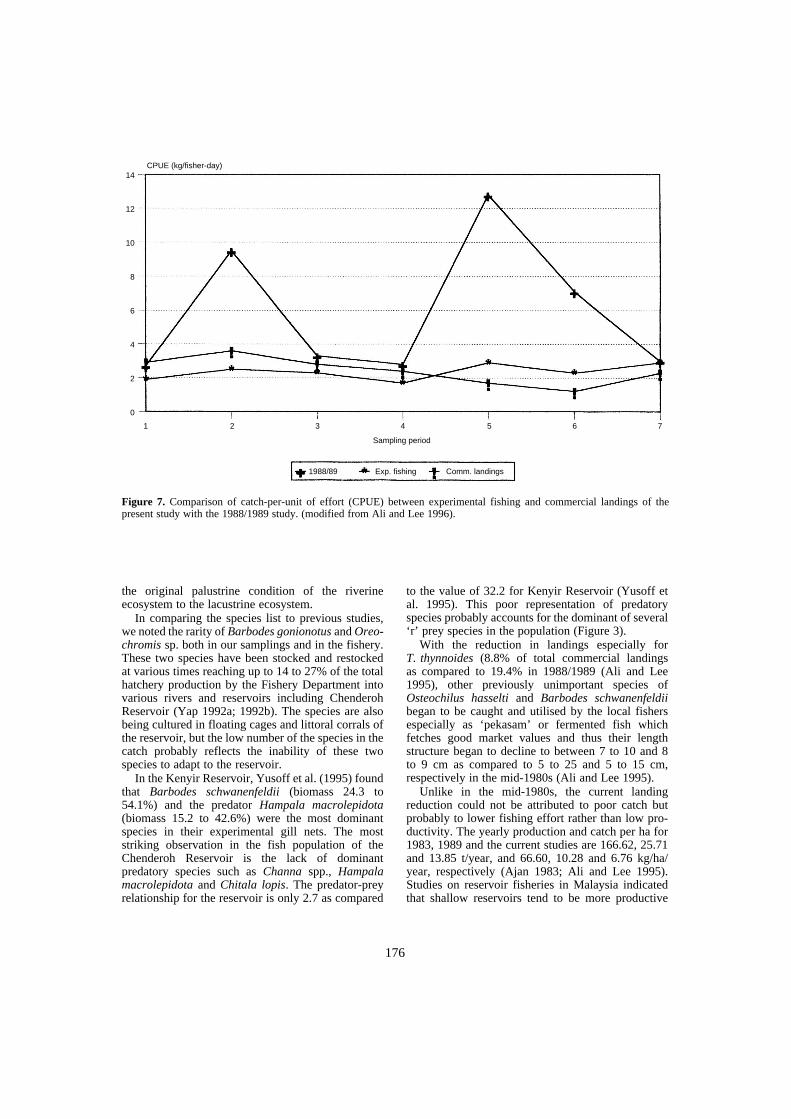
176
the original palustrine condition of the riverineecosystem to the lacustrine ecosystem.
In comparing the species list to previous studies,we noted the rarity of Barbodes gonionotus and Oreo-chromis sp. both in our samplings and in the fishery.These two species have been stocked and restockedat various times reaching up to 14 to 27% of the totalhatchery production by the Fishery Department intovarious rivers and reservoirs including ChenderohReservoir (Yap 1992a; 1992b). The species are alsobeing cultured in floating cages and littoral corrals ofthe reservoir, but the low number of the species in thecatch probably reflects the inability of these twospecies to adapt to the reservoir.
In the Kenyir Reservoir, Yusoff et al. (1995) foundthat Barbodes schwanenfeldii (biomass 24.3 to54.1%) and the predator Hampala macrolepidota(biomass 15.2 to 42.6%) were the most dominantspecies in their experimental gill nets. The moststriking observation in the fish population of theChenderoh Reservoir is the lack of dominantpredatory species such as Channa spp., Hampalamacrolepidota and Chitala lopis. The predator-preyrelationship for the reservoir is only 2.7 as compared
to the value of 32.2 for Kenyir Reservoir (Yusoff etal. 1995). This poor representation of predatoryspecies probably accounts for the dominant of several‘r’ prey species in the population (Figure 3).
With the reduction in landings especially forT. thynnoides (8.8% of total commercial landingsas compared to 19.4% in 1988/1989 (Ali and Lee1995), other previously unimportant species ofOsteochilus hasselti and Barbodes schwanenfeldiibegan to be caught and utilised by the local fishersespecially as ‘pekasam’ or fermented fish whichfetches good market values and thus their lengthstructure began to decline to between 7 to 10 and 8to 9 cm as compared to 5 to 25 and 5 to 15 cm,respectively in the mid-1980s (Ali and Lee 1995).
Unlike in the mid-1980s, the current landingreduction could not be attributed to poor catch butprobably to lower fishing effort rather than low pro-ductivity. The yearly production and catch per ha for1983, 1989 and the current studies are 166.62, 25.71and 13.85 t/year, and 66.60, 10.28 and 6.76 kg/ha/year, respectively (Ajan 1983; Ali and Lee 1995).Studies on reservoir fisheries in Malaysia indicatedthat shallow reservoirs tend to be more productive
Figure 7. Comparison of catch-per-unit of effort (CPUE) between experimental fishing and commercial landings of thepresent study with the 1988/1989 study. (modified from Ali and Lee 1996).
14
12
10
8
6
4
2
0
CPUE (kg/fisher-day)
1 2 3 4 5 6 7
Sampling period
1988/89 Exp. fishing Comm. landings

177
than the larger deeper reservoirs. Subang Reservoirand Bukit Merah Reservoir produced 90 and 37 kgof fish/ha/year (Yap and Furtado 1983; Yap 1983)whereas in the larger and deeper Kenyir Reservoirestimates ranged from 2.0 to 20.0 kg/ha (DoF, 1994;Yusoff et al. 1995). Thus, Chenderoh Reservoir,being shallower like the Subang and Bukit MerahReservoir, has the potential to produce at least60 kg/ha of fish if properly managed.
The state of Perak where Chenderoh Reservoir islocated is one of the few states in Peninsula Malaysiawhich has enacted Inland Fishery Regulations con-trolling the types of gears to be used in the fishery(Ismail 1992). The enactment has controlled the useof destructive fishing techniques such as poisoning,electro-fishing and small mesh gill nets. With thereduction in fishing effort and proper managementstrategies, we expect the reservoir to recover its fishproduction. Considering the appropriate limnologicaland morphometric conditions of the reservoir (Ali1996), we feel that the reservoir could be made asproductive as in the early 1980s. Increased fish pro-duction has been obtained through introductions andrestockings in other Asian reservoirs (Amarasinghe1992; Hardjamulia and Wardoyo 1992; Pawaputanon1992). In fact, inland fisheries of Sri Lanka onlydeveloped as recently as 1952 with the successfulintroduction of O. mossambicus (Amarasinghe1992). However, the caveat to any exotic speciesintroduction is the negative impacts it would have onenvironment and native fish species and whether thespecies is acceptable to the local populace (Ali1998). Other factors negatively affecting reservoirfisheries should also be tackled in order to improvefish production. These factors, such as increasedfishing pressure, open access and unregulatedfisheries, and biologically incompatible reservoirwater level management, are commonly associatedwith reservoir fisheries in the Indo-Pacific region(Petr 1995). Others such as sustainable riparian landuse, protection of riversbanks and littoral zones, andmanagement of watershed area are also important inconserving the biodiversity and production of thefishery.
Acknowledgments
This study was funded by the Malaysian Govern-ment R&D-IRPA grant. We thank Md. Yaakob Md.Yusof, Abdullah Nayan, Meor Ahmad Fauzi andWan Abdul Aziz for their help during the study. Wealso thank Tok Lang and her family and the kindpeople of Chenderoh Reservoir for their help andhospitality.
References
Ajan, J.K. 1983. Assessment of Tasik Chenderoh fisherybased on gill-net. B.Sc. Honors Dissertation, UniversitiSains Malaysia, Penang, Malaysia, 69 p.
Ali, A.B. 1998. Impact of fish introduction on indigenousfish populations and fisheries in Malaysia. In: Cowx, I.G.ed. Stocking and Introduction of Fish. Fishing NewsBook, UK, 274–286.
Ali, A.B. 1996. Chenderoh Reservoir, Malaysia: The con-servation and wise use of fish biodiversity in a smallflow-through tropical reservoir. Lakes and Reservoirs:Research and Management, 2:, 17–30.
Ali, A.B. and Kadir, B-K. A. 1996. The reproductivebiology of the cyprinid, Thynnichtys thynnoides(Bleeker) in the Chenderoh Reservoir – a small tropicalreservoir in Malaysia. Hydrobiologia, 318: 139–151.
Ali, A.B. and Lee, K.Y. 1995. Chenderoh Reservoir,Malaysia: a characterisation of a small-scale, multi-gearand multi-species artisanal fishery in the tropics. FisheryResearch, 23: 267–281.
Amarasinghe, U.S. 1992. Recent trends in the inlandfishery of Sri Lanka. In: Baluyut, E.A. ed. Indo-PacificFishery Commission, FAO Fishery Report No. 458Supplement, FIRI/R458, Rome, 84–105.
Costa-Pierce, B.A. 1992. Multiple regression analysis ofplankton and water-quality relationships as affected bysewage inputs and cage aquaculture in a eutrophic,tropical reservoir. In: De Silva, S.S. ed. ReservoirFishery in Asia. International Development ResearchCenter (IDRC), Canada, 38–48.
Dahlen, B.F. 1993. Hydropower in Malaysia. TenagaNasional Berhad (TNB), Malaysia, 184 p.
Department of Fishery (DoF) 1994. Notes on Tasik Kenyir,State Department of Fishery, Kuala Terengganu,Terengganu, Malaysia, 24 p.
Fowler, J. and Cohen, L. 1990. Practical statistics for fieldbiology. Open University Press, UK, 227 p.
Hails, A.J. and Abdullah, Z. 1982. Reproductive biology ofthe tropical fish Trichogaster pectoralis (Regan). Journalof Fish Biology, 21: 157–170.
Hardjamulia, A. and Wardoyo, S.E. 1992. The role oftilapia in capture and culture-based fisheries inIndonesia. In: Baluyut, E.A. ed. Indo-Pacific FisheryCommission, FAO Fishery Report No. 458 Supplement,FIRI/R458, Rome, 162–174.
Inger, R.F. and Chin, P.K. 1962. The freshwater fishes ofNorth Borneo, Fieldiana: Zoology, 45: Chicago, 268p.
Ismail, A.K. 1992. Utilisation of freshwater fishes for aqua-culture, recreational and capture fishery in Malaysia. In:Proceedings of a Workshop on Conservation andManagement of Freshwater Fish and Their Habitat inPeninsula Malaysia. The Institute of Advance Studies,University of Malaya, Asian Wetland Bureau Collabora-tive Program, Kuala Lumpur, Malaysia, 7–15.
Khon Kaen University 1987. Proceedings of the 1985 Inter-national Conference on Rapid Rural Appraisal, KhonKaen, Thailand: Rural Systems Research and FarmingSystem Research Project, 357 p.
Khoo. K.H., Leong, T.S., Soon, F.L., Tan, E.S.P. andWong, S.Y. 1987. Riverine fisheries in Malaysia. Arch.Hydrobiol. Beiheningen, 28: 261–268.

178
Lee, K.Y. 1989. A preliminary study on fish population ofChenderoh Reservoir, Perak. B.Sc Honors Dissertation,Universiti Sains Malaysia, Penang, Malaysia, 109 p.
Lee, K.Y. and Ali, A.B. 1989. The status of reservoirfishery in Tasik Chenderoh, Perak: A case study. Pro-ceedings of the 12th Annual Seminar of MalaysianSociety of Marine Sciences, 12: 231–239.
Mohsin, A.K.M. and Ambak, M.A. 1992. Freshwater fishesof Peninsula Malaysia. Dewan Bahasa and Pustaka(DBP), Kuala Lumpur, Malaysia, 284 p.
Ng., P.K.L., Tay, J.B., Lim, K.K.P. and Yand, C.M. 1992.The conservation of fish and other aquatic fauna of theNorth Selangor peat swamp forest and adjacent areas.Asian Wetland Bureau (AWB), Institute of AdvanceStudies, University of Malaya, Kuala Lumpur, 90 p.
Pawaputanon, O. 1992. Inland capture fishery in Thailand.In: Baluyut, E.A. ed. Indo-Pacific Fishery Commission,FAO Fishery Report No. 458 Supplement, FIRI/R458,Rome, 106–111.
Petr, T. 1995. The present status of and constraints toinland fishery development in Southeast Asia. In: Petr,T.and Morris, M. ed. Indo-Pacific Fishery Commission,FAO Report No. 512 Supplement, FIRI/R512 Suppl.,Rome, 5–29.
Poole, R.W. 1974. An Introduction to QuantitativeEcology. McGraw-Hill Book Co., NY, 350 p.
Poule, E.C. 1975. Ecological Diversity. Wiley IntersciencePubl., London, 380 p.
Yap, S.Y. 1982. Fish resources of Bukit Merah Reservoir.Ph.D. Thesis, University Malaya, Kuala Lumpur,Malaysia, 400 p.
Yap, S.Y. 1988. Water quality criteria for the protection ofaquatic life and its uses in tropical Asian reservoirs. In:De Silva, S.S. ed. Reservoir Fishery Management andDevelopment in Asia. Proceedings of a Workshop heldin Kathmandu, Nepal, 23–28 November, 1987, 74–86.
Yap, S.W. 1983. A holistic and ecosystemic approach tomulti-species reservoir fisheries in tropical Asia. Inter-national Center for Living Aquatic Resources Manage-ment (ICLARM) Newsletter 6, 10–11.
Yap, S.W. 1992a. Inland capture fishery in Malaysia. In: In:Baluyut, E.A. ed. Indo-Pacific Fishery Commission,FAO Fishery Report No. 458 Supplement, FIRI/R458,Rome, 25–46.
Yap, S.W. 1992b. The present status and expansionpotential of tilapia capture and culture-based fisheries inMalaysia. In: Baluyut, E.A. ed. Indo-Pacific FisheryCommission, FAO Fishery Report No. 458 Supplement,FIRI/R458, Rome, 175–191.
Yap, S.W. and Furtado J.I. 1983. The fishery potential ofSubang Reservoir, Malaysia. International Journal ofEcology and Sciences, 2: 57–66.
Yusoff, F.M., Zaidi, M.Z. and Ambak, M.A. 1995. Fisheryand environmental management of Lake Kenyir,Malaysia. In: Petr, T. and Morris, M. eds. Indo-PacificFishery Commission, FAO Report No. 512 Supplement,FIRI/R512 Suppl., Rome, 112–128.
Zakariah, Z.M. and Ali, A.B. 1996. Fishery management inChenderoh Reservoir, Perak River, Malaysia. In: ZainalAbidin, A.H. and Zubaid, A. ed. Conservation andFaunal Biodiversity in Malaysia, Universiti KebangsaanMalaysia, Bangi, Selangor, D.E.. 102–112.
Zakaria-Ismail and Lim, K.K.P. 1995. The fish fauna ofTasik Temenggor and its tributaries south of Banding,Hulu Perak, Malaysia. Malayan Nature Journal, 48:319–332
Zakaria-Ismail and Sabariah, B. 1995. Lake and river waterquality as determinants of fish abundance at Temenggor,Hulu Perak, Malaysia. Malayan Nature Journal, 48:333–345.
Zar, J.H. 1984. Biostatistical Analysis. Prentice Hall, NJ,859 p.
179
Growth Rates of Transplanted Large Icefish (Protosalanx hyalocranius) in Daoguanhe Reservoir, China
Hongjuan Wu1 and Musheng Xu2
Abstract
Protosalanx hyalocranius was first transplanted in January 1995 into Daoguanhe Reservoir(400 ha), Hubei Province. Breeding populations of P. hyalocranius were established two yearsafter transplantation, and currently the species contributes about 12 kg/ha/yr to the fishery yield ofthe reservoir. Information on growth and other related indices on P. hyalocranius in DaoguanheReservoir were estimated and presented. This paper describes in detail the growth characters oftransplanted P. hyalocranius, when four stages in growth can be recognised, and the results arecompared with those from other reservoirs in China. It is concluded that P. hyalocranius influencesthe ecology of the reservoir and also results in increased production in the waters of HubeiProvince.
LARGE ice fish (Protosalanx hyalocranius),Salmioninae, Salangidae can be found in the littoralof East Sea, Huang Sea and the waters of ChangjiangRiver, middle-down reach of Huai River. Recently, ithas become regarded as a valuable fish and has beensuccessfully transplanted to many reservoirs in Chinabecause of its fast growth, short life-cycle and highnutritional value and economic importance. The aimof this study was to explore whether large ice fishcould grow in reservoirs in central China.
Daoguanhe Reservoir (DGH) lies south of DabieMountain, east of Wuhan, with 1.09 × 10⁹m3 of totalstorage, a catchment area of 108.84 km2, an averagedepth of 18.5 m, and 4000 ha surface area.
Materials and Methods
The materials were large ice fish caught in DGHReservoir by lamp, trawl-net or gill-net, and pre-served in 8–10% formalin. The body length (L) andthe body weight (W) were measured monthly. Thebody length composition, the growth index and bodycondition were calculated using standard formulae.
Results
Growth in body length
Three hundred and thirty-six specimens werecollected and measured from April 1995 to January1996 (Table 1). The growth rate was different atvarious phases. The fastest growth period was at3–4 months of age (from May to July) with an averagemonthly increase of 27.6 mm. There was only10–20 mm increase in other months. There were twopeak values of growth index in the life of large icefish: the first occurred in June and July with 21.4–22.1of growth index, the second in October, with 18.1.
Growth in body weight and the index of condition
The body weight of large ice fish (Protosalanxhyalocranius) was simultaneously measured with thebody length (Table 2). There were three periods withmarked increases in body weight: the first period inJune and July with 1.81 g of average increase, thesecond in September with 4.20 g of average increase,the third in November and December, in the sexualmaturation phase, with 9.8 g of average monthlyincrease in females and 6.67 g in males. After that,there was a decline in body weight, possibly due tospawning.
Based on analysis on the index of condition, thelowest was 0.16 in its earlier phases (2–3 months ofage in April and May). Then the index of condition
1Institute of Reservoir Fisheries, Ministry of WaterResources and CAS, PR China, 4300792Wuhan Water Conservancy Bureau, PR China, 430015
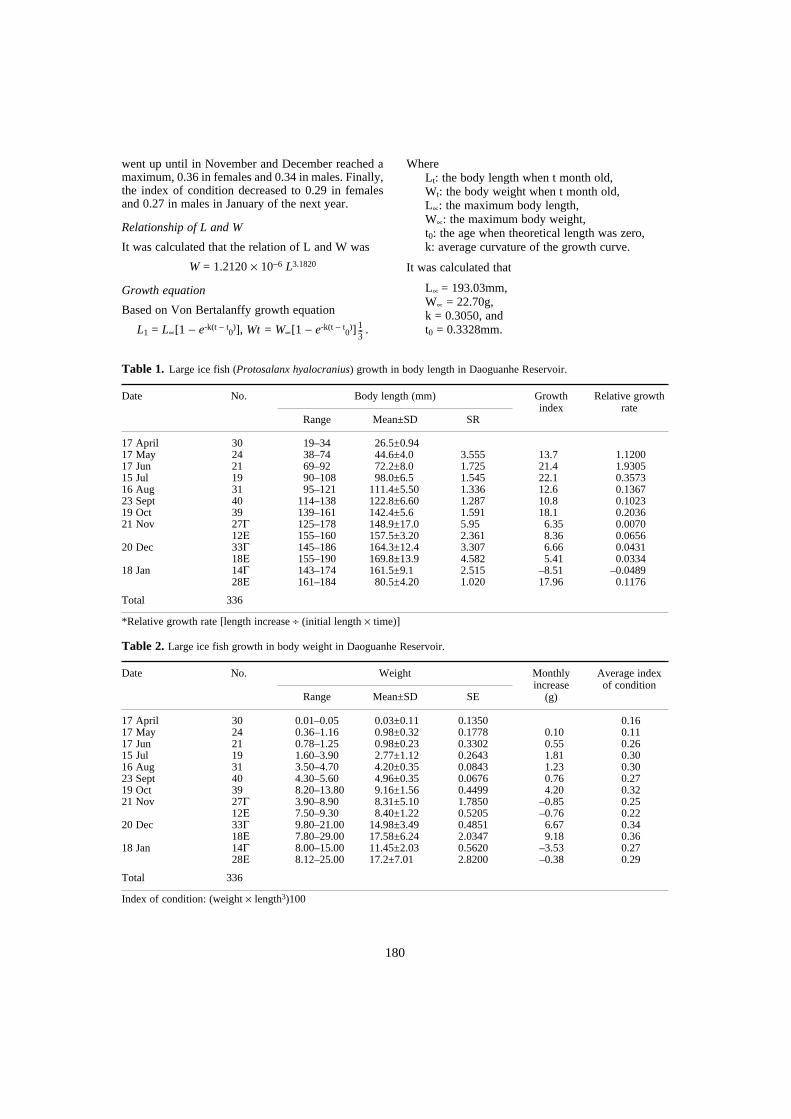
180
went up until in November and December reached amaximum, 0.36 in females and 0.34 in males. Finally,the index of condition decreased to 0.29 in femalesand 0.27 in males in January of the next year.
Relationship of L and W
It was calculated that the relation of L and W was
W = 1.2120 × 10⁻⁶ L3.1820
Growth equation
Based on Von Bertalanffy growth equation
L1 = L∝[1 − e-k(t − t0
)], Wt = W∝[1 − e-k(t − t0
)] .
WhereLt: the body length when t month old, Wt: the body weight when t month old,L∝: the maximum body length, W∝: the maximum body weight,t0: the age when theoretical length was zero,k: average curvature of the growth curve.
It was calculated that
L∝ = 193.03mm, W∝ = 22.70g, k = 0.3050, andt0 = 0.3328mm.1
3---
*Relative growth rate [length increase ÷ (initial length × time)]
Index of condition: (weight × length3)100
Table 1. Large ice fish (Protosalanx hyalocranius) growth in body length in Daoguanhe Reservoir.
Date No. Body length (mm) Growth index
Relative growth rate
Range Mean±SD SR
17 April 30 19–34 26.5±0.94 17 May 24 38–74 44.6±4.0 3.555 13.7 1.120017 Jun 21 69–92 72.2±8.0 1.725 21.4 1.930515 Jul 19 90–108 98.0±6.5 1.545 22.1 0.357316 Aug 31 95–121 111.4±5.50 1.336 12.6 0.136723 Sept 40 114–138 122.8±6.60 1.287 10.8 0.102319 Oct 39 139–161 142.4±5.6 1.591 18.1 0.203621 Nov 27Γ 125–178 148.9±17.0 5.95 6.35 0.0070
12Ε 155–160 157.5±3.20 2.361 8.36 0.065620 Dec 33Γ 145–186 164.3±12.4 3.307 6.66 0.0431
18Ε 155–190 169.8±13.9 4.582 5.41 0.033418 Jan 14Γ 143–174 161.5±9.1 2.515 –8.51 –0.0489 28Ε 161–184 80.5±4.20 1.020 17.96 0.1176
Total 336
Table 2. Large ice fish growth in body weight in Daoguanhe Reservoir.
Date No. Weight Monthlyincrease
(g)
Average indexof condition
Range Mean±SD SE
17 April 30 0.01–0.05 0.03±0.11 0.1350 0.16 17 May 24 0.36–1.16 0.98±0.32 0.1778 0.10 0.11 17 Jun 21 0.78–1.25 0.98±0.23 0.3302 0.55 0.26 15 Jul 19 1.60–3.90 2.77±1.12 0.2643 1.81 0.30 16 Aug 31 3.50–4.70 4.20±0.35 0.0843 1.23 0.30 23 Sept 40 4.30–5.60 4.96±0.35 0.0676 0.76 0.27 19 Oct 39 8.20–13.80 9.16±1.56 0.4499 4.20 0.32 21 Nov 27Γ 3.90–8.90 8.31±5.10 1.7850 –0.85 0.25 12Ε 7.50–9.30 8.40±1.22 0.5205 –0.76 0.22 20 Dec 33Γ 9.80–21.00 14.98±3.49 0.4851 6.67 0.34 18Ε 7.80–29.00 17.58±6.24 2.0347 9.18 0.36 18 Jan 14Γ 8.00–15.00 11.45±2.03 0.5620 –3.53 0.27 28Ε 8.12–25.00 17.2±7.01 2.8200 –0.38 0.29
Total 336

181
Figure 1. The relationship of length and weight of large ice fish (Protosalanx hyalocranius). H2 — Haizi Reservoir,TH — Taihu Lake, TJ — Tianjing Reservoir, DGH — Daoguanhe Reservoir.
Figure 2. The growth curve of large ice fish (Protosalanx hyalocranius) in Daoguanhe Reservoir and Lake Taihu.
HZ
TH
TJ
DGH
body length (mm)1 2 3 4 5 6 7 8 9 10 11
30
25
20
15
10
5
0
body
wei
ght (
g)
t (month old)
1 2 3 4 5 6 7 8 9 10 11 12
t (month old)
1 2 3 4 5 6 7 8 9 10 11 12
DGH
TH
DGH
TH
200
150
100
50
0
body
leng
th (
mm
)
25
20
15
10
5
0
body
wei
ght (
g)

182
Discussion
Growth characters
The life of large ice fish in DGH Reservoir could bedivided into four phases: the first phase was (about1–3 months of age) from April to May when its foodchanged from yolk to zooplankton. Low condition,slow growth, small size and higher related growthrate were characteristics in this period. The secondphase was June to October (4–8 months) when it fedon small fish but with less growth and condition. Thethird phase was in the sexual maturation period(8–10 months) with little increase in body length andmuch increase in body weight and maximum con-dition, especially in females. Decreased body weightcharacterised the last phase (10–12 months).
Comparison with the growth of large ice fish in other reservoirs
As Figure 1 shows, the relationship curve of thelength (L) and the weight (W) of large ice fish inDGH Reservoir basically coincides with that in HaiziReservoir (Zhu 1985), close to that in Lake Taihu(Wang and Jiang 1992; Seng 1995). It shows that thegrowth of large ice fish in its earlier life stage wasfaster.
In addition, the time at which the body weight oflarge ice fish greatly increased in DGH, HaiziReservoir and Taiu Lake was later than in TianjingReservoir (TJ).
Conclusion
The growth characteristics of large ice fish wereobserved to be the same as in other reservoirs inChina. They showed that the fish is widely adaptiveto environment and can grow in most reservoirs inthe north catchment areas of Changjiang River andthe north of China.
Acknowledgment
Wuhan Science Committee, China supported thisstudy.
References
Seng Qizhang 1995. The study report of transplanting largeice fish (Protosalanx hyalocranius) to Haizi Reservoirin Beijing, China. Reservoir Fisheries, (1): 27–28 (inChinese).
Wang Yufen and Jiang Quanwen. 1992. The studies on thegrowth characters of large ice fish (Protosalanx hyalo-cranius) in Lake Tai, China. Lake Science, 4(1): 56–62(in Chinese).
Wang Yupei et al. 1992. The technique of protecting andpropagation of large ice fish (Protosalanx hyalocranius)resources in Tianjing, China. Reservoir Fisheries, (6):25–28 (in Chinese).
Zhu Chende, 1985. Primary study on the growth and foodof large ice fish (Protosalanx hyalocranius) in Lake Tai,China. Acta Aquaculture, 9(3): 275–287 (in Chinese).
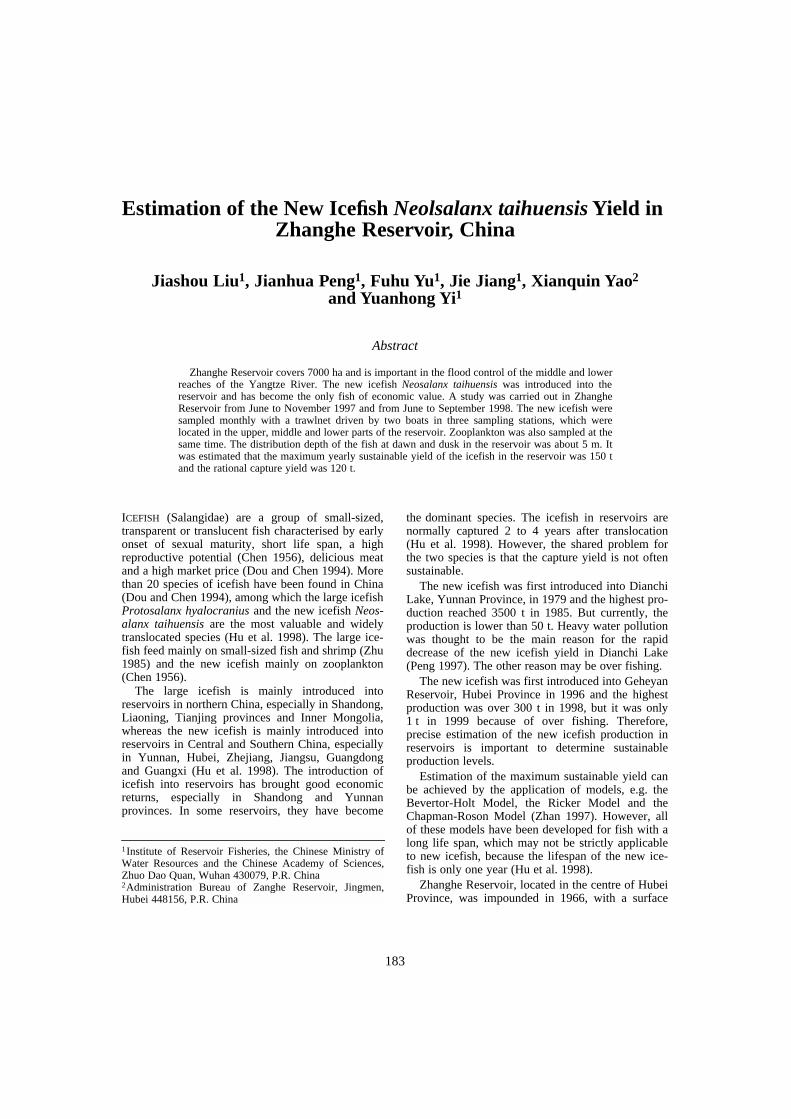
183
Estimation of the New Icefish Neolsalanx taihuensis Yield in Zhanghe Reservoir, China
Jiashou Liu1, Jianhua Peng1, Fuhu Yu1, Jie Jiang1, Xianquin Yao2
and Yuanhong Yi1
Abstract
Zhanghe Reservoir covers 7000 ha and is important in the flood control of the middle and lowerreaches of the Yangtze River. The new icefish Neosalanx taihuensis was introduced into thereservoir and has become the only fish of economic value. A study was carried out in ZhangheReservoir from June to November 1997 and from June to September 1998. The new icefish weresampled monthly with a trawlnet driven by two boats in three sampling stations, which werelocated in the upper, middle and lower parts of the reservoir. Zooplankton was also sampled at thesame time. The distribution depth of the fish at dawn and dusk in the reservoir was about 5 m. Itwas estimated that the maximum yearly sustainable yield of the icefish in the reservoir was 150 tand the rational capture yield was 120 t.
ICEFISH (Salangidae) are a group of small-sized,transparent or translucent fish characterised by earlyonset of sexual maturity, short life span, a highreproductive potential (Chen 1956), delicious meatand a high market price (Dou and Chen 1994). Morethan 20 species of icefish have been found in China(Dou and Chen 1994), among which the large icefishProtosalanx hyalocranius and the new icefish Neos-alanx taihuensis are the most valuable and widelytranslocated species (Hu et al. 1998). The large ice-fish feed mainly on small-sized fish and shrimp (Zhu1985) and the new icefish mainly on zooplankton(Chen 1956).
The large icefish is mainly introduced intoreservoirs in northern China, especially in Shandong,Liaoning, Tianjing provinces and Inner Mongolia,whereas the new icefish is mainly introduced intoreservoirs in Central and Southern China, especiallyin Yunnan, Hubei, Zhejiang, Jiangsu, Guangdongand Guangxi (Hu et al. 1998). The introduction oficefish into reservoirs has brought good economicreturns, especially in Shandong and Yunnanprovinces. In some reservoirs, they have become
the dominant species. The icefish in reservoirs arenormally captured 2 to 4 years after translocation(Hu et al. 1998). However, the shared problem forthe two species is that the capture yield is not oftensustainable.
The new icefish was first introduced into DianchiLake, Yunnan Province, in 1979 and the highest pro-duction reached 3500 t in 1985. But currently, theproduction is lower than 50 t. Heavy water pollutionwas thought to be the main reason for the rapiddecrease of the new icefish yield in Dianchi Lake(Peng 1997). The other reason may be over fishing.
The new icefish was first introduced into GeheyanReservoir, Hubei Province in 1996 and the highestproduction was over 300 t in 1998, but it was only1 t in 1999 because of over fishing. Therefore,precise estimation of the new icefish production inreservoirs is important to determine sustainableproduction levels.
Estimation of the maximum sustainable yield canbe achieved by the application of models, e.g. theBevertor-Holt Model, the Ricker Model and theChapman-Roson Model (Zhan 1997). However, allof these models have been developed for fish with along life span, which may not be strictly applicableto new icefish, because the lifespan of the new ice-fish is only one year (Hu et al. 1998).
Zhanghe Reservoir, located in the centre of HubeiProvince, was impounded in 1966, with a surface
1Institute of Reservoir Fisheries, the Chinese Ministry ofWater Resources and the Chinese Academy of Sciences,Zhuo Dao Quan, Wuhan 430079, P.R. China2Administration Bureau of Zanghe Reservoir, Jingmen,Hubei 448156, P.R. China
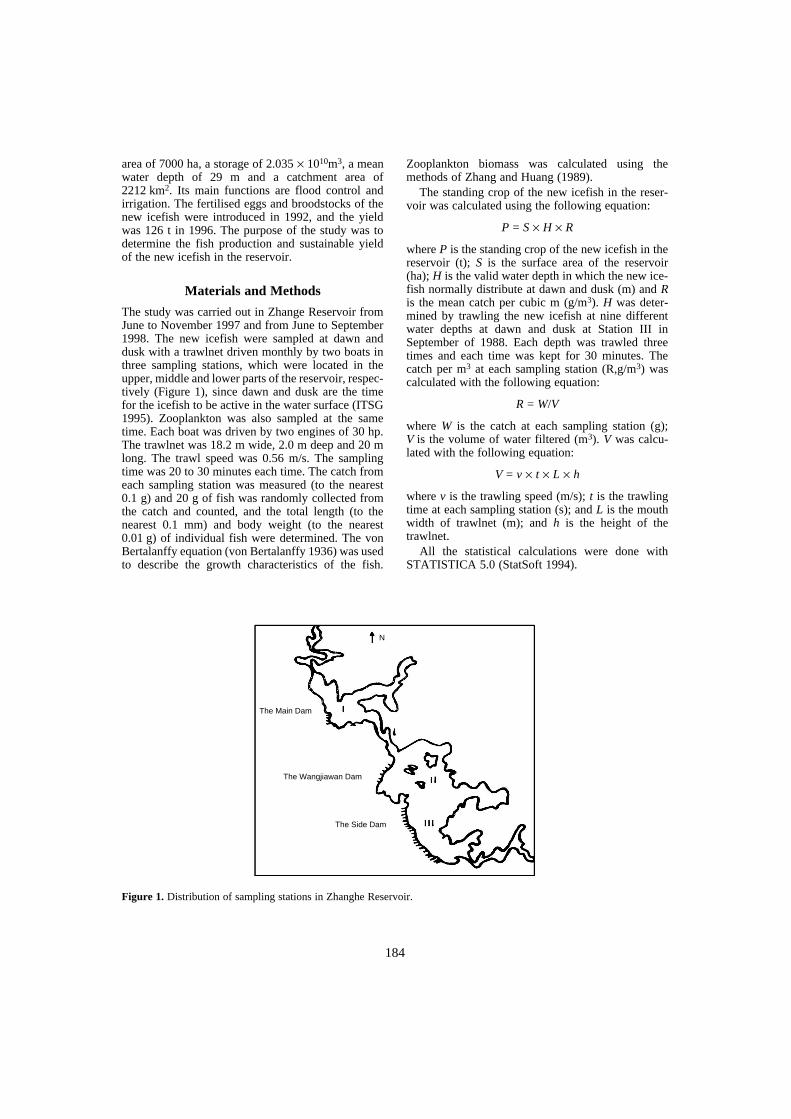
184
area of 7000 ha, a storage of 2.035 × 10¹⁰m3, a meanwater depth of 29 m and a catchment area of2212 km2. Its main functions are flood control andirrigation. The fertilised eggs and broodstocks of thenew icefish were introduced in 1992, and the yieldwas 126 t in 1996. The purpose of the study was todetermine the fish production and sustainable yieldof the new icefish in the reservoir.
Materials and Methods
The study was carried out in Zhange Reservoir fromJune to November 1997 and from June to September1998. The new icefish were sampled at dawn anddusk with a trawlnet driven monthly by two boats inthree sampling stations, which were located in theupper, middle and lower parts of the reservoir, respec-tively (Figure 1), since dawn and dusk are the timefor the icefish to be active in the water surface (ITSG1995). Zooplankton was also sampled at the sametime. Each boat was driven by two engines of 30 hp.The trawlnet was 18.2 m wide, 2.0 m deep and 20 mlong. The trawl speed was 0.56 m/s. The samplingtime was 20 to 30 minutes each time. The catch fromeach sampling station was measured (to the nearest0.1 g) and 20 g of fish was randomly collected fromthe catch and counted, and the total length (to thenearest 0.1 mm) and body weight (to the nearest0.01 g) of individual fish were determined. The vonBertalanffy equation (von Bertalanffy 1936) was usedto describe the growth characteristics of the fish.
Zooplankton biomass was calculated using themethods of Zhang and Huang (1989).
The standing crop of the new icefish in the reser-voir was calculated using the following equation:
P = S × H × R
where P is the standing crop of the new icefish in thereservoir (t); S is the surface area of the reservoir(ha); H is the valid water depth in which the new ice-fish normally distribute at dawn and dusk (m) and Ris the mean catch per cubic m (g/m3). H was deter-mined by trawling the new icefish at nine differentwater depths at dawn and dusk at Station III inSeptember of 1988. Each depth was trawled threetimes and each time was kept for 30 minutes. Thecatch per m3 at each sampling station (R,g/m3) wascalculated with the following equation:
R = W/V
where W is the catch at each sampling station (g);V is the volume of water filtered (m3). V was calcu-lated with the following equation:
V = v × t × L × h
where v is the trawling speed (m/s); t is the trawlingtime at each sampling station (s); and L is the mouthwidth of trawlnet (m); and h is the height of thetrawlnet.
All the statistical calculations were done withSTATISTICA 5.0 (StatSoft 1994).
Figure 1. Distribution of sampling stations in Zhanghe Reservoir.
The Main Dam
The Wangjiawan Dam
The Side Dam
N

185
Results
Growth of the new icefish
A total of 8619 new icefish from Zhanghe Reservoirwas used for growth measurements, among which5400 were collected in 1997 and 3219 in 1998. Table1 lists the monthly mean total length and bodyweight of the new icefish. The mean body weightand mean length of icefish caught in August toOctober were significantly (P<0.05) higher than inthe other months (Table 1). In the remaining months,these parameters did not differ significantly.
Catches of the new icefish at different water depths in Zhanghe Reservoir
Table 2 shows the results of the catches of the newicefish collected in 30 minute hauls at dawn anddusk from different water depths at Station I.Analysis of variance showed no significant differ-ences in the catch among water depths from 0–2, 1–3to 2–4 metres (P>0.05) (Table 2). However, thecatch significantly decreased with further increase indepth (P<0.05) (Table 2).
1 Values with the same superscript are not significantlydifferent from each other (P>0.05).
The standing crop and exploitable yield of the new icefish in Zhanghe Reservoir
Based on the trawl catches, the standing crop of newicefish in the reservoir was estimated. Accordingly,in 1997, the standing crop of the new icefish inZhanghe Reservoir increased from 35.7 t in June to
103.2 t in September, and then decreased to 28.7 t inNovember (Table 3). In 1998, the tendency of thestanding crop of the fish in the reservoir was com-parable to that at the same time in 1997 (Table 3).
1 R is the mean catch of the new icefish per cubic metreswithin the valid depth.2 P is the standing crop (t) of the new icefish in the reservoir.
The commercial fishery for icefish in the reser-voir is very seasonal and occurs only for a fewmonths in the year. In 1997, it commenced on22 September and ended on 15 November. In 1997,the yield was 68.5 t until 19 October, and 123.6 tuntil 15 November. In 1998, capture for the newice-fish started on 23 September and ended on13 November. The yield was 59.5 t until 19 October,103.2 t until 13 November.
Growth rate of the new icefish in Zhanghe Reservoir
The size of the new icefish in Zhanghe Reservoir ismuch smaller than that in other water bodies. Forexample, the mean length and weight were 51.9 mmin total length and 0.29 g in Zhanghe Reservoir inOctober (Table 1). However, at a comparable time,the mean length and weight were 70.0 mm and1.171 g in Fushui Reservoir, Hubei Province (Gonget al. 1977), 68.9 mm and 1.21 g in Taihu Lake,Jiangsu Province (ITSG 1995), 66.0 mm and 1.7 g inDianchi Lake, Yunan Province (Gao and Zhuang1989), respectively.
Table 2. The catches of the new icefish from differentwater depths collected at dawn and dusk.
Water depth (m) Mean catch (kg) ± s.e.1
02 3.714 ± 1.212a
13 3.953 ± 1.089a
24 3.021 ± 0.678ab
35 2.845 ± 0.154b
46 2.122 ± 0.169c
57 1.021 ± 0.078d
68 0.367 ± 0.025c
79 0.212 ± 0.012f
810 0.041 ± 0.009g
Table 3. The standing crop of the new icefish in ZhangheReservoir in 1997 and 1998.
Sampling time R (g/m3)1 P (t)2
22 June 1997 0.102 35.7021 July 1997 0.156 54.7521 August 1997 0.191 66.7721 September 1997 0.295 103.1820 October 1997 0.146 51.2020 November 1997 0.082 28.7020 June 1998 0.098 34.3720 July 1998 0.161 56.3520 August 1998 0.178 62.3020 September 1998 0.281 98.35
Table 1. The mean total length and body weight of the new icefish in Zhanghe Reservoir.
Sampling time 1997 1998
June July Aug Sept Oct Nov June July Aug Sept
Total length (mm) 38.79 41.70 44.27 46.82 51.93 56.53 38.21 41.30 46.27 50.81Body weight (g) 0.149 0.197 0.226 0.247 0.287 0.477 0.141 0.200 0.276 0.350

186
The new icefish is a zooplankton feeder (Chen1956). Its growth rate is dependent on the trophiclevel of water bodies. Zhanghe Reservoir is oligo-trophic, but Fushui Reservoir, Taihu Lake andDianchi Lake are eutrophic. The zooplankton biomasswas only 0.02–0.13 mg/L in Zhanghe Reservoir fromJune to November of 1977, showing a decreasingtendency with increasing fish size (Figure 2), perhapsindicative of food limitation in the latter part of theyear. Transplantation of the new icefish is notrecommended into water bodies with a zooplanktonbiomass less than 2.8 mg/L (Rong and Zhang 1997).The practice in Zhanghe Reservoir indicated that size-able populations of the fish could still occur in oligo-trophic water bodies, though it has much lowergrowth rate.
Zhanghe Reservoir recorded the heaviest floodingin 1998. Heavy rains brought plenty of nutrients intothe reservoir and improved its trophic conditions.
The zooplankton biomass was 0.09–0.22 mg/L inZhanghe Reservoir from June to September (Figure3) which was higher than that in the same time of1997. Consequently, the size of the new icefish inAugust and September in 1998 was significantlybigger than that in the same time of 1997 (P<0.05)(Table 1), indicating again that the growth of the newicefish was dependent on food availability. If thezooplankton availability could be improvedartificially, the size of the new icefish in ZhangheReservoir may be improved.
Valid water depth of distribution at dawn and dusk of the new icefish in Zhanghe Reservoir
The new icefish is strongly phototaxic. They moveupwards to the water surface at dawn, dusk and onmoonlit nights (ITSG 1995), a behavioural traitexploited by fishers. In some reservoirs, e.g. Xinan-jiang Reservoir, Zhejiang Province, people around
Figure 2. Biomass of zooplankton at three sampling stations in Zhanghe Reservoir in 1997.
Figure 3. Biomass of zooplankton at three sampling stations in Zhanghe Reservoir in 1998.
0.3
0.2
0.1
0
Bio
mas
s (m
g/L
)
Jun Jul Aug Sept Oct Sept
I
II
III
Mean
0.4
0.3
0.2
0.1
0
Bio
mas
s (m
g/L
)
I
II
III
Mean
Jun Jul Aug Sept
187
the reservoir catch the fish by luring the fish withartificial lights (ITSG 1995). We captured the fish atdifferent water depths and found no significant dif-ferences in the catch at depths of 0–2, 1–3 and 2–4 m(Table 2).
Acknowledgments
We would like to thank Dr S.S. De Silva at theDeakin University for checking the manuscript andmaking valuable proposals. Thanks also to ProfessorChuanlin Hu and Mr Daoming Huang at the Instituteof Reservoir Fisheries, the Chinese Ministry ofWater Resources and the Chinese Academy ofSciences for providing some useful information. Thestudy was jointly founded by the Chinese Ministry ofScience and Technology (originally the ChineseCommission of Science and Technology) (ProjectNo. 96-008-02-04) and the Water Resources Bureauof Hubei Province.
ReferencesChen, N.S. 1956. Primary studies on Neosalanx tangkaheii
taihuensis Chen. Acta Hydrobiologica Sinica, 2: 324–334.Dou, S.Z. and Chen, D.G. 1994. Taxonomy, biology and
abundance of icefish, or noodelfishes (Salangidae) in theYellow River estuary of the Bohai Sea, China. Journal ofFish Biology, 45: 737–748.
Gao, L. and Zhuang, D. 1989. Studies on the transplantednew icefish Neosalanx taihuensis in Dianchi Lake. LakeScience, 1(1): 79–88 (in Chinese).
Gong, S., Wu, M., Jin, D. and Wang, A. 1997. Growth ofthe new icefish Neolsalanx taihuensis in FushuiReservoir and its maximum economic yield. ReservoirFisheries, 1997 (special): 125–128 (in Chinese).
Hu, C., Chen, W. and Liu, J. 1998. Status of transplantationand enhancement of icefishes in China and their develop-ment strategies. Reservoir Fisheries, 1998(2): 3–7 (inChinese).
ITSG (Icefish Transplantation Survey Group) 1995. Statusof icefish transplantation and strategies in Chinese large-and medium-sized water bodies. Reservoir Fisheries,1995(3): 3–5 (in Chinese).
Peng, Q. 1997. Studies on the biology of the new icefishNeosalanx taihuensis in Dianchi Lake and the reasonsfor its resource succession. Reservoir Fisheries, 1997(special): 147–150 (in Chinese).
Rong, C. and Zhang, H. 1997. Studies on the ecologicalenvironments of water bodies for transplantation of ice-fishes. Reservoir Fisheries, 1997 (special): 115–118 (inChinese).
StatSoft 1994. STATITICA Users Guide, Version 4.1.Tulsa, OK. Statsoft Inc.
von Bertalanffy, L. 1936. A quantitative theory of organicgrowth (Inquiries on growth laws II). Human Biology,10: 181–213.
Zhan, B. 1997. Assessment of Fisheries Resources. Beijing,Agriculture Press.
Zhang, Z. and Huang, X. 1989. Research Methods forFreshwater Plankton. Beijing: Science Press. 414 p (inChinese).
Zhu, C. 1985. Preliminary studies on the growth andfeeding habits of the large icefish. J. Fish. 9(3): 275–287(in Chinese).
188
Population Dynamics of Potential Fish Species for Exploitation in Presently Underdeveloped Fisheries of
Some Perennial Reservoirs in Sri Lanka
M.J.S. Wijeyaratne and W.M.D.S.K. Perera*
Abstract
Fish resources in some perennial reservoirs of Sri Lanka are presently under exploited orunexploited mainly because these reservoirs are located in close proximity to marine fish landingsites or in urban areas where marine fish are readily available. The asymptotic length (L∞), vonBertalanffy growth coefficient (K) and natural mortality coefficient (M) of fish species inhabitingfive such reservoirs in the western coastal region in Sri Lanka, namely, Boralasgamuwa (16 ha),Lunuwila (14 ha), Madampe (81 ha), Mahawewa (60 ha) and Mattegoda (4 ha) reservoirs, wereevaluated in order to determine the feasibility of their sustainable exploitation. Of the 17 fishspecies recorded, only three species had L∞ values > 15 cm. L∞ of two species were < 5 cm. The Kvalues of most of the species were > 1.0/year. Since no fishing is carried out in these reservoirs, thefish are subjected to natural mortality only. The M values of all species other than three specieswere found to be > 2.0/year. High K and M values of most of the fish indicate that they have highproduction per biomass (P/B) ratios. Most of the fish species inhabiting these reservoirs could besubjected to heavy fishing mortalities. These species have a high economic value both asornamental and food fish. The results indicate that there is a high potential to develop capturefisheries in these reservoirs to harvest both food and ornamental fish.
THE inland fish production of Sri Lanka, after asteady decrease from 39 721 mt in 1989 to 12 000 mtin 1994, has increased in the past few years, to reacha level of 27 250 mt in 1997 which is about 11% ofthe total fish production of the country (NARA1999). This production has been obtained mainlyfrom man made reservoirs which have a total extentof around 191 382 ha (NARA 1998).
However, fish resources in some perennial reser-voirs of Sri Lanka are under exploited or unexploitedmainly because these reservoirs are either in closeproximity to marine fish landing sites or in urbanareas where marine fish are readily available. Thisstudy was carried out in five such reservoirs, namely,Boralasgamuwa (16 ha), Lunuwila (14 ha), Madampe(81 ha), Mahawewa (60 ha) and Mattegoda (4 ha) inthe western coastal region of Sri Lanka (Figure 1)
with an objective of estimating the asymptoticlengths (L∞), von Bertalanffy growth coefficient (K)and natural mortality rates (M) of the fish speciesinhabiting these reservoirs, to determine the feasi-bility of their sustainable utilisation.
Materials and Methods
The fish populations in the Boralasgamuwa,Lunuwila, Madampe, Mahawewa and Mattegodareservoirs in the western and northwestern provincesof Sri Lanka were sampled in 1992–1993 using acast-net of 2.0 cm stretched mesh. No fishing is donein these reservoirs so no commercial catch was avail-able for sampling. In each reservoir, sampling wasdone once a month for 12 months. The fish caughtwere identified using Munro (1955) and Pethiyagoda(1991) and their total lengths measured to the nearestmm. Length frequency data were analysed usingFiSAT version 1.0 software package (Gayanilo et al.1996). The value for L∞ obtained by PowellWetherall method (Sparre and Venema 1992)
*Department of Zoology, University of Kelaniya, Kelaniya,Sri Lanka. E-mail: [email protected]
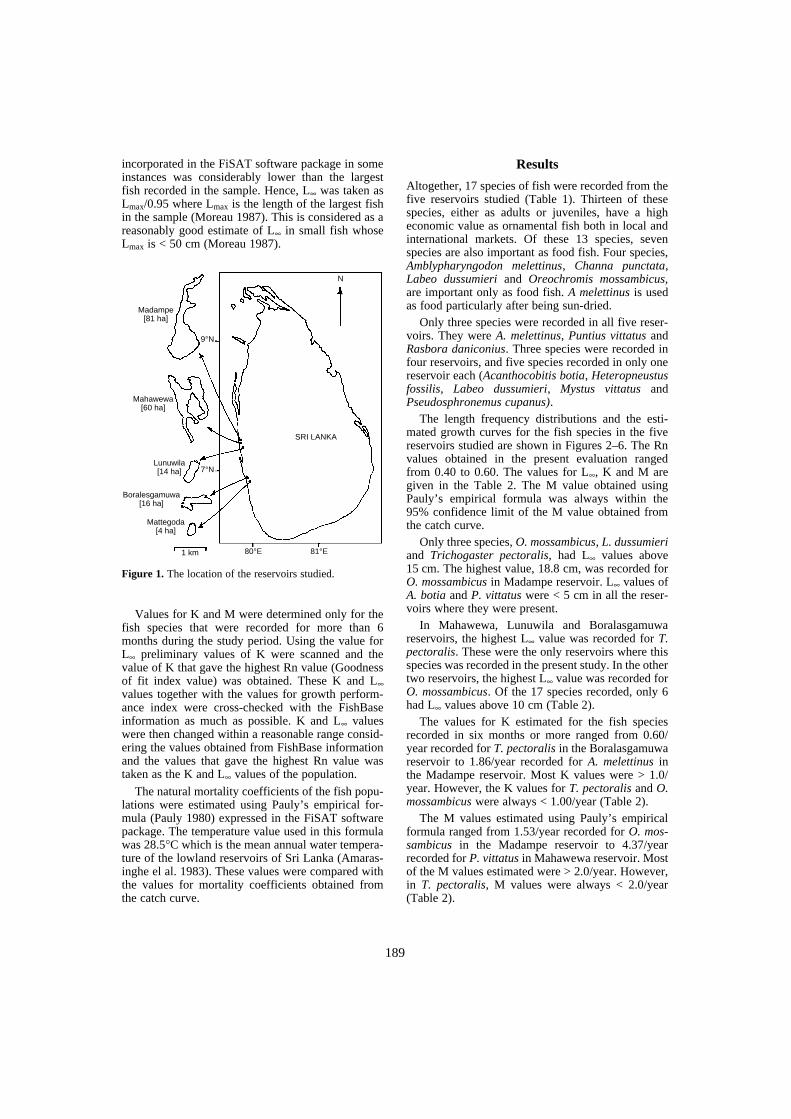
189
incorporated in the FiSAT software package in someinstances was considerably lower than the largestfish recorded in the sample. Hence, L∞ was taken asLmax/0.95 where Lmax is the length of the largest fishin the sample (Moreau 1987). This is considered as areasonably good estimate of L∞ in small fish whoseLmax is < 50 cm (Moreau 1987).
Figure 1. The location of the reservoirs studied.
Values for K and M were determined only for thefish species that were recorded for more than 6months during the study period. Using the value forL∞ preliminary values of K were scanned and thevalue of K that gave the highest Rn value (Goodnessof fit index value) was obtained. These K and L∞values together with the values for growth perform-ance index were cross-checked with the FishBaseinformation as much as possible. K and L∞ valueswere then changed within a reasonable range consid-ering the values obtained from FishBase informationand the values that gave the highest Rn value wastaken as the K and L∞ values of the population.
The natural mortality coefficients of the fish popu-lations were estimated using Pauly’s empirical for-mula (Pauly 1980) expressed in the FiSAT softwarepackage. The temperature value used in this formulawas 28.5°C which is the mean annual water tempera-ture of the lowland reservoirs of Sri Lanka (Amaras-inghe el al. 1983). These values were compared withthe values for mortality coefficients obtained fromthe catch curve.
Results
Altogether, 17 species of fish were recorded from thefive reservoirs studied (Table 1). Thirteen of thesespecies, either as adults or juveniles, have a higheconomic value as ornamental fish both in local andinternational markets. Of these 13 species, sevenspecies are also important as food fish. Four species,Amblypharyngodon melettinus, Channa punctata,Labeo dussumieri and Oreochromis mossambicus,are important only as food fish. A melettinus is usedas food particularly after being sun-dried.
Only three species were recorded in all five reser-voirs. They were A. melettinus, Puntius vittatus andRasbora daniconius. Three species were recorded infour reservoirs, and five species recorded in only onereservoir each (Acanthocobitis botia, Heteropneustusfossilis, Labeo dussumieri, Mystus vittatus andPseudosphronemus cupanus).
The length frequency distributions and the esti-mated growth curves for the fish species in the fivereservoirs studied are shown in Figures 2–6. The Rnvalues obtained in the present evaluation rangedfrom 0.40 to 0.60. The values for L∞, K and M aregiven in the Table 2. The M value obtained usingPauly’s empirical formula was always within the95% confidence limit of the M value obtained fromthe catch curve.
Only three species, O. mossambicus, L. dussumieriand Trichogaster pectoralis, had L∞ values above15 cm. The highest value, 18.8 cm, was recorded forO. mossambicus in Madampe reservoir. L∞ values ofA. botia and P. vittatus were < 5 cm in all the reser-voirs where they were present.
In Mahawewa, Lunuwila and Boralasgamuwareservoirs, the highest L∞ value was recorded for T.pectoralis. These were the only reservoirs where thisspecies was recorded in the present study. In the othertwo reservoirs, the highest L∞ value was recorded forO. mossambicus. Of the 17 species recorded, only 6had L∞ values above 10 cm (Table 2).
The values for K estimated for the fish speciesrecorded in six months or more ranged from 0.60/year recorded for T. pectoralis in the Boralasgamuwareservoir to 1.86/year recorded for A. melettinus inthe Madampe reservoir. Most K values were > 1.0/year. However, the K values for T. pectoralis and O.mossambicus were always < 1.00/year (Table 2).
The M values estimated using Pauly’s empiricalformula ranged from 1.53/year recorded for O. mos-sambicus in the Madampe reservoir to 4.37/yearrecorded for P. vittatus in Mahawewa reservoir. Mostof the M values estimated were > 2.0/year. However,in T. pectoralis, M values were always < 2.0/year(Table 2).
Madampe[81 ha]
Mahawewa[60 ha]
Lunuwila[14 ha]
Boralesgamuwa[16 ha]
Mattegoda[4 ha]
1 km
9°N
7°N
80°E 81°E
N
SRI LANKA

190
Figure 2. The length frequency distribution and estimated growth curves of the fish species of Mahawewa reservoir.
Amblypharyngodon melettinus
Jan Feb Mar Apr May Jun Jul Aug Sep Oct Nov Dec1992
8
6
4
2
0
Etroplus maculatus
Jan Feb Mar Apr May Jun Jul Aug Sep Oct Nov Dec1992
8
6
4
2
0
Oreochromis mossambicus
Jan Feb Mar Apr May Jun Jul Aug Sep Oct Nov Dec1992
12
8
4
0
Leng
th (
cm)
Puntius filamentosus
Jan Feb Mar Apr May Jun Jul Aug Sep Oct Nov Dec1992
12
8
4
0
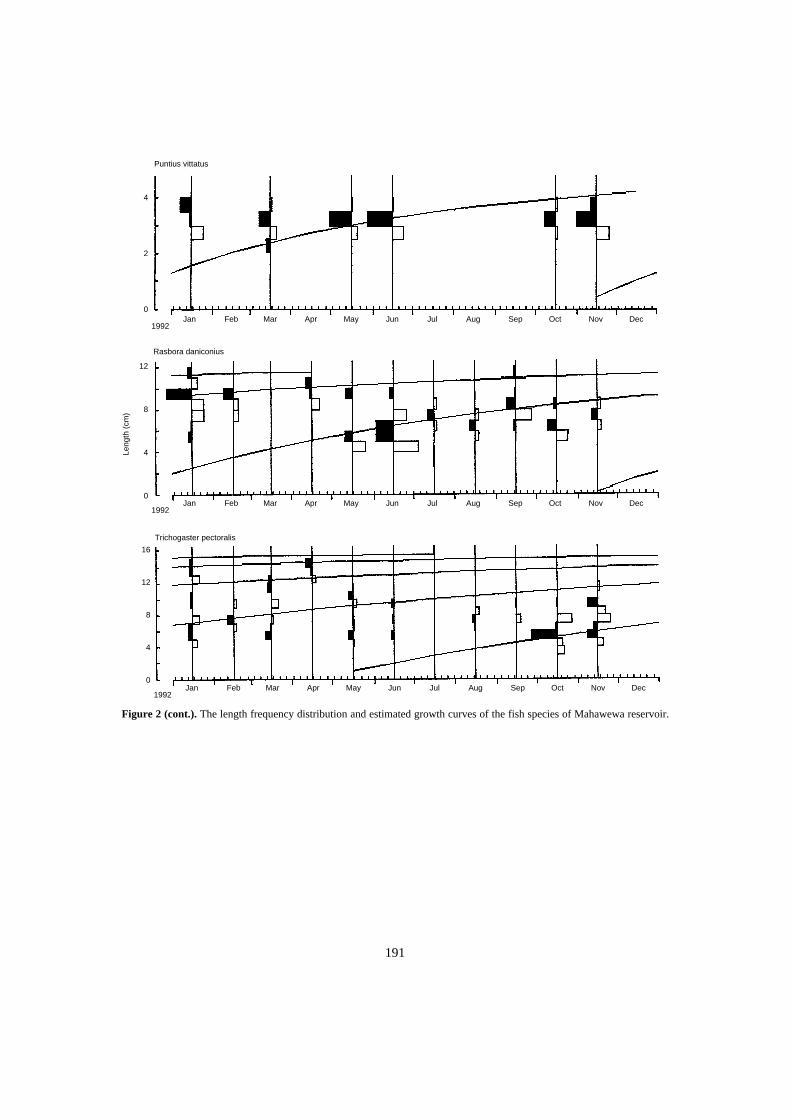
191
Figure 2 (cont.). The length frequency distribution and estimated growth curves of the fish species of Mahawewa reservoir.
Puntius vittatus
Jan Feb Mar Apr May Jun Jul Aug Sep Oct Nov Dec1992
4
2
0
Rasbora daniconius
Jan Feb Mar Apr May Jun Jul Aug Sep Oct Nov Dec1992
12
8
4
0
Leng
th (
cm)
Trichogaster pectoralis
Jan Feb Mar Apr May Jun Jul Aug Sep Oct Nov Dec1992
16
12
8
4
0
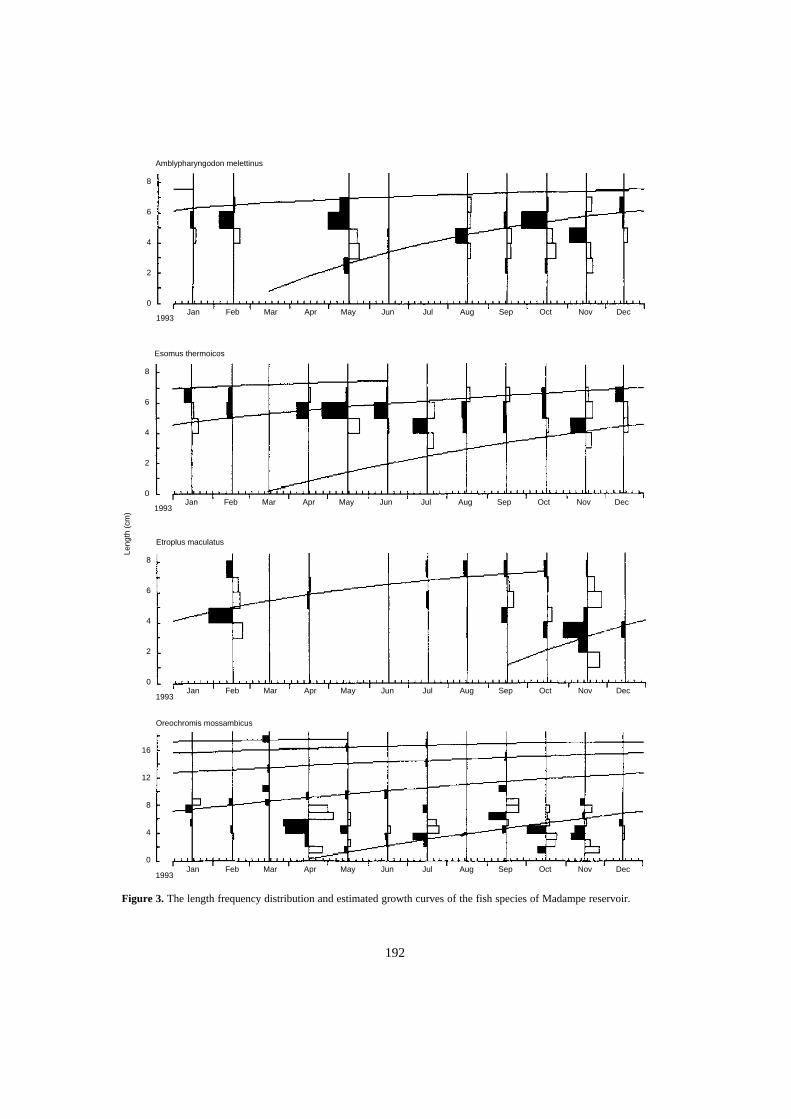
192
Figure 3. The length frequency distribution and estimated growth curves of the fish species of Madampe reservoir.
Amblypharyngodon melettinus
Jan Feb Mar Apr May Jun Jul Aug Sep Oct Nov Dec1993
8
6
4
2
0
Leng
th (
cm)
Esomus thermoicos
Jan Feb Mar Apr May Jun Jul Aug Sep Oct Nov Dec1993
8
6
4
2
0
Etroplus maculatus
Jan Feb Mar Apr May Jun Jul Aug Sep Oct Nov Dec1993
8
6
4
2
0
Oreochromis mossambicus
Jan Feb Mar Apr May Jun Jul Aug Sep Oct Nov Dec1993
16
12
8
4
0
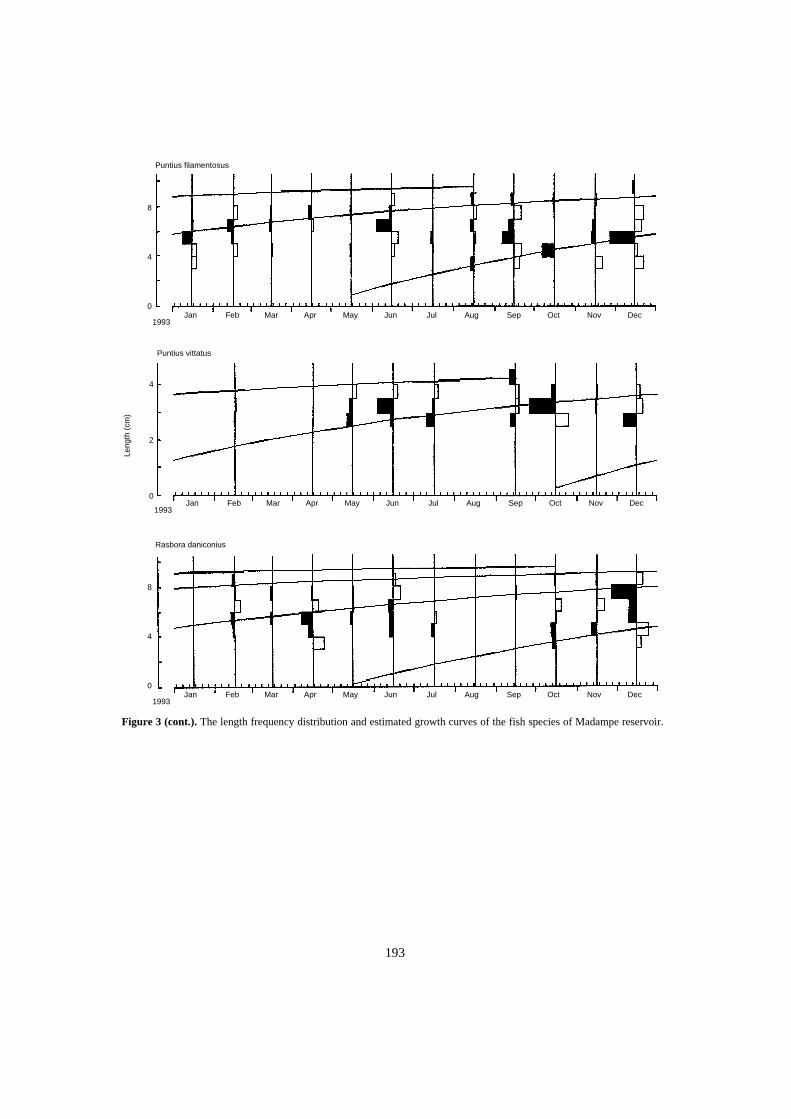
193
Figure 3 (cont.). The length frequency distribution and estimated growth curves of the fish species of Madampe reservoir.
Puntius filamentosus
Jan Feb Mar Apr May Jun Jul Aug Sep Oct Nov Dec1993
8
4
0
Leng
th (
cm)
Puntius vittatus
Jan Feb Mar Apr May Jun Jul Aug Sep Oct Nov Dec1993
4
2
0
Rasbora daniconius
Jan Feb Mar Apr May Jun Jul Aug Sep Oct Nov Dec1993
8
4
0

194
Figure 4. The length frequency distribution and estimated growth curves of the fish species of Lunuwila reservoir.
Amblypharyngodon melettinus
Jan Feb Mar Apr May Jun Jul Aug Sep Oct Nov Dec1993
8
6
4
2
0
Leng
th (
cm)
Esomus thermoicos
Jan Feb Mar Apr May Jun Jul Aug Sep Oct Nov Dec1993
8
6
4
2
0
Puntius vittatus
Jan Feb Mar Apr May Jun Jul Aug Sep Oct Nov Dec1993
4
2
0
Rasbora daniconius
Jan Feb Mar Apr May Jun Jul Aug Sep Oct Nov Dec1993
8
4
0
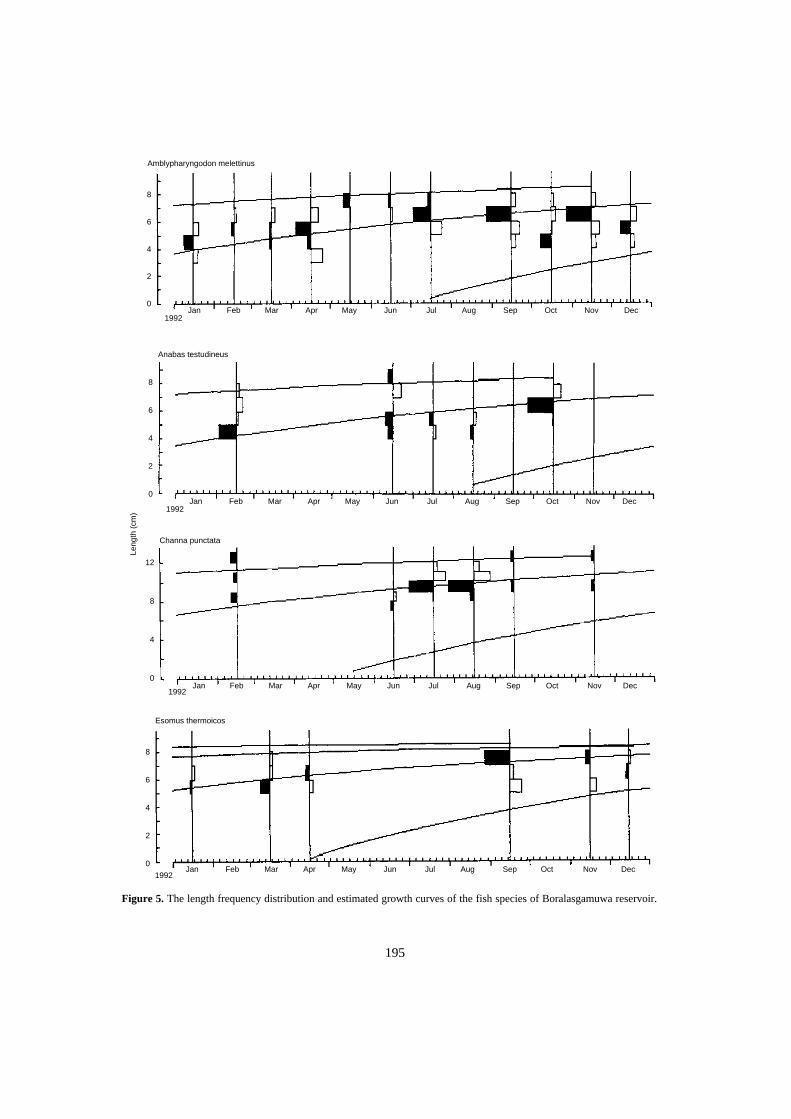
195
Figure 5. The length frequency distribution and estimated growth curves of the fish species of Boralasgamuwa reservoir.
Amblypharyngodon melettinus
Jan Feb Mar Apr May Jun Jul Aug Sep Oct Nov Dec1992
8
6
4
2
0
Leng
th (
cm)
Anabas testudineus
Jan Feb Mar Apr May Jun Jul Aug Sep Oct Nov Dec1992
8
6
4
2
0
Channa punctata
Jan Feb Mar Apr May Jun Jul Aug Sep Oct Nov Dec1992
12
8
4
0
Esomus thermoicos
Jan Feb Mar Apr May Jun Jul Aug Sep Oct Nov Dec1992
8
6
4
2
0
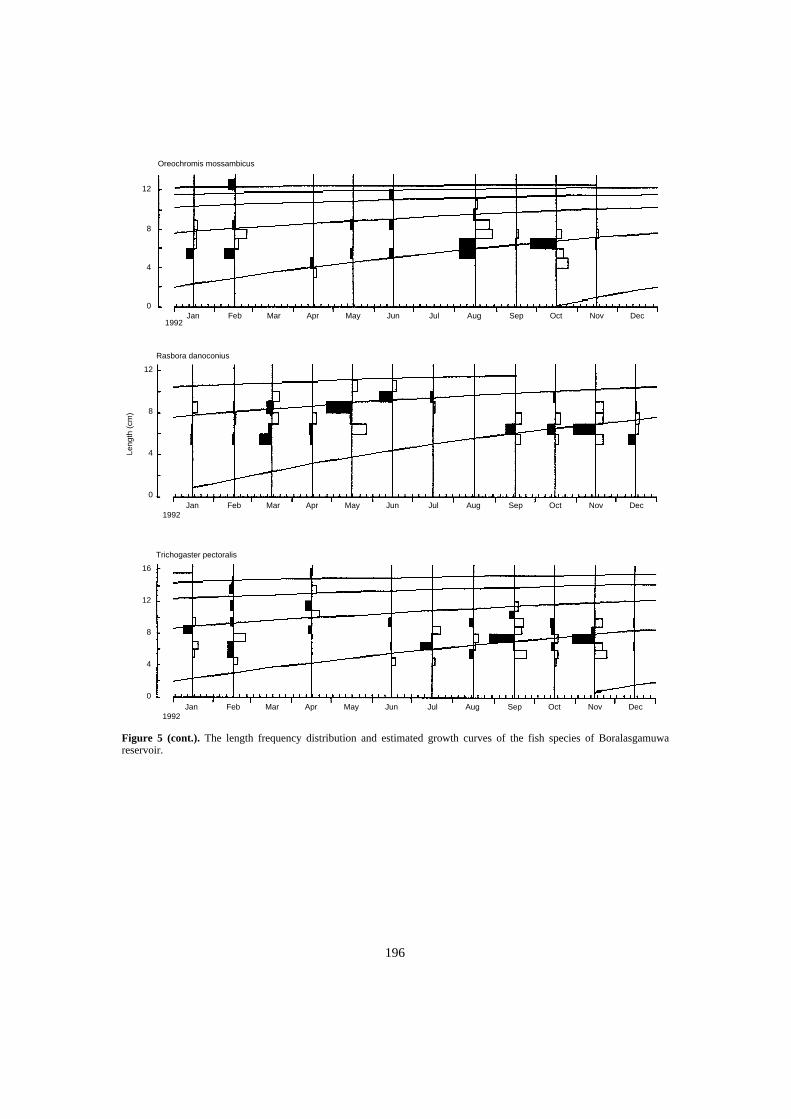
196
Figure 5 (cont.). The length frequency distribution and estimated growth curves of the fish species of Boralasgamuwareservoir.
Oreochromis mossambicus
Jan Feb Mar Apr May Jun Jul Aug Sep Oct Nov Dec1992
12
8
4
0
Leng
th (
cm)
Rasbora danoconius
Jan Feb Mar Apr May Jun Jul Aug Sep Oct Nov Dec1992
12
8
4
0
Trichogaster pectoralis
Jan Feb Mar Apr May Jun Jul Aug Sep Oct Nov Dec1992
16
12
8
4
0

197
Figure 6. The length frequency distribution and estimated growth curves of the fish species of Mattegoda reservoir.
Oreochromis mossambicus
Jan Feb Mar Apr May Jun Jul Aug Sep Oct Nov Dec1993
12
8
4
0
Leng
th (
cm)
Amblypharyngodon melettinus
Jan Feb Mar Apr May Jun Jul Aug Sep Oct Nov Dec1993
8
6
4
2
0
Puntius vittatus
Jan Feb Mar Apr May Jun Jul Aug Sep Oct Nov Dec1993
4
2
0
Rasbora daniconius
Jan Feb Mar Apr May Jun Jul Aug Sep Oct Nov Dec1993
8
4
0
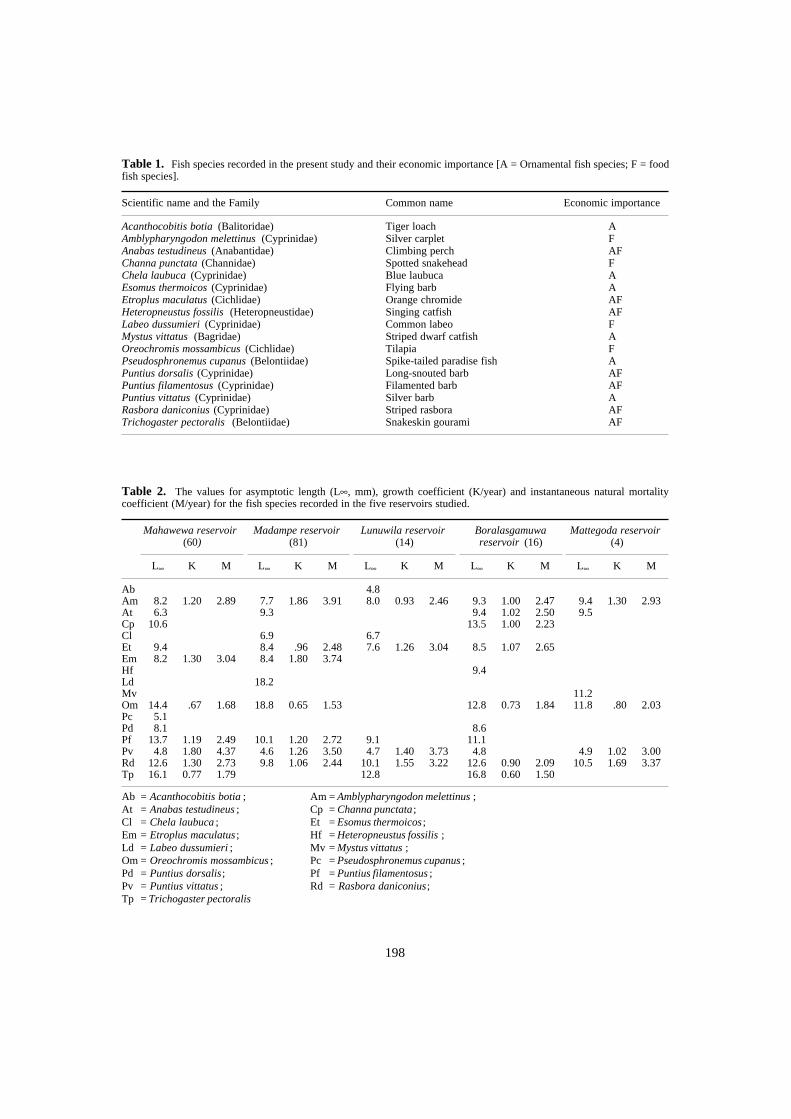
198
Ab = Acanthocobitis botia ; Am = Amblypharyngodon melettinus ; At = Anabas testudineus ; Cp = Channa punctata ; Cl = Chela laubuca ; Et = Esomus thermoicos ; Em = Etroplus maculatus ; Hf = Heteropneustus fossilis ; Ld = Labeo dussumieri ; Mv = Mystus vittatus ; Om = Oreochromis mossambicus ; Pc = Pseudosphronemus cupanus ; Pd = Puntius dorsalis; Pf = Puntius filamentosus ; Pv = Puntius vittatus ; Rd = Rasbora daniconius;Tp = Trichogaster pectoralis
Table 1. Fish species recorded in the present study and their economic importance [A = Ornamental fish species; F = foodfish species].
Scientific name and the Family Common name Economic importance
Acanthocobitis botia (Balitoridae)Amblypharyngodon melettinus (Cyprinidae)Anabas testudineus (Anabantidae)Channa punctata (Channidae)Chela laubuca (Cyprinidae)Esomus thermoicos (Cyprinidae)Etroplus maculatus (Cichlidae)Heteropneustus fossilis (Heteropneustidae)Labeo dussumieri (Cyprinidae)Mystus vittatus (Bagridae)Oreochromis mossambicus (Cichlidae)Pseudosphronemus cupanus (Belontiidae)Puntius dorsalis (Cyprinidae)Puntius filamentosus (Cyprinidae)Puntius vittatus (Cyprinidae)Rasbora daniconius (Cyprinidae)Trichogaster pectoralis (Belontiidae)
Tiger loachSilver carpletClimbing perchSpotted snakeheadBlue laubucaFlying barbOrange chromideSinging catfishCommon labeoStriped dwarf catfishTilapiaSpike-tailed paradise fishLong-snouted barbFilamented barbSilver barbStriped rasboraSnakeskin gourami
AFAFFAAAFAFFAFAAFAFAAFAF
Table 2. The values for asymptotic length (L∞, mm), growth coefficient (K/year) and instantaneous natural mortalitycoefficient (M/year) for the fish species recorded in the five reservoirs studied.
Mahawewa reservoir (60)
Madampe reservoir (81)
Lunuwila reservoir (14)
Boralasgamuwa reservoir (16)
Mattegoda reservoir (4)
L∞ K M L∞ K M L∞ K M L∞ K M L∞ K M
Ab 4.8Am 8.2 1.20 2.89 7.7 1.86 3.91 8.0 0.93 2.46 9.3 1.00 2.47 9.4 1.30 2.93At 6.3 9.3 9.4 1.02 2.50 9.5Cp 10.6 13.5 1.00 2.23Cl 6.9 6.7Et 9.4 8.4 .96 2.48 7.6 1.26 3.04 8.5 1.07 2.65Em 8.2 1.30 3.04 8.4 1.80 3.74Hf 9.4Ld 18.2Mv 11.2Om 14.4 .67 1.68 18.8 0.65 1.53 12.8 0.73 1.84 11.8 .80 2.03Pc 5.1Pd 8.1 8.6Pf 13.7 1.19 2.49 10.1 1.20 2.72 9.1 11.1Pv 4.8 1.80 4.37 4.6 1.26 3.50 4.7 1.40 3.73 4.8 4.9 1.02 3.00Rd 12.6 1.30 2.73 9.8 1.06 2.44 10.1 1.55 3.22 12.6 0.90 2.09 10.5 1.69 3.37Tp 16.1 0.77 1.79 12.8 16.8 0.60 1.50
199
Discussion
The values for asymptotic length of five fish speciesrecorded in the present study are considerably lowerthan the maximum lengths recently recorded forthese species in other regions of the country (Pethi-yagoda 1991). These species are A. testudineus, H.fossilis, L. dussumieri, O. mossambicus and P.dorsalis. Records indicate that O. mossambicus, themain contributor to inland fish production in SriLanka (Amarasinghe 1994), usually grows up to35 cmTL (Pethiyagoda 1991). However, in thepresent study the highest value recorded for L∞ forthis species was 18.8 cm in Madampe reservoir,which is the largest among the five reservoirsstudied. According to FishBase information, L∞values in the range obtained in the present studyhave been reported from aquaculture tanks andponds in Thailand, USA and Zambia while thosereported for Parakrama Samudra and Pimburettewareservoir stocks in Sri Lanka, 34.9–40.6 cm and39.3 cm respectively (Amarasinghe 1987) were con-siderable higher than those estimated in the presentstudy.
Although the L∞ value recorded for L. dussumieriis 18.2 cm, this species is reported to reach a size of40 cm in total length in Sri Lanka (Pethiyagoda1991). Similarly, A. testudineus, H. fossilis and P.dorsalis are reported to reach sizes of 15 cm, 30 cmand 25 cm respectively (Pethiyagoda 1991) althoughin the present study, the L∞ values of these specieswere estimated to be less than 10 cm. The L∞ valuesestimated for the other 12 species recorded in thepresent study were either very close to or slightlyabove the maximum lengths recorded by Pethiya-goda (1991).
The K values estimated for O. mossambicus werehigher than those recorded in FishBase data for thisspecies in Parakrama Samudra and Pimburettewareservoirs (Amarasinghe 1987). Closer values forthose recorded in this study have been reported inFishBase data for this species in fish ponds in Egyptand De Hoop Vlei and Doorndrai Dams in SouthAfrica. The K values recorded in FishBase data forH. fossilis are considerably lower than the value esti-mated in the present study. Most fish species areomnivorous, aquatic macrophytes and detritus beingtheir major food items (Wijeyaratne and Perera1999). Aquatic macrophytes and detritus are highlyabundant in these reservoirs (Wijeyaratne and Perera1999).
Since no fishing is carried out in these reservoirsthe fish are subject to natural mortality only. Thelowest M values in the present study were recordedfor O. mossambicus and T. pectoralis. However,even these values were very much higher than those
recorded for O. mossambicus in Pimburettewa(Amarasinghe 1987) and Parakrama Samudra reser-voirs (Amarasinghe 1988b).
The main reason for the high natural mortalityobserved in the present study may be the highgrowth rate coupled with the small size of the fish.High K and M values also indicate that these fishhave high turnover rates or production per biomass(P:B) ratios.
Among fish, natural mortality is found to bepositively correlated with reproductive success(Gunderson 1997). High growth rates, small asymp-totic lengths and high natural mortality indicate thatthe fish species in these reservoirs mature early inlife and have a small life span, as stated by Sparreand Venema (1992).
If M is high, fish soon reach the age where lossdue to natural mortality exceeds the gain in biomassdue to growth. Therefore, fishing mortality should behigh to catch the fish before they die of naturalcauses (Sparre and Venema 1992). Fish populationsare considered to be under optimal exploitation whenfishing mortality equals natural mortality. Hence, itappears that the fish populations in these reservoirscould be subjected to heavy fishing mortality as theirnatural mortalities are high. The results of this studytherefore indicate a high biological potential todevelop capture fisheries in these reservoirs. How-ever, since these reservoirs are very close to marinefish landing sites and in urban areas where marinefish are readily available, the exploitation of thesefish as food may not be economically viable. Thereis a high potential to exploit the resource for orna-mental purposes, at present a rapidly growingindustry in Sri Lanka.
Acknowledgments
The financial support provided by Natural ResourcesEnergy and Science Authority of Sri Lanka (presentlyNational Science Foundation, Sri Lanka) (ResearchGrant No: RG/90/WW/1) is gratefully acknowledged.The authors also wish to thank Professor U.S. Amar-asinghe of the Department of Zoology, University ofKelaniya, for his useful suggestions and commentsand help in the preparation of Figures and Ms K.R.D.Padminie of the Office of the Dean/Faculty of Scienceof the University of Kelaniya for secretarialassistance.
References
Amarasinghe, U.S. 1987. Status of the fishery of Pimburet-tewa Wewa, a man-made lake in Sri Lanka. Aquacultureand Fisheries Management, 18: 375–385.

200
—— 1988. Empirical determination of a desirable meshsize for the gill net fishery of Oreochromis mossambicus(Peters) in a man made lake in Sri Lanka. Asian Fish-eries Science, 2: 59–69.
—— 1994. A Synthesis on the management of the capturefisheries of Sri Lankan perennial reservoirs. VidyodayaJournal of Science, 5 (1): 23–40.
Gayanilo, F.C. Jr., Sparre, P and Pauly, D. 1996. The FAO-ICLARM Stock Assessment Tools (FiSAT) User’sGuide. FAO Computerised Information Series (Fisheries)No. 8. FAO, Rome, 126 p.
Gunderson, D.R. 1997. Trade off between reproductiveeffort and adult survival in oviparous and viviparousfishes. Canadian Journal of Fisheries and AquaticScience, 54: 990–995.
Moreau, J. 1987. Mathematical and biological expression ofgrowth in fish: recent trends and future developments.In: Summerfelt, R.C. and Hall, G.E. ed. Age and Growthof Fish, Iowa State University Press. Ames, Iowa, 81–113.
Munro, I.S.R. 1955. Marine and Freshwater Fishes ofCeylon, Department of External Affairs, Canberra,Australia, 349 p.
NARA 1998. Sri Lanka Fisheries Year Book. 1997.National Aquatic Resources Research and DevelopmentAgency, Sri lanka. 81 p.
NARA 1999. Sri Lanka Fisheries Year Book, 1998.National Aquatic Resources Research and DevelopmentAgency, Sri Lanka. NARA-SED-FY-Vol. 2. 56 p.
Pauly, D. 1980. On the interrelationships between naturalmortality, growth parameters and mean environmentaltemperature in 175 fish stocks. J. Cons. CIEM. 29(2):179–192.
Pethiyagoda, R. 1991. Freshwater Fish of Sri Lanka. WorldHeritage Trust. Colombo, Sri Lanka, 362 p.
Sparre, P. and Venema, S.C. 1992. Introduction to TropicalFish Stock Assessment. Part 1. Manual, FAO FisheriesTechnical Paper No. 306/1. FAO, Rome, 376 p.
Wijeyaratne, M.J.S. and Perera, W.M.D.S.K. 1999. Studieson the feasibility of using indigenous fish to controlaquatic macrophytes in Sri Lanka. Journal of Aqua-culture in the Tropics (in press).
201
Trophic Relationships and Possible Evolution of the Production under Various Fisheries Management Strategies
in a Sri Lankan Reservoir
J. Moreau1, M.C. Villanueva1, U.S. Amarasinghe2 and F. Schiemer3
Abstract
The ECOPATH trophic model has been used to describe an extensive study of the trophicrelationships of Parakrama Samudra reservoir, Sri Lanka, during the 1970s. It has supportedpreliminary assessments made regarding the importance of unexploited fish stocks and canpossibly provide the link to understanding the further evolution of the lake under various fisheriesmanagement schemes.
IN SRI LANKA for a long time, reservoir fisherieshave been characterised by high levels of production(Moreau and De Silva 1990) and by the dominance ofOreochromis mossambicus (Peters), an Africancichlid fish introduced in 1952 (De Silva 1985, 1988;Welcomme 1988). It was only after the investigationsreported by Schiemer (1983) and by Newrkla andDuncan (1983) on the Parakrama Samudra reservoirthat the possible importance of autochthonous smallfish species has been recognised (De Silva andSirisena 1987; Sirisena and De Silva 1989). Further,the possible competition and ecological overlapexisting in terms of habitat and food availabilitybetween the introduced and native populations havebeen considered (Pet and Piet 1993; Piet and Guruge1997). The present contribution deals with an ancientman-made lake, which has been highly documented(the Parakrama Samudra reservoir).
This study aims to provide a quantitative descrip-tion of the ecosystem as it appeared during the bulkof the field work reported by Schiemer in 1983 and
to show how such an analysis contributes to the iden-tification and significance of unexploited fish stocks.Attempts to evaluate the ecological overlap in termsof food partioning can possibly link and provide anexplanation for the evolution of the fish communityduring the 1980s and the 1990s, following the devel-opment of smal-mesh gill-netting.
This contribution is not only expected to help inthe investigation and understanding of adaptivemechanisms that might have contributed to therecent evolution observed and recorded on other SriLankan reservoirs, but also to aid in understandingthose same mechanisms in other Asian countries byidentifying bottlenecks, i.e. research to be specifi-cally carried out for that purpose.
The Parakrama Samudra reservoir
The Parakrama Samudra reservoir (Figure 1), (latitude10°45′N, longitude 35°20′E, altitude 212 m above sealevel (m.a.s.l.). and area of approximately 25 km2), isa shallow (average depth at maximum water level 5 mand maximum depth 12 m) and eutrophic reservoircreated by damming the Ambang Ganga, in the dryzone of Sri Lanka, about 150 km east of Colombo(Schiemer 1983). The reservoir is drawn down yearlyto 206 m.a.s.l. Parakrama Samudra is an ‘open waterreservoir’ with a distinct pelagic zone. The dam wasclosed centuries ago. The reservoir is divided bychains of islands into three basins and even at highwater levels, these three basins keep a distinct limno-logical identity.
1Dept. of Inland Fisheries, I.N.P./E.N.S.A.T., BP 107Auzeville Tolosane 31 326 CASTANET TOLOSAN France2Department of Zoology, Kelaniya University, Kelanyia,Sri Lanka3Department of Zoology, The University of Vienna, A 1010Vienna, Austria
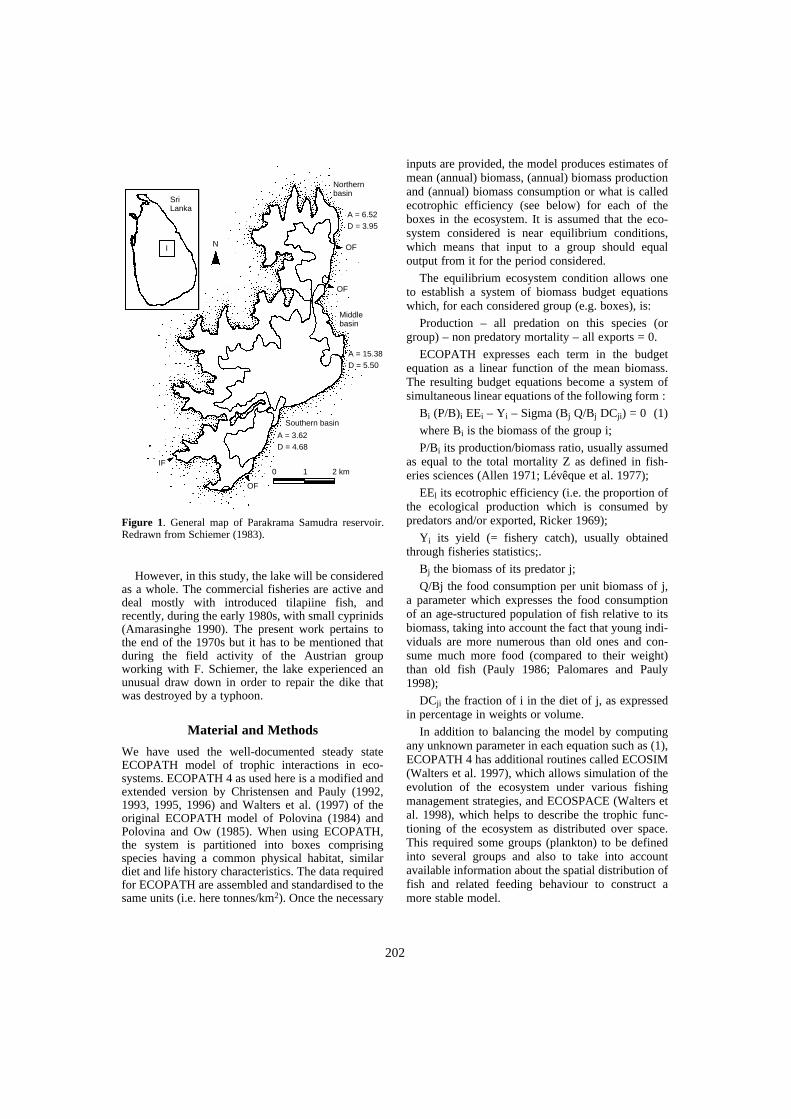
202
Figure 1. General map of Parakrama Samudra reservoir.Redrawn from Schiemer (1983).
However, in this study, the lake will be consideredas a whole. The commercial fisheries are active anddeal mostly with introduced tilapiine fish, andrecently, during the early 1980s, with small cyprinids(Amarasinghe 1990). The present work pertains tothe end of the 1970s but it has to be mentioned thatduring the field activity of the Austrian groupworking with F. Schiemer, the lake experienced anunusual draw down in order to repair the dike thatwas destroyed by a typhoon.
Material and Methods
We have used the well-documented steady stateECOPATH model of trophic interactions in eco-systems. ECOPATH 4 as used here is a modified andextended version by Christensen and Pauly (1992,1993, 1995, 1996) and Walters et al. (1997) of theoriginal ECOPATH model of Polovina (1984) andPolovina and Ow (1985). When using ECOPATH,the system is partitioned into boxes comprisingspecies having a common physical habitat, similardiet and life history characteristics. The data requiredfor ECOPATH are assembled and standardised to thesame units (i.e. here tonnes/km2). Once the necessary
inputs are provided, the model produces estimates ofmean (annual) biomass, (annual) biomass productionand (annual) biomass consumption or what is calledecotrophic efficiency (see below) for each of theboxes in the ecosystem. It is assumed that the eco-system considered is near equilibrium conditions,which means that input to a group should equaloutput from it for the period considered.
The equilibrium ecosystem condition allows oneto establish a system of biomass budget equationswhich, for each considered group (e.g. boxes), is:
Production – all predation on this species (orgroup) – non predatory mortality – all exports = 0.
ECOPATH expresses each term in the budgetequation as a linear function of the mean biomass.The resulting budget equations become a system ofsimultaneous linear equations of the following form :
Bi (P/B)i EEi – Yi – Sigma (Bj Q/Bj DCji) = 0 (1)
where Bi is the biomass of the group i;
P/Bi its production/biomass ratio, usually assumedas equal to the total mortality Z as defined in fish-eries sciences (Allen 1971; Lévêque et al. 1977);
EEl its ecotrophic efficiency (i.e. the proportion ofthe ecological production which is consumed bypredators and/or exported, Ricker 1969);
Yi its yield (= fishery catch), usually obtainedthrough fisheries statistics;.
Bj the biomass of its predator j;
Q/Bj the food consumption per unit biomass of j,a parameter which expresses the food consumptionof an age-structured population of fish relative to itsbiomass, taking into account the fact that young indi-viduals are more numerous than old ones and con-sume much more food (compared to their weight)than old fish (Pauly 1986; Palomares and Pauly1998);
DCji the fraction of i in the diet of j, as expressedin percentage in weights or volume.
In addition to balancing the model by computingany unknown parameter in each equation such as (1),ECOPATH 4 has additional routines called ECOSIM(Walters et al. 1997), which allows simulation of theevolution of the ecosystem under various fishingmanagement strategies, and ECOSPACE (Walters etal. 1998), which helps to describe the trophic func-tioning of the ecosystem as distributed over space.This required some groups (plankton) to be definedinto several groups and also to take into accountavailable information about the spatial distribution offish and related feeding behaviour to construct amore stable model.
SriLanka
Northernbasin
A = 6.52D = 3.95
N OF
OF
Middlebasin
A = 15.38D = 5.50
Southern basin
A = 3.62D = 4.68
0 1 2 km
OF
IF
I
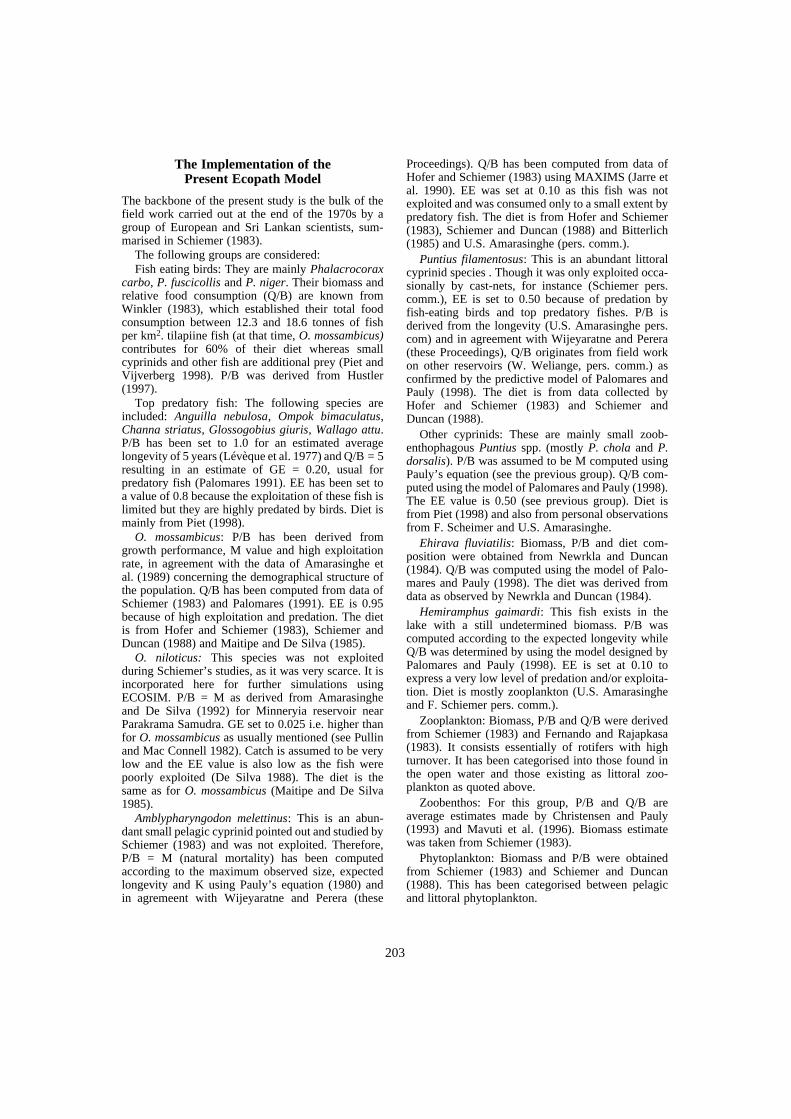
203
The Implementation of the Present Ecopath Model
The backbone of the present study is the bulk of thefield work carried out at the end of the 1970s by agroup of European and Sri Lankan scientists, sum-marised in Schiemer (1983).
The following groups are considered:Fish eating birds: They are mainly Phalacrocorax
carbo, P. fuscicollis and P. niger. Their biomass andrelative food consumption (Q/B) are known fromWinkler (1983), which established their total foodconsumption between 12.3 and 18.6 tonnes of fishper km2. tilapiine fish (at that time, O. mossambicus)contributes for 60% of their diet whereas smallcyprinids and other fish are additional prey (Piet andVijverberg 1998). P/B was derived from Hustler(1997).
Top predatory fish: The following species areincluded: Anguilla nebulosa, Ompok bimaculatus,Channa striatus, Glossogobius giuris, Wallago attu.P/B has been set to 1.0 for an estimated averagelongevity of 5 years (Lévèque et al. 1977) and Q/B = 5resulting in an estimate of GE = 0.20, usual forpredatory fish (Palomares 1991). EE has been set toa value of 0.8 because the exploitation of these fish islimited but they are highly predated by birds. Diet ismainly from Piet (1998).
O. mossambicus: P/B has been derived fromgrowth performance, M value and high exploitationrate, in agreement with the data of Amarasinghe etal. (1989) concerning the demographical structure ofthe population. Q/B has been computed from data ofSchiemer (1983) and Palomares (1991). EE is 0.95because of high exploitation and predation. The dietis from Hofer and Schiemer (1983), Schiemer andDuncan (1988) and Maitipe and De Silva (1985).
O. niloticus: This species was not exploitedduring Schiemer’s studies, as it was very scarce. It isincorporated here for further simulations usingECOSIM. P/B = M as derived from Amarasingheand De Silva (1992) for Minneryia reservoir nearParakrama Samudra. GE set to 0.025 i.e. higher thanfor O. mossambicus as usually mentioned (see Pullinand Mac Connell 1982). Catch is assumed to be verylow and the EE value is also low as the fish werepoorly exploited (De Silva 1988). The diet is thesame as for O. mossambicus (Maitipe and De Silva1985).
Amblypharyngodon melettinus: This is an abun-dant small pelagic cyprinid pointed out and studied bySchiemer (1983) and was not exploited. Therefore,P/B = M (natural mortality) has been computedaccording to the maximum observed size, expectedlongevity and K using Pauly’s equation (1980) andin agremeent with Wijeyaratne and Perera (these
Proceedings). Q/B has been computed from data ofHofer and Schiemer (1983) using MAXIMS (Jarre etal. 1990). EE was set at 0.10 as this fish was notexploited and was consumed only to a small extent bypredatory fish. The diet is from Hofer and Schiemer(1983), Schiemer and Duncan (1988) and Bitterlich(1985) and U.S. Amarasinghe (pers. comm.).
Puntius filamentosus: This is an abundant littoralcyprinid species . Though it was only exploited occa-sionally by cast-nets, for instance (Schiemer pers.comm.), EE is set to 0.50 because of predation byfish-eating birds and top predatory fishes. P/B isderived from the longevity (U.S. Amarasinghe pers.com) and in agreement with Wijeyaratne and Perera(these Proceedings), Q/B originates from field workon other reservoirs (W. Weliange, pers. comm.) asconfirmed by the predictive model of Palomares andPauly (1998). The diet is from data collected byHofer and Schiemer (1983) and Schiemer andDuncan (1988).
Other cyprinids: These are mainly small zoob-enthophagous Puntius spp. (mostly P. chola and P.dorsalis). P/B was assumed to be M computed usingPauly’s equation (see the previous group). Q/B com-puted using the model of Palomares and Pauly (1998).The EE value is 0.50 (see previous group). Diet isfrom Piet (1998) and also from personal observationsfrom F. Scheimer and U.S. Amarasinghe.
Ehirava fluviatilis: Biomass, P/B and diet com-position were obtained from Newrkla and Duncan(1984). Q/B was computed using the model of Palo-mares and Pauly (1998). The diet was derived fromdata as observed by Newrkla and Duncan (1984).
Hemiramphus gaimardi: This fish exists in thelake with a still undetermined biomass. P/B wascomputed according to the expected longevity whileQ/B was determined by using the model designed byPalomares and Pauly (1998). EE is set at 0.10 toexpress a very low level of predation and/or exploita-tion. Diet is mostly zooplankton (U.S. Amarasingheand F. Schiemer pers. comm.).
Zooplankton: Biomass, P/B and Q/B were derivedfrom Schiemer (1983) and Fernando and Rajapkasa(1983). It consists essentially of rotifers with highturnover. It has been categorised into those found inthe open water and those existing as littoral zoo-plankton as quoted above.
Zoobenthos: For this group, P/B and Q/B areaverage estimates made by Christensen and Pauly(1993) and Mavuti et al. (1996). Biomass estimatewas taken from Schiemer (1983).
Phytoplankton: Biomass and P/B were obtainedfrom Schiemer (1983) and Schiemer and Duncan(1988). This has been categorised between pelagicand littoral phytoplankton.
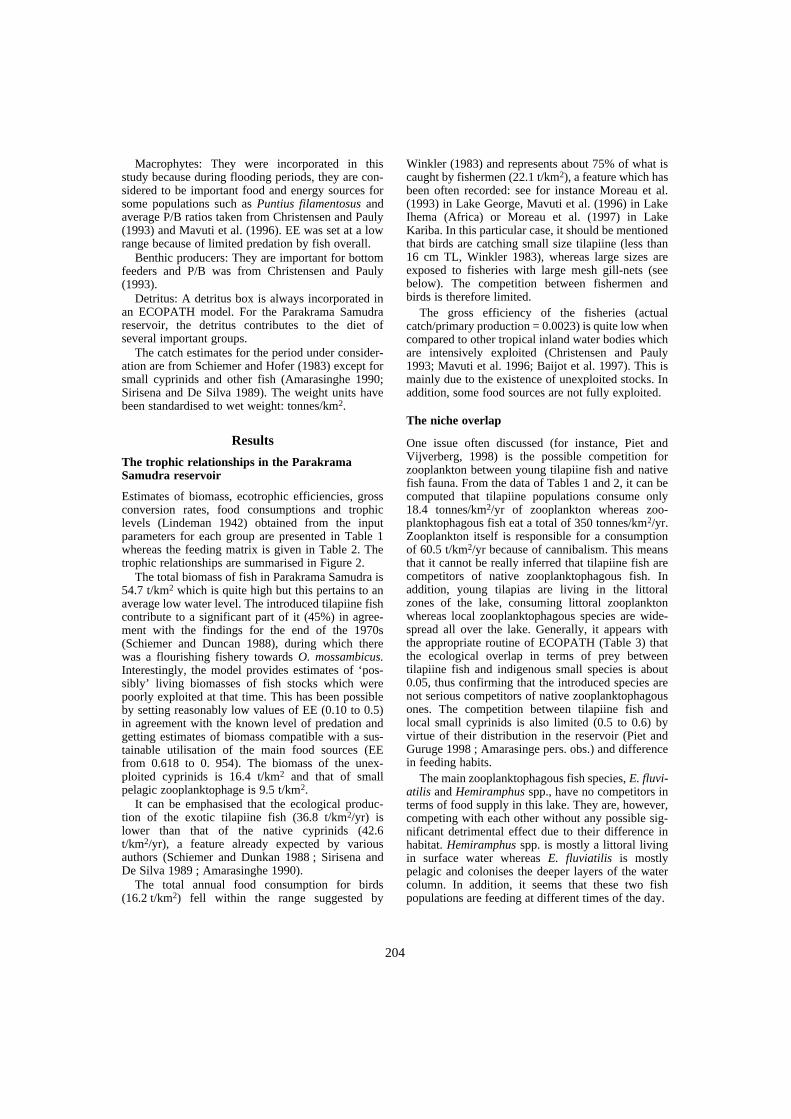
204
Macrophytes: They were incorporated in thisstudy because during flooding periods, they are con-sidered to be important food and energy sources forsome populations such as Puntius filamentosus andaverage P/B ratios taken from Christensen and Pauly(1993) and Mavuti et al. (1996). EE was set at a lowrange because of limited predation by fish overall.
Benthic producers: They are important for bottomfeeders and P/B was from Christensen and Pauly(1993).
Detritus: A detritus box is always incorporated inan ECOPATH model. For the Parakrama Samudrareservoir, the detritus contributes to the diet ofseveral important groups.
The catch estimates for the period under consider-ation are from Schiemer and Hofer (1983) except forsmall cyprinids and other fish (Amarasinghe 1990;Sirisena and De Silva 1989). The weight units havebeen standardised to wet weight: tonnes/km2.
Results
The trophic relationships in the Parakrama Samudra reservoir
Estimates of biomass, ecotrophic efficiencies, grossconversion rates, food consumptions and trophiclevels (Lindeman 1942) obtained from the inputparameters for each group are presented in Table 1whereas the feeding matrix is given in Table 2. Thetrophic relationships are summarised in Figure 2.
The total biomass of fish in Parakrama Samudra is54.7 t/km2 which is quite high but this pertains to anaverage low water level. The introduced tilapiine fishcontribute to a significant part of it (45%) in agree-ment with the findings for the end of the 1970s(Schiemer and Duncan 1988), during which therewas a flourishing fishery towards O. mossambicus.Interestingly, the model provides estimates of ‘pos-sibly’ living biomasses of fish stocks which werepoorly exploited at that time. This has been possibleby setting reasonably low values of EE (0.10 to 0.5)in agreement with the known level of predation andgetting estimates of biomass compatible with a sus-tainable utilisation of the main food sources (EEfrom 0.618 to 0. 954). The biomass of the unex-ploited cyprinids is 16.4 t/km2 and that of smallpelagic zooplanktophage is 9.5 t/km2.
It can be emphasised that the ecological produc-tion of the exotic tilapiine fish (36.8 t/km2/yr) islower than that of the native cyprinids (42.6t/km2/yr), a feature already expected by variousauthors (Schiemer and Dunkan 1988 ; Sirisena andDe Silva 1989 ; Amarasinghe 1990).
The total annual food consumption for birds(16.2 t/km2) fell within the range suggested by
Winkler (1983) and represents about 75% of what iscaught by fishermen (22.1 t/km2), a feature which hasbeen often recorded: see for instance Moreau et al.(1993) in Lake George, Mavuti et al. (1996) in LakeIhema (Africa) or Moreau et al. (1997) in LakeKariba. In this particular case, it should be mentionedthat birds are catching small size tilapiine (less than16 cm TL, Winkler 1983), whereas large sizes areexposed to fisheries with large mesh gill-nets (seebelow). The competition between fishermen andbirds is therefore limited.
The gross efficiency of the fisheries (actualcatch/primary production = 0.0023) is quite low whencompared to other tropical inland water bodies whichare intensively exploited (Christensen and Pauly1993; Mavuti et al. 1996; Baijot et al. 1997). This ismainly due to the existence of unexploited stocks. Inaddition, some food sources are not fully exploited.
The niche overlap
One issue often discussed (for instance, Piet andVijverberg, 1998) is the possible competition forzooplankton between young tilapiine fish and nativefish fauna. From the data of Tables 1 and 2, it can becomputed that tilapiine populations consume only18.4 tonnes/km2/yr of zooplankton whereas zoo-planktophagous fish eat a total of 350 tonnes/km2/yr.Zooplankton itself is responsible for a consumptionof 60.5 t/km2/yr because of cannibalism. This meansthat it cannot be really inferred that tilapiine fish arecompetitors of native zooplanktophagous fish. Inaddition, young tilapias are living in the littoralzones of the lake, consuming littoral zooplanktonwhereas local zooplanktophagous species are wide-spread all over the lake. Generally, it appears withthe appropriate routine of ECOPATH (Table 3) thatthe ecological overlap in terms of prey betweentilapiine fish and indigenous small species is about0.05, thus confirming that the introduced species arenot serious competitors of native zooplanktophagousones. The competition between tilapiine fish andlocal small cyprinids is also limited (0.5 to 0.6) byvirtue of their distribution in the reservoir (Piet andGuruge 1998 ; Amarasinge pers. obs.) and differencein feeding habits.
The main zooplanktophagous fish species, E. fluvi-atilis and Hemiramphus spp., have no competitors interms of food supply in this lake. They are, however,competing with each other without any possible sig-nificant detrimental effect due to their difference inhabitat. Hemiramphus spp. is mostly a littoral livingin surface water whereas E. fluviatilis is mostlypelagic and colonises the deeper layers of the watercolumn. In addition, it seems that these two fishpopulations are feeding at different times of the day.
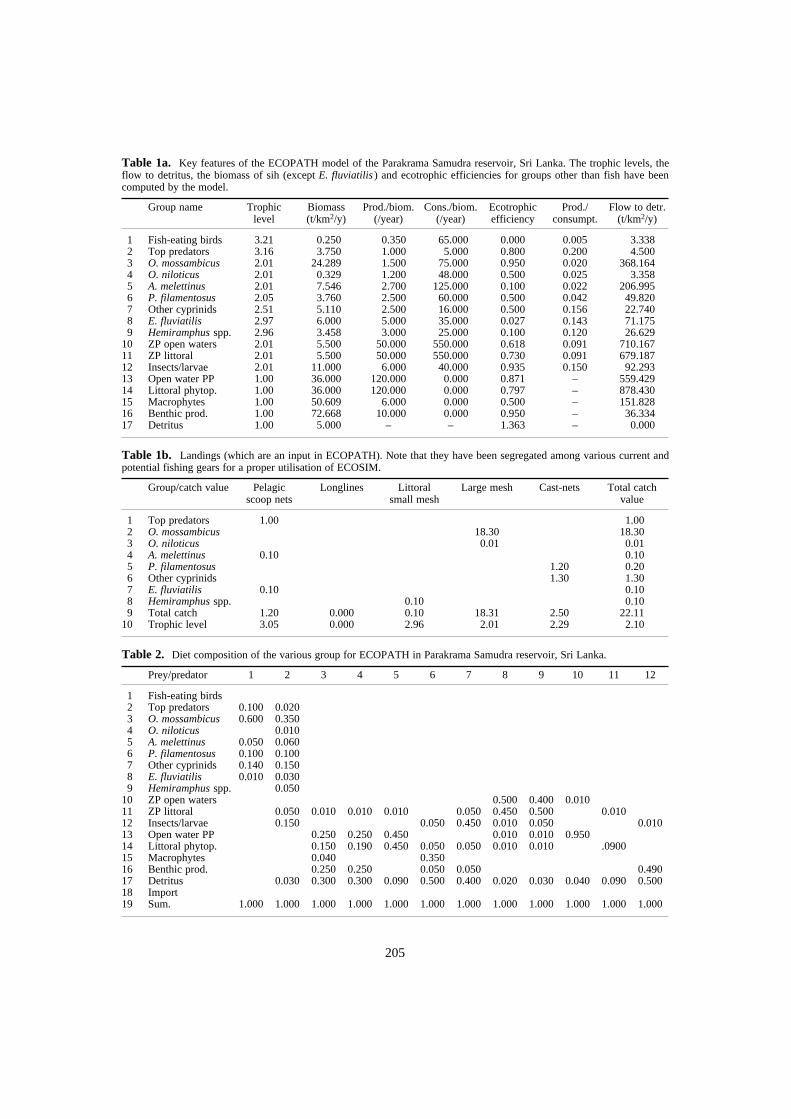
205
Table 1a. Key features of the ECOPATH model of the Parakrama Samudra reservoir, Sri Lanka. The trophic levels, theflow to detritus, the biomass of sih (except E. fluviatilis ) and ecotrophic efficiencies for groups other than fish have beencomputed by the model.
Group name Trophiclevel
Biomass(t/km2/y)
Prod./biom.(/year)
Cons./biom.(/year)
Ecotrophicefficiency
Prod./consumpt.
Flow to detr.(t/km2/y)
1 Fish-eating birds 3.21 0.250 0.350 65.000 0.000 0.005 3.3382 Top predators 3.16 3.750 1.000 5.000 0.800 0.200 4.5003 O. mossambicus 2.01 24.289 1.500 75.000 0.950 0.020 368.1644 O. niloticus 2.01 0.329 1.200 48.000 0.500 0.025 3.3585 A. melettinus 2.01 7.546 2.700 125.000 0.100 0.022 206.9956 P. filamentosus 2.05 3.760 2.500 60.000 0.500 0.042 49.8207 Other cyprinids 2.51 5.110 2.500 16.000 0.500 0.156 22.7408 E. fluviatilis 2.97 6.000 5.000 35.000 0.027 0.143 71.1759 Hemiramphus spp. 2.96 3.458 3.000 25.000 0.100 0.120 26.629
10 ZP open waters 2.01 5.500 50.000 550.000 0.618 0.091 710.16711 ZP littoral 2.01 5.500 50.000 550.000 0.730 0.091 679.18712 Insects/larvae 2.01 11.000 6.000 40.000 0.935 0.150 92.29313 Open water PP 1.00 36.000 120.000 0.000 0.871 – 559.42914 Littoral phytop. 1.00 36.000 120.000 0.000 0.797 – 878.43015 Macrophytes 1.00 50.609 6.000 0.000 0.500 – 151.82816 Benthic prod. 1.00 72.668 10.000 0.000 0.950 – 36.33417 Detritus 1.00 5.000 – – 1.363 – 0.000
Table 1b. Landings (which are an input in ECOPATH). Note that they have been segregated among various current andpotential fishing gears for a proper utilisation of ECOSIM.
Group/catch value Pelagic scoop nets
Longlines Littoral small mesh
Large mesh Cast-nets Total catch value
1 Top predators 1.00 1.002 O. mossambicus 18.30 18.303 O. niloticus 0.01 0.014 A. melettinus 0.10 0.105 P. filamentosus 1.20 0.206 Other cyprinids 1.30 1.307 E. fluviatilis 0.10 0.108 Hemiramphus spp. 0.10 0.109 Total catch 1.20 0.000 0.10 18.31 2.50 22.11
10 Trophic level 3.05 0.000 2.96 2.01 2.29 2.10
Table 2. Diet composition of the various group for ECOPATH in Parakrama Samudra reservoir, Sri Lanka.
Prey/predator 1 2 3 4 5 6 7 8 9 10 11 12
1 Fish-eating birds2 Top predators 0.100 0.0203 O. mossambicus 0.600 0.3504 O. niloticus 0.0105 A. melettinus 0.050 0.0606 P. filamentosus 0.100 0.1007 Other cyprinids 0.140 0.1508 E. fluviatilis 0.010 0.0309 Hemiramphus spp. 0.050
10 ZP open waters 0.500 0.400 0.01011 ZP littoral 0.050 0.010 0.010 0.010 0.050 0.450 0.500 0.01012 Insects/larvae 0.150 0.050 0.450 0.010 0.050 0.01013 Open water PP 0.250 0.250 0.450 0.010 0.010 0.95014 Littoral phytop. 0.150 0.190 0.450 0.050 0.050 0.010 0.010 .090015 Macrophytes 0.040 0.35016 Benthic prod. 0.250 0.250 0.050 0.050 0.49017 Detritus 0.030 0.300 0.300 0.090 0.500 0.400 0.020 0.030 0.040 0.090 0.50018 Import19 Sum. 1.000 1.000 1.000 1.000 1.000 1.000 1.000 1.000 1.000 1.000 1.000 1.000
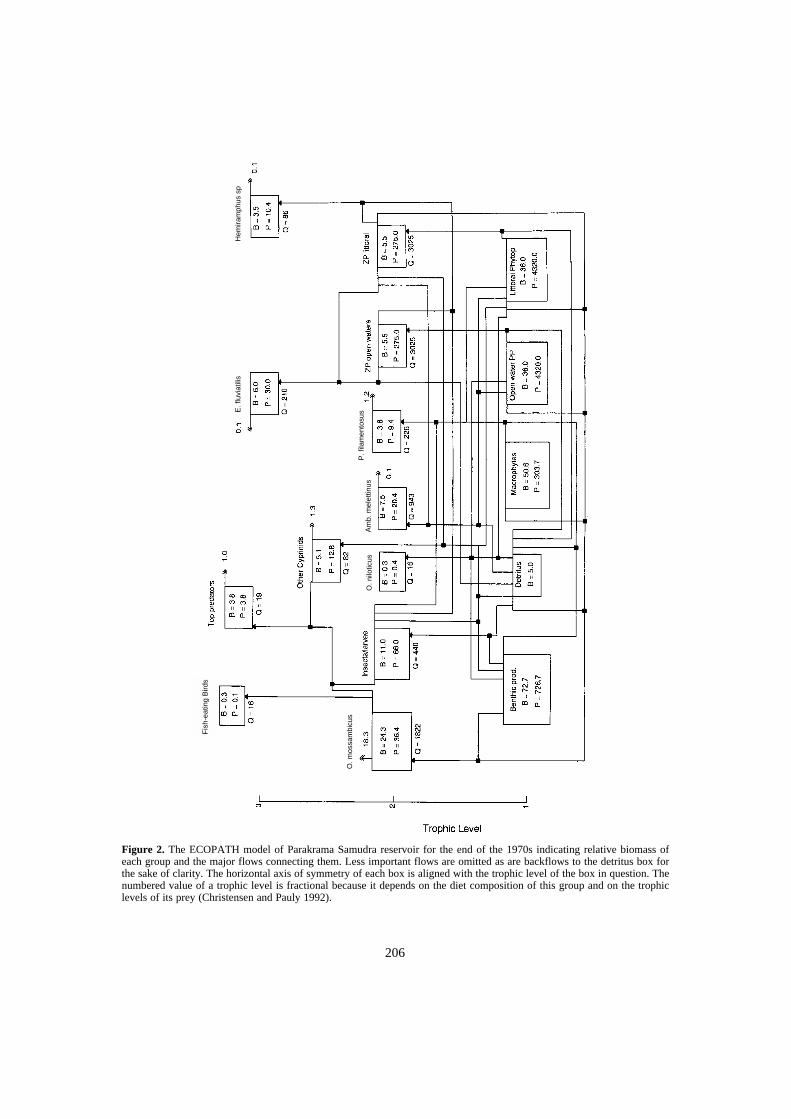
206
Figure 2. The ECOPATH model of Parakrama Samudra reservoir for the end of the 1970s indicating relative biomass ofeach group and the major flows connecting them. Less important flows are omitted as are backflows to the detritus box forthe sake of clarity. The horizontal axis of symmetry of each box is aligned with the trophic level of the box in question. Thenumbered value of a trophic level is fractional because it depends on the diet composition of this group and on the trophiclevels of its prey (Christensen and Pauly 1992).
O. m
ossa
mbi
cus
O. n
ilotic
usA
mb.
mel
ettin
usP
. fila
men
tosu
sE. f
luvi
atili
sH
emira
mph
us s
p
Fis
h-ea
ting
Bird
s
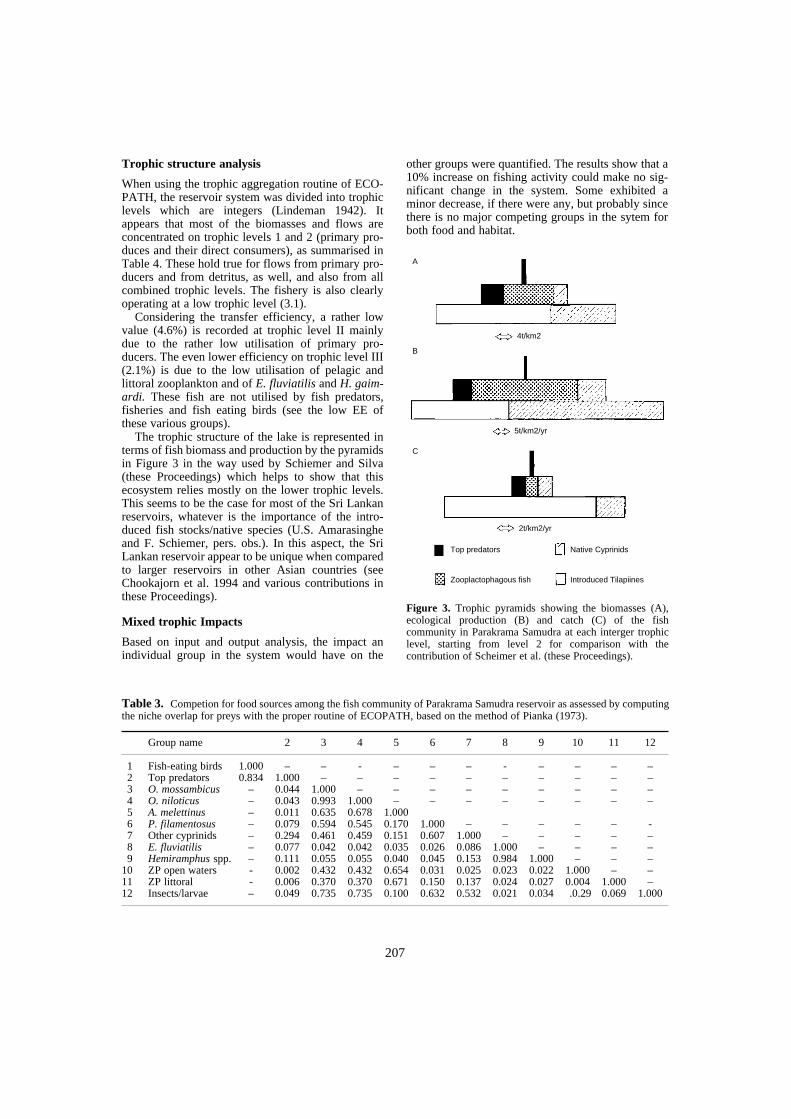
207
Trophic structure analysis
When using the trophic aggregation routine of ECO-PATH, the reservoir system was divided into trophiclevels which are integers (Lindeman 1942). Itappears that most of the biomasses and flows areconcentrated on trophic levels 1 and 2 (primary pro-duces and their direct consumers), as summarised inTable 4. These hold true for flows from primary pro-ducers and from detritus, as well, and also from allcombined trophic levels. The fishery is also clearlyoperating at a low trophic level (3.1).
Considering the transfer efficiency, a rather lowvalue (4.6%) is recorded at trophic level II mainlydue to the rather low utilisation of primary pro-ducers. The even lower efficiency on trophic level III(2.1%) is due to the low utilisation of pelagic andlittoral zooplankton and of E. fluviatilis and H. gaim-ardi. These fish are not utilised by fish predators,fisheries and fish eating birds (see the low EE ofthese various groups).
The trophic structure of the lake is represented interms of fish biomass and production by the pyramidsin Figure 3 in the way used by Schiemer and Silva(these Proceedings) which helps to show that thisecosystem relies mostly on the lower trophic levels.This seems to be the case for most of the Sri Lankanreservoirs, whatever is the importance of the intro-duced fish stocks/native species (U.S. Amarasingheand F. Schiemer, pers. obs.). In this aspect, the SriLankan reservoir appear to be unique when comparedto larger reservoirs in other Asian countries (seeChookajorn et al. 1994 and various contributions inthese Proceedings).
Mixed trophic Impacts
Based on input and output analysis, the impact anindividual group in the system would have on the
other groups were quantified. The results show that a10% increase on fishing activity could make no sig-nificant change in the system. Some exhibited aminor decrease, if there were any, but probably sincethere is no major competing groups in the sytem forboth food and habitat.
Figure 3. Trophic pyramids showing the biomasses (A),ecological production (B) and catch (C) of the fishcommunity in Parakrama Samudra at each interger trophiclevel, starting from level 2 for comparison with thecontribution of Scheimer et al. (these Proceedings).
A
B
C
4t/km2
5t/km2/yr
2t/km2/yr
Top predators
Zooplactophagous fish
Native Cyprinids
Introduced Tilapiines
Table 3. Competion for food sources among the fish community of Parakrama Samudra reservoir as assessed by computingthe niche overlap for preys with the proper routine of ECOPATH, based on the method of Pianka (1973).
Group name 2 3 4 5 6 7 8 9 10 11 12
1 Fish-eating birds 1.000 – – - – – – - – – – –2 Top predators 0.834 1.000 – – – – – – – – – –3 O. mossambicus – 0.044 1.000 – – – – – – – – –4 O. niloticus – 0.043 0.993 1.000 – – – – – – – –5 A. melettinus – 0.011 0.635 0.678 1.0006 P. filamentosus – 0.079 0.594 0.545 0.170 1.000 – – – – – -7 Other cyprinids – 0.294 0.461 0.459 0.151 0.607 1.000 – – – – –8 E. fluviatilis – 0.077 0.042 0.042 0.035 0.026 0.086 1.000 – – – –9 Hemiramphus spp. – 0.111 0.055 0.055 0.040 0.045 0.153 0.984 1.000 – – –
10 ZP open waters - 0.002 0.432 0.432 0.654 0.031 0.025 0.023 0.022 1.000 – –11 ZP littoral - 0.006 0.370 0.370 0.671 0.150 0.137 0.024 0.027 0.004 1.000 –12 Insects/larvae – 0.049 0.735 0.735 0.100 0.632 0.532 0.021 0.034 .0.29 0.069 1.000
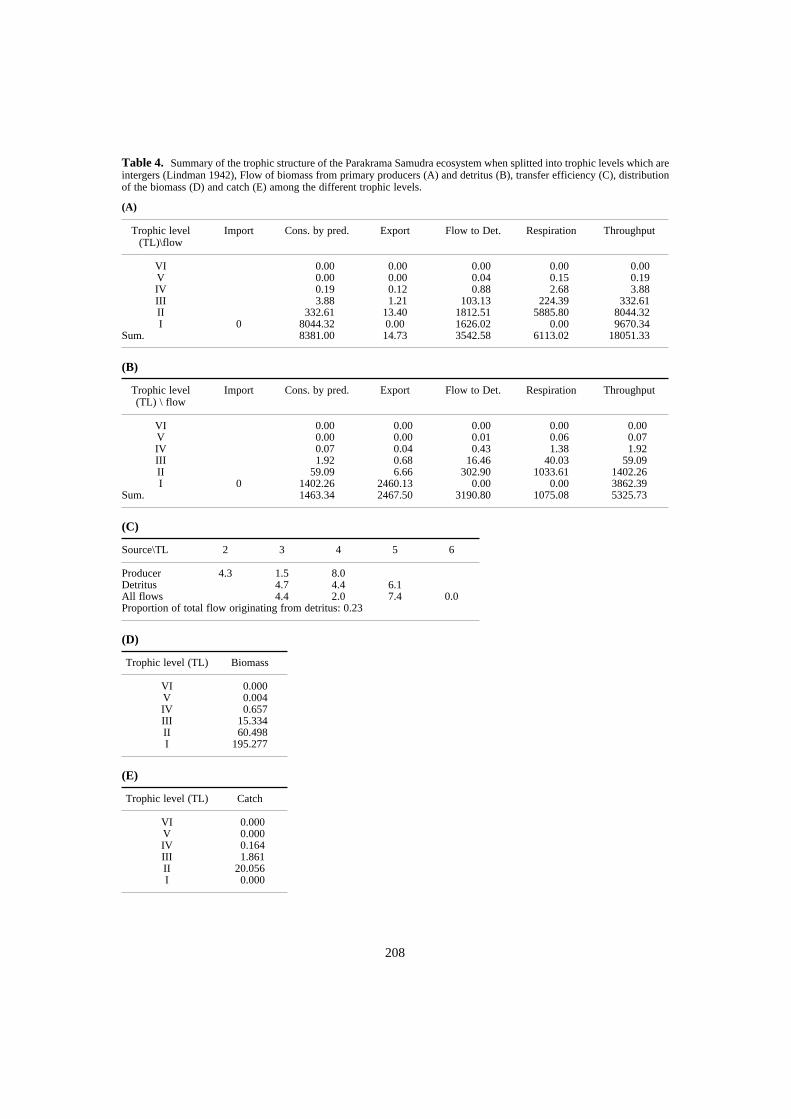
208
(B)
(C)
(D)
(E)
Table 4. Summary of the trophic structure of the Parakrama Samudra ecosystem when splitted into trophic levels which areintergers (Lindman 1942), Flow of biomass from primary producers (A) and detritus (B), transfer efficiency (C), distributionof the biomass (D) and catch (E) among the different trophic levels.
(A)
Trophic level(TL)\flow
Import Cons. by pred. Export Flow to Det. Respiration Throughput
VI 0.00 0.00 0.00 0.00 0.00V 0.00 0.00 0.04 0.15 0.19IV 0.19 0.12 0.88 2.68 3.88III 3.88 1.21 103.13 224.39 332.61II 332.61 13.40 1812.51 5885.80 8044.32I 0 8044.32 0.00 1626.02 0.00 9670.34
Sum. 8381.00 14.73 3542.58 6113.02 18051.33
Trophic level(TL) \ flow
Import Cons. by pred. Export Flow to Det. Respiration Throughput
VI 0.00 0.00 0.00 0.00 0.00V 0.00 0.00 0.01 0.06 0.07IV 0.07 0.04 0.43 1.38 1.92III 1.92 0.68 16.46 40.03 59.09II 59.09 6.66 302.90 1033.61 1402.26I 0 1402.26 2460.13 0.00 0.00 3862.39
Sum. 1463.34 2467.50 3190.80 1075.08 5325.73
Source\TL 2 3 4 5 6
Producer 4.3 1.5 8.0Detritus 4.7 4.4 6.1All flows 4.4 2.0 7.4 0.0Proportion of total flow originating from detritus: 0.23
Trophic level (TL) Biomass
VI 0.000V 0.004IV 0.657III 15.334II 60.498I 195.277
Trophic level (TL) Catch
VI 0.000V 0.000IV 0.164III 1.861II 20.056I 0.000
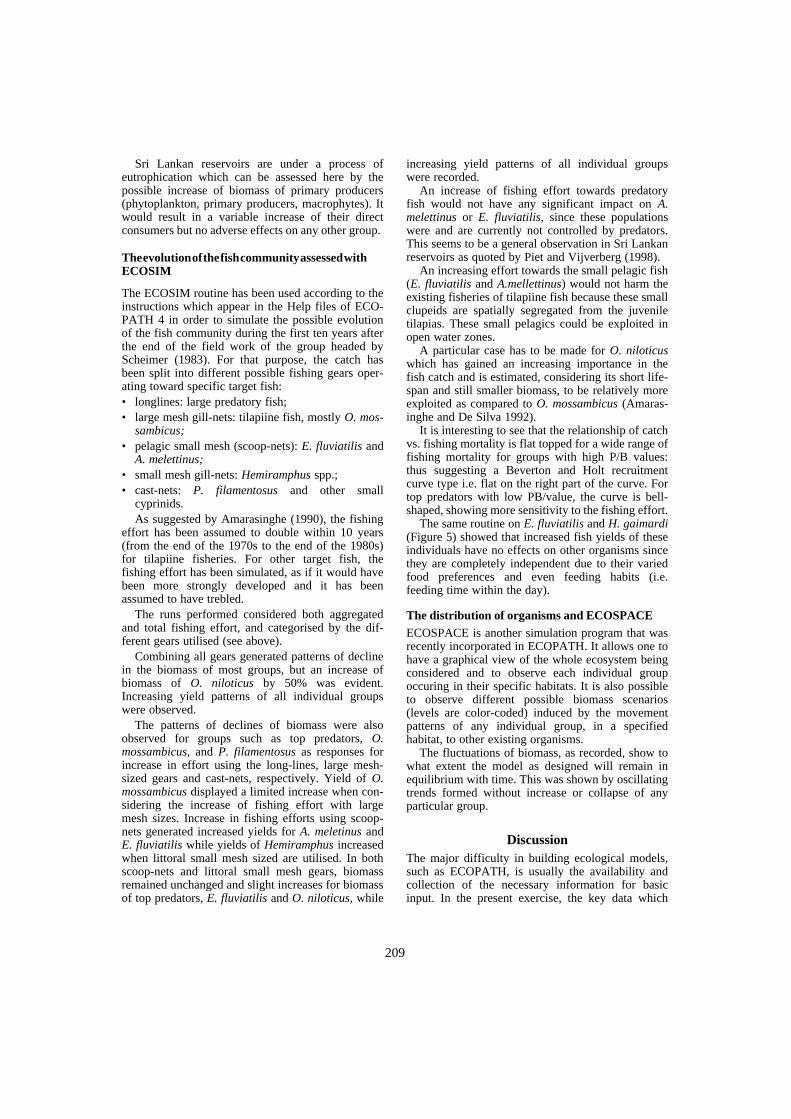
209
Sri Lankan reservoirs are under a process ofeutrophication which can be assessed here by thepossible increase of biomass of primary producers(phytoplankton, primary producers, macrophytes). Itwould result in a variable increase of their directconsumers but no adverse effects on any other group.
The evolution of the fish community assessed with ECOSIM
The ECOSIM routine has been used according to theinstructions which appear in the Help files of ECO-PATH 4 in order to simulate the possible evolutionof the fish community during the first ten years afterthe end of the field work of the group headed byScheimer (1983). For that purpose, the catch hasbeen split into different possible fishing gears oper-ating toward specific target fish: • longlines: large predatory fish;• large mesh gill-nets: tilapiine fish, mostly O. mos-
sambicus;• pelagic small mesh (scoop-nets): E. fluviatilis and
A. melettinus;• small mesh gill-nets: Hemiramphus spp.; • cast-nets: P. filamentosus and other small
cyprinids.As suggested by Amarasinghe (1990), the fishing
effort has been assumed to double within 10 years(from the end of the 1970s to the end of the 1980s)for tilapiine fisheries. For other target fish, thefishing effort has been simulated, as if it would havebeen more strongly developed and it has beenassumed to have trebled.
The runs performed considered both aggregatedand total fishing effort, and categorised by the dif-ferent gears utilised (see above).
Combining all gears generated patterns of declinein the biomass of most groups, but an increase ofbiomass of O. niloticus by 50% was evident.Increasing yield patterns of all individual groupswere observed.
The patterns of declines of biomass were alsoobserved for groups such as top predators, O.mossambicus, and P. filamentosus as responses forincrease in effort using the long-lines, large mesh-sized gears and cast-nets, respectively. Yield of O.mossambicus displayed a limited increase when con-sidering the increase of fishing effort with largemesh sizes. Increase in fishing efforts using scoop-nets generated increased yields for A. meletinus andE. fluviatilis while yields of Hemiramphus increasedwhen littoral small mesh sized are utilised. In bothscoop-nets and littoral small mesh gears, biomassremained unchanged and slight increases for biomassof top predators, E. fluviatilis and O. niloticus, while
increasing yield patterns of all individual groupswere recorded.
An increase of fishing effort towards predatoryfish would not have any significant impact on A.melettinus or E. fluviatilis, since these populationswere and are currently not controlled by predators.This seems to be a general observation in Sri Lankanreservoirs as quoted by Piet and Vijverberg (1998).
An increasing effort towards the small pelagic fish(E. fluviatilis and A.mellettinus) would not harm theexisting fisheries of tilapiine fish because these smallclupeids are spatially segregated from the juveniletilapias. These small pelagics could be exploited inopen water zones.
A particular case has to be made for O. niloticuswhich has gained an increasing importance in thefish catch and is estimated, considering its short life-span and still smaller biomass, to be relatively moreexploited as compared to O. mossambicus (Amaras-inghe and De Silva 1992).
It is interesting to see that the relationship of catchvs. fishing mortality is flat topped for a wide range offishing mortality for groups with high P/B values:thus suggesting a Beverton and Holt recruitmentcurve type i.e. flat on the right part of the curve. Fortop predators with low PB/value, the curve is bell-shaped, showing more sensitivity to the fishing effort.
The same routine on E. fluviatilis and H. gaimardi(Figure 5) showed that increased fish yields of theseindividuals have no effects on other organisms sincethey are completely independent due to their variedfood preferences and even feeding habits (i.e.feeding time within the day).
The distribution of organisms and ECOSPACE ECOSPACE is another simulation program that wasrecently incorporated in ECOPATH. It allows one tohave a graphical view of the whole ecosystem beingconsidered and to observe each individual groupoccuring in their specific habitats. It is also possibleto observe different possible biomass scenarios(levels are color-coded) induced by the movementpatterns of any individual group, in a specifiedhabitat, to other existing organisms.
The fluctuations of biomass, as recorded, show towhat extent the model as designed will remain inequilibrium with time. This was shown by oscillatingtrends formed without increase or collapse of anyparticular group.
DiscussionThe major difficulty in building ecological models,such as ECOPATH, is usually the availability andcollection of the necessary information for basicinput. In the present exercise, the key data which
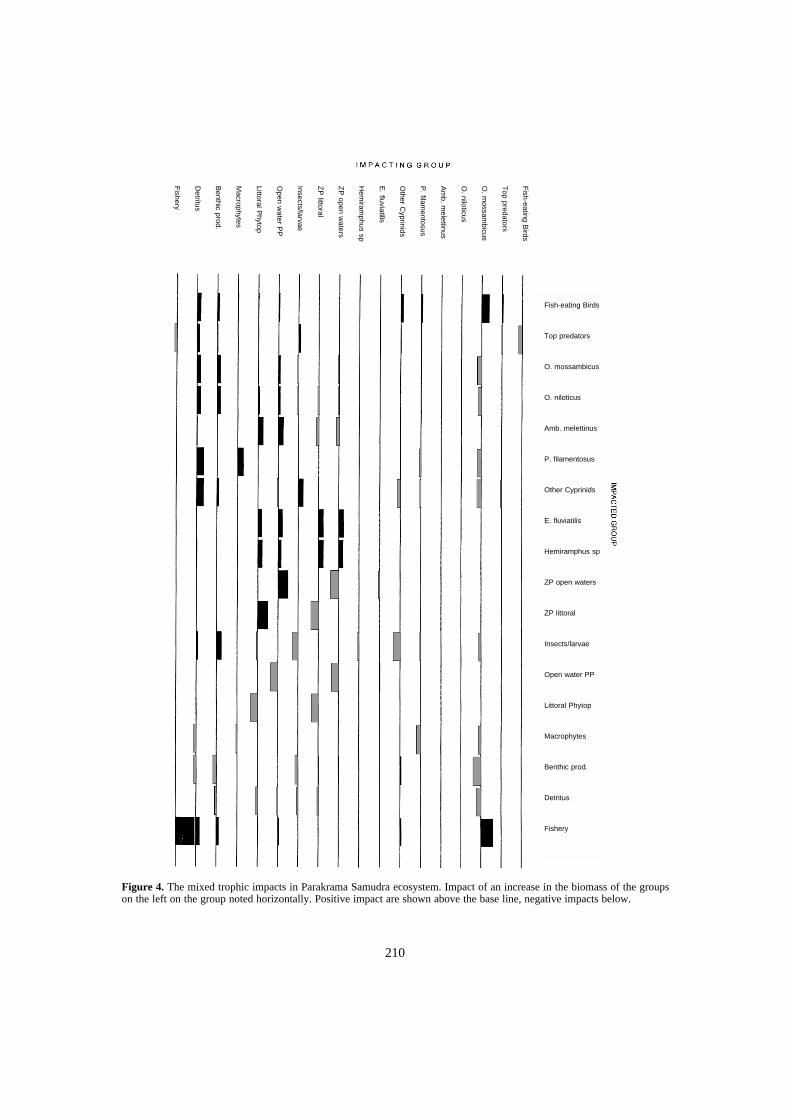
210
Figure 4. The mixed trophic impacts in Parakrama Samudra ecosystem. Impact of an increase in the biomass of the groupson the left on the group noted horizontally. Positive impact are shown above the base line, negative impacts below.
Fish-eating Birds
Top predators
O. mossambicus
O. niloticus
Amb. melettinus
P. filamentosus
Other Cyprinids
E. fluviatilis
Hemiramphus sp
ZP open waters
ZP littoral
Insects/larvae
Open water PP
Littoral Phytop
Macrophytes
Benthic prod.
Detritus
Fishery
Fish-eating B
irds
Top predators
O. m
ossambicus
O. niloticus
Am
b. melettinus
P. filam
entosus
Other C
yprinids
E. fluviatilis
Hem
iramphus sp
ZP
open waters
ZP
littoral
Insects/larvae
Open w
ater PP
Littoral Phytop
Macrophytes
Benthic prod.
Detritus
Fishery
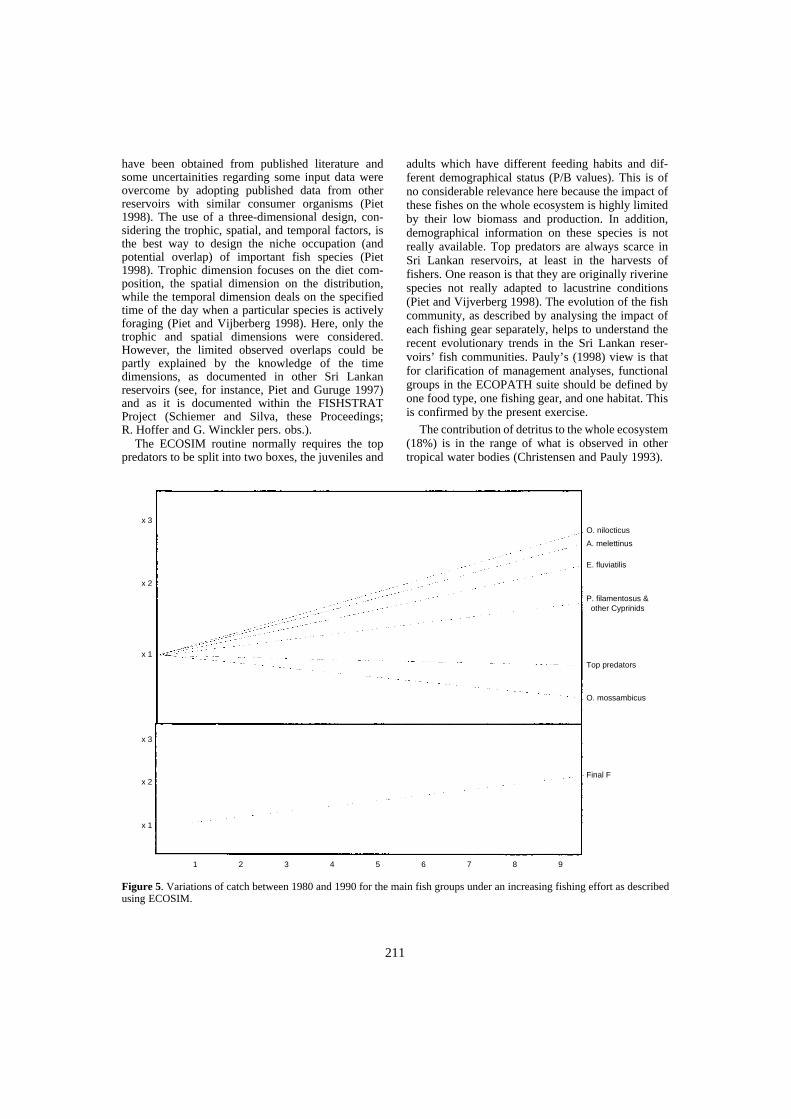
211
have been obtained from published literature andsome uncertainities regarding some input data wereovercome by adopting published data from otherreservoirs with similar consumer organisms (Piet1998). The use of a three-dimensional design, con-sidering the trophic, spatial, and temporal factors, isthe best way to design the niche occupation (andpotential overlap) of important fish species (Piet1998). Trophic dimension focuses on the diet com-position, the spatial dimension on the distribution,while the temporal dimension deals on the specifiedtime of the day when a particular species is activelyforaging (Piet and Vijberberg 1998). Here, only thetrophic and spatial dimensions were considered.However, the limited observed overlaps could bepartly explained by the knowledge of the timedimensions, as documented in other Sri Lankanreservoirs (see, for instance, Piet and Guruge 1997)and as it is documented within the FISHSTRATProject (Schiemer and Silva, these Proceedings;R. Hoffer and G. Winckler pers. obs.).
The ECOSIM routine normally requires the toppredators to be split into two boxes, the juveniles and
adults which have different feeding habits and dif-ferent demographical status (P/B values). This is ofno considerable relevance here because the impact ofthese fishes on the whole ecosystem is highly limitedby their low biomass and production. In addition,demographical information on these species is notreally available. Top predators are always scarce inSri Lankan reservoirs, at least in the harvests offishers. One reason is that they are originally riverinespecies not really adapted to lacustrine conditions(Piet and Vijverberg 1998). The evolution of the fishcommunity, as described by analysing the impact ofeach fishing gear separately, helps to understand therecent evolutionary trends in the Sri Lankan reser-voirs’ fish communities. Pauly’s (1998) view is thatfor clarification of management analyses, functionalgroups in the ECOPATH suite should be defined byone food type, one fishing gear, and one habitat. Thisis confirmed by the present exercise.
The contribution of detritus to the whole ecosystem(18%) is in the range of what is observed in othertropical water bodies (Christensen and Pauly 1993).
Figure 5. Variations of catch between 1980 and 1990 for the main fish groups under an increasing fishing effort as describedusing ECOSIM.
O. nilocticus
A. melettinus
E. fluviatilis
P. filamentosus & other Cyprinids
Top predators
O. mossambicus
Final F
x 3
x 2
x 1
x 3
x 2
x 1
1 92 3 4 5 6 7 8
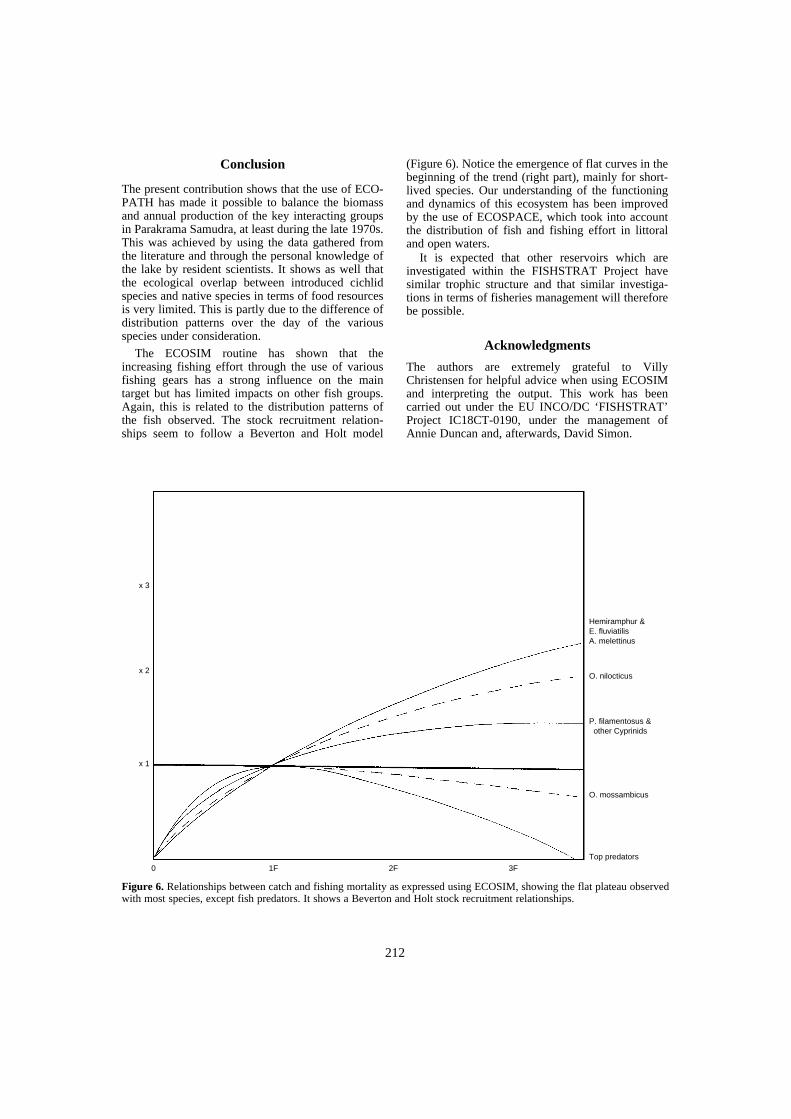
212
Conclusion
The present contribution shows that the use of ECO-PATH has made it possible to balance the biomassand annual production of the key interacting groupsin Parakrama Samudra, at least during the late 1970s.This was achieved by using the data gathered fromthe literature and through the personal knowledge ofthe lake by resident scientists. It shows as well thatthe ecological overlap between introduced cichlidspecies and native species in terms of food resourcesis very limited. This is partly due to the difference ofdistribution patterns over the day of the variousspecies under consideration.
The ECOSIM routine has shown that theincreasing fishing effort through the use of variousfishing gears has a strong influence on the maintarget but has limited impacts on other fish groups.Again, this is related to the distribution patterns ofthe fish observed. The stock recruitment relation-ships seem to follow a Beverton and Holt model
(Figure 6). Notice the emergence of flat curves in thebeginning of the trend (right part), mainly for short-lived species. Our understanding of the functioningand dynamics of this ecosystem has been improvedby the use of ECOSPACE, which took into accountthe distribution of fish and fishing effort in littoraland open waters.
It is expected that other reservoirs which areinvestigated within the FISHSTRAT Project havesimilar trophic structure and that similar investiga-tions in terms of fisheries management will thereforebe possible.
Acknowledgments
The authors are extremely grateful to VillyChristensen for helpful advice when using ECOSIMand interpreting the output. This work has beencarried out under the EU INCO/DC ‘FISHSTRAT’Project IC18CT-0190, under the management ofAnnie Duncan and, afterwards, David Simon.
Figure 6. Relationships between catch and fishing mortality as expressed using ECOSIM, showing the flat plateau observedwith most species, except fish predators. It shows a Beverton and Holt stock recruitment relationships.
O. nilocticus
P. filamentosus &other Cyprinids
Top predators
O. mossambicus
x 3
x 2
x 1
0 3F1F 2F
Hemiramphur &E. fluviatilisA. melettinus
213
References
Allen, K.R. 1971. Relation between production and bio-mass, Journal of the Fisheries Research Board ofCanada, 28:1573-1581.
Amarasinghe, U.S. 1990. Minor Cyprinids resources in aman made lake in Sri Lanka: a potential supplementarysource of income for fishermen. Fisheries Researh, 9:81–89.
Amarasinghe, U.S. and De Silva, S.S. 1992. Populationsdynamics of Oreochromis mossambicus and Oreo-chromis niloticus (Cichlidae) in two reservoirs in SriLanka. Asian Fisheries Sciences, 5: 37–61.
Amarasinghe, U.S., De Silva, S.S. and Moreau, J. 1989:Spatial changes in growth and mortality and their effecton the fisheries of Oreochromis mossambicus in a manmade lake in Sri Lanka. Asian Fisheries Sciences, 3:57–68.
Baijot, E., Moreau, J. and Zigani, R. 1997. Hydrobiologyand fisheries in small reservoirs of the Sahelian region.Publ. C.C.E. Brussels - C.T.A. Wageningen, The Nether-lands, 250 p.
Bitterlich, G. 1985. The nutrition of stomachless phyto-planktophagous fish in comparison with tilapia. Hydro-biologia, 121: 173–179.
Chookajorn, T., Leenanond, Y., Moreau, J. and Sricha-roendam, B. 1994. Evolution of trophic relationships inUbolratana reservoir (Thailand) as described using amultispecies trophic model. Asian Fisheries Sciences,7: 201–213.
Christensen, V. and Pauly, D. 1992. ECOPATH II a softwarefor balancing steady state ecosystems models and calcu-lating network characteristics. Ecological Modelling, 61:169–185.
—— (eds.). 1993. Trophic Models of Aquatic Ecosystems,ICLARM Conference Proceedings 26: 390 p.
—— 1995. Fish production, catches and the carryingcapacity of the world oceans. NAGA, The ICLARMQuartely, 18 (3): 34–40.
—— 1996. Ecological Modelling for all, NAGA, TheICLARM Quartely, 19(2): 25–26.
De Silva, S.S. 1985. Status of the introduced cichlidSarotherodon mossambicus (Peters) in the reservoirfishery of Sri Lanka: a management strategy and eco-logical implications. Aquaculture and Fisheries manage-ment, 1: 91–102.
De Silva, S.S. 1988. Reservoirs of Sri Lanka and theirfisheries. FAO Fisheries Technical Papers, 298: 128 p.Publ. FAO Rome
De Silva, S.S. and Sirisena, H.K.G. 1987. New fishresources of reservoirs in Sri Lanka, feasibility of intro-duction of a subsidiary gill-net fisheries for minorcyprinids. Fisheries Research, 6: 17–34.
Fernando, C.F. and Rajapkasa, R. 1983. Some remarks onlong-term and seasonal changes in the zooplankton ofParakrama Samudra. In: Schiemer, F. ed. 1983.Limnology of Parakrama Samudra, Sri Lanka, Develop-ments in Hydrobiology, Dr W. Junk Publisher, 77–84.
Hofer, R. and Schiemer, F. 1983. Feeding ecology; assimi-lation efficiency and energetics of two herbivorous fishSarotherodon mossambicus (Peters) and Puntius fila-mentosus (Cuvier and Valenciennes) In: Schiemer, F. ed.
1983. Limnology of Parakrama Samudra, Sri Lanka,Developments in Hydrobiology, Dr W. Junk Publisher,154–164
Hustler, K. 1997. The ecology of fish-eating birds and theirimpact on the inshore fisheries of Lake Kariba. In Moreau,J. (ed) Advances in the Ecology of Lake Kariba. Univer-sity of Zimbabwe Publications, Zimbabwe, 196–218.
Jarre, A., Palomares, M.L., Soriano, M.N., Sambilay, V.C.and Pauly, D. 1990. A User’s Manual for MAXIMS. Acomputer program for estimating food consumption offishes from diel stomach content data and populationparameters. ICLARM software 4. Publ. InternationalCenter for Living Aquatic Resources Management,Manila Philippines: 27 p.
Lévêque, C., Durand, J.R. and Ecoutin, J.M. 1977. Relationentre le rapport P/B et la longévité chez les organismes.Cahiers de l’ ORSTOM, série Hydrobiologie, 11: 17–32.
Lindeman, R.L. 1942. The trophic dynamic aspect ofecology. Ecology, 23: 399–418.
Maitipe, P. and De Silva, S.S. 1985. Switches betweenzoophagy, phytophagy and detritivory of Sarotherodonmossambicus (Peters) populations in twelve sri lankanman-made lakes. Journal of Fish Biology, 26: 49–61.
Mavuti, K., Moreau, J., Munyandorero, J. and Plisnier, P.D.1996. Trophic relationships in two shallow lakes ofAfrica, Lake Naivasha (Kenya) and Lake Ihema(Rwanda) comparison with Lake George. Hydrobiologia,321: 89–110.
Moreau, J. ed. 1997. Advances in the ecology of LakeKariba, Harare, Univ. Zimbabwe Publ. 270 p.
Moreau, J. 1999. The adaptation and impact on trophicrelationships of introduced cichlids in Southeast Asianlakes and reservoirs. In: van Densen, W.L.T. and Morris,M.J. eds. Fish and fisheries of lakes and reservoirs inSoutheast Asia and Africa. Westbury Publishing. Otley,UK, 207–228.
Moreau, J., Christensen, V. and Pauly, D. 1993. A trophicmodel for Lake George, Uganda. In: Christensen V. andPauly, D. eds. 1993. Trophic Models of Aquatic Eco-systems, ICLARM Conference Proceedings 26: 124–129.
Moreau, J. and De Silva, S.S. 1990. Predicting yield modelsfor lakes and reservoirs in Philippines, Sri Lanka andThailand. F.A.O. Fish. Tech. Pap. 319: 42 p.
Moreau, J., Cronberg, G., Games, I., Hustler, K., Kautsky,N., Kiibus, M., Machena, C. and Marshall, B. 1997. Bio-mass and flows in Lake Kariba: Towards an ecosystemapproach. In Moreau J. ed. 1997. Advances in theecology of Lake Kariba, Harare, Univ. Zimbabwe Publ.219–230.
Newrkla, P. and Duncan, A. 1984. The biology anddensity of Ehirava fluvialitis (clupeoid) in ParakramaSamudra. Verh. Internationale Vereinungen Limnology,22: 1572–1578.
Palomares, M.L. 1991. La consommation de nourriturechez les poissons; étude comparative, mise au point d’unmodèle prédictif et application à l’étude des réseauxtrophiques, Ph.D. Thesis, Institut National Polytechniquede Toulouse France, 210 pp.
Palomares, M.L. and Pauly, D. 1998. Predicting food con-sumption of fish populations as functions of mortality,food type, morphometrics, temperature and salinity.Marine and Freshwater Research, 49(5): 447–453.

214
Pauly, D. 1980. On the interrelationship between naturalmortality, growth parameters and the mean environ-mental temperature in 175 fish stocks. J. Cons. Explor.Mer., 39(3): 175–192.
Pauly, D. 1986. A simple method for estimating the food con-sumption of fish populations from growth data and foodconversion experiment. Fisheries Bulletin, 84: 827–839.
Pauly, D. ed. 1998. A workshop on Ecosim and EcospaceThe Fisheries Center, Univ. British Columbia, Vancouver,Canada var. pages.
Pet, J.S. and Piet, G.J. 1993. The consequences of habitatoccupation and habitat overlap of the introduced TilapiaOreochromis mossambicus and indigenous fish speciesfor fishery management in a Sri Lankan reservoir.Journal of Fish Biology, 43(A): 193–208.
Piet, G.J. and Guruge, W.A.H.P. 1997. Diel variation infeeding and vertical distribution of ten co-occuring fishspecies: consequences for resources partitioning.Environmental Biology of Fishes, 50: 293–307.
Piet, G.J. 1998. Impact of environmental perturbations on atropical fish community. Canadian Journal of Fisheriesand Aquatic Sciences, 55: 1842–1853.
Piet, G.J. and Vijverberg, J. 1998. An ecosystem perspec-tive for the management of a tropical reservoir fishery.International Revue der gesamten Hydrobiologie, specialissue.
Polovina, J.J. 1984. Model of a coral reef ecosystem. TheECOPATH model and its application to French FregateShoal. Coral Reefs, 3: 1–11.
Polovina, J.J. and Ow, M.D. 1985. An approach toestimating an ecosystem box model. Fisheries Bulletin,83: 457–460.
Pullin, R.S.V. and MacConnell, R.H. 1982. The biologyand culture of Tilapia. ICLARM Conference Proceed-ings 7, Publ. International Center for Living AquaticResources Management, Manila Philippines, 432 p.
Ricker, W.E. 1969. Food from the Sea. In: Resources andMan, A Study and Recommendations by the Committeeon Resources and Man (San francisco U.S.A., W.H.Treeman), 87–108.
Schiemer, F. ed. 1983. Limnology of Parakrama Samudra,Sri Lanka. Developments in Hydrobiology, Dr W. JunkPublisher, 150: 236 p.
Schiemer, F. and Duncan, A. 1988. The significance of theecosystem approach for reservoir management. In: deSilva, S.S. ed. Reservoir Ffisheries Management andDevelopment in Asia. Publ. IDRC Ottawa, Canada,183–194.
Schiemer, F. and Hofer, R. 1983. A contribution to theecology of the fish fauna from the Parakrama Samudrareservoir In: Schiemer, F. ed. 1983. Limnology ofParakrama Samudra, Sri Lanka. Developments inHydrobiology, Dr W. Junk Publisher, 150: 135–148.
Sirisena, H.K.G. and De Silva, S.S. 1989. New fishresources of reservoirs in Sri Lanka II: Further studies ona gill-net fishery for minor cyprinids. Fisheries Research,7: 17–29.
Walters, C., Christensen, V. and Pauly, D. 1997. Struc-turing dynamic models of exploited ecosystems fromtrophic mass balanced assessments. Review of Fishbiology and Fisheries, 7: 139–172.
Walters, C., Pauly, D. and Christensen, V. 1998. Ecospace,a software tool for predicting mesoscale spatial patters introphic realtionships of exploited ecosystems withspecial reference to impacts of marine protected areas.ICES Annual Conference
Welcomme, R.L. 1988. International introduction of inlandaquatic species. FAO Technical Paper, 249: 318 p. Publ.FAO, Rome.
Winkler, H. 1983. The ecology of cormorants (genusPhalacrocorax). In: Schiemer, F. ed. 1983. Limnologyof Parakrama Samudra, Sri Lanka. Developments inHydrobiology, Dr W. Junk Publisher, 150: 193–199.
215
Ecosystem Structure and Dynamics—A Management Basis for Asian Reservoirs and Lakes
F. Schiemer1, U.S. Amarasinghe2, J. Frouzova3, B. Sricharoendham4 and E.I.L. Silva5
Abstract
INCO-DC FISHSTRAT Project, funded by the European Commission, is an ongoing multi-disciplinary research program undertaken over the period 1998–2001. Three reservoirs in SriLanka (Victoria, Minneriya and Udawalawe) of different morphology, age and geographiclocation, Ubolratana reservoir, in Thailand, and Lake Taal, in the Philippines, are the object of thisstudy. The scope of the project encompasses a comparison of the limnology, fisheries and socio-economic aspects of local communities in order to determine whether the trophic characteristicsand key ecosystem processes sustain the available fisheries, and to examine the ecologicalpotential for increased fish production by intensive cage culture. The paper first presents integratedresults on trophic state, trophic structure and food web relationships of different water bodies. Theresults demonstrate the importance of ecosystem-orientated analysis in order to optimise manage-ment strategies. The broad spectrum of Asian water bodies studied allows testing of a set ofhypotheses on: 1) the control of the trophic state of lakes and reservoirs by geographic, climaticand morphometric conditions; 2) the significance of the structure of the fish assemblages (bio-geography, exotic species) on ecosystem processes; 3) bottom up versus top down control underAsian reservoir and lake conditions (in comparison to established concepts for water bodies in thetemperate zone); and 4) the human impact and resilience of ecosystem processes and trophicconditions towards human impact.
A COLLABORATIVE international project funded bythe European Union’s INCO-DC Program is under-taking research in five water bodies (four reservoirsand one lake) in Sri Lanka, Thailand and the Philip-pines over the period 1998–2001. The partner institu-tions within this Project are from the three Asian
countries, the United Kingdom, Austria, France, theNetherlands and the Czech Republic.
The program combines three main research fields:1. Ecosystem orientated limnological studies;2. Fisheries and fish communities;3. Socio-economics of the riparian fishing
communities.The aim of the program is to integrate the results
from the three fields and to define their interdepend-encies. The ecology of the reservoir ecosystemsdetermines the habitat quality and the carryingcapacity for fish and provides the basis for itsfisheries and local socio-economics. On the otherhand, there are top-down influences on the aquaticecosystems by fisheries management via exploita-tion, stocking practices, cage culture etc. and by thesocio-economics of the local communities via land-use practices. Also the regulation of the hydraulicregime for irrigation and hydroelectric power genera-tion, have profound impacts on the ecology of theaquatic resources (Figure 1).
1Department of Limnology, Institute of Ecology and Con-servation Biology, Althanstr. 14, PO Box 285, A-1091Vienna, Austria. E-mail: [email protected] of Zoology, University of Kelaniya, Kelaniya11600, Sri Lanka. E-mail: [email protected] Institute AS CR, Na sadkach 7, 370 05Ceske Budejovice, Czech Republic. E-mail: [email protected] of Fisheries, National Inland Fisheries Institute,Pholyothin Road, Jatujak, Bangkok, 10900, Thailand.E-mail: [email protected] of Fundamental Studies, Hantana Road, Kandy,Sri Lanka. E-mail: [email protected]
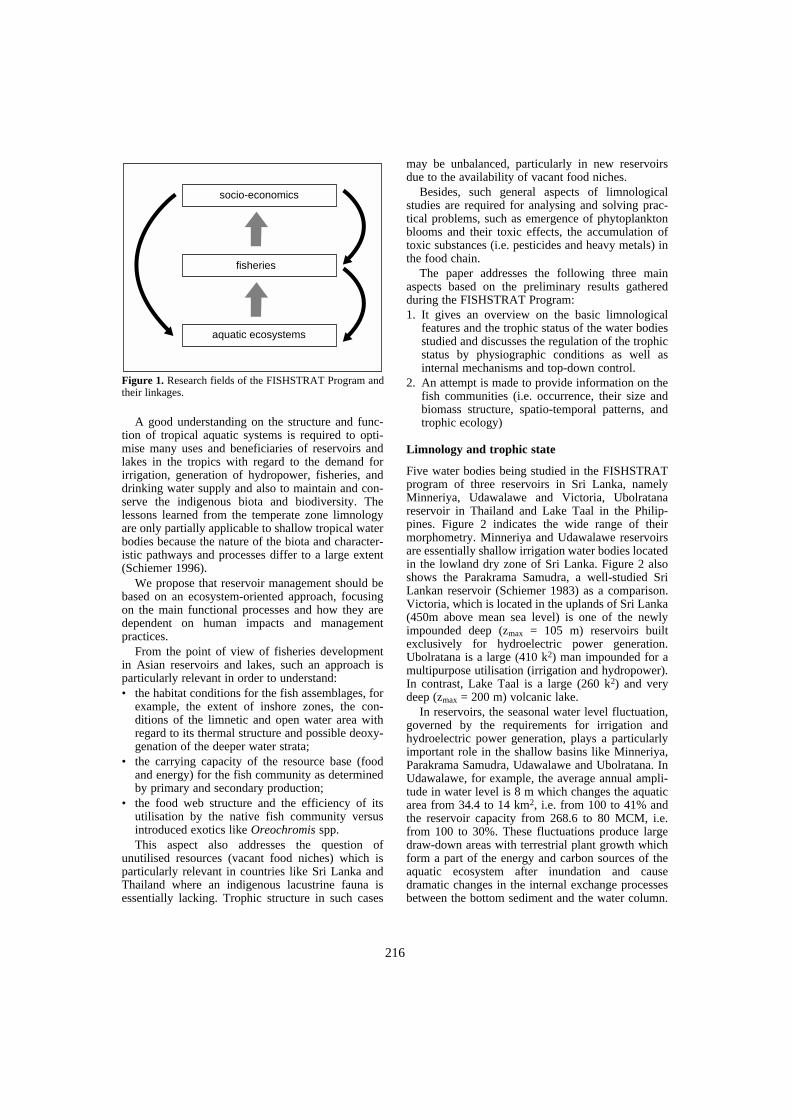
216
Figure 1. Research fields of the FISHSTRAT Program andtheir linkages.
A good understanding on the structure and func-tion of tropical aquatic systems is required to opti-mise many uses and beneficiaries of reservoirs andlakes in the tropics with regard to the demand forirrigation, generation of hydropower, fisheries, anddrinking water supply and also to maintain and con-serve the indigenous biota and biodiversity. Thelessons learned from the temperate zone limnologyare only partially applicable to shallow tropical waterbodies because the nature of the biota and character-istic pathways and processes differ to a large extent(Schiemer 1996).
We propose that reservoir management should bebased on an ecosystem-oriented approach, focusingon the main functional processes and how they aredependent on human impacts and managementpractices.
From the point of view of fisheries developmentin Asian reservoirs and lakes, such an approach isparticularly relevant in order to understand:• the habitat conditions for the fish assemblages, for
example, the extent of inshore zones, the con-ditions of the limnetic and open water area withregard to its thermal structure and possible deoxy-genation of the deeper water strata;
• the carrying capacity of the resource base (foodand energy) for the fish community as determinedby primary and secondary production;
• the food web structure and the efficiency of itsutilisation by the native fish community versusintroduced exotics like Oreochromis spp.This aspect also addresses the question of
unutilised resources (vacant food niches) which isparticularly relevant in countries like Sri Lanka andThailand where an indigenous lacustrine fauna isessentially lacking. Trophic structure in such cases
may be unbalanced, particularly in new reservoirsdue to the availability of vacant food niches.
Besides, such general aspects of limnologicalstudies are required for analysing and solving prac-tical problems, such as emergence of phytoplanktonblooms and their toxic effects, the accumulation oftoxic substances (i.e. pesticides and heavy metals) inthe food chain.
The paper addresses the following three mainaspects based on the preliminary results gatheredduring the FISHSTRAT Program:1. It gives an overview on the basic limnological
features and the trophic status of the water bodiesstudied and discusses the regulation of the trophicstatus by physiographic conditions as well asinternal mechanisms and top-down control.
2. An attempt is made to provide information on thefish communities (i.e. occurrence, their size andbiomass structure, spatio-temporal patterns, andtrophic ecology)
Limnology and trophic state
Five water bodies being studied in the FISHSTRATprogram of three reservoirs in Sri Lanka, namelyMinneriya, Udawalawe and Victoria, Ubolratanareservoir in Thailand and Lake Taal in the Philip-pines. Figure 2 indicates the wide range of theirmorphometry. Minneriya and Udawalawe reservoirsare essentially shallow irrigation water bodies locatedin the lowland dry zone of Sri Lanka. Figure 2 alsoshows the Parakrama Samudra, a well-studied SriLankan reservoir (Schiemer 1983) as a comparison.Victoria, which is located in the uplands of Sri Lanka(450m above mean sea level) is one of the newlyimpounded deep (zmax = 105 m) reservoirs builtexclusively for hydroelectric power generation.Ubolratana is a large (410 k2) man impounded for amultipurpose utilisation (irrigation and hydropower).In contrast, Lake Taal is a large (260 k2) and verydeep (zmax = 200 m) volcanic lake.
In reservoirs, the seasonal water level fluctuation,governed by the requirements for irrigation andhydroelectric power generation, plays a particularlyimportant role in the shallow basins like Minneriya,Parakrama Samudra, Udawalawe and Ubolratana. InUdawalawe, for example, the average annual ampli-tude in water level is 8 m which changes the aquaticarea from 34.4 to 14 km2, i.e. from 100 to 41% andthe reservoir capacity from 268.6 to 80 MCM, i.e.from 100 to 30%. These fluctuations produce largedraw-down areas with terrestrial plant growth whichform a part of the energy and carbon sources of theaquatic ecosystem after inundation and causedramatic changes in the internal exchange processesbetween the bottom sediment and the water column.
socio-economics
fisheries
aquatic ecosystems
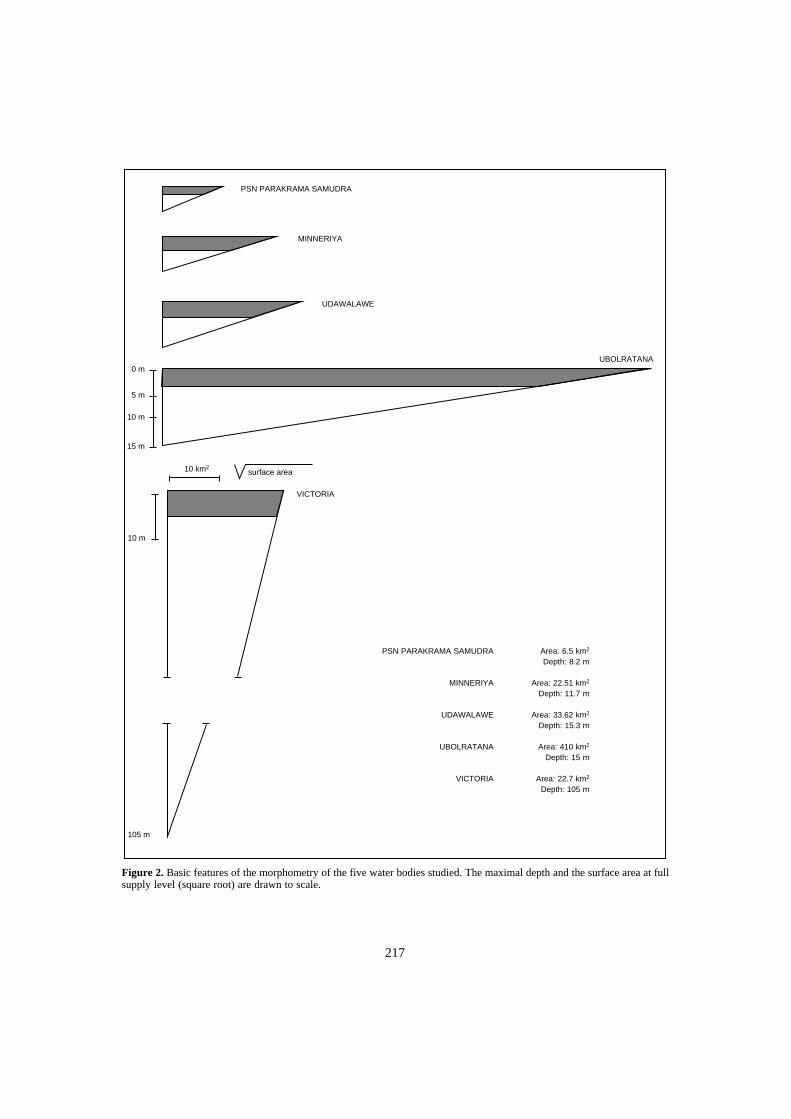
217
Figure 2. Basic features of the morphometry of the five water bodies studied. The maximal depth and the surface area at fullsupply level (square root) are drawn to scale.
PSN PARAKRAMA SAMUDRA
MINNERIYA
UDAWALAWE
UBOLRATANA0 m
5 m
10 m
15 m
10 km2surface area
VICTORIA
10 m
105 m
PSN PARAKRAMA SAMUDRA Area: 6.5 km2
Depth: 8.2 m
MINNERIYA Area: 22.51 km2
Depth: 11.7 m
UDAWALAWE Area: 33.62 km2
Depth: 15.3 m
UBOLRATANA Area: 410 km2
Depth: 15 m
VICTORIA Area: 22.7 km2
Depth: 105 m
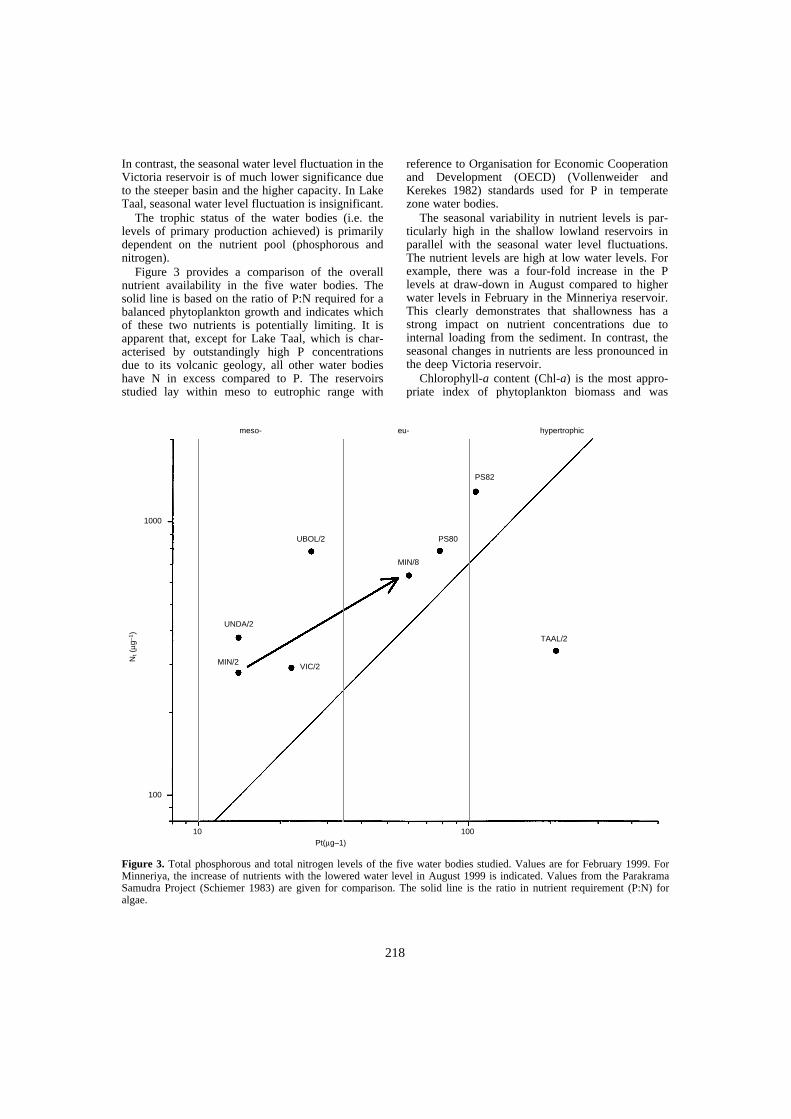
218
In contrast, the seasonal water level fluctuation in theVictoria reservoir is of much lower significance dueto the steeper basin and the higher capacity. In LakeTaal, seasonal water level fluctuation is insignificant.
The trophic status of the water bodies (i.e. thelevels of primary production achieved) is primarilydependent on the nutrient pool (phosphorous andnitrogen).
Figure 3 provides a comparison of the overallnutrient availability in the five water bodies. Thesolid line is based on the ratio of P:N required for abalanced phytoplankton growth and indicates whichof these two nutrients is potentially limiting. It isapparent that, except for Lake Taal, which is char-acterised by outstandingly high P concentrationsdue to its volcanic geology, all other water bodieshave N in excess compared to P. The reservoirsstudied lay within meso to eutrophic range with
reference to Organisation for Economic Cooperationand Development (OECD) (Vollenweider andKerekes 1982) standards used for P in temperatezone water bodies.
The seasonal variability in nutrient levels is par-ticularly high in the shallow lowland reservoirs inparallel with the seasonal water level fluctuations.The nutrient levels are high at low water levels. Forexample, there was a four-fold increase in the Plevels at draw-down in August compared to higherwater levels in February in the Minneriya reservoir.This clearly demonstrates that shallowness has astrong impact on nutrient concentrations due tointernal loading from the sediment. In contrast, theseasonal changes in nutrients are less pronounced inthe deep Victoria reservoir.
Chlorophyll-a content (Chl-a) is the most appro-priate index of phytoplankton biomass and was
Figure 3. Total phosphorous and total nitrogen levels of the five water bodies studied. Values are for February 1999. ForMinneriya, the increase of nutrients with the lowered water level in August 1999 is indicated. Values from the ParakramaSamudra Project (Schiemer 1983) are given for comparison. The solid line is the ratio in nutrient requirement (P:N) foralgae.
meso- eu- hypertrophic
1000
100
Nt (
µg–1
)
PS82
PS80
MIN/8
UBOL/2
UNDA/2
MIN/2VIC/2
TAAL/2
10 100Pt(µg–1)

219
determined as the standard method to define thetrophic status. The significant relationship betweentotal phosphorus (Ptot) concentrations and Chl-acontents (Dillon and Rigler 1974) established fortemperate zone lakes and reservoirs, is used here(Figure 4) for comparative purposes and also as astandard. However, a strong scatter of data pointswas found for Asian reservoirs during this analysis.It appears that the Chl-a levels per unit P concentra-tion are higher compared to the regression estab-lished for the temperate lakes. This can be attributedto faster recycling processes in the tropical reser-voirs. The seasonal variation of Chl-a contents isvery high especially in the shallow reservoirs and iscorrelated with the seasonal change in Ptot.
Lake Taal with its exceptionally high phosphorouslevels is characterised by low phytoplankton biomass.
It is important to understand how primary produc-tion (PP) is controlled with respect to the manage-ment of reservoir ecosystems. Primary production isgoverned (Figure 5) by a wide range of external
influences and internal processes within the aquaticsystems. In order to gain insight into the nature ofthese effects, the areal production (Pa) accumulatedover the water column per m2 can be used. Pa is thegross production, the amount of carbon fixed in thewater column per unit area of the water body. It isthe product of algal biomass (B in units of Chl-aµg/L) and its specific productivity. The specificphotosynthetic rate is the amount of carbon fixed perunit Chl-a per hour. The algal biomass is the resultof phytoplankton production minus the losses due tosedimentation, hydrological flushing and grazing byzooplankton and algivorous fish.
This specific production rate is dependent on:• the size structure, taxonomic composition and
physiological state of algal communities;• the light climate in the water column (i.e. the total
incoming irradiance and its attenuation controlledby the inorganic and organic turbidity); and
• availability of nutrients.
Figure 4. Relationship of total phosphorous and Chl-a of the water bodies studied. The regression line calculated by Dillonand Rigler (1974) for temperate zone water bodies is given for comparison.
100
10
1
0, 1
1 10 100 1000TP (mg × m–3)
hypertrophic
eutrophic
mesotrophic
oligotrophic
UBOL/8MIN/8
UBOL/2
VIC/2
VIC/8
MIN/2
UDA/2 TAAL/8
TAAL/2
Dillan & Rigler (1980)log Chla = 1.449 logP – 1.136

220
The latter is a result of nutrient intake from thecatchment by inflow and diffuse sources (externalloading). In shallow tropical water bodies, nutrientavailability appears even to a larger extent to bedetermined by internal recycling processes, i.e. aninternal loading by nutrient release from the sedi-ments and grazing by zooplankton and fish. Table 1presents some results obtained on primary produc-tion during FISHSTRAT. The areal gross primaryproduction is generally high in the order of 2 gC/m2/day. However, a high fraction of the assimi-lated energy is used up by the respiration of the algaland microbial community of the water body over the24 h cycle. Therefore, the daily carbon budget isdependent on the irradiance level of the particularday. For example, on rainy days with low irradiance,
the carbon budget might be negative and the Chl-alevels will decline accordingly.
A further important factor for the daily carbonbudget of the mixed water column is the relationshipbetween euphotic depth and the mixing depth. Itoccurs under windy situations when vertical mixingoccurs beyond the depth of algal photosynthesis, thenet column production declines. This is alsoexpressed by low oxygen levels below saturation, ofthe mixed epilimnetic zone indicating that the carbonbalance becomes negative. Thus, a tight budgetexists between carbon gains and losses (Figure 6).
The net productivity calculated for the mixed waterlayer of the shallow irrigation reservoirs is in theorder of 0.2 g/C/m2/day which roughly converts to aproduction of 10 tons of organic fresh weight/ha/y.
Figure 5. Regulation of primary production. Pa = areal production (per m2 lake area); Ps = specific production per unitphytoplankton biomass (B); L = Light conditions: incoming irradiance and its attenuation within the water column;N = availability of limiting nutrients (phosphorus); D = decomposition processes in the water column and at the sedimentsurface; G = grazing of phytoplankton by zooplankton and filter-feeding fish (Schiemer 1996).
L
Pa = B × P2
HYDROL.FLUSHING
WIND ANDCONVECTION
G
D N
D
SEDIMENT
“CORMORANTS”
EXTERNALLOADING
BENTHIVOROUS FISH
depressing effects
stimulating effects
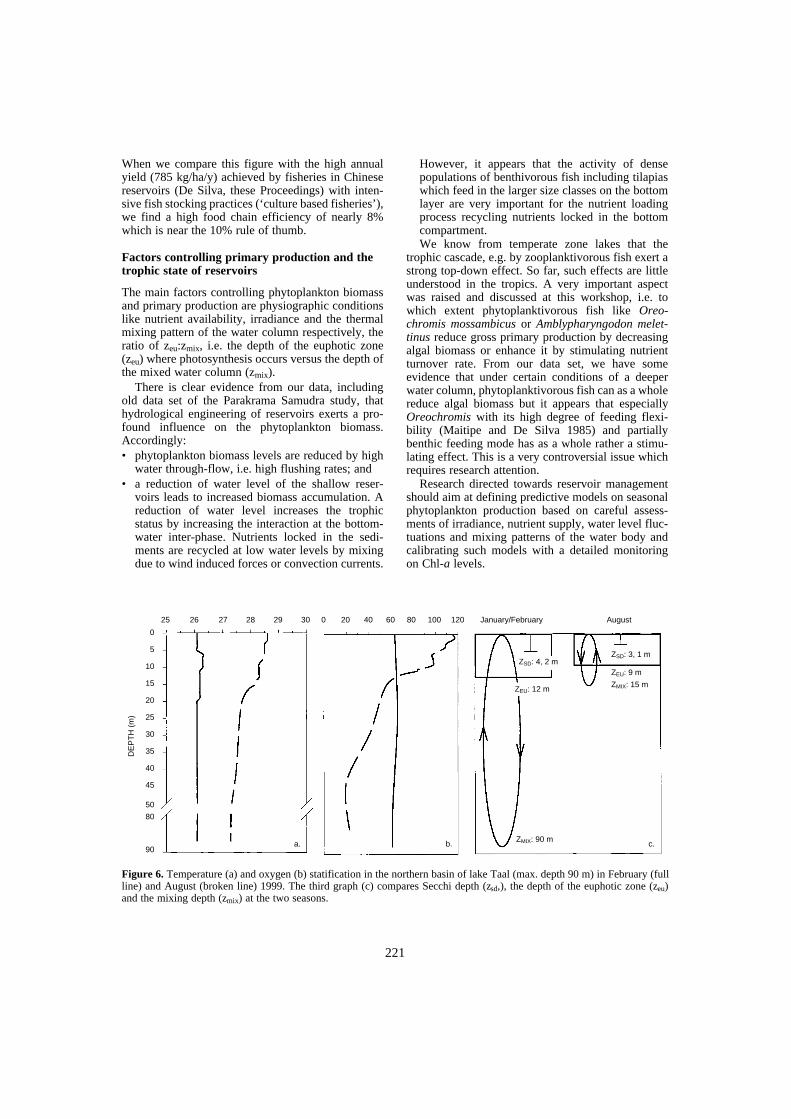
221
When we compare this figure with the high annualyield (785 kg/ha/y) achieved by fisheries in Chinesereservoirs (De Silva, these Proceedings) with inten-sive fish stocking practices (‘culture based fisheries’),we find a high food chain efficiency of nearly 8%which is near the 10% rule of thumb.
Factors controlling primary production and the trophic state of reservoirs
The main factors controlling phytoplankton biomassand primary production are physiographic conditionslike nutrient availability, irradiance and the thermalmixing pattern of the water column respectively, theratio of zeu:zmix, i.e. the depth of the euphotic zone(zeu) where photosynthesis occurs versus the depth ofthe mixed water column (zmix).
There is clear evidence from our data, includingold data set of the Parakrama Samudra study, thathydrological engineering of reservoirs exerts a pro-found influence on the phytoplankton biomass.Accordingly:• phytoplankton biomass levels are reduced by high
water through-flow, i.e. high flushing rates; and• a reduction of water level of the shallow reser-
voirs leads to increased biomass accumulation. Areduction of water level increases the trophicstatus by increasing the interaction at the bottom-water inter-phase. Nutrients locked in the sedi-ments are recycled at low water levels by mixingdue to wind induced forces or convection currents.
However, it appears that the activity of densepopulations of benthivorous fish including tilapiaswhich feed in the larger size classes on the bottomlayer are very important for the nutrient loadingprocess recycling nutrients locked in the bottomcompartment.We know from temperate zone lakes that the
trophic cascade, e.g. by zooplanktivorous fish exert astrong top-down effect. So far, such effects are littleunderstood in the tropics. A very important aspectwas raised and discussed at this workshop, i.e. towhich extent phytoplanktivorous fish like Oreo-chromis mossambicus or Amblypharyngodon melet-tinus reduce gross primary production by decreasingalgal biomass or enhance it by stimulating nutrientturnover rate. From our data set, we have someevidence that under certain conditions of a deeperwater column, phytoplanktivorous fish can as a wholereduce algal biomass but it appears that especiallyOreochromis with its high degree of feeding flexi-bility (Maitipe and De Silva 1985) and partiallybenthic feeding mode has as a whole rather a stimu-lating effect. This is a very controversial issue whichrequires research attention.
Research directed towards reservoir managementshould aim at defining predictive models on seasonalphytoplankton production based on careful assess-ments of irradiance, nutrient supply, water level fluc-tuations and mixing patterns of the water body andcalibrating such models with a detailed monitoringon Chl-a levels.
Figure 6. Temperature (a) and oxygen (b) statification in the northern basin of lake Taal (max. depth 90 m) in February (fullline) and August (broken line) 1999. The third graph (c) compares Secchi depth (zsd,), the depth of the euphotic zone (zeu)and the mixing depth (zmix) at the two seasons.
25 26 27 28 29 30 0 20 40 60 80 100 120 January/February August
0
5
10
15
20
25
30
35
40
45
50
80
90
DE
PT
H (
m)
a. b. c.ZMIX: 90 m
ZSD: 4, 2 m
ZEU: 12 m
ZSD: 3, 1 m
ZEU: 9 m
ZMIX: 15 m
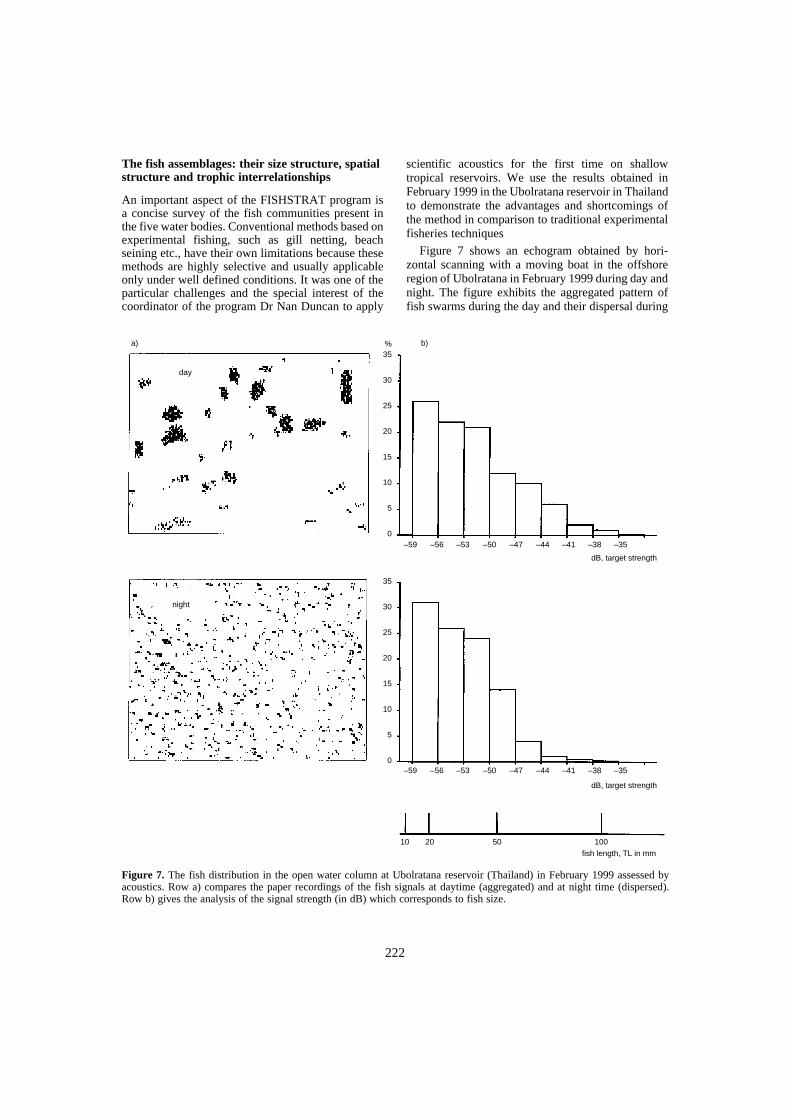
222
The fish assemblages: their size structure, spatial structure and trophic interrelationships
An important aspect of the FISHSTRAT program isa concise survey of the fish communities present inthe five water bodies. Conventional methods based onexperimental fishing, such as gill netting, beachseining etc., have their own limitations because thesemethods are highly selective and usually applicableonly under well defined conditions. It was one of theparticular challenges and the special interest of thecoordinator of the program Dr Nan Duncan to apply
scientific acoustics for the first time on shallowtropical reservoirs. We use the results obtained inFebruary 1999 in the Ubolratana reservoir in Thailandto demonstrate the advantages and shortcomings ofthe method in comparison to traditional experimentalfisheries techniques
Figure 7 shows an echogram obtained by hori-zontal scanning with a moving boat in the offshoreregion of Ubolratana in February 1999 during day andnight. The figure exhibits the aggregated pattern offish swarms during the day and their dispersal during
Figure 7. The fish distribution in the open water column at Ubolratana reservoir (Thailand) in February 1999 assessed byacoustics. Row a) compares the paper recordings of the fish signals at daytime (aggregated) and at night time (dispersed).Row b) gives the analysis of the signal strength (in dB) which corresponds to fish size.
a) b)%35
30
25
20
15
10
5
0
day
–59 –56 –53 –50 –47 –44 –41 –38 –35
dB, target strength
35
30
25
20
15
10
5
0–59 –56 –53 –50 –47 –44 –41 –38 –35
dB, target strength
10 20 50 100fish length, TL in mm
night
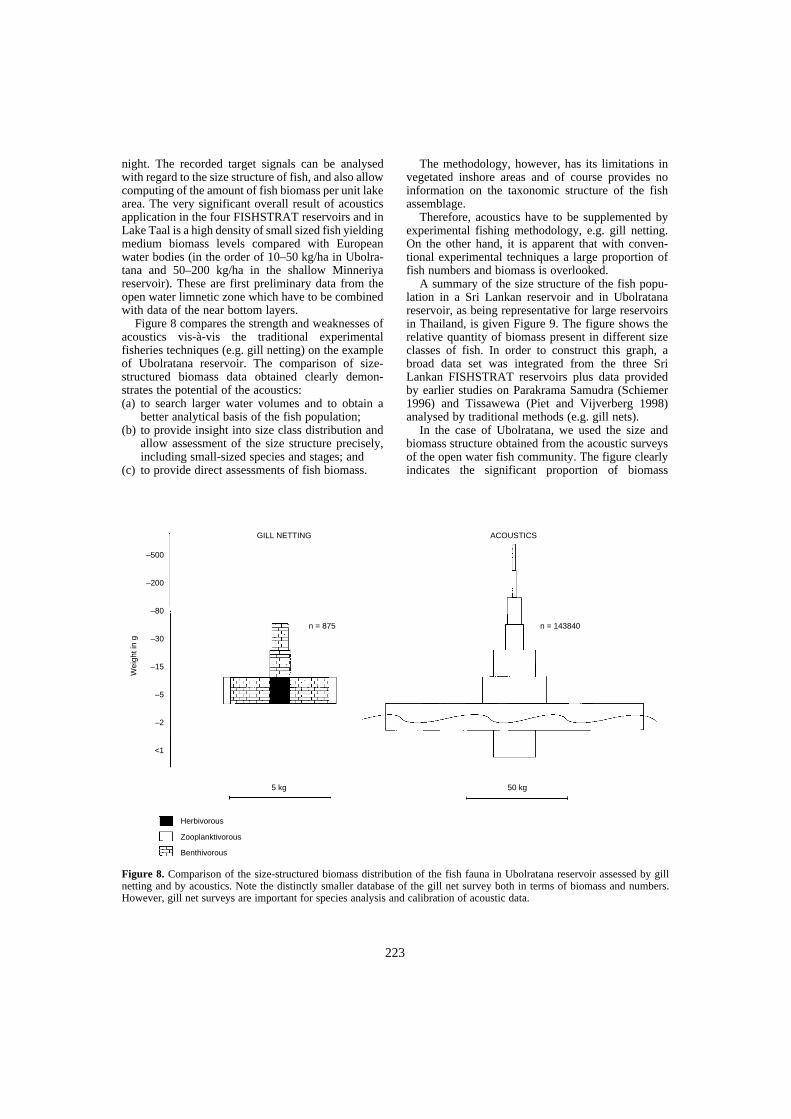
223
night. The recorded target signals can be analysedwith regard to the size structure of fish, and also allowcomputing of the amount of fish biomass per unit lakearea. The very significant overall result of acousticsapplication in the four FISHSTRAT reservoirs and inLake Taal is a high density of small sized fish yieldingmedium biomass levels compared with Europeanwater bodies (in the order of 10–50 kg/ha in Ubolra-tana and 50–200 kg/ha in the shallow Minneriyareservoir). These are first preliminary data from theopen water limnetic zone which have to be combinedwith data of the near bottom layers.
Figure 8 compares the strength and weaknesses ofacoustics vis-à-vis the traditional experimentalfisheries techniques (e.g. gill netting) on the exampleof Ubolratana reservoir. The comparison of size-structured biomass data obtained clearly demon-strates the potential of the acoustics: (a) to search larger water volumes and to obtain a
better analytical basis of the fish population;(b) to provide insight into size class distribution and
allow assessment of the size structure precisely,including small-sized species and stages; and
(c) to provide direct assessments of fish biomass.
The methodology, however, has its limitations invegetated inshore areas and of course provides noinformation on the taxonomic structure of the fishassemblage.
Therefore, acoustics have to be supplemented byexperimental fishing methodology, e.g. gill netting.On the other hand, it is apparent that with conven-tional experimental techniques a large proportion offish numbers and biomass is overlooked.
A summary of the size structure of the fish popu-lation in a Sri Lankan reservoir and in Ubolratanareservoir, as being representative for large reservoirsin Thailand, is given Figure 9. The figure shows therelative quantity of biomass present in different sizeclasses of fish. In order to construct this graph, abroad data set was integrated from the three SriLankan FISHSTRAT reservoirs plus data providedby earlier studies on Parakrama Samudra (Schiemer1996) and Tissawewa (Piet and Vijverberg 1998)analysed by traditional methods (e.g. gill nets).
In the case of Ubolratana, we used the size andbiomass structure obtained from the acoustic surveysof the open water fish community. The figure clearlyindicates the significant proportion of biomass
Figure 8. Comparison of the size-structured biomass distribution of the fish fauna in Ubolratana reservoir assessed by gillnetting and by acoustics. Note the distinctly smaller database of the gill net survey both in terms of biomass and numbers.However, gill net surveys are important for species analysis and calibration of acoustic data.
–500
–200
–80
–30
–15
–5
–2
<1
Wei
ght i
n g
GILL NETTING ACOUSTICS
n = 875 n = 143840
50 kg5 kg
Herbivorous
Zooplanktivorous
Benthivorous
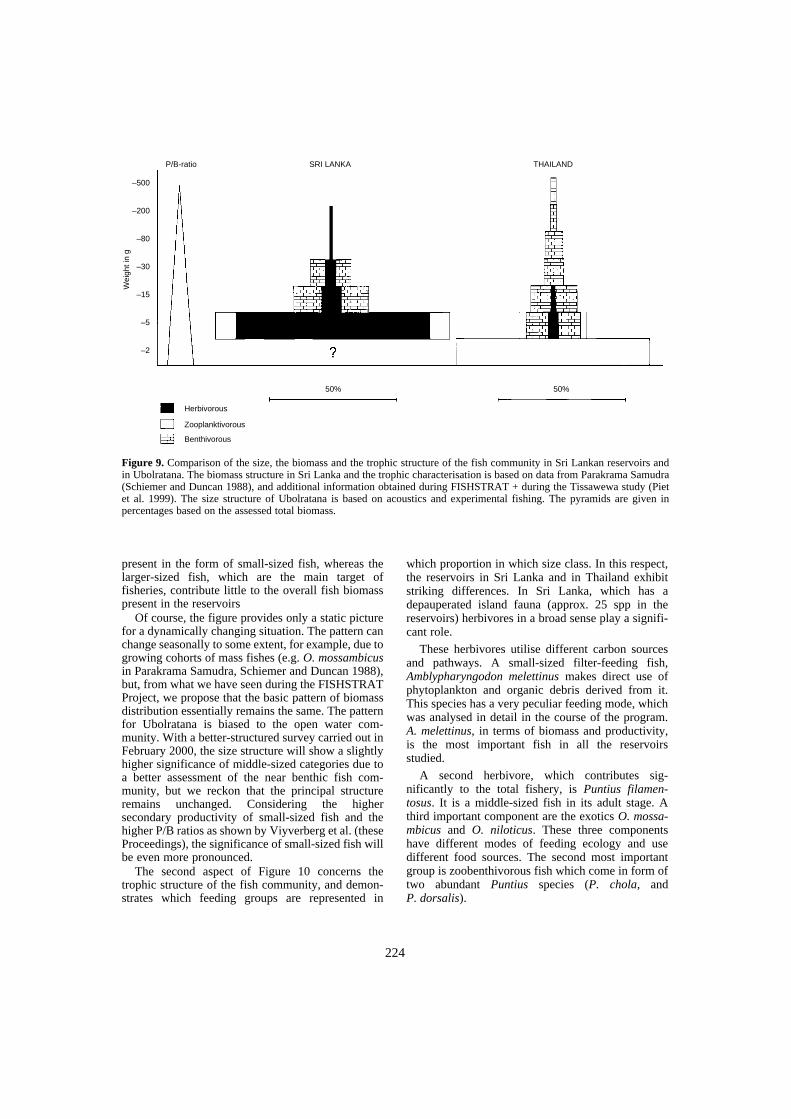
224
present in the form of small-sized fish, whereas thelarger-sized fish, which are the main target offisheries, contribute little to the overall fish biomasspresent in the reservoirs
Of course, the figure provides only a static picturefor a dynamically changing situation. The pattern canchange seasonally to some extent, for example, due togrowing cohorts of mass fishes (e.g. O. mossambicusin Parakrama Samudra, Schiemer and Duncan 1988),but, from what we have seen during the FISHSTRATProject, we propose that the basic pattern of biomassdistribution essentially remains the same. The patternfor Ubolratana is biased to the open water com-munity. With a better-structured survey carried out inFebruary 2000, the size structure will show a slightlyhigher significance of middle-sized categories due toa better assessment of the near benthic fish com-munity, but we reckon that the principal structureremains unchanged. Considering the highersecondary productivity of small-sized fish and thehigher P/B ratios as shown by Viyverberg et al. (theseProceedings), the significance of small-sized fish willbe even more pronounced.
The second aspect of Figure 10 concerns thetrophic structure of the fish community, and demon-strates which feeding groups are represented in
which proportion in which size class. In this respect,the reservoirs in Sri Lanka and in Thailand exhibitstriking differences. In Sri Lanka, which has adepauperated island fauna (approx. 25 spp in thereservoirs) herbivores in a broad sense play a signifi-cant role.
These herbivores utilise different carbon sourcesand pathways. A small-sized filter-feeding fish,Amblypharyngodon melettinus makes direct use ofphytoplankton and organic debris derived from it.This species has a very peculiar feeding mode, whichwas analysed in detail in the course of the program.A. melettinus, in terms of biomass and productivity,is the most important fish in all the reservoirsstudied.
A second herbivore, which contributes sig-nificantly to the total fishery, is Puntius filamen-tosus. It is a middle-sized fish in its adult stage. Athird important component are the exotics O. mossa-mbicus and O. niloticus. These three componentshave different modes of feeding ecology and usedifferent food sources. The second most importantgroup is zoobenthivorous fish which come in form oftwo abundant Puntius species (P. chola, andP. dorsalis).
Figure 9. Comparison of the size, the biomass and the trophic structure of the fish community in Sri Lankan reservoirs andin Ubolratana. The biomass structure in Sri Lanka and the trophic characterisation is based on data from Parakrama Samudra(Schiemer and Duncan 1988), and additional information obtained during FISHSTRAT + during the Tissawewa study (Pietet al. 1999). The size structure of Ubolratana is based on acoustics and experimental fishing. The pyramids are given inpercentages based on the assessed total biomass.
–500
–200
–80
–30
–15
–5
–2
P/B-ratio SRI LANKA THAILAND
Herbivorous
Zooplanktivorous
Benthivorous
50% 50%
Wei
ght i
n g
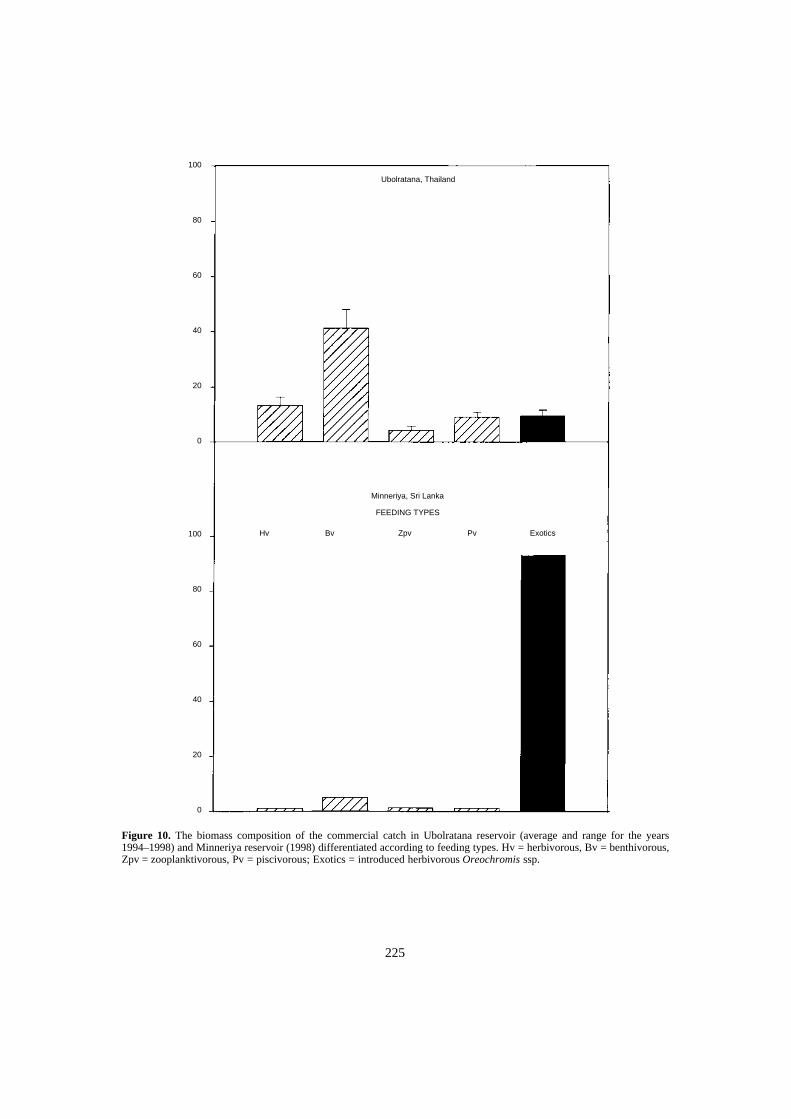
225
Figure 10. The biomass composition of the commercial catch in Ubolratana reservoir (average and range for the years1994–1998) and Minneriya reservoir (1998) differentiated according to feeding types. Hv = herbivorous, Bv = benthivorous,Zpv = zooplanktivorous, Pv = piscivorous; Exotics = introduced herbivorous Oreochromis ssp.
100
80
60
40
20
0
Ubolratana, Thailand
Minneriya, Sri Lanka
FEEDING TYPES
100
80
60
40
20
0
Hv Bv Zpv Pv Exotics

226
Small-sized zooplankton feeding fish occur inform of Rasbora daniconius and in the lowlandreservoirs in the form of Hyporamphus gaimardi(Minneriya, Parakrama Samudra, Udawalawe). Thisspecies is, however, missing in the Victoria reservoir.
The most important aspect of the Thai reservoirsappears to be a distinctly lower significance of herbi-vores. With regard to the commercial catch, the con-tribution is more significant than suggested by theresults of the experimental fishing. Commerciallyharvested herbivores are two small-sized cyprinids(Cirrhinus jullieni and Osteochilus hasselti) both ofwhich take algae and detritus from the bottom layers,as well as the exotic species O. niloticus. Con-sidering the vast inshore zones of the reservoir,littoral bound herbivores like C. jullieni and O. has-selti are more significant in the biomass pyramidthan suggested by the graph. The biomass pyramid ischaracterised by the dominance of a small sized zoo-planktivorous clupeid (Clupeichthyes aesarnensis,Thai river sprat) and a number of zoobenthivorousfish especially Puntioplites and Cyclocheilichthyes.Both groups constitute similar proportions to thetotal fish biomass of the reservoir.
The low proportion of herbivores is surprisingconsidering the high fish biodiversity of the country(75 species recorded in the reservoir). It might beexplainable by the lack of a lacustrine fish fauna,which, however, is also the case in Sri Lanka, andpinpoints to the necessity to take into account bio-geographical and evolutionary aspects in fisheriesmanagement. It raises the question whether thereservoirs rich in fish diversity can only produce lessyield compared to island reservoirs where fishdiversity is low.
The low significance of herbivores in Ubolratanais also puzzling from the point of view of ecologicalenergetics since the net primary production, immedi-ately available for herbivores remains widely unusedby fish. The summary data of the International Bio-logical Program suggests as a rough rule of thumb anecological conversion efficiency from primary pro-duction to secondary production of zooplankton of10% and a much less efficient pathway to zoo-benthos of 2–5% (however, there could be a moreefficient pathway under shallow tropical conditions).
Our hypothesis for Ubolratana reservoir, there-fore, is that the energy transfer to fish is less efficientcompared to Sri Lankan reservoirs. This agrees withthe higher commercial catches, e.g. in Minneriya200 kg/ha compared to 20–40 kg/ha in Ubolratana,despite the fact that the local fishing communityharvests intensively a much larger-sized range of fishcompared to Sri Lanka.
References
Amarasinghe, U.S., Duncan, A., Moreau, J., Schiemer, F.,Simon, D. and Vijverberg, J. (in press): Promotion ofsustainable fisheries and aquaculture in Asian reservoirsand lakes. Hydrobiologia.
Chookajorn, T., Leenanond, Y., Moreau, J. and Sricha-roendham, B. 1994. Evolution of trophic relationships inUbolratana reservoir (Thailand) as described using amultispecies trophic model. Asian Fisheries Science,7: 201–213.
Dillon, P. and Rigler, R.H. 1974. A test of a simple nutrientbudget model predicting the phosphorus concentration inlake water. J. Fish. Res. Bd. Canada, 31: 1771–1778.
Maitipe, P. and De Silva, S.S. 1985. Switches betweenzoophagy, phytophagy and detritivory of Sarotherodonmossambicus (Peters) adult populations in twelveman-made Sri Lankan lakes. Journal of Fish Biology,26: 49–61.
Piet, G.J., Vijverberg, J. and van Densen, W.L.T. 1999.Foodweb structure of a Sri Lankan reservoir. In: vanDensen, W.L.T. and Morris, M.J. eds. Fish and fisheriesof Lakes and reservoirs in southeast Asia and Africa.Westbury Academic & Scientific Publishing, 187–205.
Schiemer, F. (ed.) (1983): Limnology of ParakramaSamudra — a case study of an ancient man-made lake inthe tropics. Developments in Hydrobiology–series, JunkPublishers.
Schiemer, F. (1996): Significance of filter-feeding fish intropical freshwaters. In: Schiemer, F. & Boland, K.T.(eds.): Perspectives in Tropical Limnology. SBPAcademic Publishing: 65–76.
Schiemer, F. & A. Duncan (1988): The significance of theecosystem approach for reservoir management. In: DeSilva, S. (ed.): Reservoir fishery management anddevelopment in Asia. Proceedings series, InternationalDevelopment Research Centre. Ottawa, 183–194.
Vollenweider, R. & J. Kerekes (1982): Eutrophication ofWaters, Monitoring Assessment and Control. OECD,Paris.
227
Developing Fisheries Enhancement in Small Waterbodies: Lessons from Lao PDR and Northeast Thailand
C. Garaway1, K. Lorenzen1 and B. Chamsingh2
Abstract
Culture fisheries enhancements are widely practised in small waterbodies throughout theMekong region. Although frequently initiated by local communities, enhancements have receivedconsiderable financial and logistic support from governments and some NGOs (non-governmentorganisations). Firstly, this paper reviews the characteristics of their performance in terms ofproductivity, socioeconomic and environmental impacts. Secondly, it assesses the need andpotential for improving the performance of enhancements, and explores how governmentalorganisations and NGOs can aid the sustainable development of enhancements through a processof participatory adaptive learning.
THE resources under consideration, small water-bodies, have been defined as ‘small reservoirs andlakes less than 10 km2 in area, small ponds, canalsincluding irrigation canals, small seasonal inlandfloodplains and swamps, and small rivers and streamsless than 100 km2 in length’ (Anderson 1987).
Experiences of stocking ventures in such water-bodies have shown that while stocking has thepotential to yield substantial benefits, the actualoutcomes (in terms of production, distribution ofbenefits, institutional sustainability, etc.) are oftendifferent from those initially expected (Samina andWorby 1993; Garaway 1995; Hartmann 1995;Cowan et al. 1997; Lorenzen and Garaway 1998;Garaway 1999).
The underlying reason for the prevalence ofunexpected and sometimes undesirable outcomes ofstocking in small waterbodies lies in (a) the inevitablylimited prior knowledge of the physical, biological,technical and institutional characteristics ofindividual sites which show great variability, and (b),the complexity of the environments into which
enhancements are introduced, involving dynamicinteractions between the biological characteristics ofthe resource, the technical intervention of enhance-ment and the people who use or manage it.
The paper seeks to highlight these points andsuggests ways in which the constraints they pose canbe addressed. It reviews some of the previous experi-ences specifically relating to small waterbodies, andfocuses on the small waterbody research experienceof the authors in Udon Thani Province, NE Thailand(1993–96) and Savannakhet Province, Lao PDR(1994–present).
The next section presents a brief review of some ofthe small waterbody stocking initiatives in the studycountries and gives some examples of outcomes thathave occurred. The following section highlights somegeneral lessons that have been learnt from studyingthese processes and outcomes and, in particular, theirconstraints and opportunities. The section ends withrecommendations for an adaptive process-orientedapproach to management and suggests a possible rolefor governments and/or other external research anddevelopment agencies.
Case Studies from Lao PDR and NE Thailand
This section provides a brief review of some of theresults and conclusions of previous work by theauthors. Details can be found in Garaway (1995),Garaway et al. (1997), Lorenzen and Garaway
1T.H. Huxley School of Environment Earth Science andEngineering, Imperial College, 8 Princes Gardens, LondonSW7 1NA, UK2Livestock and Fisheries Section, Department of Agri-culture and Forestry, PO Box 16, Savannakhet Province,Lao PDR
228
(1998), Lorenzen, Juntana et al. (1998), Lorenzen,Garaway et al. (1998), and Garaway (1999).
Small waterbodies and their role in rural livelihoods
In Savannakhet Province, Lao PDR, small water-bodies are ubiquitous and play a very importantdirect role in the livelihoods of almost all ruralhouseholds, primarily for subsistence needs but also,and increasingly, for income generation (Garaway1999). Household participation in such fisheries isalmost universal (Claridge 1996; Garaway 1999).The province, like the country, is characterised bysemi-independent rural villages engaged in sub-sistence agricultural production, rice farming beingthe primary economic activity, supplemented byother activities such as fishing and small livestock-rearing. Personal fishing in small waterbodiesaccounts for, on average, at least 70% of the fishacquired by rural households (Garaway 1999).
In NE Thailand, the growth of the agriculturalsector has declined in recent years but, as in LaoPDR, rice production is still the most importantsector in the region and people in rural areascombine farming with fishing activities. Smallwaterbodies, widespread, are the important fisheryresources (Fedoruk and Leelapatra 1992; Garaway1995). In the rural areas in the northeast, up to 80%of fish consumed was obtained from such sources(Prapertchop 1989). While it is expected thatreliance is less now, a less detailed but later studysuggested that reliance was still high, but that itvaried between households of different socio-economic status (Garaway 1995).
In both research locations, it is believed that fresh-water fish is the most important source of animalprotein.
Promoting stocking and uptake
Lao PDR
In Savannakhet Province, stocking of small water-bodies, particularly with Nile tilapia Oreochromisniloticus, and to a lesser extent common and Indianmajor carp, has been promoted actively by thegovernment since 1994, and the practice is spreadingrapidly. Government policy has stated that ‘priorityin the short-, medium- and long-term is to be given tothe reduction of declining harvests and the develop-ment of fisheries in the rivers, lakes and reservoirs ...these actions could allow the fisheries sub-sector toincrease gradually its production figures from thecurrent estimates’ (Phonvisay 1994). The promotionof stocking in small waterbodies is seen as one wayto do it.
Waterbodies currently subject to enhancementinclude oxbow lakes, natural depressions and reser-voirs of sizes ranging typically 1–20 ha. Typically,these waterbodies are under the de facto ownershipof one or two closely connected villages, and areadjacent to the villages concerned.
Government has been supporting villages throughthe provision of limited technical advice, throughpart-payment of fingerlings and through facilitating‘study tours’ to villages already involved withstocking. Operational rules (including monitoring andenforcement) regarding management are predomi-nantly devised (and carried out) by the local commu-nities themselves, and hence there is considerablevariation between villages, with villages also experi-menting with their own rules, through time. Govern-ment staff give advice, particularly regarding whoshould be benefactors of the initiatives.
In Savannakhet Province, response to stocking inrural communities has been varied. Of 31 villagesand waterbodies studied, 20 supplied new institu-tions to manage their newly enhanced waterbody andsubsequently maintained these new institutions,while 11 did not (Garaway 1999). The types of insti-tutions supplied are discussed in the next section.Research found that communities were more likelyto supply new rules when there was a commitment todo so prior to stocking. Such communities devisedthe idea themselves or in partnership with thegovernment fisheries department, and at least part-financed the stocking. Having information aboutbenefits from stocking, in particular firsthand infor-mation gained from visiting other villages enhancedthe commitment. Other factors encouraging supplyof new rules included the presence of skilful leaders,entrepreneurs and district government staff in thevillage (Garaway 1999).
Northeast Thailand
In Northern Thailand, culture-based fisheries invillage ponds have developed since the 1980s,following the expansion of government and privatefish seed production, and various programs to buildvillage ponds and to promote aquaculture. At thetime of the research (1993–96), fish culture in com-munal ponds and reservoirs was being promoted bythe Village Fisheries Programme (VFP) of theDepartment of Fisheries (DOF), one of the primaryaims being the promotion of communal semi-intensive aquaculture. Again, waterbodies selectedwere generally under the de facto ownership of oneor two closely connected villages and were adjacentto the villages concerned.
As in Lao PDR, under the program, villagecommunities assumed responsibility for pond
229
management, and specific decisions on operationalrules, including monitoring and enforcement, weretaken by the village communities. Governmentsupport included brief training in managementtechniques such as nursing, feeding, fertilisation andintegrated agriculture-aquaculture. Seed fish werepartially subsidised in the first three years of anynew village fish pond.
Department of Fisheries staff expressed dissatis-faction with the technology uptake in the VFP(Lorenzen, pers. comm.). Surveys show that manyvillages continued to manage the village pondactively after the first three years, but that fewvillages provided significant inputs other than seedfish (which were stocked at 2–3 cm without nursing)(Lorenzen, Juntana et al. 1998), and thereforevillagers were not operating the communal semi-intensive aquaculture systems originally promoted.
Types of institutional change that stocking catalysed — a preliminary outcome of stocking
The stocking initiatives discussed above frequentlycatalysed changes in how waterbodies could be usedand by whom, and many changes were often notanticipated by external agencies.
Commonly, in both countries, operational rulesradically altered access rights and the nature ofhousehold benefits that could be obtained fromresources.1 For example, personal subsistencefishing, usually previously permitted, was commonlyprohibited or very much restricted, the level ofrestriction depending on the extent to which indi-vidual fishers had access to other resources. Instead,the fishery became increasingly commercialised.Resources were harvested in a way that produced avillage income for community development, and theallocation of fish not used for these commercial pur-poses, and other derived benefits from the water-body, were determined by rules set up by localdecision-makers.
In NE Thailand, by far the most common manage-ment regime that replaced subsistence or small-scalefishing was the holding of an annual fishing daywhere tickets were sold to individuals from withinand outside the village, allowing them to fish withcast-nets and lift-nets. As well as generating incomefrom the village, these days were also importantsocial occasions (Chantarawarathit 1989; Garaway1995). Outside this day, fishing was commonlyprohibited.
More common in Lao PDR was that the resourcewould be fished by teams under the supervision of amanagement committee in a period of low agricul-tural labour demand (between January and May).Payment to the fishers concerned varied betweenvillages. Outside that time, fishing was also com-monly prohibited. Why the institutions developed inLao PDR were different to those in NE Thailand isnot known, though a possible explanation is that theopportunity costs of team-fishing are far greater inThailand than in Lao PDR. Other less commonsystems in Lao PDR included renting the waterbodyto a group inside the village or, as in Thailand,holding an annual fishing day (Garaway 1999).
As well as these broad variations in institutionsbetween village communities, there were numeroussmaller variations. Villages also experimented withtheir own management rules over time, continuallyadapting to local objectives and circumstances.
Examples of some outcomes of stocking initiatives
This section gives a very brief review of some of themain technical, socioeconomic and environmentaloutcomes.
Technical outcomes (production potential and yields)
In Savannakhet Province, Lao PDR, a comparativestudy of waterbodies under different managementregimes showed that the management systemsdescribed above, with a combination of accessregimes and stocking, had a strong positive effect onboth standing stocks and biological productionpotential (Lorenzen, Garawan et al. 1998). However,low levels of effort, brought about the access restric-tions, and selected harvesting of the larger stockedspecies only meant that overall yields were notdifferent between enhanced and non-enhancedfisheries, i.e. the potential for increased productionwas not realised (Garaway 1999). On the other hand,harvesting efficiency and hence the productivity oflabour in the fishery increased greatly by up to afactor of three, and this was appreciated and valuedhighly by stakeholders (Garaway 1999).
An institutional analysis suggested that the lowlevels of effort were ultimately the result of a com-bination of the operational rules that governed accessand low incentives for active involvement in thefishery. Crucially, while any of these rules couldhave been changed to increase effort, possiblyleading to increased yields and associated benefits,all would have involved increased costs or lowereconomic returns to labour, and hence were not pre-ferred (Garaway 1999).
In NE Thailand, stocking, catch and related datawere collected for 16 village ponds. There was large
1 In Thailand, an exception to this was where waterbodieswere purpose-built, and in these instances, rules werecreated rather than altered.
230
variation in technical outcomes, with yields rangingfrom 26 to 2881 (median 652) kg/ha/year. Yieldswere strongly related to the trophic status of thewaterbody and to stocking density (with an optimumat 9800 fish/ha/year of 2–3 cm seed fish). Stockingperformance varied greatly between species and wasalso influenced by the trophic status of the water-body (Lorenzen, Juntana et al. 1998). Catches weredominated by tilapia in the most fertile water bodiesand by carp species in all others, but catch speciescomposition did not significantly influence yieldwhen the effect of trophic status was accounted for.
The median yield of 652 kg/ha/yr was far lessthan villagers could have obtained had they managedthe waterbodies as communal, semi-intensive aqua-culture systems as originally promoted, instead ofculture-based fisheries. For example, data for semi-intensive aquaculture, based on recommendations forfarmer pond culture (AIT 1993), suggest yields ofaround two-and-a-half times that much, at 1563kg/ha/yr.
The reason why local decision-makers chose thisroute was suggested by an economic analysis. Itshowed that the culture-based fishery provided muchhigher returns to communal labour and finance thansemi-intensive aquaculture enterprises, and the factthat people opted for culture-based fisheries suggeststhat such communal labour and finance were in shortsupply (Lorenzen, Juntana et al. 1998). Therefore,operating a culture-based fishery was a successfuladaptation of the extended technology to villageneeds.
In summary, in both these cases it can be seen thatthe operational rules devised by local communitieshad a crucial effect on what outcomes were achievedor were achievable, and these rules and consequentoutcomes were not fully anticipated by externalagencies. Closer analysis suggests that the rules hadbeen chosen to fit local needs and circumstances.
Socioeconomic outcomes of enhancement initiatives
The section above discussed total benefits ofstocking initiatives in terms of yields and harvestingefficiency. However, given that the stocking initia-tives catalysed changes in both the allocation andnature of benefits from the fishery, it is important tounderstand how the changes affected the distributionof benefits among resource users.
As mentioned previously, the principal benefit ofthe stocking initiatives was the production of villageincome for community development. This is very dif-ferent from the benefits from capture fisheries, anddemonstrates that stocking can catalyse a fundamentalshift in the role and function of small waterbodies. Ina detailed study of four villages managing stocking
initiatives in Savannakhet Province, householdbenefits from the stocked waterbodies were found toinclude a cheap source of good quality fish, decreasedpersonal cash contributions to the community devel-opment fund, increased community income forimproved community services (in some cases),decreased personal fish contributions for when thevillage entertained guests, and payment (in fish orsometimes cash) for communal harvesting andmarketing. Selling fish cheaply to individuals fromsurrounding villages and entertaining guests fulfilleda traditional social function of strengthening linksbetween villages (Garaway 1999).
Regarding the distribution of these benefits, withtheir higher capacity to buy fish richer householdswere able to take more advantage of the new marketsupply of fish than the poorest socioeconomicgroups. However, this saving was small, at less thanUS$2/household/season. In addition, it could beargued that the poorest households, with less house-hold economic surplus, benefited relatively morefrom the decreased personal cash and fish contribu-tion needed to fulfil community obligations. In sum-mary, it is believed that no socioeconomic group wasbenefiting substantially more than others (Garaway1999).
However, research showed that members of thepoorest rural households most utilised local fisheryresources for their own purposes, and therefore hadthe highest total annual catches. This suggested thatif they did not have access to suitable alternativesthey would have most to lose from the restriction ofindividual access to small waterbody resourcesbrought about by stocking initiatives. While this wasthe case, it should be noted that variation betweenthe socioeconomic groups in terms of utilisation ofthe fishery was not large, and was found to be fargreater between villages (Garaway 1999).
In fact, despite loss of personal use, villagers didnot perceive they had been adversely affected byaccess restrictions. This was because either they hadother convenient places to fish or, when this was notthe case, it had been taken into consideration by therule designers and the access restrictions werecorrespondingly less severe.
There is less information available on the benefitsof stocked waterbodies and their distribution in NEThailand, but they did not seem as wide-ranging asthose in Lao PDR, the main benefit being com-munity income, the social occasion of the fish-catching day, and the use of water for buffalo andvegetable irrigation. There is little information onwhether these benefits were distributed evenly. Onestudy suggested that some of the poorer householdsdid not participate in the fish-catching day becauseof the ticket price. However, this did not appear to be
231
common (Garaway 1995). Regarding the costs oflost access to previous fishing resources, the samestudy suggested that, contrary to the situation in LaoPDR, it was middle-income farmers rather thanpoorer farmers who most utilised local fisheryresources and would therefore be most affected byaccess restrictions (Garaway 1995). Again though, inthe area studied, the loss of only one of many fisheryresources was not perceived by resource users tohave had a deleterious effect.
Evidence suggests therefore that while the natureof benefits had changed, local rules had been chosenthat distributed the new benefits evenly across socio-economic groups and accounted for local fishing forsubsistence needs.
Environmental outcomes
Information on environmental impacts is availableonly for Lao PDR.
In the comparative study of waterbodies underaccess restrictions and/or stocking or neither, it wasshown that access restrictions, even in combinationwith the stocking of exotic species, had a significantpositive effect on the standing stocks of wild fish,and there was no evidence of negative effects ontheir diversity (Lorenzen, Garaway et al. 1998). Thiswas an unexpected outcome, brought about by theaccess restrictions and selected harvesting of thelarger stocked species only for selling and enter-taining guests. While stocking is not necessary forcommunities to introduce and enforce access restric-tions, it has certainly facilitated such steps, and thenet effect has been a rapid proliferation of restrictedaccess fisheries in Savannakhet. Increased stocks inperennial small waterbodies are likely to havepositive effects on the yield from seasonal habitatssuch as paddies, and may also have conservationbenefits.
Again then, it can be seen that the changes tooperational rules catalysed by stocking had a pro-found and unanticipated effect on fishing practices,which in turn led to unexpected and, in this case,possibly desirable environmental outcomes.
Discussion
Results show that stocking initiatives have providedbenefits due to both (1) direct biological effects ofstocking (increased recruitment of valuable species),and (2) indirect effects due to institutional changeresulting from the investment in common poolresources (e.g. incentives for sustainable use, reducedfishing pressure and higher returns to labour).
However, as is also shown, outcomes have alsobeen unpredictable, different from what has been
anticipated or less than optimal. Unexpected out-comes are caused by the fact that there is still a greatdeal of uncertainty surrounding both the direct andindirect effects of stocking.
Uncertainty associated with enhancement managementFirstly, uncertainty may result from the fact that theunderlying biological processes (such as speciesinteractions) are still not fully understood, or they aresubject to ‘random’ variation linked to variation inexternal conditions (such as rainfall). Anotherproblem is that even in cases when processes areunderstood, external agents such as governments areconstrained by a lack of location-specific infor-mation (e.g. waterbody productivity, species com-position and biomass), as resources for widespreadresearch at such a specific and local level are oftenlacking. All these factors result in there being con-siderable technical uncertainty associated withstocking initiatives.
The same sources of uncertainty (lack of under-standing about the underlying processes and lack oflocation-specific information) are also relevant whenconsidering the institutional aspects of stocking initi-atives. The act of stocking often catalyses institu-tional change, but such rule changes are frequentlynot considered or not anticipated pre-intervention,and the rules and their consequent effects rarelystudied in a systematic way in ongoing initiatives.Because of this, there is still very little informationabout the underlying factors and processes that moti-vate different types of human action, actions thatultimately result in certain types of rules beingdevised and/or certain levels of rule compliance.This creates much institutional uncertainty aboutwhat changes are likely to accompany which type ofinitiative, and what institutions are likely to providethe more optimal outcome in any given set ofecological and social circumstance.
This lack of understanding is exacerbated by thefact that in many cases, even when there areresources to collect this type of information, manyanalysts are unaware of the value of doing so, insteadrelying on technical information only. Studying tech-nical and biological interactions, though essential,does not enable us to understand, predict or improveoutcomes in real settings, without understanding howthey are affected by, or in turn effect, the institutionsput in place to govern use (and investment). Eventechnical outcomes cannot be understood with refer-ence to technical variables alone. Integrated researchrecognising the inter-relationship between the tech-nical intervention, the nature of institutions, theresource and community characteristics is urgentlyrequired to address this point.

232
The uncertainty makes it difficult for externalagencies to come up with context-specific manage-ment guidelines to produce predictable and desirableoutcomes. The question to be addressed is whatapproach could such agencies take that would dealwith or reduce these uncertainties, to increase thechances of that happening.
Dealing with uncertainty through participatory adaptive learning
Some uncertainties could be reduced by having moreknowledge, pre-intervention. Others, which may betermed dynamic uncertainties (i.e. the response ofcertain variables to change), can be resolved only byactually observing them, either through time oracross systems under different management. Otheruncertainties such as ‘random’ variation in externalconditions cannot easily be reduced at all.
It is suggested here that much could be gained andmuch uncertainty reduced by external agencies andlocal communities combining their strengths througha process of participatory adaptive learning, asdescribed in Lorenzen and Garaway, 1998.
Adaptive learning has been described as a struc-tured process of ‘learning by doing’ that involveslearning processes in management rather than singlesolutions, or control, through management. Theapproach provides for an increase in knowledgeabout the resource systems in question that will, inturn, enable management policy to be refined. Toproduce this knowledge, and thereby reduce uncer-tainty, management is treated as an experimentalprocess, aimed at yielding crucial information for theimprovement of management regimes as well asmore immediate benefits for the participating stake-holders. Participatory adaptive learning requires thatthe communities affected by the stocking initiativestake an active and equal role in the experimentalprocess.
It is believed that such an approach could help toreduce the reducible uncertainties in the type of smallwaterbody enhancement management described inthis paper, more quickly and at lower cost. Such anapproach is possible because of the opportunities thatthe resource management systems described hereprovide.
Attributes of resource systems that facilitate adaptive learning
The ubiquitous nature of small waterbodies
Small waterbodies are ubiquitous throughout theenvironments being considered, and therefore thereare opportunities to observe differences across dif-ferent entities at the same time, thereby reducing the
time required for knowledge to accumulate. If thiswere done in a systematic way, there would be greatopportunities for reducing dynamic uncertainties, byfirst identifying precisely what information isrequired to reduce the uncertainty, and, secondly,carefully selecting sites to yield that information.
The presence of variation that enables comparative study
The resource systems in question already show greatvariability in terms of their biology and the institu-tions set up to govern use. This means that much canbe learnt from the careful selection and study ofexisting management resource systems without theneed for any further intervention (so-called passiveexperimentation). There may be cases where moreactive experimentation would yield substantiallymore information and, in these cases, where suchintervention can be implemented at appropriatelevels of cost and risk and with the full participationof local communities, such an approach would beappropriate.
The time-and-place knowledge of local users
One of the major uncertainties to be addressed is thelack of location-specific information. While externalagencies have not the resources to collect the infor-mation themselves, it should be recognised that localcommunities already have extensive knowledgeabout their resources, their communities, and theinstitutions they use to govern resource use. Suchknowledge should be utilised.
The research has shown that under certain circum-stances, communities can and do manage stockinginitiatives in a way that produces satisfactory, if notnecessarily, optimal, outcomes, because of their con-siderable local knowledge of the resources availableto them and the communities that utilise them.Crucially, they have a far better understanding oflocal needs and local patterns of behaviour,knowledge that they can use when considering thedesign of operational rules for management. Thismeans, in particular, that compared to externalagencies they are far more likely to be able to predictwhether certain operational rules are likely to beworkable or not (i.e. meet the needs of users, beacceptable, be monitorable, and be enforceable).External agencies could learn much from thatinformation.
The experimental approach of communities to resource management
Research has also shown that, given the opportunityto do so, communities will experiment with manage-ment through time, continually learning and
233
changing rules better to adapt them to local needsand circumstances. It suggests that the idea of exper-imentation is one that communities would embraceunder certain circumstances (e.g. suitable levels ofrisk, information about the possible benefits of suchexperimentation). Communities particularly experi-ment with rules that distribute benefits and rules thatmotivate different types of human action. Experi-mentation with technical aspects, such as stockingdensities and species combinations, is less common,as technical knowledge is limited and, particularly inLao PDR, actions depend on what is available andaffordable. Currently, with communities experi-menting in isolation and without the same technicalknowledge as external agencies, their process oflearning is slow. However, external agencies couldplay a prominent role in change.
The wider reach and technical knowledge of external agencies
As suggested in the last section, external agencieshave two vital attributes that complement com-munity extensive local knowledge. Firstly, they havetechnical scientific knowledge (or access to it).Secondly, they have knowledge of, and access to, alarge number of communities managing enhancedwaterbodies. Were external agencies to facilitatecommunication and information exchange betweencommunities (and between communities and externalagencies), this could greatly increase the knowledgebase of local communities.
The community interest in learning from the experience of other local communities
Finally, following the last point, the research con-ducted in Lao PDR has shown that communitieshave a great interest in, and benefit significantlyfrom, communicating with other communities. Thiswas a major factor that increased the chance ofsuccessful uptake of new enhancement technology inthe province. Given that interest, it is expected that,were communities fully aware of the objectives ofparticipatory adaptive learning, they would beinterested in participating in an experimentalapproach that brought together a larger number ofcommunity experiences and ultimately providedbetter information for the management of their ownenhanced fisheries.
The role of external agencies in a participatory adaptive learning approach
To best support an adaptive learning approach andhence reduce the considerable uncertainties associatedwith small waterbody enhancement, it is suggestedthat external agencies take the following steps:
• Collect initial information on key attributes of theresource systems under consideration (biological,social, and institutional) and current outcomes,with the full participation of local communitiesthrough participatory appraisals. The processshould include identifying the objectives ofenhancement management on the part of the usercommunity.
• With the aid of scientific analysis, identify wherethe greatest uncertainties (technical and institu-tional) are in the first instance, and discuss withparticipating communities what experimentalstrategies are most likely to reduce these uncer-tainties at an appropriate level of risk while stillachieving beneficial outcomes. It is at this stagethat the local knowledge of communities and thetechnical knowledge of external agencies can bemost fruitfully combined.
• Facilitate local experimentation and then localmonitoring of the outcomes of the process.
• Facilitate learning between communities, andbetween communities and external agencies,through scientific analysis, ‘study tours’ andworkshops.
• Repeat the process until it is believed that thecosts of further experimentation outweigh thebenefits that can be gained from further reducinguncertainty.
The process is a continual one of adaptation,experimentation and learning. By repeating theprocess, uncertainty can be further reduced andmanagement strategies further refined to producegreater benefits that meet the needs of the user com-munity. Such a process has rarely been tried in thefield of enhancement, and more research is requiredto assess the efficacy of the approach. Such researchis now being carried out in Department for Inter-national Development-funded project in SavannakhetProvince, Lao PDR in a joint collaboration betweenRDC, Savannakhet and MRAG Ltd, London. Theproject started in 1999 and is due to end in February2002.
Acknowledgments
The authors would like to acknowledge financialsupport for this research from the Department forInternational Development of the UK. The viewsexpressed are those of the authors and do not neces-sarily reflect the views of that agency.
234
ReferencesAIT 1993. An economic comparison of aquaculture with
cropping options for small scale farmers in NortheastThailand. AIT Aquaculture Outreach Project, WorkingPaper No 5. AIT, Bangkok.
Anderson, 1987. The development and management offisheries in small waterbodies. Symposium on the devel-opment and management of fisheries in small water-bodies, Accra, Ghana.
Chantarawarathit, N. 1989. The DOF village fisheriesproject: an analysis of its problems and impact inUdonthani Province, Thailand. MSc thesis, Bangkok:Asian Institute of Technology.
Claridge, G. 1996. An Inventory of Wetlands of the LaoPDR. IUCN Wetlands Programme, Bangkok.
Cowan, V. Aeron-Thomas, M. and Payne, I.A. 1997. Anevaluation of floodplain stock enhancement. Report,MRAG Ltd, London.
Fedoruk, A. and Leelapatra, W. 1992. Rice field fisheries inThailand. In: de la Cruz, C. ed. Rice–Fish Research andDevelopment in Asia, ICLARM, Manila, 91–104.
Garaway, C.J. 1995. Communal ponds in NE Thailandunder different use-rights systems: a participatory ruralappraisal of their differing roles in people’s livelihoods.Report. London: MRAG Ltd, 106 p.
—— 1999. Small waterbody fisheries and the potential forcommunity-led enhancement: case studies from LaoPDR. PhD thesis, University of London, 414 p.
Hartmann, W.D. 1995. Institutional development forcommon-pool resources management: a task in technicalcooperation. In: Wahl, P. ed. Reinventing the Commons.Amsterdam: Transnational Institute.
Lorenzen, K. and Garaway, C. J. 1988. How predictable isthe outcome of stocking? In: Inland Fisheries Enhance-ments. FAO Fisheries Technical Paper 374, Rome, FAO,133–152.
Lorenzen, K., Juntana, J., Bundit, J. and Tourongruang, D.1998. Assessing culture fisheries practices in small waterbodies: a study of village fisheries in Northeast Thailand.Aquaculture Research, 29: 211–224.
Lorenzen, K., Garaway, C.J., Chamsingh, B. and Warren,T.J. 1998. Effects of access restrictions and stocking onsmall waterbody fisheries in Laos. Journal of FishBiology, 53 (Supplement 1): 349–357.
Phonvisay, 1994. Inland fisheries development policies andstrategies in Lao PDR with special emphasis on theMekong Basin. Livestock and Fisheries Section, Ministryof Agriculture and Forestry, Vientiane, Lao PDR.
Prapertchop, P. 1989. Analysis of Freshwater Fish Con-sumption and Marine Product Marketing in NE Thailand.Khon Khaen University, Khon Khaen.
Samina, Z. and Worby, E. 1993. Nagashini beel: a casestudy of the transformation of a common propertyresource. NAGA, The ICLARM Quarterly, April–July1993, 7–8.

235
Effectiveness of Stocking in Reservoirs in Vietnam
Nguyen Quoc An*Abstract
There are about 2470 reservoirs of total area 184 000 ha in Vietnam (1995 data). Reservoirfisheries here mostly are stock-based. Chinese silver carp, bighead carp and grass carp are thepredominant species used for stocking. More recently, Indian carps (rohu and mrigal) have beenstocked. These species grow rapidly in southern Vietnam reservoirs, but results in the north arepoor. Common carp and tilapia can reproduce in reservoirs to some extent, so they are mostlystocked only once or twice. These two species perform better in the south than in the north. Sincemost stocked species do not reproduce, stocking needs to be done every year. The cost of stockingcan exceed the financial ability of many reservoir fishery agencies. Earlier, most State reservoirfisheries farms had losses because the value of fish sales could not recover the necessary expensesof maintaining the fishery. Between 1980 and 1990, stocking was stopped in 90% of previouslystocked reservoirs. Under recently reformed policy, private leases have sometimes generatedbenefit. The study results given by the project ‘Management of Reservoir Fisheries in the LowerMekong Basin’ in Dak Lak Province also proved the production and economical effectiveness ofstocking the reservoirs under study. Stocking in reservoirs remains an important measure fordeveloping fisheries in Vietnam reservoirs. In order to stock successfully, a series of optimalmanagement systems for different types of reservoirs should be set up, including choice of suitablespecies, species combinations, stocking size and rate, and measures for preventing escape ofstocked fish and the like. In this paper, data pertaining to the performance of stocked species indifferent sized reservoirs, and the economic feasibility of stocking are presented. Also, empiricalrelationships are derived in respect of stocking density and yield and other relevant parameters.
ACCORDING to data collected by the ResearchInstitute for Aquaculture No. 1 (RIA1) in 1993, therewere 768 reservoirs in 38 provinces with a combinedarea of 215 549 ha (Thai 1995) in Vietnam. Mostreservoirs are distributed in the midland and high-land provinces. The Institute of Fisheries Economicsand Planning (1994) data indicate about 2470 reser-voirs with a total area of 183 579 ha in the country.Among these, reservoirs greater than 5 ha in areatotal 1403, with a total area 181 176 ha (Chinh et al.1994). The current number of reservoirs must behigher because many new reservoirs have been con-structed in recent years.
From 1962 to 1970, fish culture was practised in16% of the reservoirs, occupying 48% of the totalarea. The main measure was to stock popular culturedspecies like silver carp, bighead, grass carp, mud carp,common carp and tilapia. Harvests of stocked speciescontributed 15–90% of total reservoir fish production,depending on the situation of each reservoir.
However, the fluctuation of reservoir fish productionwas closely related to the success of stockingactivities. Since 1970, intensive stocking has tendedto decline due to poor economic returns. Especiallysince 1980, economic crises and the termination ofsubsidies have led to the termination of stocking inmost reservoirs. Recently, stocking has continued andremains viable in only a few reservoirs. Among theseare small and medium-sized reservoirs in the CentralHighlands, under study by the project ‘Managementof Reservoir Fisheries In the Lower Mekong Basin’(project MRFP), where stocking appears a very effec-tive way of increasing fish production and generatingeconomic benefits. This paper presents the generalexperience of culture-based reservoir fisheries inVietnam, the role of stocking, and some relatedissues, experiences and recommendations.
Materials and Methods
Three different data sources are considered in thisreport:
*Management of Reservoir Fisheries, 68 Le Hong Phong,Ban Me Thuot, Vietnam. Email [email protected]

236
• Data collected by the author in 1970–1972 inCam-son Reservoir and in 1971–1976 in Thac-baReservoir. The catch samples were collectedsystematically, 10 days per month by the FishResources Survey Team of the Research Institutefor Aquaculture No. 1. Catch composition wasrecorded for every sample. Age structure of culti-vated species was recorded from annual rings onscales. Recapture rate was also calculated as thesum of number of fish of the same cohort fromthree continuous years of capture after stocking.Other data such as stocking cost and labour werecollected from statistical data of the localFisheries Companies.
• Data cited from published and unpublished docu-ments of the Ministry of Fisheries and RIA 1.
• Reports and raw data of MRFP Vietnam, collectedby fish biologists, 1996–1999. Catch samplesfrom reservoirs were collected systematically eachmonth. For the smallest reservoir, the biologistscensued the catch throughout the harvest period.They also were present during stocking, andobtained detailed data on species composition,weight stocked, and individual length and weight.Data for years prior to 1996 were supplied bylocal fishery agencies.
Results
Stocking status
In Vietnam, stocking has been considered a majorcomponent of reservoir fisheries management since1962. By now, the technology of artificial breedingof cultivated fish species has been successfullyapplied and provides the opportunity for supplyingmass stocking material. At the same time, a largenumber of reservoirs were built. State fisheriesagencies were set up at most newly built reservoirs.But as mentioned above, since 1970 stocking activityhas gradually declined. The government attempted toprevent the decline, but by 1993, many reservoir
fisheries all over the country had collapsed (seeTable 1).
In 1993, only 8.1% of the total area of the reser-voirs was stocked, and produced only 1028 t fish.The situation could improve if the effectiveness ofstocking can be clarified and the right measures tomanage fishing activities in reservoirs carried out.
Advantages of stocking
Effective use of natural resources
In newly built reservoirs, nutrients are rich andprovide good conditions for developing phyto-plankton and zooplankton. The average density ofphytoplankton is 1–3 million cells/L and zoo-plankton is 300–800 individuals/m3 (Table 2). Thiscompares with the density in good fish ponds, whichcan give yields of 1–2 t/ha. Among cultivatedspecies, silver carp and bighead carp are the mostsuitable species for use as food sources. Also, thequantity of detritus produced from the decompositionof terrestrial organisms is much higher than in ponds.
After the closure of the dam, water volumeincreases so quickly that the density of natural fishpopulations becomes relatively low. Moreover, lackof recruitment is common in new reservoirs. Silvercarp and bighead carp are considered the most appro-priate available species for effectively using the foodsources in new reservoirs. Meanwhile, benthicfeeders like common carp and tilapia can also beconsidered for stocking since they utilise insectlarvae and small crustacea like fresh water shrimp.Mud carp utilise periphyton.
In Thac-ba Reservoir, much money was spent tobuild fishing grounds by cutting down trees, makingparts of the bottom even, and other measures to makeharvesting easier. However, the work had practicallyno effect because fish did not concentrate in clearedplaces. In some small reservoirs where the forest wascut and burned, like Suoi-hai and Van-truc reser-voirs, the natural food available was so poor that thereservoirs had very short eutrophic periods and
Table 1. General status of reservoir fisheries in Vietnam in 1993.
Regions Total reservoir area (ha)
Under stocking Production
No.(%)
Area(%)
Total catch(t)
Productivitykg/ha
Northern provinces 63 667 3.4 10.3 370.4 56.4Northern Central provinces 20 775 33.9 8.9 92 50.0Southern Central provinces 11 196 7.1 43.9 192 39.1Central Plateau 12 424 3.2 3.2 59.5 150.6Eastern Mekong region 73 105 19.0 1.3 314 330.9Total 181 167 7.6 8.1 1027.9 70.1
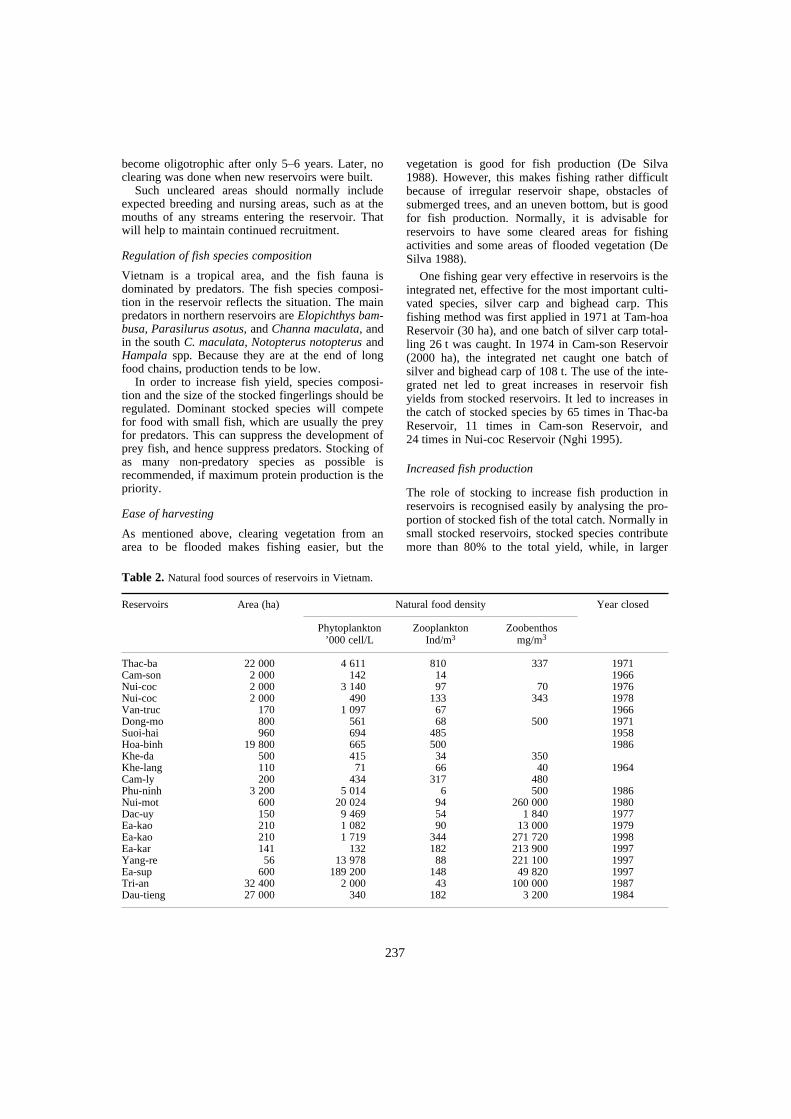
237
become oligotrophic after only 5–6 years. Later, noclearing was done when new reservoirs were built.
Such uncleared areas should normally includeexpected breeding and nursing areas, such as at themouths of any streams entering the reservoir. Thatwill help to maintain continued recruitment.
Regulation of fish species composition
Vietnam is a tropical area, and the fish fauna isdominated by predators. The fish species composi-tion in the reservoir reflects the situation. The mainpredators in northern reservoirs are Elopichthys bam-busa, Parasilurus asotus, and Channa maculata, andin the south C. maculata, Notopterus notopterus andHampala spp. Because they are at the end of longfood chains, production tends to be low.
In order to increase fish yield, species composi-tion and the size of the stocked fingerlings should beregulated. Dominant stocked species will competefor food with small fish, which are usually the preyfor predators. This can suppress the development ofprey fish, and hence suppress predators. Stocking ofas many non-predatory species as possible isrecommended, if maximum protein production is thepriority.
Ease of harvesting
As mentioned above, clearing vegetation from anarea to be flooded makes fishing easier, but the
vegetation is good for fish production (De Silva1988). However, this makes fishing rather difficultbecause of irregular reservoir shape, obstacles ofsubmerged trees, and an uneven bottom, but is goodfor fish production. Normally, it is advisable forreservoirs to have some cleared areas for fishingactivities and some areas of flooded vegetation (DeSilva 1988).
One fishing gear very effective in reservoirs is theintegrated net, effective for the most important culti-vated species, silver carp and bighead carp. Thisfishing method was first applied in 1971 at Tam-hoaReservoir (30 ha), and one batch of silver carp total-ling 26 t was caught. In 1974 in Cam-son Reservoir(2000 ha), the integrated net caught one batch ofsilver and bighead carp of 108 t. The use of the inte-grated net led to great increases in reservoir fishyields from stocked reservoirs. It led to increases inthe catch of stocked species by 65 times in Thac-baReservoir, 11 times in Cam-son Reservoir, and24 times in Nui-coc Reservoir (Nghi 1995).
Increased fish production
The role of stocking to increase fish production inreservoirs is recognised easily by analysing the pro-portion of stocked fish of the total catch. Normally insmall stocked reservoirs, stocked species contributemore than 80% to the total yield, while, in larger
Table 2. Natural food sources of reservoirs in Vietnam.
Reservoirs Area (ha) Natural food density Year closed
Phytoplankton’000 cell/L
Zooplankton Ind/m3
Zoobenthos mg/m3
Thac-ba 22 000 4 611 810 337 1971Cam-son 2 000 142 14 1966Nui-coc 2 000 3 140 97 70 1976Nui-coc 2 000 490 133 343 1978Van-truc 170 1 097 67 1966Dong-mo 800 561 68 500 1971Suoi-hai 960 694 485 1958Hoa-binh 19 800 665 500 1986Khe-da 500 415 34 350Khe-lang 110 71 66 40 1964Cam-ly 200 434 317 480Phu-ninh 3 200 5 014 6 500 1986Nui-mot 600 20 024 94 260 000 1980Dac-uy 150 9 469 54 1 840 1977Ea-kao 210 1 082 90 13 000 1979Ea-kao 210 1 719 344 271 720 1998Ea-kar 141 132 182 213 900 1997Yang-re 56 13 978 88 221 100 1997Ea-sup 600 189 200 148 49 820 1997Tri-an 32 400 2 000 43 100 000 1987Dau-tieng 27 000 340 182 3 200 1984
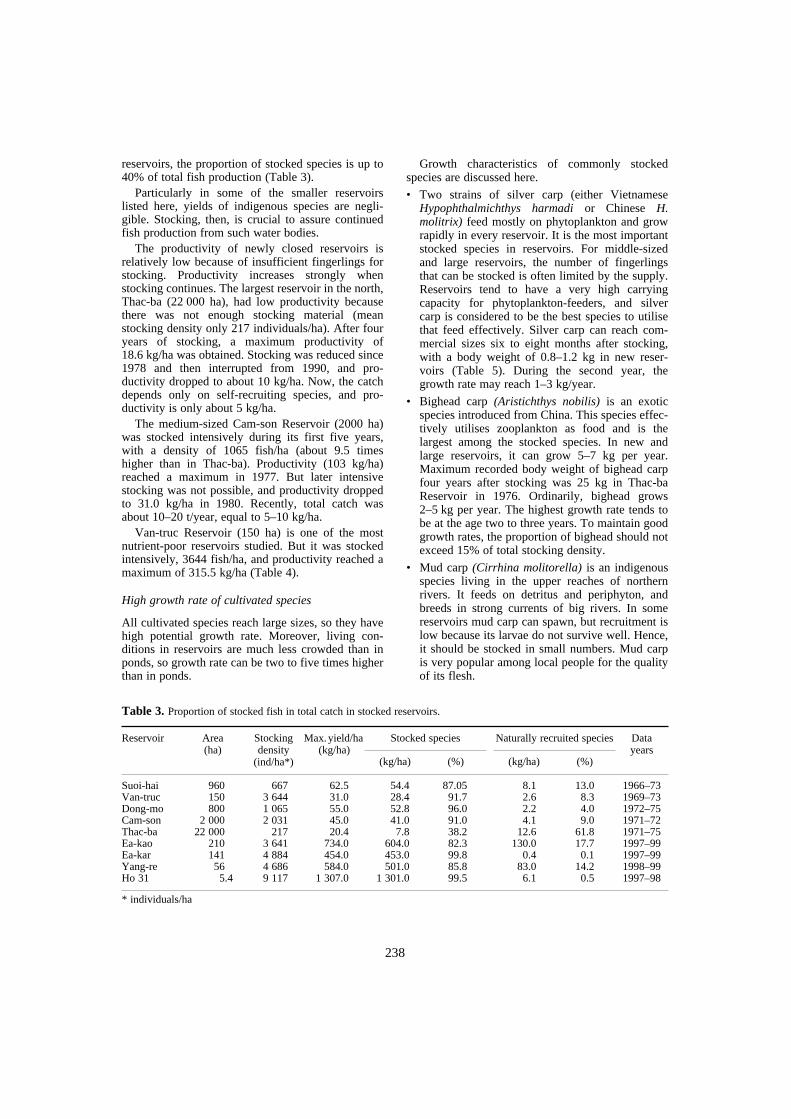
238
reservoirs, the proportion of stocked species is up to40% of total fish production (Table 3).
Particularly in some of the smaller reservoirslisted here, yields of indigenous species are negli-gible. Stocking, then, is crucial to assure continuedfish production from such water bodies.
The productivity of newly closed reservoirs isrelatively low because of insufficient fingerlings forstocking. Productivity increases strongly whenstocking continues. The largest reservoir in the north,Thac-ba (22 000 ha), had low productivity becausethere was not enough stocking material (meanstocking density only 217 individuals/ha). After fouryears of stocking, a maximum productivity of18.6 kg/ha was obtained. Stocking was reduced since1978 and then interrupted from 1990, and pro-ductivity dropped to about 10 kg/ha. Now, the catchdepends only on self-recruiting species, and pro-ductivity is only about 5 kg/ha.
The medium-sized Cam-son Reservoir (2000 ha)was stocked intensively during its first five years,with a density of 1065 fish/ha (about 9.5 timeshigher than in Thac-ba). Productivity (103 kg/ha)reached a maximum in 1977. But later intensivestocking was not possible, and productivity droppedto 31.0 kg/ha in 1980. Recently, total catch wasabout 10–20 t/year, equal to 5–10 kg/ha.
Van-truc Reservoir (150 ha) is one of the mostnutrient-poor reservoirs studied. But it was stockedintensively, 3644 fish/ha, and productivity reached amaximum of 315.5 kg/ha (Table 4).
High growth rate of cultivated species
All cultivated species reach large sizes, so they havehigh potential growth rate. Moreover, living con-ditions in reservoirs are much less crowded than inponds, so growth rate can be two to five times higherthan in ponds.
Growth characteristics of commonly stockedspecies are discussed here.
• Two strains of silver carp (either VietnameseHypophthalmichthys harmadi or Chinese H.molitrix) feed mostly on phytoplankton and growrapidly in every reservoir. It is the most importantstocked species in reservoirs. For middle-sizedand large reservoirs, the number of fingerlingsthat can be stocked is often limited by the supply.Reservoirs tend to have a very high carryingcapacity for phytoplankton-feeders, and silvercarp is considered to be the best species to utilisethat feed effectively. Silver carp can reach com-mercial sizes six to eight months after stocking,with a body weight of 0.8–1.2 kg in new reser-voirs (Table 5). During the second year, thegrowth rate may reach 1–3 kg/year.
• Bighead carp (Aristichthys nobilis) is an exoticspecies introduced from China. This species effec-tively utilises zooplankton as food and is thelargest among the stocked species. In new andlarge reservoirs, it can grow 5–7 kg per year.Maximum recorded body weight of bighead carpfour years after stocking was 25 kg in Thac-baReservoir in 1976. Ordinarily, bighead grows2–5 kg per year. The highest growth rate tends tobe at the age two to three years. To maintain goodgrowth rates, the proportion of bighead should notexceed 15% of total stocking density.
• Mud carp (Cirrhina molitorella) is an indigenousspecies living in the upper reaches of northernrivers. It feeds on detritus and periphyton, andbreeds in strong currents of big rivers. In somereservoirs mud carp can spawn, but recruitment islow because its larvae do not survive well. Hence,it should be stocked in small numbers. Mud carpis very popular among local people for the qualityof its flesh.
* individuals/ha
Table 3. Proportion of stocked fish in total catch in stocked reservoirs.
Reservoir Area(ha)
Stocking density
(ind/ha*)
Max. yield/ha (kg/ha)
Stocked species Naturally recruited species Data years
(kg/ha) (%) (kg/ha) (%)
Suoi-hai 960.0 667 62.5 54.4 87.05 8.1 13.0 1966–73Van-truc 150.0 3 644 31.0 28.4 91.7 2.6 8.3 1969–73Dong-mo 800.0 1 065 55.0 52.8 96.0 2.2 4.0 1972–75Cam-son 2 000.0 2 031 45.0 41.0 91.0 4.1 9.0 1971–72Thac-ba 22 000.0 217 20.4 7.8 38.2 12.6 61.8 1971–75Ea-kao 210.0 3 641 734.0 604.0 82.3 130.0 17.7 1997–99Ea-kar 141.0 4 884 454.0 453.0 99.8 0.4 0.1 1997–99Yang-re 56.0 4 686 584.0 501.0 85.8 83.0 14.2 1998–99Ho 31 5.4 9 117 1 307.0 1 301.0 99.5 6.1 0.5 1997–98
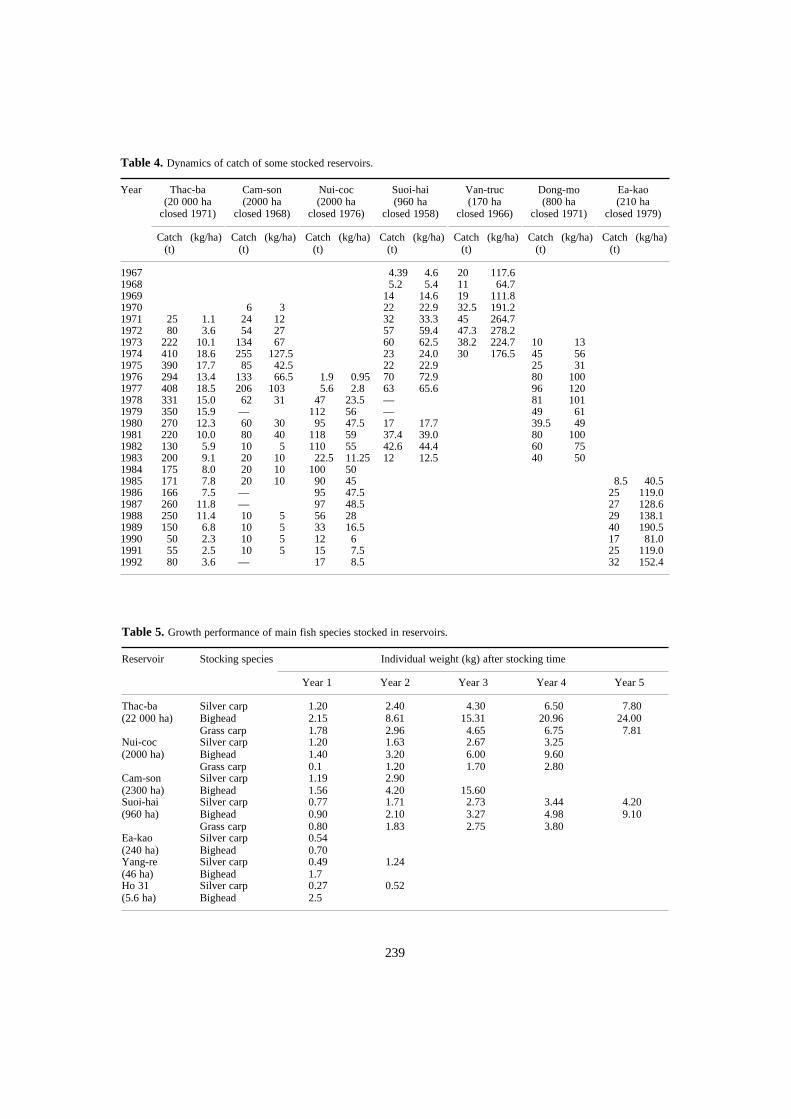
239
Table 4. Dynamics of catch of some stocked reservoirs.
Year Thac-ba(20 000 ha
closed 1971)
Cam-son(2000 ha
closed 1968)
Nui-coc(2000 ha
closed 1976)
Suoi-hai(960 ha
closed 1958)
Van-truc(170 ha
closed 1966)
Dong-mo(800 ha
closed 1971)
Ea-kao(210 ha
closed 1979)
Catch (t)
(kg/ha) Catch (t)
(kg/ha) Catch (t)
(kg/ha) Catch (t)
(kg/ha) Catch (t)
(kg/ha) Catch (t)
(kg/ha) Catch (t)
(kg/ha)
1967 4.39 4.6 20 117.61968 5.2 5.4 11 64.71969 14 14.6 19 111.81970 6 3 22 22.9 32.5 191.21971 25 1.1 24 12 32 33.3 45 264.71972 80 3.6 54 27 57 59.4 47.3 278.21973 222 10.1 134 67 60 62.5 38.2 224.7 10 131974 410 18.6 255 127.5 23 24.0 30 176.5 45 561975 390 17.7 85 42.5 22 22.9 25 311976 294 13.4 133 66.5 1.9 0.95 70 72.9 80 1001977 408 18.5 206 103 5.6 2.8 63 65.6 96 1201978 331 15.0 62 31 47 23.5 — 81 1011979 350 15.9 — 112 56 — 49 611980 270 12.3 60 30 95 47.5 17 17.7 39.5 491981 220 10.0 80 40 118 59 37.4 39.0 80 1001982 130 5.9 10 5 110 55 42.6 44.4 60 751983 200 9.1 20 10 22.5 11.25 12 12.5 40 501984 175 8.0 20 10 100 501985 171 7.8 20 10 90 45 8.5 40.51986 166 7.5 — 95 47.5 25 119.01987 260 11.8 — 97 48.5 27 128.61988 250 11.4 10 5 56 28 29 138.11989 150 6.8 10 5 33 16.5 40 190.51990 50 2.3 10 5 12 6 17 81.01991 55 2.5 10 5 15 7.5 25 119.01992 80 3.6 — 17 8.5 32 152.4
Table 5. Growth performance of main fish species stocked in reservoirs.
Reservoir Stocking species Individual weight (kg) after stocking time
Year 1 Year 2 Year 3 Year 4 Year 5
Thac-ba(22 000 ha)
Silver carpBigheadGrass carp
1.202.151.78
2.408.612.96
4.3015.314.65
6.5020.966.75
7.8024.007.81
Nui-coc(2000 ha)
Silver carpBigheadGrass carp
1.201.400.1
1.633.201.20
2.676.001.70
3.259.602.80
Cam-son(2300 ha)
Silver carpBighead
1.191.56
2.904.20 15.60
Suoi-hai(960 ha)
Silver carpBigheadGrass carp
0.770.900.80
1.712.101.83
2.733.272.75
3.444.983.80
4.209.10
Ea-kao(240 ha)
Silver carpBighead
0.540.70
Yang-re(46 ha)
Silver carpBighead
0.491.7
1.24
Ho 31(5.6 ha)
Silver carpBighead
0.272.5
0.52

240
• Grass carp (Ctenopharyngodon idellus) is anexotic species introduced from China in 1962. Itfeeds on aquatic and terrestrial plants. Growth rateof grass carp in reservoirs is relatively low com-pared with silver and bighead carp. Productiontends to depend on the availability of aquaticmacrophytes, which varies greatly from reservoirto reservoir. Usually, it is stocked in limited quan-tities and does not breed in Vietnamese reservoirs.
• Tilapia, Oreochromis mossambicus, is popular inthe north and O. niloticus in the south. Tilapiadevelop rather well in small and shallow reser-voirs. In northern reservoirs, O. mossambicus canreach a maximal body weight of 0.5 kg at fiveyears of age. It can reproduce in reservoirs, tosome extent. In Van-truc Reservoir (150 ha, Vinh-phu Province) during 1967–1972, tilapia averaged9.55% of the total catch. Maximum yield in 1967was 19.0 t, 40% of the total catch. In Dong-tranhReservoir (41 ha, Luong-son District, Hoa-binhProvince), tilapia contributed 15% to the totalcatch (1966). In the south, O. niloticus contributedon average 4.7% to the total catch in Ea KaoReservoir, but in other southern reservoirs, theyield is usually less than 0.1% of the catch.
• Common carp (Cyprinus carpio) can breed inmost reservoirs, so small quantities should be
stocked in new reservoirs to supplement recruit-ment. Harvesting this bottom-living species can bevery difficult, so common carp is not recom-mended for stocking deep reservoirs and thosewith uneven bottom. Common carp displays a lowgrowth rate and low production in old northernreservoirs because of a lack of suitable naturalfood. However, growth rate in some southernreservoirs is high. Besides their high productivity, the pelagic
Chinese carps are popular for stocking because theyare easily caught by various gear, in contrast to morebenthic species.
Relationship between stocking density and yield
The general relationship between stocking densityand fish production is presented in Figure 1. Asthe above-mentioned cultivated species contribute30–99% of the total catch of the reservoir, fishproduction is closely related to stocking density andrecapture rate. The dynamics tend to be unique toeach reservoir, and as such a wide scatter is seen.
In small reservoirs like Ho-31, there are no self-recruited species so the catch depends on stocking.When the density exceeds optimum levels, growthand sometimes survival can be affected, andproduction, at best, does not increase much. For
Figure 1. General relationship between stocking and total catch in reservoirs.
1400
1200
1000
800
600
400
200
0
Fis
h pr
oduc
tivity
(kg
/ha)
0 1000 2000 3000 4000 5000 6000 7000 8000 9000 10 000
Stocking density (Ind./ha)
y = 0.1231xR2 = 0.7749
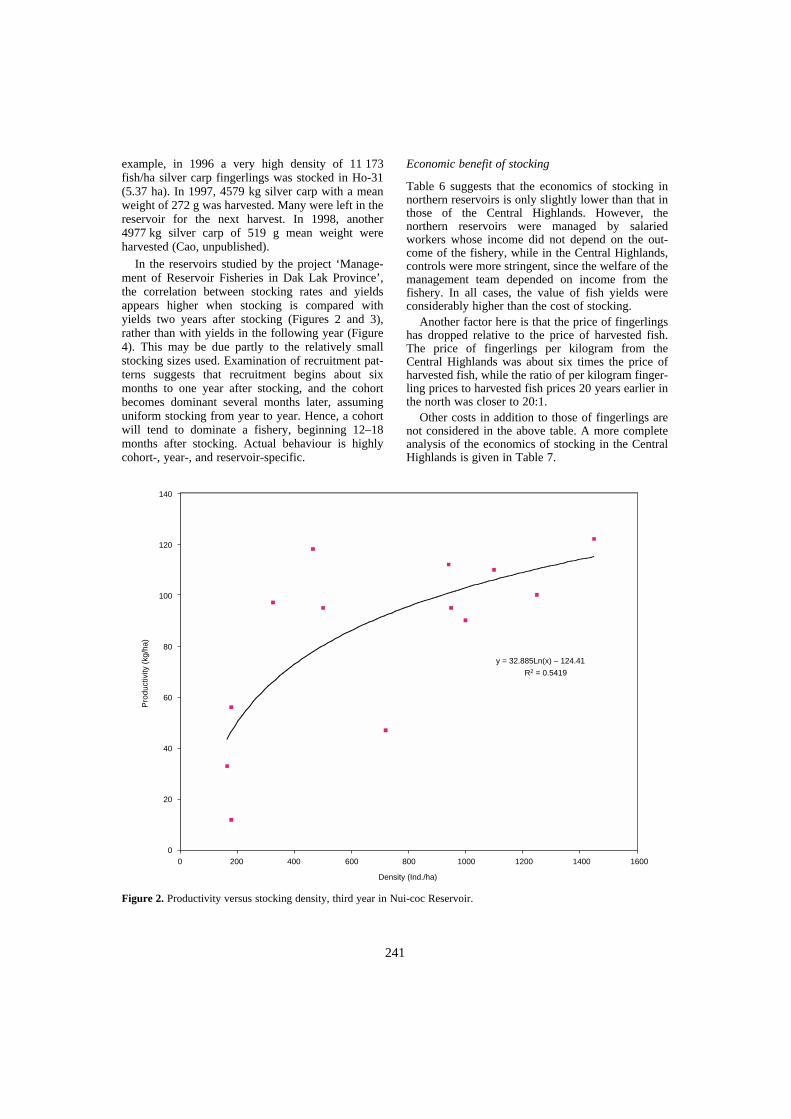
241
example, in 1996 a very high density of 11 173fish/ha silver carp fingerlings was stocked in Ho-31(5.37 ha). In 1997, 4579 kg silver carp with a meanweight of 272 g was harvested. Many were left in thereservoir for the next harvest. In 1998, another4977 kg silver carp of 519 g mean weight wereharvested (Cao, unpublished).
In the reservoirs studied by the project ‘Manage-ment of Reservoir Fisheries in Dak Lak Province’,the correlation between stocking rates and yieldsappears higher when stocking is compared withyields two years after stocking (Figures 2 and 3),rather than with yields in the following year (Figure4). This may be due partly to the relatively smallstocking sizes used. Examination of recruitment pat-terns suggests that recruitment begins about sixmonths to one year after stocking, and the cohortbecomes dominant several months later, assuminguniform stocking from year to year. Hence, a cohortwill tend to dominate a fishery, beginning 12–18months after stocking. Actual behaviour is highlycohort-, year-, and reservoir-specific.
Economic benefit of stocking
Table 6 suggests that the economics of stocking innorthern reservoirs is only slightly lower than that inthose of the Central Highlands. However, thenorthern reservoirs were managed by salariedworkers whose income did not depend on the out-come of the fishery, while in the Central Highlands,controls were more stringent, since the welfare of themanagement team depended on income from thefishery. In all cases, the value of fish yields wereconsiderably higher than the cost of stocking.
Another factor here is that the price of fingerlingshas dropped relative to the price of harvested fish.The price of fingerlings per kilogram from theCentral Highlands was about six times the price ofharvested fish, while the ratio of per kilogram finger-ling prices to harvested fish prices 20 years earlier inthe north was closer to 20:1.
Other costs in addition to those of fingerlings arenot considered in the above table. A more completeanalysis of the economics of stocking in the CentralHighlands is given in Table 7.
Figure 2. Productivity versus stocking density, third year in Nui-coc Reservoir.
140
120
100
80
60
40
20
0
Pro
duct
ivity
(kg
/ha)
0 200 400 600 800 1000 1200 1400 1600
Density (Ind./ha)
y = 32.885Ln(x) – 124.41
R2 = 0.5419
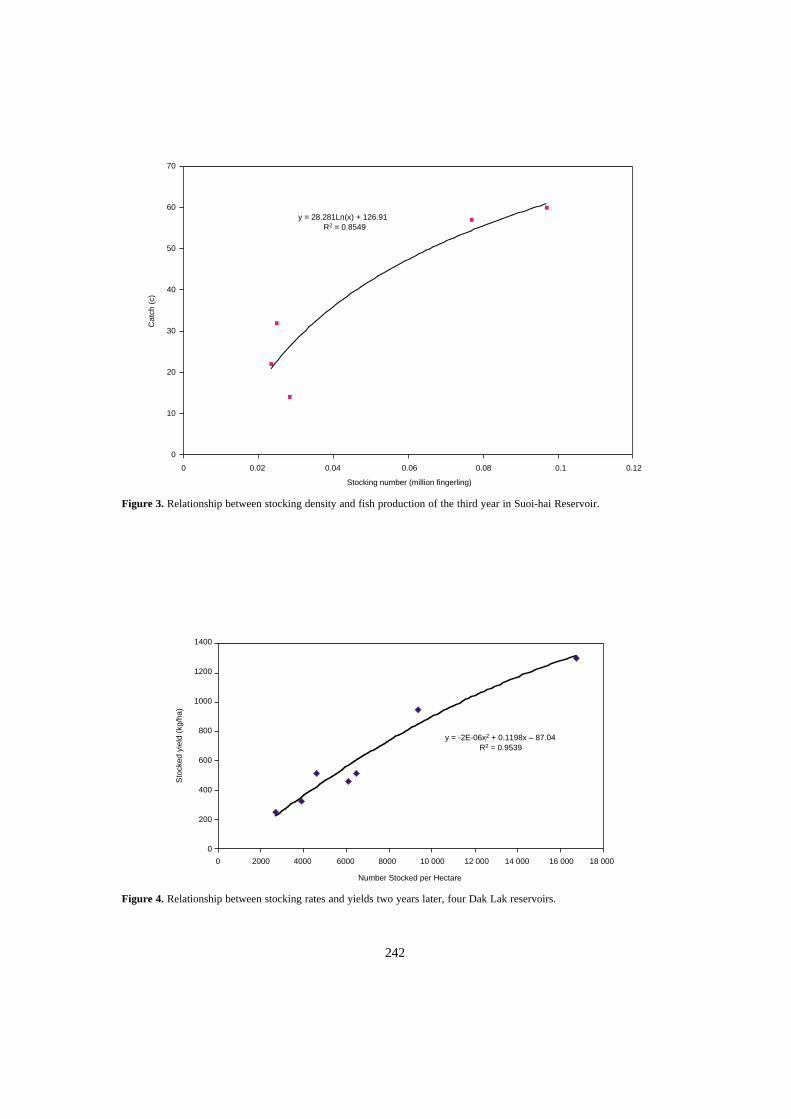
242
Figure 3. Relationship between stocking density and fish production of the third year in Suoi-hai Reservoir.
Figure 4. Relationship between stocking rates and yields two years later, four Dak Lak reservoirs.
70
60
50
40
30
20
10
0
Cat
ch (
c)
0 0.02 0.04 0.06 0.08 0.1 0.12
Stocking number (million fingerling)
y = 28.281Ln(x) + 126.91R2 = 0.8549
1400
1200
1000
800
600
400
200
0
Sto
cked
yie
ld (
kg/h
a)
0 2000 4000 6000 8000 10 000 12 000 14 000 16 000 18 000
Number Stocked per Hectare
y = -2E-06x2 + 0.1198x – 87.04R2 = 0.9539

243
‘Other costs’ in Table 7 does not include fees paidto fishers. When only stocking costs are considered,returns per hectare tended to drop with increasingreservoir area, and returns on investment (benefit tocost ratio) tend to increase with reservoir area.Although the economic efficiency of the operationscan be improved in some ways, in all cases stockingproved economically viable.
Recapture rate of stocked species:
In order to ensure a high survival rate for stockedfish in reservoirs, fish seed must be large enough.Theoretically, Chinese carp should be 8–12 cm, butdue to a lack of rearing ponds and high costs, onlysmaller (3–5 cm) fingerlings were stocked in mostreservoirs.
In large and middle-sized northern reservoirs, thefish are recruited about one year after stocking, butare caught mainly in years 2 to 4 (Table 8). Themethod used here has been applied in order to esti-mate recapture rates in the other reservoirs listed inTable 9. Hence, effectiveness of stocking can beassessed only after many years of research.
Recovery rates tend to be inversely related toreservoir size (Table 9). Exceptions exist, such as TamHoa, a new reservoir with a high predator population.Recapture rates often are higher in slightly olderreservoirs after predator populations diminish.
In general, recapture rates for silver and bigheadcarp in northern reservoirs tend to range from 10% to15% in small to medium-sized reservoirs, and lessthan 5% in larger ones (Table 10). Stocking in larger
Table 6. Economics of stocking in some Central Highlands reservoirs 1996–99.
Reservoir Year Stocked cost (VND) Harvested value (VND) Net benefit (VND) Benefit: cost ratio
Suoi Hai 1974 25 317 221 521 196 204 7.75Dong Mo 1974 30 594 195 328 164 734 5.38Ho 31 1996 9 000 18 686 9 686 1.08
1997 6 015 32 867 26 852 4.461998 3 910 29 554 25 644 6.56
Yang Re 1997 28 968 249 569 220 601 7.621998 6 971 168 150 161 179 23.12
Ea-kar 1996 33 525 326 849 293 324 8.751997 34 791 469 135 434 344 12.481998 40 742 329 736 288 994 7.09
Ea-kao 1996 29 525 545 996 516 471 17.491997 20 430 495 384 474 954 23.251998 31 412 250 642 219 230 6.98
Table 7. Economics of stocking in some Central Highlands reservoirs, 1996–99.
Year Invest cost (1000 VND) Harvest value in year +1
(1000 VND)
Net benefit(1000 VND)
Net benefit/ha (1000 VND)
Net benefit: invest cost
Stocking Others
Ho-31 Reservoir (5.37 ha)1996 9 000 4 800 18 606 4 806 895 0.341997 6 015 4 800 32 867 22 052 4 107 2.041998 3 910 4 800 29 554 20 844 3 882 2.39
Yang-Re Reservoir (56 ha)1997 28 968 31 000 249 569 189 601 3 386 3.161998 6 971 31 000 168 150 130 179 2 325 3.43
Ea-Kar Reservoir (141 ha)1996 33 525 103 100 326 849 190 224 1 349 1.391997 34 791 103 100 469 135 331 244 2 349 2.401998 40 742 103 100 329 736 185 894 1 318 1.29
Ea-Kao Reservoir (210 ha)1996 29 525 83 000 545 996 433 471 2 064 3.851997 20 430 83 000 495 384 391 954 1 866 3.791998 31 412 83 000 250 642 136 230 649 1.19
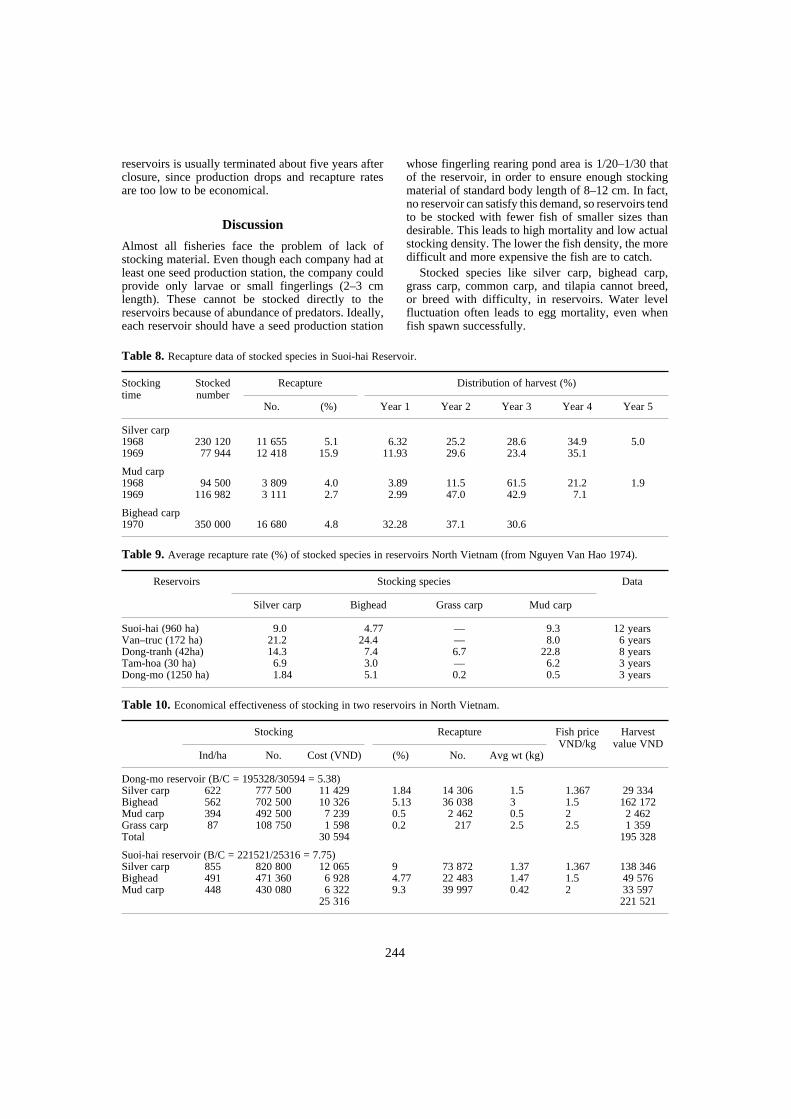
244
reservoirs is usually terminated about five years afterclosure, since production drops and recapture ratesare too low to be economical.
Discussion
Almost all fisheries face the problem of lack ofstocking material. Even though each company had atleast one seed production station, the company couldprovide only larvae or small fingerlings (2–3 cmlength). These cannot be stocked directly to thereservoirs because of abundance of predators. Ideally,each reservoir should have a seed production station
whose fingerling rearing pond area is 1/20–1/30 thatof the reservoir, in order to ensure enough stockingmaterial of standard body length of 8–12 cm. In fact,no reservoir can satisfy this demand, so reservoirs tendto be stocked with fewer fish of smaller sizes thandesirable. This leads to high mortality and low actualstocking density. The lower the fish density, the moredifficult and more expensive the fish are to catch.
Stocked species like silver carp, bighead carp,grass carp, common carp, and tilapia cannot breed,or breed with difficulty, in reservoirs. Water levelfluctuation often leads to egg mortality, even whenfish spawn successfully.
Table 8. Recapture data of stocked species in Suoi-hai Reservoir.
Stocking time
Stocked number
Recapture Distribution of harvest (%)
No. (%) Year 1 Year 2 Year 3 Year 4 Year 5
Silver carp1968 230 120 11 655 5.1 6.32 25.2 28.6 34.9 5.01969 77 944 12 418 15.9 11.93 29.6 23.4 35.1
Mud carp1968 94 500 3 809 4.0 3.89 11.5 61.5 21.2 1.91969 116 982 3 111 2.7 2.99 47.0 42.9 7.1
Bighead carp1970 350 000 16 680 4.8 32.28 37.1 30.6
Table 9. Average recapture rate (%) of stocked species in reservoirs North Vietnam (from Nguyen Van Hao 1974).
Reservoirs Stocking species Data
Silver carp Bighead Grass carp Mud carp
Suoi-hai (960 ha) 9.0 4.77 — 9.3 12 yearsVan–truc (172 ha) 21.2 24.4 — 8.0 6 yearsDong-tranh (42ha) 14.3 7.4 6.7 22.8 8 yearsTam-hoa (30 ha) 6.9 3.0 — 6.2 3 yearsDong-mo (1250 ha) 1.84 5.1 0.2 0.5 3 years
Table 10. Economical effectiveness of stocking in two reservoirs in North Vietnam.
Stocking Recapture Fish price VND/kg
Harvest value VND
Ind/ha No. Cost (VND) (%) No. Avg wt (kg)
Dong-mo reservoir (B/C = 195328/30594 = 5.38)Silver carp 622 777 500 11 429 1.84 14 306 1.5 1.367 29 334Bighead 562 702 500 10 326 5.13 36 038 3 1.5 162 172Mud carp 394 492 500 7 239 0.5 2 462 0.5 2 2 462Grass carp 87 108 750 1 598 0.2 217 2.5 2.5 1 359Total 30 594 195 328
Suoi-hai reservoir (B/C = 221521/25316 = 7.75)Silver carp 855 820 800 12 065 9 73 872 1.37 1.367 138 346Bighead 491 471 360 6 928 4.77 22 483 1.47 1.5 49 576Mud carp 448 430 080 6 322 9.3 39 997 0.42 2 33 597
25 316 221 521
245
Because of the small size of the stocking material,the great majority is consumed by predators beforerecruitment. In rare cases when fish can spawn inreservoirs, recruitment is often very low because ofthe very low survival rate. Hence, continued stockingis required. Interruptions to stocking lead to reducedfish production immediately, the following year.
The cost of catching fish in reservoirs can berather high. In recent years, gill-nets have become apopular fishing gear. However, the current in reser-voirs is weak so it has a relatively low effect. More-over, fishing gear is quickly worn out because ofdifferent kinds of obstacles like rocks and trees. Lowyields in reservoirs led to increases in fishing effort,in the past. All these problems caused high cost offishing and low returns.
In 1980, the country faced a long economic crisis.The situation affected developing fisheries in reser-voirs. Many reservoir fisheries companies could notmaintain their staff by selling fish products. Thegovernment stopped supplying money for stockingand other expenses, and even many of the strongestcompanies could not exist on their own. Staffnumbers were reduced. Stocking was discontinued.Now most are carrying out their business only byfishing natural stocks. More recently, in some newlybuilt reservoirs, some State fisheries companies arestill stocking, as they have enough money and thestocking is cost-effective.
Stocking fish to the reservoir can improve qualityof fish fauna, increase reservoir productivity, andhence increase fish yield. But, after many years ofexperience, it was realised that stocking could not becontinued, because the State fisheries companiescould not solve the management problems thatobstructed them.
Conclusions
Stocking in reservoirs is effective in increasing fishproduction. Good results are still obtained in smalland middle-sized reservoirs, but in large reservoirs,the work has led to almost no result.
Stocking with small fingerlings is popular inreservoir fisheries in Vietnam, and has led to a recap-ture rate of 20–30% in small reservoirs and 10–15%in middle-sized reservoirs.
In the small to medium-sized reservoirs of theCentral Highlands, stocking remains economicallyviable. Returns appear highest with silver and bigheadcarp, which have high production potential, achieve alarge size, and are relatively easy to harvest. Thesespecies normally occupy unexploited niches, and asplankton feeders, have very high production potential.
Fisheries management should be by a group ofindividuals whose welfare depends on the results of
the fishery, and who can cooperate with fishers tomanage reservoirs together in order to assureequitable distribution of benefits.
Preserving or creating spawning grounds foruseful species, restricting harvest of spawners inspawning season and in spawning grounds, and othermeasures are needed to maintain the wild fish fauna.While it cannot increase fish production as much asstocking, it requires only relatively small investment.
Especially in old reservoirs, fish productivity isnormally low, and fishery potential is limited. Theintroduction of fish culture may increase economicoutput. Cage-fish culture should be consideredbecause of the large areas available and relativelyclean water. Moreover, pollution from cage cultureshould be low in reservoirs with deep water and ahigh flushing rate. Limits will also apply, so con-sideration is needed as to who should get cages, howmany cages should be placed, and where cagesshould be placed.
AcknowledgmentsThis paper presents the work of all fish biologists ofMRCP Vietnam component staff: Phan Dinh Phuc,Vo The Dung, Nguyen Quoc Nghi, Thai NgocChien, Do Tinh Loi, Tran Thanh Viet, Nguyen NgocVinh, and Phan Thuong Huy. Mr John Sollows gavevaluable comments and spent time correcting theEnglish manuscript. The author presents his sincerethanks to them all.
ReferencesDe Silva, S.S. 1988. Reservoir bed preparation in relation
to fisheries development: an evaluation. In: De Silva,S.S. ed. Reservoir Fishery Management and Develop-ment in Asia, IDRC, Ottowa, Canada, 121–130.
Dinh Trong Thai, 1995. Reservoir fisheries status andfuture developing plan. Proceedings of the SecondNational Reservoir Fisheries Workshop, Ha-bac 7/1995,2–10.
Nguyen Duy Chinh, et al. 1994. General Reservoir FisheriesDevelopment Plan for 1995–2010 Period. Institute ofEconomy and Planning for Fisheries; Hanoi, Dec.1994,103 p.
Nguyen Huu Nghi, 1995. Achievements, weakness andtendencies for development fishing method in reservoir.Proceedings of the Second National Reservoir FisheriesWorkshop, Ha-bac 7/1995, 25–30.
Truong Van Cao. Fisheries management and harvest statusin Ho 31 reservoir, Dac-lac province, National Seminar‘Reservoir Fisheries Management’, Nha-trang, May1999 (unpubl.) 5 p.
Nguyen Van Hao, 1974. Results of study on reservoirfisheries in small and middle size reservoirs NorthVietnam, National Seminar ‘Aquaculture in NorthVietnam’, 8–15 October 1974, Kien-xuong District,Thai-binh Province, 11p.
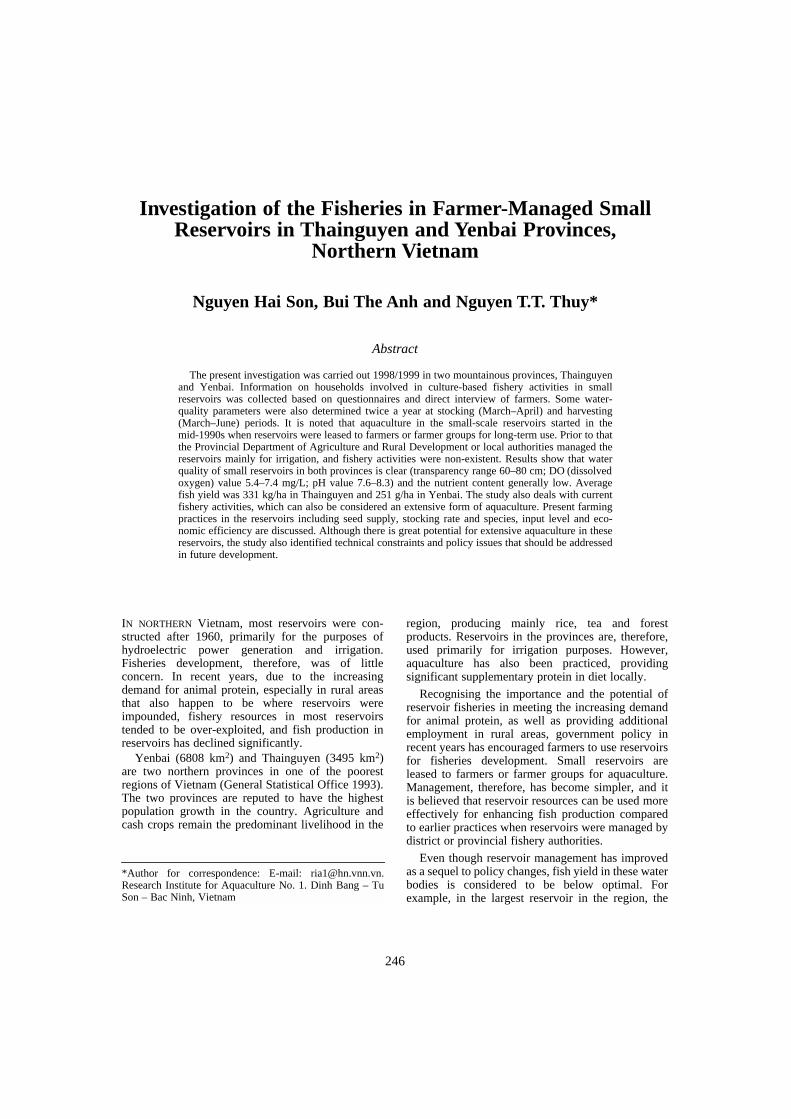
246
Investigation of the Fisheries in Farmer-Managed Small Reservoirs in Thainguyen and Yenbai Provinces,
Northern Vietnam
Nguyen Hai Son, Bui The Anh and Nguyen T.T. Thuy*
Abstract
The present investigation was carried out 1998/1999 in two mountainous provinces, Thainguyenand Yenbai. Information on households involved in culture-based fishery activities in smallreservoirs was collected based on questionnaires and direct interview of farmers. Some water-quality parameters were also determined twice a year at stocking (March–April) and harvesting(March–June) periods. It is noted that aquaculture in the small-scale reservoirs started in themid-1990s when reservoirs were leased to farmers or farmer groups for long-term use. Prior to thatthe Provincial Department of Agriculture and Rural Development or local authorities managed thereservoirs mainly for irrigation, and fishery activities were non-existent. Results show that waterquality of small reservoirs in both provinces is clear (transparency range 60–80 cm; DO (dissolvedoxygen) value 5.4–7.4 mg/L; pH value 7.6–8.3) and the nutrient content generally low. Averagefish yield was 331 kg/ha in Thainguyen and 251 g/ha in Yenbai. The study also deals with currentfishery activities, which can also be considered an extensive form of aquaculture. Present farmingpractices in the reservoirs including seed supply, stocking rate and species, input level and eco-nomic efficiency are discussed. Although there is great potential for extensive aquaculture in thesereservoirs, the study also identified technical constraints and policy issues that should be addressedin future development.
IN NORTHERN Vietnam, most reservoirs were con-structed after 1960, primarily for the purposes ofhydroelectric power generation and irrigation.Fisheries development, therefore, was of littleconcern. In recent years, due to the increasingdemand for animal protein, especially in rural areasthat also happen to be where reservoirs wereimpounded, fishery resources in most reservoirstended to be over-exploited, and fish production inreservoirs has declined significantly.
Yenbai (6808 km2) and Thainguyen (3495 km2)are two northern provinces in one of the poorestregions of Vietnam (General Statistical Office 1993).The two provinces are reputed to have the highestpopulation growth in the country. Agriculture andcash crops remain the predominant livelihood in the
region, producing mainly rice, tea and forestproducts. Reservoirs in the provinces are, therefore,used primarily for irrigation purposes. However,aquaculture has also been practiced, providingsignificant supplementary protein in diet locally.
Recognising the importance and the potential ofreservoir fisheries in meeting the increasing demandfor animal protein, as well as providing additionalemployment in rural areas, government policy inrecent years has encouraged farmers to use reservoirsfor fisheries development. Small reservoirs areleased to farmers or farmer groups for aquaculture.Management, therefore, has become simpler, and itis believed that reservoir resources can be used moreeffectively for enhancing fish production comparedto earlier practices when reservoirs were managed bydistrict or provincial fishery authorities.
Even though reservoir management has improvedas a sequel to policy changes, fish yield in these waterbodies is considered to be below optimal. Forexample, in the largest reservoir in the region, the
*Author for correspondence: E-mail: [email protected] Institute for Aquaculture No. 1. Dinh Bang – TuSon – Bac Ninh, Vietnam

247
Thacba Reservoir, fish yield has been about 16–28kg/ha/yr (Thai 1995), considerably less than thatfrom even oligotrophic reservoirs in truly temperateregions such as in Russia, where average fish yield inreservoirs is normally 30–50 kg/ha/yr (Tuong 1995).This is thought to be due to the lack of a scientificallydetermined stocking and recapture strategy. Farmersdetermine stocking/recapture and/or managementstrategies based mainly on the availability of larvaeand fry for stocking rather than on a strictly scientificbasis. This paper aims to develop simple yield pre-dictive models, which in turn can be used to deter-mine suitable stock and recapture strategies for smallfarmer-managed reservoirs in Yenbai and Thain-guyen provinces, the final outcome being increasedfish production.
Methods
Surveys were carried out from March 1998 toOctober 1999 in 13 reservoirs in Yenbai and eight inThainguyen provinces. Farmer-managed reservoirswere selected for the present study on the basis ofconsultation with provincial authorities. Sites studiedare shown in Figure 1. For each reservoir, data per-taining to stocking practices, number and weight ofeach species stocked and details of the harvest, i.e.number and mean weight of each stocked speciesharvested and the total weight of naturally-recruitedspecies (referred to as wild fish, here) were obtained.Information on marketing the catch was also collatedfrom each farmer.
The water quality in each selected reservoir wasdetermined twice a year, once at stocking and againat harvesting, then analysed in the EnvironmentalLaboratory at the Research Institute for AquacultureNo. 1 (Vietnam) using standard techniques (AOAC1984). Important water quality parameters includednitrate, phosphorus, chlorophyll-a and conductivity.
Potential statistical relationships (linear, curvi-linear, exponential and second-order polynomial)and/or selected limnological characteristics to yield,and between the numbers and weight of stocked fishto the yield, were explored using the softwarepackage Excel 98.
Results
Reservoirs
The variation in size of small reservoirs in Yenbaiand Thainguyen is relatively high. The smallestreservoirs include Docvien, Dambeo, Huongly andLovoi with an area of 2 ha in Yenbai Province. Thelargest reservoir, Langday, is about 160 ha, also inthis province. Water depth in each water body varied
mainly according to the geographical condition ofthe region, and ranged 2.5–11 m. Detailed data arepresented in Table 1.
Water quality
Even though the variation in temperature and dis-solved oxygen (DO) has not been studied in detail,the preliminary data collected (Table 2) show thatthese parameters in all reservoirs studied are withinthe range suitable for fish culture. Variations of tem-perature and DO within and between reservoirs arerelatively small. In March, temperature was about27–28°C and in September increased to 30–31°C. Itwas also found that daytime DO concentrations aresimilar between March and September, as well asbetween reservoirs, ranging 6.8–8.8 mg/L and 6.5–8.5 mg/L in March and September respectively.
Concentrations of nitrogen in the form NO3– and
phosphorus in the form PO43– were relatively low.
Nitrate concentration ranged 0.01–0.02 mg/L inMarch and 0.008–0.020 mg/L in September. Con-centration of phosphorus ranged 0.02–0.07 mg/L and0.02–0.05 mg/L in March and September, respec-tively. These two nutritional components also vary in
Table 1. Relevant morphometric characteristics of thereservoirs in the study.
Province/No. Reservoirs Area(ha)
Depth (m)
Year impounded
Yenbai1 Trai Lam 3.0 6.0 19782 Dong Ly 41.0 7.0 19783 Doc Vien 2.0 4.0 19804 Tan Chung 25.0 5.0 19805 Doc Them 7.0 6.0 19846 Lang Day 160.0 12.0 19797 Nghia
Trang10.0 11.0 1984
8 Dong Ly 5.0 12.0 19789 Dam Chem 3.0 5.5 1986
10 Dam Beo 2.0 6.0 198411 Huong Ly 2.0 8.0 198512 Lo Voi 2.0 5.0 197813 Lo Xa 5.0 6.0 1982
Thainguyen1 Bao Linh 83.0 11.0 19872 Binh Son 65.0 9.0 19873 Quan Tre 41.5 6.0 19924 Phuong
Hoang20.2 10.0 1977
5 Suoi Lanh 48.0 9.0 19936 Phu Xuyen 18.2 5.0 19937 Doan Uy 16.2 6.0 19928 Ban Co 4.2 6.0 1966
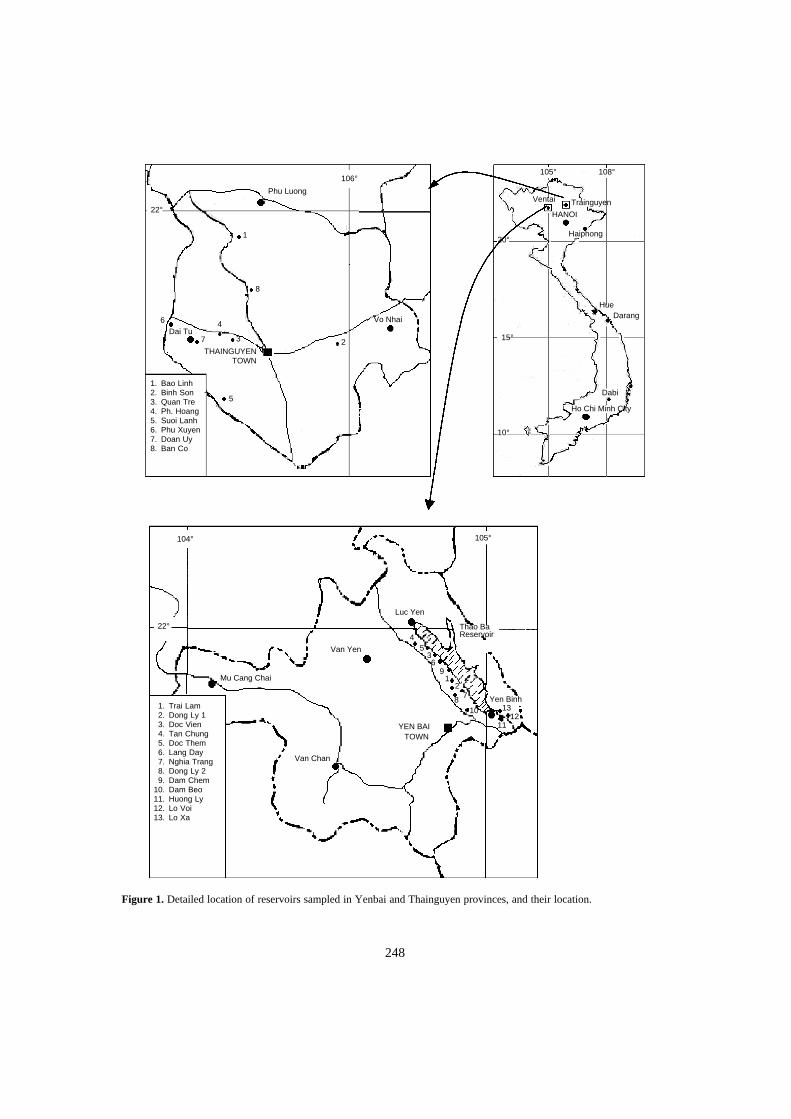
248
Figure 1. Detailed location of reservoirs sampled in Yenbai and Thainguyen provinces, and their location.
1. Bao Linh2. Binh Son3. Quan Tre4. Ph. Hoang5. Suoi Lanh6. Phu Xuyen7. Doan Uy8. Ban Co
106°
Phu Luong
22°
1
8
6 4
37
5
2Dai Tu
THAINGUYENTOWN
Vo Nhai
105° 108°
20°
10°
15°
Ventai Trainguyen
HANOI
Haiphong
HueDarang
Dabi
Ho Chi Minh City
104° 105°
22°
1. Trai Lam2. Dong Ly 13. Doc Vien4. Tan Chung5. Doc Them6. Lang Day7. Nghia Trang8. Dong Ly 29. Dam Chem
10. Dam Beo11. Huong Ly12. Lo Voi13. Lo Xa
Luc Yen
Thao BaReservoir
Yen Binh13
1211
108
72
19
63
54
YEN BAITOWN
Van Yen
Mu Cang Chai
Van Chan
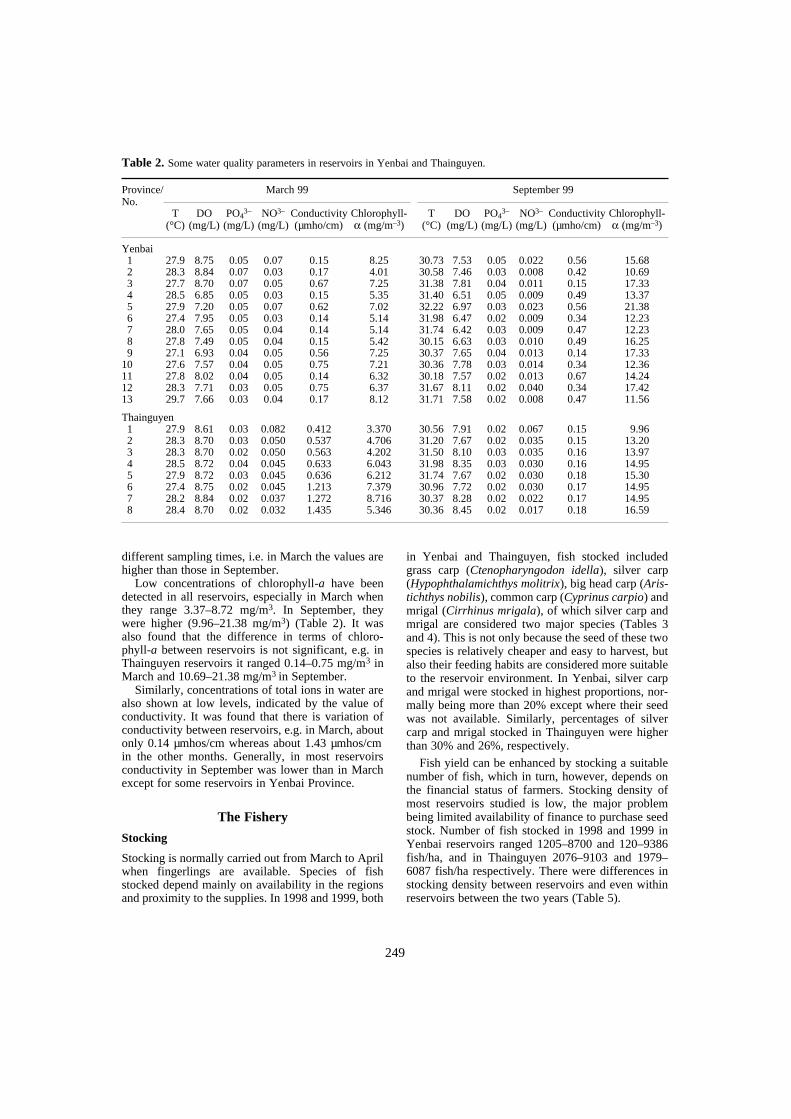
249
different sampling times, i.e. in March the values arehigher than those in September.
Low concentrations of chlorophyll-a have beendetected in all reservoirs, especially in March whenthey range 3.37–8.72 mg/m3. In September, theywere higher (9.96–21.38 mg/m3) (Table 2). It wasalso found that the difference in terms of chloro-phyll-a between reservoirs is not significant, e.g. inThainguyen reservoirs it ranged 0.14–0.75 mg/m3 inMarch and 10.69–21.38 mg/m3 in September.
Similarly, concentrations of total ions in water arealso shown at low levels, indicated by the value ofconductivity. It was found that there is variation ofconductivity between reservoirs, e.g. in March, aboutonly 0.14 µmhos/cm whereas about 1.43 µmhos/cmin the other months. Generally, in most reservoirsconductivity in September was lower than in Marchexcept for some reservoirs in Yenbai Province.
The Fishery
Stocking
Stocking is normally carried out from March to Aprilwhen fingerlings are available. Species of fishstocked depend mainly on availability in the regionsand proximity to the supplies. In 1998 and 1999, both
in Yenbai and Thainguyen, fish stocked includedgrass carp (Ctenopharyngodon idella), silver carp(Hypophthalamichthys molitrix), big head carp (Aris-tichthys nobilis), common carp (Cyprinus carpio) andmrigal (Cirrhinus mrigala), of which silver carp andmrigal are considered two major species (Tables 3and 4). This is not only because the seed of these twospecies is relatively cheaper and easy to harvest, butalso their feeding habits are considered more suitableto the reservoir environment. In Yenbai, silver carpand mrigal were stocked in highest proportions, nor-mally being more than 20% except where their seedwas not available. Similarly, percentages of silvercarp and mrigal stocked in Thainguyen were higherthan 30% and 26%, respectively.
Fish yield can be enhanced by stocking a suitablenumber of fish, which in turn, however, depends onthe financial status of farmers. Stocking density ofmost reservoirs studied is low, the major problembeing limited availability of finance to purchase seedstock. Number of fish stocked in 1998 and 1999 inYenbai reservoirs ranged 1205–8700 and 120–9386fish/ha, and in Thainguyen 2076–9103 and 1979–6087 fish/ha respectively. There were differences instocking density between reservoirs and even withinreservoirs between the two years (Table 5).
Table 2. Some water quality parameters in reservoirs in Yenbai and Thainguyen.
Province/No.
March 99 September 99
T (°C)
DO(mg/L)
PO43–
(mg/L)NO3–
(mg/L)Conductivity (µmho/cm)
Chlorophyll-α (mg/m–3)
T (°C)
DO (mg/L)
PO43–
(mg/L)NO3–
(mg/L)Conductivity (µmho/cm)
Chlorophyll-α (mg/m–3)
Yenbai1 27.9 8.75 0.05 0.07 0.15 8.25 30.73 7.53 0.05 0.022 0.56 15.682 28.3 8.84 0.07 0.03 0.17 4.01 30.58 7.46 0.03 0.008 0.42 10.693 27.7 8.70 0.07 0.05 0.67 7.25 31.38 7.81 0.04 0.011 0.15 17.334 28.5 6.85 0.05 0.03 0.15 5.35 31.40 6.51 0.05 0.009 0.49 13.375 27.9 7.20 0.05 0.07 0.62 7.02 32.22 6.97 0.03 0.023 0.56 21.386 27.4 7.95 0.05 0.03 0.14 5.14 31.98 6.47 0.02 0.009 0.34 12.237 28.0 7.65 0.05 0.04 0.14 5.14 31.74 6.42 0.03 0.009 0.47 12.238 27.8 7.49 0.05 0.04 0.15 5.42 30.15 6.63 0.03 0.010 0.49 16.259 27.1 6.93 0.04 0.05 0.56 7.25 30.37 7.65 0.04 0.013 0.14 17.33
10 27.6 7.57 0.04 0.05 0.75 7.21 30.36 7.78 0.03 0.014 0.34 12.3611 27.8 8.02 0.04 0.05 0.14 6.32 30.18 7.57 0.02 0.013 0.67 14.2412 28.3 7.71 0.03 0.05 0.75 6.37 31.67 8.11 0.02 0.040 0.34 17.4213 29.7 7.66 0.03 0.04 0.17 8.12 31.71 7.58 0.02 0.008 0.47 11.56
Thainguyen1 27.9 8.61 0.03 0.082 0.412 3.370 30.56 7.91 0.02 0.067 0.15 9.962 28.3 8.70 0.03 0.050 0.537 4.706 31.20 7.67 0.02 0.035 0.15 13.203 28.3 8.70 0.02 0.050 0.563 4.202 31.50 8.10 0.03 0.035 0.16 13.974 28.5 8.72 0.04 0.045 0.633 6.043 31.98 8.35 0.03 0.030 0.16 14.955 27.9 8.72 0.03 0.045 0.636 6.212 31.74 7.67 0.02 0.030 0.18 15.306 27.4 8.75 0.02 0.045 1.213 7.379 30.96 7.72 0.02 0.030 0.17 14.957 28.2 8.84 0.02 0.037 1.272 8.716 30.37 8.28 0.02 0.022 0.17 14.958 28.4 8.70 0.02 0.032 1.435 5.346 30.36 8.45 0.02 0.017 0.18 16.59

250
Table 3. Weight (kg) of different species released into the reservoirs.
Province/No. Grass carp Silver carp Bighead carp Common carp Mrigal
1997 1998 1997 1998 1997 1998 1997 1998 1997 1998
Yenbai1 80 70 200 120 40 20 10 20 90 1202 50 50 200 150 0 25 0 0 100 953 100 60 100 100 0 20 0 10 50 804 0 150 400 250 0 80 0 8 500 2625 150 70 100 190 0 45 0 15 50 806 200 120 400 300 0 100 0 12 500 3687 30 80 120 160 0 30 0 20 30 608 50 75 150 140 0 10 50 9 20 669 150 100 100 150 60 20 80 11 60 189
10 250 80 350 120 90 45 90 12 350 9311 180 20 120 70 30 10 25 10 115 4012 50 40 100 90 0 15 20 10 50 8513 200 70 300 180 0 45 100 15 100 90
Thainguyen1 75 100 375 250 75 15 95 30 580.0 4552 55 160 425 360 50 25 0 60 350.0 3953 60 200 160 200 25 40 40 45 1.3 2154 501 80 120 150 40 30 50 45 140.0 1155 85 90 275 200 75 50 65 30 0.3 1306 40 150 135 210 180 20 45 55 150.0 1657 100 180 220 190 70 29 50 30 210.0 2918 80 80 130 110 40 25 70 50 130.0 115
Table 4. Percentage by number of each species released into reservoirs in Yenbai and Thainguyen Provinces.
Province/No. Grass carp Silver carp Bighead carp Common carp Mrigal
1997 1998 1997 1998 1997 1998 1997 1998 1997 1998
Yenbai1 19.0 20.0 47.6 34.3 9.5 5.7 2.4 5.7 21.4 34.32 14.3 15.6 57.1 46.9 0.0 7.8 0.0 0.0 28.6 29.73 40.0 22.2 40.0 37.0 0.0 7.4 0.0 3.7 20.0 29.64 0.0 20.0 44.4 33.3 0.0 10.7 0.0 1.1 55.6 34.95 50.0 17.5 33.3 47.5 0.0 11.3 0.0 3.8 16.7 20.06 18.2 13.3 36.4 33.3 0.0 11.1 0.0 1.3 45.5 40.97 16.7 22.9 66.7 45.7 0.0 8.6 0.0 5.7 16.7 17.18 18.5 25.0 55.6 46.7 0.0 3.3 18.5 3.0 7.4 22.09 33.3 21.3 22.2 31.9 13.3 4.3 17.8 2.3 13.3 40.2
10 22.1 22.9 31.0 34.3 8.0 12.9 8.0 3.4 31.0 26.611 38.3 13.3 25.5 46.7 6.4 6.7 5.3 6.7 24.5 26.712 22.7 16.7 45.5 37.5 0.0 6.3 9.1 4.2 22.7 35.413 28.6 17.5 42.9 45.0 0.0 11.3 14.3 3.8 14.3 22.5
Thainguyen1 6.0 11.8 30.0 29.4 2.0 1.8 10.0 3.5 52.0 53.52 2.0 16.0 45.0 36.0 4.0 2.5 16.5 6.0 32.0 39.53 5.0 28.6 40.0 28.6 0.0 5.7 5.0 6.4 50.0 30.74 10.0 19.1 30.0 35.7 5.0 7.1 8.0 10.7 47.0 27.45 8.5 18.0 45.0 40.0 5.0 10.0 1.2 6.0 40.0 26.06 1.3 25.0 44.4 35.0 6.7 3.3 0.7 9.2 46.7 27.57 1.4 25.0 35.0 26.4 13.0 4.0 9.2 4.2 41.7 40.48 8.0 21.1 40.0 29.0 0.0 6.6 12.1 13.2 39.6 30.3
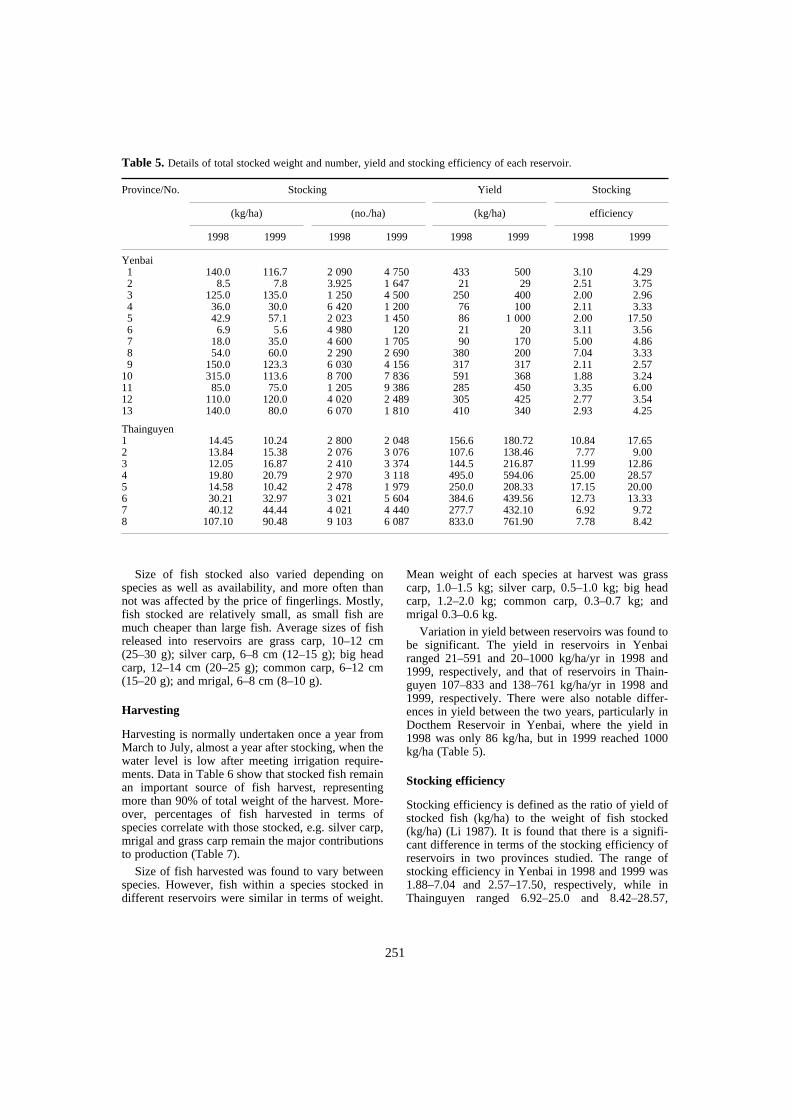
251
Size of fish stocked also varied depending onspecies as well as availability, and more often thannot was affected by the price of fingerlings. Mostly,fish stocked are relatively small, as small fish aremuch cheaper than large fish. Average sizes of fishreleased into reservoirs are grass carp, 10–12 cm(25–30 g); silver carp, 6–8 cm (12–15 g); big headcarp, 12–14 cm (20–25 g); common carp, 6–12 cm(15–20 g); and mrigal, 6–8 cm (8–10 g).
Harvesting
Harvesting is normally undertaken once a year fromMarch to July, almost a year after stocking, when thewater level is low after meeting irrigation require-ments. Data in Table 6 show that stocked fish remainan important source of fish harvest, representingmore than 90% of total weight of the harvest. More-over, percentages of fish harvested in terms ofspecies correlate with those stocked, e.g. silver carp,mrigal and grass carp remain the major contributionsto production (Table 7).
Size of fish harvested was found to vary betweenspecies. However, fish within a species stocked indifferent reservoirs were similar in terms of weight.
Mean weight of each species at harvest was grasscarp, 1.0–1.5 kg; silver carp, 0.5–1.0 kg; big headcarp, 1.2–2.0 kg; common carp, 0.3–0.7 kg; andmrigal 0.3–0.6 kg.
Variation in yield between reservoirs was found tobe significant. The yield in reservoirs in Yenbairanged 21–591 and 20–1000 kg/ha/yr in 1998 and1999, respectively, and that of reservoirs in Thain-guyen 107–833 and 138–761 kg/ha/yr in 1998 and1999, respectively. There were also notable differ-ences in yield between the two years, particularly inDocthem Reservoir in Yenbai, where the yield in1998 was only 86 kg/ha, but in 1999 reached 1000kg/ha (Table 5).
Stocking efficiency
Stocking efficiency is defined as the ratio of yield ofstocked fish (kg/ha) to the weight of fish stocked(kg/ha) (Li 1987). It is found that there is a signifi-cant difference in terms of the stocking efficiency ofreservoirs in two provinces studied. The range ofstocking efficiency in Yenbai in 1998 and 1999 was1.88–7.04 and 2.57–17.50, respectively, while inThainguyen ranged 6.92–25.0 and 8.42–28.57,
Table 5. Details of total stocked weight and number, yield and stocking efficiency of each reservoir.
Province/No. Stocking Yield Stocking
(kg/ha) (no./ha) (kg/ha) efficiency
1998 1999 1998 1999 1998 1999 1998 1999
Yenbai1 140.0 116.7 2 090 4 750 433 500 3.10 4.292 8.5 7.8 3.925 1 647 21 29 2.51 3.753 125.0 135.0 1 250 4 500 250 400 2.00 2.964 36.0 30.0 6 420 1 200 76 100 2.11 3.335 42.9 57.1 2 023 1 450 86 1 000 2.00 17.506 6.9 5.6 4 980 120 21 20 3.11 3.567 18.0 35.0 4 600 1 705 90 170 5.00 4.868 54.0 60.0 2 290 2 690 380 200 7.04 3.339 150.0 123.3 6 030 4 156 317 317 2.11 2.57
10 315.0 113.6 8 700 7 836 591 368 1.88 3.2411 85.0 75.0 1 205 9 386 285 450 3.35 6.0012 110.0 120.0 4 020 2 489 305 425 2.77 3.5413 140.0 80.0 6 070 1 810 410 340 2.93 4.25
Thainguyen1 14.45 10.24 2 800 2 048 156.6 180.72 10.84 17.652 13.84 15.38 2 076 3 076 107.6 138.46 7.77 9.003 12.05 16.87 2 410 3 374 144.5 216.87 11.99 12.864 19.80 20.79 2 970 3 118 495.0 594.06 25.00 28.575 14.58 10.42 2 478 1 979 250.0 208.33 17.15 20.006 30.21 32.97 3 021 5 604 384.6 439.56 12.73 13.337 40.12 44.44 4 021 4 440 277.7 432.10 6.92 9.728 107.10 90.48 9 103 6 087 833.0 761.90 7.78 8.42
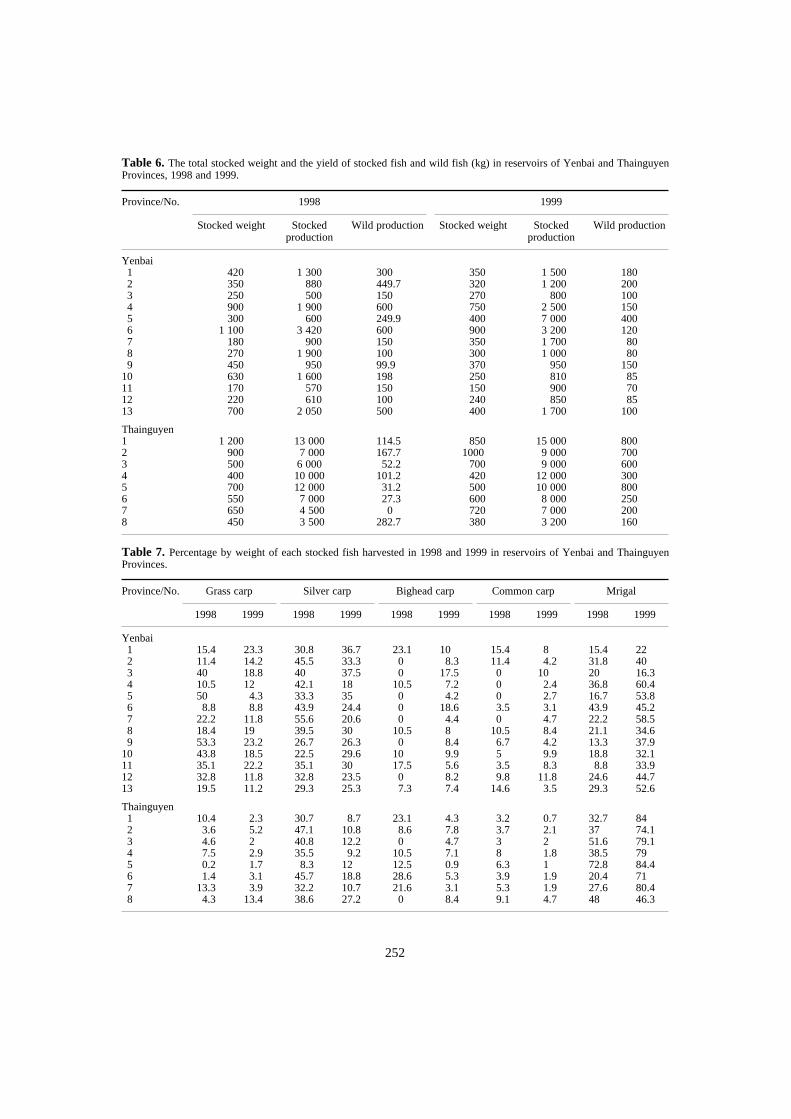
252
Table 6. The total stocked weight and the yield of stocked fish and wild fish (kg) in reservoirs of Yenbai and ThainguyenProvinces, 1998 and 1999.
Province/No. 1998 1999
Stocked weight Stocked production
Wild production Stocked weight Stocked production
Wild production
Yenbai1 420 1 300 300 350 1 500 1802 350 880 449.7 320 1 200 2003 250 500 150 270 800 1004 900 1 900 600 750 2 500 1505 300 600 249.9 400 7 000 4006 1 100 3 420 600 900 3 200 1207 180 900 150 350 1 700 808 270 1 900 100 300 1 000 809 450 950 99.9 370 950 150
10 630 1 600 198 250 810 8511 170 570 150 150 900 7012 220 610 100 240 850 8513 700 2 050 500 400 1 700 100
Thainguyen1 1 200 13 000 114.5 850 15 000 8002 900 7 000 167.7 1000 9 000 7003 500 6 000 52.2 700 9 000 6004 400 10 000 101.2 420 12 000 3005 700 12 000 31.2 500 10 000 8006 550 7 000 27.3 600 8 000 2507 650 4 500 0 720 7 000 2008 450 3 500 282.7 380 3 200 160
Table 7. Percentage by weight of each stocked fish harvested in 1998 and 1999 in reservoirs of Yenbai and ThainguyenProvinces.
Province/No. Grass carp Silver carp Bighead carp Common carp Mrigal
1998 1999 1998 1999 1998 1999 1998 1999 1998 1999
Yenbai1 15.4 23.3 30.8 36.7 23.1 10 15.4 8 15.4 222 11.4 14.2 45.5 33.3 0 8.3 11.4 4.2 31.8 403 40 18.8 40 37.5 0 17.5 0 10 20 16.34 10.5 12 42.1 18 10.5 7.2 0 2.4 36.8 60.45 50 4.3 33.3 35 0 4.2 0 2.7 16.7 53.86 8.8 8.8 43.9 24.4 0 18.6 3.5 3.1 43.9 45.27 22.2 11.8 55.6 20.6 0 4.4 0 4.7 22.2 58.58 18.4 19 39.5 30 10.5 8 10.5 8.4 21.1 34.69 53.3 23.2 26.7 26.3 0 8.4 6.7 4.2 13.3 37.9
10 43.8 18.5 22.5 29.6 10 9.9 5 9.9 18.8 32.111 35.1 22.2 35.1 30 17.5 5.6 3.5 8.3 8.8 33.912 32.8 11.8 32.8 23.5 0 8.2 9.8 11.8 24.6 44.713 19.5 11.2 29.3 25.3 7.3 7.4 14.6 3.5 29.3 52.6
Thainguyen1 10.4 2.3 30.7 8.7 23.1 4.3 3.2 0.7 32.7 842 3.6 5.2 47.1 10.8 8.6 7.8 3.7 2.1 37 74.13 4.6 2 40.8 12.2 0 4.7 3 2 51.6 79.14 7.5 2.9 35.5 9.2 10.5 7.1 8 1.8 38.5 795 0.2 1.7 8.3 12 12.5 0.9 6.3 1 72.8 84.46 1.4 3.1 45.7 18.8 28.6 5.3 3.9 1.9 20.4 717 13.3 3.9 32.2 10.7 21.6 3.1 5.3 1.9 27.6 80.48 4.3 13.4 38.6 27.2 0 8.4 9.1 4.7 48 46.3

253
respectively (Table 5). According to Li (1987),reservoirs in Yenbai had both poor (less than 5) andgood (5 to 10) stocking efficiency, whereas Thain-guyen’s reservoirs remain higher and rangedbetween good and excellent (more than 10). It is alsofound that stocking efficiencies in each reservoirwere similar between two years, except for DocthemReservoir where the values in 1998 and 1999 were 2and 17.5.
Statistical relationships
The data were used to explore the existence ofpossible statistical relationship of yield to reservoirfeatures, such as area, and water-quality parameterssuch as chlorophyll-a concentration and conductivity,and to stocking levels. In this attempt, for each reser-voir, the mean for 1998 and 1999 was taken, and, inview of the climatic and other physical differencesbetween the two provinces, the data on the reservoirsof the two provinces treated separately. Relationshipsare shown in Table 8. In both groups, the followingrelationships were found to be significant:
Fish yield (kg/ha/yr) to reservoir area (ha) (Figure 2);Fish yield to stocked weight (kg/ha) (Figure 3);Fish yield to chlorophyll-a concentration (mg/m3)(Figure 4); andFish yield to conductivity (µmhos/cm) (Figure 5).
Economic efficiency
Data from Table 9 show the summary of economicefficiency in 1998 and 1999 of reservoir fisheries inYenbai and Thainguyen, calculated for a one-hawater surface. Cost:benefit ratios are low, exceptThainguyen in 1999 which had a ratio of approxi-mately 78%. In terms of investment, capital costsrepresent only a small proportion of total cost, being7.1–7.7% in Yenbai and 12.8–12.1% in Thainguyen.On the other hand, variable costs remained the bulkin which labour and fish seed required the highestinvestment, more than 60% of total costs. It is also
noted that in Thainguyen money spent on feed ismore than in Yenbai. However, fingerling costs inYenbai are much higher than those in Thainguyen,which could result in different cost:benefit ratiosgained from fisheries in the reservoirs of the twoprovinces.
Discussion
Vietnam is estimated to have 242 725 ha of reser-voirs distributed throughout the country, of whichabout 48.05% considered suited to culture-basedfisheries (Hao et al. 1993). Over the last five to sevenyears, major policy changes have taken place inregard to reservoir fishery development and manage-ment in Vietnam. The most notable is the leasing of
Table 9. Summary of capital and operating costs and cashflow analysis for the culture-based fisheries of reservoirs inYenbai and Thainguyen Provinces.
Yenbai Thainguyen
1998 1999 1998 1999
Capital costs (1000 VND)Leasing 150.0 150.0 250.0 250.0
Total capital costs 150.0 150.0 250.0 250.0
Operating costs (1000 VND)LabourProtection 560.0 560.0 437.1 437.1Others 140.4 120.5 138.5 285.8Food 195.0 297.2 397.5 355.0Seed 897.3 992.2 550.6 622.5
Total operating costs 1792.7 1969.9 1523.7 1700.4
Gross output(1000 VND) 2480.9 2558.3 2487.7 3343.5
Net income(1000 VND) 465.3 588.4 964.0 1520.2
Benefit:cost ratio 0.24 0.27 0.54 0.78
Table 8. Summary of relationship between annual yield (Y = kg/ha/yr) and reservoir area (A = ha), stocked weight(W = kg/ha), chlorophyll-α concentration (Chl = mg/m3) and conductivity (Con = µmhos/cm).
Relationship Location Equation R2 P-value
Yield vs area Yenbai Y = 818.33 A–0.7384 0.84 <0.001Thainguyen Y = 2219.60 A–0.6154 0.85 <0.050
Yield vs stocked weight Yenbai Y = –0.0138W2 + 4.741W + 37.67 0.62 <0.050Thainguyen Y = –0.0268W2 + 9.6178W + 100.42 0.74 <0.050
Yield vs cholorophyll-a Yenbai Y = 751.97Ln(Chl) – 1470.4 0.62 <0.050Thainguyen Y = 683.84Ln(Chl) – 1213.0 0.30 <0.050
Yield vs conductivity Yenbai Y = 1248.54 Con – 206.17 0.68 <0.001Thainguyen Y = 1201.54 Con – 170.44 0.58 <0.001

254
Figure 2. Relationship between annual yield and surface area of small reservoirs in Yenbai and Thainguyen.
Figure 3. Relationship between annual yield (year n+1) and total stocked weight in reservoirs (year n) in Yenbai andThainguyen.
Figure 4. Relationship between annual yield and cholorophyll-a concentration in reservoirs in Yenbai and Thainguyen.
Yenbai
Thainguyen
1000
800
600
400
200
00 50 100 150 200
Yie
ld (
kg h
a–1
yr–1
)
Area (ha)
Yie
ld (
kg/h
a/yr
)
1000
800
600
400
200
0
Yenbai
Thainguyen
0 50 100 150 200 250
Stocked weight (kg/ha)
1000
800
600
400
200
0
Chlorophyll-α (kg/m3)
5 6 7 8 9 10 11 12 13 14 15
Yie
ld (
kg/h
a/yr
)
Yenbai
Thainguyen
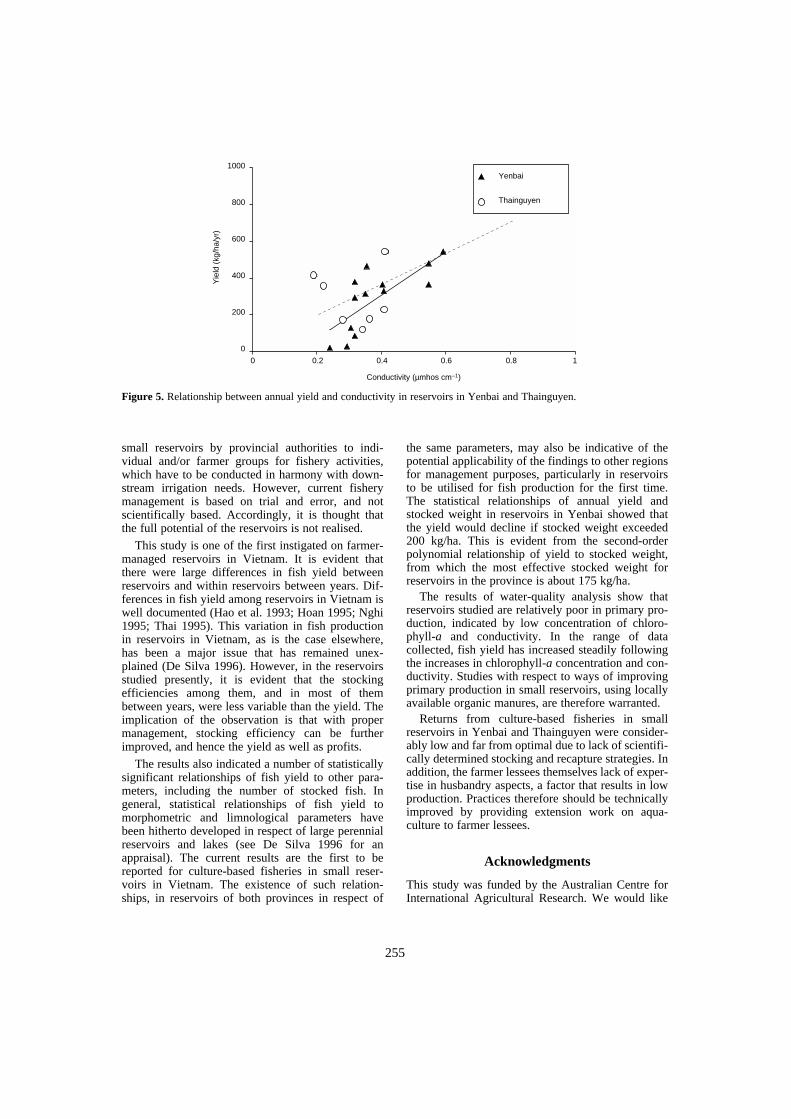
255
small reservoirs by provincial authorities to indi-vidual and/or farmer groups for fishery activities,which have to be conducted in harmony with down-stream irrigation needs. However, current fisherymanagement is based on trial and error, and notscientifically based. Accordingly, it is thought thatthe full potential of the reservoirs is not realised.
This study is one of the first instigated on farmer-managed reservoirs in Vietnam. It is evident thatthere were large differences in fish yield betweenreservoirs and within reservoirs between years. Dif-ferences in fish yield among reservoirs in Vietnam iswell documented (Hao et al. 1993; Hoan 1995; Nghi1995; Thai 1995). This variation in fish productionin reservoirs in Vietnam, as is the case elsewhere,has been a major issue that has remained unex-plained (De Silva 1996). However, in the reservoirsstudied presently, it is evident that the stockingefficiencies among them, and in most of thembetween years, were less variable than the yield. Theimplication of the observation is that with propermanagement, stocking efficiency can be furtherimproved, and hence the yield as well as profits.
The results also indicated a number of statisticallysignificant relationships of fish yield to other para-meters, including the number of stocked fish. Ingeneral, statistical relationships of fish yield tomorphometric and limnological parameters havebeen hitherto developed in respect of large perennialreservoirs and lakes (see De Silva 1996 for anappraisal). The current results are the first to bereported for culture-based fisheries in small reser-voirs in Vietnam. The existence of such relation-ships, in reservoirs of both provinces in respect of
the same parameters, may also be indicative of thepotential applicability of the findings to other regionsfor management purposes, particularly in reservoirsto be utilised for fish production for the first time.The statistical relationships of annual yield andstocked weight in reservoirs in Yenbai showed thatthe yield would decline if stocked weight exceeded200 kg/ha. This is evident from the second-orderpolynomial relationship of yield to stocked weight,from which the most effective stocked weight forreservoirs in the province is about 175 kg/ha.
The results of water-quality analysis show thatreservoirs studied are relatively poor in primary pro-duction, indicated by low concentration of chloro-phyll-a and conductivity. In the range of datacollected, fish yield has increased steadily followingthe increases in chlorophyll-a concentration and con-ductivity. Studies with respect to ways of improvingprimary production in small reservoirs, using locallyavailable organic manures, are therefore warranted.
Returns from culture-based fisheries in smallreservoirs in Yenbai and Thainguyen were consider-ably low and far from optimal due to lack of scientifi-cally determined stocking and recapture strategies. Inaddition, the farmer lessees themselves lack of exper-tise in husbandry aspects, a factor that results in lowproduction. Practices therefore should be technicallyimproved by providing extension work on aqua-culture to farmer lessees.
Acknowledgments
This study was funded by the Australian Centre forInternational Agricultural Research. We would like
Figure 5. Relationship between annual yield and conductivity in reservoirs in Yenbai and Thainguyen.
Yenbai
Thainguyen
1000
800
600
400
200
0
Yie
ld (
kg/h
a/yr
)
0 0.2 0.4 0.6 0.8 1
Conductivity (µmhos cm–1)

256
to extend our sincere thanks to Professor Sena S. DeSilva (Deakin University, Australia) for his guidancethroughout the study and for invaluable adviceduring the preparation of this paper. Special thanksare given to Dr Le Thanh Luu for his support andencouragement and the staff of the Departments ofAgriculture and Rural Development of Yenbai andThainguyen provinces, without whose cooperationthe study would not have been possible.
ReferencesAOAC (Association of Official Analytical Chemists) 1984.
Official Methods of Analysis. 14th Williams, S. (ed.)AOAC, Arlington, VA, 1141 p.
De Silva, S.S. 1996. The Asian Fishery with SpecialReference to Reservoir Fisheries: A Reappraisal. In:Schiemer, F. and Boland, K.T. ed. Perspectives inTropical Limnology, SBP Academic Publisher, Nether-lands, 321–332.
General Statistical Office 1993. Statistical Data on BasisSituation and Infrastructure of Rural Area in Vietnam.Statistical Publishing House, Hanoi.
Hao, N.V., Nghi N.H. and Am P.X. 1993. Status of Reser-voir Fisheries. Project Report, RIA 1 (in Vietnamese).
Hoan, N.D. 1995. Status of reservoir fisheries in the centralprovinces of Vietnam. In: Proceedings of the SecondWorkshop on Reservoir Fisheries, Vietnam (in Viet-namese), 50–53.
Nghi, N.H. 1995. Techniques in reservoirs harvesting:achievements and existences. In: Proceedings of theSecond Workshop on Reservoir Fisheries, Vietnam (inVietnamese), 25–34.
Li, S. 1987. The principles and strategies of fish culture inChinese reservoirs. In: Reservoir Fishery Managementand Development in Asia, Proceedings of a Workshopheld in Kathmandu, Nepal, 214–223.
Thai, D.T. 1995. Current status of reservoir fisheries,strategies for its future development. In: Proceedings ofthe Second Workshop on Reservoir Fisheries, Vietnam(in Vietnamese), 2–10.
Tuong, N.H. 1995. Chemical, Biological Characteristics,and Fish Fauna in Thacba Reservoir and Strategies toEnhance Fish Yield in Reservoir. Project Report RIA 1,Vietnam (in Vietnamese).
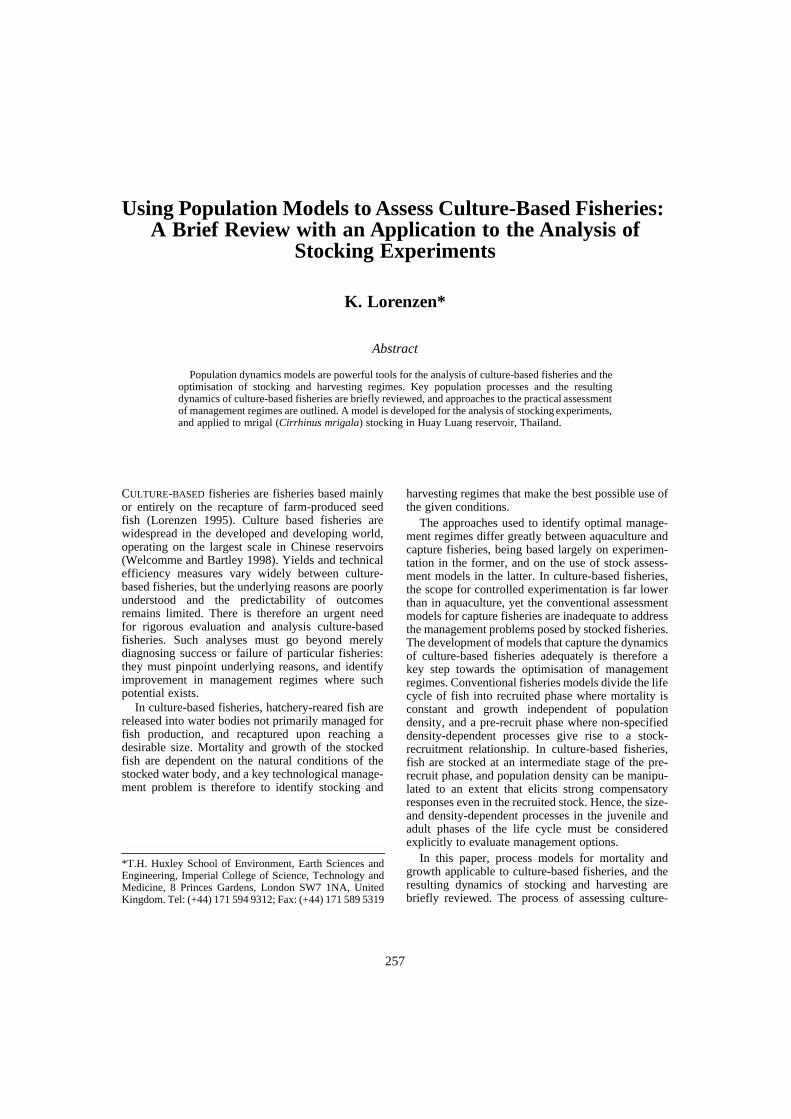
257
Using Population Models to Assess Culture-Based Fisheries: A Brief Review with an Application to the Analysis of
Stocking Experiments
K. Lorenzen*
Abstract
Population dynamics models are powerful tools for the analysis of culture-based fisheries and theoptimisation of stocking and harvesting regimes. Key population processes and the resultingdynamics of culture-based fisheries are briefly reviewed, and approaches to the practical assessmentof management regimes are outlined. A model is developed for the analysis of stocking experiments,and applied to mrigal (Cirrhinus mrigala) stocking in Huay Luang reservoir, Thailand.
CULTURE-BASED fisheries are fisheries based mainlyor entirely on the recapture of farm-produced seedfish (Lorenzen 1995). Culture based fisheries arewidespread in the developed and developing world,operating on the largest scale in Chinese reservoirs(Welcomme and Bartley 1998). Yields and technicalefficiency measures vary widely between culture-based fisheries, but the underlying reasons are poorlyunderstood and the predictability of outcomesremains limited. There is therefore an urgent needfor rigorous evaluation and analysis culture-basedfisheries. Such analyses must go beyond merelydiagnosing success or failure of particular fisheries:they must pinpoint underlying reasons, and identifyimprovement in management regimes where suchpotential exists.
In culture-based fisheries, hatchery-reared fish arereleased into water bodies not primarily managed forfish production, and recaptured upon reaching adesirable size. Mortality and growth of the stockedfish are dependent on the natural conditions of thestocked water body, and a key technological manage-ment problem is therefore to identify stocking and
harvesting regimes that make the best possible use ofthe given conditions.
The approaches used to identify optimal manage-ment regimes differ greatly between aquaculture andcapture fisheries, being based largely on experimen-tation in the former, and on the use of stock assess-ment models in the latter. In culture-based fisheries,the scope for controlled experimentation is far lowerthan in aquaculture, yet the conventional assessmentmodels for capture fisheries are inadequate to addressthe management problems posed by stocked fisheries.The development of models that capture the dynamicsof culture-based fisheries adequately is therefore akey step towards the optimisation of managementregimes. Conventional fisheries models divide the lifecycle of fish into recruited phase where mortality isconstant and growth independent of populationdensity, and a pre-recruit phase where non-specifieddensity-dependent processes give rise to a stock-recruitment relationship. In culture-based fisheries,fish are stocked at an intermediate stage of the pre-recruit phase, and population density can be manipu-lated to an extent that elicits strong compensatoryresponses even in the recruited stock. Hence, the size-and density-dependent processes in the juvenile andadult phases of the life cycle must be consideredexplicitly to evaluate management options.
In this paper, process models for mortality andgrowth applicable to culture-based fisheries, and theresulting dynamics of stocking and harvesting arebriefly reviewed. The process of assessing culture-
*T.H. Huxley School of Environment, Earth Sciences andEngineering, Imperial College of Science, Technology andMedicine, 8 Princes Gardens, London SW7 1NA, UnitedKingdom. Tel: (+44) 171 594 9312; Fax: (+44) 171 589 5319

258
based fisheries is described, and an example applica-tion to the analysis of stocking experiments isprovided. Finally, the potential for comparativeanalyses is discussed.
Population Process Models for Culture-Based Fisheries
Key population processes in culture-based fisheriesare density-dependent growth and size-dependentmortality.
Density-dependent growth
Density-dependent growth is well documented inwild fish populations (e.g. Beverton and Holt 1957;Le Cren 1958; Backiel and Le Cren 1978; Hansonand Leggett 1985; Salojaervi and Mutenia, 1994) andin extensive aquaculture (Walter 1934; Swingle andSmith 1942; van Someren and Whitehead 1961).Building on earlier work by Beverton and Holt(1957), Lorenzen (1996a) developed a von Berta-lanffy growth model for density dependent growth.In the model, asymptotic length is assumed todecline linearly with population biomass density.This leads to the following expression for asymptoticweight:
W4B = (W4L1/3 – c B)3 (2)
where W4B is the asymptotic weight at biomass Band W4L is the limiting asymptotic weight when bio-mass approaches zero. The competition coefficient cdescribes how steeply asymptotic weight declineswith increasing biomass. For a given species, thelimiting asymptotic weight W4L is related toproperties of the water body stocked, and in generalW4L is likely to be positively correlated with the pro-ductivity of the water body. Generalisations aboutthe competition coefficient c are difficult to make atpresent, but are likely to emerge from comparativestudies once the model has been applied to a widerrange of populations.
Size-dependent mortality
Theoretical and empirical studies (Peterson andWroblewski 1984; McGurk 1986; Lorenzen 1996b)point to the existence of an allometric relationshipbetween natural mortality and body weight in fish ofthe form:
MW = Mu W –b (1)
where MW is natural mortality at weight W, Mu ismortality at unit weight, and b is the allometricexponent. Lorenzen (1996b) shows that mortality offish in natural ecosystems is governed by a consistent
allometric relationship with parameters b = –0.3 andMu = 3/year.
A meta-analysis of stocking experiments(Lorenzen unpublished) shows that average releasesize-survival relationships are well described bymodels based on allometric mortality with constantb, and that the mathematically convenient assump-tion of b = –1/3 is adequate for the analysis ofrelease size. Mu was found to be highly variablebetween experiments. Hence in practical assessmentwork, b can be fixed at –1/3 a priori, while Mu has tobe estimated separately for each fishery.
Population Dynamics of Culture-Based Fisheries
The population dynamics of culture-based fisheriesgoverned by density-dependent growth and size-dependent mortality have been investigated byLorenzen (1995). Key results of this analysis can besummarised as follows.
The optimal stocking regime is dependent on theharvesting regime and vice versa. This is illustratedschematically in Figure 1 where production is shownas a function stocking density and fishing effort.High fishing effort calls for high stocking densitiesand vice versa. High stocking densities combinedwith low fishing effort lead to overstocking, withlow production due to slow growth and low survivalfrom stocking to harvest. Conversely, low stockingrates combined with high fishing effort lead to over-fishing. Note that both overstocking and overfishingcan be alleviated by changes in either stockingdensity or fishing effort.
Potential production from stocked fisheries isinversely related to the size at which fish areharvested. Hence, in combination with the overallecological productivity of the water body, theminimum size at which fish are marketable effec-tively limits the production that can be achievedfrom stocking. Where large fish are desired, stockingdensities should be low and overall production willalso be low. Where small fish are marketable, highproduction levels can be achieved when stockingdensities are high and fish are harvested at thesmallest marketable size. Where fish are marketablebelow their normal size at maturity, culture-basedfisheries can achieve higher levels of production thanwild stocks of the same species because large andsomatically unproductive spawners can be replacedby a large number of small and somatically produc-tive fish.
A wide range of different stocking sizes can beused to achieve similar levels of production, butthe numbers that need to be stocked decrease ina non-linear way as size increases (Figure 2).
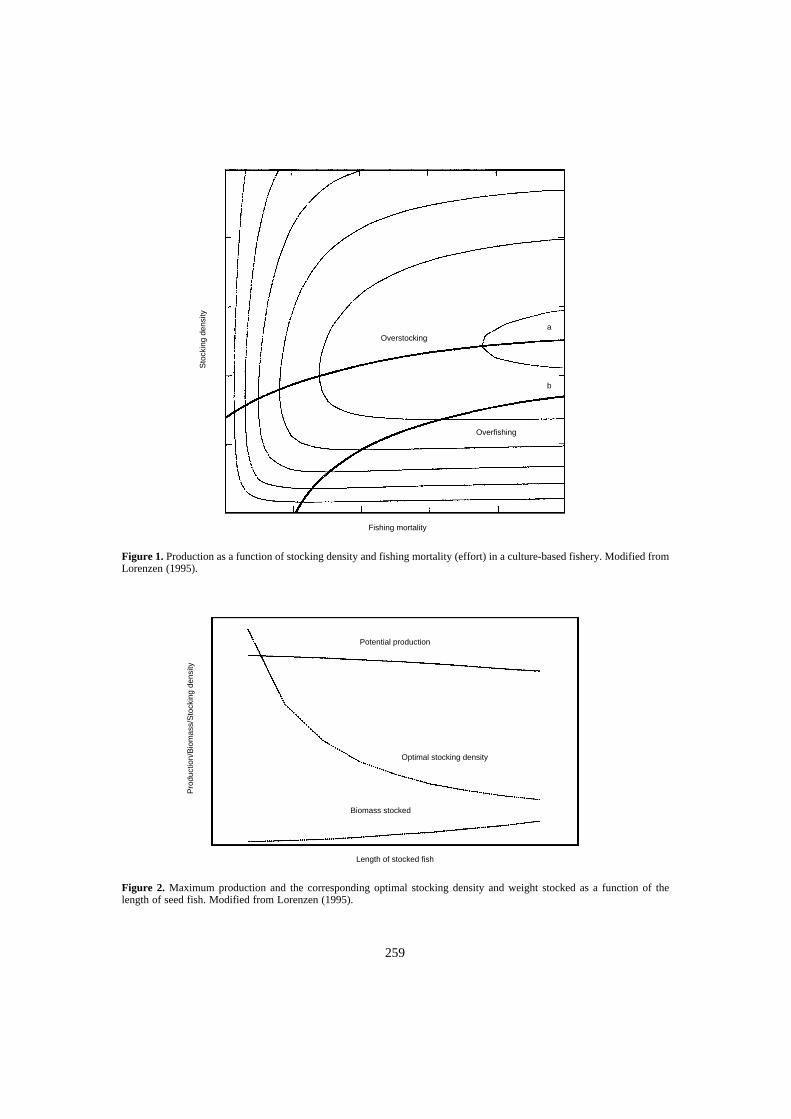
259
Figure 1. Production as a function of stocking density and fishing mortality (effort) in a culture-based fishery. Modified fromLorenzen (1995).
Figure 2. Maximum production and the corresponding optimal stocking density and weight stocked as a function of thelength of seed fish. Modified from Lorenzen (1995).
Fishing mortality
Overstocking
Overfishing
Sto
ckin
g de
nsity
a
b
Length of stocked fish
Biomass stocked
Optimal stocking density
Potential production
Pro
duct
ion/
Bio
mas
s/S
tock
ing
dens
ity
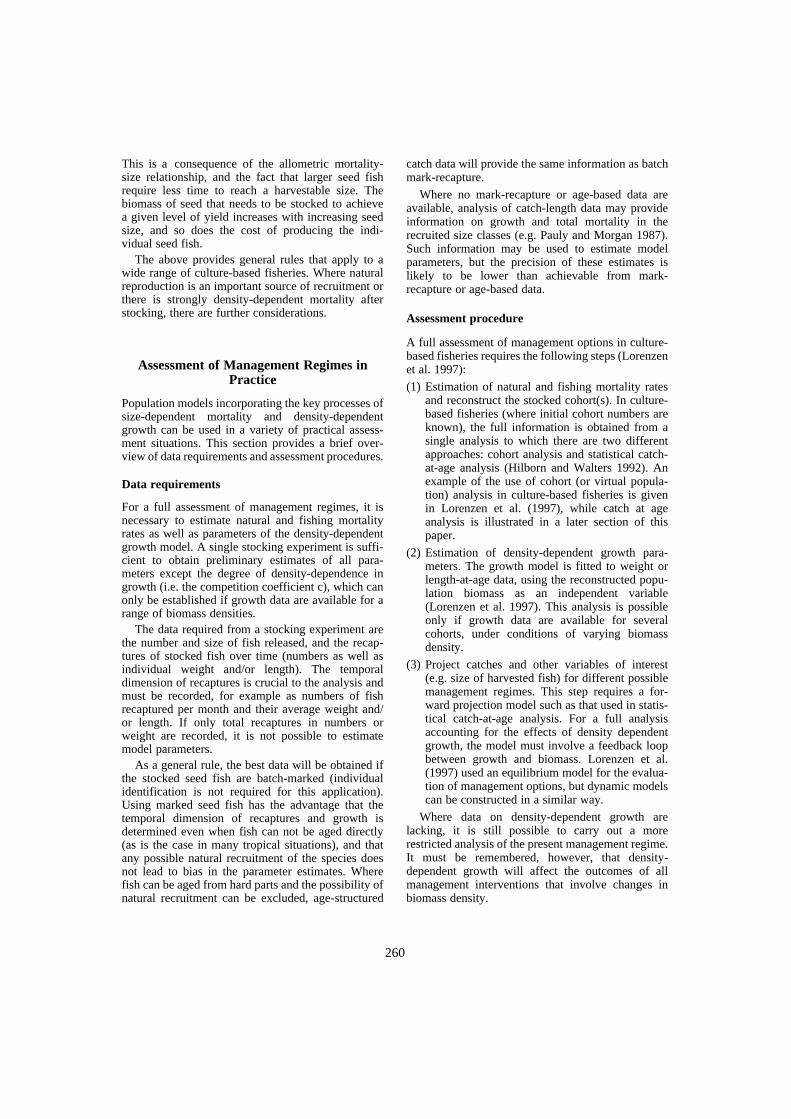
260
This is a consequence of the allometric mortality-size relationship, and the fact that larger seed fishrequire less time to reach a harvestable size. Thebiomass of seed that needs to be stocked to achievea given level of yield increases with increasing seedsize, and so does the cost of producing the indi-vidual seed fish.
The above provides general rules that apply to awide range of culture-based fisheries. Where naturalreproduction is an important source of recruitment orthere is strongly density-dependent mortality afterstocking, there are further considerations.
Assessment of Management Regimes in Practice
Population models incorporating the key processes ofsize-dependent mortality and density-dependentgrowth can be used in a variety of practical assess-ment situations. This section provides a brief over-view of data requirements and assessment procedures.
Data requirements
For a full assessment of management regimes, it isnecessary to estimate natural and fishing mortalityrates as well as parameters of the density-dependentgrowth model. A single stocking experiment is suffi-cient to obtain preliminary estimates of all para-meters except the degree of density-dependence ingrowth (i.e. the competition coefficient c), which canonly be established if growth data are available for arange of biomass densities.
The data required from a stocking experiment arethe number and size of fish released, and the recap-tures of stocked fish over time (numbers as well asindividual weight and/or length). The temporaldimension of recaptures is crucial to the analysis andmust be recorded, for example as numbers of fishrecaptured per month and their average weight and/or length. If only total recaptures in numbers orweight are recorded, it is not possible to estimatemodel parameters.
As a general rule, the best data will be obtained ifthe stocked seed fish are batch-marked (individualidentification is not required for this application).Using marked seed fish has the advantage that thetemporal dimension of recaptures and growth isdetermined even when fish can not be aged directly(as is the case in many tropical situations), and thatany possible natural recruitment of the species doesnot lead to bias in the parameter estimates. Wherefish can be aged from hard parts and the possibility ofnatural recruitment can be excluded, age-structured
catch data will provide the same information as batchmark-recapture.
Where no mark-recapture or age-based data areavailable, analysis of catch-length data may provideinformation on growth and total mortality in therecruited size classes (e.g. Pauly and Morgan 1987).Such information may be used to estimate modelparameters, but the precision of these estimates islikely to be lower than achievable from mark-recapture or age-based data.
Assessment procedure
A full assessment of management options in culture-based fisheries requires the following steps (Lorenzenet al. 1997):
(1) Estimation of natural and fishing mortality ratesand reconstruct the stocked cohort(s). In culture-based fisheries (where initial cohort numbers areknown), the full information is obtained from asingle analysis to which there are two differentapproaches: cohort analysis and statistical catch-at-age analysis (Hilborn and Walters 1992). Anexample of the use of cohort (or virtual popula-tion) analysis in culture-based fisheries is givenin Lorenzen et al. (1997), while catch at ageanalysis is illustrated in a later section of thispaper.
(2) Estimation of density-dependent growth para-meters. The growth model is fitted to weight orlength-at-age data, using the reconstructed popu-lation biomass as an independent variable(Lorenzen et al. 1997). This analysis is possibleonly if growth data are available for severalcohorts, under conditions of varying biomassdensity.
(3) Project catches and other variables of interest(e.g. size of harvested fish) for different possiblemanagement regimes. This step requires a for-ward projection model such as that used in statis-tical catch-at-age analysis. For a full analysisaccounting for the effects of density dependentgrowth, the model must involve a feedback loopbetween growth and biomass. Lorenzen et al.(1997) used an equilibrium model for the evalua-tion of management options, but dynamic modelscan be constructed in a similar way.
Where data on density-dependent growth arelacking, it is still possible to carry out a morerestricted analysis of the present management regime.It must be remembered, however, that density-dependent growth will affect the outcomes of allmanagement interventions that involve changes inbiomass density.
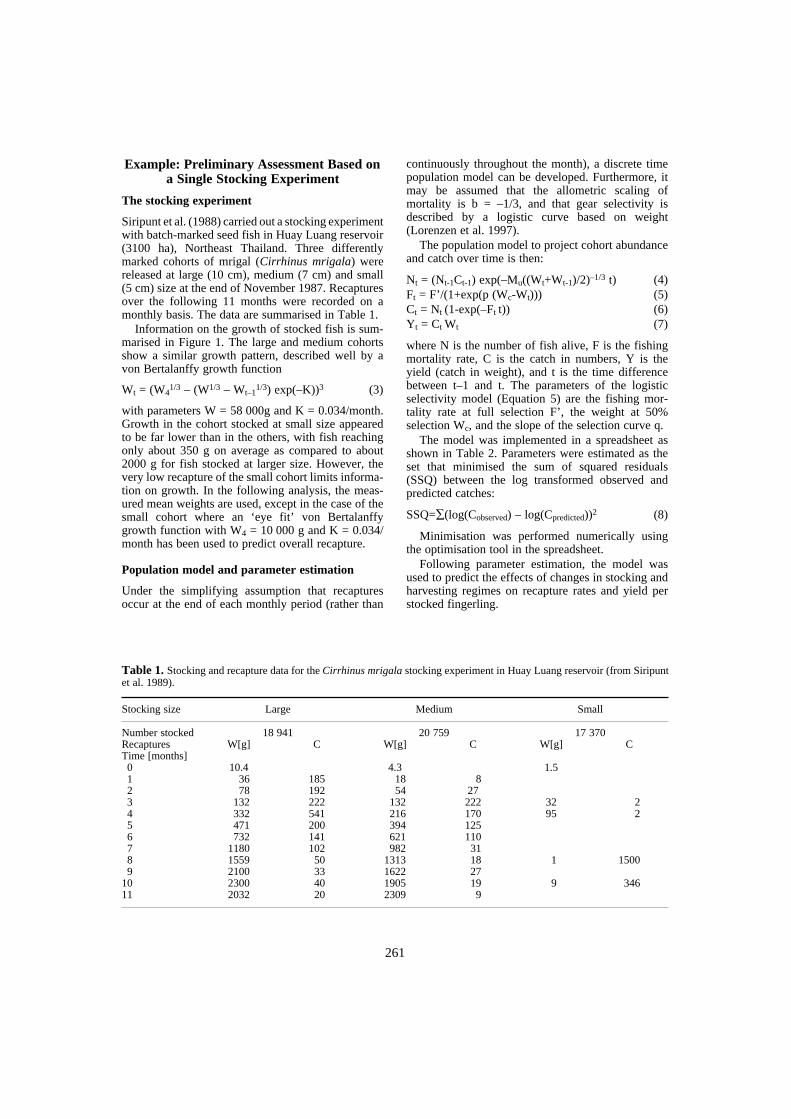
261
Example: Preliminary Assessment Based on a Single Stocking Experiment
The stocking experiment
Siripunt et al. (1988) carried out a stocking experimentwith batch-marked seed fish in Huay Luang reservoir(3100 ha), Northeast Thailand. Three differentlymarked cohorts of mrigal (Cirrhinus mrigala) werereleased at large (10 cm), medium (7 cm) and small(5 cm) size at the end of November 1987. Recapturesover the following 11 months were recorded on amonthly basis. The data are summarised in Table 1.
Information on the growth of stocked fish is sum-marised in Figure 1. The large and medium cohortsshow a similar growth pattern, described well by avon Bertalanffy growth function
Wt = (W41/3 – (W1/3 – Wt–1
1/3) exp(–K))3 (3)
with parameters W = 58 000g and K = 0.034/month.Growth in the cohort stocked at small size appearedto be far lower than in the others, with fish reachingonly about 350 g on average as compared to about2000 g for fish stocked at larger size. However, thevery low recapture of the small cohort limits informa-tion on growth. In the following analysis, the meas-ured mean weights are used, except in the case of thesmall cohort where an ‘eye fit’ von Bertalanffygrowth function with W4 = 10 000 g and K = 0.034/month has been used to predict overall recapture.
Population model and parameter estimation
Under the simplifying assumption that recapturesoccur at the end of each monthly period (rather than
continuously throughout the month), a discrete timepopulation model can be developed. Furthermore, itmay be assumed that the allometric scaling ofmortality is b = –1/3, and that gear selectivity isdescribed by a logistic curve based on weight(Lorenzen et al. 1997).
The population model to project cohort abundanceand catch over time is then:
Nt = (Nt-1Ct-1) exp(–Mu((Wt+Wt-1)/2)–1/3 t) (4)Ft = F’/(1+exp(p (Wc-Wt))) (5)Ct = Nt (1-exp(–Ft t)) (6)Yt = Ct Wt (7)
where N is the number of fish alive, F is the fishingmortality rate, C is the catch in numbers, Y is theyield (catch in weight), and t is the time differencebetween t–1 and t. The parameters of the logisticselectivity model (Equation 5) are the fishing mor-tality rate at full selection F’, the weight at 50%selection Wc, and the slope of the selection curve q.
The model was implemented in a spreadsheet asshown in Table 2. Parameters were estimated as theset that minimised the sum of squared residuals(SSQ) between the log transformed observed andpredicted catches:
SSQ=∑(log(Cobserved) – log(Cpredicted))2 (8)
Minimisation was performed numerically usingthe optimisation tool in the spreadsheet.
Following parameter estimation, the model wasused to predict the effects of changes in stocking andharvesting regimes on recapture rates and yield perstocked fingerling.
Table 1. Stocking and recapture data for the Cirrhinus mrigala stocking experiment in Huay Luang reservoir (from Siripuntet al. 1989).
Stocking size Large Medium Small
Number stocked 18 941 20 759 17 370Recaptures W[g] C W[g] C W[g] CTime [months]0 10.4 4.3 1.51 36 185 18 8 2 78 192 54 27 3 132 222 132 222 32 24 332 541 216 170 95 25 471 200 394 125 6 732 141 621 110 7 1180 102 982 31 8 1559 50 1313 18 1 15009 2100 33 1622 27
10 2300 40 1905 19 9 34611 2032 20 2309 9
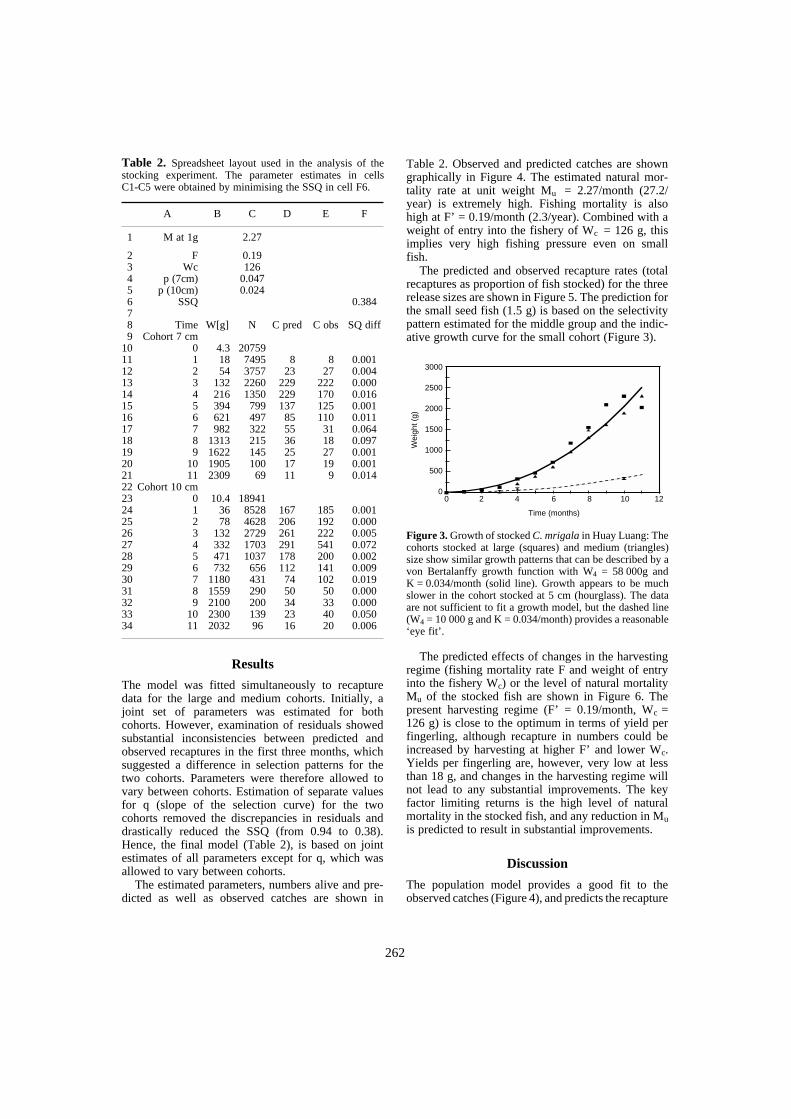
262
Results
The model was fitted simultaneously to recapturedata for the large and medium cohorts. Initially, ajoint set of parameters was estimated for bothcohorts. However, examination of residuals showedsubstantial inconsistencies between predicted andobserved recaptures in the first three months, whichsuggested a difference in selection patterns for thetwo cohorts. Parameters were therefore allowed tovary between cohorts. Estimation of separate valuesfor q (slope of the selection curve) for the twocohorts removed the discrepancies in residuals anddrastically reduced the SSQ (from 0.94 to 0.38).Hence, the final model (Table 2), is based on jointestimates of all parameters except for q, which wasallowed to vary between cohorts.
The estimated parameters, numbers alive and pre-dicted as well as observed catches are shown in
Table 2. Observed and predicted catches are showngraphically in Figure 4. The estimated natural mor-tality rate at unit weight Mu = 2.27/month (27.2/year) is extremely high. Fishing mortality is alsohigh at F’ = 0.19/month (2.3/year). Combined with aweight of entry into the fishery of Wc = 126 g, thisimplies very high fishing pressure even on smallfish.
The predicted and observed recapture rates (totalrecaptures as proportion of fish stocked) for the threerelease sizes are shown in Figure 5. The prediction forthe small seed fish (1.5 g) is based on the selectivitypattern estimated for the middle group and the indic-ative growth curve for the small cohort (Figure 3).
Figure 3. Growth of stocked C. mrigala in Huay Luang: Thecohorts stocked at large (squares) and medium (triangles)size show similar growth patterns that can be described by avon Bertalanffy growth function with W4 = 58 000g andK = 0.034/month (solid line). Growth appears to be muchslower in the cohort stocked at 5 cm (hourglass). The dataare not sufficient to fit a growth model, but the dashed line(W4 = 10 000 g and K = 0.034/month) provides a reasonable‘eye fit’.
The predicted effects of changes in the harvestingregime (fishing mortality rate F and weight of entryinto the fishery Wc) or the level of natural mortalityMu of the stocked fish are shown in Figure 6. Thepresent harvesting regime (F’ = 0.19/month, Wc =126 g) is close to the optimum in terms of yield perfingerling, although recapture in numbers could beincreased by harvesting at higher F’ and lower Wc.Yields per fingerling are, however, very low at lessthan 18 g, and changes in the harvesting regime willnot lead to any substantial improvements. The keyfactor limiting returns is the high level of naturalmortality in the stocked fish, and any reduction in Muis predicted to result in substantial improvements.
Discussion
The population model provides a good fit to theobserved catches (Figure 4), and predicts the recapture
Table 2. Spreadsheet layout used in the analysis of thestocking experiment. The parameter estimates in cellsC1-C5 were obtained by minimising the SSQ in cell F6.
A B C D E F
1 M at 1g 2.27
2 F 0.193 Wc 1264 p (7cm) 0.0475 p (10cm) 0.0246 SSQ 0.384 78 Time W[g] N C pred C obs SQ diff9 Cohort 7 cm
10 0 4.3 20759 11 1 18 7495 8 8 0.001 12 2 54 3757 23 27 0.004 13 3 132 2260 229 222 0.000 14 4 216 1350 229 170 0.016 15 5 394 799 137 125 0.001 16 6 621 497 85 110 0.011 17 7 982 322 55 31 0.064 18 8 1313 215 36 18 0.097 19 9 1622 145 25 27 0.001 20 10 1905 100 17 19 0.001 21 11 2309 69 11 9 0.014 22 Cohort 10 cm 23 0 10.4 18941 24 1 36 8528 167 185 0.001 25 2 78 4628 206 192 0.000 26 3 132 2729 261 222 0.005 27 4 332 1703 291 541 0.072 28 5 471 1037 178 200 0.002 29 6 732 656 112 141 0.009 30 7 1180 431 74 102 0.019 31 8 1559 290 50 50 0.000 32 9 2100 200 34 33 0.00033 10 2300 139 23 40 0.050 34 11 2032 96 16 20 0.006
3000
2500
2000
1500
1000
500
0
Wei
ght (
g)
0 2 4 6 8 10 12
Time (months)
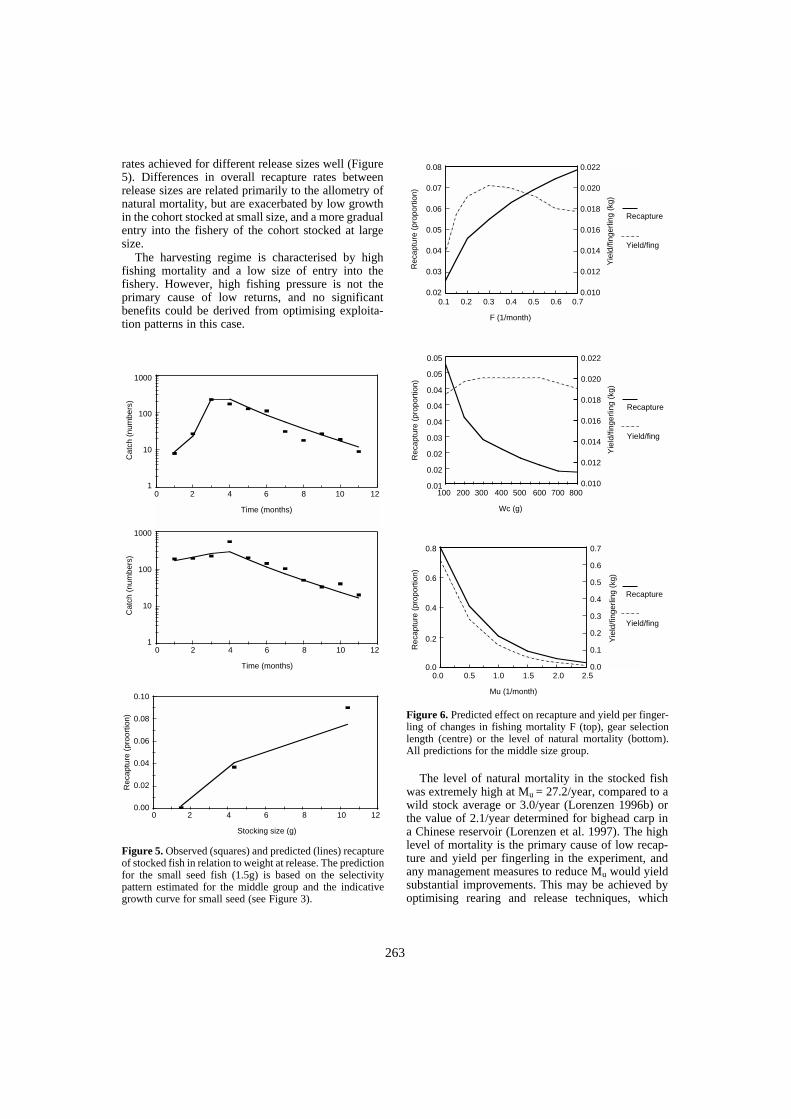
263
rates achieved for different release sizes well (Figure5). Differences in overall recapture rates betweenrelease sizes are related primarily to the allometry ofnatural mortality, but are exacerbated by low growthin the cohort stocked at small size, and a more gradualentry into the fishery of the cohort stocked at largesize.
The harvesting regime is characterised by highfishing mortality and a low size of entry into thefishery. However, high fishing pressure is not theprimary cause of low returns, and no significantbenefits could be derived from optimising exploita-tion patterns in this case.
Figure 5. Observed (squares) and predicted (lines) recaptureof stocked fish in relation to weight at release. The predictionfor the small seed fish (1.5g) is based on the selectivitypattern estimated for the middle group and the indicativegrowth curve for small seed (see Figure 3).
Figure 6. Predicted effect on recapture and yield per finger-ling of changes in fishing mortality F (top), gear selectionlength (centre) or the level of natural mortality (bottom).All predictions for the middle size group.
The level of natural mortality in the stocked fishwas extremely high at Mu = 27.2/year, compared to awild stock average or 3.0/year (Lorenzen 1996b) orthe value of 2.1/year determined for bighead carp ina Chinese reservoir (Lorenzen et al. 1997). The highlevel of mortality is the primary cause of low recap-ture and yield per fingerling in the experiment, andany management measures to reduce Mu would yieldsubstantial improvements. This may be achieved byoptimising rearing and release techniques, which
1000
100
10
1
Cat
ch (
num
bers
)
0 2 4 6 8 10 12
Time (months)
1000
100
10
1
Cat
ch (
num
bers
)
0 2 4 6 8 10 12
Time (months)
0.10
0.08
0.06
0.04
0.02
0.00
Rec
aptu
re (
proo
rtio
n)
0 2 4 6 8 10 12
Stocking size (g)
0.08
0.07
0.06
0.05
0.04
0.03
0.02
Rec
aptu
re (
prop
ortio
n)
0.022
0.020
0.018
0.016
0.014
0.012
0.010
Yie
ld/fi
nger
ling
(kg)
Recapture
Yield/fing
0.1 0.2 0.70.60.50.40.3
F (1/month)
0.05
0.05
0.04
0.04
0.04
0.03
0.02
0.02
0.01
Rec
aptu
re (
prop
ortio
n)
0.022
0.020
0.018
0.016
0.014
0.012
0.010
Yie
ld/fi
nger
ling
(kg)
Recapture
Yield/fing
100 200 700600500400300
Wc (g)
800
0.8
0.6
0.4
0.2
0.0
Rec
aptu
re (
prop
ortio
n)
0.7
0.6
0.5
0.4
0.3
0.2
0.1
0.0
Yie
ld/fi
nger
ling
(kg)
Recapture
Yield/fing
0.0 0.5 2.52.01.51.0
Mu (1/month)
264
have been shown to influence survival of stockedfish (Berg and Joergensen 1991, 1994; Cowx 1994;Carlstein 1997). Any reductions in Mu would lead toincreased biomass (unless stocking is reduced orfishing intensified), and a density-dependent growthresponse. The actual benefits of reduced mortalityare therefore likely to be lower than predicted here,but the exact magnitude of this compensatory effectcannot be predicted without information on thedegree of density dependence in growth.
The Need for Comparative Analyses
At present, most of the population model parametershave to be estimated for each particular fishery. Anexception is the allometric scaling factor b of naturalmortality, which has been found to be highly con-sistent in comparative analyses, and may therefore beconsidered known a priori. Other key parameterssuch as the competition coefficient c or the limitingasymptotic weight WL are likely to be related to thespecies concerned and to characteristics of the waterbody stocked. Once these parameters have beendetermined for a range of fisheries, comparativeanalyses may lead to empirical generalisations thatwould greatly improve the predictability of outcomesof culture-based fisheries. Hence, more widespreaduse of population models in the assessment ofculture-based fisheries would lead to synergisticbenefits in addition to the immediate benefits to thefishery assessed.
Conclusions
Population models with explicit representation of thekey processes of density-dependent growth and size-dependent mortality are powerful tools for theassessment of stocking and harvesting regimes inculture-based fisheries. Population models provideinsights into the factors underlying observed out-comes, and allow a quantitative evaluation ofmanagement options. Such models also aid compara-tive studies because they allow estimation of para-meters that can be compared between widelydifferent fisheries, such as Mu or the asymptotic sizefor a standardised biomass density.
Widespread use of population models will allowcomparative analyses to identify relationshipsbetween population model parameters and waterbody characteristics, which would further reduce datarequirements for individual fisheries and provide abetter basis for pre-stocking appraisal.
Acknowledgments
This work was supported by the Department forInternational Development of the United Kingdom(DFID), Fisheries Management Science Programme.The author gratefully acknowledges financialsupport from DFID and ACIAR for attending theworkshop.
References
Backiel, T. and Le Cren, E.D. 1978. Some density relation-ships for fish population parameters. In: Gerking, S.D.ed. The Ecology of Freshwater Fish Production. Black-well, Oxford, 279-302.
Berg, S. and Joergensen, J. 1991. Stocking experimentswith 0+ and 1+ trout parr, Salmo trutta L., of wild andhatchery origin: post-stocking mortality and smolt yield.J. Fish Biol., 39: 151–169.
—— 1994. Stocking eel (Anguilla anguilla) in streams. In:Cowx, I.G. ed. The Rehabilitation of FreshwaterFisheries. Blackwell Science, Oxford, 314–325.
Beverton, R.J.H. and Holt, S.J. 1957. On the Dynamics ofExploited Fish Populations. Fish. Invest. Ser. II, Vol. 19,553 p.
Carlstein, M. 1997. Effects of rearing technique and fishsize on post-stocking feeding, growth and survival ofEuropean grayling, Thymallus thymallus (L.). Fish.Manage. Ecol., 4: 391–404.
Cowx, I.G. 1994. Stocking strategies. Fish. Manage. Ecol.,1: 15–31.
Hilborn, R. and Walters, C.J. 1992. Quantitative FisheriesStock Assessment: Choice, Dynamics and Uncertainty.Chapman and Hall, New York.
Hanson, J.M. and Leggett, W.C. 1985. Experimental andfield evidence for inter- and intra-specific competitionin two freshwater fishes. Can. J. Fish. Aquat. Sci.,42: 280–286.
Le Cren, E.D. 1958. Observations on the growth of perch(Perca fluviatilis L.) over twenty-two years with specialreference to the effects of temperature and changes inpopulation density. J. Anim. Ecol., 27: 287-334.
Lorenzen, K. 1995. Population dynamics and managementof culture-based fisheries. Fish. Manage. Ecol., 2: 61–73.
——1996a. A simple von Bertalanffy model for density-dependent growth in extensive aquaculture, with anapplication to common carp (Cyprinus carpio). Aqua-culture, 142: 191-205.
—— 1996b. The relationship between body weight andnatural mortality in fish: a comparison of natural eco-systems and aquaculture. J. Fish Biol., 49: 627–647.
Lorenzen, K., Xu, G., Cao, F., Ye, J. and Hu, T. 1997.Analysing extensive fish culture systems by transparentpopulation modelling: bighead carp, Aristichthys nobilis(Richardson 1845), culture in a Chinese reservoir.Aquacult. Res.. 28: 867–880.
McGurk, M.D. 1986. Natural mortality of marine pelagicfish eggs and larvae: role of spatial patchiness. Mar.Ecol. Progr. Ser., 34: 227–242.

265
Pauly, D. and Morgan, G.P. ed.(1987. The Theory andApplication of Length-Based Methods of Stock Assess-ment. ICLARM, Manila.
Peterson, I. and Wroblewski, J.S. 1984. Mortality rate offishes in the pelagic ecosystem. Can. J. Fish. Aquat. Sci.,41: 1117–1120.
Salojaervi, K. and Mutenia, A. 1994. Effects of fingerlingstocking on recruitment in the Lake Inari whitefish(Coregonus lavaretus L. s.l.) fishery. In: Cowx, I. ed.Rehabilitation of Inland Fisheries. Fishing News Books,Oxford, 302–313.
Siripunt, N., Pawaputanond, O., Mahasarakham, N.,Juntana, J. Weerawaitaya, N. and Sankorntanakit, T.1988. Study on sizes of seed fishes for stocking in publicwaters. Technical Paper 11/1989; Inland FisheriesDivision, Department of Fisheries, Thailand.
Swingle, H.S. and Smith, E.V. 1942. Management of farmfish ponds. Bull. Ala. agric. Exp. Stn., No. 254.
van Someren, V.D. and Whitehead, P.J. 1961. The cultureof Tilapia nigra (Guenther) in ponds. V. The effect ofprogressive alterations in stocking density on the growthof male T. nigra. East African Agriculture and ForestryJournal, 26: 145–155.
Walter, E., 1934. Grundlagen der allgemeinen fischereili-chen Produktionslehre, einschließlich ihrer Anwendungauf die Fütterung. Handbuch d. Binnenfischerei Mitte-leuropas, 4(5): 481-662.
Welcomme, R.L. and Bartley, D.M. 1998. Currentapproaches to the enhancement of fisheries. Fish.Manage. Ecol., 5: 351–382.
266
Community-based Freshwater Fish Culture in Sri Lanka
K.B.C. Pushpalatha*
Abstract
In the recent past, planning and aquaculture development programs were a failure due to theabsence of the participation of local communities. The programs completely collapsed when Statepatronage was discontinued in 1990. However, State support for aquaculture development has sub-sequently been revived and the importance of community participation in implementing thestrategy is now well realised. This paper presents the results of attempts to increase fish productionin the North Central Province of Sri Lanka through aquaculture with the participation of village-level organisations. The activities centered on fry to fingerling rearing of Oreochromis niloticus,Labeo dussumieri and Cyprinus carpio in net cages (4 × 2.5 × 2 m) in reservoirs and a number ofvillage ponds (0.013–0.054 ha). The fingerlings produced were utilised in the culture-based fisheryin seasonal reservoirs, and six seasonal tanks (area 7–18 ha) were stocked. The agricultural farmerorganisations associated with seasonal tanks were trained in fish culture and were entrusted withstocking and harvesting fish. The general technological aspects of these culture systems, theiradvantages and constraints, with special reference to community participation, are discussed. Thedevelopment strategy of identifying village-level organisations suitable for aquaculture activities,formation of new societies for pond fish culture, and of linking them to state-owned fish-breedingstations are discussed. Tools utilised for technology extension are also highlighted. The importanceof providing financial assistance during the take-off stage is emphasised.
Sri Lanka is an island of 65 000 km2 and vast waterresources of more than 100 river systems and amultitude of reservoirs ranging in size from a fewhectares to several thousand and some dating backabout 2500 years. The total extent of reservoirs isabout 175 000 ha (Fernando 1993). There is historicalevidence that freshwater fisheries existed as early as100 AD (Siriweera 1986). However, due to low fishyields from indigenous fish that thrived in thesewaters and also due to religious barriers, the inlandfisheries remained sidelined for many years.
Government support for the sector was first pro-vided in the 1950s. In the year 1950, two fish-breeding stations were set up by the government, onein Polonnaruwa and the other in Colombo. Theexotic cichlid Oreochromis mossambicus (Peters)was introduced into reservoirs in 1952. With thisintroduction and combined with extension support,
fish production in the reservoirs increased dramati-cally. The fish catch of 400 t in 1956 rose to 8000 tby the year 1969 (Amarasinghe and De Silva 1999).
Due to various state-sponsored inland fisheriesdevelopment activities, the country’s annual inlandfish production increased to 39 750 t in 1989. How-ever, due to various religious and political reasons,State patronage for the inland fisheries and aqua-culture was discontinued during 1990–1994 (Amara-singhe and De Silva 1999). During that period, fishproduction dropped to 12 000 t in 1994 (Table 1).
Failure to monitor reservoir fisheries by govern-ment resulted in over-exploitation of the resource,causing production to decline, thus indicating theineffectiveness of a top-down approach for imple-menting management strategies (Amarasinghe1998a). It was also evident that in reservoirs wherethere were well-organised fishing communities withtheir own fishery regulations to manage fish stocks,there was no over-exploitation even after withdrawalof State patronage (Amarasinghe 1998a; Amara-singhe and De Silva 1999). The policy of the govern-ment on inland fisheries reversed in 1994 and the
*National Aquaculture Development Authority of Sri Lanka,Fisheries Research Station, Dambulla, Sri Lanka
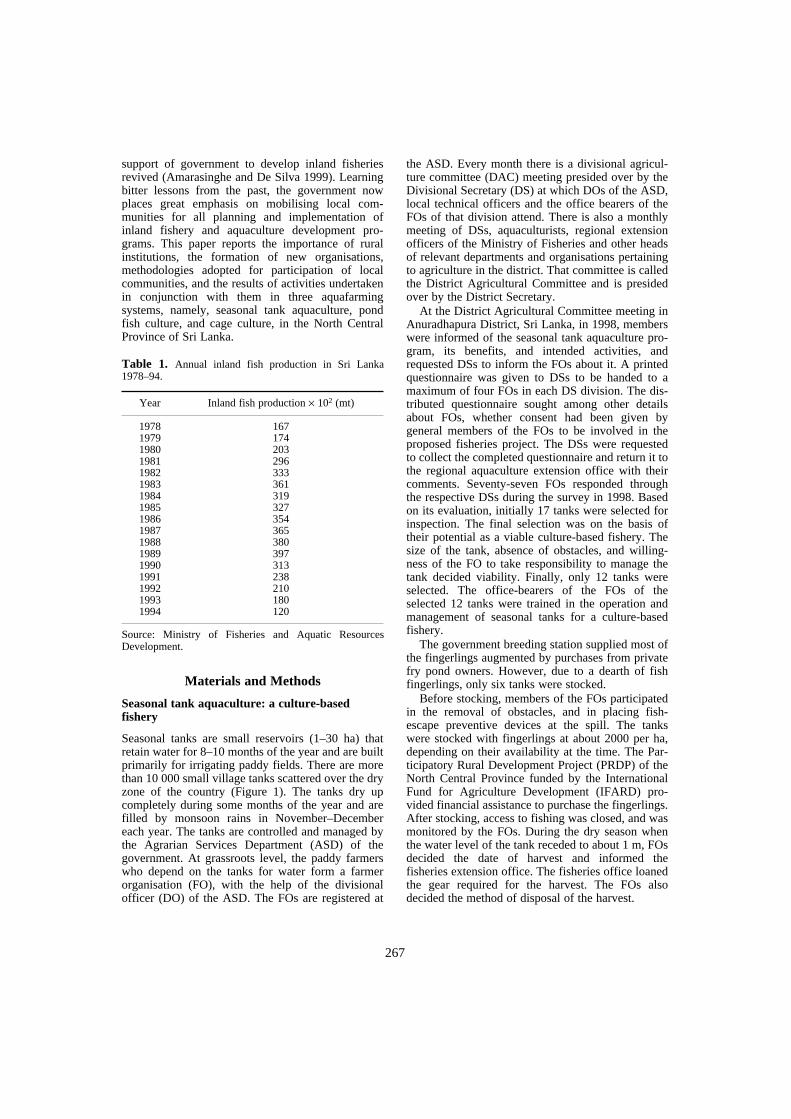
267
support of government to develop inland fisheriesrevived (Amarasinghe and De Silva 1999). Learningbitter lessons from the past, the government nowplaces great emphasis on mobilising local com-munities for all planning and implementation ofinland fishery and aquaculture development pro-grams. This paper reports the importance of ruralinstitutions, the formation of new organisations,methodologies adopted for participation of localcommunities, and the results of activities undertakenin conjunction with them in three aquafarmingsystems, namely, seasonal tank aquaculture, pondfish culture, and cage culture, in the North CentralProvince of Sri Lanka.
Source: Ministry of Fisheries and Aquatic ResourcesDevelopment.
Materials and Methods
Seasonal tank aquaculture: a culture-based fishery
Seasonal tanks are small reservoirs (1–30 ha) thatretain water for 8–10 months of the year and are builtprimarily for irrigating paddy fields. There are morethan 10 000 small village tanks scattered over the dryzone of the country (Figure 1). The tanks dry upcompletely during some months of the year and arefilled by monsoon rains in November–Decembereach year. The tanks are controlled and managed bythe Agrarian Services Department (ASD) of thegovernment. At grassroots level, the paddy farmerswho depend on the tanks for water form a farmerorganisation (FO), with the help of the divisionalofficer (DO) of the ASD. The FOs are registered at
the ASD. Every month there is a divisional agricul-ture committee (DAC) meeting presided over by theDivisional Secretary (DS) at which DOs of the ASD,local technical officers and the office bearers of theFOs of that division attend. There is also a monthlymeeting of DSs, aquaculturists, regional extensionofficers of the Ministry of Fisheries and other headsof relevant departments and organisations pertainingto agriculture in the district. That committee is calledthe District Agricultural Committee and is presidedover by the District Secretary.
At the District Agricultural Committee meeting inAnuradhapura District, Sri Lanka, in 1998, memberswere informed of the seasonal tank aquaculture pro-gram, its benefits, and intended activities, andrequested DSs to inform the FOs about it. A printedquestionnaire was given to DSs to be handed to amaximum of four FOs in each DS division. The dis-tributed questionnaire sought among other detailsabout FOs, whether consent had been given bygeneral members of the FOs to be involved in theproposed fisheries project. The DSs were requestedto collect the completed questionnaire and return it tothe regional aquaculture extension office with theircomments. Seventy-seven FOs responded throughthe respective DSs during the survey in 1998. Basedon its evaluation, initially 17 tanks were selected forinspection. The final selection was on the basis oftheir potential as a viable culture-based fishery. Thesize of the tank, absence of obstacles, and willing-ness of the FO to take responsibility to manage thetank decided viability. Finally, only 12 tanks wereselected. The office-bearers of the FOs of theselected 12 tanks were trained in the operation andmanagement of seasonal tanks for a culture-basedfishery.
The government breeding station supplied most ofthe fingerlings augmented by purchases from privatefry pond owners. However, due to a dearth of fishfingerlings, only six tanks were stocked.
Before stocking, members of the FOs participatedin the removal of obstacles, and in placing fish-escape preventive devices at the spill. The tankswere stocked with fingerlings at about 2000 per ha,depending on their availability at the time. The Par-ticipatory Rural Development Project (PRDP) of theNorth Central Province funded by the InternationalFund for Agriculture Development (IFARD) pro-vided financial assistance to purchase the fingerlings.After stocking, access to fishing was closed, and wasmonitored by the FOs. During the dry season whenthe water level of the tank receded to about 1 m, FOsdecided the date of harvest and informed thefisheries extension office. The fisheries office loanedthe gear required for the harvest. The FOs alsodecided the method of disposal of the harvest.
Table 1. Annual inland fish production in Sri Lanka1978–94.
Year Inland fish production × 102 (mt)
1978 1671979 1741980 2031981 2961982 3331983 3611984 3191985 3271986 3541987 3651988 3801989 3971990 3131991 2381992 2101993 1801994 120
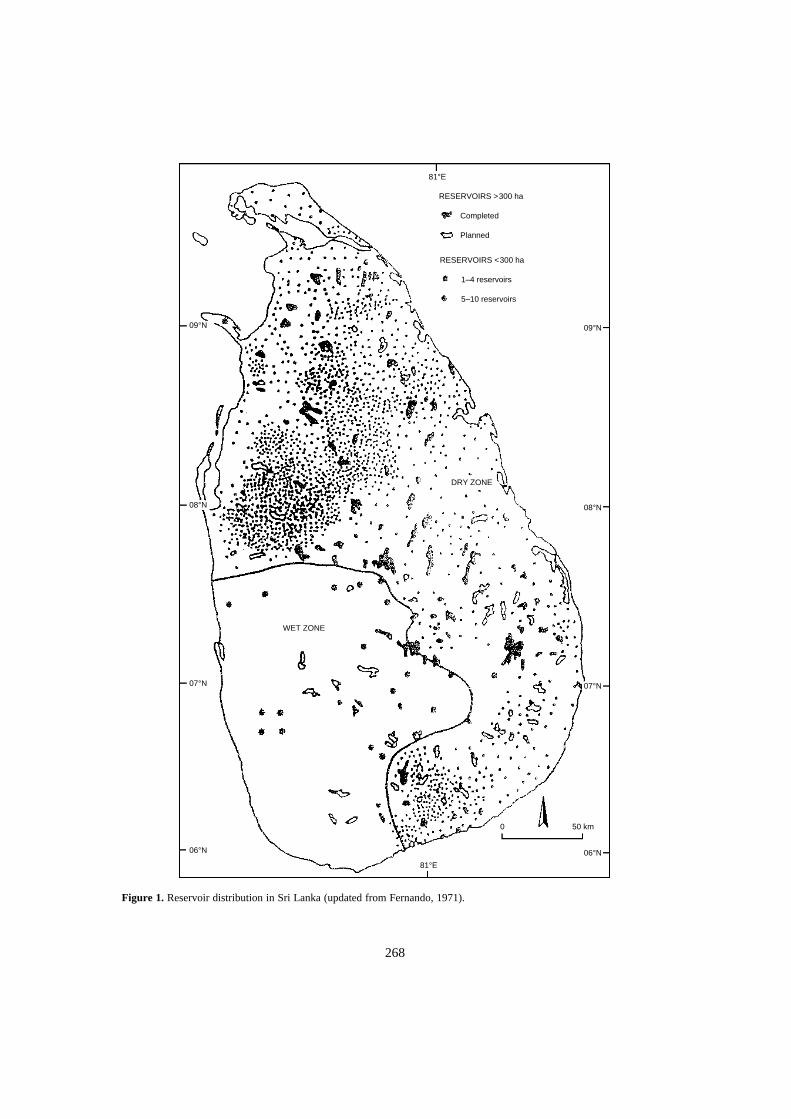
268
Figure 1. Reservoir distribution in Sri Lanka (updated from Fernando, 1971).
09°N
08°N
07°N
06°N
81°E
81°E
09°N
08°N
07°N
06°N
DRY ZONE
WET ZONE
RESERVOIRS >300 ha
Completed
Planned
RESERVOIRS <300 ha
1–4 reservoirs
5–10 reservoirs
50 km0
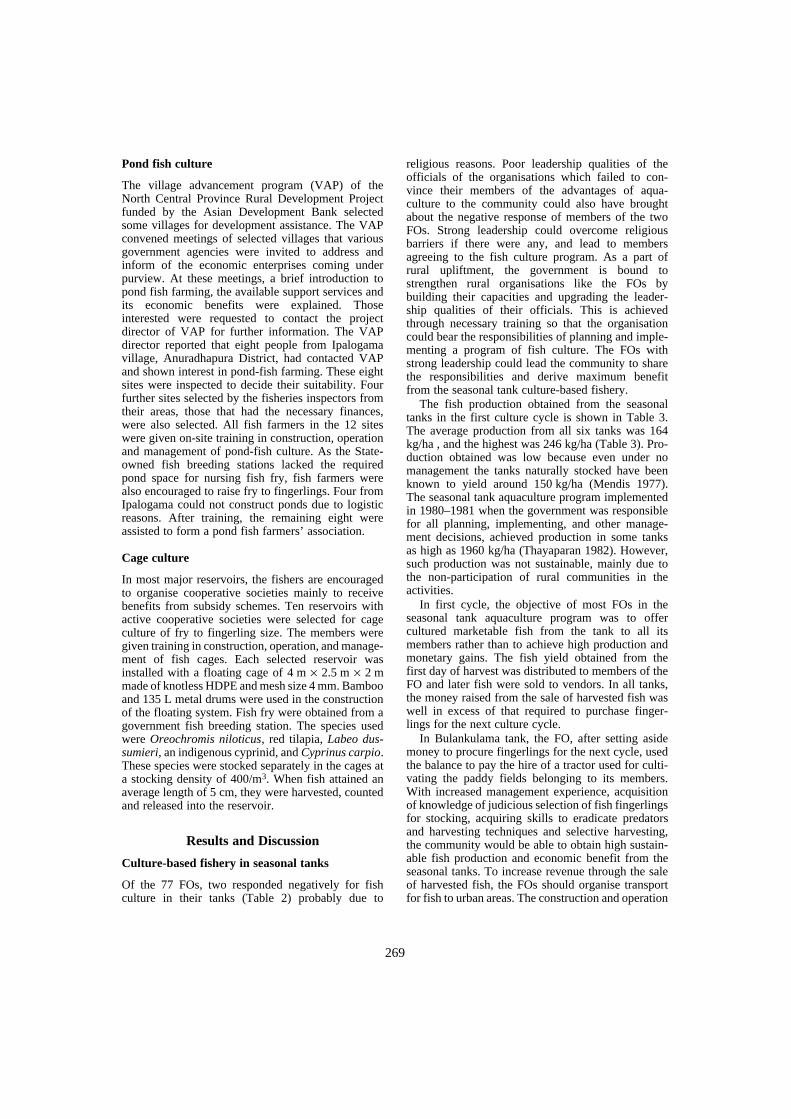
269
Pond fish culture
The village advancement program (VAP) of theNorth Central Province Rural Development Projectfunded by the Asian Development Bank selectedsome villages for development assistance. The VAPconvened meetings of selected villages that variousgovernment agencies were invited to address andinform of the economic enterprises coming underpurview. At these meetings, a brief introduction topond fish farming, the available support services andits economic benefits were explained. Thoseinterested were requested to contact the projectdirector of VAP for further information. The VAPdirector reported that eight people from Ipalogamavillage, Anuradhapura District, had contacted VAPand shown interest in pond-fish farming. These eightsites were inspected to decide their suitability. Fourfurther sites selected by the fisheries inspectors fromtheir areas, those that had the necessary finances,were also selected. All fish farmers in the 12 siteswere given on-site training in construction, operationand management of pond-fish culture. As the State-owned fish breeding stations lacked the requiredpond space for nursing fish fry, fish farmers werealso encouraged to raise fry to fingerlings. Four fromIpalogama could not construct ponds due to logisticreasons. After training, the remaining eight wereassisted to form a pond fish farmers’ association.
Cage culture
In most major reservoirs, the fishers are encouragedto organise cooperative societies mainly to receivebenefits from subsidy schemes. Ten reservoirs withactive cooperative societies were selected for cageculture of fry to fingerling size. The members weregiven training in construction, operation, and manage-ment of fish cages. Each selected reservoir wasinstalled with a floating cage of 4 m × 2.5 m × 2 mmade of knotless HDPE and mesh size 4 mm. Bambooand 135 L metal drums were used in the constructionof the floating system. Fish fry were obtained from agovernment fish breeding station. The species usedwere Oreochromis niloticus, red tilapia, Labeo dus-sumieri, an indigenous cyprinid, and Cyprinus carpio.These species were stocked separately in the cages ata stocking density of 400/m3. When fish attained anaverage length of 5 cm, they were harvested, countedand released into the reservoir.
Results and Discussion
Culture-based fishery in seasonal tanks
Of the 77 FOs, two responded negatively for fishculture in their tanks (Table 2) probably due to
religious reasons. Poor leadership qualities of theofficials of the organisations which failed to con-vince their members of the advantages of aqua-culture to the community could also have broughtabout the negative response of members of the twoFOs. Strong leadership could overcome religiousbarriers if there were any, and lead to membersagreeing to the fish culture program. As a part ofrural upliftment, the government is bound tostrengthen rural organisations like the FOs bybuilding their capacities and upgrading the leader-ship qualities of their officials. This is achievedthrough necessary training so that the organisationcould bear the responsibilities of planning and imple-menting a program of fish culture. The FOs withstrong leadership could lead the community to sharethe responsibilities and derive maximum benefitfrom the seasonal tank culture-based fishery.
The fish production obtained from the seasonaltanks in the first culture cycle is shown in Table 3.The average production from all six tanks was 164kg/ha , and the highest was 246 kg/ha (Table 3). Pro-duction obtained was low because even under nomanagement the tanks naturally stocked have beenknown to yield around 150 kg/ha (Mendis 1977).The seasonal tank aquaculture program implementedin 1980–1981 when the government was responsiblefor all planning, implementing, and other manage-ment decisions, achieved production in some tanksas high as 1960 kg/ha (Thayaparan 1982). However,such production was not sustainable, mainly due tothe non-participation of rural communities in theactivities.
In first cycle, the objective of most FOs in theseasonal tank aquaculture program was to offercultured marketable fish from the tank to all itsmembers rather than to achieve high production andmonetary gains. The fish yield obtained from thefirst day of harvest was distributed to members of theFO and later fish were sold to vendors. In all tanks,the money raised from the sale of harvested fish waswell in excess of that required to purchase finger-lings for the next culture cycle.
In Bulankulama tank, the FO, after setting asidemoney to procure fingerlings for the next cycle, usedthe balance to pay the hire of a tractor used for culti-vating the paddy fields belonging to its members.With increased management experience, acquisitionof knowledge of judicious selection of fish fingerlingsfor stocking, acquiring skills to eradicate predatorsand harvesting techniques and selective harvesting,the community would be able to obtain high sustain-able fish production and economic benefit from theseasonal tanks. To increase revenue through the saleof harvested fish, the FOs should organise transportfor fish to urban areas. The construction and operation
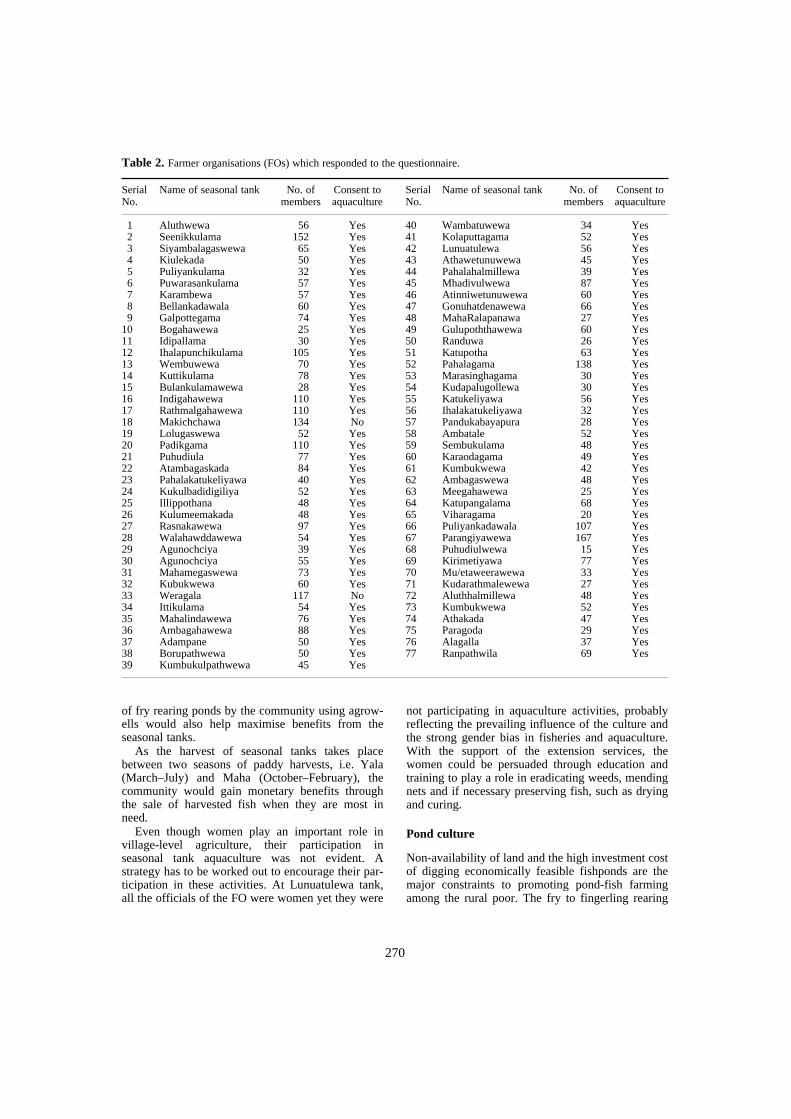
270
of fry rearing ponds by the community using agrow-ells would also help maximise benefits from theseasonal tanks.
As the harvest of seasonal tanks takes placebetween two seasons of paddy harvests, i.e. Yala(March–July) and Maha (October–February), thecommunity would gain monetary benefits throughthe sale of harvested fish when they are most inneed.
Even though women play an important role invillage-level agriculture, their participation inseasonal tank aquaculture was not evident. Astrategy has to be worked out to encourage their par-ticipation in these activities. At Lunuatulewa tank,all the officials of the FO were women yet they were
not participating in aquaculture activities, probablyreflecting the prevailing influence of the culture andthe strong gender bias in fisheries and aquaculture.With the support of the extension services, thewomen could be persuaded through education andtraining to play a role in eradicating weeds, mendingnets and if necessary preserving fish, such as dryingand curing.
Pond culture
Non-availability of land and the high investment costof digging economically feasible fishponds are themajor constraints to promoting pond-fish farmingamong the rural poor. The fry to fingerling rearing
Table 2. Farmer organisations (FOs) which responded to the questionnaire.
SerialNo.
Name of seasonal tank No. of members
Consent to aquaculture
Serial No.
Name of seasonal tank No. of members
Consent to aquaculture
1 Aluthwewa 56 Yes 40 Wambatuwewa 34 Yes2 Seenikkulama 152 Yes 41 Kolaputtagama 52 Yes3 Siyambalagaswewa 65 Yes 42 Lunuatulewa 56 Yes4 Kiulekada 50 Yes 43 Athawetunuwewa 45 Yes5 Puliyankulama 32 Yes 44 Pahalahalmillewa 39 Yes6 Puwarasankulama 57 Yes 45 Mhadivulwewa 87 Yes7 Karambewa 57 Yes 46 Atinniwetunuwewa 60 Yes8 Bellankadawala 60 Yes 47 Gonuhatdenawewa 66 Yes9 Galpottegama 74 Yes 48 MahaRalapanawa 27 Yes
10 Bogahawewa 25 Yes 49 Gulupoththawewa 60 Yes11 Idipallama 30 Yes 50 Randuwa 26 Yes12 Ihalapunchikulama 105 Yes 51 Katupotha 63 Yes13 Wembuwewa 70 Yes 52 Pahalagama 138 Yes14 Kuttikulama 78 Yes 53 Marasinghagama 30 Yes15 Bulankulamawewa 28 Yes 54 Kudapalugollewa 30 Yes16 Indigahawewa 110 Yes 55 Katukeliyawa 56 Yes17 Rathmalgahawewa 110 Yes 56 Ihalakatukeliyawa 32 Yes18 Makichchawa 134 No 57 Pandukabayapura 28 Yes19 Lolugaswewa 52 Yes 58 Ambatale 52 Yes20 Padikgama 110 Yes 59 Sembukulama 48 Yes21 Puhudiula 77 Yes 60 Karaodagama 49 Yes22 Atambagaskada 84 Yes 61 Kumbukwewa 42 Yes23 Pahalakatukeliyawa 40 Yes 62 Ambagaswewa 48 Yes24 Kukulbadidigiliya 52 Yes 63 Meegahawewa 25 Yes25 Illippothana 48 Yes 64 Katupangalama 68 Yes26 Kulumeemakada 48 Yes 65 Viharagama 20 Yes27 Rasnakawewa 97 Yes 66 Puliyankadawala 107 Yes28 Walahawddawewa 54 Yes 67 Parangiyawewa 167 Yes29 Agunochciya 39 Yes 68 Puhudiulwewa 15 Yes30 Agunochciya 55 Yes 69 Kirimetiyawa 77 Yes31 Mahamegaswewa 73 Yes 70 Mu/etaweerawewa 33 Yes32 Kubukwewa 60 Yes 71 Kudarathmalewewa 27 Yes33 Weragala 117 No 72 Aluthhalmillewa 48 Yes34 Ittikulama 54 Yes 73 Kumbukwewa 52 Yes35 Mahalindawewa 76 Yes 74 Athakada 47 Yes36 Ambagahawewa 88 Yes 75 Paragoda 29 Yes37 Adampane 50 Yes 76 Alagalla 37 Yes38 Borupathwewa 50 Yes 77 Ranpathwila 69 Yes39 Kumbukulpathwewa 45 Yes

271
was more attractive to them as the area needed wassmaller and the crop turn over rate is higher. Cul-turing marketable-size fish in small ponds requireshigh technology and input costs, both of which arebeyond the reach of the rural poor. The fry survivalrate was 33–86% (Table 4). Lower survival rateswere mainly due to the absence of cover nets to pre-vent bird predation (Fernando 1980). Forming anassociation of pond fish farmers help to reduce thecost of pond construction. Through their association,Ipalogama fish farmers made representations to theRoad Development Authority (RDA) to obtain therelease of a back-hoe that came to the village (torehabilitate the village road) for pond construction.Any individual requests would have been rejected bythe RDA as against regulations to release themachines for private work. Close links between thepond farmers, extension staff and breeding stationare vital to the timely disposal of fingerlings and
stocking of fish fry. It is critical for farmers whohave obtained loans for pond construction, to avoidpenal interest expenses. In pond fish farming, theloan servicing should be tied up to the cash flowgenerating capacity of the project, and not tostandard monthly interest payment servicingnormally adopted by commercial banks.
Cage rearing
The cooperative societies of the perennial reservoirswere mostly involved in activities connected with thesubsidy schemes. When the State withdrew subsidyschemes, the societies became inactive (Amara-singhe and De Silva 1999). The introduction of cagefish farming in the reservoirs reactivated them. Theyrealised that enforcement of regulations alone by thecommunity would not suffice to increase fish pro-duction, and stocking fingerlings is a vital manage-ment aspect. Amarasinghe (1998) has shown that this
Rh = Labeo rohita; cc = Cyprinus carpio; On = Oreochromis niloticus; Ld = Labeo dussumieri; Mg = Cirrihinus mrigal
Table 3. Number of fingerlings stocked and harvest obtained from the seasonal tanks. Notes: Reservoir area is expressed asthe effective area (= 0.5 × area at full supply level).
Name of seasonal tank
Divisional Secretary Division
Effective area (ha)
Species Total harvest
(kg)
Culture period
(months)
Remarks
Gulupettawewa Wilachchiya 7.6 RhccOnLd
1500450052003000
428 5 partial harvest
Rathmalgahawewa Thirappane 8.5 RhccOnLdMg
16004800560024001600
375 6
Bulankulama Thirappane 10.0 RhccOnLdMg
20005500650038401000
1420 8
Lunuatulewa Kebethigollewa 11.3 RhccOnLdMg
25006500800035001500
2780 6 officials of FO are women
Maharalapanawa Kabethigollewa 12.8 RhccOnLdMg
250075008500500
1200
2635 6 partial harvest
Galpottegama Anuradhapura (west) 17.0 RhccOnLd
15004000800
3000
3400 6
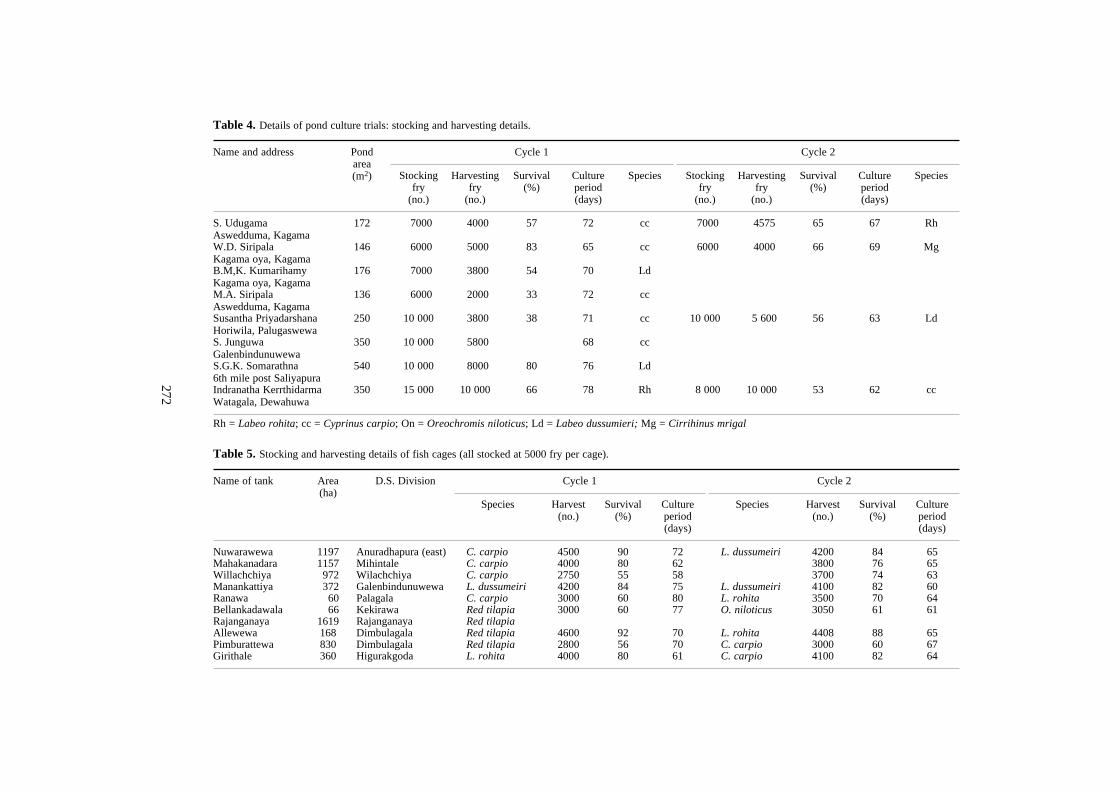
272
Rh = Labeo rohita; cc = Cyprinus carpio; On = Oreochromis niloticus; Ld = Labeo dussumieri; Mg = Cirrihinus mrigal
Table 4. Details of pond culture trials: stocking and harvesting details.
Name and address Pond area (m2)
Cycle 1 Cycle 2
Stockingfry
(no.)
Harvesting fry
(no.)
Survival(%)
Cultureperiod(days)
Species Stockingfry
(no.)
Harvesting fry
(no.)
Survival(%)
Culture period (days)
Species
S. Udugama Aswedduma, Kagama
172 7000 4000 57 72 cc 7000 4575 65 67 Rh
W.D. SiripalaKagama oya, Kagama
146 6000 5000 83 65 cc 6000 4000 66 69 Mg
B.M,K. KumarihamyKagama oya, Kagama
176 7000 3800 54 70 Ld
M.A. SiripalaAswedduma, Kagama
136 6000 2000 33 72 cc
Susantha PriyadarshanaHoriwila, Palugaswewa
250 10 000 3800 38 71 cc 10 000 5 600 56 63 Ld
S. JunguwaGalenbindunuwewa
350 10 000 5800 68 cc
S.G.K. Somarathna6th mile post Saliyapura
540 10 000 8000 80 76 Ld
Indranatha KerrthidarmaWatagala, Dewahuwa
350 15 000 10 000 66 78 Rh 8 000 10 000 53 62 cc
Table 5. Stocking and harvesting details of fish cages (all stocked at 5000 fry per cage).
Name of tank Area(ha)
D.S. Division Cycle 1 Cycle 2
Species Harvest (no.)
Survival(%)
Culture period (days)
Species Harvest (no.)
Survival (%)
Culture period (days)
Nuwarawewa 1197 Anuradhapura (east) C. carpio 4500 90 72 L. dussumeiri 4200 84 65Mahakanadara 1157 Mihintale C. carpio 4000 80 62 3800 76 65Willachchiya 972 Wilachchiya C. carpio 2750 55 58 3700 74 63Manankattiya 372 Galenbindunuwewa L. dussumeiri 4200 84 75 L. dussumeiri 4100 82 60Ranawa 60 Palagala C. carpio 3000 60 80 L. rohita 3500 70 64Bellankadawala 66 Kekirawa Red tilapia 3000 60 77 O. niloticus 3050 61 61Rajanganaya 1619 Rajanganaya Red tilapiaAllewewa 168 Dimbulagala Red tilapia 4600 92 70 L. rohita 4408 88 65Pimburattewa 830 Dimbulagala Red tilapia 2800 56 70 C. carpio 3000 60 67Girithale 360 Higurakgoda L. rohita 4000 80 61 C. carpio 4100 82 64

273
is true only for shallow (<750 ha) perennial reser-voirs. The culture of fry to fingerlings in cagesinstalled in the reservoirs was therefore well receivedby the fishing community. Fry rearing in cages in allthe reservoirs was very satisfactory and the survivalrates obtained were around 70% (Table 5). With theintroduction of fish cages in reservoirs, the aqua-culturists, extension officers and the fishing com-munities were closely linked, which augurs well forthe industry.
For the sustainable development of culturing fishin seasonal tanks, ponds and cages installed in reser-voirs with the participation of communities, it isnecessary to transfer fish breeding techniques andnursery operations to these communities.
Acknowledgment
The author thanks Mr A.M. Jayasekara, Director-General, NAQDA for all encouragement, Mr V.K.J.Thalpawila, Project Director, North Central ProvinceRural Development Project (Asian DevelopmentBank) for providing facilities, and Dr U.S. Amara-singhe, Associate Professor, Department of Zoology,University of Kelaniya, for his guidance. Mr H.P.Amandakoon, consultant, North Central ProvinceRural Development Project, read the draft of thismanuscript.
ReferencesAmarasinghe, U.S. 1998a. Reservoir fisheries management
in Sri Lanka: achievements, mistakes and lessons for thefuture. International Review of Hydrobiology (SpecialIssue), 83: 523–530.
—— U.S. 1998b. How effective are the stocking strategiesfor the management of reservoir fisheries in Sri Lanka?In: Cowx, I.G. ed. Stocking and Introduction of Fish.Fishing News Books, Blackwell Science Ltd, Oxford,422–436.
Amarasinghe, U.S. and De Silva, S.S. 1999. Sri Lankanreservoir fishery: A case for introduction of a co-management strategy. Fisheries Management andEcology, 6: 387–399.
Fernando, C.H. 1980. Tropical man-made lakes, African fishand cheap protein. ICLARM Newsletter, 3(1): 15–17.
—— 1993. Impact of Sri Lankan reservoirs, their fisheries,management and conservation. In: Erdelen, W., Preu, C.,Ishwaran, N. and Madduma Bandara, C.M. ed. Proceed-ings of the International and Interdisciplinary Sym-posium, Ecology and Landscape Management in SriLanka, Colombo, Sri Lanka 12–16 March 1990. Mar-graft Science Books, Weikersheim, Germany, 351–374.
Mendis, A.S. 1977. The role of manmade lakes in thedevelopment of freshwater fisheries in Sri Lanka. Pro-ceedings of the Indo-Pacific Fisheries Council, 17(3):247–254.
Siriweera, S.L. 1986. The Inland Fisheries in Sri Lanka: AHistorical Perspective. Agrarian Research and TrainingInstutute, Colombo, 44 p.
Thayaparan, K. 1982. Role of seasonal tanks in the develop-ment of fresh-water fisheries in Sri Lanka. Journal ofInland Fisheries, Sri Lanka, 1: 133–167.
274
Status of Culture-based Fisheries in Small Reservoirs in India
V.V. Sugunan*
Abstract
Small irrigation impoundments on small streams constitute nearly half of the total 3.15 millionha of reservoirs in India. Most of these either dry up or retain very little water during summer,leaving little scope for natural recruitment of fish populations. Thus, culture-based fisheriesbecome the most appropriate forms of management for these water bodies. As stocking of exoticcarp and tilapia is not encouraged in reservoirs in India, the Indian major carps Catla catla, Labeorohita and Cirrhinus mrigala are the most preferred options. Fish yield from small reservoirs inIndia ranges from 3.9 kg/ha in Bihar to 188 kg/ha in Andhra Pradesh, at a national average of50 kg/ha, which is much lower than those of Sri Lanka (300 kg/ha) and Cuba (100 kg/ha). Physico-chemical parameters of Indian reservoirs suggest a conducive regime for organic productivity andthey have impressive standing crops of plankton and other biotic communities. However, thesepositive attributes are not reflected in the fish catch due to inadequate stock and species manage-ment. In the absence of a clear policy or guidelines, stocking practices in the reservoirs of differentIndian states is rather arbitrary. Some major aspects of culture-based fisheries, viz. size at stocking,stocking density, size at capture and harvesting schedule, have not received attention. Besides,there is a shortage of large-sized fingerlings for stocking reservoirs. Although India produces morethan 18 000 million fry annually (mainly Indian major carps), they are seldom reared to fingerlingsize and stocked in reservoirs. Most fry are used for the pond culture segment which is in theprivate sector. The government and cooperative societies which manage the reservoir fisherieshave inadequate facilities to raise the required number of fingerlings. Improved stock and speciesmanagement, experimented in selected reservoirs across the country, has shown encouragingresults. In Aliyar and Thirumoorthy reservoirs of Tamil Nadu, yield could be increased to 194 and182 kg/ha respectively, against the state average of 48 kg/ha. Yields of Meenkara and Chulliarreservoirs in Kerala increased to 107 and 316 kg/ha, respectively (state average 53.5 kg/ha). Sim-ilar yield enhancements were achieved in Karnataka, Uttar Pradesh and Rajasthan. The averageyield of nine such managed reservoirs is 150 kg/ha, which indicates the possibility for increasingthe present yield (74 129 t) of small reservoirs by at least three times (to 222 839 t), if the norms ofculture-based fisheries are followed.
RESERVOIRS constitute the single largest inland fish-eries resource of India, both in terms of resource sizeand the production potential. The country receives anestimated annual 400 million ha–m rainfall, one ofthe highest in the world for a country of comparablesize (Rama 1978). However, the temporal and spatialdistribution of this rainfall exhibit wide variationwithin the country. The Western Ghats, Assam, partsof sub-Himalayan West Bengal and some higher
elevations of the Himalayas up to Punjab have morethan 100 rainy days a year, while in extreme westRajasthan, the number of rainy days is fewer than 10.
In more than one-third of the country, 90% of therainfall and thereby surface flow is limited to a briefperiod of 2–3 months. This extreme seasonality inrainfall distribution makes the irrigation reservoirs asine qua non for agriculture in India, especially inthe rain shadows of peninsular India. The steepgradient and heavy discharge of water in the moun-tain slopes of the Western Ghats, the northeast andthe Himalayas offer ideal opportunities for hydro-electric power generation. Many such projects have
*Central Inland Capture Fisheries Research Institute,Barrackpore 743101, West Bengal, India. Email: [email protected]
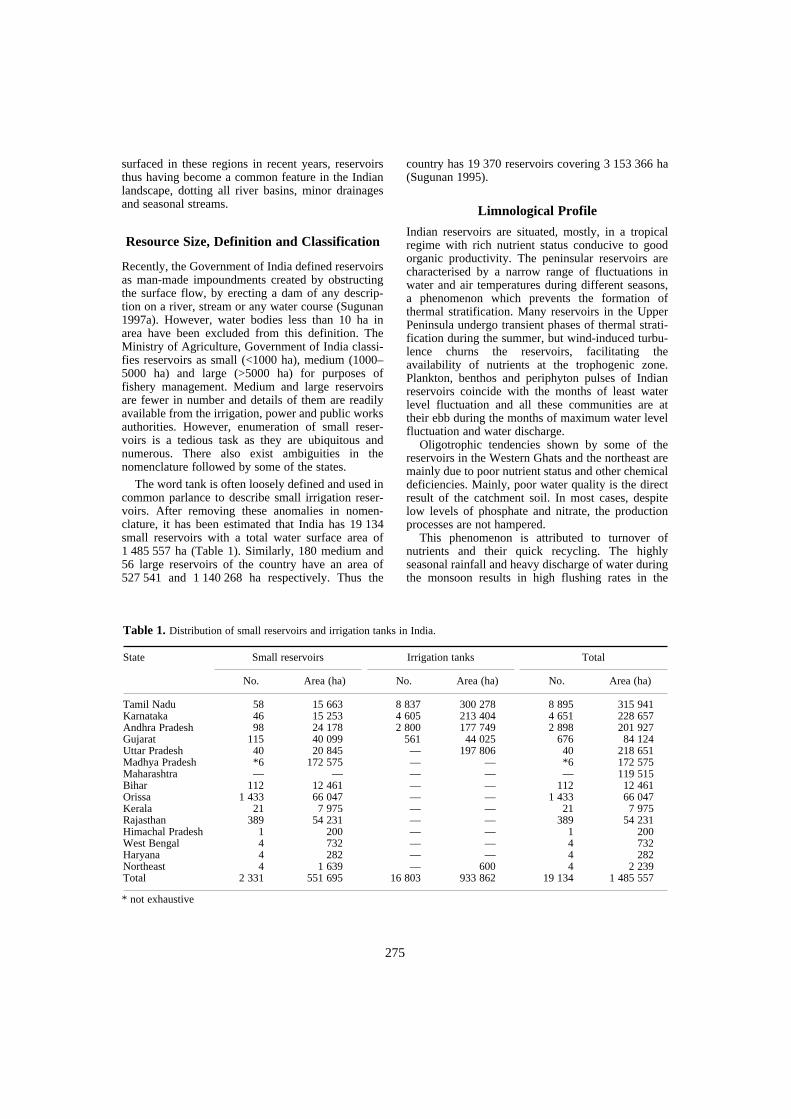
275
surfaced in these regions in recent years, reservoirsthus having become a common feature in the Indianlandscape, dotting all river basins, minor drainagesand seasonal streams.
Resource Size, Definition and Classification
Recently, the Government of India defined reservoirsas man-made impoundments created by obstructingthe surface flow, by erecting a dam of any descrip-tion on a river, stream or any water course (Sugunan1997a). However, water bodies less than 10 ha inarea have been excluded from this definition. TheMinistry of Agriculture, Government of India classi-fies reservoirs as small (<1000 ha), medium (1000–5000 ha) and large (>5000 ha) for purposes offishery management. Medium and large reservoirsare fewer in number and details of them are readilyavailable from the irrigation, power and public worksauthorities. However, enumeration of small reser-voirs is a tedious task as they are ubiquitous andnumerous. There also exist ambiguities in thenomenclature followed by some of the states.
The word tank is often loosely defined and used incommon parlance to describe small irrigation reser-voirs. After removing these anomalies in nomen-clature, it has been estimated that India has 19 134small reservoirs with a total water surface area of1 485 557 ha (Table 1). Similarly, 180 medium and56 large reservoirs of the country have an area of527 541 and 1 140 268 ha respectively. Thus the
country has 19 370 reservoirs covering 3 153 366 ha(Sugunan 1995).
Limnological Profile
Indian reservoirs are situated, mostly, in a tropicalregime with rich nutrient status conducive to goodorganic productivity. The peninsular reservoirs arecharacterised by a narrow range of fluctuations inwater and air temperatures during different seasons,a phenomenon which prevents the formation ofthermal stratification. Many reservoirs in the UpperPeninsula undergo transient phases of thermal strati-fication during the summer, but wind-induced turbu-lence churns the reservoirs, facilitating theavailability of nutrients at the trophogenic zone.Plankton, benthos and periphyton pulses of Indianreservoirs coincide with the months of least waterlevel fluctuation and all these communities are attheir ebb during the months of maximum water levelfluctuation and water discharge.
Oligotrophic tendencies shown by some of thereservoirs in the Western Ghats and the northeast aremainly due to poor nutrient status and other chemicaldeficiencies. Mainly, poor water quality is the directresult of the catchment soil. In most cases, despitelow levels of phosphate and nitrate, the productionprocesses are not hampered.
This phenomenon is attributed to turnover ofnutrients and their quick recycling. The highlyseasonal rainfall and heavy discharge of water duringthe monsoon results in high flushing rates in the
* not exhaustive
Table 1. Distribution of small reservoirs and irrigation tanks in India.
State Small reservoirs Irrigation tanks Total
No. Area (ha) No. Area (ha) No. Area (ha)
Tamil Nadu 58 15 663 8 837 300 278 8 895 315 941Karnataka 46 15 253 4 605 213 404 4 651 228 657Andhra Pradesh 98 24 178 2 800 177 749 2 898 201 927Gujarat 115 40 099 561 44 025 676 84 124Uttar Pradesh 40 20 845 — 197 806 40 218 651Madhya Pradesh *6 172 575 — — *6 172 575Maharashtra — — — — — 119 515Bihar 112 12 461 — — 112 12 461Orissa 1 433 66 047 — — 1 433 66 047Kerala 21 7 975 — — 21 7 975Rajasthan 389 54 231 — — 389 54 231Himachal Pradesh 1 200 — — 1 200West Bengal 4 732 — — 4 732Haryana 4 282 — — 4 282Northeast 4 1 639 — 600 4 2 239Total 2 331 551 695 16 803 933 862 19 134 1 485 557
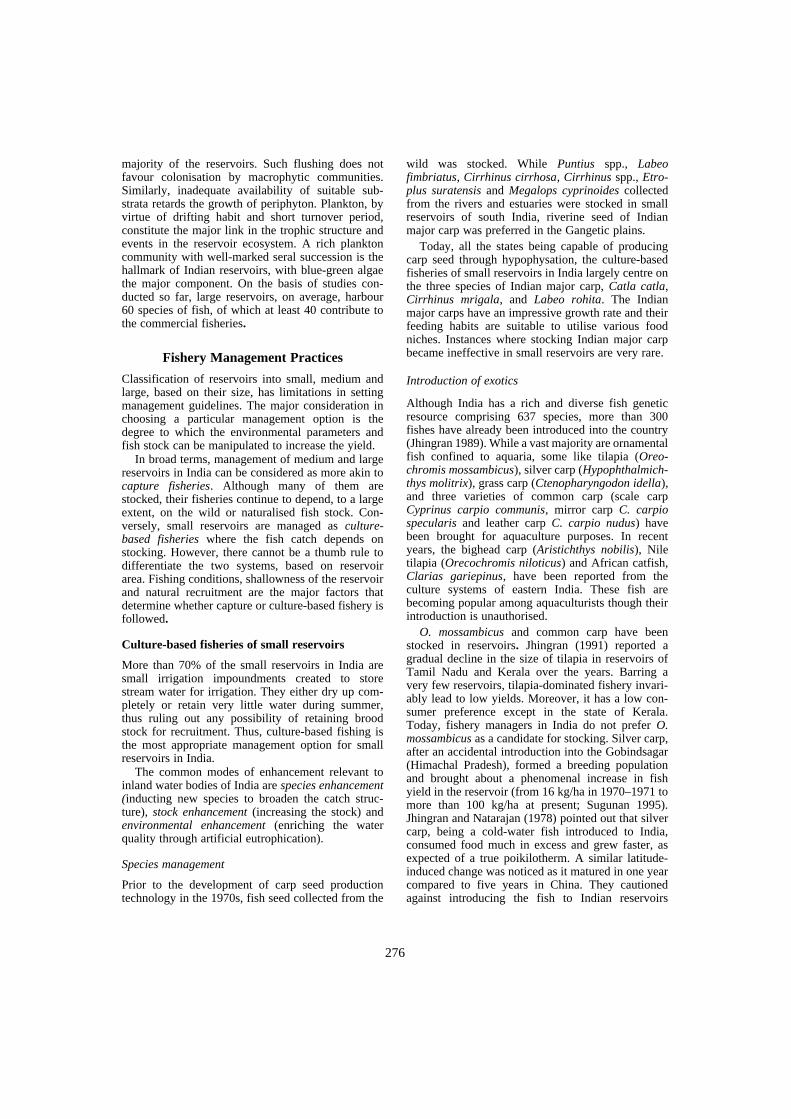
276
majority of the reservoirs. Such flushing does notfavour colonisation by macrophytic communities.Similarly, inadequate availability of suitable sub-strata retards the growth of periphyton. Plankton, byvirtue of drifting habit and short turnover period,constitute the major link in the trophic structure andevents in the reservoir ecosystem. A rich planktoncommunity with well-marked seral succession is thehallmark of Indian reservoirs, with blue-green algaethe major component. On the basis of studies con-ducted so far, large reservoirs, on average, harbour60 species of fish, of which at least 40 contribute tothe commercial fisheries.
Fishery Management Practices
Classification of reservoirs into small, medium andlarge, based on their size, has limitations in settingmanagement guidelines. The major consideration inchoosing a particular management option is thedegree to which the environmental parameters andfish stock can be manipulated to increase the yield.
In broad terms, management of medium and largereservoirs in India can be considered as more akin tocapture fisheries. Although many of them arestocked, their fisheries continue to depend, to a largeextent, on the wild or naturalised fish stock. Con-versely, small reservoirs are managed as culture-based fisheries where the fish catch depends onstocking. However, there cannot be a thumb rule todifferentiate the two systems, based on reservoirarea. Fishing conditions, shallowness of the reservoirand natural recruitment are the major factors thatdetermine whether capture or culture-based fishery isfollowed.
Culture-based fisheries of small reservoirs
More than 70% of the small reservoirs in India aresmall irrigation impoundments created to storestream water for irrigation. They either dry up com-pletely or retain very little water during summer,thus ruling out any possibility of retaining broodstock for recruitment. Thus, culture-based fishing isthe most appropriate management option for smallreservoirs in India.
The common modes of enhancement relevant toinland water bodies of India are species enhancement(inducting new species to broaden the catch struc-ture), stock enhancement (increasing the stock) andenvironmental enhancement (enriching the waterquality through artificial eutrophication).
Species management
Prior to the development of carp seed productiontechnology in the 1970s, fish seed collected from the
wild was stocked. While Puntius spp., Labeofimbriatus, Cirrhinus cirrhosa, Cirrhinus spp., Etro-plus suratensis and Megalops cyprinoides collectedfrom the rivers and estuaries were stocked in smallreservoirs of south India, riverine seed of Indianmajor carp was preferred in the Gangetic plains.
Today, all the states being capable of producingcarp seed through hypophysation, the culture-basedfisheries of small reservoirs in India largely centre onthe three species of Indian major carp, Catla catla,Cirrhinus mrigala, and Labeo rohita. The Indianmajor carps have an impressive growth rate and theirfeeding habits are suitable to utilise various foodniches. Instances where stocking Indian major carpbecame ineffective in small reservoirs are very rare.
Introduction of exotics
Although India has a rich and diverse fish geneticresource comprising 637 species, more than 300fishes have already been introduced into the country(Jhingran 1989). While a vast majority are ornamentalfish confined to aquaria, some like tilapia (Oreo-chromis mossambicus), silver carp (Hypophthalmich-thys molitrix), grass carp (Ctenopharyngodon idella),and three varieties of common carp (scale carpCyprinus carpio communis, mirror carp C. carpiospecularis and leather carp C. carpio nudus) havebeen brought for aquaculture purposes. In recentyears, the bighead carp (Aristichthys nobilis), Niletilapia (Orecochromis niloticus) and African catfish,Clarias gariepinus, have been reported from theculture systems of eastern India. These fish arebecoming popular among aquaculturists though theirintroduction is unauthorised.
O. mossambicus and common carp have beenstocked in reservoirs. Jhingran (1991) reported agradual decline in the size of tilapia in reservoirs ofTamil Nadu and Kerala over the years. Barring avery few reservoirs, tilapia-dominated fishery invari-ably lead to low yields. Moreover, it has a low con-sumer preference except in the state of Kerala.Today, fishery managers in India do not prefer O.mossambicus as a candidate for stocking. Silver carp,after an accidental introduction into the Gobindsagar(Himachal Pradesh), formed a breeding populationand brought about a phenomenal increase in fishyield in the reservoir (from 16 kg/ha in 1970–1971 tomore than 100 kg/ha at present; Sugunan 1995).Jhingran and Natarajan (1978) pointed out that silvercarp, being a cold-water fish introduced to India,consumed food much in excess and grew faster, asexpected of a true poikilotherm. A similar latitude-induced change was noticed as it matured in one yearcompared to five years in China. They cautionedagainst introducing the fish to Indian reservoirs
277
connected to major river systems as it mightadversely affect catla and other indigenous carp.
Like tilapia, common carp found its way to alltypes of water bodies in the country. The relativeease with which the fish could be bred in controlledconditions prompted the state fish farms throughoutthe country to produce them in large numbers and tostock reservoirs. Being a sluggish fish, its chances ofsurvival in predator-dominated reservoirs are verypoor. It is not frequently caught in a passive fishinggear like gill-net due to its slow movement andbottom-dwelling habit. A more important disqualifi-cation of common carp is its propensity to competewith some indigenous carp like Cirrhinus mrigala,C. cirrhosa and C. reba, with which it shares a foodniche. Mirror carp has affected the survival of nativefish species in Gobindsagar Reservoir, upland lakesof Kashmir and Kumaon Himalayas (Schizothoraxspp.), and Loktak Lake in the northeast (Osteobramabelangiri).
Indian policy disallows the introduction of exoticspecies in reservoirs. However, presence of tilapia,common carp, in reservoirs is a fait accompli.Common carp is very popular in reservoirs of thenortheast where it enjoys a favourable microclimateand a good market. The three exotic species broughtin clandestinely by the fish farmers, bighead carp, O.niloticus and African catfish, have not gained entryto the reservoir ecosystems so far, and they remainrestricted to the culture systems.
Stock enhancement
Augmenting the stock of fish has been the most crucialmanagement input to the reservoir fisheries. This isprimarily due to the fact that the original fish stock ofthe parent stream is insufficient to support a fishery.Augmentation of stock is also necessary to preventunwanted fish from utilising the available food nichesand flourishing at the cost of economically importantspecies. The major food niches of the Indian reservoirsare phytoplankton (Cyanophyceae, Chlorophyceae,Dinophyceae and Bacillariophyceae), zooplankton(copepods, cladocerans, rotifers and protozoans), andbenthos (insect larvae and nymphs, oligochaetes,nematodes and molluscs). Significantly, many of theabove niches, with the exception of insects, Cyano-phyceae and molluscs, are shared between Indianmajor carp and uneconomic species.
Stocking rate
A large country like India, with too many water bodiesto stock, has inadequate state machinery to meet thestocking requirements of all its reservoirs. Stockingdensities need to be specified for individual waterbodies or a group sharing common characteristics
such as size, presence of natural fish populations,predation pressure, fishing effort, minimum market-able size, amenability to fertilisation and multiplewater uses.
The main considerations in determining thestocking rate are growth rate of individual speciesstocked, the mortality rate, size at stocking and thegrowing time. Recently, based on the National Con-sultation on Reservoir Fisheries (Sugunan 1997), theGovernment of India adapted the following formula(Welcomme 1976) to calculate the stocking rate forsmall reservoirs:
S Number of fish to be stocked (no./ha);P Natural annual potential yield of the water body
(kg);q The proportion of the yield that can come from
the species in question;W Mean weight at capture (g);tc Age at capture;to Age at stocking;−z Total mortality rate.
Environmental enhancement
By improving the nutrient status through the selectiveinput of fertilisers in small reservoirs, stocks can bemaintained at levels higher than the natural carryingcapacity of the ecosystem. However, careful con-sideration of the possible impact on the environmentis needed before this option is used. Scientific knowl-edge to guide the safe application of this type ofenhancement and the methods to reverse the environ-mental degradation, if any, are still inadequate.Sreenivasan and Pillai (1979), Sreenivasan (1971),Sugunan and Yadava (1991a, b) have attempted thismethod with encouraging results. Environmentalconsiderations and the possible conflicts of interestamong various water users are the main factors thatprevent the wide use of this option.
Fish Production Trends
In spite of a conducive physico-chemical regime, agood standing crop of plankton and a high rate ofprimary productivity, the fish yield from the reser-voirs on a national level is very poor. It varies from3.9 kg/ha in Bihar to 188 kg/ha in Andhra Pradesh.The average national yield from small reservoirs inIndia is nearly 50 kg/ha (Table 2), which is low(Sugunan 1997b), compared to other countries in Asiaand Latin America such as Sri Lanka (300 kg/ha) andCuba (100 kg/ha).
Sq.PW------- e z tc to–( )–=
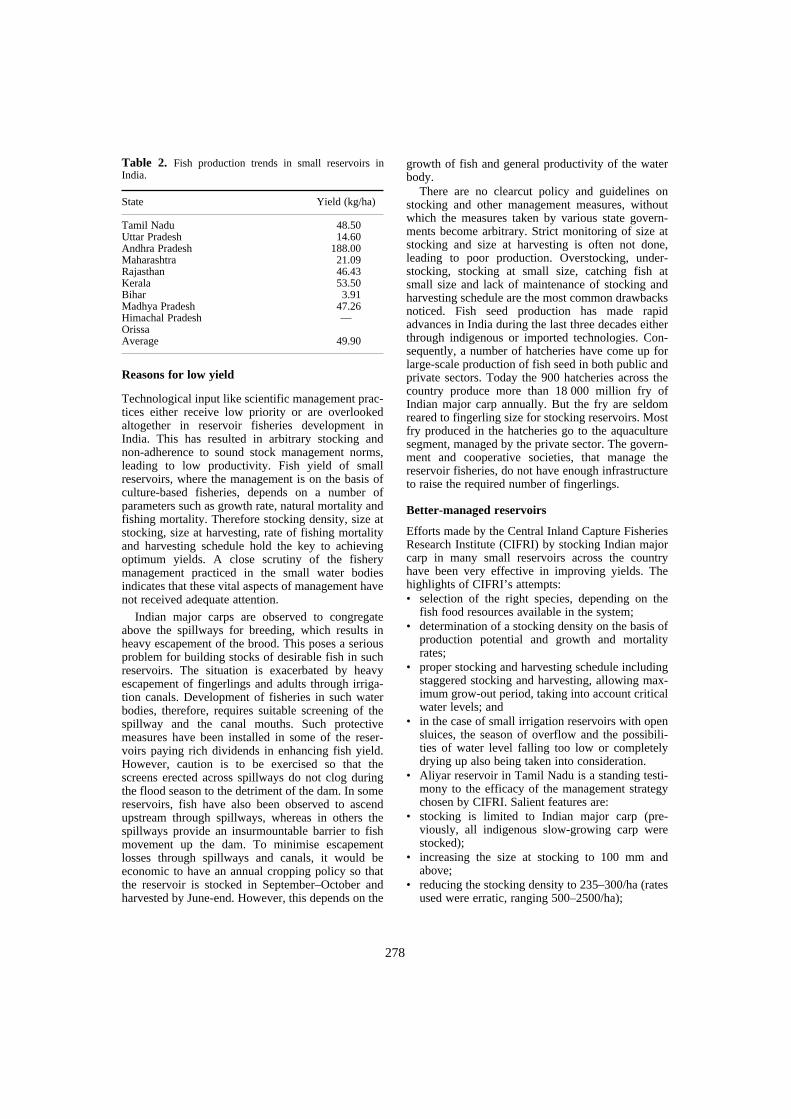
278
Reasons for low yield
Technological input like scientific management prac-tices either receive low priority or are overlookedaltogether in reservoir fisheries development inIndia. This has resulted in arbitrary stocking andnon-adherence to sound stock management norms,leading to low productivity. Fish yield of smallreservoirs, where the management is on the basis ofculture-based fisheries, depends on a number ofparameters such as growth rate, natural mortality andfishing mortality. Therefore stocking density, size atstocking, size at harvesting, rate of fishing mortalityand harvesting schedule hold the key to achievingoptimum yields. A close scrutiny of the fisherymanagement practiced in the small water bodiesindicates that these vital aspects of management havenot received adequate attention.
Indian major carps are observed to congregateabove the spillways for breeding, which results inheavy escapement of the brood. This poses a seriousproblem for building stocks of desirable fish in suchreservoirs. The situation is exacerbated by heavyescapement of fingerlings and adults through irriga-tion canals. Development of fisheries in such waterbodies, therefore, requires suitable screening of thespillway and the canal mouths. Such protectivemeasures have been installed in some of the reser-voirs paying rich dividends in enhancing fish yield.However, caution is to be exercised so that thescreens erected across spillways do not clog duringthe flood season to the detriment of the dam. In somereservoirs, fish have also been observed to ascendupstream through spillways, whereas in others thespillways provide an insurmountable barrier to fishmovement up the dam. To minimise escapementlosses through spillways and canals, it would beeconomic to have an annual cropping policy so thatthe reservoir is stocked in September–October andharvested by June-end. However, this depends on the
growth of fish and general productivity of the waterbody.
There are no clearcut policy and guidelines onstocking and other management measures, withoutwhich the measures taken by various state govern-ments become arbitrary. Strict monitoring of size atstocking and size at harvesting is often not done,leading to poor production. Overstocking, under-stocking, stocking at small size, catching fish atsmall size and lack of maintenance of stocking andharvesting schedule are the most common drawbacksnoticed. Fish seed production has made rapidadvances in India during the last three decades eitherthrough indigenous or imported technologies. Con-sequently, a number of hatcheries have come up forlarge-scale production of fish seed in both public andprivate sectors. Today the 900 hatcheries across thecountry produce more than 18 000 million fry ofIndian major carp annually. But the fry are seldomreared to fingerling size for stocking reservoirs. Mostfry produced in the hatcheries go to the aquaculturesegment, managed by the private sector. The govern-ment and cooperative societies, that manage thereservoir fisheries, do not have enough infrastructureto raise the required number of fingerlings.
Better-managed reservoirs
Efforts made by the Central Inland Capture FisheriesResearch Institute (CIFRI) by stocking Indian majorcarp in many small reservoirs across the countryhave been very effective in improving yields. Thehighlights of CIFRI’s attempts:• selection of the right species, depending on the
fish food resources available in the system;• determination of a stocking density on the basis of
production potential and growth and mortalityrates;
• proper stocking and harvesting schedule includingstaggered stocking and harvesting, allowing max-imum grow-out period, taking into account criticalwater levels; and
• in the case of small irrigation reservoirs with opensluices, the season of overflow and the possibili-ties of water level falling too low or completelydrying up also being taken into consideration.
• Aliyar reservoir in Tamil Nadu is a standing testi-mony to the efficacy of the management strategychosen by CIFRI. Salient features are:
• stocking is limited to Indian major carp (pre-viously, all indigenous slow-growing carp werestocked);
• increasing the size at stocking to 100 mm andabove;
• reducing the stocking density to 235–300/ha (ratesused were erratic, ranging 500–2500/ha);
Table 2. Fish production trends in small reservoirs inIndia.
State Yield (kg/ha)
Tamil Nadu 48.50Uttar Pradesh 14.60Andhra Pradesh 188.00Maharashtra 21.09Rajasthan 46.43Kerala 53.50Bihar 3.91Madhya Pradesh 47.26Himachal Pradesh —OrissaAverage 49.90
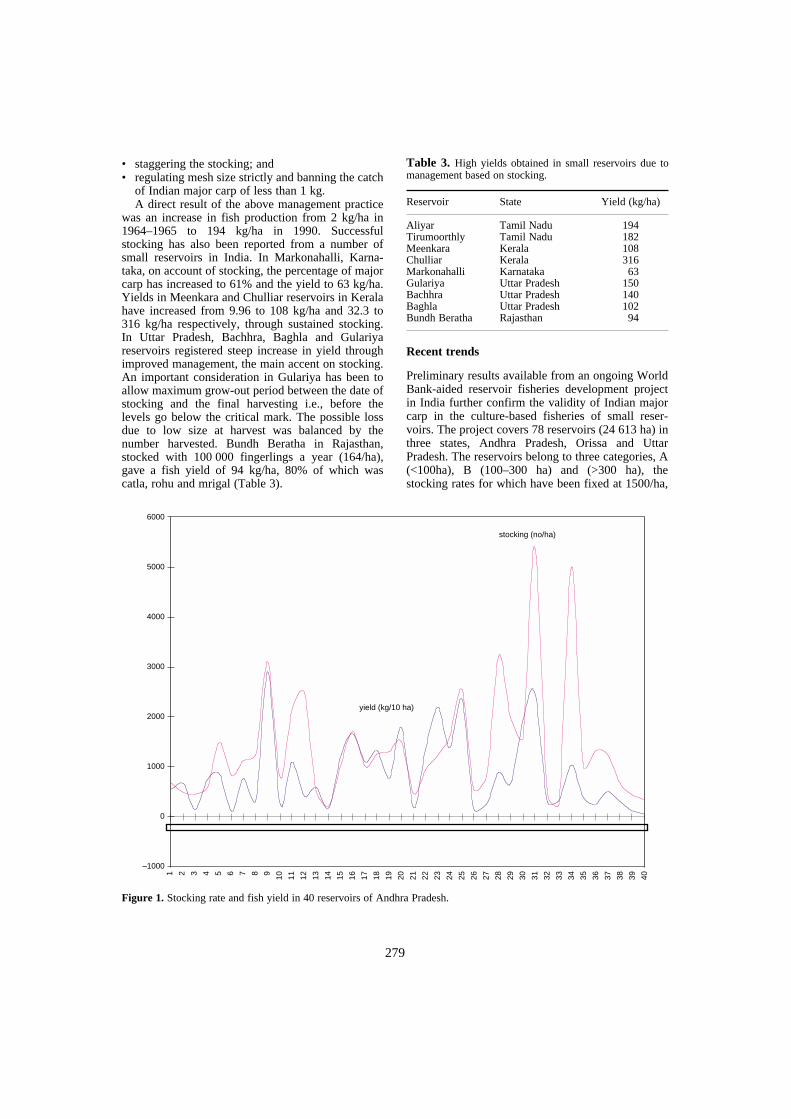
279
• staggering the stocking; and• regulating mesh size strictly and banning the catch
of Indian major carp of less than 1 kg.A direct result of the above management practice
was an increase in fish production from 2 kg/ha in1964–1965 to 194 kg/ha in 1990. Successfulstocking has also been reported from a number ofsmall reservoirs in India. In Markonahalli, Karna-taka, on account of stocking, the percentage of majorcarp has increased to 61% and the yield to 63 kg/ha.Yields in Meenkara and Chulliar reservoirs in Keralahave increased from 9.96 to 108 kg/ha and 32.3 to316 kg/ha respectively, through sustained stocking.In Uttar Pradesh, Bachhra, Baghla and Gulariyareservoirs registered steep increase in yield throughimproved management, the main accent on stocking.An important consideration in Gulariya has been toallow maximum grow-out period between the date ofstocking and the final harvesting i.e., before thelevels go below the critical mark. The possible lossdue to low size at harvest was balanced by thenumber harvested. Bundh Beratha in Rajasthan,stocked with 100 000 fingerlings a year (164/ha),gave a fish yield of 94 kg/ha, 80% of which wascatla, rohu and mrigal (Table 3).
Recent trends
Preliminary results available from an ongoing WorldBank-aided reservoir fisheries development projectin India further confirm the validity of Indian majorcarp in the culture-based fisheries of small reser-voirs. The project covers 78 reservoirs (24 613 ha) inthree states, Andhra Pradesh, Orissa and UttarPradesh. The reservoirs belong to three categories, A(<100ha), B (100–300 ha) and (>300 ha), thestocking rates for which have been fixed at 1500/ha,
Table 3. High yields obtained in small reservoirs due tomanagement based on stocking.
Reservoir State Yield (kg/ha)
Aliyar Tamil Nadu 194Tirumoorthly Tamil Nadu 182Meenkara Kerala 108Chulliar Kerala 316Markonahalli Karnataka 63Gulariya Uttar Pradesh 150Bachhra Uttar Pradesh 140Baghla Uttar Pradesh 102Bundh Beratha Rajasthan 94
Figure 1. Stocking rate and fish yield in 40 reservoirs of Andhra Pradesh.
6000
5000
4000
3000
2000
1000
0
–1000
stocking (no/ha)
yield (kg/10 ha)
1 2 3 4 5 6 7 8 9 10 11 12 13 14 15 16 17 18 19 20 21 22 23 24 25 26 27 28 29 30 31 32 33 34 35 36 37 38 39 40

280
1000/ha and 500/ha, respectively. The scheme pro-vides for erecting pen nurseries in the reservoirs toensure that the fish seed is reared to at least 100 mmbefore stocking. Loans are provided to the coopera-tive societies to purchase boats and nets. Resultsobtained so far have been very encouraging and aperceptible relation between stocking and yield canbe observed (Figures 1–2).
References
Jhingran, A.G. 1989. Role of exotic fishes in capturefishery waters in India. In: Jhingran, A. G. and SugunanV.V. eds. Conservation and Management of Inland Fish-eries Resources of India, Inland Fisheries Society ofIndia, Barrackpore, 275 p.
——1991. Performance of tilapia in Indian waters and itspossible impact on the native ichthyofauna. In: FAOFisheries Report No. 458. Food and Agriculture Organ-isation, Rome, 143–161.
Jhingarn, V.G. and Natarajan, A.V. 1978. Recommenda-tions for stocking silver carp in Gobindsagar (H.P.) andNagarjunasgar (A.P.) together with an account of scopeand limitations of silver carp stocking in rivers andreservoirs of India. Bulletin No. 28. Central InlandFisheries Research Institute, Barrackpore, 743101 WestBengal, 8 p.
Rama, 1978. Our Water Resources. National Book Trust,India, New Delhi, 115 .
Sreenivasan, A. 1971. Liming of an upland lake. Madras J.Fish., 6: 9-13.
Sreenivasan, A. and Pillai, K.V. 1979. Fertilisation offishery waters—experimental fertilisation of a smallreservoir. Madras J. Fish., 8: 143–145.
Sugunan, V.V. 1995. Reservoir Fisheries in India. FAOFisheries Technical Paper No. 345. Food and AgricultureOrganisation of the United Nations, Rome, 423 p.
——1997a. Guidelines for management of small reservoirsin India. Fishing Chimes, 17: 23–27
——1997b. Fisheries Management of Small Water Bodiesin Seven Countries in Africa, Asia and Latin America.FAO Technical Circular No. 933 Food and AgricultureOrganisation of the United Nations, Rome, 149 p.
Sugunan, V.V. and Yadava, Y.S. 1991a. Feasibility Studiesfor Fisheries Development of Kyrdemkulai Reservoir.Central Inland Capture Fisheries Research Institute,Barrackpore, 743101 West Bengal, 34 p.
——1991b. Feasibility Studies for Fisheries Developmentof Nongmahir Reservoir. Central Inland CaptureFisheries Research Institute, Barrackpore, 743101 WestBengal, 30 p.
Welcomme, R.L. 1976. Approaches to Resource Evaluationand Management in Tropical Inland Waters. Proceedingsof the Indo-Pacific Fisheries Council, Food and Agri-culture Organisation of the United Nations. ColomboOctober 1976, 500 p.
Figure 2. A scatter polot showing the relationship between stocking (no./ha) and fish yield (kg/10 ha) for 40 reservoirs inAndhra Pradesh.
3500
3000
2500
2000
1500
1000
500
00 1000 2000 3000 4000 5000 6000
Stocking rate (no/ha)
Yie
ld (
kg/1
0 ha
)
281
Livestock–Fish Integrated Systems and Their Application
Shenggui Wu1, Chuanlin Hu1 and Youchun Chen2
Abstract
Livestock–fish integrated systems are old practices, which interestingly are becoming popular.The common integration may be pig–fish, duck–fish, cattle–fish, livestock–poultry–fish, grass–livestock–fish and so on. The commonest and most efficient integrated system is the crop–livestock–fish integration. Some important factors, including dissolved oxygen content, depth of water, typesof livestock manure used and level of input in integrated systems, all influence the nature of theoperation. The introduction of crops to integrated systems has resulted in many positive outcomesfrom a human nutrition viewpoint. Studies of nutrient and energy cycles along the food web ofintegrated systems have also made the crop–livestock–fish integrated system the most understood,scientifically. Economic recycling of all kinds of nutrient matter has reduced fuel consumption andoperational costs, resulting in an overall increase in economic efficiency. Under the integratedsystem, crops–livestock and fish production have increased faster than the rate of populationincrease. Fish output in integrated systems is about twice to 12 times that in a monoculture.
IN CHINA, the requirement of meat, eggs and fish(cultured fish) is 316.6 million t. Every person needs274 kg of cereal a year and 1200 million people need328.8 million t, for a total of 645.4 million t. Thetotal cereal production is about 551.93 million t/year.That means there is a shortfall of 93.47 million t(Chen 1996). The livestock–fish combination may beone of the solutions to meeting this shortfall.
The reason for intensifying the fish-livestock inte-grated systems is the requirement to produce high-quality animal protein to replace plant protein. Someresources without nutritional value for human beingsand animals could be turned into food in the fish–livestock integrated system, and consequently useless feed and produce more high-quality animalprotein (Pekar and Olah 1992).
In China, the earliest record of an integrated live-stock–fish system was in the Agriculture Encyclo-pedia, published in 1639, in the Ming Dynasty by XuGuang-qi (1562–1633). In the early 1920s of the
Qing Dynasty, in the book Additions to Agriculture,a four-element culture was mentioned, namelyplanting–mulberry–fish–livestock.
Realising the potential of low-input of livestock–fish integration in boosting animal food production,international agencies, especially the FAO, helped tointroduce the system to developing countries sincethe 1950s. The livestock–fish integration system hasbeen a very fast development until now (Csavas1992; Devendra 1996).
Models for Livestock–fish Integration
If certain species of domestic animals are chosen, thecombinations of the integration may be pig–fish,duck–fish, cattle–fish, chicken–fish and so on. Eachtype of combination produces manure of a differentcharacter, which supplies nutrients suitable for dif-ferent fish species. If the species of domestic animalsare defined, the fish varieties can be matched.
Pig–fish integration
Pork is one of the most important animal proteinresources in China. Pig–fish integration is quitepopular and traditional. Pig slurry has a high contentof nitrogen, with a N:C ratio 14.3:1, which is less thanthat for other animals. Manure input may increase
1Institute of Reservoir Fisheries, the Chinese Ministry ofWater Resources and the Chinese Academy of Sciences,Wuhan, 430079, China2Institute of Animal Science, the Chinese Academy ofAgriculture Sciences, Beijing 100094, China
282
phytoplankton and zooplankton to 20.61 mg/L and7.73 mg/L, respectively, at a loading of 12 kg/m3 ofwater. The pig–fish integration is 35.1% more bene-ficial than a single fish culture and the cost of raisingpigs decreases by 11.7% per kg of growth.
Duck–fish integration
This is one of the classical and traditional systems inAsia (Yadava and Vaishalli 1992). Ducks areanimals with relatively short digestive tracts. Theirdigestive tracts are only about four times the bodylength, so a large amount of feed (34%) is excretedbefore being properly digested, resulting in highermanure content of organic matter.
Duck manure can help reduce 20–25% of inputsinto a culture system comprising phyto- and zoo-plankton feeders of fish feed. The decay and decom-position of duck waste in pond waters lead to releaseof essential nutrients, enhancing the primary andsecondary productivity of water bodies, ultimatelyboosting fish production, which can save about 50%of supplementary feeds for fish (Mukherjee et al.1992).
A duck can drain 70 kg of faeces, or 5–10 kg indry faeces in a year. It is concluded that eachfattened duck is capable of producing 0.5–0.75 kg offish. About 3–6 batches of ducks can be produced,depending on different climate zones. Taking fourbatches a year, fish production will be 260–390 kgand without any feed inputs, the daily fish produc-tion with only duck wastes could be 36.5 kg/ha.
The duck number must be in accordance with thefish number. From generalised experiments andpractices, each hectare is matched to 1200–1500ducks. In ponds, duck–fish integration systems fishmust be polycultured to increase the feed utility andwater holding capacity.
The survival rate of carp is related to the densityof duck waste. The ‘safe’ level mentioned above is inthe range of waste concentrations, possibly due tothe existence of favourable hydrological conditionslike water dissolved oxygen, pH and hardness. Underdifferent densities of wastes in different times oftesting, survival rates differ. Obvious mortality canbe observed when the density of duck wastes is0.02%, but becomes serious when it is 0.035%.
Ducks dive to devour fish, but only fingerlingsunder 4 g are ingested. Therefore, seed-fish pondsare unsuitable for integration with duck.
Cattle (horse)–fish integration
Cattle–fish integration has been practiced for a longtime. Fish are integrated not only with cattle but alsowith horses and mules. Dairy cattle–fish is a newintegration. The nutrients in cow dung are lesser than
in pig manure. The nitrogen contents are a littlehigher, but phosphorus comes in trace amounts only.‘One milking cow and half ton fish’ is a commonproverb among farmers.
Cow manure is fine, granular, floats for a longtime, and is 33% heavier than pig slurry in dryweight. The total floating materials in the cow dungpond is 54.6% more than in pig, duck and chickenmanure ponds. The floating character of cow dunggranules increases feeding opportunities for fish andrestricts accumulation of the oxygen-consumingmaterials. Consequently, less harmful gas is formed.Because feed in ruminants is digested by micro-organisms, their degradation needs less oxygen incomparison to other manure resources. Each kg ofbull manure exhausted 20.6 g of oxygen in 5 days,while the pig slurry needs 30.0 g, which is 32%more. Therefore, cow dung is called ‘safe’ manure inlivestock–fish integration.
A milking cow of 400–500 kg can produce about13 600 kg of cow dung and 9000 kg of urine a year.Practices demonstrate that 0.17 kg of cow dung perm3 of water a week may produce one kg of fish.
Besides this, the wasted feeds from dairy barns arealso rich — 9000–11 000 kg of grasses are suppliedfor a cow a year and 3000 kg are wasted. Thisamount is always spattered away during the summertime, when it is a good season for fish growth. In thecattle–fish integration with an output of 7500 kg ayear, the manure of 15 head of cattle can contributefeed to meet the requirements of fish in a 1 ha pond.
Chicken–fish integration
In this system, 0.07 kg of chicken faeces is suppliedper m3 of water, 5 kg of chicken faeces able to pro-duce 1 kg filter-feeding fish. If the chicken faeces arefermented, the results can be better.
Other kinds of integration
Besides the above-mentioned integrated systems,sheep, goats and geese are all good for the purposes.A goose can supply l20–150 kg of faeces a year, and25–30 kg of goose faeces can produce 1 kg of filter-feeding fish. In the Yangtze River area, geese areused for this purpose. In integration with fish, 750–900 geese are released in one ha. Goat/sheep–fishintegration is found more in Northern China. Multi-livestock–fish is also common (Chen 1996).
Models for livestock–fish integration
Main models for livestock–fish integration areshown in Table 1.

283
Important Elements in Livestock–Fish Integration
Three important elements in livestock–fish integra-tion are dissolved oxygen concentration, the depth ofpond water and manure (Xu and Zhu 1992).
Dissolved oxygen
The dissolved oxygen concentration is different indifferent water levels (Figure 1), and so is the distri-bution of phytoplankton.
Dissolved oxygen concentrations lower than1 mg/L are not suitable for fish growth. When thewater level is 0.3 m, the oxygen content is normallyhigher than 2.6 mg/L; at 2 m deep, it is higher thanl.8 mg/L. Therefore, a pond 2.5 m deep is suitablefor fish growth with sufficient oxygen. Phyto-plankton development is related to strength of sun-light. The amount of phytoplankton is different atdifferent depths. The deeper the water, the fewerphytoplankton were accounted (Table 2). Related tothis, zooplankton numbers consequently change.
Fish such as silver carp and bighead carp feed onphytoplankton and zooplankton, respectively, and inless than 4 m grow better than in deeper water.
Depths of pond water
Choosing an appropriate water depth may increasefish production. Product performance for fish likeblack carp, grass carp, common carp and silver carpis closely related to water depth in ponds (Table 3).
It is suggested that 2.5 to 3 m deep is the bestlayer for carp habitation. Within this depth, a highlydissolved oxygen content and higher planktonnumber supply enough feed for aquatic animals.Therefore, it is beneficial for fish of any kind offeeding habit.
Manure
Livestock–fish integration in nature is the way toutilise animal excrement and waste for feeding fish.The nutrient contents of manures are shown inTable 4.
Figure 1. Oxygen concentrations at different strata of water in September (mg/L).
Table 1. Main models for livestock–fish integration.
Variants Livestock (head) Manure (kg) Fish Output (kg/ha)
Duck–fish Usual 900–1500,intensified 1500–1800
40–50 Silver carp, bighead carp 4500–7500
Pig–fish 75 200 Silver carp, bighead carp 3000Dairy cattle–fish 15 Faeces 13 600
Urine 9000Wasted feeds 3000
Grass carp, bream 7500
Chicken–fish 2250–3000 70 Tilapia 4000–7500Grass–livestock–fish Duck 900/pig 60/
Dairy cattle 12Grassland 1/3–1/2 ha
Grass carp, breamsilver carp, bighead carp
7500
7
DO(mg/L)
2
1
0
0.3 1 2 3 4 5 6
Water depth (m)
9
17
1
13
21
5
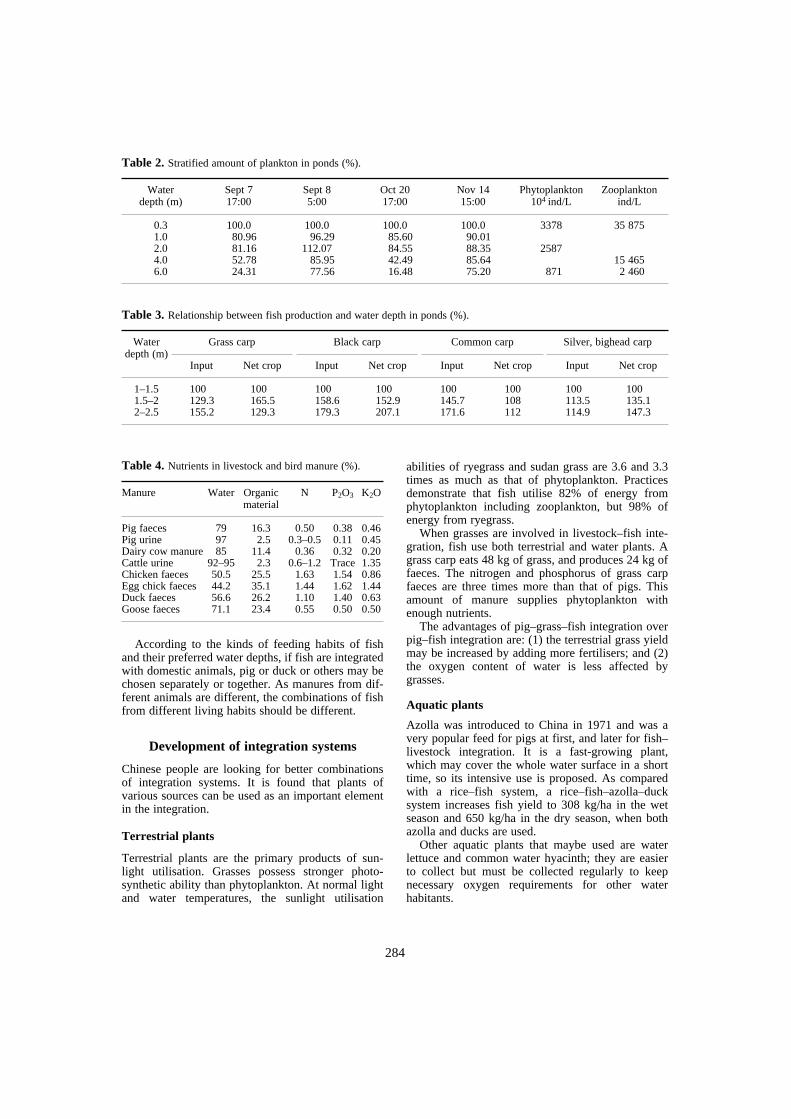
284
According to the kinds of feeding habits of fishand their preferred water depths, if fish are integratedwith domestic animals, pig or duck or others may bechosen separately or together. As manures from dif-ferent animals are different, the combinations of fishfrom different living habits should be different.
Development of integration systems
Chinese people are looking for better combinationsof integration systems. It is found that plants ofvarious sources can be used as an important elementin the integration.
Terrestrial plants
Terrestrial plants are the primary products of sun-light utilisation. Grasses possess stronger photo-synthetic ability than phytoplankton. At normal lightand water temperatures, the sunlight utilisation
abilities of ryegrass and sudan grass are 3.6 and 3.3times as much as that of phytoplankton. Practicesdemonstrate that fish utilise 82% of energy fromphytoplankton including zooplankton, but 98% ofenergy from ryegrass.
When grasses are involved in livestock–fish inte-gration, fish use both terrestrial and water plants. Agrass carp eats 48 kg of grass, and produces 24 kg offaeces. The nitrogen and phosphorus of grass carpfaeces are three times more than that of pigs. Thisamount of manure supplies phytoplankton withenough nutrients.
The advantages of pig–grass–fish integration overpig–fish integration are: (1) the terrestrial grass yieldmay be increased by adding more fertilisers; and (2)the oxygen content of water is less affected bygrasses.
Aquatic plants
Azolla was introduced to China in 1971 and was avery popular feed for pigs at first, and later for fish–livestock integration. It is a fast-growing plant,which may cover the whole water surface in a shorttime, so its intensive use is proposed. As comparedwith a rice–fish system, a rice–fish–azolla–ducksystem increases fish yield to 308 kg/ha in the wetseason and 650 kg/ha in the dry season, when bothazolla and ducks are used.
Other aquatic plants that maybe used are waterlettuce and common water hyacinth; they are easierto collect but must be collected regularly to keepnecessary oxygen requirements for other waterhabitants.
Table 4. Nutrients in livestock and bird manure (%).
Manure Water Organic material
N P2O3 K2O
Pig faeces 79 16.3 0.50 0.38 0.46Pig urine 97 2.5 0.3–0.5 0.11 0.45Dairy cow manure 85 11.4 0.36 0.32 0.20Cattle urine 92–95 2.3 0.6–1.2 Trace 1.35Chicken faeces 50.5 25.5 1.63 1.54 0.86Egg chick faeces 44.2 35.1 1.44 1.62 1.44Duck faeces 56.6 26.2 1.10 1.40 0.63Goose faeces 71.1 23.4 0.55 0.50 0.50
Table 2. Stratified amount of plankton in ponds (%).
Waterdepth (m)
Sept 717:00
Sept 85:00
Oct 2017:00
Nov 1415:00
Phytoplankton104 ind/L
Zooplanktonind/L
0.3 100.0 100.0 100.0 100.0 3378 35 8751.0 80.96 96.29 85.60 90.012.0 81.16 112.07 84.55 88.35 25874.0 52.78 85.95 42.49 85.64 15 4656.0 24.31 77.56 16.48 75.20 871 2 460
Table 3. Relationship between fish production and water depth in ponds (%).
Water depth (m)
Grass carp Black carp Common carp Silver, bighead carp
Input Net crop Input Net crop Input Net crop Input Net crop
1–1.5 100 100 100 100 100 100 100 1001.5–2 129.3 165.5 158.6 152.9 145.7 108 113.5 135.12–2.5 155.2 129.3 179.3 207.1 171.6 112 114.9 147.3

285
Methane products
Methane gas generation has been popularised inChina for decades and the livestock manure andstems of crops are normally used for this purpose.Farmers often used liquid and sediment methane pro-duction as fertilisers for arable lands and also forfishponds. Practices demonstrate that the fish outputreaches 6772 kg/ha from 965 kg of fish fingerlingsdue to the input of methane production to ponds.
Reasons for higher production include: (1) higheramount of chlorophyll or higher phytoplanktonquantity; (2) higher dissolved oxygen; and (3) betterfood conversion efficiency in methane-fertilisedponds than in manure ponds (Table 5).
New symbiotic species
Fish species used in pond culture in China have beenlimited mainly to the Chinese carps. However, thesecannot meet new and developing market require-ments. Accordingly, some new fish species havebeen used in the Pearl River Delta and Yangtze RiverDelta to boost production (Table 6). Fish specieslisted in Table 6 are carnivorous or omnivorous,usually considered unsuitable to combine in culture.However, experiments and field tests demonstratethat they can be used in integrated systems.
Efficiency of the livestock–fish integrated system
Under the right conditions, multi-element combina-tions may have advantages over single ones, but theirinvestment intensity is also larger. Ponds are heavilyloaded with nutrition inputs from different resources,
as shown in Table 7. Among them, the input forfish–plant variant is the highest, and the income rateis also the best (1.84) with cash income of 33 118.5yuan per ha. The net income is the best, too.Obviously, the input level is the most important ingetting a good harvest.
Integration of animals with cereal crops is aflexible system in agriculture. Any element can beincluded and have tremendous effects. Because ofpromotion, this system has had a big influence onrural economic development (Table 8). In Zhang-zhuang Village, Wu County, Jiangsu Province, with567 families with 1962 people, owning 59.1 ha ofland and 49.9 ha of pond, the introduction of a crop–livestock–poultry–fish integrated system made theeconomy improve. In this well-developed village, themulti-element integrated system was very wellaccepted, and as a result, the average crop outputincreased from 306.1 kg to 512.7 kg per person, pigsfrom 0.21 to l.34 head, and chicken from 4 to 5pieces. The communal financial accumulationincreased by 2.5 times (Table 8).
The statistical data demonstrated that during1985–1995 fish production increased 3.54 times,freshwater fish by 3.71 times and cultured fish by3.95 times. In the intensified pond system in someregions, pond fish production has played an impor-tant role in freshwater fish cultivation systems. InShanghai, Jiangsu and Guangdong provinces, thecultured-fish output accounted for 95.2, 81.4 and95.1% of total pond fish yields, respectively. Theusual pond yields were 2.9, 1.6 and 2.9 t/ha and thecultured pond yields were 5.7, 2.8 and 4.9 t/ha in1990 (Table 9).
Integration systems gave 2–12 times more produc-tion than normal. The figures show the integratedsystems are vivid and fast-growing, and under thesesystems, crops, livestock and fish productionincrease much faster than the increase in population.
Conclusions
There are three important elements in integrationsystems. Manure, which links the animals withplankton and fish directly and indirectly, is the most
Table 5. Comparison of pig-manure and methane liquidfertilised pond.
Ponds Lowest DO mg/L
Chl. mg/m3
Phytoplankton Output(kg/ha)
Biomass(mg/L)
Amounts(106/L)
Meth.Liq 1.1 107.46 21.39 19.755 3817.5Manured 0.7 81.47 16.25 14.458 2781.0
Table 6. New fish species used in integrated systems in the Pearl River Delta.
Fish symbiosis Length offish fry
Density(no./ha)
Main feeds Output(kg/ha)
Mandarin fish >3 cm 30–50 Wild muss-fish 300–450Largemouth bass >3 cm 30–40 Mosquito-fish, insects, benthos 225–300Japanese eel 10 g 20–30 Mosquito-fish, benthos, feed 75–150Channel catfish 15 cm 50–100 Feed, insects, benthos 400–1125Piaractus brach. 3 cm 30–50 Algae, insects, benthos 225–375

286
important one. Mud, which links the accumulatednutrients in the pond with crop production, is thesecond. The third element is human beings whocreate the recycling paths. This integration is oneagro-alimentary-environmental system and humansare the leading factor.
In many integration systems, the livestock–fish–crop integration is the most efficient variant andplays a very important role in solving the foodproblems of the developing world.
ReferencesChen, YC. 1996. Livestock–fish farming integration system
in China. In: Proc. FAO/AAAP Symposium on Inte-grated Systems of Animal Production in the AsianRegion, 77–82.
Devendra, C. 1996. Overview of integrated animals-crops-fish production systems: achievements and futurepotential. In: Proc. FAO/AAAP Symposium on
Integrated Systems of Animal Production in the AsianRegion, 9–22.
Csavas, Imre 1992. Regional review: on livestock–fish pro-duction systems in Asia. In: Proc. FAO/IPT. Int. Work-shop on livestock–fish integrated production. Rome,Italy, 35–40.
Mukherjce, T.K., Geeta, S., Rohani, A. and Phang, S.M.1992. A study on duck–fish and goat–fish productionsystems. In: Proc. FAO/IPT Int. Workshop on livestock–fish integrated production, Rome, Italy, 41–48.
Pekar, F. and Olah, J. 1992. Carbonic pathways, bio-energetic efficiencies and energy cost in fish cum live-stock ecosystem. In: Proc. FAO/IPT Int. Workshop onlivestock–fish integrated production. Rome, Italy, 78–84.
Xu, H.C. and Zhu, S. 1992. Techniques for integrated fish-ponds. Agriculture Publishing House, Beijing, 95–140(In Chinese).
Yadava, N.K. and Vaishalli, B. The duck–cum–fishfarming integration systems. In: Proc. FAO/IPT Int.Workshop on livestock–fish integrated production.Rome, Italy. 135–139.
Table 7. Input and output of variants in different fish production combinations (8 yuan = US$1).
Variants Single fish Fish-plant Fish-livestock Fish–crop–livestock
Fish fry (no.) 717.00 2 031.00 1 083.00 696.00Cereals (kg/ha) 8 265.00 14 865 12 225.00 10 950.00Grass (kg/ha) 19 050.00 133 155.00 36 735.00 47 265.00Organic fertiliser (kg/ha) 4 320.00 11 655.00 14 370.00 12 120.00Chemical fertiliser (kg/ha) 1 128.00 925.00 1 755.00 1 710.00Fuel (kg) 1 065.00 1 890.00 1 380.00 705.00Output of fish (kg/ha) 5 139.00 12 186 7 111.50 7 441.50Cash Income (yuan) 13 524.00 33 118.50 17 487.00 17 541.00Cost (yuan) 7 828.50 17 970.00 10 504.50 9 688.50Fish/fish fry 7.17 6.00 6.57 10.70Cereal/fish 1.61 1.22 1.72 1.47Grass/fish 3.70 10.92 5.16 6.35Net income (yuan) 5 695.50 16 498.50 6 983.50 7 848.00Income rate 1.73 1.84 1.66 1.81
Table 8. Efficiency of the livestock–fish integrated farming system.
Items Wheat, barley(kg/ha)
Rice(kg/ha)
Poultry(pieces)
Pig(head)
Fish(kg/ha)
Economyaccumulation
(Yuan)
1977 2 562.0 7 605.0 8 000 420.0 2 715.0 22 000.01983 5 875.5 11 304.0 10 000 2 630.0 11 790.0 58 000.0Increase % 223.5 148.6 125 626.2 1 500.0 263.6
Table 9. Effect of integrated fish production.
Integrations Integrated (t/ha) Usual(t/ha) Increased(%) Year Provinces
Duck–fish, tight integrated 12.2–13.7 2.6 498.0 1984 JiangsuDuck–fish, tight integrated 5.4 1.6 337.5 1983 JiangsuDuck–fish, slotted dike feeding 4.5 1.9 236.8 1984 SichuanGrass–livestock–fish 19.5 1.55 1258.0 1983 Guangdong

281
Livestock–Fish Integrated Systems and Their Application
Shenggui Wu1, Chuanlin Hu1 and Youchun Chen2
Abstract
Livestock–fish integrated systems are old practices, which interestingly are becoming popular.The common integration may be pig–fish, duck–fish, cattle–fish, livestock–poultry–fish, grass–livestock–fish and so on. The commonest and most efficient integrated system is the crop–livestock–fish integration. Some important factors, including dissolved oxygen content, depth of water, typesof livestock manure used and level of input in integrated systems, all influence the nature of theoperation. The introduction of crops to integrated systems has resulted in many positive outcomesfrom a human nutrition viewpoint. Studies of nutrient and energy cycles along the food web ofintegrated systems have also made the crop–livestock–fish integrated system the most understood,scientifically. Economic recycling of all kinds of nutrient matter has reduced fuel consumption andoperational costs, resulting in an overall increase in economic efficiency. Under the integratedsystem, crops–livestock and fish production have increased faster than the rate of populationincrease. Fish output in integrated systems is about twice to 12 times that in a monoculture.
IN CHINA, the requirement of meat, eggs and fish(cultured fish) is 316.6 million t. Every person needs274 kg of cereal a year and 1200 million people need328.8 million t, for a total of 645.4 million t. Thetotal cereal production is about 551.93 million t/year.That means there is a shortfall of 93.47 million t(Chen 1996). The livestock–fish combination may beone of the solutions to meeting this shortfall.
The reason for intensifying the fish-livestock inte-grated systems is the requirement to produce high-quality animal protein to replace plant protein. Someresources without nutritional value for human beingsand animals could be turned into food in the fish–livestock integrated system, and consequently useless feed and produce more high-quality animalprotein (Pekar and Olah 1992).
In China, the earliest record of an integrated live-stock–fish system was in the Agriculture Encyclo-pedia, published in 1639, in the Ming Dynasty by XuGuang-qi (1562–1633). In the early 1920s of the
Qing Dynasty, in the book Additions to Agriculture,a four-element culture was mentioned, namelyplanting–mulberry–fish–livestock.
Realising the potential of low-input of livestock–fish integration in boosting animal food production,international agencies, especially the FAO, helped tointroduce the system to developing countries sincethe 1950s. The livestock–fish integration system hasbeen a very fast development until now (Csavas1992; Devendra 1996).
Models for Livestock–fish Integration
If certain species of domestic animals are chosen, thecombinations of the integration may be pig–fish,duck–fish, cattle–fish, chicken–fish and so on. Eachtype of combination produces manure of a differentcharacter, which supplies nutrients suitable for dif-ferent fish species. If the species of domestic animalsare defined, the fish varieties can be matched.
Pig–fish integration
Pork is one of the most important animal proteinresources in China. Pig–fish integration is quitepopular and traditional. Pig slurry has a high contentof nitrogen, with a N:C ratio 14.3:1, which is less thanthat for other animals. Manure input may increase
1Institute of Reservoir Fisheries, the Chinese Ministry ofWater Resources and the Chinese Academy of Sciences,Wuhan, 430079, China2Institute of Animal Science, the Chinese Academy ofAgriculture Sciences, Beijing 100094, China

282
phytoplankton and zooplankton to 20.61 mg/L and7.73 mg/L, respectively, at a loading of 12 kg/m3 ofwater. The pig–fish integration is 35.1% more bene-ficial than a single fish culture and the cost of raisingpigs decreases by 11.7% per kg of growth.
Duck–fish integration
This is one of the classical and traditional systems inAsia (Yadava and Vaishalli 1992). Ducks areanimals with relatively short digestive tracts. Theirdigestive tracts are only about four times the bodylength, so a large amount of feed (34%) is excretedbefore being properly digested, resulting in highermanure content of organic matter.
Duck manure can help reduce 20–25% of inputsinto a culture system comprising phyto- and zoo-plankton feeders of fish feed. The decay and decom-position of duck waste in pond waters lead to releaseof essential nutrients, enhancing the primary andsecondary productivity of water bodies, ultimatelyboosting fish production, which can save about 50%of supplementary feeds for fish (Mukherjee et al.1992).
A duck can drain 70 kg of faeces, or 5–10 kg indry faeces in a year. It is concluded that eachfattened duck is capable of producing 0.5–0.75 kg offish. About 3–6 batches of ducks can be produced,depending on different climate zones. Taking fourbatches a year, fish production will be 260–390 kgand without any feed inputs, the daily fish produc-tion with only duck wastes could be 36.5 kg/ha.
The duck number must be in accordance with thefish number. From generalised experiments andpractices, each hectare is matched to 1200–1500ducks. In ponds, duck–fish integration systems fishmust be polycultured to increase the feed utility andwater holding capacity.
The survival rate of carp is related to the densityof duck waste. The ‘safe’ level mentioned above is inthe range of waste concentrations, possibly due tothe existence of favourable hydrological conditionslike water dissolved oxygen, pH and hardness. Underdifferent densities of wastes in different times oftesting, survival rates differ. Obvious mortality canbe observed when the density of duck wastes is0.02%, but becomes serious when it is 0.035%.
Ducks dive to devour fish, but only fingerlingsunder 4 g are ingested. Therefore, seed-fish pondsare unsuitable for integration with duck.
Cattle (horse)–fish integration
Cattle–fish integration has been practiced for a longtime. Fish are integrated not only with cattle but alsowith horses and mules. Dairy cattle–fish is a newintegration. The nutrients in cow dung are lesser than
in pig manure. The nitrogen contents are a littlehigher, but phosphorus comes in trace amounts only.‘One milking cow and half ton fish’ is a commonproverb among farmers.
Cow manure is fine, granular, floats for a longtime, and is 33% heavier than pig slurry in dryweight. The total floating materials in the cow dungpond is 54.6% more than in pig, duck and chickenmanure ponds. The floating character of cow dunggranules increases feeding opportunities for fish andrestricts accumulation of the oxygen-consumingmaterials. Consequently, less harmful gas is formed.Because feed in ruminants is digested by micro-organisms, their degradation needs less oxygen incomparison to other manure resources. Each kg ofbull manure exhausted 20.6 g of oxygen in 5 days,while the pig slurry needs 30.0 g, which is 32%more. Therefore, cow dung is called ‘safe’ manure inlivestock–fish integration.
A milking cow of 400–500 kg can produce about13 600 kg of cow dung and 9000 kg of urine a year.Practices demonstrate that 0.17 kg of cow dung perm3 of water a week may produce one kg of fish.
Besides this, the wasted feeds from dairy barns arealso rich — 9000–11 000 kg of grasses are suppliedfor a cow a year and 3000 kg are wasted. Thisamount is always spattered away during the summertime, when it is a good season for fish growth. In thecattle–fish integration with an output of 7500 kg ayear, the manure of 15 head of cattle can contributefeed to meet the requirements of fish in a 1 ha pond.
Chicken–fish integration
In this system, 0.07 kg of chicken faeces is suppliedper m3 of water, 5 kg of chicken faeces able to pro-duce 1 kg filter-feeding fish. If the chicken faeces arefermented, the results can be better.
Other kinds of integration
Besides the above-mentioned integrated systems,sheep, goats and geese are all good for the purposes.A goose can supply l20–150 kg of faeces a year, and25–30 kg of goose faeces can produce 1 kg of filter-feeding fish. In the Yangtze River area, geese areused for this purpose. In integration with fish, 750–900 geese are released in one ha. Goat/sheep–fishintegration is found more in Northern China. Multi-livestock–fish is also common (Chen 1996).
Models for livestock–fish integration
Main models for livestock–fish integration areshown in Table 1.
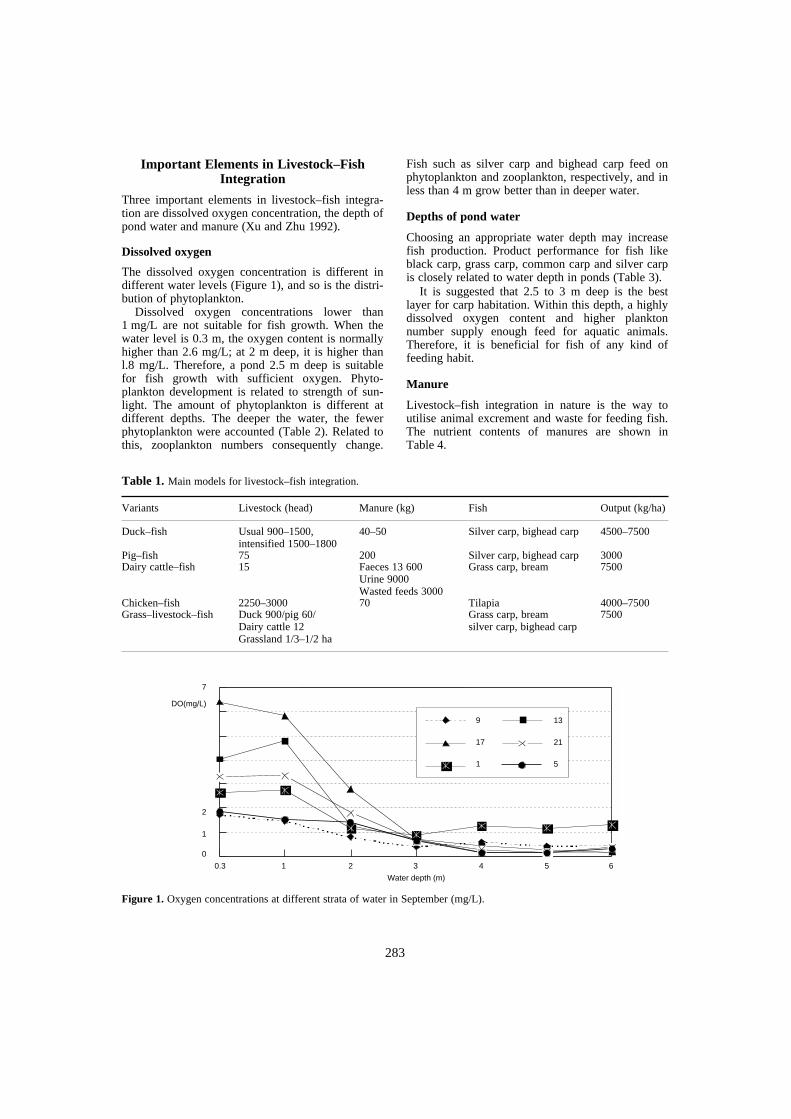
283
Important Elements in Livestock–Fish Integration
Three important elements in livestock–fish integra-tion are dissolved oxygen concentration, the depth ofpond water and manure (Xu and Zhu 1992).
Dissolved oxygen
The dissolved oxygen concentration is different indifferent water levels (Figure 1), and so is the distri-bution of phytoplankton.
Dissolved oxygen concentrations lower than1 mg/L are not suitable for fish growth. When thewater level is 0.3 m, the oxygen content is normallyhigher than 2.6 mg/L; at 2 m deep, it is higher thanl.8 mg/L. Therefore, a pond 2.5 m deep is suitablefor fish growth with sufficient oxygen. Phyto-plankton development is related to strength of sun-light. The amount of phytoplankton is different atdifferent depths. The deeper the water, the fewerphytoplankton were accounted (Table 2). Related tothis, zooplankton numbers consequently change.
Fish such as silver carp and bighead carp feed onphytoplankton and zooplankton, respectively, and inless than 4 m grow better than in deeper water.
Depths of pond water
Choosing an appropriate water depth may increasefish production. Product performance for fish likeblack carp, grass carp, common carp and silver carpis closely related to water depth in ponds (Table 3).
It is suggested that 2.5 to 3 m deep is the bestlayer for carp habitation. Within this depth, a highlydissolved oxygen content and higher planktonnumber supply enough feed for aquatic animals.Therefore, it is beneficial for fish of any kind offeeding habit.
Manure
Livestock–fish integration in nature is the way toutilise animal excrement and waste for feeding fish.The nutrient contents of manures are shown inTable 4.
Figure 1. Oxygen concentrations at different strata of water in September (mg/L).
Table 1. Main models for livestock–fish integration.
Variants Livestock (head) Manure (kg) Fish Output (kg/ha)
Duck–fish Usual 900–1500,intensified 1500–1800
40–50 Silver carp, bighead carp 4500–7500
Pig–fish 75 200 Silver carp, bighead carp 3000Dairy cattle–fish 15 Faeces 13 600
Urine 9000Wasted feeds 3000
Grass carp, bream 7500
Chicken–fish 2250–3000 70 Tilapia 4000–7500Grass–livestock–fish Duck 900/pig 60/
Dairy cattle 12Grassland 1/3–1/2 ha
Grass carp, breamsilver carp, bighead carp
7500
7
DO(mg/L)
2
1
0
0.3 1 2 3 4 5 6
Water depth (m)
9
17
1
13
21
5

284
According to the kinds of feeding habits of fishand their preferred water depths, if fish are integratedwith domestic animals, pig or duck or others may bechosen separately or together. As manures from dif-ferent animals are different, the combinations of fishfrom different living habits should be different.
Development of integration systems
Chinese people are looking for better combinationsof integration systems. It is found that plants ofvarious sources can be used as an important elementin the integration.
Terrestrial plants
Terrestrial plants are the primary products of sun-light utilisation. Grasses possess stronger photo-synthetic ability than phytoplankton. At normal lightand water temperatures, the sunlight utilisation
abilities of ryegrass and sudan grass are 3.6 and 3.3times as much as that of phytoplankton. Practicesdemonstrate that fish utilise 82% of energy fromphytoplankton including zooplankton, but 98% ofenergy from ryegrass.
When grasses are involved in livestock–fish inte-gration, fish use both terrestrial and water plants. Agrass carp eats 48 kg of grass, and produces 24 kg offaeces. The nitrogen and phosphorus of grass carpfaeces are three times more than that of pigs. Thisamount of manure supplies phytoplankton withenough nutrients.
The advantages of pig–grass–fish integration overpig–fish integration are: (1) the terrestrial grass yieldmay be increased by adding more fertilisers; and (2)the oxygen content of water is less affected bygrasses.
Aquatic plants
Azolla was introduced to China in 1971 and was avery popular feed for pigs at first, and later for fish–livestock integration. It is a fast-growing plant,which may cover the whole water surface in a shorttime, so its intensive use is proposed. As comparedwith a rice–fish system, a rice–fish–azolla–ducksystem increases fish yield to 308 kg/ha in the wetseason and 650 kg/ha in the dry season, when bothazolla and ducks are used.
Other aquatic plants that maybe used are waterlettuce and common water hyacinth; they are easierto collect but must be collected regularly to keepnecessary oxygen requirements for other waterhabitants.
Table 4. Nutrients in livestock and bird manure (%).
Manure Water Organic material
N P2O3 K2O
Pig faeces 79 16.3 0.50 0.38 0.46Pig urine 97 2.5 0.3–0.5 0.11 0.45Dairy cow manure 85 11.4 0.36 0.32 0.20Cattle urine 92–95 2.3 0.6–1.2 Trace 1.35Chicken faeces 50.5 25.5 1.63 1.54 0.86Egg chick faeces 44.2 35.1 1.44 1.62 1.44Duck faeces 56.6 26.2 1.10 1.40 0.63Goose faeces 71.1 23.4 0.55 0.50 0.50
Table 2. Stratified amount of plankton in ponds (%).
Waterdepth (m)
Sept 717:00
Sept 85:00
Oct 2017:00
Nov 1415:00
Phytoplankton104 ind/L
Zooplanktonind/L
0.3 100.0 100.0 100.0 100.0 3378 35 8751.0 80.96 96.29 85.60 90.012.0 81.16 112.07 84.55 88.35 25874.0 52.78 85.95 42.49 85.64 15 4656.0 24.31 77.56 16.48 75.20 871 2 460
Table 3. Relationship between fish production and water depth in ponds (%).
Water depth (m)
Grass carp Black carp Common carp Silver, bighead carp
Input Net crop Input Net crop Input Net crop Input Net crop
1–1.5 100 100 100 100 100 100 100 1001.5–2 129.3 165.5 158.6 152.9 145.7 108 113.5 135.12–2.5 155.2 129.3 179.3 207.1 171.6 112 114.9 147.3

285
Methane products
Methane gas generation has been popularised inChina for decades and the livestock manure andstems of crops are normally used for this purpose.Farmers often used liquid and sediment methane pro-duction as fertilisers for arable lands and also forfishponds. Practices demonstrate that the fish outputreaches 6772 kg/ha from 965 kg of fish fingerlingsdue to the input of methane production to ponds.
Reasons for higher production include: (1) higheramount of chlorophyll or higher phytoplanktonquantity; (2) higher dissolved oxygen; and (3) betterfood conversion efficiency in methane-fertilisedponds than in manure ponds (Table 5).
New symbiotic species
Fish species used in pond culture in China have beenlimited mainly to the Chinese carps. However, thesecannot meet new and developing market require-ments. Accordingly, some new fish species havebeen used in the Pearl River Delta and Yangtze RiverDelta to boost production (Table 6). Fish specieslisted in Table 6 are carnivorous or omnivorous,usually considered unsuitable to combine in culture.However, experiments and field tests demonstratethat they can be used in integrated systems.
Efficiency of the livestock–fish integrated system
Under the right conditions, multi-element combina-tions may have advantages over single ones, but theirinvestment intensity is also larger. Ponds are heavilyloaded with nutrition inputs from different resources,
as shown in Table 7. Among them, the input forfish–plant variant is the highest, and the income rateis also the best (1.84) with cash income of 33 118.5yuan per ha. The net income is the best, too.Obviously, the input level is the most important ingetting a good harvest.
Integration of animals with cereal crops is aflexible system in agriculture. Any element can beincluded and have tremendous effects. Because ofpromotion, this system has had a big influence onrural economic development (Table 8). In Zhang-zhuang Village, Wu County, Jiangsu Province, with567 families with 1962 people, owning 59.1 ha ofland and 49.9 ha of pond, the introduction of a crop–livestock–poultry–fish integrated system made theeconomy improve. In this well-developed village, themulti-element integrated system was very wellaccepted, and as a result, the average crop outputincreased from 306.1 kg to 512.7 kg per person, pigsfrom 0.21 to l.34 head, and chicken from 4 to 5pieces. The communal financial accumulationincreased by 2.5 times (Table 8).
The statistical data demonstrated that during1985–1995 fish production increased 3.54 times,freshwater fish by 3.71 times and cultured fish by3.95 times. In the intensified pond system in someregions, pond fish production has played an impor-tant role in freshwater fish cultivation systems. InShanghai, Jiangsu and Guangdong provinces, thecultured-fish output accounted for 95.2, 81.4 and95.1% of total pond fish yields, respectively. Theusual pond yields were 2.9, 1.6 and 2.9 t/ha and thecultured pond yields were 5.7, 2.8 and 4.9 t/ha in1990 (Table 9).
Integration systems gave 2–12 times more produc-tion than normal. The figures show the integratedsystems are vivid and fast-growing, and under thesesystems, crops, livestock and fish productionincrease much faster than the increase in population.
Conclusions
There are three important elements in integrationsystems. Manure, which links the animals withplankton and fish directly and indirectly, is the most
Table 5. Comparison of pig-manure and methane liquidfertilised pond.
Ponds Lowest DO mg/L
Chl. mg/m3
Phytoplankton Output(kg/ha)
Biomass(mg/L)
Amounts(106/L)
Meth.Liq 1.1 107.46 21.39 19.755 3817.5Manured 0.7 81.47 16.25 14.458 2781.0
Table 6. New fish species used in integrated systems in the Pearl River Delta.
Fish symbiosis Length offish fry
Density(no./ha)
Main feeds Output(kg/ha)
Mandarin fish >3 cm 30–50 Wild muss-fish 300–450Largemouth bass >3 cm 30–40 Mosquito-fish, insects, benthos 225–300Japanese eel 10 g 20–30 Mosquito-fish, benthos, feed 75–150Channel catfish 15 cm 50–100 Feed, insects, benthos 400–1125Piaractus brach. 3 cm 30–50 Algae, insects, benthos 225–375
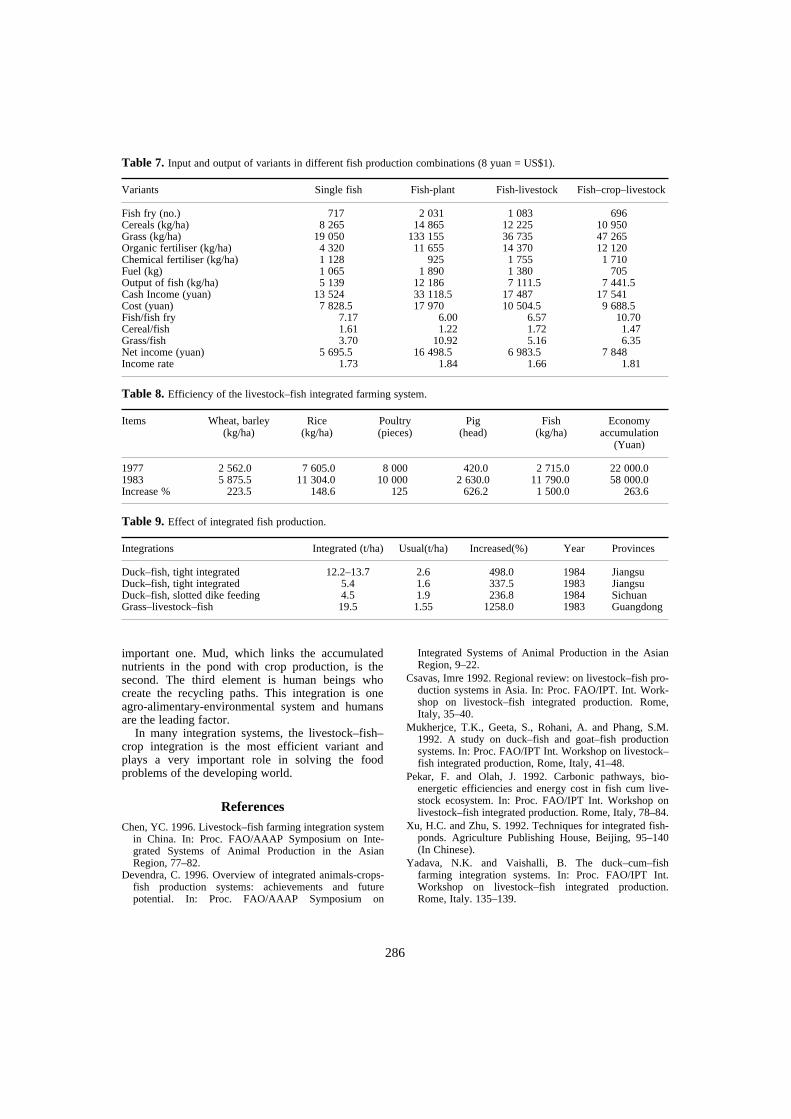
286
important one. Mud, which links the accumulatednutrients in the pond with crop production, is thesecond. The third element is human beings whocreate the recycling paths. This integration is oneagro-alimentary-environmental system and humansare the leading factor.
In many integration systems, the livestock–fish–crop integration is the most efficient variant andplays a very important role in solving the foodproblems of the developing world.
ReferencesChen, YC. 1996. Livestock–fish farming integration system
in China. In: Proc. FAO/AAAP Symposium on Inte-grated Systems of Animal Production in the AsianRegion, 77–82.
Devendra, C. 1996. Overview of integrated animals-crops-fish production systems: achievements and futurepotential. In: Proc. FAO/AAAP Symposium on
Integrated Systems of Animal Production in the AsianRegion, 9–22.
Csavas, Imre 1992. Regional review: on livestock–fish pro-duction systems in Asia. In: Proc. FAO/IPT. Int. Work-shop on livestock–fish integrated production. Rome,Italy, 35–40.
Mukherjce, T.K., Geeta, S., Rohani, A. and Phang, S.M.1992. A study on duck–fish and goat–fish productionsystems. In: Proc. FAO/IPT Int. Workshop on livestock–fish integrated production, Rome, Italy, 41–48.
Pekar, F. and Olah, J. 1992. Carbonic pathways, bio-energetic efficiencies and energy cost in fish cum live-stock ecosystem. In: Proc. FAO/IPT Int. Workshop onlivestock–fish integrated production. Rome, Italy, 78–84.
Xu, H.C. and Zhu, S. 1992. Techniques for integrated fish-ponds. Agriculture Publishing House, Beijing, 95–140(In Chinese).
Yadava, N.K. and Vaishalli, B. The duck–cum–fishfarming integration systems. In: Proc. FAO/IPT Int.Workshop on livestock–fish integrated production.Rome, Italy. 135–139.
Table 7. Input and output of variants in different fish production combinations (8 yuan = US$1).
Variants Single fish Fish-plant Fish-livestock Fish–crop–livestock
Fish fry (no.) 717.00 2 031.00 1 083.00 696.00Cereals (kg/ha) 8 265.00 14 865 12 225.00 10 950.00Grass (kg/ha) 19 050.00 133 155.00 36 735.00 47 265.00Organic fertiliser (kg/ha) 4 320.00 11 655.00 14 370.00 12 120.00Chemical fertiliser (kg/ha) 1 128.00 925.00 1 755.00 1 710.00Fuel (kg) 1 065.00 1 890.00 1 380.00 705.00Output of fish (kg/ha) 5 139.00 12 186 7 111.50 7 441.50Cash Income (yuan) 13 524.00 33 118.50 17 487.00 17 541.00Cost (yuan) 7 828.50 17 970.00 10 504.50 9 688.50Fish/fish fry 7.17 6.00 6.57 10.70Cereal/fish 1.61 1.22 1.72 1.47Grass/fish 3.70 10.92 5.16 6.35Net income (yuan) 5 695.50 16 498.50 6 983.50 7 848.00Income rate 1.73 1.84 1.66 1.81
Table 8. Efficiency of the livestock–fish integrated farming system.
Items Wheat, barley(kg/ha)
Rice(kg/ha)
Poultry(pieces)
Pig(head)
Fish(kg/ha)
Economyaccumulation
(Yuan)
1977 2 562.0 7 605.0 8 000 420.0 2 715.0 22 000.01983 5 875.5 11 304.0 10 000 2 630.0 11 790.0 58 000.0Increase % 223.5 148.6 125 626.2 1 500.0 263.6
Table 9. Effect of integrated fish production.
Integrations Integrated (t/ha) Usual(t/ha) Increased(%) Year Provinces
Duck–fish, tight integrated 12.2–13.7 2.6 498.0 1984 JiangsuDuck–fish, tight integrated 5.4 1.6 337.5 1983 JiangsuDuck–fish, slotted dike feeding 4.5 1.9 236.8 1984 SichuanGrass–livestock–fish 19.5 1.55 1258.0 1983 Guangdong
287
Fisheries Marketing Systems in Sri Lanka and Their Relevance to Local Reservoir Fishery Development
F.J. Murray1, S. Koddithuwakku2 and D.C. Little1
Abstract
Poverty alleviation programs that focus on rural aquaculture or fisheries development typicallystress the potential of increased fish production to both sustain and enhance food security and forincome generation. Although most programs deal with the biotechnical aspects of production, fewadequately assess the marketing situation and its impact on the potential of different wealth groupsto benefit. Poor understanding of this aspect has resulted in misguided policy directives at nationaland local levels and undermined the sustainability of many development programs. This paper isbased on research investigating the potential for integrated production of aquatic organisms insmall-scale farmer-managed irrigation systems within the dry-zone of Sri Lanka, and the potentialof such activities to diversify the livelihood strategies of marginal groups in this risk-proneenvironment. It begins with a brief consideration of the water resource and fish production andconsumption trends within the country. The validity of regional and national production data (amajor determinant of government development policy) is assessed in the light of field findings anddata triangulation. It then assesses market infrastructure and examines the networks of actorsparticipating in the market (producers, middlemen, retailers and consumers), differentiatingbetween different levels of market space: inter-regional and sub-regional characterised by themarkedly different nature of interaction between actors in these spaces. It assesses seasonal andhistoric demand and supply trends and consumer preferences for local fish varieties, differentforms and substitutes, and the margins earned by actors at different levels of the market network.Throughout, it highlights the differences that exist between different wealth groups. Insights intothe local market situation are also gained through contrast with markets in other fishery sectors.Data were assembled and triangulated using a variety of sources and methods including in-depth orsemi-structured interviews with key actors, direct participant observation and focus groupdiscussions at production and marketing sites. Consumer preferences were assessed using rankingand scoring exercises, part of wider livelihood analyses undertaken in project villages. Based onthese findings the potential for future development of market networks and entry points for targetbeneficiaries (including women’s groups) with respect to participation in marketing and processingactivities is assessed, as is the potential of ‘low-input’ processing activities to bring benefit throughaddition of value to fisheries products. Finally the findings are considered in the light of existingregional development policies (governmental, non-governmental and research), drawing lessonsthat may have relevance to wider recommendation domains.
RESULTS presented in this paper were collected aspart of an ongoing DFID–CARE-funded researchprogram being undertaken within Northwest Provincein the Dry Zone of Sri Lanka. The program is inves-tigating the potential for integrated production ofaquatic organisms in small-scale farmer-managed
irrigation systems and the potential of such activitiesto diversify the livelihood strategies of marginalgroups in water-stressed areas. Taking a ‘people-first’, sustainable livelihoods approach incorporatingfarmer-managed trials, the project aims to developinnovative technologies capable of increasing or sus-taining existing production.
Poverty alleviation programs focusing on ruralaquaculture or fisheries development typically stressthe potential of increased fish production to both sus-tain and enhance food security and increase income
1Institute of Aquaculture, Stirling University, Stirling FK94LA, Scotland. E-mail: [email protected] Centre, Faculty of Agriculture, University ofPeradeniya, Sri Lanka.
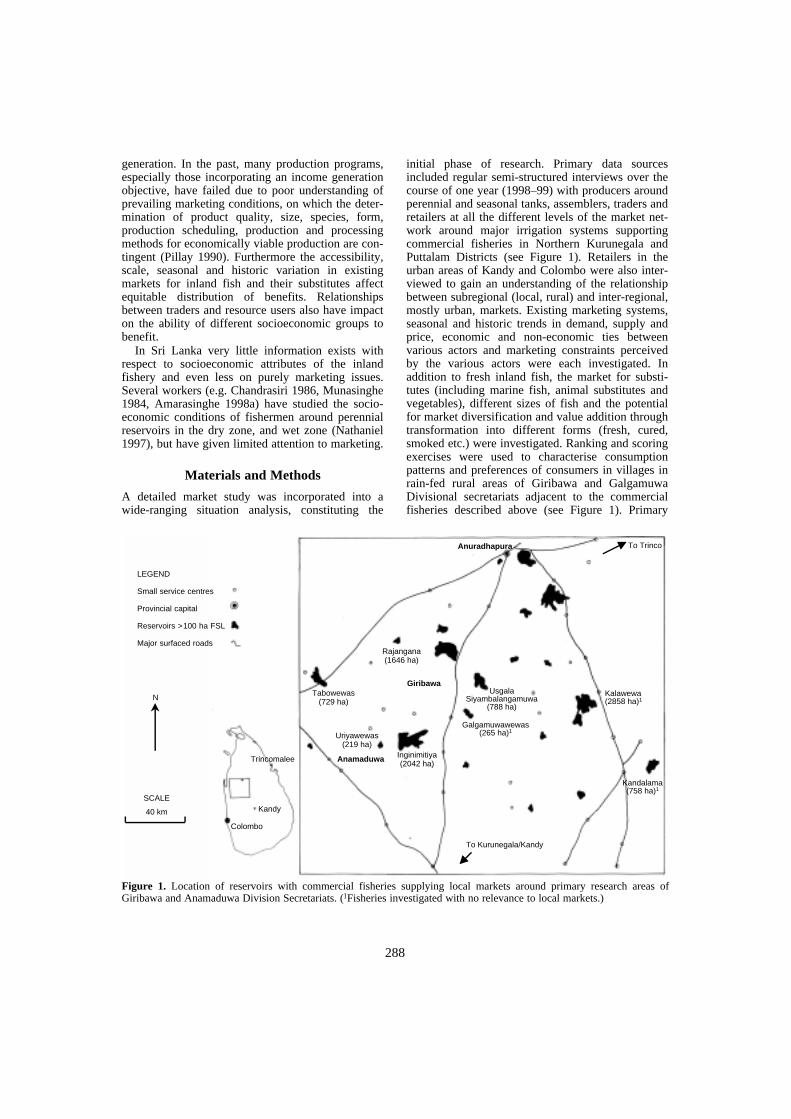
288
generation. In the past, many production programs,especially those incorporating an income generationobjective, have failed due to poor understanding ofprevailing marketing conditions, on which the deter-mination of product quality, size, species, form,production scheduling, production and processingmethods for economically viable production are con-tingent (Pillay 1990). Furthermore the accessibility,scale, seasonal and historic variation in existingmarkets for inland fish and their substitutes affectequitable distribution of benefits. Relationshipsbetween traders and resource users also have impacton the ability of different socioeconomic groups tobenefit.
In Sri Lanka very little information exists withrespect to socioeconomic attributes of the inlandfishery and even less on purely marketing issues.Several workers (e.g. Chandrasiri 1986, Munasinghe1984, Amarasinghe 1998a) have studied the socio-economic conditions of fishermen around perennialreservoirs in the dry zone, and wet zone (Nathaniel1997), but have given limited attention to marketing.
Materials and Methods
A detailed market study was incorporated into awide-ranging situation analysis, constituting the
initial phase of research. Primary data sourcesincluded regular semi-structured interviews over thecourse of one year (1998–99) with producers aroundperennial and seasonal tanks, assemblers, traders andretailers at all the different levels of the market net-work around major irrigation systems supportingcommercial fisheries in Northern Kurunegala andPuttalam Districts (see Figure 1). Retailers in theurban areas of Kandy and Colombo were also inter-viewed to gain an understanding of the relationshipbetween subregional (local, rural) and inter-regional,mostly urban, markets. Existing marketing systems,seasonal and historic trends in demand, supply andprice, economic and non-economic ties betweenvarious actors and marketing constraints perceivedby the various actors were each investigated. Inaddition to fresh inland fish, the market for substi-tutes (including marine fish, animal substitutes andvegetables), different sizes of fish and the potentialfor market diversification and value addition throughtransformation into different forms (fresh, cured,smoked etc.) were investigated. Ranking and scoringexercises were used to characterise consumptionpatterns and preferences of consumers in villages inrain-fed rural areas of Giribawa and GalgamuwaDivisional secretariats adjacent to the commercialfisheries described above (see Figure 1). Primary
Figure 1. Location of reservoirs with commercial fisheries supplying local markets around primary research areas ofGiribawa and Anamaduwa Division Secretariats. (1Fisheries investigated with no relevance to local markets.)
LEGEND
Small service centres
Provincial capital
Reservoirs >100 ha FSL
Major surfaced roads
N
SCALE
40 km
Trincomalee
Kandy
Colombo
Anuradhapura
Giribawa
Anamaduwa
To Kurunegala/Kandy
To Trinco
Kalawewa(2858 ha)1
Galgamuwawewas(265 ha)1
UsgalaSiyambalangamuwa
(788 ha)
Kandalama(758 ha)1
Inginimitiya(2042 ha)
Uriyawewas(219 ha)
Tabowewas(729 ha)
Rajangana(1646 ha)
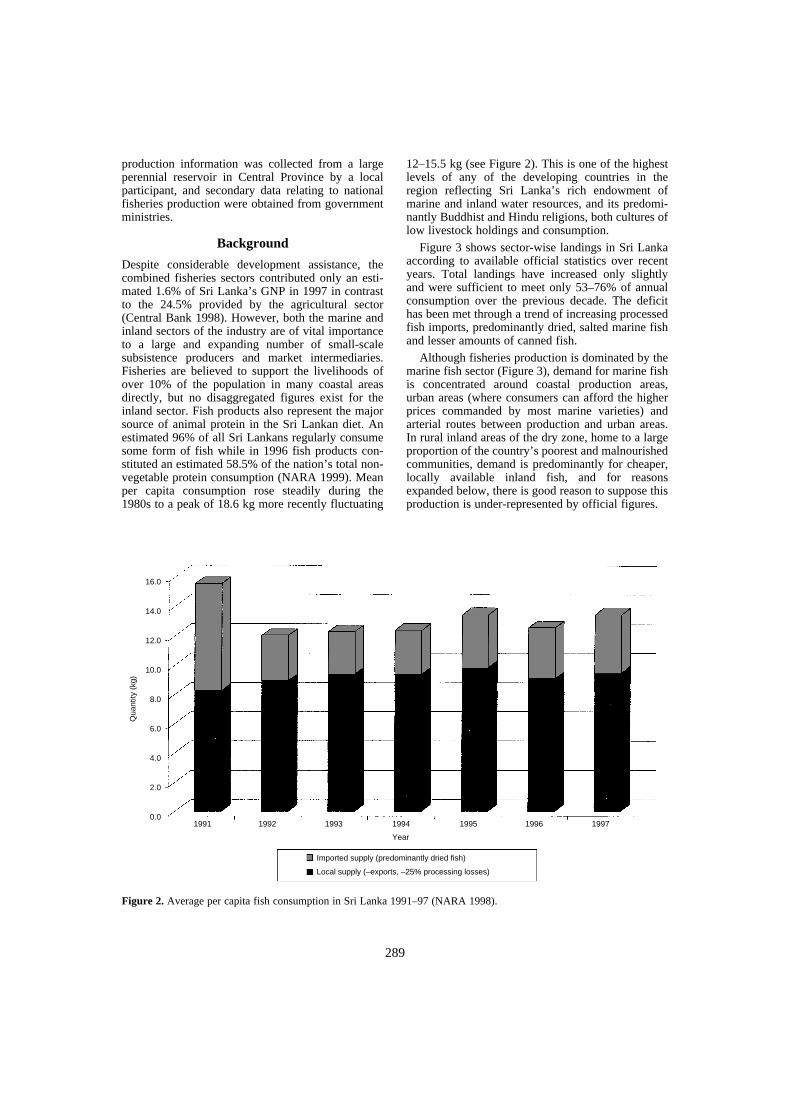
289
production information was collected from a largeperennial reservoir in Central Province by a localparticipant, and secondary data relating to nationalfisheries production were obtained from governmentministries.
Background
Despite considerable development assistance, thecombined fisheries sectors contributed only an esti-mated 1.6% of Sri Lanka’s GNP in 1997 in contrastto the 24.5% provided by the agricultural sector(Central Bank 1998). However, both the marine andinland sectors of the industry are of vital importanceto a large and expanding number of small-scalesubsistence producers and market intermediaries.Fisheries are believed to support the livelihoods ofover 10% of the population in many coastal areasdirectly, but no disaggregated figures exist for theinland sector. Fish products also represent the majorsource of animal protein in the Sri Lankan diet. Anestimated 96% of all Sri Lankans regularly consumesome form of fish while in 1996 fish products con-stituted an estimated 58.5% of the nation’s total non-vegetable protein consumption (NARA 1999). Meanper capita consumption rose steadily during the1980s to a peak of 18.6 kg more recently fluctuating
12–15.5 kg (see Figure 2). This is one of the highestlevels of any of the developing countries in theregion reflecting Sri Lanka’s rich endowment ofmarine and inland water resources, and its predomi-nantly Buddhist and Hindu religions, both cultures oflow livestock holdings and consumption.
Figure 3 shows sector-wise landings in Sri Lankaaccording to available official statistics over recentyears. Total landings have increased only slightlyand were sufficient to meet only 53–76% of annualconsumption over the previous decade. The deficithas been met through a trend of increasing processedfish imports, predominantly dried, salted marine fishand lesser amounts of canned fish.
Although fisheries production is dominated by themarine fish sector (Figure 3), demand for marine fishis concentrated around coastal production areas,urban areas (where consumers can afford the higherprices commanded by most marine varieties) andarterial routes between production and urban areas.In rural inland areas of the dry zone, home to a largeproportion of the country’s poorest and malnourishedcommunities, demand is predominantly for cheaper,locally available inland fish, and for reasonsexpanded below, there is good reason to suppose thisproduction is under-represented by official figures.
Figure 2. Average per capita fish consumption in Sri Lanka 1991–97 (NARA 1998).
16.0
14.0
12.0
10.0
8.0
6.0
4.0
2.0
0.0
Qua
ntity
(kg
)
1991 1992 1993 1994 1995 1996 1997
Year
Imported supply (predominantly dried fish)
Local supply (–exports, –25% processing losses)
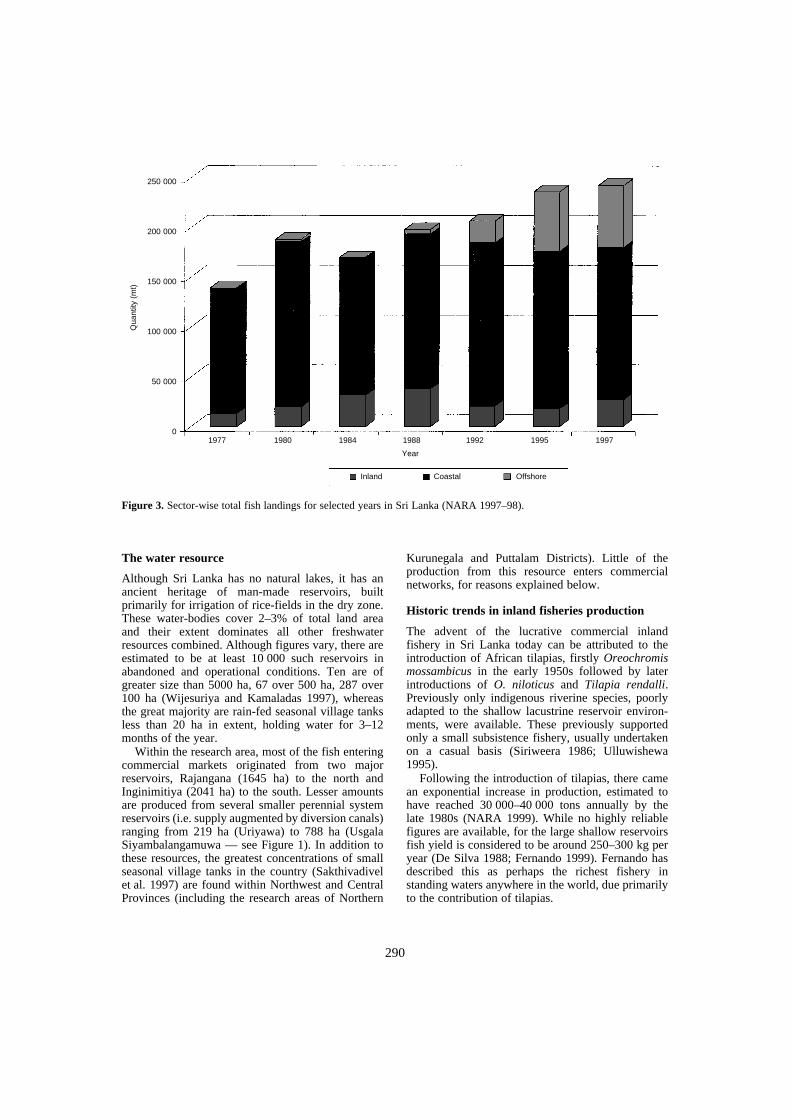
290
The water resource
Although Sri Lanka has no natural lakes, it has anancient heritage of man-made reservoirs, builtprimarily for irrigation of rice-fields in the dry zone.These water-bodies cover 2–3% of total land areaand their extent dominates all other freshwaterresources combined. Although figures vary, there areestimated to be at least 10 000 such reservoirs inabandoned and operational conditions. Ten are ofgreater size than 5000 ha, 67 over 500 ha, 287 over100 ha (Wijesuriya and Kamaladas 1997), whereasthe great majority are rain-fed seasonal village tanksless than 20 ha in extent, holding water for 3–12months of the year.
Within the research area, most of the fish enteringcommercial markets originated from two majorreservoirs, Rajangana (1645 ha) to the north andInginimitiya (2041 ha) to the south. Lesser amountsare produced from several smaller perennial systemreservoirs (i.e. supply augmented by diversion canals)ranging from 219 ha (Uriyawa) to 788 ha (UsgalaSiyambalangamuwa — see Figure 1). In addition tothese resources, the greatest concentrations of smallseasonal village tanks in the country (Sakthivadivelet al. 1997) are found within Northwest and CentralProvinces (including the research areas of Northern
Kurunegala and Puttalam Districts). Little of theproduction from this resource enters commercialnetworks, for reasons explained below.
Historic trends in inland fisheries production
The advent of the lucrative commercial inlandfishery in Sri Lanka today can be attributed to theintroduction of African tilapias, firstly Oreochromismossambicus in the early 1950s followed by laterintroductions of O. niloticus and Tilapia rendalli.Previously only indigenous riverine species, poorlyadapted to the shallow lacustrine reservoir environ-ments, were available. These previously supportedonly a small subsistence fishery, usually undertakenon a casual basis (Siriweera 1986; Ulluwishewa1995).
Following the introduction of tilapias, there camean exponential increase in production, estimated tohave reached 30 000–40 000 tons annually by thelate 1980s (NARA 1999). While no highly reliablefigures are available, for the large shallow reservoirsfish yield is considered to be around 250–300 kg peryear (De Silva 1988; Fernando 1999). Fernando hasdescribed this as perhaps the richest fishery instanding waters anywhere in the world, due primarilyto the contribution of tilapias.
Figure 3. Sector-wise total fish landings for selected years in Sri Lanka (NARA 1997–98).
250 000
200 000
150 000
100 000
50 000
0
Qua
ntity
(m
t)
1977 1980 1984 1988 1992 1995 1997
Year
Inland Coastal Offshore

291
Despite decades of government and internationaldevelopment investment, attempts to introduceChinese and Indian major carps as part of the per-ennial tank fisheries have so far been a failure due toa variety of political, socioeconomic, cultural andtechnical factors. Over the same period attempts toestablish semi-intensive pond and extensive smalltank culture fisheries stocking carps and tilapias havemet with equal failure. These efforts can be con-trasted with the tilapia-based fishery in the largereservoirs, where after initial stocking of tilapia, asustainable and high-yielding fishery was establishedwithout any further government intervention.
Contribution of perennial and seasonal tanks
Only perennial reservoirs support full-time pro-fessional fishing communities, and it is estimatedthat 90% of all commercially available inland pro-duction originates from only 74 of the largest peren-nial reservoirs in the dry zone. These are essentiallyunmechanised shore and canoe-based, artisanal gill-net fisheries.
Stocking trials in rain-fed village tanks have dem-onstrated yield potentials in excess of 800kg/ha/yr(Chakrabarty 1983) though results have been highlyvariable and so far no sustained adoption has beenachieved. Research indicates that even in the absenceof stocking initiatives, substantial though erratic nat-ural production occurs in such tanks. Interviews withsubsistence fishermen in watersheds around Ana-maduwa and Giribawa indicated production levelsduring seasonal collective fishing 150–200 kg/ha fortanks ranging from 3 to 7.5 ha (maximum waterspread) retaining water for 9–12 months during theprevious season. Negligible production (<25kg/ha)was recorded for the smallest highly seasonal tanksholding water for less than six months. Greatest var-iation exists in the production levels from medium-sized semi-seasonal tanks (drying intermittently)where potential for natural repopulation depends onseasonal hydrological linkages between tanks at thewider cascade level. Such linkages are in turn deter-mined by a number of factors, principally seasonalrainfall patterns and tank rehabilitation practices.Village tank production, which is concentratedmostly during the dry season, remains invisible toofficial statistics, being used almost exclusively forlocal household consumption. Any surpluses aretypically limited to neighbouring villages, under-taken by casual participants (mainly youth), often ona relational basis at highly discounted prices.
Current status in commercial inland fisheries production
The current production situation in the commercialinland fishery remains far from clear due to a unique
politically and economically inspired withdrawal ofall government economic support to the sector in1989–94, which saw an almost complete loss ofinstitutional memory. Only the most rudimentaryfisheries inspection capacity has since been re-established, yet official figures suggest substantialrecovery since State support was resumed. As all thelarger fisheries effectively remain open-accessdespite attempts to establish cooperatives and as nosignificant stock enhancement efforts have recentlytaken place, it is difficult to justify such claims.Furthermore, the effectiveness of earlier stockinginitiatives in large perennial reservoirs remainsundemonstrated (Amarasinghe 1998b). It is inter-esting to note that earlier surges in reported pro-duction appear to correlate with the provision ofsubsidised fishing gears and craft, the most notableexample being the provision of more than 5000canoes and fishing gears by the government duringthe late 1980s.
Key informant interviews with producers aroundthe major reservoirs (shown in Figure 2) over the lastyear suggest a steady increase in the number ofentrants to the fishery and total production, accom-panied by a steady decrease in the mean size oflanded fish and loss of indigenous varieties. Watson(1999) reports similar findings in reservoirs of theMahaweli H system. Most respondents attributed thelatter effect to the unregulated intensification offishing effort and fishing practices.
Figure 4 shows production figures collected by alocal participant over several low-season monthsfrom three landing sites (from which 12–15 canoesoperated) around Kandalama, a large perennial reser-voir of 758 ha in Central Province (see Figure 1).Accuracy of these figures was verified by regularfield checks. Tilapias constitute some 95% of totallandings during the period, reflecting the resilienceof the species to intensive fishing pressure. The bal-ance of the catch consists of a variety of mostlysmall indigenous species and a few large exoticcarps, relics of earlier stocking programs. Estimatesof the tilapia contribution to annual landings byfishermen and vendors around other commercialreservoirs within the research area ranged 75–90% oftotal catch.
Seasonal and historic variation in price for inland fish and substitutes
Figures 5 to 8 show mean monthly retail and whole-sale prices (Sri Lankan Rupees) for dried and freshinland and marine fish in Colombo during 11 monthsin 1998–99, with standard deviation bars indicatingthe degree of weekly variation each month. As areference it should be borne in mind that agricultural
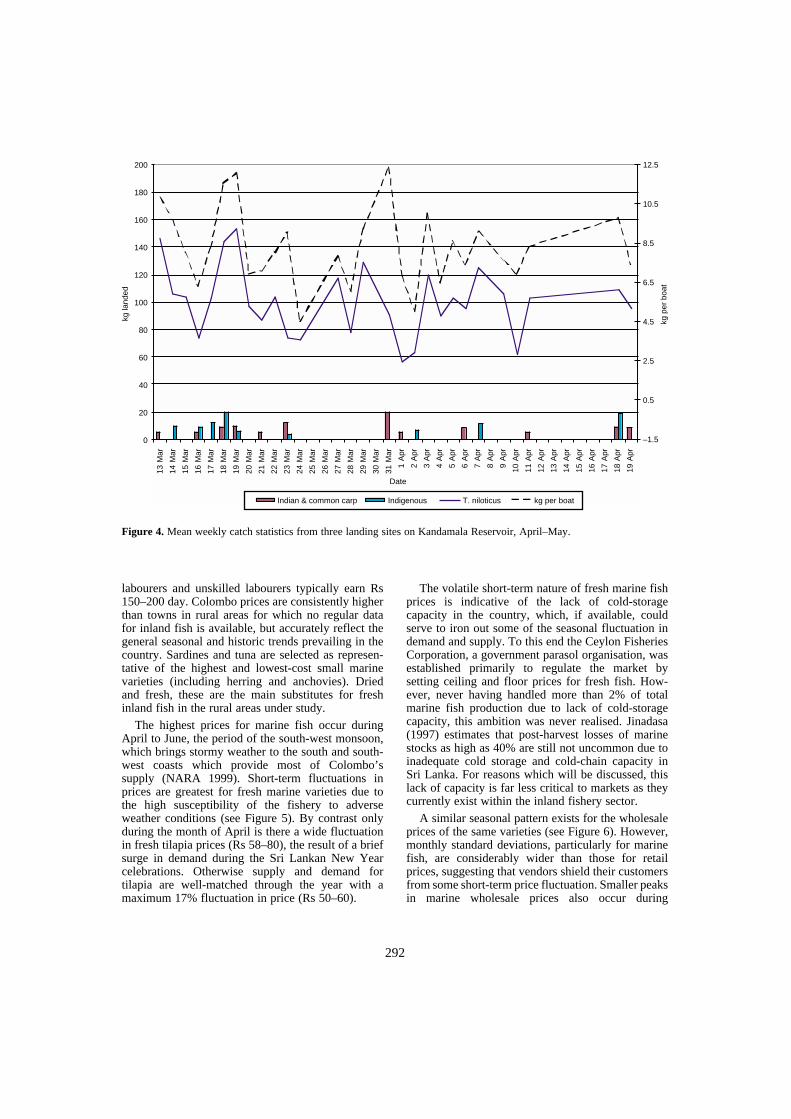
292
labourers and unskilled labourers typically earn Rs150–200 day. Colombo prices are consistently higherthan towns in rural areas for which no regular datafor inland fish is available, but accurately reflect thegeneral seasonal and historic trends prevailing in thecountry. Sardines and tuna are selected as represen-tative of the highest and lowest-cost small marinevarieties (including herring and anchovies). Driedand fresh, these are the main substitutes for freshinland fish in the rural areas under study.
The highest prices for marine fish occur duringApril to June, the period of the south-west monsoon,which brings stormy weather to the south and south-west coasts which provide most of Colombo’ssupply (NARA 1999). Short-term fluctuations inprices are greatest for fresh marine varieties due tothe high susceptibility of the fishery to adverseweather conditions (see Figure 5). By contrast onlyduring the month of April is there a wide fluctuationin fresh tilapia prices (Rs 58–80), the result of a briefsurge in demand during the Sri Lankan New Yearcelebrations. Otherwise supply and demand fortilapia are well-matched through the year with amaximum 17% fluctuation in price (Rs 50–60).
The volatile short-term nature of fresh marine fishprices is indicative of the lack of cold-storagecapacity in the country, which, if available, couldserve to iron out some of the seasonal fluctuation indemand and supply. To this end the Ceylon FisheriesCorporation, a government parasol organisation, wasestablished primarily to regulate the market bysetting ceiling and floor prices for fresh fish. How-ever, never having handled more than 2% of totalmarine fish production due to lack of cold-storagecapacity, this ambition was never realised. Jinadasa(1997) estimates that post-harvest losses of marinestocks as high as 40% are still not uncommon due toinadequate cold storage and cold-chain capacity inSri Lanka. For reasons which will be discussed, thislack of capacity is far less critical to markets as theycurrently exist within the inland fishery sector.
A similar seasonal pattern exists for the wholesaleprices of the same varieties (see Figure 6). However,monthly standard deviations, particularly for marinefish, are considerably wider than those for retailprices, suggesting that vendors shield their customersfrom some short-term price fluctuation. Smaller peaksin marine wholesale prices also occur during
Figure 4. Mean weekly catch statistics from three landing sites on Kandamala Reservoir, April–May.
200
180
160
140
120
100
80
60
40
20
0
kg la
nded
12.5
10.5
8.5
6.5
4.5
2.5
0.5
–1.5
kg p
er b
oat
13 M
ar
14 M
ar
15 M
ar
16 M
ar
17 M
ar
18 M
ar
19 M
ar
20 M
ar
21 M
ar
22 M
ar
23 M
ar
24 M
ar
25 M
ar
26 M
ar
27 M
ar
28 M
ar
29 M
ar
30 M
ar
31 M
ar
1 A
pr
2 A
pr
3 A
pr
4 A
pr
5 A
pr
6 A
pr
7 A
pr
8 A
pr
9 A
pr
10 A
pr
11 A
pr
12 A
pr
13 A
pr
14 A
pr
15 A
pr
16 A
pr
17 A
pr
18 A
pr
19 A
pr
Date
Indian & common carp Indigenous T. niloticus kg per boat

293
Figure 5. Mean monthly retail prices and standard deviations in weekly prices, for fresh marine and inland fish varieties,Colombo (ARTI 1998–99).
Figure 6. Mean monthly wholesale prices and standard deviations in weekly prices, for fresh marine and inland fishvarieties, Colombo Pettah fish market 1998–99 (ARTI 1998–99).
180
160
140
120
100
80
60
40
20
0
Mea
n pr
ice
(Rs/
kg)
Fresh tilapia Fresh sardines Fresh tuna
Nov 98 Dec 98 Jan 99 Feb 99 Mar 99 Apr 99 May 99 Jun 99 Jul 99 Aug 99 Sep 99
Month
100
90
80
70
60
50
40
30
20
10
0
Mea
n pr
ice
(Rs/
kg)
Fresh tilapia Fresh sardines Fresh tuna
Nov 98 Dec 98 Jan 99 Feb 99 Mar 99 Apr 99 May 99 Jun 99 Jul 99 Aug 99 Sep 99
Month
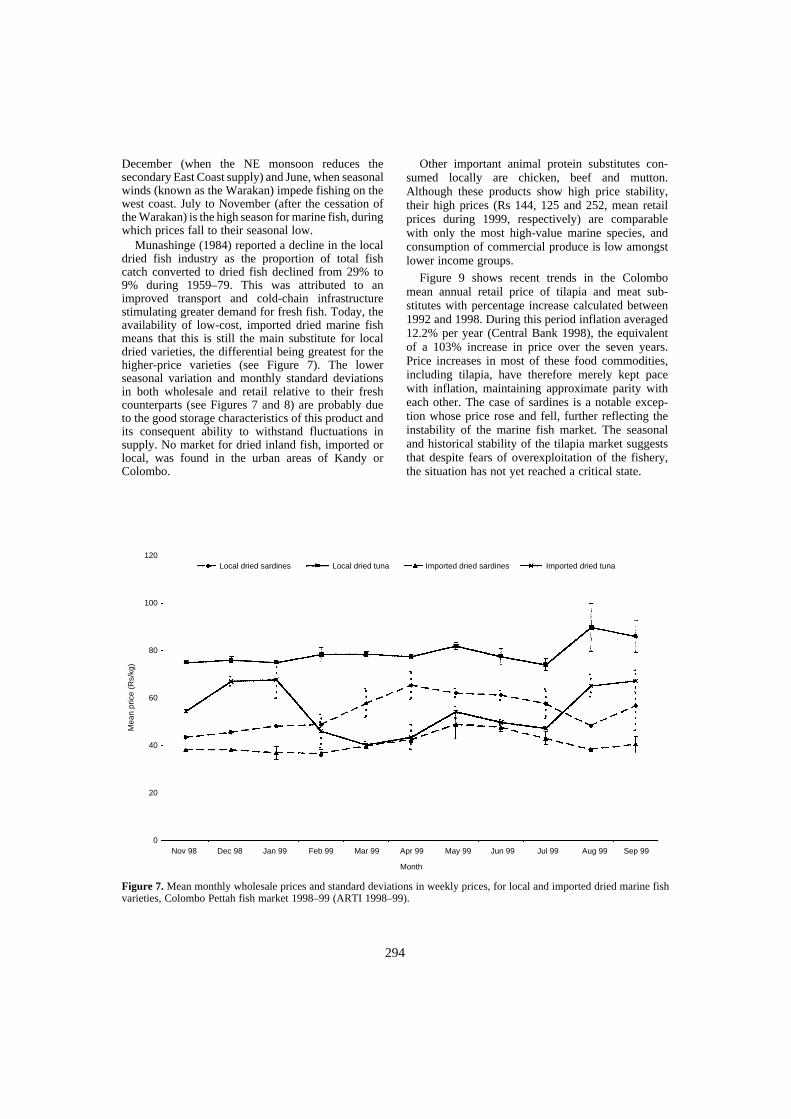
294
December (when the NE monsoon reduces thesecondary East Coast supply) and June, when seasonalwinds (known as the Warakan) impede fishing on thewest coast. July to November (after the cessation ofthe Warakan) is the high season for marine fish, duringwhich prices fall to their seasonal low.
Munashinge (1984) reported a decline in the localdried fish industry as the proportion of total fishcatch converted to dried fish declined from 29% to9% during 1959–79. This was attributed to animproved transport and cold-chain infrastructurestimulating greater demand for fresh fish. Today, theavailability of low-cost, imported dried marine fishmeans that this is still the main substitute for localdried varieties, the differential being greatest for thehigher-price varieties (see Figure 7). The lowerseasonal variation and monthly standard deviationsin both wholesale and retail relative to their freshcounterparts (see Figures 7 and 8) are probably dueto the good storage characteristics of this product andits consequent ability to withstand fluctuations insupply. No market for dried inland fish, imported orlocal, was found in the urban areas of Kandy orColombo.
Other important animal protein substitutes con-sumed locally are chicken, beef and mutton.Although these products show high price stability,their high prices (Rs 144, 125 and 252, mean retailprices during 1999, respectively) are comparablewith only the most high-value marine species, andconsumption of commercial produce is low amongstlower income groups.
Figure 9 shows recent trends in the Colombomean annual retail price of tilapia and meat sub-stitutes with percentage increase calculated between1992 and 1998. During this period inflation averaged12.2% per year (Central Bank 1998), the equivalentof a 103% increase in price over the seven years.Price increases in most of these food commodities,including tilapia, have therefore merely kept pacewith inflation, maintaining approximate parity witheach other. The case of sardines is a notable excep-tion whose price rose and fell, further reflecting theinstability of the marine fish market. The seasonaland historical stability of the tilapia market suggeststhat despite fears of overexploitation of the fishery,the situation has not yet reached a critical state.
Figure 7. Mean monthly wholesale prices and standard deviations in weekly prices, for local and imported dried marine fishvarieties, Colombo Pettah fish market 1998–99 (ARTI 1998–99).
120
100
80
60
40
20
0
Mea
n pr
ice
(Rs/
kg)
Nov 98 Dec 98 Jan 99 Feb 99 Mar 99 Apr 99 May 99 Jun 99 Jul 99 Aug 99 Sep 99
Month
Local dried sardines Local dried tuna Imported dried sardines Imported dried tuna
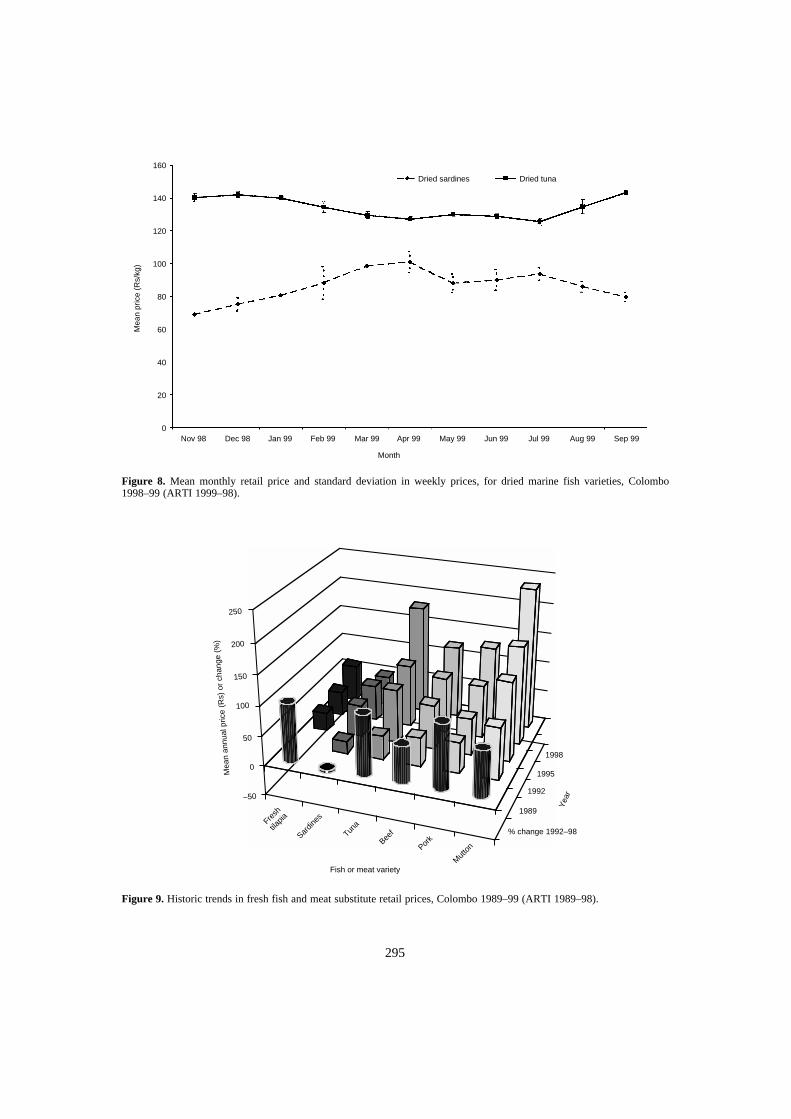
295
Figure 8. Mean monthly retail price and standard deviation in weekly prices, for dried marine fish varieties, Colombo1998–99 (ARTI 1999–98).
Figure 9. Historic trends in fresh fish and meat substitute retail prices, Colombo 1989–99 (ARTI 1989–98).
160
140
120
100
80
60
40
20
0
Mea
n pr
ice
(Rs/
kg)
Nov 98 Dec 98 Jan 99 Feb 99 Mar 99 Apr 99 May 99 Jun 99 Jul 99 Aug 99 Sep 99
Month
Dried sardines Dried tuna
250
200
150
100
50
0
–50
Mea
n an
nual
pric
e (R
s) o
r ch
ange
(%
)
Fresh
tilapia
Sardin
es
Tuna
Beef
Pork
Mut
ton
1998
1995
1992
1989
% change 1992–98
Yea
r
Fish or meat variety
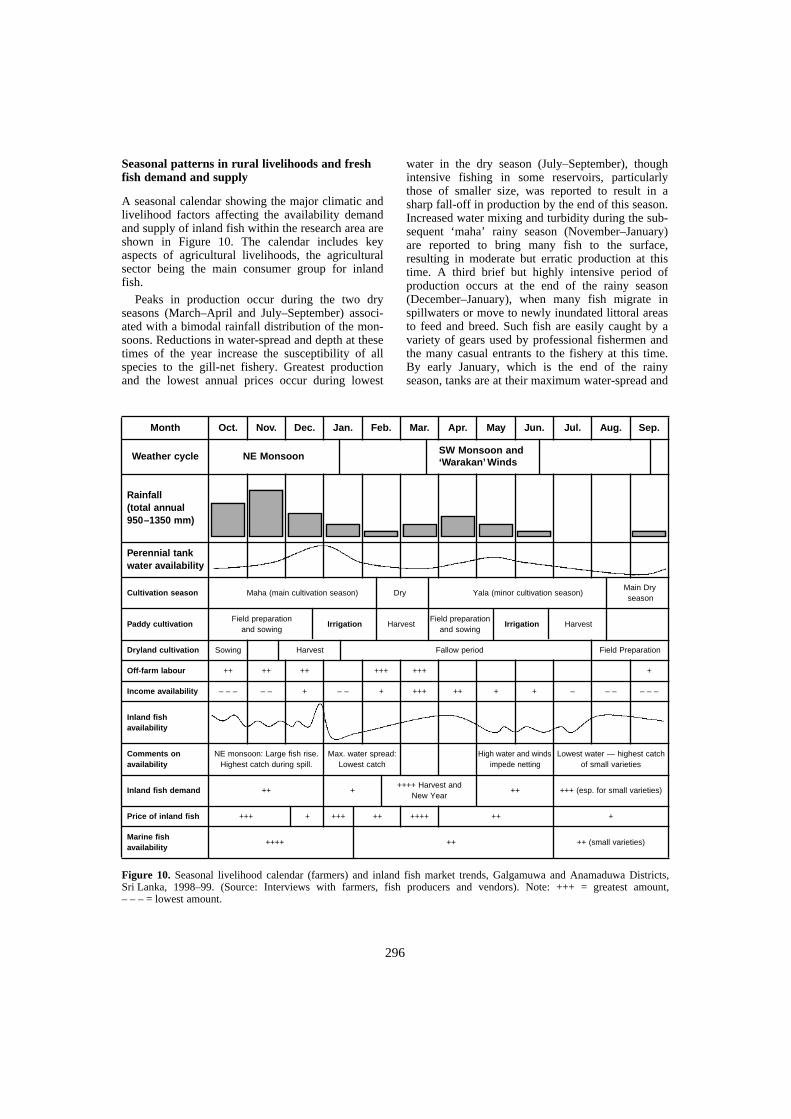
296
Seasonal patterns in rural livelihoods and fresh fish demand and supply
A seasonal calendar showing the major climatic andlivelihood factors affecting the availability demandand supply of inland fish within the research area areshown in Figure 10. The calendar includes keyaspects of agricultural livelihoods, the agriculturalsector being the main consumer group for inlandfish.
Peaks in production occur during the two dryseasons (March–April and July–September) associ-ated with a bimodal rainfall distribution of the mon-soons. Reductions in water-spread and depth at thesetimes of the year increase the susceptibility of allspecies to the gill-net fishery. Greatest productionand the lowest annual prices occur during lowest
water in the dry season (July–September), thoughintensive fishing in some reservoirs, particularlythose of smaller size, was reported to result in asharp fall-off in production by the end of this season.Increased water mixing and turbidity during the sub-sequent ‘maha’ rainy season (November–January)are reported to bring many fish to the surface,resulting in moderate but erratic production at thistime. A third brief but highly intensive period ofproduction occurs at the end of the rainy season(December–January), when many fish migrate inspillwaters or move to newly inundated littoral areasto feed and breed. Such fish are easily caught by avariety of gears used by professional fishermen andthe many casual entrants to the fishery at this time.By early January, which is the end of the rainyseason, tanks are at their maximum water-spread and
Figure 10. Seasonal livelihood calendar (farmers) and inland fish market trends, Galgamuwa and Anamaduwa Districts,Sri Lanka, 1998–99. (Source: Interviews with farmers, fish producers and vendors). Note: +++ = greatest amount,– – – = lowest amount.
Month Oct. Nov. Dec. Jan. Feb. Mar. Apr. May Jun. Jul. Aug. Sep.
Weather cycleSW Monsoon and
NE Monsoon‘Warakan’ Winds
Rainfall (total annual 950–1350 mm)
Perennial tank water availability
Cultivation seasonMain Dry
Maha (main cultivation season) Dry Yala (minor cultivation season)season
Paddy cultivationField preparation Field preparation
Irrigation Harvest Irrigation Harvestand sowing and sowing
Dryland cultivation Sowing Harvest Fallow period Field Preparation
Off-farm labour ++ ++ ++ +++ +++ +
Income availability – – – – – + – – + +++ ++ + + – – – – – –
Inland fish availability
Comments on availability
NE monsoon: Large fish rise.Highest catch during spill.
Max. water spread:Lowest catch
High water and winds impede netting
Lowest water — highest catch of small varieties
Inland fish demand ++++++ Harvest and
+New Year
++ +++ (esp. for small varieties)
Price of inland fish +++ + +++ ++ ++++ ++ +
Marine fish availability
++++ ++ ++ (small varieties)

297
depth, and production briefly falls to a seasonal lowand prices rise (January–February). However, highirrigation demands and low rainfall during thisperiod rapidly deplete water levels, allowing asecondary minor peak in production (March–April).
The minor SW monsoon (March to May) bringsmuch lower and highly erratic rainfall. However,reduced irrigation demands during the minor cultiva-tion season results in a slower rate of water depletionrelative to the maha season. During the same periodseasonal winds blow, impeding fishing. The combi-nation of these factors means that moderate thoughvariable production is maintained during this period(May–July).
Seasonal patterns in species composition
Seasonal variations also exist in the species composi-tion of fish production. Bottom-feeding common carpare most susceptible to the gill-net fishery during thedry season, during which time a small number offishermen specialise in this fishery using larger netsizes (up to 10″). However, most production is inci-dental through entanglement in the smaller gears (31⁄2″to 21⁄2″) used to target a range of tilapia sizes. Smalleramounts of large common carp are also caught duringthe rainy season when they move to the surface.Catches of other stocked exotic carps are extremelylow. Whether the continued catches of common carpare due to some breeding success (specimens <1kgwere occasionally observed) or limited stockingactivities requires further clarification.
Many fishermen resort to smaller mesh sizes (wellbelow the legal 31⁄2″ stretched mesh size) as the dryseason progresses, targeting not only small tilapiasbut many indigenous species including a variety ofminor cyprinids. Nets as small as 3⁄4″ are used toharvest the so-called ‘tank sardine’ A. melettinus atthis time. A secondary peak in the catch of manymigrating indigenous species takes place during tankspill events during November to January.
High-value snakehead (Channa striatus) is alsorelatively immune to the gill-net fishery until the dryseason when it becomes accessible to a variety ofgears. These predatory air breathers are highlyadapted to conditions in small seasonal tanks, wherethey are typically second in volume only to tilapiaproduction within subsistence fisheries, representinga possible niche production area within this fishery.
Despite the marked seasonal variation in inlandproduction described above, complementary varia-tion in other agricultural livelihood factors serves toensure that supply and demand are well matched andprices remain relatively constant throughout the year.Greatest demand for fresh fish occurs during themain (maha) harvesting period (February–April)
corresponding with the minor dry season peak inproduction. Farming incomes are highest andseasonal agricultural labourers are traditionally fedfish by their employees during this period. Onlyduring the Sinhala New Year celebrations do pricesincrease briefly to their annual high as demandsurges for 1–2 weeks. Greatest availability andlowest prices occur during the dry season whenpoorer farmers face the greatest difficulty achievingbasic food security. Small tilapias are so plentifuland prices so low at this point that many poorerfarmers reported that they substitute them forvegetables, which increase in price during the dryseason. This observation underlines the truly lowcost of inland fish and their importance to lowerwealth groups. Marine fish availability is greatestand prices lowest during main rainy season (Octoberto January) when the ‘Warakan’ ceases to blow,complementing the modest availability of inland fishat this time.
The marketing network
Figure 11 shows the principal marketing channels forinland fish within the research area. Most commercialproduction is undertaken by a large number of small-scale professional fishermen who land their catch atdispersed points around larger perennial reservoirs.Most professional fishing is carried out at night, withstocks being maintained alive in small wire keep-cages or partially flooded canoes. Vendors collectthese fish at first light to take advantage of the coolerearlier hours to transport their stock as fresh aspossible to the consumer. Most selling is completedby midday. During periods of increased productionsmaller secondary catches are distributed later in theday. Although professional fishermen were rarelyfound to retail their catch direct to the consumer,casual fishermen using hooks and cast-nets often sellsmaller catches (particularly lower-volume, high-value species such as snakehead and eels along theroadside close to the source of production. Fish aresold almost exclusively by weight during the earlypart of the day. From mid-afternoon as retail oppor-tunities decrease, surplus fish are likely to be sold atdiscounted rates. Secondary catches including thoseof casual fishermen made later in the day are gener-ally sold as ‘strings’ of fish sorted by size and sold byapproximate weight at favourable rates to the con-sumer, to ensure speedy sales.
Rural population levels within the research areasare high though widely dispersed within villages andsmall rural service centres. Densities in Puttalam andKurunegala Districts averaged some 328 and 227persons/km2 respectively in 1997, having almostdoubled over the last two decades (Central Bank
298
1998). Consequently out-with the dry season, fishsupply is well matched by demand from the localpopulation, even in the case of Rajangana andInginimitiya, two of the largest fisheries investigated.To meet this demand which is predominantly forwhole fresh fish, most retail distribution is under-taken on a low-volume, door-to-door basis, by a largenumber of small-scale 2-wheeler vendors sellingaround their home areas. These vendors are able toreach even the remotest villages investigated, someaccessible only by path or track. The great majorityof vendors use bicycles, distributing 5–50 kg of fishper day (typically 10–20 kg) while a smaller numberof motorbikes retail or wholesale as much as 150 kgper day (typically 30–50 kg), volumes depending onthe season.
Within the retail sector, primary and secondary net-works of 2-wheeler vendors exist. Vendors within theprimary networks purchase fish directly from landingsites distributing their stock to consumers close tosource, while secondary networks are supplied by alarge number of mostly small-scale wholesalers. Thesecondary retail sector operates at a wider marketspace beginning from as little as 3–4 km from thelanding site and extending up to 87 km in the case ofthe Rajangana fishery. The boundary between the twomarket spaces is largely a function of bicycle journeytime from production sources rather than distance persocioeconomic and is demarcated by a differential inretail prices. The boundary, along with the location ofminor wholesale points, moves further from produc-tion sites, becoming less well-defined during periodsof peak production. Bicycle vendors were found totravel to sites as far as 36 km distant from their sourceof supply when fish availability, the number ofentrants and individual volumes are greatest duringthe dry season, resulting in increased competition tofind market share.
Shorter distances, typically 4–20 km from source,are covered during the low season. Strategic sellingpoints at busy road junctions are used as wholesalestaging points for supply of fish to the secondarynetworks. These are also important retail points intheir own right, particularly those located within orclose to rural towns. The most strategic junctions arehighly coveted and cartels of small traders oftencontrol the movement of fish through these nodes.These wholesaler/retailers either collect fish directlyfrom landing points themselves or are supplied byother vendors. Wholesale supply is both by motor-cycle and bicycle to junction sites up to 4–5 kmfrom the landing sites visited and increasinglymotorbikes alone thereafter. In the unlikely instancethat junction vendors have not sold all their stock bymidday, they will soon after sell it in situ at a dis-count rate or more rarely transport it into villages
themselves. Considerable flexibility therefore existsfor actors to adjust their marketing strategies bymovement between the various wholesale and retailfunctions as seasonal demand and supply dictates.
The low-volume local marketing patternsdescribed and the excellent transport qualities oftilapias, which constitute the bulk of production dis-tributed by 2-wheeler vendors in villages, mean thatother than for larger seasonal truck and van whole-salers, there is no requirement for icing during trans-port. The high durability of tilapia meant they werecommonly observed arriving alive at the point of saleeven within secondary 2-wheeler networks. Thismeans operational costs are kept down to just thecost of stock and bicycle maintenance for thesmallest traders. Low capital requirements and thedispersed nature of the market and hence competi-tion facilitate casual entry into and out of the sector.Many marginal farmers, sharecroppers and landlesslabourers take advantage of these factors to diversifytheir livelihood strategies by retailing fish for severalmonths during the dry season, returning to agricul-ture shortly thereafter to commence cultivation withthe onset of the rains.
Only during the dry season (July–September)when sufficient production surpluses exist andseasonal prices are lowest do larger wholesalers withvans and trucks enter the network on a regular basis.The availability of these surpluses also coincideswith the marine low season (see Figure 10) creatinggreater demand for inland fish in larger rural townsand interestingly, also in coastal areas. Only thelargest reservoirs studied, Rajangana, Inginimitiyaand Kalawewas, where sufficient stock can rapidlybe assembled to fill a truck or van, are visited con-sistently in this manner (on average 3–4 times perweek). From Rajangana lorries take upwards of1000 kg of fish per visit for distribution to ruraltowns up to 87 km including Puttalam and Chillaw,important marine landing centres in their own right.Smaller amounts of fish are also taken to secondarydistribution points and roadside stalls on route tothese markets. Very little of this production finds itsway to the largest regional urban markets aroundKandy and Colombo due to low demand and theinability of low-value inland species to bear long-distance refrigerated transport costs. The inland pro-duce which does find its way to these markets islikely to originate from a few large reservoirs on thearterial routes between these cities and principalmarine fish landing sites, including Kantale Reser-voir close to Trincomalee on the east coast andMinneriya Reservoir, midway between Kandy andTrincomalee (see Figure 1). Surprisingly, little inlandproduction finds its way into the hotels andrestaurants within the rural areas investigated, such
299
establishments being frequented most regularly byhauliers and travellers in transit between towns, whogenerally prefer marine varieties.
Although high demand for dried fish (inland andmarine) was identified, little is produced within thestudy area due to the greater profits to be made fromselling fresh fish. Main outlets for dried fish arevillage and town boutiques (general stores) and theweekly agricultural fair or ‘polas’ held in most smallrural towns. Specialised traders who wholesale fishto boutiques and move between polas where theyboth retail and wholesale stock are responsible forthe bulk of supply. They bring mostly importedmarine varieties from Colombo and lesser amountsof local produce from coastal locations on theirtransit routes. In addition to these retailer/whole-salers who dominate the central covered marketareas, a large number of small-scale ground tradersretailing locally produced dried fish operate in theperiphery. These traders specialise in small low-costvarieties, mostly marine, usually self-produced orpurchased at source. Entry into this section of themarket is highly seasonal with the number ofvendors (including many female participants) sellinginland fish (mostly small to medium-sized tilapias)and marine varieties rising during the dry season andmain rainy season respectively.
Estimates of the number of participants in thelargest reservoirs varied widely (400–800 full-timefishermen in the case of Rajangana). For the smallerUsgala Siyambalangamuwa (788 ha — see Figure 1)Reservoir it was possible to determine the number ofparticipants more accurately by visiting all thelanding sites. In this case there were 39 canoes oper-ated by 63 professional fishermen, approximately130 participants mostly fishing smaller gill-nets inshallow littoral areas, in addition to an undeterminednumber of casual seasonal participants (i.e. 1 canoeper 20 ha and approximately one full-time fishermanper 3.7 ha). For much of the year the ratio of vendorsto fishermen in the primary network is 1:1 or infavour of the fishermen creating competition amongthe vendors for reliable suppliers. During peak pro-duction in the dry season, many seasonal vendorsenter the network around Rajangana, increasing theration to 2–3:1. The number of participants in thesecondary retail networks also rises at this time.
Market intervention and relational aspects in marketing networks
The network outlined above can be contrasted withthat for marine fish where the limiting consignmentsize is usually a lorry or van (required to take fish todistant markets in urban areas). In the inlandnetworks investigated, it is typically a bicycle or
motorbike. The stages at each end of both networksare characterised by high inputs of labour and lowinputs of capital, but only the central ‘bulking’ phaseof the marine network offers the opportunity formajor scale economies and consequently dominationby middlemen who exploit them. Such middlemen or‘malu mudalali’ often act as trader/financiers, guar-anteeing themselves assured supplies and favourablefuture prices through the monopolistic supply ofshort-term production and personal capital. Althoughsuch relationships range from the exploitative tosymbiotic depending on the local marketing context,experience in many developing countries (wherecapital is generally scarce) has shown that it isalmost impossible to replace the range of servicesprovided, at the same price, by institutional means(Lawson 1988).
Within the inland sector under investigation,producers operate in a seller’s market for much ofthe year and competition exists among professional2-wheeler vendors to find producers who will offerguaranteed supplies and extend regular short-termcredit in the form of advances of fish stock. Thisinvolves a reciprocal commitment on the part of the2-wheeler vendors to conform to the seasonal pro-duction strategies of their client fishermen. Manyvendors cement their relationship further by offeringseasonal credit to fishermen, who have greaterrecurrent operating costs, for replacement of fishinggears. The exact nature and duration of such relation-ships showed considerable variation, the longestrecorded having lasted eight years, but moretypically only 1–2 seasons, often dissolving duringthe dry season when surpluses temporarily create abuyer’s market favouring the vendor. The highnumber of mostly youthful seasonal entrants tosmall-scale trading networks relative to the morestatic production base serves to enhance such flux.Only in Kalawewas (2858 ha), the largest single res-ervoir investigated, were significant numbers offishermen aligned to larger traders. In such instancesproducers accepted a small drop in price butbenefited through the year-round availability ofcredit, a generally more secure trading relationship,including avoidance of the risk of credit extension bythemselves. The availability of credit during the lowseason (when small-scale vendors are least able toprovide a supply) is particularly important ininstances where fishermen have no secondary agri-cultural income. In the presence of abundant compe-tition from the small-scale vending sector, suchrelationships were generally equitable with only a Rs2–3/kg (10–12%) difference in the prices received byproducers from 2-wheeler vendors and financiertraders. By contrast much more exploitative tiedmarketing relationships exist between ‘malu
300
mudalali’ and producers as typical of the marinesector (Alexander 1995; Munasinghe 1984), fosteredby the capital requirements for product bulking,greater producer overheads, the more seasonal natureof the fishery and lack of livelihood diversificationby most participants in the fishery.
In a study of two reservoir fisheries in HambantotaDistrict, southern region, Chandrasoma (1986)describes a market situation within the inland sectorwhich contrasts markedly with that in our study areasto the northwest. There he observed tied monopsonicmarketing relationships and poor terms of trade thatwere more comparable with the marine sector due tothe greater number of wholesale traders and assem-blers dominating the market. The difference may beattributable to the less favourable marketing con-ditions vis a vis the greater availability, lower cost anddemand for marine fish in the locations studied(which were close to the coast) and the lower inlandrural population densities in the southeast, and con-sequently a greater requirement to transport fish tomore distant inland markets.
Credit relationships also exist between vendorsand consumers, particularly where longer-term pro-fessional vendors are concerned. Such credit is shortterm, commonly lasting for less than one week,though up to a month in the case of salaried govern-ment officials who represent a low credit risk.
Participation of different socioeconomic groups
Early exploitation of the tilapia fishery from itsinception in the 1950s was mostly by low-castecoastal fishermen. Mostly Christians, of Sinhaleseand Tamil ethnicity, these fishermen seized theopportunity to augment their catches throughseasonal migrations to inland water bodies during themarine low seasons until increasing cultural andethnic tensions with Christian settlers saw a virtualtermination to migration by the mid-1970s. However,many Christian fishermen remained as permanentlyencroached settlers around larger perennial tanks.Three such Christian villages around Rajangana tankrepresent some of the poorest communities in thearea, having had no opportunity to legalise their landafter 20 years of occupation, and consequently littleopportunity to diversify their livelihoods.
As in many Asian cultures, fishing and its relatedactivities are perceived as low-caste activities and inBuddhist Sri Lanka it is often described as ‘pitywork’ by members of the upper (majority) farmercaste. However, as ‘second generation problems’associated with irrigation developments have pro-gressively reduced access to productive agriculturalland, increasing numbers of younger participantsfrom the farming caste have become involved in all
levels of the marketing network to supplement theiragricultural income.
Although women have a variety of well-developed production roles with the agriculturalsector, the entire marketing chain for inland fish asportrayed in Figure 11 is dominated by male actors.Only the preparation and retailing of small dried‘trash’ species currently offer significant potentialfor women’s independent participation within theinland areas under study. Here social taboos stillpresent a formidable barrier, most of the participantsinterviewed being single or widowed women, fromlandless families, or travelling from coastal areaswhere women from lower-caste backgrounds havegreater freedom to participate in a wider range offisheries-related activities.
Marketing margins for network actors
Table 1 shows the price ranges and marketingmargins earned by intermediaries at the various levelsof the market network, for the main commercialinland species, forms and sizes within Galgamuwaand Anamaduwa Divisional Secretariats (seeFigure 1). Seasonal ranges in price are identified foreach species/form at different levels of the network.
Tilapia, the principal commercial species, ispriced within small (<75 g) medium (75–175 g) andlarge (>175 g) size categories, the largest fish costing50% more per unit weight than the smallest at theretail level. This has important consequences forpatterns of consumption within different socio-economic strata as discussed below. Etroplus surat-ensis (green chromid, like tilapia, a cichlid) is abrackishwater species, and has become successfullyestablished in the freshwater fishery at a low thoughsteady production level. Sharing similar consumptioncharacteristics and growing to a modest size (mostly<200 g), its market performance is almost identicalto the small and medium tilapia size classes, withwhich mixed sales are often made. The highest-valuespecies are the predatory air-breathers, Channastriatus (snakehead) and several eel species (seefootnotes Table 1). The latter commands a nichemarket amongst Muslim consumers, while theformer is almost universally acclaimed as thechoicest inland variety due to its superior taste, lackof bones, good handling qualities and the attributionof various medicinal properties. A variety of othermostly small indigenous species (SISs — see foot-notes Table 1) make low-volume seasonal entriesinto the fisheries at the low end of the price range.Common carp almost exclusively available in largersizes (>2 kg) with low and erratic availabilityachieves an almost identical market performance tothe large tilapia category.
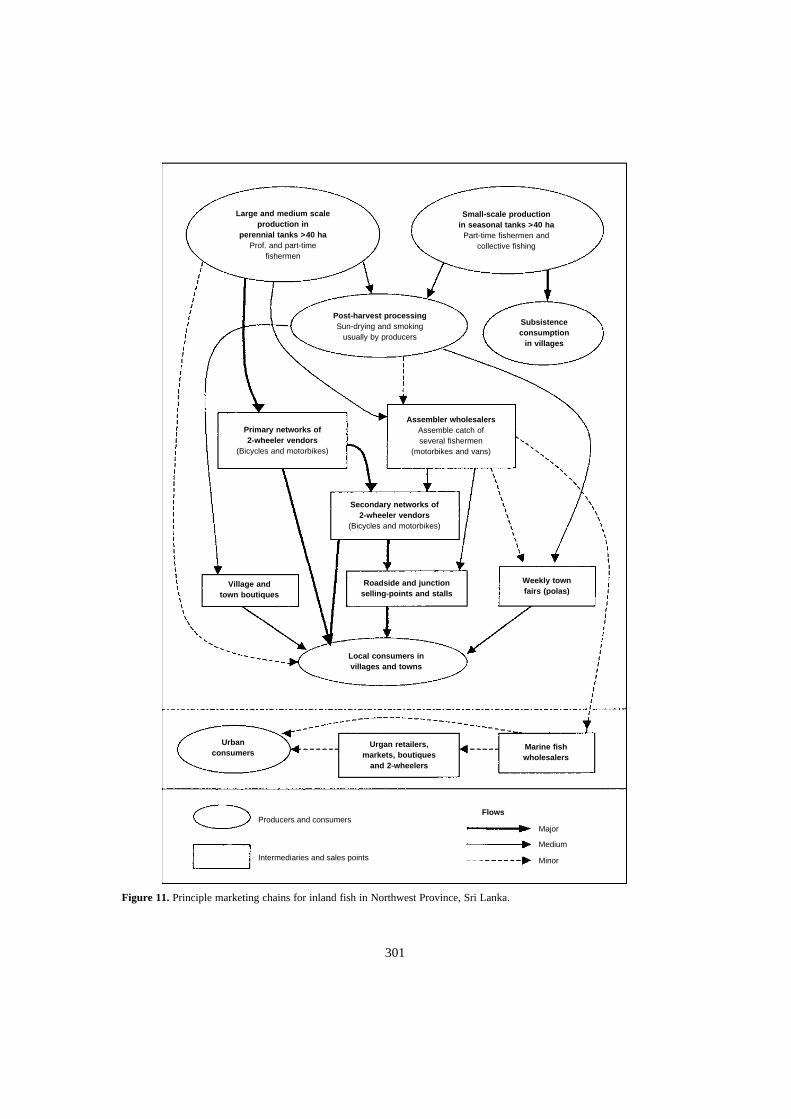
301
Figure 11. Principle marketing chains for inland fish in Northwest Province, Sri Lanka.
Large and medium scaleproduction in
perennial tanks >40 haProf. and part-time
fishermen
Small-scale productionin seasonal tanks >40 ha
Part-time fishermen andcollective fishing
Post-harvest processingSun-drying and smoking
usually by producers
Subsistenceconsumption
in villages
Primary networks of2-wheeler vendors
(Bicycles and motorbikes)
Assembler wholesalersAssemble catch ofseveral fishermen
(motorbikes and vans)
Secondary networks of2-wheeler vendors
(Bicycles and motorbikes)
Village andtown boutiques
Roadside and junctionselling-points and stalls
Weekly townfairs (polas)
Local consumers invillages and towns
Urbanconsumers
Urgan retailers,markets, boutiques
and 2-wheelers
Marine fishwholesalers
Producers and consumers
Intermediaries and sales points
Major
Medium
Minor
Flows
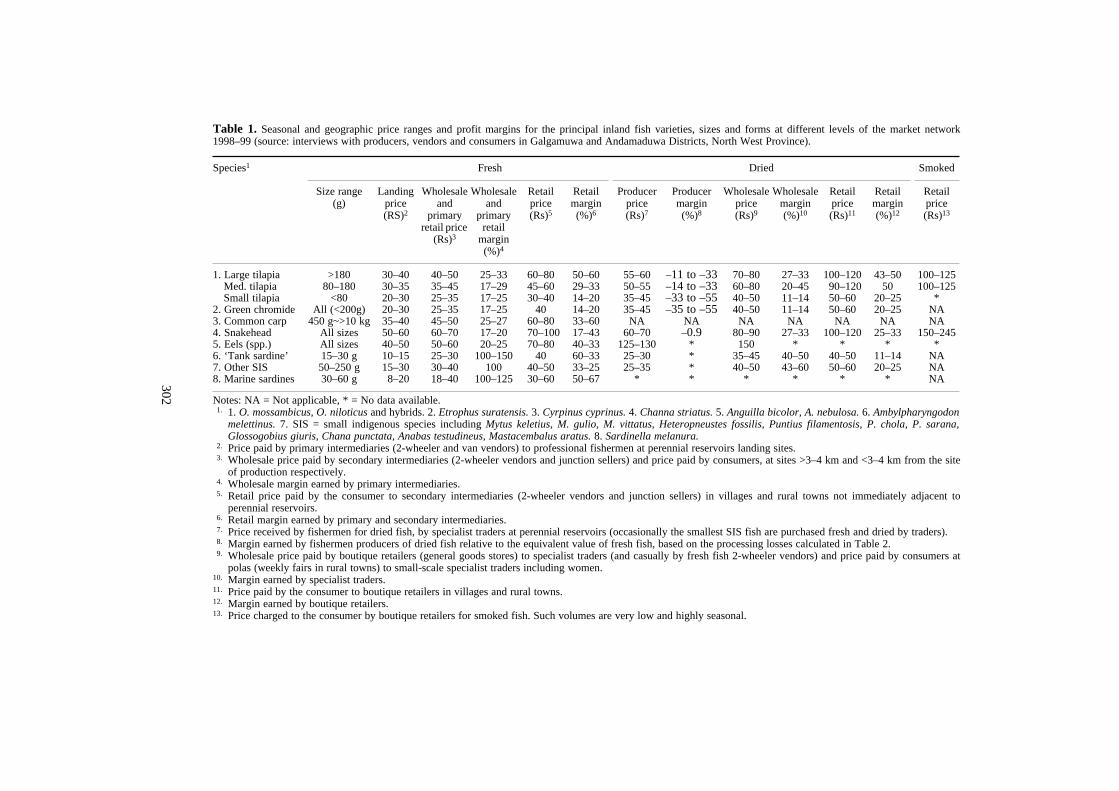
302 Notes: NA = Not applicable, * = No data available.1. 1. O. mossambicus, O. niloticus and hybrids. 2. Etrophus suratensis. 3. Cyrpinus cyprinus. 4. Channa striatus. 5. Anguilla bicolor, A. nebulosa. 6. Ambylpharyngodon
melettinus. 7. SIS = small indigenous species including Mytus keletius, M. gulio, M. vittatus, Heteropneustes fossilis, Puntius filamentosis, P. chola, P. sarana,Glossogobius giuris, Chana punctata, Anabas testudineus, Mastacembalus aratus. 8. Sardinella melanura.
2. Price paid by primary intermediaries (2-wheeler and van vendors) to professional fishermen at perennial reservoirs landing sites.3. Wholesale price paid by secondary intermediaries (2-wheeler vendors and junction sellers) and price paid by consumers, at sites >3–4 km and <3–4 km from the site
of production respectively.4. Wholesale margin earned by primary intermediaries.5. Retail price paid by the consumer to secondary intermediaries (2-wheeler vendors and junction sellers) in villages and rural towns not immediately adjacent to
perennial reservoirs.6. Retail margin earned by primary and secondary intermediaries.7. Price received by fishermen for dried fish, by specialist traders at perennial reservoirs (occasionally the smallest SIS fish are purchased fresh and dried by traders).8. Margin earned by fishermen producers of dried fish relative to the equivalent value of fresh fish, based on the processing losses calculated in Table 2.9. Wholesale price paid by boutique retailers (general goods stores) to specialist traders (and casually by fresh fish 2-wheeler vendors) and price paid by consumers at
polas (weekly fairs in rural towns) to small-scale specialist traders including women.10. Margin earned by specialist traders.11. Price paid by the consumer to boutique retailers in villages and rural towns.12. Margin earned by boutique retailers.13. Price charged to the consumer by boutique retailers for smoked fish. Such volumes are very low and highly seasonal.
Table 1. Seasonal and geographic price ranges and profit margins for the principal inland fish varieties, sizes and forms at different levels of the market network1998–99 (source: interviews with producers, vendors and consumers in Galgamuwa and Andamaduwa Districts, North West Province).
Species1 Fresh Dried Smoked
Size range(g)
Landing price(RS)2
Wholesale and
primary retail price
(Rs)3
Wholesale and
primary retail
margin (%)4
Retail price (Rs)5
Retail margin (%)6
Producer price (Rs)7
Producer margin(%)8
Wholesale price(Rs)9
Wholesale margin (%)10
Retail price(Rs)11
Retail margin (%)12
Retail price (Rs)13
1. Large tilapia >180 30–40 40–50 25–33 60–80 50–60 55–60 –11 to –33 70–80 27–33 100–120 43–50 100–125Med. tilapia 80–180 30–35 35–45 17–29 45–60 29–33 50–55 –14 to –33 60–80 20–45 90–120 50 100–125Small tilapia <80 20–30 25–35 17–25 30–40 14–20 35–45 –33 to –55 40–50 11–14 50–60 20–25 *
2. Green chromide All (<200g) 20–30 25–35 17–25 40 14–20 35–45 –35 to –55 40–50 11–14 50–60 20–25 NA3. Common carp 450 g~>10 kg 35–40 45–50 25–27 60–80 33–60 NA NA NA NA NA NA NA4. Snakehead All sizes 50–60 60–70 17–20 70–100 17–43 60–70 –0.9 80–90 27–33 100–120 25–33 150–2455. Eels (spp.) All sizes 40–50 50–60 20–25 70–80 40–33 125–130 * 150 * * * *6. ‘Tank sardine’ 15–30 g 10–15 25–30 100–150 40 60–33 25–30 * 35–45 40–50 40–50 11–14 NA7. Other SIS 50–250 g 15–30 30–40 100 40–50 33–25 25–35 * 40–50 43–60 50–60 20–25 NA8. Marine sardines 30–60 g 8–20 18–40 100–125 30–60 50–67 * * * * * * NA
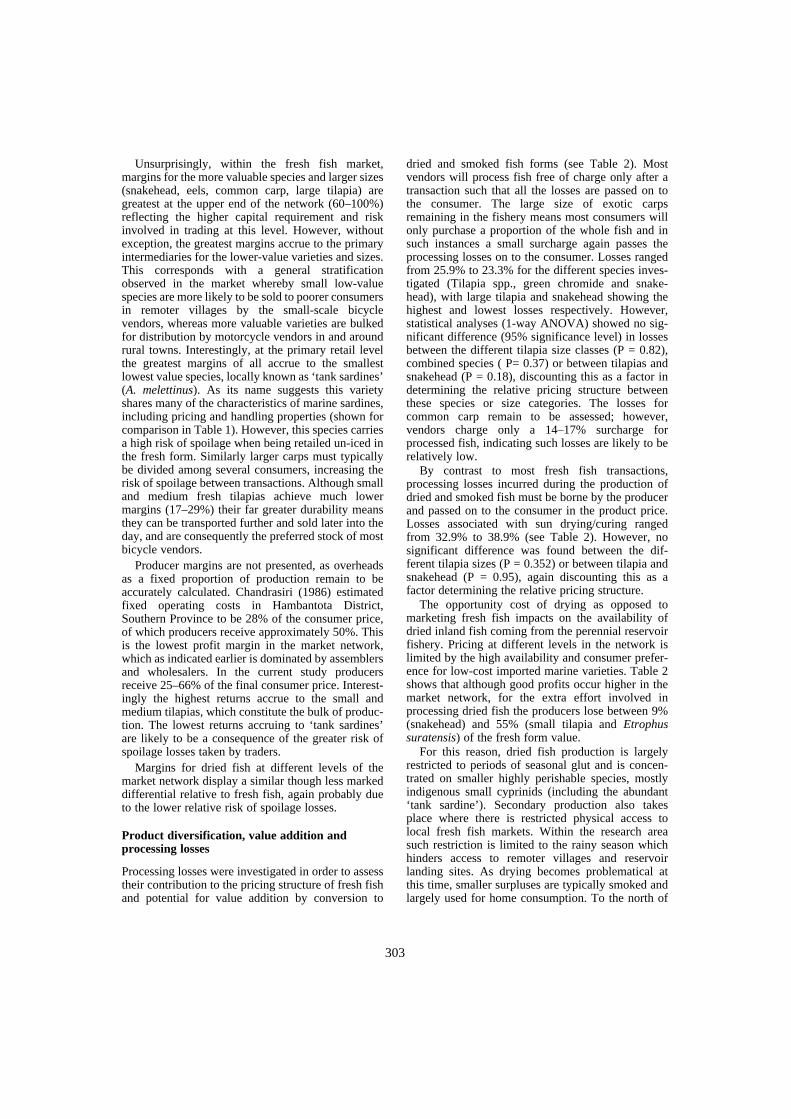
303
Unsurprisingly, within the fresh fish market,margins for the more valuable species and larger sizes(snakehead, eels, common carp, large tilapia) aregreatest at the upper end of the network (60–100%)reflecting the higher capital requirement and riskinvolved in trading at this level. However, withoutexception, the greatest margins accrue to the primaryintermediaries for the lower-value varieties and sizes.This corresponds with a general stratificationobserved in the market whereby small low-valuespecies are more likely to be sold to poorer consumersin remoter villages by the small-scale bicyclevendors, whereas more valuable varieties are bulkedfor distribution by motorcycle vendors in and aroundrural towns. Interestingly, at the primary retail levelthe greatest margins of all accrue to the smallestlowest value species, locally known as ‘tank sardines’(A. melettinus). As its name suggests this varietyshares many of the characteristics of marine sardines,including pricing and handling properties (shown forcomparison in Table 1). However, this species carriesa high risk of spoilage when being retailed un-iced inthe fresh form. Similarly larger carps must typicallybe divided among several consumers, increasing therisk of spoilage between transactions. Although smalland medium fresh tilapias achieve much lowermargins (17–29%) their far greater durability meansthey can be transported further and sold later into theday, and are consequently the preferred stock of mostbicycle vendors.
Producer margins are not presented, as overheadsas a fixed proportion of production remain to beaccurately calculated. Chandrasiri (1986) estimatedfixed operating costs in Hambantota District,Southern Province to be 28% of the consumer price,of which producers receive approximately 50%. Thisis the lowest profit margin in the market network,which as indicated earlier is dominated by assemblersand wholesalers. In the current study producersreceive 25–66% of the final consumer price. Interest-ingly the highest returns accrue to the small andmedium tilapias, which constitute the bulk of produc-tion. The lowest returns accruing to ‘tank sardines’are likely to be a consequence of the greater risk ofspoilage losses taken by traders.
Margins for dried fish at different levels of themarket network display a similar though less markeddifferential relative to fresh fish, again probably dueto the lower relative risk of spoilage losses.
Product diversification, value addition and processing losses
Processing losses were investigated in order to assesstheir contribution to the pricing structure of fresh fishand potential for value addition by conversion to
dried and smoked fish forms (see Table 2). Mostvendors will process fish free of charge only after atransaction such that all the losses are passed on tothe consumer. The large size of exotic carpsremaining in the fishery means most consumers willonly purchase a proportion of the whole fish and insuch instances a small surcharge again passes theprocessing losses on to the consumer. Losses rangedfrom 25.9% to 23.3% for the different species inves-tigated (Tilapia spp., green chromide and snake-head), with large tilapia and snakehead showing thehighest and lowest losses respectively. However,statistical analyses (1-way ANOVA) showed no sig-nificant difference (95% significance level) in lossesbetween the different tilapia size classes (P = 0.82),combined species ( P= 0.37) or between tilapias andsnakehead (P = 0.18), discounting this as a factor indetermining the relative pricing structure betweenthese species or size categories. The losses forcommon carp remain to be assessed; however,vendors charge only a 14–17% surcharge forprocessed fish, indicating such losses are likely to berelatively low.
By contrast to most fresh fish transactions,processing losses incurred during the production ofdried and smoked fish must be borne by the producerand passed on to the consumer in the product price.Losses associated with sun drying/curing rangedfrom 32.9% to 38.9% (see Table 2). However, nosignificant difference was found between the dif-ferent tilapia sizes (P = 0.352) or between tilapia andsnakehead (P = 0.95), again discounting this as afactor determining the relative pricing structure.
The opportunity cost of drying as opposed tomarketing fresh fish impacts on the availability ofdried inland fish coming from the perennial reservoirfishery. Pricing at different levels in the network islimited by the high availability and consumer prefer-ence for low-cost imported marine varieties. Table 2shows that although good profits occur higher in themarket network, for the extra effort involved inprocessing dried fish the producers lose between 9%(snakehead) and 55% (small tilapia and Etrophussuratensis) of the fresh form value.
For this reason, dried fish production is largelyrestricted to periods of seasonal glut and is concen-trated on smaller highly perishable species, mostlyindigenous small cyprinids (including the abundant‘tank sardine’). Secondary production also takesplace where there is restricted physical access tolocal fresh fish markets. Within the research areasuch restriction is limited to the rainy season whichhinders access to remoter villages and reservoirlanding sites. As drying becomes problematical atthis time, smaller surpluses are typically smoked andlargely used for home consumption. To the north of
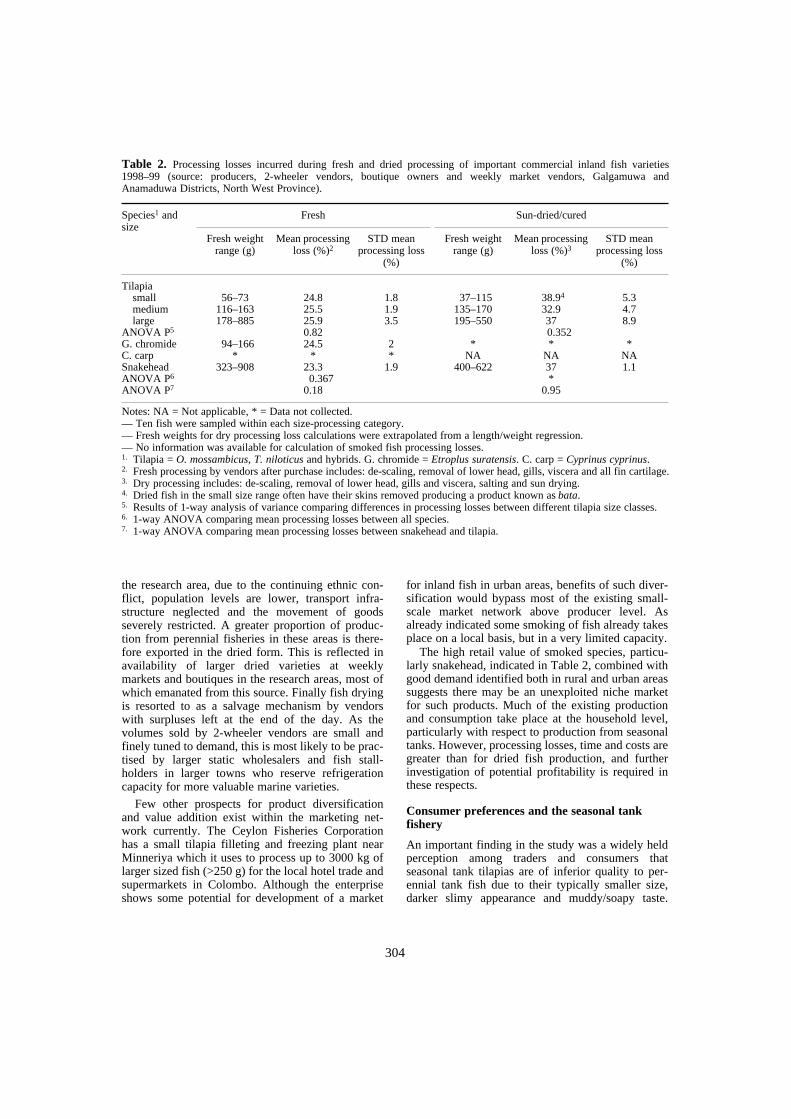
304
the research area, due to the continuing ethnic con-flict, population levels are lower, transport infra-structure neglected and the movement of goodsseverely restricted. A greater proportion of produc-tion from perennial fisheries in these areas is there-fore exported in the dried form. This is reflected inavailability of larger dried varieties at weeklymarkets and boutiques in the research areas, most ofwhich emanated from this source. Finally fish dryingis resorted to as a salvage mechanism by vendorswith surpluses left at the end of the day. As thevolumes sold by 2-wheeler vendors are small andfinely tuned to demand, this is most likely to be prac-tised by larger static wholesalers and fish stall-holders in larger towns who reserve refrigerationcapacity for more valuable marine varieties.
Few other prospects for product diversificationand value addition exist within the marketing net-work currently. The Ceylon Fisheries Corporationhas a small tilapia filleting and freezing plant nearMinneriya which it uses to process up to 3000 kg oflarger sized fish (>250 g) for the local hotel trade andsupermarkets in Colombo. Although the enterpriseshows some potential for development of a market
for inland fish in urban areas, benefits of such diver-sification would bypass most of the existing small-scale market network above producer level. Asalready indicated some smoking of fish already takesplace on a local basis, but in a very limited capacity.
The high retail value of smoked species, particu-larly snakehead, indicated in Table 2, combined withgood demand identified both in rural and urban areassuggests there may be an unexploited niche marketfor such products. Much of the existing productionand consumption take place at the household level,particularly with respect to production from seasonaltanks. However, processing losses, time and costs aregreater than for dried fish production, and furtherinvestigation of potential profitability is required inthese respects.
Consumer preferences and the seasonal tank fishery
An important finding in the study was a widely heldperception among traders and consumers thatseasonal tank tilapias are of inferior quality to per-ennial tank fish due to their typically smaller size,darker slimy appearance and muddy/soapy taste.
Notes: NA = Not applicable, * = Data not collected.— Ten fish were sampled within each size-processing category.— Fresh weights for dry processing loss calculations were extrapolated from a length/weight regression.— No information was available for calculation of smoked fish processing losses.1. Tilapia = O. mossambicus, T. niloticus and hybrids. G. chromide = Etroplus suratensis. C. carp = Cyprinus cyprinus.2. Fresh processing by vendors after purchase includes: de-scaling, removal of lower head, gills, viscera and all fin cartilage.3. Dry processing includes: de-scaling, removal of lower head, gills and viscera, salting and sun drying.4. Dried fish in the small size range often have their skins removed producing a product known as bata.5. Results of 1-way analysis of variance comparing differences in processing losses between different tilapia size classes.6. 1-way ANOVA comparing mean processing losses between all species.7. 1-way ANOVA comparing mean processing losses between snakehead and tilapia.
Table 2. Processing losses incurred during fresh and dried processing of important commercial inland fish varieties1998–99 (source: producers, 2-wheeler vendors, boutique owners and weekly market vendors, Galgamuwa andAnamaduwa Districts, North West Province).
Species1 and size
Fresh Sun-dried/cured
Fresh weight range (g)
Mean processing loss (%)2
STD mean processing loss
(%)
Fresh weight range (g)
Mean processing loss (%)3
STD mean processing loss
(%)
Tilapiasmall 56–73 24.8 1.8 37–115 38.94 5.3medium 116–163 25.5 1.9 135–170 32.9 4.7large 178–885 25.9 3.5 195–550 37 8.9
ANOVA P5 0.82 0.352G. chromide 94–166 24.5 2 * * *C. carp * * * NA NA NASnakehead 323–908 23.3 1.9 400–622 37 1.1ANOVA P6 0.367 *ANOVA P7 0.18 0.95
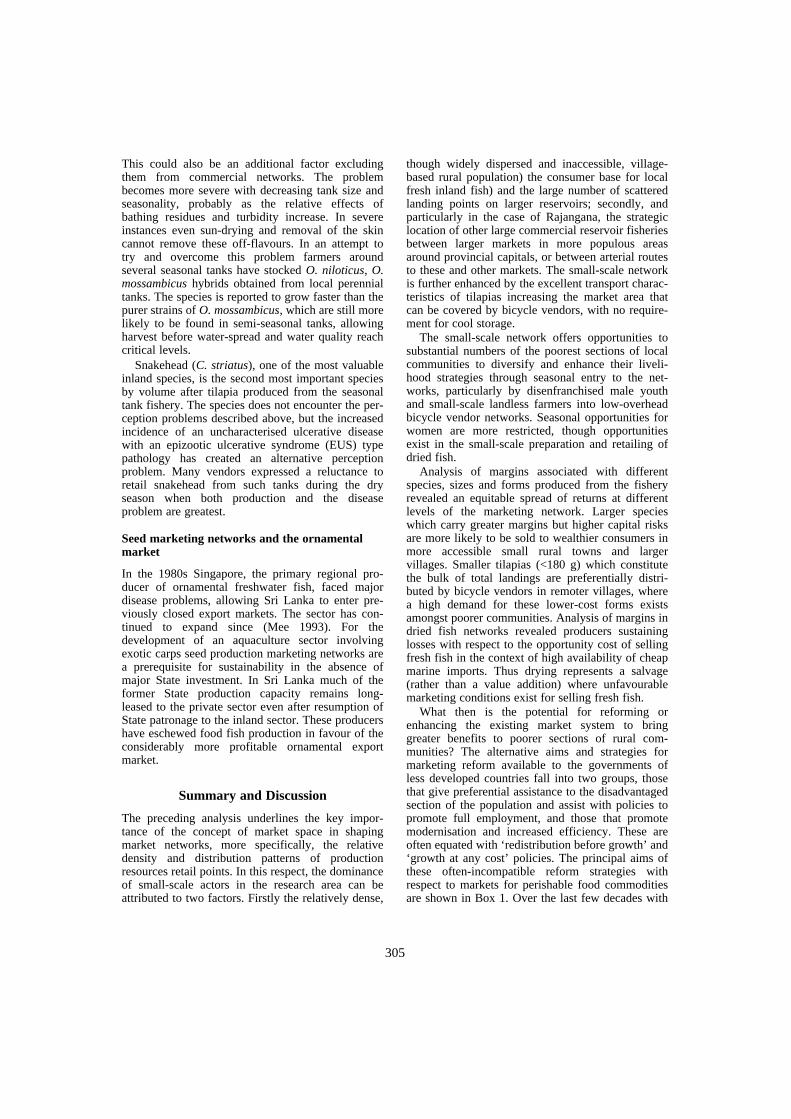
305
This could also be an additional factor excludingthem from commercial networks. The problembecomes more severe with decreasing tank size andseasonality, probably as the relative effects ofbathing residues and turbidity increase. In severeinstances even sun-drying and removal of the skincannot remove these off-flavours. In an attempt totry and overcome this problem farmers aroundseveral seasonal tanks have stocked O. niloticus, O.mossambicus hybrids obtained from local perennialtanks. The species is reported to grow faster than thepurer strains of O. mossambicus, which are still morelikely to be found in semi-seasonal tanks, allowingharvest before water-spread and water quality reachcritical levels.
Snakehead (C. striatus), one of the most valuableinland species, is the second most important speciesby volume after tilapia produced from the seasonaltank fishery. The species does not encounter the per-ception problems described above, but the increasedincidence of an uncharacterised ulcerative diseasewith an epizootic ulcerative syndrome (EUS) typepathology has created an alternative perceptionproblem. Many vendors expressed a reluctance toretail snakehead from such tanks during the dryseason when both production and the diseaseproblem are greatest.
Seed marketing networks and the ornamental market
In the 1980s Singapore, the primary regional pro-ducer of ornamental freshwater fish, faced majordisease problems, allowing Sri Lanka to enter pre-viously closed export markets. The sector has con-tinued to expand since (Mee 1993). For thedevelopment of an aquaculture sector involvingexotic carps seed production marketing networks area prerequisite for sustainability in the absence ofmajor State investment. In Sri Lanka much of theformer State production capacity remains long-leased to the private sector even after resumption ofState patronage to the inland sector. These producershave eschewed food fish production in favour of theconsiderably more profitable ornamental exportmarket.
Summary and Discussion
The preceding analysis underlines the key impor-tance of the concept of market space in shapingmarket networks, more specifically, the relativedensity and distribution patterns of productionresources retail points. In this respect, the dominanceof small-scale actors in the research area can beattributed to two factors. Firstly the relatively dense,
though widely dispersed and inaccessible, village-based rural population) the consumer base for localfresh inland fish) and the large number of scatteredlanding points on larger reservoirs; secondly, andparticularly in the case of Rajangana, the strategiclocation of other large commercial reservoir fisheriesbetween larger markets in more populous areasaround provincial capitals, or between arterial routesto these and other markets. The small-scale networkis further enhanced by the excellent transport charac-teristics of tilapias increasing the market area thatcan be covered by bicycle vendors, with no require-ment for cool storage.
The small-scale network offers opportunities tosubstantial numbers of the poorest sections of localcommunities to diversify and enhance their liveli-hood strategies through seasonal entry to the net-works, particularly by disenfranchised male youthand small-scale landless farmers into low-overheadbicycle vendor networks. Seasonal opportunities forwomen are more restricted, though opportunitiesexist in the small-scale preparation and retailing ofdried fish.
Analysis of margins associated with differentspecies, sizes and forms produced from the fisheryrevealed an equitable spread of returns at differentlevels of the marketing network. Larger specieswhich carry greater margins but higher capital risksare more likely to be sold to wealthier consumers inmore accessible small rural towns and largervillages. Smaller tilapias (<180 g) which constitutethe bulk of total landings are preferentially distri-buted by bicycle vendors in remoter villages, wherea high demand for these lower-cost forms existsamongst poorer communities. Analysis of margins indried fish networks revealed producers sustaininglosses with respect to the opportunity cost of sellingfresh fish in the context of high availability of cheapmarine imports. Thus drying represents a salvage(rather than a value addition) where unfavourablemarketing conditions exist for selling fresh fish.
What then is the potential for reforming orenhancing the existing market system to bringgreater benefits to poorer sections of rural com-munities? The alternative aims and strategies formarketing reform available to the governments ofless developed countries fall into two groups, thosethat give preferential assistance to the disadvantagedsection of the population and assist with policies topromote full employment, and those that promotemodernisation and increased efficiency. These areoften equated with ‘redistribution before growth’ and‘growth at any cost’ policies. The principal aims ofthese often-incompatible reform strategies withrespect to markets for perishable food commoditiesare shown in Box 1. Over the last few decades with
306
its transition from a centrally planned to a freemarket economy Sri Lanka has seen an acceleratedshift toward policies falling into the latter categoryand is now beginning to feel the full effects of globaltrade liberalisation on its agribusiness markets.These markets stand in sharp contrast to the marketdescribed above with respect to potential for the poorto benefit. Under the centrally planned economy,markets for agricultural produce were characterisedby high levels of input subsidies and guaranteedmarkets designed to encourage national self-reliancein production. Although liberalisation has beenaccompanied by increased production it has failed toprovide access to newly emerging markets for themajority of poorer farmers with small productionsurpluses. In many instances such farmers are insteadresorting to subsistence production strategies withincreased reliance on off-farm labour, while themeans of production become concentrated in anever-fewer number of hands (Kodithuwakku 1997).
The open and highly equitable nature of the inlandfish market described above, which delivers a freshhigh-quality product with little wastage, has broughtbenefits to a large number of small-scale producers,vendors and consumers alike in the absence of anysignificant government intervention or other institu-tional involvement. Few of the options outlined inBox 1 therefore have much relevance to the localsituation, many having been attempted over theyears, with little success but at great cost. This workhas also demonstrated little potential for smallertraders to benefit from product diversification, themost feasible option, drying, losing rather thanadding value.
Current government policy objectives as stated inthe most recent National Fisheries Plan 1995–2000(MOFARD 1995) require clarification and prioritis-ation. With respect to inland fisheries, they are toincrease sustainable production, generate employ-ment, uplift socioeconomic conditions among fishingcommunities, improve nutrition and increase foreignexchange earnings. To these ends, the governmenthas progressively moved away from direct fiscalsupport and provision of inputs, concentratinginstead on promoting private-sector development andfacilitating community-based initiatives in collabora-tion with NGOs.
Findings from this research indicate that policyshould be primarily people-focused and on localsocioeconomic conditions, rather than production-focused and on the national economy. Priority shouldtherefore be given to enhancing or simply sustainingthe existing marketing network while avoiding thenegative impacts of liberalisation as experienced inthe agricultural sector. This should incorporategreater consultation with primary stakeholders
involved in the sector, including the small-scaletrading components of the network, the dispersednature of which has made them particularly inacces-sible and hitherto overlooked. Production priorityshould be on promoting sustainable fishing practicesand developing the ability of fisheries societies inself-regulation of reservoir fisheries. The preferentialdemand by low-income groups for smaller low-valuetilapias must also be considered in this respect.
Perhaps because of the complexities involved inpromoting self-regulation, particularly around largerinstitutionally managed reservoirs, the focus of mostdevelopment organisations continues to be on pro-duction enhancement through stocking initiatives insmaller perennial reservoirs. In the absence of a sus-tainable private-sector or State fingerling productioncapacity, attempts have recently shifted tocommunity-based fingerling production based onexotic carps and O. niloticus. In the past the avail-ability of cheap, plentiful, highly popular and almostyear-round production from the tilapia capturefishery has all too often been an overlooked contrib-utory factor to the failure of attempts to establishinland culture fisheries based on carps. In this con-text, all but the most extensive options incurringlimited overheads are likely to struggle to remaineconomically viable.
This is particularly the case if the high opportunitycost for seed production of food fish species is con-sidered in the context of the highly lucrative exportmarket that exists for ornamental fish in Sri Lanka.Furthermore, large exotic carps also have poorertransport characteristics, and it is doubtful that theywould sustain their market price relative to tilapia inthe event of increased production.
Our work has also shown potential for productionfrom smaller semi-seasonal and seasonal tanks toenter commercial networks is severely restricted byconsumer perceptions regarding off-flavours anddisease, in addition to an unfavourable productioncycle with respect to seasonal pricing. Yet mostfarmers in rain-fed areas have access only to suchwater resources. It is therefore recommended thatgreater research and development focus should beplaced on enhancing subsistence options with greaterreliance on local resources. Such options would havegreatest relevance to poorer inland communities inthe remoter areas including upper watershed areasand conflict areas to the north and east. Conflict-affected communities are often deprived of alterna-tive off-farm labour opportunities, and preliminarywork suggests many farmers in these areas alreadyrely on a variety of self-caught small indigenousspecies for a large proportion of their daily proteinintake. Research in the current research area has alsoshown that participation in the seasonal tank fishery

307
increasingly provides subsistence options to dis-enfranchised and landless youth, often from a widesurrounding area with little formal access to waterresources. Innovative approaches are required toreach such target groups. Because of the importanceof hydrological linkages between seasonal tanks innatural fisheries recruitment and the resource accessby wider user groups, the watershed the naturalspace integrating such socioeconomic and hydro-logical functions, is the optimum scale to conductfuture research.
Box 1. General aims of market reform strategies(after Bromley 1971). Note several of theoptions may be incompatible with one ormore of the other aims.
Acknowledgments
The current study is part of a research project (DFIDproject R7064) funded by the Aquaculture ResearchProgram of the Department of International Develop-ment, UK. CARE Sri Lanka also provides generoussupport to the project. Yasanthe Naveratne, BandaraSamarakoon, Harsha Balasooriya and I.M. Gune-wardene are acknowledged for their assistance infieldwork.
References
Alexander, P. 1995. Sri Lankan Fishermen: Rural Capitalismand Peasant Society. Charles Subasinghe and Sons,Colombo.
ARTI 1998–99 Weekly Food Commodities Bulletin.Kobbekaduwa, H. ed. A publication of the food policydivision of the Agrarian Research and Training Institute(ARTI). 113 Wijerama Mawatha, Colombo.
Attapatu, A. 1994. The role of marketing development andfisheries cooperatives in improving socioeconomic con-ditions of small-scale fishermen. In: Socioeconomicissues in Coastal Fisheries Management. Proceedings ofthe IPFC symposium in conjunction with 24th sessionIPFC, Bangkok Thailand 23–26 Nov. 1993. FAO Indo-Pacific Fisheries Comm. 281–286.
Amarasinghe, U.S. 1998a. The role of fishermen in imple-menting management strategies in the reservoirs of SriLanka. In: De Silva, S.S. ed. Reservoir Fishery Manage-ment and Development in Asia. Proceedings of a work-shop held in Kathmandu, Nepal, 23–28 November 1987.IDRC, Ottowa, Canada, 158–163.
——1998b. How effective are the stocking strategies forthe management of reservoir fisheries in Sri Lanka. In:Cowx, I. ed. Stocking Strategies for Inland Fisheries.
Bromley, R.J. 1971. Inter-regional marketing and alterna-tive reform strategies in Ecuador. European Journal ofMarketing, 8(3): 245–265.
Central Bank of Sri Lanka, 1998. Economic and socialstatistics of Sri Lanka.
Chakrabarty, R.D. 1983. Fish culture in seasonal tanks inSri Lanka. J. Inland Fish., 2: 123–140.
Chandrasiri, J.K.M.D. 1986. Socio-economic conditions ofinland fishermen in Sri Lanka. A pre-project study offive major reservoirs in the Hambantota District.Agrarian Research and Training Institue, Sri Lanka.No. 73. 95 p.
De Silva, S.S. 1988. Reservoirs of Sri Lanka and theirFisheries. FAO Fisheries Technical Paper, Rome.
Jinadasa, J. 1997. Fisheries. In: Somasekaram, T. ed.Arjuna Atlas of Sri Lanka. Arjuna Consulting Co.,Colombo, 113–117.
Kodithuwakku, S. 1997. Entrepreneurial processes in anapparently uniform context: a study of rural farmers inSri Lanka. PhD thesis. Stirling; University of Stirling,Department of Management and Organisation, xii, 320 p.
Lawson, R. 1988. Economics of the fish market. In:Marketing in Developing Countries. Blackwell, 97–157.
1. To increase the prices received by producersfor their products (value–addition).
2. To reduce the prices consumers pay for thegoods they buy.
3. To increase the efficiency of the marketingprocess through improved transport, handlingand reduction in breaks of bulk.
4. To reduce wastage through the application ofappropriate preservation techniques.
5. Stabilisation of prices through subsidy orlong-term stockpiling.
6. Standardisation and control of weights andmeasures and commercial practices to reducecorruption and the formation of monopolies.
7. To prevent trading in low quality orunhealthy goods.
8. To increase the efficiency of taxation oncommercial activities.
9. Reorganisation of the locations or types ortrading institutions through provision of reg-ulated markets.
10. To diffuse information on prevailing pricesthrough local media to encourage fairtrading.
11. Encouragement or provision of credit andsavings facilities to allow modernisation ofproduction marketing techniques or reductionof dependence on money-lenders.
12. Encouraging vertical integration of com-merce (i.e. producer involvement in mar-keting or assisting consumers to controlmarketing activities).
13. Encouraging horizontal integration of com-merce (i.e. through promotion of coopera-tives) to achieve scale economies andbargaining power possessed by large-scalecompetitors.

308
Mee, J. 1993. An Overview of the Ornamental AquaticSector in Sri Lanka. The Agro-Enterprise DevelopmentProject, Sri Lanka. Colombo.
Munasinghe, H. 1984. Socioeconomic conditions of small-scale fishermen in Sri Lanka. Marga Quarterly SpecialIssue 7 (2 & 3): 11–36.
MOFARD 1995. National Fisheries Development Plan1995–2000. Ministry of Fisheries and Aquatic ResourcesDevelopment, Maligawatta, Colombo 10, Sri Lanka.
Murray, F.J. 1999. Fisheries marketing systems and con-sumer preferences in North West Province, Sri Lanka.Working paper. Institute of Aquaculture Stirling Uni-versity (unpublished).
NARA 1999. Sri Lanka Fisheries Year Book 1998. Socio-economic and Marketing Research Division, NationalAquatic Resources Research and Development Agency(NARA). Colombo.
Nathaniel, S. and Silva, E.I.L. 1998. Socioeconomics of theFish Marketing System at the Victoria Reservoir, SriLanka, Journal of Aquatic Sciences, 3: 51–59.
Pillay, T.V.R. 1990. Marketing of aquaculture products. In:Aquaculture: Principles and Practices. 244–252.
Sakthivadivel, Fernando, R. and Brewer, J. 1997. Rehabili-tation planning for small tanks in cascades: a method-ology based on rapid assessment. Research Report 13.Colombo, Sri Lanka: International Irrigation Manage-ment Institute (IIMI).
Siriweera 1986. The Inland Fisheries in Sri Lanka, aHistorical Perspective. Agrarian Research and TrainingInstitute, 114 Wijerama Mawatha, Colombo 7. Occasionalpublication No. 33.
Ulluwishewa, R. 1995. Traditional practices of inlandfishery resources management in the dry zone of SriLanka: implications for sustainability. EnvironmentalConservation, 22(2): 127–132.
Watson, I.G. 1999. Report to the Mahaweli Authority onthe Potential for Improving Fisheries in the MahaweliSystems. NRI Report 844. Natural Resources Institute,Chatham Maritime, Kent.
Wijesuriya, L.T. and Kamaladas, G.B.U. 1997. IrrigationSchemes in Sri Lanka. In: Somasekaram, T., Perera,M.P. and Godellawata, H. (ed.) Arjuna’s Atlas of SriLanka, Arjuna Consulting Co. Ltd, Colombo, 96–101.
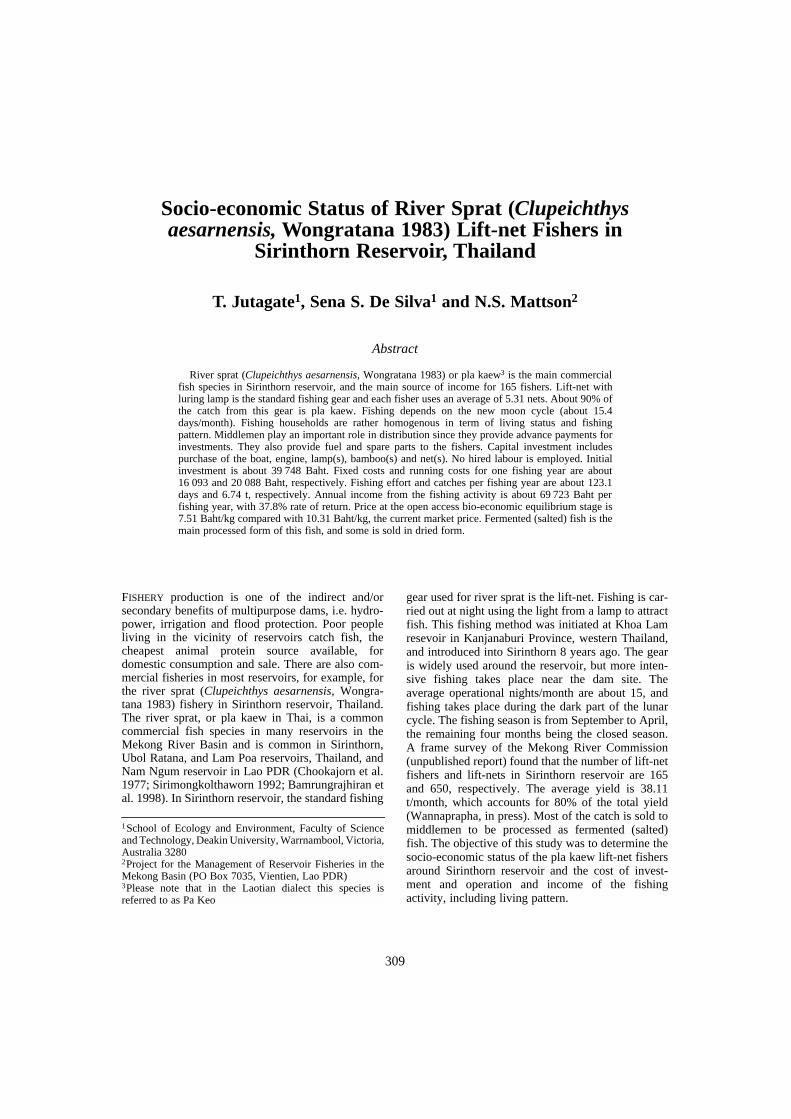
309
Socio-economic Status of River Sprat (Clupeichthys aesarnensis, Wongratana 1983) Lift-net Fishers in
Sirinthorn Reservoir, Thailand
T. Jutagate1, Sena S. De Silva1 and N.S. Mattson2
Abstract
River sprat (Clupeichthys aesarnensis, Wongratana 1983) or pla kaew3 is the main commercialfish species in Sirinthorn reservoir, and the main source of income for 165 fishers. Lift-net withluring lamp is the standard fishing gear and each fisher uses an average of 5.31 nets. About 90% ofthe catch from this gear is pla kaew. Fishing depends on the new moon cycle (about 15.4days/month). Fishing households are rather homogenous in term of living status and fishingpattern. Middlemen play an important role in distribution since they provide advance payments forinvestments. They also provide fuel and spare parts to the fishers. Capital investment includespurchase of the boat, engine, lamp(s), bamboo(s) and net(s). No hired labour is employed. Initialinvestment is about 39 748 Baht. Fixed costs and running costs for one fishing year are about16 093 and 20 088 Baht, respectively. Fishing effort and catches per fishing year are about 123.1days and 6.74 t, respectively. Annual income from the fishing activity is about 69 723 Baht perfishing year, with 37.8% rate of return. Price at the open access bio-economic equilibrium stage is7.51 Baht/kg compared with 10.31 Baht/kg, the current market price. Fermented (salted) fish is themain processed form of this fish, and some is sold in dried form.
FISHERY production is one of the indirect and/orsecondary benefits of multipurpose dams, i.e. hydro-power, irrigation and flood protection. Poor peopleliving in the vicinity of reservoirs catch fish, thecheapest animal protein source available, fordomestic consumption and sale. There are also com-mercial fisheries in most reservoirs, for example, forthe river sprat (Clupeichthys aesarnensis, Wongra-tana 1983) fishery in Sirinthorn reservoir, Thailand.The river sprat, or pla kaew in Thai, is a commoncommercial fish species in many reservoirs in theMekong River Basin and is common in Sirinthorn,Ubol Ratana, and Lam Poa reservoirs, Thailand, andNam Ngum reservoir in Lao PDR (Chookajorn et al.1977; Sirimongkolthaworn 1992; Bamrungrajhiran etal. 1998). In Sirinthorn reservoir, the standard fishing
gear used for river sprat is the lift-net. Fishing is car-ried out at night using the light from a lamp to attractfish. This fishing method was initiated at Khoa Lamresevoir in Kanjanaburi Province, western Thailand,and introduced into Sirinthorn 8 years ago. The gearis widely used around the reservoir, but more inten-sive fishing takes place near the dam site. Theaverage operational nights/month are about 15, andfishing takes place during the dark part of the lunarcycle. The fishing season is from September to April,the remaining four months being the closed season.A frame survey of the Mekong River Commission(unpublished report) found that the number of lift-netfishers and lift-nets in Sirinthorn reservoir are 165and 650, respectively. The average yield is 38.11t/month, which accounts for 80% of the total yield(Wannaprapha, in press). Most of the catch is sold tomiddlemen to be processed as fermented (salted)fish. The objective of this study was to determine thesocio-economic status of the pla kaew lift-net fishersaround Sirinthorn reservoir and the cost of invest-ment and operation and income of the fishingactivity, including living pattern.
1School of Ecology and Environment, Faculty of Scienceand Technology, Deakin University, Warrnambool, Victoria,Australia 32802Project for the Management of Reservoir Fisheries in theMekong Basin (PO Box 7035, Vientien, Lao PDR)3Please note that in the Laotian dialect this species isreferred to as Pa Keo
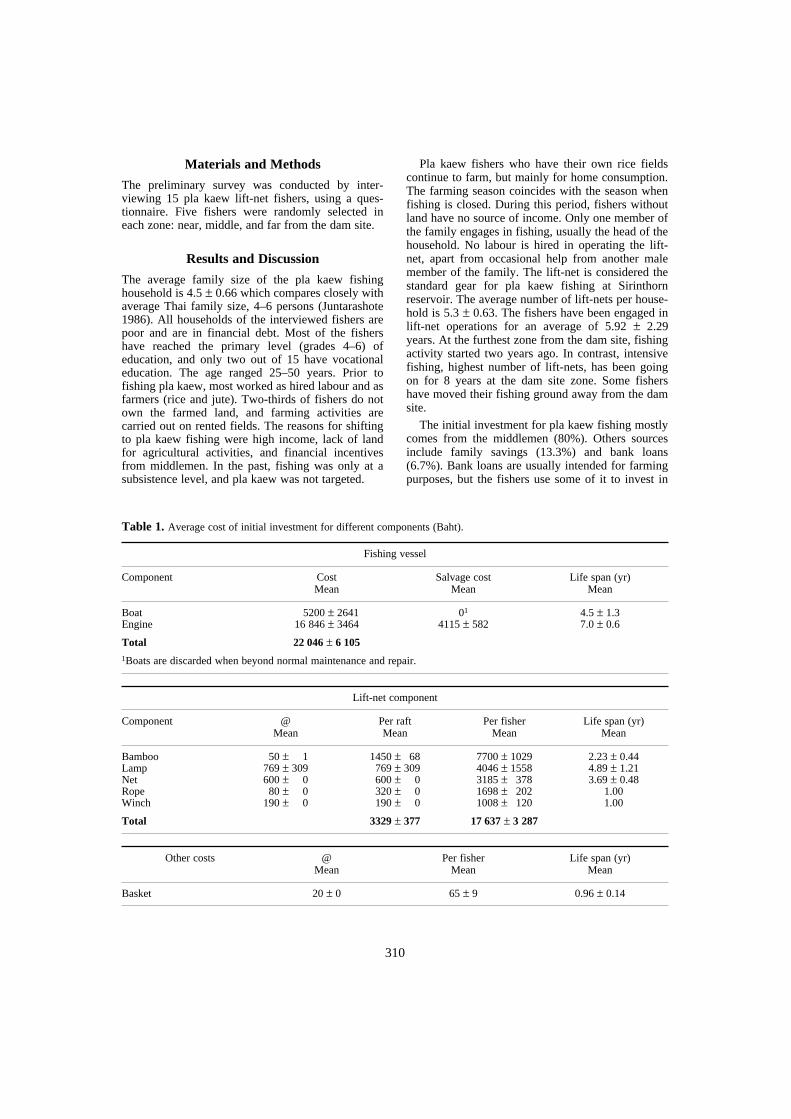
310
Materials and Methods
The preliminary survey was conducted by inter-viewing 15 pla kaew lift-net fishers, using a ques-tionnaire. Five fishers were randomly selected ineach zone: near, middle, and far from the dam site.
Results and Discussion
The average family size of the pla kaew fishinghousehold is 4.5 ± 0.66 which compares closely withaverage Thai family size, 4–6 persons (Juntarashote1986). All households of the interviewed fishers arepoor and are in financial debt. Most of the fishershave reached the primary level (grades 4–6) ofeducation, and only two out of 15 have vocationaleducation. The age ranged 25–50 years. Prior tofishing pla kaew, most worked as hired labour and asfarmers (rice and jute). Two-thirds of fishers do notown the farmed land, and farming activities arecarried out on rented fields. The reasons for shiftingto pla kaew fishing were high income, lack of landfor agricultural activities, and financial incentivesfrom middlemen. In the past, fishing was only at asubsistence level, and pla kaew was not targeted.
Pla kaew fishers who have their own rice fieldscontinue to farm, but mainly for home consumption.The farming season coincides with the season whenfishing is closed. During this period, fishers withoutland have no source of income. Only one member ofthe family engages in fishing, usually the head of thehousehold. No labour is hired in operating the lift-net, apart from occasional help from another malemember of the family. The lift-net is considered thestandard gear for pla kaew fishing at Sirinthornreservoir. The average number of lift-nets per house-hold is 5.3 ± 0.63. The fishers have been engaged inlift-net operations for an average of 5.92 ± 2.29years. At the furthest zone from the dam site, fishingactivity started two years ago. In contrast, intensivefishing, highest number of lift-nets, has been goingon for 8 years at the dam site zone. Some fishershave moved their fishing ground away from the damsite.
The initial investment for pla kaew fishing mostlycomes from the middlemen (80%). Others sourcesinclude family savings (13.3%) and bank loans(6.7%). Bank loans are usually intended for farmingpurposes, but the fishers use some of it to invest in
Table 1. Average cost of initial investment for different components (Baht).
Fishing vessel
Component CostMean
Salvage costMean
Life span (yr)Mean
Boat 5200 ± 2641 01 4.5 ± 1.3Engine 16 846 ± 3464 4115 ± 582 7.0 ± 0.6
Total 22 046 ± 6 1051Boats are discarded when beyond normal maintenance and repair.
Lift-net component
Component @Mean
Per raftMean
Per fisherMean
Life span (yr)Mean
Bamboo 50 ± 1 1450 ± 68 7700 ± 1029 2.23 ± 0.44Lamp 769 ± 309 769 ± 309 4046 ± 1558 4.89 ± 1.21Net 600 ± 0 600 ± 0 3185 ± 378 3.69 ± 0.48Rope 80 ± 0 320 ± 0 1698 ± 202 1.00Winch 190 ± 0 190 ± 0 1008 ± 120 1.00
Total 3329 ± 377 17 637 ± 3 287
Other costs @Mean
Per fisherMean
Life span (yr)Mean
Basket 20 ± 0 65 ± 9 0.96 ± 0.14

311
pla kaew fishing because banks do not give loans tofishers who have no land as collateral. Thus, themiddlemen play an important role in the pla kaewfishery. They not only provide cash for investmentbut also provide fuel and spare parts to meetrecurring costs. The fisher has to sell his catch to themiddleman with whom he deals. The price paid tothe fisher is about 20% lower than the market price,to cover loan repayments, and is determined by themiddleman. Payment to the fisher is made regularlyat the end of the month.
Financial analysis
The financial analysis of pla kaew lift-net fishingoperation is shown in the accompanying Tables. Thecurrency used is Thai Baht (1 Baht = 0.04 Australiandollars and = 0.025 US dollars).
The initial investment costs of boat, engine, andlamp have high standard deviations because ofdifferences in price of raw materials and types. Ingeneral, the higher the price, the longer the life span.From this study, the initial investment cost of pla kaewfishing using five lift-nets is about 39 748 Baht. Onlythe engine has a salvage cost. Other items are dis-carded when they do not function. The fishers changethe rope and winch annually when the fishing seasonstarts. Each raft needs 4 kg of rope and one winch.
Depreciation costs and rates are calculated usingthe straight-line method assumption, in which thedepreciation cost and rate are equally distributedthroughout the lifespan of the equipment(Rijirawanich and Ploytongkum 1986);
DC = (P-S) / L (1)
and
DR = [(1-S/P) / L] * 100 (2)
when
DC = Depreciation cost (Baht)
DR = Depreciation rate (%)
P = Price (Baht)
S = Salvage cost (Baht)
L = Life span (Year)
The average depreciation rate of the basket wasmore than 100% because some fishers mentionedthat the life span of the basket is about half a year.The repair and maintenance costs for the vessel focuson resin (used as a sealant) and lubricants. It was dif-ficult for the fishers to give a figure for the repairand maintenance cost of the lift-nets since they rarelyrepair these components. Maintenance cost for thelamp is uniform. In each lamp, the curved pipe,socket and inner axle are changed every two years.The outer axle and pump seal are changed every twomonths. Other parts are replaced monthly. The costsare about 64 Baht/lamp/month. Variations in lampmaintenance costs come from changing the coverglass of the lamp. One or two out of five lamps needa new cover glass each month.
Table 2. Average fixed costs.
Average depreciation cost
Fishing vessel
Depreciation cost (Baht/yr)
Mean
Depreciation rate (%)
Mean
Boat 1122 ± 324 23.52 ± 5.70Engine 1836 ± 384 10.89 ± 0.96
Total 2958 ± 708
Lift-net
Depreciation cost (Baht/yr) Depreciation rate (%)
Per raftMean
per fisherMean
Mean
Bamboo 669 ± 110 3535 ± 663 46.15 ± 7.31Lamp 155 ± 35 823 ± 206 22.05 ± 6.24Net 165 ± 24 873 ± 125 27.56 ± 4.00Rope 320 ± 0 1698 ± 202 100.00Winch 190 ± 0 1008 ± 120 100.00
Total 1499 ± 169 7937 ± 1316
Others Depreciation cost (Baht/yr)
Mean
Depreciation rate (%)
Mean
Basket 69 ± 18 107.69 ± 27.14
Average repair and maintenance cost
Fishing vessel per monthMean
per fishing yearMean
Boat 85 ± 21 682 ± 168Engine 92 ± 7 738 ± 58
Total 177 ± 28 1420 ± 226
Lift-net Fisher/monthMean
Fisher/fishing yearMean
Lamps 464 ± 83 3 709 ± 662
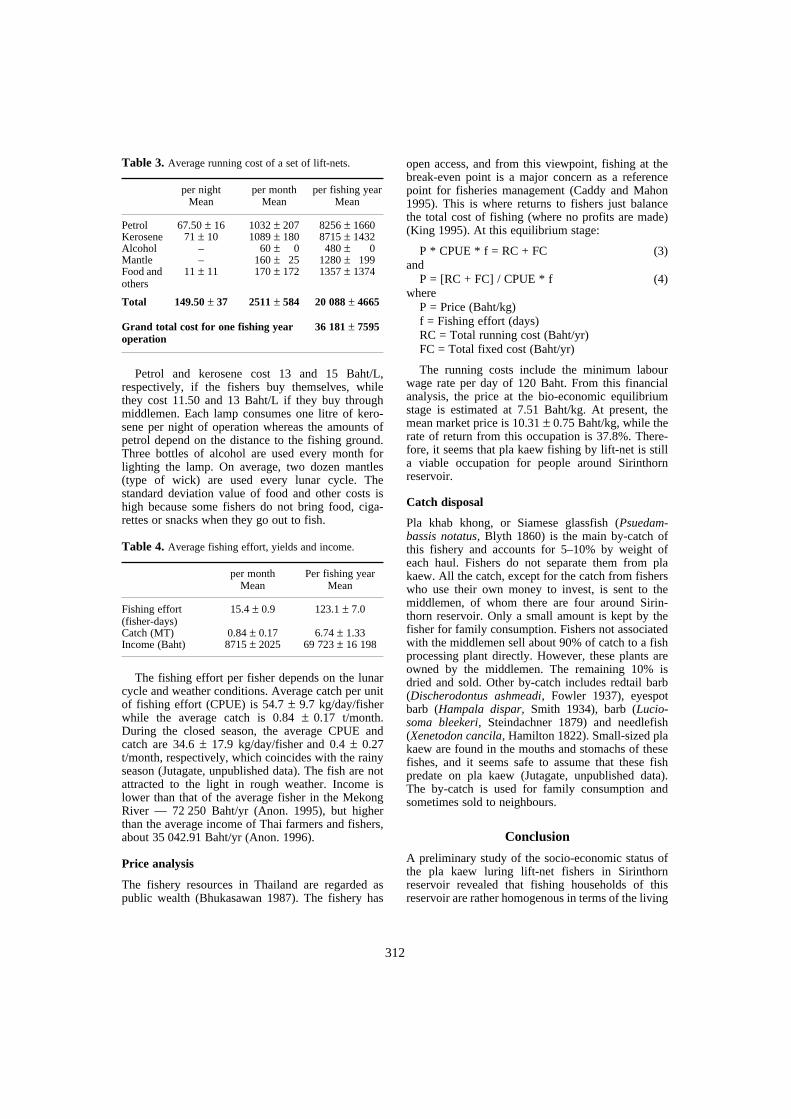
312
Petrol and kerosene cost 13 and 15 Baht/L,respectively, if the fishers buy themselves, whilethey cost 11.50 and 13 Baht/L if they buy throughmiddlemen. Each lamp consumes one litre of kero-sene per night of operation whereas the amounts ofpetrol depend on the distance to the fishing ground.Three bottles of alcohol are used every month forlighting the lamp. On average, two dozen mantles(type of wick) are used every lunar cycle. Thestandard deviation value of food and other costs ishigh because some fishers do not bring food, ciga-rettes or snacks when they go out to fish.
The fishing effort per fisher depends on the lunarcycle and weather conditions. Average catch per unitof fishing effort (CPUE) is 54.7 ± 9.7 kg/day/fisherwhile the average catch is 0.84 ± 0.17 t/month.During the closed season, the average CPUE andcatch are 34.6 ± 17.9 kg/day/fisher and 0.4 ± 0.27t/month, respectively, which coincides with the rainyseason (Jutagate, unpublished data). The fish are notattracted to the light in rough weather. Income islower than that of the average fisher in the MekongRiver — 72 250 Baht/yr (Anon. 1995), but higherthan the average income of Thai farmers and fishers,about 35 042.91 Baht/yr (Anon. 1996).
Price analysis
The fishery resources in Thailand are regarded aspublic wealth (Bhukasawan 1987). The fishery has
open access, and from this viewpoint, fishing at thebreak-even point is a major concern as a referencepoint for fisheries management (Caddy and Mahon1995). This is where returns to fishers just balancethe total cost of fishing (where no profits are made)(King 1995). At this equilibrium stage:
P * CPUE * f = RC + FC (3)and
P = [RC + FC] / CPUE * f (4)where
P = Price (Baht/kg)f = Fishing effort (days)RC = Total running cost (Baht/yr)FC = Total fixed cost (Baht/yr)
The running costs include the minimum labourwage rate per day of 120 Baht. From this financialanalysis, the price at the bio-economic equilibriumstage is estimated at 7.51 Baht/kg. At present, themean market price is 10.31 ± 0.75 Baht/kg, while therate of return from this occupation is 37.8%. There-fore, it seems that pla kaew fishing by lift-net is stilla viable occupation for people around Sirinthornreservoir.
Catch disposal
Pla khab khong, or Siamese glassfish (Psuedam-bassis notatus, Blyth 1860) is the main by-catch ofthis fishery and accounts for 5–10% by weight ofeach haul. Fishers do not separate them from plakaew. All the catch, except for the catch from fisherswho use their own money to invest, is sent to themiddlemen, of whom there are four around Sirin-thorn reservoir. Only a small amount is kept by thefisher for family consumption. Fishers not associatedwith the middlemen sell about 90% of catch to a fishprocessing plant directly. However, these plants areowned by the middlemen. The remaining 10% isdried and sold. Other by-catch includes redtail barb(Discherodontus ashmeadi, Fowler 1937), eyespotbarb (Hampala dispar, Smith 1934), barb (Lucio-soma bleekeri, Steindachner 1879) and needlefish(Xenetodon cancila, Hamilton 1822). Small-sized plakaew are found in the mouths and stomachs of thesefishes, and it seems safe to assume that these fishpredate on pla kaew (Jutagate, unpublished data).The by-catch is used for family consumption andsometimes sold to neighbours.
Conclusion
A preliminary study of the socio-economic status ofthe pla kaew luring lift-net fishers in Sirinthornreservoir revealed that fishing households of thisreservoir are rather homogenous in terms of the living
Table 3. Average running cost of a set of lift-nets.
per nightMean
per monthMean
per fishing yearMean
Petrol 67.50 ± 16 1032 ± 207 8256 ± 1660Kerosene 71 ± 10 1089 ± 180 8715 ± 1432Alcohol – 60 ± 0 480 ± 0Mantle – 160 ± 25 1280 ± 199Food and others
11 ± 11 170 ± 172 1357 ± 1374
Total 149.50 ± 37 2511 ± 584 20 088 ± 4665
Grand total cost for one fishing year operation
36 181 ± 7595
Table 4. Average fishing effort, yields and income.
per monthMean
Per fishing yearMean
Fishing effort (fisher-days)
15.4 ± 0.9 123.1 ± 7.0
Catch (MT) 0.84 ± 0.17 6.74 ± 1.33Income (Baht) 8715 ± 2025 69 723 ± 16 198
313
status and fishing patterns. It was also found that thisoccupation produces high incentive for investment,especially for poor people who do not own land. Cur-rent market price of pla kaew is about 10.5 Baht/kg,whereas the break even price is 7.1 Baht/kg.
Acknowledgment
The authors wish to thank Mr Henrik Nilsson, MRCSocio-economics Advisor for his valuable commentsand suggestions, and Mr Chalermchon Bamrungra-jhiran for field survey assistance. The research wasmade possible through a grant from a DeakinUniversity Research Scholarship for InternationalStudents (DURSIS).
ReferencesAnon. 1995. Socioeconomic Study of the People around Pak
Mun Resevoir, Ubon Ratchathani Province. Planning andPolicy Division. Royal Thai Department of Fisheries,Bangkok. 24 p (in Thai).
Anon., 1996. Agricultural Economics Indicator of Thailand.Center for Agricultural Information. Office of Agri-cultural Economics, Ministry of Agriculture andCooperative. 72 p (in Thai).
Bhukasawan, T. 1987. Inland Fisheries. In: Thai Fisheriesin the Future, SEAFDEC, Samut Prakarn, 150–194 (inThai).
Bamrungrajhiran, C., Degen, P., Janesirisak, S. et al. 1998.A preliminary assessment of the Pla Kaew (Clupeichthysgoniognatus) fishery of Sirindhorn Reservoir, Thailand.A poster presented at the Fifth Asian Fisheries Forumheld in Chaing Mai, Thailand, 11–14 November 1998.
Caddy, J.F. and Mahon, R. 1995. Reference Points forFisheries Management. FAO Fisheries Technical Paper347. FAO, Rome, 83 p.
Chookajorn, T., Somprasong, N., and Chotikul, S. 1977.Thai River Sprat Fishery in Northeast Thailand. Thai.Fisheries Gazette, 30: 93–99 (in Thai).
Jantarashote, K. 1986. Socioeconomic status of fishinghouseholds around the Bang Larng Dam, Yala ProvinceIn: Proceedings of the 24th Kasetsart University Con-ference; Fisheries Section, National Inland FisheriesInstitute, Kasetsart University, Bangkok, 332–342.
King, M. 1995. Fisheries Biology, Assessment andManagement. Blackwell Science Ltd, 342 p.
Rijirawanich, W. and Ploytongkum, C. 1986. EngineeringEconomics. Science, Engineering and Education Co. Ltd,Bangkok. 351 p (in Thai).
Sirimongkolthaworn, R. 1992. The Biology and Feeding ofthe Freshwater Sardine Clupeichthys aesarnensis inUbolratana Reservoir, Thailand, MSc thesis, Universityof Waterloo, Canada, 131 p.

314
Fisheries Co-management in Two Large Reservoirs — Problems and Challenges
H. Nilsson1, S. Phonsavath1, M. Khumsri2 and W.D. Hartmann1
Abstract
Co-management of natural resources is believed to lead to more sustainable and equitableresource use. The Lower Mekong Basin has shown examples from small water bodies with posi-tive results. However, larger water bodies are characterised by a complexity of users and interestsas well as being important sources of revenue. Hence, local involvement of the overall manage-ment is limited. Surveys carried out at Nam Ngum Reservoir (370 km2) in Lao PDR and Sirind-horn Reservoir (288 km2) in Thailand showed that the main problems are related to theft of fishinggear and that fisheries issues are discussed at meetings in only few villages. Stakeholder meetings,however, revealed major problems such as decreasing catches, environmental issues and lack ofalternative economic activities. Experiences with involvement of resource users cover fishingcooperatives, conservation volunteers, local participation in data collection, and awareness meet-ings. Enabling and disabling factors for co-management are discussed, and the main challengesahead are presented.
MOST inland fisheries of the Mekong Basin are dejure under state management. De facto, however,such fisheries are managed by local resource users.Lately, national governments and internationaldonors have been encouraging the setting-up of co-management systems, where all stakeholders, i.e.user communities and local and national govern-ments, share in aquatic resource decision-making.
A recent survey of a number of co-managementcases in the four countries of the Lower MekongBasin showed that many such initiatives have beensuccessful in small water bodies, 0.5–30 ha of water-spread, utilised by communities which commonlyuse available natural resources in an integrated way(Phounsavath et al. 1999). Strengthening reservoirfisheries co-management has been a major objectiveduring Phase I of the Management of Reservoir Fish-eries Component of the Mekong River Commission
(MRC) Fisheries Program. However, in Lao PDRand Thailand the project targeted large water bodiesutilised by rural populations whose livelihoods didnot depend traditionally on commercial fishing.
Larger water bodies (e.g. large reservoirs and riversystems) are normally characterised by a complexityof users and interests, as well as being importantsources of revenue. These have been sufficient rea-sons for putting the management of these resourcesunder government control with little or no influenceby resource users.
Introduction of co-management of naturalresources is believed to lead to more sustainableresource use. Furthermore, it leads to a more equi-table distribution of benefits and ideally also to amore efficient use of the resources. National govern-ments and international donors have now recogniseda role for co-management. The approach has beendefined as a cornerstone for the Management ofReservoir Fisheries Component (Phase II) of theMRC Fisheries Program.
This paper presents results obtained during theproject’s efforts directed at identifying and analysingexisting institutions and processes which, oncestrengthened, could lead to effective co-managementsystems.
1 Management of Reservoir Fisheries Project, MekongRiver Commission, PO Box 7035, Vientiane, Lao PDR.Email [email protected] 2 Ubon Ratchathani Inland Fisheries Development Center,40 Soi Jangsanit, Jangsanit Road, Muang District, UbonRatchathani 3400, Thailand. Email [email protected]
315
Methods
Study areas
Nam Ngum Reservoir is a 370 km2 large reservoir inLao PDR (MRF, in prep.). It was built as a hydro-power reservoir and completed in 1971. Apart fromelectricity generation, the reservoir serves as a richsource of fishing for the 30 villages surrounding it.Other activities related to the reservoir include small-scale irrigation of reservoir-shore farming, under-water and forestry logging and a lakeshore resort.The population residing immediately in the 30 reser-voir villages is estimated at 16 658.
The similar-sized Sirindhorn Reservoir of North-eastern Thailand (288 km2) was also completed in1971 (MRF, in prep.). The purpose of its construc-tion was electricity generation while irrigation ofagricultural lands for some of the reservoir villageshas become an important benefit. Fishing is also animportant activity for many of the 37 800 people inthe 50 reservoir villages.
Data collection
Information on management issues at the two reser-voirs has been collected by a number of methods.Traditional questionnaire surveys have been carriedout at village and household levels. At Nam NgumReservoir, 100 randomly selected households wereinterviewed on management perceptions (fisheries-related problems and suggestions for their solution,and what various stakeholders could do and shouldnot do in order to improve the fisheries). Among theresponding households, 72% had a fisher amongtheir members. At village and unit (sub-village)levels, representatives were asked to what extentfisheries issues were discussed at local meetings.1Interviews covered 30 respondents at village leveland 64 at unit level. At Sirindhorn Reservoir groupquestionnaire interviews were carried out withfishers in all 50 villages surrounding the reservoir.
An in-depth field study for a MSc thesis was car-ried out in two villages at Nam Ngum Reservoir(Phounsavath 1998). Methods included questionnaireinterviews with 150 households and semi-structuredinterviews with key informants and rapid ruralappraisal (RRA). The two villages (Ban Xai Oudomand Ban Phonsavat), where fishing is the main eco-nomic activity, were chosen as sites for this study.
A short study was carried out around SirindhornReservoir to identify co-management initiatives. This
was guided by information available at the Conser-vation Unit. Interviews were held with fishers,school leaders and pupils, abbots and staff at theConservation Unit.
Finally, stakeholder meetings were held with theaim of facilitating the joint management processbetween the various groups of resource users andgovernment agencies. The meetings included fishersand village representatives of all villages, projectassociated data collectors (locally based, govern-ment-contracted but unpaid), conservation volun-teers, sub-district and district representatives,technical staff from district and provincial level andrepresentatives of the local electricity authority. AtNam Ngum, a two-day meeting was held with 48participants. At Sirindhorn, meetings were heldwithin each of the three districts involving a total of172 participants. At both sets of meetings, partici-pants were given brief feedback of the main findingsfrom the surveys carried out by the Management ofReservoir Fisheries Component. This was followedby a stakeholder-wise identification of problemsrelated to the reservoir management, their causes andpossible activities to address them. A prioritisation ofthe problems, and hence the activities, was made.
Results
Survey findings
The survey at Nam Ngum found that fisheries man-agement issues are not frequently discussed at localmeetings. As many as 67% of representatives amongvillage respondents had no mention of any fishery-related issues discussed at village meetings (MRF, inprep.). In villages where such issues were raised theycovered illegal fishing (23% of villages), fish prices(10%), theft of fishing gears (10%) and fishery con-trol (7%). Other issues discussed in single cases werethe need for an awareness campaign, means for reso-lution of fisher conflicts, measures against theft offishing gear, agreement on retrieving time of fishinggears, needs for training in fish cage-culture andraising small livestock, needs for cheap sources offishing, supply and consumption goods, need forimprovement of the fish marketing system andexchange of common fishing experiences.
At unit level, management issues were an evenrarer feature. Only 9% of the 64 units surveyed hadthese issues on the agenda. However, issues discussedincluded the need for exchange of fishing experiencesand a ban on dynamite fishing (5% each), and a banon the use of both air pumps for diving fishing andimpermeable firecrackers for light fishing of smallclupeids (3% each). Other issues mentioned oncewere the ban on the use of spear gun and drifting
1 All 30 villages were selected for this exercise, as were all64 units in 11 sample villages. Representatives of these levelswere trained in filling out the forms, which also includedissues relating to fishing effort, catch and marketing.

316
gill-nets, exchange of experiences of gill-net fishing,long distances to landing sites, needs for training infish cage-culture and raising small livestock.
At Sirindhorn Reservoir, fisheries-related issueswere discussed in 28% of the villages (MRF, inprep.). The issues included fishing at the reservoir ingeneral (20%), interventions of the Fishing Patrol(10%), conflicts over fishing grounds (6%) and wateruse for irrigation (affecting the water level, 6%).
With fishing such an important activity to the res-ervoir population, it is worthwhile considering whyissues related to fishing are apparently not discussedat village level to a larger extent, especially at NamNgum Reservoir.
The main problem identified at the two reservoirswas theft of fishing gear. This was mentioned by82% of respondents (group of fishers) at SirindhornReservoir and 40% of respondents (head of house-hold) at Nam Ngum Reservoir. Other issues men-tioned at Sirindhorn were drowned fishers (30%) andspoiled fish due to lack of traders (22%). At NamNgum, decreasing catches (11%) and dynamitefishing (4%) were mentioned.
It may appear strange that overall so little atten-tion is given to decreasing catches. Stakeholdermeetings at both reservoirs, however, clearly demon-strated that fishers are individually experiencingsmaller catches than previously (see below). How-ever, this reflects the value of different methods,especially in the given cultural context. According toThai and Lao culture, people do not easily bring for-ward their problems to strangers with whom theytalk only for the length of an interview, and espe-cially not government officers, the enumerators at
the present surveys. Sufficient confidence is notgained in such short time. A participatory researchapproach (PRA) exercise or in-depth village studymight have generated the trust and confidenceneeded. Nevertheless, the stakeholder meetings, exe-cuted in a participatory style, managed to engage theresource user side in presenting many details of theproblems faced.
Respondents in the two surveys came up with sug-gestions on how various stakeholders could act toimprove the fishing situation. The key stakeholdersare presented in Table 1. Respondents at the ThaiSirindhorn Reservoir found that the provincial fish-eries authority could assist through stocking (42%)and the promotion of aquaculture (34%), while thefew respondents at the Lao Nam Ngum Reservoirfocused on improved management of the fishery,including organisation of the fishers (10%). Intro-duction of sanctuaries was mentioned by a fewrespondents at both reservoirs.
At Sirindhorn Reservoir, fellow-fishers were rec-ommended to start aquaculture or introduce a fishingcommittee (10% each). Other suggestions hardlyreflect any poor fishing practices. The reverse situa-tion is found when recommendations are given forfishers outside the respondent’s village. Suggestionsare that these should avoid using illegal gear (4% atNam Ngum and 22% at Sirindhorn), refrain fromstealing fishing gear (10% and 16%) and fish only inallocated areas (12% and 16%, respectively). How-ever, bearing in mind the Lao and Thai culturerefraining people from talking badly about fellow-villagers, the hints to outside fishers might actuallyreflect a more general situation.
Note: Only main categories of answers are presented here. For full details, see MRF (in prep.)
Table 1. Main stakeholder perceived roles in improved fisheries management, according to respondents at Nam Ngum andSirindhorn reservoirs.
Stakeholder Issue Nam Ngum Reservoir(N = 100 households) (%)
Sirindhorn Reservoir(N = 50 villages; group
interview with fishers) (%)
Provincial fisheries Stocking fish or prawn 2 42authority Promote aquaculture 1 34
Make sanctuaries 5 12Manage fishery/organise fishers
10 —
Village-based fishers Start aquaculture — 10Introduce fishing committee — 10Improve market strategy 2 6Join efforts to prevent theft 2 —
Outside fishers Avoid use of illegal gear 4 22Don’t steal fishing gear 10 16Fish only in allocated areas 12 16Register with village authority 8 —
317
Stakeholder meetings
Stakeholder workshops were organised by theproject in November–December 1999 to assemble allthe involved stakeholders of the reservoirs in anattempt to initiate a participatory forum with theobjective of improving existing fisheries manage-ment. Various stakeholders took part in the work-shop, namely local fishers, village headmen, datacollectors working with the project, conservationvolunteers, district officers from fisheries, agricul-ture and other sectors, and provincial fisheriesauthorities.
Participants identified a list of problems related tofishing as well as their causes. The dominatingproblem identified at all workshops was thedecreasing catch that fishers are facing. Other issuesfocused on degradation of the environment (habitatsand spawning grounds) and the need for alternativeeconomic activities, especially if the closed season isadhered to. This led to a series of activities designedto address those causes as well as the identificationof stakeholders responsible for subsequent actions.
Discussion
Co-management initiatives
Even though genuine co-management processescannot be said to be in place at any of the reservoirs,there are structures and procedures in place, which, iffurther developed, could lead to co-management sit-uations.
In the late 1970s, fisher cooperatives were estab-lished in seven villages at Nam Ngum Reservoir.They provided a government-run enterprise with fishat a fixed (and low) price and in return received sup-plies of fishing gear and food at fixed prices. How-ever, the fishers lost interest in this setup after a fewyears when supplies were often not available andbetter prices for the fish could be obtained on thefree market (Phounsavath 1998).
This example shows that handing over (in thiscase economic) power to local resource users is notsustained in the longer term if those users have notbeen partners in the process of designing and man-aging the set-up. Literature from other parts of theworld shows the importance of the initiative andinvolvement of the community. Locally formed usergroups at the major lakes of Malawi were establishedwith the aim of acting as link between fishers and theFisheries Department (Scholtz et al. 1998). Afterseeing the initial success of this set-up, it was soonamended into the national Fisheries Conservationand Management Act and used as a model country-wide. Barbosa and Hartmann (1998) found thatalthough community organisation could be instigated
by outsiders, its sustainability would depend on thecommunities and their dedicated and persistentleaders.
A recent initiative in Thailand saw the establish-ment of groups of Conservation Volunteers at majorwater bodies (including Sirindhorn and Ubolratanareservoirs). They are villagers with a couple of daystraining who are requested to take care of the fisheryresources, i.e. propagate awareness of the resourcesand report illegal fishing practices. The volunteersare not formally employed and have no power toapprehend illegal fishers. However, they enjoy somestatus in the local environment, being equipped witha uniform. While it is still early to say how this insti-tution will work, it appears that the ConservationVolunteers serve as the extended arm of the FisheriesConservation Division. One could have hoped for agreater involvement with the local communities towhich they belong. However, whereas their statusarises from the linkage to the DoF, their personalstatus in the village might not necessarily be high. Asmany of the volunteers are relatively young, it couldbe difficult to generate respect for any initiative.
At both reservoirs, local participation in data col-lection has been sought in order to improve thequality of the data. Data covers length/weight-fre-quency related to effort. This collaboration has beenin place since 1998. Although a major motive for thefishers to participate seems to be the small incentivespaid, project staff involved feel that the fishers arealso interested in the collaboration itself.2(Ticheler1998) found that proper feedback from the researchinvolving local fishers as data collectors could leadto enhanced awareness among fishing communitiesregarding exploitation patterns and management con-sequences. However, such collaboration should betaken even further, as fishers could take part in thedesign of the survey itself. This would not onlyimprove the relevance and quality of the data butalso lead to a better understanding of the results andan appreciation of the work carried out.
Fisheries authorities at both reservoirs haveregular awareness meetings with village leaders toremind them of the fisheries regulations. At the sametime, fisheries staff obtain information about fishingand possible problems. Surveys indicate that fishersin general are quite aware of the regulations in place.
2 Fishers at Sirindhorn Reservoir are paid 200 Baht(US$5.41) per month for daily recording individual lengthsof each fish caught. Fishers at Nam Ngum Reservoirreceive 2000 Kip (US$0.27) per day for allowing projectstaff to measure their catch.
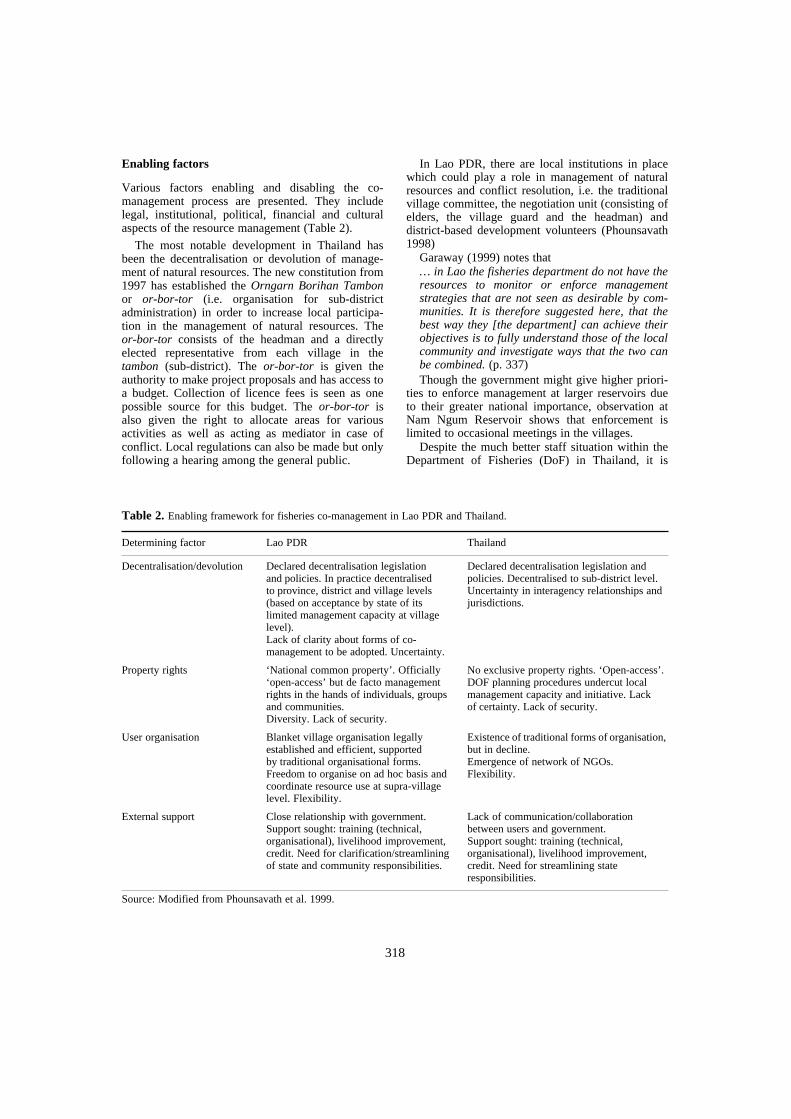
318
Enabling factors
Various factors enabling and disabling the co-management process are presented. They includelegal, institutional, political, financial and culturalaspects of the resource management (Table 2).
The most notable development in Thailand hasbeen the decentralisation or devolution of manage-ment of natural resources. The new constitution from1997 has established the Orngarn Borihan Tambonor or-bor-tor (i.e. organisation for sub-districtadministration) in order to increase local participa-tion in the management of natural resources. Theor-bor-tor consists of the headman and a directlyelected representative from each village in thetambon (sub-district). The or-bor-tor is given theauthority to make project proposals and has access toa budget. Collection of licence fees is seen as onepossible source for this budget. The or-bor-tor isalso given the right to allocate areas for variousactivities as well as acting as mediator in case ofconflict. Local regulations can also be made but onlyfollowing a hearing among the general public.
In Lao PDR, there are local institutions in placewhich could play a role in management of naturalresources and conflict resolution, i.e. the traditionalvillage committee, the negotiation unit (consisting ofelders, the village guard and the headman) anddistrict-based development volunteers (Phounsavath1998)
Garaway (1999) notes that … in Lao the fisheries department do not have theresources to monitor or enforce managementstrategies that are not seen as desirable by com-munities. It is therefore suggested here, that thebest way they [the department] can achieve theirobjectives is to fully understand those of the localcommunity and investigate ways that the two canbe combined. (p. 337)Though the government might give higher priori-
ties to enforce management at larger reservoirs dueto their greater national importance, observation atNam Ngum Reservoir shows that enforcement islimited to occasional meetings in the villages.
Despite the much better staff situation within theDepartment of Fisheries (DoF) in Thailand, it is
Source: Modified from Phounsavath et al. 1999.
Table 2. Enabling framework for fisheries co-management in Lao PDR and Thailand.
Determining factor Lao PDR Thailand
Decentralisation/devolution Declared decentralisation legislation and policies. In practice decentralised to province, district and village levels (based on acceptance by state of its limited management capacity at village level).Lack of clarity about forms of co-management to be adopted. Uncertainty.
Declared decentralisation legislation and policies. Decentralised to sub-district level.Uncertainty in interagency relationships and jurisdictions.
Property rights ‘National common property’. Officially ‘open-access’ but de facto management rights in the hands of individuals, groups and communities.Diversity. Lack of security.
No exclusive property rights. ‘Open-access’.DOF planning procedures undercut local management capacity and initiative. Lack of certainty. Lack of security.
User organisation Blanket village organisation legally established and efficient, supported by traditional organisational forms.Freedom to organise on ad hoc basis and coordinate resource use at supra-village level. Flexibility.
Existence of traditional forms of organisation, but in decline.Emergence of network of NGOs. Flexibility.
External support Close relationship with government.Support sought: training (technical, organisational), livelihood improvement, credit. Need for clarification/streamlining of state and community responsibilities.
Lack of communication/collaboration between users and government.Support sought: training (technical, organisational), livelihood improvement, credit. Need for streamlining state responsibilities.
319
recognised by senior officers within DoF thatdetailed management cannot be supervised andenforced by the Department due to budget con-straints (MRF 2000). It is foreseen that within thenext 10 years more and more responsibility for man-agement will be delegated to or-bor-tor level.
The situation in both countries is therefore in prin-ciple conducive to co-management. Legal and organ-isational structures are in favour of, or at least notdirectly hindering, such an approach.
Disabling factors
Realising that the present situation has not led to fur-ther development of co-management at larger reser-voirs necessitates a look at the factors disabling theprocess.
In Thailand, reservoir fisheries management isdealt with by two separate divisions within theDepartment, i.e. the Inland Fisheries DevelopmentResearch Centre and the Fisheries ConservationDivision. At Ubolratana Reservoir, Prompoj (1994)found that there was a need for a single organisationto be responsible for all management tasks of the res-ervoir fisheries. However, present experience fromSirindhorn Reservoir does not seem to indicate thatthis split is a major reason for not developing themanagement further. Nevertheless, it must be recog-nised that local resource users might find it difficultto know who is in charge of the management fromthe government side.
The management set-up in Lao PDR and Thailandis to a large extent centred on awareness creation andenforcement of regulations. Enforcement is carriedout by patrolling. At Nam Ngum fisheries, stafffocus on patrolling the main estuary, which is con-sidered a very important reproduction site for manyspecies. As settlement in that area is illegal, the taskis carried out together with the provincial securitystaff. Hence, the situation is often tense. Not only isthe fishing ground at stake here but also the entirelivelihood of families staying in the area, as they alsodepend on livestock-keeping and shifting cultivation.Prompoj (1994) reported from Ubolratana Reservoirsimilar hostility toward fisheries staff. Here fisherswere even supported by locally based governmentstaff (district head and MP). Prompoj further foundfrom a review of the annual reports of the fisheriesstation ‘… that there was not much emphasis on dis-seminating fisheries knowledge (i.e. specified as avillage seminar) but rather the emphasis was onpolicing’ (p. 132).
Fisheries staffs at both reservoirs have their expe-rience in patrolling, meeting the villagers and datacollection. A more participatory approach involvingthe fishers in controlling the resources is a new con-cept for them. While the staff might be willing to try
this new approach, it is difficult to push unless a greenlight is given from above. As community-based man-agement of natural resources is not a new concept, theconstraints seem to be more budgetary than political.
Fishers are often equally inexperienced with par-ticipatory approaches when working with govern-ment. This takes time to develop. Further, fishers atthese large reservoirs feel little ownership towardtheir resource. The studies carried out by the projectshowed that abandoning illegal fishing practices wasan important part of the roles fellow-fishers couldplay (although these probably for sensitivity reasonswere directed toward fishers from other villages).Hence, although fishers might have high awarenessof the resources, there is still a low degree ofstewardship among them.
Conclusion and Recommendations
Problems identified through surveys and stakeholdermeetings at Nam Ngum and Sirindhorn Reservoirfocused on theft of fishing gear, decreasing catches,environmental issues and lack of alternative eco-nomic activities.
Co-management initiatives at the two reservoirsincluded establishment of fishing co-operatives,deployment of Conservation Volunteers, semi-participatory data collection and awareness meetings.Apart from the data collection, these initiatives haveall been introduced by the respective fisheriesauthorities. Experiences from various cases showedthat the success of such initiatives depends on towhat extent resource users have been involved in thedesign and implementation.
Enabling factors for co-management at NamNgum and Sirindhorn Reservoirs include decentrali-sation of responsibility for natural resource manage-ment (typically caused by budgetary constraints) andlegal space for local user organisations.
Among the disabling factors were lack of experi-ence with joint management and participatoryapproaches among government agencies as well asresource users. Others were uncertainty of relation-ships and the jurisdiction of various governmentagencies.
Another problem is the potential conflict betweenthe multiple uses and interests related to large reser-voirs. Fishing has usually second priority to hydro-power generation and irrigation. In Thailand,communication between government fisheries agen-cies and local resource users is limited and wherefound usually reflects an unwillingness to listen tothe users.
The strengthening and involvement of existingtraditional local institutions could play a greater rolein more effective management of the fisheries at the
320
Nam Ngum and Sirindhorn Reservoirs. Specificlocal organs evolved at various levels could befurther involved in the management process. Theyare the traditional village committee, the negotiationunit, district development volunteers (Lao PDR),Conservation Volunteers and or-bor-tor (Thailand).Traditional informal ethnic institutions should alsobe considered such as ethnic clans/leaders (e.g.Hmong ethnic group at Nam Ngum). Other non-government organisations could also be involved indifferent management activities such as mass organi-sations (youth, women, NGOs, etc.).
The challenges ahead for the co-managementprocess therefore include the task of getting allimportant stakeholders involved in developingproper communication and management fora. Thismight necessitate training in conflict resolution andparticipatory processes for government staff as wellas resources users.
AcknowledgmentsWe would like to thank people who in one way oranother have contributed to this paper. In Lao PDR,Khemkham Vanthanouvong, Vankham Keophim-phone, Khambao Sihalat, Khankeo Siharath, Khan-tong Chanmany and Boungou Phantavong from theNam Ngum Development and Management Projectassisted with data collection. Khamla Phommachanand Saleumphone Chanthavong from the Manage-ment of the Reservoir Fisheries in the Mekong Basinassisted with data collection and processed the data.In Thailand, Mallika Wannaprapha of KanchanaburiInland Fisheries Development Centre assisted withdata collection and was in charge of data processing.Praneet Ngamsnae of Ubon University and Chalerm-chon Bamrungrajhiran of Ubon Ratchathani InlandFisheries Development Center facilitated a shortsurvey on co-management initiatives.
References
Barbosa, F.I. and Hartmann, W.D. 1998. Participatory man-agement of reservoir fisheries in North-eastern Brazil.In: Inland fisheries enhancements. FAO TechnicalPaper 374.
Garaway, C.J. 1999. Small Water Body Fisheries and thePotential for Community-led Enhancement: Case-studiesfrom Lao PDR. PhD thesis, University of London,London 414 p.
MRF 2000. Facilitators report on MRFP Stakeholder work-shops, Sirindhorn Reservoir, Ubon Ratchathani, Thailand.Management of Reservoir Fisheries Component.
MRF. The Fishery of Nam Ngum Reservoir, Lao PDR.Management of Reservoir Fisheries Component (inprep.).
MRF. The Fishery of Sirindhorn Reservoir, Thailand.Management of Reservoir Fisheries Component (inprep.).
Phounsavath, S. 1998. Community-based fisheries manage-ment as an approach to participatory management ofreservoir fisheries — a case study two fishing villages atthe Nam Ngum Reservoir, Lao PDR. MSc thesis.Bangkok: Asian Institute of Technology, School ofEnvironment, Resources and Development.
Phounsavath, S., Hartmann, W., Thouk, N., Degen, P. andLogarta, M. 1999. Are State–user relations conducive tofisheries co-management in the Lower Mekong Basin?Paper presented at the MRC/Fisheries Program Tech-nical Symposium, 13–14 December, 1999.
Prompoj, W. 1994. Planning for sustainable reservoirfisheries in Thailand. PhD thesis. Waterloo, Canada.
Scholtz, U.F., Njaya, F.J., Chimatiro, S., Hummel, M.,Donda, S. and Mkoko, B.J. 1998. Status and prospects ofparticipatory fisheries management programs in Malawi.In: Inland Fisheries Enhancements. FAO TechnicalPaper 374.
Ticheler, H.J. 1998. Participation of local fishermen inscientific fisheries data collection: a case study from theBangweulu Swamps, Zambia. Fisheries Management andEcology, 5: 81–92.

321
Some Imperatives for Co-management of the Fishery inEa Soup Reservoir
Truong Ha Phuong, Nguyen Thi Nhung, Mercedes Logarta, J.D. Sollows, Nguyen Thi Bich and Ho Ngoc Dan*
Abstract
Deforestation, siltation and associated flooding are major problems in the Central Highlands ofVietnam. Between 1979 and 1994, the percentage of forest cover in Dak Lak Province droppedfrom 75 to 59. The increasing cultivation of coffee and other crops is partly responsible for thisreduction. Besides land, water is crucial for agriculture. Most is stored in 370 reservoirs with atotal estimated area of 8500 ha. Though maintained mainly for irrigation, reservoirs have also beenused for fisheries. While yielding high production, they are also vulnerable to unchecked exploita-tion. Sustainable ways of managing the fishery therefore need to be identified and strengthened.The project ‘Management of Reservoir Fisheries in the Lower Mekong Basin’ is attempting toidentify management schemes that will ensure the sustainability of the fishery resource byinvolving all stakeholders, especially the fishing communities. This paper documents the relevantexperience of the project in one reservoir. In Ea Soup Reservoir, most fish species are indigenous.Access to the fishery has been open, with little effective enforcement of regulations. Enhancementof yields through stocking may not be viable because of periodic flooding. Protection and otherways of suitably managing the fishery are being piloted. Ea Soup is a relatively new district, withhigh immigration, in spite of an official policy to stop settlement in the area and consequently morepressure is put on the fishery resource, and on the surrounding forests. The absence of an estab-lished management system provides an opportunity to test and develop co-management. Con-straints encountered and preliminary lessons learned are discussed.
TWO common phenomena in fisheries are decliningyields in the face of over exploitation, and unequaldistribution of benefits among resource users. Fre-quently, the two are interrelated, since wealthierusers often prioritise immediate gains rather thansustainable production, which is of greater concernto small-scale users, whose welfare depends morefully on the resource.
Regulation of fisheries by government has varyingeffectiveness. Enforcement can be expensive, theneeds and concerns of small-scale fishers can easilybe ignored, and management may be less responsivethan desirable to changing circumstances.
Involvement of resource users in managementputs to use their knowledge of the fishery and localcircumstances, and takes into account their needs and
concerns. They are in the best logistical position torespond to these circumstances, and have a stronginterest in maintaining sustainable yields from theresources on which they depend. The self-reliancegenerated by such an approach makes them lessdependent on external support.
Co-management
While user participation in resource management isbecoming increasingly recognised as essential toissues of sustainability and equitability, the involve-ment of concerned public officials and agencies isalso necessary. They have the responsibility andauthority to ensure sustainable management ofnatural resources and the welfare of the population atlarge. They are also in the best position to supportand guide resource users in management of theresources. Hence, the concept of co-management,defined here as ‘a formalised and replicable process
*Management of Reservoir Fisheries in the Lower MekongBasin, 68 Le Hong Phong, Ban Me Thuot. E-mail: [email protected]

322
of sharing of authority and responsibility betweengovernment and organised groups of stakeholderswith identical or complementary roles and functionsin a decentralised approach to decision-makingaiming at improved participatory and democraticresource management’ (Phounsavath et al. 1999).
The process of developing a co-managementscheme depends on the situation, the perceptions andaims of the resource users, and of the agencies con-cerned. In order for co-management to be successful,it has to satisfy a number of requirements, which willbe dealt with later.
The project ‘Management of Reservoir Fisheriesin the Lower Mekong Basin’ operates in Laos, Thai-land, and Vietnam and has as its development objec-tive ‘sustained high yields of fish achieved fromreservoirs managed under local community agree-ment with government’. Hence, the project isidentifying management schemes that ensure the sus-tainability of reservoir fisheries through the activeinvolvement of all stakeholders, but especially thefishing communities. The initial step is to develop asufficient understanding of local conditions that willhelp determine the nature of the final co-managementscheme. In Vietnam, initial efforts have been concen-trated in Ea Soup Reservoir, Dak Lak Province.
Provincial and local situation
Dak Lak is the largest (19 530 km2) of the CentralHighlands provinces of Vietnam. Its populationgrew from about 350 000 in 1975 to an estimated1.2 million in 1994. Current estimates put it at closeto 1.5 million, of whom about 20% live in Buon MeThuot.
The province is known for its rich basaltic soil.Agricultural land expanded from 93 350 ha in 1979to 291 320 ha in 1994, a 312% increase (SWAP 1996).With suitable climate and fertile soil, the province hasbecome the largest coffee-producer in the country.Over that period, the area under coffee productionincreased from 18 000 ha to 82 980 ha, or 461%. Arecent estimate (March 1999) from Dak Lak Depart-ment of Agricultural and Rural Development (DARD)estimate the current area under coffee at about170 000 ha. Conversion to coffee farming continues,although steps are being taken to slow the expansion.The crop places considerable demand on waterresources, and requires fertilisers and pesticides.
Reservoirs are an important source of water foragriculture, and the number is increasing, in responseto growing demand. The most recent (March 1999)estimate by DARD suggests about 370 reservoirs inthe province, 8500 ha in area. While the greatmajority were built for irrigation, fishery is animportant secondary use.
In 1979, an estimated 75.1% of the province wasforested. Almost 400 000 ha was deforested between1979 and 1994, when only about 59% of the areawas forested. Deforestation tends to lead to erosionand reduced retention of water in the catchment area,and therefore siltation and less stable water flows instreams and reservoirs.
Ea Soup is a relatively new district, occupying thenorthwest corner of Dak Lak, bounded by Cambodiato the west and Gia Lai Province to the north. It wasestablished in 1977 and was divided into Ea Soupand Cu Mgar districts in 1983. In 1995, it was furtherdivided into Ea Soup and Ban Don districts. Beforeformal establishment, the area was inhabited mainlyby indigenous Ede and Jrai peoples, but now Kinhpeople account for about 74%, Jrai about 10%, andthe 16% remaining is Muong, Giao, Tay, Nung, Ede,and Thai people.
The population density of the district is low (17.8inhabitants/km2, 1999), but growing rapidly. Dataindicate that the population of the entire district grewfrom 24 150 in May 1997 to 31 269 in April 1999,an annual increase of 14.7%. Most is due to immi-gration, mainly from the north. While currentpolicies discourage such migration, it still continues.
In contrast to most of Dak Lak, the soils of EaSoup district are relatively poor in basaltic elements,and sandy. The relatively poor soil probably helpsaccount for the historically low population in thearea, and suggests that even when more fully settled,Ea Soup should have a lower population-carryingcapacity than many parts of the central highlands.
Its economy is primarily agricultural. The fisheryis also an important protein source for the district,with about 52 tons from Ea Soup Reservoir (Phuc etal., in press) and about 97 tons from aquaculture(Dak Lak Statistic Office, 1998) annually.
Ea Soup Reservoir has an open-access fisheryunder the nominal control of local authorities. Theyare aware of their limitations here, and were open tothe idea of allowing the fishing community to helpmanage the fishery. This paper documents projectexperience in ongoing work to facilitate the estab-lishment of fishery co-management in Ea SoupReservoir, and to extract some preliminary lessons.
Ea Soup Reservoir
Ea Soup Reservoir was impounded in 1980 by theDak Lak Water Resources Scheme. Though it wasintended to irrigate about 1600 ha of mainly low-lying rice, its capacity at present is estimated at onlyabout 1000 ha. The reservoir has an area of 240 ha atfsl, a dam height of 12 m and a length of 3500 m.
The spillway is wide (200 m), considering the areaof the reservoir. However, the catchment area of the
323
reservoir is about 350 km2. At times of high water,the dam beside the spillway is breached to allowexcess water to flow out.
While impounded for irrigation, its fishery is ofimportant secondary use. A few families living nearthe irrigation canal also use the water for domesticwashing.
Fisheries management there has gone thoughvarious stages since the reservoir was impounded.From 1982-85, a group of 10 fishers was organisedby the district and expected to sell their catch to agovernment-operated company whose purchaseswere subsidised at a relatively high price. The fishwas then sold at a lower price to end-consumers. In1986, the subsidies stopped, the arrangement nolonger became viable. The management was passedon to the three communes: Ea Soup, Ea Le and EaBung. The communes managed the reservoir on atwo-year rotation while paying the district taxesduring their respective terms.
In 1986, Ea Soup commune managed the reser-voir. Two private traders bought the catch and soldthem to end-users. In 1988–89, Ea Le took over butdid not control the fisheries. It allowed anyone whowanted to, to catch fish, and two other traders pur-chased and sold fish. In 1989–90, Ea Soup took onthe management again, since Ea Bung did not takethe responsibility. This time, anyone was allowed tocatch fish, and fishers could sell on their own. Taxeswere collected at 10% on the catches over the period,until 1993, when it was judged that catches were toolow to allow further taxation. Since 1993, no taxeshave been collected.
The district regulates the fishery to the extentbelieved possible: blasting, poisoning and electro-fishing are banned. The rules do not completelyeliminate the practices due to insufficient capital,low enforcement capacity, insufficient public aware-ness of the need for management, and a lack ofagreement among fishers. An effective mechanismtherefore does not exist. Battery-powered electro-fishing is widespread, and six fishers operate electro-fishing dynamos at certain times, as well.
Fishing in the reservoir is not lucrative. Projectsurvey results suggest that mean income from fishingis not more 25% of the mean annual family incomefor the commune. Hence, it is more of a last-resortoccupation, rather than a first choice.
Fishers believe that fish yields from the reservoirhave declined in both quantity and quality over time.The catch now is dominated by small, lower-pricedspecies. Electrofishing is commonly blamed as animportant cause. Deforestation in the watershedcauses siltation and turbidity, which will shorten thelife of the reservoir and interfere with food produc-tion in certain seasons. Pollution by pesticide-laden
runoff is suspected by some fishers at some times ofyears, when minor fish mortalities are noticed.
Stocking is a widespread and very cost-effectivepractice in many reservoirs in Dak Lak (Phuc andSollows, these Proceedings). However, in theabsence of effective controls for fishing activitiesand because of concern about loss of fish due toflooding, Ea Soup has not been stocked.
Beginning in 1993, a couple of fishers introducedcage culture of grass carp into the reservoir. By 1996,the number of cages had exceeded 150. At that point,disease broke out, and most cage owners sufferedfinancial losses, which discouraged further attemptsuntil June 1998, when three fishers, jointly with theproject, tested modifications to the old technology.
Recent trends indicate that the fishing communityaround Ea Soup is growing rapidly. The populationof the three villages around the reservoir grew froman estimated 942 in May 1997 to 1382 in April 1999,or by about 23% annually. The number of fishersmore than doubled over this period from about 40 toslightly over 100.
Estimated annual total yield between June 1997and May 1999 increased from about 51.5 to 60.5 t(17.5%). However, annual catch per unit effort forall gear types has dropped over the reporting period.Declines of about 14% and 24% were estimated forgill-nets and lift-nets, respectively, while that forlong-lines amounted to only 6.9%. The declines arenot surprising, in light of the higher number offishers.
During the survey period, project staff identified53 species in the catches from the reservoir. The pro-portion of the annual yield occupied by non-nativespecies dropped from 7.4% to 4.6%. Most representescapes from fish culture operations, althoughcommon carp makes up a respectable proportion ofthe total yield (3.1%), and is probably establishedthere. The very high diversity of species and yieldsof wild fish may be explained by two factors: the lowdraw-down allows an abundant growth of aquaticplants, which provide feed, shelter, and substrate formany species, and the large catchment area alsoallows some migratory species to reproduceupstream of the reservoir.
Work on a new upper Ea Soup dam, which will lieabout three km upstream from the current reservoir,began in October, 1999. It will have unpredictableeffects on fish yields. Construction work couldincrease the turbidity of the lower reservoir, andtoxic runoff from construction operations could alsopresent problems.
In the longer term, the dam will effectively blockupstream migration of many species, which couldlead to some local extinctions. The local fish fauna inEa Kao Reservoir declined considerably a year or

324
two after Ea Chukap dam was completed about10 km upstream from Ea Kao (Anh pers. comm.).Hence, while 18 native species were identified in EaKao prior to the start of the project (MRFP 1997),many no longer occur. Twelve native species identi-fied in catches during the project period made uponly about 1.3% of total yield.
The new dam should effectively control floodingof the old reservoir, eliminating the annual periodicbreach of the dam near the spillway. Hence, fish lossfrom the lower reservoir should be reduced. Reducedturbidity in the lower reservoir can also be antici-pated, along with a corresponding reduction innutrient loading.
The fishery is under rapidly increasing pressure(number of fishers, deforestation, destructive fishingmethods, siltation, etc.). Rapid immigration to thearea could have other effects on aquatic life. And theupper dam, now under construction, will have pro-found effects on the present fishery.
Project Activities
Project activities in Ea Soup began in March, 1997with three surveys.
A qualitative socioeconomic survey addressed avariety of questions, including relative importance ofeconomic activities, uses of the reservoir and impor-tance of these uses, diet, seasonality of activities,spatial and temporal fisheries trends, and problem-scoring.
A quantitative household survey was carried outconcurrently to obtain more rigorous data on suchfactors as economic activities, income, diet, and theimportance of the fishery.
The biological survey began in March 1997, butonly in June 1997 could it be modified to allowquantitative estimates of monthly fish yields. Thesurvey is ongoing.
Results of the various research activities are sum-marised above. In the course of work, districtofficials acknowledged that their regulation of thefishery was, largely, nominal, and they were open tothe involvement of the project in order to involve thecommunity in establishing a more effective manage-ment system. This attitude was formalised in lateJune 1998, when the project held discussions withlocal officials of the various options possible forreservoir fisheries management. The officials againindicated that they were open to involving the fishingcommunity in fisheries management, and allowedthe project to help organise the fishers, with this inmind.
Initially, a series of four two-day training sessionsin environmental awareness and related fisheriesmanagement concerns was held for fishers in Ea
Soup from July to December 1998. Trainees totalled60 (about 60% of the local fishers). While the levelof comprehension of details varied, there was wideconsensus among them at the end of the courses thatthey needed to work together to assure high, sustain-able yields from the reservoir fishery.
Twelve participants selected from the courseswere subsequently invited to form a core group towork with the fishing community. Through the firsthalf of 1999, the group worked with the fishing com-munity to carry out a poster campaign againstelectrofishing, and organised a membership drivethat culminated on 5 August 1999 in the formalestablishment of the Fishers’ Union.
Two-exposure trips for Ea Soup and Lak fisherswere held in September 1999, and led to the testingof shrimp traps and fence nets as alternatives toexisting fishing gear.
A livelihood survey was conducted in November1999 with the local Agriculture Extension Office, toidentify possible options open to fishers in the fieldof agriculture and livestock-rearing, and to discoversuitable fishing gears to replace current electro-fishing methods.
The union executive met the Director of Dak LakAquatic Products Company and Ea Kao reservoirfishery manager to give initial consideration tostocking the reservoir in the year 2000.
In December 1999, the project organised a three-day training course in Organisational Mechanics andLeadership for the union executive and likely futureexecutive members.
With the guidance of project staff, the union iscurrently considering relevant regulations and how toimplement them. The search for alternatives to non-sustainable fishing practices is ongoing. Discussionsare underway with local officials and line agencies toestablish a sustainable co-management mechanismthat would involve all three parties in future manage-ment of the reservoir fishery.
Imperatives and Related Needs in Ea Soup
Training
The process of establishing resource co-managementmust have a beginning point. Once all concernedagree on the need, training appears to be that point.The nature and targets of training can be variable,but normally, from the fishers’ point of view, aninitial focus on environmental awareness and itsrelevance to maintaining sustainable fisheries yieldsmay be a reasonable first topic. A session for con-cerned officials, followed by an appropriate numberof sessions for fishers and other resource-users, is anormal pattern.
325
Such training courses are an opportunity for par-ticipants to relate their perspectives and experiencesas well, making the first steps in communicationwith and feedback among all concerned.
Training needs in other areas evolve as the co-management process is established. For Ea Soup, theexposure tours and training in organisationalmechanics and leadership are cases in point.
Leadership
Local leadership is a critical and necessary conditionfor the success of co-management. Local leaders setan example for others to follow, set out courses ofaction, and provide energy and direction for theprocess. The community must look inward todevelop local leadership itself. Buhat (1994) indi-cated that core group formation was strategic inidentifying and developing leaders. Core groups nor-mally took responsibility for the initial implementa-tion of co-management strategies.
A core group was formed in Ea Soup at the end ofa series of 2-day training sessions, in late 1998.While the group could not, by itself, fulfil all thenecessary management tasks, it worked withmembers of the fishing community on activities thatled ultimately to the establishment of a union on5 August 1999.
There must be incentive and willingness on thepart of fishers to participate actively, with time,effort and money, in fisheries management.
The training course already given in organis-ational mechanics and leadership should help assurethat the union will be satisfactorily effective inworking with the fishing community at large, as wellas local officials and line agencies. There is not yetunanimous support for it among the fishing com-munity. Further work is needed, initially with fisherswho have joined the union, and later with all fishersusing the reservoir, after the new election held9 January 2000 of the Fishers’ Union executive.
Membership
The number of fishers with rights to fish in the reser-voir should be clearly defined, and illegal fishersshould be controlled.
Many non-registered and illegal fishers use thereservoir. Once the membership is as high as realisti-cally possible, a list of legal and illegal fishersshould be defined by the Fishers’ Union and may beannounced to local authorities. Illegal fishingactivities could then be more easily curtailed.
Support from authorities
Property rights over fisheries resources shouldaddress legal ownership of the resource. Without
legally supported property rights, resource-usershave no standing to enforce claim over the resourceagainst outsiders and other illegal users.
Effective links between local government and lineagencies will enhance co-management arrangements.The agencies may be able to provide administrative,technical, and financial support.
Pomeroy (1999) indicated that in some case studiesin the Philippines, where the local political ‘powerstructure’ was not included in the process or wasopposed to the project for some reason, community-based management interventions failed to be sus-tained after the project ended.
Co-management requires the existence of legiti-mate organisations that have a clearly defined mem-bership, mandate, and duration for that mandate. Theorganisations should have the legal right to exist andto make arrangements related to their needs (Pomeroy1999). The organisations should also represent themajority of resource-users in the community.
The Fishers’ Union of Ea Soup received inDecember 1999 a mandate from the district to allowthe fishers to monitor and manage the reservoir withthe help of other local agencies. The mandate alsoindicates that fisher union members should be regis-tered in Ea Soup Commune. They should also estab-lish a guarding group to protect and enforceregulations restricting outsiders and other illegalfishers. However, the union still needs protectionfrom the authorities against repercussions by illegalfishers.
Other support is also needed. The union has insuf-ficient financing, and the participation of authoritiesand line agencies needs more encouragement.
Well-defined communications and co-management mechanisms
Individual and community empowerment is a centralelement. Empowerment is concerned with thecapacity-building of individuals and the communityto greater social awareness, to gain greater autonomyin decision-making, to gain greater self-reliance, andto establish a balance in community power relations.
In Ea Soup, local government agencies are quitewilling to devolve decisions regarding fisheriesmanagement to the union, but the details need furtherdiscussion and agreement. A continuing role forthese agencies in managing the reservoir could wellbe necessary.
A regular communications mechanism among allconcerned needs to be established. The nature of thismechanism and the roles of the various actors needto be mutually agreeable. Resource-users will nor-mally not be to able to manage the resource alone.They require the permission, guidance and support of
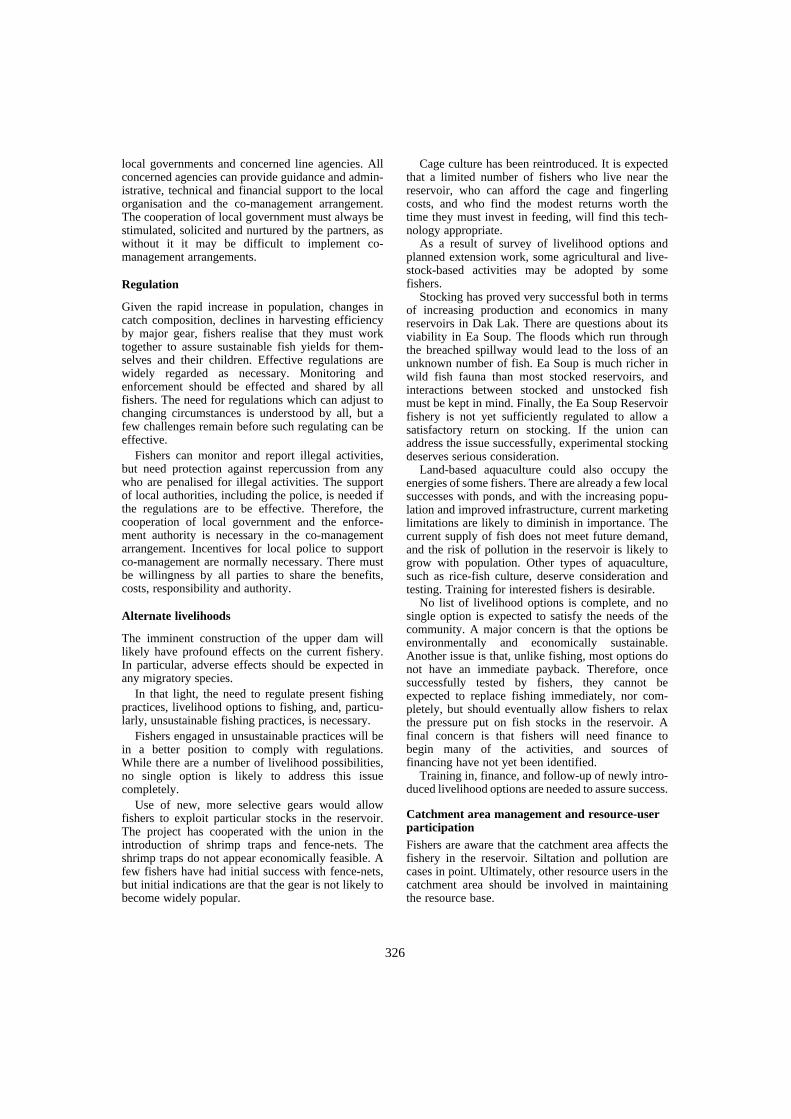
326
local governments and concerned line agencies. Allconcerned agencies can provide guidance and admin-istrative, technical and financial support to the localorganisation and the co-management arrangement.The cooperation of local government must always bestimulated, solicited and nurtured by the partners, aswithout it it may be difficult to implement co-management arrangements.
Regulation
Given the rapid increase in population, changes incatch composition, declines in harvesting efficiencyby major gear, fishers realise that they must worktogether to assure sustainable fish yields for them-selves and their children. Effective regulations arewidely regarded as necessary. Monitoring andenforcement should be effected and shared by allfishers. The need for regulations which can adjust tochanging circumstances is understood by all, but afew challenges remain before such regulating can beeffective.
Fishers can monitor and report illegal activities,but need protection against repercussion from anywho are penalised for illegal activities. The supportof local authorities, including the police, is needed ifthe regulations are to be effective. Therefore, thecooperation of local government and the enforce-ment authority is necessary in the co-managementarrangement. Incentives for local police to supportco-management are normally necessary. There mustbe willingness by all parties to share the benefits,costs, responsibility and authority.
Alternate livelihoods
The imminent construction of the upper dam willlikely have profound effects on the current fishery.In particular, adverse effects should be expected inany migratory species.
In that light, the need to regulate present fishingpractices, livelihood options to fishing, and, particu-larly, unsustainable fishing practices, is necessary.
Fishers engaged in unsustainable practices will bein a better position to comply with regulations.While there are a number of livelihood possibilities,no single option is likely to address this issuecompletely.
Use of new, more selective gears would allowfishers to exploit particular stocks in the reservoir.The project has cooperated with the union in theintroduction of shrimp traps and fence-nets. Theshrimp traps do not appear economically feasible. Afew fishers have had initial success with fence-nets,but initial indications are that the gear is not likely tobecome widely popular.
Cage culture has been reintroduced. It is expectedthat a limited number of fishers who live near thereservoir, who can afford the cage and fingerlingcosts, and who find the modest returns worth thetime they must invest in feeding, will find this tech-nology appropriate.
As a result of survey of livelihood options andplanned extension work, some agricultural and live-stock-based activities may be adopted by somefishers.
Stocking has proved very successful both in termsof increasing production and economics in manyreservoirs in Dak Lak. There are questions about itsviability in Ea Soup. The floods which run throughthe breached spillway would lead to the loss of anunknown number of fish. Ea Soup is much richer inwild fish fauna than most stocked reservoirs, andinteractions between stocked and unstocked fishmust be kept in mind. Finally, the Ea Soup Reservoirfishery is not yet sufficiently regulated to allow asatisfactory return on stocking. If the union canaddress the issue successfully, experimental stockingdeserves serious consideration.
Land-based aquaculture could also occupy theenergies of some fishers. There are already a few localsuccesses with ponds, and with the increasing popu-lation and improved infrastructure, current marketinglimitations are likely to diminish in importance. Thecurrent supply of fish does not meet future demand,and the risk of pollution in the reservoir is likely togrow with population. Other types of aquaculture,such as rice-fish culture, deserve consideration andtesting. Training for interested fishers is desirable.
No list of livelihood options is complete, and nosingle option is expected to satisfy the needs of thecommunity. A major concern is that the options beenvironmentally and economically sustainable.Another issue is that, unlike fishing, most options donot have an immediate payback. Therefore, oncesuccessfully tested by fishers, they cannot beexpected to replace fishing immediately, nor com-pletely, but should eventually allow fishers to relaxthe pressure put on fish stocks in the reservoir. Afinal concern is that fishers will need finance tobegin many of the activities, and sources offinancing have not yet been identified.
Training in, finance, and follow-up of newly intro-duced livelihood options are needed to assure success.
Catchment area management and resource-user participation Fishers are aware that the catchment area affects thefishery in the reservoir. Siltation and pollution arecases in point. Ultimately, other resource users in thecatchment area should be involved in maintainingthe resource base.

327
ReferencesBuhat, D. 1994. Community-Based Coral Reef and
Fisheries Management, San Salvador Island, Philippines.In: White, A., Hale, L., Renard, Y. and Cortesi, L. ed.Collaborative and Community-Based Management ofCoral Reefs: Kumarian Press.
Dak Lak Statistical Yearbook, 1998Phounsavath, S., Hartmann, W.D., Logarta, M. and Degen,
P. 1999. Are State-User Relations Conducive toFisheries Co-Management in the Lower Mekong Basin.Second MRC Fisheries Technical Symposium,December, 1999. Phnom Penh, 29 p.
Phuc, P.D., Vinh, N.N., Nhung, N.T., Dung, L.T.A., Dan,H.N., Huy, P.T., Bich, N.T., Yen, N.T.H., An, N.Q.,
Logarta, M.D. and Sollows, J.D. In press. Managementof Reservoir Fisheries: Findings from Ea Soup,1997–1999. MRFP Technical Report No. VN4-99. 41 p.
Logarta, M. 1999. Prospects for Co-Management of Reser-voir Fisheries in Dak Lak. National Reservoir FisheriesSeminar, May 1999, Nha Trang, Viet Nam.
Pomeroy, R.S. 1999. Key Conditions and Principles forSuccessful Fisheries Co-Management. The Fisheries Co-management Research Project. Manila: ICLARM.
SWAP/Action Plan for Water Resources DevelopmentPhase III; Upper Srepok Bash, Vietnam. 1996. Water-shed Changes in Upper Srepok Basin and Dak Lak.Working Paper No. 17. 24 p.

328
Cage Culture of Finfish in Australian Lakes and Reservoirs: A Pilot-scale Case Study of Biological, Environmental and Economic Viability
G.J. Gooley1, Sena S. De Silva2, B.A. Ingram1, L.J. McKinnon1,F.M. Gavine1 and W. Dalton1
Abstract
With an increasing emphasis on ecologically sustainable development of natural resources, theneed to integrate where possible appropriate farming practices to enhance farm productivity andwater use efficiency is becoming increasingly apparent in Australia. This combination of environ-mental and economic imperatives is now resulting in serious consideration being given to moreinnovative inland water uses such as commercial scale aquaculture in both private and publicwaters, including cage culture of finfish in lakes and reservoirs. In the present study, an investi-gation of experimental-scale cage culture in irrigation lakes and reservoirs was undertaken withinthe Goulburn-Broken catchment of the Goulburn-Murray Irrigation District (GMID) of Victoria, inan attempt to objectively evaluate biotechnical, environmental and economic viability of apotential commercial enterprise. Results of the field trials indicate that cage culture in lakes andreservoirs within the GMID is biotechnically feasible, if not optimal, for at least some species inwhich suitable water quality and ambient water temperatures can be achieved. Economic analysisindicates the need to optimise system design and fish production parameters to maximiseprofitability. However, at a catchment scale, cage culture of finfish in lakes and reservoirspotentially can accommodate effective recovery of full external (environmental) costs of waterusage, and potentially offers investors a significant competitive advantage over other irrigatedagribusiness sectors. The outcomes of the present study should facilitate the formulation of draftBest Practice technical and environmental management guidelines for potential cage culturedevelopments in Australian lakes and reservoirs.
AUSTRALIA is a relatively dry country, with half thelandmass having a mean annual rainfall of less than300 mm, and only 20% having more than 600 mm.The majority of the rainfall occurs in the tropical farnorth and the cold temperate far south of the country.The level of water storage and diversion for irrigatedagriculture varies widely, with the highest rates ofdiversion frequently occurring in areas where surfacerunoff is limited and water resources are almost fullycommitted (Thomas 1999).
Australia’s water use exceeds 20 000 GL perannum, an increase of 25% in the period from 1983/84
to 1995/96, due largely to increased demand from irri-gated agriculture (presently about 72% of nationalwater demand). Production of irrigated commoditiesrepresents about one third of Australian farm exports,worth approximately AUD$6400 million in 1995/96(Thomas 1999). The total irrigated area in Australiaof about 2.25 million ha consists primarily of cotton(13.2%), pasture/dairy (41%), horticulture (11.1%),sugar (10%) and cereal/rice (15%) production (sourceBureau of Rural Sciences, Australia, and AustralianBureau of Statistics based on 1996/97 census). Asso-ciated with this production is an extensive network ofwater storages mostly situated in or adjacent to thedefined irrigation areas around the country (Figure 1)(Hallows and Thompson 1997).
Within the Goulburn-Murray Irrigation District(GMID) of Victoria (Figure 2) alone there areapproximately 490 000 ha of irrigated farmland
1Marine and Freshwater Resources Institute, AquacultureProgram, Private Bag 20, Alexandra, Victoria 3714, Aust-ralia ph: +61 3 5774 2208 fax: +61 3 5774 2659. E-mail:[email protected] of Ecology & Environment, Deakin University,Warrnambool, Victoria 3280
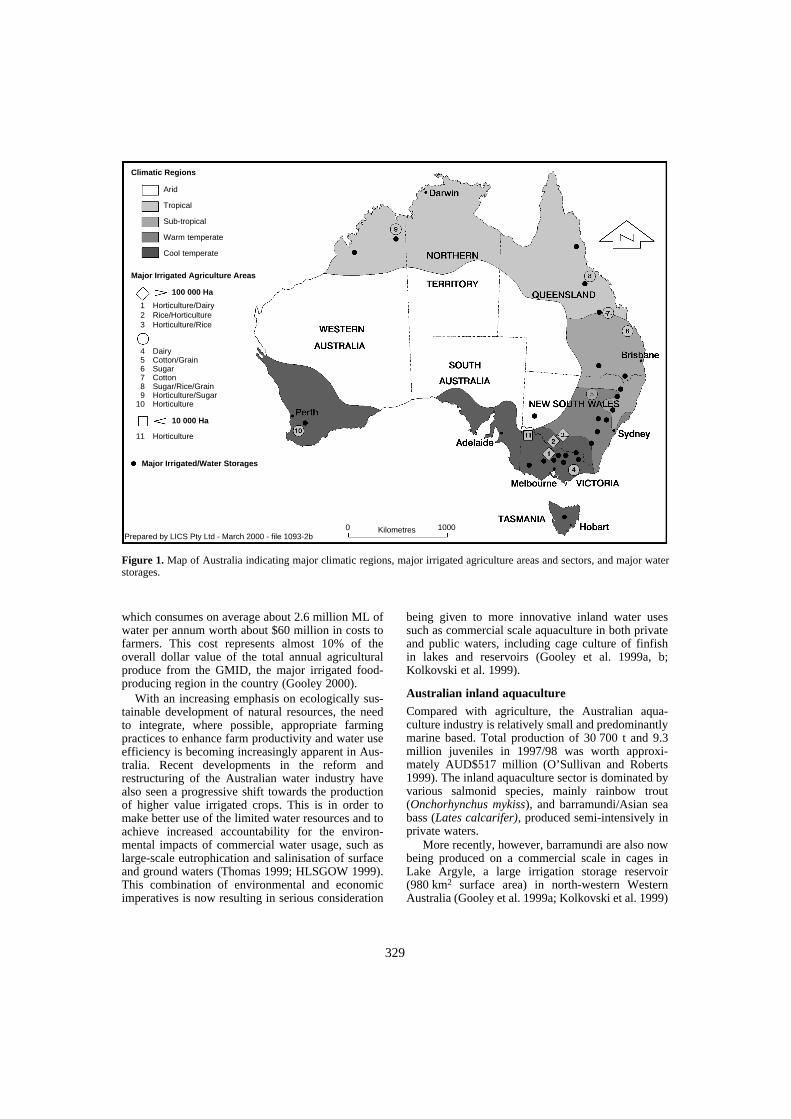
329
which consumes on average about 2.6 million ML ofwater per annum worth about $60 million in costs tofarmers. This cost represents almost 10% of theoverall dollar value of the total annual agriculturalproduce from the GMID, the major irrigated food-producing region in the country (Gooley 2000).
With an increasing emphasis on ecologically sus-tainable development of natural resources, the needto integrate, where possible, appropriate farmingpractices to enhance farm productivity and water useefficiency is becoming increasingly apparent in Aus-tralia. Recent developments in the reform andrestructuring of the Australian water industry havealso seen a progressive shift towards the productionof higher value irrigated crops. This is in order tomake better use of the limited water resources and toachieve increased accountability for the environ-mental impacts of commercial water usage, such aslarge-scale eutrophication and salinisation of surfaceand ground waters (Thomas 1999; HLSGOW 1999).This combination of environmental and economicimperatives is now resulting in serious consideration
being given to more innovative inland water usessuch as commercial scale aquaculture in both privateand public waters, including cage culture of finfishin lakes and reservoirs (Gooley et al. 1999a, b;Kolkovski et al. 1999).
Australian inland aquaculture
Compared with agriculture, the Australian aqua-culture industry is relatively small and predominantlymarine based. Total production of 30 700 t and 9.3million juveniles in 1997/98 was worth approxi-mately AUD$517 million (O’Sullivan and Roberts1999). The inland aquaculture sector is dominated byvarious salmonid species, mainly rainbow trout(Onchorhynchus mykiss), and barramundi/Asian seabass (Lates calcarifer), produced semi-intensively inprivate waters.
More recently, however, barramundi are also nowbeing produced on a commercial scale in cages inLake Argyle, a large irrigation storage reservoir(980 km2 surface area) in north-western WesternAustralia (Gooley et al. 1999a; Kolkovski et al. 1999)
Figure 1. Map of Australia indicating major climatic regions, major irrigated agriculture areas and sectors, and major waterstorages.
Arid
Tropical
Sub-tropical
Warm temperate
Cool temperate
Climatic Regions
Major Irrigated Agriculture Areas
Major Irrigated/Water Storages
100 000 Ha
1 Horticulture/Dairy2 Rice/Horticulture3 Horticulture/Rice
4 Dairy5 Cotton/Grain6 Sugar7 Cotton8 Sugar/Rice/Grain9 Horticulture/Sugar
10 Horticulture
10 000 Ha
11 Horticulture
0 1000KilometresPrepared by LICS Pty Ltd - March 2000 - file 1093-2b

330
(see also Figure 3). This is the only such aquacultureoperation in an Australian lake or reservoir, and is thepreliminary stage of a projected 10 000 t per annumbarramundi cage culture industry in the lake (Kolko-vski et al. 1999). In other developments, considera-tion is now being given to cage culture of Atlanticsalmon parr in Tasmanian freshwater lakes, includinghydro-electric storage reservoirs, as a cost-effectivemeans of increasing hatchery capacity for theAUD$80 million pa Tasmanian salmon industry(Anon. 1999). The key issue potentially constrainingcommercial development of this type in Australia isthe threat of environmental impact from excessivenutrient discharge on water quality. Other issuesinclude perceived loss of visual amenity to the com-munity at large, threat of horizontal disease trans-mission to co-habitant wild fish stocks, escape ofhatchery stocks which may compete with and/or com-promise the genetic integrity of wild stocks, andoverall general conflict with other water users, e.g.recreational fishing and boating.
The resource planning and associated Govern-ment policy implications for Australian inland aqua-culture are complex, and dictate the need fordecision support databases which enable objectiveanalysis of relevant issues, establishment of relevantenvironmental, economic and fish production ‘BestPractice’ benchmarks, and the development of rele-vant management tools for industry and resourcemanagers. In the present study, an investigation ofexperimental-scale cage culture in irrigation lakesand reservoirs was undertaken within the Goulburn-Broken catchment of the GMID of Victoria (Figure2), in an attempt to objectively evaluate biotech-nical, environmental and economic viability of apotential commercial enterprise. This study is of oneof several being undertaken within the greaterMurray-Darling Basin, Australia’s major food-pro-ducing region (Figure 1), which are investigatingvarious aspects of integrated agri-aquaculturesystems (Gooley 2000; Gooley et al. 1999a,b;Ingram et al. 1999).
Figure 2. Map of Victorian water and irrigation resources showing location of major catchment areas, irrigation districts andfarming sectors, significant natural lakes and major irrigation storages.
Major catchment areas
Major irrigation districts
Significant natural lakes >1000 ha
Major irrigation storages
GMID study sites
Kilometres
Prepared by LICS Pty Ltd - March 2000 - file 1093-1b
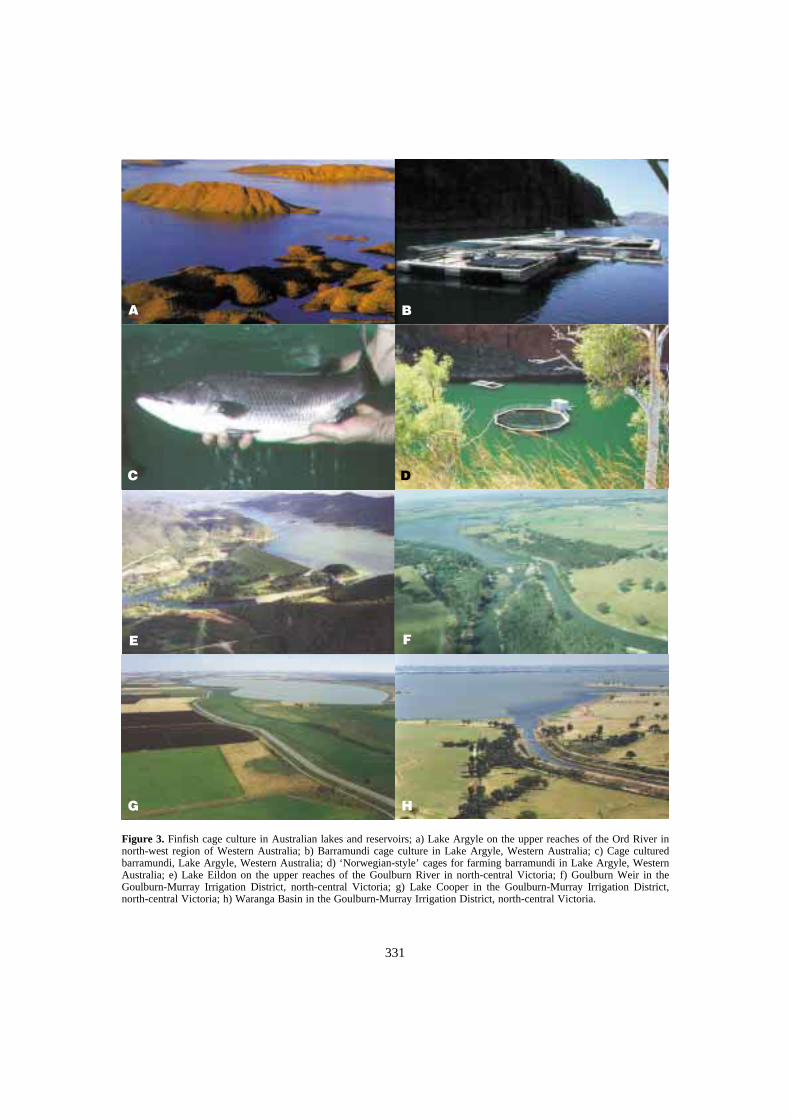
331
Figure 3. Finfish cage culture in Australian lakes and reservoirs; a) Lake Argyle on the upper reaches of the Ord River innorth-west region of Western Australia; b) Barramundi cage culture in Lake Argyle, Western Australia; c) Cage culturedbarramundi, Lake Argyle, Western Australia; d) ‘Norwegian-style’ cages for farming barramundi in Lake Argyle, WesternAustralia; e) Lake Eildon on the upper reaches of the Goulburn River in north-central Victoria; f) Goulburn Weir in theGoulburn-Murray Irrigation District, north-central Victoria; g) Lake Cooper in the Goulburn-Murray Irrigation District,north-central Victoria; h) Waranga Basin in the Goulburn-Murray Irrigation District, north-central Victoria.
A B
D
EE F
HG
C

332
Figure 4. Finfish cage culture in Australian lakes and reservoirs; a) Floating cages used in trials during the present study;b) Pilot-scale cage culture system in Goulburn Weir, Victoria during the present study; c) Pilot-scale cage culture system inLake Cooper, Victoria during the present study; d) Silver perch stockers at the start of cage culture trials during the presentstudy; e) Cage cultured silver perch harvested at the completion of cage culture trials during the present study; f) Introducedwild carp, common in GMID lakes and reservoirs in Victoria; g) Endemic, fish eating cormorants, common throughout GMIDlakes and reservoirs in Victoria; h) Endemic, fish eating water rats, common throughout GMID lakes and reservoirs in Victoria.
A B
D
E F F
HG
C
333
Materials and Methods
Study sites and experimental design
The case study specifically focuses on cage cultureof silver perch (Bidyanus bidyanus), an endemicwarm water Murray-Darling species, and the intro-duced salmonids, rainbow trout (Onchorhynchusmykiss) and Atlantic salmon (Salmo salar), in threelakes and reservoirs within the GMID, viz. LakeCooper (1100 ha surface area; 24 000 ML capacity),Waranga Basin (5850 ha surface area; 411 000 MLcapacity) and Goulburn Weir (1120 ha surface area;25 000 ML capacity) (Figures 2–4). All three watersare relatively shallow (mean depth 2–3 m) and usedto varying degrees for irrigation water storage and,the latter two at least, for flow regulation. GoulburnWeir is an on-river storage, located in the mid-reaches of the Goulburn-Broken catchment, andsupplies water directly to Waranga Basin. The othertwo waters are off-river storages located furtherdownstream in the catchment, with Waranga Basinspecifically regulating flows to much of the irriga-tion supply channels within the GMID. Lake Cooperis predominantly a terminal storage for surplusirrigation and drainage waters within the GMID.
The performance of fish in all three waters wasstatistically compared in terms of growth rates andsurvival for trials using silver perch (first of twotrials) and rainbow trout (single trial only). Sub-sequent trials using both silver perch (second trial)and Atlantic salmon were completed at GoulburnWeir only. No attempt was made to statistically com-pare growth and survival of fish between waters andspecies over the full term of the study due to theinherent temporal and spatial variability involved insuch a comparison. Qualitative comparisons, how-ever, were made to assess relevant trends.
Trials were completed at different times of theyear to optimise ambient climatic conditions for thetarget species. Cages were of a floating, rectangulardesign and 2 m3 in capacity (Figure 4). Stocked fishwere hatchery-bred and feeding was by hand and/orby auto feeders using commercially available,extruded pellets. All systems were standardisedwhere appropriate with respect to design, and alltreatments were replicated to enable statisticalanalysis where appropriate.
Analysis of fish growth (%SGR) and survivalrates for relevant trials were analysed where appro-priate using the SAS General Linear Models Pro-cedure and Tukey’s Multiple Range Test, followingtesting for homogeneity using Cochran’s Test (SASInstitute Inc. 1990). Standard error bars for all graphswere generated from SAS and were equal to twostandard deviations of the mean.
A full suite of water quality parameters wasmeasured for the purpose of correlating with fish pro-duction levels, and for evaluating the level ofenvironmental impact on the culture waters them-selves. Parameters measured included total ammoniaas nitrogen (TAN), pH, total phosphorus (surface andsediment), dissolved oxygen, temperature, total alka-linity, suspended solids, conductivity, Secchi diskdepth and turbidity. Measurements were replicatedand water samples were collected weekly from twosites, viz. one from among the cages and a second ata reference point 200 m away from the cages.
In this paper, only summary results of selectedbiotechnical and water quality parameters measuredand analysed during the present study are presented.A more detailed description of experimental designand results is provided by Ingram et al. (1999).
Nutrient mass balance model
In natural waters, phosphorus (P) occurs predomi-nantly as phosphate, which may be in several formsincluding orthophosphates, condensed phosphatesand organically bound phosphates, while nitrogen(N) occurs as ammonia (NH3), ammonium (NH4
+),nitrite (NO2
–) and nitrate (NO3–) (Baldwin 1999).
These may be soluble, bound to detritus or in thebodies of aquatic organisms. Nutrients in the effluentwaters from a fish farm are primarily derived fromfeed waste (fines/dust and feed not eaten by fish),dissolved metabolic waste (NH3) excreted from thegills of the fish and excreted faecal wastes. Nutrientsdischarged from fish farms are characterised by bothdissolved and solid components (including sus-pended solids), the relative proportions of which willvary during the production cycle. Dissolved outputsare primarily composed of N in the form of ammoniaand urea produced by fish metabolism (excretedwastes), and P leached from solid wastes.
The simplified nutrient mass balance modeldeveloped and utilised in the present study (Figure 5)provides the framework for quantifying estimatednutrient flux, based on target species, feed type/rate,food conversion ratio and fish stocking density,within an inland finfish cage culture system. Specifi-cally the model derives estimated levels of N and Pdischarged from the cage culture system to theenvironment, and is based on models developed fortrout farming (GBWQWG 1995b; Ingram 1999a, b)and integrated irrigation farming of silver perch(Gooley et al. 1999a, b) in Victoria. For the purposesof the economic analysis undertaken as part of thepresent study, P is assumed to be the primarynutrient which predominantly limits algal bloomsand overall levels of eutrophication in temperateinland waters of Australia.
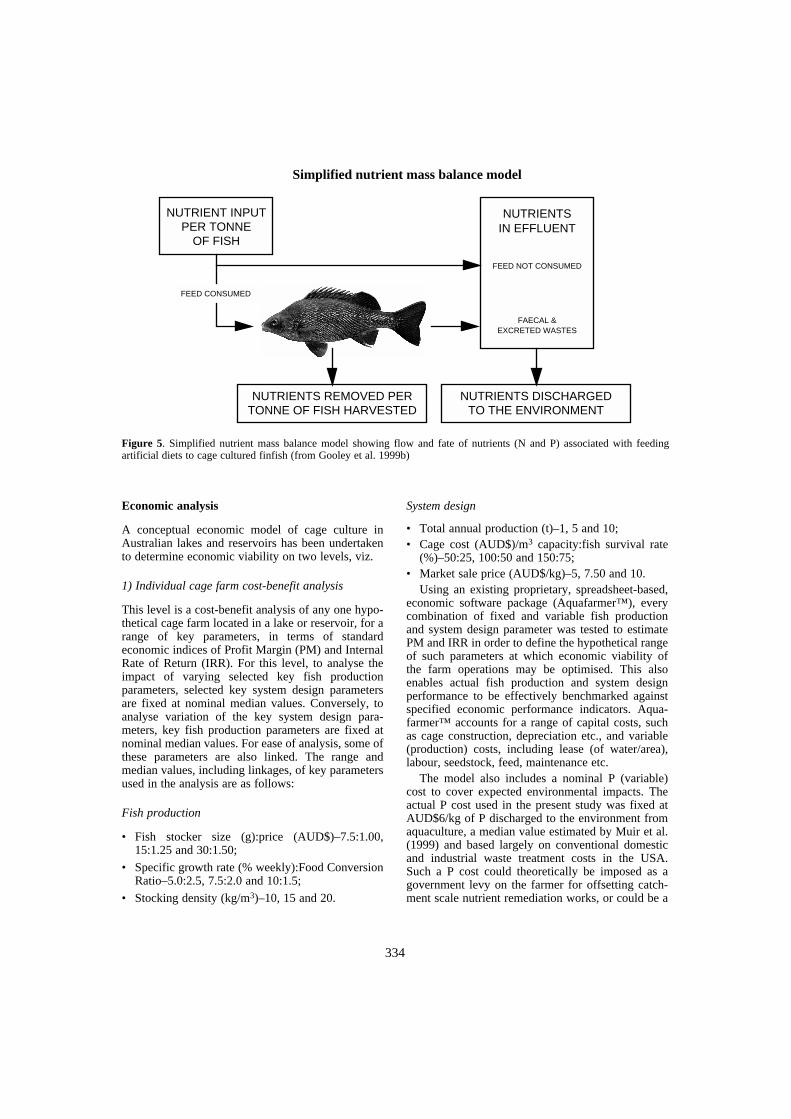
334
Economic analysis
A conceptual economic model of cage culture inAustralian lakes and reservoirs has been undertakento determine economic viability on two levels, viz.
1) Individual cage farm cost-benefit analysis
This level is a cost-benefit analysis of any one hypo-thetical cage farm located in a lake or reservoir, for arange of key parameters, in terms of standardeconomic indices of Profit Margin (PM) and InternalRate of Return (IRR). For this level, to analyse theimpact of varying selected key fish productionparameters, selected key system design parametersare fixed at nominal median values. Conversely, toanalyse variation of the key system design para-meters, key fish production parameters are fixed atnominal median values. For ease of analysis, some ofthese parameters are also linked. The range andmedian values, including linkages, of key parametersused in the analysis are as follows:
Fish production
• Fish stocker size (g):price (AUD$)–7.5:1.00,15:1.25 and 30:1.50;
• Specific growth rate (% weekly):Food ConversionRatio–5.0:2.5, 7.5:2.0 and 10:1.5;
• Stocking density (kg/m3)–10, 15 and 20.
System design
• Total annual production (t)–1, 5 and 10;• Cage cost (AUD$)/m3 capacity:fish survival rate
(%)–50:25, 100:50 and 150:75;• Market sale price (AUD$/kg)–5, 7.50 and 10.
Using an existing proprietary, spreadsheet-based,economic software package (Aquafarmer™), everycombination of fixed and variable fish productionand system design parameter was tested to estimatePM and IRR in order to define the hypothetical rangeof such parameters at which economic viability ofthe farm operations may be optimised. This alsoenables actual fish production and system designperformance to be effectively benchmarked againstspecified economic performance indicators. Aqua-farmer™ accounts for a range of capital costs, suchas cage construction, depreciation etc., and variable(production) costs, including lease (of water/area),labour, seedstock, feed, maintenance etc.
The model also includes a nominal P (variable)cost to cover expected environmental impacts. Theactual P cost used in the present study was fixed atAUD$6/kg of P discharged to the environment fromaquaculture, a median value estimated by Muir et al.(1999) and based largely on conventional domesticand industrial waste treatment costs in the USA.Such a P cost could theoretically be imposed as agovernment levy on the farmer for offsetting catch-ment scale nutrient remediation works, or could be a
Figure 5. Simplified nutrient mass balance model showing flow and fate of nutrients (N and P) associated with feedingartificial diets to cage cultured finfish (from Gooley et al. 1999b)
NUTRIENTSIN EFFLUENT
FEED NOT CONSUMED
FAECAL &EXCRETED WASTES
NUTRIENTS DISCHARGEDTO THE ENVIRONMENT
NUTRIENTS REMOVED PERTONNE OF FISH HARVESTED
NUTRIENT INPUTPER TONNE
OF FISH
FEED CONSUMED
Simplified nutrient mass balance model
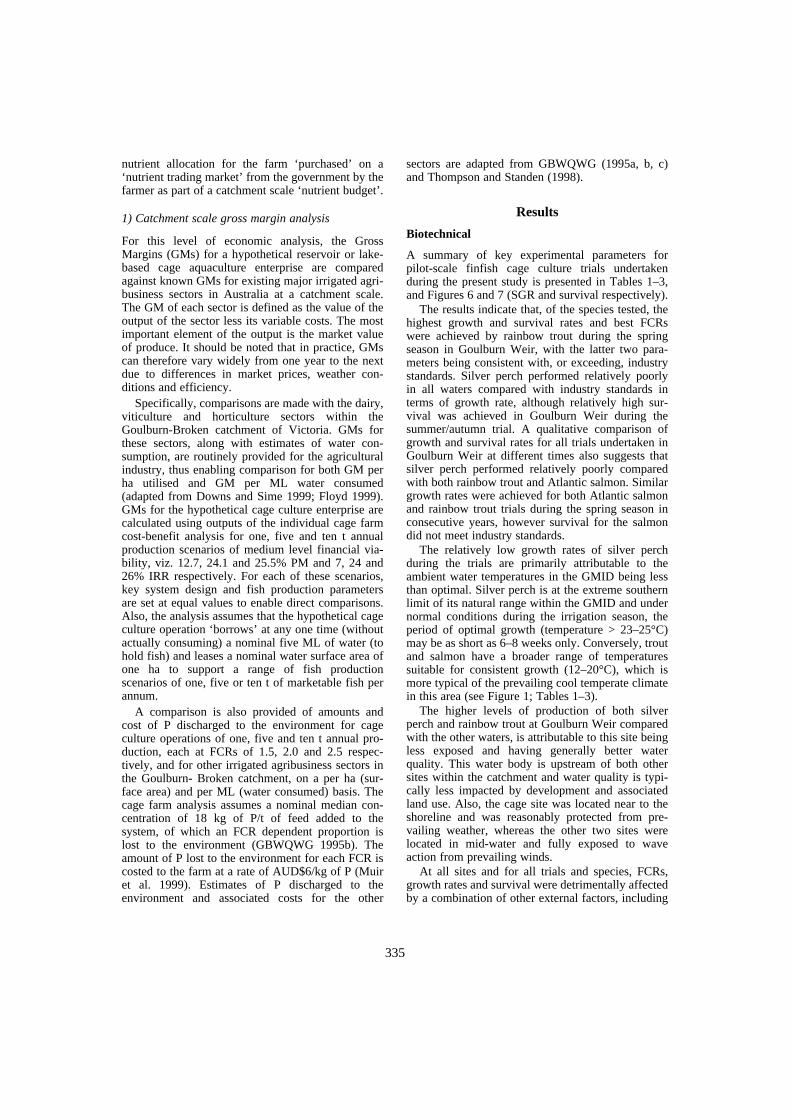
335
nutrient allocation for the farm ‘purchased’ on a‘nutrient trading market’ from the government by thefarmer as part of a catchment scale ‘nutrient budget’.
1) Catchment scale gross margin analysis
For this level of economic analysis, the GrossMargins (GMs) for a hypothetical reservoir or lake-based cage aquaculture enterprise are comparedagainst known GMs for existing major irrigated agri-business sectors in Australia at a catchment scale.The GM of each sector is defined as the value of theoutput of the sector less its variable costs. The mostimportant element of the output is the market valueof produce. It should be noted that in practice, GMscan therefore vary widely from one year to the nextdue to differences in market prices, weather con-ditions and efficiency.
Specifically, comparisons are made with the dairy,viticulture and horticulture sectors within theGoulburn-Broken catchment of Victoria. GMs forthese sectors, along with estimates of water con-sumption, are routinely provided for the agriculturalindustry, thus enabling comparison for both GM perha utilised and GM per ML water consumed(adapted from Downs and Sime 1999; Floyd 1999).GMs for the hypothetical cage culture enterprise arecalculated using outputs of the individual cage farmcost-benefit analysis for one, five and ten t annualproduction scenarios of medium level financial via-bility, viz. 12.7, 24.1 and 25.5% PM and 7, 24 and26% IRR respectively. For each of these scenarios,key system design and fish production parametersare set at equal values to enable direct comparisons.Also, the analysis assumes that the hypothetical cageculture operation ‘borrows’ at any one time (withoutactually consuming) a nominal five ML of water (tohold fish) and leases a nominal water surface area ofone ha to support a range of fish productionscenarios of one, five or ten t of marketable fish perannum.
A comparison is also provided of amounts andcost of P discharged to the environment for cageculture operations of one, five and ten t annual pro-duction, each at FCRs of 1.5, 2.0 and 2.5 respec-tively, and for other irrigated agribusiness sectors inthe Goulburn- Broken catchment, on a per ha (sur-face area) and per ML (water consumed) basis. Thecage farm analysis assumes a nominal median con-centration of 18 kg of P/t of feed added to thesystem, of which an FCR dependent proportion islost to the environment (GBWQWG 1995b). Theamount of P lost to the environment for each FCR iscosted to the farm at a rate of AUD$6/kg of P (Muiret al. 1999). Estimates of P discharged to theenvironment and associated costs for the other
sectors are adapted from GBWQWG (1995a, b, c)and Thompson and Standen (1998).
Results
Biotechnical
A summary of key experimental parameters forpilot-scale finfish cage culture trials undertakenduring the present study is presented in Tables 1–3,and Figures 6 and 7 (SGR and survival respectively).
The results indicate that, of the species tested, thehighest growth and survival rates and best FCRswere achieved by rainbow trout during the springseason in Goulburn Weir, with the latter two para-meters being consistent with, or exceeding, industrystandards. Silver perch performed relatively poorlyin all waters compared with industry standards interms of growth rate, although relatively high sur-vival was achieved in Goulburn Weir during thesummer/autumn trial. A qualitative comparison ofgrowth and survival rates for all trials undertaken inGoulburn Weir at different times also suggests thatsilver perch performed relatively poorly comparedwith both rainbow trout and Atlantic salmon. Similargrowth rates were achieved for both Atlantic salmonand rainbow trout trials during the spring season inconsecutive years, however survival for the salmondid not meet industry standards.
The relatively low growth rates of silver perchduring the trials are primarily attributable to theambient water temperatures in the GMID being lessthan optimal. Silver perch is at the extreme southernlimit of its natural range within the GMID and undernormal conditions during the irrigation season, theperiod of optimal growth (temperature > 23–25°C)may be as short as 6–8 weeks only. Conversely, troutand salmon have a broader range of temperaturessuitable for consistent growth (12–20°C), which ismore typical of the prevailing cool temperate climatein this area (see Figure 1; Tables 1–3).
The higher levels of production of both silverperch and rainbow trout at Goulburn Weir comparedwith the other waters, is attributable to this site beingless exposed and having generally better waterquality. This water body is upstream of both othersites within the catchment and water quality is typi-cally less impacted by development and associatedland use. Also, the cage site was located near to theshoreline and was reasonably protected from pre-vailing weather, whereas the other two sites werelocated in mid-water and fully exposed to waveaction from prevailing winds.
At all sites and for all trials and species, FCRs,growth rates and survival were detrimentally affectedby a combination of other external factors, including
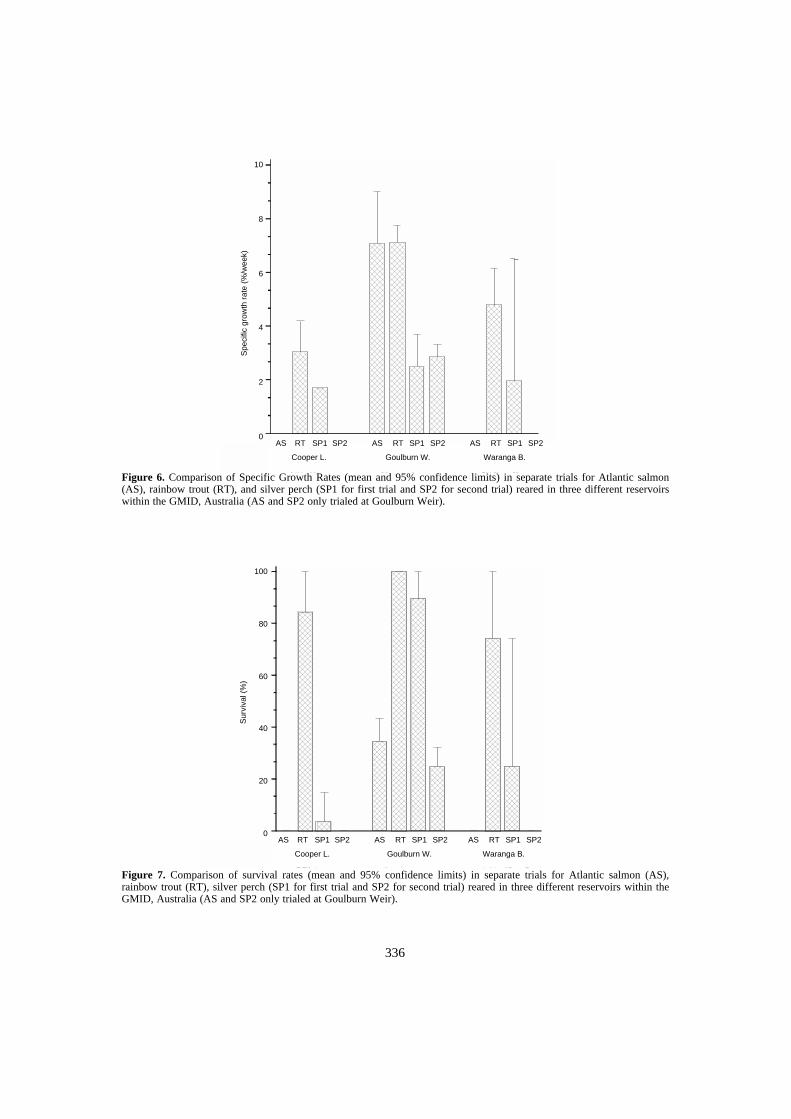
336
Figure 6. Comparison of Specific Growth Rates (mean and 95% confidence limits) in separate trials for Atlantic salmon(AS), rainbow trout (RT), and silver perch (SP1 for first trial and SP2 for second trial) reared in three different reservoirswithin the GMID, Australia (AS and SP2 only trialed at Goulburn Weir).
Figure 7. Comparison of survival rates (mean and 95% confidence limits) in separate trials for Atlantic salmon (AS),rainbow trout (RT), silver perch (SP1 for first trial and SP2 for second trial) reared in three different reservoirs within theGMID, Australia (AS and SP2 only trialed at Goulburn Weir).
10
8
6
4
2
0
Spe
cific
gro
wth
rat
e (%
/wee
k)
AS RT SP1 SP2 AS RT SP1 SP2 AS RT SP1 SP2
Cooper L. Goulburn W. Waranga B.
100
80
60
40
20
0
Sur
viva
l (%
)
AS RT SP1 SP2 AS RT SP1 SP2 AS RT SP1 SP2
Cooper L. Goulburn W. Waranga B.
337
* industry standard in parentheses
* industry standard in parentheses
Table 1. Summary of rainbow trout cage culture trials undertaken during spring 1997 in three irrigation storages in theGoulburn-Murray Irrigation District, Victoria, Australia, as part of the present study; weights and lengths include standarderror.
Lake Cooper Goulburn Weir Waranga Basin
Species Rainbow Trout Rainbow Trout Rainbow TroutDuration of Trial 17 weeks 17 weeks 17 weeks
No. fish/replicate 95 95 95
Initial Weight (g) 109 ± 3.4 114 ± 5.3 103 ± 3.1Final Weight (g) 180 ± 4.7 372 ± 13.7 231 ± 7.9
Initial Length (mm) 203 ± 2.3 206 ± 3.0 201 ± 2.1Final Length (mm) 234 ± 2.0 286 ± 3.6 256 ± 3.0
SGR (%/week)* 3.06 (10) 7.35 (10) 5.12 (10)FCR* 4.46 (1.5–2.5) 1.79 (1.5–2.5) 2.66 (1.5–2.5)Survival* (%) 85 (90–95) 100 (90–95) 74 (90–95)Water Temp. °C mean (range) 12 (6–19) 12 (9–18) 12 (7–17)
Table 2. Summary of silver perch cage culture trials undertaken during summer/autumn 1996/7 in three irrigation storagesin the Goulburn-Murray Irrigation District, Victoria, Australia, as part of the present study; weights and lengths includestandard error.
Lake Cooper Goulburn Weir Waranga Basin
Species Silver Perch Silver Perch Silver PerchDuration of Trial 23 23 23
No. fish/replicate 100 100 100
Initial Weight (g) 134 ± 8.4 115 ± 8.4 131 ± 7.2Final Weight (g) 203 ± 26.3 219 ± 13.4 238 ± 14.9
Initial Length (mm) 203 ± 3.8 189 ± 4.9 204 ± 3.6Final Length (mm) 226 ± 8.7 231 ± 3.9 243 ± 4.8
SGR (%/week)* 1.73 (7–10) 2.82 (7–10) 2.66 (7–10)Survival (%)* 3.5 (90–95) 89.8 (90–95) 25.0 (90–95)
Water Temp. °C mean (range) 19 (13–26) 17 (14–22) 18 (12–25)
Table 3. Summary of finfish cage culture trials for a range of species and seasonal conditions undertaken during 1996–99in Goulburn Weir, Victoria, Australia, as part of the present study; weights and lengths include standard error.
Atlantic salmon Silver perch Rainbow trout
Spring Summer/Autumn Summer Spring
Duration of trial 8 weeks 23 weeks 20 weeks 17 weeks
No. fish/replicate 100 100 100 100
Initial weight (g) 57 ± 0.71 115 ± 8.34 101 ± 1.46 114 ± 5.3Final weight (g) 101 ± 1.89 219 ± 13.4 177 ± 5.31 372 ± 13.7
Initial length (mm) 170 ± 0.69 189 ± 4.9 185.4 ± 0.85 206 ± 3.0Final length (mm) 208 (± 1.26) 231 (± 3.87) 221 (± 1.88) 286 ± 3.6
SGR (%/week)* 7.23 (7–10) 2.82 (7–10) 2.81 (7–10) 7.35 (10)Survival (%)* 34.5 (90–95) 89.8 (90–95) 24.8 (90–95) 100 (90–95)
Water temp. °C mean (range) 20 (17–23) 17 (14–22) 20 (13–24) 12 (9–18)
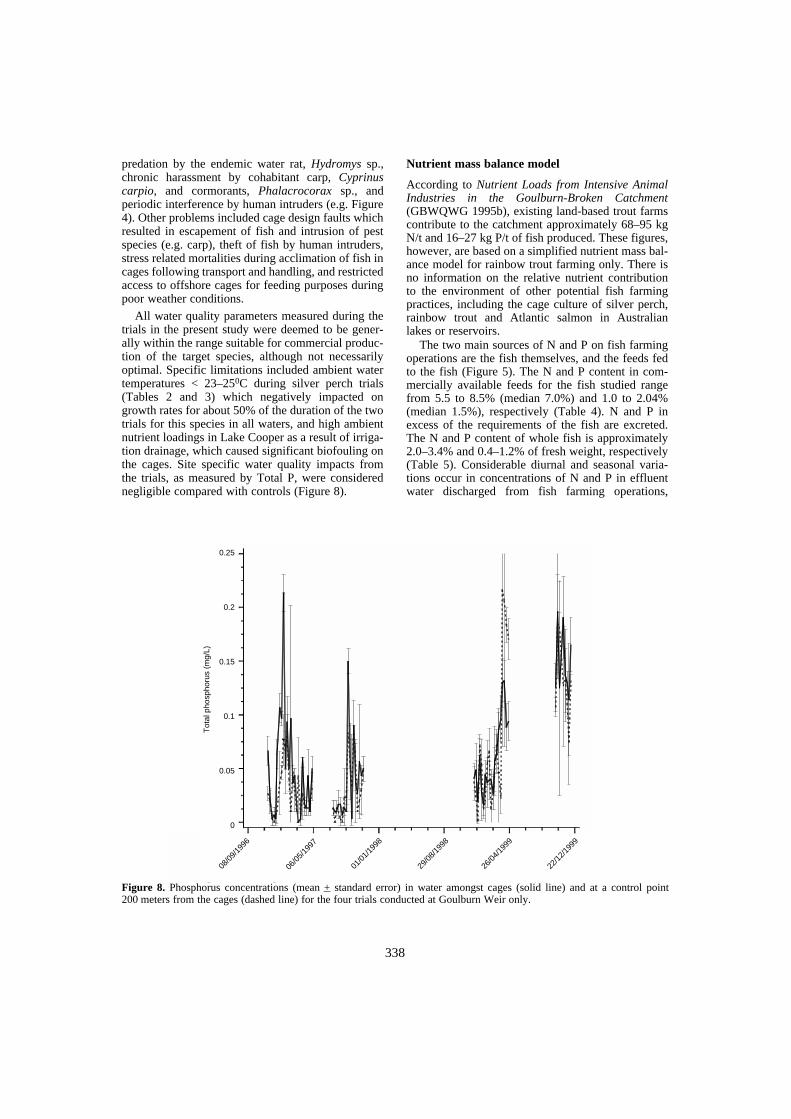
338
predation by the endemic water rat, Hydromys sp.,chronic harassment by cohabitant carp, Cyprinuscarpio, and cormorants, Phalacrocorax sp., andperiodic interference by human intruders (e.g. Figure4). Other problems included cage design faults whichresulted in escapement of fish and intrusion of pestspecies (e.g. carp), theft of fish by human intruders,stress related mortalities during acclimation of fish incages following transport and handling, and restrictedaccess to offshore cages for feeding purposes duringpoor weather conditions.
All water quality parameters measured during thetrials in the present study were deemed to be gener-ally within the range suitable for commercial produc-tion of the target species, although not necessarilyoptimal. Specific limitations included ambient watertemperatures < 23–250C during silver perch trials(Tables 2 and 3) which negatively impacted ongrowth rates for about 50% of the duration of the twotrials for this species in all waters, and high ambientnutrient loadings in Lake Cooper as a result of irriga-tion drainage, which caused significant biofouling onthe cages. Site specific water quality impacts fromthe trials, as measured by Total P, were considerednegligible compared with controls (Figure 8).
Nutrient mass balance model
According to Nutrient Loads from Intensive AnimalIndustries in the Goulburn-Broken Catchment(GBWQWG 1995b), existing land-based trout farmscontribute to the catchment approximately 68–95 kgN/t and 16–27 kg P/t of fish produced. These figures,however, are based on a simplified nutrient mass bal-ance model for rainbow trout farming only. There isno information on the relative nutrient contributionto the environment of other potential fish farmingpractices, including the cage culture of silver perch,rainbow trout and Atlantic salmon in Australianlakes or reservoirs.
The two main sources of N and P on fish farmingoperations are the fish themselves, and the feeds fedto the fish (Figure 5). The N and P content in com-mercially available feeds for the fish studied rangefrom 5.5 to 8.5% (median 7.0%) and 1.0 to 2.04%(median 1.5%), respectively (Table 4). N and P inexcess of the requirements of the fish are excreted.The N and P content of whole fish is approximately2.0–3.4% and 0.4–1.2% of fresh weight, respectively(Table 5). Considerable diurnal and seasonal varia-tions occur in concentrations of N and P in effluentwater discharged from fish farming operations,
Figure 8. Phosphorus concentrations (mean + standard error) in water amongst cages (solid line) and at a control point200 meters from the cages (dashed line) for the four trials conducted at Goulburn Weir only.
0.25
0.2
0.15
0.1
0.05
0
Tot
al p
hosp
horu
s (m
g/L)
08/0
9/19
96
06/0
5/19
97
01/0
1/19
98
29/0
8/19
98
26/0
4/19
99
22/1
2/19
99
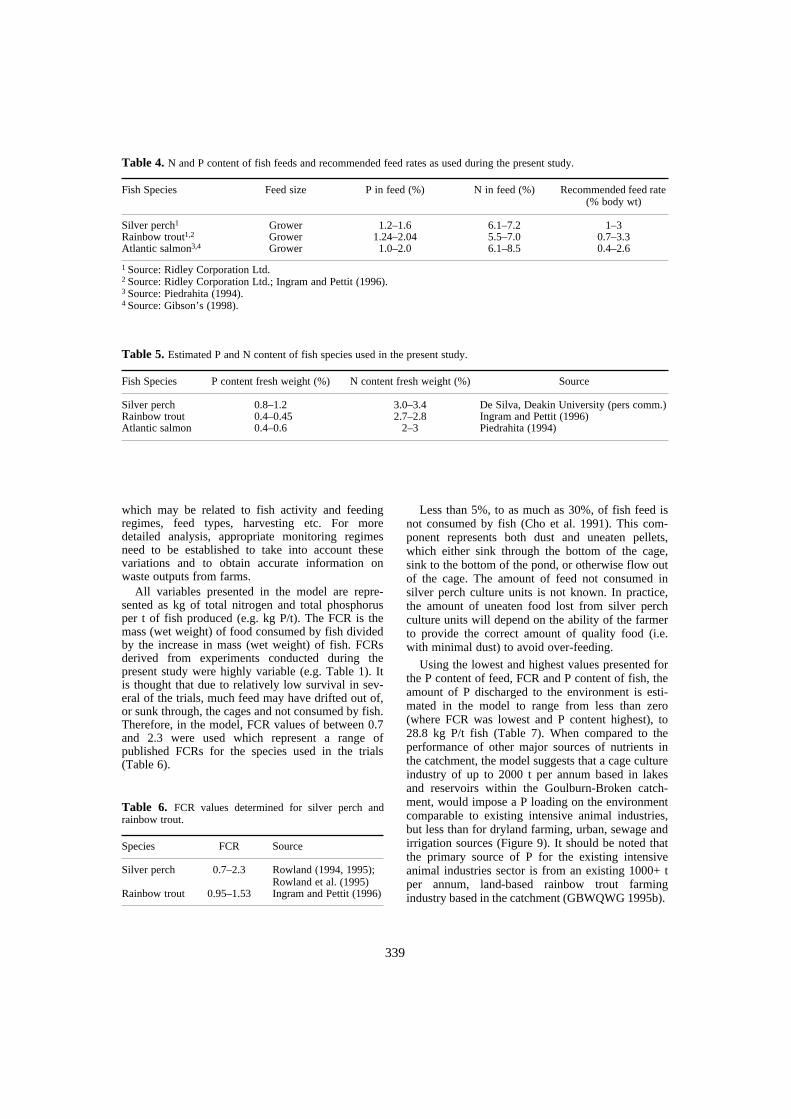
339
which may be related to fish activity and feedingregimes, feed types, harvesting etc. For moredetailed analysis, appropriate monitoring regimesneed to be established to take into account thesevariations and to obtain accurate information onwaste outputs from farms.
All variables presented in the model are repre-sented as kg of total nitrogen and total phosphorusper t of fish produced (e.g. kg P/t). The FCR is themass (wet weight) of food consumed by fish dividedby the increase in mass (wet weight) of fish. FCRsderived from experiments conducted during thepresent study were highly variable (e.g. Table 1). Itis thought that due to relatively low survival in sev-eral of the trials, much feed may have drifted out of,or sunk through, the cages and not consumed by fish.Therefore, in the model, FCR values of between 0.7and 2.3 were used which represent a range ofpublished FCRs for the species used in the trials(Table 6).
Less than 5%, to as much as 30%, of fish feed isnot consumed by fish (Cho et al. 1991). This com-ponent represents both dust and uneaten pellets,which either sink through the bottom of the cage,sink to the bottom of the pond, or otherwise flow outof the cage. The amount of feed not consumed insilver perch culture units is not known. In practice,the amount of uneaten food lost from silver perchculture units will depend on the ability of the farmerto provide the correct amount of quality food (i.e.with minimal dust) to avoid over-feeding.
Using the lowest and highest values presented forthe P content of feed, FCR and P content of fish, theamount of P discharged to the environment is esti-mated in the model to range from less than zero(where FCR was lowest and P content highest), to28.8 kg P/t fish (Table 7). When compared to theperformance of other major sources of nutrients inthe catchment, the model suggests that a cage cultureindustry of up to 2000 t per annum based in lakesand reservoirs within the Goulburn-Broken catch-ment, would impose a P loading on the environmentcomparable to existing intensive animal industries,but less than for dryland farming, urban, sewage andirrigation sources (Figure 9). It should be noted thatthe primary source of P for the existing intensiveanimal industries sector is from an existing 1000+ tper annum, land-based rainbow trout farmingindustry based in the catchment (GBWQWG 1995b).
Table 6. FCR values determined for silver perch andrainbow trout.
Species FCR Source
Silver perch 0.7–2.3 Rowland (1994, 1995); Rowland et al. (1995)
Rainbow trout 0.95–1.53 Ingram and Pettit (1996)
1 Source: Ridley Corporation Ltd.2 Source: Ridley Corporation Ltd.; Ingram and Pettit (1996).3 Source: Piedrahita (1994).4 Source: Gibson’s (1998).
Table 4. N and P content of fish feeds and recommended feed rates as used during the present study.
Fish Species Feed size P in feed (%) N in feed (%) Recommended feed rate (% body wt)
Silver perch1 Grower 1.2–1.6 6.1–7.2 1–3Rainbow trout1,2 Grower 1.24–2.04 5.5–7.0 0.7–3.3Atlantic salmon3,4 Grower 1.0–2.0 6.1–8.5 0.4–2.6
Table 5. Estimated P and N content of fish species used in the present study.
Fish Species P content fresh weight (%) N content fresh weight (%) Source
Silver perch 0.8–1.2 3.0–3.4 De Silva, Deakin University (pers comm.)Rainbow trout 0.4–0.45 2.7–2.8 Ingram and Pettit (1996)Atlantic salmon 0.4–0.6 2–3 Piedrahita (1994)
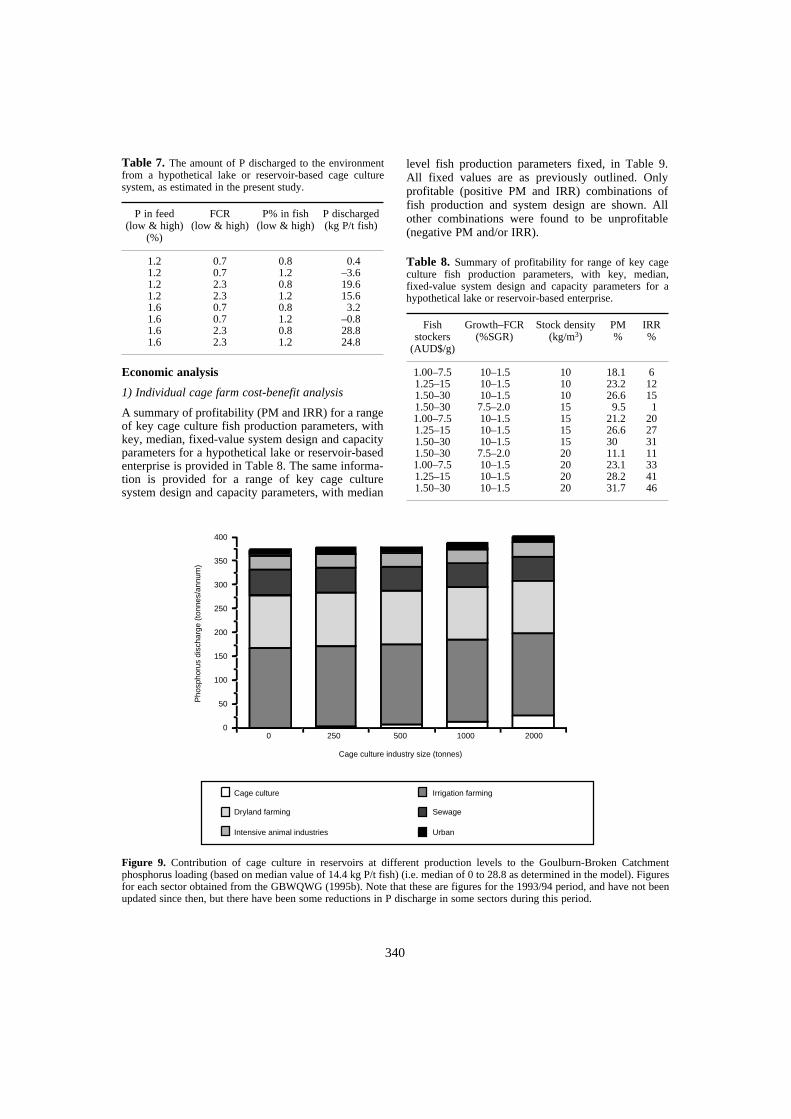
340
Economic analysis
1) Individual cage farm cost-benefit analysis
A summary of profitability (PM and IRR) for a rangeof key cage culture fish production parameters, withkey, median, fixed-value system design and capacityparameters for a hypothetical lake or reservoir-basedenterprise is provided in Table 8. The same informa-tion is provided for a range of key cage culturesystem design and capacity parameters, with median
level fish production parameters fixed, in Table 9.All fixed values are as previously outlined. Onlyprofitable (positive PM and IRR) combinations offish production and system design are shown. Allother combinations were found to be unprofitable(negative PM and/or IRR).
Table 7. The amount of P discharged to the environmentfrom a hypothetical lake or reservoir-based cage culturesystem, as estimated in the present study.
P in feed (low & high)
(%)
FCR (low & high)
P% in fish (low & high)
P discharged (kg P/t fish)
1.2 0.7 0.8 0.41.2 0.7 1.2 –3.61.2 2.3 0.8 19.61.2 2.3 1.2 15.61.6 0.7 0.8 3.21.6 0.7 1.2 –0.81.6 2.3 0.8 28.81.6 2.3 1.2 24.8
Table 8. Summary of profitability for range of key cageculture fish production parameters, with key, median,fixed-value system design and capacity parameters for ahypothetical lake or reservoir-based enterprise.
Fish stockers
(AUD$/g)
Growth–FCR(%SGR)
Stock density(kg/m3)
PM%
IRR%
1.00–7.5 10–1.5 10 18.1 61.25–15 10–1.5 10 23.2 121.50–30 10–1.5 10 26.6 151.50–30 7.5–2.0 15 9.5 11.00–7.5 10–1.5 15 21.2 201.25–15 10–1.5 15 26.6 271.50–30 10–1.5 15 30 311.50–30 7.5–2.0 20 11.1 111.00–7.5 10–1.5 20 23.1 331.25–15 10–1.5 20 28.2 411.50–30 10–1.5 20 31.7 46
Figure 9. Contribution of cage culture in reservoirs at different production levels to the Goulburn-Broken Catchmentphosphorus loading (based on median value of 14.4 kg P/t fish) (i.e. median of 0 to 28.8 as determined in the model). Figuresfor each sector obtained from the GBWQWG (1995b). Note that these are figures for the 1993/94 period, and have not beenupdated since then, but there have been some reductions in P discharge in some sectors during this period.
400
350
300
250
200
150
100
50
0
Pho
spho
rus
disc
harg
e (t
onne
s/an
num
)
0 250 500 1000 2000
Cage culture industry size (tonnes)
Cage culture
Dryland farming
Intensive animal industries
Irrigation farming
Sewage
Urban
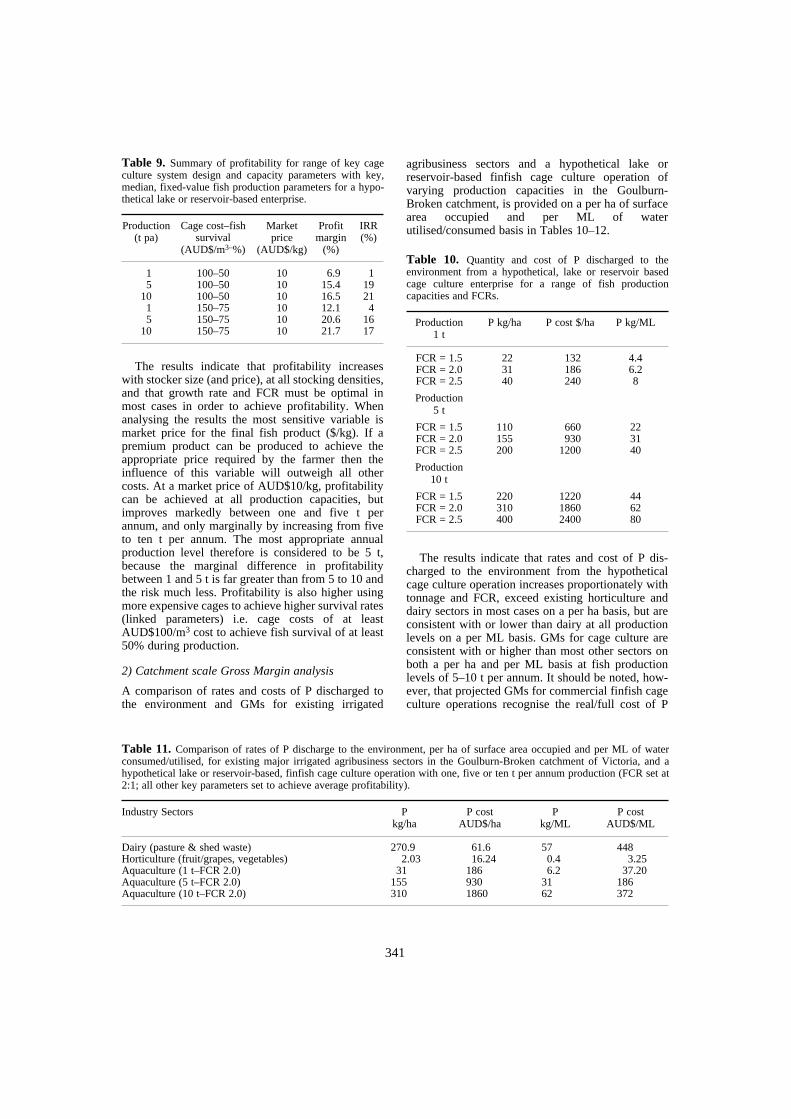
341
The results indicate that profitability increaseswith stocker size (and price), at all stocking densities,and that growth rate and FCR must be optimal inmost cases in order to achieve profitability. Whenanalysing the results the most sensitive variable ismarket price for the final fish product ($/kg). If apremium product can be produced to achieve theappropriate price required by the farmer then theinfluence of this variable will outweigh all othercosts. At a market price of AUD$10/kg, profitabilitycan be achieved at all production capacities, butimproves markedly between one and five t perannum, and only marginally by increasing from fiveto ten t per annum. The most appropriate annualproduction level therefore is considered to be 5 t,because the marginal difference in profitabilitybetween 1 and 5 t is far greater than from 5 to 10 andthe risk much less. Profitability is also higher usingmore expensive cages to achieve higher survival rates(linked parameters) i.e. cage costs of at leastAUD$100/m3 cost to achieve fish survival of at least50% during production.
2) Catchment scale Gross Margin analysis
A comparison of rates and costs of P discharged tothe environment and GMs for existing irrigated
agribusiness sectors and a hypothetical lake orreservoir-based finfish cage culture operation ofvarying production capacities in the Goulburn-Broken catchment, is provided on a per ha of surfacearea occupied and per ML of waterutilised/consumed basis in Tables 10–12.
The results indicate that rates and cost of P dis-charged to the environment from the hypotheticalcage culture operation increases proportionately withtonnage and FCR, exceed existing horticulture anddairy sectors in most cases on a per ha basis, but areconsistent with or lower than dairy at all productionlevels on a per ML basis. GMs for cage culture areconsistent with or higher than most other sectors onboth a per ha and per ML basis at fish productionlevels of 5–10 t per annum. It should be noted, how-ever, that projected GMs for commercial finfish cageculture operations recognise the real/full cost of P
Table 9. Summary of profitability for range of key cageculture system design and capacity parameters with key,median, fixed-value fish production parameters for a hypo-thetical lake or reservoir-based enterprise.
Production(t pa)
Cage cost–fish survival
(AUD$/m3–%)
Market price
(AUD$/kg)
Profit margin
(%)
IRR(%)
1 100–50 10 6.9 15 100–50 10 15.4 19
10 100–50 10 16.5 211 150–75 10 12.1 45 150–75 10 20.6 16
10 150–75 10 21.7 17
Table 10. Quantity and cost of P discharged to theenvironment from a hypothetical, lake or reservoir basedcage culture enterprise for a range of fish productioncapacities and FCRs.
Production 1 t
P kg/ha P cost $/ha P kg/ML
FCR = 1.5 22 132 4.4FCR = 2.0 31 186 6.2FCR = 2.5 40 240 8
Production 5 t
FCR = 1.5 110 660 22FCR = 2.0 155 930 31FCR = 2.5 200 1200 40
Production10 t
FCR = 1.5 220 1220 44FCR = 2.0 310 1860 62FCR = 2.5 400 2400 80
Table 11. Comparison of rates of P discharge to the environment, per ha of surface area occupied and per ML of waterconsumed/utilised, for existing major irrigated agribusiness sectors in the Goulburn-Broken catchment of Victoria, and ahypothetical lake or reservoir-based, finfish cage culture operation with one, five or ten t per annum production (FCR set at2:1; all other key parameters set to achieve average profitability).
Industry Sectors P kg/ha
P costAUD$/ha
P kg/ML
P costAUD$/ML
Dairy (pasture & shed waste) 270.9 61.6 57 448Horticulture (fruit/grapes, vegetables) 2.03 16.24 0.4 3.25Aquaculture (1 t–FCR 2.0) 31 186 6.2 37.20Aquaculture (5 t–FCR 2.0) 155 930 31 186Aquaculture (10 t–FCR 2.0) 310 1860 62 372
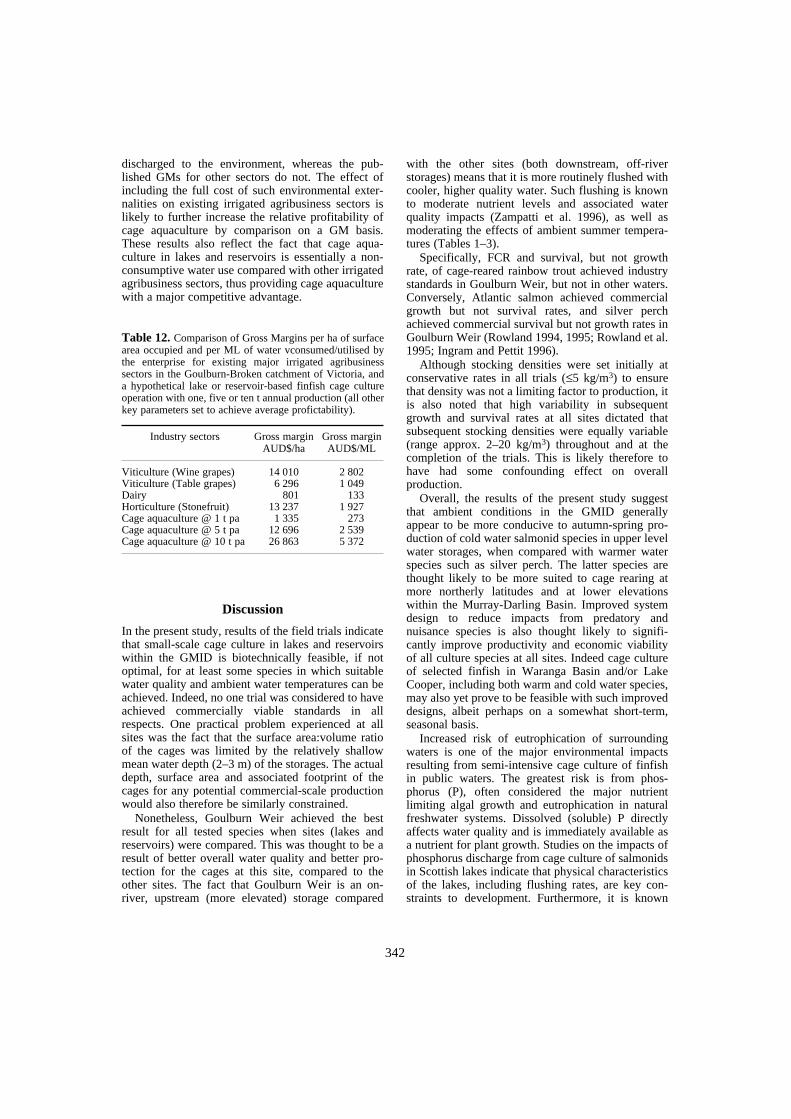
342
discharged to the environment, whereas the pub-lished GMs for other sectors do not. The effect ofincluding the full cost of such environmental exter-nalities on existing irrigated agribusiness sectors islikely to further increase the relative profitability ofcage aquaculture by comparison on a GM basis.These results also reflect the fact that cage aqua-culture in lakes and reservoirs is essentially a non-consumptive water use compared with other irrigatedagribusiness sectors, thus providing cage aquaculturewith a major competitive advantage.
Discussion
In the present study, results of the field trials indicatethat small-scale cage culture in lakes and reservoirswithin the GMID is biotechnically feasible, if notoptimal, for at least some species in which suitablewater quality and ambient water temperatures can beachieved. Indeed, no one trial was considered to haveachieved commercially viable standards in allrespects. One practical problem experienced at allsites was the fact that the surface area:volume ratioof the cages was limited by the relatively shallowmean water depth (2–3 m) of the storages. The actualdepth, surface area and associated footprint of thecages for any potential commercial-scale productionwould also therefore be similarly constrained.
Nonetheless, Goulburn Weir achieved the bestresult for all tested species when sites (lakes andreservoirs) were compared. This was thought to be aresult of better overall water quality and better pro-tection for the cages at this site, compared to theother sites. The fact that Goulburn Weir is an on-river, upstream (more elevated) storage compared
with the other sites (both downstream, off-riverstorages) means that it is more routinely flushed withcooler, higher quality water. Such flushing is knownto moderate nutrient levels and associated waterquality impacts (Zampatti et al. 1996), as well asmoderating the effects of ambient summer tempera-tures (Tables 1–3).
Specifically, FCR and survival, but not growthrate, of cage-reared rainbow trout achieved industrystandards in Goulburn Weir, but not in other waters.Conversely, Atlantic salmon achieved commercialgrowth but not survival rates, and silver perchachieved commercial survival but not growth rates inGoulburn Weir (Rowland 1994, 1995; Rowland et al.1995; Ingram and Pettit 1996).
Although stocking densities were set initially atconservative rates in all trials (≤5 kg/m3) to ensurethat density was not a limiting factor to production, itis also noted that high variability in subsequentgrowth and survival rates at all sites dictated thatsubsequent stocking densities were equally variable(range approx. 2–20 kg/m3) throughout and at thecompletion of the trials. This is likely therefore tohave had some confounding effect on overallproduction.
Overall, the results of the present study suggestthat ambient conditions in the GMID generallyappear to be more conducive to autumn-spring pro-duction of cold water salmonid species in upper levelwater storages, when compared with warmer waterspecies such as silver perch. The latter species arethought likely to be more suited to cage rearing atmore northerly latitudes and at lower elevationswithin the Murray-Darling Basin. Improved systemdesign to reduce impacts from predatory andnuisance species is also thought likely to signifi-cantly improve productivity and economic viabilityof all culture species at all sites. Indeed cage cultureof selected finfish in Waranga Basin and/or LakeCooper, including both warm and cold water species,may also yet prove to be feasible with such improveddesigns, albeit perhaps on a somewhat short-term,seasonal basis.
Increased risk of eutrophication of surroundingwaters is one of the major environmental impactsresulting from semi-intensive cage culture of finfishin public waters. The greatest risk is from phos-phorus (P), often considered the major nutrientlimiting algal growth and eutrophication in naturalfreshwater systems. Dissolved (soluble) P directlyaffects water quality and is immediately available asa nutrient for plant growth. Studies on the impacts ofphosphorus discharge from cage culture of salmonidsin Scottish lakes indicate that physical characteristicsof the lakes, including flushing rates, are key con-straints to development. Furthermore, it is known
Table 12. Comparison of Gross Margins per ha of surfacearea occupied and per ML of water vconsumed/utilised bythe enterprise for existing major irrigated agribusinesssectors in the Goulburn-Broken catchment of Victoria, anda hypothetical lake or reservoir-based finfish cage cultureoperation with one, five or ten t annual production (all otherkey parameters set to achieve average profictability).
Industry sectors Gross marginAUD$/ha
Gross marginAUD$/ML
Viticulture (Wine grapes) 14 010 2 802Viticulture (Table grapes) 6 296 1 049Dairy 801 133Horticulture (Stonefruit) 13 237 1 927Cage aquaculture @ 1 t pa 1 335 273Cage aquaculture @ 5 t pa 12 696 2 539Cage aquaculture @ 10 t pa 26 863 5 372
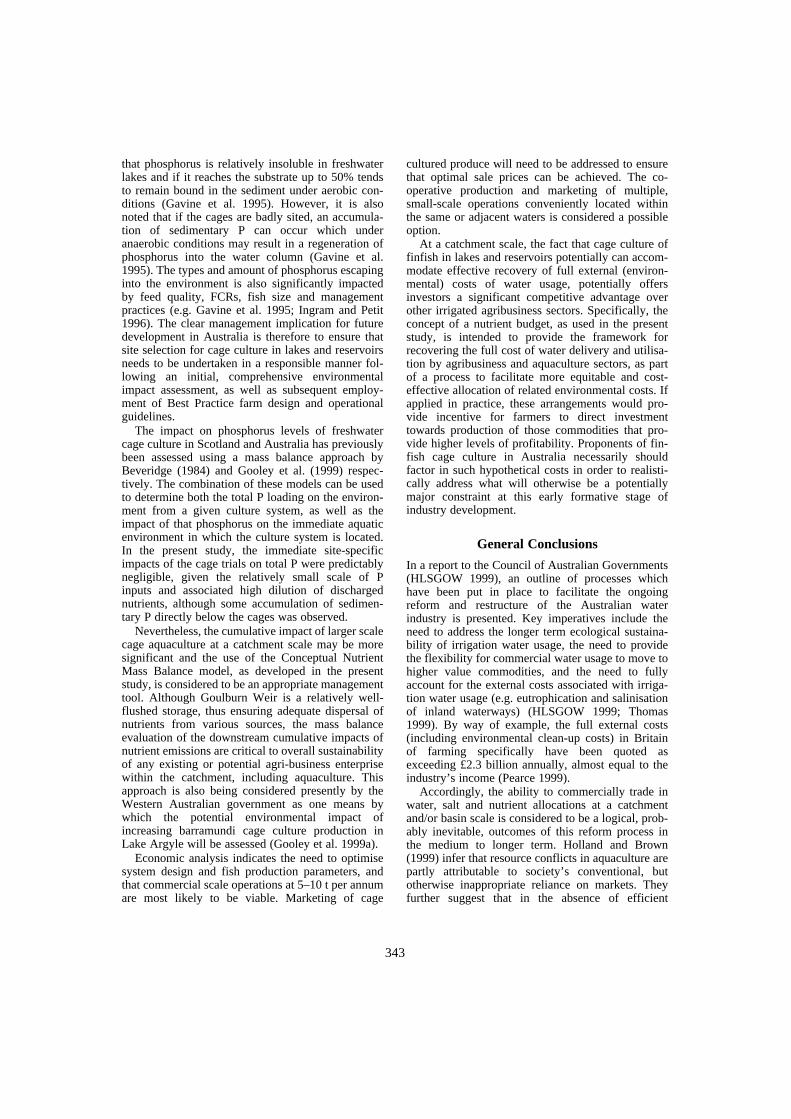
343
that phosphorus is relatively insoluble in freshwaterlakes and if it reaches the substrate up to 50% tendsto remain bound in the sediment under aerobic con-ditions (Gavine et al. 1995). However, it is alsonoted that if the cages are badly sited, an accumula-tion of sedimentary P can occur which underanaerobic conditions may result in a regeneration ofphosphorus into the water column (Gavine et al.1995). The types and amount of phosphorus escapinginto the environment is also significantly impactedby feed quality, FCRs, fish size and managementpractices (e.g. Gavine et al. 1995; Ingram and Petit1996). The clear management implication for futuredevelopment in Australia is therefore to ensure thatsite selection for cage culture in lakes and reservoirsneeds to be undertaken in a responsible manner fol-lowing an initial, comprehensive environmentalimpact assessment, as well as subsequent employ-ment of Best Practice farm design and operationalguidelines.
The impact on phosphorus levels of freshwatercage culture in Scotland and Australia has previouslybeen assessed using a mass balance approach byBeveridge (1984) and Gooley et al. (1999) respec-tively. The combination of these models can be usedto determine both the total P loading on the environ-ment from a given culture system, as well as theimpact of that phosphorus on the immediate aquaticenvironment in which the culture system is located.In the present study, the immediate site-specificimpacts of the cage trials on total P were predictablynegligible, given the relatively small scale of Pinputs and associated high dilution of dischargednutrients, although some accumulation of sedimen-tary P directly below the cages was observed.
Nevertheless, the cumulative impact of larger scalecage aquaculture at a catchment scale may be moresignificant and the use of the Conceptual NutrientMass Balance model, as developed in the presentstudy, is considered to be an appropriate managementtool. Although Goulburn Weir is a relatively well-flushed storage, thus ensuring adequate dispersal ofnutrients from various sources, the mass balanceevaluation of the downstream cumulative impacts ofnutrient emissions are critical to overall sustainabilityof any existing or potential agri-business enterprisewithin the catchment, including aquaculture. Thisapproach is also being considered presently by theWestern Australian government as one means bywhich the potential environmental impact ofincreasing barramundi cage culture production inLake Argyle will be assessed (Gooley et al. 1999a).
Economic analysis indicates the need to optimisesystem design and fish production parameters, andthat commercial scale operations at 5–10 t per annumare most likely to be viable. Marketing of cage
cultured produce will need to be addressed to ensurethat optimal sale prices can be achieved. The co-operative production and marketing of multiple,small-scale operations conveniently located withinthe same or adjacent waters is considered a possibleoption.
At a catchment scale, the fact that cage culture offinfish in lakes and reservoirs potentially can accom-modate effective recovery of full external (environ-mental) costs of water usage, potentially offersinvestors a significant competitive advantage overother irrigated agribusiness sectors. Specifically, theconcept of a nutrient budget, as used in the presentstudy, is intended to provide the framework forrecovering the full cost of water delivery and utilisa-tion by agribusiness and aquaculture sectors, as partof a process to facilitate more equitable and cost-effective allocation of related environmental costs. Ifapplied in practice, these arrangements would pro-vide incentive for farmers to direct investmenttowards production of those commodities that pro-vide higher levels of profitability. Proponents of fin-fish cage culture in Australia necessarily shouldfactor in such hypothetical costs in order to realisti-cally address what will otherwise be a potentiallymajor constraint at this early formative stage ofindustry development.
General Conclusions
In a report to the Council of Australian Governments(HLSGOW 1999), an outline of processes whichhave been put in place to facilitate the ongoingreform and restructure of the Australian waterindustry is presented. Key imperatives include theneed to address the longer term ecological sustaina-bility of irrigation water usage, the need to providethe flexibility for commercial water usage to move tohigher value commodities, and the need to fullyaccount for the external costs associated with irriga-tion water usage (e.g. eutrophication and salinisationof inland waterways) (HLSGOW 1999; Thomas1999). By way of example, the full external costs(including environmental clean-up costs) in Britainof farming specifically have been quoted asexceeding £2.3 billion annually, almost equal to theindustry’s income (Pearce 1999).
Accordingly, the ability to commercially trade inwater, salt and nutrient allocations at a catchmentand/or basin scale is considered to be a logical, prob-ably inevitable, outcomes of this reform process inthe medium to longer term. Holland and Brown(1999) infer that resource conflicts in aquaculture arepartly attributable to society’s conventional, butotherwise inappropriate reliance on markets. Theyfurther suggest that in the absence of efficient
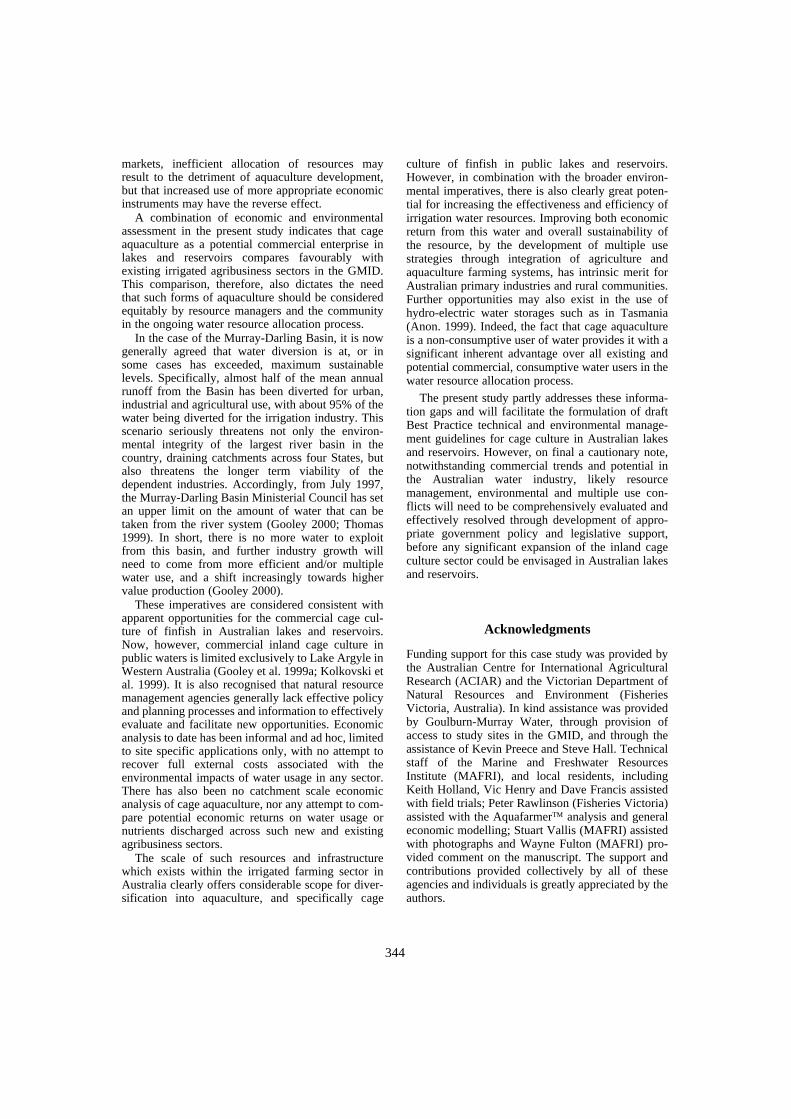
344
markets, inefficient allocation of resources mayresult to the detriment of aquaculture development,but that increased use of more appropriate economicinstruments may have the reverse effect.
A combination of economic and environmentalassessment in the present study indicates that cageaquaculture as a potential commercial enterprise inlakes and reservoirs compares favourably withexisting irrigated agribusiness sectors in the GMID.This comparison, therefore, also dictates the needthat such forms of aquaculture should be consideredequitably by resource managers and the communityin the ongoing water resource allocation process.
In the case of the Murray-Darling Basin, it is nowgenerally agreed that water diversion is at, or insome cases has exceeded, maximum sustainablelevels. Specifically, almost half of the mean annualrunoff from the Basin has been diverted for urban,industrial and agricultural use, with about 95% of thewater being diverted for the irrigation industry. Thisscenario seriously threatens not only the environ-mental integrity of the largest river basin in thecountry, draining catchments across four States, butalso threatens the longer term viability of thedependent industries. Accordingly, from July 1997,the Murray-Darling Basin Ministerial Council has setan upper limit on the amount of water that can betaken from the river system (Gooley 2000; Thomas1999). In short, there is no more water to exploitfrom this basin, and further industry growth willneed to come from more efficient and/or multiplewater use, and a shift increasingly towards highervalue production (Gooley 2000).
These imperatives are considered consistent withapparent opportunities for the commercial cage cul-ture of finfish in Australian lakes and reservoirs.Now, however, commercial inland cage culture inpublic waters is limited exclusively to Lake Argyle inWestern Australia (Gooley et al. 1999a; Kolkovski etal. 1999). It is also recognised that natural resourcemanagement agencies generally lack effective policyand planning processes and information to effectivelyevaluate and facilitate new opportunities. Economicanalysis to date has been informal and ad hoc, limitedto site specific applications only, with no attempt torecover full external costs associated with theenvironmental impacts of water usage in any sector.There has also been no catchment scale economicanalysis of cage aquaculture, nor any attempt to com-pare potential economic returns on water usage ornutrients discharged across such new and existingagribusiness sectors.
The scale of such resources and infrastructurewhich exists within the irrigated farming sector inAustralia clearly offers considerable scope for diver-sification into aquaculture, and specifically cage
culture of finfish in public lakes and reservoirs.However, in combination with the broader environ-mental imperatives, there is also clearly great poten-tial for increasing the effectiveness and efficiency ofirrigation water resources. Improving both economicreturn from this water and overall sustainability ofthe resource, by the development of multiple usestrategies through integration of agriculture andaquaculture farming systems, has intrinsic merit forAustralian primary industries and rural communities.Further opportunities may also exist in the use ofhydro-electric water storages such as in Tasmania(Anon. 1999). Indeed, the fact that cage aquacultureis a non-consumptive user of water provides it with asignificant inherent advantage over all existing andpotential commercial, consumptive water users in thewater resource allocation process.
The present study partly addresses these informa-tion gaps and will facilitate the formulation of draftBest Practice technical and environmental manage-ment guidelines for cage culture in Australian lakesand reservoirs. However, on final a cautionary note,notwithstanding commercial trends and potential inthe Australian water industry, likely resourcemanagement, environmental and multiple use con-flicts will need to be comprehensively evaluated andeffectively resolved through development of appro-priate government policy and legislative support,before any significant expansion of the inland cageculture sector could be envisaged in Australian lakesand reservoirs.
Acknowledgments
Funding support for this case study was provided bythe Australian Centre for International AgriculturalResearch (ACIAR) and the Victorian Department ofNatural Resources and Environment (FisheriesVictoria, Australia). In kind assistance was providedby Goulburn-Murray Water, through provision ofaccess to study sites in the GMID, and through theassistance of Kevin Preece and Steve Hall. Technicalstaff of the Marine and Freshwater ResourcesInstitute (MAFRI), and local residents, includingKeith Holland, Vic Henry and Dave Francis assistedwith field trials; Peter Rawlinson (Fisheries Victoria)assisted with the Aquafarmer analysis and generaleconomic modelling; Stuart Vallis (MAFRI) assistedwith photographs and Wayne Fulton (MAFRI) pro-vided comment on the manuscript. The support andcontributions provided collectively by all of theseagencies and individuals is greatly appreciated by theauthors.

345
References
Anon. 1999. Government policy on inland cage culture inTasmania. On the Rise, Tasmanian Inland FisheriesService Newsletter, 28:3, 6.
Baldwin, D.S. 1999. Nutrients in freshwater ecosystems. In:Ingram, B.A. ed. Towards Best Practice in Land-basedSalmonid Farming: Options for Treatment, Re-use andDisposal of Effluent. Marine and Freshwater ResourcesInstitute, Alexandra, 18–25.
Beveridge, M.C.M. 1984. Cage and Pen Fish Farming:Carrying Capacity Models and Environmental Impact.FAO Fisheries Technical Paper 255. FIRI/T255. FAO,Rome. 131 p.
Cho, C.Y., Hynes, J.D., Wood, K.R. and Yoshida, H.K.1991. Quantitation of fish culture wastes by biological(nutritional) and chemical (limnological) methods: thedevelopment of high nutrient dense (HND) diets. In:Cowey, C.D. and Cho, C.Y. ed. Nutritional Strategies andAquaculture Waste. Proceedings of the First InternationalSymposium on Nutritional Strategies in Management ofAquaculture Waste. Fish Nutrition Research Laboratory,University of Guelph, Guelph, Ontario.
Downs, A. and Sime, A. 1999. Horticultural gross marginsfor the Loddon Murray Region. 1999–2000. Departmentof Natural Resources and Environment. Victoria.
Floyd, P. 1999. North-East Gross Margins, 1998–1999.Department of Natural Resources and Environment,Farm Smart. Victoria.
Gavine, F.M., Phillips, M.J. and Murray, A. 1995. Influ-ence of improved feed quality and food conversion ratioson phosphorus loadings from cage culture of rainbowtrout, Oncorhynchus mykiss (Walbaum), in freshwaterlakes. Aquaculture Research, 26: 483–495.
GBWQWG 1995a. Dryland diffuse source nutrients forGoulburn Broken Catchment. Goulburn Broken WaterQuality Working Group Issues Paper No. 2.
—— 1995b. Nutrient Loads from Intensive AnimalIndustries in the Goulburn Broken Catchment. GoulburnBroken Water Quality Working Group Issues PaperNo. 3.
—— 1995c. Nutrients in irrigation drainage water from theGoulburn and Broken Catchments. Goulburn BrokenWater Quality Working Group Issues paper.
Gibson’s 1998. Feed Management Guidelines for Salmonids.Gibson’s Limited, Rosny, Tasmania, 137 p.
Gooley, G.J. 2000. R&D Plan for Integrated Agri-Aquaculture Systems 1999–2004. A report from a work-shop in September 1998. RIRDC Publication No. 99/153.Rural Industries R&D Corporation, Canberra, 32 p.
Gooley, G.J., De Silva, S.S., Hone, P.W., McKinnon, L.J.and Ingram, B.A. 1999a. Cage aquaculture in Australia:A developed country perspective with reference to inte-grated aquaculture development within inland waters. In:Proceedings of First International Symposium on CageAquaculture in Asia, Tungkang, Taiwan, 2–6 November,1999 (in press).
Gooley, G.J., McKinnon, L.J., Ingram, B.A. and Gasior, R.1999b. Agriculture/aquaculture systems integration toenhance farm productivity and water use efficiency.Final Report to the Rural Industries Research and Devel-opment Corporation, Canberra, Australia, (in press).
Holland, P. and Brown, D. 1999. Resource conflicts inaquaculture: international experiences. AquacultureMagazine, November/December, 39–46, 48.
Hallows, P.J. and Thompson, D.G. 1997. The History ofIrrigation in Australia. Australian National Committee onIrrigation and Drainage. 126 p.
HLSGOW 1999. Progress in implementation of the COAGwater reform framework. Report to the Council of Aus-tralian Governments by the High Level Steering GroupOn Water, Occasional Paper Number 1, Canberra, Aus-tralia, 113 p.
Ingram, B.A. 1999a. An interactive software program forestimation of nitrogen and phosphorus levels dischargedfrom trout farms. In: Ingram, B.A. ed. Towards BestPractice in Land-based Salmonid Farming: Options forTreatment, Re-use and Disposal of Effluent. Marine andFreshwater Resources Institute, Alexandra, 42–49.
—— (1999b). A phosphorus model for trout farming in theGoulburn-Broken Catchment. In: Ingram, B.A. ed.Towards Best Practice in Land-based Salmonid Farming:Options for Treatment, Re-use and Disposal of Effluent.Marine and Freshwater Resources Institute, Alexandra,26–41.
Ingram, B. and Pettit, J. 1996. The effects of feed type onthe feeding and growth of rainbow trout and the qualityof discharge water. Report prepared on behalf of theAustralian Trout & Salmon Farmers Association toobtain information for its members, the EnvironmentalProtection Authority, Ridley Agriproducts Pty. Ltd. andGibson’s Ltd. Marine and Freshwater ResourcesInstitute, Alexandra.
Ingram, B.A., Gooley, G.J., McKinnon, L.J. and De Silva,S.S. 1999. Aquaculture-agriculture systems integration:an Australian perspective. Fisheries Management andEcology, 6: 1–11.
Kolkovski, S., Jenkins, G.L. and Lee, C.L. 1999. Cageaquaculture in Western Australia: Current status andfuture plans. In: Proceedings of First InternationalSymposium on Cage Aquaculture in Asia, Tungkang,Taiwan, 2–6 November, 1999 (in press).
Muir, J.F., Brugere, C., Young, J.A. and Stewart, J.A. 1999.The solution to pollution: the value and limitations ofenvironmental economics in guiding aquaculture devel-opment. Aquaculture Economics and Management, 3: 1.
O’Sullivan, D. and Roberts, N. 1999. Status of Australianaquaculture in 1997/98. In: Austasia Aquaculture TradeDirectory 1999, 14–28. Turtle Press, Hobart, Tasmania.
Pearce, F. 1999. Crops without profit. New Scientist,18 December, 1999: 10.
Piedrahita, R.H. 1994. Managing environmental impacts inaquaculture. Bulletin of the National Research Instituteof Aquaculture Suppl. 1: 13–20.
Rowland, S.J. 1994. Preliminary evaluation of the Aus-tralian freshwater fish silver perch, Bidyanus bidyanus,for pond culture. Journal of Applied Aquaculture, 4(1):39–48.
Rowland, S.J. 1995. High density pond culture of silverperch, Bidyanus bidyanus. Asian Fisheries Science,8: 73–79.

346
Rowland, S.J., Allan, G.L., Hollis, M. and Pontifex, T.1995. Production of the Australian freshwater silverperch, Bidyanus bidyanus (Mitchell), at two densities inearthen ponds. Aquaculture, 130: 317–328.
Thomas, J.F. 1999. Water and the Australian economy.Australian Academy of Technological Sciences andEngineering. Community Summary, April, 1999,Parkville, Victoria. 18 p.
Thompson, C. and Standen, R. 1998. Managing nutrientson irrigated dairy farms. Goulburn Broken CatchmentManagement Authority. Victorian Nutrient ManagementInitiative.
Zampatti, B., Loone, J. and Hunter, K. 1996. LakeNagambie Water Quality Study Final Report. Water Eco-Science Report No. 57/96. Water EcoScience Pty Ltd,Melbourne, 37 p.

347
Cage Rearing of Fry to Fingerling of Carp Species in Large Reservoirs in Northern Vietnam
Bui T. Anh and Nguyen H. Son1
Abstract
In North of Vietnam, culture-based fisheries and small scale aquaculture is often constrained bythe lack of suitably sized seed stock. Although large amounts of fry are produced there is dearth offingerlings for stocking purposes, thereby inducing fry to be stocked for aquaculture and culture-based fisheries. The present experiments were instigated to evaluate the feasibility of using cageculture technology, in large reservoirs, for fry to fingerling rearing. The paper describes the resultsof experiments conducted in Thac Ba and Nui Coc reservoirs, in northern Vietnam, in 1997 to1999, on the rearing of carp species. The technical, economical and environmental feasibility of fryto fingerling rearing in large reservoirs were evaluated based on experiments conducted using arandomised block design, in bamboo and net cages, when the optimal stocking density, feedingregime and cage type were determined. Water quality parameters were investigated in and outsidethe cages to evaluate the influence of cage culture on reservoir water quality. Finally, the data wereused to determine the economic feasibility of cage rearing of fry to fingerling in large reservoirs.
THE NORTHERN mid-highland region of Viet Namhas 1705 reservoirs with an acreage of 65 629 ha,representing 69% and 36% of the total number andacreage, respectively in Viet Nam. The developmentof reservoir fisheries in mountain areas is alsoexpected to generate new avenues of employmentand provide an additional source of income to dis-placed persons who have lost their livelihood due toimpoundment of larger reservoir (ACIAR 1997).
In the north of Vietnam, culture-based fisheries andsmall-scale aquaculture are often constrained by thelack of suitably sized seed stock. Although there is alarge quantity of fry of cultured species, in particularcarp species produced in north Vietnam, fingerlingproduction has lagged behind due to economic andland constraints. Consequently, most aquaculture andculture-based fishery activities are dependent on fryfor stocking purposes, resulting in higher lossesduring transportation and during culture.
The advantages of cage rearing are well known.Cage rearing uses utilise existing water bodies, areeasy to harvest and enable fish to use the naturalproductivity of water bodies, such as reservoirs(Phuong 1998).
However, the nursing of fry to fingerling stage inlarge reservoirs has not been carried out before in themid-highlands of Northern Vietnam. Therefore, thisstudy was conducted between 1997–1999 with thefollowing objectives:• to assess the environmental effects of nursing fry
in cages;• to determine a suitable type of feed, type of cage
and stocking density; and• to evaluate the economic feasibility of rearing fry
to the fingerling stage in cages.
Materials and MethodsThe experiments were conducted in Thac ba reser-voir, and Nui coc reservoirs in Yen Bai Thai Nguyenprovinces, respectively, in the mid-highland regionof Northern Vietnam, between July 1997 andNovember 1999.
Experimental design In 1997 two types of cages were used: bamboo andnet cages. All cages were 2 × 2 × 1.5 m and wereanchored in a water depth of 3 m in each of thereservoirs. The experiments were designed to test thefollowing: effectiveness of bamboo and net cages,the optimum stocking density for each of thecultured species (three densities were tested for each
1Research Institute for Aquaculture No. 1, Dinh Bang, TuSon, Bac Ninh, Vietnam. E-mail: [email protected]
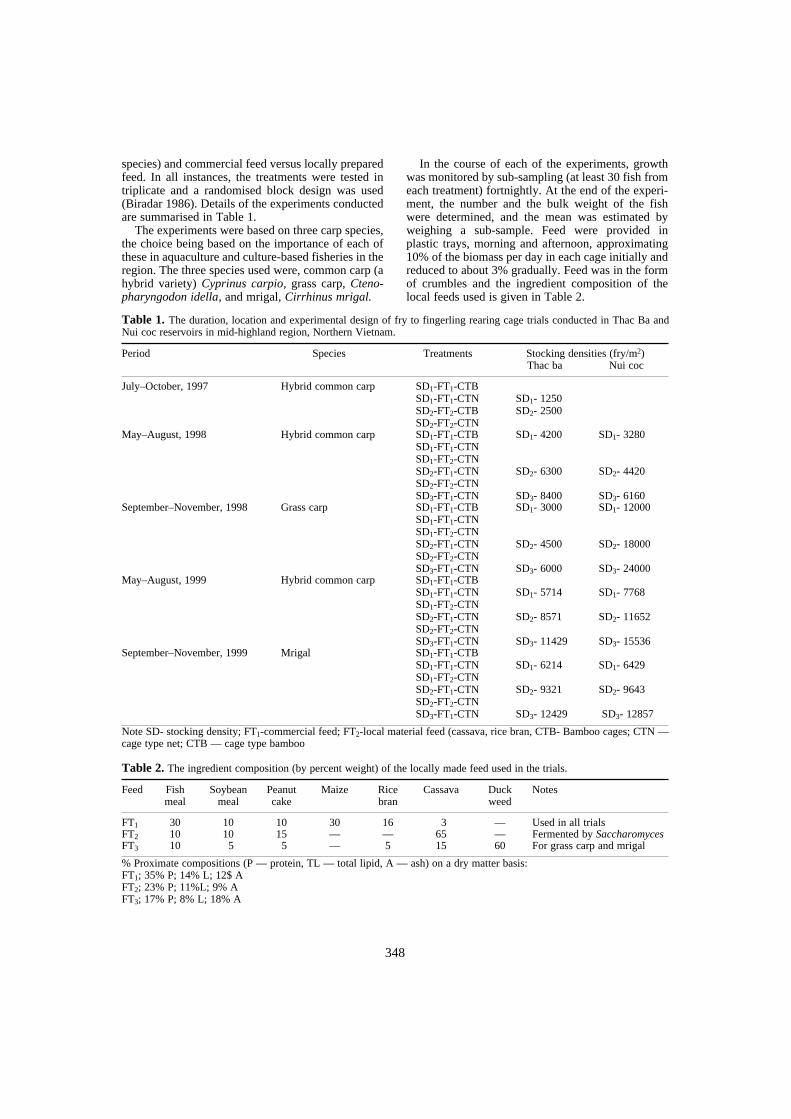
348
species) and commercial feed versus locally preparedfeed. In all instances, the treatments were tested intriplicate and a randomised block design was used(Biradar 1986). Details of the experiments conductedare summarised in Table 1.
The experiments were based on three carp species,the choice being based on the importance of each ofthese in aquaculture and culture-based fisheries in theregion. The three species used were, common carp (ahybrid variety) Cyprinus carpio, grass carp, Cteno-pharyngodon idella, and mrigal, Cirrhinus mrigal.
In the course of each of the experiments, growthwas monitored by sub-sampling (at least 30 fish fromeach treatment) fortnightly. At the end of the experi-ment, the number and the bulk weight of the fishwere determined, and the mean was estimated byweighing a sub-sample. Feed were provided inplastic trays, morning and afternoon, approximating10% of the biomass per day in each cage initially andreduced to about 3% gradually. Feed was in the formof crumbles and the ingredient composition of thelocal feeds used is given in Table 2.
Note SD- stocking density; FT1-commercial feed; FT2-local material feed (cassava, rice bran, CTB- Bamboo cages; CTN —cage type net; CTB — cage type bamboo
% Proximate compositions (P — protein, TL — total lipid, A — ash) on a dry matter basis:FT1; 35% P; 14% L; 12$ AFT2; 23% P; 11%L; 9% AFT3; 17% P; 8% L; 18% A
Table 1. The duration, location and experimental design of fry to fingerling rearing cage trials conducted in Thac Ba andNui coc reservoirs in mid-highland region, Northern Vietnam.
Period Species Treatments Stocking densities (fry/m2)Thac ba Nui coc
July–October, 1997 Hybrid common carp SD1-FT1-CTBSD1-FT1-CTNSD2-FT2-CTBSD2-FT2-CTN
SD1- 1250 SD2- 2500
May–August, 1998 Hybrid common carp SD1-FT1-CTBSD1-FT1-CTNSD1-FT2-CTNSD2-FT1-CTNSD2-FT2-CTNSD3-FT1-CTN
SD1- 4200
SD2- 6300
SD3- 8400
SD1- 3280
SD2- 4420 SD3- 6160
September–November, 1998 Grass carp SD1-FT1-CTBSD1-FT1-CTNSD1-FT2-CTNSD2-FT1-CTNSD2-FT2-CTNSD3-FT1-CTN
SD1- 3000
SD2- 4500
SD3- 6000
SD1- 12000
SD2- 18000 SD3- 24000
May–August, 1999 Hybrid common carp SD1-FT1-CTBSD1-FT1-CTNSD1-FT2-CTNSD2-FT1-CTNSD2-FT2-CTNSD3-FT1-CTN
SD1- 5714
SD2- 8571
SD3- 11429
SD1- 7768
SD2- 11652 SD3- 15536
September–November, 1999 Mrigal SD1-FT1-CTBSD1-FT1-CTNSD1-FT2-CTNSD2-FT1-CTNSD2-FT2-CTNSD3-FT1-CTN
SD1- 6214
SD2- 9321
SD3- 12429
SD1- 6429
SD2- 9643
SD3- 12857
Table 2. The ingredient composition (by percent weight) of the locally made feed used in the trials.
Feed Fish meal
Soybean meal
Peanut cake
Maize Ricebran
Cassava Duck weed
Notes
FT1 30 10 10 30 16 3 — Used in all trialsFT2 10 10 15 — — 65 — Fermented by SaccharomycesFT3 10 5 5 — 5 15 60 For grass carp and mrigal
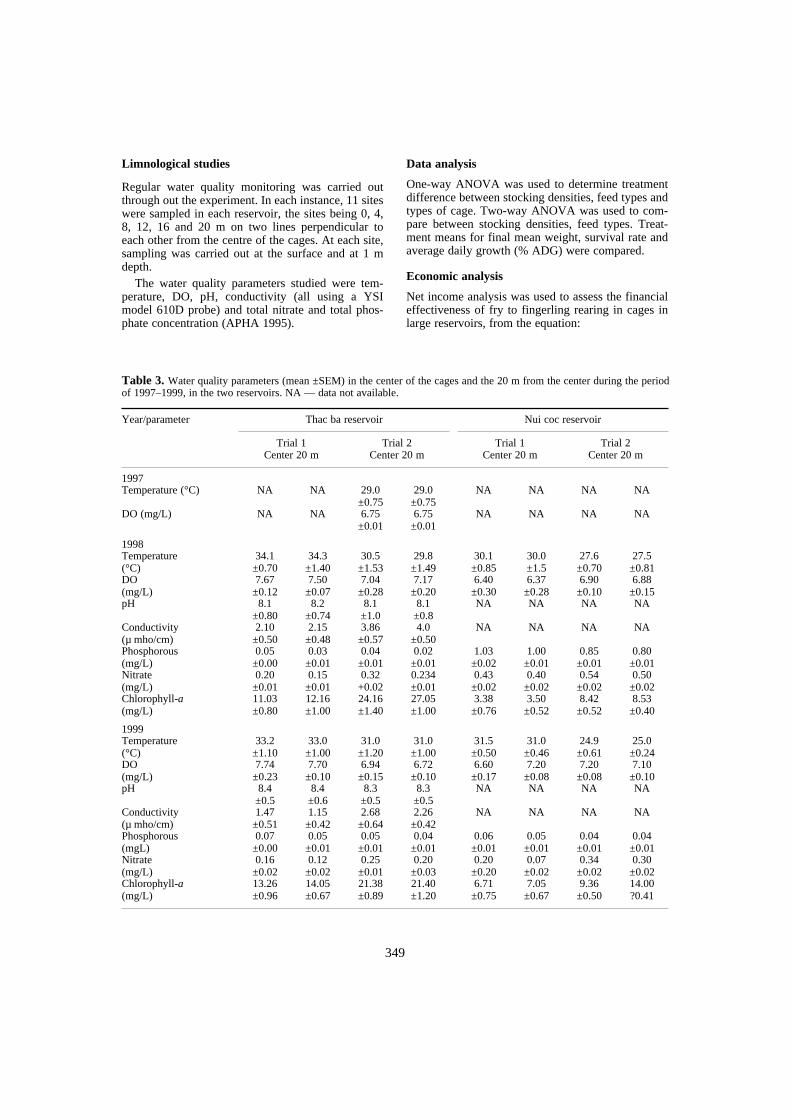
349
Limnological studies
Regular water quality monitoring was carried outthrough out the experiment. In each instance, 11 siteswere sampled in each reservoir, the sites being 0, 4,8, 12, 16 and 20 m on two lines perpendicular toeach other from the centre of the cages. At each site,sampling was carried out at the surface and at 1 mdepth.
The water quality parameters studied were tem-perature, DO, pH, conductivity (all using a YSImodel 610D probe) and total nitrate and total phos-phate concentration (APHA 1995).
Data analysis
One-way ANOVA was used to determine treatmentdifference between stocking densities, feed types andtypes of cage. Two-way ANOVA was used to com-pare between stocking densities, feed types. Treat-ment means for final mean weight, survival rate andaverage daily growth (% ADG) were compared.
Economic analysis
Net income analysis was used to assess the financialeffectiveness of fry to fingerling rearing in cages inlarge reservoirs, from the equation:
Table 3. Water quality parameters (mean ±SEM) in the center of the cages and the 20 m from the center during the periodof 1997–1999, in the two reservoirs. NA — data not available.
Year/parameter Thac ba reservoir Nui coc reservoir
Trial 1Center 20 m
Trial 2Center 20 m
Trial 1Center 20 m
Trial 2Center 20 m
1997Temperature (°C) NA NA 29.0
±0.7529.0
±0.75NA NA NA NA
DO (mg/L) NA NA 6.75±0.01
6.75±0.01
NA NA NA NA
1998Temperature (°C)
34.1±0.70
34.3±1.40
30.5±1.53
29.8±1.49
30.1±0.85
30.0±1.5
27.6±0.70
27.5±0.81
DO (mg/L)
7.67±0.12
7.50±0.07
7.04±0.28
7.17±0.20
6.40±0.30
6.37±0.28
6.90±0.10
6.88±0.15
pH 8.1±0.80
8.2±0.74
8.1±1.0
8.1±0.8
NA NA NA NA
Conductivity (µ mho/cm)
2.10±0.50
2.15±0.48
3.86±0.57
4.0±0.50
NA NA NA NA
Phosphorous (mg/L)
0.05±0.00
0.03±0.01
0.04±0.01
0.02±0.01
1.03±0.02
1.00±0.01
0.85±0.01
0.80±0.01
Nitrate(mg/L)
0.20±0.01
0.15±0.01
0.32+0.02
0.234±0.01
0.43±0.02
0.40±0.02
0.54±0.02
0.50±0.02
Chlorophyll-a(mg/L)
11.03±0.80
12.16±1.00
24.16±1.40
27.05±1.00
3.38±0.76
3.50±0.52
8.42±0.52
8.53±0.40
1999Temperature (°C)
33.2±1.10
33.0±1.00
31.0±1.20
31.0±1.00
31.5±0.50
31.0±0.46
24.9±0.61
25.0±0.24
DO (mg/L)
7.74±0.23
7.70±0.10
6.94±0.15
6.72±0.10
6.60±0.17
7.20±0.08
7.20±0.08
7.10±0.10
pH 8.4±0.5
8.4±0.6
8.3±0.5
8.3±0.5
NA NA NA NA
Conductivity (µ mho/cm)
1.47±0.51
1.15±0.42
2.68±0.64
2.26±0.42
NA NA NA NA
Phosphorous (mgL)
0.07±0.00
0.05±0.01
0.05±0.01
0.04±0.01
0.06±0.01
0.05±0.01
0.04±0.01
0.04±0.01
Nitrate (mg/L)
0.16±0.02
0.12±0.02
0.25±0.01
0.20±0.03
0.20±0.20
0.07±0.02
0.34±0.02
0.30±0.02
Chlorophyll-a(mg/L)
13.26±0.96
14.05±0.67
21.38±0.89
21.40±1.20
6.71±0.75
7.05±0.67
9.36±0.50
14.00?0.41
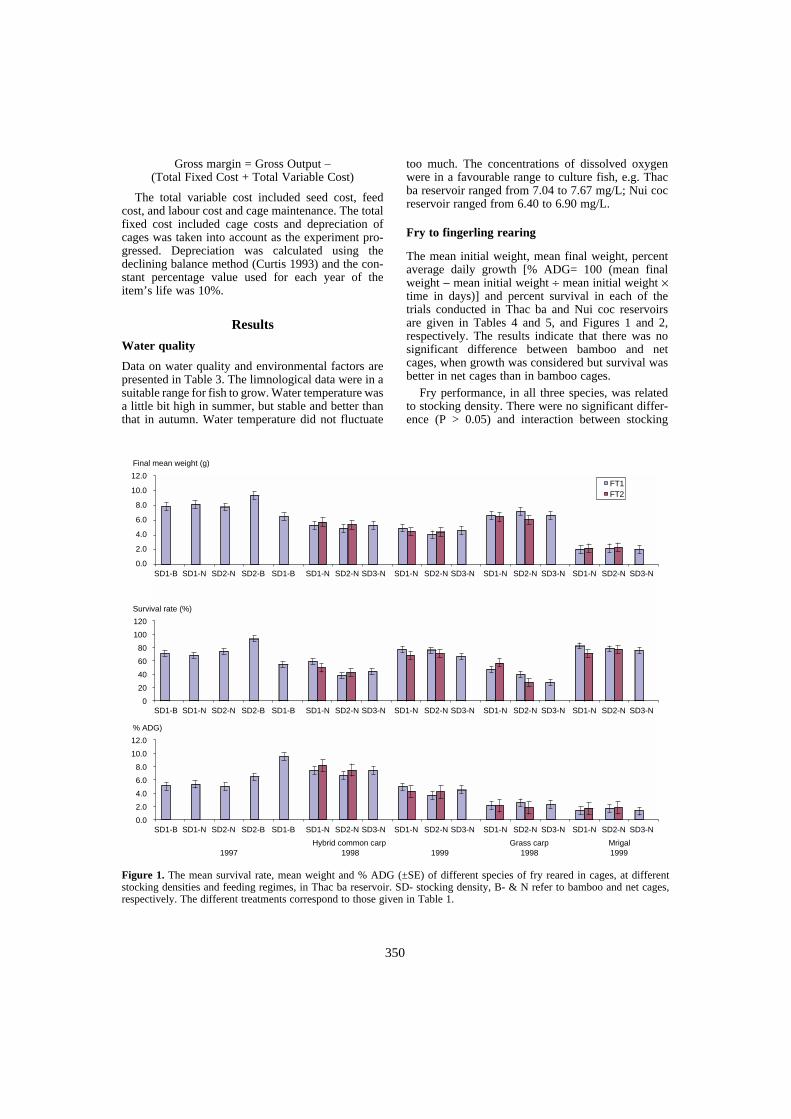
350
Gross margin = Gross Output – (Total Fixed Cost + Total Variable Cost)
The total variable cost included seed cost, feedcost, and labour cost and cage maintenance. The totalfixed cost included cage costs and depreciation ofcages was taken into account as the experiment pro-gressed. Depreciation was calculated using thedeclining balance method (Curtis 1993) and the con-stant percentage value used for each year of theitem’s life was 10%.
Results
Water quality
Data on water quality and environmental factors arepresented in Table 3. The limnological data were in asuitable range for fish to grow. Water temperature wasa little bit high in summer, but stable and better thanthat in autumn. Water temperature did not fluctuate
too much. The concentrations of dissolved oxygenwere in a favourable range to culture fish, e.g. Thacba reservoir ranged from 7.04 to 7.67 mg/L; Nui cocreservoir ranged from 6.40 to 6.90 mg/L.
Fry to fingerling rearing
The mean initial weight, mean final weight, percentaverage daily growth [% ADG= 100 (mean finalweight − mean initial weight ÷ mean initial weight ×time in days)] and percent survival in each of thetrials conducted in Thac ba and Nui coc reservoirsare given in Tables 4 and 5, and Figures 1 and 2,respectively. The results indicate that there was nosignificant difference between bamboo and netcages, when growth was considered but survival wasbetter in net cages than in bamboo cages.
Fry performance, in all three species, was relatedto stocking density. There were no significant differ-ence (P > 0.05) and interaction between stocking
Figure 1. The mean survival rate, mean weight and % ADG (±SE) of different species of fry reared in cages, at differentstocking densities and feeding regimes, in Thac ba reservoir. SD- stocking density, B- & N refer to bamboo and net cages,respectively. The different treatments correspond to those given in Table 1.
Final mean weight (g)
12.0
10.0
8.0
6.0
4.0
2.0
0.0
FT1FT2
SD1-B SD1-N SD2-N SD2-B SD1-B SD1-N SD2-N SD3-N SD1-N SD2-N SD3-N SD1-N SD2-N SD3-N SD1-N SD2-N SD3-N
Survival rate (%)
120
100
80
60
40
20
0SD1-B SD1-N SD2-N SD2-B SD1-B SD1-N SD2-N SD3-N SD1-N SD2-N SD3-N SD1-N SD2-N SD3-N SD1-N SD2-N SD3-N
% ADG)
12.0
10.0
8.0
6.0
4.0
2.0
0.0SD1-B SD1-N SD2-N SD2-B SD1-B SD1-N SD2-N SD3-N SD1-N SD2-N SD3-N SD1-N SD2-N SD3-N SD1-N SD2-N SD3-N
1997 1998 1999 1998 1999Hybrid common carp Grass carp Mrigal
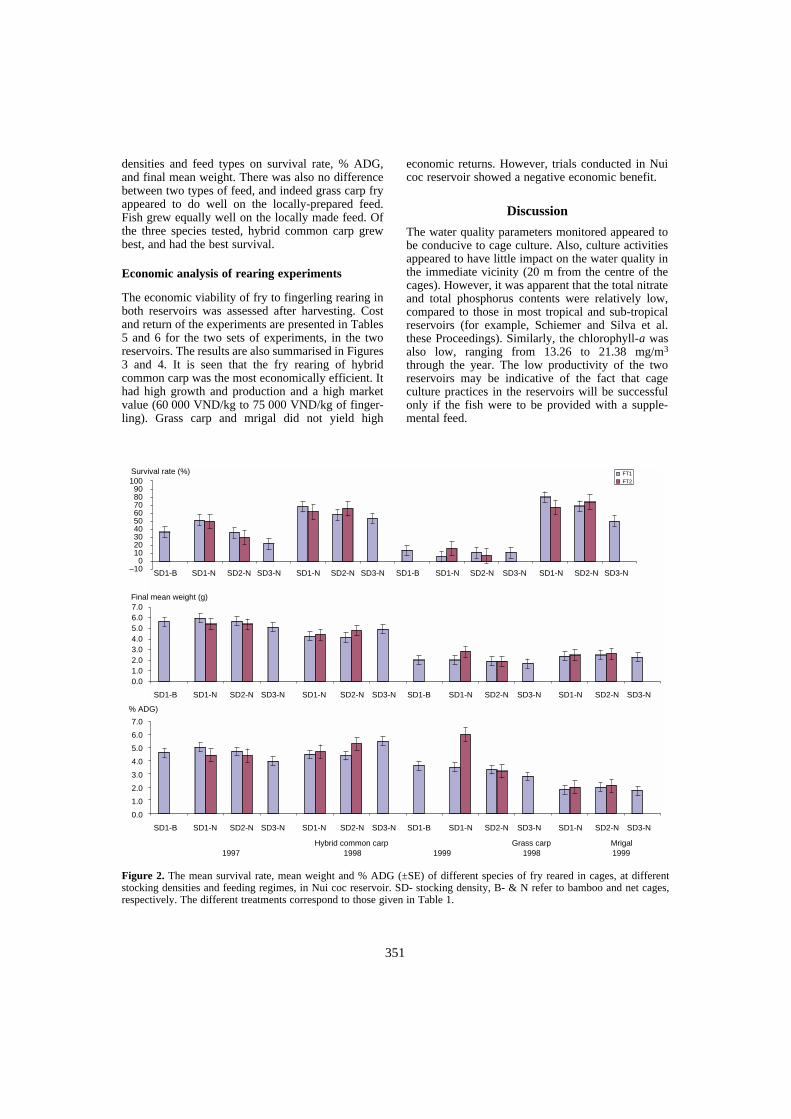
351
densities and feed types on survival rate, % ADG,and final mean weight. There was also no differencebetween two types of feed, and indeed grass carp fryappeared to do well on the locally-prepared feed.Fish grew equally well on the locally made feed. Ofthe three species tested, hybrid common carp grewbest, and had the best survival.
Economic analysis of rearing experiments
The economic viability of fry to fingerling rearing inboth reservoirs was assessed after harvesting. Costand return of the experiments are presented in Tables5 and 6 for the two sets of experiments, in the tworeservoirs. The results are also summarised in Figures3 and 4. It is seen that the fry rearing of hybridcommon carp was the most economically efficient. Ithad high growth and production and a high marketvalue (60 000 VND/kg to 75 000 VND/kg of finger-ling). Grass carp and mrigal did not yield high
economic returns. However, trials conducted in Nuicoc reservoir showed a negative economic benefit.
Discussion
The water quality parameters monitored appeared tobe conducive to cage culture. Also, culture activitiesappeared to have little impact on the water quality inthe immediate vicinity (20 m from the centre of thecages). However, it was apparent that the total nitrateand total phosphorus contents were relatively low,compared to those in most tropical and sub-tropicalreservoirs (for example, Schiemer and Silva et al.these Proceedings). Similarly, the chlorophyll-a wasalso low, ranging from 13.26 to 21.38 mg/m3
through the year. The low productivity of the tworeservoirs may be indicative of the fact that cageculture practices in the reservoirs will be successfulonly if the fish were to be provided with a supple-mental feed.
Figure 2. The mean survival rate, mean weight and % ADG (±SE) of different species of fry reared in cages, at differentstocking densities and feeding regimes, in Nui coc reservoir. SD- stocking density, B- & N refer to bamboo and net cages,respectively. The different treatments correspond to those given in Table 1.
Survival rate (%)100
908070605040302010
0–10
FT1
FT2
SD1-B SD1-N SD2-N SD3-N SD1-N SD2-N SD3-N SD1-B SD1-N SD2-N SD3-N SD1-N SD2-N SD3-N
Final mean weight (g)7.06.05.04.03.02.01.00.0
% ADG)
7.0
6.0
5.0
4.0
3.0
2.0
1.0
0.0
1997 1998 1999 1998 1999Hybrid common carp Grass carp Mrigal
SD1-B SD1-N SD2-N SD3-N SD1-N SD2-N SD3-N SD1-B SD1-N SD2-N SD3-N SD1-N SD2-N SD3-N
SD1-B SD1-N SD2-N SD3-N SD1-N SD2-N SD3-N SD1-B SD1-N SD2-N SD3-N SD1-N SD2-N SD3-N

352
Figure 3. A summary of the results of the financial analysis of fry to fingerling rearing in in cages in Thac ba reservoir.
(NA: data not available)
Table 4. Mean initial weight, mean final weight, % ADG and percentage survival rate of fish species in fry to fingerlingrearing trials in Thac ba reservoir. Where appropriate ± SE are also given.
Rearing cycle Treatment Weight (g)Initial
Final % ADG Survival(%)
1997Hybrid common carp SD1-FT1-CTB
SD1-FT1-CTNSD2-FT2-CTBSD2-FT2-CTN
2.39 ± 0.252.39 ± 0.252.39 ± 0.252.39 ± 0.25
7.81 ± 0.558.16 ± 0.367.78 ± 0.199.31 ± 0.70
5.04 ± 0.515.36 ± 0.345.01 ± 0.186.43 ± 0.63
70.88a ± 0.8067.52a ± 1.0473.76a ± 2.0692.32a ± 1.50
1998Hybrid common carp SD1-FT1-CTB
SD1-FT1-CTNSD1-FT2-CTNSD2-FT1-CTNSD2-FT2-CTNSD3-FT1-CTN
1.23 ± 0.181.23 ± 0.181.23 ± 0.181.23 ± 0.181.23 ± 0.181.23 ± 0.18
6.49 ± 0.455.29 ± 0.175.75 ± 0.284.90 ± 0.445.37 ± 0.105.34 ± 0.43
9.50 ± 0.827.35 ± 0.318.16 ± 0.516.63 ± 0.797.48 ± 0.187.42 ± 0.79
41.33x ± 14.7059.14x ± 05.2749.50b ± 03.5338.23y ± 05.5842.35b ± 03.1732.81z ± 10.97
2. Grass carp SD1-FT1-CTBSD1-FT1-CTNSD1-FT2-CTNSD2-FT1-CTNSD2-FT2-CTNSD3-FT1-CTN
NA3.33 ± 0.293.33 ± 0.293.33 ± 0.293.33 ± 0.293.33 ± 0.29
NA6.60 ± 0.606.45 ± 0.167.12 ± 0.266.04 ± 0.276.68 ± 0.17
NA2.18 ± 0.392.08 ± 0.112.53 ± 0.181.81 ± 0.182.23 ± 0.11
NA35.70x ± 12.7044.08b ± 18.7320.22y ± 05.0527.22b ± 03.7827.48z ± 03.28
1999Hybrid common carp SD1-FT1-CTB
SD1-FT1-CTNSD1-FT2-CTNSD2-FT1-CTNSD2-FT2-CTNSD3-FT1-CTN
NA1.25 ± 0.091.25 ± 0.091.25 ± 0.091.25 ± 0.091.25 ± 0.09
NA4.95 ± 0.654.47 ± 0.374.02 ± 0.444.40 ± 0.364.61 ± 0.14
NA4.93 ± 0.874.29 ± 0.493.69 ± 0.594.20 ± 0.484.48 ± 0.18
NA76.50x ± 6.3168.02b ± 6.0075.45y ± 6.3070.93b ± 3.0565.80z ± 6.57
Grass carp SD1-FT1-CTBSD1-FT1-CTNSD1-FT2-CTNSD2-FT1-CTNSD2-FT2-CTNSD3-FT1-CTN
NA1.11 ± 0.081.11 ± 0.081.11 ± 0.081.11 ± 0.081.11 ± 0.08
NA2.07 ± 0.172.25 ± 0.172.24 ± 0.222.33 ± 0.302.00 ± 0.16
NA1.44 ± 0.261.70 ± 0.261.69 ± 0.331.83 ± 0.441.33 ± 0.23
NA81.88 ± 2.5170.70 ± 6.1278.41± 2.8077.18 ± 5.0075.06 ± 2.54
Gross output Inputs Net income
experiment 1 experiment 2 experiment 3 experiment 4 experiment 5
1 600 000
1 400 000
1 200 000
1 000 000
800 000
600 000
400 000
200 000
0
–200 000
–400 000
VND/m3
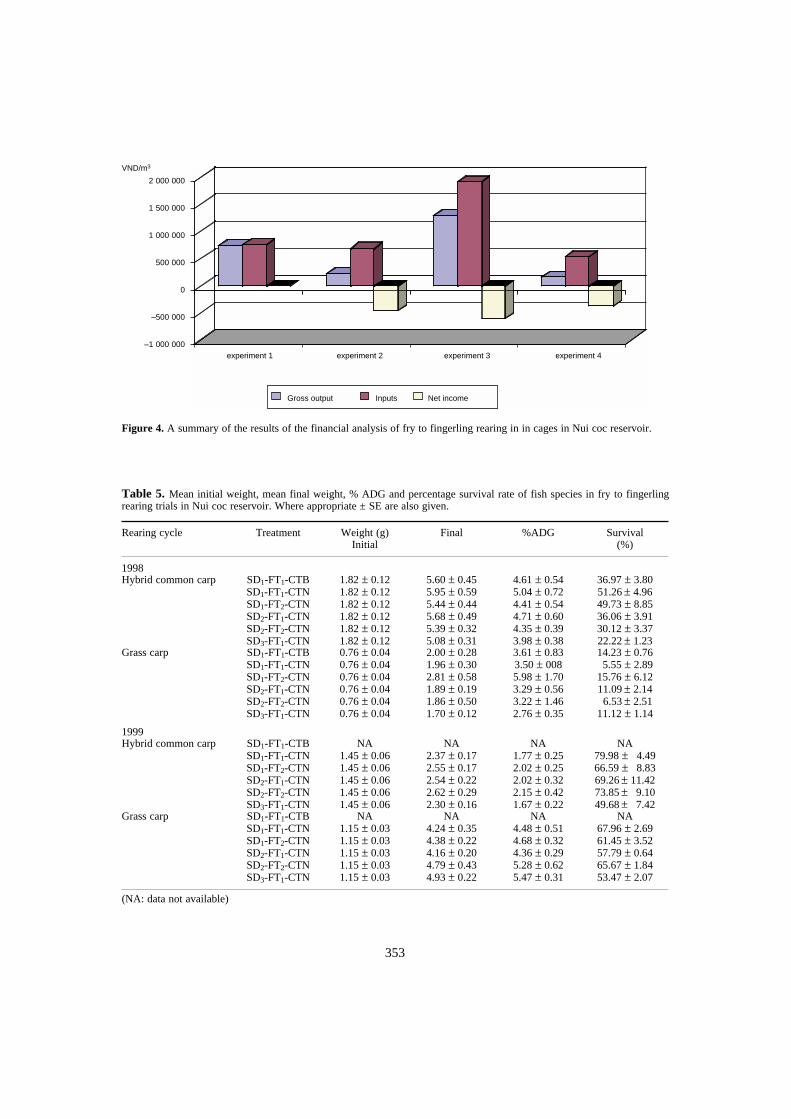
353
Figure 4. A summary of the results of the financial analysis of fry to fingerling rearing in in cages in Nui coc reservoir.
(NA: data not available)
Table 5. Mean initial weight, mean final weight, % ADG and percentage survival rate of fish species in fry to fingerlingrearing trials in Nui coc reservoir. Where appropriate ± SE are also given.
Rearing cycle Treatment Weight (g)Initial
Final %ADG Survival(%)
1998Hybrid common carp SD1-FT1-CTB
SD1-FT1-CTNSD1-FT2-CTNSD2-FT1-CTNSD2-FT2-CTNSD3-FT1-CTN
1.82 ± 0.121.82 ± 0.121.82 ± 0.121.82 ± 0.121.82 ± 0.121.82 ± 0.12
5.60 ± 0.455.95 ± 0.595.44 ± 0.445.68 ± 0.495.39 ± 0.325.08 ± 0.31
4.61 ± 0.545.04 ± 0.724.41 ± 0.544.71 ± 0.604.35 ± 0.393.98 ± 0.38
36.97 ± 3.8051.26 ± 4.9649.73 ± 8.8536.06 ± 3.9130.12 ± 3.3722.22 ± 1.23
Grass carp SD1-FT1-CTBSD1-FT1-CTNSD1-FT2-CTNSD2-FT1-CTNSD2-FT2-CTNSD3-FT1-CTN
0.76 ± 0.040.76 ± 0.040.76 ± 0.040.76 ± 0.040.76 ± 0.040.76 ± 0.04
2.00 ± 0.281.96 ± 0.302.81 ± 0.581.89 ± 0.191.86 ± 0.501.70 ± 0.12
3.61 ± 0.833.50 ± 0085.98 ± 1.703.29 ± 0.563.22 ± 1.462.76 ± 0.35
14.23 ± 0.765.55 ± 2.89
15.76 ± 6.1211.09 ± 2.146.53 ± 2.51
11.12 ± 1.14
1999Hybrid common carp SD1-FT1-CTB
SD1-FT1-CTNSD1-FT2-CTNSD2-FT1-CTNSD2-FT2-CTNSD3-FT1-CTN
NA1.45 ± 0.061.45 ± 0.061.45 ± 0.061.45 ± 0.061.45 ± 0.06
NA2.37 ± 0.172.55 ± 0.172.54 ± 0.222.62 ± 0.292.30 ± 0.16
NA1.77 ± 0.252.02 ± 0.252.02 ± 0.322.15 ± 0.421.67 ± 0.22
NA79.98 ± 4.4966.59 ± 8.8369.26 ± 11.4273.85 ± 9.1049.68 ± 7.42
Grass carp SD1-FT1-CTBSD1-FT1-CTNSD1-FT2-CTNSD2-FT1-CTNSD2-FT2-CTNSD3-FT1-CTN
NA1.15 ± 0.031.15 ± 0.031.15 ± 0.031.15 ± 0.031.15 ± 0.03
NA4.24 ± 0.354.38 ± 0.224.16 ± 0.204.79 ± 0.434.93 ± 0.22
NA4.48 ± 0.514.68 ± 0.324.36 ± 0.295.28 ± 0.625.47 ± 0.31
NA67.96 ± 2.6961.45 ± 3.5257.79 ± 0.6465.67 ± 1.8453.47 ± 2.07
Gross output Inputs Net income
experiment 1 experiment 2 experiment 3 experiment 4
2 000 000
1 500 000
1 000 000
500 000
0
–500 000
–1 000 000
VND/m3
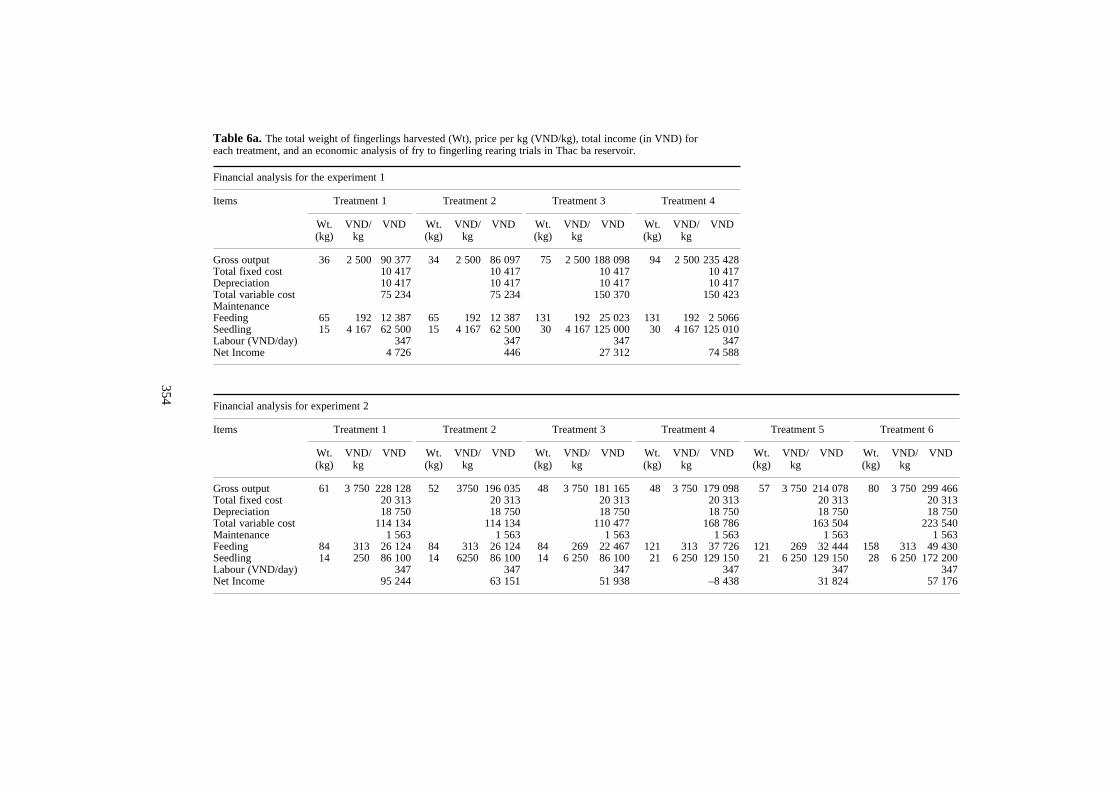
354
Table 6a. The total weight of fingerlings harvested (Wt), price per kg (VND/kg), total income (in VND) for each treatment, and an economic analysis of fry to fingerling rearing trials in Thac ba reservoir.
Financial analysis for the experiment 1
Items Treatment 1 Treatment 2 Treatment 3 Treatment 4
Wt. (kg)
VND/kg
VND Wt.(kg)
VND/kg
VND Wt.(kg)
VND/kg
VND Wt.(kg)
VND/kg
VND
Gross output 36 2 500 90 377 34 2 500 86 097 75 2 500 188 098 94 2 500 235 428Total fixed cost 10 417 10 417 10 417 10 417Depreciation 10 417 10 417 10 417 10 417Total variable cost 75 234 75 234 150 370 150 423MaintenanceFeeding 65 192 12 387 65 192 12 387 131 192 25 023 131 192 2 5066Seedling 15 4 167 62 500 15 4 167 62 500 30 4 167 125 000 30 4 167 125 010Labour (VND/day) 347 347 347 347Net Income 4 726 446 27 312 74 588
Financial analysis for experiment 2
Items Treatment 1 Treatment 2 Treatment 3 Treatment 4 Treatment 5 Treatment 6
Wt.(kg)
VND/kg
VND Wt.(kg)
VND/kg
VND Wt.(kg)
VND/kg
VND Wt.(kg)
VND/kg
VND Wt.(kg)
VND/kg
VND Wt.(kg)
VND/kg
VND
Gross output 61 3 750 228 128 52 3750 196 035 48 3 750 181 165 48 3 750 179 098 57 3 750 214 078 80 3 750 299 466Total fixed cost 20 313 20 313 20 313 20 313 20 313 20 313Depreciation 18 750 18 750 18 750 18 750 18 750 18 750Total variable cost 114 134 114 134 110 477 168 786 163 504 223 540Maintenance 1 563 1 563 1 563 1 563 1 563 1 563Feeding 84 313 26 124 84 313 26 124 84 269 22 467 121 313 37 726 121 269 32 444 158 313 49 430Seedling 14 250 86 100 14 6250 86 100 14 6 250 86 100 21 6 250 129 150 21 6 250 129 150 28 6 250 172 200Labour (VND/day) 347 347 347 347 347 347Net Income 95 244 63 151 51 938 –8 438 31 824 57 176
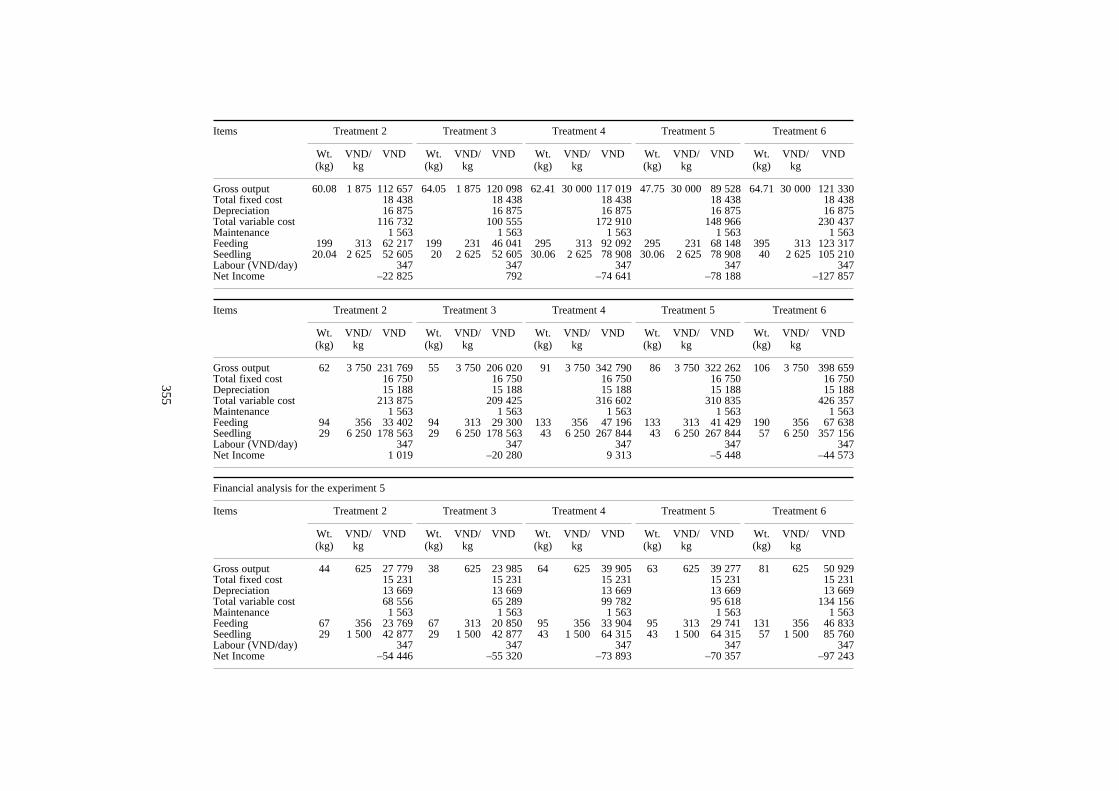
355
Items Treatment 2 Treatment 3 Treatment 4 Treatment 5 Treatment 6
Wt.(kg)
VND/kg
VND Wt.(kg)
VND/kg
VND Wt.(kg)
VND/kg
VND Wt.(kg)
VND/kg
VND Wt.(kg)
VND/kg
VND
Gross output 60.08 1 875 112 657 64.05 1 875 120 098 62.41 30 000 117 019 47.75 30 000 89 528 64.71 30 000 121 330Total fixed cost 18 438 18 438 18 438 18 438 18 438Depreciation 16 875 16 875 16 875 16 875 16 875Total variable cost 116 732 100 555 172 910 148 966 230 437Maintenance 1 563 1 563 1 563 1 563 1 563Feeding 199 313 62 217 199 231 46 041 295 313 92 092 295 231 68 148 395 313 123 317Seedling 20.04 2 625 52 605 20 2 625 52 605 30.06 2 625 78 908 30.06 2 625 78 908 40 2 625 105 210Labour (VND/day) 347 347 347 347 347Net Income –22 825 792 –74 641 –78 188 –127 857
Items Treatment 2 Treatment 3 Treatment 4 Treatment 5 Treatment 6
Wt.(kg)
VND/kg
VND Wt.(kg)
VND/kg
VND Wt.(kg)
VND/kg
VND Wt.(kg)
VND/kg
VND Wt.(kg)
VND/kg
VND
Gross output 62 3 750 231 769 55 3 750 206 020 91 3 750 342 790 86 3 750 322 262 106 3 750 398 659Total fixed cost 16 750 16 750 16 750 16 750 16 750Depreciation 15 188 15 188 15 188 15 188 15 188Total variable cost 213 875 209 425 316 602 310 835 426 357Maintenance 1 563 1 563 1 563 1 563 1 563Feeding 94 356 33 402 94 313 29 300 133 356 47 196 133 313 41 429 190 356 67 638Seedling 29 6 250 178 563 29 6 250 178 563 43 6 250 267 844 43 6 250 267 844 57 6 250 357 156Labour (VND/day) 347 347 347 347 347Net Income 1 019 –20 280 9 313 –5 448 –44 573
Financial analysis for the experiment 5
Items Treatment 2 Treatment 3 Treatment 4 Treatment 5 Treatment 6
Wt.(kg)
VND/kg
VND Wt.(kg)
VND/kg
VND Wt.(kg)
VND/kg
VND Wt.(kg)
VND/kg
VND Wt.(kg)
VND/kg
VND
Gross output 44 625 27 779 38 625 23 985 64 625 39 905 63 625 39 277 81 625 50 929Total fixed cost 15 231 15 231 15 231 15 231 15 231Depreciation 13 669 13 669 13 669 13 669 13 669Total variable cost 68 556 65 289 99 782 95 618 134 156Maintenance 1 563 1 563 1 563 1 563 1 563Feeding 67 356 23 769 67 313 20 850 95 356 33 904 95 313 29 741 131 356 46 833Seedling 29 1 500 42 877 29 1 500 42 877 43 1 500 64 315 43 1 500 64 315 57 1 500 85 760Labour (VND/day) 347 347 347 347 347Net Income –54 446 –55 320 –73 893 –70 357 –97 243
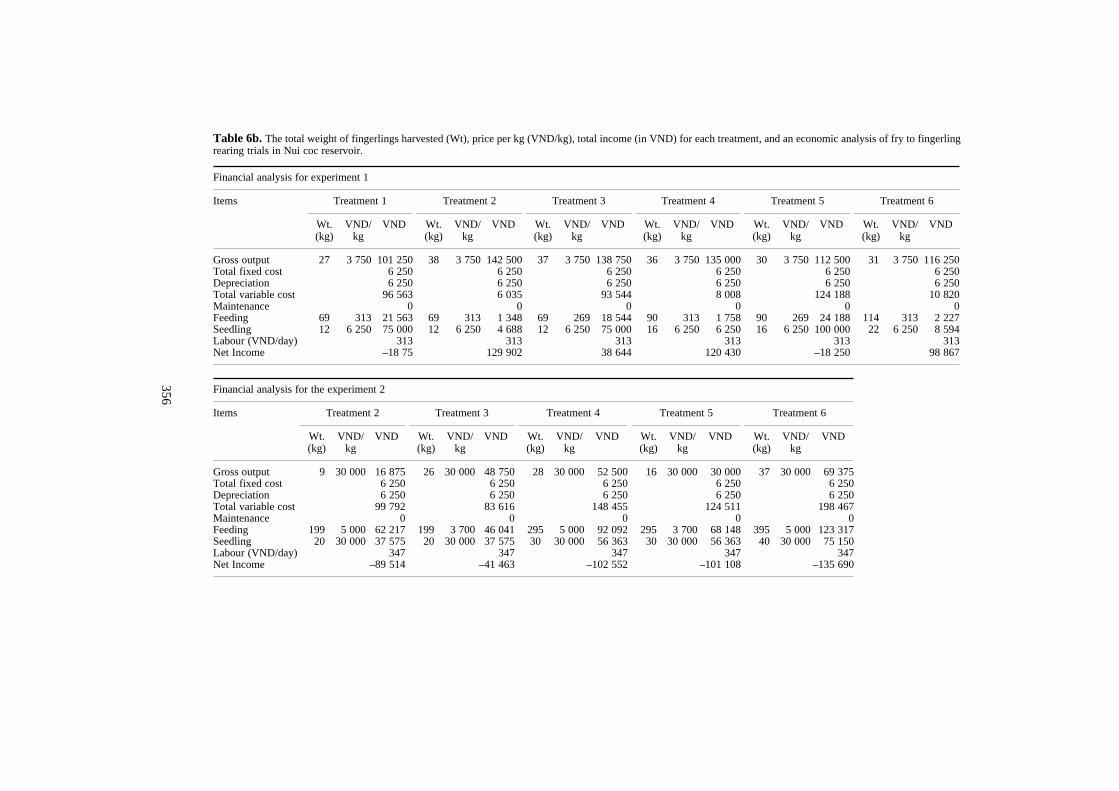
356
Table 6b. The total weight of fingerlings harvested (Wt), price per kg (VND/kg), total income (in VND) for each treatment, and an economic analysis of fry to fingerlingrearing trials in Nui coc reservoir.
Financial analysis for experiment 1
Items Treatment 1 Treatment 2 Treatment 3 Treatment 4 Treatment 5 Treatment 6
Wt. (kg)
VND/kg
VND Wt.(kg)
VND/kg
VND Wt.(kg)
VND/kg
VND Wt.(kg)
VND/kg
VND Wt.(kg)
VND/kg
VND Wt.(kg)
VND/kg
VND
Gross output 27 3 750 101 250 38 3 750 142 500 37 3 750 138 750 36 3 750 135 000 30 3 750 112 500 31 3 750 116 250Total fixed cost 6 250 6 250 6 250 6 250 6 250 6 250Depreciation 6 250 6 250 6 250 6 250 6 250 6 250Total variable cost 96 563 6 035 93 544 8 008 124 188 10 820Maintenance 0 0 0 0 0 0Feeding 69 313 21 563 69 313 1 348 69 269 18 544 90 313 1 758 90 269 24 188 114 313 2 227Seedling 12 6 250 75 000 12 6 250 4 688 12 6 250 75 000 16 6 250 6 250 16 6 250 100 000 22 6 250 8 594Labour (VND/day) 313 313 313 313 313 313Net Income –18 75 129 902 38 644 120 430 –18 250 98 867
Financial analysis for the experiment 2
Items Treatment 2 Treatment 3 Treatment 4 Treatment 5 Treatment 6
Wt.(kg)
VND/kg
VND Wt.(kg)
VND/kg
VND Wt.(kg)
VND/kg
VND Wt.(kg)
VND/kg
VND Wt.(kg)
VND/kg
VND
Gross output 9 30 000 16 875 26 30 000 48 750 28 30 000 52 500 16 30 000 30 000 37 30 000 69 375Total fixed cost 6 250 6 250 6 250 6 250 6 250Depreciation 6 250 6 250 6 250 6 250 6 250Total variable cost 99 792 83 616 148 455 124 511 198 467Maintenance 0 0 0 0 0Feeding 199 5 000 62 217 199 3 700 46 041 295 5 000 92 092 295 3 700 68 148 395 5 000 123 317Seedling 20 30 000 37 575 20 30 000 37 575 30 30 000 56 363 30 30 000 56 363 40 30 000 75 150Labour (VND/day) 347 347 347 347 347Net Income –89 514 –41 463 –102 552 –101 108 –135 690
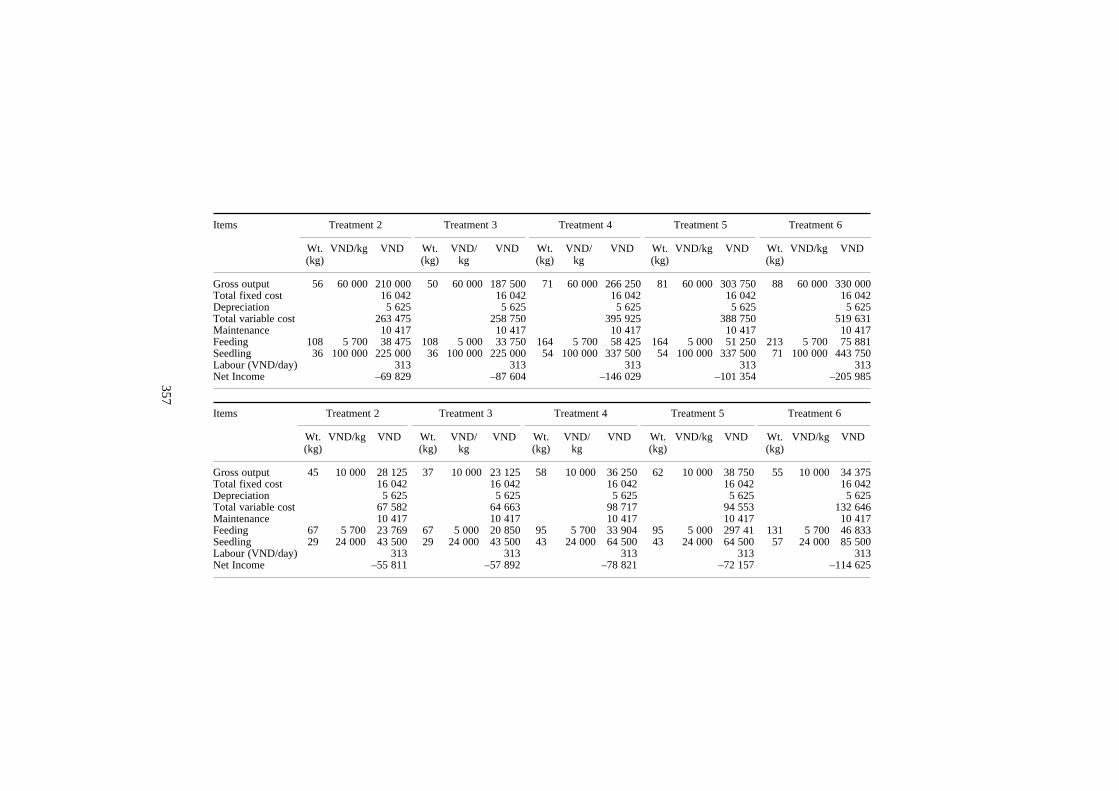
357
Items Treatment 2 Treatment 3 Treatment 4 Treatment 5 Treatment 6
Wt.(kg)
VND/kg VND Wt.(kg)
VND/kg
VND Wt.(kg)
VND/kg
VND Wt.(kg)
VND/kg VND Wt.(kg)
VND/kg VND
Gross output 56 60 000 210 000 50 60 000 187 500 71 60 000 266 250 81 60 000 303 750 88 60 000 330 000Total fixed cost 16 042 16 042 16 042 16 042 16 042Depreciation 5 625 5 625 5 625 5 625 5 625Total variable cost 263 475 258 750 395 925 388 750 519 631Maintenance 10 417 10 417 10 417 10 417 10 417Feeding 108 5 700 38 475 108 5 000 33 750 164 5 700 58 425 164 5 000 51 250 213 5 700 75 881Seedling 36 100 000 225 000 36 100 000 225 000 54 100 000 337 500 54 100 000 337 500 71 100 000 443 750Labour (VND/day) 313 313 313 313 313Net Income –69 829 –87 604 –146 029 –101 354 –205 985
Items Treatment 2 Treatment 3 Treatment 4 Treatment 5 Treatment 6
Wt.(kg)
VND/kg VND Wt.(kg)
VND/kg
VND Wt.(kg)
VND/kg
VND Wt.(kg)
VND/kg VND Wt.(kg)
VND/kg VND
Gross output 45 10 000 28 125 37 10 000 23 125 58 10 000 36 250 62 10 000 38 750 55 10 000 34 375Total fixed cost 16 042 16 042 16 042 16 042 16 042Depreciation 5 625 5 625 5 625 5 625 5 625Total variable cost 67 582 64 663 98 717 94 553 132 646Maintenance 10 417 10 417 10 417 10 417 10 417Feeding 67 5 700 23 769 67 5 000 20 850 95 5 700 33 904 95 5 000 297 41 131 5 700 46 833Seedling 29 24 000 43 500 29 24 000 43 500 43 24 000 64 500 43 24 000 64 500 57 24 000 85 500Labour (VND/day) 313 313 313 313 313Net Income –55 811 –57 892 –78 821 –72 157 –114 625

358
It is common for small-scale fish farmers to usebamboo cages, primarily because of its ready avail-ability in Vietnam. However, the present study hasshown that bamboo cages were inferior to net cages;fry survival and growth were higher in net cages.Furthermore, net cages were easier to assemble andalso facilitated harvesting. The better performance offry in net cages may be due to a higher rate of waterexchange with net cages, and also reduced damage tostock caused by the rigid structure of the bamboocages.
The present trials indicate that the optimalstocking density for fry to fingerling rearing is fromabout 3000 to 4000 fry/m3. Apart from commoncarp, the size dispersion at the end of the rearingperiod was narrow, and as such, minimised anypotential cannibalism.
The economic effectiveness of mrigal and grasscarp was very low because of low selling prices andhigh inputs. Local feed is an advantage for rearingfish in cages. The farmers can gain more from cageculture by reusing farm by-products, local feed types.
Acknowledgement
This study was funded by Australian Centre forInternational Agriculture Research (ACIAR). We
would like to thank Yen Bai Fisheries Center,Department of Agriculture and Rural Developmentof Yen Bai and Thai Nguyen provinces for their helpduring the completion of this study. Finally, wewould like to express our gratitude to Professor SenaS. De Silva and Dr Le Thanh Luu for giving invalu-able advice and for their encouragement.
References
ACIAR 1997. Memorandum of subsidiary arrangementACIAR Project FIS/97/68. Reservoir.
Fishery development and Management in Northern MidHighland region, Vietnam.
APHA, 1995. Standard methods for the Examination ofWater and Wastewater. 19th edition.
American Public Health Association, Washington DC,USA.
Biradar, R.S. 1986. Course Manual of Fisheries Statistics.Central Institute of Fisheries.
Education, Indian Council of Agricultural research, NewDelhi, India.
Phuong, Truong ha 1998. Assessment and preliminary trialsof nursing common carp in cages in Eakao reservoir,Vietnam. MSc Thesis, Asian Institute of Technology,Bangkok, Thailand.
359
Performance of Cage-reared Fingerlings of Commonly Cultured Fish Species in Response to Different Feeds
M.H.S. Ariyaratne*
Abstract
Fingerling-rearing in net cages in perennial reservoirs of Sri Lanka is a recent developmentintroduced by the government. It includes the involvement of reservoir fishing communities. Ricebran and locally formulated fish feed were used as feed in the culture practices. The potential ofusing small cyprinids, abundant in reservoirs of Sri Lanka, was also evaluated in this strategy.
Twenty-four net cages (2 × 4 × 2.5 (20 m3) were installed in three Sri Lankan reservoirs,Chandrikawewa, Kiriibbanwewa and Muthukandiyawewa, and were stocked with fry of one offive cyprinid species, i.e. Cyprinus carpio, Catla catla, Labeo rohita, L. dussumieri, Hypophthal-michthys molitrix and one cichlid species, Oreochromis niloticus. The trials were conducted to rearfry up to advanced fry (rearing period 21–45 days) and fry to fingerling (rearing period: 70–80days). Members of fisheries cooperative societies were trained to operate this aquaculture system.Three feed types were used. Rice bran (RB), a commercial fish feed (Cf) and farmer-made aqua-feed (Mf) were compared with a treatment in which feed was not presented. The main ingredientsused for preparing Mf were locally available RB, fishmeal (prepared from cyprinids in reservoirs)and cooked cassava tubers.
Of the six species cultured, the lowest percentage survival occurred in C. catla in Chandri-kawewa (<1%). In Muthukandiyawewa, where fishing communities are better experienced in cage-culture, high survival was observed for L. rohita (37.1–55.1%), and C. carpio (36.6–78.5%). Theindigenous cyprinid L. dussumieri performed well in two reservoirs when survival as high as95.1% in Kiriibbanwewa was recorded. Based on survival, L. dussumieri, L. rohita, C. carpio andO. niloticus can therefore be considered as better candidates for cage aquaculture for fry to finger-ling rearing than C. catla and H. molitrix. Percentage average daily growth (%ADG) was alwayslower in cages with high survival than in cages with low survival, perhaps due to the competitionfor food. RB and Cf gave better survival rates in most trials. Proximate composition of Mf (drymatter, 51–71%; moisture, 28–48%; ash, 5–12%; protein, 17–33% and fat 2–12%) which is com-parable to Cf, can be used to reduce the cost of feeding.
ASIAN aquaculture is dominated by semi-intensiveculture systems. The most commonly used groups offish in semi-intensive aquaculture practices in Asiancountries are carp, milkfish and tilapias. According toAnderson and De Silva (1997), the opportunity existsfor inclusion of agricultural by-products and wastesin the feed for these species. However, requirementof animal protein, at least to a lesser extent, cannot bedisregarded in preparing farmer-made aquafeed.Minor cyprinid resources, found in large quantities inreservoirs (Amarasinghe 1985; De Silva and Sirisena
1987; Amarasinghe 1990; Pet and Piet 1993), havethe potential to be used in feed preparation as ananimal protein source. Anderson and De Silva (1997)emphasised the importance of feed formulation oflow-cost diets instead of nutritionally wholesomediets for semi-intensive culture practices.
In Sri Lanka, an aquaculture development plan hasbeen implemented since 1995. Under the program, astrategy to rear fish fry to fingerling size in floatingnet cages has been introduced in several perennialreservoirs. This aquaculture practice is carried outthrough community participation. Fingerlings rearedin net cages are used for stocking seasonal reservoirsand small village reservoirs. In Sri Lanka, there is apaucity of fingerling availability for culture practices,
*National Aquatic Resources Research and DevelopmentAgency, Crow Island, Colombo-15, Sri Lanka
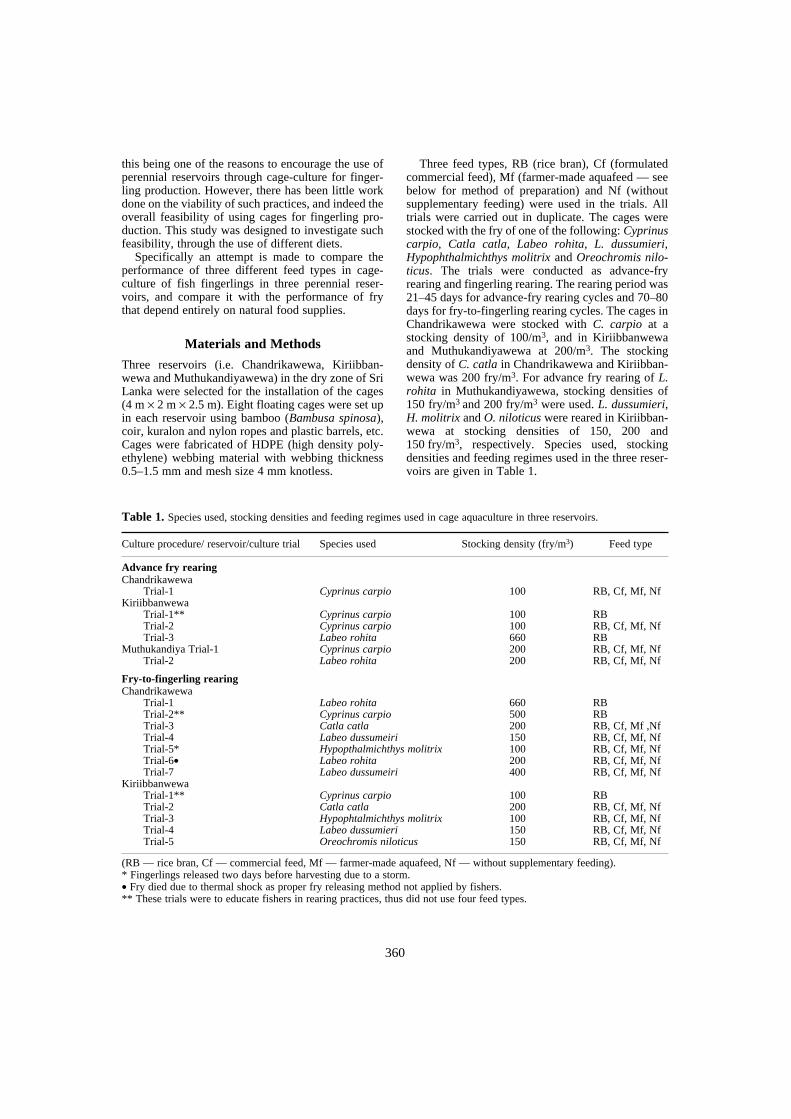
360
this being one of the reasons to encourage the use ofperennial reservoirs through cage-culture for finger-ling production. However, there has been little workdone on the viability of such practices, and indeed theoverall feasibility of using cages for fingerling pro-duction. This study was designed to investigate suchfeasibility, through the use of different diets.
Specifically an attempt is made to compare theperformance of three different feed types in cage-culture of fish fingerlings in three perennial reser-voirs, and compare it with the performance of frythat depend entirely on natural food supplies.
Materials and Methods
Three reservoirs (i.e. Chandrikawewa, Kiriibban-wewa and Muthukandiyawewa) in the dry zone of SriLanka were selected for the installation of the cages(4 m × 2 m × 2.5 m). Eight floating cages were set upin each reservoir using bamboo (Bambusa spinosa),coir, kuralon and nylon ropes and plastic barrels, etc.Cages were fabricated of HDPE (high density poly-ethylene) webbing material with webbing thickness0.5–1.5 mm and mesh size 4 mm knotless.
Three feed types, RB (rice bran), Cf (formulatedcommercial feed), Mf (farmer-made aquafeed — seebelow for method of preparation) and Nf (withoutsupplementary feeding) were used in the trials. Alltrials were carried out in duplicate. The cages werestocked with the fry of one of the following: Cyprinuscarpio, Catla catla, Labeo rohita, L. dussumieri,Hypophthalmichthys molitrix and Oreochromis nilo-ticus. The trials were conducted as advance-fryrearing and fingerling rearing. The rearing period was21–45 days for advance-fry rearing cycles and 70–80days for fry-to-fingerling rearing cycles. The cages inChandrikawewa were stocked with C. carpio at astocking density of 100/m3, and in Kiriibbanwewaand Muthukandiyawewa at 200/m3. The stockingdensity of C. catla in Chandrikawewa and Kiriibban-wewa was 200 fry/m3. For advance fry rearing of L.rohita in Muthukandiyawewa, stocking densities of150 fry/m3 and 200 fry/m3 were used. L. dussumieri,H. molitrix and O. niloticus were reared in Kiriibban-wewa at stocking densities of 150, 200 and150 fry/m3, respectively. Species used, stockingdensities and feeding regimes used in the three reser-voirs are given in Table 1.
(RB — rice bran, Cf — commercial feed, Mf — farmer-made aquafeed, Nf — without supplementary feeding).* Fingerlings released two days before harvesting due to a storm.• Fry died due to thermal shock as proper fry releasing method not applied by fishers.** These trials were to educate fishers in rearing practices, thus did not use four feed types.
Table 1. Species used, stocking densities and feeding regimes used in cage aquaculture in three reservoirs.
Culture procedure/ reservoir/culture trial Species used Stocking density (fry/m3) Feed type
Advance fry rearingChandrikawewa
Trial-1 Cyprinus carpio 100 RB, Cf, Mf, NfKiriibbanwewa
Trial-1** Cyprinus carpio 100 RBTrial-2 Cyprinus carpio 100 RB, Cf, Mf, NfTrial-3 Labeo rohita 660 RB
Muthukandiya Trial-1 Cyprinus carpio 200 RB, Cf, Mf, NfTrial-2 Labeo rohita 200 RB, Cf, Mf, Nf
Fry-to-fingerling rearingChandrikawewa
Trial-1 Labeo rohita 660 RBTrial-2** Cyprinus carpio 500 RBTrial-3 Catla catla 200 RB, Cf, Mf ,NfTrial-4 Labeo dussumeiri 150 RB, Cf, Mf, NfTrial-5* Hypopthalmichthys molitrix 100 RB, Cf, Mf, NfTrial-6• Labeo rohita 200 RB, Cf, Mf, NfTrial-7 Labeo dussumeiri 400 RB, Cf, Mf, Nf
KiriibbanwewaTrial-1** Cyprinus carpio 100 RBTrial-2 Catla catla 200 RB, Cf, Mf, NfTrial-3 Hypophtalmichthys molitrix 100 RB, Cf, Mf, NfTrial-4 Labeo dussumieri 150 RB, Cf, Mf, NfTrial-5 Oreochromis niloticus 150 RB, Cf, Mf, Nf
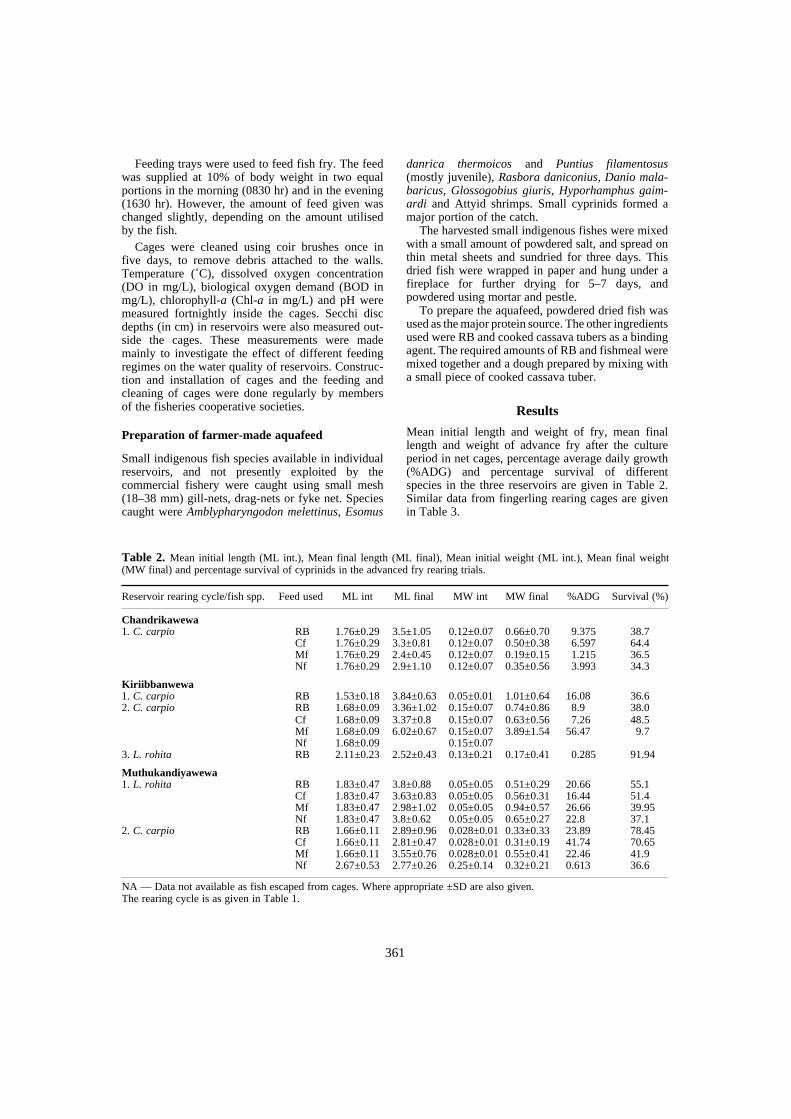
361
Feeding trays were used to feed fish fry. The feedwas supplied at 10% of body weight in two equalportions in the morning (0830 hr) and in the evening(1630 hr). However, the amount of feed given waschanged slightly, depending on the amount utilisedby the fish.
Cages were cleaned using coir brushes once infive days, to remove debris attached to the walls.Temperature (˚C), dissolved oxygen concentration(DO in mg/L), biological oxygen demand (BOD inmg/L), chlorophyll-a (Chl-a in mg/L) and pH weremeasured fortnightly inside the cages. Secchi discdepths (in cm) in reservoirs were also measured out-side the cages. These measurements were mademainly to investigate the effect of different feedingregimes on the water quality of reservoirs. Construc-tion and installation of cages and the feeding andcleaning of cages were done regularly by membersof the fisheries cooperative societies.
Preparation of farmer-made aquafeed
Small indigenous fish species available in individualreservoirs, and not presently exploited by thecommercial fishery were caught using small mesh(18–38 mm) gill-nets, drag-nets or fyke net. Speciescaught were Amblypharyngodon melettinus, Esomus
danrica thermoicos and Puntius filamentosus(mostly juvenile), Rasbora daniconius, Danio mala-baricus, Glossogobius giuris, Hyporhamphus gaim-ardi and Attyid shrimps. Small cyprinids formed amajor portion of the catch.
The harvested small indigenous fishes were mixedwith a small amount of powdered salt, and spread onthin metal sheets and sundried for three days. Thisdried fish were wrapped in paper and hung under afireplace for further drying for 5–7 days, andpowdered using mortar and pestle.
To prepare the aquafeed, powdered dried fish wasused as the major protein source. The other ingredientsused were RB and cooked cassava tubers as a bindingagent. The required amounts of RB and fishmeal weremixed together and a dough prepared by mixing witha small piece of cooked cassava tuber.
Results
Mean initial length and weight of fry, mean finallength and weight of advance fry after the cultureperiod in net cages, percentage average daily growth(%ADG) and percentage survival of differentspecies in the three reservoirs are given in Table 2.Similar data from fingerling rearing cages are givenin Table 3.
NA — Data not available as fish escaped from cages. Where appropriate ±SD are also given.The rearing cycle is as given in Table 1.
Table 2. Mean initial length (ML int.), Mean final length (ML final), Mean initial weight (ML int.), Mean final weight(MW final) and percentage survival of cyprinids in the advanced fry rearing trials.
Reservoir rearing cycle/fish spp. Feed used ML int ML final MW int MW final %ADG Survival (%)
Chandrikawewa1. C. carpio RB 1.76±0.29 3.5±1.05 0.12±0.07 0.66±0.70 9.375 38.7
Cf 1.76±0.29 3.3±0.81 0.12±0.07 0.50±0.38 6.597 64.4Mf 1.76±0.29 2.4±0.45 0.12±0.07 0.19±0.15 1.215 36.5Nf 1.76±0.29 2.9±1.10 0.12±0.07 0.35±0.56 3.993 34.3
Kiriibbanwewa1. C. carpio RB 1.53±0.18 3.84±0.63 0.05±0.01 1.01±0.64 16.08 36.62. C. carpio RB
Cf1.68±0.091.68±0.09
3.36±1.023.37±0.8
0.15±0.070.15±0.07
0.74±0.860.63±0.56
8.97.26
38.048.5
Mf 1.68±0.09 6.02±0.67 0.15±0.07 3.89±1.54 56.47 9.7Nf 1.68±0.09 0.15±0.07
3. L. rohita RB 2.11±0.23 2.52±0.43 0.13±0.21 0.17±0.41 0.285 91.94
Muthukandiyawewa1. L. rohita RB 1.83±0.47 3.8±0.88 0.05±0.05 0.51±0.29 20.66 55.1
Cf 1.83±0.47 3.63±0.83 0.05±0.05 0.56±0.31 16.44 51.4Mf 1.83±0.47 2.98±1.02 0.05±0.05 0.94±0.57 26.66 39.95Nf 1.83±0.47 3.8±0.62 0.05±0.05 0.65±0.27 22.8 37.1
2. C. carpio RB 1.66±0.11 2.89±0.96 0.028±0.01 0.33±0.33 23.89 78.45Cf 1.66±0.11 2.81±0.47 0.028±0.01 0.31±0.19 41.74 70.65Mf 1.66±0.11 3.55±0.76 0.028±0.01 0.55±0.41 22.46 41.9Nf 2.67±0.53 2.77±0.26 0.25±0.14 0.32±0.21 0.613 36.6

362
Percentage survival and % ADG of C. carpio inthree reservoirs are shown in Figures 1a and 1brespectively for advance fry rearing cages. Similardata for C. catla cages in Kiriibbanwewa and Chan-drikawewa are shown in Figures 2a and 2b. L. dus-sumieri in the same reservoirs are shown in Figures2c and 2d. Values for O. niloticus and H. molitrix inKiriibbanwewa are shown in Figures 2e and 2f,respectively. Percentage survival and % ADG of C.carpio, C. catla, H. molitrix and L. dussumieri in Mffeeding regimes during five rearing cycles are shownin Figure 3.
Proximate compositions of farmer-made aqua-feed, rice bran and commercial feed are given inTable 4. Percentage protein in farmer made aquafeedincreased when fine powdered fishmeal was used toprepare Mf (Table 5). Percentage protein levels inMf prepared using fine powdered fishmeal were sig-nificantly higher than in Mf prepared using coarsepowdered fishmeal (t=1.943181; p<0.05).
Table 4. Proximate analysis (%) of commercial feed (Cf),Rice bran (RB) and farmer-made aquafeed (Mf) in Chandri-kawewa (C), Kiriibbanwewa (K) and Muthukandiyawewa(M). The values with similar superscripts in any onecolumn are not significantly different (p>0.05; Sheffe’stest).
Reservoir Feed Dry matter
Moisture Ash Protein Fat
C, K, M
C, K, M
K
C
M
Cf
RB
Mf
Mf
Mf
92.7A
±0.285.2A
±3.956.6B
±5.856.4B
±1.961.0B
±5.9
7.2C
±0.214.9D
±3.8
43.3E
±5.943.5E
±1.938.9E
±5.9
9.5F
±0.010.7G
±4.6
7.3H
±1.99.1K
±0.86.9K
±0.7
37.1L
±2.213.2M
±0.4
24.1N
±7.225.7N
±3.031.4N
±2.4
6.6P
±1.72.8R
±0.1
2.6S
±0.59.3T
±0.012.0U
±0.1
The rearing cycle is as given in Table 1. + These data were not considered as the fishers paid less attention to feeding.NA — Data not available as fish escaped from cages. Where appropriate ±SD are also given.
Table 3. Mean initial length (ML int.), Mean final length (ML final), Mean initial weight (ML int.), Mean final weight(MW final) and percentage survival of cyprinids in the fry-to-fingerling rearing trials.
Reservoir rearing cycle/ fish spp. Feed used ML int. ML final MW int. MW final %ADG % survival
Chandrikawewa1. L. rohita RB 1.94±0.53 3.5±0.70 0.17 ±0.06 1.79±0.27 2.83 63.12. C. carpio RB 1.26±.098 3.93±.2.7 0.034±.006 0.62±0.17 1.010 17.03. C. catla RB 1.89±0.13 7.35±2.51 0.07 ±0.16 2.19±3.08 71.48 <1.0
Cf 1.89±0.13 3.50±1.23 0.07 ±0.16 0.73±0.56 22.37 <1.0Mf 1.89±0.13 4.08±1.23 0.07 ±0.16 0.64±0.48 19.15 <1.0Nf 1.89±0.13 4.8 ±0.94 0.07 ±0.16 1.26±0.86 40.06 <1.0
4. L. dussumeiri RB 2.99±0.46 5.11±0.66 0.19 ±0.13 0.95±0.43 5.686 42Cf 2.99±0.46 5.20±0.58 0.19 ±0.13 0.86±0.24 4.982 48Mf 2.99±0.46 5.35±0.73 0.19 ±0.13 1.12±0.41 6.96 49Nf 2.99±0.46 5.07±0.95 0.19 ±0.13 0.94±0.37 5.61 40
7. L. dussumeiri RB + + 0.05 ±0.01 + + <1.0Cf + + 0.05 ±0.01 + + 1.5Mf + + 0.05 ±0.01 + + 10.6Nf + + 0.05 ±0.01 + + 13.8
Kiriibbanwewa2. C. catla RB 1.89±0.13 4.41±1.02 0.07 ±0.01 1.17±1.22 33.2 23.25
Cf 1.89±0.13 3.48±1.32 0.07 ±0.01 0.64±0.87 17.13 46.5Mf 1.89±0.13 3.30±1.31 0.07 ±0.01 0.55±0.79 14.49 25.25Nf 1.89±0.13 4.03±1.42 0.0 7±0.01 0.98±1.15 27.34 25.0
3. H. molitrix RB 3.05±0.39 4.93±1.31 0.25 ±0.11 1.24±1.34 4.95 19.5Cf 3.05±0.39 4.97±1.3 0.25 ±0.11 1.25±1.55 5.03 40.5Mf 3.05±0.39 5.37±1.28 0.25 ±0.11 1.58±1.86 6.67 34.15Nf 3.05±0.39 5.23±1.42 0.25 ±0.11 1.56±1.6 6.59 24.05
4. L. dussumeiri RB 2.68±0.46 10.32±1.55 0.33 ±0.17 12.86±5.72 60.99 12.45Cf 2.68±0.46 5.92±1.34 0.33 ±0.17 2.47±1.88 10.55 95.1Mf 2.68±0.46 5.42±0.74 0.33 ±0.17 1.66±0.75 6.56 61.5Nf 2.68±0.46 8.20±1.09 0.33 ±0.17 6.12±2.74 28.28 17.85
5. O. niloticus RB 2.3±0.21 5.45±0.97 0.16 ±0.04 1.02±0.68 2.15 88.35Cf 2.35±0.51 5.92±1.11 0.24 ±0.17 2.6±0.962 4.72 39.87Mf 2.35±0.51 5.57±0.61 0.24 ±0.17 2.57±1.14 4.66 26.0Nf 2.35±0.51 5.05±0.87 0.24 ±0.17 2.69±1.07 4.90 30.15
6. L. rohita RB 2.36±0.21 NA 0.18 ±0.08 1.39±1.01 2.28 21.46
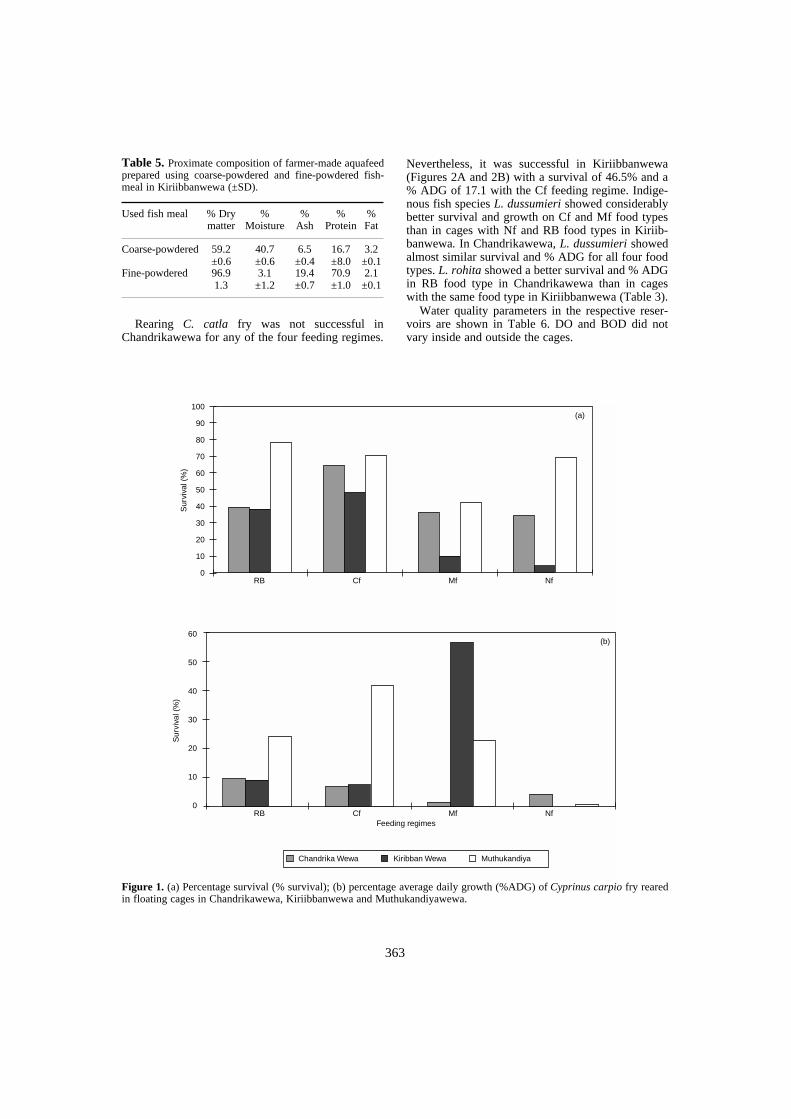
363
Rearing C. catla fry was not successful inChandrikawewa for any of the four feeding regimes.
Nevertheless, it was successful in Kiriibbanwewa(Figures 2A and 2B) with a survival of 46.5% and a% ADG of 17.1 with the Cf feeding regime. Indige-nous fish species L. dussumieri showed considerablybetter survival and growth on Cf and Mf food typesthan in cages with Nf and RB food types in Kiriib-banwewa. In Chandrikawewa, L. dussumieri showedalmost similar survival and % ADG for all four foodtypes. L. rohita showed a better survival and % ADGin RB food type in Chandrikawewa than in cageswith the same food type in Kiriibbanwewa (Table 3).
Water quality parameters in the respective reser-voirs are shown in Table 6. DO and BOD did notvary inside and outside the cages.
Table 5. Proximate composition of farmer-made aquafeedprepared using coarse-powdered and fine-powdered fish-meal in Kiriibbanwewa (±SD).
Used fish meal % Dry matter
% Moisture
% Ash
% Protein
% Fat
Coarse-powdered 59.2±0.6
40.7±0.6
6.5±0.4
16.7±8.0
3.2±0.1
Fine-powdered 96.91.3
3.1±1.2
19.4±0.7
70.9±1.0
2.1±0.1
Figure 1. (a) Percentage survival (% survival); (b) percentage average daily growth (%ADG) of Cyprinus carpio fry rearedin floating cages in Chandrikawewa, Kiriibbanwewa and Muthukandiyawewa.
100
90
80
70
60
50
40
30
20
10
0
Sur
viva
l (%
)
RB Cf Mf Nf
60
50
40
30
20
10
0
Sur
viva
l (%
)
RB Cf Mf Nf
Chandrika Wewa Kiribban Wewa Muthukandiya
Feeding regimes
(a)
(b)
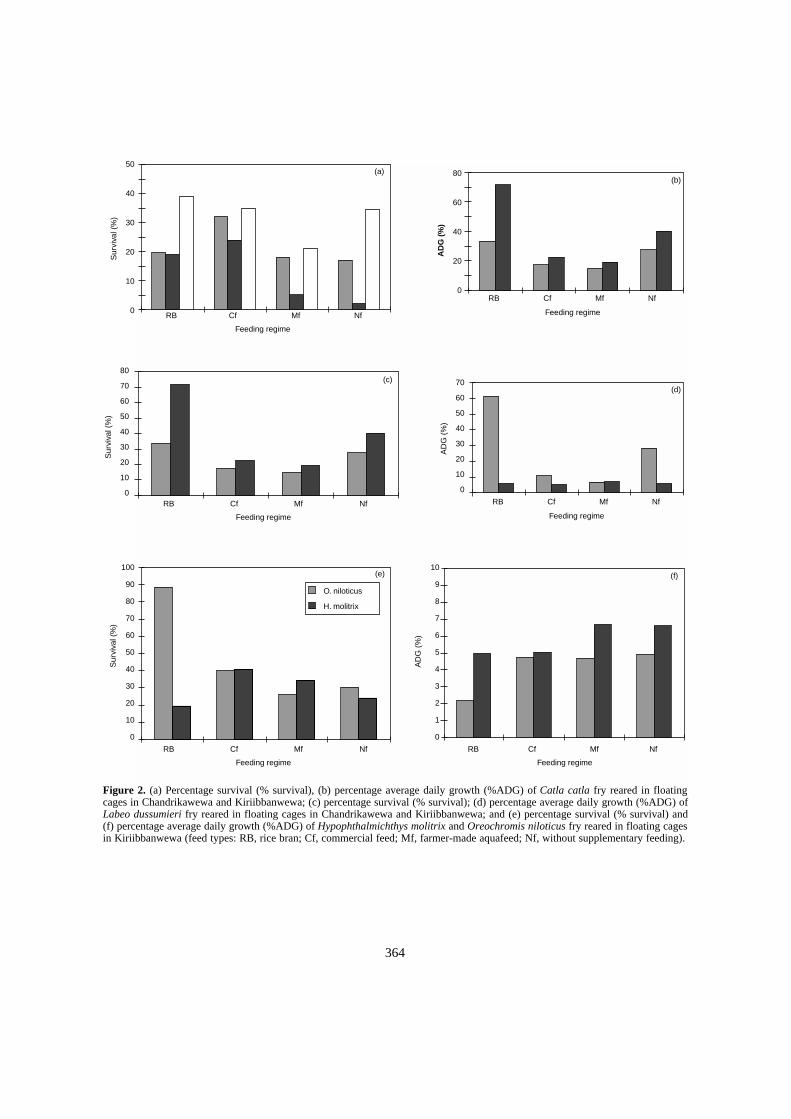
364
Figure 2. (a) Percentage survival (% survival), (b) percentage average daily growth (%ADG) of Catla catla fry reared in floatingcages in Chandrikawewa and Kiriibbanwewa; (c) percentage survival (% survival); (d) percentage average daily growth (%ADG) ofLabeo dussumieri fry reared in floating cages in Chandrikawewa and Kiriibbanwewa; and (e) percentage survival (% survival) and(f) percentage average daily growth (%ADG) of Hypophthalmichthys molitrix and Oreochromis niloticus fry reared in floating cagesin Kiriibbanwewa (feed types: RB, rice bran; Cf, commercial feed; Mf, farmer-made aquafeed; Nf, without supplementary feeding).
50
40
30
20
10
0
Sur
viva
l (%
)
(a)(b)
(c)(d)
(e) (f)
RB Cf Mf Nf
Feeding regime
RB Cf Mf Nf
Feeding regime
RB Cf Mf Nf
Feeding regime
RB Cf Mf Nf
Feeding regime
RB Cf Mf Nf
Feeding regime
RB Cf Mf Nf
Feeding regime
80
70
60
50
40
30
20
10
0
Sur
viva
l (%
)
100
90
80
70
60
50
40
30
20
10
0
Sur
viva
l (%
)
O. niloticus
H. molitrix
80
60
40
20
0
AD
G (
%)
70
60
50
40
30
20
10
0
AD
G (
%)
10
9
8
7
6
5
4
3
2
1
0
AD
G (
%)
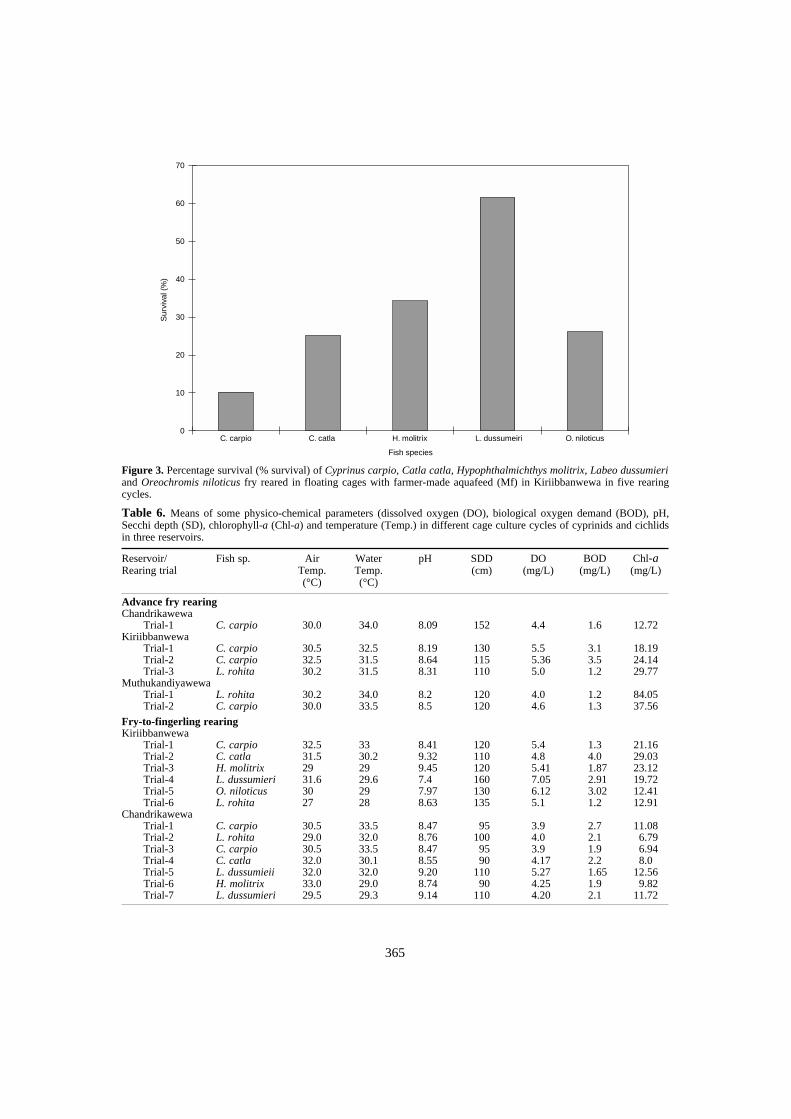
365
Table 6. Means of some physico-chemical parameters (dissolved oxygen (DO), biological oxygen demand (BOD), pH,Secchi depth (SD), chlorophyll-a (Chl-a) and temperature (Temp.) in different cage culture cycles of cyprinids and cichlidsin three reservoirs.
Reservoir/Rearing trial
Fish sp. AirTemp.(°C)
WaterTemp. (°C)
pH SDD (cm)
DO(mg/L)
BOD(mg/L)
Chl-a(mg/L)
Advance fry rearingChandrikawewa
Trial-1 C. carpio 30.0 34.0 8.09 152 4.4 1.6 12.72Kiriibbanwewa
Trial-1 C. carpio 30.5 32.5 8.19 130 5.5 3.1 18.19Trial-2 C. carpio 32.5 31.5 8.64 115 5.36 3.5 24.14Trial-3 L. rohita 30.2 31.5 8.31 110 5.0 1.2 29.77
MuthukandiyawewaTrial-1 L. rohita 30.2 34.0 8.2 120 4.0 1.2 84.05Trial-2 C. carpio 30.0 33.5 8.5 120 4.6 1.3 37.56
Fry-to-fingerling rearingKiriibbanwewa
Trial-1 C. carpio 32.5 33 8.41 120 5.4 1.3 21.16Trial-2 C. catla 31.5 30.2 9.32 110 4.8 4.0 29.03Trial-3 H. molitrix 29 29 9.45 120 5.41 1.87 23.12Trial-4 L. dussumieri 31.6 29.6 7.4 160 7.05 2.91 19.72Trial-5 O. niloticus 30 29 7.97 130 6.12 3.02 12.41Trial-6 L. rohita 27 28 8.63 135 5.1 1.2 12.91
ChandrikawewaTrial-1 C. carpio 30.5 33.5 8.47 95 3.9 2.7 11.08Trial-2 L. rohita 29.0 32.0 8.76 100 4.0 2.1 6.79Trial-3 C. carpio 30.5 33.5 8.47 95 3.9 1.9 6.94Trial-4 C. catla 32.0 30.1 8.55 90 4.17 2.2 8.0Trial-5 L. dussumieii 32.0 32.0 9.20 110 5.27 1.65 12.56Trial-6 H. molitrix 33.0 29.0 8.74 90 4.25 1.9 9.82Trial-7 L. dussumieri 29.5 29.3 9.14 110 4.20 2.1 11.72
Figure 3. Percentage survival (% survival) of Cyprinus carpio, Catla catla, Hypophthalmichthys molitrix, Labeo dussumieriand Oreochromis niloticus fry reared in floating cages with farmer-made aquafeed (Mf) in Kiriibbanwewa in five rearingcycles.
70
60
50
40
30
20
10
0
Sur
viva
l (%
)
C. carpio C. catla H. molitrix L. dussumeiri O. niloticus
Fish species
366
Discussion
De Silva (1989) and Amarasinghe (1990) indicatedthat the minor cyprinids found in large quantities inSri Lankan reservoirs could be differentiallyexploited and utilised to produce fishmeal for theaquaculture industry. According to the present study,it is clear that fisher communities are able to learnthe preparation of aquafeed for semi-intensive cageaquaculture. For example, in Kiriibbanwewa, fishersgradually obtained better results in the culture trials,possibly due to learning the feed preparation strategy(Figure 3).
The percentage protein in farmer-made aquafeedimproved when fine-powdered fishmeal was used.At the beginning of the Mf feeding regime in thesecond rearing trials, survival of C. carpio was 9.7%in Kiriibbanwewa (Table 2). In the second rearingtrial with C. catla fingerlings and the same food typein Kiriibbanwewa it improved up to 25.2%. At thethird fingerling rearing trial on H. molitrix, itincreased to 34.1%. Survival of 61.5% was achievedby L. dussumieri in Kiriibbanwewa (Table 3). Thelearning factor significantly contributed to thesuccess of the aquaculture strategy. In Chandri-kawewa, too, increased survival of C. carpio(36.5%) in Mf feeding regime was achieved inadvanced fry rearing cages (Table 2).
Percentage survival of L. dussumieri fingerlingreared in cages in that reservoir increased from 42%to 49% (Table 3). However, in the seventh rearingtrial of L. dussumieri fry to fingerling size in Chan-drikawewa, the highest survival rate that could beobtained was 13.8% (Table 3), due to poor attentionpaid by the farmer community to this aquaculturestrategy. The %ADG of C. carpio fry in Mf feedingregime was as low as 1.2%, possibly due to low pro-tein content in the feed in Chandrikawewa (Tables 2and 5). Both survival and growth rates could beimproved through increasing % protein in farmer-made aquafeed in Chandrikawewa. In Muthukandi-yawewa, survival varied with the Mf feeding regime,and was relatively high and ranged 39.5–41.9%(Table 2).
Similarly, % ADG values in this reservoir alsoranged 22.4–26.7% (Table 2). According to theresults of a culture trial done by the fisherieswomen’s organisation (a non-government organis-ation) only 15% survival was achieved with C. catlafry reared on a RB feed in Chandrikawewa. The highprotein level (31–34%) in Mf in Muthukandiyawewa(Table 4) may be responsible for the high survivaland high growth rates in the cage-culture trials. Thisis further substantiated by the high survival and highgrowth observed in most culture trials with Cf (Table2), when the crude protein content was 37.1%.
Entry of wild fish to the cages was a seriousproblem during the initial trials in the three reser-voirs. A. melettinus, E. danrica thermoicos, P. fila-mentosus, R. daniconius and D. malabaricus werepresent in cages and perhaps competed for feed.Predatory fish species such as Glossogobius giurisand Heteropneustes fossilis were also present in thecages. These predators may also have accounted forthe observed low survival in the cages. According tothe analysis of water quality parameters in reservoirswhere cage-culture trials were carried out (Table 6),so far no evidence has been found to suggest adeterioration of water quality due to rearing fishfingerlings in floating cages. However, continuousmonitoring of the water quality of the three reser-voirs is needed to determine optimal cage density.On the other hand, it is unlikely that the cage-culturein perennial reservoirs would be intensified indefi-nitely because the fisher communities rely on capturefisheries in reservoirs as a source of their mainincome, and the two activities may come into con-flict if the number of cages is increased significantly.
Acknowledgments
This study was conducted with the financial supportof a research grant from the Australian Centre forInternational Agricultural Research (ACIAR).
References Anderson, T.A. and De Silva, S.S. 1997. Strategies for
low-pollution feeds and feeding. Aquaculture Asia,11(1): 8–22.
Amarasinghe, U.S. 1985. Studies on the exploitation ofminor cyprinids in Parakrama Samudra, a man-madelake in Sri Lanka, using gillnets. Journal of NationalAquaculture Resources Research Agency (Sri Lanka),32: 11–23.
—— 1990. Minor cyprinid resources in a man-made lake inSri Lanka: a potential supplementary source of incomefor fishermen. Fisheries Research, 9: 81–89.
De Silva, S.S. 1989.The trends in the Sri Lankan reservoirfishery with special reference to the role of cyprinids. In:Petr, T. ed., Indo-Pacific Fisheries Commission, Paperscontributed to the Workshop on the Use of Cyprinids inthe Fisheries Management of Larger Inland Water Bodiesof the Indo-Pacific, Katmandu, Nepal, 8–10 September1988, FAO Fisheries Report No. 405 Supplement, 34–35.FAO, Rome, 35–45.
De Silva, S.S. and Sirisena, H.K.G. 1987. New fishresources of reservoirs in Sri Lanka: feasibility of intro-duction of a subsidiary gillnet fishery for minorcyprinids. Fisheries Research, 6: 17–34.
Pet, J.S. and Piet, G.J. 1993. The consequences of habitoccupation and habitat overlap of the introduced Oreo-chromis mossambicus and indigenous fish species forfishery management in a Sri Lankan reservoir. Journal ofFish Biology, 43 (Supplement A), 193-208.

367
Cage Fish Trials in Ea Soup Reservoir, Vietnam
Phan Thuong Huy, Phan Dinh Phuc, Nguyen Ngoc Vinh and J.D. Sollows*
Abstract
Reservoirs in the Central Highlands of Vietnam are numerous and growing in number. Dak LakProvince has about 370 reservoirs of varying sizes with a total estimated area of 8500 ha. Whileconstructed primarily for irrigation, these reservoirs have great potential for fish culture in the area.Ea Soup Reservoir lies in a remote district of Dak Lak. It covers an estimated 240 ha at upperstorage level, and has a drawdown of about 2.5 m. Probably for this reason, there is an abundantsupply of macrophytes in the reservoir. Compared to most reservoirs in the Central Highlands, EaSoup has a relatively large catchment area (350 Km2). While a number of species have cageculture potential, grass carp (Ctenopharyngodon idella) is popular in many parts of Vietnam. Thespecies feeds almost entirely on macrophytes, so cash requirements for feed are minimal. This issuitable for most poor farmers in the area. The market price of this species, about $0.65/kg, ishigher than that for many species. In Ea Soup Reservoir, cage culture of grass carp commenced in1993, and rapidly expanded. By 1996, there were about 157 cages. Stocks were hit by disease, andwere decimated late in the year. Many owners suffered heavy financial losses. Pollution, poorcirculation in the cages, high stocking density and overcrowding of cages may have contributed tothe disease problem. From June 1998, the project, jointly with three fishers, has tested culture ofgrass carp combined with small numbers of tilapia and common carp in cages with new materials,somewhat larger mesh size, and lower stocking density. The economic viability of this modifiedtechnology will depend mainly on the lifetime of the cages. Nevertheless, fishers are continuing toculture at their own expense. This suggests that the technology has some sustainability in thereservoir. The extent to which cage culture can be practised remains to be seen, but any expansionmust be cautious.
THE Central Highlands of Vietnam have hundreds ofreservoirs of varying sizes. Virtually all are less than500 ha in area. The current estimate by this projectsuggests a total of 370 reservoirs covering 8500 ha inDak Lak Province.
Most of the reservoirs were built mainly forirrigation, with flood control and occasionally,hydroelectricity, as secondary functions.
Ea Soup Reservoir lies about 68 km northwest ofBan Me Thuot in a remote district bordering Gia LaiProvince and Cambodia. Construction began in 1978and finished in 1980. The reservoir covers an esti-mated 240 ha at upper storage level, and has a draw-down of only 2.5 m. Probably for this reason, there isan abundant supply of macrophytes in the reservoir.
While a number of species have cage culturepotential, grass carp (Ctenopharyngodon idella) isparticularly popular. The species feeds almostentirely on macrophytes, so cash requirements forfeed are minimal. The market price (about VND10 000/kg (US $0.91, $1 = VND 14 000) is higherthan that for many species. On the negative side, thespecies eats voraciously; therefore, the cage culturistmust have the time and/or labour needed to gather andsupply the needed plant material (which must also beconveniently available in sufficient quantities). Thisfeeding habit assures heavy competition for feed,which tends to lead to increasingly uneven sizesamong the fish; this can be remedied by periodicseparation of fish according to size. Finally, grasscarp are susceptible to a number of diseases, and thissusceptibility increases when the fish are stressed.Overcrowding, combined with poor water quality,can therefore easily lead to disease outbreaks whichare very difficult to treat, especially in cages.
*Management of Reservoir Fisheries Project, 69 Le HongPhong, Ban Me Thuoc, VietnamEmail johns@netnam2. org.vn

368
In Ea Soup Reservoir, cage culture of grass carpcommenced in 1993, and rapidly expanded. By1996, there were 157 cages. Stocks were hit bydisease, and decimated late in the year. The losseswere a strong discouragement to continuation of thepractice. Many owners suffered heavy financiallosses.
The causes of the disease outbreak are open tospeculation. Pesticide runoff was blamed by some.However, the presence of Branchiomyces in at leastsome specimens suggested that overcrowded,polluted conditions may have been a factor. Mostcages were situated in the widest part of the reser-voir, near the irrigation outlet of the dam. The dis-tances among the cages were small. The bottoms ofsome cages near the reservoir shore were next to theground. The cages were made of wooden lathes,most of which had only 1–2 cm separation betweenthem. Stocking densities, while variable, appear tohave been high, with up to 56 fish/m3. The quantityof feed (water weeds) often put in the cages occupiedup to 25–35% of the volume of the cages, and morefeed would not be given till the fish finished whathad been given, which could take 2–3 days. Theremaining unused feed (e.g. stems of cassava) wasnot removed from the area of the cages, polluting theenvironment, and helping cause the outbreak.
To see whether cage culture could be restored inEa Soup, the project, jointly with three fishers, testedculture of grass carp, combined with small numbersof tilapia and common carp in cages with newmaterials, somewhat large mesh size, and lowerstocking density. Trials began in June 1998. Resultsfrom the first culture cycle are reported here.
Materials and Methods
The fishers were not willing to make the entireinvestment in the cages. They each invested VND500 000 (AUD$36) in their cages, the project paidthe remainder.
The project supplied black plastic mesh of sizea = 26 mm, and a nylon mesh liner of mesh sizea = 10 mm. The fishers found their own timber forframes, side lathes, and covers.
A cost estimate for each cage:Grow-Out Cage Costs (Ea Soup)Wood: frame: VND 500 000 ($36)Wooden slats: VND 300 000 ($21)Bamboo: VND 180 000 ($13)Hut: VND 200 000 ($14)Mesh: (a) 1.8 m roll: (15 m of 30m)
× VND 900 000 ($64)= VND 450 000 ($32)
(b) 0.9 m roll: (8 m of 30m)× VND 380 000 ($27)= VND 50 667 ($4)Total: VND 500 667
(6) Nylon liner: 10 kg 39.2/kg× VND 1 411 000 ($101)= VND 349 949 ($25)
(7) Labour: VND 150 000 ($11)Total construction cost: VND 2 180 616 ($156)
The wooden slats served to maintain the shape ofthe plastic mesh, which was tied to them and thewooden frame. They were also used to make thecover of the cage. The nylon liner was necessarybecause of the large size (a = 26 mm) of the plasticmesh. It would not have been possible to find insufficient quantity fingerlings, which could notescape from a cage of such a large mesh size. Eachcage was floated by a bundle of bamboos (eachabout 10–15 cm in diameter) on each of two sides ofthe cage.
Cage dimensions were 5 m × 2 m × 2 m deep. Ofthis, about 1.4 m was submerged for a total sub-merged volume of 14 m3.
Each cage has a hatch of about 40 cm × 40 cm inthe cover, for stocking and feeding.
It was felt that a polyculture situation with grasscarp as the predominant species was worth trying.One author had seen satisfactory results fromincluding a few common carp with grass carp incages in Nepal. The common carp consume theexcreta of the grass carp, thereby converting apollutant into a fish feed. Tilapia may do the same,and may also help keep the cages clean ofperiphytes, which would clog the mesh and impedecirculation.
Fingerlings were stocked 25 June 1998. Thestocking density was set by agreement with thefishers. Each cage received 488 grass carp (C. idella)of mean weight 9.18 g, 60 common carp (Cyprinuscarpio), and 40 tilapia (Oreochromis niloticus) ofsimilar size. Total fingerling cost per cage was VND600 000. Total stocking density, then, was 42/m3
(34 grass carp/m3). Over the first 10 days, a total of 103 grass carp, 13
common carp and 10 tilapia were found dead. Thegrass carp were replaced by fish of a similar size inmid-July, each cage receiving the number noteddead.
The fishers managed the cage systems themselves.All had previous experience in grass carp cageculture. As a rule, feeding was twice a day, morningand afternoon. During the first month, the fish werefed mainly rice bran and cassava leaves. Waterweeds were introduced late in the first month, andgradually became the predominant feed. Excess feed
369
(mainly stems) was removed each day. Cages werealso cleaned as necessary, roughly every week.
Each fisher was given a book to record datarelated to inputs, mortalities and catches. In practice,one of the three was more diligent than the others incompleting the information, so the method wassupplemented by interviews.
Inputs were weighed periodically in order tocheck estimates by the fishers.
Project staff checked the growth of the fish eachmonth. Samples were weighed, counted, thenreleased back into the cages.
After approximately 12 months of culture, all fishwere harvested.
Results
In the following Tables, each cage is identified bythe name of the owner (Nghi, Huong, Than).
Inputs
Inputs are summarised by cage in Table 1.
Note: Labour involved in providing rice bran and soybean cake isincluded in labour for giving cassava.Water weed and cassava weights include stems as well asleaves. Stem material is not consumed.Huong’s ‘cassava’ includes 50 kg young grass.
It should be noted that these are approximations,based on fishers’ records and monthly interviews,which depend on recollection, and hence are notprecise. However, it is believed that they reflectreality to the closest extent possible.
The soybean cake was given during the first monthof operations. Most of the rice bran and cassava wasgiven during the first two months, after which thedosages tapered off rapidly. Waterweeds were thepredominant feed from month 3 (September) until
April. In two of the cages (Huong’s and Than’s),cassava and water weeds were fed on alternate daysin May.
Labour inputs are not converted into cash, sincefamily labour was used in all three cages. Thecurrent labour rate in Ea Soup was estimated by thefishers as VND 30 000 per eight-hour day. Workrequired to feed fish and clean cages usually does notcompete much with other activities — normally, ittakes about one hour to carry out a feeding. Henceassigning opportunity cost on the basis of eight-hourdays is not realistic, and overestimates the cash valueof time invested.
It is also worth noting here that Than gave consid-erably less feed than the other two owners, especiallyduring the third to fifth month of culture. He ran acoffee farm, which put relatively high demands onhis family labour force, and as a result, did not givesufficient feed.
Recovery
Fish in each cage were counted in September,January, and April (see Table 2). It should be notedthat the counts were not complete, and the focus wason grass carp.
Grass carp mortalities during the first five daysafter stocking totalled 64, 33, and 10 in the cages ofNghi, Huong, and Than, respectively.
Following the 28 April check, as mentionedabove, grass carp in Nghi’s and Huong’s cagessuffered heavy mortality (see Table 3).
No signs of disease were noted in the cages,except for those possibly associated with stockinginjuries.
Nevertheless, recovery rates were lower thandesirable. While causes of the losses are open tospeculation, the following possibilities can beadvanced.1. Escape from the cages at stocking: the fish were
checked against the mesh size of the nylon linerbefore being packed. Some minor losses may stillhave occurred. Damage to the nylon liner couldhave caused other escapes.
Table 1. Inputs by cage, 27 May 1999.
Owner Nghi Huong Than
Fingerlings (no.) 588 588 588 Cost (VND) 600 000 600 000 600 000
Rice bran (kg) 72.4 48 24.4 Cost (VND) 202 720 110 400 92 320
Soy cake (kg) 3 0 9 Cost (VND) 15 000 18 000
Cassava (kg) 255 2 225 305 Labour (man-hours) 120 135 110
Water weeds (kg) 31 880 32 000 26 000 Labour (man-hours) 358 405 340
Cage cleaning (man-hours) 34.5 21.5 66.5 Cash (VND) 817 720 710 400 710 320 Labour (man-hours) 512.5 561.5 516.5
Table 2. Fish count from the three cages.
Owner Nghi Huong Than
Date Grass carp Grass carp Grass carp25/6/98 488 488 48827/9/98 310 280 33026/1/99 270 130 33028/4/99 210 120 298Final number caught 284 118 352
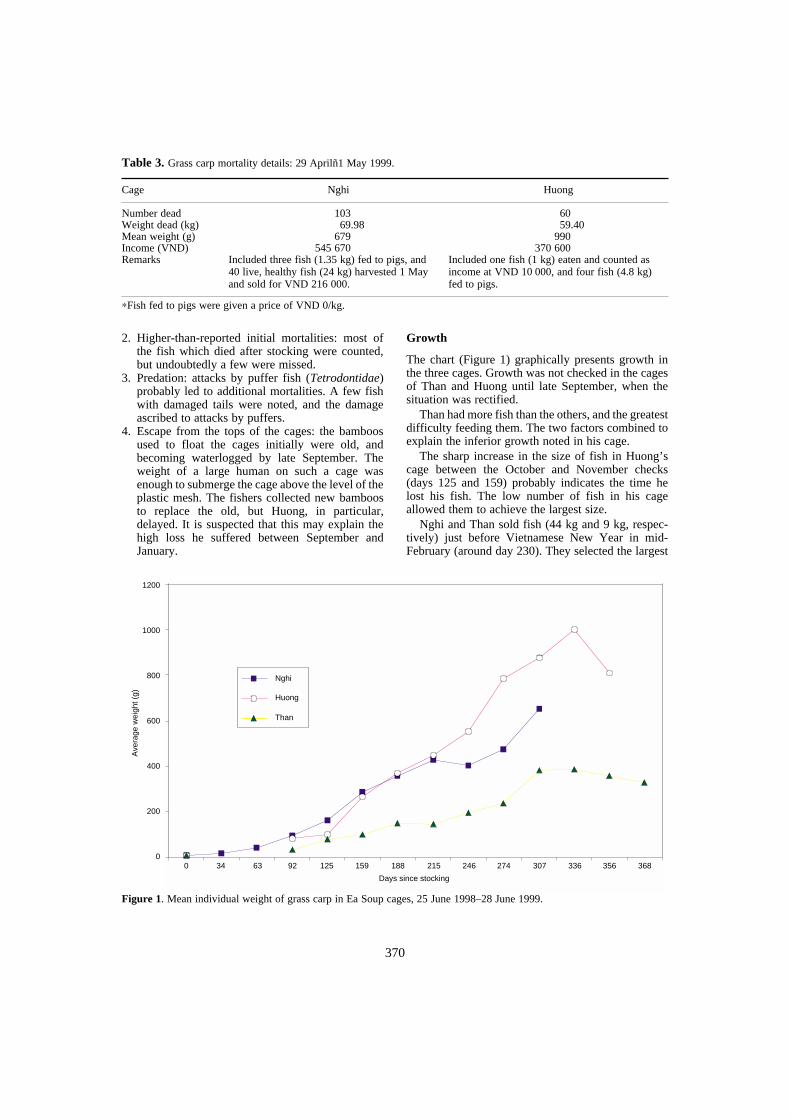
370
2. Higher-than-reported initial mortalities: most ofthe fish which died after stocking were counted,but undoubtedly a few were missed.
3. Predation: attacks by puffer fish (Tetrodontidae)probably led to additional mortalities. A few fishwith damaged tails were noted, and the damageascribed to attacks by puffers.
4. Escape from the tops of the cages: the bamboosused to float the cages initially were old, andbecoming waterlogged by late September. Theweight of a large human on such a cage wasenough to submerge the cage above the level of theplastic mesh. The fishers collected new bamboosto replace the old, but Huong, in particular,delayed. It is suspected that this may explain thehigh loss he suffered between September andJanuary.
Growth
The chart (Figure 1) graphically presents growth inthe three cages. Growth was not checked in the cagesof Than and Huong until late September, when thesituation was rectified.
Than had more fish than the others, and the greatestdifficulty feeding them. The two factors combined toexplain the inferior growth noted in his cage.
The sharp increase in the size of fish in Huong’scage between the October and November checks(days 125 and 159) probably indicates the time helost his fish. The low number of fish in his cageallowed them to achieve the largest size.
Nghi and Than sold fish (44 kg and 9 kg, respec-tively) just before Vietnamese New Year in mid-February (around day 230). They selected the largest
∗Fish fed to pigs were given a price of VND 0/kg.
Table 3. Grass carp mortality details: 29 Aprilñ1 May 1999.
Cage Nghi Huong
Number dead 103.00 60.00Weight dead (kg) 69.98 59.40Mean weight (g) 679.00 990.00Income (VND) 545 670.00 370 600.00Remarks Included three fish (1.35 kg) fed to pigs, and
40 live, healthy fish (24 kg) harvested 1 Mayand sold for VND 216 000.
Included one fish (1 kg) eaten and counted as income at VND 10 000, and four fish (4.8 kg)fed to pigs.
Figure 1. Mean individual weight of grass carp in Ea Soup cages, 25 June 1998–28 June 1999.
1200
1000
800
600
400
200
0
Ave
rage
wei
ght (
g)
0 34 63 92 125 159 188 215 246 274 307 336 356 368
Days since stocking
Nghi
Huong
Than
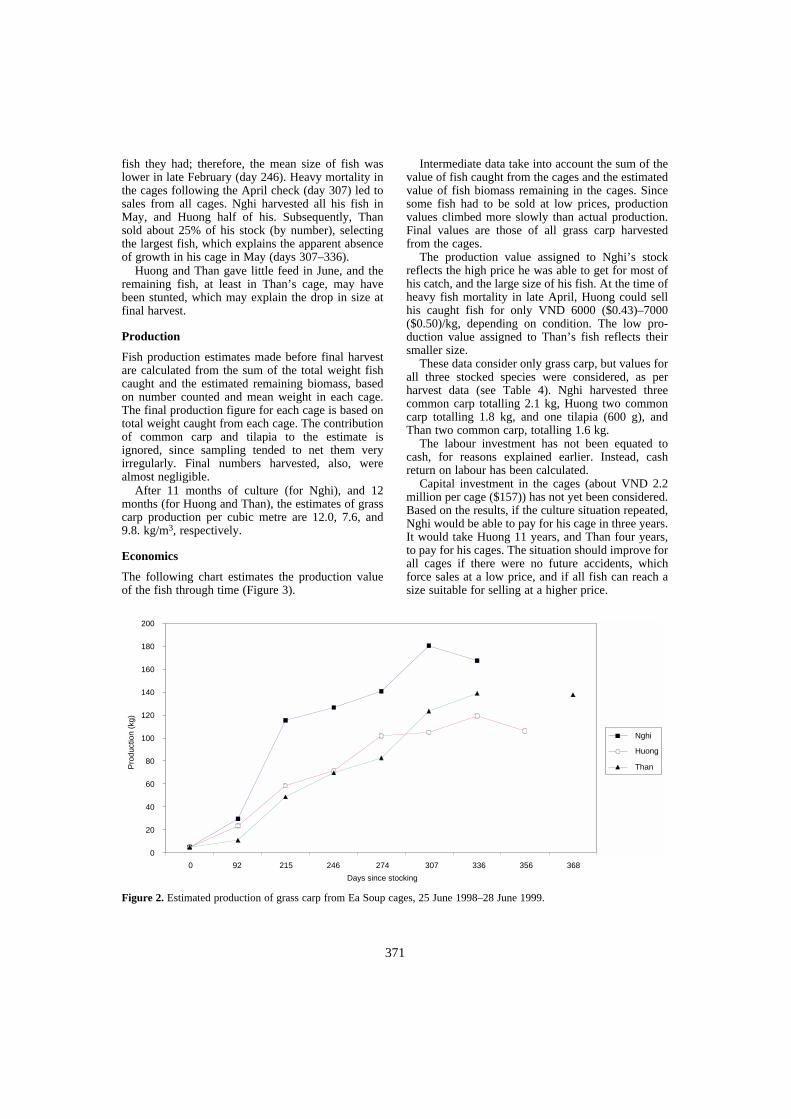
371
fish they had; therefore, the mean size of fish waslower in late February (day 246). Heavy mortality inthe cages following the April check (day 307) led tosales from all cages. Nghi harvested all his fish inMay, and Huong half of his. Subsequently, Thansold about 25% of his stock (by number), selectingthe largest fish, which explains the apparent absenceof growth in his cage in May (days 307–336).
Huong and Than gave little feed in June, and theremaining fish, at least in Than’s cage, may havebeen stunted, which may explain the drop in size atfinal harvest.
Production
Fish production estimates made before final harvestare calculated from the sum of the total weight fishcaught and the estimated remaining biomass, basedon number counted and mean weight in each cage.The final production figure for each cage is based ontotal weight caught from each cage. The contributionof common carp and tilapia to the estimate isignored, since sampling tended to net them veryirregularly. Final numbers harvested, also, werealmost negligible.
After 11 months of culture (for Nghi), and 12months (for Huong and Than), the estimates of grasscarp production per cubic metre are 12.0, 7.6, and9.8. kg/m3, respectively.
Economics
The following chart estimates the production valueof the fish through time (Figure 3).
Intermediate data take into account the sum of thevalue of fish caught from the cages and the estimatedvalue of fish biomass remaining in the cages. Sincesome fish had to be sold at low prices, productionvalues climbed more slowly than actual production.Final values are those of all grass carp harvestedfrom the cages.
The production value assigned to Nghi’s stockreflects the high price he was able to get for most ofhis catch, and the large size of his fish. At the time ofheavy fish mortality in late April, Huong could sellhis caught fish for only VND 6000 ($0.43)–7000($0.50)/kg, depending on condition. The low pro-duction value assigned to Than’s fish reflects theirsmaller size.
These data consider only grass carp, but values forall three stocked species were considered, as perharvest data (see Table 4). Nghi harvested threecommon carp totalling 2.1 kg, Huong two commoncarp totalling 1.8 kg, and one tilapia (600 g), andThan two common carp, totalling 1.6 kg.
The labour investment has not been equated tocash, for reasons explained earlier. Instead, cashreturn on labour has been calculated.
Capital investment in the cages (about VND 2.2million per cage ($157)) has not yet been considered.Based on the results, if the culture situation repeated,Nghi would be able to pay for his cage in three years.It would take Huong 11 years, and Than four years,to pay for his cages. The situation should improve forall cages if there were no future accidents, whichforce sales at a low price, and if all fish can reach asize suitable for selling at a higher price.
Figure 2. Estimated production of grass carp from Ea Soup cages, 25 June 1998–28 June 1999.
200
180
160
140
120
100
80
60
40
20
0
Pro
duct
ion
(kg)
Nghi
Huong
Than
0 92 215 246 274 307 336 356 368
Days since stocking

372
Discussion and Conclusion
Cage culture in Ea Soup appears to be of modestviability. As expected, in contrast to the situation in1996, disease did not present a serious problem.There were far fewer cages in operation. There wasalso less internal cage pollution: water circulationthrough the cages was better, stocking densities ofgrass carp were slightly lower, the few common carpand tilapia in the cages would have consumed muchof the grass carp excreta, and remaining unused feedwas removed from the area of the cages.
Judging by the growth of fish in Huong’s cage,following a loss of fish in November, it is likely thatthe stocking density used (35 grass carp/m3) ishigher than ideal. This may be suitable as an initialdensity for nursing fingerlings, but the stock should
be thinned, and preferably segregated by sizebetween two cages after two or three months ofculture. The final appropriate number of fish woulddepend on the labour force and free time available toeach interested family.
Problems reported by fishers and already men-tioned include initial mortality and attacks by pufferfish, waterlogging of bamboos, loss of fish throughthe growing season, and insufficient labour, at leaston Than’s part, adequately to feed the fish. Other-wise, the fishers felt that growth was slower than inprevious years, and suspected that fingerling qualitymay be partly to blame. They also mentioned that itwould be much better for each individual to managetwo cages — labour needed to feed the fish in twocages is only marginally higher than that needed tofeed one, and this would allow large and small fish
Figure 3. Production value of grass carp from cages in Ea Soup, 25 June 1998–28 June 1999.
Note: One man-day is set at eight man-hours.Running costs only are considered in the above cash costs.
Table 4. Economic indicators for three cages.
Owner Nghi Huong Than
Production value (dong) 1 683 770.0 911 600.0 1 313 400.0Cash costs (dong) 817 720.0 710 400.0 710 320.0Net benefit (dong) 866 050.0 201 200.0 603 080.0Labour investment (man-hours) 512.5 561.5 516.5Benefit: cost ratio 1.059.0 0.283.0 0.849Benefit/man-day (dong) 13 519.0 2 867.0 9 341.0
2 000 000
1 800 000
1 600 000
1 400 000
1 200 000
1 000 000
800 000
600 000
400 000
200 000
0
Pro
duct
ion
(kg) Nghi
Huong
Than
0 92 215 246 274 307 336 356 368
Days since stocking
373
to be separated. Competition among the fish wouldthus be reduced, and overall growth and productionhigher.
In 1999, the three fishers restocked their cages ontheir own and at their own expense, with fish from alocal nursing. Reported stocking densities weresimilar to those used in 1998, but count made laterindicated considerably lower number. A fourth fisherconstructed and stocked his own cage. Results areawaited.
Given results to date, the profitability of the prac-tice will be modest, at best. It may well be suitablefor families living near the reservoir who have a boatfor other purposes, and who have the necessary com-bination of time and available labour to feed fish andmaintain cages. The practice will probably be ofmore interest to families who find the modest returnsworth the time investment — well-off families areless likely to be interested.
The events of 1996 suggest strongly that the reser-voir has a limited carrying capacity for cage fishculture. It should not be exceeded. The massive mor-tality of 1996 may have been due in part to over-crowding of cages near the dam.
Other factors may also impose advisable upperlimits on the number of cages. Adverse effects onother fish species, due either to pollution from thecages or depletion of waterweeds may need con-sideration. Some villagers report that when a largenumber of cage operators were selling fish in 1996,market prices for local fish were depressed (Phillips1998). Waste and stems from the cages alsoreportedly clogged the irrigation outlet from thereservoir at times. Most people living around theirrigation outlet of the reservoir also use reservoirwater for domestic washing. They may be affectedby disease due to pollution from overcrowded cages.
The risks associated with water quality problemsare underlined by the mortality rate in two of thecages at the end of April. Sporadic water qualitychecks indicated relatively low oxygen levels atcertain times of year, particularly in the early rainyseason.
Closing the irrigation outlet about 20 April led topoor circulation of water through the cages. Thewater level of the reservoir was kept lower as a pre-caution against floods, and that crowded the fish.Waterweeds also died in the area, as water levelsdropped. The weather had been cloudy for severaldays prior to the checks, and it continued through toearly May. Some mortality of natural species,including Puntius brevis and Corica sp., was alsonoticed. Following census and growth check of eachcage April 27–28, mortalities were noticed in Nghi’sand Huong’s cages. As mentioned earlier, in theearly morning some large grass carp were noticed
floating in the two cages, and other fish showedsigns of severe stress, gaping at the surface and dis-playing swollen lips. Only large fish were severelyaffected. Than’s cage was in deeper water, and hisfish were smaller. Also, Nghi and Huong gave theirfish large quantities of feed after the check. Than didnot feed his fish.
It is suspected that the fish were already understress due to low oxygen levels. The handling addedto their stress, and may have led to death. Large fishcould have suffered more from collision in thecourse of handling, and their oxygen requirementswould have been higher.
Removal of the nylon liner (10 mm mesh) wouldprobably have improved circulation through thecages to some extent. However, the fishers found thisvery difficult to achieve, and the liners were left in.
The experience raises several points: • cage operators would do well to sell part of their
stock as soon as it reaches a size which commandsa satisfactory price, particularly advisable at suchtimes as holidays, when fish sell for a higher pricethan usual. That would reduce density and com-petition in the cages, making for higher overallproduction, and assure that emergency sales arekept to a minimum;
• caution in handling fish is essential at times whenwater quality problems are suspected. Closure ofthe irrigation outlet would have reduced circulationin the area of the cages, and the low reservoir waterlevel and prolonged periods of cloudy weatherwould have led to very low oxygen conditions;
• cages should be set in deep water, with at least1.5–2 m between the cage bottom and the bottomof the reservoir, when water levels are low. Thisallows for better circulation and less pollutionfrom bottom sediment, including waste from thecages;
• as fish grow, every effort should be made to max-imise cage mesh size. Liners should be set in sucha way that they can be removed easily whenescape is no longer possible. Otherwise largemesh cages should be used when the fish growlarge enough.A few other cage management considerations and
precautions apply to the reservoir, in general.• It is difficult to say exactly how many cages the
reservoir can support, but 104 cages were report-edly in place in 1995, and no problems presentedat that time, though the number is probably muchhigher than advisable. Given recent experience,the expansion of cage culture in Ea Soup shoulddevelop very gradually, with 10–20 cages as acurrent maximum.
• Who should get cages? Fishing families of appro-priate means are probably in the best logistical
374
position, since they live near the reservoir andhave boats. They must be able to afford the neces-sary inputs, and yet find the modest returns satis-factory.
• Placement of cages needs consideration. Cagesshould be set in deep enough water to facilitatewaste disposal. They should be sheltered fromrough weather, yet where currents can augmentcirculation of water through them. Individualsmanaging cages should also consider placing themnear their houses, where management and surveil-lance are more convenient.
• New material allows better circulation of waterthrough the cages than previously. The stockingdensity of grass carp and the number of commoncarp and tilapia needs further study, but shouldnot be higher than that tested and reported here,and not too much feed should be given, especiallywhen water quality problems are suspected.Applicability of these results to other reservoirs
deserves consideration. Compared to most reservoirsin the Central Highlands, Ea Soup has a relatively
large catchment area (350 km2), and therefore shouldhave a high flushing rate. The low draw-down hasallowed a very profuse growth of waterweeds, whichmakes culture of grass carp convenient. Ea Soup isrelatively remote, and there is therefore a strongincentive for self-sufficiency, but also a limitedmarket capacity. The negative factors are likely todiminish in importance as immigration to the areacontinues and improvements to the road connectingEa Soup and Ban Me Thuot are made.
The availability of feed and the high flushing ratesuggest that the potential for cage culture of grasscarp is probably high in Ea Soup, compared to mostreservoirs in the Central Highlands. However, givenexperience to date, any expansion in cage culture islikely to be very limited.
Reference
Phillips, M.J. 1998. Freshwater Cage Culture Developmentin the Reservoirs of Central Highlands of Vietnam.Prepared for the Mekong River Commission. 123 p.

375
The Biology and Fishery of Indigenous Gobies ofMainit Lake, Philippines
A.M. Calicia Jr and N.A. Lopez*
THE paper presents information of the results of a 17-month study of the biology, fishery andpopulation structures of gobies (Order Gobioidea) Glossogobius giurus (Family Gobiidae) andHypseleotris agilis (Family Eleotridae) caught by beach seine in Lake Mainit from August 1997 toDecember 1998.
The study is a component of a research grant funded by the Government of Spain which coversa 3-year research study of the biology and fishers of 7 major lakes in the Philippines.
Glossogobius giurus, locally known as Pedianga and H. agilis, locally known as Buguan, areamong the most abundant fish species of commercial value of the family Gobiidae and Eleotridaefound in the lake. Fish-landing records from beach seiner showed that the highest catch ofG. giurus and H. agilis were recorded during the months of April and September, respectively. Thelowest were recorded during the months of November and December for both species. Mean catchper unit effort (CPUE) for both species were recorded on a monthly basis. The equivalent meanCPUE for G. giurus was estimated at 19.87 kg/hr, and 5.79 kg/hr recorded for H. agilis.
Aspects of the biology of the species, namely size and species composition, growth, seasonality,length/weight relationship, gonadal maturity, sex ratio, spawning months, size at first maturity andplankton composition were studied and correlated.
Collected data on sexual maturity revealed the appearance of matured, gravid and spentindividuals throughout the year for both species, indicating that spawning is continuously takingplace all year round, but peak spawning is evident for both species. Estimates of size at firstmaturity also indicated the early maturity of H. agilis over G. giurus for both sexes, while sex ratioof both species indicated the dominance of female over male as much as 16% for the former and27% the latter. Management policies for the conservation of the fisheries are also discussed.
*Bureau of Fisheries & Aquatic Resources, 860 Quezon Avenue, Quezon City, Metro Manila 3008, Philippines
376
Dam and Fish Diversity:Case Study of the Pak Mun, Thailand
C. Vidthayanon1 and S. Premcharoen1
THE Mekong basin supports the third highest fish species diversity in the world, with anestimated number of fish species exceeding 1200. Basin-wide in Thailand alone, 290 species, andpossibly up to 350 species, have been previously reported.
The best representative is the Mun River tributary which is reported to have 256 native species.Its diversity impact from dam construction has been controversial. The preliminary post-impounded assessment when compared to the species record has shown a decline, possibly due tohabitat alteration, loss of migration routes accompanied with over fishing.
Although a fish ladder was installed, only 62 species, 3 cm to 30 cm, are able to utilise it. Atleast 30 strictly riverine species are disappearing. As well, five artisanal fishing methods wereabandoned upstream of the Mun River.
Post-impounded assessment needs to be continued for future planing of impact mitigation andhabitat rehabilitation of the river.
1 Fisheries Museum Division Department of Fisheries, Zoology Section, Faculty of Liberal Art and Science, KasetsartUniversity Kampangsaen campus
377
Workshop Issues and Recommendations
THE Asian region has the highest population concen-tration in the world. Its current annual average fishconsumption is about 17.2 kg as opposed to theworld average of 15.8 kg. Its population is expectedto reach 4.16 billion by year 2020. If the current fishconsumption rate is to be maintained the region willrequire 70 million t fish by 2020, an increase ofnearly 26 million t from the present Asian productionof 44 million t. With little growth in the supply ofaquatic products from the marine capture fishery, itis envisaged that inland fisheries and aquaculture inthe region will become increasingly important.
Asia also has one of the world’s highest densitiesof reservoirs and a relatively low river index com-pared to the other continents, as well as a relativelysmall acreage of natural lakes. Damming naturalwaterways is a controversial issue. However, reser-voirs are rarely or never impounded for fishery pur-poses. Once a reservoir is created, the resourcesthereof, and in particular the fishery resources andtheir aquaculture potential, should nevertheless beutilised effectively and efficiently for food pro-duction and poverty alleviation, and to provide alter-native employment for displaced persons. In thatcontext it is imperative that reservoir fisheries andaquaculture constitute an important component offuture fish supplies in the region.
A holistic approach to fisheries management
The workshop resolved:…that reservoir fisheries management in theregion needs to adopt a more holistic approachthan is presently the case. This approach needs to ensure that a reservoir, per
se, is considered a component of the whole water-shed, and that socioeconomic, policy developmentand management issues and actions are all effec-tively integrated to optimise and sustain fisheriesdevelopment in reservoirs. A conceptual summary isshown in Figure 1.
To facilitate increased emphasis on more holisticmanagement of reservoir fisheries in the region, theworkshop identified a range of issues and drafted asuite of recommendations for the consideration ofkey stakeholders.
Issues and Recommendations
1. Integrated management
The workshop recognised that:• there is a paucity of empirical models depicting
inter-relationships of fish yield/production to
catchment and limnological characteristics, aswell as yield and fishing effort of reservoirs inwatersheds; existing models have limited applica-tion to integrated catchment-scale management offisheries and aquaculture in reservoirs;
• the existing models and databases in mostcountries in the region are unavailable and/orunreliable and inadequate; and
• the development of suitable models will be theonly solution to upscale results from site-specificstudies.
Recommendations
1.1 To encourage and support the development ofcost-effective empirical models across differentwatersheds in the region based on catchmentand limnological characteristics (such as Secchidepth, chlorophyll-a, nutrient levels), usingstandardised methodologies and/or GIS andremote sensing, and reservoirs be grouped intoappropriate ‘classes’ (e.g. size) to facilitatemodel development and application;
1.2 to develop indicators (e.g. fish yields) andmanagement characteristics (e.g. fishing effort),where appropriate and relevant;
1.3 to identify and develop appropriate criteriafor reservoir classification from multivariateanalyses.
1.4 to conduct research in partnership with fishersand other stakeholders where possible. This willrequire involvement of stakeholders in theidentification of research priorities, studydesign, data collection and analysis, and shouldcontribute to the achievement of stakeholderobjectives.
The Workshop recognised: • a lack of a policy framework(s) to facilitate inte-
grated catchment-scale management for fisheriesand aquaculture;
• a lack of an effective voice for fisheries and aqua-culture and a relative lack of understanding of theinfluence of non-fisheries activities that havehindered the development of reservoir fisheries inmost nations; and
• most current reservoir fisheries yields tend to besuboptimal, often impacted by catchment exter-nalities, underexploited and based on few species,and large biomasses of mostly indigenous specieshitherto underexploited.
1.5 To develop an effective linkage to decision-making/policy development processes withincatchments across the region.
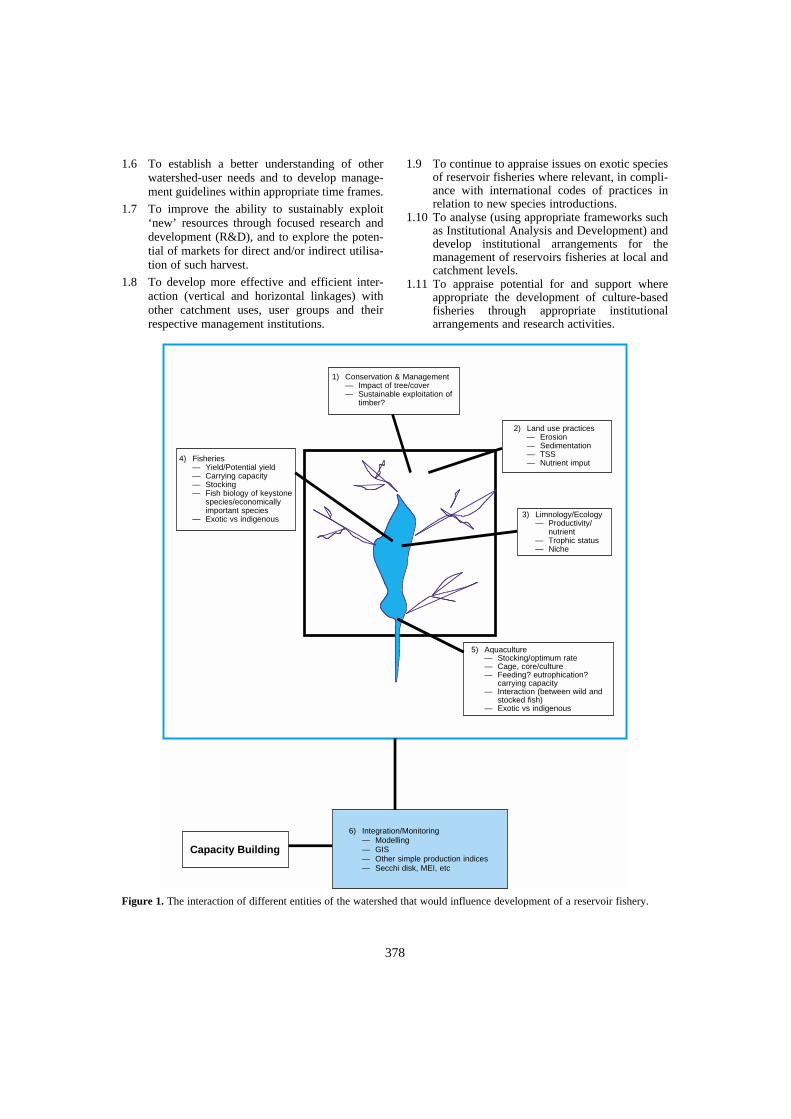
378
1.6 To establish a better understanding of otherwatershed-user needs and to develop manage-ment guidelines within appropriate time frames.
1.7 To improve the ability to sustainably exploit‘new’ resources through focused research anddevelopment (R&D), and to explore the poten-tial of markets for direct and/or indirect utilisa-tion of such harvest.
1.8 To develop more effective and efficient inter-action (vertical and horizontal linkages) withother catchment uses, user groups and theirrespective management institutions.
1.9 To continue to appraise issues on exotic speciesof reservoir fisheries where relevant, in compli-ance with international codes of practices inrelation to new species introductions.
1.10 To analyse (using appropriate frameworks suchas Institutional Analysis and Development) anddevelop institutional arrangements for themanagement of reservoirs fisheries at local andcatchment levels.
1.11 To appraise potential for and support whereappropriate the development of culture-basedfisheries through appropriate institutionalarrangements and research activities.
Figure 1. The interaction of different entities of the watershed that would influence development of a reservoir fishery.
1) Conservation & Management— Impact of tree/cover— Sustainable exploitation of
timber?
4) Fisheries— Yield/Potential yield— Carrying capacity— Stocking— Fish biology of keystone
species/economically important species
— Exotic vs indigenous
2) Land use practices— Erosion— Sedimentation— TSS— Nutrient imput
3) Limnology/Ecology— Productivity/
nutrient— Trophic status— Niche
5) Aquaculture— Stocking/optimum rate— Cage, core/culture— Feeding? eutrophication?
carrying capacity— Interaction (between wild and
stocked fish)— Exotic vs indigenous
6) Integration/Monitoring— Modelling— GIS— Other simple production indices— Secchi disk, MEI, etc
Capacity Building
379
2. SocioeconomicsThe workshop recognised that socioeconomic aspectsof reservoir fisheries development have hithertoreceived less attention than deserved, and indeed arerequired for optimisation of benefits to the com-munity, which happens to be more often than notrural and poor. It also acknowledged that it is imprac-tical, if not prohibitive, to develop a general researchagenda on socioeconomic aspects of reservoirfisheries covering many countries.
In spite of these limitations, it was agreed that indeveloping such an agenda the following aspectsshould be taken into consideration:• identification of research should start with consul-
tation with reservoir communities, whom theresearch eventually will benefit; and
• recognition of the need for such research.The workshop recommended that the following
questions be addressed in socioeconomic researchagendas.2.1 How can fisheries development address the
needs of the poorer people; in particular, iden-tify ways to improve fish prices and economicoutput for fishers without depriving the poorerpeople of a cheap supply of protein (issuesrelated to fishery management, processing andmarketing).
2.2 The various ways through which communitiesare internally differentiated, and the consequentresults in unequal access to and control ofresources.
2.3 How to address the problems of women andchildren in usually male-centred fisheriesdevelopment (e.g. fish culture, net-making,processing, marketing).
2.4 How to empower the local community in termsof technical and administrative capacities.
2.5 How to value fisheries resources.2.6 The socioeconomic benefits of reservoirs (at
community and national levels) and theirdistribution.
2.7 The social impact of reservoir impoundment;and
2.8 its costs and benefits, especially in stockenhancement measures.
3. Policy development toward an holistic approach to resource managementThe use of participatory research approach (PRA)methods at catchment/watershed level and theemployment of GIS and remote sensing technologiesin resource assessment permit consultation to set andprioritise objectives at the relevant scale. However, itis suggested that stakeholder consensus is necessaryin developing policy although it may not always beeasily achieved. In this regard ‘outsiders’ may help
develop appropriate conflict resolution measures,which may be situation-specific.
The interactive nature of such a policy developmentstructure is schematically represented in Figure 2.3.1 To take into consideration the existing national,
provincial and local institutional and policyframework.
The workshop also recognised the followingaspects which may be taken into consideration:• Institutional/management arrangements and the
importance of the issue must be balanced againstthe ability to achieve the goals.
• Participatory methodologies for addressingissues holistically need to be developed and/orimplemented.
• Resource-users may understand quickly the needfor rational management, which often implies theneed for restraints to existing practices, but in theabsence of alternate livelihood opportunities maynot be able to comply fully. The immediate paybackfrom fishing activities (and some other resourceextraction activities) gives these activities anadditional competitive advantage to alternatives.
• The degree to which the user depends on theresource is of great importance. Also, resourceusers fall into different categories (e.g. level ofwealth), and some will be able to move to alterna-tive livelihoods more easily than others. They mayreact to changes in different ways. Risk-reductionin moving to new livelihoods is an importantissue, and the solution is likely to depend on localcontext.The Workshop also noted that:
• managing a fishery to assure sustainable liveli-hood may be more appropriate than managing toassure optimal yields;
• the aims and practices of the main reservoir usersneed to be accommodated, and will determine thestakes for other users. Good communicationsbetween fishers and the main users are importantand may lead to improved management of theresource for all;
• user institutions are likely to evolve continuously,as needs and opportunities are identified;
• external organisations such as government depart-ments may help resource users to assess andoptimise management regimes through a processof participatory adaptive learning.
3.2 To move toward co-management arrangementswith major stakeholders, duly identified in aparticipatory stakeholder analysis.
It was agreed that primary stakeholder (resourceuser) perceptions tend to synthesise pertinent issuesmore holistically than those of anyone, and evenmore so, their perceptions are highly often pragmaticand should be given priority in relevant analysis.
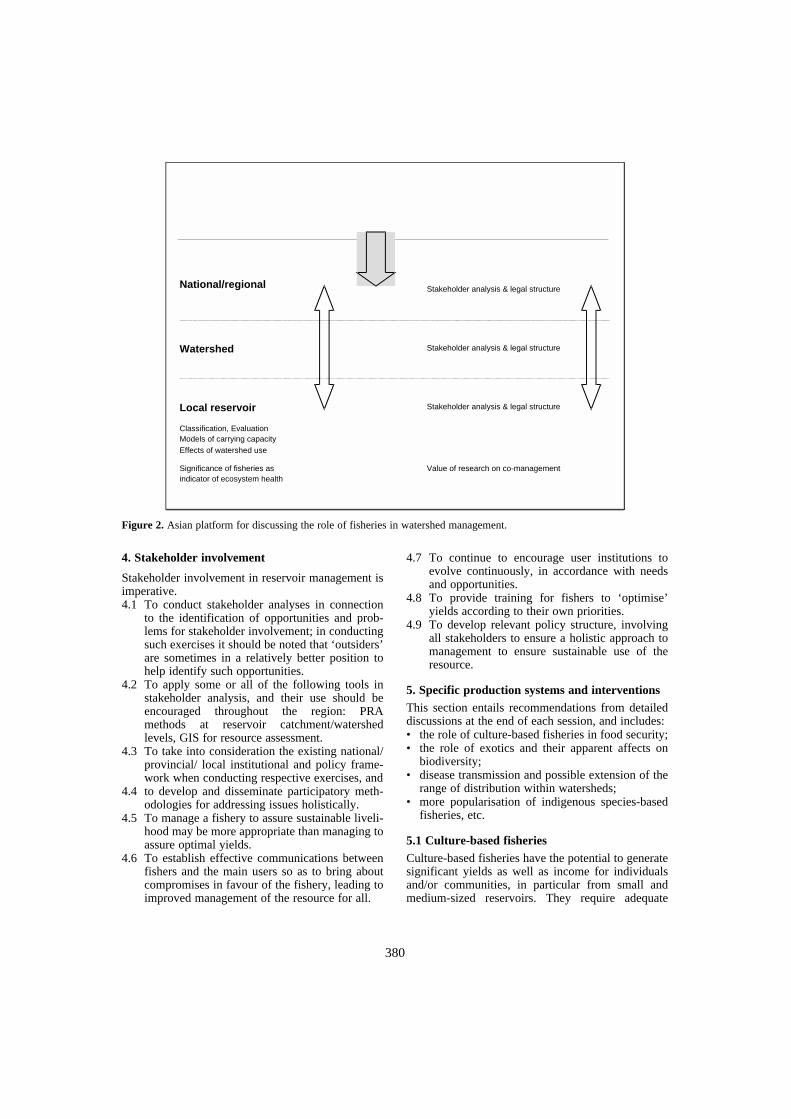
380
4. Stakeholder involvement
Stakeholder involvement in reservoir management isimperative.4.1 To conduct stakeholder analyses in connection
to the identification of opportunities and prob-lems for stakeholder involvement; in conductingsuch exercises it should be noted that ‘outsiders’are sometimes in a relatively better position tohelp identify such opportunities.
4.2 To apply some or all of the following tools instakeholder analysis, and their use should beencouraged throughout the region: PRAmethods at reservoir catchment/watershedlevels, GIS for resource assessment.
4.3 To take into consideration the existing national/provincial/ local institutional and policy frame-work when conducting respective exercises, and
4.4 to develop and disseminate participatory meth-odologies for addressing issues holistically.
4.5 To manage a fishery to assure sustainable liveli-hood may be more appropriate than managing toassure optimal yields.
4.6 To establish effective communications betweenfishers and the main users so as to bring aboutcompromises in favour of the fishery, leading toimproved management of the resource for all.
4.7 To continue to encourage user institutions toevolve continuously, in accordance with needsand opportunities.
4.8 To provide training for fishers to ‘optimise’yields according to their own priorities.
4.9 To develop relevant policy structure, involvingall stakeholders to ensure a holistic approach tomanagement to ensure sustainable use of theresource.
5. Specific production systems and interventionsThis section entails recommendations from detaileddiscussions at the end of each session, and includes:• the role of culture-based fisheries in food security;• the role of exotics and their apparent affects on
biodiversity;• disease transmission and possible extension of the
range of distribution within watersheds; • more popularisation of indigenous species-based
fisheries, etc.
5.1 Culture-based fisheriesCulture-based fisheries have the potential to generatesignificant yields as well as income for individualsand/or communities, in particular from small andmedium-sized reservoirs. They require adequate
Figure 2. Asian platform for discussing the role of fisheries in watershed management.
Stakeholder analysis & legal structure
Stakeholder analysis & legal structure
Stakeholder analysis & legal structure
Value of research on co-management
National/regional
Watershed
Local reservoir
Classification, EvaluationModels of carrying capacityEffects of watershed use
Significance of fisheries asindicator of ecosystem health
381
institutional arrangements to sustain investment instocking and to regulate exploitation. Stocking andharvesting regimes must be tailored to local condi-tions to maximise benefits. It is recognised also thatstocking can facilitate more active management ofreservoir fisheries in general, leading to wider bene-fits such as more efficient exploitation. 5.1.1 To support the development of culture-based
fisheries by creating conducive externalinstitutional arrangements, and co-managementsystems where appropriate. This may befacilitated by wider application of institutionalanalysis and development.
5.1.2 Stocking and harvesting regimes for culture-based fisheries should be optimised for localconditions to maximise benefits. Populationand empirical models, particularly when com-bined and integrated in comparative studies,are highly cost-effective tools for identifyingoptimal management regimes. The wider useof such tools should be encouraged andsupported.
5.1.3 Participatory adaptive learning from manage-ment experience holds great potential for theoptimisation of culture-based fisheries. Thismay promote effective linkages between localuser organisations and research.
5.2 The role of exotics
The workshop noted that more often than not exoticspecies have been targeted as the causative agent forthe disappearance of certain indigenous species, inspite of lack of scientific evidence.5.2.1 Implementation of a comprehensive desk study
to address the following issues: contribution ofexotics to food security in the region; evalua-tion of the relative merits of the contribution ofexotics against the importance of indigenousspecies; assessment of the impact of exotics onbiodiversity-related issues; evaluation of theprobabilities of ‘invasion’ of new watersheds,causing detrimental impacts.
5.3 Ecosystem studies
Even though an holistic approach was recommendedfor effective and sustainable management of theresource, the workshop recognised the importanceand relevance of ‘ecosystem’ studies of selected, rep-resentative reservoirs of different watersheds in theregion. It was acknowledged that such studies enrichunderstanding of the dynamics of reservoir eco-systems and the influence of the catchment on thereservoir ecosystem, and will enable better under-standing potential impacts of other human activitiesof the catchment on reservoir ecology.
5.3.1 To encourage whenever possible ecosystemstudies of reservoirs of different watershed,and that such studies be an integral componentof reservoir management plans per se.
5.3.2 To make use of new technologies such asecho-sounding techniques for biomass assess-ment that will contribute to better utilisation offish resources.
5.4 Cage cultureThe workshop considered the ‘pros’ and ‘cons’ ofdevelopment of cage culture in reservoirs, andaccepted that in certain circumstances it will play animportant role in providing a means of sustainablefish production. The workshop accepted that it willbe difficult, if not impossible, to predict the extent ofcage culture activities that can be sustainablyachieved in large reservoirs in the tropics. 5.4.1 Cage culture activities in upstream areas of
reservoirs should not be encouraged.5.4.2 A complete economic appraisal should be con-
ducted, and feed or feed ingredient supplies,markets, etc. be taken into consideration insuch analysis.
5.4.3 Attempts be made to apply nutrient mass-balance models in determining the extent ofcage culture activities that could be sustainedin a reservoir.
6. Capacity-buildingThe workshop recognised that there is dearth ofskilled human resources to collate, analyse and con-tinually monitor all aspects pivotal to introducing anholistic approach to sustainable utilisation of theresource(s).
It was recognised that capacity-building at alllevels is needed to realise the goals set out earlier,and in all sectors is imperative to achieving foodsecurity and poverty alleviation, particularly of therural poor.6.1 To build human capacity on aspects relevant to
reservoir fishery management (such as popula-tion dynamics, fish biology, aquatic ecology,limnology, socioeconomics) as a priority, andthat such skill development be integrated in away so as to make the outcome cost-effective.
6.2 To develop mechanisms to network reservoirfishery management and monitoring teams oper-ating in the region.
6.3 To establish, as an initial step, an electronicdiscussion group through the world-wide web,initially restricting participation to the workshopparticipants, and if found effective and useful,extended to a wider audience.
Sena S. De Silva15 March 2000

382
Participants
Professor Sena De SilvaSchool of Ecology and EnvironmentDeakin UniversityWarrnambool CampusPO Box 423Warrnambool VIC 3280 AUSTRALIAEmail: [email protected]
Mr Geoff GooleyMarine and Freshwater Resources InstituteSnobs CreekPrivate Bag 20Alexandra Vic 3714 AUSTRALIAEmail: [email protected]
Mrs Christine HarrisSchool of Ecology and EnvironmentDeakin UniversityWarrnambool CampusPO Box 423Warrnambool Vic 3280 AUSTRALIAEmail: [email protected]
Mr Peter LynchACIARGPO Box 1571Canberra ACT 2601AUSTRALIAEmail: [email protected]
Mr Colin MagiltonSchool of Ecology and EnvironmentDeakin UniversityWarrnambool CampusPO Box 423Warrnambool Vic 3280 AUSTRALIAEmail: [email protected]
Mr Barney SmithACIARGPO Box 1571Canberra ACT 2601AUSTRALIAEmail: [email protected]
Professor Fritz SchiemerDepartment of ZoologyUniversity of Vienna14 Althanstr A-1090 WienAUSTRIAEmail: [email protected]
Dr M.R. HassanDepartment of AquacultureFaculty of Fisheries,Bangladesh Agricultural UniversityMymensingh 2202 BANGLADESHEmail: [email protected]
Professor Jacques MoreauDepartment of Inland FisheriesI.N.P./E.N.S.A.T., B.P. 107Auzeville Tolosane 31326Castanet Tolosan FRANCEEmail: [email protected]
Professor Ahyaudin B. AliSchool of Biological ScienceUniversity of Sains11800 PenangMALAYSIAEmail: [email protected]
Mr Vongpachhang BalavongManagement of the Reservoir Fisheries in the Mekong BasinMekong River CommissionNamngum Reservoir Management and Development ProjectPO Box 7035Vientiane LAO PDREmail: [email protected]
Mr Wolf HartmanManagement of the Reservoir Fisheries in the Mekong BasinMekong River CommissionPO Box 7035Vientiane LAO PDREmail: [email protected]
Dr Niklas MattsonManagement of the Reservoir Fisheries in the Mekong BasinMekong River CommisionPO Box 7035Vientiane LAO PDREmail: [email protected]
Mr Henrik NilssonManagement of the Reservoir Fisheries in the Mekong BasinMekong River CommissionPO Box 7035VientianeLAO PDREmail: [email protected]
Mr Sommano PhonsavathManagement of the Reservoir Fisheries in the Mekong BasinMekong River CommissionLiving Aquatic Resources Research Centre PO Box 7035VientianeLAO PDREmail: [email protected]
Mr Abundio M. GaliciaBureau of Fisheries & Aquatic Resources860 Quezon AvenueQuezon City, Metro Manila 3008 PHILIPPINESTeleFax: 373 0792 Tel:410-9981
Nelson A. LopezBureau of Fisheries & Aquatic Resources860 Quezon AvenueQuezon City, Metro Manila 3008 PHILIPPINESTelefax: 373 0792Tel: 410-9981
Associate Professor Daoming HuangInstitute of Reservoir FisheriesZhuo Dao QuanWuhan 430079 P.R. CHINAEmail:
Dr Jiashou LiuInstitute of Reservoir FisheriesZhuo Dao QuanWuhan 430079 P.R. CHINAEmail: [email protected]
Associate Professor Shenggui Wu Institute of Reservoir FisheriesZhuo Dao QuanWuhan 430079 P.R. CHINA
Associate Professor Hongjuan WuInstitute of Reservoir FisheriesZhuo Dao QuanWuhan 430079 P.R. CHINAEmail: [email protected]

383
Mr Edwin Oreihaka Chief Fisheries Officer Fisheries Division/Dept. of Agri & Fisheries Ministry of Lands, Agriculture & Fisheries PO Box G13 HoniaraSOLOMON ISLANDSEmail: [email protected].
Dr Upali AmarasingheDepartment of ZoologyKelaniya UniversityKelaniyaSRI LANKAEmail: [email protected]
Ms Soma AriyaratneNational Aquatic Resources AuthorityCrow IslandMattakkuliya Colombo 15 SRI LANKAEmail: [email protected]
Mr Chandana NissankaDepartment of ZoologyKelaniya UniversityKelaniyaSRI LANKAEmail: [email protected]
Dr Swarna PiyasiriDepartment of BiologySri Jayawardenapura UniversityGangodawilaNugegoda SRI LANKAEmail: [email protected]
Ms K.B.C. PushpalathaAquaculture Extension CentreFisheries Corporation BuildingAnuradhapura SRI LANKA
Associate Professor E.I.L. SilvaInstitute of Fundamental StudiesHantanaKandy SRI LANKAEmail: [email protected]
Professor M.J.S. WijeyaratneDepartment of ZoologyKelaniya UnivesityKelaniyaSRI LANKAEmail: [email protected]
Mr Tuatong JutagateFaculty of AgricultureUbon Rachathani UniversityWarin ChamprabUbon Rathchathani 34190 THAILANDEmail: [email protected]
Mr Boonsong SricharoendhamNational Inland Fisheries InstituteDepartment of FisheriesAgriculture and Co-operatives MinistryTHAILANDEmail: [email protected]
Mr Cherdsak VirapatSmall Holder Aquaculture Research and DevelopmentFisheries Engineering DivisonDepartment of FisheriesPhaholyothin RoadBangkhen Bangkok 10900 THAILANDEmail: [email protected] or [email protected]
Dr J. VijverbergCentre of LimnologyNetherlands Institute of EcologyRijksstraatweg 63631 AC NieuwersluisTHE NETHERLANDSEmail: [email protected]
Dr Caroline GarawayT.H. Huxley SchoolImperial College8 Princes GardensLONDON SW7 1NA UKEmail: [email protected]
Dr Kai LorenzenT.H. Huxley SchoolImperial College8 Princes GardenLONDON SW7 1NA UKEmail: [email protected]
Mr Francis MurrayPh D StudentInstitute of AquacultureStirling UniversitySCOTLANDEmail: [email protected]
Professor David SimonProfessor of Development GeographyDept. of GeographyRoyal Holloway University of LondonEGHAMSurrey TW20 0EX UKEmail: [email protected]
Dr Nguyen Quoc AnReservoir Fisheries ProjectC/- Mekong River Commission68 Le Hong PhongBan Me ThuotDak Lak VIETNAMEmail: [email protected]
Mr Bui The AnhResearch Institute for Aquaculture No. 1Dinh Bang, Tien-SonBack NinhVIETNAM Email: [email protected]
Mr Thai Ngoc ChienReservoir Fisheries ProjectC/- Mekong River Commission68 Le Hong PhongBan Me ThuotDak Lak VIETNAMEmail: [email protected]
Mr Phan Thuong HuyReservoir Fisheries ProjectC/- Mekong River Commission68 Le Hong PhongBan Me ThuotDak Lak VIETNAMEmail: [email protected]
Ms Mercedes LogartaReservoir Fisheries ProjectC/- Mekong River Commission68 Le Hong PhongBan Me ThuotDak Lak VIETNAMEmail: [email protected]
Dr Le Thanh LuuResearch Institute for Aquaculture No. 1Dinh Bang, Tun-sonBac Ninh VIETNAMEmail: [email protected]

384
Ms Nguyen Thi NhungReservoir Fisheries ProjectC/- Mekong River Commission68 Le Hong PhongBan Me ThuotDak Lak VIETNAMEmail: [email protected]
Mr Truong Ha PhongReservoir Fisheries ProjectC/- Mekong River Commission68 Le Hong PhongBan Me ThuotDak Lak VIETNAMEmail: [email protected]
Mr Phan Dinh PhucReservoir Fisheries ProjectC/- Mekong River Commission68 Le Hong PhongBan Me ThuotDak Lak VIETNAMEmail: [email protected]
Mr John SollowsReservoir Fisheries ProjectC/- Mekong River Commission68 Le Hong PhongBan Me ThuotDak Lak VIETNAMEmail: [email protected]
Mr Nguyen Hai SonResearch Institute for Aquaculture No. 1Dinh Bang, Tien-sonBac Ninh VIETNAMEmail: [email protected]
Ms. Nguyen Thi Thu Thuy Research Institute for Aquaculture No.1 Dinh Ban, Tien-sonBac Ninh VIETNAM
Mr Tran Thanh VietReservoir Fisheries ProjectC/- Mekong River Commission68 Le Hong PhongBan Me ThuotDak Lak VIETNAMEmail: [email protected]
Dr V.V. SugunanCentral Inland Capture Fisheries Research InstituteBarrackpore 743101 WEST BENGALEmail: [email protected]
Dr K.I. MaticsC/- Mekong River CommissionMRC SecretariatPO Box 1112Phnom PenhCAMBODIAEmail: [email protected]
Dr Jeanineke Dahl KristensenFishery Adviser2, Asiatisk PlaceDK-1448 Copenhagen KDENMARKEmail: [email protected]
Mr Malasri KhumsriFisheries BiologistUbonratchathani Inland Fisheries Development CentreJangsanit RoadAmphur MuangUbon THAILAND 34000Email: [email protected]
Mr Jorgen G. JensenMekong River CommissionPO Box 1112Phnom PenhKINGDOM OF CAMBODIAEmail: [email protected]
Related Documents