1 MIF Program Research Paper Do Mergers and Acquisitions Transactions Create Value for Shareholders? A Theoretical and Empirical Approach on Value Creation in Cross-Border Mergers and Acquisitions Transactions in the Consumer Goods Industry Tobias Tietz Under the Supervision of Professor Patrick Legland June 2017

Welcome message from author
This document is posted to help you gain knowledge. Please leave a comment to let me know what you think about it! Share it to your friends and learn new things together.
Transcript
1
MIF Program
Research Paper
Do Mergers and Acquisitions Transactions Create Value for Shareholders?
A Theoretical and Empirical Approach on Value Creation in Cross-Border Mergers and Acquisitions Transactions in the
Consumer Goods Industry
Tobias Tietz
Under the Supervision of
Professor Patrick Legland
June 2017
2
Abstract
This study examines the nature of wealth changes in cross-border M&A transactions in the consumer goods industry as well as the sources of gains and losses in these transactions in the light of different underlying motives: synergy, managerialism and hubris. Concerning overall value creation it was found that on average total gains are positive for all transactions and that significant positive gains accrue to target shareholders. Moreover, it was found that the results are in line with the author’s expectations, that multiple sources of value creation exist in cross-border M&A with positive total gains: financial diversification, market seeking and bank governance systems. However, for negative total gains transactions, no statistically significant results could be found. The results provided by this study reinforce the importance of considering different behavioral assumptions in empirical research for value creation in M&A and cross-border M&A.
Acknowledgments:
I would like to express my sincere gratitude to Professor Patrick Legland for accepting the supervision of my thesis and for his continued support and guidance that have made this thesis possible. Moreover, I would like to thank all HEC staff that have helped with the administration and all communication related activities for the mater thesis. I would like to thank especially the library staff, since they helped me to gain access to crucial data sources without which I would not have been able to conduct my analysis.
3
Table of Contents
List of Abbreviations ........................................................................................................................ 5
List of Figures .................................................................................................................................... 6
List of Tables ..................................................................................................................................... 7
List of Variables ................................................................................................................................ 8
I. Introduction ...................................................................................................................... 9
I.1 Background ............................................................................................................................... 9
I.2 Problem Discussion and Thesis Outline ............................................................................... 10
II. Theoretical Background on Mergers and Acquisitions .............................................. 10
II.1 Creating Value in Mergers and Acquisitions .................................................................. 10
II.1.1 Definitions ....................................................................................................................... 10
II.1.2 Shareholder Value Creation in Mergers and Acquisitions .............................................. 11
II.1.3 The Impact of Market Efficiency on Shareholder Wealth Creation ................................ 12
II.1.4 Measuring Value Creation through Cumulative Abnormal Returns (CAR) ................... 13
II.2 Cross-Border Mergers and Acquisitions ......................................................................... 14
II.2.1 Value Creation in Cross-Border Mergers ........................................................................ 14
II.2.2 Developments in the Consumer Goods Industry ............................................................. 15
II.3 Rationales for Mergers and Acquisitions in a Cross-Border Context ........................... 17
II.3.1 Synergies as Strategic Rationale for Mergers and Acquisitions ...................................... 17
II.3.2 Managerialism Hypothesis as Rationale for Mergers and Acquisitions .......................... 20
II.3.3 Hubris Hypothesis as Rationale for Mergers and Acquisitions ....................................... 21
III. Empirical Analysis and Predictions .............................................................................. 22
III.1 Hypotheses .......................................................................................................................... 22
III.1.1 The Relationship between Target and Acquirer Gains to Total Gains ........................ 22
III.1.2 The Explanation of Total Gains through a Linear Regression .................................... 26
IV. Methodology ............................................................................................................... 28
IV.1 Sample and Data ................................................................................................................ 28
IV.2 Event Study Methodology ................................................................................................. 29
IV.3 Regressions ......................................................................................................................... 36
IV.3.1 Regression Model for the Relationship between Target and Acquirer Gains ............. 36
IV.3.2 Explanation of Variables ............................................................................................. 37
IV.3.3 Regression Model ........................................................................................................ 40
V. Findings and Analysis .................................................................................................... 42
V.1 Cumulative abnormal Returns and Total Gains ............................................................. 42
V.2 Analysis of Descriptive Statistics ...................................................................................... 44

4
V.3 Analysis of Hypotheses ...................................................................................................... 45
V.3.1 Analysis of Hypotheses concerning the Relationship between Target and Acquirer Gains
to Total Gains ............................................................................................................................... 45
V.3.2 Analysis of Hypotheses concerning the Relationship between Total Gains and the
independent Variables .................................................................................................................. 48
VI. Conclusion and Implications for Future Research ................................................. 54
VI.1 Conclusion .......................................................................................................................... 54
VI.2 Implications for Future Research ..................................................................................... 55
VII. Publication bibliography ........................................................................................... 57
VIII. Appendix ..................................................................................................................... 64
VIII.1 Deal Overview .................................................................................................................... 64
VIII.2 Regressions ......................................................................................................................... 65
VIII.3 Heteroskedasticity Tests .................................................................................................... 71

5
List of Abbreviations
CAR Cumulative Abnormal Returns
DSC Dollar Shave Club
e.g. for example, from Latin exempli gratia
et al. and others, from latin (et alii)
GDP Gross Domestic Product
i.e. that is, from Latin id est
M&A Mergers and Acquisitions
NAV Net Asset Value
OLS Ordinary Least Squares
UK United Kingdom
USA United States of America
VIF Variance of Inflation

6
List of Figures
Figure 1: Illustration for development of M&A industry taken from
https://publishing.dealogic.com/ib/DealogicGlobalMAReviewFullYear2016FINALMEDIA.p
df
Figure 2: Illustration for development of cross-border M&A taken from
http://crossbordermaindex.bakermckenzie.com/fmcg-q4-2016
Figure 3: Illustration of average abnormal returns to target shareholders in %
Figure 4: Illustration of average abnormal returns to acquirer shareholders in %
Figure 5: Illustration of average cumulative abnormal returns to both target and acquirer
shareholders
7
List of Tables
Table 1: Summary of studies concerning value creation in M&A (studies with significant results are highlighted)
Table 2: Summary of Studies concerning Value Creation in Cross-Border M&A (Studies using Abnormal Returns and CAR are displayed)
Table 3: Illustration of the t-test for the variable %TOTGAIN in the full sample
Table 4: Illustration for the binomial tests for the number of positive transactions
Table 5: Illustration of descriptive statistics for the sample of transactions
Table 6: Total Gains of the Combined Firm and Value Creation for Acquirers and Targets for each Country
Table 7: Illustration of the t-test for the variable %TOTGAIN in the full sample for target gains
Table 8: Illustration of the t-test for the variable %TOTGAIN in the full sample for acquirer gains
Table 9: Illustration of the t-test for the variable %TOTGAIN in the sample with positive gains for target gains
Table 10: Illustration of the t-test for the variable %TOTGAIN in the sample with positive gains for acquirer gains
Table 11: Illustration of the t-test for the variable %TOTGAIN in the sample with negative gains for target gains
Table 12: Illustration of the t-test for the variable %TOTGAIN in the sample with negative gains for acquirer gains
Table 13: Ouput for OLS Linear Regression for %TOTGAIN Variable for the full sample
Table 14: Ouput for OLS Linear Regression for CARBID Variable for the full sample
Table 15: Correlation matrix for Independent Variables
Table 16: Output for OLS Linear Regression for %TOTGAIN in Synergy Sample
Table 17: Output for OLS Linear Regression for CARBID in Synergy Sample
Table 18: Summary of Expectations and Findings for all hypotheses

8
List of Variables
%TOTGAIN Total gains for both target and acquirer shareholders around the announcement of the transaction
CARBID Gains accruing to acquirer shareholders around the announcement of the transaction
INTANG Variable describing the reverse internalization benefits from a transaction
RELSIZE Variable describing the economies of scale and economies of scope benefits arising from a transaction
RELGDP Variable describing the relation between the GDP-growth rates of the acquirer’s country and the United States or Canada
GDPGROW Variable derived from the variable RELGDP capturing the market seeking motives of the acquirer
REDVAR Variable capturing the financial diversification benefits arising from the transaction
GOVMKT Dependent dummy variable describing countries with “market-systems”
GOVGRP Independent dummy variable describing countries with “group-systems”
GOVBANK Independent dummy variable describing countries with “bank-systems”
9
I. Introduction
I.1 Background
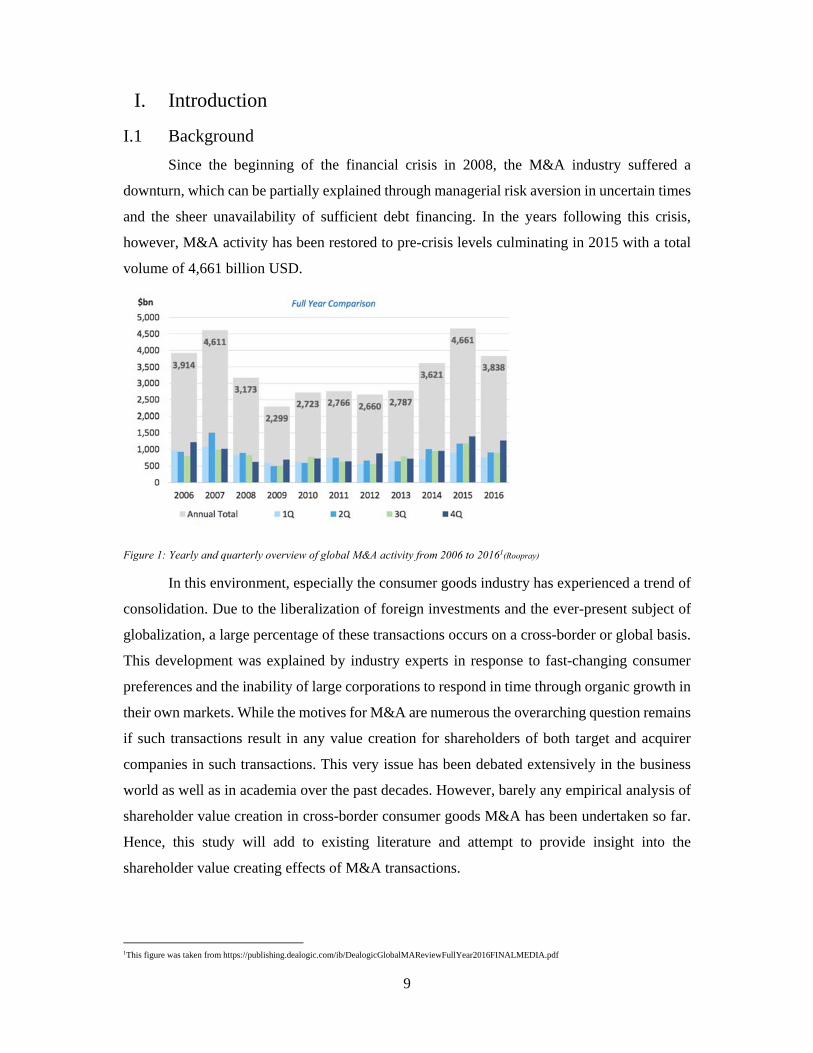
Since the beginning of the financial crisis in 2008, the M&A industry suffered a
downturn, which can be partially explained through managerial risk aversion in uncertain times
and the sheer unavailability of sufficient debt financing. In the years following this crisis,
however, M&A activity has been restored to pre-crisis levels culminating in 2015 with a total
volume of 4,661 billion USD.
Figure 1: Yearly and quarterly overview of global M&A activity from 2006 to 20161(Roopray)
In this environment, especially the consumer goods industry has experienced a trend of
consolidation. Due to the liberalization of foreign investments and the ever-present subject of
globalization, a large percentage of these transactions occurs on a cross-border or global basis.
This development was explained by industry experts in response to fast-changing consumer
preferences and the inability of large corporations to respond in time through organic growth in
their own markets. While the motives for M&A are numerous the overarching question remains
if such transactions result in any value creation for shareholders of both target and acquirer
companies in such transactions. This very issue has been debated extensively in the business
world as well as in academia over the past decades. However, barely any empirical analysis of
shareholder value creation in cross-border consumer goods M&A has been undertaken so far.
Hence, this study will add to existing literature and attempt to provide insight into the
shareholder value creating effects of M&A transactions.
1This figure was taken from https://publishing.dealogic.com/ib/DealogicGlobalMAReviewFullYear2016FINALMEDIA.pdf
10
I.2 Problem Discussion and Thesis Outline
Do cross-border M&A transactions create value in the consumer goods industry? This
question of wealth effects through M&A activity has been discussed heavily in the past as
indicated above. So far, however, no general consensus among researchers has been reached.
One can distinguish between mainly three different types of questions when considering
M&A transactions. The fist concerns the motive of such activity. The second and third ask if
value is created for target and/or acquirer shareholders respectively (Seth et al. 2002, p.923).
Since existing literature is divided concerning the answers to these questions, this study will try
to provide insight into the value creating effects of M&A in the consumer goods industry based
on an analysis of recent transactions.
After discussing past literature and evidence on the subject, the author will evaluate the
motives for M&A empirically as well as the wealth effects for target and acquirer shareholders
and the company as a whole. The United States and Canada were chosen as target markets, as
they have displayed the highest volume in M&A activity over the recent years and thus this
study expects them to be suitable to assess the question of value creation for target and acquirer
shareholders.
II. Theoretical Background on Mergers and Acquisitions
II.1 Creating Value in Mergers and Acquisitions
II.1.1 Definitions
Existing literature provides several definitions for the term mergers and acquisition.
Sudarsanam (2010), for instance, argues that a combination of businesses can be referred to as
either a “merger” or an “acquisition (Sudarsanam 2010, p.21). A more detailed explanation is
provided by the wording of the International Accounting Standards, IAS 22. It refers to mergers
as “uniting of interests” and to acquisitions as a “purchase”. An acquisition is defined as “a
business combination in which one of the enterprises, the acquirer, obtains control over the net
assets and operations of another enterprise, the acquiree, in exchange for the transfer of assets,
incurrence of a liability or issue of equity” (Deloitte). A merger is defined as “as a business
combination in which the shareholders of the combining enterprises combine control over the
whole, or effectively the whole, of their net assets and operations to achieve a continuing mutual
sharing in the risks and benefits attaching to the combine entity such that neither party can be
identified as the acquirer. Also called a pooling of interests” (Deloitte).
11
A merger transaction involves corporations that join forces in order to achieve shared
objectives. As far as shareholders are concerned, they often remain shareholders of the newly
established combined entity and sustain their interest in the company. Since none of the parties
can be identified as an acquirer, such a transaction is often referred to as a “merger-of-equals”
(Sudarsanam 2010, p.3).
In an acquisition, on the other hand, one firm purchases the assets of the other using several
possible means such as cash, shares or a combination of the two. Contrary to a merger, the
acquired firm becomes a subsidiary of the acquirer, and the shareholders (of the acquired
company) cease to have an interest in the company post-acquisition (as long as they are solely
paid in cash). Commonly, an acquisition is often described as a takeover, since one of the parties
involved is usually the dominant player.
Mergers are usually categorized as horizontal, vertical or conglomerate (Gaughan 2007,
p.13). A merger is horizontal when two competitors combine as they are on the same level of
the supply chain. Vertical mergers, on the other hand, occur when two companies come together
that have a buyer-seller-relationship and are at different levers within the same value chain. A
conglomerate merger takes place when the companies involved are not competitors and do not
have a buyer-seller relationship (Gaughan 2007, p.13).
II.1.2 Shareholder Value Creation in Mergers and Acquisitions
One of the most fundamental questions in M&A is how and for whom value is created
through transactions. This discussion often involves shareholders and other stakeholders
opposing each other in terms of who management should create value for first in the combined
entity post-acquisition.
According to finance theory, shareholder wealth maximization is the supreme goal of the
corporate investment and financing decisions (Sudarsanam 2010, p.52). It has been shown by
Koller et al. (2015) that companies, that are dedicated to value creation are healthier and more
robust – and that investing for sustainable growth builds stronger economies and higher living
standards (Koller et al. 2015, p.6). The legal frameworks for the jurisdictions of the acquiring
countries all indicate a fiduciary duty of directors to act in the best interest of the shareholders.
Pursuing shareholder value creation, however, does not necessarily imply that no value is
created for other stakeholders (Koller et al. 2015, p.7). Koller et al. name employees as an
example for possible stakeholders. A company trying to boost profits by providing a subpar
work environment, by underpaying employees, or by skimping on benefits will have trouble
12
attracting and retaining high-quality employees. (Koller et al. 2015, p.7). This will lead to a
higher staff churn rate and consequently higher recruiting as well as training costs. The same
logic applies to most stakeholders that are affected by the board of directors’ decisions.
Consequently, if managers want to create value for shareholders in the long term, they must
consider the effects of their decisions on stakeholder wealth as well.
II.1.3 The Impact of Market Efficiency on Shareholder Wealth Creation
Previous studies have typically evaluated shareholder wealth creation through the
application of the event-study methodology. Tuch and O’Sullivan (2007) have shown that
research varies regarding the length of the event window (Tuch, O'Sullivan 2007, p.144). This
lack of consensus concerning event windows has its roots in the question of at what point in
time all deal information is reflected in the respective stock prices. That is because capturing
the changes in stock prices induced by a transaction is essential to the evaluation of shareholder
value creation. When and how information is reflected in the stock prices is dependent on the
form of efficiency the market is assumed to show.
The efficient-market hypothesis has been a topic of heated debate for the last decades.
This theory claims that all information is reflected in the prices of securities. Consequently, the
only mean to get a higher return is to take on more risk. This theory was first introduced by
Fama in 1969, who introduces three different forms of market efficiency: (1) weak-form
efficiency, (2) semi-strong form efficiency and (3) strong-form efficiency.
Under the weak-form efficiency it is assumed that current stock prices reflect all
information contained in past prices. Consequently, under this form of efficiency, one should
not be able to generate profits through technical analysis.
Under the semi-strong form efficiency, current prices reflect all information contained
in past prices as well as all publicly available information. In this case, the stock price will
adjust immediately to newly available public information such as the announcement of a
transaction.
Finally, under the strong-form efficiency, current prices reflect all past information and
all publicly available as well as private information. Here, not even insiders should be able to
generate an abnormal return, since private information is already contained in the stock price.
Moreover, the stock price should not be affected on the announcement date, since the
announcement is already expected and thus already incorporated in the stock price.
13
Existing studies have assumed the semi-strong form efficiency for their event studies,
indicating that share prices react in a timely and unbiased manner to new information and that
the size of the gains reflects the value of the firm in forthcoming periods (Tuch, O'Sullivan
2007, p.142-143). Following this generally accepted assumption, this study will also assume
the semi-strong form efficiency.
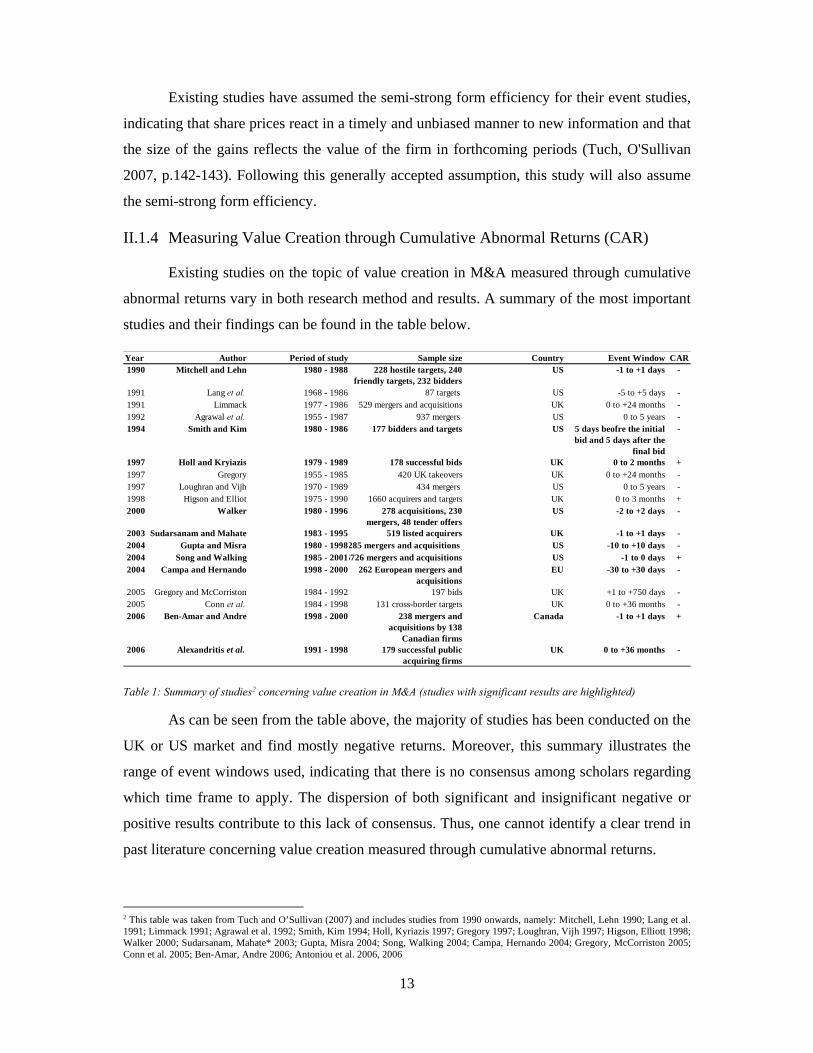
II.1.4 Measuring Value Creation through Cumulative Abnormal Returns (CAR)
Existing studies on the topic of value creation in M&A measured through cumulative
abnormal returns vary in both research method and results. A summary of the most important
studies and their findings can be found in the table below.
Table 1: Summary of studies2 concerning value creation in M&A (studies with significant results are highlighted)
As can be seen from the table above, the majority of studies has been conducted on the
UK or US market and find mostly negative returns. Moreover, this summary illustrates the
range of event windows used, indicating that there is no consensus among scholars regarding
which time frame to apply. The dispersion of both significant and insignificant negative or
positive results contribute to this lack of consensus. Thus, one cannot identify a clear trend in
past literature concerning value creation measured through cumulative abnormal returns.
2 This table was taken from Tuch and O’Sullivan (2007) and includes studies from 1990 onwards, namely: Mitchell, Lehn 1990; Lang et al. 1991; Limmack 1991; Agrawal et al. 1992; Smith, Kim 1994; Holl, Kyriazis 1997; Gregory 1997; Loughran, Vijh 1997; Higson, Elliott 1998; Walker 2000; Sudarsanam, Mahate* 2003; Gupta, Misra 2004; Song, Walking 2004; Campa, Hernando 2004; Gregory, McCorriston 2005; Conn et al. 2005; Ben-Amar, Andre 2006; Antoniou et al. 2006, 2006
Year Author Period of study Sample size Country Event Window CAR1990 Mitchell and Lehn 1980 - 1988 228 hostile targets, 240
friendly targets, 232 biddersUS -1 to +1 days -
1991 Lang et al. 1968 - 1986 87 targets US -5 to +5 days -1991 Limmack 1977 - 1986 529 mergers and acquisitions UK 0 to +24 months -1992 Agrawal et al. 1955 - 1987 937 mergers US 0 to 5 years -1994 Smith and Kim 1980 - 1986 177 bidders and targets US 5 days beofre the initial
bid and 5 days after the final bid
-
1997 Holl and Kryiazis 1979 - 1989 178 successful bids UK 0 to 2 months +
1997 Gregory 1955 - 1985 420 UK takeovers UK 0 to +24 months -1997 Loughran and Vijh 1970 - 1989 434 mergers US 0 to 5 years -1998 Higson and Elliot 1975 - 1990 1660 acquirers and targets UK 0 to 3 months +2000 Walker 1980 - 1996 278 acquisitions, 230
mergers, 48 tender offersUS -2 to +2 days -
2003 Sudarsanam and Mahate 1983 - 1995 519 listed acquirers UK -1 to +1 days -2004 Gupta and Misra 1980 - 1998285 mergers and acquisitions US -10 to +10 days -2004 Song and Walking 1985 - 20015726 mergers and acquisitions US -1 to 0 days +2004 Campa and Hernando 1998 - 2000 262 European mergers and
acquisitionsEU -30 to +30 days -
2005 Gregory and McCorriston 1984 - 1992 197 bids UK +1 to +750 days -2005 Conn et al. 1984 - 1998 131 cross-border targets UK 0 to +36 months -2006 Ben-Amar and Andre 1998 - 2000 238 mergers and
acquisitions by 138 Canadian firms
Canada -1 to +1 days +
2006 Alexandritis et al. 1991 - 1998 179 successful public acquiring firms
UK 0 to +36 months -
14
II.2 Cross-Border Mergers and Acquisitions
II.2.1 Value Creation in Cross-Border Mergers
The theory for positive returns from cross-border M&A follows the assumption that
firms seek to enter foreign markets, to exploit its firm-specific resources in international
markets by taking advantage of market imperfections (Shimizu et al. 2004, p.336). Existing
literature states that cross-border M&A provide the benefits of internalization, risk
diversification and synergy - therefore creating value for both the target and acquirer (Kang
1993, p.369; Morck, Yeung 1991, p.185; Markides, Ittner 1994, p.360). Regarding the tools to
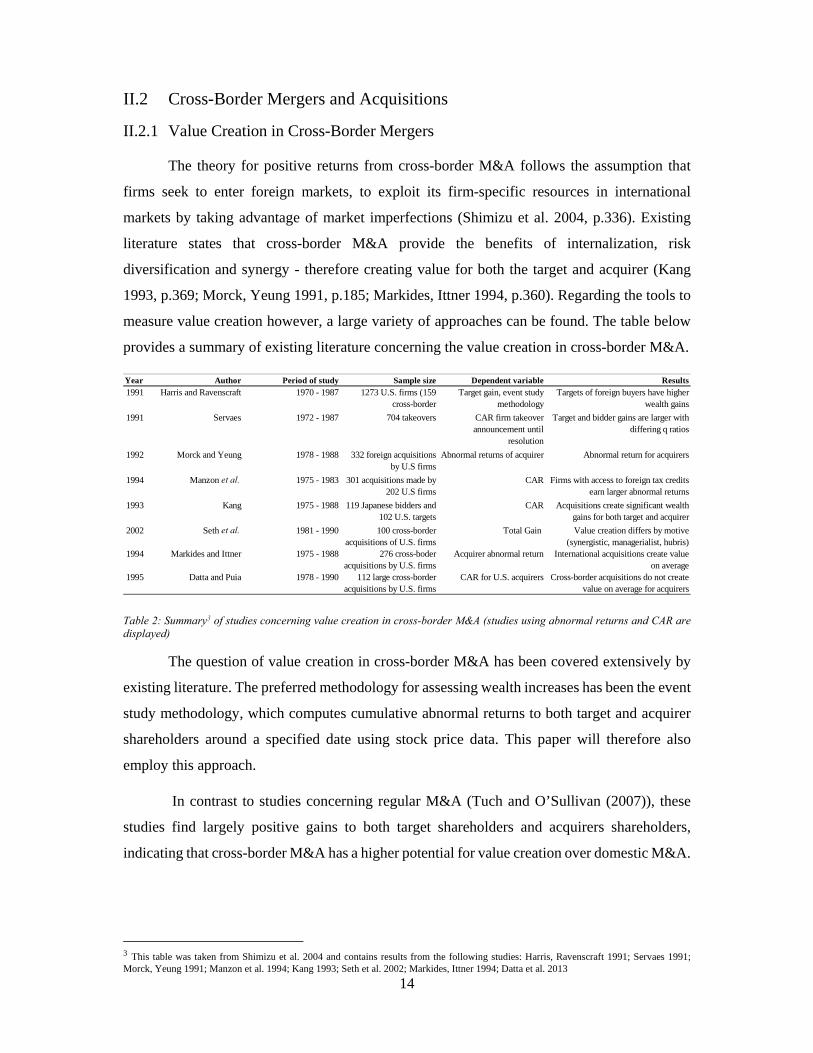
measure value creation however, a large variety of approaches can be found. The table below
provides a summary of existing literature concerning the value creation in cross-border M&A.
Table 2: Summary3 of studies concerning value creation in cross-border M&A (studies using abnormal returns and CAR are displayed)
The question of value creation in cross-border M&A has been covered extensively by
existing literature. The preferred methodology for assessing wealth increases has been the event
study methodology, which computes cumulative abnormal returns to both target and acquirer
shareholders around a specified date using stock price data. This paper will therefore also
employ this approach.
In contrast to studies concerning regular M&A (Tuch and O’Sullivan (2007)), these
studies find largely positive gains to both target shareholders and acquirers shareholders,
indicating that cross-border M&A has a higher potential for value creation over domestic M&A.
3 This table was taken from Shimizu et al. 2004 and contains results from the following studies: Harris, Ravenscraft 1991; Servaes 1991; Morck, Yeung 1991; Manzon et al. 1994; Kang 1993; Seth et al. 2002; Markides, Ittner 1994; Datta et al. 2013
Year Author Period of study Sample size Dependent variable Results
1991 Harris and Ravenscraft 1970 - 1987 1273 U.S. firms (159 cross-border
Target gain, event study methodology
Targets of foreign buyers have higher wealth gains
1991 Servaes 1972 - 1987 704 takeovers CAR firm takeover announcement until
resolution
Target and bidder gains are larger with differing q ratios
1992 Morck and Yeung 1978 - 1988 332 foreign acquisitions by U.S firms
Abnormal returns of acquirer Abnormal return for acquirers
1994 Manzon et al. 1975 - 1983 301 acquisitions made by 202 U.S firms
CAR Firms with access to foreign tax credits earn larger abnormal returns
1993 Kang 1975 - 1988 119 Japanese bidders and 102 U.S. targets
CAR Acquisitions create significant wealth gains for both target and acquirer
2002 Seth et al. 1981 - 1990 100 cross-border acquisitions of U.S. firms
Total Gain Value creation differs by motive (synergistic, managerialist, hubris)
1994 Markides and Ittner 1975 - 1988 276 cross-boder acquisitions by U.S. firms
Acquirer abnormal return International acquisitions create value on average
1995 Datta and Puia 1978 - 1990 112 large cross-border acquisitions by U.S. firms
CAR for U.S. acquirers Cross-border acquisitions do not create value on average for acquirers

15
II.2.2 Developments in the Consumer Goods Industry
For the past seven years, with the exception of 2016 and 2013, cross-border M&A in
the consumer goods industry has seen a steady increase, both in volume and in value.
This increase in transaction activity is mainly due to two major trends in consumer
preferences and behavior: Health-conscious living and Digitalization
Health-Conscious Living
In the past years, the awareness for organically sourced products and environmentally
friendly manufacturing has increased steadily and has become a major purchase factor for a
significant number of consumers, as evidenced by the following quote: “Organic, local, additive
and cruelty-free are the labels that consumers crave – particularly millennials” (Baker
McKenzie 2016). These products, however, are not cheap but consumers are willing to a pay a
premium. According to Baker McKenzie’s David Scott, “healthier and premium products are
driving, and will continue to drive a lot of growth in [consumer goods] M&A” (Baker
McKenzie 2016). Moreover, he asserts that the margins in this sector are very attractive,
indicating the revenue generation potential behind this trend.
Since large corporates are usually unable or too slow to meet changing consumer
demands in time they turn to inorganic growth in the required sub-segments through M&A.
Such an example would be the deal of Danone, which acquired WhiteWave Foods, a natural,
health-focused beverage producer for a total consideration of 12bn USD in July 2016, making
it the biggest deal in the consumer goods industry in this year (Baker McKenzie 2016). This
Figure 2: Volume and value of cross-border M&A from 2009 to 2016 taken from Baker McKenzie (Baker McKenzie 2016)
16
transaction enhanced Danone’s healthy products portfolio and expanded its footprint in the
USA.
Enhancing the company’s bottom line, however, is not the only appealing factor driving
M&A in the consumer goods industry. Premium products can lift brand perception for the
corporation as a whole and increase pricing power. According to Baker McKenzie’s Tim Gee
“Unilever, for example, is moving into premium products in the personal care space, because it
enables them to exert a bit more authority across the range” (Baker McKenzie 2016)
By allying the business with environmentally friendly and premium products, one can
enhance the company’s perception with consumers, increase retention and through higher
pricing power, achieve an increased bottom line.
Digitalization
The pace of digitalization has increased exponentially over the last ten years and has
had a significant impact on every industry, especially consumer goods. New platforms and
business models are emerging every day, revolutionizing delivery systems and consequently
making it easier and faster for customers to gain access to their desired products. Due to the
pace of development, it is often not feasible for corporates to build their own platforms and new
delivery systems. “[Consumer goods] companies are not good at developing their own
technology platforms” (Baker McKenzie 2016) says Baker McKenzie’s David Fleming. This,
however, does not at all mitigate the willingness of corporates to take advantage of the new
opportunities that digitalization offers. One approach chosen by some companies is the use of
an incubator or an accelerator in their own corporation. Two examples would be Axel
Springer’s “Plug and Play” and Deutsche Telekom’s “Hub:Raum”. These investment vehicles
are allocated a certain amount of money, with which they undertake strategic investments to
enhance the corporation’s portfolio and potentially gain access to above mentioned disruptive
technologies.
The second, and more commonly chosen approach, is to engage in M&A. Digital
innovation is creating a new type of transaction, since M&A in the consumer goods industry is
no longer necessarily about vertical or horizontal integration but focuses on digital capability.
According to Tim Gee, the most important innovation that companies will focus on, when
engaging in M&A. is online sales since he considers this particular sector to be an area of
growth. (Baker McKenzie 2016)
17
An example of such a deal would be Unilever’s acquisition of the Dollar Shave Club
(DSC) for a total of 1 billion USD. This company offered online subscriptions for shaving
products on a monthly or weekly basis. Business models such as DSC are disrupting a
previously unchallenged market and thus provide room for M&A in this sector. Tim Gee argues
that “you will see plenty of corporate venture transactions where the majors buy up recently
established, blossoming micro brands and then see if they can globalize them” (Baker
McKenzie 2016).
The above-mentioned trends provide an overview of potential motives to engage in
cross-border M&A in the consumer goods industry and illustrate the attractiveness of
consolidation in this particular sector. The North American markets have been the most targeted
in the consumer goods industry for cross-border M&A (Baker McKenzie 2016). Due to this
high volume of M&A activity, this study expects the United States to represent an appropriate
market to test the motives and extent of value creation for target and acquirer shareholders.
II.3 Rationales for Mergers and Acquisitions in a Cross-Border Context
The following section will outline the three main motives or rationales for engaging in
in cross-border M&A, which are namely: synergies, managerialism and hubris.
II.3.1 Synergies as Strategic Rationale for Mergers and Acquisitions
There are various sources of synergies in cross-border acquisitions. Before elaborating
on these aspects, however, basic definitions shall be given. Synergies in the case of M&A
translate into the ability of the combined firm to be more profitable than the individual parts of
the firms (Gaughan 2007, p.124). This anticipation of benefits allows the bidding firm to incur
the expenses of such a transaction and still be able to pay target shareholders a premium
(Gaughan 2007, p.124). Despite the premium paid and the acquisition cost, the existence of
synergies allows the firm to have a positive net asset value (NAV) (Gaughan 2007, p.124).
In this equation, is equal to the value of the combined firms. and are equal to
the value of the target and the acquirer respectively. The variable P represents the premium paid
by the bidder and E represents the transaction costs.
Reorganizing this equation yields the following result:
18
Here displays the synergy effect and represents the costs
incurred by the bidder for the transaction. This equation illustrates that as long as the synergy
effect is larger than the costs associated with a transaction the bidding firm should go through
with the merger.
Especially in the context of cross-border M&A, various aspects concerning synergies
need to be considered. The synergy hypothesis assumes that a company’s unique and
specialized resources are not costlessly appropriable by other firms and that market frictions
exist preventing the firm from trading its stock of valuable excess resources (Seth et al. 2000,
p.389). Such frictions include restrictions on information sharing, government regulation and
differing levels of managerial skills across countries. Previous studies have argued that
synergies may arise from domestic acquisition due to (1) high investments needs of entering
into a new market, (2) the time and financial means required to establish the firm in a new
market and (3) the entry barriers that may be overcome by acquiring an incumbent (Singh,
Montgomery 1987, p.378-379).
Considering cross-border M&A additional factors are introduced that do not necessarily
play a role in domestic transactions. The general theory of foreign direct investment suggests
that “Internationalization serves to determine the reasons for the foreign production and sales
of the [multi-national enterprise], namely that these activities take place in response to
imperfections in the goods and factor markets” (Rugman 1980, p.24). The Heckscher-Ohlin
model of free trade assumes frictionless markets, zero transportation costs and homogenous
tastes (Rugman 1980, p.25; Caves 2007, p.45). In such a perfectly competitive environment
there would be no incentive for a company to relocate and produce in another country since
free flow and movement of goods will ensure that supply meets demand and the prices will be
equalized across economies (Calvet 1981, p.50; Seth et al. 2002, p.924). As this is, however,
only a theory, previous literature has examined the various potential sources of value creation
in cross-border M&A, of which some are going to be addressed in this paper in the context of
the consumer goods industry.
Caves (2007) argues that one source of value creation that can be derived from cross-
border M&A lies in the potential of the combined firm to share intangible assets in the context
of imperfect international markets (Caves 2007, p.50). Should a firm have, for example, certain
know-how under its control and the sale or lease of those assets is inefficient, then the firm
should use it within the organization (Seth et al. 2002, p.924). Some advantages arising from
such an internalization may be that the firm is able to work a new plant at designed capacity
19
sooner than a competitor or a product innovation coming from the parent company may present
economies of scale in a subsidiary (Caves 2007, p.72). Previous research agrees that transacting
in an international environment does entail various costs, which will in turn reduce the value of
the intangible assets owned by the firm (Buckley, Casson 2003, p.220; Seth et al. 2002, p.925).
If these costs prevent the firm from selling or leasing such assets, it is the best option to
internalize them.
Another source of value may be associated with the opposite view of internalization, or
“reverse-internalization”. In the case of reverse-internalization, the bidding firm acquires
intangible assets from the target company that can be considered valuable in the bidder’s home
market (Seth et al. 2002, p.925). Despite the fact that internalization and reverse-internalization
may seem quite similar a crucial difference lies in the direction of the flow of knowledge (Seth
et al. 2002, p.925).
In the case of imperfect national capital markets characterized by information
asymmetry or capital controls, previous research has shown that it is possible for the
multinational corporation to reduce the risk of their profits by engaging in foreign operations
(Rugman 1976, p.75). This is due to the imperfect correlation of different national markets,
resulting in a reduction in overall return variability. In the case of domestic acquisitions, such
benefits cannot be realized since shareholders can simply recreate the company’s diversification
strategies. In an international context however, a single shareholder is unlikely to be able to
reproduce the exact diversification benefits of the corporation due to differences in transaction
costs. Thus, one can assume that risk reduction activity in an international context does create
shareholder value.
Value may also be realized through the reallocation of certain inputs to other areas of
use. Penrose (2009) argues that inputs that are absorbed in one activity, may present a more
profitable opportunity when put to a different use (Penrose 2009, p.155). If growth at home is
limited, firms may seek to invest their excess resources abroad to assure long-run profitability
of the organization. Similarly, for example in the presence of trade restrictions, exporting
enterprises may only be able to take advantage of business opportunities in foreign markets
through direct investment. This study will test the synergy hypothesis empirically in the context
of cross-border M&A.
20
II.3.2 Managerialism Hypothesis as Rationale for Mergers and Acquisitions
The managerialism hypothesis as argued by Berkovitch and Narayanan (1993) suggests
that “takeovers occur because they enhance the acquirer management’s welfare at the expense
of acquirer shareholders” (Berkovitch, Narayanan 1993, p.350). They found a negative
correlation between acquirer gains and total gains in a subset of US acquisitions, which provides
evidence for the hypothesis that managers pursue their own well-being at the expense of their
principals. This constitutes the classical principal-agent conflict. While managerialism was
proven before in domestic transactions, it may also present a valid argument for cross-border
M&A. In the past mainly two types of motives have found interest in research questions: empire
building and risk reduction (Seth et al. 2002, p.926).
The notion of empire building was first introduced by Berle and Means (1933) through
their analysis of the relationship between ownership and control in the corporation. They
suggest that “stockholders have traded their legal position of private ownership for the role of
recipient of capital returns” (Berle, Means 1997, 1991, p.9). Several studies built on the idea
introduced by Berle and Means, deriving various models that address the sales or growth
maximizing ambitions pursued by managers at the expense of their shareholders (Mueller 1969;
Marris 1964; Williamson 1963). This is due to the fact that management compensation is often
positively connected to the amount of assets under their control, thus leading them to pursue an
increase in assets rather than in profits (Seth et al. 2002, p.926). While all managerial theories
share the same goal in that they intend to maximize the managers’ welfare, they are limited by
constraints put on them by the capital market (Trautwein 1990, p.287). Marris’ model
introduces the concept of sustainable growth as the goal for managers (Marris 1964, p.40-41).
Williamson, on the other hand introduced the idea of managers’ expense preferences, which
were modeled as a variable containing factors such as excess staff or company cars (Trautwein
1990, p.288; Williamson 1963, p.40). Mueller argued that managers “maximize, or at least
pursue as one of their goals, the growth in physical size of their corporation rather than its
profits or stockholder welfare” (Mueller 1969, p.644).
The second concept that has been treated at length by existing literature is the pursuit of
risk reduction by managers. Amihud and Lev (1981) addressed the idea of managers reducing
their employment risk through conglomerate mergers. Such employment risk is closely related
to the firm’s risk, since management compensation is based on, e.g. profit-sharing agreements,
bonuses and the value of stock options (Amihud, Lev 1981, p.606). Since human capital is not
tradable managers cannot diversify their employment risk, which is why they engage in
21
conglomerate mergers in order to stabilize the corporation’s income streams and thus the basis
upon which their compensation is computed (Amihud, Lev 1981, p.606). As argued before,
domestic diversification attempts do not create shareholder value, since the arising
diversification benefits can be replicated by the shareholders themselves. Assuming that
international capital markets are not segmented but integrated, the benefit from cross-border
M&A in terms of reduction in return variability also ceases to exist (Seth et al. 2002, p.926).
Managers may still, however, seek to smooth the earnings streams of their corporation given
low earnings correlation in different countries. Consequently, they may engage in foreign
acquisitions as vehicles for risk reduction and in the absence of control mechanisms, they may
overpay for these transactions (Seth et al. 2002, p.926). This study will test the managerialism
hypothesis empirically in the context of cross-border M&A in the consumer goods industry
II.3.3 Hubris Hypothesis as Rationale for Mergers and Acquisitions
The hubris hypothesis as presented by Roll (1986) indicates that a large part of the price
increase in target firms may represent a simple transfer of wealth from the bidding firm. That
is, the observed takeover premium overstates the increase in economic value of the corporate
combination (Roll 1986, p.198). If no potential synergies exist, but some bidding firms think
there are, this hypothesis argues that the valuation of the target itself can be considered a random
variable with the target firm’s current market price as mean (Roll 1986, p.199). When this
variable exceeds the mean, an offer is made, whereas outcomes in the left tail of the distribution
are never observed, i.e. the distribution is truncated to the left (Roll 1986, p.199). Thus, the
takeover premium simply represents a random error made by the bidding firm and the observed
error is always in the same direction (Roll 1986, p.199). In case there do exist some gains for
certain corporate combinations, at least part of the observed takeover premium may still be
prone to valuation error and hubris (Roll 1986, p.200).
Previous research has found evidence for the hubris hypothesis. Their findings can be
summarized as follows: Should any synergistic gains exist in a transaction, a manager acting in
the best interest of his shareholders will pursue such an opportunity. Despite the fact that these
synergies may be positive, due to a flawed calculation of the target’s value managers may
overpay in some transactions, resulting in value destruction for the bidding firm’s shareholders
(Roll 1986). This study will test the hubris hypothesis empirically in the context of cross-border
M&A.
22
III. Empirical Analysis and Predictions
III.1 Hypotheses
Synergy, hubris and managerialism, as outlined in the previous section, may all
represent valid motives for cross-border M&A. Their importance in the context of cross-border
acquisitions represents an empirical question. In order to answer this question, the average gains
to both target and acquirer and the total gains arising from the acquisition were computed.
Moreover, the proportion of acquisitions with positive total gains was computed (Bradley et al.
1988, p.14; Roll 1986, p.202; Seth et al. 2000, p.392). This paper will also test the relationships
between target and acquirer gains and between target and total gains. In a second step, following
Seth (2002), this study will test the overall total gains from an acquisition using a regression
with several different independent variables. The following section will outline the hypotheses
that will be tested empirically. The approach used by this study does consider the fact that all
three reasons (synergy, and hubris) may be present in the samples.
III.1.1 The Relationship between Target and Acquirer Gains to Total Gains
The synergy hypothesis proposes that acquisitions occur when the value of the
combined firms is larger than the value of the individual firms (Bradley et al. 1988, p.4). These
total gains are shared between the target and acquirer, where the former commonly receives a
larger proportion as there is competition in the bidding process for the target (Seth et al. 2002,
p.924). As the target is expected to extract more gains from the transaction than the acquirer, a
positive relationship between target gains and total gains is expected. Depending on the level
of competition in the market, acquirer gains may be close to zero. In such a case, the expected
relationship between target and acquirer gains will be also close to zero. One may also argue,
that the target will not be able to extract all of the synergistic gains associated with the
acquisition due to differences in bargaining power. In this case, the shareholders of the
acquiring firm will capture some gains as well (Seth et al. 2000, p.392). These predictions lead
to the following hypotheses concerning the synergy:
Hypothesis 1: The main driver for cross-border acquisitions is synergy. Due to this fact, the
following will be observed:
a) Positive total gains in acquisitions on average
b) Acquirers will receive, on average, non-negative gains
c) Targets will receive, on average, positive gains
d) There will be a higher proportion of positive total gains than expected by chance
23
e) Target and acquirer gains will show a non-negative relationship
f) Target and total gains will show a positive relationship.
As presented above, the hubris hypothesis argues that M&A transactions represent simply
a transfer of value from the acquirer to the target. This leads to the prediction that around the
time of announcement of a merger, (a) the combined value of the firm should remain the same,
(b) the value of the target should increase and (c) the value of the acquirer should decrease.
Since the hubris hypothesis indicates that acquisitions are a mere transfer of value, there should
be no correlation between total gain and gains to the target. Moreover, there should be a
negative relationship between gains to acquirer and gains to target (Seth et al. 2000, p.392).
These predictions lead to the following hypotheses concerning hubris:
Hypothesis 2: The main driver for cross-border acquisitions is hubris. Due to this fact, the
following will be observed:
a) Zero total gains in acquisitions on average
b) Acquirers will receive, on average, negative gains
c) Targets will receive, on average, positive gains
d) There will be a proportion of acquisitions with positive total gains, equal to that
expected by chance
e) There will be a negative relationship between target gains and acquirer gains
f) There will be no relationship between target gains and total gains
The managerialism hypothesis, as argued before suggests that bidder’s managers engage in
takeovers to enhance their own welfare at the expense of bidder’s shareholders (Berkovitch,
Narayanan 1993, p.350). In an acquisition, the bidder has identified the target as being the most
suitable to increase the acquirer’s welfare. Due to this fact, target shareholders have some
bargaining power over the bidder’s management, which is why positive gains to target
shareholders can be expected (Berkovitch, Narayanan 1993, p.350). Since the acquisition is
undertaken at the expense of acquirer shareholders, their wealth should decline. Moreover,
since there is some transfer of wealth from the combined entity to the acquirer management,
total gains in such an acquisition will be negative. As target shareholders will be able to extract
some value from the transaction due to their bargaining power, a positive relationship between
target gains and total value loss is expected. Furthermore, a positive relationship between loss
in welfare to acquirer shareholders and gains to target shareholders is expected (Seth et al. 2000,
p.393). These predictions, lead to the following hypotheses concerning managerialism:
24
Hypothesis 3: The main driver for cross-border acquisitions is managerialism. Due to this fact,
the following will be observed
a) Negative total gains in acquisitions on average
b) Acquirers will receive, on average, negative gains
c) Targets will receive, on average, positive gains
d) There will be a higher proportion of negative total gains than expected by chance
e) There will be a negative relationship between target gains and acquirer gains
f) There will be a negative relationship between target gains and total gains
The listed hypotheses as stated above are mutually exclusive as they identify separate ways
to test the three explanations (synergy, hubris, managerialism) for cross-border acquisitions in
the full sample. However, because some acquisitions may present evidence for more than one
of the explanations, it is possible that all three are present in the full dataset used in this study.
The hypotheses as stated make opposing predictions for some of the tests, which is why their
effects may cancel out (Seth et al. 2000, p.393). Therefore, this study assesses the effects of the
three explanations on the subsets of transactions with positive and negative total gains.
As discussed above, transactions that present characteristics of managerialism often show
negative total gains. Consequently, this hypothesis can be eliminated in the subset with positive
total gains and it remains to analyze the effects of synergy and hubris. This study supposes that
the synergy hypothesis is going to play a major explanatory role. It is, however, possible that at
the same time hubris is also present. As discussed above, both hypotheses predict positive total
gains on average to targets. If the synergy hypothesis represents a major explanatory factor,
then acquirer gains should also be positive on average. Should hubris be present, it will have
the effect of driving down these gains to acquirers. In order to establish to which extent one or
the other affects the gains to targets and acquirers in the subset of positive total gains several
tests will be applied to determine the relationship between target and acquirer gains. Within the
subset of positive total gains acquirer gains may be positive or negative and this study analyzes,
whether the relationship between target gains and acquirer gains is the same for the group of
transactions with positive and negative acquirer gains respectively (Seth et al. 2000, p.394). If
hubris is negligible, a positive relationship between the acquirer gains and the target gains
should be displayed and this effect should be observable for both groups of transactions, i.e.
with either positive or negative acquirer gains (Seth et al. 2000, p.394). If there is, on the other
hand, coexistence of synergy and hubris, a strong positive relationship between gains to
acquirers and targets for the group of transactions with positive acquirer gains is expected, as
25
suggested by the synergy hypothesis. In the group with negative acquirer gains, a strong
negative relationship between gains to targets and acquirers is expected, as suggested by the
hubris hypothesis (Seth et al. 2000, p.394). Moreover, a strong negative relationship between
these two subsets is expected. The above predictions lead to the following hypotheses:
Hypothesis 4: In the subset with positive total gains, synergy is the main motive for cross-border
acquisitions. Thus, one will observe:
a) Acquirers will receive, on average, positive total gains
b) Targets will receive, on average, positive total gains
c) A positive relationship between target and acquirer gains and there will be no difference
between this relationship for the group with positive acquirer gains relative to the group
with negative acquirer gains
Hypothesis 5: In the subset with positive total gains, synergy and hubris are the main motives
for cross-border acquisitions. Thus, one will observe:
a) Acquirers will receive, on average, positive total gains
b) Targets will receive, on average, positive total gains
c) A positive relationship between target and acquirer gains for the group with positive
acquirer gains and a negative relationship for the group with negative acquirer gains.
A similar assessment of the subset with negative total gains must be undertaken. For
acquisitions with negative total gains one can assume that the synergy hypothesis is eliminated,
since it predicts positive gains to both target and acquirer shareholders. This leaves hubris and
managerialism as possible explanations for the observed returns. Both predict for this subset
that acquirers will receive negative gains and targets will receive positive gains. Moreover, a
negative relationship between target and acquirer gains is predicted (Seth et al. 2000, p.395). In
order to examine whether managerialism or hubris dominates the subset, the relationship
between target gains and total gains is assessed. If managerialism is the dominant explanation,
there will be a negative relationship between target and total gains. As discussed above,
managerialism suggests that targets will receive some of the gains extracted by the firm’s
managers from their shareholders, by virtue of their bargaining power in the transaction (Seth
et al. 2000, p.395). According to the hubris explanation, however, such a relationship does not
exist. These predictions lead to the following hypotheses:
26
Hypothesis 6: In the sub-sample with negative total gains hubris is the main motive for cross-
border acquisitions. Thus, one will observe:
a) Acquirers will receive, on average, negative gains
b) Targets will receive, on average, positive gains
c) No relationship between target and acquirer gains
Hypothesis 7: In the sub-sample with negative total gains, Managerialism is the main motive
for cross-border acquisitions.
a) Acquirers will receive, on average, negative gains
b) Targets will receive, on average, positive gains
c) A negative relationship between target and acquirer gains
As mentioned above, the second part of this study aims to provide an empirical evaluation
of the total gains associated with the transaction in the data sample using a regression with
various independent variables.
III.1.2 The Explanation of Total Gains through a Linear Regression
Referring to section II.3.1, various sources of value may coexist in synergistic acquisitions.
In the above section, four different possibilities for value creation have been identified: (a) asset
sharing, (b) reverse internalization, (c) market seeking and (d) financial diversification (Seth et
al. 2002, p.925). If these concepts can provide an explanation for value creation in the dataset,
one can predict a positive relationship between variables that act as proxies for the above
possibilities and total gains. Thus, we can formulate the following hypothesis.
Hypothesis 8: Transactions in which synergies, i.e. positive total gains can be observed, a
positive relationship will be observable between:
a) Value creation and asset sharing
b) Value creation and reverse internalization
c) Value creation and market seeking
d) Value creation and financial diversification
Referring to section II.3.2 this study will examine if one or both of the agency problems
described above is associated with value loss in transactions with negative total gains i.e.
transactions that can be considered managerialist. Assuming that both empire building and risk
reduction correspond to value destruction, a negative relationship is predicted between the
variables that act as their proxies and total gains. In turn, a positive relationship between those

27
proxies and acquirer losses is expected (Seth et al. 2002, p.927). According to these predictions
the following hypotheses can be formulated:
Hypothesis 9: For transactions which can be characterized as managerialist, i.e. which feature
negative total gains, a positive relationship will be observable between:
a) Value destruction and empire building
b) Value destruction and risk reduction
Hypothesis 10: For transactions which can be characterized as managerialist, i.e. which
feature negative total gains, a positive relationship will be observable between:
a) Bidder losses and empire building
b) Bidder losses and risk reduction
28
IV. Methodology
This chapter will discuss the methodological approach used in the study as well as its
reliability and validity.
IV.1 Sample and Data
If the results of a research paper are to be reliable, the data used to conduct the study
has to be chosen in a way that the reader of the study is able to replicate the results achieved by
a research paper. Consequently, reliability is defined by Stenbacka (2001) as: “a measurement
method’s ability to produce the same research result over and over again” (Stenbacka 2001,
p.552). The following section will elaborate on the data used for this study, to infer its
reliability.
The sample of M&A transaction for this study was obtained from the mergermarket
database. In order to check the reliability of the data from this source, the deal information was
double-checked with respective press releases. Since mergermarket did not provide the
information on the number of bidders involved in the M&A process, this information had to be
sourced manually from press and news reports. For some of the transactions, this data was rather
difficult to obtain, and since the data research was done manually, certain mistakes may have
occurred over the data sourcing process.
The stock price data of the companies involved in the transactions was obtained from
Bloomberg., which is considered to be a reliable data base, as it is widely used in practice and
research. This data base was used, since it contains stock price data from delisted companies –
an important feature, as in M&A deals the target company’s shares are often removed from the
stock market post-merger. The stock price data used was adjusted by Bloomberg for potential
stock splits and dividends in order to represent the most reliable information.
All other data used for the calculation of the variables in the regression was also
obtained from Bloomberg in order to ensure consistency in data base usage across all
parameters. Furthermore, all statistical calculations were computed using the software SPSS
and should thus provide accurate results.
Another crucial factor one has to consider when conducting empirical research is the
external and internal validity of results. Internal validity considers the question whether the
conclusions derived from an experiment truly imply cause (Cooper, Schindler 2014, p.201).
External validity, on the other hand, considers the question whether the conclusions derived
from an experiment can be generalized (Cooper, Schindler 2014, p.201).
29
The research approach used by this study measures if the announcement of a deal is
value creating for both target and acquirer shareholders. To answer this question, several factors
have to be considered. Firstly, is it possible to measure the effects of such an announcement
through share price development? Should this be the case, one requires a model to estimate the
expected stock prices, had the event not taken place. The approaches used by existing literature
are numerous concerning both the applied event windows, as well as the models used for
calculating the normal, or expected, return. The methods used in this study are in line with past
research and can thus be considered to be valid (Seth et al. 2002; Seth et al. 2000).
Regression analysis is used in this study to establish a causal relationship between firm-
specific variables and share price performance of both the target and the acquirer. The variables
used in this paper are in line with past research and thus validity can be assumed (Seth et al.
2000; Seth et al. 2002).
The external validity, as mentioned above, considers the question if one can generalize
the results generated by this study. Since the results found by existing literature are numerous
and often vastly different, one cannot make a clear statement about the validity of this study’s
results. Their external validity will be only known in the future.
IV.2 Event Study Methodology
Event studies have been used to establish shareholder wealth creation for various
corporate events including M&A. The first research on this topic was conducted by James
Dolley in 1933, who assessed share price effects in split-ups (Dolley 1933). His early efforts
provide evidence that event studies have been of interest to the world of finance for almost
eighty years. This research paper will follow the approach used by MacKinley (1997), who
separates the process of conducting such a study into three distinct steps (MacKinlay 1997, p.
14).
Event Definition
The first step in measuring the value creating effect of M&A for target and acquirer
shareholders through the event study methodology is to define the event itself. This study will
use the approach outlined by Warner (1985), defining the event date as the day of the
announcement of the merger (Brown, Warner 1985, p. 6).
In the next step, one has to define an event window in which to assess the effects of the
event on the share prices of both target and acquirer. As mentioned above, we will assume for
this study that the markets are in the semi-strong form according to Fama (1969) where “current
30
prices “fully reflect” all obviously publicly available information ” (Fama 1969, p.404). From
this rationality of markets we can infer that “the effect of an event will be reflected immediately
in asset prices” (MacKinlay 1997, p.149).
Concerning the length of the event window, one can find hardly any consensus in
existing literature. They range for example from three days [-1;+1] (Sudarsanam, Mahate*
2003, p.308) to eighty-one days [-40;+40] (Weston et al. 2001, p.171), where the announcement
date is 0. So far, not many studies have been conducted on value creation in cross-border M&A
transactions. Due to this fact, this paper will follow to a certain extent Seth et. al. (2002), who
used a twenty-day event window for their event studies. The event studies used for this study
expanded this window to, where possible, forty-one days, i.e. [-20;+20]. Such a large event
window, however, introduces a certain amount of noise into the model. Some research suggests
that the statistically most reliable results come from short-term event windows, such as three
days (Andrade et al. 2001, p.109). However, since the results of this event study will be used
later for the calculation of total gains to target and acquirer shareholders, a prolonged event
window is more likely to gather any and all value creating or destroying impacts from the
respective M&A transaction and is thus considered to be more applicable.
Selection Criteria
After identifying the event date for the study, it is now necessary to determine the
selection criteria for the inclusion of a given firm in the study (MacKinlay 1997, p.151). As
mentioned above this study uses information from the data base mergermarket. The
announcements that were studied include transactions that were subject to the following
restricting criteria:
The sample includes data from 01/01/2009 to 31/12/2016
Both target and acquirer companies had to be listed on an exchange at the time of the
transactions and stock price data has to be available through the databases that were at
disposal.
The target company is based in North America.
The acquiring company may not be from the same country as the target.
Both target and acquirer belong to the consumer goods industry
The acquirer has to purchase a controlling stake in the company, i.e. own less than 50%
pre-transaction and more than 50% post-transaction.
31
The dates were chosen to show recent developments in the consumer goods industry over a
short time frame. As this study’s aim is to assess the value creation effect in the context of
North-America-bound M&A, the target company had to be headquartered in North America.
Moreover, since this paper assesses the overall value creation in M&A transactions both target
and acquirer have to be publicly listed at the time of the acquisitions (Seth et al. 2002, p.930).
As some of the companies studied are not publicly listed anymore due to delisting procedures
after the closing of the merger, it was crucial to the reliability of the study to obtain this data.
Due to the very comprehensive nature of Bloomberg’s data offering, the necessary data was
easily found. In order to limit the sample to control transaction, the 50% criterion was adopted
(Seth et al. 2002, p.928). These criteria result in a sample of a total of 24 transactions, 18 of
which showed positive total gains and the remainder of which featured negative total gains.
Normal and abnormal returns
In order to evaluate the impact of the event, we have to define a measure for the
abnormal return. The abnormal return can be defined as ”the actual ex-post return of the security
over the event window minus the normal return of the firm over the event window” (MacKinlay
1997, p.151). Thus, we first need to establish a measure for the normal return for the shares of
both acquirer and target company.
To establish the normal return, one first has to calculate the actual return on the stock
for the time period considered in the study. The following equation was used:
,,
,1 (1)
, is the actual return on security i today. Accordingly, , represents the last price of
security i at time t=1, and , represents the last price of security I at time t=0. For this
calculation, last price data from Bloomberg was used instead of average bid/ask price of the
respective security. This may raise issues, since the last price is quoted as either the bid or the
ask price. According to Blume (1983), this may result in an upwards bias of recorded closing
prices, especially in smaller firms (Blume, Stambaugh 1983, p.388). Since all transactions
included in the data sample represent M&A from larger companies, however, this effect should
not compromise the calculation of the abnormal return.
The second step involved in calculating the abnormal return of a security, is the
computation of the normal return, which can be defined as “(…) the return that would be
expected if the event did not take place” (MacKinlay 1997, p.151). According to Weston et al.
32
(2001) there are basically three models of calculating the normal return: (1) The mean-adjusted
return model; (2) The market model; (3) The market adjusted return model (Weston et al. 2001,
p.171).
In the mean adjusted return model, a so-called clean period is chosen for which the
average daily return is calculated. This period is always before, after or before and after the
event period, but never during the event period (Weston et al. 2001, p.171).
The market adjusted return model simply assumes that the predicted or normal return
during the event period is equal to the return of the chosen market index (Weston et al. 2001,
p. 172).
Lastly, the market model is a statistical method and is estimated by performing a
regression for the days in the period considered (Weston et al. 2001, p.172). One of the
advantages of the market model over the market adjusted return and mean adjusted return model
is that it reduces the variance in the abnormal return by removing the portion of return that is
related to variation (MacKinlay 1997, p.155). Previous research suggests nonetheless that all
models yield similar results (Brown, Warner 1985, p.25; Weston et al. 2001, p.171). Due to this
fact, this paper will use the market model methodology to compute abnormal returns, since it
provides some benefits over the market adjusted and mean adjusted return models.
, ∗ , , (2)
The above formula was used for the computation of the expected return , for security
i. In this equation, , represents the return of the market portfolio at time t, and and
represent the parameters of the model. The parameter , describes the zero mean disturbance
term (MacKinlay 1997, p.155).
As described above, the abnormal return represents the ex post return of a security less
the expected return if the announcement had never happened. This results in the following
computation:
, , , , ∗ , (3)
In this equation , , , and , represent the abnormal return, the actual return and
the return of the market portfolio of security i at time t. The coefficients and are the
regression estimates for the estimation period before the announcement date.
33
Estimation Procedure
To calculate the normal return, a choice has to be made concerning the index and the
estimation period, i.e. how many days of return data will be considered. As far as the index is
concerned, this paper chose the MSCI WORLD/CONSUMER Index. This selection was made
since all companies involved in the dataset belong to the consumer goods industry but are listed
on different exchanges. The MSCI WORLD/CONSUMER Index captures all firms in the
dataset and thus allows to reduce variation in the data sample.
For the estimation of the market mode,l one needs to use historical data for the pre-event
window. There is no consensus among scholars concerning both the estimation period and the
frequency at which the returns are measured. Some research suggests that the parameter
estimates improve when one increases the number of returns measured (Merton 1980, p.354).
Others suggest that the opposite is the case and that due to, for example, microstructure noise
the values of the parameters may be distorted (Ryu 2011, p.1). Scholes and Williams (1977)
argue that, because the closing prices that are reported typically present trades prior to the actual
close of the trading day, returns measured tend to deviate from true returns. The resulting non-
synchronization in returns for different securities introduces into the market model an
econometric problem of errors in variables (Scholes, Williams 1977, p.324). They argue that
this problem is especially severe with daily returns and thus advise to use monthly or weekly
data. According to Brown and Warner (1985), however, even when biases in β exist, they do
not necessarily imply misspecification in an event study (Brown, Warner 1985, p.16). They
argue that by construction the OLS residuals for a security sum up to zero in the period
considered, which consequently eliminates any bias in β through a bias in α (Brown, Warner
1985, p.16).
The author believes Brown and Warner’s (1985) assessment to be correct. Due to data
availability issues for some transaction different time frames had to be chosen. For most
transactions, however, a total of 205 days was chosen in the window [-225;-20].
Testing Procedure
As mentioned above, the results of the event study were used to calculate the total gain
(%TOTGAIN) associated with the announcement to acquire a target company (Seth et al. 2000,
p.396). In order to do so, the cumulative abnormal returns (CARs) for each security are
calculated over the event window [ ; . This will be done using the following formula:

34
; ∑ (4)
To arrive at the variable %TOTGAIN, one further calculates the value for PREVAL,
which is equal to the value of the target firm on day -21 (Seth et al. 2000, p.396).
∗ ∗ ∗ (5)
, , and represent respectively the shares outstanding and stock prices
for the securities from company i and j. The value for PREVAL is used to show the relative
gain to both target and acquirer shareholders through the cumulative abnormal return around
the announcement date.
%∗∑ ∗ ∗ ∗∑
∗ ∗ ∗ (6)
In the above equation, k represents the portion of target shares acquired and e represents
the exchange rate from currency of the country of origin of the acquirer to the US Dollar.
∑ and ∑ display the cumulative abnormal returns for the target and acquirer
respectively (Seth et al. 2000, p.396).
These percentage values enable the computation statistical tests in order to make a
significant statement about the population as a whole. They, however, do not allow us to infer
any relationship between acquirer and target gains or between gains to targets and the combined
firm. Previous research argues that there may be large size discrepancies, which interfere with
meaningful interpretation of the results (Seth et al. 2000; Berkovitch, Narayanan 1993, p.355).
Following the approach of Seth (2000), this paper will use dollar gains to assess these
relationships in detail. These dollar values can be obtained from the variable PREVAL, which
is already quoted in US Dollar and from the dividend of the %TOTGAIN equation, where the
first term represents the Dollar gains to the target and the second term the dollar gains to the
acquirer.
In a first test, this paper will test the statistical significance of the percentage total gains
(%TOTGAIN). To do so, one has to formulate a null and alternative hypothesis:
:% 0 (7)
:% 0 (8)

35
These hypotheses will be tested using a t-test. This type of test requires the estimation
of variance in the sample used for the study. Previous research (Brown, Warner 1980, p.249;
Patell 1976, p.273) has used pre-event return data to estimate the variance. By doing so,
however, one implicitly assumes that there are no mean nor variance effects in the sample. In
the dataset that this study assesses, it is reasonable to believe that the announcement of an
acquisition itself has an impact on the variance of the security returns. This paper will only test
for the mean effect, which when using the traditional approach might lead us to reject the null
hypothesis in too many cases. In order to circumvent this problem, the computation cannot rely
on pre-announcement returns. Previous research suggests a cross-sectional approach, where a
cross section of abnormal returns is used to form an estimator of the variance (MacKinlay 1997,
p.167; Boehmer 1991, p.259).
% , ∗ ∑ % , % , (9)
Furthermore, one has to make an assumption of uncorrelated abnormal returns for the
estimator to be consistent (Ekholm, Svensson 2009, p.38). Previous research has established
that if the event date is not the same for every company, then this assumption holds (Brown,
Warner 1985, p.15-16). As this is also the case for this study’s dataset, we can arrive at the
following formula for the t-statistic:
% ,
% , (10)
Following Seth (2000), this paper also tests the statistical significance of the number of
acquisitions with positive total gains. To do so, a binomial test was applied evaluating the
following hypotheses:
: 0.5 (11)
: 0.5 (12)
This test will allow us to establish if the probability to observe positive total gains is
smaller than 50%. In order to conduct this test, the following formula is used:
∗ ∗
Here n represents the number of total observations and x represents the number of
transactions with positive total gains. is the combination of n over x observations. The
parameters p and q represent the probabilities of observing and not observing positive total
gains respectively.

36
IV.3 Regressions
The following section will outline the methodology for the regressions performed on
the dataset to evaluate the relationship between target and acquirer gains to establish if the total
gains associated with the announcement of the transaction can be explained through some
independent firm-specific variables.
IV.3.1 Regression Model for the Relationship between Target and Acquirer Gains
As pointed out above, the variable %TOTGAIN allows us to make statistical
examinations concerning the mean level of gains to targets, acquirers and the combined entity.
(Seth et al. 2000, p.396). Alternatively, however, one can use the dollar gains to the acquirer
and target, which will allow an assessment of their relationship using a regression.
In order to assess the relationship between target gains and acquirer gains in the sample,
for all transactions during the event window ( , ) the following regression was used (Seth et
al. 2000, p.398).:
, ∗ (13)
In this equation and both represent the statistical parameter output of the regression
performed on the dataset.
To test the coexistence of hubris and synergy hypothesis in the sample for positive total
gains, a similar approach was used with the addition of a dummy variable:
, ,
Following Seth (2000), this dummy variable allows the slope of the group of firms
showing positive acquirer gains to differ from the slope for the group of firms that show
negative acquirer gains (Seth et al. 2000, p.400). This permits us to test for the coexistence of
synergy and hubris in the data sample (Seth et al. 2000, p.400).
, ∗ ∗ (14)
In this equation, represents the relationship between target gains and acquirer
gains for the negative acquirer group of firms and shows whether the slopes for the two
groups are different (Seth et al. 2000, p.400).

37
IV.3.2 Explanation of Variables
Dependent Variable
In this study’s regression, the dependent variables are %TOTGAIN and CARBID
(representing total gains and bidder gains respectively). The regression used in this study
follows the outline of Seth (2002) and will use the %TOTGAIN and CARBID for the event
period , .
Explanatory Variables
The first variable introduced to the regression is INTANG and will be used to test the
reverse internalization hypothesis. It is expected to display the extent to which intangible assets
in the target firm are of value to the combined entity (Seth et al. 2002, p.930)
,
(15)
It is expected that this variable will have a positive relationship with both total gains as
well as bidder gains in the positive total gains subset.
As argued by Seth (1990), economies of scale and scope may be exploited through
related acquisitions to create value for the combined entity and thus its shareholders (Seth 1990,
p.101-104). Following Seth (2002) this study captured the above effect through the proxy of
the relative size of the target to the acquirer (Seth et al. 2002, p.930).
(16)
The sales data used for the calculation of this variable are as reported for the previous
financial year for the respective firm. For the subset of positive total gains, a positive
relationship between total gains and RELSIZE is expected, since transferring valuable
intangible assets predicts such a positive association.
An argument for engaging in cross-border acquisitions lies in the market seeking motive
of acquiring firms that wish to purchase companies from countries with faster growing markets
than their own, which implies a higher growth potential (Seth et al. 2002, p.931). The proxy
GDPGROW will be used in order to model this market seeking motive. Firstly, one computes:
(17)

38
The indices N and C represent the origin of the country, where N represents either
Canada or the United States and C the home country of the acquirer. In a second step, one can
now calculate the variable GDPGROW:
, , (18)
If the growth rate in the home country of the acquirer is larger than in the United States
or Canada, RELGDP will be smaller than one. In this case, market seeking as explained above
is not relevant in explaining total gains (Seth et al. 2002, p.931). On the other hand, should the
RELGDP will be larger than one, this implies that the United States’ or Canada’s growth rate
is higher than that of the home country of the acquirer. Subsequently, market seeking may be a
source of value creation (Seth et al. 2002, p.931). For the subset with positive total gains, a
positive association is expected between GDPGROW and total gains due to the growth
argument described above. In the subset for negative total gains it is expected that there will be
a negative relationship between GDPGROW and total gains since managers may seek growth
at the expense of profits and thus shareholder wealth (Seth et al. 2002, p.931).
Another motive for engaging in cross-border M&A is the financial diversification
benefit that is represented by such a transaction. This diversification benefit arises from the
imperfect correlation of the returns of the two companies in the different markets, assuming
that financial markets are not integrated (Seth et al. 2002, p.931; Gubbi et al. 2010, p.408). The
proxy used in the regression for this advantage was named REDVAR and was computed under
the following assumptions:
and represent the sample standard deviation of target and acquirer returns
respectively
and represent the weight fractions of the securities measured as their respective
market capitalization in relation to the market value of equity of the combined entity
These assumptions lead to the following equation for the variance of the combined
entity in case of a merger.
∗ ∗ 2 ∗ ∗ ∗ ∗ ∗ (19)
Here, represents the correlation coefficient between the returns of the target and
acquirer. Should a merger not lead to any reduction in variance then will be equal to 1 (Seth
et al. 2002, p.931). This will result in the following equation:
39
∗ ∗ 2 ∗ ∗ ∗ ∗
Consequently, the diversification benefit arising from such a transaction will be the
difference between those two variance terms:
2 ∗ 1 ∗ ∗ ∗ ∗ (20)
A positive relationship between the absolute value of the variable REDVAR and total
gains is expected for the positive total gains sample. In this subset no relationship is expected
for bidder gains, since the potential sources of gains are relatively small to begin with (Seth et
al. 2002, p.931). Concerning the subset with negative gains, however, a different outcome is
predicted. As previously noted managers may not always act in the shareholders’ best interest.
Thus, they might seek out risk reduction without considering the effects on total shareholder
wealth. Should acquisitions be undertaken only for the virtue of reducing risk in returns, then
one should observe a negative relationship between the absolute value of the variable REDVAR
and total gains (Seth et al. 2002, p.931).
Another variable worth considering in the attempt to explain total gains is the
effectiveness of the market for corporate control. As Conn and Connell (1990) argue, “(…)
imperfections in the local capital market may allow a multinational acquiring firm to extract
monopsony returns” (Conn, Connell 1990, p.690). An example for such an event may be
described if a multinational firm’s bid for a local firm is well below the expected net benefits
of the merger and if no competing bids from local firms occur, then this may result in abnormal
returns to the acquirer (Conn, Connell 1990, p.690). This may be translated into a more general
idea, i.e. there may be incentives for cross-border mergers if agency costs vary systematically
across countries and foreign acquirers have specialized knowledge in reducing these agency
costs (Seth et al. 2002, p.932). This leads to the question of which governance is the most
effective, i.e. which system is the most effective in monitoring business activity. Previous
research suggests that there is indeed a large variety in the effectiveness of national governance
systems (Roe 1993, p.375). It does remain unclear, however, whether one system is superior to
the other in terms of value creation (Seth et al. 2002, p.932).
This study follows Seth (2002) and Kay and Silberston (1995) concerning the influence
of national governance systems on value creation through M&A transactions (Seth et al. 2002,
p.932). According to Seth (2002), one has to distinguish between three distinct groups of
governance systems, namely “market-systems”, s“bank-systems” and “group-systems”. In the
United States and the United Kingdom “corporate governance is a market process rather than a

40
political one” (Kay, Silberston 1995, p.92). In bank-systems, banks play a critical monitoring
role, whereas in group-systems ownership concentration is high and families or groups have
relatively high ownership stakes (Seth et al. 2002, p.932). According to these criteria, three
dummy variables were constructed:
(21)
(22)
(23)
The data sample this paper analyzes contains acquirers from twelve different countries.
The United States, the United Kingdom and Sweden belong to the group of market-systems.
Hongkong, Belgium, France, South Korea, Canada, South Africa and Mexico are considered to
belong to the group of group-systems. The Netherlands and Japan belong to the group of bank-
systems. As previously noted, one has to consider these variables with caution, as there is
controversy regarding the effectiveness of corporate governance systems (Seth et al. 2002,
p.933). This increases the difficulty in predicting the sign of the coefficient of the dummy
variables GOVGRP and GOVBANK and the subsequent effect on the omitted dependent
variable GOVMKT.
Lastly, a dummy variable is constructed in order to capture the effect of multiple bidders
in a transaction (MULBID). Especially, for the subset of acquisitions with negative gains, a
negative coefficient is expected (Seth et al. 2002, p.932).
IV.3.3 Regression Model
This study tests the above mentioned explanatory variables for both %TOTGAIN and
the gains to acquirers CARBID using the approach outlined by Seth (2002), with the following
regressions (Seth et al. 2002, p.929).
% ∗ ∗ ∗ ∗
∗ ∗ ∗
∗ ∗ ∗ ∗
∗ ∗ ∗
41
To estimate the parameters and of this model, the ordinary least squares method
will be used. To ensure that the basic assumptions of a linear regression are fulfilled, several
tests were employed.
Following Brooks (2008), the first assumption that needs to be tested is that the average
of the error terms is zero (Brooks 2008, p.131). “If a constant error term is included in the
regression equation, this assumption will never be violated” (Brooks 2008, p.131). Since this
study includes a constant intercept, this assumption is fulfilled.
The second assumption for the regression is that the variance of the error terms is
constant, which is otherwise known as the assumption of heteroscedasticity (Brooks 2008,
p.132). To test this assumption, this study used an abridged version of the White’s test. This
test looks for significant parameters by running the squared residuals from the initial model as
a function of the explanatory variables (Ekholm, Svensson 2009, p.42). Previous research
suggests, that if heteroscedasticity is found, the interference could point in the wrong direction
and the estimates resulting from the regression may not be the best estimators, i.e. they would
not be the best linear unbiased estimators, or “BLUE”. Brooks (2008) suggests another
approach called the generalized least squares test (Brooks 2008, p.132). This study will focus
on the White’s test because the heteroscedasticity-robust standard errors used in the test allow
to mitigate the above-mentioned effect (Brooks 2008, p.138).
Another assumption made by the OLS method is that explanatory variables are not
correlated (Brooks 2008, p.170). In practice, it is unlikely to achieve zero correlation between
the variables. If these correlations are small though, this multicollinearity will not affect the
results (Brooks 2008, p. 171). This study computed the variance of inflation factors for each
regression to determine if multicollinearity exists in the models.
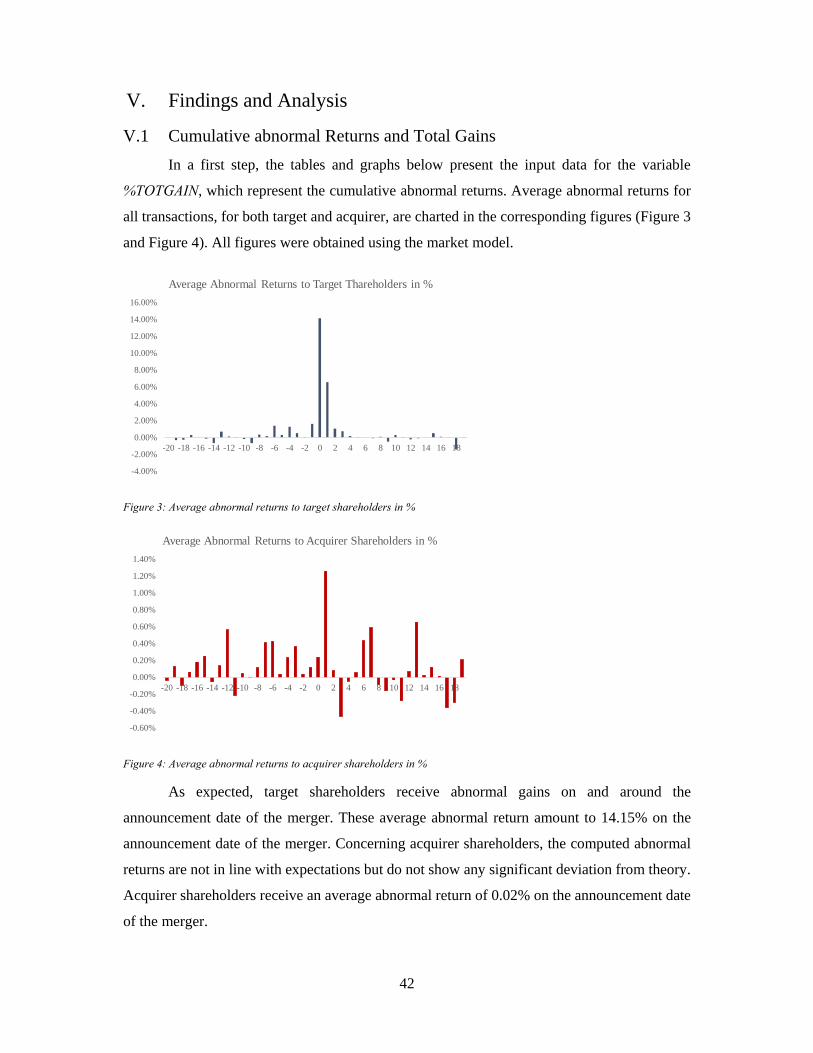
42
V. Findings and Analysis
V.1 Cumulative abnormal Returns and Total Gains
In a first step, the tables and graphs below present the input data for the variable
%TOTGAIN, which represent the cumulative abnormal returns. Average abnormal returns for
all transactions, for both target and acquirer, are charted in the corresponding figures (Figure 3
and Figure 4). All figures were obtained using the market model.
Figure 3: Average abnormal returns to target shareholders in %
Figure 4: Average abnormal returns to acquirer shareholders in %
As expected, target shareholders receive abnormal gains on and around the
announcement date of the merger. These average abnormal return amount to 14.15% on the
announcement date of the merger. Concerning acquirer shareholders, the computed abnormal
returns are not in line with expectations but do not show any significant deviation from theory.
Acquirer shareholders receive an average abnormal return of 0.02% on the announcement date
of the merger.
-4.00%
-2.00%
0.00%
2.00%
4.00%
6.00%
8.00%
10.00%
12.00%
14.00%
16.00%
-20 -18 -16 -14 -12 -10 -8 -6 -4 -2 0 2 4 6 8 10 12 14 16 18
Average Abnormal Returns to Target Thareholders in %
-0.60%
-0.40%
-0.20%
0.00%
0.20%
0.40%
0.60%
0.80%
1.00%
1.20%
1.40%
-20 -18 -16 -14 -12 -10 -8 -6 -4 -2 0 2 4 6 8 10 12 14 16 18
Average Abnormal Returns to Acquirer Shareholders in %

43
In a next step, cumulative abnormal returns were computed. A graphic representation
of these returns can be seen below in Figure 5.
Figure 5: Average cumulative abnormal returns
As can be seen above, cumulative abnormal returns of target shareholders far
outperform those of acquirer shareholders. This is in line with expectations since target
shareholders receive a control premium for tendering their shares in return for giving up control
of the company, which in turn increases, on average, target stock prices.
Lastly, the variable %TOTGAIN was computed for each transaction. On average the
total gains amount to 12.85%. To test the statistical significance of this result, the t-test was
conducted as described above. Furthermore, the binomial test was used to determine, if the
number of positive transactions is statistically significant.
From the results above, we can conclude that the average total gain is significant at the
one-percent-level, and thus we reject the null-hypothesis. Moreover, the number of acquisitions
with positive total gains is also statistically significant at the one-percent-level, which results in
-5.00%
0.00%
5.00%
10.00%
15.00%
20.00%
25.00%
30.00%
-20 -18 -16 -14 -12 -10 -8 -6 -4 -2 0 2 4 6 8 10 12 14 16 18
Average Cumulative Abnormal Returns
Target CAR Acquirer CAR
Table 3: T-test for %TOTGAIN for the fullsample
Table 4: Binomial test for number ofpositive gains transactions
Binomial test
#of acquisitions 24#of positive gains acquisitions 18#of negative gains acquisitions 6
probability to find positive gains 0.5
alpha 0.05p-value 1.13%
T-Test for Total Gains in Full Sample
Count 24Mean 12.85Std Dev 3.59
hyp mean 0alpha 0.01tails 1df 23t-stat 3.58p-value 0.08%t-crit 2.50
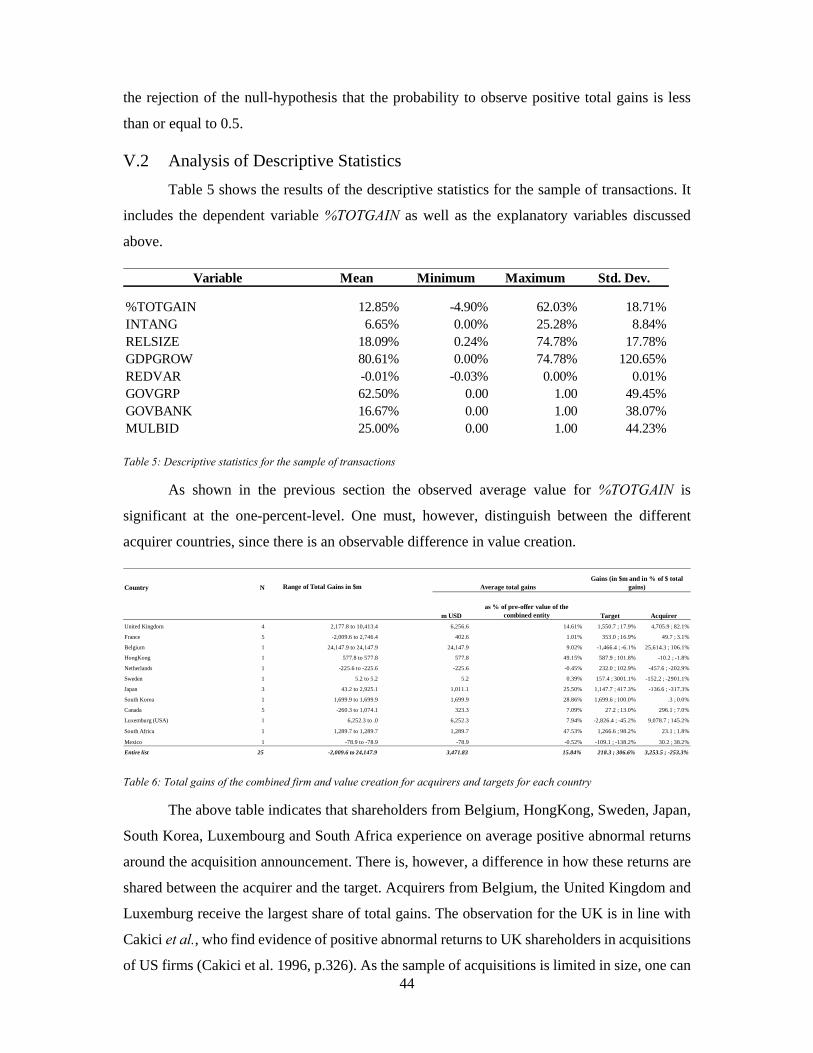
44
the rejection of the null-hypothesis that the probability to observe positive total gains is less
than or equal to 0.5.
V.2 Analysis of Descriptive Statistics
Table 5 shows the results of the descriptive statistics for the sample of transactions. It
includes the dependent variable %TOTGAIN as well as the explanatory variables discussed
above.
Table 5: Descriptive statistics for the sample of transactions
As shown in the previous section the observed average value for %TOTGAIN is
significant at the one-percent-level. One must, however, distinguish between the different
acquirer countries, since there is an observable difference in value creation.
Table 6: Total gains of the combined firm and value creation for acquirers and targets for each country
The above table indicates that shareholders from Belgium, HongKong, Sweden, Japan,
South Korea, Luxembourg and South Africa experience on average positive abnormal returns
around the acquisition announcement. There is, however, a difference in how these returns are
shared between the acquirer and the target. Acquirers from Belgium, the United Kingdom and
Luxemburg receive the largest share of total gains. The observation for the UK is in line with
Cakici et al., who find evidence of positive abnormal returns to UK shareholders in acquisitions
of US firms (Cakici et al. 1996, p.326). As the sample of acquisitions is limited in size, one can
Variable Mean Minimum Maximum Std. Dev.
%TOTGAIN 12.85% -4.90% 62.03% 18.71%INTANG 6.65% 0.00% 25.28% 8.84%RELSIZE 18.09% 0.24% 74.78% 17.78%GDPGROW 80.61% 0.00% 74.78% 120.65%REDVAR -0.01% -0.03% 0.00% 0.01%GOVGRP 62.50% 0.00 1.00 49.45%GOVBANK 16.67% 0.00 1.00 38.07%MULBID 25.00% 0.00 1.00 44.23%
Country N Range of Total Gains in $m
m USDas % of pre-offer value of the
combined entity Target Acquirer
United Kingdom 4 2,177.8 to 10,413.4 6,256.6 14.61% 1,550.7 ; 17.9% 4,705.9 ; 82.1%
France 5 -2,009.6 to 2,746.4 402.6 1.01% 353.0 ; 16.9% 49.7 ; 3.1%
Belgium 1 24,147.9 to 24,147.9 24,147.9 9.02% -1,466.4 ; -6.1% 25,614.3 ; 106.1%
HongKong 1 577.8 to 577.8 577.8 49.15% 587.9 ; 101.8% -10.2 ; -1.8%
Netherlands 1 -225.6 to -225.6 -225.6 -0.45% 232.0 ; 102.9% -457.6 ; -202.9%
Sweden 1 5.2 to 5.2 5.2 0.39% 157.4 ; 3001.1% -152.2 ; -2901.1%
Japan 3 43.2 to 2,925.1 1,011.1 25.50% 1,147.7 ; 417.3% -136.6 ; -317.3%
South Korea 1 1,699.9 to 1,699.9 1,699.9 28.86% 1,699.6 ; 100.0% .3 ; 0.0%
Canada 5 -260.3 to 1,074.1 323.3 7.09% 27.2 ; 13.0% 296.1 ; 7.0%
Luxemburg (USA) 1 6,252.3 to .0 6,252.3 7.94% -2,826.4 ; -45.2% 9,078.7 ; 145.2%
South Africa 1 1,289.7 to 1,289.7 1,289.7 47.53% 1,266.6 ; 98.2% 23.1 ; 1.8%
Mexico 1 -78.9 to -78.9 -78.9 -0.52% -109.1 ; -138.2% 30.2 ; 38.2%
Entire list 25 -2,009.6 to 24,147.9 3,471.83 15.84% 218.3 ; 306.6% 3,253.5 ; -253.3%
Gains (in $m and in % of $ total gains)Average total gains
45
only make a suggestive analysis and cannot conclude on the statistical significance of these
results. The most striking result is the transaction involving a Swedish acquirer. This result
suggests that the target and acquirer gains almost cancel out and may indicate a high degree of
bargaining power for the target since their return was unusually high. Similar characteristics
can be derived from the transactions involving Japanese and Dutch acquirers, since they also
present negative acquirer gains, although not to the same extent. The acquirers with positive
gains differ in one more aspect. Since their returns are positive the evidence suggests that they
have the ability to identify targets with a potential for value creation. While, however, acquirers
from the UK or Luxemburg seem to benefit from this capability, French, South African and
South Korean acquirers seem to transfer all gains to target shareholders.
V.3 Analysis of Hypotheses
The following section will cover the analysis of the empirical findings for the hypothesis
stated above. This analysis will be segmented into (1) the hypotheses concerning the
relationship between target and acquirer gains to total gains and (2) the regression model using
independent variables to explain the variables %TOTGAIN and CARBID.
V.3.1 Analysis of Hypotheses concerning the Relationship between Target and
Acquirer Gains to Total Gains
Hypotheses 1, 2 and 3 deal with the question whether the main motivation for cross-
border M&A in this data sample is synergy, hubris or managerialism. As evidenced above, this
study found statistically significant positive total gains and a statistically significant number of
transactions with positive total gains, i.e. the probability to observe positive total gains is larger
than 50%. This suggests that the main motive behind these transactions was likely the search
for synergies. Consequently, the evidence is in line with predictions 1a) and 1d), and since these
hypotheses are as mentioned above mutually exclusive, we can thus reject hypotheses 2a) and
2d) relating to hubris and hypotheses 3a) and 3d) relating to managerialism. The prediction
concerning acquirer gains, hypotheses 1b), could not be accepted with statistical significance,
which may be an indication for the occurrence of hubris and managerialism in the dataset. Since
there overall is a large variation in gains to acquirers, however, this study can only suggest the
reasons for these results and not provide any statistical evidence.

46
Table 7: T-test for %TOTGAIN for target gains
Table 7 shows that target gains are positive on average and significant at the ten percent
level. This observation is in line with the predictions from hypotheses 1c), 2c) and 3c). Acquirer
gains are negative on average, however, not at a statistically significant level.
In a next step this paper assessed descriptive statistics concerning the subsets of
transactions with positive and negative total gains. As discussed above 18 transactions with
positive total gains and 6 transactions with negative total gains were found. For the sub-sample
with positive total gains, similar results were achieved concerning the motive of synergy for
these transactions as was for the full sample.
For the sub-sample with positive total gains the evidence is consistent with the
predictions from hypothesis 4b) as the t-statistic is significant at the ten percent level. Since,
however, acquirer gains are on average negative for this sub-sample we cannot rule out
T-test for target gains in full sample
Count 24Mean 1.96Std Dev 1.22
hyp mean 0alpha 0.1tails 1df 23t-stat 1.60p-value 6.14%t-crit 1.32
Table 10: T-Test for acquirer gains (%TOTGAIN)in transactions with positive total gains
Table 9: T-Test for target gains (%TOTGAIN) in transactions with positive total gains
Table 8: T-test for %TOTGAIN for acquirer gains
T-test for acquirer gains in full sample
Count 24Mean -1.46Std Dev 1.20
hyp mean 0alpha 0.1tails 1df 23t-stat -1.21p-value 88.10%t-crit 1.32
T-test for target gains
Count 18Mean 264%Std Dev 158%
hyp mean 0alpha 0.1tails 1df 17.00t-stat 1.67p-value 0.06t-crit 1.33
T-test for acquirer gains
Count 18Mean -164%Std Dev 158%
hyp mean 0alpha 0.1tails 1df 17.00t-stat -1.04p-value 0.84t-crit 1.33

47
managerialism for this subset since hypotheses 6a) and 7a) predict on average negative gains to
acquirers. As hypothesis 5a) also predicts average positive gains to targets, hubris can also not
be ruled out. The variance and size of the sample, as argued above, do not allow for any
statistically significant claims concerning acquirer gains, but give room for suggestions that
hubris or managerialism may also be present.
For the subset with negative total gains the observations are in line with predictions 6a)
and 7a). However, for both the hubris and managerialism hypothesis, positive gains to targets
could not be observed and therefore hypotheses 6b) and 7b) could not be validated. Moreover,
due to the restricted sample size, the observed results could not be validated on a statistically
significant level, as can be seen in table 11 and 12.
In conclusion, this study provides statistically significant evidence that target
shareholders receive positive gains and that this relationship holds also for targets in positive
total gains transactions. For acquirers, on the other hand, the observations only indicate that
they achieve on average negative gains, but not on a statistically significant level.
In a second step, this study analyzed the relationship between target, acquirer and total
gains. As discussed in section IV.3.1, regressions were computed in order to determine an
answer to the above-stated goal. However, no statistically significant relationship could be
determined for all subsets, i.e. the full sample, the sample with positive total gains and the
sample with negative total gains. This study believes that due to the limited size of the data
sample, no noteworthy evidence could be achieved.
T-Test for target gains
Count 6Mean -9%Std Dev 39%
hyp mean 0alpha 0.1tails 1df 5.00t-stat -0.23p-value 0.59t-crit 1.48
Table 12: T-test for acquirer gains ( %TOTGAIN) in transactions with negative total gains
Table 11: T-test for target gains (%TOTGAIN) in transactions with negative total gains
T-Test for acquirer gains
Count 6Mean -91%Std Dev 39%
hyp mean 0alpha 0.05tails 1df 5.00t-stat -2.32p-value 0.97t-crit 2.02
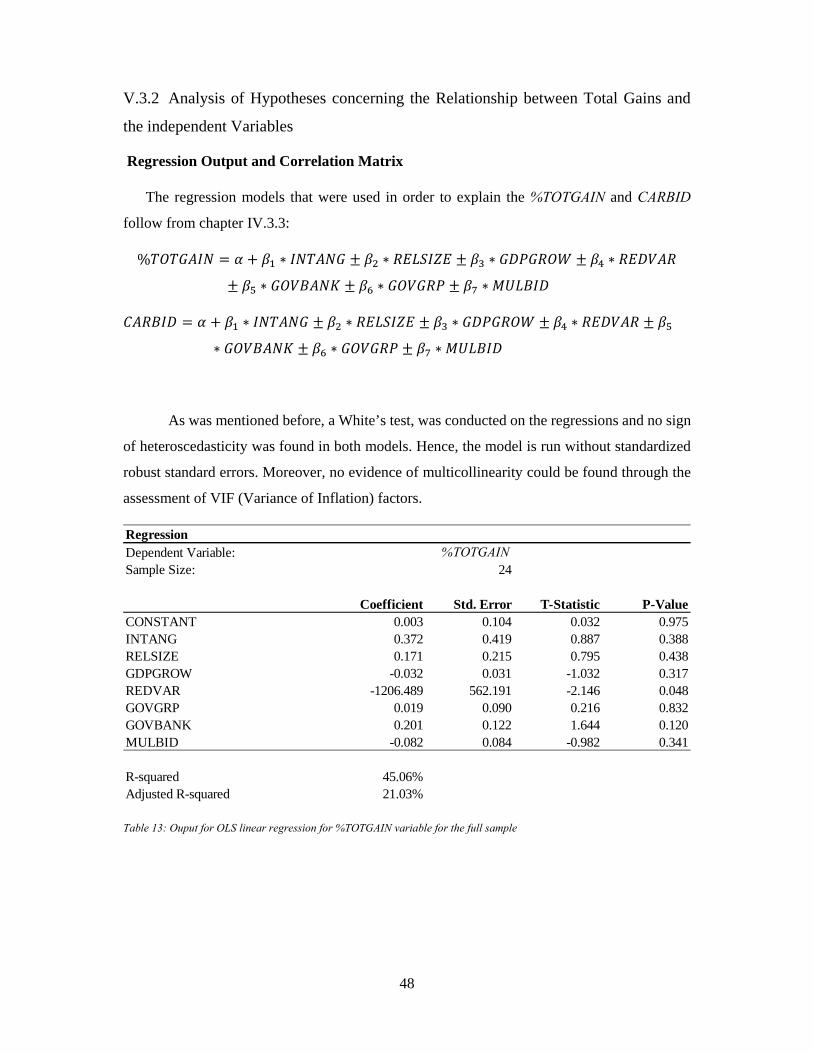
48
V.3.2 Analysis of Hypotheses concerning the Relationship between Total Gains and
the independent Variables
Regression Output and Correlation Matrix
The regression models that were used in order to explain the %TOTGAIN and CARBID
follow from chapter IV.3.3:
% ∗ ∗ ∗ ∗
∗ ∗ ∗
∗ ∗ ∗ ∗
∗ ∗ ∗
As was mentioned before, a White’s test, was conducted on the regressions and no sign
of heteroscedasticity was found in both models. Hence, the model is run without standardized
robust standard errors. Moreover, no evidence of multicollinearity could be found through the
assessment of VIF (Variance of Inflation) factors.
Table 13: Ouput for OLS linear regression for %TOTGAIN variable for the full sample
RegressionDependent Variable: %TOTGAINSample Size: 24
Coefficient Std. Error T-Statistic P-ValueCONSTANT 0.003 0.104 0.032 0.975INTANG 0.372 0.419 0.887 0.388RELSIZE 0.171 0.215 0.795 0.438GDPGROW -0.032 0.031 -1.032 0.317REDVAR -1206.489 562.191 -2.146 0.048GOVGRP 0.019 0.090 0.216 0.832GOVBANK 0.201 0.122 1.644 0.120MULBID -0.082 0.084 -0.982 0.341
R-squared 45.06%Adjusted R-squared 21.03%
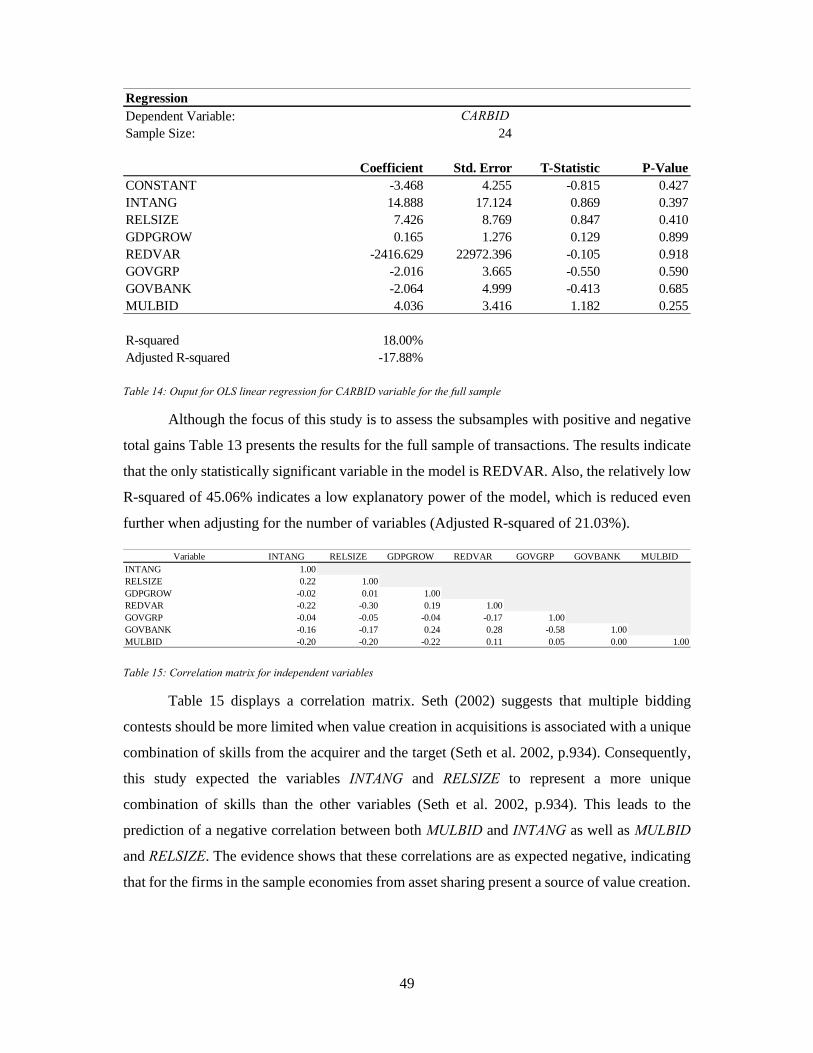
49
Table 14: Ouput for OLS linear regression for CARBID variable for the full sample
Although the focus of this study is to assess the subsamples with positive and negative
total gains Table 13 presents the results for the full sample of transactions. The results indicate
that the only statistically significant variable in the model is REDVAR. Also, the relatively low
R-squared of 45.06% indicates a low explanatory power of the model, which is reduced even
further when adjusting for the number of variables (Adjusted R-squared of 21.03%).
Table 15: Correlation matrix for independent variables
Table 15 displays a correlation matrix. Seth (2002) suggests that multiple bidding
contests should be more limited when value creation in acquisitions is associated with a unique
combination of skills from the acquirer and the target (Seth et al. 2002, p.934). Consequently,
this study expected the variables INTANG and RELSIZE to represent a more unique
combination of skills than the other variables (Seth et al. 2002, p.934). This leads to the
prediction of a negative correlation between both MULBID and INTANG as well as MULBID
and RELSIZE. The evidence shows that these correlations are as expected negative, indicating
that for the firms in the sample economies from asset sharing present a source of value creation.
RegressionDependent Variable: CARBIDSample Size: 24
Coefficient Std. Error T-Statistic P-ValueCONSTANT -3.468 4.255 -0.815 0.427INTANG 14.888 17.124 0.869 0.397RELSIZE 7.426 8.769 0.847 0.410GDPGROW 0.165 1.276 0.129 0.899REDVAR -2416.629 22972.396 -0.105 0.918GOVGRP -2.016 3.665 -0.550 0.590GOVBANK -2.064 4.999 -0.413 0.685MULBID 4.036 3.416 1.182 0.255
R-squared 18.00%Adjusted R-squared -17.88%
Variable INTANG RELSIZE GDPGROW REDVAR GOVGRP GOVBANK MULBIDINTANG 1.00RELSIZE 0.22 1.00GDPGROW -0.02 0.01 1.00REDVAR -0.22 -0.30 0.19 1.00GOVGRP -0.04 -0.05 -0.04 -0.17 1.00GOVBANK -0.16 -0.17 0.24 0.28 -0.58 1.00MULBID -0.20 -0.20 -0.22 0.11 0.05 0.00 1.00
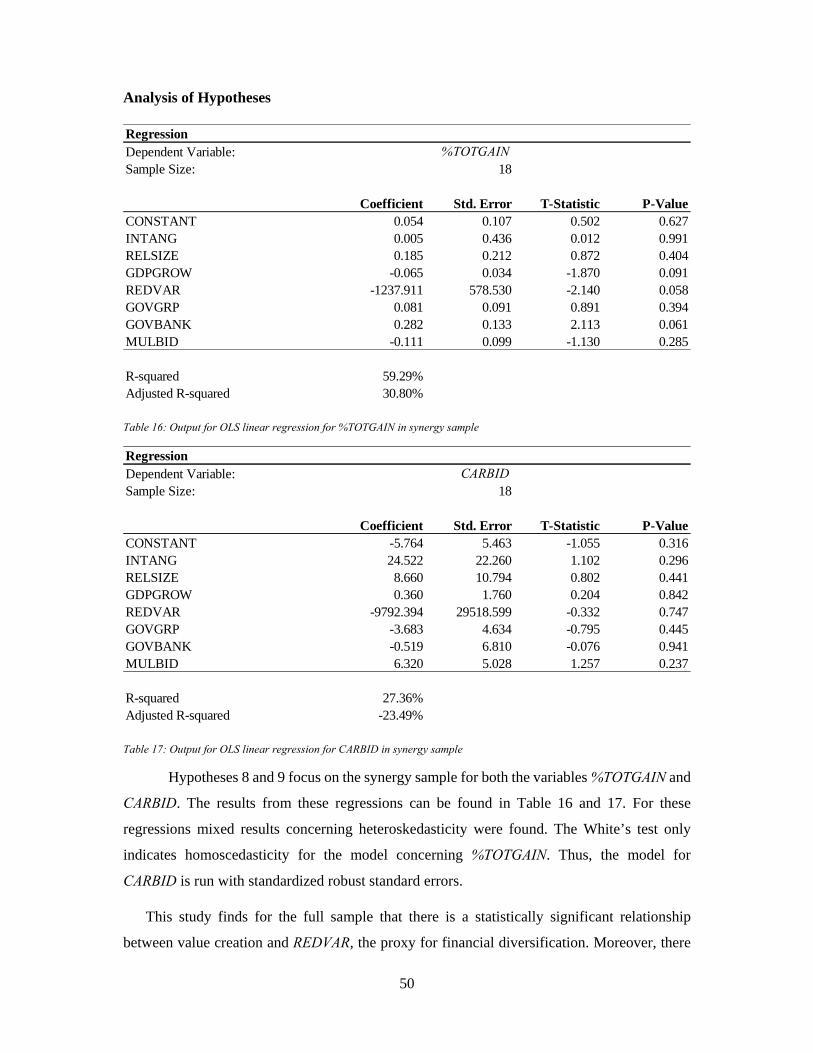
50
Analysis of Hypotheses
Table 16: Output for OLS linear regression for %TOTGAIN in synergy sample
Table 17: Output for OLS linear regression for CARBID in synergy sample
Hypotheses 8 and 9 focus on the synergy sample for both the variables %TOTGAIN and
CARBID. The results from these regressions can be found in Table 16 and 17. For these
regressions mixed results concerning heteroskedasticity were found. The White’s test only
indicates homoscedasticity for the model concerning %TOTGAIN. Thus, the model for
CARBID is run with standardized robust standard errors.
This study finds for the full sample that there is a statistically significant relationship
between value creation and REDVAR, the proxy for financial diversification. Moreover, there
RegressionDependent Variable: %TOTGAINSample Size: 18
Coefficient Std. Error T-Statistic P-ValueCONSTANT 0.054 0.107 0.502 0.627INTANG 0.005 0.436 0.012 0.991RELSIZE 0.185 0.212 0.872 0.404GDPGROW -0.065 0.034 -1.870 0.091REDVAR -1237.911 578.530 -2.140 0.058GOVGRP 0.081 0.091 0.891 0.394GOVBANK 0.282 0.133 2.113 0.061MULBID -0.111 0.099 -1.130 0.285
R-squared 59.29%Adjusted R-squared 30.80%
RegressionDependent Variable: CARBIDSample Size: 18
Coefficient Std. Error T-Statistic P-ValueCONSTANT -5.764 5.463 -1.055 0.316INTANG 24.522 22.260 1.102 0.296RELSIZE 8.660 10.794 0.802 0.441GDPGROW 0.360 1.760 0.204 0.842REDVAR -9792.394 29518.599 -0.332 0.747GOVGRP -3.683 4.634 -0.795 0.445GOVBANK -0.519 6.810 -0.076 0.941MULBID 6.320 5.028 1.257 0.237
R-squared 27.36%Adjusted R-squared -23.49%

51
is a significant relationship at the ten percent level for GDPGROW, indicating that market
seeking is indeed a source of value creation in cross-border transactions in the consumer goods
industry. This supports the fact outlined in the previous section, concerning growth
opportunities in the consumer goods industry. Regarding the variables for governance, this
study finds a significant relationship at the ten percent level for GOVBANK, indicating that
bank-oriented-systems contribute to value creation in such transactions. This observation is in
line with the results achieved by Thomsen and Pedersen (2000), who found that bank ownership
is associated with value creation for shareholders in their sample of European transactions
(Thomsen, Pedersen 2000, p.702-703).
Moreover, the regression indicates a negative relationship between INTANG, the proxy for
reverse internalization, and %TOTGAIN, which is however not statistically significant. A
positive relationship can be observed between RELSIZE and %TOTGAIN indicating that asset
sharing is a source of value creation in cross-border transactions in the consumer goods
industry. Thus, the evidence points toward a rejection of hypothesis 8a) but an acceptance of
hypothesis 8b).
The results concerning the benefit of financial diversification are in line with the evidence
provided by Kwok and Reeb (2000) and their “up-stream hypothesis”. They argued that the
business risk among countries influences the risk impacts of foreign direct investments.
Consequently, as firms invest in “up-stream” economies (or stable economies), they decrease
their risk, while “downstream” investments lead to an increase of said risk (Kwok, Reeb 2000,
p. 612). They show a negative association between internationalization of firms and risk for
non-US firms (Kwok, Reeb 2000, p.619).
While the regression results concerning bidder gains are not statistically significant, they
provide some indications. Following Seth (2002), this study anticipated a strong association
between RELSIZE and INTANG with CARBID as compared to the relationship between
GDPGROW and REDVAR with CARBID. The evidence indicates that there is a positive
relationship between INTANG and RELSIZE with CARBID. Consequently, the results, while
not significant, indicate that reverse internalization and asset sharing create value for acquirers
in cross-border transactions.
Summarizing the above, this study provides evidence for Hypotheses 8c) and 8d), whereas
8a) and 8b) could not be proven on a statistically significant level.

52
The sample of transaction with negative total gains is limited in size to the number of six.
Thus, a linear regression on such a small dataset does not provide any statistically significant
empirical results, which is why this study cannot make any statement regarding Hypotheses
9a), 9b), 10a) and 10b).
Table 18 provides a summary of all results from the hypotheses analyzed in this study.
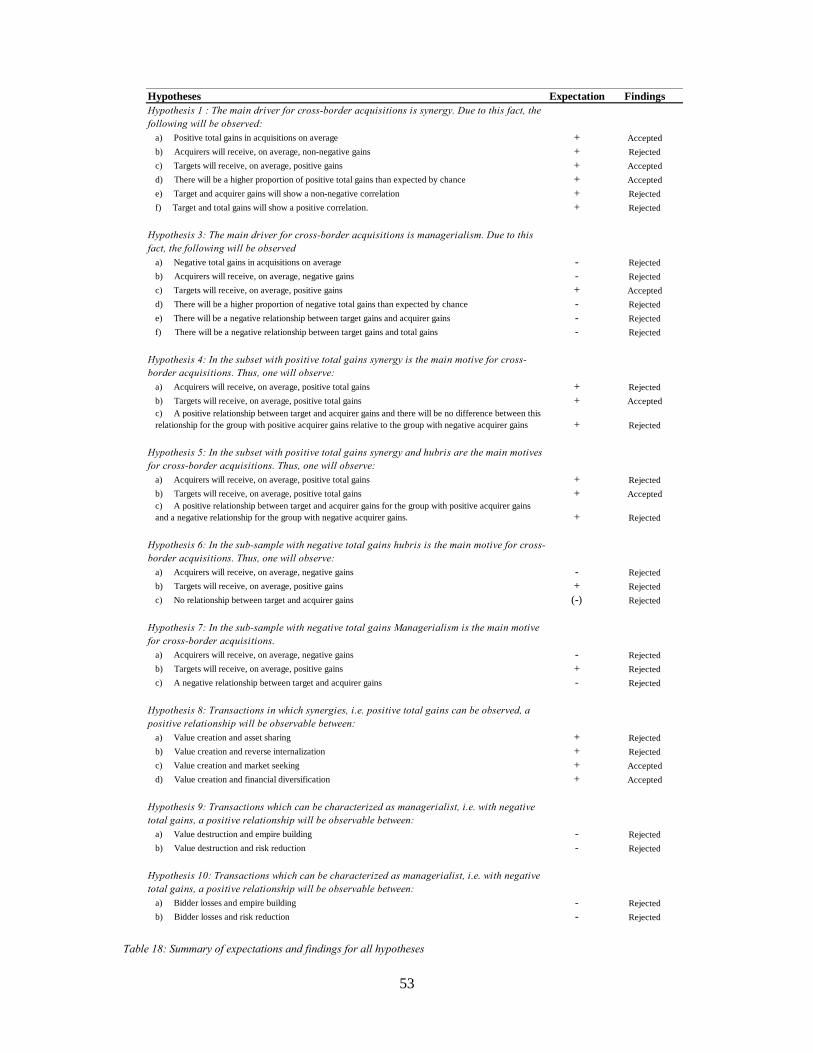
53
Table 18: Summary of expectations and findings for all hypotheses
Hypotheses Expectation FindingsHypothesis 1 : The main driver for cross-border acquisitions is synergy. Due to this fact, the following will be observed:
a) Positive total gains in acquisitions on average + Accepted
b) Acquirers will receive, on average, non-negative gains + Rejected
c) Targets will receive, on average, positive gains + Accepted
d) There will be a higher proportion of positive total gains than expected by chance + Accepted
e) Target and acquirer gains will show a non-negative correlation + Rejected
f) Target and total gains will show a positive correlation. + Rejected
Hypothesis 3: The main driver for cross-border acquisitions is managerialism. Due to this fact, the following will be observed
a) Negative total gains in acquisitions on average - Rejected
b) Acquirers will receive, on average, negative gains - Rejected
c) Targets will receive, on average, positive gains + Accepted
d) There will be a higher proportion of negative total gains than expected by chance - Rejected
e) There will be a negative relationship between target gains and acquirer gains - Rejected
f) There will be a negative relationship between target gains and total gains - Rejected
Hypothesis 4: In the subset with positive total gains synergy is the main motive for cross-border acquisitions. Thus, one will observe:
a) Acquirers will receive, on average, positive total gains + Rejected
b) Targets will receive, on average, positive total gains + Acceptedc) A positive relationship between target and acquirer gains and there will be no difference between this relationship for the group with positive acquirer gains relative to the group with negative acquirer gains + Rejected
Hypothesis 5: In the subset with positive total gains synergy and hubris are the main motives for cross-border acquisitions. Thus, one will observe:
a) Acquirers will receive, on average, positive total gains + Rejected
b) Targets will receive, on average, positive total gains + Acceptedc) A positive relationship between target and acquirer gains for the group with positive acquirer gains and a negative relationship for the group with negative acquirer gains. + Rejected
Hypothesis 6: In the sub-sample with negative total gains hubris is the main motive for cross-border acquisitions. Thus, one will observe:
a) Acquirers will receive, on average, negative gains - Rejected
b) Targets will receive, on average, positive gains + Rejected
c) No relationship between target and acquirer gains (-) Rejected
Hypothesis 7: In the sub-sample with negative total gains Managerialism is the main motive for cross-border acquisitions.
a) Acquirers will receive, on average, negative gains - Rejected
b) Targets will receive, on average, positive gains + Rejected
c) A negative relationship between target and acquirer gains - Rejected
Hypothesis 8: Transactions in which synergies, i.e. positive total gains can be observed, a positive relationship will be observable between:
a) Value creation and asset sharing + Rejected
b) Value creation and reverse internalization + Rejected
c) Value creation and market seeking + Accepted
d) Value creation and financial diversification + Accepted
Hypothesis 9: Transactions which can be characterized as managerialist, i.e. with negative total gains, a positive relationship will be observable between:
a) Value destruction and empire building - Rejected
b) Value destruction and risk reduction - Rejected
Hypothesis 10: Transactions which can be characterized as managerialist, i.e. with negative total gains, a positive relationship will be observable between:
a) Bidder losses and empire building - Rejected
b) Bidder losses and risk reduction - Rejected
54
VI. Conclusion and Implications for Future Research
The aim of this final chapter is to outline the conclusions that can be drawn from the
empirical findings of this study. Moreover, this chapter will provide implications for future
research.
VI.1 Conclusion
The main aim of this paper was to assess if cross-border M&A transactions in the consumer
goods industry create value. Following Seth (2002), this study assessed different motives for
these transactions, since previous research, that did not include these motives, did not find
strong empirical evidence (Seth et al. 2002, p.938). They assumed that all transactions are
characterized by the motive of synergy and that synergy is only explanatory factor for value
creation. Consequently, this paper empirically assessed three distinctly different motives for
cross-border M&A in the consumer goods industry: synergy, managerialism and hubris.
In a second step, this study aimed to provide statistically significant evidence to the nature
of gains for both target and acquirer shareholders in such transactions. This was achieved
through the computation of the variables %TOTGAIN and CARBID, on which statistical tests
were conducted. Another area the author deemed worthy to explore was the relationship
between target and acquirer gains.
Lastly, OLS regressions were computed on the dataset in order to find firm-specific and
independent variables to explain the variables %TOTGAIN and CARBID.
For the first and second part of this study, the results achieved are in line with Seth (2000)
and Seth (2002). They also found significant positive total gains, which in this study total
12.85% accruing to both target and acquirer shareholders. This indicates, that cross-border
M&A in the consumer goods industry does create value for both parties complementing the
rationales for the observed M&A activity in the consumer goods industry outlined in chapter
II.2.2. Concerning the motives for these transactions, the results indicate that synergy is the
main rationale. Since, this could not be proven with statistical significance, however, the data
indicates that several motives are present in the dataset, as managerialism and hubris could not
be ruled out.
Concerning the transactions with positive total gains, or synergistic acquisitions, this study
evidenced that targets receive on average positive gains. The recorded acquirer gains, on the
other hand, are not statistically significant but the observed values indicate negative gains on

55
average. This observation is in line with past research which provided clear evidence of acquirer
losses (Sudarsanam, Mahate* 2003, p.1).
This study also set out to understand and prove the relationship between target and acquirer
gains. Due to the limited size of the dataset, however, such a relationship could not be
established with statistical significance.
Concerning the last part of this paper, one has to distinguish between the subsets with
positive and negative total gains. This study finds that the data is in line with the expectations
that multiple sources of value creation exist in cross-border M&A in the consumer goods
industry: financial diversification and market seeking. Both asset sharing and reverse
internalization as sources of value creation could not be confirmed. Nonetheless, this study
provides evidence for various theories of foreign direct investment (Calvet 1981; Rugman 1980;
Harris, Ravenscraft 1991) and suggests that the chosen approach is relevant in understanding
performance differences in such transactions. Concerning the effect of governance systems on
these transactions, this study found that acquirers from countries underlying bank-systems
generate value creating M&A. This indicates that in states where banks play a critical
monitoring role, cross-border M&A in the consumer goods industry is more likely to generate
value than in countries following different governance systems.
Concerning the subset of negative total gains, which are believed to be driven by
managerialism, none of the sources of value destruction could be found. Again, this may be due
to limitations in terms of size of the dataset.
As mentioned above, one of the major challenges when conducting this study was
represented by its data requirements, since all stock price data had to be sourced manually and
validated through various secondary sources. This issue influenced the size of the dataset as
well as the computation of variables.
VI.2 Implications for Future Research
Previous research on the topics of value creation in cross-border M&A is already quite
substantial. By examining a single industry, this study adds to the literature by delivering a
more focused view on the topic. Several topics, however, are still worth examining in the future,
some of which are going to be outlined in this chapter.
Firstly, one could expand the size of the dataset, which would likely increase the statistical
significance of this study due to the higher number of observations, and thus enhance its
external validity. This could be achieved by, e.g., widening the country focus. This study
56
focused on the United States and Canada as target countries. By expanding this geographical
reach, one may be able to analyze global trends in M&A value creation in the consumer goods
industry.
As mentioned in section II.2.2, there are several trends that affect consumer preferences and
thus consumer goods companies in a fundamental fashion. These effects, however, are not
limited to this particular industry but present motives and rationales for M&A in other industries
as well. It would thus be useful to assess the value creation in cross-border transactions in other
industries that experience similar disruptive trends.
Section II.3 outlined several differences between domestic and cross-border M&A in terms
of value creation. It would thus be interesting to explore these differences empirically, which
would require a dataset containing both domestic and cross-border transactions in the consumer
goods industry.
This study chose the event study methodology to assess value creation. While this is a valid
approach for measuring changes in shareholder wealth, it only provides a snapshot picture and
does not provide evidence for value creation in the long run for the company as a whole. Future
studies may assess the transactions in this dataset in more detail, by analyzing company
fundamentals over time, which will likely yield more detailed results on the extent of value
creation for the organization.
These listed implications for future research are, however, only examples of the many
possibilities for future studies on value creation in the context of M&A and cross-border M&A.
57
VII. Publication bibliography
Agrawal, Anup; Jaffe, Jeffrey F.; Mandelker, Gershon N. (1992): The Post-Merger
Performance of Acquiring Firms. A Re-examination of an Anomaly. In The Journal of
Finance 47 (4), pp. 1605–1621.
Amihud, Yakov; Lev, Baruch (1981): Risk Reduction as a Managerial Motive for
Conglomerate Mergers. In The Bell Journal of Economics 12 (2), p. 605. DOI:
10.2307/3003575.
Andrade, Gregor; Mitchell, Mark; Stafford, Erik (2001): New Evidence and Perspectives
on Mergers. In Journal of Economic Perspectives 15 (2), pp. 103–120. DOI:
10.1257/jep.15.2.103.
Antoniou, Antonios; Alexandridis, George; Zhao, Huainan (2006): Valuation Effects of
Institutional Ownership. The Case of Corporate Takeovers. In SSRN Journal. DOI:
10.2139/ssrn.884247.
Baker McKenzie (2016): Changing Consumer Demand Drives FMCG M&A. Available
online at http://crossbordermaindex.bakermckenzie.com/fmcg-q4-2016, checked on 6/7/2017.
Ben-Amar, Walid; Andre, Paul (2006): Separation of Ownership from Control and
Acquiring Firm Performance. The Case of Family Ownership in Canada. In J Bus Fin & Acc
33 (3-4), pp. 517–543. DOI: 10.1111/j.1468-5957.2006.00613.x.
Berkovitch, Elazar; Narayanan, M. P. (1993): Motives for Takeovers. An Empirical
Investigation. In The Journal of Financial and Quantitative Analysis 28 (3), p. 347. DOI:
10.2307/2331418.
Berle, Adolf Augustus; Means, Gardiner C. (1997, 1991): The modern corporation and
private property. [Rev. ed.] / with a new introduction by Murray L. Weidenbaum and Mark
Jensen. New Brunswick, N.J, London: Transaction.
Blume, Marshall E.; Stambaugh, Robert F. (1983): Biases in computed returns. In Journal
of Financial Economics 12 (3), pp. 387–404. DOI: 10.1016/0304-405X(83)90056-9.
Boehmer, E. (1991): Event-study methodology under conditions of event-induced variance.
In Journal of Financial Economics 30 (2), pp. 253–272. DOI: 10.1016/0304-405X(91)90032-
F.

58
Bradley, Michael; Desai, Anand; Kim, E.Han (1988): Synergistic gains from corporate
acquisitions and their division between the stockholders of target and acquiring firms. In
Journal of Financial Economics 21 (1), pp. 3–40. DOI: 10.1016/0304-405X(88)90030-X.
Brooks, Chris (2008): Introductory econometrics for finance. 2nd ed. Cambridge: Cambridge
University Press. Available online at
http://www.loc.gov/catdir/enhancements/fy0810/2008003208-b.html.
Brown, Stepehn J.; Warner, Jerold B. (1985): Using Daily Stock Returns: The Case of
Event Studies. In Journal of Financial Economics 14, pp. 3–31.
Brown, Stephen J.; Warner, Jerold B. (1980): Measuring security price performance. In
Journal of Financial Economics 8 (3), pp. 205–258. DOI: 10.1016/0304-405X(80)90002-1.
Buckley, Peter J.; Casson, M. (2003): The Future of the Multinational Enterprise in
retrospect and in prospect. In J Int Bus Stud 34 (2), pp. 219–222. DOI:
10.1057/palgrave.jibs.8400024.
Cakici, Nusret; Hessel, Chris; Tandon, Kishore (1996): Foreign acquisitions in the United
States. Effect on shareholder wealth of foreign acquiring firms. In Journal of Banking &
Finance 20 (2), pp. 307–329. DOI: 10.1016/0378-4266(94)00131-6.
Calvet, A. L. (1981): A Synthesis of Foreign Direct Investment Theories and Theories of the
Multinational Firm. In J Int Bus Stud 12 (1), pp. 43–59. DOI: 10.1057/palgrave.jibs.8490570.
Campa, Jose Manuel; Hernando, Ignacio (2004): Shareholder Value Creation in European
M&As. In Eur Financial Management 10 (1), pp. 47–81. DOI: 10.1111/j.1468-
036X.2004.00240.x.
Caves, Richard E. (2007): Multinational enterprise and economic analysis. 3rd ed. New
York, Cambridge: Cambridge University Press (Cambridge surveys of economic literature).
Available online at http://www.loc.gov/catdir/enhancements/fy0729/2007013035-d.html.
Conn, R. L.; Connell, F. (1990): International Mergers. Returns to U.S. and British Firms. In
J Bus Fin & Acc 17 (5), pp. 689–711. DOI: 10.1111/j.1468-5957.1990.tb00568.x.
Conn, Robert L.; Cosh, Andy; Guest, Paul M.; Hughes, Alan (2005): The Impact on UK
Acquirers of Domestic, Cross-border, Public and Private Acquisitions. In J Bus Fin & Acc 32
(5-6), pp. 815–870. DOI: 10.1111/j.0306-686X.2005.00615.x.
59
Cooper, Donald R.; Schindler, Pamela S. (2014): Business research methods. Twelfth
edition. New York NY: McGraw-Hill/Irwin (The McGraw-Hill/Irwin series in operations and
decision sciences business statistics).
Datta, Sanjukta; Kodwani, Devendra; Viney, Howard (2013): Shareholder wealth creation
following M&A. Evidence from European utility sectors. In Applied Financial Economics 23
(10), pp. 891–900. DOI: 10.1080/09603107.2013.778943.
Deloitte: IAS 22 — Business Combinations (Superseded). Available online at IAS 22 —
Business Combinations (Superseded), checked on 6/6/2017.
Dolley, James Clay (1933): Characteristics and Procedure of Common Stock Split-Ups. In
Harvard Business Review 11, pp. 316–326.
Ekholm, Daniel; Svensson, Petter (2009): The sources and extent of value creation in
acquisitions- a strategic perspective. Master's dissertation. Lund University.
Fama, Eugene F. (1969): Efficient Capital Markets: A Review of Theory and Empirical
Work. In The Journal of Finance 25 (2), pp. 383–417.
Gaughan, Patrick A. (2007): Mergers, acquisitions, and corporate restructurings. 4th ed.
Hoboken, N.J.: Wiley.
Gregory, Alan (1997): An Examination of the Long Run Performance of UK Acquiring
Firms. In J Bus Fin & Acc 24 (7&8), pp. 971–1002. DOI: 10.1111/1468-5957.00146.
Gregory, Alan; McCorriston, Steve (2005): Foreign acquisitions by UK limited companies.
Short- and long-run performance. In Journal of Empirical Finance 12 (1), pp. 99–125. DOI:
10.1016/j.jempfin.2003.10.003.
Gubbi, Sathyajit R.; Aulakh, Preet S.; Ray, Sougata; Sarkar, M. B.; Chittoor,
Raveendra (2010): Do international acquisitions by emerging-economy firms create
shareholder value? The case of Indian firms. In J Int Bus Stud 41 (3), pp. 397–418. DOI:
10.1057/jibs.2009.47.
Gupta, A.; Misra, L. (2004): Deal size, premium paid and the gains in financial mergers: the
impact of managerial motivation. Bentley College of Business.
Harris, Robert S.; Ravenscraft, David (1991): The Role of Acquisitions in Foreign Direct
Investment. Evidence from the U.S. Stock Market. In The Journal of Finance 46 (3), pp. 825–
844. DOI: 10.1111/j.1540-6261.1991.tb03767.x.
60
Higson, Chris; Elliott, Jamie (1998): Post-takeover returns. The UK evidence. In Journal of
Empirical Finance 5 (1), pp. 27–46. DOI: 10.1016/S0927-5398(96)00015-1.
Holl, Peter; Kyriazis, Dimitris (1997): WEALTH CREATION AND BID RESISTANCE
IN U.K. TAKEOVER BIDS. In Strat. Mgmt. J. 18 (6), pp. 483–498. DOI:
10.1002/(SICI)1097-0266(199706)18:6<483::AID-SMJ895>3.0.CO;2-6.
Kang, Jun-Koo (1993): The international market for corporate control. In Journal of
Financial Economics 34 (3), pp. 345–371. DOI: 10.1016/0304-405X(93)90031-6.
Kay, John; Silberston, Aubrey (1995): Corporate Governance. In National Institute
Economic Review 153 (1), pp. 84–107.
Koller, Tim; Goedhart, Marc H.; Wessels, David (2015): Valuation. Measuring and
Managing the Value of Companies / McKinsey & Company, Tim Koller, Marc Goedhart,
David Wessels. Sixth edition, University edition. Hoboken, New Jersey: Wiley (The Wiley
finance series).
Kwok, Chuck C. Y.; Reeb, David M. (2000): Internationalization and Firm Risk. An
Upstream-Downstream Hypothesis. In J Int Bus Stud 31 (4), pp. 611–629. DOI:
10.1057/palgrave.jibs.8490925.
Lang, Larry H.P.; Stulz, RenéM.; Walkling, Ralph A. (1991): A test of the free cash flow
hypothesis. In Journal of Financial Economics 29 (2), pp. 315–335. DOI: 10.1016/0304-
405X(91)90005-5.
Limmack, R. J. (1991): Corporate Mergers and Shareholder Wealth Effects. 1977-1986. In
Accounting and Business Research 21 (83), pp. 239–252. DOI:
10.1080/00014788.1991.9729838.
Loughran, T. I.M.; Vijh, Anand M. (1997): Do Long-Term Shareholders Benefit From
Corporate Acquisitions? In The Journal of Finance 52 (5), pp. 1765–1790. DOI:
10.1111/j.1540-6261.1997.tb02741.x.
MacKinlay, A. Craig (1997): Event Studys in Economics and Finance. In Journal of
Economic Literature 35, pp. 13–39.
Manzon, G. B.I.L.; Sharp, David J.; Travlos, Nickolaos G. (1994): An Empirical Study of
the Consequences of U.S. Tax Rules for International Acquisitions by U.S. Firms. In The
Journal of Finance 49 (5), pp. 1893–1904. DOI: 10.1111/j.1540-6261.1994.tb04786.x.

61
Markides, Constantinos C.; Ittner, Christopher D. (1994): Shareholder Benefits from
Corporate International Diversification. Evidence from U.S. International Acquisitions. In J
Int Bus Stud 25 (2), pp. 343–366. DOI: 10.1057/palgrave.jibs.8490204.
Marris, Robin (1964): The Economic Theory of ‘Managerial’ Capitalism. London: Palgrave
Macmillan UK.
Merton, Robert C. (1980): On estimating the expected return on the market. In Journal of
Financial Economics 8 (4), pp. 323–361. DOI: 10.1016/0304-405X(80)90007-0.
Mitchell, Mark L.; Lehn, Kenneth (1990): Do Bad Bidders Become Good Targets? In J
Appl Corporate Finance 3 (2), pp. 60–69. DOI: 10.1111/j.1745-6622.1990.tb00200.x.
Morck, Randall; Yeung, Bernard (1991): Why Investors Value Multinationality. In J BUS
64 (2), p. 165. DOI: 10.1086/296532.
Mueller, Dennis C. (1969): A Theory of Conglomerate Mergers. In The Quarterly Journal of
Economics 83 (4), p. 643. DOI: 10.2307/1885454.
Patell, James M. (1976): Corporate Forecasts of Earnings Per Share and Stock Price
Behavior. Empirical Test. In Journal of Accounting Research 14 (2), p. 246. DOI:
10.2307/2490543.
Penrose, Edith Tilton (2009): The theory of the growth of the firm. 4th ed. / with a new
introduction by Christos N. Pitelis. Oxford: Oxford University Press.
Roe, Mark J. (1993): Takeover Politics. The Deal Decade: With assistance of Margaret M.
Blair.
Roll, Richard (1986): The Hubris Hypothesis of Corporate Takeovers. In J BUS 59 (2),
p. 197. DOI: 10.1086/296325.
Roopray, Nandeep: Microsoft Word - Dealogic Global MA Review - Full Year 2016 -
FINAL.docx. Available online at
https://publishing.dealogic.com/ib/DealogicGlobalMAReviewFullYear2016FINALMEDIA.p
df, checked on 6/14/2017.
Rugman, Alan M. (1976): Risk Reduction by International Diversification. In J Int Bus Stud
7 (2), pp. 75–80. DOI: 10.1057/palgrave.jibs.8490702.
Rugman, Alan M. (1980): Internalization as a general theory of foreign direct investment. A
re-appraisal of the literature. In Weltwirtschaftliches Archiv 116 (2), pp. 365–379. DOI:
10.1007/BF02696864.
62
Ryu, Angela (2011): Bet Estimation Using High Frequency Data. Honor's Undergraduate
Thesis. Duke University, checked on 5/23/2017.
Scholes, Myron; Williams, Joseph (1977): Estimating betas from nonsynchronous data. In
Journal of Financial Economics 5 (3), pp. 309–327. DOI: 10.1016/0304-405X(77)90041-1.
Servaes, Henri (1991): Tobin's Q and the Gains from Takeovers. In The Journal of Finance
46 (1), pp. 409–419. DOI: 10.1111/j.1540-6261.1991.tb03758.x.
Seth, Anju (1990): Value creation in acquisitions. A re-examination of performance issues. In
Strat. Mgmt. J. 11 (2), pp. 99–115. DOI: 10.1002/smj.4250110203.
Seth, Anju; Song, Kean P.; Pettit, Richardson (2000): Synergy, Managerialism or Hubris?
An Empirical Examination of Motives for Foreign Acquisitions of U.S. Firms. In J Int Bus
Stud 31 (3), pp. 387–405. DOI: 10.1057/palgrave.jibs.8490913.
Seth, Anju; Song, Kean P.; Richardson Pettit, R. (2002): Value Creation and Destruction
in Cross-Border Acquisitions: An Empirical Analysis of U.S. Firms. In Strategic Management
Journal, pp. 921–940.
Shimizu, Katsuhiko; Hitt, Michael A.; Vaidyanath, Deepa; Pisano, Vincenzo (2004):
Theoretical foundations of cross-border mergers and acquisitions. A review of current
research and recommendations for the future. In Journal of International Management 10 (3),
pp. 307–353. DOI: 10.1016/j.intman.2004.05.005.
Singh, Harbir; Montgomery, Cynthia A. (1987): Corporate acquisition strategies and
economic performance. In Strat. Mgmt. J. 8 (4), pp. 377–386. DOI: 10.1002/smj.4250080407.
Smith, Richard L.; Kim, Joo-Hyun (1994): The Combined Effects of Free Cash Flow and
Financial Slack on Bidder and Target Stock Returns. In J BUS 67 (2), p. 281. DOI:
10.1086/296633.
Song, M. H.; Walking, R.A (2004): Anticipation acquisitions and the bidder return puzzle.
Ohio State University.
Stenbacka, Caroline (2001): Qualitative research requires quality concepts of its own. In
Management Decision 39 (7), pp. 551–556. DOI: 10.1108/EUM0000000005801.
Sudarsanam, P. S. (2010): Creating value from mergers and acquisitions. The challenges /
Sudi Sudarsanam. 2nd ed. Harlow: Financial Times Prentice Hall.

63
Sudarsanam, Sudi; Mahate*, Ashraf A. (2003): Glamour Acquirers, Method of Payment
and Post-acquisition Performance. The UK Evidence. In J Bus Fin & Acc 30 (1-2), pp. 299–
342. DOI: 10.1111/1468-5957.00494.
Thomsen, Steen; Pedersen, Torben (2000): Ownership structure and economic performance
in the largest european companies. In Strat. Mgmt. J. 21 (6), pp. 689–705. DOI:
10.1002/(SICI)1097-0266(200006)21:6<689::AID-SMJ115>3.0.CO;2-Y.
Trautwein, Friedrich (1990): Merger motives and merger prescriptions. In Strat. Mgmt. J.
11 (4), pp. 283–295. DOI: 10.1002/smj.4250110404.
Tuch, Christian; O'Sullivan, Noel (2007): The impact of acquisitions on firm performance.
A review of the evidence. In Int J Management Reviews 9 (2), pp. 141–170. DOI:
10.1111/j.1468-2370.2007.00206.x.
Walker, M. Mark (2000): Corporate Takeovers, Strategic Objectives, and Acquiring-Firm
Shareholder Wealth. In Financial Management 29 (1), p. 53. DOI: 10.2307/3666361.
Weston, J. Fred; Siu, Juan A.; Johnson, Brian A. (2001): Takeovers, restructuring, and
corporate governance. 3rd ed., J. Fred Watson, Juan A. Siu, Brian A. Johnson. Upper Saddle
River, N.J., Great Britain: Prentice Hall (Prentice Hall finance series.
Mergers/acquisitions/takeovers).
Williamson, Oliver E. (1963): Managerial Discretion and Business Behavior. In The
American Economic Review 53 (5), pp. 1032–1057.

64
VIII. Appendix
VIII.1 Deal Overview
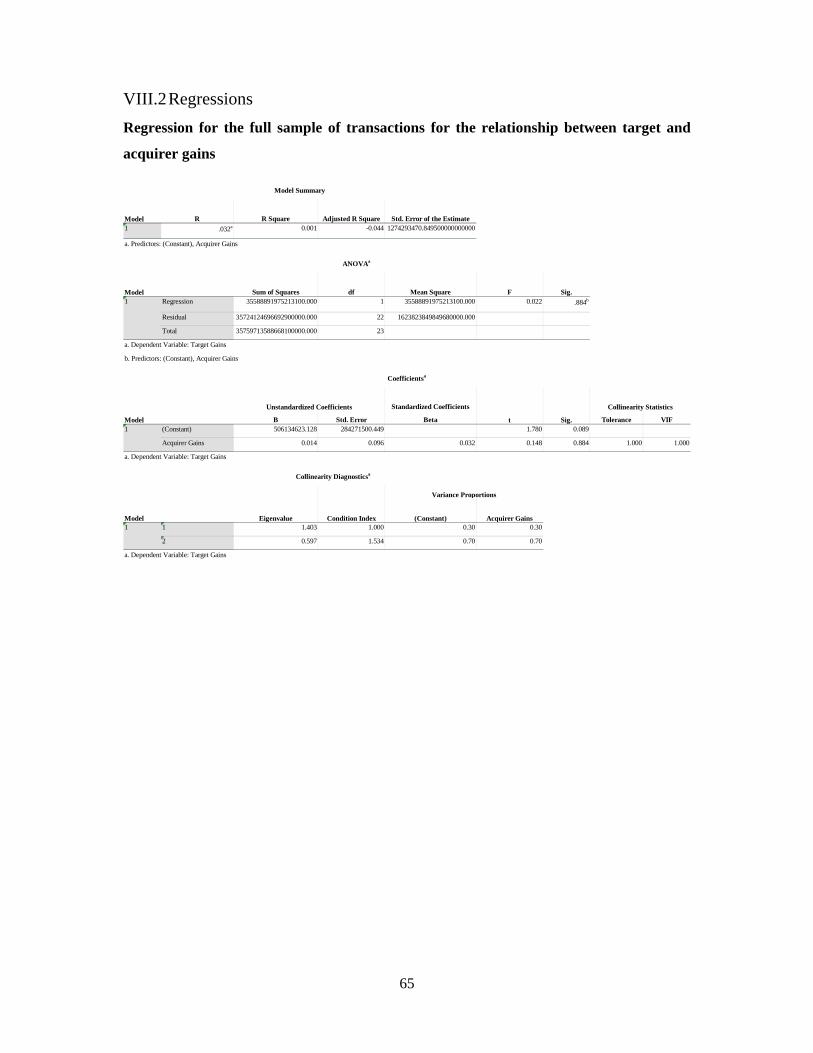
65
VIII.2 Regressions
Regression for the full sample of transactions for the relationship between target and
acquirer gains
R R Square Adjusted R Square Std. Error of the Estimate1 .032a 0.001 -0.044 1274293470.849500000000000
Sum of Squares df Mean Square F Sig.Regression 35588891975213100.000 1 35588891975213100.000 0.022 .884b
Residual 35724124696692900000.000 22 1623823849849680000.000
Total 35759713588668100000.000 23
Standardized Coefficients
B Std. Error Beta Tolerance VIF(Constant) 506134623.128 284271500.449 1.780 0.089
Acquirer Gains 0.014 0.096 0.032 0.148 0.884 1.000 1.000
(Constant) Acquirer Gains1 1.403 1.000 0.30 0.30
2 0.597 1.534 0.70 0.70
1
a. Dependent Variable: Target Gains
1
a. Dependent Variable: Target Gains
Collinearity Diagnosticsa
Model Eigenvalue Condition Index
Variance Proportions
1
a. Dependent Variable: Target Gains
b. Predictors: (Constant), Acquirer Gains
Coefficientsa
Model
Unstandardized Coefficients
t Sig.
Collinearity Statistics
Model Summary
Model
a. Predictors: (Constant), Acquirer Gains
ANOVAa
Model

66
Regression for the sample of transactions with positive total gains for the relationship
between target and acquirer gains
R R Square Adjusted R Square Std. Error of the Estimate1 .136a 0.018 -0.112 1483528154.213760000000000
Sum of Squares df Mean Square F Sig.Regression 621626071586603000.000 2 310813035793302000.000 0.141 .869b
Residual 33012836765173100000.000 15 2200855784344870000.000
Total 33634462836759700000.000 17
Standardized Coefficients
B Std. Error Beta Tolerance VIF(Constant) 625524106.168 509138237.222 1.229 0.238
Acquirer Gains -0.014 0.133 -0.028 -0.101 0.921 0.861 1.162
V3 404431440.032 906691215.949 0.123 0.446 0.662 0.861 1.162
(Constant) Acquirer Gains V31 1.710 1.000 0.14 0.10 0.08
2 1.020 1.295 0.00 0.26 0.37
3 0.270 2.515 0.86 0.64 0.54
1
a. Dependent Variable: Target Gains
1
a. Dependent Variable: Target Gains
Collinearity Diagnosticsa
Model Eigenvalue Condition Index
Variance Proportions
1
a. Dependent Variable: Target Gains
b. Predictors: (Constant), V3, Acquirer Gains
Coefficientsa
Model
Unstandardized Coefficients
t Sig.
Collinearity Statistics
Model Summary
Model
a. Predictors: (Constant), V3, Acquirer Gains
ANOVAa
Model
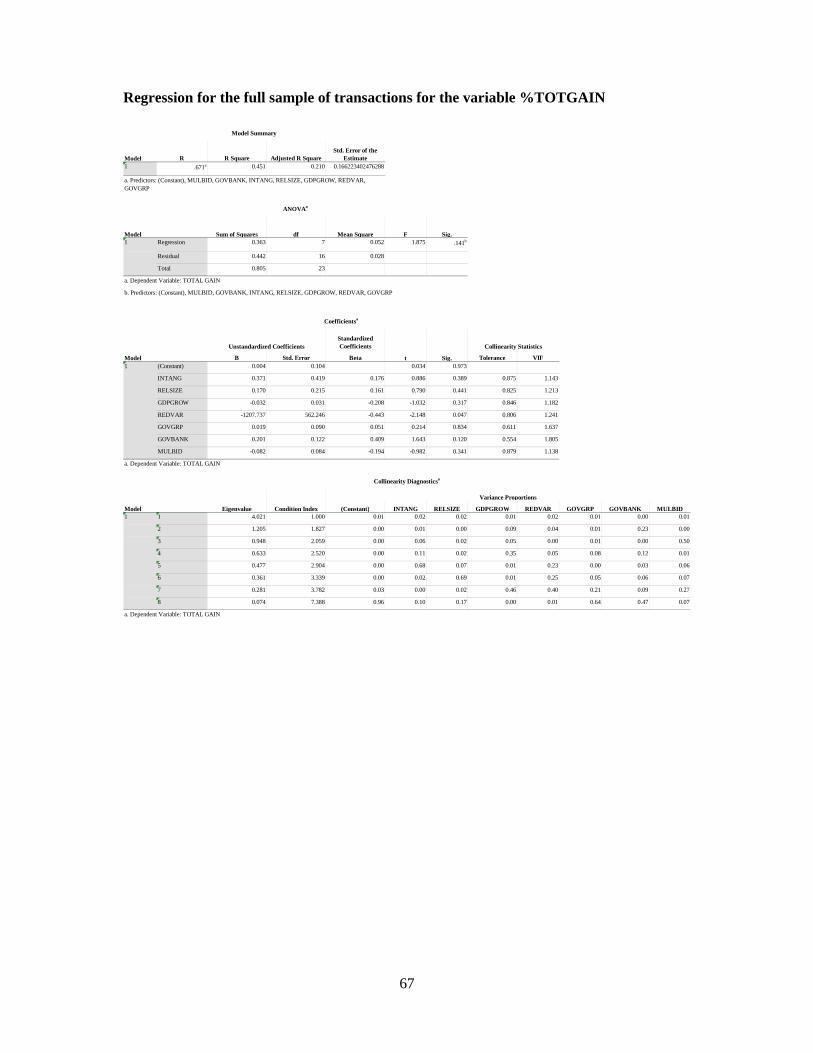
67
Regression for the full sample of transactions for the variable %TOTGAIN
R R Square Adjusted R SquareStd. Error of the
Estimate1 .671a 0.451 0.210 0.166223402476288
Sum of Squares df Mean Square F Sig.Regression 0.363 7 0.052 1.875 .141b
Residual 0.442 16 0.028
Total 0.805 23
Standardized Coefficients
B Std. Error Beta Tolerance VIF(Constant) 0.004 0.104 0.034 0.973
INTANG 0.371 0.419 0.176 0.886 0.389 0.875 1.143
RELSIZE 0.170 0.215 0.161 0.790 0.441 0.825 1.213
GDPGROW -0.032 0.031 -0.208 -1.032 0.317 0.846 1.182
REDVAR -1207.737 562.246 -0.443 -2.148 0.047 0.806 1.241
GOVGRP 0.019 0.090 0.051 0.214 0.834 0.611 1.637
GOVBANK 0.201 0.122 0.409 1.643 0.120 0.554 1.805
MULBID -0.082 0.084 -0.194 -0.982 0.341 0.879 1.138
(Constant) INTANG RELSIZE GDPGROW REDVAR GOVGRP GOVBANK MULBID1 4.021 1.000 0.01 0.02 0.02 0.01 0.02 0.01 0.00 0.01
2 1.205 1.827 0.00 0.01 0.00 0.09 0.04 0.01 0.23 0.00
3 0.948 2.059 0.00 0.06 0.02 0.05 0.00 0.01 0.00 0.50
4 0.633 2.520 0.00 0.11 0.02 0.35 0.05 0.08 0.12 0.01
5 0.477 2.904 0.00 0.68 0.07 0.01 0.23 0.00 0.03 0.06
6 0.361 3.339 0.00 0.02 0.69 0.01 0.25 0.05 0.06 0.07
7 0.281 3.782 0.03 0.00 0.02 0.46 0.40 0.21 0.09 0.27
8 0.074 7.388 0.96 0.10 0.17 0.00 0.01 0.64 0.47 0.07
1
a. Dependent Variable: TOTAL GAIN
1
a. Dependent Variable: TOTAL GAIN
Collinearity Diagnosticsa
Model Eigenvalue Condition Index
Variance Proportions
1
a. Dependent Variable: TOTAL GAIN
b. Predictors: (Constant), MULBID, GOVBANK, INTANG, RELSIZE, GDPGROW, REDVAR, GOVGRP
Coefficientsa
Model
Unstandardized Coefficients
t Sig.
Collinearity Statistics
Model Summary
Model
a. Predictors: (Constant), MULBID, GOVBANK, INTANG, RELSIZE, GDPGROW, REDVAR, GOVGRP
ANOVAa
Model
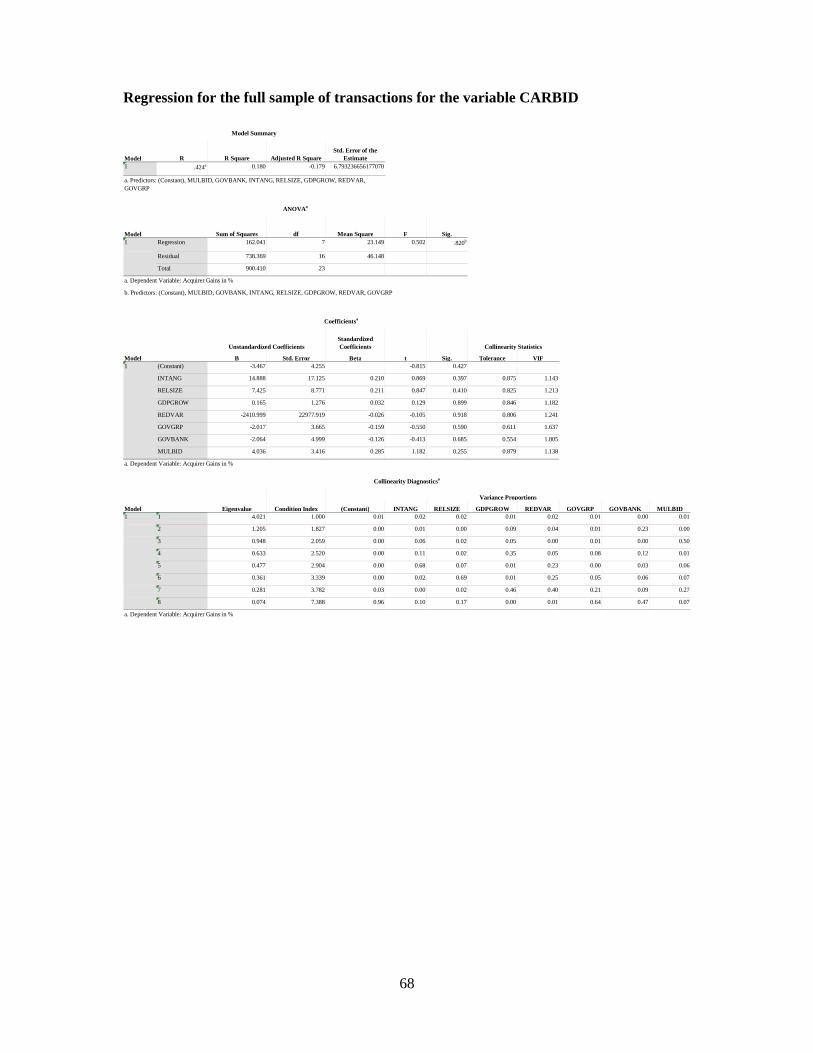
68
Regression for the full sample of transactions for the variable CARBID
R R Square Adjusted R SquareStd. Error of the
Estimate1 .424a 0.180 -0.179 6.793236656177070
Sum of Squares df Mean Square F Sig.Regression 162.041 7 23.149 0.502 .820b
Residual 738.369 16 46.148
Total 900.410 23
Standardized Coefficients
B Std. Error Beta Tolerance VIF(Constant) -3.467 4.255 -0.815 0.427
INTANG 14.888 17.125 0.210 0.869 0.397 0.875 1.143
RELSIZE 7.425 8.771 0.211 0.847 0.410 0.825 1.213
GDPGROW 0.165 1.276 0.032 0.129 0.899 0.846 1.182
REDVAR -2410.999 22977.919 -0.026 -0.105 0.918 0.806 1.241
GOVGRP -2.017 3.665 -0.159 -0.550 0.590 0.611 1.637
GOVBANK -2.064 4.999 -0.126 -0.413 0.685 0.554 1.805
MULBID 4.036 3.416 0.285 1.182 0.255 0.879 1.138
(Constant) INTANG RELSIZE GDPGROW REDVAR GOVGRP GOVBANK MULBID1 4.021 1.000 0.01 0.02 0.02 0.01 0.02 0.01 0.00 0.01
2 1.205 1.827 0.00 0.01 0.00 0.09 0.04 0.01 0.23 0.00
3 0.948 2.059 0.00 0.06 0.02 0.05 0.00 0.01 0.00 0.50
4 0.633 2.520 0.00 0.11 0.02 0.35 0.05 0.08 0.12 0.01
5 0.477 2.904 0.00 0.68 0.07 0.01 0.23 0.00 0.03 0.06
6 0.361 3.339 0.00 0.02 0.69 0.01 0.25 0.05 0.06 0.07
7 0.281 3.782 0.03 0.00 0.02 0.46 0.40 0.21 0.09 0.27
8 0.074 7.388 0.96 0.10 0.17 0.00 0.01 0.64 0.47 0.07
1
a. Dependent Variable: Acquirer Gains in %
1
a. Dependent Variable: Acquirer Gains in %
Collinearity Diagnosticsa
Model Eigenvalue Condition Index
Variance Proportions
1
a. Dependent Variable: Acquirer Gains in %
b. Predictors: (Constant), MULBID, GOVBANK, INTANG, RELSIZE, GDPGROW, REDVAR, GOVGRP
Coefficientsa
Model
Unstandardized Coefficients
t Sig.
Collinearity Statistics
Model Summary
Model
a. Predictors: (Constant), MULBID, GOVBANK, INTANG, RELSIZE, GDPGROW, REDVAR, GOVGRP
ANOVAa
Model
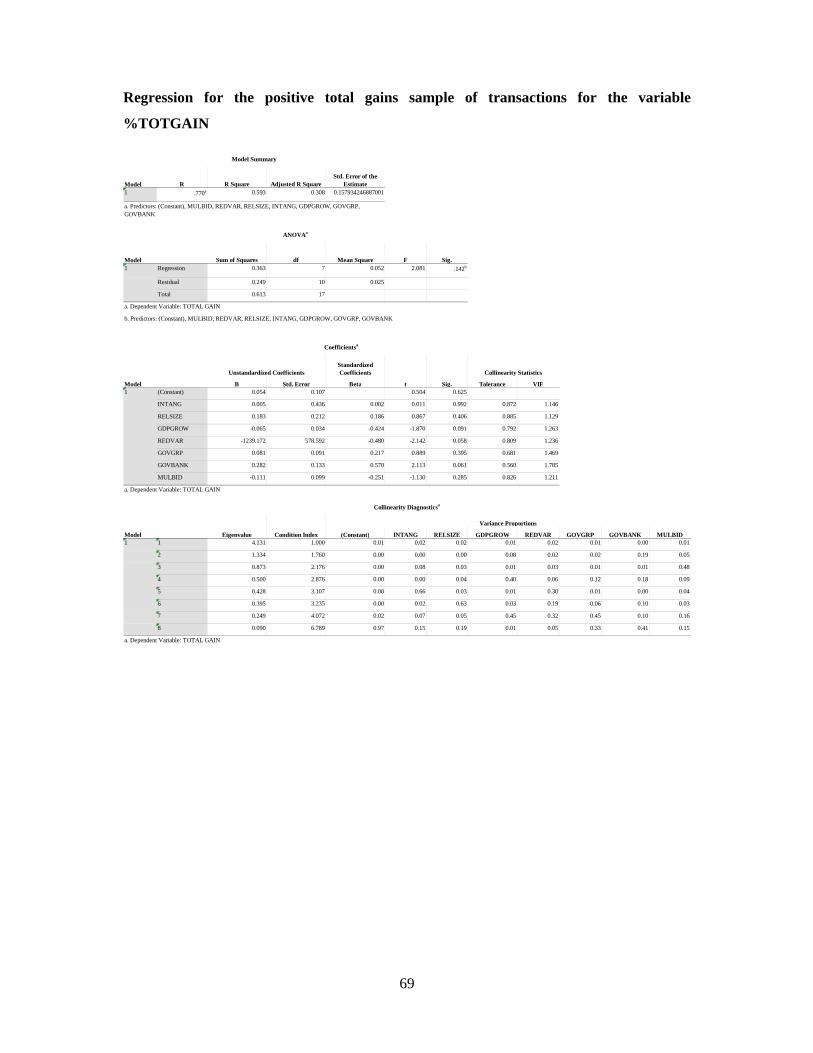
69
Regression for the positive total gains sample of transactions for the variable
%TOTGAIN
R R Square Adjusted R SquareStd. Error of the
Estimate1 .770a 0.593 0.308 0.157934246887001
Sum of Squares df Mean Square F Sig.Regression 0.363 7 0.052 2.081 .142b
Residual 0.249 10 0.025
Total 0.613 17
Standardized Coefficients
B Std. Error Beta Tolerance VIF(Constant) 0.054 0.107 0.504 0.625
INTANG 0.005 0.436 0.002 0.011 0.992 0.872 1.146
RELSIZE 0.183 0.212 0.186 0.867 0.406 0.885 1.129
GDPGROW -0.065 0.034 -0.424 -1.870 0.091 0.792 1.263
REDVAR -1239.172 578.592 -0.480 -2.142 0.058 0.809 1.236
GOVGRP 0.081 0.091 0.217 0.889 0.395 0.681 1.469
GOVBANK 0.282 0.133 0.570 2.113 0.061 0.560 1.785
MULBID -0.111 0.099 -0.251 -1.130 0.285 0.826 1.211
(Constant) INTANG RELSIZE GDPGROW REDVAR GOVGRP GOVBANK MULBID1 4.131 1.000 0.01 0.02 0.02 0.01 0.02 0.01 0.00 0.01
2 1.334 1.760 0.00 0.00 0.00 0.08 0.02 0.02 0.19 0.05
3 0.873 2.176 0.00 0.08 0.03 0.01 0.03 0.01 0.01 0.48
4 0.500 2.876 0.00 0.00 0.04 0.40 0.06 0.12 0.18 0.09
5 0.428 3.107 0.00 0.66 0.03 0.01 0.30 0.01 0.00 0.04
6 0.395 3.235 0.00 0.02 0.63 0.03 0.19 0.06 0.10 0.03
7 0.249 4.072 0.02 0.07 0.05 0.45 0.32 0.45 0.10 0.16
8 0.090 6.789 0.97 0.15 0.19 0.01 0.05 0.33 0.41 0.15
1
a. Dependent Variable: TOTAL GAIN
1
a. Dependent Variable: TOTAL GAIN
Collinearity Diagnosticsa
Model Eigenvalue Condition Index
Variance Proportions
1
a. Dependent Variable: TOTAL GAIN
b. Predictors: (Constant), MULBID, REDVAR, RELSIZE, INTANG, GDPGROW, GOVGRP, GOVBANK
Coefficientsa
Model
Unstandardized Coefficients
t Sig.
Collinearity Statistics
Model Summary
Model
a. Predictors: (Constant), MULBID, REDVAR, RELSIZE, INTANG, GDPGROW, GOVGRP, GOVBANK
ANOVAa
Model

70
Regression for the positive total gains sample of transactions for the variable CARBID
R R Square Adjusted R SquareStd. Error of the
Estimate1 .523a 0.274 -0.235 8.059543238666250
Sum of Squares df Mean Square F Sig.Regression 244.615 7 34.945 0.538 .788b
Residual 649.562 10 64.956
Total 894.177 17
Standardized Coefficients
B Std. Error Beta Tolerance VIF(Constant) -5.763 5.462 -1.055 0.316
INTANG 24.521 22.260 0.318 1.102 0.296 0.872 1.146
RELSIZE 8.657 10.796 0.230 0.802 0.441 0.885 1.129
GDPGROW 0.360 1.760 0.062 0.204 0.842 0.792 1.263
REDVAR -9789.931 29526.153 -0.099 -0.332 0.747 0.809 1.236
GOVGRP -3.683 4.634 -0.260 -0.795 0.445 0.681 1.469
GOVBANK -0.520 6.810 -0.027 -0.076 0.941 0.560 1.785
MULBID 6.320 5.028 0.373 1.257 0.237 0.826 1.211
(Constant) INTANG RELSIZE GDPGROW REDVAR GOVGRP GOVBANK MULBID1 4.131 1.000 0.01 0.02 0.02 0.01 0.02 0.01 0.00 0.01
2 1.334 1.760 0.00 0.00 0.00 0.08 0.02 0.02 0.19 0.05
3 0.873 2.176 0.00 0.08 0.03 0.01 0.03 0.01 0.01 0.48
4 0.500 2.876 0.00 0.00 0.04 0.40 0.06 0.12 0.18 0.09
5 0.428 3.107 0.00 0.66 0.03 0.01 0.30 0.01 0.00 0.04
6 0.395 3.235 0.00 0.02 0.63 0.03 0.19 0.06 0.10 0.03
7 0.249 4.072 0.02 0.07 0.05 0.45 0.32 0.45 0.10 0.16
8 0.090 6.789 0.97 0.15 0.19 0.01 0.05 0.33 0.41 0.15
1
a. Dependent Variable: Acquirer Gains in %
1
a. Dependent Variable: Acquirer Gains in %
Collinearity Diagnosticsa
Model Eigenvalue Condition Index
Variance Proportions
1
a. Dependent Variable: Acquirer Gains in %
b. Predictors: (Constant), MULBID, REDVAR, RELSIZE, INTANG, GDPGROW, GOVGRP, GOVBANK
Coefficientsa
Model
Unstandardized Coefficients
t Sig.
Collinearity Statistics
Model Summary
Model
a. Predictors: (Constant), MULBID, REDVAR, RELSIZE, INTANG, GDPGROW, GOVGRP, GOVBANK
ANOVAa
Model

71
VIII.3 Heteroskedasticity Tests
Heteroskedasticity test (White’s test) for the full sample of transactions for the variable
%TOTGAIN
R R Square Adjusted R SquareStd. Error of the
Estimate1 .434a 0.188 0.111 0.02841
Sum of Squares df Mean Square F Sig.Regression 0.004 2 0.002 2.437 .112b
Residual 0.017 21 0.001
Total 0.021 23
Standardized Coefficients
B Std. Error Beta(Constant) 0.003 0.009 0.288 0.776
PRE_12 -0.403 0.274 -0.667 -1.471 0.156
Unstandardized Predicted Value 0.222 0.109 0.924 2.040 0.054
Minimum Maximum Mean Std. Deviation NPredicted Value -0.0062 0.0331 0.0184 0.01308 24
Residual -0.02912 0.09961 0.00000 0.02715 24
Std. Predicted Value -1.881 1.124 0.000 1.000 24
Std. Residual -1.025 3.506 0.000 0.956 24
a. Dependent Variable: RES_12
Residuals Statisticsa
a. Dependent Variable: RES_12
Model
Unstandardized Coefficients
t Sig.1
Model1
a. Dependent Variable: RES_12
b. Predictors: (Constant), Unstandardized Predicted Value, PRE_12
Coefficientsa
Model Summaryb
Model
a. Predictors: (Constant), Unstandardized Predicted Value, PRE_12
b. Dependent Variable: RES_12
ANOVAa
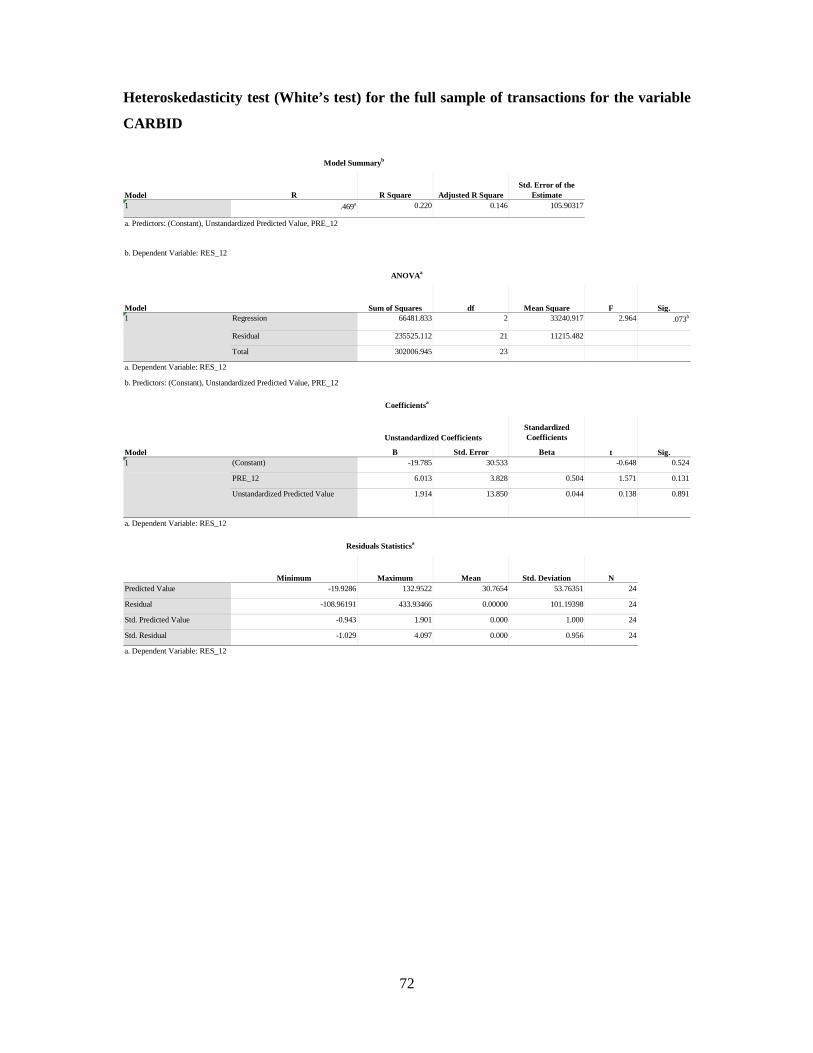
72
Heteroskedasticity test (White’s test) for the full sample of transactions for the variable
CARBID
R R Square Adjusted R SquareStd. Error of the
Estimate1 .469a 0.220 0.146 105.90317
Sum of Squares df Mean Square F Sig.Regression 66481.833 2 33240.917 2.964 .073b
Residual 235525.112 21 11215.482
Total 302006.945 23
Standardized Coefficients
B Std. Error Beta(Constant) -19.785 30.533 -0.648 0.524
PRE_12 6.013 3.828 0.504 1.571 0.131
Unstandardized Predicted Value 1.914 13.850 0.044 0.138 0.891
Minimum Maximum Mean Std. Deviation NPredicted Value -19.9286 132.9522 30.7654 53.76351 24
Residual -108.96191 433.93466 0.00000 101.19398 24
Std. Predicted Value -0.943 1.901 0.000 1.000 24
Std. Residual -1.029 4.097 0.000 0.956 24
a. Dependent Variable: RES_12
Residuals Statisticsa
a. Dependent Variable: RES_12
Model
Unstandardized Coefficients
t Sig.1
Model1
a. Dependent Variable: RES_12
b. Predictors: (Constant), Unstandardized Predicted Value, PRE_12
Coefficientsa
Model Summaryb
Model
a. Predictors: (Constant), Unstandardized Predicted Value, PRE_12
b. Dependent Variable: RES_12
ANOVAa

73
Heteroskedasticity test (White’s test) for the sample of transactions with positive total
gains for the variable %TOTGAIN
R R Square Adjusted R SquareStd. Error of the
Estimate1 .677a 0.458 0.386 0.01266
Sum of Squares df Mean Square F Sig.Regression 0.002 2 0.001 6.333 .010b
Residual 0.002 15 0.000
Total 0.004 17
Standardized Coefficients
B Std. Error Beta(Constant) -0.006 0.006 -0.979 0.343
PRE_12 -0.268 0.111 -1.308 -2.414 0.029
Unstandardized Predicted Value 0.190 0.060 1.722 3.178 0.006
Minimum Maximum Mean Std. Deviation NPredicted Value -0.0074 0.0272 0.0139 0.01093 18
Residual -0.02373 0.02611 0.00000 0.01189 18
Std. Predicted Value -1.947 1.220 0.000 1.000 18
Std. Residual -1.875 2.063 0.000 0.939 18
a. Dependent Variable: RES_12
Residuals Statisticsa
a. Dependent Variable: RES_12
Model
Unstandardized Coefficients
t Sig.1
Model1
a. Dependent Variable: RES_12
b. Predictors: (Constant), Unstandardized Predicted Value, PRE_12
Coefficientsa
Model Summaryb
Model
a. Predictors: (Constant), Unstandardized Predicted Value, PRE_12
b. Dependent Variable: RES_12
ANOVAa
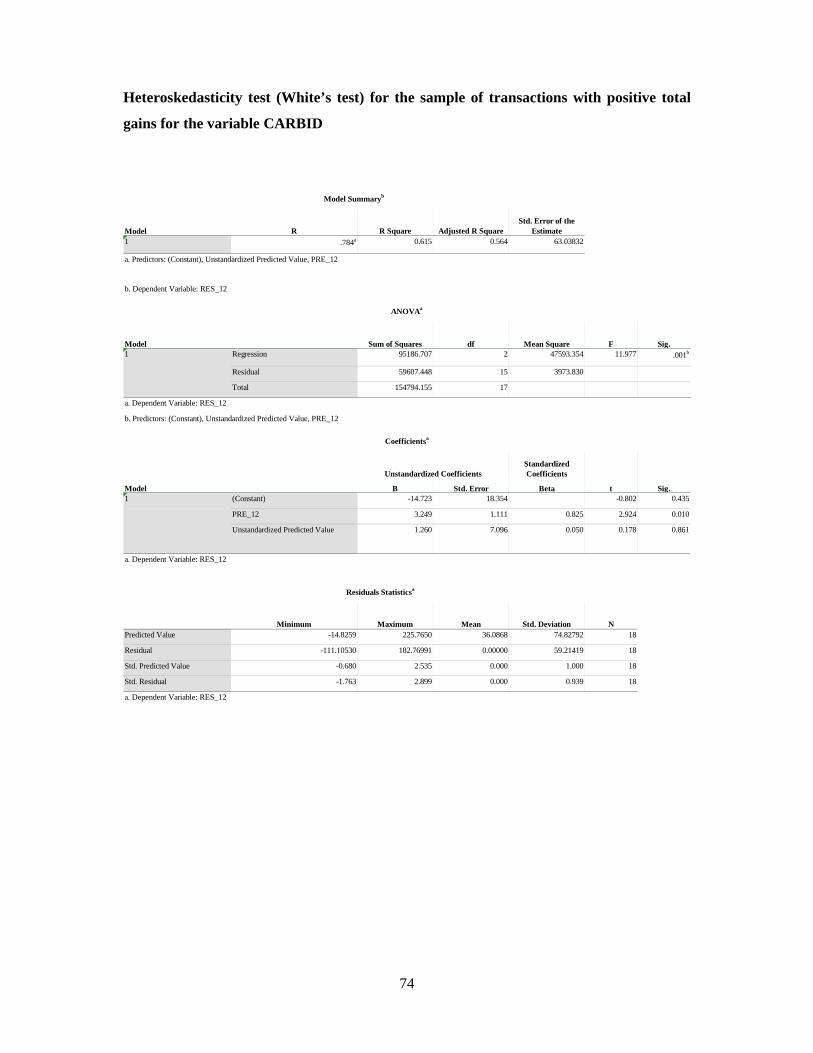
74
Heteroskedasticity test (White’s test) for the sample of transactions with positive total
gains for the variable CARBID
R R Square Adjusted R SquareStd. Error of the
Estimate1 .784a 0.615 0.564 63.03832
Sum of Squares df Mean Square F Sig.Regression 95186.707 2 47593.354 11.977 .001b
Residual 59607.448 15 3973.830
Total 154794.155 17
Standardized Coefficients
B Std. Error Beta(Constant) -14.723 18.354 -0.802 0.435
PRE_12 3.249 1.111 0.825 2.924 0.010
Unstandardized Predicted Value 1.260 7.096 0.050 0.178 0.861
Minimum Maximum Mean Std. Deviation NPredicted Value -14.8259 225.7650 36.0868 74.82792 18
Residual -111.10530 182.76991 0.00000 59.21419 18
Std. Predicted Value -0.680 2.535 0.000 1.000 18
Std. Residual -1.763 2.899 0.000 0.939 18
a. Dependent Variable: RES_12
Residuals Statisticsa
a. Dependent Variable: RES_12
Model
Unstandardized Coefficients
t Sig.1
Model1
a. Dependent Variable: RES_12
b. Predictors: (Constant), Unstandardized Predicted Value, PRE_12
Coefficientsa
Model Summaryb
Model
a. Predictors: (Constant), Unstandardized Predicted Value, PRE_12
b. Dependent Variable: RES_12
ANOVAa
Related Documents