Research Visual Analytics – Visualization Research Work Silvia Miksch Silvia Miksch: Short History Linz

Welcome message from author
This document is posted to help you gain knowledge. Please leave a comment to let me know what you think about it! Share it to your friends and learn new things together.
Transcript

Research Visual Analytics – VisualizationResearch WorkSilvia Miksch
Silvia Miksch: Short History
Linz

Backbone of Research Project Ecosystem
Visual Computing
Visual ComputingEXPAND
Doctoral College
www.cvast.tuwien.ac.atContent
Part 1:
Motivation & Contextualization
Visual Analytics of Time-Oriented Data
Challenges & Opportunities
Part 2:How Does Research Work
Research &TeachingScientific Writing Scientific Reviewing
´ Funding
Conclusion
Content
Part 1:
Motivation & Contextualization
Visual Analytics of Time-Oriented Data
Challenges & Opportunities
Part 2:How Does Research Work
Research &TeachingScientific Writing Scientific Reviewing
´ Funding
Conclusion
Visualization Success Story
Mystery: What is causing a cholera epidemic in London in 1854?
[Tufte, 1997]adapted from [Hearst , 2004]
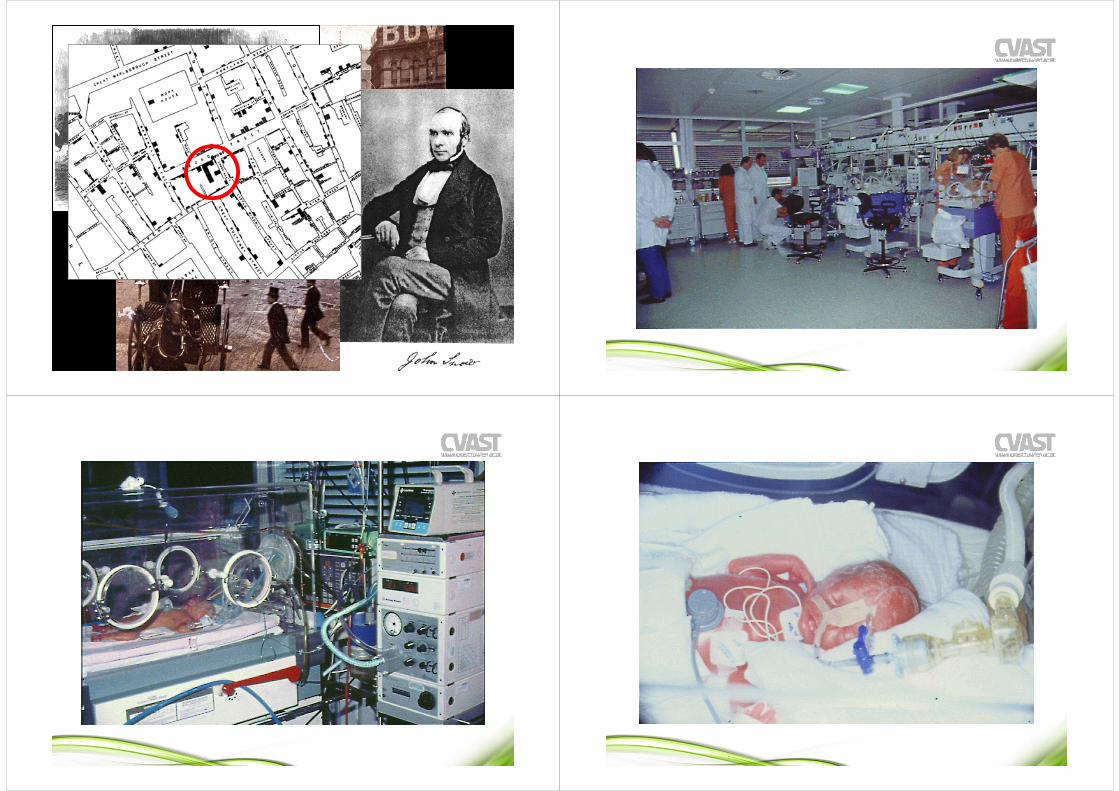
London 18549

Which Information to Tackle ...
Patient Data
++
** *
to do1. ..........................2. .......................... 3. ................
to do1. ..........................2. .......................... 3. ................
to do1. ..........................2. .......................... 3. ................
GuidelinesData
Users
Tasks
... Change over Time
time
Patient Data
+
+
*
**
to do1. ..........................2. .......................... 3. ................
to do1. ..........................2. .......................... 3. ................
to do1. ..........................2. .......................... 3. ................
Guidelines
Patient Data
+
+
*
**
to do1. ..........................2. .......................... 3. ................
to do1. ..........................2. .......................... 3. ................
to do1. ..........................2. .......................... 3. ................
Guidelines
to do1. ..........................2. .......................... 3. ................
to do1. ..........................2. .......................... 3. ................
to do1. ..........................2. .......................... 3. ................
Guidelines
Patient Data
+
+
*
**
Data & Information Big Data
time
variablesOn the one hand, a huge amount of highly structured data and information is available in working situations and the daily life, ...
On the other hand, different kinds of data and information analysis methods were developed to gain more insights (information and knowledge gains).
time-oriented, multivariate, irregular sampled, having different temporal granularities, qualitative, quantitative, etc. structured and unstructured enriched by meta data
Motivation: Main Problems
Data Unmanageable – Information Overload
Missing Integration ofVarious (Heterogeneous) Information SourcesVarious Interdisciplinary Methods
Missing Involvement ofUsers and their Tasks
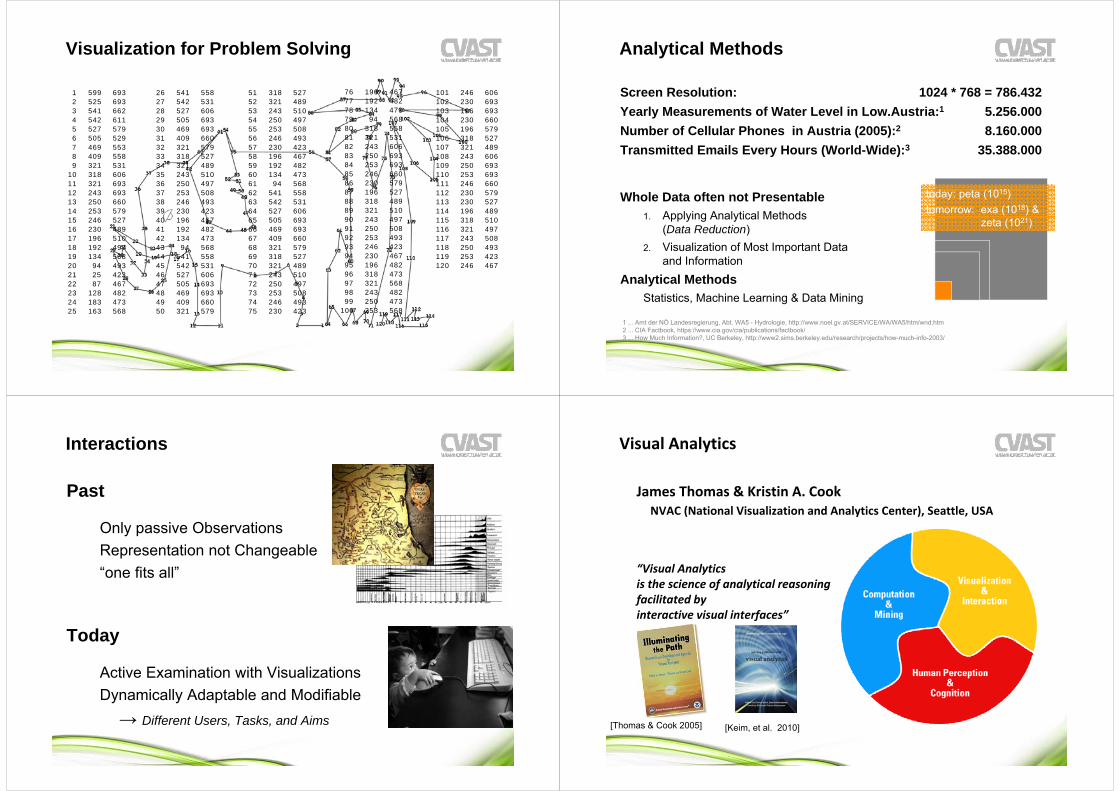
1 599 6932 525 6933 541 6624 542 6115 527 5796 505 5297 469 5538 409 5589 321 531
10 318 60611 321 69312 243 69313 250 66014 253 57915 246 52716 230 48917 196 51018 192 49719 134 50820 94 49321 25 42322 87 46723 128 48224 183 47325 163 568
26 541 55827 542 53128 527 60629 505 69330 469 69331 409 66032 321 57933 318 52734 321 48935 243 51036 250 49737 253 50838 246 49339 230 42340 196 46741 192 48242 134 47343 94 56844 541 55845 542 53146 527 60647 505 69348 469 69349 409 66050 321 579
51 318 52752 321 48953 243 51054 250 49755 253 50856 246 49357 230 42358 196 46759 192 48260 134 47361 94 56862 541 55863 542 53164 527 60665 505 69366 469 69367 409 66068 321 57969 318 52770 321 48971 243 51072 250 49773 253 50874 246 49375 230 423
76 196 46777 192 48278 134 47379 94 56880 318 55881 321 53182 243 60683 250 69384 253 69385 246 66086 230 57987 196 52788 318 48989 321 51090 243 49791 250 50892 253 49393 246 42394 230 46795 196 48296 318 47397 321 56898 243 48299 250 473
100 253 568
101 246 606102 230 693103 196 693104 230 660105 196 579106 318 527107 321 489108 243 606109 250 693110 253 693111 246 660112 230 579113 230 527114 196 489115 318 510116 321 497117 243 508118 250 493119 253 423120 246 467
Visualization for Problem Solving
Screen Resolution: 1024 * 768 = 786.432Yearly Measurements of Water Level in Low.Austria:1 5.256.000Number of Cellular Phones in Austria (2005):2 8.160.000Transmitted Emails Every Hours (World-Wide):3 35.388.000
Whole Data often not Presentable1. Applying Analytical Methods
(Data Reduction)2. Visualization of Most Important Data
and InformationAnalytical Methods
Statistics, Machine Learning & Data Mining
Analytical Methods
1 ... Amt der NÖ Landesregierung, Abt. WA5 - Hydrologie, http://www.noel.gv.at/SERVICE/WA/WA5/htm/wnd.htm2 ... CIA Factbook, https://www.cia.gov/cia/publications/factbook/3 ... How Much Information?, UC Berkeley, http://www2.sims.berkeley.edu/research/projects/how-much-info-2003/
today: peta (1015)tomorrow: exa (1018) &
zeta (1021)
Interactions
Past
Only passive ObservationsRepresentation not Changeable“one fits all”
Today
Active Examination with VisualizationsDynamically Adaptable and Modifiable→ Different Users, Tasks, and Aims
Visual Analytics
James Thomas & Kristin A. Cook NVAC (National Visualization and Analytics Center), Seattle, USA
“Visual Analytics is the science of analytical reasoning facilitated by interactive visual interfaces”
[Thomas & Cook 2005] [Keim, et al. 2010]
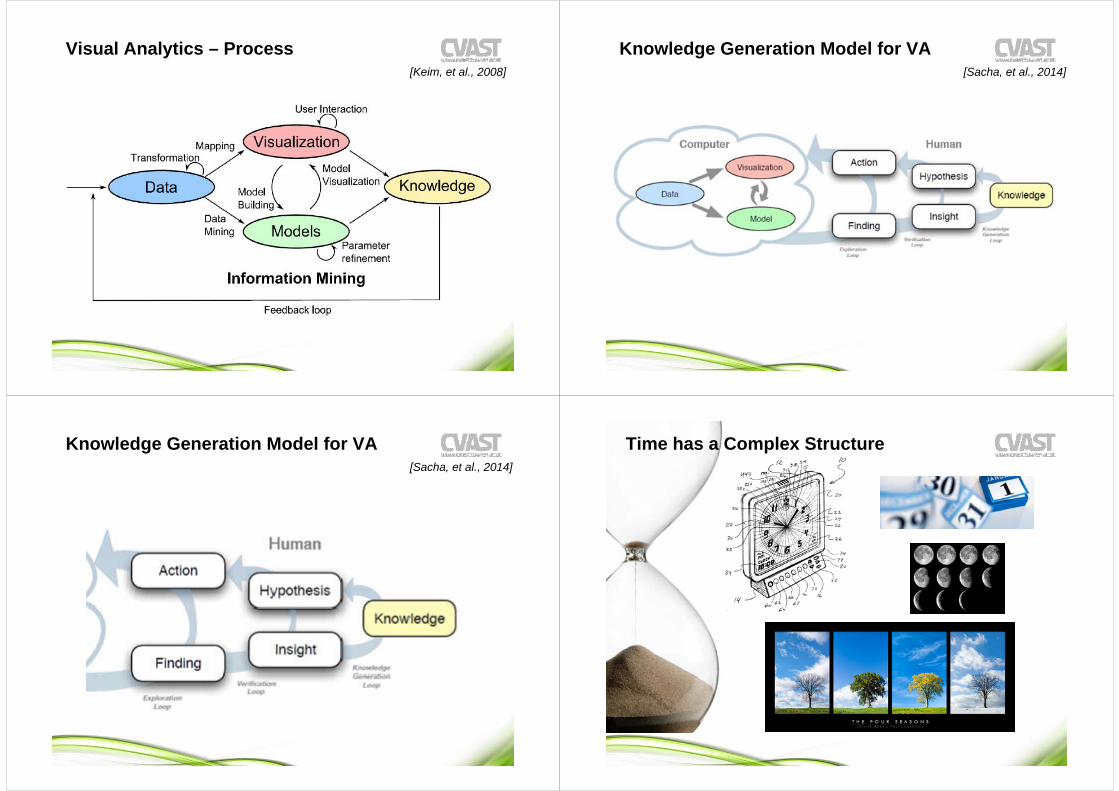
Visual Analytics – Process[Keim, et al., 2008]
Knowledge Generation Model for VA[Sacha, et al., 2014]
Knowledge Generation Model for VA[Sacha, et al., 2014]
Time has a Complex Structure

Visual Analytics of Time-Oriented Data
characterizingtime &
time-oriented data
visualizingtime-oriented
datainteracting
with timeanalyzing
time-oriented data
User-Centered Design
InteractiveVisual Analytics
Methods
data
goals/tasks user/audienceappropriateness
Content
Part 1:
Motivation & Contextualization
Visual Analytics of Time-Oriented Data
Challenges & Opportunities
Part 2:How Does Research Work
Research &TeachingScientific Writing Scientific Reviewing
´ Funding
Conclusion
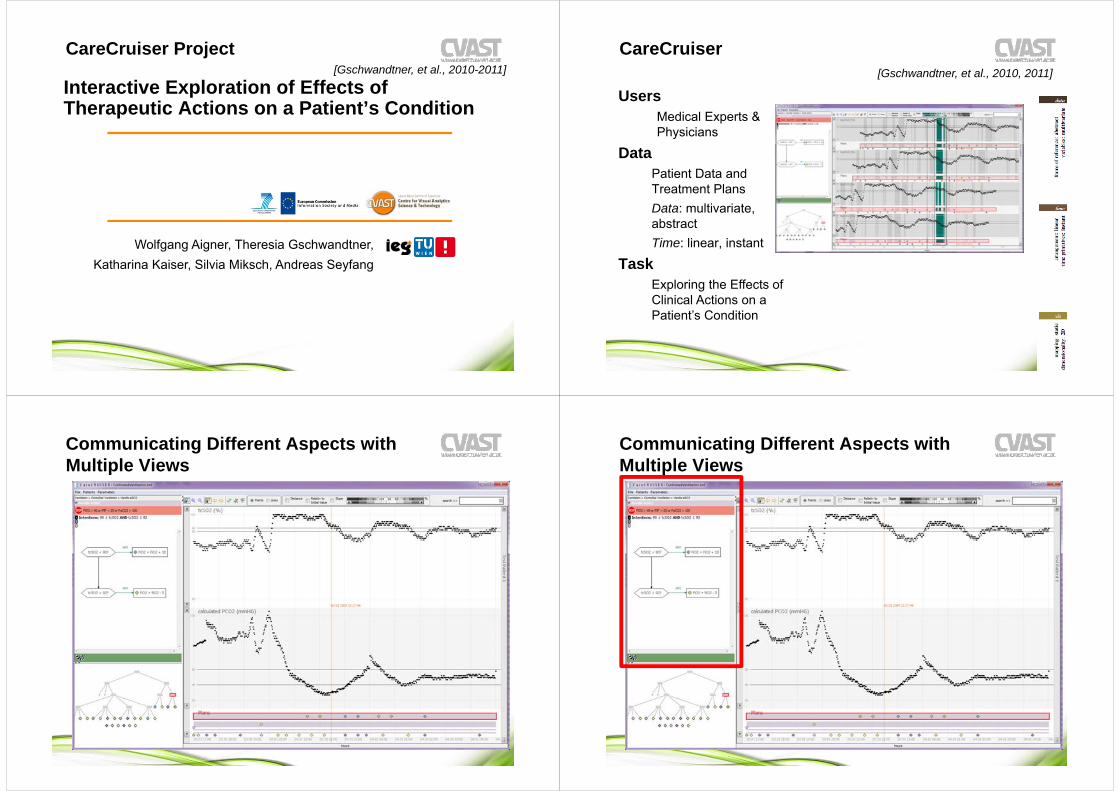
CareCruiser Project
Interactive Exploration of Effects of Therapeutic Actions on a Patient’s Condition
Wolfgang Aigner, Theresia Gschwandtner, Katharina Kaiser, Silvia Miksch, Andreas Seyfang
[Gschwandtner, et al., 2010-2011]CareCruiser
[Gschwandtner, et al., 2010, 2011]
UsersMedical Experts & Physicians
DataPatient Data and Treatment Plans Data: multivariate, abstractTime: linear, instant
TaskExploring the Effects of Clinical Actions on a Patient’s Condition
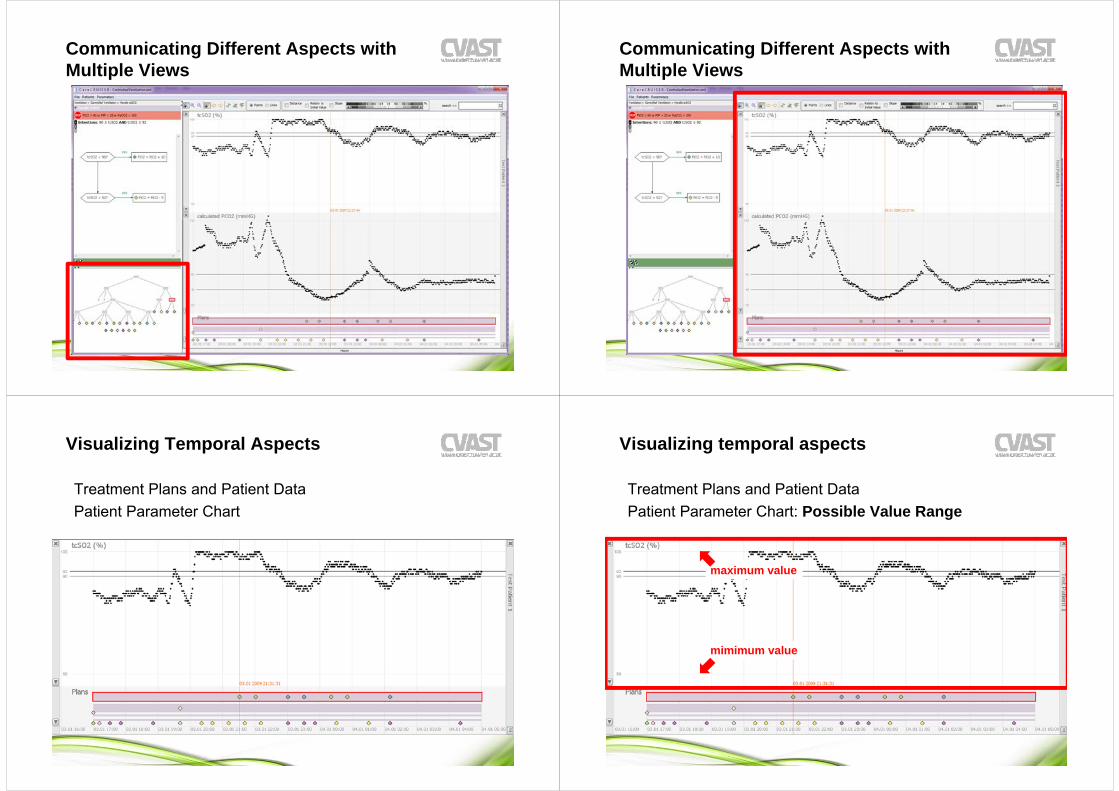
Communicating Different Aspects with Multiple Views
Communicating Different Aspects with Multiple Views
Communicating Different Aspects with Multiple Views
Communicating Different Aspects with Multiple Views
Visualizing Temporal Aspects
Treatment Plans and Patient DataPatient Parameter Chart
Visualizing temporal aspects
Treatment Plans and Patient DataPatient Parameter Chart: Possible Value Range
maximum value
mimimum value
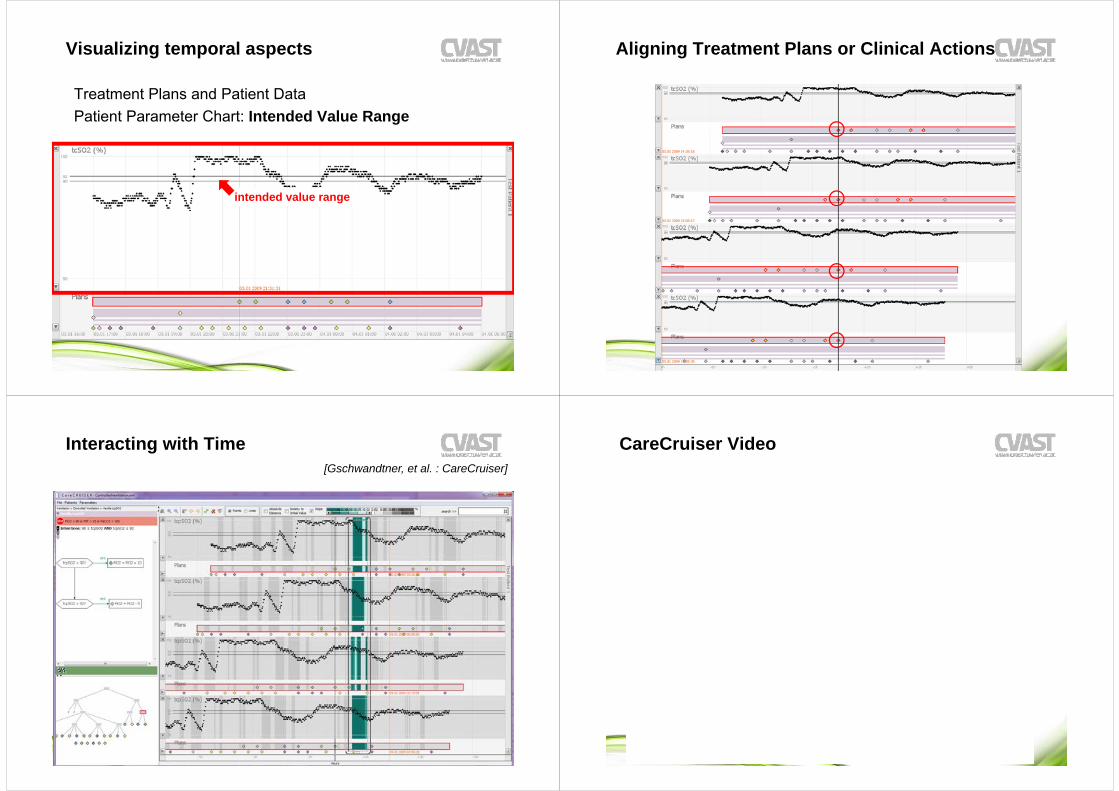
Visualizing temporal aspects
Treatment Plans and Patient DataPatient Parameter Chart: Intended Value Range
intended value range
Aligning Treatment Plans or Clinical Actions
38
Interacting with Time[Gschwandtner, et al. : CareCruiser]
CareCruiser Video
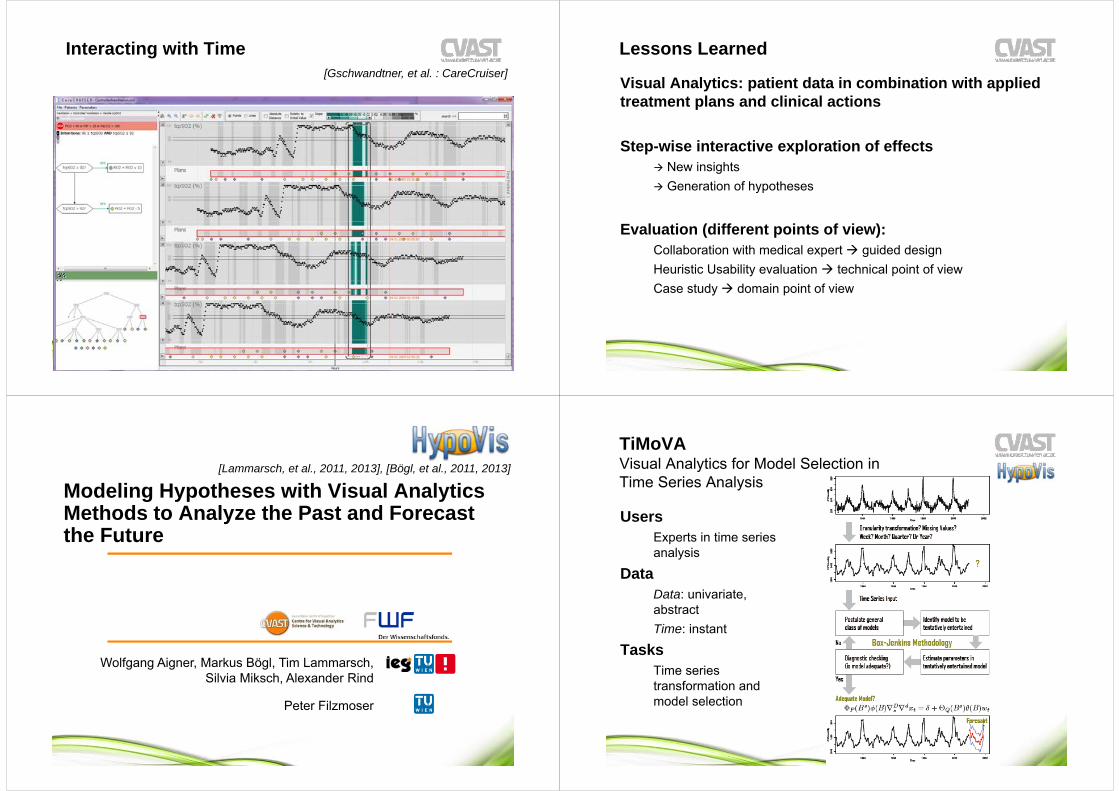
Interacting with Time[Gschwandtner, et al. : CareCruiser]
Lessons Learned
Visual Analytics: patient data in combination with applied treatment plans and clinical actions
Step-wise interactive exploration of effects New insights Generation of hypotheses
Evaluation (different points of view): Collaboration with medical expert guided designHeuristic Usability evaluation technical point of viewCase study domain point of view
Modeling Hypotheses with Visual Analytics Methods to Analyze the Past and Forecast the Future
Wolfgang Aigner, Markus Bögl, Tim Lammarsch, Silvia Miksch, Alexander Rind
Peter Filzmoser
[Lammarsch, et al., 2011, 2013], [Bögl, et al., 2011, 2013]
TiMoVA Visual Analytics for Model Selection in Time Series Analysis
Users Experts in time series analysis
DataData: univariate, abstractTime: instant
TasksTime series transformation and model selection

Example: Statistical SW Tool Gretl Preview-Video[Bögl, et al., 2011, 2013]
Usage Scenario Model SelectionTime Series Line Plot
Autocorrelation Function (ACF) Residual Analysis
[Bögl, et al., 2011, 2013]
TiMoVA – VA Prototype
Definition of
[Shumway and Stoffer, 2011]
[Bögl, et al., 2011, 2013]
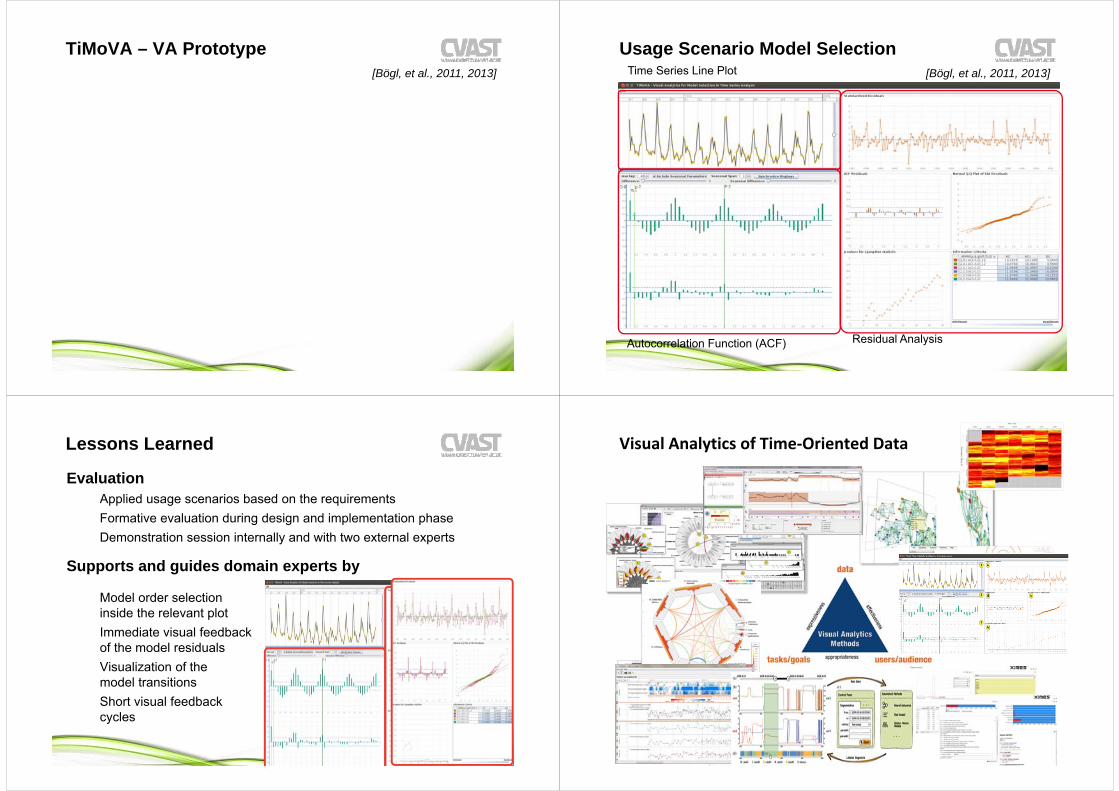
TiMoVA – VA Prototype[Bögl, et al., 2011, 2013]
Usage Scenario Model SelectionTime Series Line Plot
Autocorrelation Function (ACF) Residual Analysis
[Bögl, et al., 2011, 2013]
Lessons Learned
EvaluationApplied usage scenarios based on the requirementsFormative evaluation during design and implementation phaseDemonstration session internally and with two external experts
Supports and guides domain experts by
Model order selectioninside the relevant plotImmediate visual feedbackof the model residualsVisualization of the model transitionsShort visual feedback cycles
Visual Analytics of Time‐Oriented Data
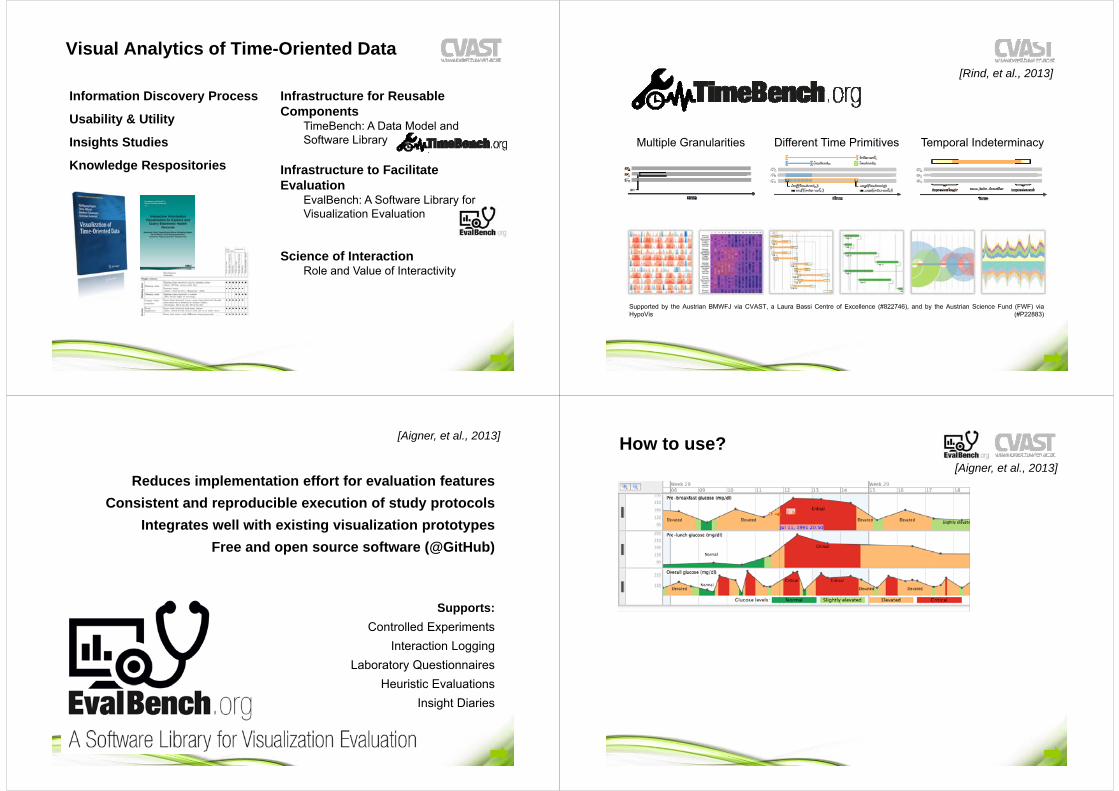
Visual Analytics of Time-Oriented Data
Infrastructure for Reusable Components
TimeBench: A Data Model and Software Library
Infrastructure to Facilitate Evaluation
EvalBench: A Software Library for Visualization Evaluation
Science of InteractionRole and Value of Interactivity
Information Discovery Process
Usability & Utility
Insights Studies
Knowledge Respositories
Supported by the Austrian BMWFJ via CVAST, a Laura Bassi Centre of Excellence (#822746), and by the Austrian Science Fund (FWF) viaHypoVis (#P22883)
Multiple Granularities Different Time Primitives Temporal Indeterminacy
[Rind, et al., 2013]
Reduces implementation effort for evaluation featuresConsistent and reproducible execution of study protocols
Integrates well with existing visualization prototypesFree and open source software (@GitHub)
Supports:Controlled Experiments
Interaction LoggingLaboratory Questionnaires
Heuristic EvaluationsInsight Diaries
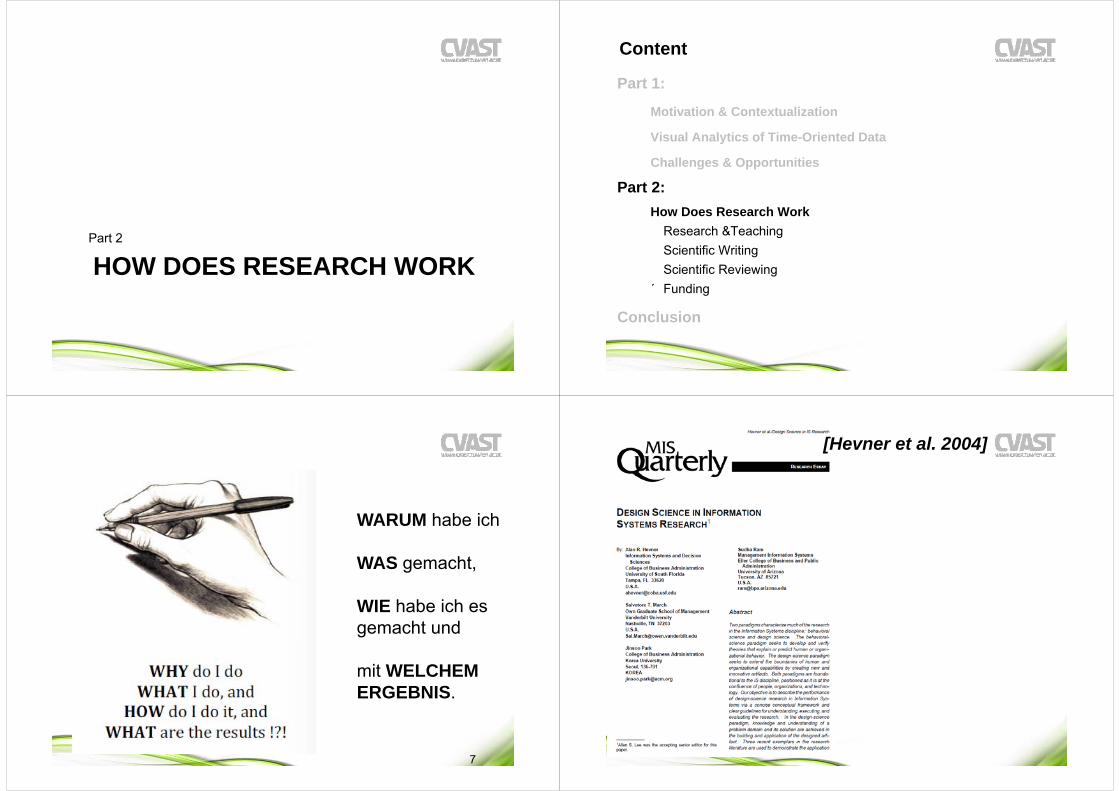
[Aigner, et al., 2013] How to use?[Aigner, et al., 2013]
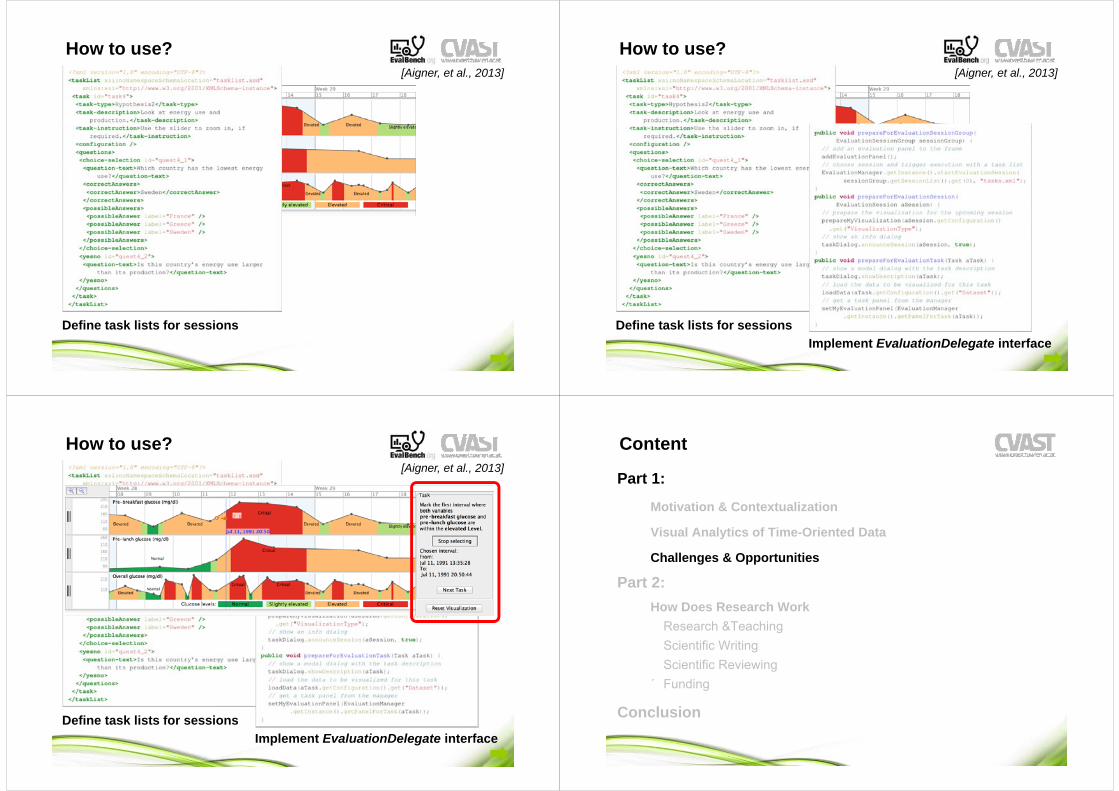
How to use?
Define task lists for sessions
[Aigner, et al., 2013]
How to use?
Define task lists for sessionsImplement EvaluationDelegate interface
[Aigner, et al., 2013]
How to use?
Define task lists for sessionsImplement EvaluationDelegate interface
[Aigner, et al., 2013]
Content
Part 1:
Motivation & Contextualization
Visual Analytics of Time-Oriented Data
Challenges & Opportunities
Part 2:How Does Research Work
Research &TeachingScientific Writing Scientific Reviewing
´ Funding
Conclusion

Challenges
(Time-Oriented) DataScale and Complexity
Heterogeneous Data(Meta Data, Semantics, Multiple Sources, etc.)
Data Quality & Uncertainty
Data Provenance
DesignGuidance on how to Design and Develop Visual Analytics Systems
UserMeeting Users’ Needs
High Degree of Interactivity(Temporal Dimensions)
Evaluation (Qualitative & Quantitative)
TechnologyProvide Reusable Infrastructure
[VisMaster Challenges 2010]
Application Challenges in Visual Analytics
Challenges: Visual Analytics – Process[Keim, et al., 2008]
ConclusionVisual Analytics –
Detect the Expected and Discover the Unexpected
InteractiveVisual Analytics
Methods
data
goals/tasks user/audienceappropriateness

Thanks to
Alan Albert Alessio Alexander Alexander Alime Amin Andreas Andreas Annette Arghad Barbara Barbara Ben Bilal Brain Burcu Carlo Catherine
Christian Christian Christian Claudio Daniel David Dorna EdeltraudEduard Elisabeth Elpida Elske Eva Fabian Felix Florian Florian Frank
Franz Gennady Georg Georg Gerhard Gerhilde Guiseppe Hanna Heidrun Helga Helwig Ingrid Jarke Jim Jimmy Johannes Jörn Jürgen Kai Karl
Katharina Klaus Krist Luca Lukas Manfred Mar Margit Maria Markus Markus Martin Martin Matt Michael Michael Michael Mikko Monika Monika
Mor Nada Natalie Nikolaus Otto Panagiotis Paolo Paolo Patrick PeterPeter Peter Rene Rita Robert Robert Robert Roberto Ruth Sabine SalvoSamson Silvana Simone Sophie Stefan Stefan Stephan Susanne Sylvia
Taowei David Theresia Thomas Tim Tom Werner Wolfgang Yuval
... and many students and co-workerswww.timeviz.net
Wolfgang Aigner • Silvia MikschHeidrun Schumann • Christian Tominski
Visualization of Time-Oriented Datawith a foreword by Ben Shneiderman
Springer1st Edition., 2011, XVIII, 286 p. 221 illus., 198 in color.Hardcover, ISBN 978-0-85729-078-6Due: June 2011
Table of ContentsIntroduction • Historical Background • Time & Time-Oriented Data • Visualization Aspects • Interaction Support • Analytical Support • Survey of Visualization Techniques • Conclusion
www.timeviz.net Horizon Graph[Reijner, 2005]
HOW DOES RESEARCH WORKPart 2
Content
Part 1:
Motivation & Contextualization
Visual Analytics of Time-Oriented Data
Challenges & Opportunities
Part 2:How Does Research Work
Research &TeachingScientific Writing Scientific Reviewing
´ Funding
Conclusion
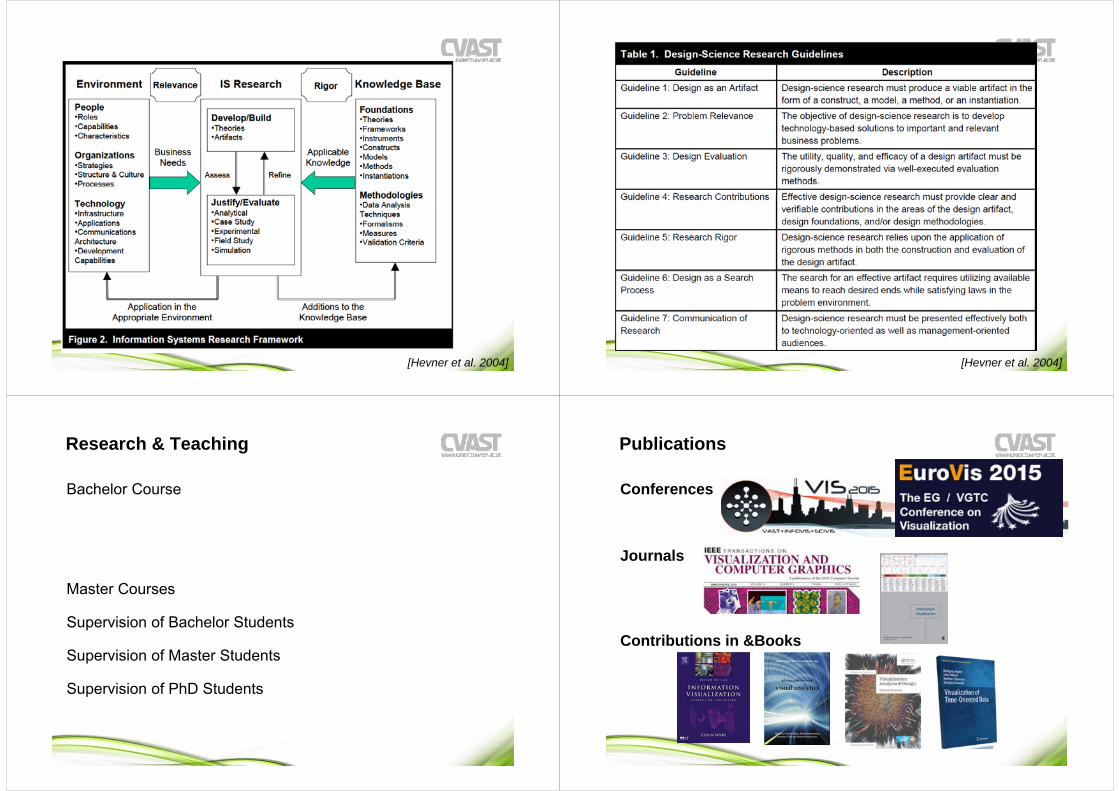
7
WARUM habe ich
WAS gemacht,
WIE habe ich es gemacht und
mit WELCHEM ERGEBNIS.
[Hevner et al. 2004]
[Hevner et al. 2004] [Hevner et al. 2004]
Research & Teaching
Bachelor Course
Master Courses
Supervision of Bachelor Students
Supervision of Master Students
Supervision of PhD Students
Publications
Conferences
Journals
Contributions in &Books
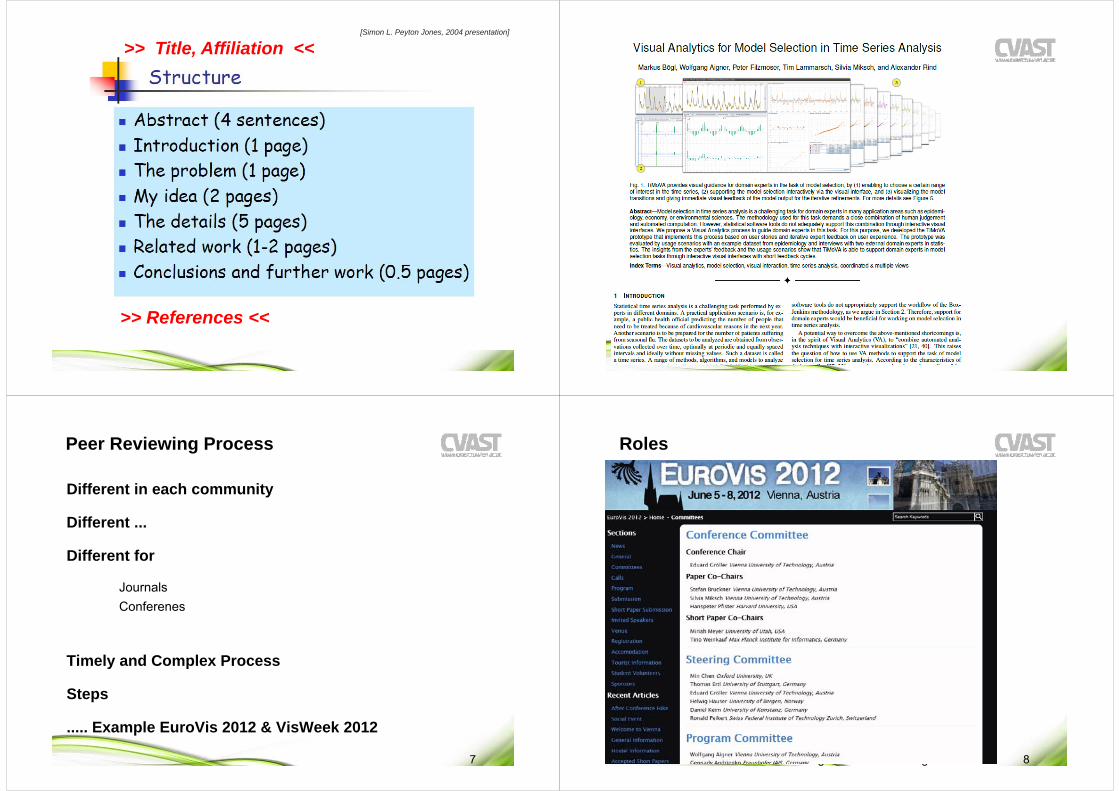
[Simon L. Peyton Jones, 2004 presentation]
>> Title, Affiliation <<
>> References <<
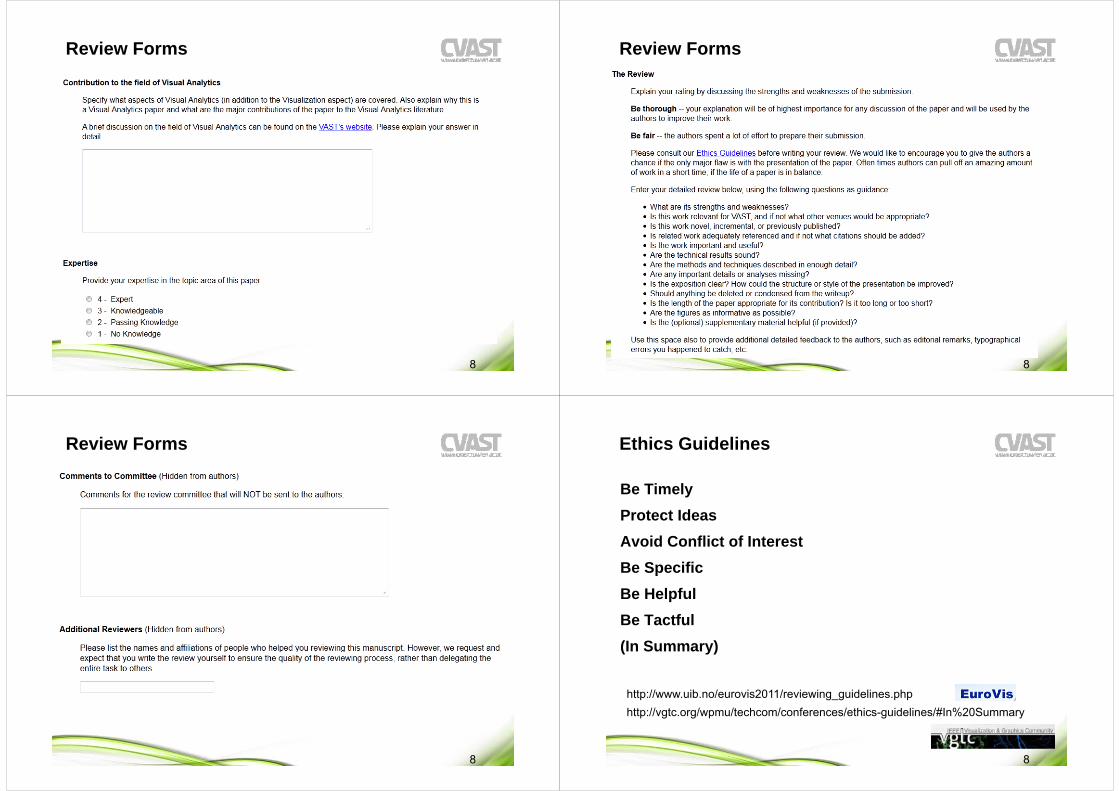
Different in each community
Different ...
Different for
JournalsConferenes
Timely and Complex Process
Steps
..... Example EuroVis 2012 & VisWeek 2012
Peer Reviewing Process
7
PC
IPC
Roles
20.4.2 188.917 – VU Informationsdesign und Visualisierung 8

8
Primary and Secondary Reviewers
8
Review Forms
8
Review Forms
8
Review Forms
8
Review Forms
8
Review Forms
8
Be TimelyProtect IdeasAvoid Conflict of InterestBe SpecificBe HelpfulBe Tactful(In Summary)
Ethics Guidelines
8
http://vgtc.org/wpmu/techcom/conferences/ethics-guidelines/#In%20Summaryhttp://www.uib.no/eurovis2011/reviewing_guidelines.php
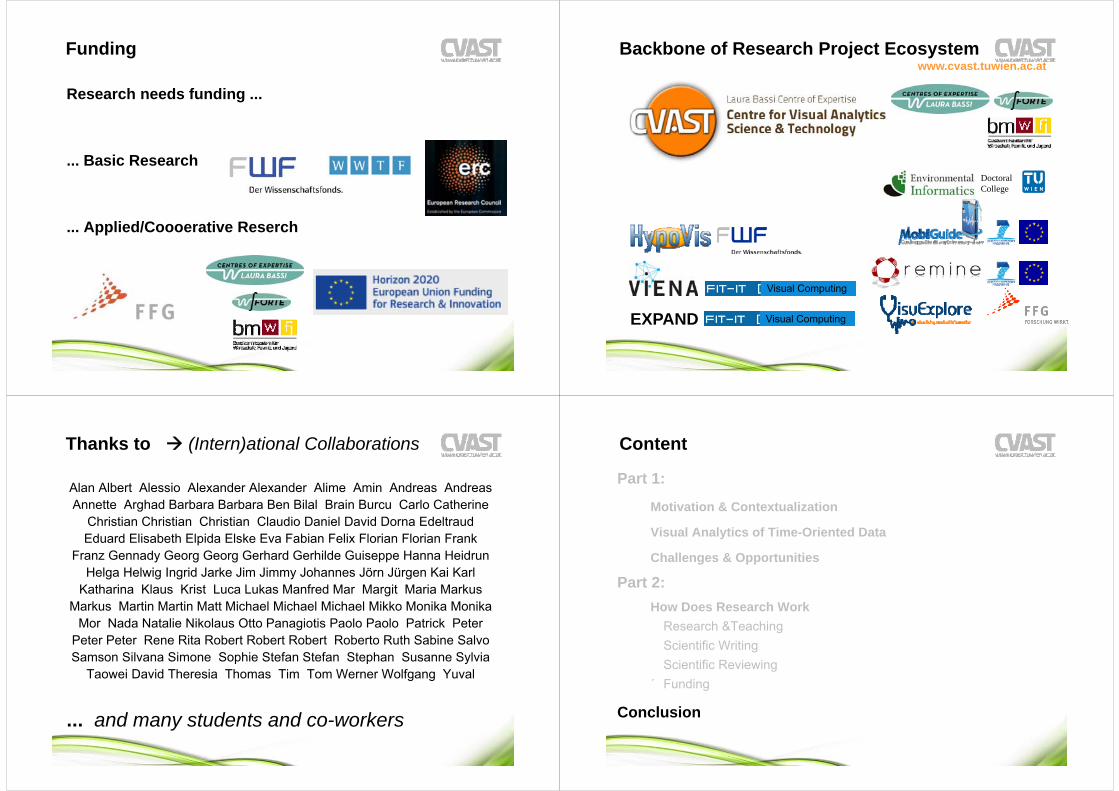
Funding
Research needs funding ...
... Basic Research
... Applied/Coooerative Reserch
Backbone of Research Project Ecosystem
Visual Computing
Visual ComputingEXPAND
Doctoral College
www.cvast.tuwien.ac.at
Thanks to (Intern)ational Collaborations
Alan Albert Alessio Alexander Alexander Alime Amin Andreas Andreas Annette Arghad Barbara Barbara Ben Bilal Brain Burcu Carlo Catherine
Christian Christian Christian Claudio Daniel David Dorna EdeltraudEduard Elisabeth Elpida Elske Eva Fabian Felix Florian Florian Frank
Franz Gennady Georg Georg Gerhard Gerhilde Guiseppe Hanna Heidrun Helga Helwig Ingrid Jarke Jim Jimmy Johannes Jörn Jürgen Kai Karl
Katharina Klaus Krist Luca Lukas Manfred Mar Margit Maria Markus Markus Martin Martin Matt Michael Michael Michael Mikko Monika Monika
Mor Nada Natalie Nikolaus Otto Panagiotis Paolo Paolo Patrick PeterPeter Peter Rene Rita Robert Robert Robert Roberto Ruth Sabine SalvoSamson Silvana Simone Sophie Stefan Stefan Stephan Susanne Sylvia
Taowei David Theresia Thomas Tim Tom Werner Wolfgang Yuval
... and many students and co-workers
Content
Part 1:
Motivation & Contextualization
Visual Analytics of Time-Oriented Data
Challenges & Opportunities
Part 2:How Does Research Work
Research &TeachingScientific Writing Scientific Reviewing
´ Funding
Conclusion
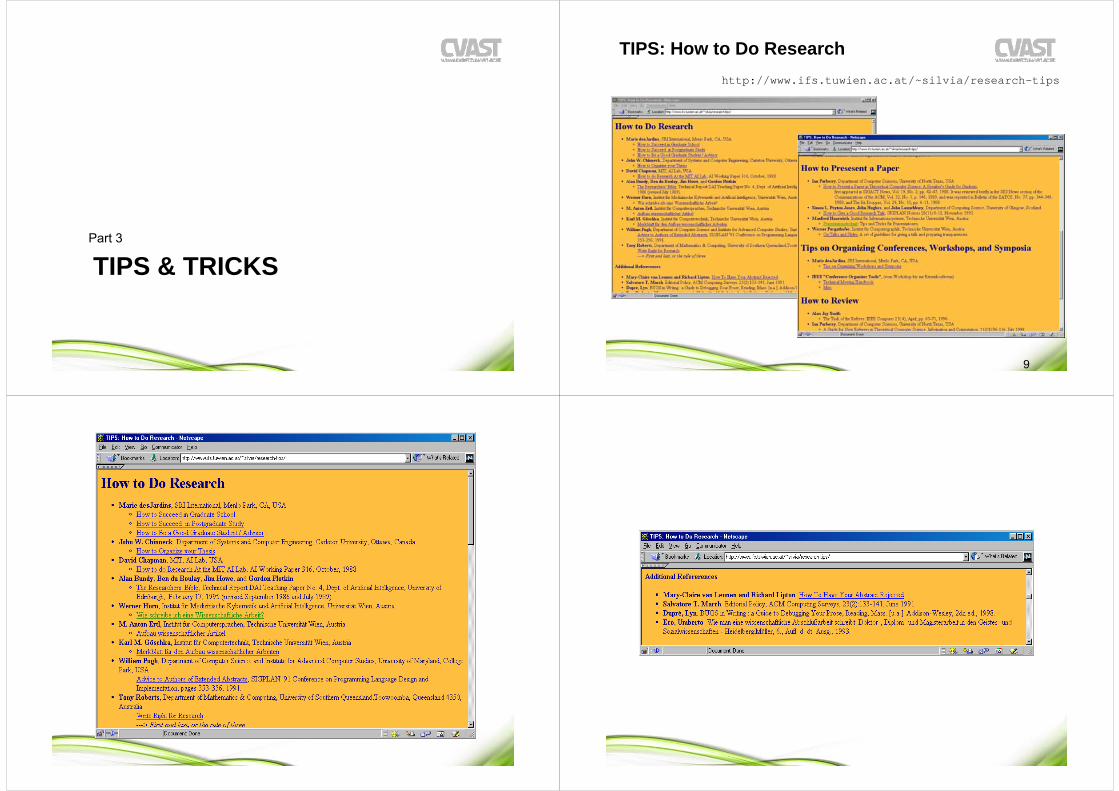
TIPS & TRICKSPart 3
TIPS: How to Do Research
9
http://www.ifs.tuwien.ac.at/~silvia/research-tips
TIPS: How to Do Research TIPS: How to Do Research
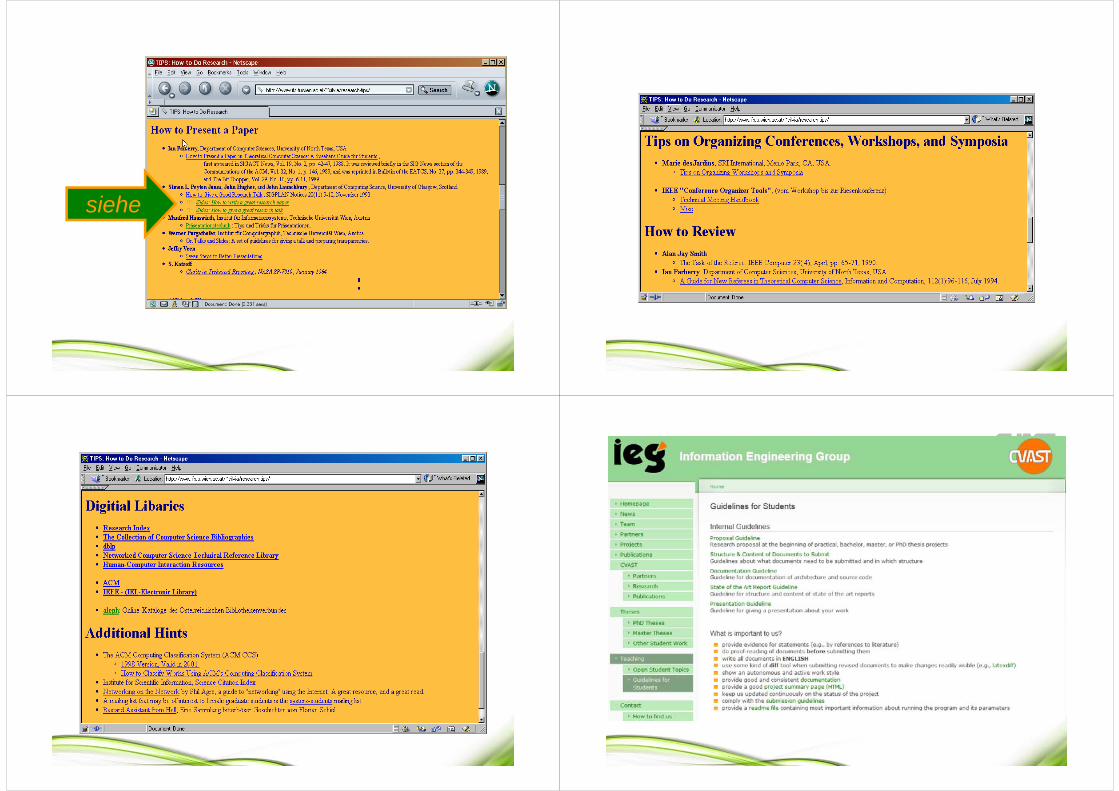
TIPS: How to Do Research
siehe
TIPS: How to Do Research
TIPS: How to Do Research

My Favorite Book for years ...
1
Lyn Dupré:
BUGS in Writing:a Guide to Debugging Your Prose, Addison-Wesley, 1998
... and
1
William Strunk Jr., E. B. White
The Elements of StyleLongman, New York; 4th edition 1999
1
WARUM habe ich
WAS gemacht,
WIE habe ich es gemacht und
mit WELCHEM ERGEBNIS.
Related Documents


