Research School in Biosystematics – ForBio Tromsø The 3 rd DNA Metabarcoding spring school in Tromsø Eric Coissac, Sergei Drovetski, Inger Greve Alsos, Nigel Yoccoz March 30 th – April 5 th 2014

Welcome message from author
This document is posted to help you gain knowledge. Please leave a comment to let me know what you think about it! Share it to your friends and learn new things together.
Transcript

Research School in Biosystematics – ForBio Tromsø
The 3
rdDNA Metabarcoding spring school in Tromsø
Eric Coissac, Sergei Drovetski, Inger Greve Alsos, Nigel Yoccoz
March 30
th– April 5
th2014

Proc. of the 3rd DNA metabarcoding spring school (Tromsø, Norway, 30th March - 5th April
Proc-ii
Proc. of the 3rd DNA metabarcoding spring school (Tromsø, Norway, 30th March - 5th April
Conference Program
School - Day 0 - March 30th 2014 1
17:00 – 19:00 : Transportation to the Skibotndalen field station
School - Day 1 - March 31st 2014 1
8:30 – 9:00 : Welcome lecture
Lecture Session 11 9:00 – 10:00 : DNA metabarcoding introduction
Pierre Taberlet2 10:00 – 11:30 : Sampling design
Nigel Yoccoz
11:30 – 13:00 : Lunch break
Practical Session 33 13:00 – 15:30 : Introduction to the Unix system
Aurélie Bonin, Frédéric Boyer, Eric Coissac
15:30 – 17:30 : Dinner break
Evenning Session 1919 17:30 – 17:45 : Revealing butterflies’, parasitoids’ and spiders’ roles in an Arctic community
Helena Wirta, Elisabeth Weingartner, Peter Hambäck, Tomas Roslin20 17:45 – 18:00 : Species distribution modeling and climate change impact of biodiversity in Doi Suthep - Pui
National Park aiding by the power of DNA metabarcodingMaslin Osathanunkul
21 18:00 – 18:15 : Factors responsible for high phenotypic diversity in northern peatmosses (Sphagnum)Narjes Yousefi, Kristian Hassel, Hans K. Stenøien
22 18:15 – 18:30 : A survey of the ecosystem of the groundwater amphipod Crangonyx islandicusRagnhildur Guðmundsdóttir, Snæbjörn Pálsson
23 18:30 – 18:45 : Rapid construction of a comprehensive mitogenome library – Mitochondrion 10K projectMin Tang, Meihua Tan, Guanliang Meng, Xu Su,Shenzhou Yang, Yiyuan Li, Wenhui Song, Qing Zhang, ShanlinLiu, Xin Zhou
24 18:45 – 19:00 : Reliability of nrDNA markers on tropical plants: the case of ITS-1Amaia Iribar, Ludovic Gielly, Lucie Zinger, Pierre Taberlet, Jérôme Chave
25 19:00 – 19:15 : Trophic cascades and tick-borne pathogensTaal Levi, Felicia Keesing, Richard S. Ostfeld
26 19:15 – 19:30 : Using Environmental DNA to Census Fishes in Marine EcosystemsJesse Port, Ryan Kelly, Kevan Yamahara
Proc-iii
Proc. of the 3rd DNA metabarcoding spring school (Tromsø, Norway, 30th March - 5th April
School - Day 2 - April 1st 2014 27
Lecture Session 2727 8:30 – 10:00 : Designing new DNA Metabarcodes
Eric Coissac28 10:00 – 11:30 : DNA metabarcoding: technical aspects
Pierre Taberlet
11:30 – 13:00 : Lunch break
Practical Session 2929 13:00 – 15:30 : In silico DNA metabarcoding marker design
Aurélie Bonin, Frédéric Boyer, Eric Coissac
15:30 – 17:30 : Dinner break
Evenning Session 4343 17:30 – 17:45 : Ecological and evolutionary responses of Arctic flies to recent climate change at Zackenberg,
GreenlandSarah Loboda, Jade Savage, Toke Hoye, Chris Buddle
44 17:45 – 18:00 : Air biodiversity: a high throughput plant species identification on environmental DNACleopatra Leontidou, Cristiano Vernesi, Antonella Cristofori
45 18:00 – 18:15 : Metabarcoding applied to the study of seasonal variations of the diversity of the meroplanktonSabrina Le Cam, Sophie Delerue-Ricard, Frédérique Viard, Thierry Comtet
46 18:15 – 18:30 : Arctic fox diet in Yamal peninsula, RussiaMaite Cerezo, Dorothee Ehrich
47 18:30 – 18:45 : Towards delimiting the African species of thalloid liverworts Riccardia based on an integrativetaxonomy studyCatherine Reeb, Jean-Yves Dubuisson
48 18:45 – 19:00 : OTU delineation based on DNA barcodes – insights from Sanger-based dataMari Kekkonen, Paul Hebert, Lauri Kaila, Marko Mutanen, Marko Nieminen, Sean Prosser
49 19:00 – 19:15 : Fungal degradation of macromolecular materials in sand –dune soilsIrma Gonzalez Gonzalez, Bart E. van Dongen, Clare H. Robinson
50 19:15 – 19:30 : Low host preference of root associated microbes at an Arctic siteSynnøve Botnen, Unni Vik, Tor Carlsen, Pernille Bronken Eidesen, Marie Louise Davey, Håvard Kauserud
Proc-iv

Proc. of the 3rd DNA metabarcoding spring school (Tromsø, Norway, 30th March - 5th April
School - Day 3 - April 2nd 2014 51
Lecture Session 5151 8:30 – 10:00 : From molecular diversity patterns to processes: how far can we conciliate Community Ecology
and DNA metabarcoding?Lucie Zinger
52 10:00 – 11:30 : Diet analysis using DNA metabarcodingMarta De Barba
11:30 – 13:00 : Lunch break
Practical Session 5353 13:00 – 15:30 : From raw sequence to contingency table
Aurélie Bonin, Frédéric Boyer, Eric Coissac
15:30 – 17:30 : Dinner break
Evenning Session 7373 17:30 – 17:45 : Arctic arthropods and the effect of climate changes
Rikke Reisner Hansen, Toke Thomas Høye74 17:45 – 18:00 : Biodiversity in a bottle: Metabarcoding as a tool for assessing the effects of pipeline crossings
on stream biodiversityMarla Schwarzfeld, Anne-Marie Flores, Aynsley Thielman, Allan Costello, Daniel Erasmus, Brent Murray, LisaPoirier, Jeanne Robert, Dezene Huber, Mark Shrimpton, Michael Gillingham
75 18:00 – 18:15 : Pathogen hunting in Formica exsecta antsKishor Dhaygude, Helena Johansson, Jonna Kulmuni, Kalevi Trontti, Liselotte Sundström
76 18:15 – 18:30 : DNA barcoding of terrestrial orchids and their tuber in tradeAbdolbaset Ghorbani, Barbara Gravendeel, Hugo de Boer
77 18:30 – 18:45 : The use of environmental DNA (eDNA) as a tool in detecting invasive fish species and determin-ing the impact on community assemblages and vertebrate declines in tropical freshwater ecosystemsHeather Robson, Richard Saunders, Damien Burrows, Dean Jerry
78 18:45 – 19:00 : On the origin of contaminationPer Sjögren
79 19:00 – 19:15 : Description of Pyramimonas diskoicola sp. nov. and the importance of the flagellate Pyrami-monas (Prasinophyceae) in Greenland sea ice during the winter spring transitionSara Harðardóttir, Nina Lundholm, Øjvind Moestrup, Torkel Gissel Nielsen
Proc-v

Proc. of the 3rd DNA metabarcoding spring school (Tromsø, Norway, 30th March - 5th April
School - Day 4 - April 3rd 2014 80
Lecture Session 8080 8:30 – 10:00 : Using metabarcoding for the environmental assessment and monitoring of sedimentary environ-
ments: designs, analysis and interpretationsAntony Chariton
81 10:00 – 11:30 : Microbiology DNA metabarcodingHåvard Kauserud
11:30 – 13:00 : Lunch break
Practical Session 8282 13:00 – 15:30 : Basic analysis of metabarcoding data with R
Aurélie Bonin, Frédéric Boyer, Eric Coissac
17:00 – 19:00 : Transportation to Tromsø
Proc-vi
Proc. of the 3rd DNA metabarcoding spring school (Tromsø, Norway, 30th March - 5th April
Workshop - Day 1 - April 4th 2014 86
8:30 – 9:00 : Welcome lecture
Keynote lecture 1 8686 9:00 – 10:00 : Reliable, verifiable, and efficient monitoring of biodiversity via metabarcoding
Douglas W. Yu, Ji Yinqiu
10:00 – 10:30 : Coffee break
Oral Session 1 - Community ecology 8787 10:30 – 10:50 : Exploring soil tropical biodiversity via DNA metabarcoding
Lucie Zinger, Aurélie Bonin, Amaia Iribar, Ludovic Gielly, Eric Coissac, Heidy Schimann, Mélanie Roy, JérômeChave, Pierre Taberlet
88 10:50 – 11:10 : Next-generation biodiversity assessment of benthic communities using high-throughput DNAmetabarcodingTruls Moum, Henning Reiss, Paul E. Renaud, Tom Moens
89 11:10 – 11:30 : Characterizing the composition of the rumen microbiome: a DNA metabarcoding approachAurélie Bonin, Frédéric Boyer, Eric Coissac, Ilma Tapio, Seppo Ahvenjärvi, Tomasz Stefanski, Johanna Vilkki,Kevin J. Shingfield, Pierre Taberlet
11:30 – 14:00 : Lunch + Poster time break
Keynote lecture 2 9090 14:00 – 15:00 : DNA metabarcoding and palaeo-enviroments
Pierre Taberlet
15:00 – 15:30 : Coffee break
Oral Session 2 - Paleo-ecosytem studies 9191 15:30 – 15:50 : Ancient plant DNA of Nordic Environments
Laura Parducci92 15:50 – 16:10 : DNA-based reconstruction of past landscape history
Johan Pansu, Charline Giguet-Covex, Francesco Ficetola, Ludovic Gielly, Frédéric Boyer, Jérôme Poulenard,Fabien Arnaud, Philippe Choler, Pierre Taberlet
93 16:10 – 16:30 : Ancient DNA of SvalbardInger Greve Alsos
94 16:30 – 16:50 : Lake sedDNA as a proxy for 20th century vegetation change in ScotlandPer Sjögren, Mary E. Edwards, Catherine Langdon, Ludovic Gielly, Marie K. Føreid, Inger Greve Alsos
Proc-vii

Proc. of the 3rd DNA metabarcoding spring school (Tromsø, Norway, 30th March - 5th April
Workshop - Day 2 - April 5th 2014 95
Keynote lecture 3 9595 9:00 – 10:00 : Moving from COI metabarcoding to mitochondrial metabarcoding.
Xin Zhou
10:00 – 10:30 : Coffee break
Oral Session 3 - Bioinformatic 9696 10:30 – 10:50 : SUMATRA and SUMACLUST: fast and exact comparison and clustering of full-length barcode
sequencesCéline Mercier, Frédéric Boyer, Pierre Taberlet, Aurélie Bonin, Eric Coissac
97 10:50 – 11:10 : Rapid construction of a comprehensive mitogenome library – Mitochondrion 10K projectMin Tang, Meihua Tan, Guanliang Meng, Xu Su,Shenzhou Yang, Yiyuan Li, Wenhui Song, Qing Zhang, ShanlinLiu, Xin Zhou
98 11:10 – 11:30 : Unifying DNA metabarcoding, DNA barcoding and PhylogeniesEric Coissac, Frédéric Boyer
11:30 – 14:00 : Lunch + Poster time break
Keynote lecture 4 9999 14:00 – 15:00 : Metabarcoding as a routine monitoring tool for Australian estuaries: 1,000s of taxa I cannot
pronounce or ecologically useful data?Antony Chariton, Sarah Stephenson, Andy Steven
15:00 – 15:30 : Coffee break
Oral Session 4 - Quality assessment / Diet analysis 100100 15:30 – 15:50 : Drinking water microbiome: preliminary study to assess how it can vary across a drinking water
treatment plant.Antonia Bruno
101 15:50 – 16:10 : Using next generation sequencing to assess the diet of the Mediterranean Shag and applicationof these technologies for high-throughput study and monitoring of marine biodiversity.Panagiotis Kasapidis, Aris Christidis, Frédéric Boyer, Jon Bent Kristoffersen, Jakob Fric
16:10 – 16:30 : Closure
Proc-viii

Proc. of the 3rd DNA metabarcoding spring school (Tromsø, Norway, 30th March - 5th April
Poster Session 102102 Assessing the potential of metabarcoding data for testing biodiversity models
Guilhem Sommeria-Klein, Lucie Zinger, Pierre Taberlet, Eric Coissac, Delphine Rioux, Amaia Iribar, JérômeChave
103 Monitoring soil microarthropod diversity using high throughput (e-)DNA metabarcoding toolsArjen De Groot, Ivo Laros, Wim Dimmers, Kevin Beentjes, Camiel Doorenweerd, Jack Faber
104 Impact of ionizing radiations and soil structure on the soil macrofauna after 20 years of artificial contamination(Komi Republic, Russia)Emmanuel Lapied, Turid Hertel-Aas, Yevgeniya Tomkiv, Elena Belykh, Deborah Oughton, Turid Hertel-Aas
Index of Authors 105
Proc-ix

Proc. of the 3rd DNA metabarcoding spring school (Tromsø, Norway, 30th March - 5th April
Proc-x

Introduction to DNA metabarcoding
Pierre Taberlet⇤
LECA UMR 5553 CNRS/Université Grenoble Alpes,BP 53 2233 Rue de la Piscine, 38041 Grenoble Cedex 9
The first part of the talk deals with classical DNA barcoding. After presentingHebert’s seminal papers, the potential and limitations of the standard barcodes for ani-mals and plants will be discussed. The second part concerns next generation sequencing.The different technologies will be presented in details, as well as their implications forDNA-based species identification. The next part examines in details the developmentsof DNA metabarcoding. After defining precisely the concept and suggesting a termi-nology, the advantages and drawbacks of the standard barcodes will be discussed in ametabarcoding context. The problem of setting up sound DNA metabarcoding studiescomes from the difficulty to properly integrate the skills of field ecologists, of molecularecologists familiar with DNA techniques, and of bioinformaticians. Indeed, the bioinfor-matic aspect is crucial first for designing suitable DNA metabarcodes, and second forproperly analyzing the output of the next generation sequencers. The last part of thepresentation consists of a review of the landmark studies in the DNA metabarcodingfield, with emphasize on plants and animals, and on the perspectives.
⇤Electronic address: [email protected]; Speaker
()
Sampling design
Nigel Yoccoz⇤
Department of Arctic and Marine Biology, UiT The Arctic University of Norway,N-9037 Tromso, Norway
Sampling theory has mostly been concerned with either populations of well-definedunits (e.g., inhabitants of a country) or with continuous fields (e.g., carbon soil concen-trations in a lansdcape). Errors, such as misidentification, are often ignored. Samplingin the context of metabarcoding poses new problems, which I will mention briefly inthis introductory lecture. Basic principles of sampling, and what could lead to biasedinferences, will serve as a starting point.
⇤Electronic address: [email protected]
()
Practical IIntroduction to the Unix system
Frédéric Boyer⇤1, Aurélie Bonin†1, and Eric Coissac‡1
1LECA UMR 5553 CNRS/Université Joseph Fourier, BP 53, 2233 Rue de laPiscine, 38041 Grenoble Cedex 9, France
The aim of this first practical is to get familiar with the Unix environment and tointroduce a few basic Unix commands. First, we will learn how the file system is organizedin Unix and how files can be created, viewed and manipulated. Second, we will focus onseveral Unix commands which are especially helpful for handling sequence files, e.g. tosort (sort command), select (grep command) or count (wc command) sequence recordsin a file. Finally, we will present the concept of regular expression and illustrate how itcan be exploited for sequence data analysis.
⇤Electronic address: [email protected]†Electronic address: [email protected]‡Electronic address: [email protected]

File system1.0 : Le systeme de fichiers 11
Figure 1.1 – Exemple d’une partie de l’arborescence d’un système de fichier Unix : Le chemin marqué enrouge correspond au nom de fichier /etc/passwd. Ce fichier contient l’ensemble des informations décrivantles utilisateurs d’un système Unix.
– /usr est un répertoire qui contient une grosse partie du système– /usr/local, est un répertoire qui contient l’ensemble des programmes spécifiques à une ma-
chine.
Règles lexicales pour les noms de fichiersLes noms des label constituant un nom de fichier peuvent contenir des caractères alphabétiques
(a-z et A-Z), numeriques (0-9) et des signes de ponctuation (& ,$ ,* ,+ ,= ,. , etc...). Cependant,l’utilisation de certains de ces signes peut poser des problèmes, aussi, il est recommandé de n’utiliserque les signes : . , %, - , _ , : , = .
En Unix les majuscules et les minuscules sont des caractères di�érents, aussi les noms TOTO,toto, Toto et ToTo sont tous di�érents.
Les noms de fichiers commençants par le caractère «point» ’.’ sont des fichiers caches et corres-pondent le plus souvent à des fichiers de configuration.
Quelques subtilités dans l’arbre des noms de fichiersles liens
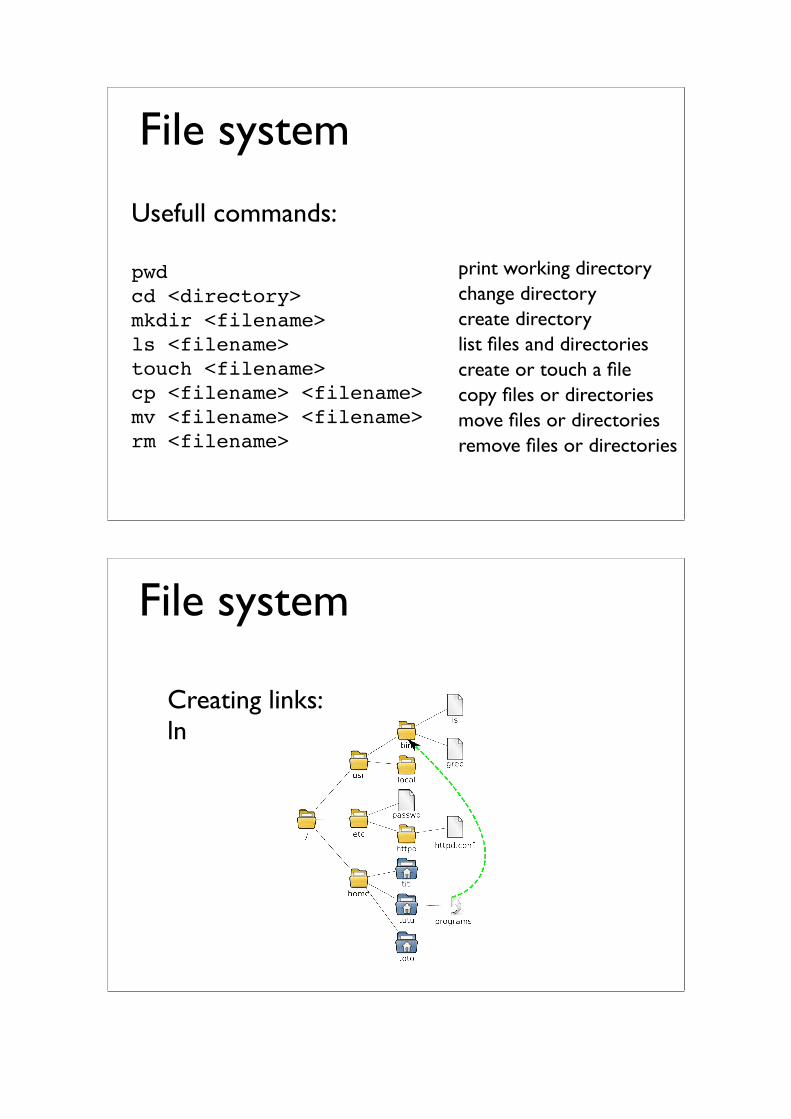
La notion de lien (link en anglais) peut être assimilée à la notion de raccourci proposé par d’autressystèmes d’exploitation. Un lien est donc un fichier spécial qui crée des arrêtes supplémentairesdans l’arbre des noms de fichier. D’un point de vu informatique la structure d’arbre devient doncun graph acyclique dirigé ou DAG (Directed acyclic graph), puisqu’il existe pour certains noeudsplusieurs chemin depuis la racine. Créer un lien dans un système de fichier Unix revient à créerune synonymie entre le lien ajouté et le fichier pointé par le lien. Dans l’exemple de la figure 1.2,le lien /home/tutu/programs pointe sur le répertoire /usr/bin. Il existe donc une relation desynonymie entre ces deux nom. Cette relation s’étend à tous les noms situés sous le nom /usr/bin.
File system
1.0 : Le systeme de fichiers 13
Figure 1.3 – Les liens «.» et «..» permettent de remonter dans l’arbre : .
Le répertoire courant
D’un point de vu pratique, lorsque l’on travail sur une machine on réalise des séries de calculs surun ensemble de fichiers de données. À un moment donné, le jeux de fichiers que nous utilisons estprincipalement localisé dans la même région de l’arbre des noms, car nous rangeons normalementles fichiers correspondant à une même expérience dans un même répertoire. Il en résulte que tous lesnoms de ces fichiers commencent de la même manière. La partie commune à tous ces noms est lenom du répertoire où tous nos fichiers sont stockés. L’idée du répertoire courant est donc de stockerce facteur commun dans une variable dite d’environnement nommé CWD (Current Working Directory).Par défaut lorsque nous nous connectons sur notre compte Unix d’une machine, cette variable estinitialisée avec le nom de notre répertoire home. La valeur de cette variable est modifiable grâce à lacommande Unix cd (page 30).
Les chemins relatifs
Les noms de fichier relatifs ou chemins relatifs sont exprimés relativement à ce répertoire cou-rant. Pour connaître le vrai nom correspondant à un nom relatif, il faut concatener le nom du réper-toire courant et le nom relatif.
– Considérons les nom de fichiers Unix suivants
/home/toto/manip_1/sequence.fasta/home/toto/manip_1/expressions.dat/home/toto/manip_1/annotation.g�
– Si le répertoire courant est : /home/toto/manip_1, On peut nommer ces même fichiers :
sequence.fastaexpressions.datannotation.g�
On reconnaît un nom relatif au fait qu’il ne commence pas par le caractère «/». Par oppositionà la notion de nom ou chemin relatif, on parle pour les noms de fichier complets de chemins ou denoms absolus. Ils commencent toujours par le caractère «/».
Absolute vs relative path:using ‘~’, ‘.’ and ‘..’
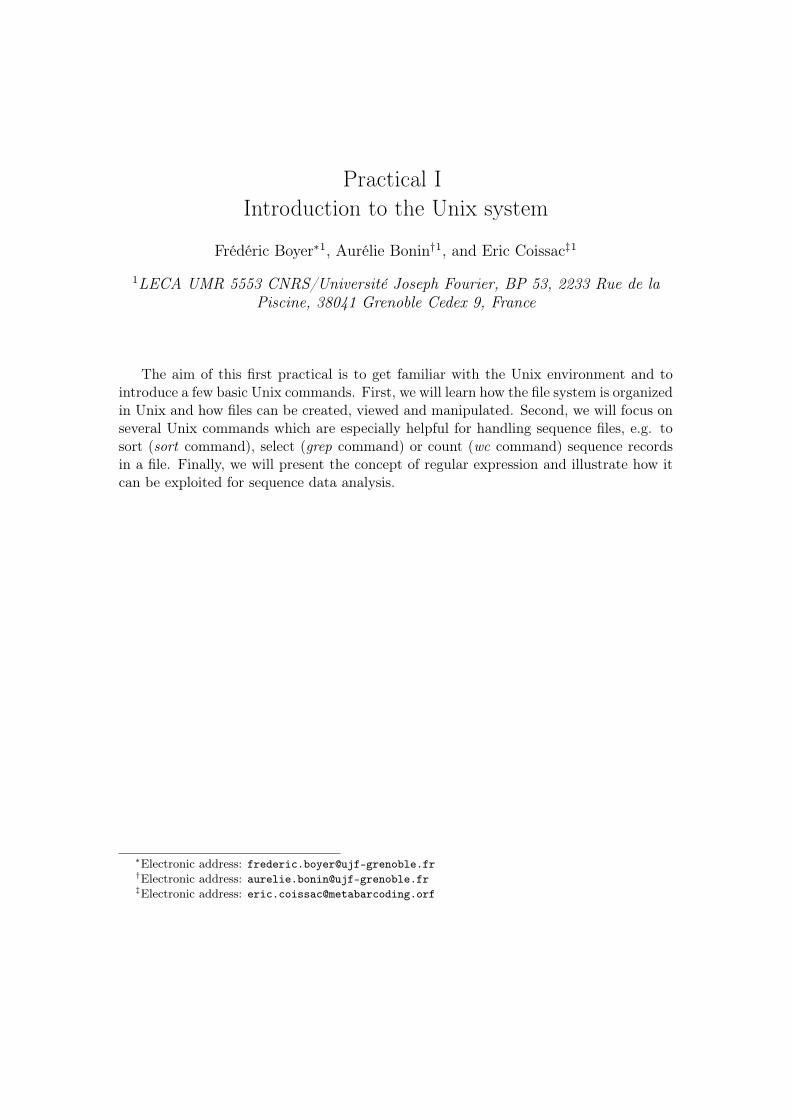
Usefull commands:
pwdcd <directory>mkdir <filename>ls <filename>touch <filename>cp <filename> <filename>mv <filename> <filename>rm <filename>
print working directorychange directorycreate directorylist files and directoriescreate or touch a filecopy files or directoriesmove files or directoriesremove files or directories
File system
12 Chapitre 1 : Introduction a Unix
Figure 1.2 – /home/tutu/programs un lien vers le répertoire /usr/bin : Le fichier spécial/home/tutu/programs est un lien dit symbolique vers le répertoire /usr/bin. Il crée dans l’arbre des fi-chiers une synonymie entre les nom /usr/bin et /home/tutu/programs.
Le nom /home/tutu/programs/grep est donc synonyme de /usr/bin/grep. Il existe donc deuxchemin pour aller du noeud racine / au noeud grep, l’arbre des fichiers donc en réalité un DAG.
les repertoires «.» et «..»
Le système Unix utilise ce système de liens pour faciliter l’utilisation de l’arbre des noms defichiers. Lors de la création d’un noeud répertoire, le système ajoute automatiquement sous ce noeuddeux liens nommés respectivement point «.» et point point «..». Le lien «.» est un raccourcit vers lerépertoire qui le contient, alors que le lien «..» pointe sur le répertoire père de celui-ci (voir fig. 1.3).
Ces liens font que pour chaque fichier il n’existe pas un nom mais une infinité de noms possibles.Le fichier /home/tutu/mon_fichier, peut aussi être nommé :
– /home/tutu/./mon_fichier– /home/tutu/../../home/tutu/mon_fichier– /home/tutu/./././mon_fichier
La multiplicité des noms synonymes pour un même fichier peut sembler bien futile, mais elleprend tout son intérêt avec la notion de noms de fichiers relatifs abordée dans le paragraphe suivant.
Le répertoire courant et les noms de fichiers relatifsLa structure arborescente des noms de fichier Unix est très puissante car elle permet le classe-
ment des fichiers dans une structure hiérarchique. L’ajout de la notion de lien permet de complexifiercette classification en la faisant reposer sur un DAG plutôt que sur une simple arbre. Mais cette mé-thode de dénomination a l’inconvénient de produire des noms de fichiers souvent très longs et doncabsolument pas pratiques à utiliser, surtout si l’on doit saisir ces noms au clavier. Pour contourner ceproblème Unix propose la notion de répertoire courant et de chemins relatifs.
Creating links:ln
File system
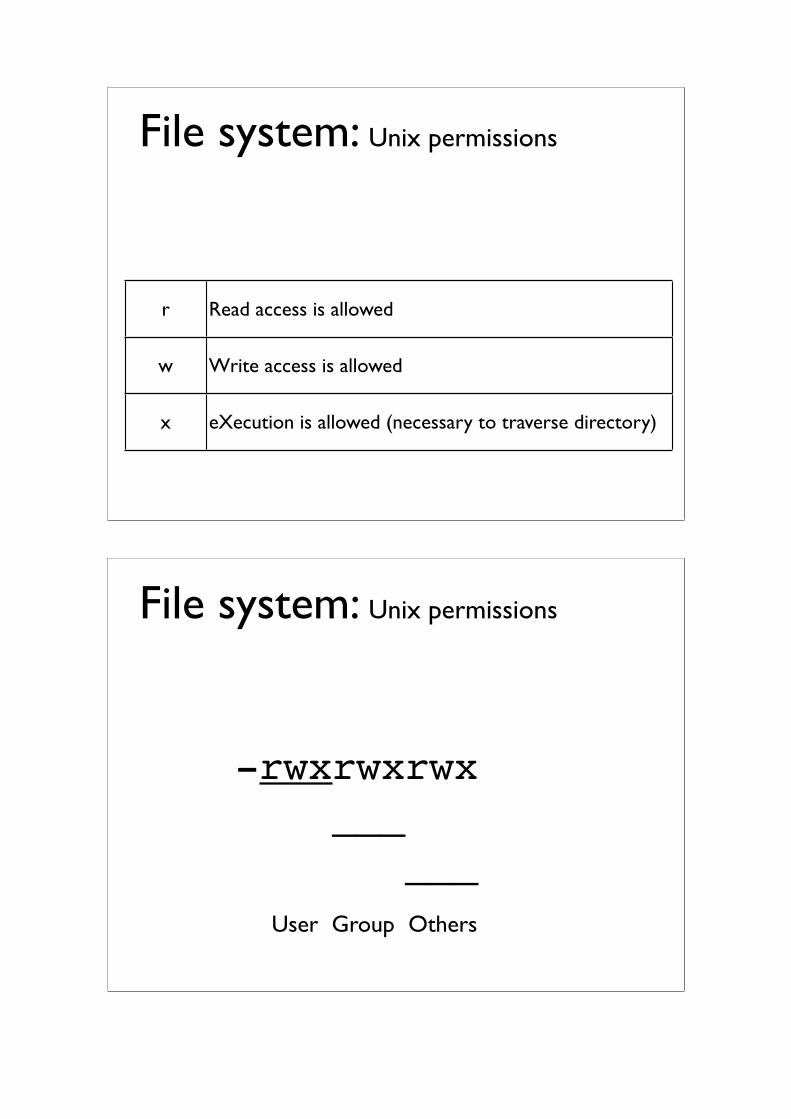
r Read access is allowed
w Write access is allowed
x eXecution is allowed (necessary to traverse directory)
File system: Unix permissions
-rwxrwxrwx ___ ___
User Group Others
File system: Unix permissions

view permissions:ls -l
change permissions:chmod <options> <filename>
File system: Unix permissions
less <filename>
‘h’ for help
Some commands:‘q’ to quit‘/’ to search for a pattern,
‘n’ for next occurence, ‘shift-n’ for previous
arrow keys and space to navigate‘g’ go to top‘G’ go to end
Viewing files
Editing files
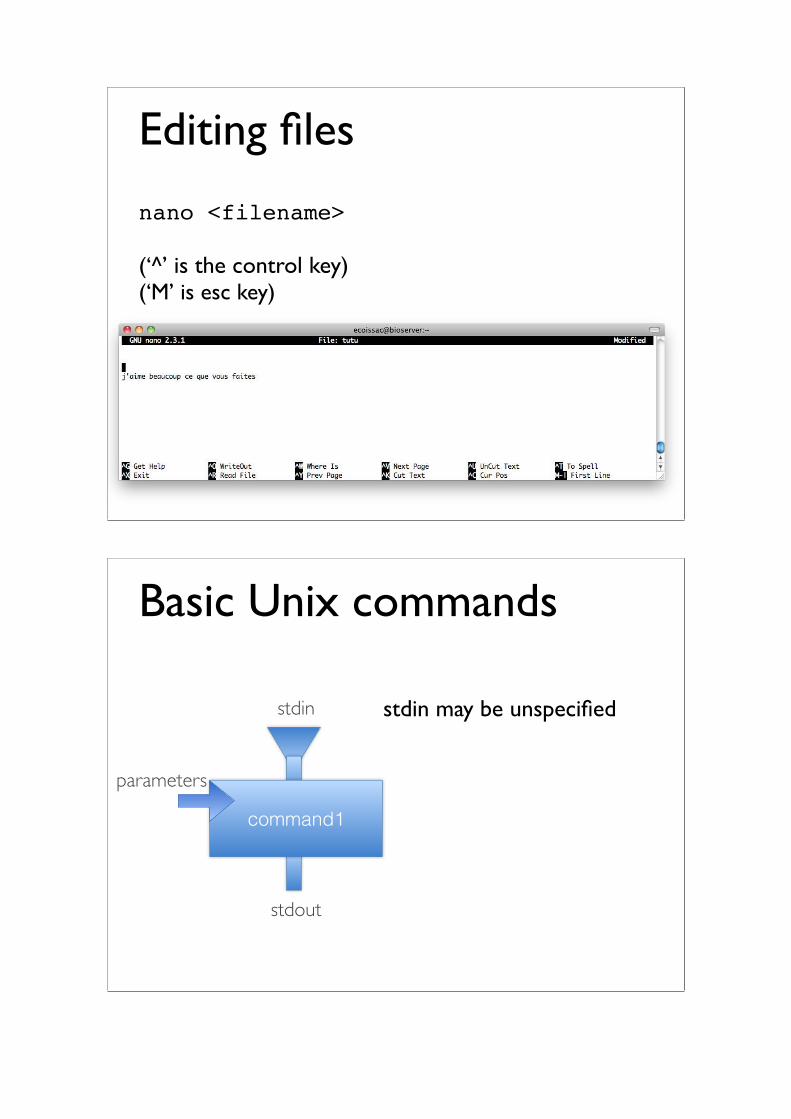
nano <filename>
(‘^’ is the control key)(‘M’ is esc key)
command1
stdin
stdout
parameters
stdin may be unspecified
Basic Unix commands
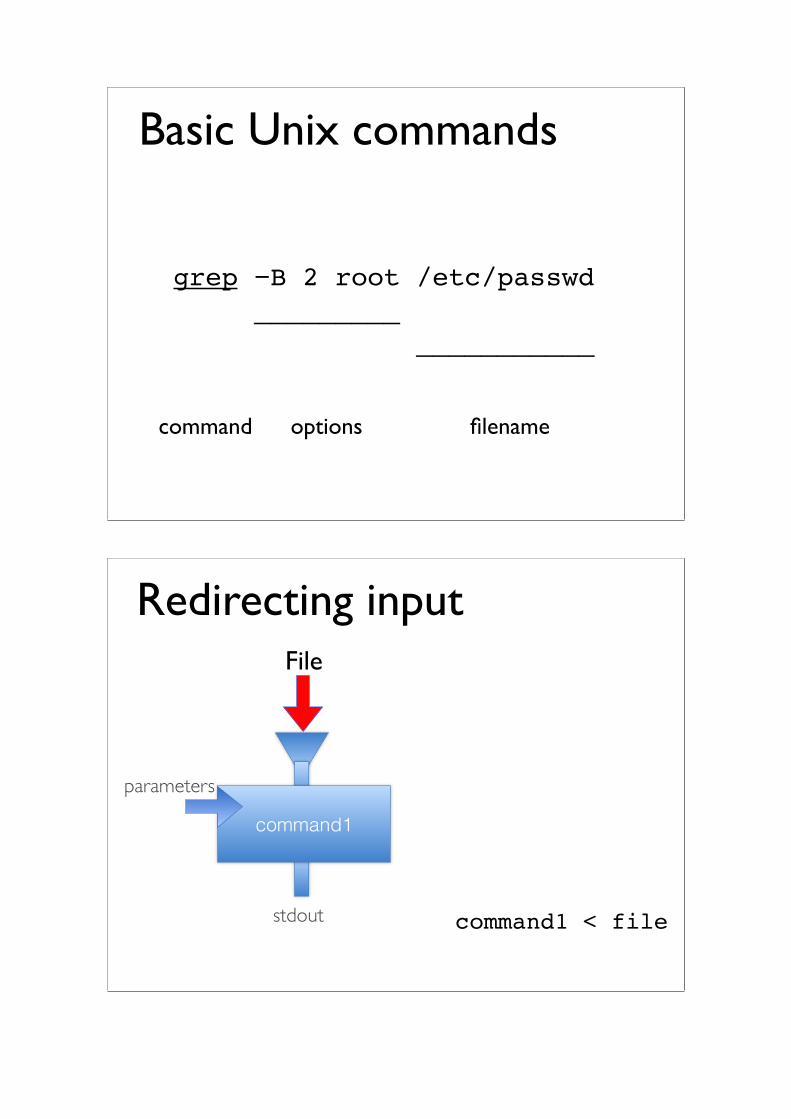
grep −B 2 root /etc/passwd _________ ___________
command options filename
Basic Unix commands
command1
parameters
File
command1 < file
Redirecting input
stdout

command1
stdin
parameters
File
Create or replace filecommand1 > file
Append to or create filecommand1 >> file
Redirecting output
command1
stdin
parameters
command2
stdout
command1 | command2
Redirecting output

man <command>
command -h
command --help
Getting help on commands
Usefull Unix commands
Printing on stdout the content of a filecat <filename>
Viewing only the first lines of a filehead [-<N>] <filename>
Viewing only the last lines of a filetail [-<N>] <filename>

Usefull Unix commands
Sorting sort [options] <filename>
Removing duplicated linesuniq [options] <filename>
Extracting specific column of a file cut [options] <filename>
Usefull Unix commands
Identifying differences between files diff [options] <filenames>
Joining files on the basis of column contentjoin [options] <filename> <filename>
Pasting files line by linepaste [options] <filenames>

Usefull Unix commandsCounting characters, words or lines wc [options] <filenames>
Searching for filesfind <directory> -name <pattern>
Processing files line by line for basic editingsed <command> <filename>
Searching files for patterngrep [options] <regular expression> <filename>
Regular expressions
In computing, a regular expression is a specific pattern that provides concise and flexible means to "match" (specify and recognize) strings of text, such as particular characters, words, or patterns of characters.
Common abbreviations for "regular expression" include regex and regexp.
http://en.wikipedia.org/wiki/Regular_expression

Regular expressions
Regular expressions can be drawn as ‘automata’
State
Initial state (‘D’ is for ‘début’, the french word for ‘start’)
Final stateTransition (with symbols, i.e. letters)
Regular expressions If you can reach the ‘Final state’ the expression is ‘matched’
Tutu et toto sont sur un bateau. Toto tombe à l’eau.
Obama: «If daughters get tattoos, we will too»
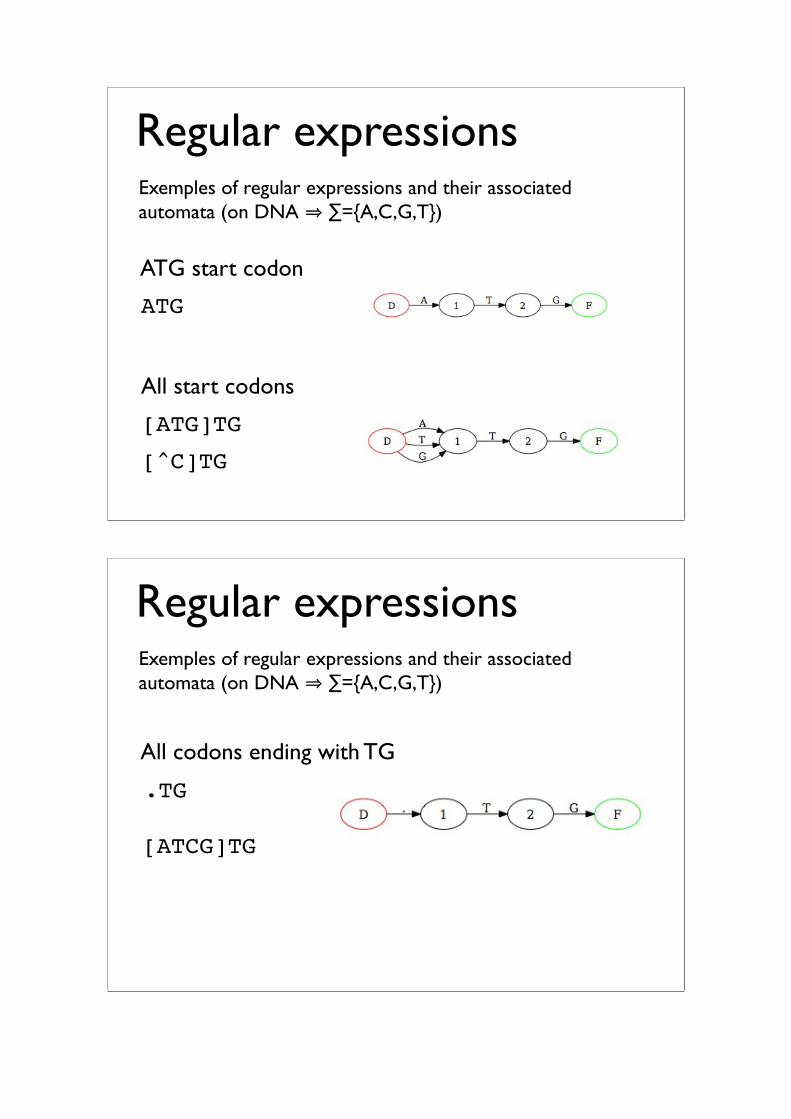
Regular expressions Exemples of regular expressions and their associated automata (on DNA ⇒ ∑={A,C,G,T})
ATG
ATG start codon
All start codons
[ATG]TG
[^C]TG
Regular expressions Exemples of regular expressions and their associated automata (on DNA ⇒ ∑={A,C,G,T})
All codons ending with TG
.TG
[ATCG]TG

Regular expressions Exemples of regular expressions and their associated automata (on DNA ⇒ ∑={A,C,G,T})
TTA+TTTTAA*TT
All DNA motifs of the form: TT, no or any number of A, TTTTA*TT
All DNA motifs of the form: TT, at least one A, TT
Regular expressions Special characters:
^ begining of the line$ end of the line[] set of characters to be matched[^] set of characters not to be matched| used to specify multiple choices{} repetitions characters (ex: TTA{3,5}TT, TTA{3}TT, TTA{3,}TT)* any number of times+ at least one? 0 or 1 time
Regular expressions Special characters:
() used to define sub-expressions\1 used to reuse first sub-expression\* the ‘*’ character\+ the ‘+’ character
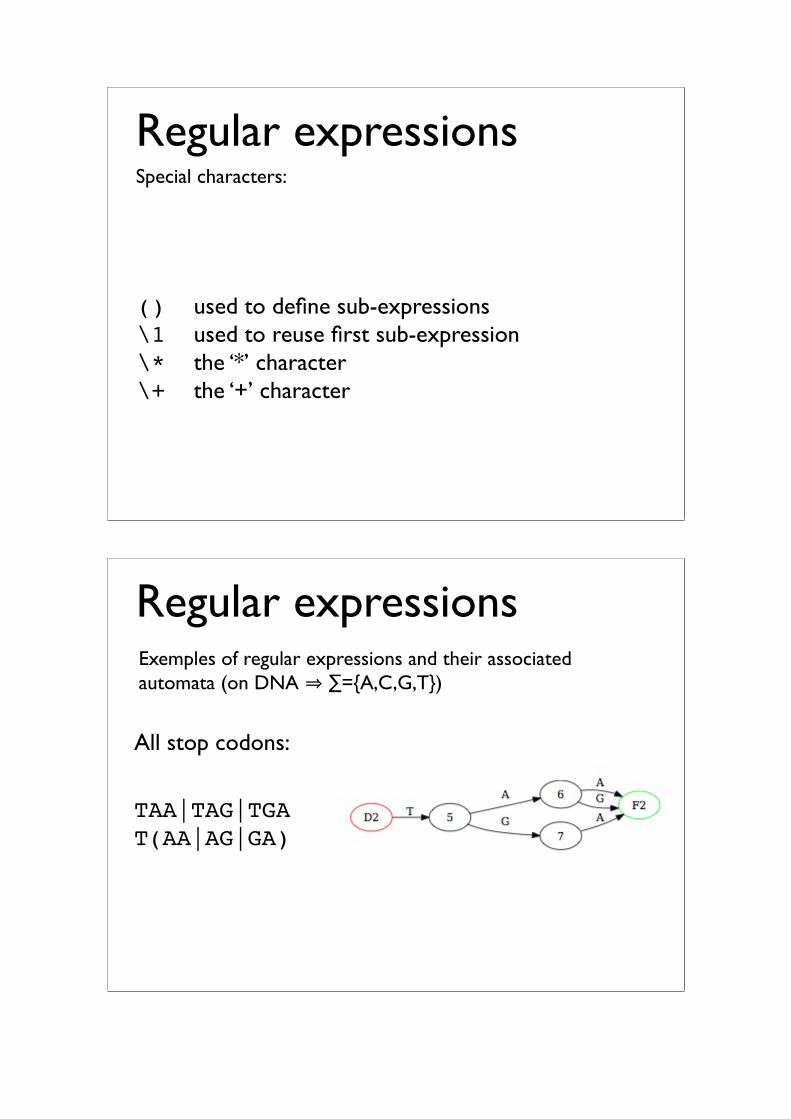
Regular expressions Exemples of regular expressions and their associated automata (on DNA ⇒ ∑={A,C,G,T})
TAA|TAG|TGAT(AA|AG|GA)
All stop codons:
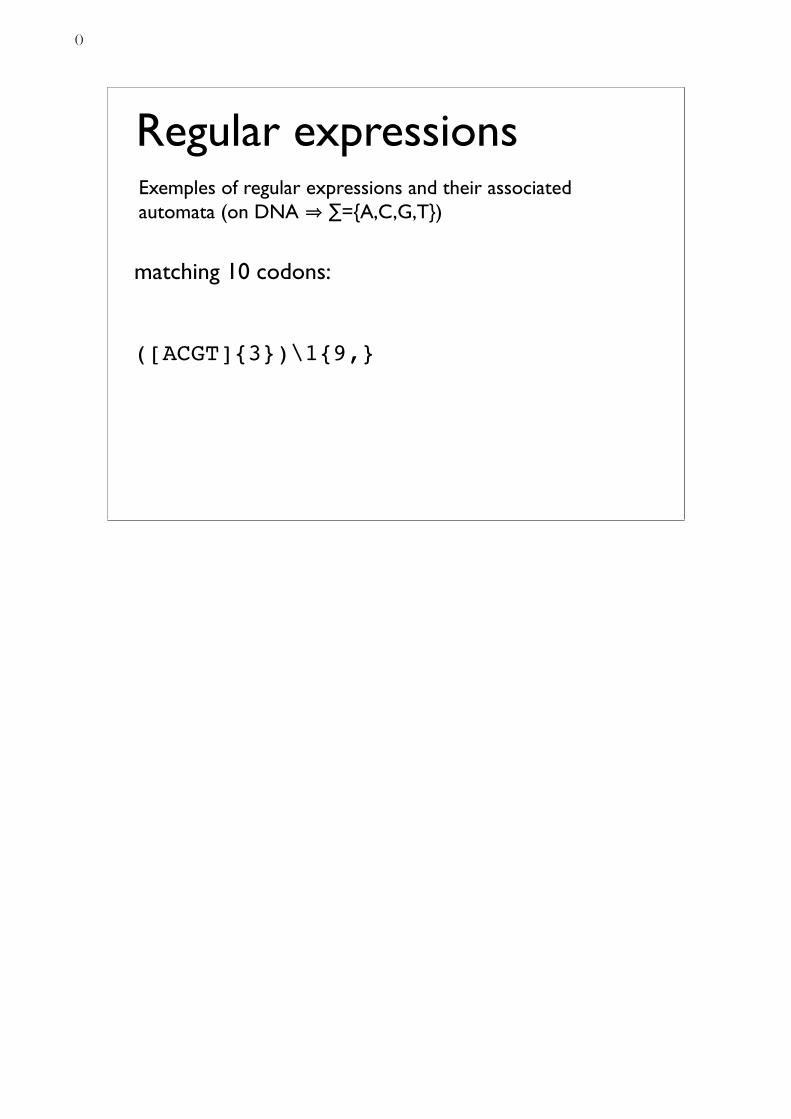
Regular expressions Exemples of regular expressions and their associated automata (on DNA ⇒ ∑={A,C,G,T})
([ACGT]{3})\1{9,}
matching 10 codons:
()

Revealing butterflies’, parasitoids’ and spiders’ rolesin an Arctic community
Helena Wirta⇤1, Elisabeth Weingartner2, Peter Hambäck2, and Tomas Roslin1
1Department of Agricultural Sciences, Latokartanonkaari 5, University ofHelsinki, FI-00014 Helsinki, Finland
2Department of Ecology, Environment and Plant Sciences, Stockholm University,SE-106 91 Stockholm, Sweden
All species in nature interact with other species. To understand how a communityfunctions, trophic interactions between species and their strengths need to be described.This then allows for testing and understanding how direct and indirect trophic interac-tions among species will contribute to structuring a community as well as how a com-munity will react to changes.
We dissect the trophic structure of a High Arctic community by identifying the in-teracting species using DNA barcodes. This allows for a new level of resolution, bothin terms of species identities as well as of resolving otherwise undetectable trophic links.First, interactions of lepidopteran hosts and parasitic wasps and flies were revealed byselectively amplifying and sequencing host remains from the gut of the parasitoid as wellas the parasitoid from within the host larvae. Secondly, we examined the lepidopteranand dipteran part of spidersí diet by sequencing the gut contents of spiders.
The food web is much more tightly knit than thought before. The host species areparasitized by more species than expected, and both the parasitoids as well as spidersare largely generalists, with overlapping diets. This suggests the community to be morestable than assumed, in an area under harsh abiotic conditions, yet due to warm up fast.
⇤Electronic address: [email protected]; Speaker
()
Species distribution modeling and climate change impactof biodiversity in Doi Suthep - Pui National Park aiding
by the power of DNA metabarcoding
Maslin Osathanunkul⇤1
1Department of Biology, Faculty of Science, Chiang Mai University, Chiang Mai50200, Thailand
The geographical distribution of biological species is highly correlated with climate,soil and other physical factors. This implies that species distributions will shift in re-sponse to climate change, and other perturbations. Predictive species distribution modelshave played an important role in both ecology and biogeography with a wide range ofapplications. But the questions are how or in which way climate change could haveeffect on species distributions? How quickly? To be able to make any predictions orgiving answer, biodiversity assessment would be needed. The Doi Suthep - Pui NationalPark is one of the parks in Thailand where high biodiversity of both flora and faunawas observed. It presents a mountain landscape with three main summits, the highesthaving an elevation of 1600m with a switch between deciduous to evergreen forest. Thisgeographical property makes the Doi Suthep - Pui National Park an excellent place tostudy the impact of climate change as the elevation gradient is obviously associated toa climatic gradient and a change in the ecosystem. Current methods for monitoring di-versity rely on time-consuming sampling and identification in which most cases requireexpertise in many taxonomical groups. This constraint obliges to limit studies to a smallsubset of the organisms in an ecosystem and to a small number of observations, thusignoring the largest part of the biodiversity. DNA metabarcoding is a recently developedmethod which has been proved to be a powerful approach for biodiversity assessmentand thus will be used in this study.
⇤Electronic address: [email protected]; Speaker
()
Factors responsible for high phenotypic diversity innorthern peatmosses (Sphagnum)
Narjes Yousefi⇤1, Kristian Hassel1, and Hans K. Stenøien†1
1Museum of Natural History and Archaeology, Norwegian university of scienceand technology (NTNU), Trondheim, Norway
Central Norway is an area with particular high diversity of peat mosses, almost allEuropean peat moss species are found in this area. Understanding factors contributingto evolutionary (phylogenetic) diversity, species diversity and functional diversity is im-portant for understanding the functional role of these organisms. Aim of this study isto understand the basis of the high diversity observed in complex traits in Sphagnumby using cultivation experiments, transplantation experiments and novel genome widemarkers (RADseq). This will contribute to understanding principles of genome diver-gence during speciation. Different phenotypic morphs of Sphagnum magellanicum, “greenmorph” in mire margin and “red morph” in bog center are collected. Transplantation ex-periment and cultivation experiments to quantify the genetic and environmental factorscontributing to quantitative variability in various characters separating the morphs andRAD sequencing to study genetic variability between morphs will be done.
⇤Electronic address: [email protected]; Speaker†Electronic address: [email protected]
()
A survey of the ecosystem of the groundwater amphipodCrangonyx islandicus
Ragnhildur Guðmundsdóttir⇤1 and Snæbjörn Pálsson1
1Department of Life and Environmental Science, University of Iceland
Two subterranean freshwater amphipod species were recently discovered in Iceland,Crangonyx islandicus and Crymostygious thingvallensis, both endemic and the only fresh-water amphipods known to the Icelandic fauna. These species are found within the vol-canic active zone in the groundwater system and genetic patterns within C. islandicushave shown that it has survived repeated glaciations in Iceland. Nothing is known ofthis newly discovered ecosystem but findings of such complex organisms as amphipodsin this subterranean environment points to an existence of other living taxa. Recentlyciliate epibionts were found accompanying the amphipods and other microorganisms asbacteria are likely to inhabit this system. With the use of the new environmental DNAmetabarcoding method we plan to explore this ecosystem further, and to discover theother species inhabiting this curious system.
⇤Electronic address: [email protected]; Speaker
()

Rapid construction of a comprehensive mitogenome library– Mitochondrion 10K project
Min Tang⇤1, Meihua Tan1, Guanliang Meng1, Xu Su1, Shenzhou Yang1, YiyuanLi2, Wenhui Song1, Qing Zhang1, Shanlin Liu1, and Xin Zhou†1
1China National Genebank, BGI-Shenzhen, Shenzhen, China, 5180832Department of Biological Sciences, University of Notre Dame, IN 46556
Classic DNA barcoding and metabarcoding approaches have been relying on one ortwo standard genes to differentiate species. A recent trend in metabarcoding is to directlysequence the mixed genomic-DNA without having to rely on PCR amplification, whichtypically introduces artifacts due to biased primer efficiencies. One obvious challenge tothis new approach is that the majority of NGS sequences cannot be utilized for speciesidentification due to the lack of reference for non-COI genes. Here we develop a new NGSapproach to rapidly build a reference library for whole mitogenomes in a cost-efficientfashion. In this pilot experiment, we sequence a mixture of 50 animal species withoutindividual tagging or PCR. With only 1 failure, most protein-coding MT genes weresuccessfully recovered for each of the mixed species. Our new pipeline delivers high-quality assemblies even from highly degraded DNA. And closely related species (e.g.,co-genus) can be successfully assembled separately. Based on the success of this pilottest, we propose a new initiative – MT10K – with an aim to sequence whole mitogenomesfor 10,000 animal species. Such dataset will significantly improve our knowledge onmitogenomes across animals and expand the application of metabarcoding to utilize fullset of MT DNA.
⇤Electronic address: [email protected]; Speaker†Electronic address: [email protected]
()

Reliability of nrDNA markers on tropical plants:the case of ITS-1
Amaia Iribar⇤1, Ludovic Gielly2, Lucie Zinger1, Pierre Taberlet2, and JérômeChave1
1Laboratoire EDB UMR 5174 CNRS Université Paul Sabatier Toulouse III bat4R1 118 route de Narbonne 31062 Toulouse, France
2Laboratoire d?Ecologie Alpine, CNRS UMR 5553, Université Joseph Fourier,BP 53, F-38041 Grenoble Cedex 9, France
In the last decade, several large-scale surveys on plant taxonomic and phylogenetic di-versity have used both chloroplastic and nuclear DNA (typically ITS) markers. However,some studies questioned the reliability of nuclear ribosomal DNA barcodes, due to theexistence of pseudogenes which may be preferentially sequenced than ITS. Consequently,the sequence obtained by Sanger sequencing (i.e. one sequence a specimen) may corre-spond to a pseudogene and not ITS, which may confuse inferences. Here, we evaluatepotential of the marker ITS-1 for species identification and phylogenetic inference whenusing next-generation sequencing (NGS; Illumina MiSeq Platform). Tropical plant speci-mens were amplified for the ITS1 region using universal plant primers and the ampliconswere deep-sequenced on an Illumina MiSeq Platform. On the order of 1000 sequenceswere obtained for each species. We were able to detect pseudogenes and also quantifythe extent of contamination, and PCR/sequencing errors. This method opens the wayfor analyses on the intraspecific variability of the ITS (by sequencing several individualsfrom same species). This will contribute to the development of an error estimation modelthat will improve the accuracy of pipelines for cleaning metabarcoding data.
⇤Electronic address: [email protected]; Speaker
()

Trophic cascades and tick-borne pathogens
Taal Levi⇤1, Felicia Keesing2, and Richard S. Ostfeld†2
1Oregon State University, Corvallis, OR 973312Cary Institute of Ecosystem Studies, Millbrook, NY 12545
The transmission of vector-borne zoonotic diseases to humans depends on multiplespecies interactions that influence host and vector abundance and infection prevalence.Recent research has revealed that many pathogens, including those causing Lyme dis-ease, babesiosis, and anaplasmosis, are transmitted most efficiently by hosts, such asrodents, that occupy low trophic levels. Consequently, changes in community structurethat increase the abundance or infection prevalence of these “pathogen amplifiers” arelikely to increase risk of transmission of infectious diseases. One potentially key driver ofcommunity change is the trophic cascade, in which an apex predator suppresses a smaller“mesopredator”, allowing small prey to increase in abundance. For example, coyotes havebeen shown to suppress numerous smaller predators; their suppression of fox popula-tions (Vulpes vulpes, Urocyon cinereoargentus, and Vulpes velox ) is the best documented.The resulting reduction in predation by mesopredators has led to increased rodent andsongbird diversity and increased nesting success of ducks. The range expansion and pop-ulation increase of coyotes in the US Northeast and Upper Midwest during the mid-20thcentury may have resulted in a trophic cascade that has allowed pathogen-amplifyingprey species to increase in abundance. If so, this would at least in part explain the in-crease in prevalence of tick-borne diseases in this region. Spatial and temporal patternsof human Lyme disease incidence are consistent with this hypothesis. We field-testedthe trophic cascade hypothesis for Lyme disease, babesiosis, and anaplasmosis for inDutchess County, NY. At each site we collected ticks and tested them for the pathogensthat cause these three diseases and assessed patterns of carnivore occupancy with baitedcamera traps. Bobcats had the strongest disease reducing effect - being associated withsignificantly reduced tick infection prevalence for all three pathogens. Coyotes and foxeshad a more nuanced impact on the probability of tick infection with each pathogen, butgenerally coyotes were associated with a higher probability of infection and foxes with alower one. If infectious diseases are sensitive to changes in predation, then the continu-ing widespread extirpation of top predators and the consequent restructuring of predatorcommunities may have important consequences for human health.
⇤Electronic address: [email protected]; Speaker†Electronic address: [email protected]
()
Using Environmental DNA to Census Fishes in MarineEcosystems
Jesse Port⇤1, Ryan Kelly2, and Kevan Yamahara†3
1Stanford University, 473 Via Ortega Rm 193, Stanford, CA 943052University of Washington, 3707 Brooklyn Ave, Seattle, WA 981053Stanford University, 473 Via Ortega Rm 193, Stanford, CA 94305
The ocean is a soup of its resident species’ genetic material, cast off as metabolicwaste or sloughed cells. Sampling this environmental DNA (eDNA) is a potentiallypowerful means of assessing whole biological communities. To test and validate and thisapproach, we sampled in both controlled and field environments, including a 4.5-million-liter mesocosm tank at the Monterey Bay Aquarium and in coastal waters of MontereyBay. Sequencing the eDNA present in these samples revealed that it is generally possibleto detect bony fishes, marine mammals and seabirds sufficient to identify organismsto taxonomic family- or genus-level using a short fragment of a single 12S ribosomalgene. We also estimated false-positive and false-negative detection rates by comparingthe eDNA results to the known mesocosm community or to dive surveys conductedin parallel with field sampling. Relative abundances of taxa as determined by eDNAwere also ground-truthed to known species biomass in the tank. eDNA has substantialpotential to become a core tool for environmental monitoring, but challenges remainbefore reliable quantitative assessments of ecological communities in the field becomepossible.
⇤Electronic address: [email protected]; Speaker†Electronic address: [email protected]
()

Designing new DNA Metabarcodes
Eric Coissac⇤
LECA UMR 5553 CNRS/Université Grenoble Alpes,BP 53 2233 Rue de la Piscine, 38041 Grenoble Cedex 9
Environmental DNA metabarcoding is at the same time similar and different withthe classical taxonomical DNA Barcoding. The aims of environmental studies and thetechnical constraints oblige most of the time to compare several sets of primers andeventually to design new primers dedicated to a specific study. I will discuss during thispresentation about bioinformatics approaches allowing an objective estimation of therelative qualities of several PCR primer pairs. Based on these method, it is possible todevelop software selecting new primer pairs by maximizing these criteria in the contextof a set of experimental constraints defined by the biologist.
⇤Electronic address: [email protected]
()

DNA metabarcoding: technical aspects
Pierre Taberlet⇤
LECA UMR 5553 CNRS/Université Grenoble Alpes,BP 53 2233 Rue de la Piscine, 38041 Grenoble Cedex 9
This presentation concerns the technical aspects of DNA metabarcoding, from thefield to the bench. After a brief introduction about the metabarcoding protocol, thefirst topic will be the sampling design, both for terrestrial and aquatic environments.Concerning soil sampling in terrestrial environments, the sampling strategy should beadjusted according to the scientific question (pooling soil cores, sampling on a grid, etc.).The filtration seems to be the best strategy for sampling environmental DNA in aquaticecosystems. The second topic will be the DNA extraction step, with a special focus onthe isolation of extracellular DNA from soil samples. If fungi and bacteria are going tobe analysed, it is important to extract DNA as soon as possible after the sampling in thefield. The third topic will deal with the constraint of trying to set up very large-scaleanalysis, with hundreds or even thousands of samples. As it is not possible to analyseseparately the different samples (only large-scale experiments are possible when usingnext generation sequencers), a pooling system must be implemented, by adding a DNA-tag on the 5’end of the primers (in addition to the possibility to tag librairies). Finally,we will examine the different adjustments that can be implemented in order to limit PCRand sequencing artifacts (polymerase, different type of primers, etc.).
⇤Electronic address: [email protected]; Speaker
()
Practical IIIn silico DNA metabarcoding marker design
Frédéric Boyer⇤1, Aurélie Bonin†1, and Eric Coissac‡1
1LECA UMR 5553 CNRS/Université Joseph Fourier, BP 53 2233 Rue de laPiscine, 38041 Grenoble Cedex 9
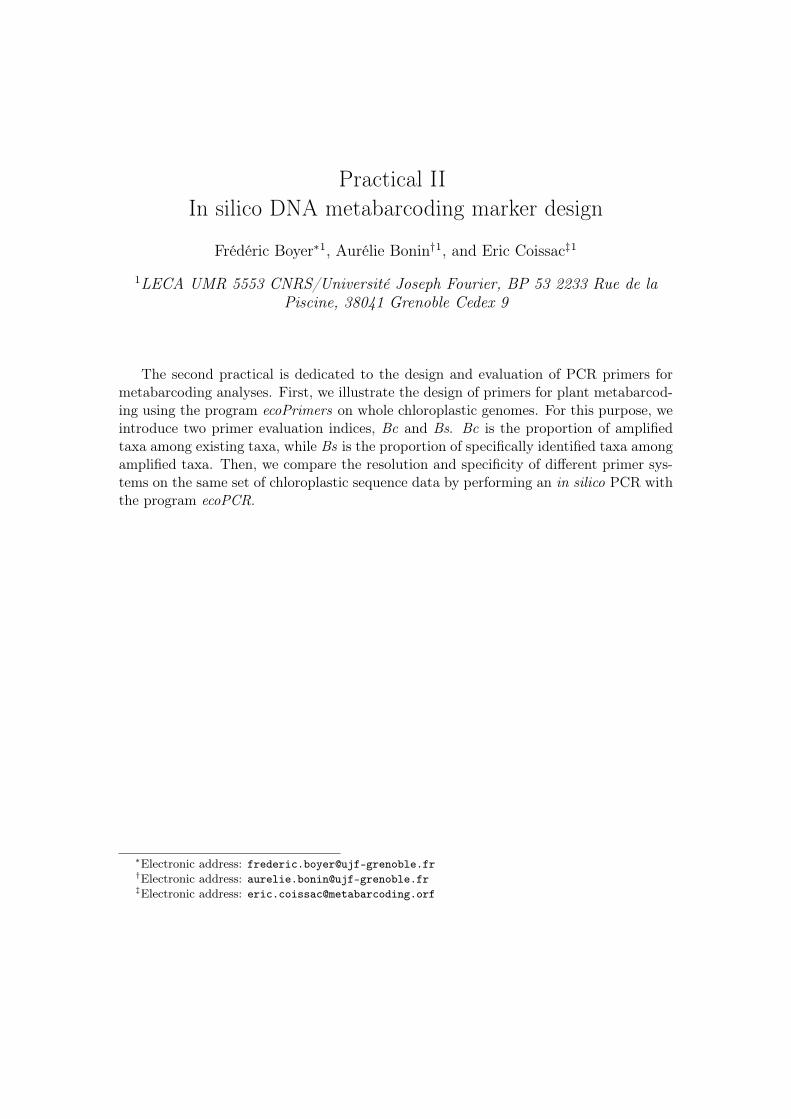
The second practical is dedicated to the design and evaluation of PCR primers formetabarcoding analyses. First, we illustrate the design of primers for plant metabarcod-ing using the program ecoPrimers on whole chloroplastic genomes. For this purpose, weintroduce two primer evaluation indices, Bc and Bs. Bc is the proportion of amplifiedtaxa among existing taxa, while Bs is the proportion of specifically identified taxa amongamplified taxa. Then, we compare the resolution and specificity of different primer sys-tems on the same set of chloroplastic sequence data by performing an in silico PCR withthe program ecoPCR.
⇤Electronic address: [email protected]†Electronic address: [email protected]‡Electronic address: [email protected]
DNA METABARCODING
ATCGCTATCGCTACGGCTACAGGGCTAGPCR
amplification & sequencing
DNA extraction Taxonomical
assignation ?
Environmental sample
Low quality DNA
DNA metabarcodes Reference DB
1. PCR primers & tagsdesign
2. from raw sequencesto barcodes
3. from barcodes totaxa (OTUs) list
Bioi
nfor
mat
ics
CASE STUDY:
Primer design for plants
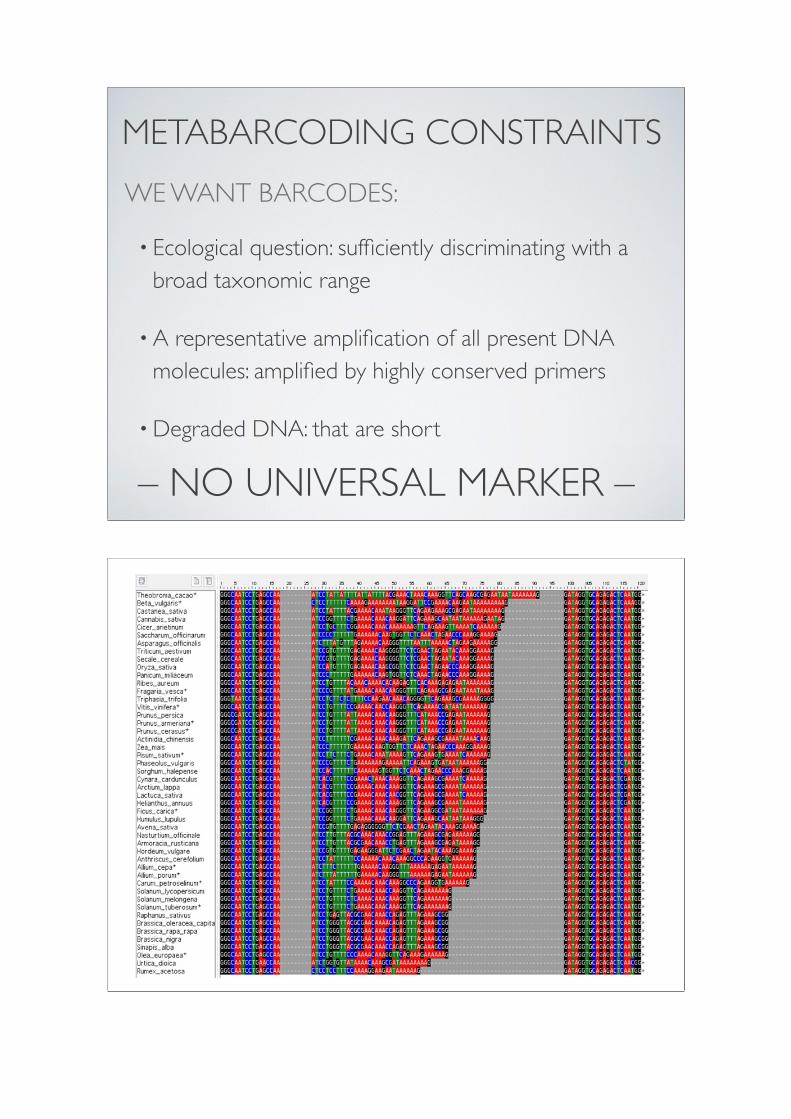
METABARCODING CONSTRAINTS
– NO UNIVERSAL MARKER –
WE WANT BARCODES:
• Ecological question: sufficiently discriminating with a broad taxonomic range
• A representative amplification of all present DNA molecules: amplified by highly conserved primers
• Degraded DNA: that are short

QUALIFYING BARCODES USING BOTH INDICES BC & BS
P1 P2R
BC: Coverage
BS: Specificity
QUALIFYING BARCODES USING BOTH INDICES BC & BS
P1 P2R
Reference database T
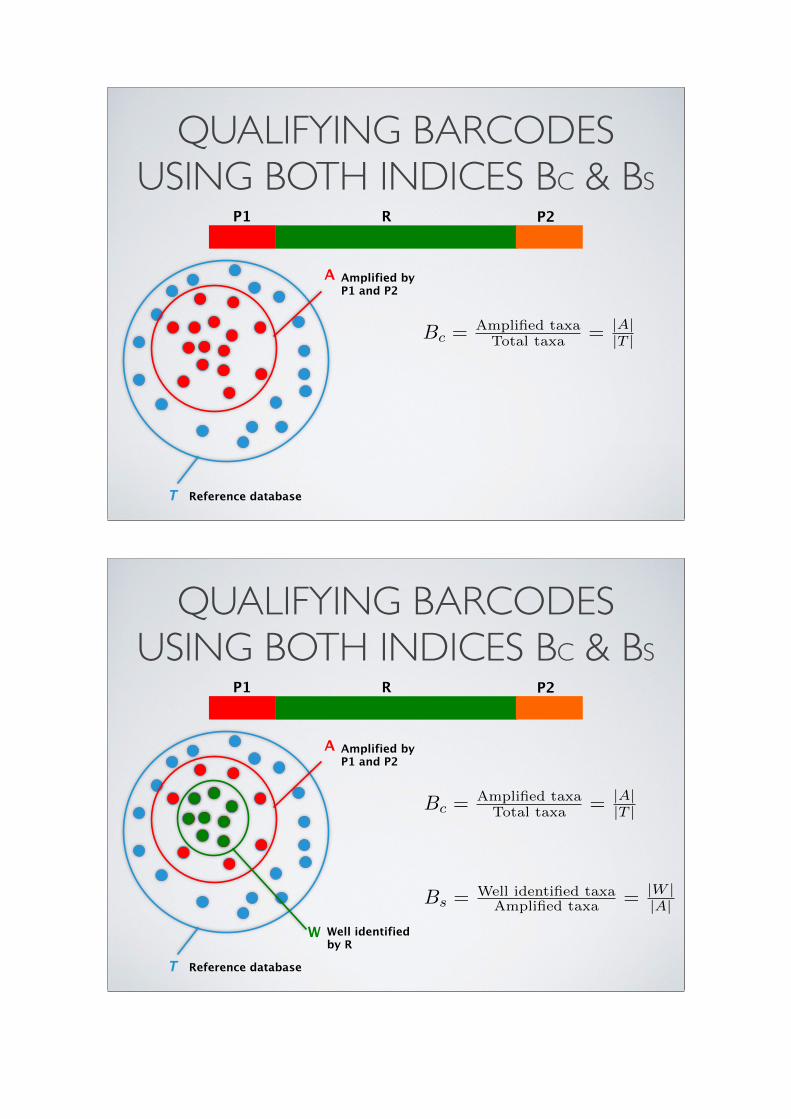
QUALIFYING BARCODES USING BOTH INDICES BC & BS
A Amplified by P1 and P2
Reference database T
P1 P2R
Bc = Amplified taxaTotal taxa = |A|
|T |
QUALIFYING BARCODES USING BOTH INDICES BC & BS
W Well identified by R
P1 P2R
Bc = Amplified taxaTotal taxa = |A|
|T |
A Amplified by P1 and P2
Bs = Well identified taxaAmplified taxa = |W |
|A|
Reference database T
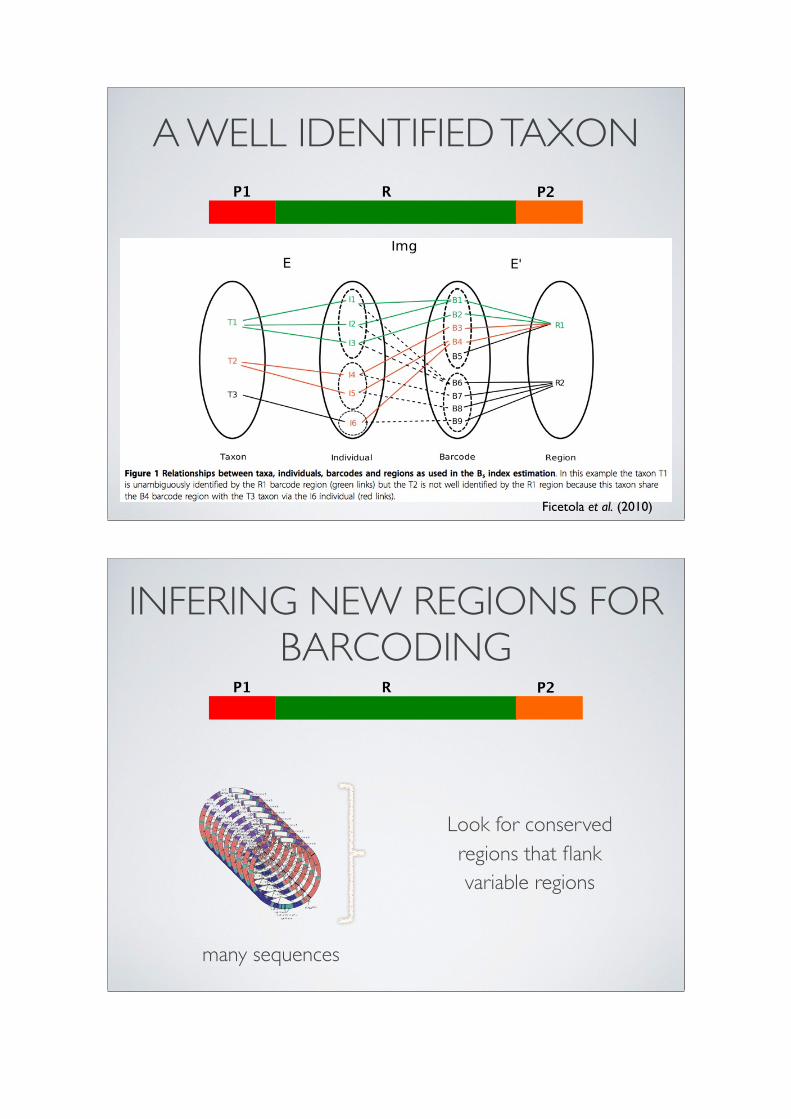
A WELL IDENTIFIED TAXONP1 P2R
Ficetola et al. (2010)
INFERING NEW REGIONS FOR BARCODING
P1 P2R
Look for conserved regions that flank variable regions
many sequences
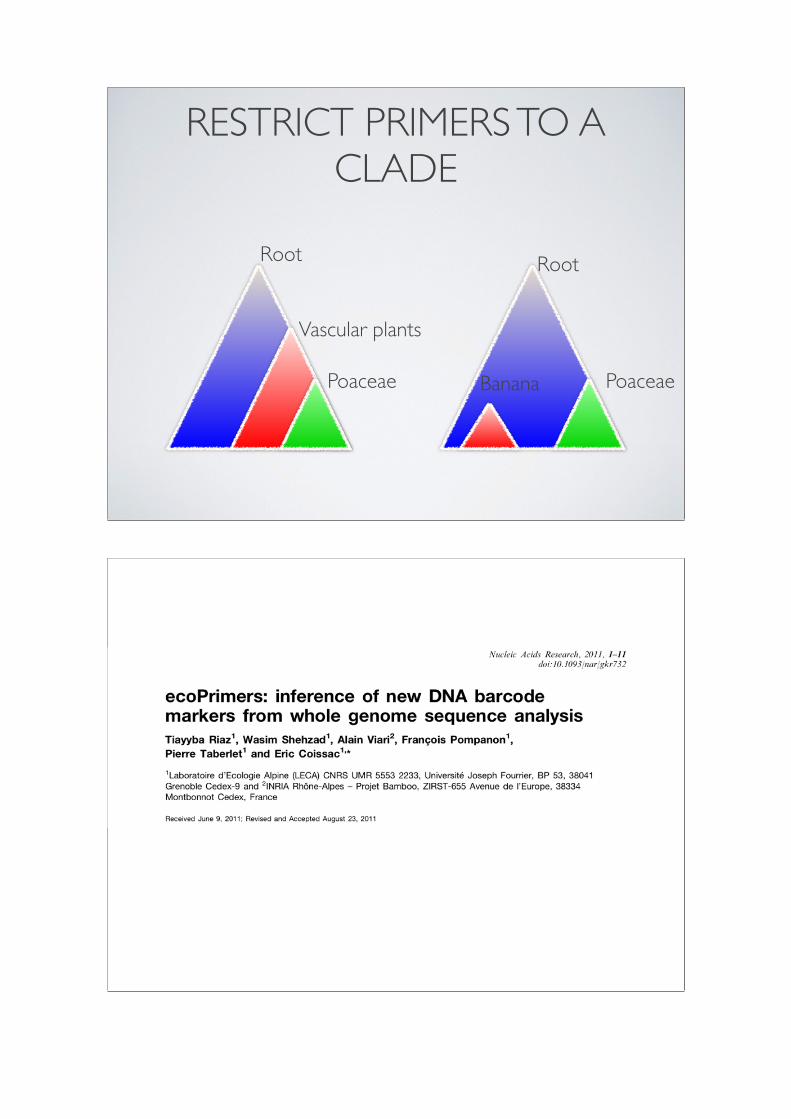
RESTRICT PRIMERS TO A CLADE
Vascular plants
Poaceae Poaceae
Root Root
Banana

CASE STUDY:
Design primers on the chloroplastic genomes

1. Get chloroplasts genomeswget -m -np 'ftp://ftp.ncbi.nih.gov/genomes/Chloroplasts/' -A.gbk
mkdir CHLOROPLASTSfind ftp.ncbi.nih.gov -name \*.gbk -exec mv {} CHLOROPLASTS\/ \;rm -R ftp.ncbi.nih.gov
2. Get the Taxonomymkdir TAXOcd TAXOwget ftp://ftp.ncbi.nih.gov/pub/taxonomy/taxdump.tar.gztar -zxvf taxdump.tar.gzcd ..
3. Format the dataobiconvert --genbank -t ./TAXO -d chloro --ecopcrDB-output=chloro CHLOROPLASTS/*.gbkmkdir ecodbmv chloro.?dx ecodb/mv chloro_001.sdx ecodb/
4. Run ecoPrimers to design barcodes#get taxid for tracheophyta: 58023ecofind -d ecodb/chloro TracheophytaecoPrimers -d ecodb/chloro -O 18 -e 3 -l 10 -L 120 -c -r 58023 > Tracheophyta_O18e3l10L120c.ecoprimers
~ 10 mins
~ 4 hours
4. Run ecoPrimers to design barcodes
Raw results## ecoPrimer version 0.3# Rank level optimisation : species# max error count by oligonucleotide : 3## Restricted to taxon:# 58023 : Tracheophyta (no rank)## strict primer quorum : 0.70# example quorum : 0.90# counterexample quorum : 0.10## database : chloro# Database is constituted of 246 examples corresponding to 239 species# and 0 counterexamples corresponding to 0 species## amplifiat length between [10,120] bp# DB sequences are considered as circular# Pairs having specificity less than 0.60 will be ignored#
0! CCATTGAGTCTCTGCACC! GGCAATCCTGAGCCAAAT! 56.1! 25.7! 56.1! 39.8! 10! 9! GG! 241! 0! 0.980! 234! 0! 0.979! 149! 0.637! 13! 96! 50.51! ! 1! CAATCCTGAGCCAAATCC! CCATTGAGTCTCTGCACC! 54.0! 39.3! 56.1! 25.7! 9! 10! GG! 241! 0! 0.980! 234! 0! 0.979! 149! 0.637! 11! 94! 48.51! ! 2! CAATCCTGAGCCAAATCC! TGAGTCTCTGCACCTATC! 54.0! 39.3! 53.5! 35.5! 9! 9! GG! 238! 0! 0.967! 231! 0! 0.967! 146! 0.632! 13! 90! 44.97! ! 3! GAGTCTCTGCACCTATCC! GGCAATCCTGAGCCAAAT! 54.5! 36.0! 56.1! 39.8! 10! 9! GG! 238! 0! 0.967! 231! 0! 0.967! 146! 0.632! 14! 91! 45.97! ! 4! GGCAATCCTGAGCCAAAT! TGAGTCTCTGCACCTATC! 56.1! 39.8! 53.5! 35.5! 9! 9! GG! 238! 0! 0.967! 231! 0! 0.967! 146! 0.632! 15! 92! 46.97! ! 5! CAATCCTGAGCCAAATCC! GAGTCTCTGCACCTATCC! 54.0! 39.3! 54.5! 36.0! 9! 10! GG! 238! 0! 0.967! 231! 0! 0.967! 146! 0.632! 12! 89! 43.97! ! 6! CAATCCTGAGCCAAATCC! GCTTCCATTGAGTCTCTG! 54.0! 39.3! 53.4! 34.3! 9! 9! GG! 237! 0! 0.963! 230! 0! 0.962! 145! 0.630! 15! 98! 52.61! ! 7! CAATCCTGAGCCAAATCC! TTCCATTGAGTCTCTGCA! 54.0! 39.3! 53.7! 39.7! 9! 8! GG! 237! 0! 0.963! 230! 0! 0.962! 145! 0.630! 13! 96! 50.61! ! 8! GCAATCCTGAGCCAAATC! TTCCATTGAGTCTCTGCA! 54.8! 38.3! 53.7! 39.7! 9! 8! GG! 237! 0! 0.963! 230! 0! 0.962! 145! 0.630! 14! 97! 51.61! ! 9! CTTCCATTGAGTCTCTGC! GGCAATCCTGAGCCAAAT! 53.4! 39.2! 56.1! 39.8! 9! 9! GG! 237! 0! 0.963! 230! 0! 0.962! 145! 0.630! 16! 99! 53.61! ! 10! GCTTCCATTGAGTCTCTG! GGCAATCCTGAGCCAAAT! 53.4! 34.3! 56.1! 39.8! 9! 9! GG! 237! 0! 0.963! 230! 0! 0.962! 145! 0.630! 17! 100! 54.61! ! 11! CAATCCTGAGCCAAATCC! TCCATTGAGTCTCTGCAC! 54.0! 39.3! 54.7! 40.1! 9! 9! GG! 237! 0! 0.963! 230! 0! 0.962! 145! 0.630! 12! 95! 49.61! ! 12! GCAATCCTGAGCCAAATC! TCCATTGAGTCTCTGCAC! 54.8! 38.3! 54.7! 40.1! 9! 9! GG! 237! 0! 0.963! 230! 0! 0.962! 145! 0.630! 13! 96! 50.61! ! 13! GGGCAATCCTGAGCCAAA! TCCATTGAGTCTCTGCAC! 58.4! 43.7! 54.7! 40.1! 10! 9! GG! 237! 0! 0.963! 230! 0! 0.962! 145! 0.630! 15! 98! 52.61! ! 14! GGGCAATCCTGAGCCAAA! TTCCATTGAGTCTCTGCA! 58.4! 43.7! 53.7! 39.7! 10! 8! GG! 237! 0! 0.963! 230! 0! 0.962! 145! 0.630! 16! 99! 53.61! ! 15! CAATCCTGAGCCAAATCC! CTTCCATTGAGTCTCTGC! 54.0! 39.3! 53.4! 39.2! 9! 9! GG! 237! 0! 0.963! 230! 0! 0.962! 145! 0.630! 14! 97! 51.61! ! 16! GGCAATCCTGAGCCAAAT! TCCATTGAGTCTCTGCAC! 56.1! 39.8! 54.7! 40.1! 9! 9! GG! 237! 0! 0.963! 230! 0! 0.962! 145! 0.630! 14! 97! 51.61! ! 17! GGCAATCCTGAGCCAAAT! TTCCATTGAGTCTCTGCA! 56.1! 39.8! 53.7! 39.7! 9! 8! GG! 237! 0! 0.963! 230! 0! 0.962! 145! 0.630! 15! 98! 52.61! ! 18! CCATTGAGTCTCTGCACC! GGGCAATCCTGAGCCAAA! 56.1! 25.7! 58.4! 43.7! 10! 10! GG! 241! 0! 0.980! 234! 0! 0.979! 142! 0.607! 14! 97! 51.51! ! 19! ATTGAGTCTCTGCACCTA! GGCAATCCTGAGCCAAAT! 52.7! 29.2! 56.1! 39.8! 8! 9! GG! 241! 0! 0.980! 234! 0! 0.979! 142! 0.607! 11! 94! 48.51! ! 20! CATTGAGTCTCTGCACCT! GGCAATCCTGAGCCAAAT! 54.7! 23.8! 56.1! 39.8! 9! 9! GG! 241! 0! 0.980! 234! 0! 0.979! 142! 0.607! 12! 95! 49.51! ! 21! CATTGAGTCTCTGCACCT! GGGCAATCCTGAGCCAAA! 54.7! 23.8! 58.4! 43.7! 9! 10! GG! 241! 0! 0.980! 234! 0! 0.979! 142! 0.607! 13! 96! 50.51! ! 22! CATTGAGTCTCTGCACCT! GCAATCCTGAGCCAAATC! 54.7! 23.8! 54.8! 38.3! 9! 9! GG! 241! 0! 0.980! 234! 0! 0.979! 142! 0.607! 11! 94! 48.51! ! 23! CCATTGAGTCTCTGCACC! GCAATCCTGAGCCAAATC! 56.1! 25.7! 54.8! 38.3! 10! 9! GG! 241! 0! 0.980! 234! 0! 0.979! 142! 0.607! 12! 95! 49.51! ! 24! ATTGAGTCTCTGCACCTA! GGGCAATCCTGAGCCAAA! 52.7! 29.2! 58.4! 43.7! 8! 10! GG! 241! 0! 0.980! 234! 0! 0.979! 142! 0.607! 12! 95! 49.51! ! 25! ATTGAGTCTCTGCACCTA! GCAATCCTGAGCCAAATC! 52.7! 29.2! 54.8! 38.3! 8! 9! GG! 239! 0! 0.972! 232! 0! 0.971! 140! 0.603! 11! 93! 47.82! ! 26! CAATCCTGAGCCAAATCC! CATTGAGTCTCTGCACCT! 54.0! 39.3! 54.7! 23.8! 9! 9! GG! 239! 0! 0.972! 232! 0! 0.971! 140! 0.603! 11! 93! 47.82! ! 27! ATTGAGTCTCTGCACCTA! CAATCCTGAGCCAAATCC! 52.7! 29.2! 54.0! 39.3! 8! 9! GG! 238! 0! 0.967! 231! 0! 0.967! 139! 0.602! 15! 92! 46.97! ! 28! AGCTTCCATTGAGTCTCT! CAATCCTGAGCCAAATCC! 53.0! 26.8! 54.0! 33.6! 8! 9! GG! 237! 0! 0.963! 230! 0! 0.962! 138! 0.600! 16! 99! 53.65! ! 29! CTTCCATTGAGTCTCTGC! GCAATCCTGAGCCAAATC! 53.4! 39.2! 54.8! 38.3! 9! 9! GG! 237! 0! 0.963! 230! 0! 0.962! 138! 0.600! 15! 98! 52.61! ! 30! AGCTTCCATTGAGTCTCT! GGCAATCCTGAGCCAAAT! 53.0! 26.8! 56.1! 39.8! 8! 9! GG! 237! 0! 0.963! 230! 0! 0.962! 138! 0.600! 18! 101! 55.65! ! 31! AGCTTCCATTGAGTCTCT! GGGCAATCCTGAGCCAAA! 53.0! 26.8! 58.4! 43.7! 8! 10! GG! 237! 0! 0.963! 230! 0! 0.962! 138! 0.600! 19! 102! 56.65! ! 32! GCTTCCATTGAGTCTCTG! GGGCAATCCTGAGCCAAA! 53.4! 34.3! 58.4! 43.7! 9! 10! GG! 237! 0! 0.963! 230! 0! 0.962! 138! 0.600! 18! 101! 55.61! ! 33! CTTCCATTGAGTCTCTGC! GGGCAATCCTGAGCCAAA! 53.4! 39.2! 58.4! 43.7! 9! 10! GG! 237! 0! 0.963! 230! 0! 0.962! 138! 0.600! 17! 100! 54.61! ! 34! GCAATCCTGAGCCAAATC! GCTTCCATTGAGTCTCTG! 54.8! 38.3! 53.4! 34.3! 9! 9! GG! 237! 0! 0.963! 230! 0! 0.962! 138! 0.600! 16! 99! 53.61! ! 35! AGCTTCCATTGAGTCTCT! GCAATCCTGAGCCAAATC! 53.0! 26.8! 54.8! 38.3! 8! 9! GG! 237! 0! 0.963! 230! 0! 0.962! 138! 0.600! 17! 100! 54.65! !

0 serial number
CCATTGAGTCTCTGCACC primer1
GGCAATCCTGAGCCAAAT primer2
56.1 primer1 Tm without mismatch
56.1 primer2 Tm without mismatch
10 primer1 G+C count
9 primer2 G+C count
241 amplified example sequence count
234 amplified example taxa count
0.979 ratio of amplified example taxa versus all example taxa (Bc index)
149 unambiguously identified example taxa count
0.637 ratio of specificity unambiguously identified example taxa versus all example taxa (Bs index)
13 minimum amplified length
96 maximum amplified length
50.51 average amplified length
4. Run ecoPrimers to design barcodes
First primer pair0 CCATTGAGTCTCTGCACC GGCAATCCTGAGCCAAAT 56.1 25.7 56.1 39.8 10 9 GG 241 0 0.980 234 0 0.979 149 0.637 13 96 50.51
g h Taberlet, et al. (2007)
CASE STUDY:
Comparing primers
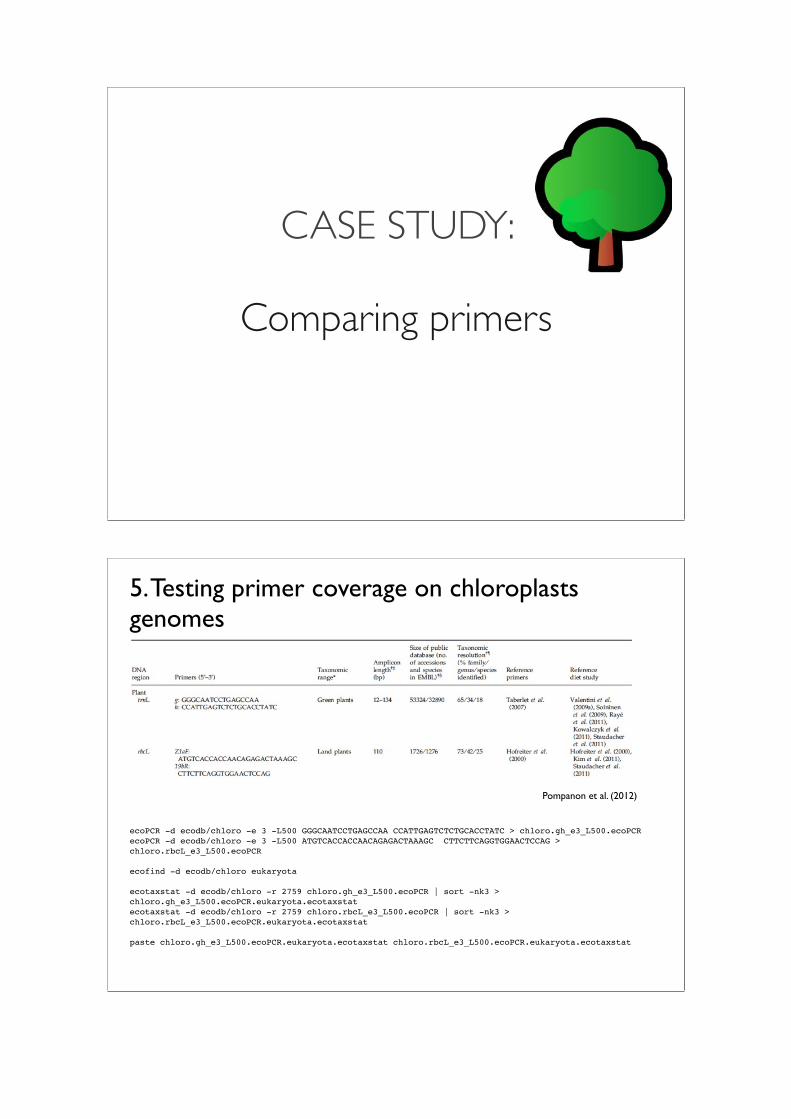
5. Testing primer coverage on chloroplasts genomes
ecoPCR -d ecodb/chloro -e 3 -L500 GGGCAATCCTGAGCCAA CCATTGAGTCTCTGCACCTATC > chloro.gh_e3_L500.ecoPCRecoPCR -d ecodb/chloro -e 3 -L500 ATGTCACCACCAACAGAGACTAAAGC CTTCTTCAGGTGGAACTCCAG > chloro.rbcL_e3_L500.ecoPCR
ecofind -d ecodb/chloro eukaryota
ecotaxstat -d ecodb/chloro -r 2759 chloro.gh_e3_L500.ecoPCR | sort -nk3 > chloro.gh_e3_L500.ecoPCR.eukaryota.ecotaxstatecotaxstat -d ecodb/chloro -r 2759 chloro.rbcL_e3_L500.ecoPCR | sort -nk3 > chloro.rbcL_e3_L500.ecoPCR.eukaryota.ecotaxstat
paste chloro.gh_e3_L500.ecoPCR.eukaryota.ecotaxstat chloro.rbcL_e3_L500.ecoPCR.eukaryota.ecotaxstat
Pompanon et al. (2012)

kingdom
superclass
superkingdom
suborder
subgenus
varietas
phylum
subclass
subtribe
subspecies
subfamily
class
tribe
order
family
genus
species
0
20
40
60
80
100
kingdom
superclass
superkingdom
suborder
subgenus
varietas
phylum
subclass
subtribe
subspecies
subfamily
class
tribe
order
family
genus
species
0
50
100
150
200
250
300
dbghrbcl
%#
5. Testing primer coverage on chloroplasts genomes
6. Testing primer resolution on chloroplasts genomesecotaxspecificity -d ecodb/chloro chloro.gh_e3_L500.ecoPCR | sort -nk3 > chloro.gh_e3_L500.ecoPCR.ecotaxspecificity ecotaxspecificity -d ecodb/chloro chloro.rbcL_e3_L500.ecoPCR | sort -nk3 > chloro.rbcL_e3_L500.ecoPCR.ecotaxspecificity
kingdom
suborder
superclass
superkingdom
phylum
subgenus
varietas
subclass
subtribe
class
subspecies
subfamily
order
tribe
family
genus
species
0
50
100
150
200
kingdom
suborder
superclass
superkingdom
phylum
subgenus
varietas
subclass
subtribe
class
subspecies
subfamily
order
tribe
family
genus
species
0
20
40
60
80
100
gh
rbcl%#
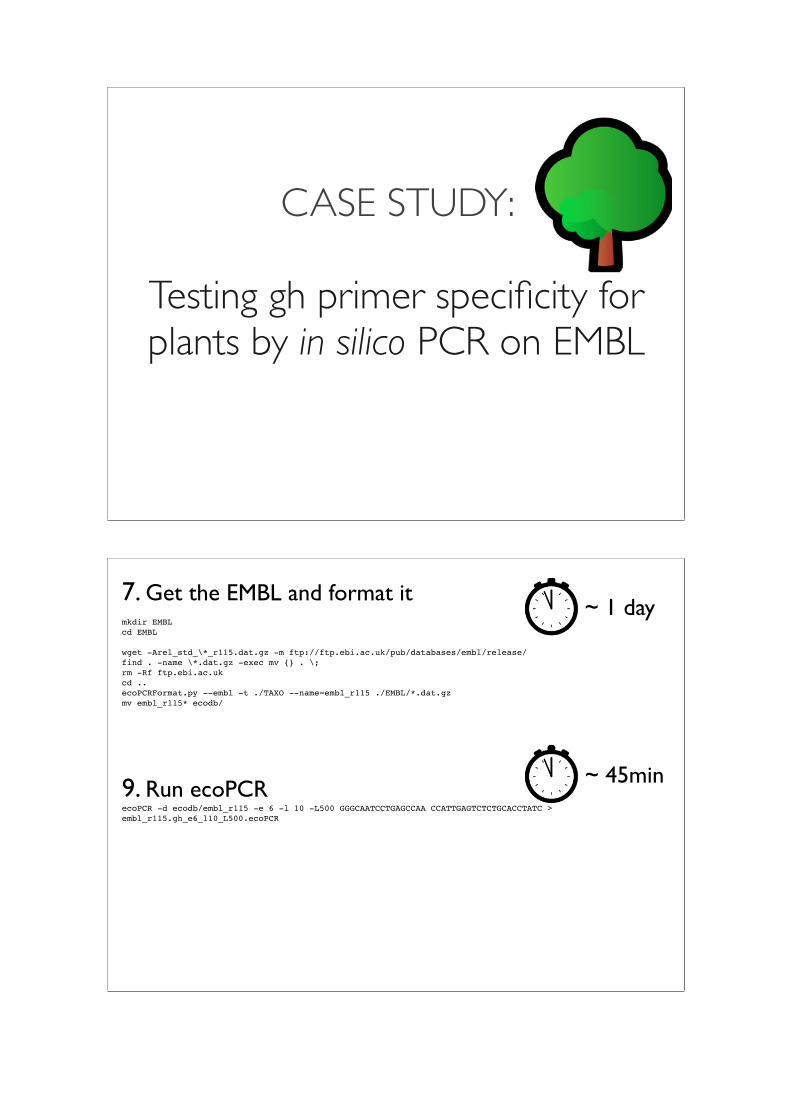
CASE STUDY:
Testing gh primer specificity for plants by in silico PCR on EMBL
7. Get the EMBL and format itmkdir EMBLcd EMBL
wget -Arel_std_\*_r115.dat.gz -m ftp://ftp.ebi.ac.uk/pub/databases/embl/release/find . -name \*.dat.gz -exec mv {} . \;rm -Rf ftp.ebi.ac.ukcd ..ecoPCRFormat.py --embl -t ./TAXO --name=embl_r115 ./EMBL/*.dat.gzmv embl_r115* ecodb/
9. Run ecoPCRecoPCR -d ecodb/embl_r115 -e 6 -l 10 -L500 GGGCAATCCTGAGCCAA CCATTGAGTCTCTGCACCTATC > embl_r115.gh_e6_l10_L500.ecoPCR
~ 45min
~ 1 day
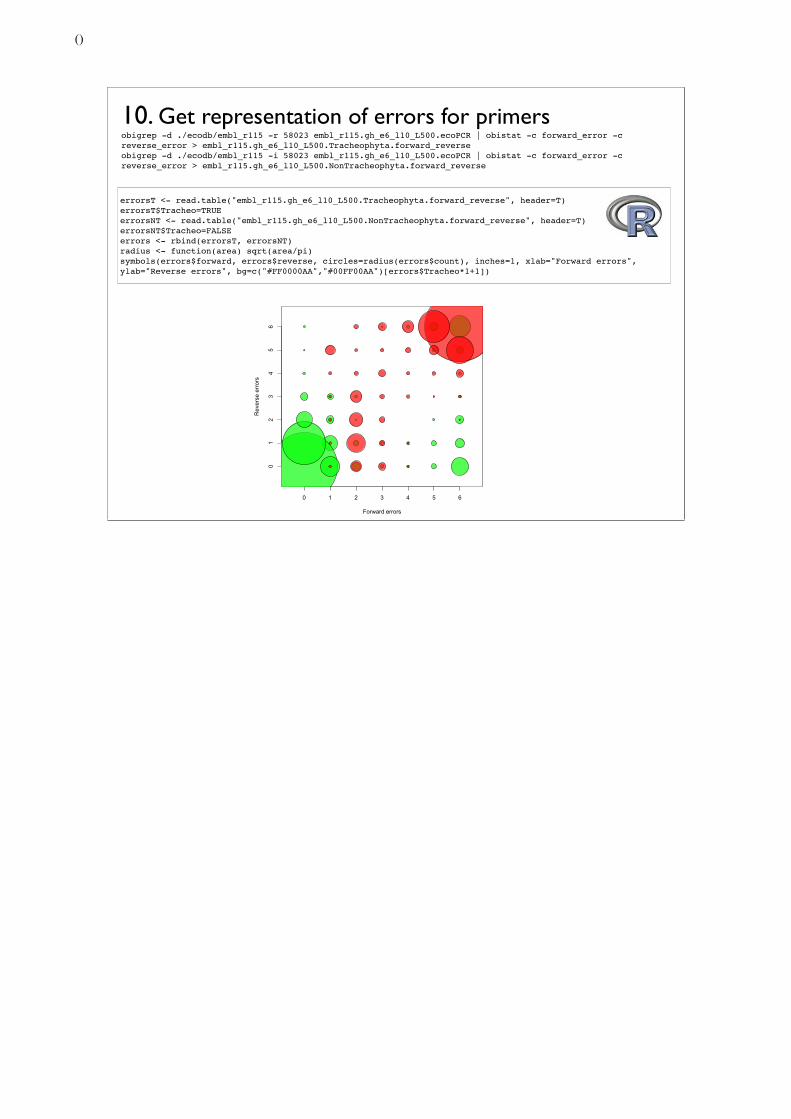
10. Get representation of errors for primersobigrep -d ./ecodb/embl_r115 -r 58023 embl_r115.gh_e6_l10_L500.ecoPCR | obistat -c forward_error -c reverse_error > embl_r115.gh_e6_l10_L500.Tracheophyta.forward_reverseobigrep -d ./ecodb/embl_r115 -i 58023 embl_r115.gh_e6_l10_L500.ecoPCR | obistat -c forward_error -c reverse_error > embl_r115.gh_e6_l10_L500.NonTracheophyta.forward_reverse
errorsT <- read.table("embl_r115.gh_e6_l10_L500.Tracheophyta.forward_reverse", header=T)errorsT$Tracheo=TRUEerrorsNT <- read.table("embl_r115.gh_e6_l10_L500.NonTracheophyta.forward_reverse", header=T)errorsNT$Tracheo=FALSEerrors <- rbind(errorsT, errorsNT)radius <- function(area) sqrt(area/pi)symbols(errors$forward, errors$reverse, circles=radius(errors$count), inches=1, xlab="Forward errors", ylab="Reverse errors", bg=c("#FF0000AA","#00FF00AA")[errors$Tracheo*1+1])
0 1 2 3 4 5 6
01
23
45
6
Forward errors
Rev
erse
err
ors
()
Ecological and evolutionary responses of Arctic flies torecent climate change at Zackenberg, Greenland
Sarah Loboda⇤1, Jade Savage2, Toke Hoye3, and Chris Buddle1
1McGill University, Montréal, Canada2Bishop’s University, Sherbrooke, Canada
3Aarhus University, Aarhus, Denmark
Climate change has intensified in the last decades and its effects are felt dispropor-tionally in the Arctic. Strong modifications of the Arctic physical environment influencethe unique biodiversity of this region, particularly diversity of insects who represent morethan 60% of Arctic terrestrial fauna. Because of their small size and ectothermy, insectsare particularly sensitive to small changes of climate. It is therefore crucial to determinehow insects, a key ecological group in the Arctic ecosystem, have responded to recent cli-mate change. My research objective is to document ecological, genetic and morphologicalchanges of Arctic flies (Muscidae and Phoridae) over the last 2 decades at Zackenberg,north-east Greenland, where a long term biodiversity monitoring program has been im-plemented in 1996. Considering that identification of insects is time-consuming anddifficult, the metabarcoding approach is a promising technique to evaluate how insectrichness has changed at Zackenberg.
⇤Electronic address: [email protected]; Speaker
()
Air biodiversity: a high throughput plant speciesidentification on environmental DNA
Cleopatra Leontidou⇤1, Cristiano Vernesi2, and Antonella Cristofori†1,2
1Fondazione Edmund Mach, via Edmund Mach 1, San Michele all’ Adige,Trento, Italy
The aerobiological spectrum is characterized by different types of biological particles(pollens, spores, bacteria, etc.), with a variability linked to site and environmental factors.
Data on airborne pollen reflect differences in the species composition of the local floraand may capture the spreading of alien species. The air biomonitoring may also detectthe flowering season of anemophilous taxa as well as the reproductive response of plantsto environmental changes at a temporal and spatial scale.
Aim of this research is to characterize the air biodiversity of different ecosystemsthrough a DNA-based metabarcode analysis applied on complex air samples. The metabar-coding of environmental DNA will allow the taxonomic identification based on specificgenetic markers, leading to an estimation of the biodiversity.
Since loss in biodiversity can endanger ecosystem health, natural ecosystems of dif-ferent vegetation zones will be selected on the basis of their putative degradation andinvasion by alien species, such as Ambrosia (ragweed), to highlight differences in speciescomposition and richness.
⇤Electronic address: [email protected]; Speaker†Electronic address: [email protected]
()

Metabarcoding applied to the study of seasonal variationsof the diversity of the meroplankton
Sabrina Le Cam⇤1,2, Sophie Delerue-Ricard1,2, Frédérique Viard†1,2, and ThierryComtet‡1,2
1Sorbonne Universités, UPMC Univ Paris 06, UMR 7144, Station Biologique deRoscoff, Place Georges Teissier, 29688 Roscoff Cedex, France
2CNRS, UMR 7144, Station Biologique de Roscoff, Place Georges Teissier, 29688Roscoff Cedex, France
This project focalizes on the study of the meroplankton , a group of organisms presentin the plankton only for a limited period, mainly composed of larvae of marine inverte-brates. This compartment at the interface of benthic and pelagic ecosystems is a sourceof diversity in the zooplankton and plays a key role both in the dynamic of benthic com-munities (e.g. recruitment) and the functioning of the pelagic ecosystem (e.g. temporarytrophic interactions). Unfortunately, because of its small size (100-500µm) and the lackof morphological diagnostic traits, such a study remains challenging, time consumingand reliable on the rare taxonomic experts. This project aims at overrunning these lim-itations using NGS metabarcoding methods. Monthly plankton net samples (63µm) of2012 from a coastal station in the Bay of Morlaix (France) will be the 18S rDNA using a454 pyrosequencing platform to study the seasonal variation of the diversity in the mero-plankton. Also, we would like to test if month-to-month variations in sequence numberfor identified species translate the variation of their relative abundance in the samples.For that, an individual barcode dataset at this same locus for bivalves and the abundanceof morphologically distinct larvae from several species are available. This study aims atsolving the question of diversity in the meroplakton and its temporal variations, first in aqualitative ways and secondly to test if semi-quantitative informations could be retrievedfrom this dataset.
⇤Electronic address: [email protected]; Speaker†Electronic address: [email protected]‡Electronic address: [email protected]
()

Arctic fox diet in Yamal peninsula, Russia.
Maite Cerezo⇤1 and Dorothee Ehrich1
1Northern populations and ecosystem group,Universiy of Tromsø, HansineHansens veg 14, 9019 Tromsø, Norway
Climate change is affecting ecosystems all over the world, and drastic changes wereobserved within the tundra ecosystem. The inland arctic foxes base its diet on lemmingsand voles, and reproduce in high number during the peak years of these preys. Whenthe abundance of rodents is low, arctic foxes must feed on a variety of alternative preys.Due to climate change, rodent cycles are fading out in some areas and consequentlyaffecting to the arctic fox population, but these changes are not following the samepattern trough the same geographical ranges as we can see when we compare Varangerpeninsula in Norway, and Yamal peninsula in Russia. In the first case, lemmings andvoles follow cycles with abundance peaks every 4 to 7 years. Arctic foxes within thisarea base its diet on lemmings and voles, and when the prey population is scarce theyuse alternative resources as reindeer carcasses. Regarding to Yamal peninsula, lemmingand voles population are much lower compared to Varanger, and fluctuations withinabundance are quite low. We hypothesize that they are not able to sustain the arcticfox population by themselves. Regarding this hypothesis, alternative prey items suchas reindeer carcasses, birds and waterfowls may be present, and allow arctic foxes tobreed as regularly as the do. The aim of this master thesis is to test this hypothesisby determining what the arctic foxes are feeding on to be able to sustain its populationand breed regularly. The methods I will use are pictures identification, scat and stableisotopes analysis.
⇤Electronic address: [email protected]; Speaker
()

Towards delimiting the African species of thalloidliverworts Riccardia based on an integrative taxonomy
study
Catherine Reeb⇤1 and Jean-Yves Dubuisson2
1MNHN, Département Systématique et Evolution, CP39 UMR7205, 57 rue cuvier75005–FRANCE Paris
2UPMC,Préparation agrégation SVSTU, CP34, 4 place jussieu, 75005–FranceParis
The genus Riccardia, (Aneuraceae) is represented by simple thalloid pinnate to plurip-innate liverworts. Twenty-three species are known from Africa, including seven unrevisedtaxa since their attribution to the genus. African Riccardia remain poorly known. Theirhighly plastic and irregular morphology involves great difficulties for their descriptionand leads to numerous misidentified or unidentified specimens in herbaria. In order topropose a well-supported delimitation of the species, an integrative taxonomic study ofthe genus Riccardia for Africa, including Indian Ocean islands, was carried out, based onmolecular and various morpho-anatomical approaches.
A study of type material and numerous specimens from recent collections and fromherbaria was conducted, revealing the complexity of the genus. A Barcoding analysiswas also initiated using three chloroplast (trnL-F, psba-trnH, matK) and one nuclear(ITS2) markers. Some traditional species are confirmed (e.g., Riccardia compacta), somenew species appear distinct, especially from the Indian Ocean Islands, and other speciesare reconsidered, such as the widely distributed Riccardia amazonica. Finally, an archi-tectural approach is proposed, based on the establishment of a model of thallus shape,formalization of shape description and its quantitative analysis. A set of five hundredthalli representing eight species have been measured using the software "2D", which havebeen developed for this study. Analysis confirm most of the previous results.
A phylogeny of the genus at a world scale is expected in order to precise relationshipsbetween these taxa.
⇤Electronic address: [email protected]; Speaker
()

OTU delineation based on DNA barcodesinsights from Sanger-based data
Mari Kekkonen⇤1, Paul Hebert2, Lauri Kaila1, Marko Mutanen3, MarkoNieminen4, and Sean Prosser2
1Finnish Museum of Natural History, University of Helsinki,Zoology Unit, P.O. Box 17, FI-00014 9 University of Helsinki, Finland
2Biodiversity Institute of Ontario, University of Guelph,Guelph, Ontario N1G 2W1, Canada
3Biodiversity Unit, Department of Biology, P.O. Box 3000,FI-90014 University of Oulu, Finland
4Metapopulation Research Group, Department of Biosciences, P.O. Box 65,FI-00014 University of 13 Helsinki, Finland
Due to the massive number of produced sequences, OTU delineation is a crucial stepof metabarcoding studies. Ideally, each delineated OTU represents only one species, andthus OTU boundaries should match with the boundaries of species. But is this reallythe case? If OTU delineation fails to match with species either by splitting, merging, oreven mixing, the results can be strongly misleading.
I present results from altogether three studies of gelechioid moths, including fourSanger-based DNA barcode data sets. I compare the results from four OTU delineationmethods (Barcode Index Numbers, BIN; Automatic Barcode Gap Discovery, ABGD;parsimony networks; General Mixed Yule-coalescent, GMYC), and evaluate their perfor-mance. To end with, I discuss the results in the context of metabarcoding.
⇤Electronic address: [email protected]; Speaker
()

Fungal degradation of macromolecular materialsin sand –dune soils
Irma Gonzalez Gonzalez⇤1,2, Bart E. van Dongen1,2, and Clare H. Robinson†1,2
1The University of Manchester, Manchester M13 9PL2SEAES and Williamson Research Centre for Molecular Environmental Science,
Manchester, M13 9PL, UK
The largest amounts of terrestrial carbon (approximately 1580 Gt carbon) can cur-rently be found in soils. This value is two to three times more carbon than is present inthe biomass of terrestrial plants. Macromolecular material such as lignin and celluloseforms a substantial part of this soil carbon. Although lignin is known to be highly resis-tant to degradation, certain fungi, particularly members of the phylum Basidiomycota,can degrade lignin completely (Kirk and Farrell, 1987). However, the extent to whichlignin-rich organic matter, such as straw, can be degraded in non-agricultural soils re-mains unclear, particularly in those soils which are very low in native organic matter,such as sand-dune grasslands. A recent study showed that, even in these systems, ligninfrom wheat straw can be degraded within a 46 month period (Kabuyah et al., 2012). Asthis type of soil may have a simple fungal community, it is necessary to analyse the degra-dation of macromolecular materials in different types of low nutrient soils where fungalcommunities may be more diverse, such as fixed dunes. This also indicates the needto identify the fungal communities present in those areas to be able to evaluate theircontribution in the degradation of lignin-rich organic matter. Fungal diversity variesamong different ecosystems (Brown, 1958). Nevertheless, fungal mycelia are difficult toidentify by conventional techniques of fruiting body surveys and culturing (O’Brien etal., 2005). These approaches are severely limited, since they cause discrimination againstnon-culturable and slow-growing taxa (Jany and Barbier, 2008). High-throughput DNAsequencing methods provide the opportunity to resolve the diversity and distribution ofmycelia in soil. The aims of this project are to characterise the degradation of lignin andcellulose of buried plant materials, and the diversity of fungi involved in this process,at three sand-dune ecosystems. Therefore, bait bags containing barley straw (Hordeumvulgare) and hawthorn wood (Crataegus sp) were buried at defined depths, at three dif-ferent ecosystems of two UK sand dunes, in May/June 2012. These bags were retrievedapproximately three, six and twelve months later and split for fungal DNA amplifica-tion, to characterise the fungal mycelia colonising the materials, and for GC-MS analysis
⇤Electronic address: [email protected]; Speaker†Electronic address: [email protected]
()

Low host preference of root associated microbes at anArctic site
Synnøve Botnen⇤1,2, Unni Vik1, Tor Carlsen1, Pernille Bronken Eidesen2, MarieLouise Davey1, and Håvard Kauserud†1
1Department of Biosciences, University of Oslo, PO box 1066 Blindern, 0316Oslo, Norway
2The University Centre in Svalbard, PO box 156, 9171 Longyearbyen, Norway
Arctic environments are challenging for plant growth due to factors such as low mois-ture, low annual mean temperature, extreme variation in radiation and seasonality. My-corrhizal fungi facilitate plant nutrient acquisition and water uptake, and may thereforebe particularly ecologically important in nutrition-poor and dry environments, such asparts of the Arctic. It is also believed that bacteria have an important role in the myc-orrhizal symbiosis. Similarly, endophytic root associates are thought to play a protectiverole, increasing plants’ stress tolerance, and likely have an important ecosystem func-tion. Despite the importance of these root-associated microbes, little is known abouttheir plant host specificity in the Arctic. In this study we analysed the mycobiomes andmicrobiomes of whole root systems of the three plants Bistorta vivipara, Salix polaris andDryas octopetala in the High Arctic archipelago Svalbard using high throughput sequenc-ing of the 16S and fungal ITS1 markers. We found a low degree of plant host specificityof the root-associated fungi and bacteria. The lack of spatial structure at small spatialscales indicates that common mycelial networks (CMNs) are rare in marginal arctic en-vironments. Further analyses will focus on the potential of co-occurrence between thefungal and bacterial OTUs.
⇤Electronic address: [email protected]; Speaker†Electronic address: [email protected]
()

From molecular diversity patterns to processes: how farcan we conciliate Community Ecology and DNA
metabarcoding?
Lucie Zinger⇤
Université Toulouse 3 Paul Sabatier, CNRS, ENFA UMR 5174 EDB(Laboratoire Evolution & Diversité Biologique), Toulouse, France
Community Ecology aims at documenting patterns of diversity in space or time, andunderstanding the processes that shape them. Over the last decade, DNA metabarcodinghas revolutionised this field by rendering possible the compilation of taxa inventories ofany form of life, ranging from elusive microbes to large mammals, hence encompassing alarge range of trophic levels.
This revolution, however, inevitably comes with new limits and questions. First,molecular taxa inventories convey an ecological signature that is, by essence, differentfrom observational surveys. Second, they are distorted by molecular techniques biases.And finally, the conceptual frameworks developed in Community Ecology have theirlimits as well. Together these considerations mean that special attention should be paidto any ecological inferences made from molecular diversity patterns, hence leading tothe disturbing, yet necessary question: what kind of ecological questions can really beanswered when using DNA metabarcoding?
During this lecture, we will attempt answering that question by (i) reviewing the mainconcepts in Community Ecology and how DNA metabarcoding has been so far used inthat respect, with examples mainly taken from the microbial ecology literature, (ii) goingback to the nature of metabarcoding data, examining how it differentiates from classicaltaxonomy inventories, and what is the consequence of such a difference on biodiversitypatterns and associated ecological inferences, and finally (iii) proposing some avenues forresearch to better conciliate a promising molecular-based technique with fundamentalquestions on biodiversity.
⇤Electronic address: [email protected]
()

Diet analysis using DNA metabarcoding
Marta De Barba⇤
LECA UMR 5553 CNRS/UniversitÈ Grenoble Alpes,BP 53 2233 Rue de la Piscine, 38041 Grenoble Cedex 9
The analysis of food webs and their dynamics facilitates understanding of the mech-anistic processes behind community ecology and ecosystem functions. Ecological under-standing of the role of consumer-resource interactions in natural food webs is limitedby the difficulty of accurately and efficiently determining the complex variety of foodtypes animals have eaten in the field. The greatest challenges are for predators feedingon many different species, such as generalists, herbivores, and to an even greater extent,omnivores that can consume different species of both plants and animals. Methods of dietanalysis mostly used so far, are not suited for revealing the full spectrum of food itemscomprising a complex diet. DNA metabarcoding and its association with the power ofnext-generation sequencing (NGS) technologies offer a promising avenue for decipheringpredators’ diets. It is now possible to simultaneously identify the taxon of various preyDNA present in excremental or regurgitate samples collected in the field, by directlysequencing in parallel thousands DNA molecules corresponding to short DNA barcodesamplified using universal primers and comparing them to a reference database. Contin-ual advance of NGS technologies and decreases in costs, increased ability of samples andmarkers multiplexing, current massive expansion of reference databases, and improve-ment of methods for data analysis make the DNA metabarcoding approach powerful andcost-effective for large-scale population level diet assessment and the detection of finedietary variation among samples or individuals and of rare food items. In this lecture,I will review the power and pitfalls of DNA metabracoding diet methods. I will presentthe critical factors to take into account when choosing or designing a suitable barcodefor diet analysis. Then, I will consider both technical and analytical aspects of NGS dietstudies. Finally, I will discuss issues related to the validation of data accuracy of the dietresults produced, including the potential of obtaining quantitative information, and willprovide an example of how internal controls and PCR replications can be used to obtaingreater standardization of data analysis protocols and to evaluate the effectiveness ofthe sequence filtering process. I will include examples from the literature and on-goingprojects to illustrate concepts and methods with real case studies. (papers: Pompanonet al. 2012 Mol Ecol. 21, 1931-1950 doi: 10.1111/j.1365-294X.2011.05403.x; De Barbaet al. 2014 Mol. Ecol. Res. 14, 306-323 doi: 10.1111/1755-0998.12188)
⇤Electronic address: [email protected]
()

Practical IIIFrom raw sequence to contingency table
Frédéric Boyer⇤1, Aurélie Bonin†1, and Eric Coissac‡1
1LECA UMR 5553 CNRS/Université Joseph Fourier, BP 53, 2233 Rue de laPiscine, 38041 Grenoble Cedex 9
The third practical will be dedicated to the OBITools, a suite of programs especiallydeveloped for the processing of metabarcoding sequence data obtained by Illumina next-generation sequencing. We will present the different programs of the pipeline successfully,including (1) illuminapairedend, for the assembly of paired-end reads; (2) ngsfilter, toassign assembled sequences to the corresponding marker and individual; (3) obigrep,designed to filter out unreliable sequences; (4) obiclean, which identifies potential PCRerrors and chimeras; and (5) ecotag, for taxonomic assignment based on a referencedatabase.
⇤Electronic address: [email protected]†Electronic address: [email protected]‡Electronic address: [email protected]
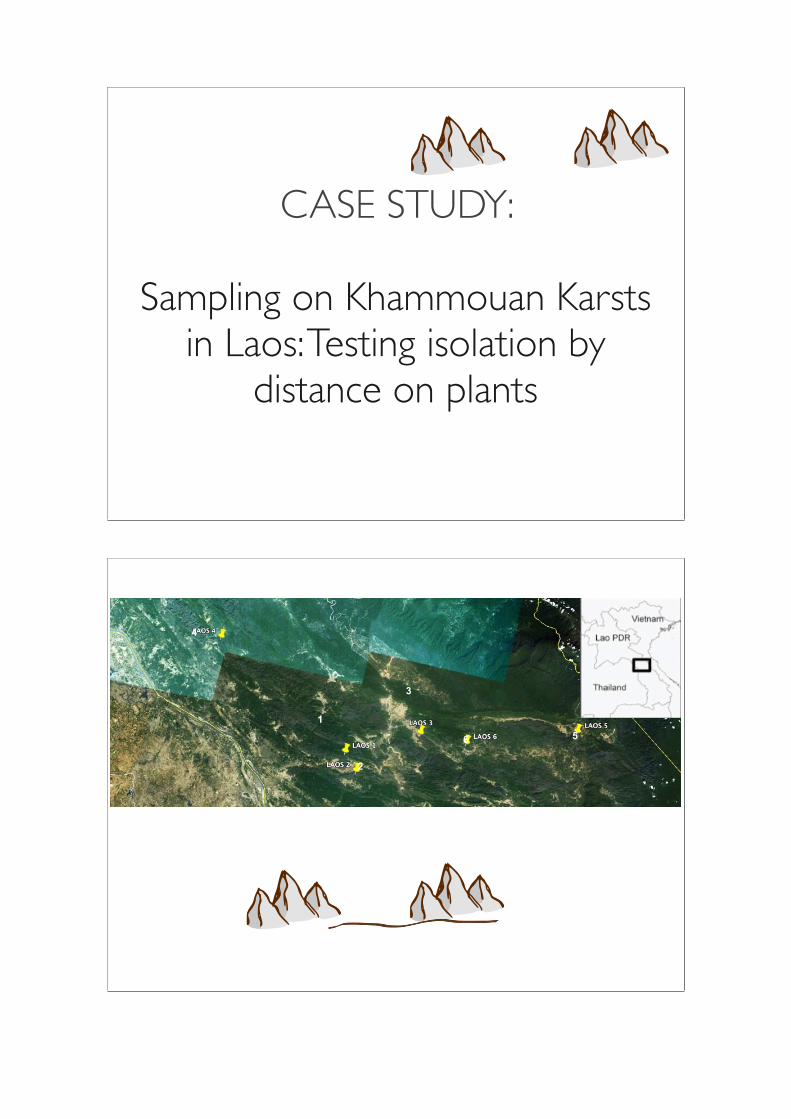
CASE STUDY:
Sampling on Khammouan Karsts in Laos: Testing isolation by
distance on plants
1
2
3
6 5
4
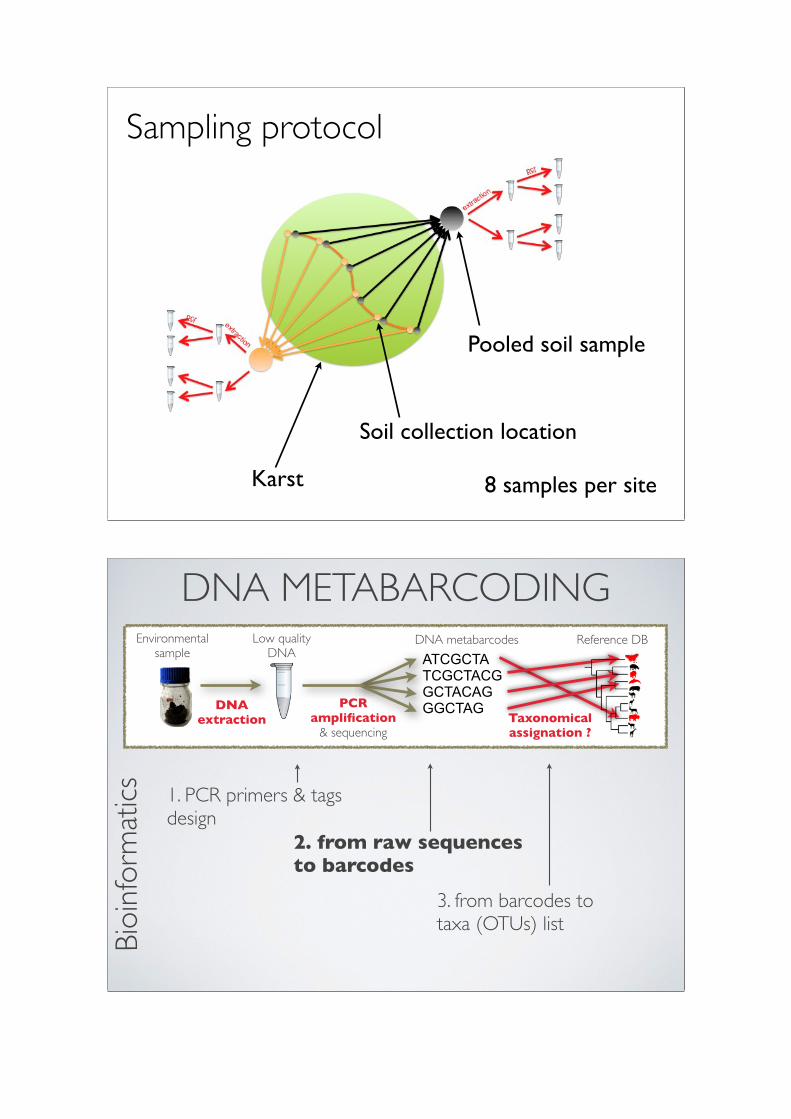
8 samples per site
Sampling protocol
Karst
Soil collection location
Pooled soil sample
DNA METABARCODING
ATCGCTATCGCTACGGCTACAGGGCTAGPCR
amplification & sequencing
DNA extraction Taxonomical
assignation ?
Environmental sample
Low quality DNA
DNA metabarcodes Reference DB
1. PCR primers & tagsdesign
2. from raw sequencesto barcodes
3. from barcodes totaxa (OTUs) list
Bioi
nfor
mat
ics
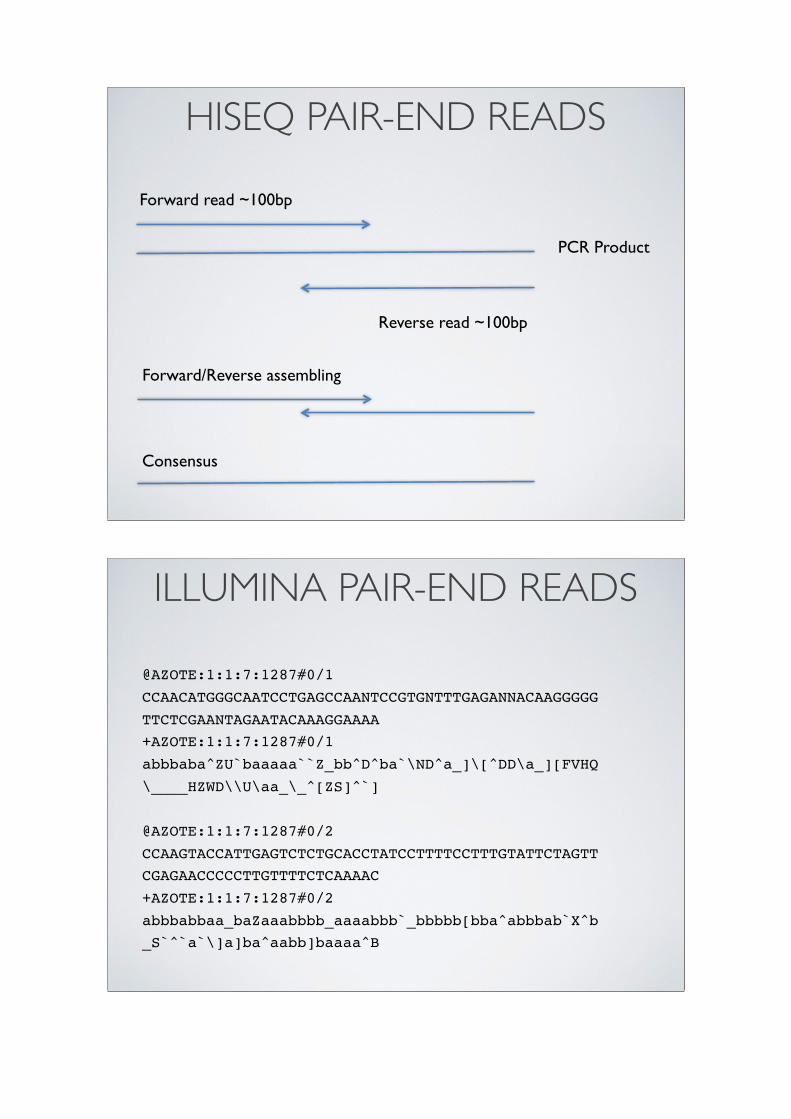
PCR Product
Forward read ~100bp
Reverse read ~100bp
Forward/Reverse assembling
HISEQ PAIR-END READS
Consensus
@AZOTE:1:1:7:1287#0/1CCAACATGGGCAATCCTGAGCCAANTCCGTGNTTTGAGANNACAAGGGGGTTCTCGAANTAGAATACAAAGGAAAA+AZOTE:1:1:7:1287#0/1abbbaba^ZU`baaaaa``Z_bb^D^ba`\ND^a_]\[^DD\a_][FVHQ\____HZWD\\U\aa_\_^[ZS]^`]
@AZOTE:1:1:7:1287#0/2CCAAGTACCATTGAGTCTCTGCACCTATCCTTTTCCTTTGTATTCTAGTTCGAGAACCCCCTTGTTTTCTCAAAAC+AZOTE:1:1:7:1287#0/2abbbabbaa_baZaaabbbb_aaaabbb`_bbbbb[bba^abbbab`X^b_S`^`a`\]a]ba^aabb]baaaa^B
ILLUMINA PAIR-END READS
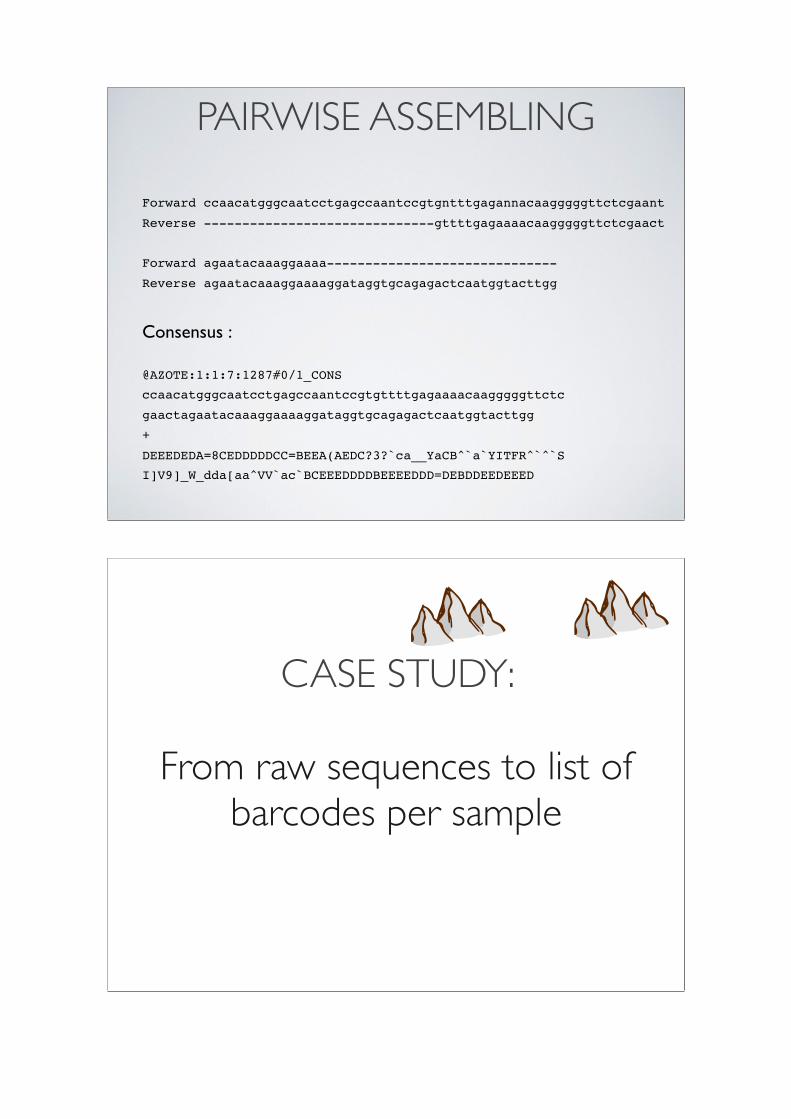
Forward ccaacatgggcaatcctgagccaantccgtgntttgagannacaagggggttctcgaant
Reverse ------------------------------gttttgagaaaacaagggggttctcgaact
Forward agaatacaaaggaaaa------------------------------
Reverse agaatacaaaggaaaaggataggtgcagagactcaatggtacttgg
Consensus :
@AZOTE:1:1:7:1287#0/1_CONS
ccaacatgggcaatcctgagccaantccgtgttttgagaaaacaagggggttctc
gaactagaatacaaaggaaaaggataggtgcagagactcaatggtacttgg
+
DEEEDEDA=8CEDDDDDCC=BEEA(AEDC?3?`ca__YaCB^`a`YITFR^`^`S
I]V9]_W_dda[aa^VV`ac`BCEEEDDDDBEEEEDDD=DEBDDEEDEEED
PAIRWISE ASSEMBLING
CASE STUDY:
From raw sequences to list of barcodes per sample
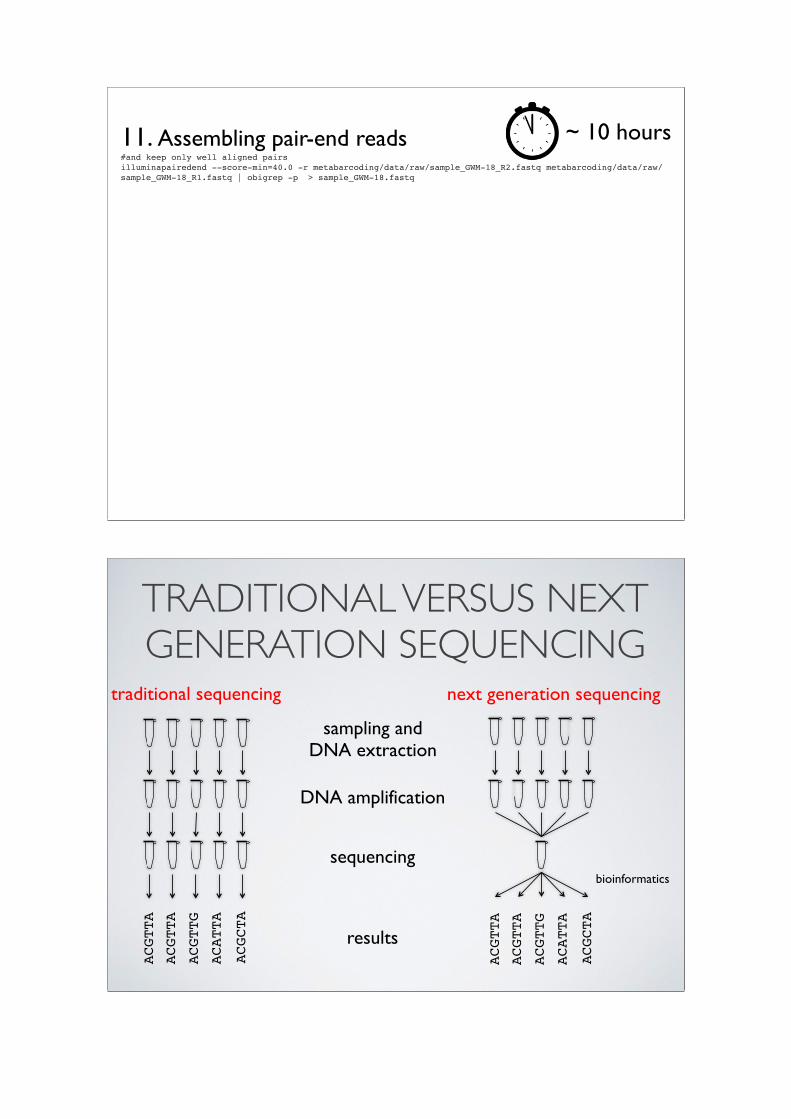
11. Assembling pair-end reads#and keep only well aligned pairsilluminapairedend --score-min=40.0 -r metabarcoding/data/raw/sample_GWM-18_R2.fastq metabarcoding/data/raw/sample_GWM-18_R1.fastq | obigrep -p > sample_GWM-18.fastq
~ 10 hours
sampling andDNA extraction
DNA amplification
sequencing
results
ACGTTA
ACGTTG
ACGTTA
ACATTA
ACGCTA
traditional sequencing next generation sequencing
bioinformatics
ACGTTA
ACGTTG
ACGTTA
ACATTA
ACGCTA
TRADITIONAL VERSUS NEXT GENERATION SEQUENCING

P2
P1
ADD TAGS TO PRIMERS
PCR
ADD TAGS TO PRIMERS
P2
P1

SAMPLE IDENTIFICATION
@HWI-M00234:6:000000000-A1LV7:1:1101:7417:5863_CONS seqAInsertion=0; seqBInsertion=0; seqAMismatch=0; seqBDeletion=34; seqADeletion=34; seqABMatch=216; seqASingle=0; seqBMismatch=0; alignment=right; seqBSingle=0; cgtacacacaccaagagatccgttgttgaaagttttaattattagattttattcagacacaaaaacgattatcagcataaatacggcactatggcgccgaaacactataataattccacgagttgaaaggttaaaggctcatggccatttggcaatgatccctccgcaggttcacctacggagaccttgttacgacttttacttccctgacataat+++&,+,**+)+'),,')+)))///+1-/1/1-/.+++/,.11212/211/-+/111121.2221/10,2/.+1221122122112111101.201011111100101011100..100010.0.-00.11..1..-.221010020.+-112221100,10111022221,0/(1122121.1222210/111221.../..+--+--.*++(+'*
P1 P2R
B06 acacacac:tatgtcag CAAGAGATCCGTTGTTGAAAGTT GGAAGTAAAAGTCGTAACAAGG
Forward Primer Reverse PrimerTagSample Name
SAMPLE IDENTIFICATION
P1 P2R
@HWI-M00234:6:000000000-A1LV7:1:1101:7417:5863_CONS seqAInsertion=0; seqBInsertion=0; seqAMismatch=0; seqBDeletion=34; seqADeletion=34; seqABMatch=216; seqASingle=0; seqBMismatch=0; alignment=right; seqBSingle=0; cgtacacacaccaagagatccgttgttgaaagttttaattattagattttattcagacacaaaaacgattatcagcataaatacggcactatggcgccgaaacactataataattccacgagttgaaaggttaaaggctcatggccatttggcaatgatccctccgcaggttcacctacggagaccttgttacgacttttacttccctgacataat+++&,+,**+)+'),,')+)))///+1-/1/1-/.+++/,.11212/211/-+/111121.2221/10,2/.+1221122122112111101.201011111100101011100..100010.0.-00.11..1..-.221010020.+-112221100,10111022221,0/(1122121.1222210/111221.../..+--+--.*++(+'*
B06 acacacac:tatgtcag CAAGAGATCCGTTGTTGAAAGTT GGAAGTAAAAGTCGTAACAAGG
Forward Primer Reverse PrimerTagSample Name
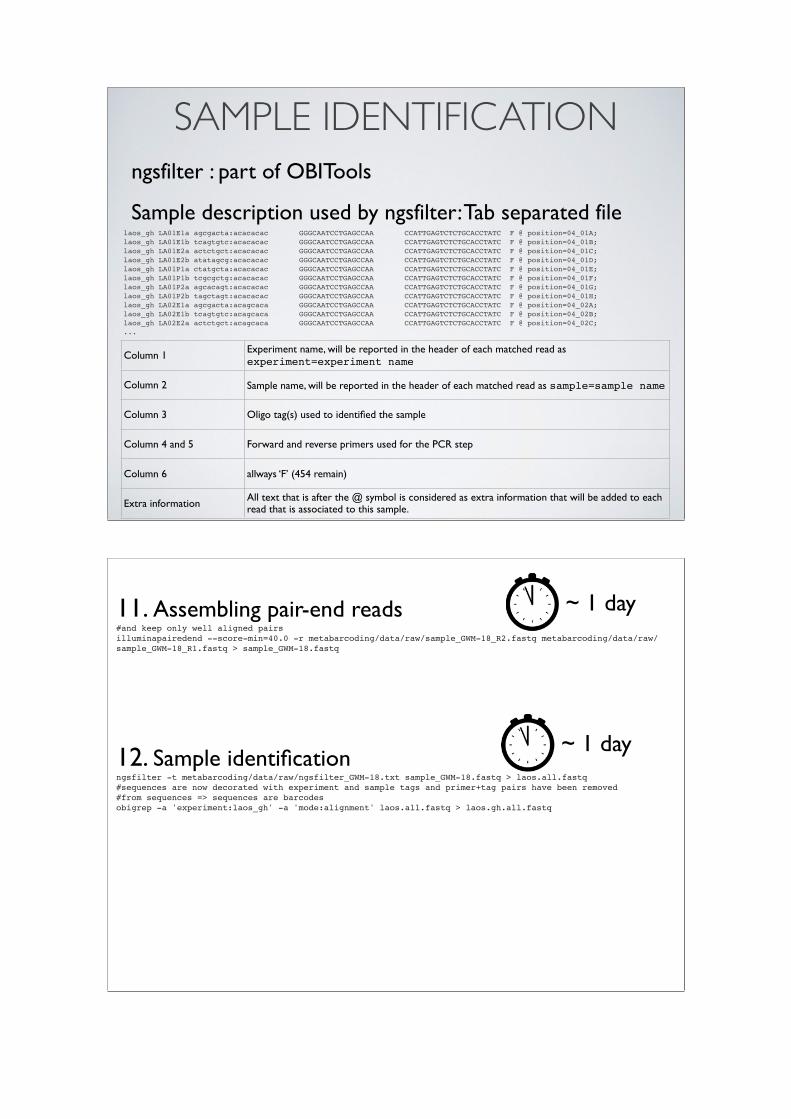
SAMPLE IDENTIFICATIONngsfilter : part of OBITools
Sample description used by ngsfilter: Tab separated filelaos_gh LA01E1a agcgacta:acacacac GGGCAATCCTGAGCCAA CCATTGAGTCTCTGCACCTATC F @ position=04_01A;laos_gh LA01E1b tcagtgtc:acacacac GGGCAATCCTGAGCCAA CCATTGAGTCTCTGCACCTATC F @ position=04_01B;laos_gh LA01E2a actctgct:acacacac GGGCAATCCTGAGCCAA CCATTGAGTCTCTGCACCTATC F @ position=04_01C;laos_gh LA01E2b atatagcg:acacacac GGGCAATCCTGAGCCAA CCATTGAGTCTCTGCACCTATC F @ position=04_01D;laos_gh LA01P1a ctatgcta:acacacac GGGCAATCCTGAGCCAA CCATTGAGTCTCTGCACCTATC F @ position=04_01E;laos_gh LA01P1b tcgcgctg:acacacac GGGCAATCCTGAGCCAA CCATTGAGTCTCTGCACCTATC F @ position=04_01F;laos_gh LA01P2a agcacagt:acacacac GGGCAATCCTGAGCCAA CCATTGAGTCTCTGCACCTATC F @ position=04_01G;laos_gh LA01P2b tagctagt:acacacac GGGCAATCCTGAGCCAA CCATTGAGTCTCTGCACCTATC F @ position=04_01H;laos_gh LA02E1a agcgacta:acagcaca GGGCAATCCTGAGCCAA CCATTGAGTCTCTGCACCTATC F @ position=04_02A;laos_gh LA02E1b tcagtgtc:acagcaca GGGCAATCCTGAGCCAA CCATTGAGTCTCTGCACCTATC F @ position=04_02B;laos_gh LA02E2a actctgct:acagcaca GGGCAATCCTGAGCCAA CCATTGAGTCTCTGCACCTATC F @ position=04_02C;...
Column 1Experiment name, will be reported in the header of each matched read as experiment=experiment name
Column 2 Sample name, will be reported in the header of each matched read as sample=sample name
Column 3 Oligo tag(s) used to identified the sample
Column 4 and 5 Forward and reverse primers used for the PCR step
Column 6 allways ‘F’ (454 remain)
Extra informationAll text that is after the @ symbol is considered as extra information that will be added to each read that is associated to this sample.
12. Sample identification ngsfilter -t metabarcoding/data/raw/ngsfilter_GWM-18.txt sample_GWM-18.fastq > laos.all.fastq#sequences are now decorated with experiment and sample tags and primer+tag pairs have been removed#from sequences => sequences are barcodesobigrep -a 'experiment:laos_gh' -a 'mode:alignment' laos.all.fastq > laos.gh.all.fastq
~ 1 day
11. Assembling pair-end reads#and keep only well aligned pairsilluminapairedend --score-min=40.0 -r metabarcoding/data/raw/sample_GWM-18_R2.fastq metabarcoding/data/raw/sample_GWM-18_R1.fastq > sample_GWM-18.fastq
~ 1 day
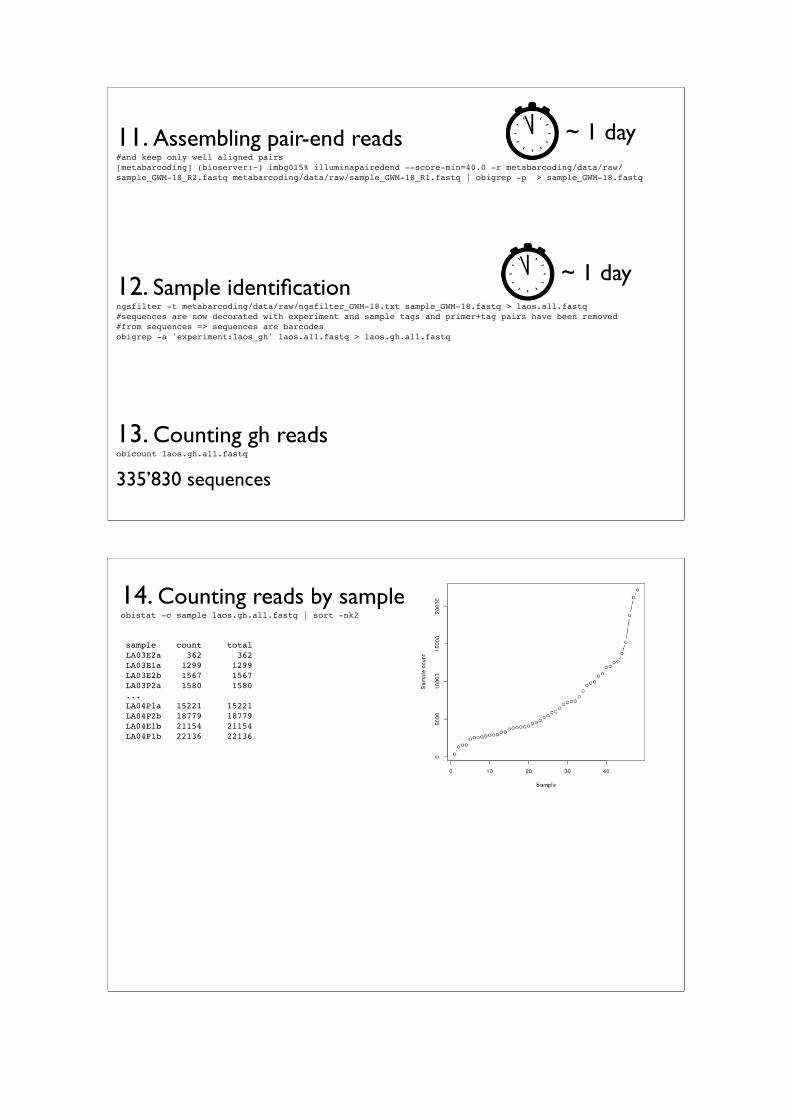
12. Sample identification ngsfilter -t metabarcoding/data/raw/ngsfilter_GWM-18.txt sample_GWM-18.fastq > laos.all.fastq#sequences are now decorated with experiment and sample tags and primer+tag pairs have been removed#from sequences => sequences are barcodesobigrep -a 'experiment:laos_gh' laos.all.fastq > laos.gh.all.fastq
~ 1 day
11. Assembling pair-end reads#and keep only well aligned pairs[metabarcoding] (bioserver:~) imbg015% illuminapairedend --score-min=40.0 -r metabarcoding/data/raw/sample_GWM-18_R2.fastq metabarcoding/data/raw/sample_GWM-18_R1.fastq | obigrep -p > sample_GWM-18.fastq
~ 1 day
13. Counting gh reads obicount laos.gh.all.fastq
335’830 sequences
14. Counting reads by sample obistat -c sample laos.gh.all.fastq | sort -nk2
sample count totalLA03E2a 362 362LA03E1a 1299 1299LA03E2b 1567 1567LA03P2a 1580 1580...LA04P1a 15221 15221LA04P2b 18779 18779LA04E1b 21154 21154LA04P1b 22136 22136
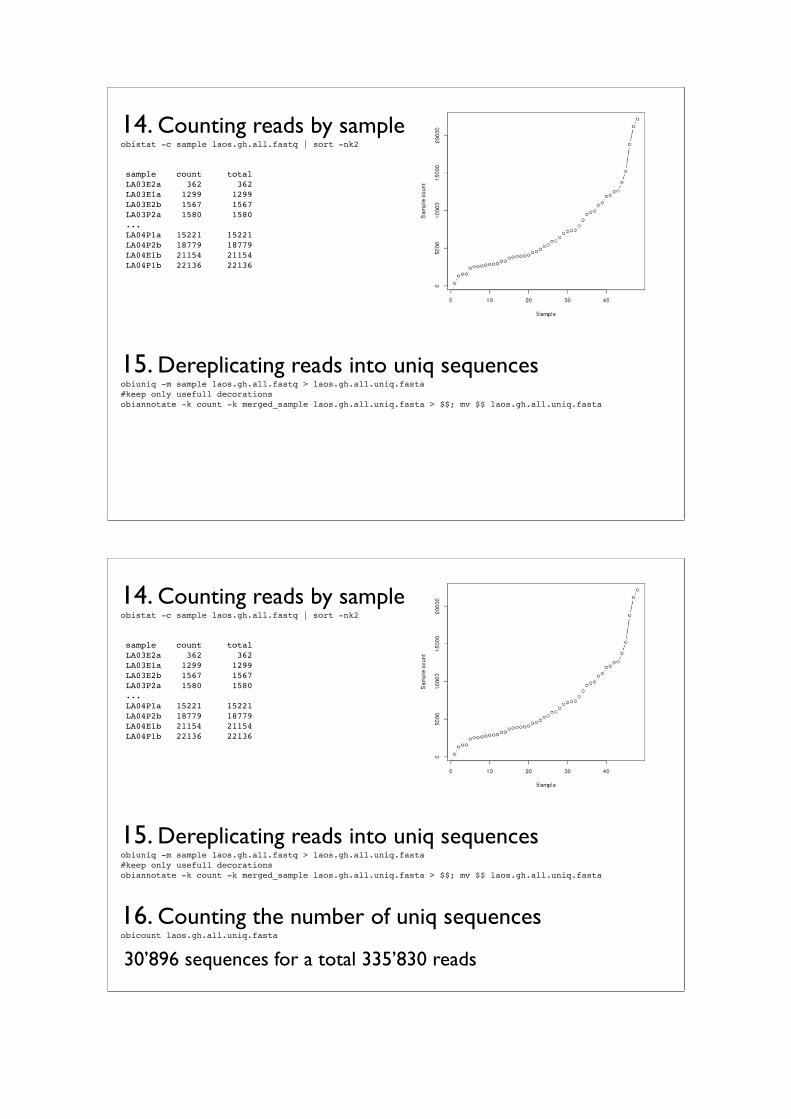
14. Counting reads by sample obistat -c sample laos.gh.all.fastq | sort -nk2
sample count totalLA03E2a 362 362LA03E1a 1299 1299LA03E2b 1567 1567LA03P2a 1580 1580...LA04P1a 15221 15221LA04P2b 18779 18779LA04E1b 21154 21154LA04P1b 22136 22136
15. Dereplicating reads into uniq sequences obiuniq -m sample laos.gh.all.fastq > laos.gh.all.uniq.fasta#keep only usefull decorationsobiannotate -k count -k merged_sample laos.gh.all.uniq.fasta > $$; mv $$ laos.gh.all.uniq.fasta
16. Counting the number of uniq sequences obicount laos.gh.all.uniq.fasta
30’896 sequences for a total 335’830 reads
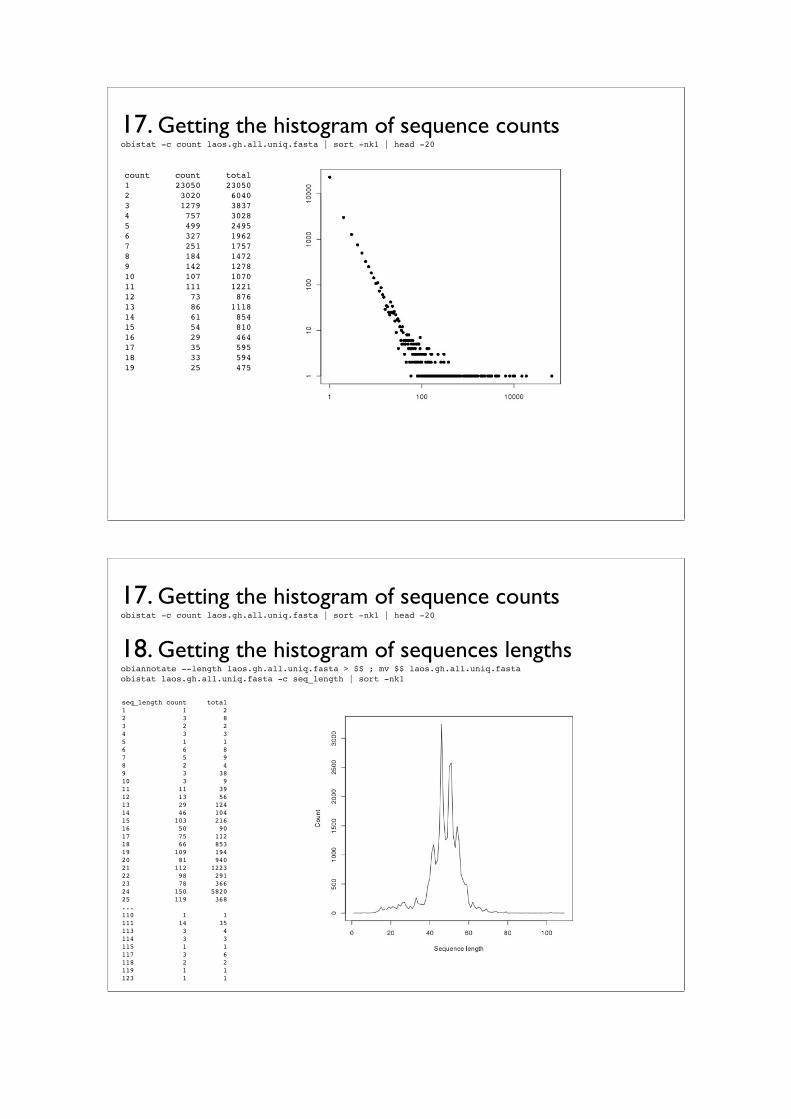
17. Getting the histogram of sequence counts obistat -c count laos.gh.all.uniq.fasta | sort -nk1 | head -20
count count total1 23050 230502 3020 60403 1279 38374 757 30285 499 24956 327 19627 251 17578 184 14729 142 127810 107 107011 111 122112 73 87613 86 111814 61 85415 54 81016 29 46417 35 59518 33 59419 25 475
17. Getting the histogram of sequence counts obistat -c count laos.gh.all.uniq.fasta | sort -nk1 | head -20
18. Getting the histogram of sequences lengths obiannotate --length laos.gh.all.uniq.fasta > $$ ; mv $$ laos.gh.all.uniq.fasta obistat laos.gh.all.uniq.fasta -c seq_length | sort -nk1
seq_length count total1 1 22 3 83 2 24 3 35 1 16 6 87 5 98 2 49 3 3810 3 911 11 3912 13 5613 29 12414 46 10415 103 21616 50 9017 75 11218 66 85319 109 19420 81 94021 112 122322 98 29123 78 36624 150 582025 119 368... 110 1 1111 14 35113 3 4114 3 3115 1 1117 3 6118 2 2119 1 1123 1 1
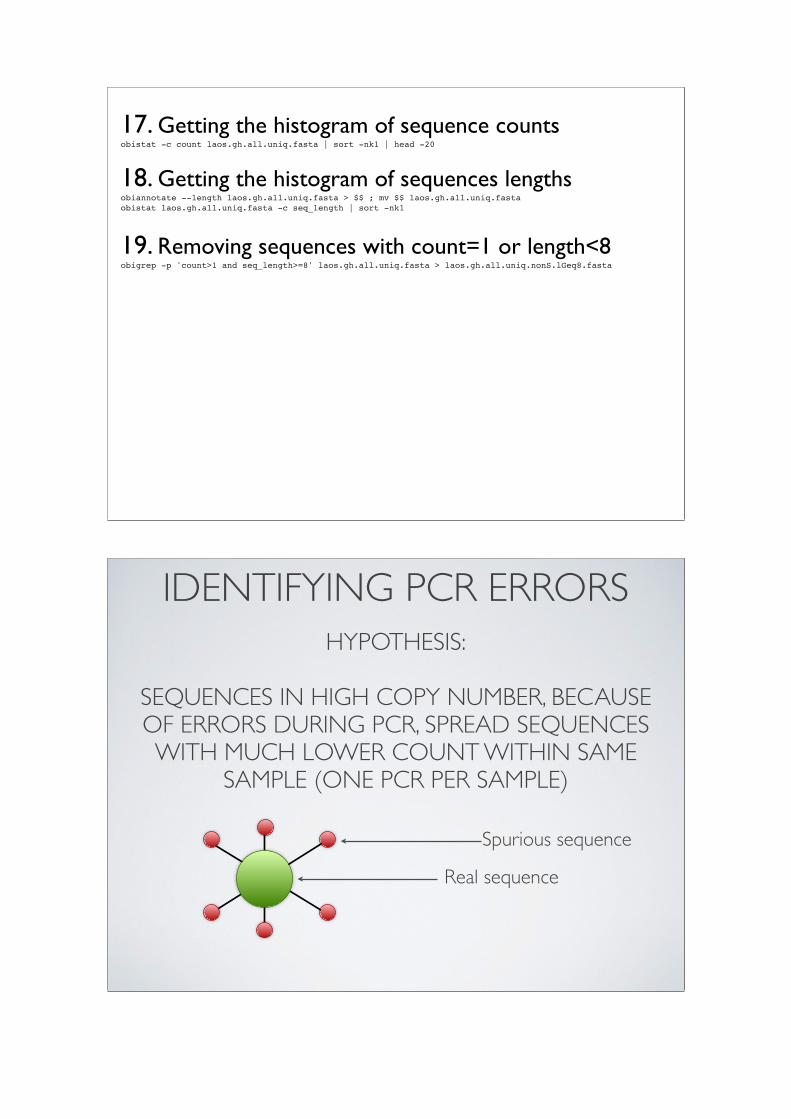
17. Getting the histogram of sequence counts obistat -c count laos.gh.all.uniq.fasta | sort -nk1 | head -20
18. Getting the histogram of sequences lengths obiannotate --length laos.gh.all.uniq.fasta > $$ ; mv $$ laos.gh.all.uniq.fasta obistat laos.gh.all.uniq.fasta -c seq_length | sort -nk1
19. Removing sequences with count=1 or length<8 obigrep -p 'count>1 and seq_length>=8' laos.gh.all.uniq.fasta > laos.gh.all.uniq.nonS.lGeq8.fasta
HYPOTHESIS:
SEQUENCES IN HIGH COPY NUMBER, BECAUSE OF ERRORS DURING PCR, SPREAD SEQUENCES WITH MUCH LOWER COUNT WITHIN SAME
SAMPLE (ONE PCR PER SAMPLE)
IDENTIFYING PCR ERRORS
Real sequence
Spurious sequence
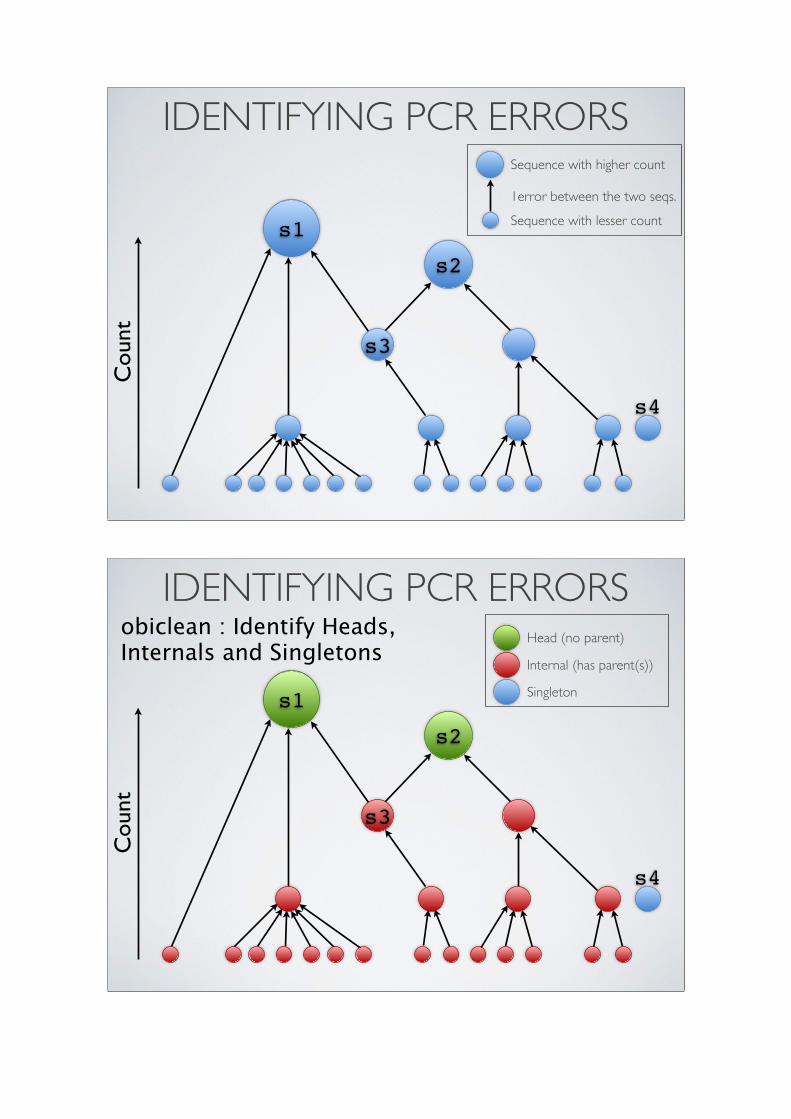
IDENTIFYING PCR ERRORSC
ount
s4
s1
s2
s3
Sequence with higher count
Sequence with lesser count
1error between the two seqs.
Cou
nt
s4
s1
s2
s3
obiclean : Identify Heads, Internals and Singletons
Head (no parent)
Singleton
Internal (has parent(s))
IDENTIFYING PCR ERRORS
20. Putative PCR errors tagging obiclean -s merged_sample -r 0.25 laos.gh.all.uniq.nonS.lGeq8.fasta > laos.gh.all.uniq.nonS.lGeq8.obiclean.r25.fasta
20. Putative PCR errors tagging obiclean -s merged_sample -r 0.25 laos.gh.all.uniq.nonS.lGeq8.fasta > laos.gh.all.uniq.nonS.lGeq8.obiclean.r25.fasta
21. Putative PCR errors removing # keep sequences seen more often head than internalobigrep -p 'head>internal' laos.gh.all.uniq.nonS.lGeq8.obiclean.r25.fasta > laos.gh.all.uniq.nonS.lGeq8.obiclean.r25.h_G_i.fastaobicount laos.gh.all.uniq.nonS.lGeq8.obiclean.r25.h_G_i.fasta
388 sequences for a total of 251’207

CASE STUDY:
Assigning taxonomic information for gh barcodes
DNA METABARCODING
ATCGCTATCGCTACGGCTACAGGGCTAGPCR
amplification & sequencing
DNA extraction Taxonomical
assignation ?
Environmental sample
Low quality DNA
DNA metabarcodes Reference DB
1. PCR primers & tagsdesign
2. from raw sequencesto barcodes
3. from barcodes totaxon (species) list
Bioi
nfor
mat
ics
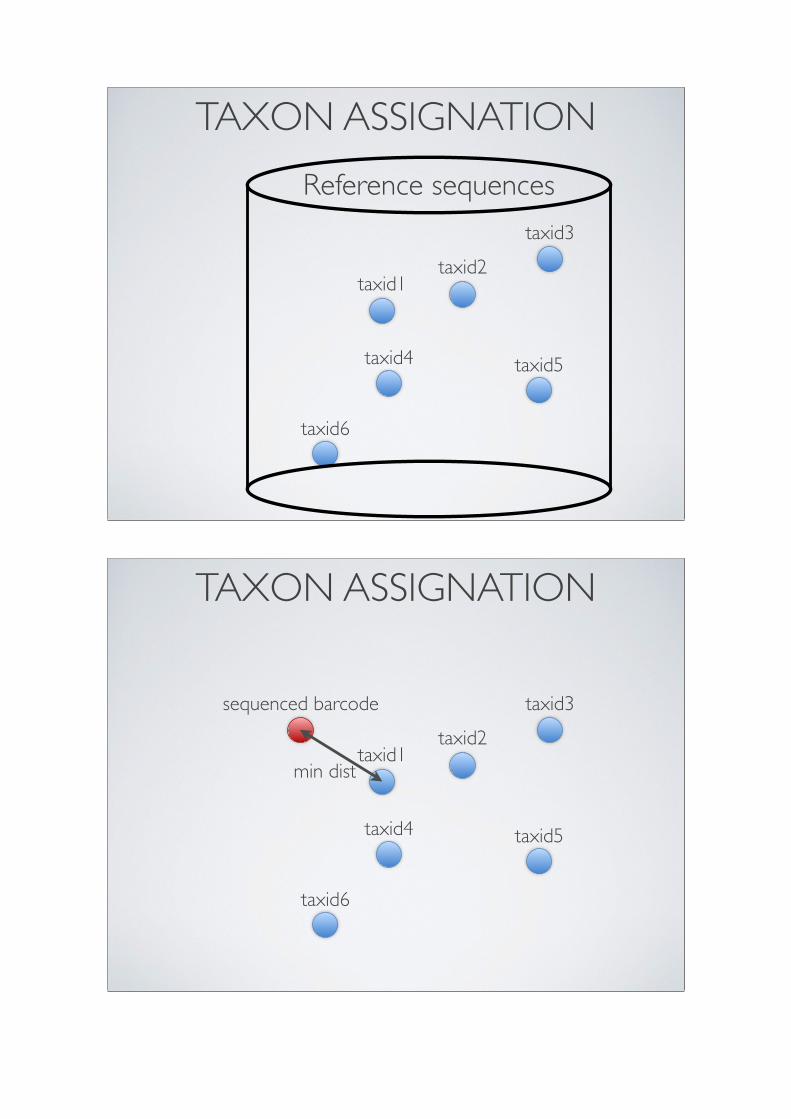
TAXON ASSIGNATION
taxid1taxid2
taxid3
taxid5taxid4
taxid6
Reference sequences
TAXON ASSIGNATION
taxid1taxid2
taxid3
taxid5taxid4
taxid6
min dist
sequenced barcode
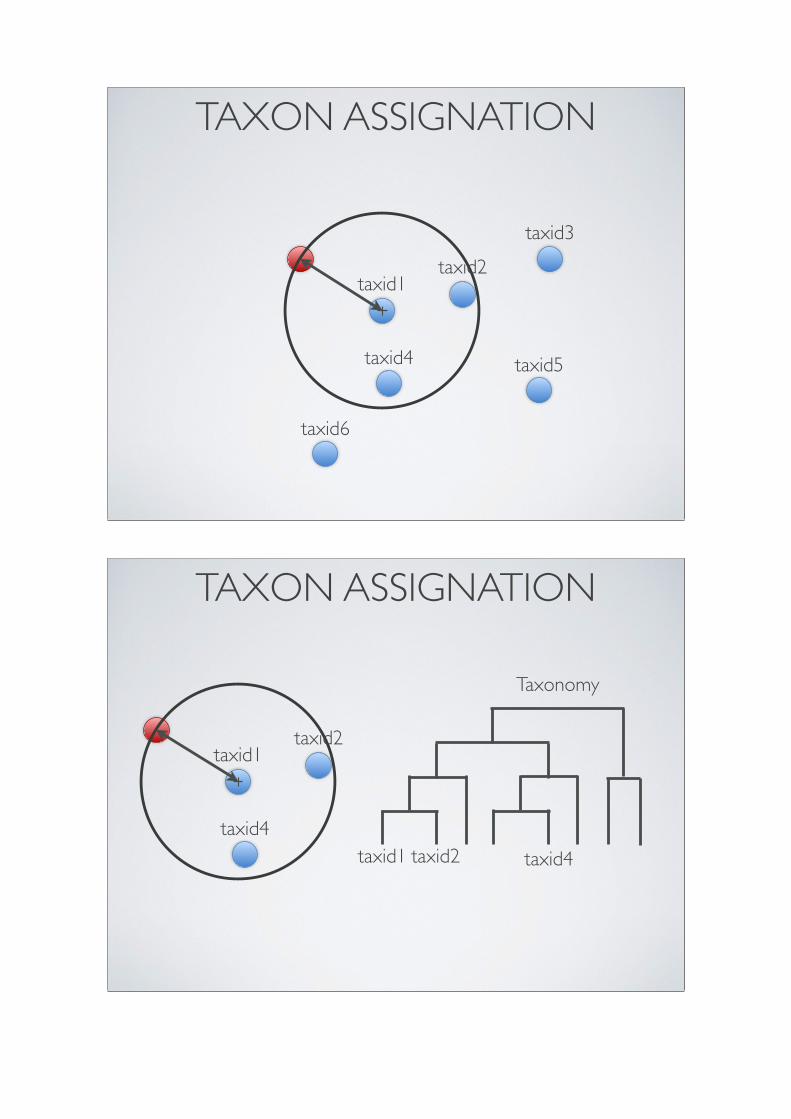
TAXON ASSIGNATION
taxid1taxid2
taxid3
taxid5taxid4
taxid6
TAXON ASSIGNATION
taxid1taxid2
taxid4taxid1 taxid2 taxid4
Taxonomy

TAXON ASSIGNATION
taxid1taxid2
taxid4taxid1 taxid2 taxid4
inferred taxid
Taxonomy
22. Setting up a reference DB obigrep -d ./ecodb/chloro -r 58023 -A taxid --require-rank=species --require-rank=genus --require-rank=family metabarcoding/data/embl_r115.gh_e6_l10_L500.ecoPCR | obigrep -p 'forward_error<=3 and reverse_error <=3'| obiuniq -d ./ecodb/chloro -c species | obiannotate --uniq-id > gh.ref.fasta
Should be curated
23. Assigning taxa ecotag -d ./ecodb/chloro -R gh.ref.fasta -m 0.95 laos.gh.all.uniq.nonS.lGeq8.obiclean.r25.h_G_i.fasta > laos.gh.all.uniq.nonS.lGeq8.obiclean.r25.h_G_i.ecoTag.fasta
24. Getting results as a ‘;’ separated text file obiannotate --delete-tag clean --delete-tag species --delete-tag species_name laos.gh.all.uniq.nonS.lGeq8.obiclean.r25.h_G_i.ecoTag.fasta | obisort -k 'count' -r | obitab --output-field-separator=";" -o > laos.gh.all.uniq.nonS.lGeq8.obiclean.r25.h_G_i.ecoTag.csv
()

Arctic arthropods and the effect of climate changes
Rikke Reisner Hansen⇤1 and Toke Thomas Høye2
1Arctic Research Centre, Aarhus University, C.F. Møllers Allé 8, bldg. 1110,DK-8000 Aarhus C, Denmark
2Aarhus Institute of Advanced Studies, Høegh-Guldbergs Gade 6B, bldgs.1630?1632, DK-8000 Aarhus C, Denmark
Greenland biodiversity is a largely unexplored area, and research has revolved mostlyaround large industrially explored species, such as reindeer, whales, mountain hare etc.,but when it comes to the smaller groups, like arthropods, our knowledge of their distribu-tion and overall habitus is limited. Climate change is happening at an accelerating pacein the arctic and the arthropods are particularly susceptible to changes in temperature.Gaining more species distribution knowledge is therefor imperative for understandingclimate change effects on biodiversity.
Species sampling and identification is a long and resource demanding task and as aresult it is often down-prioritized. Samples from remote areas of Greenland remain to beanalyzed and metabarcoding presents a potential tool for exploring large and otherwiseunused samples. The question of how much information we are willing to loose in thisprocess needs to be addressed. In my project I have collected insects along differentgradients related to climate change scenarios: Shrub cover gradient, altitude gradient,along a glacial chronosequence, in different moisture regimes. My goal is to relate thesepredicted climate change scenarios to diversity, abundance, composition and body size ofarthropods and to contribute to our overall species distribution knowledge in Greenland.
⇤Electronic address: [email protected]; Rikke Reisner Hansen
()
Biodiversity in a bottle: Metabarcoding as a tool forassessing the effects of pipeline crossings on stream
biodiversity
Marla Schwarzfeld⇤1, Anne-Marie Flores1, Aynsley Thielman1, Allan Costello1,Daniel Erasmus1, Brent Murray1, Lisa Poirier1, Jeanne Robert1, Dezene Huber1,
Mark Shrimpton1, and Michael Gillingham1
1University of Northern British Columbia, 3333 University Way, Prince George,BC, Canada, V2N 4Z9
Streams are complex aquatic ecosystems that are regulated by both within-streamand riparian ecological processes. Disturbance of streams and/or adjacent riparian zones,such as through the construction of pipelines, has been shown to affect stream processesby changing substrate conditions, flow patterns, and riparian inputs. This can in turnaffect stream biodiversity, such as benthic invertebrate communities, along with fish phys-iology and population dynamics. The Pacific Trail Pipeline (PTP) is an 460 km pipelinethat will be constructed in northwestern British Columbia, Canada, for the transporta-tion of natural gas. This study is designed as a before-after, control-impact (BACI)analysis of stream biodiversity and ecological processes at pipeline crossings, with anemphasis on invertebrate communities and aquatic food-webs. We are using traditionalmorphological methods and metabarcoding techniques to rapidly and accurately assessstream biodiversity. The metabarcoding approach will be used for environmental DNA inwater samples, for analysing preservative ethanol from bulk benthic invertebrate samples,and for conducting diet analysis of stream-dwelling fish. The goal of this project is tohelp develop best-practices guidelines for pipeline projects that maintain/restore aquaticbiodiversity and ecological processes. This study will also generate baseline species listsand records for an under-surveyed but biologically diverse region of Canada.
⇤Electronic address: [email protected]; Speaker
()
Pathogen hunting in Formica exsecta ants
Kishor Dhaygude⇤, Helena Johansson, Jonna Kulmuni, Kalevi Trontti, andLiselotte Sundström
Centre of Excellence in Biological interactions, Department of Biosciences,University of Helsinki
Ant colonies are known to have high pathogen pressure because of high colony density,interaction rate and relatedness of individuals within colonies. Only few pathogens arecurrently known in social ants;therefore it is essential to study new pathogens and theirinfection rate in social ants, in order to understand the host-parasite interaction andpathogen pressure.
Metagenomics and transcriptome approach have changed the approach to many prob-lems, redefined the concept of a genome, and accelerated the rate of discovery and en-hanced our understanding of the biological interactions between a species of ant andmicrobes. Molecular based approach through homologous gene identification to de-tect pathogens and associated parasites are wildly used in Metagenomics studies. Weused similar approach to detect the viral pathogen gene associated with Formica ex-secta species, detailed study of virus gene sequences showed a new virus associated withFormica exsecta. Here we report two new viruses, provisionally named Formica exsectavirus 1 (FEX-1) and Formica exsecta virus 2 (FEX-2) which appear to infect these ants.Both novel viruses are (functionally and in genome organization) related to insects spe-cific viruses family Dicistroviridae and Iflaviridae respectively. Rate of evolution andphylogenetic analysis indicates relatedness of this viruses with these insect viruses fami-lies.
In Addition, using protein structural modeling, we also gained insights into the func-tion of proteins and similarity and divergence between viruses.Overall, our study showsthe usefulness of metatranscriptomic approaches for virus discovery.
⇤Electronic address: [email protected]; Speaker
()
DNA barcoding of terrestrial orchids and their tuber intrade
Abdolbaset Ghorbani⇤1, Barbara Gravendeel2, and Hugo de Boer3
1Department of Organismal Biology, Evolutionary Biology Centre, UppsalaUniversity, Sweden
2Naturalis Biodiversity Center, Leiden, The Netherlands3University of Applied Science, Leiden, The Netherlands
DNA barcoding is getting more popular in identification/authentication of herbalproducts and medicinal plants in trade. However there is no universal consensus on theuse of specific DNA regions, as a standard and specific barcodes need to be developed fordifferent groups. Tuberous terrestrial orchids have been used for long time as source ofSalep, a hot milky drink made from tubers and was once common in Europe. HoweverSalep is still a common drink in Asia Minor and is regaining its vogue in eastern Mediter-ranean countries. Many species of terrestrial orchids are collected indiscriminately fortheir tubers. All of these orchids are listed in CITES appendices and their trade needspecial permission. In this study, 46 leaf samples of identified taxa were sequenced for ITS1,2 to produce a reference sequence library. Reference library where improved with inte-grating available sequences of related taxa from Genebank. 16 Salep samples purchasedfrom different markets in Iran, their DNA were extracted and sequenced to compare withreference library. From these, 6 tuber samples could be identified to species level withbootstrap validity of >80
⇤Electronic address: [email protected]; Speaker
()
The use of environmental DNA (eDNA) as a tool indetecting invasive fish species and determining the impact
on community assemblages and vertebrate declines intropical freshwater ecosystems
Heather Robson⇤1,3,4, Richard Saunders2,5, Damien Burrows3, Conrad Hoskin1, andDean Jerry1,4
1School of Marine and Tropical Biology, James Cook University, TownsvilleQueensland 4811, Australia
2School of Earth and Environmental Sciences, James Cook University, TownsvilleQueensland 4811, Australia
3TropWATER-Centre for Tropical Water & Aquatic Ecosystem Research, JamesCook University, Townsville Queensland 4811, Australia
4Centre for Sustainable Tropical Fisheries and Aquaculture, James CookUniversity, Townsville Queensland 4811, Australia
5Queensland Department of Agriculture, Fisheries & Forestry, Queensland,Australia
Invasive species are widely considered to be the leading cause of extinction and speciesendangerment in freshwater ecosystems. Their impact appears to be particularly severe intropical regions such as northern Australia, where over 20 invasive fish species have beendiscovered in freshwater rivers and streams. Recently developed techniques of large-scalemonitoring, like metabarcoding, offer great possibilities for regional monitoring of invasivespecies and their impacts, but remain to be fully explored for tropical regions with theirunique climatic conditions (high water temperatures-up to 35�C, elevated UV exposure,and large flow wet seasons).
Here we report on the application of eDNA as a tool in monitoring the presence andinvasion dynamics of the Mozambique tilapia and the spotted tilapia within the tropicalrivers of the north Queensland Wet Tropics Region. We will also be reporting on themonitoring of a newly rediscovered species of critically endangered frog, the armored mistfrog (Litoria lorica) restricted to remote access streams within the same region. We reporton our development of species specific primers for the first two of the key invasive fishspecies within the region and provide the first report on the relationship between theenvironmental temperatures found in the tropics and eDNA degradation, a key initial stepin assessing the utility of this technique as a survey and management tool in tropicalecosystems.
⇤Electronic address: [email protected]; Speaker
()

On the origin of contamination
Per Sjögren⇤1
1University of Tromsø, Tromsø, Norway
All sedimentary ancient DNA samples suffer from contamination to some degree.Common food-plant as cereal and corn are most abundant but easy identifiable and thusnot very problematic. Contamination by species common in the data-set and with anatural habitat within the environment studied is more critical. Here the possibilitythat different sedimentary DNA samples contaminate each other is assessed, so calledcross-contamination. In the two data-sets studied, one modern and one ancient, thereseem to be a degree of cross-contamination of approximately 0.01 to 1
⇤Electronic address: [email protected]; Speaker
()
Description of Pyramimonas diskoicola sp. nov. and theimportance of the flagellate Pyramimonas
(Prasinophyceae) in Greenland sea ice during the winterspring transition
Sara Harðardóttir⇤1, Nina Lundholm1, Øjvind Moestrup2, and Torkel GisselNielsen3
1The Natural History Museum of Denmark, University of Copenhagen, Denmark2Marine Biological Section, Department of Biology, University of Copenhagen,
Denmark3Section for Oceanography and Climate, National Institute of Aquatic Resources,
Technical University of Denmark,Denmark
An undescribed species of the genus Pyramimonas (Prasinophyceae), Pyramimonasdiskoicola sp.nov., was isolated from sea ice in Disko Bay, western Greenland. Based onmorphology and ultrastructure by light and electron microscopy, combined with molecu-lar phylogeny, inferred from the small-subunit SSU rDNA and the large-subunit chloro-plast encoded rbcL, the species is placed in subgenus Vestigifera. The cells possess fourflagella and the cell body measures 8.3 ± 2.6µm in length and 5.1 ± 0.8µm in width.Seven types of scales cover the flagella and cell body. Box and crown scales form theoutermost layers on the cell. The floor on the box scale is solid with an uplifted quadrantin the centre, not seen at any other Pyramimonas species. The phylogenetic analysesindicated P.diskoicola to be closely related to other polar sea ice species of Pyramimonas.The abundance of Pyramimonas in successive stages of sea ice and the water column wasstudied.Pyramimonas colonizes the early stages of forming ice, and the abundance ofPyramimonas was highest in grease ice. The abundance of Pyramimonas was more thanone magnitude higher in sea ice than in the surface water. These results illustrate thatPyramimonas from the ice is an important contributor to the plankton community priorto the spring bloom in Disko Bay.
⇤Electronic address: [email protected]; Speaker
()

Using metabarcoding for the environmental assessmentand monitoring of sedimentary environments: designs,
analysis and interpretations
Anthony Chariton⇤1
1CSIRO Land and Water,New Illawarra Rd, Lucas Heights
Metabarcoding is providing a paradigm shift in the way ecological data is being col-lected. The possibility of producing ecologically relevant data which potentially encom-passes all of life, albeit at varying levels of taxonomic certainty, is a tantalizing consider-ation for the field of environmental monitoring and assessment. However, metabarcodeddata differs markedly from that obtained using traditional approaches such as macroben-thic enumeration, and consequently new approaches are required to collect, analyse andinterpret metabarcoded data within a monitoring framework. In this presentation I willdiscuss some of the unique attributes of metabarcoded data, including its limitations, anddiscuss some practical considerations for designing, collecting, analysing and interpretingmetabarcoded data from coastal and marine sediments.
⇤Electronic address: [email protected]
()

Microbiology DNA metabarcoding
Håvard Kauserud⇤
University of Oslo, Department of Biosciences, Postboks 1066 Blindern, 0316Oslo, Norway
DNA metabarcoding approaches have been used for >15 years to characterize micro-bial communities, including fungi and bacteria. The most commonly used DNA barcoderegions for these organisms groups are parts of the rDNA ITS (fungi) and 16S (bacteria).Although widely in use, the metabarcoding approach is still hampered with numerous bi-ases and difficulties that should be taken into account. In my presentation I will addresssome of these. For example, DNA extraction and PCR are two important steps that mayintroduce severe biases into the results. Also the bioinformatics analyses include somecritical steps, including clustering of sequences into OTUs intended to work as proxiesfor species. Taxonomic annotation is also highly problematic since we still miss referencesequences for many groups and taxa. Besides focusing on problematic points in DNAmetabarcoding of microbial communities I will present results from several projects.
⇤Electronic address: [email protected]
()
Practical IVBasic analysis of metabarcoding data with R
Frédéric Boyer⇤1, Aurélie Bonin†1, and Eric Coissac‡1
1LECA UMR 5553 CNRS/Université Joseph Fourier, BP 53, 2233 Rue de laPiscine, 38041 Grenoble Cedex 9
The last practical will focus on the type of biodiversity analyses that can be performedin R using metabarcoding data. For this purpose, we will introduce the ROBITools, a Rpackage especially developed to handle metabarcoding contingency tables in R. We willalso present the popular R package vegan which is helpful to carry out basic analysessuch as distance matrix computation or multivariate analyses.
⇤Electronic address: [email protected]†Electronic address: [email protected]‡Electronic address: [email protected]
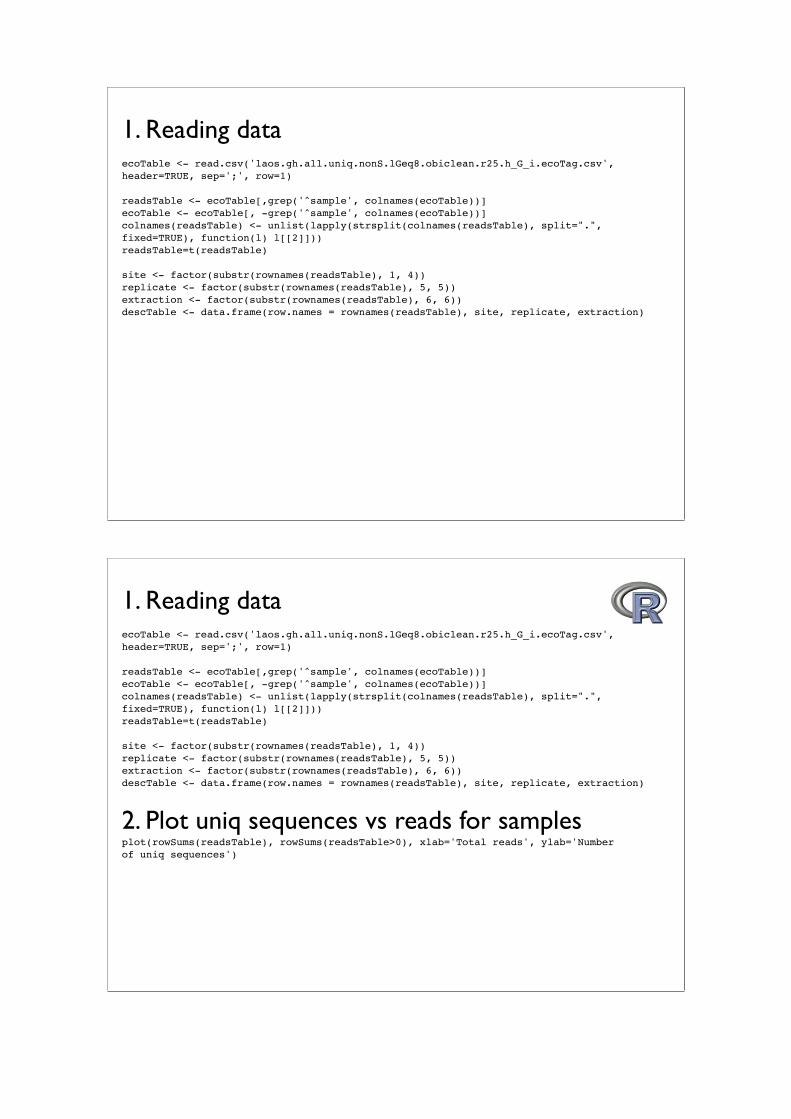
1. Reading dataecoTable <- read.csv('laos.gh.all.uniq.nonS.lGeq8.obiclean.r25.h_G_i.ecoTag.csv', header=TRUE, sep=';', row=1)
readsTable <- ecoTable[,grep('^sample', colnames(ecoTable))]ecoTable <- ecoTable[, -grep('^sample', colnames(ecoTable))]colnames(readsTable) <- unlist(lapply(strsplit(colnames(readsTable), split=".", fixed=TRUE), function(l) l[[2]]))readsTable=t(readsTable)
site <- factor(substr(rownames(readsTable), 1, 4))replicate <- factor(substr(rownames(readsTable), 5, 5))extraction <- factor(substr(rownames(readsTable), 6, 6))descTable <- data.frame(row.names = rownames(readsTable), site, replicate, extraction)
2. Plot uniq sequences vs reads for samplesplot(rowSums(readsTable), rowSums(readsTable>0), xlab='Total reads', ylab='Number of uniq sequences')
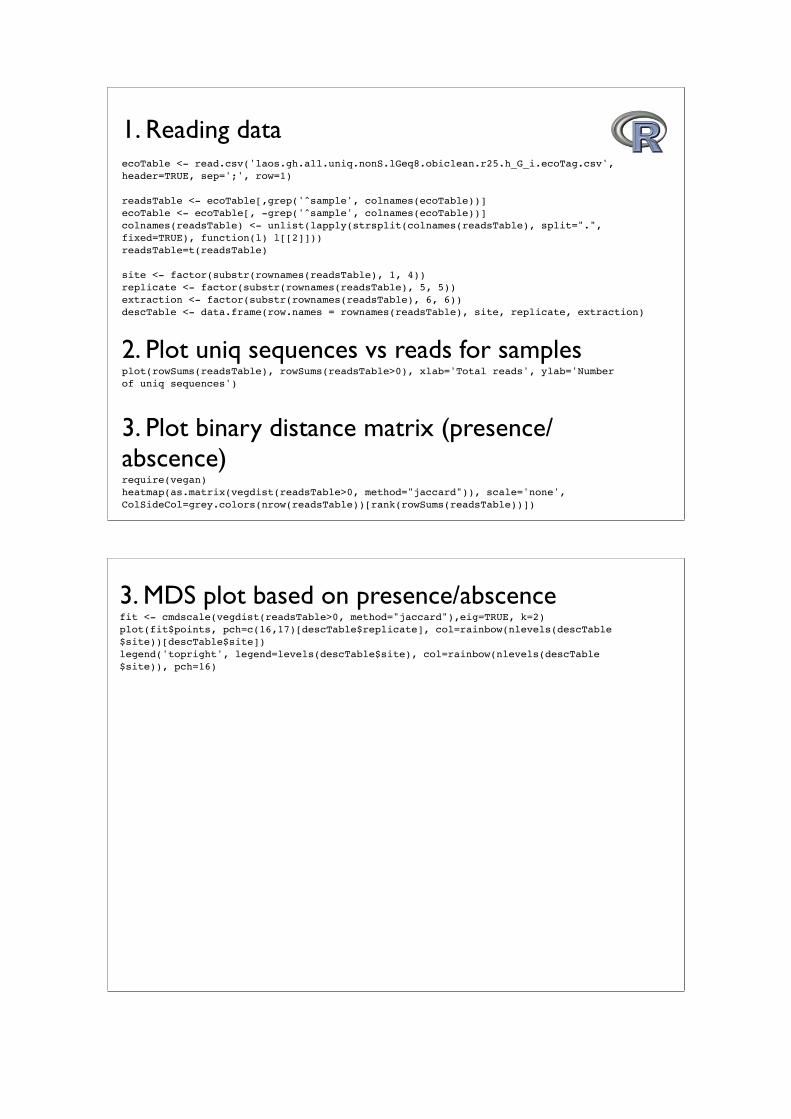
1. Reading dataecoTable <- read.csv('laos.gh.all.uniq.nonS.lGeq8.obiclean.r25.h_G_i.ecoTag.csv', header=TRUE, sep=';', row=1)
readsTable <- ecoTable[,grep('^sample', colnames(ecoTable))]ecoTable <- ecoTable[, -grep('^sample', colnames(ecoTable))]colnames(readsTable) <- unlist(lapply(strsplit(colnames(readsTable), split=".", fixed=TRUE), function(l) l[[2]]))readsTable=t(readsTable)
site <- factor(substr(rownames(readsTable), 1, 4))replicate <- factor(substr(rownames(readsTable), 5, 5))extraction <- factor(substr(rownames(readsTable), 6, 6))descTable <- data.frame(row.names = rownames(readsTable), site, replicate, extraction)
3. Plot binary distance matrix (presence/abscence)require(vegan)heatmap(as.matrix(vegdist(readsTable>0, method="jaccard")), scale='none', ColSideCol=grey.colors(nrow(readsTable))[rank(rowSums(readsTable))])
2. Plot uniq sequences vs reads for samplesplot(rowSums(readsTable), rowSums(readsTable>0), xlab='Total reads', ylab='Number of uniq sequences')
3. MDS plot based on presence/abscencefit <- cmdscale(vegdist(readsTable>0, method="jaccard"),eig=TRUE, k=2)plot(fit$points, pch=c(16,17)[descTable$replicate], col=rainbow(nlevels(descTable$site))[descTable$site])legend('topright', legend=levels(descTable$site), col=rainbow(nlevels(descTable$site)), pch=16)

3. MDS plot based on presence/abscencefit <- cmdscale(vegdist(readsTable>0, method="jaccard"),eig=TRUE, k=2)plot(fit$points, pch=c(16,17)[descTable$replicate], col=rainbow(nlevels(descTable$site))[descTable$site])legend('topright', legend=levels(descTable$site), col=rainbow(nlevels(descTable$site)), pch=16)
4. Working with genus associated sequencesgenusTable <- aggregate(t(readsTable), by= list(genus=ecoTable[,'genus']), FUN=sum)rownames(genusTable) <- genusTable[,1]genusTable <- genusTable[,-1]
barplot(as.matrix(sweep(genusTable, MARGIN=2, STATS=colSums(genusTable), FUN='/')), las=2, col=rainbow(nrow(genusTable)), cex.names=0.7)
genusTable <- t(genusTable)
5. MDS plot based on presence/abscence on genusfit <- cmdscale(vegdist(genusTable>0, method="jaccard"),eig=TRUE, k=2)plot(fit$points, pch=c(16,17)[descTable$replicate], col=rainbow(nlevels(descTable$site))[descTable$site])legend('topright', legend=levels(descTable$site), col=rainbow(nlevels(descTable$site)), pch=16)
()

Reliable, verifiable, and efficient monitoringof biodiversity via metabarcoding
Douglas W. Yu⇤1,2 and Ji Yinqiu†2
1School of Biological Sciences, University of East Anglia,Norwich, Norfolk NR47TJ UK
2Kunming Institute of Zoology, #338, 32 Jiaochang East Rd,Kunming, Yunnan 650223 China
I review the ways that my group has been using metabarcoding to accelerate theresolution of environmental management problems, including examples from restorationecology, agri-environment and forestry-environment schemes, surveillance monitoring,systematic conservation planning, and targeted detection of pests and endangered species.
⇤Electronic address: [email protected]; Speaker†Electronic address: [email protected]
()
Exploring soil tropical biodiversity via DNAmetabarcoding
Lucie Zinger⇤1, Aurélie Bonin2, Amaia Iribar1, Ludovic Gielly2, Eric Coissac2,Heidy Schimann3, Mélanie Roy1, Jérôme Chave1, and Pierre Taberlet2
1Université Toulouse 3 Paul Sabatier, CNRS, ENFA UMR 5174 EDB(Laboratoire Evolution & Diversité Biologique), Toulouse, France
2Université Grenoble 1 Joseph Fourier, CNRS, UMR 5553 LECA (Laboratoired’Ecologie Alpine), Grenoble, France
3UMR AgroParisTech CNRS Ciraf INRA UAG ECOFOG (Ecologie des Forêts deGuyane), Kourou, France
One of the major hurdles in predicting how biological diversity will respond to globalchanges is the limit to compile large and standardized diversity data that are repeatableover time. This is particularly critical for tropical rainforests, where the vast major-ity of species are extremely rare, hardly detectable, and potentially more threaten byenvironmental changes. Here, we applied DNA metabarcoding and next generation se-quencing on tropical rainforest samples (Nouragues Biological Station, French Guiana).361 soil samples were collected (up to 10 cm-depth) in a 1 ha-plot, with a grid step of5 m. Extracellular DNA was extracted on the field, and amplified later on, using dif-ferent universal primers pairs targeting each Archaea, Bacteria, Eukarya, Plants, Fungiand Termites. Sequences obtained with the Eukarya marker showed that Basidiomycota,Annelida, Collembola and Termites dominated tropical soil biota. Bacterial communitieswere dominated by Alphaproteobacteria, Acidobacteria, Actinobacteria whereas archaealones were dominated by Crenarchaeotes. We further drew high-resolution maps of taxadistribution for all organisms detected. Plant species distribution maps corresponded tofield observations, showing the reliability of the method. Using these molecular invento-ries, we are currently examining the patterns of diversity for the three domains of life,and determining how they are related to each other. This study is one of the most com-prehensive description of biodiversity in tropical rainforests and will help to get insightsinto the fundamental processes shaping these communities on a local scale.
⇤Electronic address: [email protected]
()
Next-generation biodiversity assessment of benthiccommunities using high-throughput DNA metabarcoding
Truls Moum⇤1, Henning Reiss1, Paul E. Renaud2, and Tom Moens3
1Faculty of Biosciences and Aquaculture, University of Nordland, Bodø, Norway2Akvaplan-niva, Fram Centre for Climate and the Environment, Tromsø, Norway
3Biology Department, Ghent University, Belgium
Our knowledge of marine benthos is lacking in geographic range, especially in the deepsea and at higher latitudes. We need to monitor benthic biodiversity in the face of humanimpact and environmental change. This project specifically focuses on the demand forcost effective and representative monitoring of benthic organisms in locations of partic-ular concern, including sediments influenced by aquaculture and oil production. Tradi-tional methods for identification of benthic organisms are exceedingly labour-intensiveand time-consuming, and therefore, expensive. In addition, biodiversity assessments re-quire extensive expertise, and are usually limited to a fraction of the existing biodiversity.As a result, there is an obvious mismatch between the need for representative biodiver-sity assessments and the resources at hand. DNA based methods offer the beginning ofa possible solution to these shortcomings. The current project applies next-generationDNA sequencing and barcoding to analyze the communities of benthic organisms fromsediment samples. We aim to expand our knowledge of the benthic biodiversity in borealwaters, in particular that of the marine nematodes.
⇤Electronic address: [email protected]; Speaker
()

Characterizing the composition of the rumen microbiome:a DNA metabarcoding approach
Aurélie Bonin⇤1, Frédéric Boyer1, Eric Coissac1, Ilma Tapio2, Seppo Ahvenjärvi3,Tomasz Stefański3, Johanna Vilkki2, Kevin J. Shingfield3, and Pierre Taberlet1
1Laboratoire d’Ecologie Alpine, CNRS UMR 5553, Université Joseph Fourier, BP53, 38041 Grenoble Cedex 09, France
2MTT Agrifood Research Finland, Animal Genomics, FI-31600 Jokioinen,Finland
3MTT Agrifood Research Finland, Animal Nutrition and Nutrigenomics,FI-31600 Jokioinen, Finland
The rumen microbiome plays a central role in the ability of ruminants to digestplant material, which has major implications for nutrient supply to the animal and forproduction of fermentation end-products such as methane. Therefore, we need a morecomprehensive understanding of the factors influencing rumen taxonomic composition,including host genome and diet. Here, we present a DNA metabarcoding approach tocharacterize the taxa of bacteria, archaea, fungi and protozoa present in the rumen.DNA metabarcoding consists in (1) amplifying short DNA fragments ("barcodes") froma complex mixture of organisms using primers specifically designed for a particular taxo-nomic group of interest; (2) sequencing these barcodes using next-generation sequencingtechnologies; and (3) assigning the obtained sequences to the corresponding taxa basedon a reference sequence database. In this study, we designed the most efficient primerpairs to amplify each rumen target taxon. For this purpose, we drew upon publicly avail-able sequence data, while taking into consideration current next-generation sequencingconstraints. Then we illustrated the usefulness of DNA metabarcoding in an experimentinvestigating the influence of the host species on the rumen microbiome ecosystem, whererumen contents have been transferred from cows to reindeers and sampled periodicallyafterwards.
⇤Electronic address: [email protected]; Speaker
()

DNA metabarcoding and palaeo-enviroments
Pierre Taberlet⇤1
1LECA UMR 5553 CNRS/Université de Grenoble Alpes, , BP 53 2233 Rue de laPiscine, 38041 Grenoble Cedex 9
Since 2003, it is known that permafrost samples contains fossil DNA from both plantsand animals (Willerslev et al. 2003, 2007). The talk will mainly present two recentlypublished papers using DNA metabarcoding to reconstruct past environments. The firststudy analyzed permafrost samples (Willerslev et al. 2014). DNA was extracted from242 samples, amplified with plant specific primers, and sequenced on a next generationsequencer. The results obtained allowed to assess the Arctic vegetation during the last 50thousand years. For much of the period investigated, Arctic vegetation consisted of drysteppe-tundra dominated by forbs. During the Last Glacial Maximum (25?15 kyr BP),diversity declined markedly, although forbs remained dominant. Much changed after 10kyr BP, with the appearance of moist tundra dominated by woody plants and graminoids.The second study concerns the sediments of an alpine lake (Giguet-Covex et al. 2014).Fourty seven core slices were analysed. Two metabarcodes were used, the first for plants,and the second for mammals. The results showed that the most intense erosion periodwas caused by deforestation and overgrazing by sheep and cowherds during the Late IronAge and Roman Period.
Giguet-Covex et al. (2014) Long livestock farming history and human landscapeshaping revealed by lake sediment DNA. Nature Communications,5:3221, doi:10.1038/ncomms4211.
Willerslev et al. (2007) Ancient biomolecules from deep ice cores reveal a forestedSouthern Greenland. Science, 317, 111-114.
Willerslev et al. (2014) Fifty-five thousand years of arctic vegetation and megafaunaldiet. Nature, 506, 47-51.
Willerslev et al. (2003) Diverse plant and animal genetic records from Holocene andPleistocene sediments. Science, 300, 791-795.
⇤Electronic address: [email protected]; Speaker
()
Ancient plant DNA of Nordic Environments
Laura Parducci⇤1
1Dept of Ecology and Genetics Plant Ecology and Evolution,Evolutionary Biology Centre Uppsala University, SWEDEN
Range limits of many plant species are expected to shift considerably in the nextdecades due to human-mediated climate change, particularly in Nordic environments,but the capacity of trees to migrate in response to these events has been questioned.New methodologies allow now to look directly in the species? DNA retrieved from fossilplant archives (peat/lake sediments, permafrost), investigate how species and lineagesresponded in the past and derive lineage specific tolerances and migrations rates forplants.
In my talk I will show how plant DNA information can be effectively retrieved fromthese archives and analyzed following a multidisciplinary approach that combines 1) clas-sical palaeoecological investigations, 2) front-line metabarcoding techniques, 3) analyticmodels based on living plant populations and 4) ecoinformatic modeling analyses.
The outcome of studies based on such approaches is not only useful for investigatingthe driving factors affecting past range shifts, but also for assisting ecological niche-modeling analyses of future range shifts of plants.
⇤Electronic address: [email protected]; Speaker
()
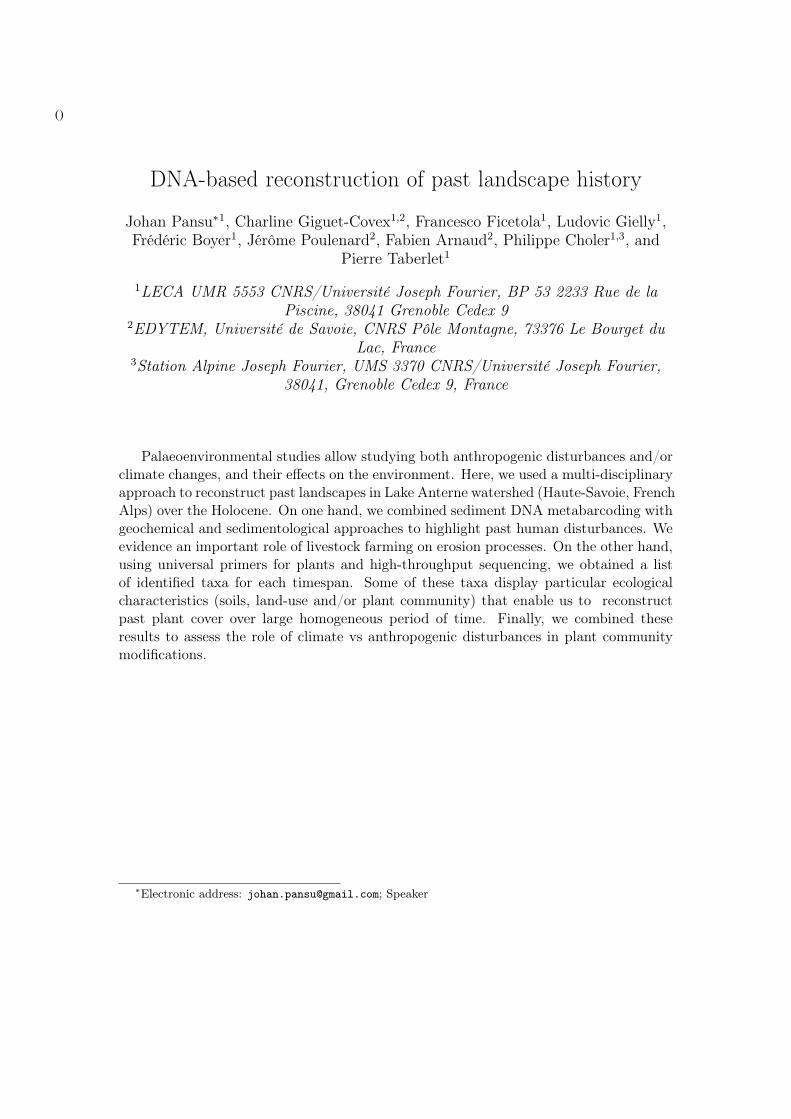
DNA-based reconstruction of past landscape history
Johan Pansu⇤1, Charline Giguet-Covex1,2, Francesco Ficetola1, Ludovic Gielly1,Frédéric Boyer1, Jérôme Poulenard2, Fabien Arnaud2, Philippe Choler1,3, and
Pierre Taberlet1
1LECA UMR 5553 CNRS/Université Joseph Fourier, BP 53 2233 Rue de laPiscine, 38041 Grenoble Cedex 9
2EDYTEM, Université de Savoie, CNRS Pôle Montagne, 73376 Le Bourget duLac, France
3Station Alpine Joseph Fourier, UMS 3370 CNRS/Université Joseph Fourier,38041, Grenoble Cedex 9, France
Palaeoenvironmental studies allow studying both anthropogenic disturbances and/orclimate changes, and their effects on the environment. Here, we used a multi-disciplinaryapproach to reconstruct past landscapes in Lake Anterne watershed (Haute-Savoie, FrenchAlps) over the Holocene. On one hand, we combined sediment DNA metabarcoding withgeochemical and sedimentological approaches to highlight past human disturbances. Weevidence an important role of livestock farming on erosion processes. On the other hand,using universal primers for plants and high-throughput sequencing, we obtained a listof identified taxa for each timespan. Some of these taxa display particular ecologicalcharacteristics (soils, land-use and/or plant community) that enable us to reconstructpast plant cover over large homogeneous period of time. Finally, we combined theseresults to assess the role of climate vs anthropogenic disturbances in plant communitymodifications.
⇤Electronic address: [email protected]; Speaker
()

Ancient DNA of Svalbard
Inger Greve Alsos⇤1, Mary E. Edwards2, Ludovic Gielly3, Per Sjögren4, Nigel G.Yoccoz5, Eric Coissac3, Jon Landvik6, Leif Jacobsen6, Marie K. Føreid1, AnneHormes7, Jostein Bakke8, Christian Brochmann9, Eske Willerslev10, and Pierre
Taberlet3
1Tromsø University Museum2University of Southampton3Université Joseph Fourier
4Tromsø University Museum5University of Tromsø, UiT
6Norwegian University of Life Sciences7University Centre in Svalbard
8University of Bergen9University of Oslo
10University of Copenhagen
Svalbard is among the geographically most remote arctic archipelagos. It was almostcompletely glaciated during the last glacial maximum, and the majority of flora immi-grated during the last 10,000 years. During the hypsithermal 9,500 - 4,000 cal. BP, thetemperatures were 1-2�C warmer than today and macrofossil studies indicate that sev-eral currently rare species had a broader distribution in that period. Here we use aDNAto explore 1) the representation of modern vegetation in upper soil layer, 2) past florawith special focus on thermophilic species and 3) time of species establishment. Multiplesoil samples and one lake core were collected from the largest island Spitsbergen, andone lake core from the small remote island Bjørnøya. Soil samples mainly reflect currentvegetation, but with the addition of some thermophilic taxa. The core form Skartjønawas dated to 8,500 - 1,200 cal. BP and the aDNA analyses revealed 15 taxa also foundas macrofossils by Birks 1991, seven additional taxa, whereas nine taxa discovered asmacrofossils were not found with aDNA. Several of the taxa were thermophilic specieswhich currently have a more restricted distribution in Svalbard. The core from Bjørnøyahas not been dated yet, but the aDNA analyses show that species adapted for dispersalas Salix, Bistorta and Oxyria arrived shortly after deglaciation, whereas species withoutsuch adaptations as e.g. Saxifraga arrived after a time lag. Use of aDNA is a propermethod to increase our knowledge of vegetation development, and is partly complemen-tary to studies of macrofossils.
⇤Electronic address: [email protected]; Speaker
()
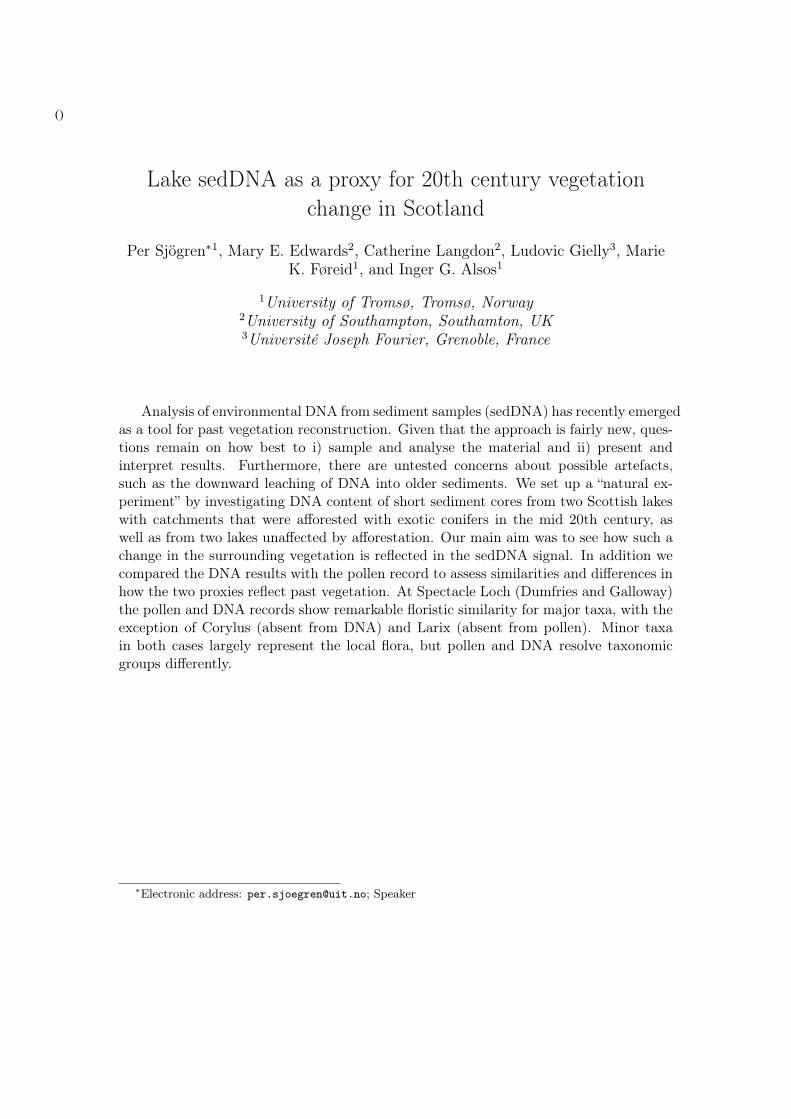
Lake sedDNA as a proxy for 20th century vegetationchange in Scotland
Per Sjögren⇤1, Mary E. Edwards2, Catherine Langdon2, Ludovic Gielly3, MarieK. Føreid1, and Inger G. Alsos1
1University of Tromsø, Tromsø, Norway2University of Southampton, Southamton, UK3Université Joseph Fourier, Grenoble, France
Analysis of environmental DNA from sediment samples (sedDNA) has recently emergedas a tool for past vegetation reconstruction. Given that the approach is fairly new, ques-tions remain on how best to i) sample and analyse the material and ii) present andinterpret results. Furthermore, there are untested concerns about possible artefacts,such as the downward leaching of DNA into older sediments. We set up a “natural ex-periment” by investigating DNA content of short sediment cores from two Scottish lakeswith catchments that were afforested with exotic conifers in the mid 20th century, aswell as from two lakes unaffected by afforestation. Our main aim was to see how such achange in the surrounding vegetation is reflected in the sedDNA signal. In addition wecompared the DNA results with the pollen record to assess similarities and differences inhow the two proxies reflect past vegetation. At Spectacle Loch (Dumfries and Galloway)the pollen and DNA records show remarkable floristic similarity for major taxa, with theexception of Corylus (absent from DNA) and Larix (absent from pollen). Minor taxain both cases largely represent the local flora, but pollen and DNA resolve taxonomicgroups differently.
⇤Electronic address: [email protected]; Speaker
()
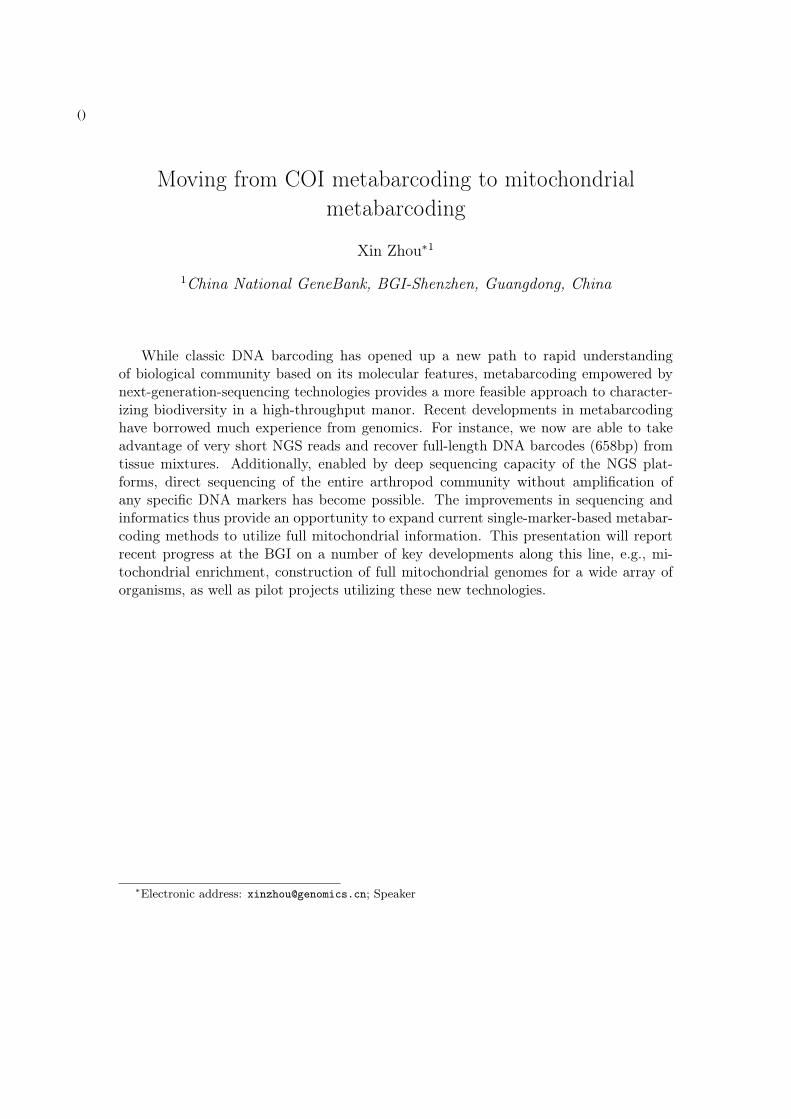
Moving from COI metabarcoding to mitochondrialmetabarcoding
Xin Zhou⇤1
1China National GeneBank, BGI-Shenzhen, Guangdong, China
While classic DNA barcoding has opened up a new path to rapid understandingof biological community based on its molecular features, metabarcoding empowered bynext-generation-sequencing technologies provides a more feasible approach to character-izing biodiversity in a high-throughput manor. Recent developments in metabarcodinghave borrowed much experience from genomics. For instance, we now are able to takeadvantage of very short NGS reads and recover full-length DNA barcodes (658bp) fromtissue mixtures. Additionally, enabled by deep sequencing capacity of the NGS plat-forms, direct sequencing of the entire arthropod community without amplification ofany specific DNA markers has become possible. The improvements in sequencing andinformatics thus provide an opportunity to expand current single-marker-based metabar-coding methods to utilize full mitochondrial information. This presentation will reportrecent progress at the BGI on a number of key developments along this line, e.g., mi-tochondrial enrichment, construction of full mitochondrial genomes for a wide array oforganisms, as well as pilot projects utilizing these new technologies.
⇤Electronic address: [email protected]; Speaker
()
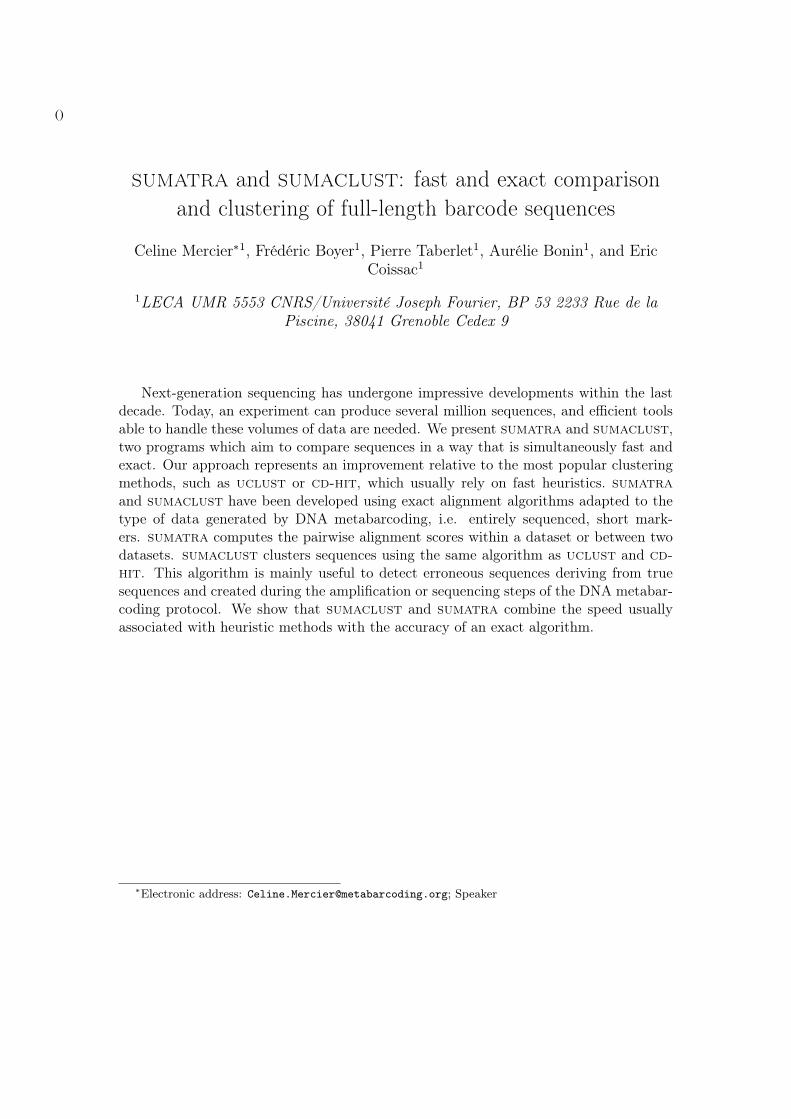
sumatra and sumaclust: fast and exact comparisonand clustering of full-length barcode sequences
Celine Mercier⇤1, Frédéric Boyer1, Pierre Taberlet1, Aurélie Bonin1, and EricCoissac1
1LECA UMR 5553 CNRS/Université Joseph Fourier, BP 53 2233 Rue de laPiscine, 38041 Grenoble Cedex 9
Next-generation sequencing has undergone impressive developments within the lastdecade. Today, an experiment can produce several million sequences, and efficient toolsable to handle these volumes of data are needed. We present sumatra and sumaclust,two programs which aim to compare sequences in a way that is simultaneously fast andexact. Our approach represents an improvement relative to the most popular clusteringmethods, such as uclust or cd-hit, which usually rely on fast heuristics. sumatraand sumaclust have been developed using exact alignment algorithms adapted to thetype of data generated by DNA metabarcoding, i.e. entirely sequenced, short mark-ers. sumatra computes the pairwise alignment scores within a dataset or between twodatasets. sumaclust clusters sequences using the same algorithm as uclust and cd-hit. This algorithm is mainly useful to detect erroneous sequences deriving from truesequences and created during the amplification or sequencing steps of the DNA metabar-coding protocol. We show that sumaclust and sumatra combine the speed usuallyassociated with heuristic methods with the accuracy of an exact algorithm.
⇤Electronic address: [email protected]; Speaker
()
Rapid construction of a comprehensive mitogenome library– Mitochondrion 10K project
Min Tang⇤1, Meihua Tan1, Guanliang Meng1, Xu Su1, Shenzhou Yang1, YiyuanLi2, Wenhui Song1, Qing Zhang1, Shanlin Liu1, and Xin Zhou†1
1China National Genebank, BGI-Shenzhen, Shenzhen, China, 5180832Department of Biological Sciences, University of Notre Dame, IN 46556
Classic DNA barcoding and metabarcoding approaches have been relying on one ortwo standard genes to differentiate species. A recent trend in metabarcoding is to directlysequence the mixed genomic-DNA without having to rely on PCR amplification, whichtypically introduces artifacts due to biased primer efficiencies. One obvious challenge tothis new approach is that the majority of NGS sequences cannot be utilized for speciesidentification due to the lack of reference for non-COI genes. Here we develop a new NGSapproach to rapidly build a reference library for whole mitogenomes in a cost-efficientfashion. In this pilot experiment, we sequence a mixture of 50 animal species withoutindividual tagging or PCR. With only 1 failure, most protein-coding MT genes weresuccessfully recovered for each of the mixed species. Our new pipeline delivers high-quality assemblies even from highly degraded DNA. And closely related species (e.g.,co-genus) can be successfully assembled separately. Based on the success of this pilottest, we propose a new initiative – MT10K – with an aim to sequence whole mitogenomesfor 10,000 animal species. Such dataset will significantly improve our knowledge onmitogenomes across animals and expand the application of metabarcoding to utilize fullset of MT DNA.
⇤Electronic address: [email protected]; Speaker†Electronic address: [email protected]
()

Unifying DNA metabarcoding, DNA barcoding andPhylogenies
Eric Coissac⇤1 and Frédéric Boyer1
1LECA UMR 5553 CNRS/Université Grenoble Alpes, , BP 53 2233 Rue de laPiscine, 38041 Grenoble Cedex 9
DNA barcoding, DNA metabarcoding and phylogenetic studies are using DNA se-quences of genetic markers to infer different facets of the species relationships. Theirtechnical constraints most of the time oblige people working in those different aspects ofthe biology to use different genetic markers and the relationship between these markers isin the best case indirectly established but often not established at all. Today biodiversitystudies take advantage of all these molecular technics to have a better comprehension ofthe species interaction and consequently we need databases establishing clearly the re-lationship between conventional barcodes, metabarcodes and phylogenetic markers. TheNGS allow to propose an solution to this problem. From an animal or vegetal specimen,it is now possible for a low cost to realize a low coverage whole genome sequencing (be-low 1x on average). This low sequencing coverage of the nuclear genomes correspondsto a high coverage for the organelle genomes and for the nuclear rDNA. Thus it is nowpossible to obtain easily at least the whole mitochondrion/chloroplast genome and therDNA sequence for all the collected specimen even stored in herbarium since 100 years.
⇤Electronic address: [email protected]; Speaker
()
Metabarcoding as a routine monitoring tool for Australianestuaries: 1,000s of taxa I cannot pronounce or ecologically
useful data?
Anthony Chariton⇤1, Sarah Stephenson1, and Andy Steven1
1CSIRO Land and Water, Lucas Heights, NSW, Australia
Australians have a strong affinity for the coast, with more than 85% of populationliving within fifty kilometers of the ocean. However, changes in land-use and the rapidurbanization in some coastal areas is having a deleterious effect on coastal environments,with this ultimately being expressed as changes in the key structural and functional at-tributes of the sedimentary communities. In order to the temper the pace of degradation,robust and reliable tools are required to monitor the trajectories of coastal environments.Traditionally, enumeration macrobenthic invertebrates has been the primary approachused to examine and monitor coastal sediments, however, this approach is costly, slowand only examines a minute fraction of a system?s true diversity. Alternatively, ecolog-ical data can now be obtained using DNA based approaches (metabarcoding), with theapproach capturing a previously unattainable breadth of biota, and the life-cycles andtolerances associated with these taxa. Here we illustrate the application of metabarcod-ing for the monitoring of five estuaries of varying ecological condition. We describe keyfinding of this research; as well discuss some considerations for increasing the ecologicalutility of the data and aiding its adoption as routine monitoring tool.
⇤Electronic address: [email protected]; Speaker
()
Drinking water microbiome: preliminary study to assesshow it can vary across a drinking water treatment plant
Antonia Bruno⇤1, Anna Sandionigi1, Massimo Labra1, and Maurizio Casiraghi1
1ZooPlantLab, Department of Biotechnologies and Biosciences, University ofMilano-Bicocca, piazza della scienza, 2 Milan, Italy
Assessing drinking water quality is a key element for environmental monitoring andfor human health. Current models of water quality monitoring are based on one handon chemical parameters and on the other hand on microbiological analysis. The last onecan detect only those known pathogens that can grow on cultured media.
The presence of microorganisms sensu lato has been detected but not investigatedin dept with specific analysis: in particular the community composition and the relatedinteractions between microorganisms are poorly understood.
Since the multiple correlations between the health status of water and microbiomestructural variations of water basins, clearly appear the need to define new indexes ofwater quality, based on the characterization of microbial community, including all themicrobial forms that an ecosystem harbors.
It is only recently, however, that the advances in sequencing technologies, in partic-ular NGS (Next Generation Sequencing technologies) or High Throughput Sequencing,allowed many microbial communities to be characterized using gene sequences amplifieddirectly from environmental samples.
We started in December 2013 a sampling campaign, that will last for one year, acrossa water treatment of Milan, in collaboration with Metropolitana Milanese Spa. TotalDNA is extracted from water samples and will be sequenced with NGS technologies. Thepresence of antibiotic resistant genes is going to be detected and quantified with RealTime PCR. Live/dead ratio of water microorganisms is evaluated for each sample withfluorescent dyes SYBR GREEN I/propidium iodide.
The relationship between physico-chemical parameters and microbiome analysis willled to the definition of new indexes of water quality that could better describe the healthstatus of water.
⇤Electronic address: [email protected]; Speaker
()

Using next generation sequencing to assess the diet of theMediterranean Shag and application of these technologies
for high-throughput study and monitoring of marinebiodiversity
Panagiotis Kasapidis⇤1, Aris Christidis2, Frederic Boyer3, Jon BentKristoffersen1, and Jakob Fric2
1Hellenic Centre for Marine Research (HCMR), P.O.Box 2214, 71003 Heraklion,Crete, Greece
2Hellenic Ornithological Society (HOS), Athens, Greece3Laboratoire d’Ecologie Alpine (LECA), CNRS, Grenoble, France
The diet of a seabird, the Mediterranean Shag (Phalacrocorax aristotelis desmarestii)was assessed using both conventional prey identification and DNA Metabarcoding ap-proaches, within the frame of the EU LIFE project ?ConShagAudMIBAGR?. Regurgi-tated pellets containing undigested prey remains were collected from different colonies ofthe species in Greece. First, conventional prey analysis was carried out on the pellets, byidentifying morphologically the indigestible part remains, mainly fish otoliths. Then, thesame pellets were subjected to amplicon sequencing using the 454 GS-FLX platform, inorder to check how well molecular approaches perform in comparison to conventional onesfor prey identification at the species’ level. The genetic analysis produced results thatwere generally concordant with the otolith analysis, although there were some discrep-ancies, and seems to be reliable and cost effective method. DNA metabarcoding can bealso applied in the study and monitoring of marine biodiversity, especially for planktonand benthic communities, which is currently based on the morphological identification ofspecies and has many limitations. The Hellenic Centre for Marine Research (HCMR) isabout to implement such approaches within the frame of two projects recently launched,which are shortly presented, and the advantages and limitations of the methodology arediscussed.
⇤Electronic address: [email protected]; Speaker
()
POSTERAssessing the potential of metabarcoding data for testing
biodiversity models
Guilhem Sommeria-Klein⇤1, Lucie Zinger1, Pierre Taberlet2, Eric Coissac2,Delphine Rioux2, Amaia Iribar1, and Jérôme Chave1
1EDB Laboratory, Toulouse, France2LECA Laboratory, Grenoble, France
Our general aim is to develop theoretical models of biodiversity and biogeography,more specifically drawing on Hubbell’s neutral theory. In the present poster, we quan-titatively assess the relevance of using metabarcoding data to test biodiversity models,especially in the case of models featuring abundance distributions. For that purpose,we perform numerical simulations of the DNA amplification and sequencing process onartificial data to quantify the propagation of error through the successive steps. More-over, since these artificial data are generated through a neutral model, estimating theparameters of the model from the data after numerical amplification and sequencing, andcomparing them to the actual parameters used, allows to quantify the robustness of theestimation with respect to the metabarcoding process. These results will be comparedto those obtained in parallel through real amplification and sequencing on DNA samplesof known content (’benchmarking’).
⇤Electronic address: [email protected]; Speaker
()
POSTERMonitoring soil microarthropod diversity using high
throughput (e-)DNA metabarcoding tools
Arjen De Groot⇤1, Ivo Laros1, Wim Dimmers1, Kevin Beentjes2, CamielDoorenweerd2, and Jack Faber1
1Alterra - Wageningen UR, P.O. Box 47,6700 AA, Wageningen, The Netherlands.
2NCB Naturalis, Sylviusweg 72, 2333 BE Leiden
Within the EU FP7-project EcoFINDERS, various European partners collaborate togain more insights in links between soil diversity and ecosystem services, across differentsoils, climate types and land uses. To allow rapid screening of many soils throughoutEurope, new tools are being developed for high-throughput species identification basedon the DNA contained in soil extracts. Alterra developed a new approach for the DNAbarcoding of soil mites and participates in development of procedures to integrate ap-proaches for various taxonomic groups into a single metabarcoding framework, based ontwo approaches: I) using DNA from invertebrate communities extracted from the soil andII) using direct (e)DNA extracts from soil. For approach I, soil samples were collectedfrom agricultural soils and (semi-)natural grasslands around Europe, and invertebrateswere extracted from them. A reference data base was created containing CO1 sequencesof as many of the local species as possible. For mites, species discrimination reached89%. Additional samples, to be used for diversity screening, were split in two. DNA wasextracted from one part, the other part was subjected to morphological identification. Amini-barcode located within the CO1-fragment was developed for 454 pyrosequencing ofthe DNA extracts. First pyrosequencing results are expected early 2014. Species compo-sition as obtained via molecular and morphological identification will then be comparedto test the performance of the new method. Based on gained experiences, in 2014 we willwork towards procedures for processing of direct (e)DNA soil extracts (approach II).
⇤Electronic address: [email protected]; Speaker
()

POSTERImpact of ionizing radiations and soil structure on the soil
macrofauna after 20 years of artificial contamination(Komi Republic, Russia)
Emmanuel Lapied⇤1, Turid Hertel-Aas1, Yevgeniya Tomkiv1, Elena Belykh2,Deborah Oughton1, and Turid Hertel-Aas1
1Norwegian University of Life Sciences (NMBU), Isotope Laboratory,Frougnerbakken 20, Ås, Norway
2Institute of Biology, Komi Scientific Center, Kommunisticheskaya 28, 167982Syktyvkar, Russia
A research project was carried out in the Komi Republic (Russia) to assess the im-pact of ionizing radiations and soil structure on the soil macrofauna. The study sitecorresponded to a contamination caused by storage of uranium mill tailings and ra-dium production wastes. Two 10x10m quadrats were established on contaminated sitesand 2 on uncontaminated control sites, both on a sandy and a silty-clayey soil. Earth-worms appeared to be everywhere the most abundant group, followed by insects larvae,adult insects (except ants), molluscs, arachnids and myriapods. Molluscs, arachnidsand myriapods were relatively rare everywhere. Myriapods were the rarest group found.Earthworm density was always lower in contaminated sites than in the controls, whichtends to demonstrate a strong effect of the level of ionizing radiations, whatever the typeof soil. This pattern was also observed in the insect larvae and adult insects. A moredetailed analysis revealed that coleopteran larvae, adult coleoptera, dipteran larvae and,to a lesser extent, arachnids, followed the same pattern. When we compare pairwise theresults between the sandy and the clayey soil within the contaminated sites or controlsites, earthworm densities were always lower in the sandy soil, this result becoming highlysignificant between the contaminated sites. This pattern was not observed in the otheranimal groups suggesting that the soil structure could have a low effect on their densities.Dna Metabarcoding analysis are planned to investigate the impact of ionizing radiationson the soil fauna at the species scale.
⇤Electronic address: [email protected]
()
Index of Authors
——/ A /——Ahvenjärvi, Seppo . . . . . . . . . . . . . 96Arnaud, Fabien. . . . . . . . . . . . . . . .91
——/ B /——Beentjes, Kevin . . . . . . . . . . . . . . 101Belykh, Elena . . . . . . . . . . . . . . . . 102Bonin, Aurélie 3, 29, 53, 82, 94–96Botnen, Synnøve . . . . . . . . . . . . . . 50Boyer, Frédéric . . 3, 29, 53, 82, 88,
91, 94, 96, 99Bronken Eidesen, Pernille . . . . . . 50Bruno, Antonia. . . . . . . . . . . . . . . .98Buddle, Chris . . . . . . . . . . . . . . . . . 43Burrows, Damien. . . . . . . . . . . . . .77
——/ C /——Carlsen, Tor . . . . . . . . . . . . . . . . . . 50Cerezo, Maite . . . . . . . . . . . . . . . . . 46Chariton, Antony . . . . . . . . . . 80, 97Chave, Jérôme . . . . . . . . 24, 95, 100Choler, Philippe . . . . . . . . . . . . . . . 91Christidis, Aris . . . . . . . . . . . . . . . . 88Coissac, Eric . . . . .3, 27, 29, 53, 82,
94–96, 99, 100Comtet, Thierry . . . . . . . . . . . . . . . 45Costello, Allan . . . . . . . . . . . . . . . . 74Cristofori, Antonella . . . . . . . . . . . 44
——/ D /——Davey, Marie Louise . . . . . . . . . . . 50de Barba, Marta . . . . . . . . . . . . . . . 52de Boer, Hugo . . . . . . . . . . . . . . . . 76de Groot, Arjen . . . . . . . . . . . . . . 101Delerue-Ricard, Sophie . . . . . . . . 45Dhaygude, Kishor . . . . . . . . . . . . . 75Dimmers, Wim . . . . . . . . . . . . . . 101Doorenweerd, Camiel . . . . . . . . 101Dubuisson, Jean-Yves . . . . . . . . . 47
——/ E /——Edwards, Mary E. . . . . . . . . . . . . . 78Ehrich, Dorothee . . . . . . . . . . . . . . 46Erasmus, Daniel . . . . . . . . . . . . . . . 74
——/ F /——Faber, Jack . . . . . . . . . . . . . . . . . . 101Ficetola, Francesco . . . . . . . . . . . . 91Flores, Anne-Marie . . . . . . . . . . . . 74Fric, Jakob. . . . . . . . . . . . . . . . . . . .88
——/ G /——Ghorbani, Abdolbaset . . . . . . . . . .76Gielly, Ludovic . . . . . 24, 78, 91, 95
Giguet-Covex, Charline . . . . . . . . 91Gillingham, Michael . . . . . . . . . . . 74Gonzalez Gonzalez, Irma . . . . . . 49Gravendeel, Barbara . . . . . . . . . . . 76Greve Alsos, Inger . . . . . . . . . 78, 92Guðmundsdóttir, Ragnhildur . . . 22
——/ H /——Hambäck, Peter . . . . . . . . . . . . . . . 19Harðardóttir, Sara . . . . . . . . . . . . . 79Hassel, Kristian . . . . . . . . . . . . . . . 21Hebert, Paul . . . . . . . . . . . . . . . . . . 48Hertel-Aas, Turid . . . . . . . . . . . . 102Hoye, Toke . . . . . . . . . . . . . . . . . . . 43Huber, Dezene . . . . . . . . . . . . . . . . 74Høye, Toke Thomas . . . . . . . . . . . 73
——/ I /——Iribar, Amaia . . . . . . . . . .24, 95, 100
——/ J /——Jerry, Dean . . . . . . . . . . . . . . . . . . . 77Johansson, Helena . . . . . . . . . . . . . 75
——/ K /——K. Føreid, Marie . . . . . . . . . . . . . . 78Kaila, Lauri . . . . . . . . . . . . . . . . . . . 48Kasapidis, Panagiotis . . . . . . . . . . 88Kauserud, Håvard . . . . . . . . . . . . . 81Kauserud, Håvard . . . . . . . . . . . . . 50Keesing, Felicia . . . . . . . . . . . . . . . 25Kekkonen, Mari . . . . . . . . . . . . . . . 48Kelly, Ryan . . . . . . . . . . . . . . . . . . . 26Kristoffersen, Jon Bent . . . . . . . . .88Kulmuni, Jonna . . . . . . . . . . . . . . . 75
——/ L /——Langdon, Catherine . . . . . . . . . . . . 78Lapied, Emmanuel . . . . . . . . . . . 102Laros, Ivo . . . . . . . . . . . . . . . . . . . 101Le Cam, Sabrina . . . . . . . . . . . . . . 45Leontidou, Cleopatra . . . . . . . . . . 44Levi, Taal . . . . . . . . . . . . . . . . . . . . .25Li, Yiyuan . . . . . . . . . . . . . . . . . . . . 23Liu, Shanlin . . . . . . . . . . . . . . . . . . 23Loboda, Sarah . . . . . . . . . . . . . . . . 43Lundholm, Nina . . . . . . . . . . . . . . . 79
——/ M /——Meng, Guanliang . . . . . . . . . . . . . . 23Mercier, Céline . . . . . . . . . . . . . . . 94Moens, Tom . . . . . . . . . . . . . . . . . . 87Moestrup, Øjvind . . . . . . . . . . . . . 79Moum, Truls . . . . . . . . . . . . . . . . . . 87
Murray, Brent . . . . . . . . . . . . . . . . . 74Mutanen, Marko . . . . . . . . . . . . . . 48
——/ N /——Nielsen, Torkel Gissel . . . . . . . . . 79Nieminen, Marko. . . . . . . . . . . . . .48
——/ O /——Osathanunkul, Maslin . . . . . . . . . .20Ostfeld, Richard S. . . . . . . . . . . . . 25Oughton, Deborah . . . . . . . . . . . . 102
——/ P /——Pansu, Johan . . . . . . . . . . . . . . . . . . 91Parducci, Laura . . . . . . . . . . . . . . . 90Poirier, Lisa. . . . . . . . . . . . . . . . . . .74Port, Jesse . . . . . . . . . . . . . . . . . . . . 26Poulenard, Jérôme . . . . . . . . . . . . . 91Prosser, Sean . . . . . . . . . . . . . . . . . 48Pálsson, Snæbjörn . . . . . . . . . . . . . 22
——/ R /——Reeb, Catherine . . . . . . . . . . . . . . . 47Reisner Hansen, Rikke . . . . . . . . . 73Reiss, Henning . . . . . . . . . . . . . . . . 87Renaud, Paul E . . . . . . . . . . . . . . . . 87Rioux, Delphine . . . . . . . . . . . . . 100Robert, Jeanne . . . . . . . . . . . . . . . . 74Robinson, Clare H. . . . . . . . . . . . . 49Robson, Heather . . . . . . . . . . . . . . 77Roslin, Tomas . . . . . . . . . . . . . . . . .19Roy, Mélanie . . . . . . . . . . . . . . . . . 95
——/ S /——Saunders, Richard . . . . . . . . . . . . . 77Savage, Jade . . . . . . . . . . . . . . . . . . 43Schimann, Heidy . . . . . . . . . . . . . . 95Schwarzfeld, Marla . . . . . . . . . . . . 74Shingfield, Kevin J. . . . . . . . . . . . . 96Shrimpton, Mark . . . . . . . . . . . . . . 74Sjögren, Per . . . . . . . . . . . . . . . . . . 78Sommeria-Klein, Guilhem . . . . 100Song, Wenhui . . . . . . . . . . . . . . . . . 23Stefanski, Tomasz . . . . . . . . . . . . . 96Stenøien, Hans K. . . . . . . . . . . . . . 21Stephenson, Sarah . . . . . . . . . . . . . 97Steven, Andy . . . . . . . . . . . . . . . . . 97Su, Xu . . . . . . . . . . . . . . . . . . . . . . . 23Sundström, Liselotte . . . . . . . . . . . 75
——/ T /——Taberlet, Pierre . . . 1, 24, 28, 89, 91,
94–96, 100Tan, Meihua . . . . . . . . . . . . . . . . . . 23

Tang, Min . . . . . . . . . . . . . . . . . . . . 23Tapio, Ilma . . . . . . . . . . . . . . . . . . . 96Thielman, Aynsley . . . . . . . . . . . . 74Tomkiv, Yevgeniya . . . . . . . . . . . 102Trontti, Kalevi . . . . . . . . . . . . . . . . 75
——/ V /——van Dongen, Bart E. . . . . . . . . . . . 49Vernesi, Cristiano . . . . . . . . . . . . . 44Viard, Frédérique . . . . . . . . . . . . . . 45
Vik, Unni . . . . . . . . . . . . . . . . . . . . . 50Vilkki, Johanna . . . . . . . . . . . . . . . 96
——/ W /——Weingartner, Elisabeth . . . . . . . . . 19Wirta, Helena . . . . . . . . . . . . . . . . . 19
——/ Y /——Yamahara, Kevan . . . . . . . . . . . . . . 26Yang, Shenzhou . . . . . . . . . . . . . . . 23
Yinqiu, Ji . . . . . . . . . . . . . . . . . . . . . 86Yoccoz, Nigel . . . . . . . . . . . . . . . . . . 2Yousefi, Narjes . . . . . . . . . . . . . . . . 21Yu, Douglas W. . . . . . . . . . . . . . . . 86
——/ Z /——Zhang, Qing . . . . . . . . . . . . . . . . . . 23Zhou, Xin . . . . . . . . . . . . . . . . . 23, 93Zinger, Lucie . . . . . . 24, 51, 95, 100
Related Documents