- 1 - Research Report No. 2018-10 Tsinghua University National Institute of Financial Research 2017 Annual Report of China’s Systemic Financial Risk Hao Zhou, Xiangpeng Chen, Biqing He and Jing Zhao Monetary Policy and Financial Stability Center National Institute of Financial Research, Tsinghua University March 28, 2018 Summary In 2017, the Chinese government has launched a torrent of investigations and regulations to revamp the financial system. As part of the efforts on reining in risk in the financial market, tighter policies have been developed and imposed. In this context, we have employed selective measures to assess the systemic risk of China’s financial systems. We have also investigated the systemic contribution of financial institutions at all levels. Based on the results, we have made relevant policy recommendations. Using various approaches proposed in existing literature, we have monitored the systemic risk of China’s financial system at both macro and micro levels. Our results show that: (i) when entering the era of tough financial regulation, the overall systemic risk soared once and has stabilized at a safe range later, indicating that the regulators should effectively

Welcome message from author
This document is posted to help you gain knowledge. Please leave a comment to let me know what you think about it! Share it to your friends and learn new things together.
Transcript
- 1 -
Research Report
No. 2018-10 Tsinghua University National Institute of Financial Research
2017 Annual Report of China’s Systemic Financial Risk
Hao Zhou, Xiangpeng Chen, Biqing He and Jing Zhao
Monetary Policy and Financial Stability Center
National Institute of Financial Research, Tsinghua University
March 28, 2018
Summary
In 2017, the Chinese government has launched a torrent of investigations and
regulations to revamp the financial system. As part of the efforts on reining in risk in the
financial market, tighter policies have been developed and imposed. In this context, we
have employed selective measures to assess the systemic risk of China’s financial systems.
We have also investigated the systemic contribution of financial institutions at all levels.
Based on the results, we have made relevant policy recommendations.
Using various approaches proposed in existing literature, we have monitored the
systemic risk of China’s financial system at both macro and micro levels. Our results show
that: (i) when entering the era of tough financial regulation, the overall systemic risk soared
once and has stabilized at a safe range later, indicating that the regulators should effectively
- 2 -
communicate with stakeholders to avoid high volatility induced by the unexpected policy
change while maintaining the strong and rigorous regulatory regime; (ii) at the industry
level, the banking sector has the highest contribution to the systemic risk, and joint-stock
commercial banks with the lowest capacity on risk coverage, both worth close monitoring;
(iii) at the institutional level, the authorities should draw special attention to Pudong
Development Bank (SPDB), Bank of Beijing (BOB), Pingan Insurance (PINGAN), Pingan
Bank (PAB), China Merchants Bank (CMB) and Industrial Bank (CIB).
I. Background
Since our 2017 first-quarter report (Systemic Risk of China’s Financial System 1Q17)
has published, the Chinese government has given greater emphasis to financial system
oversight. It has prioritized three main tasks for China’s future economic and financial
development: boost the financial industry to better serve the real economy, prevent and
dissolve systemic risk to ensure financial stability, pursue structural change and financial
sector deepening. China is working towards enhancing its surveillance and monitoring
capabilities to mitigate financial risks.
During the conference of the Political Bureau in April, China’s highest decision-
making body has set the bottom line as avoiding systemic events in China for the first time
and underscored the importance of ensuring financial stability. This objective has been
reemphasized in the National Finance Working Conference in July, which also announced
that the State Council had established a Financial Stability and Development Committee to
coordinate oversight and supervision in the financial sector. The financial regulatory
agencies all have started to impose tighter regulations to improve stability and safety of the
financial market.
First, the People’s Bank of China (PBOC) further consolidated the evaluation
mechanism of the Macro Prudential Assessment (MPA) framework. It has also released
draft guidelines that will unify rules covering asset management products, jointly with
China Banking Regulatory Commission (CBRC), China Securities Regulatory
Commission (CSRC), China Insurance Regulatory Commission (CIRC) and State

- 3 -
Administration of Foreign Exchange (SAFE).
Second, CBRC, China’s banking regulator, has devoted to eradicating irregularities in
the sector, such as irregular arbitrage, illegal transactions, wrongful profit-making and
improper fees or charges. A new guideline has been issued to regulate 10 major areas,
encompassing equity and foreign investment, institutions and their executive members,
regulatory framework, products and transactions, and business integrity.
Third, CSRC has stepped up efforts in supervising areas including mergers and
acquisitions (M&A) and initial public offerings (IPO). It has also improved its regulatory
mechanism, centering around supervising the transactions initiated by regulatory members,
applying the ‘penetrating’ supervision method, to avoid the regulatory arbitrage.
Last, CIRC has fully implemented the Solvency II. It can surveil the usage of insurance
funds, and prohibit investing in multi-layer nested financial products, which have uncertain
underlying assets, suspicious cash flows, or dubious risk profiles. It has also augmented the
regulatory framework on market-exit and business-transfer in the insurance market.
II. Macro Dimension: Although the systemic risk remains stable, the authorities
should continuously strengthen its regulatory mechanism.
Over the past twelve years (June 2006 – Dec 2017), our measure of catastrophic risk
in the financial system (CATFIN) (Appendix I) has remained in a relatively stable and safe
range (Figure 11). Its volatility is comparable to the historical average. These indicate the
predictability and stability of the systematic financial risks at the macro level, which
diminishes the possibility of the occurrence of systemic events in the foreseeable future.
1 The sample includes 202 listed companies in finance and property industries. CATFIN is calculated by
standardizing the tail risk measures of the sample firms, applying generalized Pareto distribution (GPD), extreme value
distribution (GEV) and non-parametric methods.

- 4 -
Figure 1 Macro dimension: the time series of CATFIN (2006-2017)
Source: Tsinghua University NIFR
Note: the global crisis period (May 2007 – November 2008) has been highlighted in light grey; the
market crash (May 2015 – September 2015), when the A-share market fluctuated abnormally, has been
highlighted in dark grey. The red line is the alert threshold, calculated as the historic average plus two
standard deviations.
The performance of the real economy is in line with the movement of CATFIN.
China’s economy has maintained a sustained and balanced growth. Accompany with the
deepening of the supply-side reform, the economic structure has been continuously
optimized to improve the quality of economic growth. The GDP growth rate is 6.9% in
1Q17 & 2Q17 and 6.8% in 3Q17 & 4Q17, higher than (or equal to) those of last year and
outpacing market expectations. The manufacturing PMI has stayed above the 50-threshold
for seventeen consecutive months and peaked at 52.4% in September, the first time in the
last five years. The monthly average growth rate of delivery value of industrial exports
between March and December 2017 is 10.13%, well above 1.02% for 2016.
- 5 -
Even under such rigorous regulatory pressure, the financial outcomes have kept up
with market expectations, and regulations forcing off-balance sheet assets back on balance
sheet have sustained the credit expansion. This brings in 13.53-trillion-yuan worth of new
lending in 2017, 7% higher than that in 2016. The credit balance has risen 12.7% to 120.13
trillion yuan. The amount of the total social financing (TSF) balance has risen 12.0% to
174.64 trillion yuan. Overall, the credit expansion is proceeding well, relatively unaffected
by the strengthened regulations. It is worth noting that the Chinese government, in 2017,
has imposed the most stringent and intensive regulation policies ever on the property
market. In 2017, it has been estimated that there are over 180 policies2 related to the real
estate have been introduced to over 50 cities in total. These new policies, with greater
precision and accuracy, are aimed at mildly reducing the accumulated risks in the property
market.
In the financial industry, banking, insurance, and securities sectors all exhibit a steady
growth, while experiencing structural reforms under stricter supervision. Therefore, the
financial industry is providing more significant support to the real economy. Moreover, the
stronger regulations also help to rectify the preexisting market disorder in the banking
sector. The PBOC has maintained a prudent and neutral monetary policy, cultivating
‘contractive and balanced’ market expectations. It is advocating a gradual deleveraging to
prevent accumulating systemic risks in the financial system. As regard to the exchange rate,
it is stabilizing since the CNY depreciation trend against the USD has been reversed since
March. The State Administration of Foreign Exchange (SAFE) has added a counter-cyclical
factor to the currency pricing model in June, hedging against the cyclical volatility of
market sentiment and countering the unilateral or directional expectation of the currency
market.
Looking at more recent data from 2015, the CATFIN has been moving in a safe
range most of the time, except during the periods when the stock market fluctuates
2 Statistics source: Centaline Property Agency
- 6 -
abnormally (Figure 2 3 ). Overall, CATFIN is trending toward the long-term market
expectation and remains at a stable level. However, the measure’s short-term fluctuation is
more likely caused by the regulation changes or overreaction to such market shocks. For
example, the CATFIN has soared between April and June, when CBRC took a firm position
on regulating the financial industry and subsequently put forward rigorous regulation
policies, causing widespread market panic. Nevertheless, the market has gradually
absorbed the shocks caused by regulation changes and further benefited from stronger
financial regulations. The government has been making progress on regulating the financial
markets. Especially for the banking sector, the market turmoil has been pacified profoundly.
Based on the analysis above, we recommend that the authorities should maintain a
strong and rigorous regulatory enforcement regime in the financial markets, reinforcing
both functional and conduct supervisions. Strengthened regulations are conducive to
deepen the financial reform while preventing systemic risk. A strong and stable financial
market can better serve the real economy. Meanwhile, the regulators should monitor the
market movement closely. Stable market expectations can be achieved by more proactive
and effective communication with market participants to avoid high market volatility
induced by unexpected policy adjustment. The regulatory mechanism can be continuously
improved to generate substantial economic benefits at minimal costs.
3
A shorter period has been measured, applying the same approach as above; more frequent (weekly) data
points have been included and adjustment has been made when calculating the trend, using a larger discounting factor.

- 7 -
Figure 2 Macro dimension: the time series of CATFIN (2015-2017)
Source: Tsinghua University NIFR
Note: the market crash (May 2015 – September 2015), when the A-share market fluctuated
abnormally, has been highlighted in dark grey. The red line is the alert threshold, calculated by adding
the historic average and two standard deviations.
III. Industry Dimension: The banking sector has the highest systemic risk
contribution, yet the trend is improving; within the banking sector, the authorities
should pay more attention to joint-stock commercial banks.
A. The banking sector has the highest systemic risk contribution in the financial
industry
We have estimated three micro-level systemic risk indicators, including systemic
expected shortfall (SES), delta conditional value-at-risk (∆CoVaR), and systemic risk
measure (SRISK) (Appendix I), for all listed financial institutions, 57 in total. The sample
analysis has been conducted for banking, securities, and insurance sectors (Figure 3).

- 8 -
Figure 3 Systemic Contribution by Industry
Source: Tsinghua University NIFR
First, the ∆CoVaRs for banking, securities, and insurance sectors all have fallen
sharply in 2017. SRISK and SES are far below the peak values in 2015, when the stock
market experienced abnormal fluctuations, and are trending towards stable levels.
Second, the banking sector has higher total and average values of three indicators than
the other two sectors, consistent with the fact that it has the highest overall size among the
three. Thus, the banking sector has the highest contribution to the systemic financial risk.
We advise to focus on the banking sector when taking measures to prevent systemic risk in
the financial industry.
B. The joint-stock commercial banks have low loss coverage capacity
To investigate further, we divide the banking sector into state-owned commercial banks,
joint-stock commercial banks, and regional commercial banks. We evaluate their risk
absorbing capacity on loss coverage by looking at the expected loss coverage ratio (Total
Market Capital/SRISK). Among the three categories, the joint-stock commercial banks

- 9 -
seem to have relatively low capacity to cover the potential loss, due to systemic shocks
(Figure 4).
Figure 4 Expected Loss Coverage Ratio of Banking Industry
Source: Tsinghua University NIFR
On the one hand, the expected loss coverage ratios for state-owned commercial banks
and joint-stock commercial banks are moving upwards, whereas ratios for regional
commercial banks remain stable. Overall, the banking sector has been augmenting its
capacity to absorb systemic risk shocks under more rigorous regulations. On the other hand,
the expected loss coverage ratios for state-owned commercial banks and regional
commercial banks have been mostly higher than 1 since 2015. Especially for regional
commercial banks, the ratios stay above 1.54. On the contrary, joint-stock commercial
banks have low loss coverage ratios, mostly between 0.8 and 1. Thus, the joint-stock
4
Because many regional commercial banks were not listed until late 2016, the expected loss coverage ratios prior
2017 are less relevant and have low explanatory power for the sectors performance. Thus, our report has given more
emphasis to its systemic risk since 2017.
- 10 -
commercial banks, revealing low coverage capacity for absorbing systemic risk shocks,
should attract special attention from the regulatory authorities.
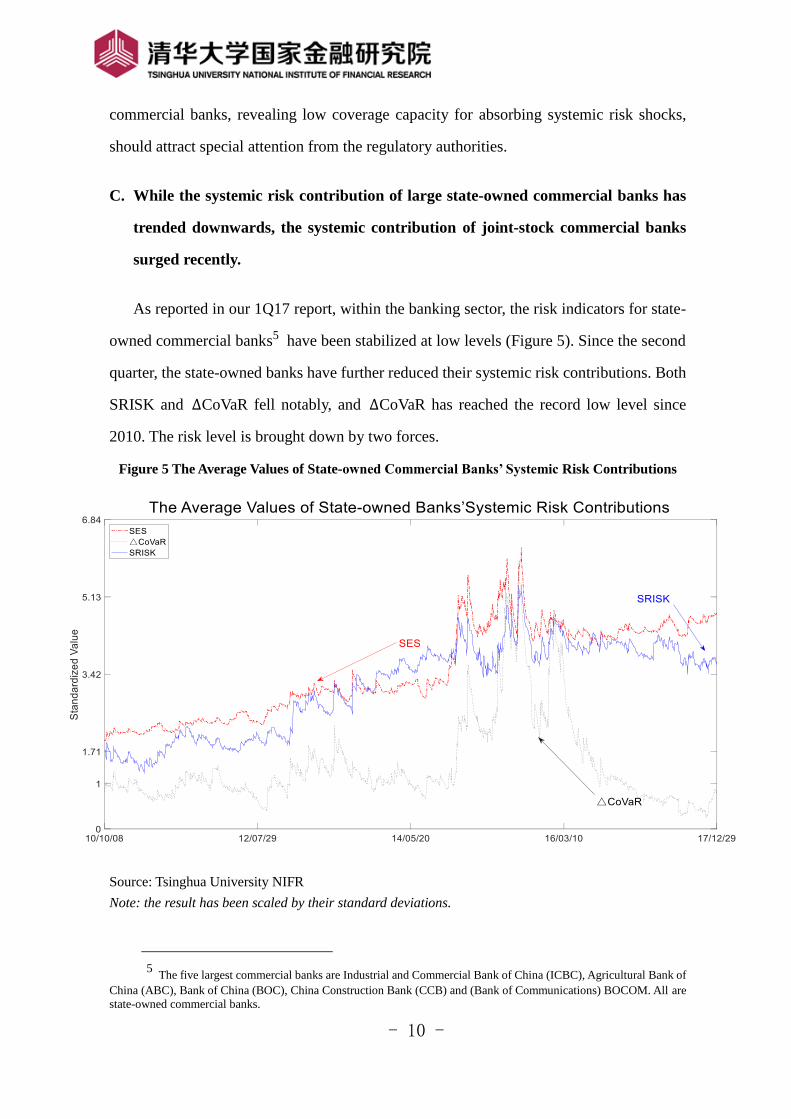
C. While the systemic risk contribution of large state-owned commercial banks has
trended downwards, the systemic contribution of joint-stock commercial banks
surged recently.
As reported in our 1Q17 report, within the banking sector, the risk indicators for state-
owned commercial banks5 have been stabilized at low levels (Figure 5). Since the second
quarter, the state-owned banks have further reduced their systemic risk contributions. Both
SRISK and ∆CoVaR fell notably, and ∆CoVaR has reached the record low level since
2010. The risk level is brought down by two forces.
Figure 5 The Average Values of State-owned Commercial Banks’ Systemic Risk Contributions
Source: Tsinghua University NIFR
Note: the result has been scaled by their standard deviations.
5
The five largest commercial banks are Industrial and Commercial Bank of China (ICBC), Agricultural Bank of
China (ABC), Bank of China (BOC), China Construction Bank (CCB) and (Bank of Communications) BOCOM. All are
state-owned commercial banks.

- 11 -
First, state-owned commercial banks have made large progress on controlling credit
risk. The growth rate of non-performing loans (NPL) has been decreasing in 2017, within
the range between 2% and 5% (Figure 6). From 1Q17 to 4Q17, the quarterly growth rate
of NPL for the state-owned commercial banks is -0.11%, well below the average rate 3.06%
for the whole banking sector, 3.14% for joint-stock and 5.04% for regional commercial
banks. Particularly in 2Q17 and 3Q17, the amount of NPL at state-owned commercial banks
has been decreasing, and the growth rate in 3Q17 is -2.01%.
Figure 6 Growth Rates of NPL in the Banking Sector
Source: Tsinghua University NIFR, CBRC
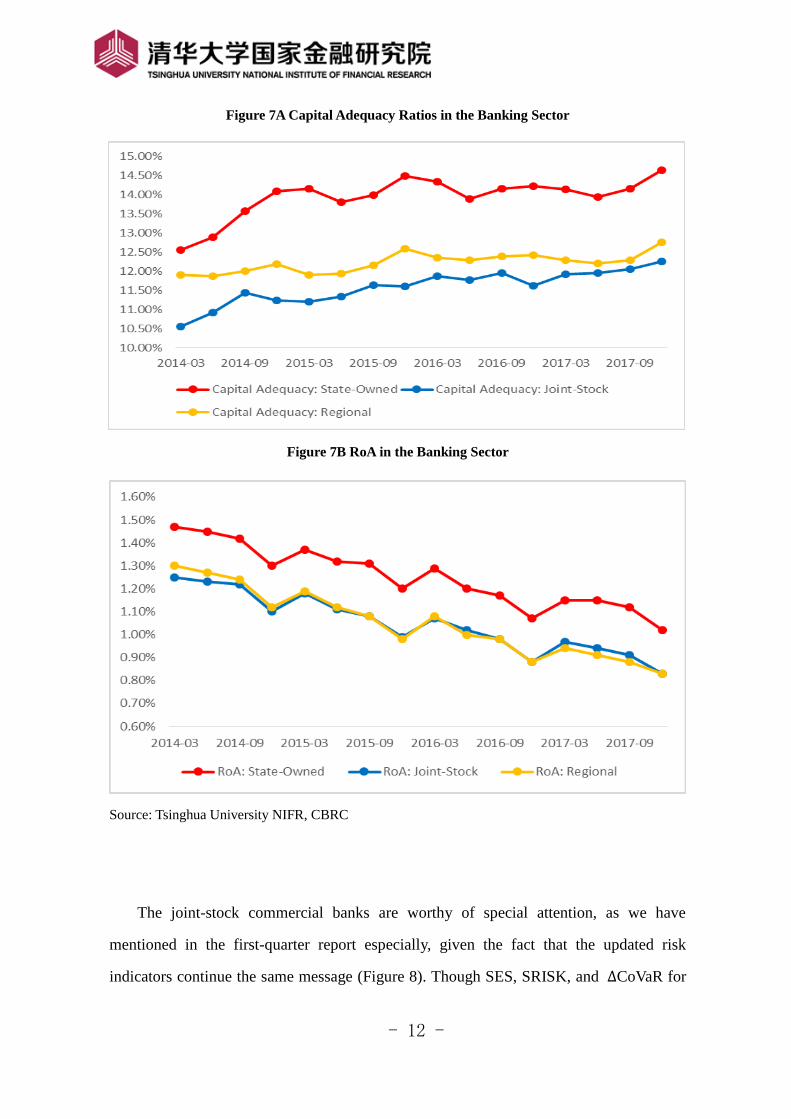
Second, state-owned commercial banks have benefited sufficient capital and high
return on assets (RoA). Since 2014, the average capital adequacy ratio of state-owned
commercial banks has been approximately 2.37% higher than joint-stock commercial banks,
and 1.73% higher than regional commercial banks (Figure 7A). Meanwhile, the RoA for
state-owned commercial banks has been higher than both join-stock and regional
commercial banks since 2014 and this gap is stable around 0.2% (Figure 7B).
- 12 -
Figure 7A Capital Adequacy Ratios in the Banking Sector
Figure 7B RoA in the Banking Sector
Source: Tsinghua University NIFR, CBRC
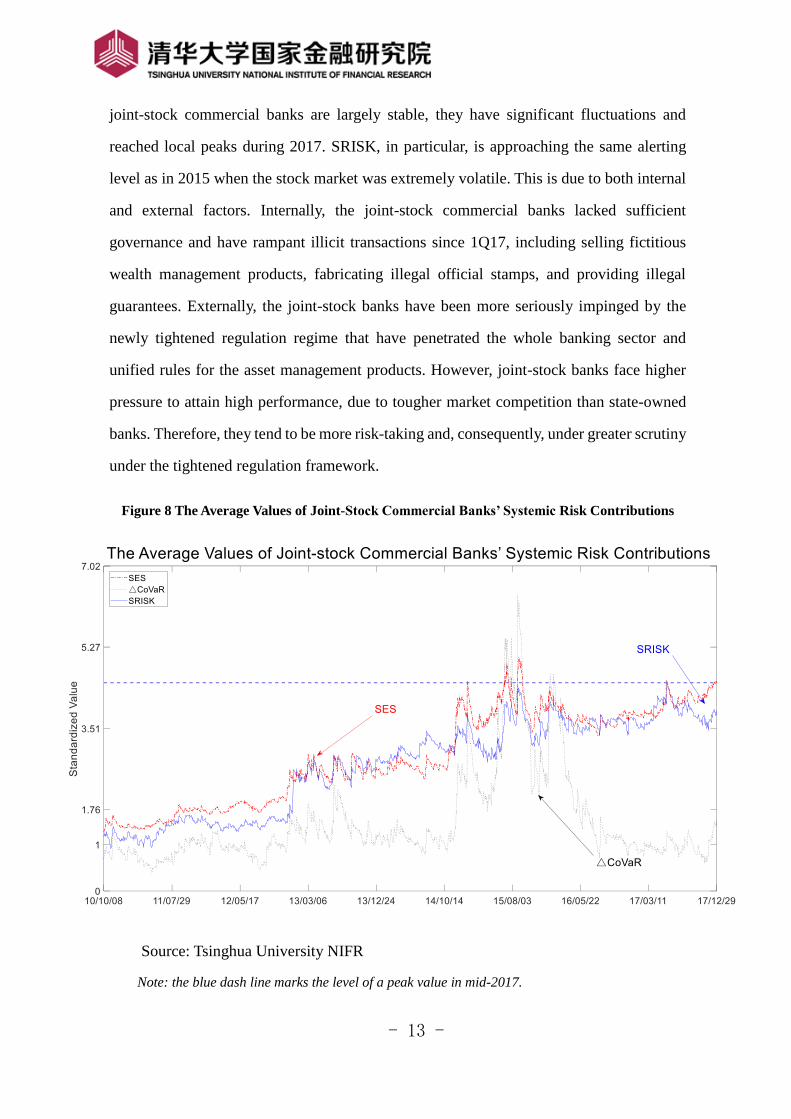
The joint-stock commercial banks are worthy of special attention, as we have
mentioned in the first-quarter report especially, given the fact that the updated risk
indicators continue the same message (Figure 8). Though SES, SRISK, and ∆CoVaR for
- 13 -
joint-stock commercial banks are largely stable, they have significant fluctuations and
reached local peaks during 2017. SRISK, in particular, is approaching the same alerting
level as in 2015 when the stock market was extremely volatile. This is due to both internal
and external factors. Internally, the joint-stock commercial banks lacked sufficient
governance and have rampant illicit transactions since 1Q17, including selling fictitious
wealth management products, fabricating illegal official stamps, and providing illegal
guarantees. Externally, the joint-stock banks have been more seriously impinged by the
newly tightened regulation regime that have penetrated the whole banking sector and
unified rules for the asset management products. However, joint-stock banks face higher
pressure to attain high performance, due to tougher market competition than state-owned
banks. Therefore, they tend to be more risk-taking and, consequently, under greater scrutiny
under the tightened regulation framework.
Figure 8 The Average Values of Joint-Stock Commercial Banks’ Systemic Risk Contributions
Source: Tsinghua University NIFR
Note: the blue dash line marks the level of a peak value in mid-2017.
- 14 -
IV. Institutional Dimension: Institutions including Pudong Development Bank
(SPDB), Bank of Beijing (BOB), Pingan Insurance (PINGAN), Pingan Bank (PAB),
China Merchants Bank (CMB) and Industrial Bank (CIB) need close monitoring
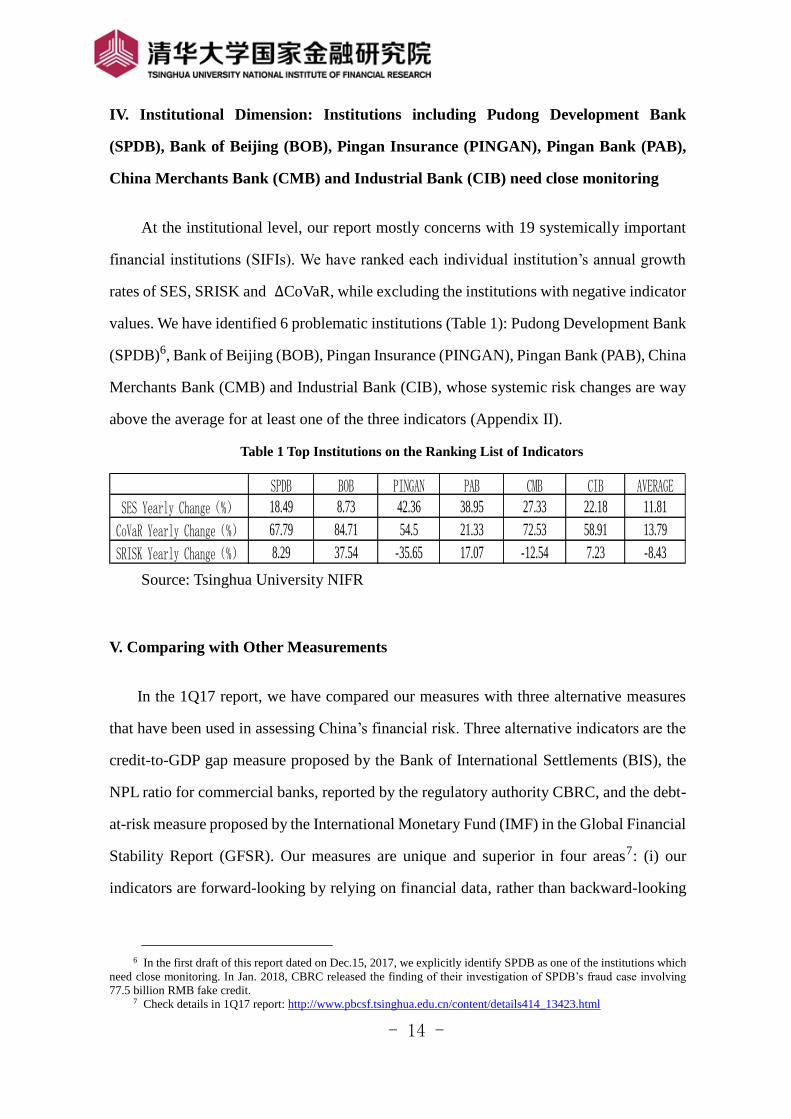
At the institutional level, our report mostly concerns with 19 systemically important
financial institutions (SIFIs). We have ranked each individual institution’s annual growth
rates of SES, SRISK and ∆CoVaR, while excluding the institutions with negative indicator
values. We have identified 6 problematic institutions (Table 1): Pudong Development Bank
(SPDB)6, Bank of Beijing (BOB), Pingan Insurance (PINGAN), Pingan Bank (PAB), China
Merchants Bank (CMB) and Industrial Bank (CIB), whose systemic risk changes are way
above the average for at least one of the three indicators (Appendix II).
Table 1 Top Institutions on the Ranking List of Indicators
Source: Tsinghua University NIFR
V. Comparing with Other Measurements
In the 1Q17 report, we have compared our measures with three alternative measures
that have been used in assessing China’s financial risk. Three alternative indicators are the
credit-to-GDP gap measure proposed by the Bank of International Settlements (BIS), the
NPL ratio for commercial banks, reported by the regulatory authority CBRC, and the debt-
at-risk measure proposed by the International Monetary Fund (IMF) in the Global Financial
Stability Report (GFSR). Our measures are unique and superior in four areas7: (i) our
indicators are forward-looking by relying on financial data, rather than backward-looking
6 In the first draft of this report dated on Dec.15, 2017, we explicitly identify SPDB as one of the institutions which
need close monitoring. In Jan. 2018, CBRC released the finding of their investigation of SPDB’s fraud case involving
77.5 billion RMB fake credit. 7 Check details in 1Q17 report: http://www.pbcsf.tsinghua.edu.cn/content/details414_13423.html
SPDB BOB PINGAN PAB CMB CIB AVERAGESES Yearly Change(%) 18.49 8.73 42.36 38.95 27.33 22.18 11.81
CoVaR Yearly Change(%) 67.79 84.71 54.5 21.33 72.53 58.91 13.79
SRISK Yearly Change(%) 8.29 37.54 -35.65 17.07 -12.54 7.23 -8.43

- 15 -
by relying on economic data; (ii) our measures (based on stock prices) include current
expectations of market participants; (iii) the information content of stock prices tend to be
more objective and less susceptible to reporting errors and manipulations that are common
concerns for those alternative measures; (iv) our real-time analysis on the data (stock
prices), which is available at daily frequency, can reflect the latest change in the financial
system.
Since 2Q17, we have updated the outcomes for these alternative measures. First, the
credit-to-GDP gap measure, proposed by the Bank of International Settlements (BIS), has
reached a record high at 28.8% in 3Q16, followed by successively tapering in next five
quarters to 18.9% in 2Q17. It has gone through the largest decrease and reached the lowest
level in four years (Figure 9). Although the absolute value is still above the alert threshold
(10%), since it is a lagging economic indicator, the large decline since 2Q17 is sufficient to
justify our conclusion that the systemic risk in Chinese financial market has notably
decreased.
Figure 9 Credit-to-GDP Gap
Source: Tsinghua University NIFR, BIS
Second, the NPL ratio for commercial banks, reported by the regulatory authority
CBRC has climbed to the locally high at 1.76%, and remained at 1.74% in the following

- 16 -
five quarters (until 4Q17) (Figure 10). These low values are consistent with our argument
that the overall systemic risk at commercial banks has stayed at a low level. It also
corresponds to the fact that the authorities have implemented rigorous regulations to rectify
the disorder in the banking sector, which brought the NPL growth rates under control.
Figure 10 NPL Ratios for Commercial Banks
Source: Tsinghua University NIFR
Third, the debt-at-risk measure, proposed by the International Monetary Fund (IMF),
has not been updated in the latest Global Financial Stability Report (Oct 2017). However,
referring to the data in the last report (April 2017), this indicator has decreased significantly
from 16.4% in 2015 to 12.8% in 2016, approaching its 10-year average.
Overall, the systemic risk in Chinese financial market has dropped markedly,
corroborated by declines of these alternative indicators in recent two years. However, the
absolute values for some indicators are still above the thresholds or higher than in other
emerging markets. We believe that there is no material difference between the result from
analyzing the trends of these alternative indicators and that from our preferred measures.
- 17 -
However, we have argued that these alternative indicators may lack some nice qualities,
such as forward-looking, relevance, objectivity, timeliness and data quality.
VI. Conclusion
This report assesses how the systemic risk of China’s financial systems reacts to the
new rigorous regulatory regime, and evaluates the systemic risk contributions for all types
of financial institutions. First, since 1Q17, the overall systemic risk has been stabilized at a
safe range that is far below the alert threshold. However, the CATFIN soared when the
‘regulatory storm’ started to blow. This indicates that the regulators should effectively
communicate with market participants to avoid high turbulence induced by the unexpected
policy change, while maintaining a strong and rigorous regulatory regime. Second, the
banking sector, which has the largest size in the financial industry, has the highest
contribution to the systemic risk. State-owned commercial banks have diminishing
marginal contribution, while joint-stock commercial banks have limited capacity to cover
the expected loss from systemic risk shocks and should be monitored closely. Lastly, at the
institutional level, the authorities should pay special attention to Pudong Development
Bank (SPDB), Bank of Beijing (BOB), Pingan Insurance (PINGAN), Pingan Bank (PAB),
China Merchants Bank (CMB) and Industrial Bank (CIB).

- 18 -
Appendix I: Technical note on systemic risk indicators
The systemic risk indicators used in this report include both macro- and micro-
dimensions. The macro-indicator includes catastrophic risk in the financial system
(CATFIN), and the micro-indicators include systemic expected shortfall (SES), delta
conditional value-at-risk (∆CoVaR), and systemic risk measure (SRISK).
CATFIN was proposed by Allen et al. (2012), by using extreme value theory to
measure catastrophic risk in the financial system (and the real estate sector). This measure
has been proven to be a good leading indicator (by 6-12 months) for the economic
downturns, and also a good leading indicator for banks’ credit tightening and profit shrink.
This measure has been widely used in academic research, industry, and regulatory practices.
Chen et al. (2017) shows that this measure is applicable to China’s financial system.
SES was proposed by Acharya et al. (2017), which measures expected shortfalls
(capital shortage) for individual financial institutions under a systemic distress. A higher
SES indicates a higher contribution of the individual financial institution to the systemic
risk, i.e., this financial institution has higher systemic risk. Acharya et al. (2017) shows that
SES is positively correlated to financial leverage.
VaR is a measure of tail risk for a portfolio or an individual financial institution. It
fails to take into account of the externality effect and is highly pro-cyclical. To overcome
these shortcomings, Adrian and Brunnermeier (2016) modified the VaR measure and
proposed ΔCoVaR. It measures the expected value-at-risk for the financial system if tail
risk happens to an individual financial institution, i.e., whether and how serious the failure
of one financial institution will cause losses to the whole financial system. A higher
ΔCoVaR indicates higher systemic risk of the financial institution.
SRISK is proposed by Brownlees and Engle (2016), with similar ideas as SES. Both
SRISK and SES measure expected shortfalls for individual financial institutions under a
systemic distress. For SRISK, the systemic distress is defined as the scenario that stock
market will fall 40% in six months.

- 19 -
References
[1] Acharya, V. V., Pedersen, L. H., Philippon, T., et al. (2017). Measuring systemic risk.
The Review of Financial Studies, 30(1), 2-47.
[2] Adrian, T., & Brunnermeier, M. K. (2016). CoVaR. American Economic Review, 106(7),
1705-1741.
[3] Allen, L., Bali, T. G., & Tang, Y. (2012). Does systemic risk in the financial sector
predict future economic downturns? Review of Financial Studies, 25(10), 3000-3036.
[4] Brownlees, C., & Engle, R. F. (2016). SRISK: A conditional capital shortfall measure
of systemic risk. The Review of Financial Studies, 30(1), 48-79.
[5] Chen, X., Zhou, H., & Zhu, H. (2017). Systemic risk of China’s financial system 1Q17.
Working Paper, Tsinghua University National Institute of Financial Research.

20
Appendix II: Systemic Risk Measures of Financial Institutions

21

22
Source: Tsinghua University NIFR
The current value of the indicated risk measure, plotted with the maximum and minimum month-end values over the past 12 months (Jan.2017 – Dec.2017).

23
Relative Systemic Risk Measures Over Time: SES, CoVaR, SRISK

24
Source: Tsinghua University NIFR
The relative SES (CoVaR/SRISK) measure is calculated by dividing an institution’s SES value at each point in time by the average SES value for all financial institutions
over the past seven years.

25
Systemic Risk Measures of Financial Institutions
SES
Institutions ICBC CCB BOC ABC BOCOM CMB CNCB SPDB CIB CMBC
CurrentValue(0.1bil) 717.96 583.48 459.95 440.79 195.63 184.10 125.53 132.36 129.82 124.83
Monthly Change(%) 0.64 2.41 1.11 3.69 0.39 6.25 -4.00 -1.22 0.55 1.58
Yearly Change(%) 15.21 5.34 4.57 9.57 2.05 27.33 -2.28 18.49 22.18 8.84
Value Oct.2010(0.1bil) 302.02 215.10 220.61 210.73 90.93 53.43 48.01 53.07 37.38 38.12
Institutions CEB PAB HXB BOB PINGAN CHINALIFE CPIC CITICSEC HTSEC AVERAGE
CurrentValue(0.1bil) 100.85 88.32 47.37 47.01 188.16 124.15 54.13 70.38 52.89 203.56
Monthly Change(%) 11.95 2.87 -1.38 5.84 3.18 3.87 4.37 -0.54 4.48 2.01
Yearly Change(%) 32.45 38.95 1.90 8.73 42.36 3.57 18.60 4.51 9.87 11.81
Value Oct.2010(0.1bil) 37.72 14.63 15.28 17.99 52.68 92.67 33.35 38.15 25.92 84.09
∆CoVaR Institutions ICBC CCB BOC ABC BOCOM CMB CNCB SPDB CIB CMBC
CurrentValue(0.1bil) 121.67 56.93 78.13 58.01 26.65 38.70 25.47 24.62 28.95 27.57
Monthly Change(%) 28.05 42.62 58.50 105.55 30.93 45.05 4.14 20.31 34.27 80.06
Yearly Change(%) 50.15 -42.06 9.90 -15.52 -6.66 72.53 14.46 67.79 58.91 29.40
Value Oct.2010(0.1bil) 101.20 80.86 82.82 71.89 34.85 20.10 17.95 21.30 14.55 15.40
Institutions CEB PAB HXB BOB PINGAN CHINALIFE CPIC CITICSEC HTSEC AVERAGE
CurrentValue(0.1bil) 20.31 19.41 9.89 10.25 44.73 23.94 11.08 11.19 9.69 34.06
Monthly Change(%) 42.86 27.87 9.97 90.51 7.90 37.76 23.62 11.72 47.29 37.87
Yearly Change(%) 38.70 21.33 11.17 84.71 54.50 15.01 58.64 -12.68 27.47 13.79
Value Oct.2010(0.1bil) 10.94 5.83 5.97 6.48 21.36 36.47 13.56 11.57 8.69 30.62

26
Source: Tsinghua University NIFR
(1) The benchmark is the value of Oct.2010.
(2) Current time is the end of Dec.2017.
(3) The time series of ‘AVERAGE’ is calculated as the average value of 19 financial institutions’ systemic risk measures over time.
SRISK Institutions ICBC CCB BOC ABC BOCOM CMB CNCB SPDB CIB CMBC
CurrentValue(10bil) 103.89 79.58 114.04 123.24 59.52 24.29 39.05 35.55 42.71 40.31
Monthly Change(%) -6.35 -7.75 0.44 2.36 1.67 28.72 -2.05 0.82 2.98 5.67
Yearly Change(%) -16.16 -34.75 0.76 -1.97 7.65 -12.54 -2.79 8.29 7.23 7.61
Value Oct.2010(10bil) 54.34 42.53 51.43 55.50 22.27 9.29 10.01 11.10 11.87 10.44
Institutions CEB PAB HXB BOB PINGAN CHINALIFE CPIC CITICSEC HTSEC AVERAGE
CurrentValue(10bil) 27.55 22.39 17.50 14.70 18.83 -12.94 -6.26 -4.85 -2.42 38.77
Monthly Change(%) -4.00 3.53 0.79 10.72 27.71 -26.95 -24.15 -11.64 -48.08 1.91
Yearly Change(%) -4.77 17.07 3.35 37.54 -35.65 213.50 30.33 18.37 -55.86 -8.43
Value Oct.2010(10bil) 8.47 4.39 8.34 3.29 -3.03 -14.42 -3.43 -2.43 -2.36 14.61
Related Documents