Eric Woods Research Director Noah Goldstein Research Director Executive Summary: Smart Cities Smart Technologies and Infrastructure for Energy, Water, Transportation, Buildings, and Government: Business Drivers, City and Supplier Profiles, Market Analysis, and Forecasts NOTE: This document is a free excerpt of a larger report. If you are interested in purchasing the full report, please contact Navigant Research at [email protected]. Published 2Q 2014 RESEARCH REPORT

Welcome message from author
This document is posted to help you gain knowledge. Please leave a comment to let me know what you think about it! Share it to your friends and learn new things together.
Transcript

Eric Woods
Research Director
Noah Goldstein
Research Director
Executive Summary: Smart Cities Smart Technologies and Infrastructure for Energy, Water, Transportation, Buildings, and Government: Business Drivers, City and Supplier Profiles, Market Analysis, and Forecasts
NOTE: This document is a free excerpt of a larger report. If you are interested in purchasing the full report, please contact Navigant Research at [email protected].
Published 2Q 2014
RESEARCH REPORT

Smart Cities
©2014 Navigant Consulting, Inc. Notice: No material in this publication may be reproduced, stored in a retrieval system, or transmitted by any means, in whole or in part, without the express written permission of Navigant Consulting, Inc.
1
Section 1 EXECUTIVE SUMMARY
1.1 The Evolution of the Smart City
City leaders all over the world have embraced the smart city concept with enthusiasm. They are heralding innovative projects and laying out a vision for how cities can use technology to meet sustainability goals, boost local economies, and improve services. It is this commitment to changing how cities operate that is driving the continued interest in smart cities. Moreover, the smart city concept is evolving as more cities set out their own agenda and a growing range of suppliers deliver solutions to meet their emerging needs.
Identifying possible paths toward more sustainable, resilient, and livable cities is of vital importance. Today, the world is experiencing an unprecedented transformation in the global urban landscape. The rapid urbanization of Asia and Africa presents immense opportunities and challenges. It is also generating requirements for smart grids, water monitoring systems, transportation management systems, and energy efficient buildings. This new infrastructure will be underpinned by information and communications technologies (ICT) that are deeply embedded in the fabric of old and new cities and are profoundly changing the way a city operates and how people live and work in these environments.
1.2 Defining the Smart City
Navigant Research defines a smart city as the integration of technology into a strategic approach to sustainability, citizen well-being, and economic development.
The concept of the smart city covers a wide range of communities and governance models spanning from megacity regions to small towns and from historic urban centers to greenfield developments. Similarly, an incredible diversity of customers, suppliers, technologies, and requirements fall under the smart city label. For these reasons, the smart city should be seen as a complex confluence of several existing markets, as well as the driver for new, emergent solutions that span existing industries, operations, and services.
1.3 Market Drivers
According to the United Nations (UN), the number of people living in cities will increase from 3.6 billion to 6.3 billion between 2010 and 2050, meaning that 70% of the global population will be urbanized by 2050. The growth in the urban population in just these 4 decades will be equivalent to the size of the urban population achieved throughout all prior periods of human history. Almost 3 billion additional people will require electricity, clean water and sanitation, efficient transportation, homes, and public services such as health, education, and public safety. Meanwhile, cities in the developed world are also looking to improve their economic viability and sustainability. More specifically, they are looking at how to achieve these goals in the context of growing global competition, limited financial resources, and aging infrastructure.

Smart Cities
©2014 Navigant Consulting, Inc. Notice: No material in this publication may be reproduced, stored in a retrieval system, or transmitted by any means, in whole or in part, without the express written permission of Navigant Consulting, Inc.
2
How cities can address these challenges and deliver services in an economically viable and environmentally sustainable manner is the question at the heart of the smart city movement.
1.4 The Role of Smart City Technologies
Technological innovation is a driver for the evolution of cities and also a vital support for those looking to find new ways to manage resources and deliver services. Many smart city technologies are being developed to deal with specific issues in energy distribution, energy management, transportation management, or public safety. These industry-specific innovations are underpinned by more general developments in areas such as wireless communications, sensor networks, data analytics, geospatial analysis, mobile computing, and cloud computing platforms. The smart city concept also promotes new integrated approaches to city operations, leading to further innovation in cross-functional technologies and solutions. In addition, smartphones and open data platforms are extending the opportunity for citizens and others to participate in the management of their cities.
1.5 Emerging Themes
The focus for smart city programs is evolving as cities become more familiar with the relevant technologies and the growing range of solutions available. Moreover, society is developing a better understanding of the challenges facing the world’s cities. There are many innovations happening among the hundreds of smart city programs around the world, but a number of issues are emerging as key to the further development of smart city movement:
» A focus on citizens: City leaders need to find ways of connecting smart city ideals with the day-to-day concerns of citizens, including developing new forms of engagement (e.g., via social media), using analytics to better understand actual needs, and demonstrating improvements in critical areas such as public safety, health, mobility, and economic security.
» Resilience as an attribute of the smart city: Resilience can be characterized as the ability of cities and communities to bounce back from catastrophic events and other threats to the stability and well-being of the city. New approaches to resilience can strengthen smart city programs and provide additional insights into issues such as security and social inclusion, for example.
» The potential of big data: The ability to harness real-time, highly granular data across a wide range of city operations and services is changing the way the urban environment is managed and experienced. For this reason, the benefits offered by big data are a key element of many smart city strategies.
» The development of smart city standards: Several initiatives are already in progress that are looking at how standards can help accelerate the adoption of smart city solutions, reduce the risks to cities and suppliers, and make it easier for successful projects to adapt to new contexts.
Smart Cities
©2014 Navigant Consulting, Inc. Notice: No material in this publication may be reproduced, stored in a retrieval system, or transmitted by any means, in whole or in part, without the express written permission of Navigant Consulting, Inc.
3
1.6 Market Opportunity
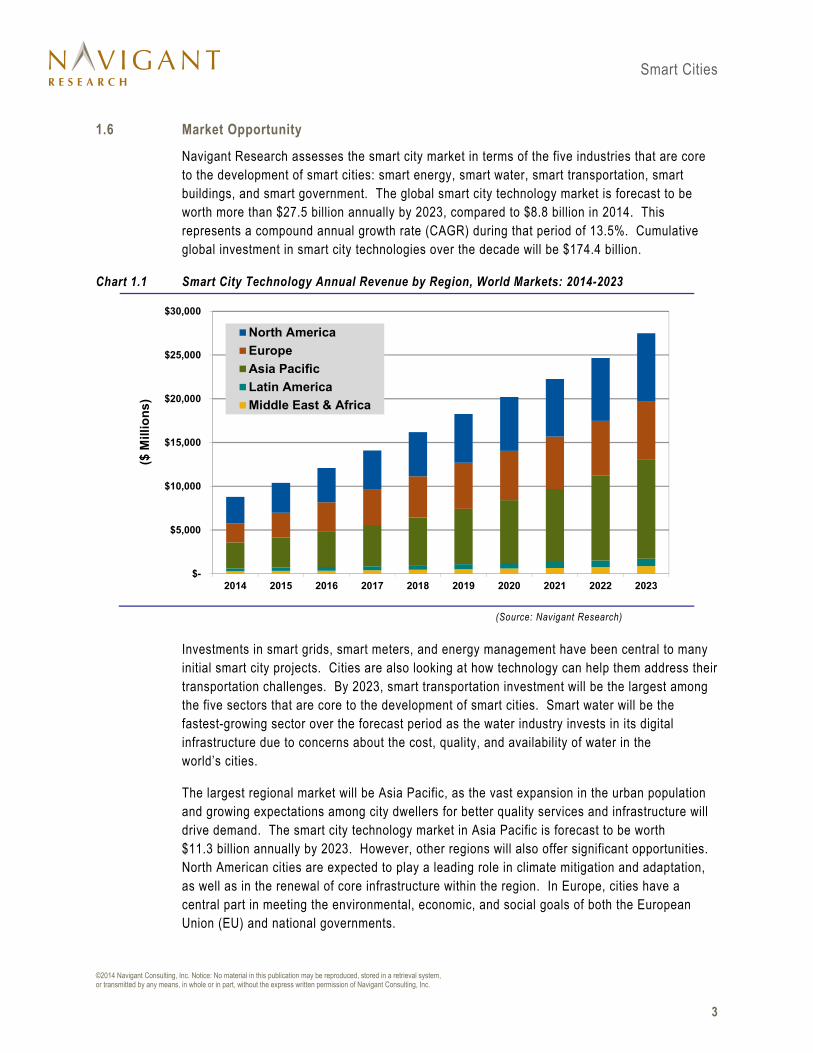
Navigant Research assesses the smart city market in terms of the five industries that are core to the development of smart cities: smart energy, smart water, smart transportation, smart buildings, and smart government. The global smart city technology market is forecast to be worth more than $27.5 billion annually by 2023, compared to $8.8 billion in 2014. This represents a compound annual growth rate (CAGR) during that period of 13.5%. Cumulative global investment in smart city technologies over the decade will be $174.4 billion.
Chart 1.1 Smart City Technology Annual Revenue by Region, World Markets: 2014-2023
(Source: Navigant Research)
Investments in smart grids, smart meters, and energy management have been central to many initial smart city projects. Cities are also looking at how technology can help them address their transportation challenges. By 2023, smart transportation investment will be the largest among the five sectors that are core to the development of smart cities. Smart water will be the fastest-growing sector over the forecast period as the water industry invests in its digital infrastructure due to concerns about the cost, quality, and availability of water in the world’s cities.
The largest regional market will be Asia Pacific, as the vast expansion in the urban population and growing expectations among city dwellers for better quality services and infrastructure will drive demand. The smart city technology market in Asia Pacific is forecast to be worth $11.3 billion annually by 2023. However, other regions will also offer significant opportunities. North American cities are expected to play a leading role in climate mitigation and adaptation, as well as in the renewal of core infrastructure within the region. In Europe, cities have a central part in meeting the environmental, economic, and social goals of both the European Union (EU) and national governments.
$-
$5,000
$10,000
$15,000
$20,000
$25,000
$30,000
2014 2015 2016 2017 2018 2019 2020 2021 2022 2023
($ M
illio
ns)
North America
Europe
Asia Pacific
Latin America
Middle East & Africa
Smart Cities
©2014 Navigant Consulting, Inc. Notice: No material in this publication may be reproduced, stored in a retrieval system, or transmitted by any means, in whole or in part, without the express written permission of Navigant Consulting, Inc.
107
Section 9 TABLE OF CONTENTS
Section 1 ........................................................................................................................................................... 1
Executive Summary .......................................................................................................................................... 1
1.1 The Evolution of the Smart City ........................................................................................................... 1
1.2 Defining the Smart City ....................................................................................................................... 1
1.3 Market Drivers .................................................................................................................................... 1
1.4 The Role of Smart City Technologies ................................................................................................... 2
1.5 Emerging Themes ............................................................................................................................... 2
1.6 Market Opportunity ............................................................................................................................. 3
Section 2 ........................................................................................................................................................... 4
Market Issues .................................................................................................................................................... 4
2.1 The Evolution of the Smart City Market ................................................................................................ 4
2.1.1 The Smart City: A Definition .......................................................................................................... 4
2.2 Market Drivers .................................................................................................................................... 5
2.2.1 Urbanization ................................................................................................................................. 6
2.2.2 Sustainability ................................................................................................................................ 6
2.2.3 Economic Development ................................................................................................................. 7
2.2.4 Improving Services and Quality of Life ........................................................................................... 8
2.3 The Building Blocks of a Smart City ..................................................................................................... 8
2.3.1 Smart Energy and Smart Grids: Powering the Smart City ................................................................ 8
2.3.2 Smart Water: Solving a Global Issue ............................................................................................. 9
2.3.3 Smart Transportation: Rethinking Urban Mobility ........................................................................... 10
2.3.4 Smart Buildings: Linking Buildings and Cities ................................................................................ 10
2.3.5 Smart Government: Improving City Services ................................................................................. 11

Smart Cities
©2014 Navigant Consulting, Inc. Notice: No material in this publication may be reproduced, stored in a retrieval system, or transmitted by any means, in whole or in part, without the express written permission of Navigant Consulting, Inc.
108
2.4 Emerging Themes .............................................................................................................................. 12
2.4.1 Focusing on the Role of the Citizen .............................................................................................. 12
2.4.2 Resilience ................................................................................................................................... 13
2.4.3 Big Data and the Smart City ......................................................................................................... 15
2.5 Market Challenges ............................................................................................................................. 16
2.5.1 Finance ....................................................................................................................................... 16
2.5.1.1 Developing a Holistic View of the City ...................................................................................... 17
2.5.1.2 Multiple Stakeholders .............................................................................................................. 18
2.5.2 Citizen Engagement and Resistance ............................................................................................. 18
2.5.3 Privacy and Security .................................................................................................................... 19
2.6 Market Dynamics: Leaders, Challengers, and New Entrants ................................................................. 20
Section 3 .......................................................................................................................................................... 22
Technology Issues ........................................................................................................................................... 22
3.1 The Smart City Model ........................................................................................................................ 22
3.2 The Connected City ........................................................................................................................... 23
3.2.1 The SCOS and the IoT ................................................................................................................. 23
3.2.2 The Communications Infrastructure of the Connected City ............................................................. 24
3.2.3 Developing a Robust and Scalable Architecture ............................................................................ 24
3.2.4 The Evolution of Smart City Communications ................................................................................ 25
3.3 The Benefits and Challenges of Big Data ............................................................................................ 26
3.3.1 The Impact of Big Data ................................................................................................................ 26
3.3.2 The Importance of Open Data ...................................................................................................... 27
3.3.3 The Challenges of Big Data .......................................................................................................... 27
3.3.3.1 Data Integration ...................................................................................................................... 27
3.3.3.2 Balancing Top-Down and Bottom-Up Approaches ..................................................................... 28

Smart Cities
©2014 Navigant Consulting, Inc. Notice: No material in this publication may be reproduced, stored in a retrieval system, or transmitted by any means, in whole or in part, without the express written permission of Navigant Consulting, Inc.
109
3.3.3.3 Lack of Data Skills .................................................................................................................. 28
3.4 Visualizing the City ............................................................................................................................ 29
3.5 Smart City Standards ......................................................................................................................... 30
3.5.1 The Push for Standards ............................................................................................................... 30
3.5.2 City Protocol ............................................................................................................................... 30
3.5.3 International Organization for Standardization ............................................................................... 31
3.5.4 European Standards Organizations .............................................................................................. 31
3.5.5 United Kingdom: Smart City Framework ........................................................................................ 31
3.5.6 Smart Cities Council .................................................................................................................... 32
Section 4 .......................................................................................................................................................... 33
Regional Trends and Case Studies .................................................................................................................. 33
4.1 Introduction ....................................................................................................................................... 33
4.2 North America ................................................................................................................................... 33
4.2.1 Urbanization Trends .................................................................................................................... 33
4.2.1.1 United States .......................................................................................................................... 34
4.2.1.2 Canada ................................................................................................................................... 34
4.2.2 Setting an Agenda for Sustainability and Climate Change Action ................................................... 35
4.2.3 Smart Grids and Smart Cities ....................................................................................................... 36
4.2.4 Upgrading the Water Infrastructure ............................................................................................... 37
4.2.5 The New Mobility Agenda ............................................................................................................. 37
4.2.6 New Approaches to Building Design and Management ................................................................... 38
4.2.7 Renewing City Government .......................................................................................................... 38
4.2.8 Case Study: San Francisco, California .......................................................................................... 39
4.3 Europe .............................................................................................................................................. 39
4.3.1 Urbanization Trends .................................................................................................................... 39
Smart Cities
©2014 Navigant Consulting, Inc. Notice: No material in this publication may be reproduced, stored in a retrieval system, or transmitted by any means, in whole or in part, without the express written permission of Navigant Consulting, Inc.
110
4.3.2 Smart Cities and Europe’s Climate, Energy, and Economic Objectives ........................................... 40
4.3.3 Building on Europe’s Cleantech Investments ................................................................................. 41
4.3.4 Europe’s Digital Agenda ............................................................................................................... 43
4.3.5 Smart Cities and Communities European Innovation Partnership ................................................... 43
4.3.6 Other European-Wide Initiatives ................................................................................................... 43
4.3.7 National Smart City Trends .......................................................................................................... 44
4.3.7.1 France .................................................................................................................................... 44
4.3.7.2 Germany ................................................................................................................................. 45
4.3.7.3 Spain ...................................................................................................................................... 45
4.3.7.4 United Kingdom ...................................................................................................................... 46
4.3.7.5 Other European Countries ....................................................................................................... 47
4.3.8 Case Study: Amsterdam, the Netherlands ..................................................................................... 47
4.3.9 Case Study: Barcelona, Spain ...................................................................................................... 48
4.3.10 Case Study: Glasgow, United Kingdom ......................................................................................... 49
4.4 Asia Pacific ....................................................................................................................................... 50
4.4.1 Urbanization Trends .................................................................................................................... 50
4.4.2 China .......................................................................................................................................... 52
4.4.3 Taiwan ........................................................................................................................................ 53
4.4.4 India ........................................................................................................................................... 53
4.4.5 Japan .......................................................................................................................................... 55
4.4.6 Singapore ................................................................................................................................... 55
4.4.7 South Korea ................................................................................................................................ 56
4.4.8 Case Study: Ningbo, China .......................................................................................................... 57
4.4.9 Case Study: Yokohama, Japan ..................................................................................................... 58
4.4.10 Case Study: Christchurch, New Zealand ....................................................................................... 58
Smart Cities
©2014 Navigant Consulting, Inc. Notice: No material in this publication may be reproduced, stored in a retrieval system, or transmitted by any means, in whole or in part, without the express written permission of Navigant Consulting, Inc.
111
4.4.11 Case Study: Songdo, South Korea ................................................................................................ 59
4.5 Latin America .................................................................................................................................... 60
4.5.1 Urbanization Trends .................................................................................................................... 60
4.5.2 Smart City Drivers and Case Studies ............................................................................................ 60
4.5.3 Case Study: Rio de Janeiro, Brazil ............................................................................................... 61
4.6 Middle East ....................................................................................................................................... 62
4.6.1 Urbanization Trends .................................................................................................................... 62
4.6.2 Smart City Drivers and Case Studies ............................................................................................ 63
4.7 Africa ................................................................................................................................................ 63
4.7.1 Urbanization Trends .................................................................................................................... 63
4.7.2 Smart City Drivers and Case Studies ............................................................................................ 64
Section 5 .......................................................................................................................................................... 66
Key Industry Players ........................................................................................................................................ 66
5.1 Introduction ....................................................................................................................................... 66
5.2 Global Smart City Providers ............................................................................................................... 66
5.2.1 Accenture .................................................................................................................................... 66
5.2.2 Cisco Systems ............................................................................................................................. 67
5.2.3 Hitachi ........................................................................................................................................ 68
5.2.4 IBM ............................................................................................................................................. 69
5.2.5 Microsoft ..................................................................................................................................... 70
5.2.6 SAP ............................................................................................................................................ 71
5.2.7 Schneider Electric ....................................................................................................................... 72
5.2.8 Siemens ...................................................................................................................................... 73
5.2.9 Toshiba ....................................................................................................................................... 74
5.3 Other Players .................................................................................................................................... 75

Smart Cities
©2014 Navigant Consulting, Inc. Notice: No material in this publication may be reproduced, stored in a retrieval system, or transmitted by any means, in whole or in part, without the express written permission of Navigant Consulting, Inc.
112
5.3.1 ABB Tropos ................................................................................................................................. 75
5.3.2 AGT International ........................................................................................................................ 76
5.3.3 Atos ............................................................................................................................................ 76
5.3.4 Autodesk ..................................................................................................................................... 77
5.3.5 Capgemini ................................................................................................................................... 77
5.3.6 Cityzenith .................................................................................................................................... 78
5.3.7 Esri ............................................................................................................................................. 78
5.3.8 Firetide ....................................................................................................................................... 79
5.3.9 Honeywell International ................................................................................................................ 79
5.3.10 Huawei ........................................................................................................................................ 80
5.3.11 Itron ............................................................................................................................................ 81
5.3.12 KT Corp. ..................................................................................................................................... 81
5.3.13 Libelium ...................................................................................................................................... 82
5.3.14 Living PlanIT ............................................................................................................................... 82
5.3.15 Oracle ......................................................................................................................................... 83
5.3.16 Orange Group ............................................................................................................................. 83
5.3.17 OSIsoft ....................................................................................................................................... 84
5.3.18 Silver Spring Networks ................................................................................................................. 85
5.3.19 Urbiotica ..................................................................................................................................... 85
5.3.20 Verizon Communications .............................................................................................................. 86
5.3.21 Worldsensing .............................................................................................................................. 87
Section 6 .......................................................................................................................................................... 88
Market Forecasts.............................................................................................................................................. 88
6.1 Forecast Methodology ........................................................................................................................ 88
6.2 Smart City Market Growth .................................................................................................................. 89
Smart Cities
©2014 Navigant Consulting, Inc. Notice: No material in this publication may be reproduced, stored in a retrieval system, or transmitted by any means, in whole or in part, without the express written permission of Navigant Consulting, Inc.
113
6.3 Industry Forecasts ............................................................................................................................. 91
6.3.1 Smart Energy .............................................................................................................................. 91
6.3.2 Smart Water ................................................................................................................................ 92
6.3.3 Smart Transportation ................................................................................................................... 92
6.3.4 Smart Buildings ........................................................................................................................... 93
6.3.5 Smart Government ....................................................................................................................... 93
6.4 Regional Forecasts ............................................................................................................................ 94
6.4.1 North America ............................................................................................................................. 94
6.4.2 Europe ........................................................................................................................................ 94
6.4.3 Asia Pacific ................................................................................................................................. 95
6.4.4 Latin America .............................................................................................................................. 96
6.4.5 Middle East & Africa .................................................................................................................... 98
6.5 Conclusions and Recommendations ................................................................................................... 98
Section 7 ........................................................................................................................................................ 100
Company Directory ........................................................................................................................................ 100
Section 8 ........................................................................................................................................................ 103
Acronym and Abbreviation List ..................................................................................................................... 103
Section 9 ........................................................................................................................................................ 107
Table of Contents ........................................................................................................................................... 107
Section 10 ...................................................................................................................................................... 114
Table of Charts and Figures ........................................................................................................................... 114
Section 11 ...................................................................................................................................................... 116
Scope of Study ............................................................................................................................................... 116
Sources and Methodology ............................................................................................................................. 116
Notes .............................................................................................................................................................. 117
Smart Cities
©2014 Navigant Consulting, Inc. Notice: No material in this publication may be reproduced, stored in a retrieval system, or transmitted by any means, in whole or in part, without the express written permission of Navigant Consulting, Inc.
114
Section 10 TABLE OF CHARTS AND FIGURES
Chart 1.1 Smart City Technology Annual Revenue by Region, World Markets: 2014-2023 ............................... 3
Chart 2.1 Fastest-Growing Megacities by Annual Growth Rate, World Markets: 2010-2025 ............................. 6
Chart 2.2 Distribution of Government Expenditures by Level of Government, Select OECD Countries: 2009 ... 18
Chart 6.1 Smart City Technology Annual Revenue by Region, World Markets: 2014-2023 .............................. 89
Chart 6.2 Smart City Technology Cumulative Revenue by Region, World Markets: 2014-2023 ........................ 90
Chart 6.3 Smart City Technology Annual Revenue by Industry, World Markets: 2014-2023 ............................. 91
Chart 6.4 Smart City Technology Annual Revenue by Industry, North America: 2014-2023 ............................. 94
Chart 6.5 Smart City Technology Annual Revenue by Industry, Europe: 2014-2023 ....................................... 95
Chart 6.6 Smart City Technology Annual Revenue by Industry, Asia Pacific: 2014-2023 ................................. 96
Chart 6.7 Smart City Technology Annual Revenue by Industry, Latin America: 2014-2023 .............................. 97
Chart 6.8 Smart City Technology Annual Revenue by Industry, Middle East & Africa: 2014-2023 .................... 98
Figure 3.1 Navigant Research Smart City Model ............................................................................................ 22
Figure 4.1 Number of Cities Greater Than 50,000 Inhabitants by Country, European Union ............................. 40
Table 3.1 Smart City Applications and Technologies ..................................................................................... 23
Table 4.1 Largest Cities* by Population and Growth Rate, United States: 2010 and 2025 ............................... 34
Table 4.2 Example City Sustainability Programs, United States ..................................................................... 35
Table 4.3 Example Smart Grid Smart City Projects, Europe .......................................................................... 42
Table 4.4 Largest Cities by Population and Growth Rate, Asia Pacific: 2010 and 2025 ................................... 51
Table 4.5 Largest Cities by Population and Growth Rate, Latin America: 2010 and 2025 ................................ 60
Table 4.6 Largest Cities by Population and Growth Rate, Middle East: 2010 and 2025 ................................... 62
Table 4.7 Largest Cities by Population and Growth Rate, Africa: 2010 and 2025 ............................................ 64

Smart Cities
©2014 Navigant Consulting, Inc. Notice: No material in this publication may be reproduced, stored in a retrieval system, or transmitted by any means, in whole or in part, without the express written permission of Navigant Consulting, Inc.
115
Table 5.1 Accenture SWOT Analysis ............................................................................................................ 67
Table 5.2 Cisco SWOT Analysis .................................................................................................................. 68
Table 5.3 Hitachi SWOT Analysis ................................................................................................................ 69
Table 5.4 IBM SWOT Analysis ..................................................................................................................... 70
Table 5.5 Microsoft SWOT Analysis ............................................................................................................. 71
Table 5.6 SAP SWOT Analysis .................................................................................................................... 72
Table 5.7 Schneider Electric SWOT Analysis ............................................................................................... 73
Table 5.8 Siemens SWOT Analysis .............................................................................................................. 74
Table 5.9 Toshiba SWOT Analysis ............................................................................................................... 75
Smart Cities
©2014 Navigant Consulting, Inc. Notice: No material in this publication may be reproduced, stored in a retrieval system, or transmitted by any means, in whole or in part, without the express written permission of Navigant Consulting, Inc.
116
Section 11 SCOPE OF STUDY
Navigant Research has prepared this report to present an analysis of the global smart city market. The report provides an examination of smart city projects around the world and related investments in smart energy, smart water, smart transportation, smart buildings, and smart government. It includes a study of regional trends, national programs, and individual city projects. Regional forecasts of the global smart city market for 2014-2023 are also included.
The report’s purpose is not to provide an exhaustive technical assessment of smart city technologies. Rather, it aims to offer a strategic examination of the market with a focus on key economic, business, and social drivers, technology issues, regulatory factors, and the competitive landscape.
SOURCES AND METHODOLOGY
Navigant Research’s industry analysts utilize a variety of research sources in preparing Research Reports. The key component of Navigant Research’s analysis is primary research gained from phone and in-person interviews with industry leaders including executives, engineers, and marketing professionals. Analysts are diligent in ensuring that they speak with representatives from every part of the value chain, including but not limited to technology companies, utilities and other service providers, industry associations, government agencies, and the investment community.
Additional analysis includes secondary research conducted by Navigant Research’s analysts and its staff of research assistants. Where applicable, all secondary research sources are appropriately cited within this report.
These primary and secondary research sources, combined with the analyst’s industry expertise, are synthesized into the qualitative and quantitative analysis presented in Navigant Research’s reports. Great care is taken in making sure that all analysis is well-supported by facts, but where the facts are unknown and assumptions must be made, analysts document their assumptions and are prepared to explain their methodology, both within the body of a report and in direct conversations with clients.
Navigant Research is a market research group whose goal is to present an objective, unbiased view of market opportunities within its coverage areas. Navigant Research is not beholden to any special interests and is thus able to offer clear, actionable advice to help clients succeed in the industry, unfettered by technology hype, political agendas, or emotional factors that are inherent in cleantech markets.
Smart Cities
©2014 Navigant Consulting, Inc. Notice: No material in this publication may be reproduced, stored in a retrieval system, or transmitted by any means, in whole or in part, without the express written permission of Navigant Consulting, Inc.
117
NOTES
CAGR refers to compound average annual growth rate, using the formula:
CAGR = (End Year Value ÷ Start Year Value)(1/steps) – 1.
CAGRs presented in the tables are for the entire timeframe in the title. Where data for fewer years are given, the CAGR is for the range presented. Where relevant, CAGRs for shorter timeframes may be given as well.
Figures are based on the best estimates available at the time of calculation. Annual revenues, shipments, and sales are based on end-of-year figures unless otherwise noted. All values are expressed in year 2014 U.S. dollars unless otherwise noted. Percentages may not add up to 100 due to rounding.
Smart Cities
©2014 Navigant Consulting, Inc. Notice: No material in this publication may be reproduced, stored in a retrieval system, or transmitted by any means, in whole or in part, without the express written permission of Navigant Consulting, Inc.
118
Published 2Q 2014
©2014 Navigant Consulting, Inc. 1320 Pearl Street, Suite 300 Boulder, CO 80302 USA Tel: +1.303.997.7609 http://www.navigantresearch.com
Navigant Research has provided the information in this publication for informational purposes only. The information has been obtained from sources believed to be reliable; however, Navigant Research does not make any express or implied warranty or representation concerning such information. Any market forecasts or predictions contained in the publication reflect Navigant Research’s current expectations based on market data and trend analysis. Market predictions and expectations are inherently uncertain and actual results may differ materially from those contained in the publication. Navigant, and its subsidiaries and affiliates hereby disclaim liability for any loss or damage caused by errors or omissions in this publication.
Any reference to a specific commercial product, process, or service by trade name, trademark, manufacturer, or otherwise, does not constitute or imply an endorsement, recommendation, or favoring by Navigant Research.
This publication is intended for the sole and exclusive use of the original purchaser. No part of this publication may be reproduced, stored in a retrieval system, distributed or transmitted in any form or by any means, electronic or otherwise, including use in any public or private offering, without the prior written permission of Navigant Consulting, Inc., Chicago, Illinois, USA.
Note: Government data and other data obtained from public sources found in this report are not protected by copyright or intellectual property claims.
Related Documents


![[Smart Grid Market Research] Brazil: The Smart Grid Network, Zpryme Smart Grid Insights, October 2011](https://static.cupdf.com/doc/110x72/577d20871a28ab4e1e931ff6/smart-grid-market-research-brazil-the-smart-grid-network-zpryme-smart-grid.jpg)

