1 | Page Research Protocol: Fairtrade Coffee Impact October 2013 V. Nelson, J. Haggar and A. Martin

Welcome message from author
This document is posted to help you gain knowledge. Please leave a comment to let me know what you think about it! Share it to your friends and learn new things together.
Transcript

1 | P a g e
Research Protocol: Fairtrade Coffee Impact October 2013
V. Nelson, J. Haggar and A. Martin

2 | P a g e
Contents
Research Protocol: Fairtrade Coffee Impact ........................................................................................... 1
1. Introduction ................................................................................................................................ 3
2. Study design ................................................................................................................................ 3
3. Research questions ..................................................................................................................... 3
4. Overall approach ......................................................................................................................... 4
5. Fairtrade Theory of Change ........................................................................................................ 6
6. Data collection ............................................................................................................................ 8
7. Selecting cases ............................................................................................................................ 9
8. Data collection plan .................................................................................................................. 11
9. Timetable .................................................................................................................................. 14
10. Data management ................................................................................................................ 15
11. Data Analysis ......................................................................................................................... 15
Appendix 1: Research methods ........................................................................................................ 17
1. Stakeholder Workshop (to be held towards end of field research) ..................................... 17
2. Meeting with leaders & board members of certified PO ..................................................... 20
3. Meeting with leaders/ Board members of Non-certified PO ............................................... 25
4. Questionnaire with marketing manager (certified organisation) ......................................... 27
5. Questionnaire with marketing manager (non-certified organisation) ..................................... 34
6. Focus Group Discussions – CERTIFIED .................................................................................. 39
7. Focus Group Discussions – NON-CERTIFIED ......................................................................... 46
8. Participatory Gross Margin Analysis PLUS for coffee growers ............................................. 53
9. Questionnaire ....................................................................................................................... 56
10. Key informant interviews .................................................................................................. 67
3 | P a g e
1. Introduction This document is a guide for the research teams conducting the Fairtrade Coffee Impact Study. It is intended to provide a clear overall picture of the study objective and design, the research instruments to be used and the analytical framework.
2. Study design The objective of this study is ‘to provide a clear understanding and articulation of the impact of Fairtrade certification for coffee producers and their organizations, drawing on a range of cases that capture some of the important diversity within Fairtrade coffee producing contexts’. Our definition of impact is: ‘positive and negative, primary and secondary long-term effects produced by a development intervention, directly or indirectly, intended or unintended’ OECD-DAC (see glossary, 2002).
3. Research questions The primary research questions are as follows:
1. What benefits does Fairtrade certification bring to smallholder coffee cooperatives (and other forms of organization) in relation to facilitating the organization and thereon organizational growth, empowerment and stability? In particular, what benefits does being part of Fairtrade bring that go beyond the Minimum Price and Premium guarantees of the Fairtrade system?
2. What benefits does Fairtrade certification bring to smallholder cooperatives (and other forms of organization in economic terms, capturing trends in production, productivity, price negotiations, market access and place in the value-chain in terms of trade and financial stability)?
3. How have the Fairtrade approach and strategies (as articulated in the Theory of Change) led to the benefits identified? Which approaches and strategies are working well, in which contexts, and why? In particular, consider whether organization typology has an impact on the effectiveness of the Fairtrade approaches and strategies?
4. What is the impact of organic and Fairtrade certification on producer organisations? What is the role of Fairtrade in a new world of multiple certification? What particular strengths and weaknesses does Fairtrade certification bring in comparison to other certification schemes?
5. What are the development and economic goals of the Fairtrade certified organizations? What progress are they making, and what challenges do they face in trying to meet these goals?
Impact at the individual farmer / household level
6. What are the benefits that accrue to individual households from being part of a Fairtrade
certified coffee cooperative? To what extent and how is Fairtrade contributing to sustainable livelihoods and empowerment at the level of farmer members and their households?
7. To what extent is Fairtrade certification enabling households to meet their own developmental goals / aspirations?
8. What would the economic and social status of these households be if they were not part of a cooperative that was Fairtrade certified (analysis of the counterfactual)?
9. To what extent and how do Fairtrade benefits extend beyond the farmer members and their

4 | P a g e
households to the wider community (we agreed this would be data gathered from FT members and non-cert PO members only)?
Recommendations and learning Based on the research findings and analysis, the team will propose recommendations and learning for the Fairtrade system. Recommendations and learning should focus on how the Fairtrade approach and strategies can be improved to deliver greater impact.
4. Overall approach From our previous experience it is very important that each country team fully understand and are aware of the principles and approach adopted in order to answer the study questions. There are several key elements to our approach: Theory based evaluation
The main conceptual framework for the evaluation is the Fairtrade theory of change. The theory of change shows the logic of the impact chain, i.e. with inputs, leading to outputs, leading in turn to outcomes and then leading to impacts. This is what is intended by Fairtrade to happen. What we are evaluating is whether this chain has occurred in practice – or if a) other factors have caused observed outcomes and impacts, b) if there are unexpected outcomes and impacts. Using different methods we will gather data from different sources and data of different kinds that will then be analysed altogether to establish the evidence for impact. Throughout the study we need to build up the evidence by tracing the process carefully and systematically along the impact chain – looking at how inputs lead to outputs, and outputs lead to outcomes and how outcomes lead to impacts. For example, if there was an input, such as training by FLO liaison officers, we should ask whether that training input led to the expected outputs (e.g. numbers of producers trained to prune coffee trees), and in turn the expected outcomes (improved yields) and impacts (improved incomes and more secure livelihoods). If we find that the outcomes and impacts were achieved as expected, and key informants and stakeholders confirm that the causes of the outcomes and impacts were Fairtrade inputs (not contextual or other development project interventions), then we can say that we have a robust case study. This is particularly strong where we also compare between certified and non-certified producers – because the comparison group helps to explain what happens when Fairtrade is not involved (for example, if there is training provided by the producer organisation, development agency or the buyer which leads to similar outcomes and impacts this would suggest these relate to the provision of training and are not necessarily attributable to Fairtrade). Comparative, case oriented design We are not just conducting one single case study. Instead we are conducting a series of country case studies and replicating against certain sets of criteria from which we can draw findings - asking the same standardized questions across each one, using the same research tools to gather the data - although adapted where necessary to local conditions, and using the same analytical techniques. Our approach thus draws on various new social science methods which seek to increase rigour in case study research (e.g. Qualitative Comparative Analysis (QCA), process tracing and elimination of rival theories, contribution analysis etc). In this way we can establish whether the theory of change does lead to expected outcomes and impacts across a number of conditions. This means we can generalize beyond the individual case, although we cannot generalize to the entire Fairtrade system or universe). We will develop a typology and selection criteria so that we are purposively selecting the cases we want to look at. In this approach, each case study is a building block to add evidence to the final conclusions, which are drawn out from across the cases. To do this requires each team to follow the research protocol carefully. If this is not done, we cannot accumulate knowledge and

5 | P a g e
build an evidence base – we are left with different studies that may be interesting, but that do not answer the evaluation questions and this means less utility for Fairtrade and ultimately Fairtrade producers. Case study research design enables researchers to understand how and why changes have occurred and to respond to complexities in real world situations. Mixed design Many people currently talk about mixed methods evaluation (meaning you might use participatory, qualitative and quantitative methods, case studies and quasi-experimental surveys). We are doing this – the survey will provide us with a broader set of data on individual farmers, but we are also using other methods such as focus groups, key informant interviews and mining of audit data to explain how and why Fairtrade has an impact. However, what is most critical to understand in evaluation is the approach to causality that you are using. Many evaluators/donors in recent times prioritize what is called the counterfactual logic – i.e. comparing the ‘with’ project group, with the ‘without’ project group. We are going to do surveys (questionnaire based, and focus group discussions) with individual farmers – both Fairtrade certified and non-certified - to make this important comparison (resources and feasibility allowing). This is important to actively reduce researcher bias, (which is also part of the rationale for a wider stakeholder meeting), but also to provide the comparison of ‘with’ and ‘without’ situations. However, we will also be using the generative approach to causality (explained above under ‘theory of change’, where you establish a rigorous set of evidence by following along the chain with great care and being very systematic at each stage of the chain, and also exploring possible other causes of change (‘rival explanations’). Advanced Statistical Techniques Since this study is being conducted at a single point of time it cannot compare in real time the outcomes for similar groups of farmers, with and without Fairtrade certification. The possibility that farmers in the Fairtrade organisations are significantly different from those who are not, may bias the findings, since it is difficult to separate the effects on outcomes of pre-existing circumstances (e.g. larger asset base, wealth, higher educational status etc.) from the effects of Fairtrade. We would like to be able to conduct Propensity Score Matching which controls for these differences – but the number of questionnaires – 75 per organisation, with more certified than non-certified groups will not be sufficient to support PSM. This approach is important, particularly in a one off study, to remove selection bias. Gender and social difference: We want to ensure that we have a gender/social difference sensitive design (e.g. we integrate questions on gender issues, we collect gender disaggregated data etc.) and implementation (e.g. in conducting the research we consider when meetings can be held so that women can attend, we ensure women are given a chance to speak up, we interview women and men in separate groups in focus group discussions etc.). There may be particular vulnerable or excluded groups (e.g. caretaker farmers, share croppers, migrants, child labourers, on-farm hired labour, widows etc.) that may not be able to benefit from Fairtrade, or could even be disadvantaged by it. However, the project funds do not cover separate interviews with these groups (e.g. hired labourers). If any individual interviews or focus group discussions can be conducted with identified marginal groups this is desirable. These design features help to maximise rigour in an essentially complex situation. In Fairtrade there are quite a lot of complicating factors. This is not a simple medical trial testing a single drug treatment. We are evaluating a system which has many inputs (e.g. training, producer networks, growing markets, standards which require changes in practices of the producer organisation and

6 | P a g e
buyers, premium funds and Fairtrade Minimum Price etc) and these lead to various impact pathways along the theory of change. It is thus extremely important that we all follow the same questions, framework, research tools and make the correct comparisons and analyses to enable us to answer the study questions. Utility To deliver a rigorous design is not everything however. It is also important that we seek ways to maximize utility to key actors. For example, while also answering the evaluation questions with the rigour required by the client, we also need to find ways to engage different stakeholders:
For Fairtrade International the study needs to demonstrate impact to the wider world (e.g. academics, donors, consumers, buyers, producers);
Engage wider Fairtrade stakeholders at national level and in the value chain, so they can participate in the analysis and understand what the study is trying to achieve and learn more about Fairtrade impact assessment. This process could build awareness of Fairtrade and build momentum to act in an appreciative inquiry approach. By building up a set of relevant stakeholders there is the opportunity to create a learning alliance for future actions;
Support producer organisations to share their goals and aspirations and share with them the study goals and findings so they can input and learn;
Encourage the POs to share the findings with individual members;
Seek to avoid over-burdening farmers with overly long or inconveniently timed exercises. Where possible we will conduct more participatory techniques (e.g. participatory gross margin analysis) that farmers themselves can find useful and understand.
See appendix 1 for draft outline of study report.
5. Fairtrade Theory of Change Figure 1 shows the Fairtrade Theory of Change. For more information please see the draft Fairtrade Theory of Change Document B).

7 | P a g e
There are two types of interventions in Fairtrade - the standards which establish the ‘rules’ for fair trading practices and engagement in Fairtrade. They include key tools such as economic protection policies, the Fairtrade Premium, and the FAIRTRADE MARK. Secondly, there are the strategies and policies which enable engagement in Fairtrade by small producers, workers, employers, supply chain businesses, consumers and civil society organisations, and leverage this engagement to bring about wider changes in support of greater justice and sustainability in trade. Strategies include building Fairtrade markets, providing support to small producers, and developing networks and alliances. Good governance policies in the Fairtrade system, a commitment to growth with integrity, and a commitment to Monitoring, Evaluation and Learning are also part of this standard system.

8 | P a g e
See also excel spreadsheet, which illustrates FLO indicators associated with the Theory of Change.
6. Data collection Fairtrade has developed a set of indicators for outputs, outcomes and impacts. Please see the Fairtrade Theory of Change document for details. This is useful for guiding our data collection – although we have to prioritize to some extent.
Research questions: Organisational level Impact Design 1. Evaluate what organisational benefits FT
certification brings to smallholder coffee cooperatives
Discuss changes and different causes of change in PO workshop/management interview. Value chain interviews – possible quantifications (production, productivity, price, market access, financial stability etc.)
2. Evaluate what economic benefits FT certification brings to smallholder coffee cooperatives
3. Analyse how FT’s approach and strategies have led to identified benefits, which are working well, in which contexts and why. What difference does the type of organization have on Fairtrade impact?
External & internal stakeholder workshop to explore causal factors, support learning and promote future change. Methods to be used include force field analysis and checklists
4. Explore the relative contribution of Fairtrade and Organic certification where chosen POs are
Flowing from Theory of Change – analysis of contribution (and interactions between factors) –

9 | P a g e
dual certified in Latin America data gathered in PO manager interviews and FGDs
5. Understand the development and economic goals of the FT organisations, progress they are seeking and challenges they face in achieving these goals.
PO leader/management workshop. Force field analysis.
Individual and household level 6. Drawing on the above, evaluate the benefits
accruing to individual households in FT certified organisations. To what extent and how is FT contributing to sustainable livelihoods and empowerment for individual members and their households? How are the impacts differentiated by gender?
FGDs, (e.g. discussion in FGD of satisfaction with PO; knowledge of FT; Premium projects
- Limited COP modelling with 1 FGD (participatory GMA+) & data from management
- Questionnaire survey
7. Assess how far FT certification is enabling HHs to meet their developmental goals /aspirations.
Focus Group Discussions
8. Analyse the counterfactual (i.e. what would economic and social status of these HHs be if not part of FT certified cooperative).
PO managers interviews FGDs with non-certified farmers Questionnaire Survey
9. Explore whether FT benefits extend beyond farmer members and their HHs to the wider community and beyond
Limited key informant interviews (e.g. community leaders or members). Mainly data from FGDs with members of FT certified PO
Specifically, the study will analyse impact at the individual producer level (certified and non-
certified) through a combination of the following methods:
The indicators for use in the research will be agreed by the project team, and will draw on the work done for the Fairtrade Theory of Change, which has proposed a draft set of indicators for Fairtrade monitoring and impact evaluation. See excel spreadsheet.
7. Selecting cases There is a widespread of Fairtrade-certified producer organizations across the world. In order to select cases based on a clear typology of the universe of Fairtrade coffee, we first need to establish the countries in which Fairtrade coffee is produced, in order to select the 4 countries of the study and to cover all of the three main geographic regions. The number of certified organizations varies greatly within each region – 268 in Latin America, 32 in Africa and 29 in Asia – Oceania). Although the overall distribution of Fairtrade coffee producing organizations is heavily weighted towards Latin America, this research recognizes that African and Asian coffee co-operatives have not been sufficiently covered in previous research in Fairtrade coffee, and aims to help redress that balance. A matrix has been developed with the following criteria:
- the number of certified Arabica ONLY producer organizations which have been certified prior to 2010 onwards) drawing on excel files shared by FLO
- FT certified production (drawing on excel files shared by FLO
- % of the FT market (drawing on excel files shared by FLO)
- FT coffee exports for the top 10 countries (FLO Monitoring report, 2012).
- % sold on FT terms (FLO Monitoring Report, 2012).

10 | P a g e
FLO said we should only include POs that only produce Arabica coffee so we have excluded POs that produce both Arabica and Robusta from the selection. We have excluded any POs certified from 2010 onwards, because this means that there is a sufficient period within which they can have experienced benefits and costs of participation in Fairtrade certification. For country selection we also include the following criteria:
- Having a regional spread (i.e. selecting at least one country from South America, North &
Central America, Africa and Asia)
- Security concerns
- Known research contacts
Based on initial analysis, the following shortlist has been developed and agreed with FLO.
Table 3: Shortlist of countries for inclusion in study
1st choice and secondary alternatives
Reasons for choice
Asia - Indonesia - Scores highest on all criteria (production; no. of POs; sales on FT terms etc.).
South America
- 1. Peru; - 2. Colombia
- Peru has most FT POs, but Colombia produces more and has higher share of FT market. Peru sells more coffee on FT terms though, but Colombia is second in South America.
Central America
- 1. Mexico; - 2. Guatemala
- Honduras is too insecure. Guatemala & Costa Rica produce more, but Mexico has more POs. and sells most on FT terms. Good research contacts and fewer other studies in Guatemala. First choice is Mexico, then Guatemala
Africa - 1. Tanzania; - 2. Kenya
- Rwanda has most POS, but Kenya is 2nd. Kenya produces more & has highest share of global FT market than other countries, Tanzania is second, but Tanzania sells more on FT terms. So first choice Tanzania, followed by Kenya.
Having chosen the countries for study – Indonesia, Mexico, Peru, Tanzania - we have then selected producer organisations. Drawing on previous experience we have gathered country information on Fairtrade coffee from FLO Liaison officers. This represents a new step for FLO commissioned impact studies and it is critically important for an external perception of independence. The team has sought to gather contextual information before selecting cases for the certified groups and the comparison non-certified groups. However, without funding for dedicated visits to gather this information, it is necessary to rely on FLO Producer Support Services staff and team contacts. Questions of location within country also need to be taken into account for logistical and budgetary reasons, but also to be able to match certified and non-certified POs and farmers in terms of their agro-ecological contexts. It is also necessary to gather basic information on PO size (membership) and exporting arrangements (e.g. direct or indirect), so that we can select them from a typology.

11 | P a g e
Finding out about where other non-Fairtrade certified organisations exist in a sub-region or district can be tricky, and we have also found that there is rarely information held centrally by one organisation about what certifications an organisation holds (as well as size and export modalities) and so this requires contacting organisations individually which takes time and resources. In some countries where certification is more advanced there are fewer organisations which are not yet holding some kind of sustainability certification. This is the case in Peru. Those that do not already hold certifications are unusual – for example they are very new. In Tanzania only one organisation was suggested in the focal zone selected that does not hold other certifications – but it used to be Fairtrade certified, still follows Fairtrade principles, and the Japanese buyer pays the premium but does not use the label. Thus, it is not a proper counterfactual. The two certified producer organisations selected should be Fairtrade or Fairtrade+organic. These could be either two Fairtrade POs, or one Fairtrade and one Fairtrade +organic PO, or where no single Fairtrade certified POs exist, two Fairtrade+organic POs. The latter point is important since it is may be difficult, particularly in Latin America to find a Fairtrade certified PO that is not also organic certified unless it is very recently created, which would make it different from those with certification. Since some Fairtrade+organic POs have both organic and non-organic members – it is important that the sample of farmers is either all Fairtrade, or all Fairtrade+organic, not mixed. (For this study it is not feasible to include organisations with other certifications except for organic). For the counterfactual, non-certified comparison, the first choice a) is a non-certified producer organisation in the same zone which has similar features as the certified PO (e.g. size, export model). If this cannot be found, then the comparison group should be b) a sample of non-organized farmers – i.e. they sell individually to other buyers.
Certified POs Counterfactual
Fairtrade Either a non-certified PO or Non certified individual coffee farmers. Fairtrade +organic (Fairtrade +organic
members or Fairtrade only members)
In each case we need to decide what provides the best comparison – and to document this for the final report. We will choose a) unless there are other confounding factors. Then b) we will include non-organized farmers that live in neighbouring villages (but also try to interview the traders they sell to).
8. Data collection plan The different research instruments have been designed to enable data to be gathered to answer the study questions.
See appendix 2 for the research methods (explanation of methods, checklists, questionnaires etc).

12 | P a g e
Figure 1: Research methods
Questionnaire
Data from certified & non-certified PO members on coffee income, other sources of income, coffee plants & equipment, amounts sold and prices
obtained from PO and other buyers, satisfaction with access to inputs and services
Key Informant Interviews
Interviews with local government, coffee associations etc and trader interviews (e.g. 1 level
up from the PO)
Participatory Gross Margin Analysis Plus
Helps farmers to model the inputs, costs, yields, outputs and sales of coffee
production and additional returns in one particular field . The data is entered int& used in sensitivity analysis. The team can build up cost of production models which
they can then use with the questionnaire & farmers can better understand the margins
of coffee production
Focus Group Discussions
Data on livelihoods, wealth/poverty, coffee farming, asset building ,
farmers own goals, Views on POs and other buyers
PO leaders/board meeting & marketing manager interview
PO goals; prices, sales, membership, Premium investment (for FT POs), democracy, management systems, gender, hired labour, child labour
issues and responses
External stakeholder workshop
to explore forces shaping change in coffee for certified & non-certified POs. if held at the end provides an opportunity to feedback, but FLO is responsible for feedback (as agreed
in negotiations)
Audit reports
Data on Fairtrade Premium, on the Producer Organisation (PO) - prices
obtained, sales, etc

13 | P a g e
Figure 2: Data gathering and methods
External stakeholder meetings (4)
Total of 8 trader interviews in field; 10 interviews at global level PO LEVEL
FT-certified POs
(2 per country)
& 1 Non-
certified PO
8 certified POs & (Limited) 4 non-certified POs = 12 management workshops for collection of
key data
Individual
producer level
FT-certified &
non-certified
producers
Management workshops & data
collection
2 FGDs per PO to assess impact
Participatory GM (1 per PO)
75 questionnaires per PO x 3 POs in each country = 225 in each country x 4 countries = 900
6 FGDs (3 with women’s groups and 3 with men’s groups) per country (= 24 in total)
3 PGMA+ per country = 12 in total
Documents
and other Key
Informant
interviews
Secondary data analysis
Audit reports
Interviews x 3
Contextual analysis (international and country-specific)
Audit reports
10 KIIs in-country & 4 global
Across the project: 4 countries selected from across Central America; South America; Africa; Asia (12 POs in total)
Wider level
Chain wide stakeholder workshops review TOC,
discuss rival explanations;
2 interviews in-country 10 Telephone interviews of traders at global level,
Questionnaire Survey

14 | P a g e
9. Timetable The timetable for the study is as follows:
Task Timeline (add dates) Preparatory work
Develop framework, protocol and research instruments
Aug-Oct
Country & Producer Organisation selection
Literature Review & Value Chain Analysis
Contacting POs to seek agreement to participate
Audit data analysis for selected POs
Obtain comments on draft research protocol and adapt questionnaires and checklists to local context/translate
Field research x 4 countries Oct-Dec 2013
Team training Familiarize lead researchers and team on Fairtrade, and on research methods overall, including how to write up/take notes – especially for qualitative methods. Train how to use Participatory Gross Margin Analysis – an excel spreadsheet will be provided. Lead researcher and NRI country lead to hold skype call with Deepali Train enumerators in how to implement the questionnaire.
Stakeholder workshop(s) At beginning or end of field research – 1 day meeting/workshop
Conduct key informant interviews Conduct 2 to 3 relevant interviews (as appropriate, including traders if deemed relevant)
Conduct workshops with producer organisation leaders and interview marketing manager
Checklist for PO managers/leaders Use checklist for marketing manager
Agree sampling strategy with PO managers
If an umbrella producer organisation, select randomly lower level primary societies and conduct questionnaires within those societies.
Pilot questionnaire survey Pilot questionnaire for a day and make any necessary changes. The questionnaire is relatively short but we need to be sure enumerators can understand it and know how to operate the tablets.
Implement questionnaire survey 75 questionnaires at each producer organisation (i.e. 75 x 3 = 225)
Conduct participatory gross margin analysis (PGMA+)
At each PO conduct one PGMA+ session
Conduct Focus Group Discussions Using the checklist provided hold 6 FGDs (3 with women’s groups and 3 with men’s groups - 6 in total per country.
Analysis Nov-Feb
FGD tabulation of data Refer to guide on how to write up qualitative data in tables
Analysis of qualitative & quantitative data
Analytical techniques include process tracing along the theory of change and comparing between certified and non-certified producers
Development of some simple infographics
NRI colleague will be requested to develop some infographics for final report
Country level and cross-country analysis (not producing 4 country studies, but a synthesis report)
March-April
Writing final report March-April

15 | P a g e
FLO to share with POs & comments on draft report
By Mid-May
Revisions to final report and submission
By end May
Sharing of data & photos with FLO By End May
Presentation to FLO End May
Feedback learning loop To be undertaken by FLO BUT if our external meetings were held at the end of the field research the tentative findings of the country study will have been shared
Dissemination
10. Data management A research partner in India is designing software for mobile phones which can be used by the research assistants to input data which is then uploaded directly to the Indian team, for checking for errors. They will provide a basic statistical analysis, which will then be shared with the research teams. Copies of field notes and tabulated analyses should be shared with NRI so that FLO can be given a copy.
11. Data Analysis
For data analysis we need to be clear on what comparisons we are making in our analysis. Figure 3 below shows the main comparisons to be made in the analysis. For more information on analytical strategies see the main report outline (column 2).

16 | P a g e
‘Within case ‘ analysis using the theory of change – building evidence
of whether inputs led to outputs, to outcomes and impacts in each certified PO & exploring possible
rival explanations
Comparisons of certified POs with non-certified
POs (the counterfactual)
Synthesis of impact evidence for each country (2 certified and
1 non-certified PO)
Cross-case comparative analysis between countries
Final analysis of evidence of impact on our research questions in each case (coffee-Peru; coffee-Mexico; coffee-Tanzania; coffee-Indonesia) and final conclusions on impact of Fairtrade coffee on drawing cross-comparative analysis under certain sets of conditions (i.e. ‘What can we say beyond individual cases is plausible, without universalizing?)
Figure 3: Analytical Strategies
17 | P a g e
Appendix 1: Research methods
1. Stakeholder Workshop (to be held towards end of field research)
Purpose:
1. To assess and score the factors causing change in coffee with a range of external
stakeholders (e.g. coffee value chain actors, PO leaders from different organisations, local
government, NGOs, service providers) etc.
2. To gather a broader understanding of what difference Fairtrade is making, if any, at other
Fairtrade producer organizations beyond the study sample
3. To feedback to study organisations
4. To build up momentum for further action from FLO, POs themselves, wider stakeholders,
including encouraging the development of a learning alliance where this is deemed to
provide added value in the zone/region (although this is up to local stakeholders and to
FLO).
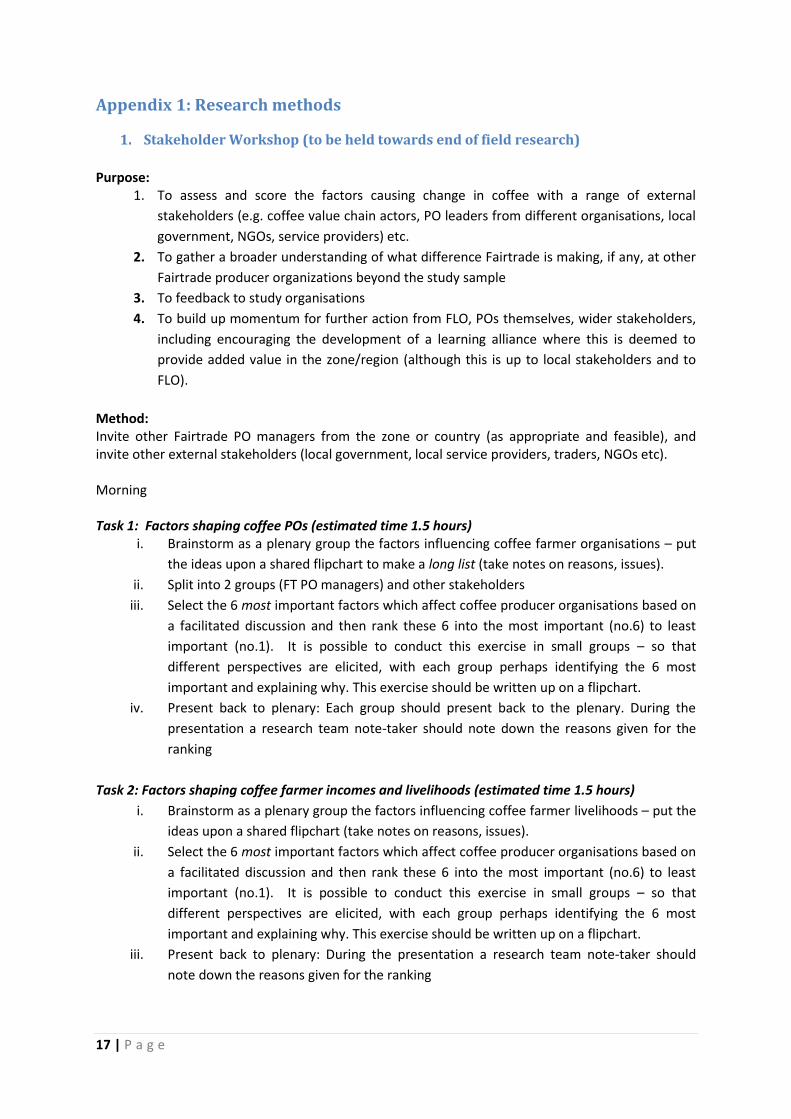
Method: Invite other Fairtrade PO managers from the zone or country (as appropriate and feasible), and invite other external stakeholders (local government, local service providers, traders, NGOs etc). Morning Task 1: Factors shaping coffee POs (estimated time 1.5 hours)
i. Brainstorm as a plenary group the factors influencing coffee farmer organisations – put
the ideas upon a shared flipchart to make a long list (take notes on reasons, issues).
ii. Split into 2 groups (FT PO managers) and other stakeholders
iii. Select the 6 most important factors which affect coffee producer organisations based on
a facilitated discussion and then rank these 6 into the most important (no.6) to least
important (no.1). It is possible to conduct this exercise in small groups – so that
different perspectives are elicited, with each group perhaps identifying the 6 most
important and explaining why. This exercise should be written up on a flipchart.
iv. Present back to plenary: Each group should present back to the plenary. During the
presentation a research team note-taker should note down the reasons given for the
ranking
Task 2: Factors shaping coffee farmer incomes and livelihoods (estimated time 1.5 hours)
i. Brainstorm as a plenary group the factors influencing coffee farmer livelihoods – put the
ideas upon a shared flipchart (take notes on reasons, issues).
ii. Select the 6 most important factors which affect coffee producer organisations based on
a facilitated discussion and then rank these 6 into the most important (no.6) to least
important (no.1). It is possible to conduct this exercise in small groups – so that
different perspectives are elicited, with each group perhaps identifying the 6 most
important and explaining why. This exercise should be written up on a flipchart.
iii. Present back to plenary: During the presentation a research team note-taker should
note down the reasons given for the ranking

18 | P a g e
Afternoon
Task 3: Discussing Fairtrade (and other standards) (2 hours)
1. What do stakeholder participants know about Fairtrade? (note who says what in
terms of stakeholder category and their views on Fairtrade; depth of knowledge;
overall perceptions – note how they describe it – is it about trading relationships,
about channelling funds, is it a charity or something which builds on their own
sales?)
2. What are the benefits and costs of Fairtrade? (use a flipchart and fill in the table
below if time allows)
3. How does Fairtrade compare to other certifications? (use a flipchart and fill in the
table below if time allows).
This discussion can be a fairly free flowing session and will depend on the level of knowledge of
participants – although it should be useful to those not knowledgeable about Fairtrade (and other
certifications).
Flipchart comparison of benefits and costs of Fairtrade (list)
Benefits of Fairtrade Costs of Fairtrade
..
..
..
..
..
..
12. .. 13. .. 14. .. 15. .. 16. .. 17. ..
Comparison of FT with other certifications (Fairtrade and other standards as locally appropriate)
Certification (fill in as is locally appropriate –what do participants know about)?
Fairtrade Organic Utz
Positives
Weaknesses
Task 4: Possible communication and action points (45 minutes)
Short discussion of possible communication and action points for stakeholders – including FLO – to
strengthen coffee producer organisations and member livelihoods. Need to take care not to raise
expectations in this exercise – we are just a research team conducting an impact study. However, it
is important that the study generates useful action strategies and this is a good way of identifying
possible options and the study itself can support momentum for action amongst those present. We
will share the findings with FLO – but uptake depends upon FLO.

19 | P a g e
What steps can coffee POs take to overcome challenges and take up opportunities?
What recommendations are there for Fairtrade International? (need to avoid a wishlist)
What steps can other coffee stakeholders take to overcome challenges and take up opportunities? (e.g. local government, traders, other service providers, NGOs etc).
Reporting & analysis Keep copies / make photos of flipcharts during the meeting so we have a record. Take detailed notes
of discussions to capture rich data (e.g. areas of consensus, disagreement, sensitive issues, reasons
and rationales) as well as the issues, rankings and recommendations.

20 | P a g e
2. Meeting with leaders & board members of certified PO
Purpose:
i. To explain (again – in person) the study and ensure PO leaders are happy with proposed
activities
ii. To ensure clear (written) agreement on level of anonymity required by the PO (We need to
have guidance on this from FLO, but please ensure that there is clarity between the research
team and the PO. There are different options – the POs are not named at all in the report but
given codes. Or they are named but anonymization occurs in terms of groups within
iii. Understand PO’s own goals and plans
iv. Gather PO leaders’ perspectives on Fairtrade
v. Gather PO leaders’ perspectives on challenges and opportunities facing their organisation
vi. Gather PO leaders’ perspectives on other factors influencing change (Force Field Analysis)
Method: Explain clearly the project, and use the checklist to guide the discussions. Write up
transcripts and analyse findings (see table xx below).
Checklist:
1. What are your organisational goals for the next 3 years? (probe whether there are written plans,
and who has been involved in setting goals and developing plans)
2. Who can be a member? (any restrictions?) (land title, area, gender, production levels)
3. How do they compare to other, non-certified coffee farmers in this region and other non-coffee
farmers in this region (better off, same, worse off)?
4. What are the main factors influencing your PO’s activities? (force field analysis)
i. On a flipchart work from 5 years ago to present day charting how the organisation
has changed (i.e. key events, trends) and then add in factors using arrows above
which have been enabling and factors which have been constraining).
ii. Identify where Fairtrade fits into this picture (if at all, and if not already there)
Box 1: How to do force field analysis (for this study)
The force field analysis is a simple, visual PRA tool, which can be used to facilitate a collective analysis of organisational development. It has been used in considering current situations and future goals and aspirations. However, we have to understand primarily how organisations have developed and what factors have enabled and constrained this. So the method presented here focuses on a retrospective analysis. However, we also suggest continuing the discussion, building on the analysis of the past, to look to the future. We will separately be asking the PO leaders and managers if they have already got a development plan, but this provides an additional opportunity to explore what their goals and aspirations are – without trying to facilitate future strategic planning which we do not have resources or time to do. The analysis as suggested below should enable us to get a picture of the role of Fairtrade – how important has it been in organisational development, and what other factors are shaping organisational development beyond Fairtrade including government policies, market forces, but also other development agencies. The first step is to fill in Box A. Box A describes the situation in the past for the organisation (e.g. let the managers come up with important indicators but probe on things like staff numbers, morale,

21 | P a g e
qualifications, roles, resources, membership, democracy, management systems, sales, number of buyers, prices, access to credit etc). Depending how comprehensive you want to be this could take up the bottom corner of a flipchart or a whole flipchart. The time frame should be decided by agreeing on a reference point that is within the experience of the participants in the discussion, prior to certification but probably not beyond 5 years (as recall will become less) The second step is Box B, which describes where you are now – what is the current situation for the organisation? (again let the managers come up with descriptions, but you can probe on similar issues as above). The third step (Box C) is to ask: ‘What factors have been enabling (supportive) in your journey from A to B? These are the positive [+ve] forces in the force field analysis). These could be to do with social, infrastructural, market, institutional or political factors, changes in government policy, or to good resources of one sort or another, or to changing global circumstances such as demography, or to external support – including, but not limited to, Fairtrade. The fourth step (Box D) is to ask: ‘What factors have inhibited your movement from A to B?’ (i.e. constraining factors or negative [-ve] factors). Again the group should be stimulated as above to think widely/laterally to get away from "lack of resources". Having got the general picture, it’s good to have time for a discussion. You may want to prioritise the importance of the +ve and -ve "forces" in the future. You may want to see what could be done to mitigate the negative forces in the future. Ideally, and time allowing, this would be a perfect time to then look to the future and taking a second flip chart you could place this on the wall and repeat the exercise. ‘Where does the organisation hope to go next, and what are the enabling and constraining factors?’ It is most likely that there will not be time to do the whole future analysis using flip charts. But a discussion would at least be possible having laid the groundwork with the analysis of how the organisation has evolved in the last 5 years, to thinking ahead to the next 5 or 10 years. Approached developed by Barry Pound and Adrienne Martin, and adapted for this study by Valerie Nelson.
Figure 4 below provides an example of what a Force Field Analysis with a coffee producer
organisation might look like. Please also see the example sent by Barry Pound.

22 | P a g e
Figure 4: An example Force Field Analysis relevant to Fairtrade coffee
Figure 4 shows the retrospective analysis. To complete a future analysis the team would bring out
more flipcharts and continue the discussion using these to chart desired progress in the future.
5. How has your organisation changed as a result of Fairtrade certification?
6. What have been the main inputs from Fairtrade (list e.g. liaison officer visits, advice, training,
linking to buyers, international exposure to end markets, support for advocacy activities to FLO
or externally, facilitating or attracting other partnerships etc.)
7. What difference, if any, has Fairtrade made to individual members?
8. What kinds of activities and inputs have Fairtrade provided to your PO?
i. Please describe the inputs of liaison officers (frequency of visits, quality of advice,
topics covered, etc)
ii. What kind of training has been supported by Fairtrade (e.g. through funding, direct or
indirect provision of technical assistance or training workshops, topics)?
iii. What were the consequences of this training for individual members? (i.e. what
difference did it make to them?)
iv. What other training does your PO provide to members? (source of funding)
v. What other kinds of engagement have you had with Fairtrade? (attending trade fairs,
being put in touch with new buyers, other)
The PO 5 years ago
(e.g. smaller in size, few
buyers, poorer quality of
coffee..)
Box A: The PO today
(e.g. much larger in size, now holds
AGMs, better quality coffee,
improved infrastructure, more
trained staff, internal control system
in place
Box C: +ve factors
(e.g. high prices for coffee, improved
government agricultural extension,
support from a Fairtrade buyer, etc)
Box D: -ve factors
(e.g. continuing lack of access to
affordable finance, rising costs of inputs,
loss of key leader affecting morale,
drought in 2011 etc)
23 | P a g e
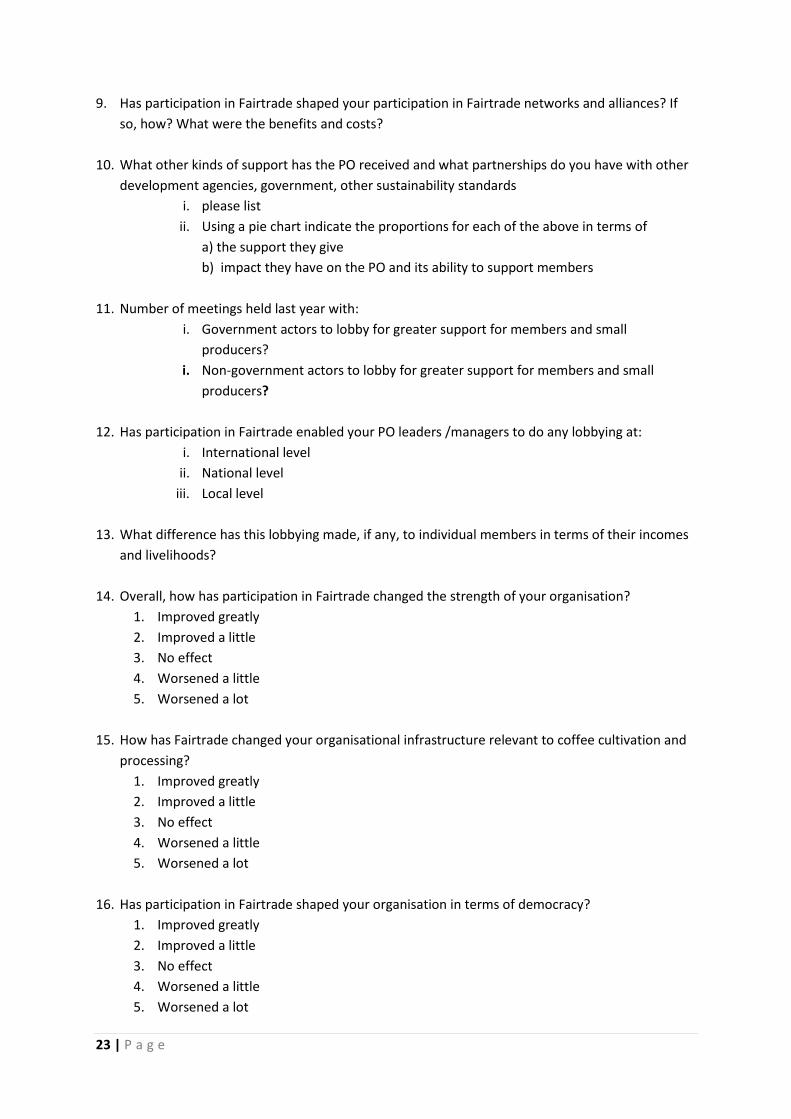
9. Has participation in Fairtrade shaped your participation in Fairtrade networks and alliances? If
so, how? What were the benefits and costs?
10. What other kinds of support has the PO received and what partnerships do you have with other
development agencies, government, other sustainability standards
i. please list
ii. Using a pie chart indicate the proportions for each of the above in terms of
a) the support they give
b) impact they have on the PO and its ability to support members
11. Number of meetings held last year with:
i. Government actors to lobby for greater support for members and small
producers?
i. Non-government actors to lobby for greater support for members and small
producers?
12. Has participation in Fairtrade enabled your PO leaders /managers to do any lobbying at:
i. International level
ii. National level
iii. Local level
13. What difference has this lobbying made, if any, to individual members in terms of their incomes
and livelihoods?
14. Overall, how has participation in Fairtrade changed the strength of your organisation?
1. Improved greatly
2. Improved a little
3. No effect
4. Worsened a little
5. Worsened a lot
15. How has Fairtrade changed your organisational infrastructure relevant to coffee cultivation and
processing?
1. Improved greatly
2. Improved a little
3. No effect
4. Worsened a little
5. Worsened a lot
16. Has participation in Fairtrade shaped your organisation in terms of democracy?
1. Improved greatly
2. Improved a little
3. No effect
4. Worsened a little
5. Worsened a lot

24 | P a g e
17. Has participation in Fairtrade shaped your organisation in terms of transparency to members?
18. Did you hold an Annual General Assembly last year during which members and representatives
approved the Work Plan and financial accounts, and approved/nominated the Board?
19. Has participation in Fairtrade provided economic support for members? If so, how?
i. medical insurance……………………yes/no
ii. crop insurance………………………..yes/no
iii. other types of insurance………….yes/no
iv. other (e.g. school materials, grants for education
etc)………………………………………………………………………………………………………………..
20. Does the Fairtrade Minimum Price make any difference to individual members? Yes/No
i) Has it made a difference during the history of the PO?
ii) Do you think it could make a difference in the future?
21. Has participation in Fairtrade led to changes in how members treat the workers that they hire on
farm? Yes/No If yes, please describe…………….
22. How many farmers have been trained in labour rights?
23. Has participation in Fairtrade led to changes in your understanding of and responses to child
labour issues?
24. How many farmers have been trained in gender issues?
25. Has participation in Fairtrade led to changes in your understanding of and responses to child
labour issues?
26. Has the organisation provided any support to disadvantaged and vulnerable groups
1. child labour elimination measures
2. youth employment projects

25 | P a g e
3. Meeting with leaders/ Board members of Non-certified PO
Purpose:
i. To explain (again – in person) the study and ensure PO leaders are happy with proposed
activities
ii. To ensure clear agreement on anonymity
iii. Understand PO’s own goals and plans
iv. Gather PO leaders’ perspectives on factors influencing their organisation and ability to
support members
v. Gather PO leaders’ perspectives on challenges and opportunities facing their organisation
vi. Gather PO leaders’ perspectives on other factors influencing change (Force Field Analysis)
Method: Explain clearly the project, and use the checklist to guide the discussions. Write up
transcripts and analyse findings .
Checklist:
i. What are your organisational goals for the next 3 years? (probe whether there are written
plans, and who has been involved in setting goals and developing plans)
a. What are the strengths and weaknesses of your PO? What challenges and
opportunities do you face? (discussion)
b. What services to you provide for members?
c. Who can be a member? (any restrictions?)
ii) How do they compare to the other coffee farmers in this region? Are they?
a) Generally much better off
b) Generally a bit better off
c) About the same
d) Generally a little worse off
e) Generally much worse off
iii) How do they compare to the other non-coffee farmers in this region? Are they?
a) Generally much better off
b) Generally a bit better off
c) About the same
d) Generally a little worse off
e) Generally much worse off
iv)(What are the main factors influencing your PO’s activities? (force field analysis)
On a flipchart work from 5 years ago to present day charting how the
organisation has changed (i.e. key events, trends) and then add in factors

26 | P a g e
using arrows above which have been enabling and factors which have been
constraining). See information above.
v) Do you have partnerships or have you had partnerships with or engage(d) with other
development agencies, government, standard systems? If yes, please describe how you work with
them and what impact this has on
vi) What other kinds of support has the PO received and what partnerships do you have with other
development agencies, government, other sustainability standards
please list
Using a pie chart indicate the proportions for each of the above in terms of
the support they give and impact they have on the PO and its ability to
support members
vii) Number of meetings held last year with:
government actors to lobby for greater support for members and small
producers?
Non-government actors to lobby for greater support for members and small
producers?
viii)What are the terms and conditions for workers hired by members on their farms?
Yes/No If yes, please describe…………….
ix)How many farmers have been trained in gender issues?
x)Has the organisation provided any support to disadvantaged and vulnerable groups
d. child labour elimination measures
e. youth employment projects

27 | P a g e
4. Questionnaire with marketing manager (certified organisation)
Purpose: To gather key detailed data from the PO. Send ahead if feasible (e.g. by email) to help PO
prepare information.
Method: Go through the questionnaire with the marketing manager to fill in the details. Several of
these questions may be outside the remit of the marketing manager (e.g. credit or technical
assistance etc). So we suggest going through the questions with the manager first and then
identifying those which should be referred to others.
1. Does the organisation have:
a) A finance department Yes/No
b) Marketing/export department Yes/No
c) Legal department Yes/No
d) Technical Department Yes/No
e) Retail of inputs or other products Yes/No
2. How many members do you have:
This year Five years ago
Total
Women
Men
3. How many producers left the organisation last year? ………………………
4. How many joined the PO last year?....................................................
5. What % of the following are women or involve women:
This year Five years ago
Board
Committees
Participants in the AGM
Participants in training activities
6. What proportion of PO members are youth (17-25?)………………….%
7. Which of the following services is provided by your organisation?:
Please tick as many of the boxes below as appropriate for your organisation
Production only
Post-harvest processing
Product transformation
Export/direct trade
Import/wholesale

28 | P a g e
Retailing
8. Please describe what support, if any, you have received as an organisation in the past 5
years
Support received (e.g. credit, grants, projects, technical, contacts, information etc)
Fairtrade buyers
Non-Fairtrade buyers
NGOs
Other sustainability Standards (e.g organic, Rainforest Alliance, Utz
Certified etc)
Others
9. Buyers
6a. How many countries was your product sold in?
6b. Number of buyers in last year? (total)
6c. What are the names of the top three most important buyers
1. 2. 3.
6d. Length of relationship with each of the top 3 buyers in years
1. 2. 3.
6e. What kind of buyer are the top three buyers?
- Quality oriented (QO) - Mission oriented
(helping smallholder coffee farmers) (MO)
- Commercially oriented (CO)
1. 2. 3.
6f. Of your buyers, which provided a sourcing plan last year?
All Some None
6g. Did your buyers provide you with pre-finance at least 3 months before harvest period?
All Some None
6h. Do you receive support from buyers to improve production?
All Some None
6i. Do you receive support from buyers to strengthen your
All Some
29 | P a g e
business?
None
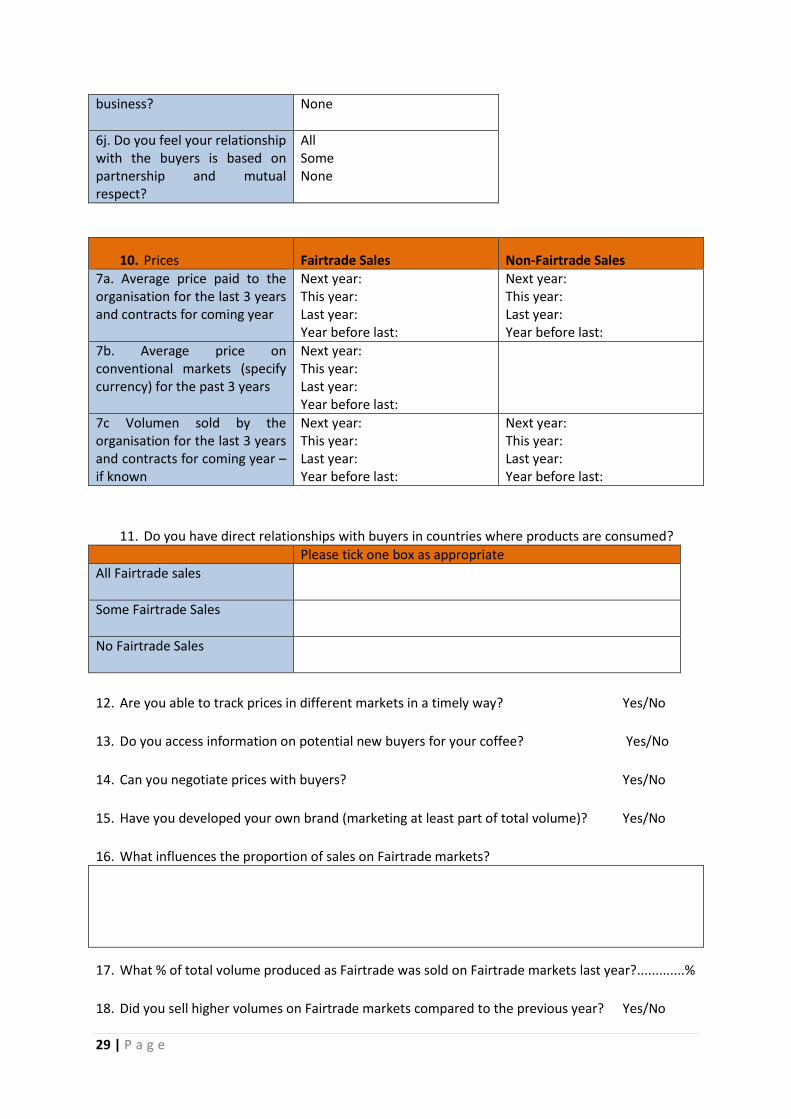
6j. Do you feel your relationship with the buyers is based on partnership and mutual respect?
All Some None
10. Prices Fairtrade Sales Non-Fairtrade Sales 7a. Average price paid to the organisation for the last 3 years and contracts for coming year
Next year: This year: Last year: Year before last:
Next year: This year: Last year: Year before last:
7b. Average price on conventional markets (specify currency) for the past 3 years
Next year: This year: Last year: Year before last:
7c Volumen sold by the organisation for the last 3 years and contracts for coming year – if known
Next year: This year: Last year: Year before last:
Next year: This year: Last year: Year before last:
11. Do you have direct relationships with buyers in countries where products are consumed?
Please tick one box as appropriate
All Fairtrade sales
Some Fairtrade Sales
No Fairtrade Sales
12. Are you able to track prices in different markets in a timely way? Yes/No
13. Do you access information on potential new buyers for your coffee? Yes/No
14. Can you negotiate prices with buyers? Yes/No
15. Have you developed your own brand (marketing at least part of total volume)? Yes/No
16. What influences the proportion of sales on Fairtrade markets?
17. What % of total volume produced as Fairtrade was sold on Fairtrade markets last year?.............%
18. Did you sell higher volumes on Fairtrade markets compared to the previous year? Yes/No

30 | P a g e
Trade fairs Answers
19. How many trade fairs has your organisation participated in during the last year?
20. Where were the trade fairs you participated in? (location)
21. List any benefits of participation in these trade fairs
Working Capital Please tick as appropriate
22. How would you describe your levels of working capital (own and third party) to undertake planned levels of sourcing last year?
100% of value of sales 75-99% value of sales 50-75% value of sales 25-50% value of sales 10-15% value of sales less than 10% value of sales
Average interest rates on loans Answers
23. What were the interest rates on loans received from Fairtrade buyers (or facilitated by them) compared to non-Fairtrade buyers (or facilitated by them)?
FT % Non FT %
24. What were the average interest rates for loans from national banks?
%
25. Have the services provided by your organization to members changed in the last 5 years?
Tick as
appropriate
Why? Please explain
reasons
Credit a. Improved a great deal b. Improved a little c. Stayed the same d. Worsened a little e. Worsened a lot
Marketing of produce (finding buyers)
1. Improved a great deal 2. Improved a little 3. Stayed the same

31 | P a g e
4. Worsened a little 5. Worsened a lot
Selling of produce 1. Improved a great deal
2. Improved a little 3. Stayed the same 4. Worsened a little 5. Worsened a lot
Technical advice 1. Improved a great deal 2. Improved a little 3. Stayed the same 4. Worsened a little 5. Worsened a lot
Training provision
1. Improved a great deal 2. Improved a little 3. Stayed the same 4. Worsened a little 5. Worsened a lot
Agronomic inputs (e.g. fertilizers, tools)
1. Improved a great deal 2. Improved a little 3. Stayed the same 4. Worsened a little 5. Worsened a lot
Development projects
1. Improved a great deal 2. Improved a little 3. Stayed the same 4. Worsened a little 5. Worsened a lot
Influencing local government on behalf of members
1. Improved a great deal 2. Improved a little 3. Stayed the same 4. Worsened a little 5. Worsened a lot
Influencing national government on behalf of members
1. Improved a great deal 2. Improved a little 3. Stayed the same 4. Worsened a little 5. Worsened a lot
Influencing Fairtrade International on behalf of members
1. Improved a great deal 2. Improved a little 3. Stayed the same 4. Worsened a little 5. Worsened a lot

32 | P a g e
26. Number of SPO members which have received credit for productive purposes during the last year
27. Total value of credit provided for productive purposes during the last year……………
28. How many infrastructure projects have you completed in the last year in each of the following categories?
Please provide numbers for each category
Please indicate which of these were funded by Fairtrade Premium funds? Yes/No
No. of communities benefitting in each category
(last year)
1. Education
2. Health
3. water
4. sanitation
5. roads and bridges
6. electricity and lighting
7. leisure facilities
8. community centres
9. Other
29. Has the Fairtrade Premium been used for administration purposes? Yes/No, If yes, please provide details…..
30. Has the Fairtrade Premium been used for purchase of equipment or infrastructure? Yes/No, If yes, please provide details…..
31. What proportion approximately of total Premium use has been employed in direct economic support to member households?
32. How is the use of the Fairtrade Premium decided upon?
33. How many environmental projects were completed in last year:
Environmental projects Number completed last year
Reforestation

33 | P a g e
Waste disposal
Fuel efficient cooking
Water conservation and quality
Other
34. Has participation in Fairtrade enabled the organisation to do any of the following: a. Develop complete and up-to-date financial systems Yes/No
b. Develop and make available an Internal Control System Manual Yes/No
c. Internal Auditors conducting internal inspections and reporting Yes/No
d. Develop and make available job descriptions and clear roles and responsibilities
Yes/No
e. Develop and make available an annual budget and resource management plan
Yes/No
f. Develop and make available a business plan Yes/No
34 | P a g e
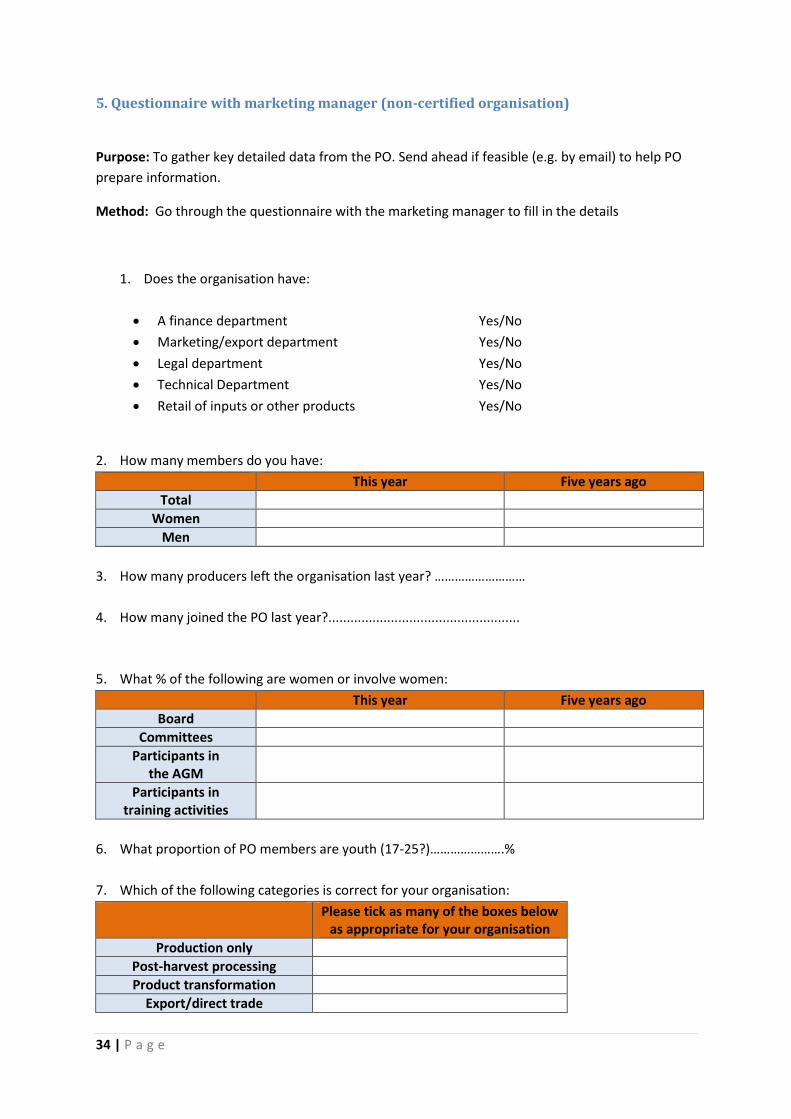
5. Questionnaire with marketing manager (non-certified organisation)
Purpose: To gather key detailed data from the PO. Send ahead if feasible (e.g. by email) to help PO
prepare information.
Method: Go through the questionnaire with the marketing manager to fill in the details
1. Does the organisation have:
A finance department Yes/No
Marketing/export department Yes/No
Legal department Yes/No
Technical Department Yes/No
Retail of inputs or other products Yes/No
2. How many members do you have:
This year Five years ago
Total
Women
Men
3. How many producers left the organisation last year? ………………………
4. How many joined the PO last year?....................................................
5. What % of the following are women or involve women:
This year Five years ago
Board
Committees
Participants in the AGM
Participants in training activities
6. What proportion of PO members are youth (17-25?)………………….%
7. Which of the following categories is correct for your organisation:
Please tick as many of the boxes below as appropriate for your organisation
Production only
Post-harvest processing
Product transformation
Export/direct trade

35 | P a g e
Import/wholesale
Retailing
8. Please describe what support, if any, you have received as an organisation in the past 5 years
Support received (e.g. credit, grants, projects, technical, contacts, information etc)
Buyers
NGOs
Others
9. Buyers
6a. How many countries was your Fairtrade product sold in?
6b. Number of buyers in last year? (total)
6c. What are the names of the top three most important buyers
1. 2. 3.
6d. Length of relationship with each of the top 3 buyers in years
1. 2. 3.
6e. What kind of buyer are the top three buyers?
- Quality oriented (QO) - Mission oriented
(helping smallholder coffee farmers) (MO)
- Commercially oriented (CO)
1. 2. 3.
6f. Of your buyers, which provided a sourcing plan last year?
All Some None
6g. Did your buyers provide you with pre-finance at least 3 months before harvest period?
All Some None
6h. Do you receive support from buyers to improve production?
All Some None
6i. Do you receive support from buyers to strengthen your business?
All Some None
6j. Do you feel your relationship with the buyers is based on partnership and mutual respect?
All Some None

36 | P a g e
10. Prices Non-Fairtrade
7a. Average price paid to the organisation last year
Next year This year Last year Year before last
7b. Average price on conventional markets?
Next year This year Last year Year before last
7c. 7c Volumen sold by the organisation for the last 3 years and contracts for coming year – if known
Next year This year Last year Year before last
11. Are you able to track prices in different markets in a timely way? Yes/No
12. Are you able to access information on potential new buyers for your coffee?
Yes/No
13. Can you negotiate prices with buyers? Yes/No
14. Have you developed your own brand (marketing at least part of total volume)? Yes/No
Trade fairs Answers
15. How many trade fairs has your organisation participated in during the last year?
16. Where were the trade fairs you participated in? (location)
17. List any benefits of participation in these trade fairs
Working Capital Please tick as appropriate
18. How would you describe your levels of working capital (own and third party) to undertake planned levels of sourcing last year?
a. Excellent………………………………….. b. Very good……………………………….. c. Quite good…………………………….. d. Poor……………………………………….. e. Very Poor…………………………………

37 | P a g e
Average interest rates on loans Answers
19. What were the interest rates on loans offered by buyers or facilitated by them?
%
20. What were the average interest rates for loans from national banks?
%
21. Have the services provided by your organization to members changed in the last 5 years?
Tick as
appropriate
Why? Please explain
reasons
Credit Improved a great deal
Improved a little
Stayed the same
Worsened a little
Worsened a lot
Marketing of produce (finding buyers and market information)
6. Improved a great deal 7. Improved a little 8. Stayed the same 9. Worsened a little 10. Worsened a lot
Selling of produce 6. Improved a great deal
7. Improved a little 8. Stayed the same 9. Worsened a little 10. Worsened a lot
Technical advice 6. Improved a great deal 7. Improved a little 8. Stayed the same 9. Worsened a little 10. Worsened a lot
Training provision
6. Improved a great deal 7. Improved a little 8. Stayed the same 9. Worsened a little 10. Worsened a lot
Agronomic inputs (e.g. fertilizers, tools)
6. Improved a great deal 7. Improved a little 8. Stayed the same 9. Worsened a little 10. Worsened a lot

38 | P a g e
Development projects
6. Improved a great deal 7. Improved a little 8. Stayed the same 9. Worsened a little 10. Worsened a lot
Influencing local government on behalf of members
6. Improved a great deal 7. Improved a little 8. Stayed the same 9. Worsened a little 10. Worsened a lot
Influencing national government on behalf of members
6. Improved a great deal 7. Improved a little 8. Stayed the same 9. Worsened a little 10. Worsened a lot
22. Number of SPO members which have received credit for productive purposes during the last
year
23. Total amount of credit received for productive purposes last year by members?
24. How many infrastructure projects have you completed in the last year in each of the following categories?
Please provide numbers for each category
No. of communities benefitting in each category (last year)
Education
Health
Water
Sanitation
Electricity and lighting
roads and bridges
leisure facilities
community centres
Other

39 | P a g e
6. Focus Group Discussions – CERTIFIED
Purpose: To gather data and farmers’ perspectives in a participatory exercise. The data gathered will complement that gathered in other exercises, and allows for more probing compared to more closed methods. Method: 1 facilitator, 1 note-taker
i. Select two groups of individual producers – 1 group of women and 1 group of men at each
PO (two certified groups = 4 FGDs in total). The two groups will be held separately to
…ensure that women’s voices are properly heard. We should invite the PO leadership during
the management meeting to support us in arranging focus groups – requesting a mix of ages
and coffee farm sizes at least. An ideal sized group is 8 to 10 individuals. One option would
be to use membership lists and select randomly, but it is unlikely to be a feasible method in
terms of our timescale and the need to then invite specific participants etc.
ii. Use the checklist to guide the discussion. Probe further on important questions and where
there is no consensus. Ensure less vocal individuals are encouraged to speak and have a
turn. Provide a clear explanation of the purpose of the focus group discussion.
iii. Take notes – as detailed as possible. Do not write notes that summarize people’s view.
Transcripts are better to capture what people say and notes should report direct speech ‘I
have only got three chickens’ (not ‘3 chickens’ ‘she said she had 3 chickens’) and take note
of differences of opinion and where there is consensus. Note who attended and quality of
discussions.
iv. Following the FGD as soon as possible tabulate the findings according to the main questions
of the checklist. Keep copies/photos of any participatory exercise outputs.
v. Share with NRI team copies of transcripts and tabulations.
A list of indicators for the FGDs is provided in appendix 1. These are drawn from the draft excel sheet sent to us by FLO. The draft checklist is as follows: See below for draft checklist.

40 | P a g e
Focus Group Discussion Checklist Coffee & Livelihoods
1. What are the main livelihood activities for members of this producer organisation?
2. What are the main sources of income for members of this producer organisation (please list)
3. How important is coffee income relative to overall household income? (Can use piles of
stones, beans, maize seeds – whatever is available – and farmers can make an estimation of
the proportion of household income generated by sales of coffee). This is done as a group
representing the members of the PO in their area (but please note down if individuals
indicate significant variation exists or not)
4. What are your average yields? (weight per unit area or other measure?)
5. What factors influence your yields?
6. Are your yields going up, stable, or declining?
7. What are the main challenges you face in coffee cultivation?
8. How does your PO address these challenges (if at all)?
Training and skills
9. Have you received any training from the PO or technical advice? (Who provides it, explore
topics)
10. How satisfied are you with the training and/or technical advice? (score out of 10?)
11. Why? (learning new or improving knowledge and skills, any changes made as a result?)
12. Has the training/technical advice led you to make any changes in your farming practices and
if so, with what results?
Producer organisation
13. How would you describe your producer organisation? (Explore what it does well, and what it
does less well, if anything)
14. What services does it provide to you and how does it represent you to external bodies (e.g.
government, traders)?
15. How does your PO compare to other coffee buyers? (how and why do they choose coffee
buyers?)
16. What is your view on the leadership of the producer organisation (e.g. listening to views of
members, competency, areas to improve?)
17. What benefits do you obtain from being a member of the producer organisation? (probe
what services it provides, and whether these have changed over time – e.g. credit, access to
inputs, technical advice and training, prices ???etc)
18. How would you describe decision-making in your organisation?
19. To what extent are your views listened to by PO leaders?
20. In which areas could the PO improve?
Awareness of Fairtrade
1. Have you heard of Fairtrade?
2. How have Fairtrade Premium investments (state what these are according to the PO
managers) affected you and if so, how? (Positively, negatively, scale of impact to lives etc)
3. Did you have a say in deciding on the use of the Fairtrade Premium?
4. Have these investments had an impact on the wider community? If yes, please explain.

41 | P a g e
Fair prices & markets
5. What prices have you received from the PO - over the last 3 years?
6. How does the PO calculate the prices paid to you? (Are there different components of the
price?)
7. How do the PO prices compare to the prices of other buyers now?
8. How do the PO prices compare to the prices of other buyers over the past 10 years (if the
PO existed then and was Fairtrade certified then)?
9. What do you know of the markets where products are sold? (where does it go after it leaves
the PO, end markets and prices and levels of demand in those end markets)?
10. What are the main challenges you face in selling your coffee? How does your PO address
these challenges (if at all)?
Terms & conditions for workers on smallholder farms
11. Do you employ workers on your farm? If yes, have their conditions of employment and basic
daily wages changed in the last x years? If yes, why have they changed?
Standard of living and assets
12. What are the most important assets of the better off households in your community?
(please list the factors of differentiation – including income estimates, as well as assets,
livelihood activities, use of hired labour etc)
13. What are the most important assets of the poorest households in your community? (please
list the factors of differentiation – including income estimates as well as assets, livelihood
activities, use of hired labour etc)
14. What are the most important assets of the middle-range households in your community?
(please list the factors of differentiation – including income estimates, as well as assets,
livelihood activities, use of hired labour etc)
15. Where would you place yourselves (poorer, middle-range or better off households – refer to
the most important assets identified in the discussions above for this placing of households).
16. Have you more, less or the same household assets now compared to 5 years ago?
17. What are the trends in land ownership amongst coffee farming households in this region?
Any differences for men, women and youth?
18. What are the trends in farming in this region (are households growing more, less or the
same coffee, what other crops are important?)
19. Is your income sufficient to cover basic needs?
20. Have you been able to invest coffee returns in recent years? If yes, what have you invested
in (e.g. productive assets, new income generating activities, household assets, other)
21. How self-sufficient are households in terms of own food production?
22. Do you think that your economic situation has (1) improved, (2) stayed the same, (3)
worsened over the past year (30)
23. Do you want your children to grow coffee for their livelihood (probe whether coffee is seen
as a positive livelihood option, and what realistic alternatives there might be? If the answer is
no, then how can children escape coffee farming? What would fund/enable this escape from
coffee farming if this is what is desired?

42 | P a g e
Producer Organisation:
Notes: Take notes on who participated and the nature of the discussions (areas of significant discussion, areas of agreement, disagreements etc).
This table is to be filled in using the detailed notes from the field. The idea is not to fill this in in the field but to do an analysis of the detailed notes (which
also should be shared with FLO via NRI) to create these tables. The findings summarize the findings from the FGDs but should not omit important detail and
areas of disagreement or variation. The detailed notes are useful as they will help us to understand what is happening in each context and will provide
quotes – the detailed notes should try and include quotes verbatim (e.g. not report that ‘they said they liked the premium project’, but should say as an
example:‘one of the group said: 'the borehole has been really important. I can now collect water more easily, it is less far to walk and I get less tired’
(woman FGD participant). The whole group agreed with this – except for two people who said that the borehole is not well maintained’. Then in the table
below you can summarize this to + perceptions of funding of borehole using Fairtrade Premium funding according to the majority, but some maintenance
issues were mentioned’ and insert quote that provides insight.
Question Responses – Men’s FGD Questions Responses – Women’s FGD Main livelihood activities
Main livelihood activities
Main sources of income
Main sources of income
Relative importance of coffee to household income
Relative importance of coffee to household income
Average yields
Average yields
Factors influencing yields
Factors influencing yields
Yields going up, stable or declining
Yields going up, stable or declining
Main challenges
Main challenges
How does PO overcome these challenges
How does PO overcome these challenges
Any training from PO Any training from

43 | P a g e
or technical advice PO or technical advice
Satisfaction with training/technical advice
Satisfaction with training/technical advice
Reasons for level of satisfaction with training
Reasons for level of satisfaction with training
Changes in farming practices and results
Changes in farming practices and results
Description of PO Description of PO Services of PO compared to other buyers & representation to external bodies
Services of PO compared to other buyers & representation to external bodies
Comparison between PO and other coffee buyers
Comparison between PO and other coffee buyers
PO leadership PO leadership Benefits from being a member of the PO
Benefits from being a member of the PO
Decision-making in the PO
Decision-making in the PO
Views listened to by PO leaders
Views listened to by PO leaders
Areas for improvement by the PO
Areas for improvement by the PO
Prices from the PO over last 3 years
Prices from the PO over last 3 years
How does the PO How does the PO
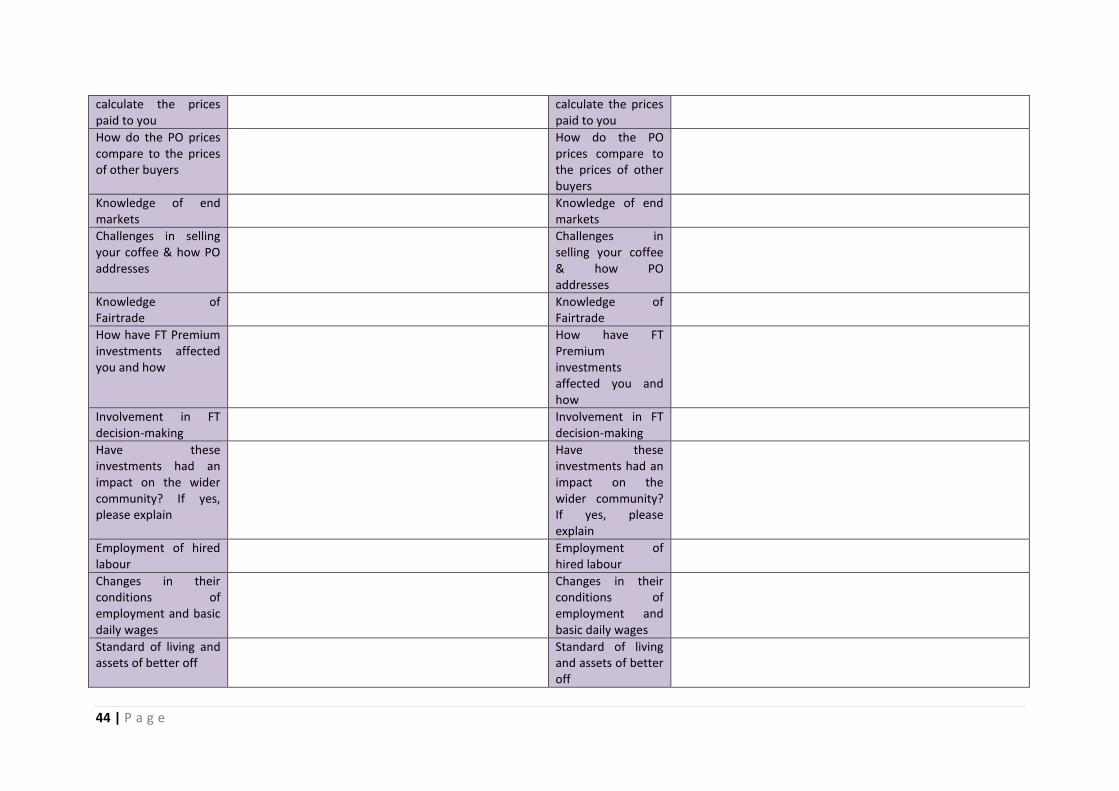
44 | P a g e
calculate the prices paid to you
calculate the prices paid to you
How do the PO prices compare to the prices of other buyers
How do the PO prices compare to the prices of other buyers
Knowledge of end markets
Knowledge of end markets
Challenges in selling your coffee & how PO addresses
Challenges in selling your coffee & how PO addresses
Knowledge of Fairtrade
Knowledge of Fairtrade
How have FT Premium investments affected you and how
How have FT Premium investments affected you and how
Involvement in FT decision-making
Involvement in FT decision-making
Have these investments had an impact on the wider community? If yes, please explain
Have these investments had an impact on the wider community? If yes, please explain
Employment of hired labour
Employment of hired labour
Changes in their conditions of employment and basic daily wages
Changes in their conditions of employment and basic daily wages
Standard of living and assets of better off
Standard of living and assets of better off

45 | P a g e
Standard of living and assets of poorest
Standard of living and assets of poorest
Standard of living and assets of middle range households
Standard of living and assets of middle range households
Asset levels now & 5 years ago
Asset levels now & 5 years ago
Trends in land ownership amongst coffee farming households (men, women, youth)
Trends in land ownership amongst coffee farming households (men, women, youth)
Trends in farming in this region
Trends in farming in this region
Income sufficient to cover basic needs
Income sufficient to cover basic needs
Investment in coffee returns in recent years
Investment in coffee returns in recent years
Self-sufficiency of households in terms of own food production
Self-sufficiency of households in terms of own food production
Economic situation Economic situation Aspirations for children to grow coffee for their livelihood
Aspirations for children to grow coffee for their livelihood

46 | P a g e
7. Focus Group Discussions – NON-CERTIFIED
Purpose: To gather data and farmers’ perspectives in a participatory exercise who are members of non-certified group (or if this is the counterfactual – unorganized farmers). The data gathered will complement that gathered in other exercises, and allows for more probing compareds to more closed methods. Method: 1 facilitator, 1 note-taker
vi. Select two groups of individual producers – 1 group of women and 1 group of men at each
PO (1 non-certified PO = 2 FGDs in total). The two groups will be held separately to ensure
that women’s voices are properly heard. We should invite the PO leadership (or community
leaders) during the management meeting to support us in arranging focus groups. An ideal
sized group is 8 to 10 individuals of a range of ages and wealth categories.
vii. Use the checklist to guide the discussion. Probe further on important questions and where
there is no consensus. Ensure less vocal individuals are encouraged to speak and have a
turn. Provide a clear explanation of the purpose of the focus group discussion.
viii. Take notes – as detailed as possible. Do not write notes that summarize people’s view.
Transcripts are better to capture what people say and notes should report direct speech ‘I
have only got three chickens’ (not ‘3 chickens’ ‘she said she had 3 chickens’) and take note
of differences of opinion and where there is consensus. Note who attended and quality of
discussions.
ix. Following the FGD as soon as possible tabulate the findings according to the main questions
of the checklist. Keep copies/photos of any participatory exercise outputs.
x. Share with NRI team copies of transcripts and tabulations.
A list of indicators for the FGDs is provided in appendix 1. These are drawn from the draft excel sheet sent to us by FLO. The draft checklist is as follows: See below for draft checklist.
Draft FGD Checklist – Non-certified farmers Coffee & Livelihoods
i. What are your main livelihood activities?
ii. What are your main sources of income (please list)
iii. How important is coffee income relative to overall household income? (Use piles of stones,
beans or maize seeds – whatever is available and ask the farmers to create an approximation
of the relative importance of coffee income to the PO members in that area (ie. Not to do this
individually). But please note if there are disagreements or the group indicate variation
between them).
iv. What are your average yields? (weight per unit area or other measure?)
v. What factors influence your yields?
vi. Are your yields going up, stable, or declining?
vii. What are the main challenges you face in coffee cultivation?
viii. How does your PO address these challenges (if at all)?
Training and skills

47 | P a g e
1. Have you received any training from the PO or technical advice? (Who provides it, explore
topics)
2. How satisfied are you with the training and/or technical advice? (score out of 10?)
3. Why? (learning new or improving knowledge and skills, any changes made as a result?)
4. Has the training/technical advice led you to make any changes in your farming practices and
if so, with what results?
Producer organisation
5. How would you describe your producer organisation? (Explore what it does well, and what it
does less well, if anything)
6. What services does it provide to you and how does it represent you to external bodies (e.g.
government, traders)?
7. How does your PO compare to other coffee buyers? (how and why do they choose coffee
buyers?)
8. What is your view on the leadership of the producer organisation (e.g. listening to views of
members, competency, areas to improve?)
9. What benefits do you obtain from being a member of the producer organisation? (probe
what services it provides, and whether these have changed over time – e.g. credit, access to
inputs, technical advice and training, prices ???etc)
10. In which areas could the PO improve?
Prices & markets
11. What prices have you received from the PO - over the last 3 years?
12. How does the PO calculate the prices paid to you? (Are there different components of the
price?)
13. How do the PO prices compare to the prices of other buyers?
14. What do you know of the markets where products are sold? (where does it go after it leaves
the PO, end markets and prices and levels of demand in those end markets)?
15. What are the main challenges you face in selling your coffee? How does your PO address
these challenges (if at all)?
Terms & conditions for workers on smallholder farms
16. Do you employ workers on your farm? If yes, have their conditions of employment and basic
daily wages changed in the last x years? If yes, why have they changed?
Standard of living and assets
17. What are the assets of the better off households in your community? (please list the main
factors of differentiation including income estimates, as well as assets, livelihood activities,
use of hired labour etc)
18. What are the assets of the poorest households in your community? (please list including
income estimates, as well as assets, livelihood activities, use of hired labour etc)
19. What are the assets of the middle-range households in your community? (please list
including income estimates, as well as assets, livelihood activities, use of hired labour etc)
20. Where would you place yourselves (poorer, middle-range or better off households) (refer to
the indicators developed above)
21. Have you more, less or the same household assets now compared to 5 years ago?
22. What are the trends in land ownership amongst coffee farming households in this region?
Any differences for men, women and youth?

48 | P a g e
23. What are the trends in farming in this region (are households growing more, less or the
same coffee, what other crops are important?)
24. Have you been able to invest coffee returns in recent years? If yes, what have you invested
in (e.g. productive assets, new income generating activities, household assets, other)
25. Is your income sufficient to cover basic needs?
26. How self-sufficient are households in terms of own food production?
27. Do you think that your economic situation has (1) improved, (2) stayed the same, (3)
worsened over the past year (30)
28. Do you want your children to grow coffee for their livelihood (probe whether coffee is seen
as a positive livelihood option, and what realistic alternatives there might be and how they
might get there – e.g. what would fund this or enable this change)?

49 | P a g e
Producer Organisation:
Notes: Basic information on who participated and the nature of discussions (agreements, disagreements, participation etc)
As above with certified FGDs for detailed notes guidance and how and when to fill the table below (which summarizes FGD findings).
Question Responses – Men’s FGD Questions Responses – Women’s FGD Main livelihood activities
Main livelihood activities
Main sources of income
Main sources of income
Relative importance of coffee to household income
Relative importance of coffee to household income
Average yields
Average yields
Factors influencing yields
Factors influencing yields
Yields going up, stable or declining
Yields going up, stable or declining
Main challenges
Main challenges
How does PO overcome these challenges
How does PO overcome these challenges
Any training from PO or technical advice
Any training from PO or technical advice
Satisfaction with training/technical advice
Satisfaction with training/technical advice
Reasons for level of satisfaction with training
Reasons for level of satisfaction with training

50 | P a g e
Changes in farming practices and results
Changes in farming practices and results
Description of PO Description of PO Services of PO compared to other buyers & representation to external bodies
Services of PO compared to other buyers & representation to external bodies
Comparison between PO and other coffee buyers
Comparison between PO and other coffee buyers
PO leadership PO leadership Benefits from being a member of the PO
Benefits from being a member of the PO
Decision-making in the PO
Decision-making in the PO
Views listened to by PO leaders
Views listened to by PO leaders
Areas for improvement by the PO
Areas for improvement by the PO
Prices from the PO over last 3 years
Prices from the PO over last 3 years
How does the PO calculate the prices paid to you
How does the PO calculate the prices paid to you
How do the PO prices compare to the prices of other buyers
How do the PO prices compare to the prices of other buyers
Knowledge of end markets
Knowledge of end markets
Challenges in selling Challenges in

51 | P a g e
your coffee & how PO addresses
selling your coffee & how PO addresses
Knowledge of Fairtrade
Knowledge of Fairtrade
How have FT Premium investments affected you and how
How have FT Premium investments affected you and how
Involvement in FT decision-making
Involvement in FT decision-making
Have these investments had an impact on the wider community? If yes, please explain
Have these investments had an impact on the wider community? If yes, please explain
Employment of hired labour
Employment of hired labour
Changes in their conditions of employment and basic daily wages
Changes in their conditions of employment and basic daily wages
Standard of living and assets of better off
Standard of living and assets of better off
Standard of living and assets of poorest
Standard of living and assets of poorest
Standard of living and assets of middle range households
Standard of living and assets of middle range households
Asset levels now & 5 years ago
Asset levels now & 5 years ago

52 | P a g e
Trends in land ownership amongst coffee farming households (men, women, youth)
Trends in land ownership amongst coffee farming households (men, women, youth)
Trends in farming in this region
Trends in farming in this region
Income sufficient to cover basic needs
Income sufficient to cover basic needs
Investment in coffee returns in recent years
Investment in coffee returns in recent years
Self-sufficiency of households in terms of own food production
Self-sufficiency of households in terms of own food production
Economic situation Economic situation Aspirations for children to grow coffee for their livelihood
Aspirations for children to grow coffee for their livelihood

53 | P a g e
8. Participatory Gross Margin Analysis PLUS for coffee growers
This method was developed by Barry Pound, with adaptations by Jeremy Haggar.
Assessing the profitability of an enterprise is challenging, as it requires calculating costs and returns
for the enterprise under changing economic and environmental conditions.
Gross Margin Analysis (GMA) involves deducting all variable production costs (labour, materials,
transport, etc.) associated with an enterprise from the revenue (value of output) over the same time
period and unit of production, to arrive at an estimate of monetary gain or loss for these units of
time and area.
The calculation of GM alone provides only part of the information needed by farmers to make
production decisions, while not taking other factors into account, such as cash flow, return to
investment, the environmental and social impact of the enterprise, and post-production
opportunities (storage, processing and marketing). Therefore there is a need for a tool that enables
farmer groups to undertake GMA, while also considering other criteria for enterprise selection. Input
and market prices fluctuate between years, and calculations will be year specific.
There may also be a need for separate calculations for different types of farmers involved in the
same enterprise but at different levels (e.g. low-input farmers vs higher-input farmers). It is
important to be familiar with the “normal” agronomic management of the crop to facilitate the
session. Also to know in what form the coffee is sold by the farmer – whether as cherries, wet
parchment, dry parchment or green coffee, and what processing steps the farmer normally
undertakes themselves.
Method
There are a number of basic steps:
Step 1: Mobilising the farmer group for the exercise. GMA+ can take several hours, farmer groups
interested in participating in the pilot are asked well in advance to identify a suitable time and place
for the exercise, and to inform all group members of the event. We are interested in contrasting
production and income from different producer typologies representative of the farmer members of
the coop, this may be organic vs conventional, high-input vs low input, men vs women farmers or
any combination of these. For each PO we may characterize between 1 and 4 typologies depending
on the number of facilitators. We should aim to have between 3 and 5 farmers representative of
each typology.
Step 2: Introduction to the exercise. Before each exercise, the facilitators explain to the group the
purpose of the exercise, and what steps they intended to follow to collate the information. The
participants should be formed into groups by typology each with a facilitator. Often the group would
select one of their members to document the calculation on a flip chart, for everyone to see.
54 | P a g e
Step 3: Agreement on the enterprise and unit of operation. Group members would then agree on the specific enterprise to be discussed, i.e. a certain coffee field or farm registering operations over the period of one year from the post harvest period of one year to completion of the harvest the following year. A coffee farm will probably include different areas of productive coffee, coffee under development and coffee nurseries. It should be agreed what is the typical proportion or area on a farm under each of these stages of production. Ideally activities should be registered for each of these areas separately and then summed to assess the overall profitability of coffee production on the farm.
Step 4: Gathering of data on expenditure. Guided by the facilitator, group members would then list
all the production costs involved in the exercise. It was generally easier, and helped avoid forgetting
expenses, when this was done chronologically, starting with agronomic management, through to
harvesting and processing. It is greatly advantageous if the facilitator has a basic understanding of
the management of the crop. Farmers would discuss each item among themselves and agree on the
appropriate measure. It may be more feasible to select the farm of one “typical” member of the
group cover differences.
Step 5: Gathering of data on income. Income may be primarily from coffee, but often other crops are
associated with coffee and the management given to the coffee also benefits these crops. In many
cases these products are for household use but some may be sold. If possible a monetary value
should be given to all products from the coffee field. Also need to make sure that the labour etc to
manage these other products is included in the expenditure calculations. In extreme cases these
other crops may be the main crop, in an intercropped system, in which case it is even more
important to adequately document the management of all crops in the field.
Step 6: Calculating the GM. With the help of the facilitator (who usually had a pocket calculator), the
gross margin would be calculated. This usually led to big surprises, because often the resulting value
was much higher or lower than farmers expected. At this stage the group would often decide to
check through the calculation again in detail, in order to detect any errors or inaccuracies.
Step 7: Discussing the outcome. The group would then discuss the outcome with the facilitator,
including reasons for losses (in case of negative gross margins), and ways of increasing returns either
by reducing production costs, increasing yields / outputs, or obtaining a better price. The list of
questions below can be used to reflect upon the data. Also different scenarios should be tried
especially price scenarios including coffee price 2 years ago, coffee price last harvest, local price at
present (if known) and Fairtrade minimum price.
Step 8: Wrap-up and next steps. As a result of the exercise, the group might agree on specific
activities in relation to the enterprise discussed, for example getting advice on improved husbandry
practices likely to increase outputs, or collective storage and marketing.
Special cases
Calculation of family labour. During the pilot, family labour was included in the calculation at rates
suggested by the farmer participants, even though convention suggests that, as a fixed cost, family
labour should not be included in GM calculations. Farmers in the pilot were keen to include family
labour, and sometimes costed family labour at a higher rate than hired labour as they said they
“worked harder and longer than hired labour” Including family labour helped to compare between

55 | P a g e
enterprises (while GMA has often been used to measure the profitability of the use of fixed assets -
particularly land and labour). Ideally family labour rates should reflect the labour market in the
locality, and therefore the opportunity cost of that labour. This may be lower than that suggested by
farmers, and therefore increase the gross margins over those presented here.
Depreciation of investments. Strictly applied, GMA does not include the costs of fixed assets, such as
land and equipment. However, when an enterprise requires substantial initial investments, these
should be included in the calculation to enable comparison between enterprises. An agreed rate of
depreciation should be used for any fixed asset, in line with its likely life span. There was some
confusion about this during the pilot, and this aspect needs to be explained clearly in any guidelines.
In addition, if farmers have to pay interest on a loan required to start a certain type of business then
this also needs to be included in the calculations
Additional questions that can be used to facilitate discussion of the results with the farmers to
complete the exercise
Is there a need for cash to be spent on inputs for the enterprise?
By what factor is the value of the investment multiplied?
How does the enterprise contribute to household food security?
Are there options for bulk purchase of inputs or for group credit?
What are the main production constraints and risks?
What are the main post-harvest constraints and risks?
What are the marketing risks?
Complementarity: How does this enterprise fit with other enterprises in the farm? Does it
compete with other enterprises for resources (cash, labour, land) or does it contribute to other
enterprises (e.g. manure for soil fertility management)
Are there any gender issues related to of the enterprise?
Sustainability: Can the enterprise be sustained in the long term?
What time frame is appropriate for the financial assessment of this enterprise?
Select participants for the focus group discussion randomly – if possible using membership lists (if a large organisation purposive sampling can be done to work at a more local level). If membership lists are not available, then we will have to ask PO leaders/community leaders to bring together a mixed group (gender, age, and wealth categories).
Please see the excel spreadsheet into which data will be added in the field during discussions.

56 | P a g e
9. Questionnaire
PURPOSE: To gather quantitative data from individual PO members METHOD: Random sample (e.g. choose sub-sections of the organisation – randomly choose primary societies or districts from the POs list. Then choose from PO lists every 6th person with random starting point or every 10th household for unorganized farmers in a transect walk – or ask community leader to invite non-certified coffee members to a meeting if first way not possible. The latter introduces bias, so should be avoided unless absolutely necessary.). Data will be entered into the tablet using the software that our Indian partner company (SEED) will provide. They will also provide a training session by skype for the research leaders to understand how to use the software. The data should be sent daily if possible to SEED so that they can provide additional checks on the data and support. It does not have to be sent directly from the farm, but can be transferred once back in internet range. SEED will provide a rapid analysis of the data once it is all gathered.

57 | P a g e
Questionnaire
Enumerator to complete:
i. Quality Control (enumerator name, date, signature) ii. Questionnaire identification (date of interview, questionnaire number, enumerator
code)
iii. Location, organisation, certification (Province, district, division, village, certification
status)
Introduction FOR CERTIFIED Organizations- This questionnaire has been designed to assess the impact of Fairtrade for coffee producers in different countries. The results will be used to help Fairtrade International and your producer organisation [name] to make improvements. FOR NON CERTIFIED organizations/Individual farmers- This questionnaire has been designed to explore the situation of coffee producers in different countries. The results will be used to help coffee producers and their organisations to make improvements. The questionnaire should take approx. 30 minutes to complete. The answers will be filled in on this mobile phone/tablet. Informed consent
1. Do you understand the objectives of this interview? Yes (Proceed to next question) No (further explanation/reassurance)
2. Are you willing to proceed with the interview? Yes (Proceed to next section) No (Thank the respondent and close interview)
Thank you. Please answer the following questions as accurately as possible. If you are unclear about anything please say so and I will try to explain.
3. Gender: Male Female
4. What is your age? 18–40yrs 41–60yrs Over 60yrs
5. How many years have you attended school? …………….. 6. For how many years have you been growing coffee? ………………………….. 7. How much land do you own? (unit of measure)
With reference to the past agricultural year:
8. How much land are you farming/utilising? (unit of measure)
9. How much land do you rent (unit of measure)
10. Please list the other main crops you grow……………………………………

58 | P a g e
11. How many livestock do you own?
Type Number
Chicken
Goats
Cows
Pigs
Other
12. How much of your land is planted with coffee? …………………………………………(unit of measure)
or
How many coffee plants do you have? ……………………………..
13. What proportion of your coffee plants are over 20 years old?
a) a quarter or less ( )
b) between a quarter and a half ( )
c) a half to three quarters ( )
d) three quarters to all of them. ( )
14. How much coffee did you produce last year, 2 years ago and 3 years ago?
Define what the actual ‘year’ is for each country
Q Year Amount Coffee produced Unit of measure
14a Last year
14b 2 years ago
14c 3 years ago
15. Do you sell your coffee as:
a. Cherries Yes/ No b. Wet Parchment Yes/No c. Dry Parchment Yes/No d. Green coffee Yes/No
16. How much of your coffee last season did you sell to:
How much sold to.. Amount of coffee sold Unit of measure
16a Your PO
16b Other buyers
17. What price did you receive from each of these buyers last season:
Q Buyer Price received last season
17a From the PO
17c Other buyers
18. How do the quality requirements of the PO compare to other buyers?
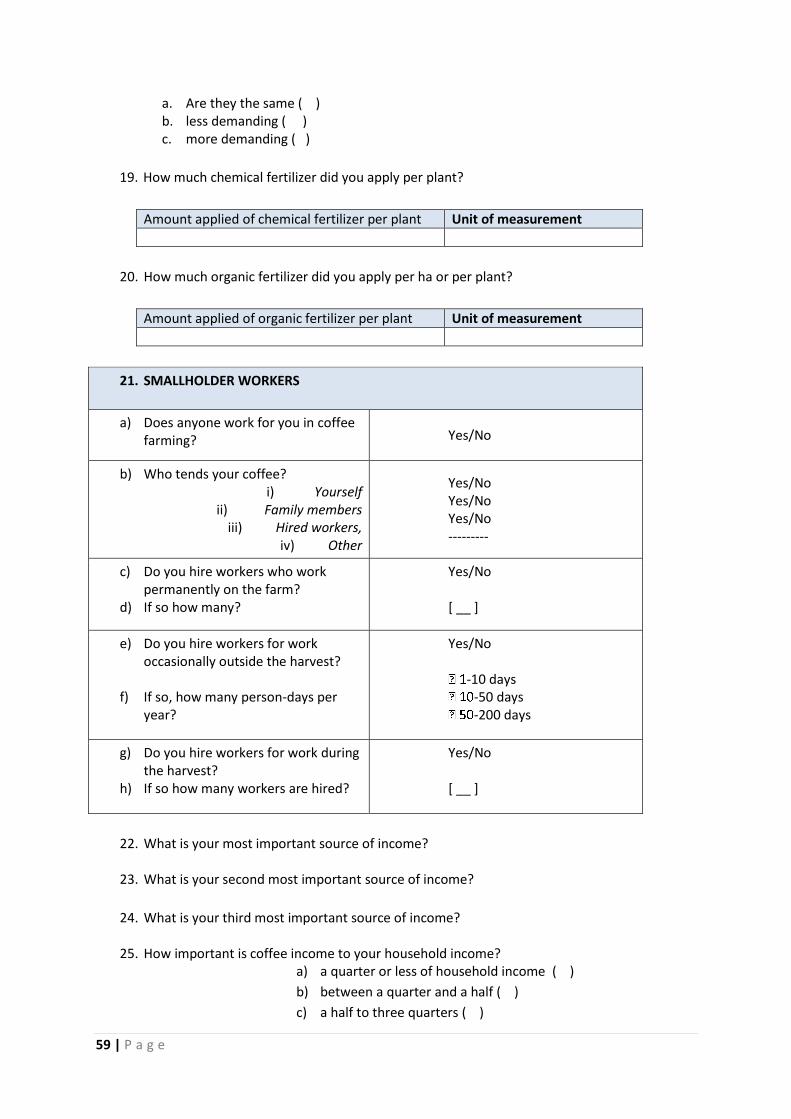
59 | P a g e
a. Are they the same ( ) b. less demanding ( ) c. more demanding ( )
19. How much chemical fertilizer did you apply per plant?
Amount applied of chemical fertilizer per plant Unit of measurement
20. How much organic fertilizer did you apply per ha or per plant?
Amount applied of organic fertilizer per plant Unit of measurement
21. SMALLHOLDER WORKERS
a) Does anyone work for you in coffee farming? Yes/No
b) Who tends your coffee? i) Yourself
ii) Family members iii) Hired workers,
iv) Other
Yes/No Yes/No Yes/No ---------
c) Do you hire workers who work permanently on the farm?
d) If so how many?
Yes/No [ __ ]
e) Do you hire workers for work occasionally outside the harvest?
f) If so, how many person-days per
year?
Yes/No
-10 days -50 days -200 days
g) Do you hire workers for work during the harvest?
h) If so how many workers are hired?
Yes/No [ __ ]
22. What is your most important source of income?
23. What is your second most important source of income?
24. What is your third most important source of income?
25. How important is coffee income to your household income? a) a quarter or less of household income ( )
b) between a quarter and a half ( )
c) a half to three quarters ( )

60 | P a g e
d) three quarters to all ( )
26. How satisfied are you with your access to inputs and services from the cooperative? (omit
reference to the cooperative if not a member)
Q Inputs and services
Extremely satisfied
Quite satisfied
Not very satisfied
Not at all satisfied
26a Production inputs
26b Extension services
26c Credit
26d Purchase and sale of coffee
27. From whom did you receive credit or financing in this past year for coffee production?
a. From my producer organization
b. From a trader
c. From a local credit provider
d. Other source
28. How many training events have you participated in the last year in the following topics:
Q Training type Yes/No
28a Fertilization
28b Pest control
28c Pruning
28d Shade Management
28e Nurseries
28f Quality control
28g Soil Conservation
28h Organic management
28i Certification
28j Cost and returns from production
28k Market trends
28l Other
29. Overall how has your economic situation changed over the past year?
a. Improved
b. Stayed the same
c. Worsened
30. Overall how would you rate your economic status now compared to 5 years ago?
a. Better
b. The same
c. Worse
31. Do you own any of the following?:
a. Depulper
b. Fermentation tanks
c. Drying tables
d. Huller

61 | P a g e
Questionnaire – Spanish Version A llenar por el entrevistador:
iv. Control de la calidad (Nombre del encuestador, fecha,) v. Identificación del Cuestionario (fecha de la entrevista, número de cuestionario, Número
de entrevistador)
vi. Lugar, Nombre de la Organización, certificación (Estado, Municipio, Comunidad, Estatus
de la certificación)
Introducción Este estudio busca evaluar la situación de los pequenos productores de café en diferentes países. Los resultados le ayudarán a la organización a su cooperativa / asociación de productores (nombre de la organización) para responder a sus necesidades y realizadades. Para responder a las preguntas en esta entrevista nos lleve 30 minutos. Las respuestas serán completadas en un teléfono celular o tableta. Dar consentimiento de la información
32. Usted entiende los objetivos o las razones de esta entrevista? Si (Continúe con la siguiente pregunta) No (realizar una explicación más
profunda/confirmar que se entendió el para qué de la entrevista) 33. Está usted listo para comenzar la entrevista?
Si (Continúe con la siguiente pregunta) No (Gracias por responder y se termina la entrevista)
Muchas gracias. Por favor conteste las siguientes preguntas de la mejor manera posible. Si tiene alguna duda acerca de cualquier cosa por favor no dude en preguntar o en decirme y intentaré en todo momento explicarle de que se trata. Información de preparación para el entrevistador:
34. Cuál es su género: Masculino Femenino
35. Cuál es su edad? 18–40 años 41–60 años Más de 60 años
36. Cuántos años fue usted a la escuela? ……………..
37. Desde cuándo usted produce café? …………………………..
38. Cuanto es el área de su propiedad (finca o chacra)? (unidad de medida)
39. Cuánta tierra tiene cultivado o en producción? (unidad de medida)
Durante este ultimo año
40. Cuánta tierra usted renta? (unidad de medida)
41. Por favor mencione los principales cultivos que usted produce, en orden de
importancia……………………………………

62 | P a g e
42. Cuántos animales tiene usted? ………………
Especie Número
Aves (Pollos, gallinas, pavos, patos)
Cabras o Borregos
Reses
Cerdos
Otros (burros, caballos, mulas)
43. Cuánta tierra tiene con café? …………………………………………(unidad de medida)
o
Cuántas plantas de café tiene usted?
44. Cual proporción de sus plantas de café tiene mayor a 20 años de edad?
a) Menos de la cuarta parte
b) Entre la cuarta parte y la mitad
c) Entre la mitad y tres-cuartos
d) Más de tres-cuartos
45. Cuánto café obtuvo el años pasado, hace 2 años y hace 3 años?
Definir qué es el año actual para cada país.
Q Año Cantidad de café producido
Unidad de Medida
14a Año pasado
14b Hace 2 años
14c Hace 3 años
46. Usted vende el café cómo:
a. Cereza Si/ No b. Pergamino húmedo Si/No c. Pergamino seco Si/No d. Café Verde Si/No
47. Cuánto de su cafe de la temporada pasada vendió cómo:
16 a Cuánto vendio usted... Cantidad de café vendido
Unidad de medida
16 b A su Organización
16 c Otros compradores
48. Qué precio le pagaron cada uno de estos compradores la temporada pasada.
Q Comprador Precio recibido la temporada pasada
17a De su Organización
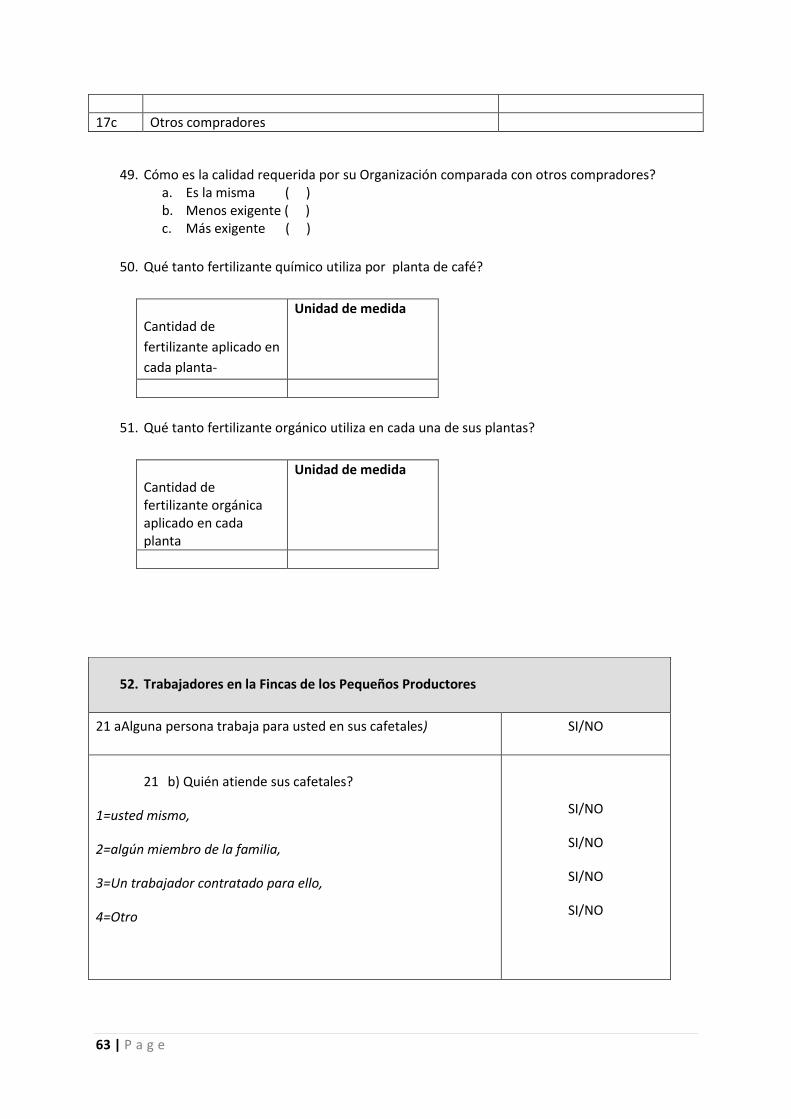
63 | P a g e
17c Otros compradores
49. Cómo es la calidad requerida por su Organización comparada con otros compradores? a. Es la misma ( ) b. Menos exigente ( ) c. Más exigente ( )
50. Qué tanto fertilizante químico utiliza por planta de café?
Cantidad de
fertilizante aplicado en
cada planta-
Unidad de medida
51. Qué tanto fertilizante orgánico utiliza en cada una de sus plantas?
Cantidad de fertilizante orgánica aplicado en cada planta
Unidad de medida
52. Trabajadores en la Fincas de los Pequeños Productores
21 aAlguna persona trabaja para usted en sus cafetales) SI/NO
21 b) Quién atiende sus cafetales?
1=usted mismo,
2=algún miembro de la familia,
3=Un trabajador contratado para ello,
4=Otro
SI/NO
SI/NO
SI/NO
SI/NO

64 | P a g e
21 c) Usted contrata trabajadores:
Cuantos trabajadores permanentes contratan?
21 d) Para realizar trabajos que no sean durante la cosecha del
café?
Si es sí, cuantos jornales al año?
21 e) Contratan trabajadores durante la cosecha del café?
Sí es si, cuántas personas son contratadas?
Si/NO
[ ]
1-10 jornales
10-50 jornales
50-200 jornales
Si/NO
[ ]
53. Cuál fue su fuente de ingreso más importante el año pasado?
54. Cuál fue su segunda fuente de ingreso más importante?
55. Cuál fue su tercera fuente de ingreso más importante?
56. Cuanto contribuye el café a los ingresos de la familia? a. Contribuye menos de la cuarta parte b. Contribuye entre la cuarta parte y la mitad c. Contribuye entre la mitad y tres-cuartos d. Contribuye mas de tres-cuartos
57. Qué tan satisfecho esta con la obtención de insumos y servicios de su organización (si es
miembro)
Q Insumos y servicios
Muy satisfecho
Satisfefcho Poco satisfecho
No satisfecho
26a Insumos para la producción
26b Servicios de Extensión (Capacitación técnica)
26c Crédito
26d Compra y venta de café
58. De quien recibió crédito o financiamiento el año pasado?
a. Mi organización de productores

65 | P a g e
b. Un intermediario
c. Un financiera local
d. Otra fuente
59. En cuántos eventos de capacitación ha participado en el ultimo año en los siguientes temas:
Q Tipo de capacitación Si/No
28a Fertilización
28b Control de plagas
28c Poda
28d Manejo de sombra
28e Viveros
28 f Control de la calidad
28 g Conservación de suelos
28 h Manejo Orgánico
28 i Certificación
28 j Costos y retornos de la producción
28 k Tendencia del Mercado
28 l Otros
60. En general cómo ha cambiado su situación económica en el último año?
a. Ha mejorado
b. Se ha mantenido igual
c. A empeorado
61. En general cómo es su situación económica en la actualidad comparada con hace 5 años?
a. Mejor
b. La misma
c. Peor
62. Usted es propietario de alguno de éstas máquinarias?:
a. Despulpadora
b. Tanques de fermentación
c. Patios o cajillas para el secado
d. Descascarillador

66 | P a g e
INSERT Tanzania Kiswahili questionnaire INSERT Indonesia Bahasa Indonesia questionnaire

67 | P a g e
10. Key informant interviews
The research teams can find key individuals to interview. Ideally, the team should try and interview someone from local government, from trade associations and farmer networks, from NGOs active in the area, but critically to traders – both those involved in Fairtrade chains, but also conventional chains. The purpose of the key informant interviews is to understand the factors causing change, to establish the role and impact of Fairtrade in creating change (as compared to or in cooperation with other types of certification, policy processes, development agencies). The interviews provide important contextual information and are also a source of triangulation to increase the trustworthiness of the data. Questions to traders should focus on buying relationships, to unpack similar questions as those asked to the PO managers/leaders and marketing manager about the nature of the buying transactions (e.g. how much trust is there, how much transparency, what are the prices and quantities involved, how do intermediaries relate to buyers further up the chain? etc). Traders One level above the FT POs in the value chain will probably in most cases be an importer or roaster in Europe or US (except perhaps for Indonesia where POs are not directly exporting). We will interview these traders next year with assistance from FLO if necessary in making contacts. For the non-FT POs these will mostly trade through national traders who we could try to interview –they may not be willing and/or interested if they know we are working for FLO, but it is worth trying as their insights will be valuable. The interview would aim to gather data to compare between the functioning of the Fairtrade and non-Fairtrade value chains. Identifying non-certified PO traders will need to be done in-country depending upon which organisations are selected for the study. Local government Useful to interview to understand government perspectives on coffee production, coffee livelihoods and farming systems, the relative wealth/poverty of coffee farmers vis-à-vis the rest of the rural population, and patterns of poverty/wealth in the region within coffee farmers. Perspectives on Fairtrade and other sustainability standards where these are known to the interviewee should be gathered. Challenges and opportunities in the coffee sector, understanding of other factors driving change in the region and the relationships between local government and coffee producer organisations should be explored time allowing. NGOs Similar to local government, NGO interviewees can provide information on the local context of the area in which the selected POs are operating, on patterns of wealth/poverty amongst coffee and non-coffee farming households and zones. Information may also be forthcoming on the types of interventions which they have made in collaboration with coffee POs – which may operate or have operated in parallel to Fairtrade inputs and therefore represent a ‘rival explanation’ of change. Local community Our resources are limited as such as we have not committed to conducting individual interviews with members of POs, nor with community leaders. However if time allows or the opportunity presents itself we should try to do so as this provides another important triangulation of information and sometimes powerful stories of change.
Related Documents


