Research Presentation by Tammy Crawford, PhD Clinical Assistant Professor Sport Management Washington State University

Research Presentation by Tammy Crawford, PhD Clinical Assistant Professor Sport Management Washington State University.
Dec 28, 2015
Welcome message from author
This document is posted to help you gain knowledge. Please leave a comment to let me know what you think about it! Share it to your friends and learn new things together.
Transcript
Research Presentationby
Tammy Crawford, PhDClinical Assistant Professor
Sport ManagementWashington State University

Goals of Higher Education:Undergraduate Student
Success
FULFILL THE INSTITUTIONAL MISSION
•promote education and maturity of the student
•empower graduates to be life-long learners
•empower graduates to contribute to society as engaged citizens

INTERCOLLEGIATE ATHLETIC
PARTICIPATION AND
UNDERGRADUATE STUDENT ENGAGEMENT

ABOUT THE PRESENTER•Current Sport Management Assistant Current Sport Management Assistant ProfessorProfessor 2007 PhD in Higher Ed Administration
•Twelve years - Intercollegiate Coach – Twelve years - Intercollegiate Coach –
Division IDivision I 1990-2002 Head Coach Women’s Rowing 1986-1990 Asst. Coach Women’s Rowing
Transitional periodransitional period from minimal student support servicesfrom minimal student support services
(for both SA and general students) (for both SA and general students) to numerous services to numerous services

TRANSITIONS
• Title IX Legislation: Many women’s club programs elevated to ICA
• NCAA Mandate: promote holistic development – LifeSkills programs evolved
• Satisfactory Progress: Academic support and advising programs evolved

What about Student Athletes?
How college affects students: Findings and insights from twenty-years of research (Pascarella & Terenzini, 2005)
“Not enough is known about the extent to which intercollegiate athletes devote time and energy to activities that are empirically linked to desired outcomes of college” - Umbach, Palmer, Kuh, Hannah, 2006, p.5

The PURPOSE1) To design an instrument and test the
reliability, validity, and usefulness of the Student Athlete College Experience Survey (SACES).
2) To examine the influence of D-IA Intercollegiate participation on student athlete involvement and engagement in the university environmentThat is: What is the SA Experience? Are they experiencing “good” educational practices?
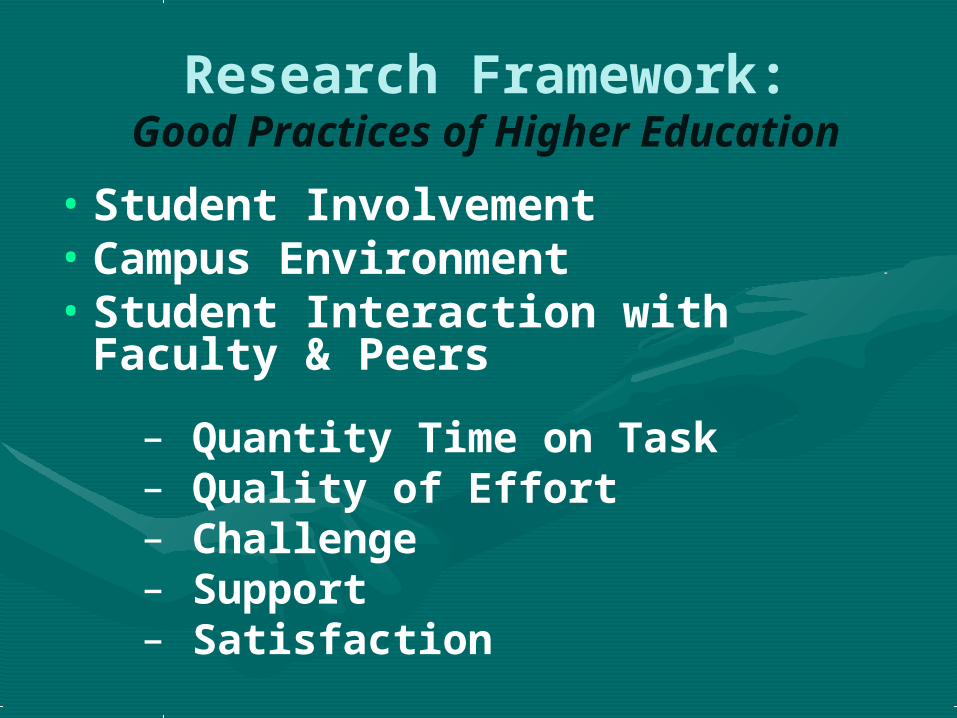
Research Framework:Good Practices of Higher Education
• Student Involvement• Campus Environment• Student Interaction with
Faculty & Peers
– Quantity Time on Task– Quality of Effort– Challenge– Support– Satisfaction

Student Involvement a positive influence on learning and
development Astin (1984)
• students must be actively involved in the college environment
• time on task or extent of involvement• quantity & quality of participation• the educator creates the environment

Campus Environmenta positive influence on learning and
development Kuh (1991); Chickering & Gamson (1991);
Pascarella & Terenzini (1991, 2005)
• many experiences cumulatively lead to development and learning
• what opportunities and resources are made available to the student?

Student Interactiona positive influence on learning and
developmentAstin (1993); Chickering & Reisser (1993); Astin (1993); Chickering & Reisser (1993);
Schroeder (2003)Schroeder (2003)• “The most powerful source of influence on
student learning appears to be interactions with peers, faculty and others” (Schroeder, 2003, p.621). (Schroeder, 2003, p.621).
• Interactions with peers and faculty are specific components of the college environment that influence identity development and learning
• “The student’s peer group is the single most potent source of influence on growth and development during the undergraduate years” (Astin, 1993, p.398)(Astin, 1993, p.398)

Student Engagementin enriching educational
experiences
• The out of class curriculum includes other educationally purposeful activities
- Kuh, Schuh, Whitt, & Assoc. (1995, 1996, 2001, 2005, 2006)- Kuh, Schuh, Whitt, & Assoc. (1995, 1996, 2001, 2005, 2006)
• Student quality, quantity, time on task- Pace (1988), Astin (1984)- Pace (1988), Astin (1984)
• The campus can be shaped: good practices, institutional mission & ethos can be created
- Chickering & Gamson (1987); Pike (2003)- Chickering & Gamson (1987); Pike (2003)
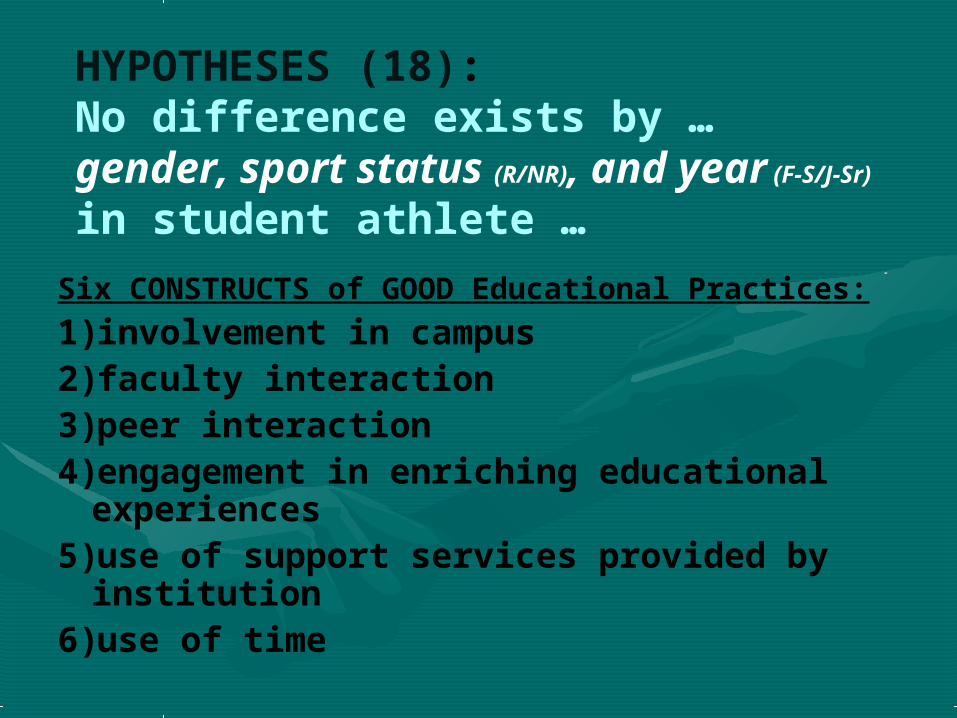
HYPOTHESES (18): No difference exists by …gender, sport status (R/NR), and year
(F-S/J-Sr) in student athlete …Six CONSTRUCTS of GOOD Educational Practices:
1)involvement in campus2)faculty interaction3)peer interaction4)engagement in enriching educational
experiences5)use of support services provided by
institution6)use of time
also Descriptive Research Questions
• SA views on academic experiences• SA views on athletic experiences
- do SA feel challenged?- do SA feel they are provided
support?- are SA satisfied with their
experience?- would SA attend the same
institution again?

Research Methods Instrument Design
NSSE: National Survey of Student Engagement
• Pilot in 1998-99 • Tool for gathering information
about the “good practices” in undergraduate education
• Students are surveyed about their behaviors … that positively correlate with many learning & personal development outcomes of college

My Research Methods Instrument Design-Building
upon NSSE
National Survey of Student Engagement• The selected institution is 1 of 570
universities participating in research about student engagement
• NSSE randomly selects Fr/Sr year students
• NSSE investigates 5 “benchmarks” associated with student behaviors influential in learning and development
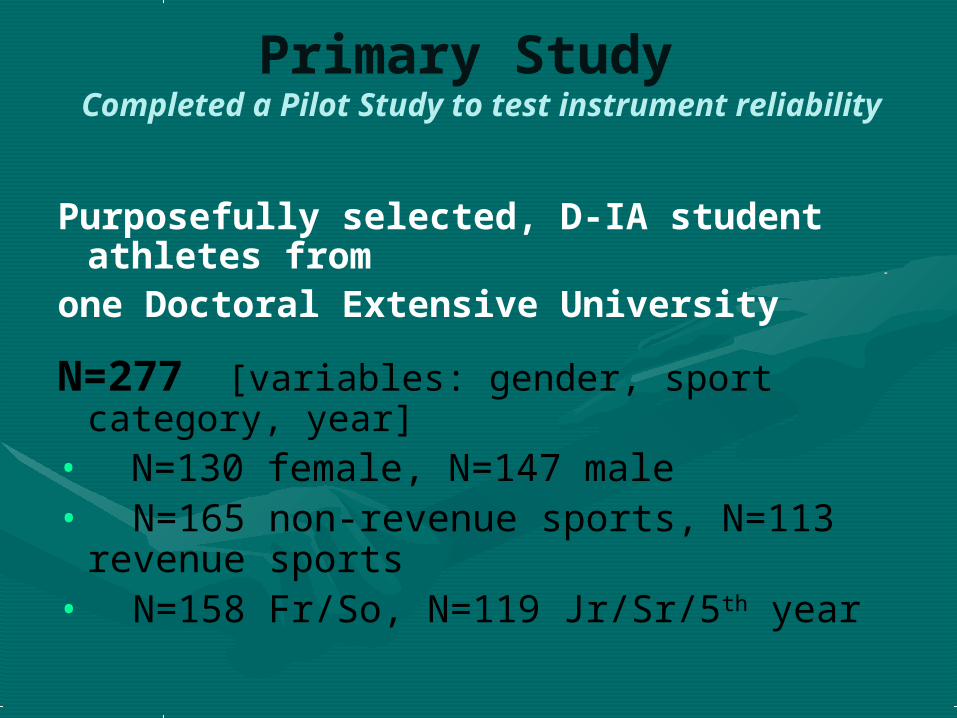
Primary Study Completed a Pilot Study to test instrument
reliability
Purposefully selected, D-IA student athletes from
one Doctoral Extensive University
N=277 [variables: gender, sport category, year]
• N=130 female, N=147 male• N=165 non-revenue sports, N=113
revenue sports• N=158 Fr/So, N=119 Jr/Sr/5th year

Primary Study Methods: Instrument
Student Athlete College Experience Survey
• paper & pencil, 5-point LIKERT scale survey
• instrument used 26 of 82 NSSE questions
• 118 questions were institution-specific; followed the NSSE format

Data Analysis: HypothesesHYPOTHESIS CONSTRUCT VARIABLE ANALYSIS
H1
Campus Involvement
GENDER
YEAR GROUP
SPORTCATEGORY
ANOVAUnivariate
F Test p < .05
MeanSd
Effect SizeHomogeneity
H2
H3
H4 Student-Faculty Interaction
H5
H6
H7
Student-Peer InteractionH8
H9
H10 Engagement in Enriching Educational Experiences
H11
H12
H13 Use of Support Services Provided by the
Institution
H14
H15
H16
Use of TimeH17
H18

Desc1 Challenge
No variables, considered all student
athletes
Mean, Sd
Desc2 SupportDesc3
SatisfactionDesc4
Desc5 Quality of EffortDesc6 SatisfactionDesc7 ChallengeDesc8 SupportDesc9
SatisfactionDesc10
Data Analysis: Descriptive Qs

Involvement in Campus Environment
HH11 Difference exists by GenderDifference exists by Gender
FF(1, 270) = 22.999, (1, 270) = 22.999, pp< .001, partial < .001, partial etaeta22 = .078. = .078.
Female student athletes appear significantly more involved in the university campus environment (M=22.77 + 4.85) compared to male student athletes (M=20.13 + 4.20)
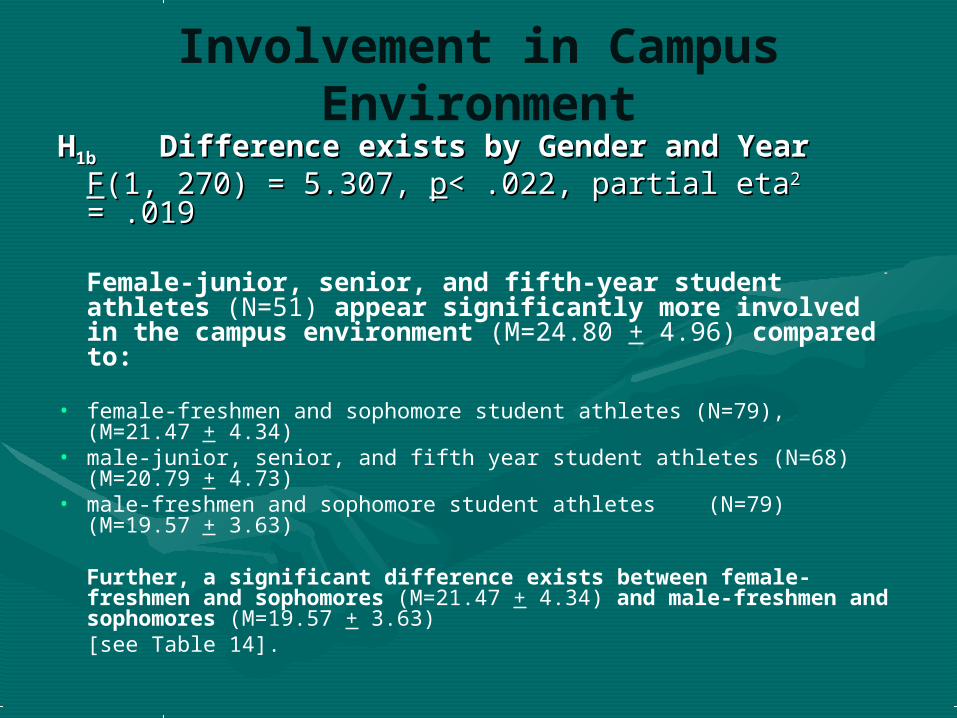
Involvement in Campus Environment
HH1b1b Difference exists by Gender and YearDifference exists by Gender and YearFF(1, 270) = 5.307, (1, 270) = 5.307, pp< .022, partial eta< .022, partial eta22
= .019= .019
Female-junior, senior, and fifth-year student athletes (N=51) appear significantly more involved in the campus environment (M=24.80 + 4.96) compared to:
• female-freshmen and sophomore student athletes (N=79), (M=21.47
+ 4.34)• male-junior, senior, and fifth year student athletes (N=68) (M=20.79
+ 4.73)• male-freshmen and sophomore student athletes (N=79) (M=19.57 +
3.63)
Further, a significant difference exists between female-freshmen and sophomores (M=21.47 + 4.34) and male-freshmen and sophomores (M=19.57 + 3.63)[see Table 14].

Involvement in Campus Environment
HH33 Difference exists by Year GroupDifference exists by Year Group
FF(1, 270) = 19.207, (1, 270) = 19.207, pp< .001, partial eta< .001, partial eta22 = = .066..066.
Junior, senior, and fifth-year student athletes(N=119) (M=22.51 + 5.20) appear significantlymore involved in the campus environment
thanfreshmen and sophomore student athletes
(N=158; M=20.52 =20.52 ++ 4.10) 4.10)
[see Table 15].[see Table 15].
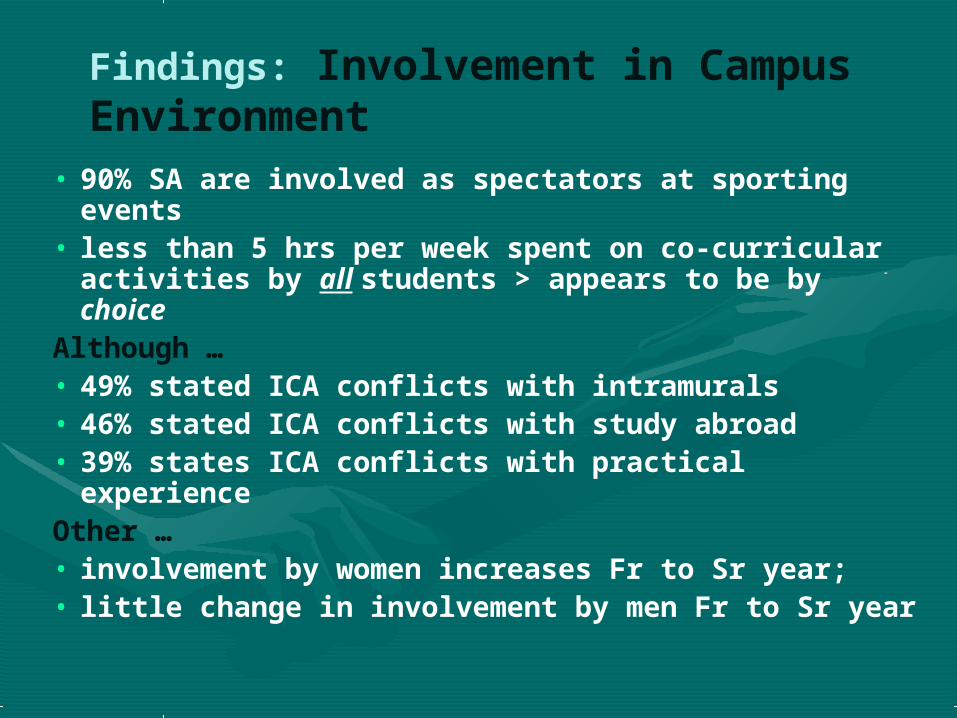
Findings: Involvement in Campus Environment
• 90% SA are involved as spectators at sporting events
• less than 5 hrs per week spent on co-curricular activities by all students > appears to be by choice
Although …• 49% stated ICA conflicts with intramurals• 46% stated ICA conflicts with study abroad• 39% states ICA conflicts with practical
experienceOther …• involvement by women increases Fr to Sr year;• little change in involvement by men Fr to Sr year
Recommendations: Campus Involvement
• Use the Life Skills seminar class– incorporate exploration of
campus offerings into the curriculum
• Practical experience, job-skill knowledge– incorporate practicum hours,
job shadowing, into the curriculum
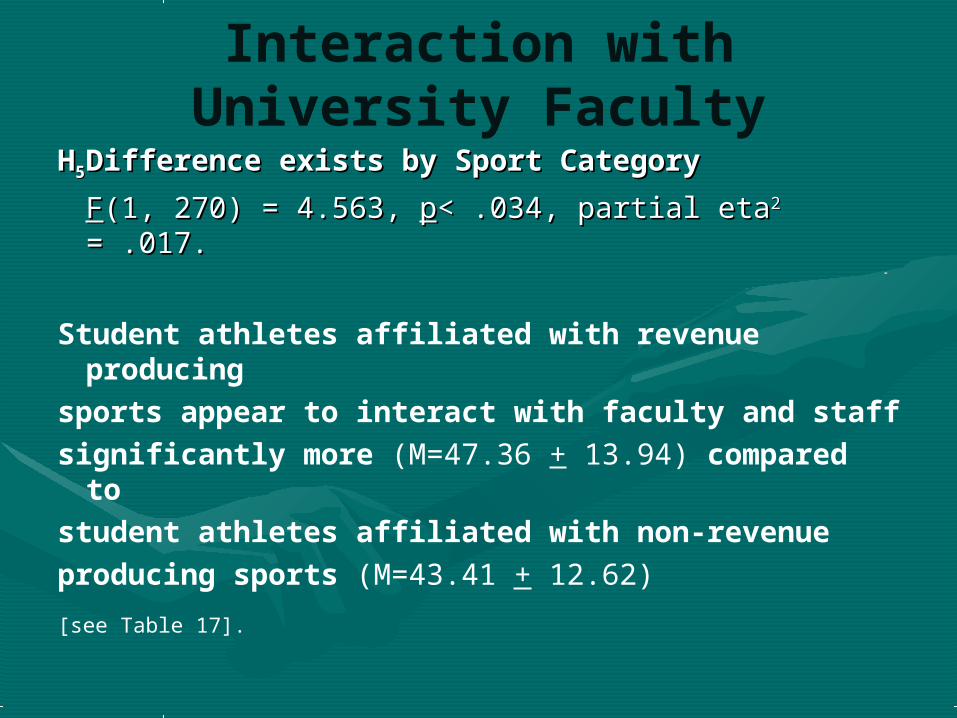
Interaction with University Faculty
HH55 Difference exists by Sport CategoryDifference exists by Sport Category
FF(1, 270) = 4.563, (1, 270) = 4.563, pp< .034, partial eta< .034, partial eta22 = .017.= .017.
Student athletes affiliated with revenue producing
sports appear to interact with faculty and staffsignificantly more (M=47.36 + 13.94) compared
tostudent athletes affiliated with non-revenueproducing sports (M=43.41 + 12.62)
[see Table 17].

Interaction with University Faculty
H6 Difference exists by Year Group
F(1, 270) = 8.272, p< .004, partial eta2 = .030.
Junior, senior, and fifth-year student athletes appear significantly more interactive with university faculty and staff (M=47.42 + 12.87) compared to freshmen and sophomore student athletes (M=43.22 + 13.37)[see Table 22].

Findings: SA Interaction w/Faculty
• While 67% SA state they discuss assignments or grades with instructors
• SA interact with “other” ICA staff more than advisors or instructors
• SA discuss career plans with ICA staff or team coaches more than faculty or advisors on campus
• SA seek personal guidance from ICA staff or coaches more than on-campus faculty or staff
Recommendations: SA–Faculty Interaction
• Greater us of Life Skills activities
– To create confidence in approachability and awareness about faculty that can serve as resources
– Round tables w/faculty: to promote student discussion about majors and academic opportunities
– Faculty dinner– Faculty “assistant coach” for a day

Interaction with Student Peers
HH77 Difference exists by GenderDifference exists by Gender
FF(1, 270) = 10.159, (1, 270) = 10.159, pp< .002, partial < .002, partial etaeta22 = .036. = .036.
Female student athletes appear to interact with student peers to a greater extent (M=18.36 + 3.30) compared to male student athletes (M=16.96 + 3.12)
[see Table 26].[see Table 26].

Findings: SA –Peer Interaction
Gender:• Women SA interact with
teammates much more than male SA
• Women SA interact with SA from other teams much more than male SA
• Male SA interact with non-athletes more than women SA

Findings: SA –Peer Interaction
Peers who have a Positive Influence on College Experience
• 93% SA state teammates have a positive influence; with 43% reporting “very much”
• 75% state non-athletes have a positive influence
• 71% state SA from other teams have a positive influence

Engagement in Enriching Educational Experiences
HH1010 Difference exists by GenderDifference exists by Gender
FF(1, 270) = 26.828, (1, 270) = 26.828, pp< .001, partial < .001, partial eta2 = .090. eta2 = .090.
Female student athletes appear significantly more engaged in Enriching Educational Experiences (M=17.80 + 4.70) compared to male student athletes (M=15.55 + 4.32) [see Table 29]. [see Table 29].

Engagement in Enriching Educational Experiences
HH1212 Difference exists by Year GroupDifference exists by Year Group
FF(1, 270) = 17.406, (1, 270) = 17.406, pp< .001, partial < .001, partial etaeta22 = .061. = .061.
Junior, senior and fifth year student athletes (M=17.66 + 4.75) appear significantly more engaged in Enriching Educational Experiences, than freshman and sophomore student athletes (M=15.81 + 4.39)
[see Table 33].[see Table 33].

Engagement in Enriching Educational Experiences
HH12b12b Difference exists by Gender and Year Difference exists by Gender and Year GroupGroup
FF(1, 270) = 5.668, (1, 270) = 5.668, pp< .018, partial eta< .018, partial eta22 = .021.= .021.
Female-junior, senior, and fifth-year student athletes (M=19.67 + 4.52), appear significantly more engaged in Enriching Educational Experiences than
• Female-freshmen and sophomores SA (M=16.59 + 4.43);
• Male-junior, senior and 5th-year SA (M=16.16 + 4.38),
• Male- freshmen and sophomore SA (M=15.03 + 4.23).
Further, freshman and sophomore female SA(M=16.59 + 4.43) appear more engaged than male-freshman and sophomore SA (M=15.03 + 4.23) [see Table 35]. [see Table 35].

Findings: SA Engagement in Enriching Educational
Experiences• Female SA are more engaged in EEE
than males• Jr/Sr SA more than underclassmen• F/So SA more involved in community
service & volunteer projects than general students
• Jr/Sr SA engaged in on-campus opportunities (80%) more than general students (65%)

SA Use of Support Services On-Campus
HH1414 Difference exists by Sport CategoryDifference exists by Sport Category
FF(1, 270) = (1, 270) = FF=11.718, =11.718, pp<.001, partial eta<.001, partial eta22 = .042.= .042.
SA affiliated with non-revenue producing sports(N=164) appear to use support services located oncampus to a lesser extent (M= 16.71 + 3.43) compared to student athletes affiliated with revenue producing sports (N=113; M= 18.12 + 4.36)
[see Table 37].[see Table 37].

SA Use of Support Services On-Campus
HH1515 Difference exists by Year GroupDifference exists by Year Group
FF(1, 270) = (1, 270) = FF=24.489, =24.489, pp<.001, partial eta<.001, partial eta22 = .083. = .083.
Junior, seniors, and fifth-year student athlete use of
student services located on the main campus appears
higher (M= 18.42 + 3.87) compared to freshmen and
sophomores (M= 16.43 + 3.68) [see Table 39]. [see Table 39].

Findings: Use of On-Campus Services
Study groups, career services, computer labs, multicultural student services • Revenue sport athletes use more Revenue sport athletes use more than non-than non-revenue sport athletesrevenue sport athletes
Library and e-journal access• Non-Revenue SA use more than Non-Revenue SA use more than revenuerevenue

Findings: Time UseRecommended that students spend 25 hrs per
weekpreparing for class
•11% of general students meet this standard [NSSE]
•4% of SA meet this standard
• 64% SA spend over 13 hr/wk attending class• 62% SA spend over 13 hr/wk at required
practice• 20% SA spend over 13 hr/wk preparing for
class
• < 1% SA spend 13 hrs/wk participating in co-curricular activities or working

Findings: Quality of EffortOptions: no time; very low; low; medium; high;
very high
SA Quality of Effort “High” or “Very High”
• Effort put forth in practice 95%• Effort put forth attending class 73%• Effort put forth as spectator
47%• Effort put forth preparing for class
41%

Findings: Challenge v. Support
• SA feel more challenged athletically than academically (Table 48 49% very much vs. 19%)(Table 48 49% very much vs. 19%)
• 90% feel they receive adequate support for both academic and athletic demands
• Those who felt the athletic challenges outweighed the athletic support included women and non-revenue sport athletes

Findings: Satisfaction
• 90% of SA express satisfaction with their educational experience [SA 58% extremely satisfied to NSSE 36%][SA 58% extremely satisfied to NSSE 36%]
• 90% express satisfaction with their athletic experience [72% extremely satisfied][72% extremely satisfied]
• 80% stated they would return to the same institution if given the choice again[90% of NSSE said they would return][90% of NSSE said they would return]

Overall Summary• Student athletes appear to be
having an experience that incorporates the six constructs of Good Educational Practices

Recommendations Use of the Life Skills Program to
inform students about campus opportunities, to get them more interactive with faculty, and to provide more practical knowledge and experience related to career options.
Have teaching faculty involved withadvising and mentoring sooner in student’s academic career

QUESTIONS?QUESTIONS?
Related Documents