research papers 234 Louis J. Farrugia et al. Charge density in Mn 2 (CO) 10 Acta Cryst. (2003). B59, 234–247 Acta Crystallographica Section B Structural Science ISSN 0108-7681 Experimental charge density in the transition metal complex Mn 2 (CO) 10 : a comparative study Louis J. Farrugia, a * Paul R. Mallinson a and Brian Stewart b a Department of Chemistry, University of Glasgow, Glasgow G12 8QQ, Scotland, and b Department of Chemisty and Chemical Engi- neering, University of Paisley, Paisley PA1 2BE, Scotland Correspondence e-mail: [email protected] # 2003 International Union of Crystallography Printed in Great Britain – all rights reserved An accurate experimental charge density study at 100 K of Mn 2 (CO) 10 [bis(pentacarbonylmanganese)(Mn—Mn)] has been undertaken. A comparison with previously reported structural determinations reveals no evidence for significant Mn—Mn bond lengthening between 100 and 296 K. The nature of the metal–metal and metal–ligand atom interactions has been studied by topological analysis using the Atoms in Molecules (AIM) approach of Bader [(1990), Atoms in Molecules: a Quantum Theory.Oxford: Clarendon Press]. An analysis of the density (r), the Laplacian of the density r 2 (r b ) and the total energy densities H(r b ) at the bond critical points is used to classify all the chemical bonds as covalent in nature. The results are compared qualitatively and quantitatively with previous charge density studies on this molecule and DFT calculations at the 6-311+G* B3LYP level. The topological properties of the theoretical and experimental densities are in close agreement. Received 18 October 2002 Accepted 8 January 2003 1. Introduction The nature of metal–metal interactions in low-valent transi- tion metal cluster compounds has been of great interest ever since it was shown (Powell & Ewens, 1939) that the Fe–Fe separation in Fe 2 (CO) 9 was short enough to constitute a metal–metal bond. The 18-electron or Effective Atom Number (EAN) rule, taught in most undergraduate courses, is often used to infer the presence or otherwise of a direct metal– metal interaction. While this rule is satisfactory in rationa- lizing the short metal–metal distances often found in these compounds, the situation is much less clear when bridging ligands are present. A classic example of such a controversy concerns Co 2 (CO) 8 , which was shown by theory (Low et al. , 1991) and experiment (Leung & Coppens, 1983) to have little or no direct Co—Co bonding, despite the diamagnetic nature of the compound and the prediction of a Co—Co bond from the EAN rule and from earlier theoretical studies (Freund & Hohneicher, 1979; Freund et al., 1980). The study of the experimental charge density (Coppens, 1997; Tsirelson & Ozerov, 1996; Coppens, 1998; Koritsanszky & Coppens, 2001) offers the possibility of confirming or otherwise the presence of metal–metal and metal–ligand interactions and providing insight into the nature of these interactions. In the past, such studies have been very demanding, requiring many weeks or even months of data acquisition. However, the advent of diffractometers equipped with CCD area detectors has greatly reduced data collection times and has the potential to make charge density studies much more routine. The suitability of CCD detectors with

Welcome message from author
This document is posted to help you gain knowledge. Please leave a comment to let me know what you think about it! Share it to your friends and learn new things together.
Transcript
research papers
234 Louis J. Farrugia et al. � Charge density in Mn2(CO)10 Acta Cryst. (2003). B59, 234±247
Acta Crystallographica Section B
StructuralScience
ISSN 0108-7681
Experimental charge density in the transition metalcomplex Mn2(CO)10: a comparative study
Louis J. Farrugia,a* Paul R.
Mallinsona and Brian Stewartb
aDepartment of Chemistry, University of
Glasgow, Glasgow G12 8QQ, Scotland, andbDepartment of Chemisty and Chemical Engi-
neering, University of Paisley, Paisley PA1 2BE,
Scotland
Correspondence e-mail: [email protected]
# 2003 International Union of Crystallography
Printed in Great Britain ± all rights reserved
An accurate experimental charge density study at 100 K of
Mn2(CO)10 [bis(pentacarbonylmanganese)(MnÐMn)] has
been undertaken. A comparison with previously reported
structural determinations reveals no evidence for signi®cant
MnÐMn bond lengthening between 100 and 296 K. The
nature of the metal±metal and metal±ligand atom interactions
has been studied by topological analysis using the Atoms in
Molecules (AIM) approach of Bader [(1990), Atoms in
Molecules: a Quantum Theory.Oxford: Clarendon Press]. An
analysis of the density �(r), the Laplacian of the density
r2�(rb) and the total energy densities H(rb) at the bond
critical points is used to classify all the chemical bonds as
covalent in nature. The results are compared qualitatively and
quantitatively with previous charge density studies on this
molecule and DFT calculations at the 6-311+G* B3LYP level.
The topological properties of the theoretical and experimental
densities are in close agreement.
Received 18 October 2002
Accepted 8 January 2003
1. Introduction
The nature of metal±metal interactions in low-valent transi-
tion metal cluster compounds has been of great interest ever
since it was shown (Powell & Ewens, 1939) that the Fe±Fe
separation in Fe2(CO)9 was short enough to constitute a
metal±metal bond. The 18-electron or Effective Atom
Number (EAN) rule, taught in most undergraduate courses, is
often used to infer the presence or otherwise of a direct metal±
metal interaction. While this rule is satisfactory in rationa-
lizing the short metal±metal distances often found in these
compounds, the situation is much less clear when bridging
ligands are present. A classic example of such a controversy
concerns Co2(CO)8, which was shown by theory (Low et al.,
1991) and experiment (Leung & Coppens, 1983) to have little
or no direct CoÐCo bonding, despite the diamagnetic nature
of the compound and the prediction of a CoÐCo bond from
the EAN rule and from earlier theoretical studies (Freund &
Hohneicher, 1979; Freund et al., 1980).
The study of the experimental charge density (Coppens,
1997; Tsirelson & Ozerov, 1996; Coppens, 1998; Koritsanszky
& Coppens, 2001) offers the possibility of con®rming or
otherwise the presence of metal±metal and metal±ligand
interactions and providing insight into the nature of these
interactions. In the past, such studies have been very
demanding, requiring many weeks or even months of data
acquisition. However, the advent of diffractometers equipped
with CCD area detectors has greatly reduced data collection
times and has the potential to make charge density studies
much more routine. The suitability of CCD detectors with
sealed-tube X-ray sources for accurate electron-density
studies has been assessed by a number of authors (Martin &
Pinkerton, 1998; Macchi et al., 1998a; Macchi, Proserpio,
Sironi, Soave & Destro, 1998). The consensus indicates that
the data quality is at least as good as from carefully calibrated
serial diffractometers, but with an enormous speed advantage.
For example, in a recent study on the mineral �-spodumene
(Kuntzinger et al., 1999) the relative merits of the Bruker
SMART and Nonius KappaCCD diffractometers were
compared. It was concluded that both machines gave excellent
quality data suitable for charge density work, although the
experimental errors appeared to be treated differently by the
instrumental software.
Increasingly, the Atoms in Molecules (AIM) approach
(Bader, 1990; Popelier, 2000) is being used in the analysis of
experimental electron density. The method has the great
advantage of avoiding the dif®cult choice of a suitable pro-
molecule and has been adopted in the study of several metal
carbonyl or organometallic compounds (Macchi et al., 1998a,
1999, 2001; Macchi, Proserpio, Sironi, Soave & Destro, 1998;
Scherer et al., 1998; Abramov et al., 1998). An example is the
archetypal molecule Mn2(CO)10 (1), which contains an
unsupported MnÐMn bond. The charge density in (1) was
originally studied by Martin et al. (1982) (hereafter MRM)
using deformation density methodology. Little evidence for
charge build-up between the Mn atoms was found. Subse-
quently, Holladay et al. (1983) undertook a multipole re®ne-
ment using this data and determined the d-orbital populations.
More recently, the charge density in (1) has been re-examined
by Bianchi et al. (2000) (hereafter BGM) using the AIM
approach on newly measured data. A (3,ÿ1) bond critical
point (b.c.p.) in �(r) at the midpoint of the MnÐMn vector
was observed, but with a very low density and with a small
positive value of the Laplacian r2�(rb). This result was in
reasonable agreement with the theoretical values of
MacDougall (1989) and Bo et al. (1993) as regards the density,
but an opposite sign was predicted for the Laplacian. No
critical points corresponding to 1,3 Mn� � �C interactions
between the Mn atom and the carbonyl groups of the other
Mn(CO)5 fragment were found in any of these studies. This is
in contradiction to some earlier theoretical studies (Brown et
al., 1971; Veillard & Rohmer, 1992) which predicted such
interactions. On the basis of the magnitudes �(r) and r2�(rb),
BGM interpreted their results in terms of a metallic bond and
dative bonds for the MnÐMn and MnÐC interactions,
respectively, related to the ionic `closed-shell' interaction, as
de®ned by Bader (1990). On the other hand, Macchi & Sironi
(2003), in a recent review of charge density studies on tran-
sition metal carbonyl compounds, have argued that these
bonds should be considered as covalent.
While several comparative charge density studies on
organic molecules have been undertaken to investigate the
reproducibility of the experimental topology [the best known
being the oxalic acid project (Coppens, 1984; Krijn et al., 1988;
Zobel et al., 1992; Martin & Pinkerton, 1998)], there have been
fewer such studies on transition metal organometallic or
coordination complexes. Charge density analyses on the
orthorhombic (Bianchi et al., 2001a) and triclinic (Bianchi et
al., 2001b) modi®cations of Co2(CO)6(�-CO)(�-C4O2H2)
have been reported. Despite very similar geometries in the
two phases, there was only qualitative agreement between the
values of �(rb) and r2�(rb) at the b.c.p.'s. Bytheway et al.
(2001) have shown the reproducibility of topological para-
meters in the two independent molecules of Cu(glygly)-
(H2O)2�H2O. Comparative studies are particularly important
in view of the well known and recently demonstrated non-
uniqueness of the least-squares method in multipole re®ne-
ment (PeÂreÁs et al., 1999) and limited ¯exibility of the radial
functions of the multipole model (Figgis et al., 1993; Iversen et
al., 1997; Volkov et al., 2001; Volkov & Coppens, 2001). We
herein report our charge density study on Mn2(CO)10 (1),
which was under way when the study by BGM was published.
Acta Cryst. (2003). B59, 234±247 Louis J. Farrugia et al. � Charge density in Mn2(CO)10 235
research papers
Table 1Experimental table.
Chemical formula C10Mn2O10
Compound color Orange±yellowMr 389.98Cell setting, space group Monoclinic, I2/aa, b, c (AÊ ) 14.1257 (2), 6.8799 (1),
14.3121 (3)� (�) 105.078 (1)V (AÊ 3) 1343.01 (4)Z 4Dx (Mg mÿ3) 1.929F(000) 760Radiation type Mo K��(Mo K�) (mmÿ1) 1.930Crystal size (mm) 0.45 � 0.45 � 0.4Transmission coef®cients
(range)0.417±0.636
� range (�) 3.31±50.06Sin �max/� 1.079Temperature (K) 100 (2)No. of data used for
merging179 392
No. of unique data 7052Absorption correction Multi-scan
Tmin 0.417Tmax 0.636
Rint 0.0350R� 0.0123
Spherical atom re®nementNo. of data in re®nement 7052No. of re®ned parameters 101Final R [I > 2�(I)] (all data) 0.0214 (0.0232)
R2w [I > 2�(I)] (all data) 0.0608 (0.0616)
Goodness-of-®t S 1.107Largest features in residual
density map (e AÊ ÿ3)0.619(max) ÿ0.812(min)
0.070(r.m.s.)Max shift/e.s.d. in last cycle 0.001
Multipole re®nementNo. of data in re®nement 6532No. of re®ned parameters 296Final R [I > 3�(I)] (all data) 0.0135 (0.0168)
Rw [I > 3�(I)] 0.0157Goodness-of-®t S 2.161Largest features in residual
density map (e AÊ ÿ3)0.274(max) ÿ0.200(min)
0.044(r.m.s.)Max shift/e.s.d. in last cycle 0.0036
R =P
(|Fo | - |Fc |)/P
(Fo); Rw = {P
[w(Fo ÿ Fc)2]/P
[w(Fo)2]}1/2; R2w = {P
[w(F2o ÿ F2
c )2]/P[w(F2
o )2]}1/2; R� = [�(F2o )]/P
[F2o ]; Rint =
P{n/(n ÿ 1)}1/2|F2
o ÿ F2o (mean)|/
PF2
o (summa-tion is carried out only where more than one symmetry equivalent is averaged).
research papers
236 Louis J. Farrugia et al. � Charge density in Mn2(CO)10 Acta Cryst. (2003). B59, 234±247
The work reported here is based on data measured with a
CCD detector and a laboratory X-ray source, while the
previous studies were based on data collected with a scintil-
lation detector. It serves as a comparative study to ascertain
the reproducibility and reliablity of multipole re®nements on
transition metal compounds.
2. Experimental procedures
2.1. Data collection, processing and spherical atom refine-ment
Compound (1) was obtained from a commercial source. It
was resublimed and allowed to evaporate to give a virtually
spherical crystal. This was sealed inside a 1 mm Lindeman
tube and attached to the tube wall using silicone grease.
Details of data collection and re®nement procedures are given
in Table 1. The crystal sample was cooled from ambient
temperature to 100 K over a period of 1 h, using an Oxford
Instruments Series 7 Cryostream low-temperature device. The
temperature was stable to � 0.2 K and is considered accurate
to �0.5 K. Data were collected on a Nonius KappaCCD
diffractometer, running under COLLECT software (Nonius,
1998). The COLLECT (Nonius, 1998) software calculates a
strategy to optimize the goniometer and detector angular
positions during data acquisition. A total of 4038 image frames
were obtained from 93 oscillation runs, with seven different
sets of exposure times. The exposure times used were 2, 10, 26,
40, 50, 159 and 180 s per image, with �max = 31, 30, 36, 45, 30, 55
and 56�, respectively, totalling 102.8 h of exposure time.
Oscillation angles of 1.7 or 2.0� were used, with the oscillation
axis being either the diffractometer ! or ' axis. Batch scaling
factors for each oscillation run within each of the seven sets
showed no consistent variation over time, indicating no
signi®cant sample decay. The high-angle sets utilized the
longer exposure times to improve the measurement statistics,
while the shorter exposure times were used to accurately
record the intense low-order data, avoiding pixel over¯ow or
integration failure. The scan sets with small � offsets were
measured ®rst in the data collection strategy, in order to
alleviate problems with ice rings which gradually build up
during data collection. The high-angle images showed no
evidence of contamination from ice rings. The unit-cell
dimensions used for re®nement purposes were determined by
post-re®nement of the setting angles of a signi®cant portion of
data set 4 (12 609 re¯ections with 3 < � < 45�) using the
SCALEPACK program (Otwinowski & Minor, 1997). The cell
errors obtained from this least-squares procedure are
undoubtedly serious underestimates (Herbstein, 2000), but
are used here in the absence of better estimates. The cell
determination procedures are not in the public domain, as
they are components of commercial software (Otwinowski &
Minor, 1997), but a study of Paciorek et al. (1999) suggests that
less accurate results are to be expected from oscillation
methods than for standard scintillation counter diffract-
ometers. The accuracy depends critically on the frame widths
and data spanning. In line with these observations, we ®nd that
the unit cells obtained from our seven sets of exposure times
vary by a much higher percentage than the extremely low s.u.'s
would suggest ± the cell volumes range from 1340.1 to
1344.5 AÊ 3. The rationale for choosing the unit cell derived
from data set 4 was that the resolution was reasonably high
(�max = 45�), but not high enough to cause integration software
problems with K�1 ÿ �2 splitting. The unit-cell volume for (1),
determined at 103 K at the SRS Daresbury with � = 0.4901 AÊ
(Farrugia & Mallinson, 2002), was virtually identical to that
reported here. While the literature discussions on unit-cell
measurements tend to focus on precision rather than accuracy
(Herbstein, 2000), we note that accurate rather than precise
unit cells are required for a meaningful comparison between
studies from different laboratories. The current reliance on
commercial `black box' data processing software for unit-cell
determination and frame integration is not entirely satisfac-
tory for accurate studies.
The frame images were integrated using DENZO(SMN)
(Otwinowski & Minor, 1997), with spot elongation for the
high-angle data, in order to (at least partially) account for the
K�1 ÿ �2 splitting, which becomes quite signi®cant at � ' 50�.
In our experience the neighborhood pro®ling used in
DENZO(SMN) appears to cope quite well with this problem.
Graafsma et al. (1997) have also reported the successful use of
DENZO for integrating synchrotron data used in a charge
density study. The resultant raw intensity ®les from
DENZO(SMN) were processed using a locally modi®ed
version of DENZOX (Blessing, 1997a), which calculates
direction cosines for the absorption correction, as well as
applying rejection criteria on the basis of bad �2 of pro®le-®t
and ignoring partial re¯ections at the starting or ®nal frame of
a scan set. A total of 179 392 intensity measurements,
excluding space-group extinctions, were harvested from the
image ®les. A semi-empirical absorption correction (Blessing,
1995) with a theta dependency was applied, to account for the
absorption of the spherical crystal and remove any anisotropy
due to the mounting medium. The resulting data were sorted
and merged using SORTAV (Blessing, 1997b), giving 7052
independent data with a mean redundancy of 25.0 and to a
resolution of sin(�max)/� = 1.0788 (�max = 50� for Mo K�radiation). Four low-angle data are absent, since all
measurements of these re¯ections apparently suffered from
complete or partial truncation by the beamstop. The data were
integrated and processed using the standard space-group
setting of C2/c, but were transformed to I2/a for re®nement
purposes, since this gives a monoclinic � angle much closer to
90�. However, the atomic labeling scheme of BGM was used to
facilitate a direct comparison. A spherical atom re®nement
using SHELXL97 (Sheldrick, 1997) was initially undertaken,
with full-matrix least-squares on F2 and using all the unique
data with the weighting scheme w = [�(Fo)2 + (AP)2 + BP]ÿ1,
where P = [F2o/3 + 2F2
c /3] and A = 0.0288, B = 0.3769. All atoms
were allowed anisotropic thermal motion. An empirical
extinction correction parameter x (Sheldrick, 1997) was
re®ned, which gave a ®nal value of 0.0107 (5). Neutral atom
scattering factors, coef®cients of anomalous dispersion and
absorption coef®cients were as supplied in SHELXL97
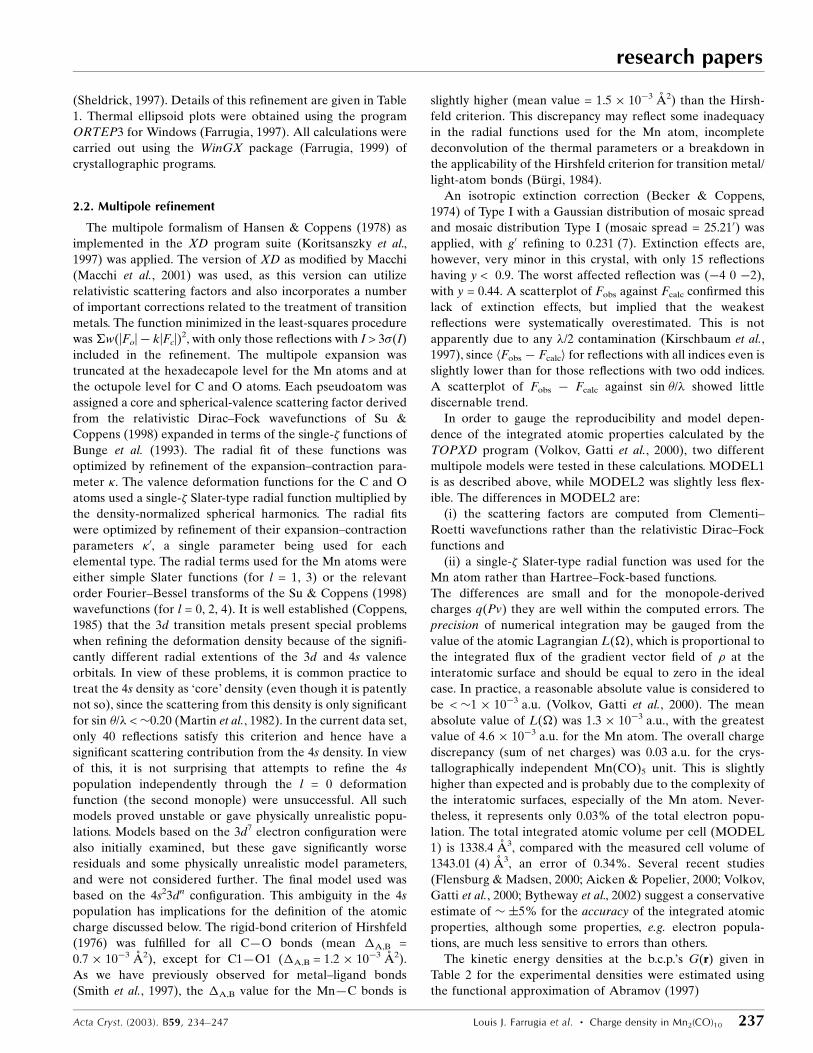
(Sheldrick, 1997). Details of this re®nement are given in Table
1. Thermal ellipsoid plots were obtained using the program
ORTEP3 for Windows (Farrugia, 1997). All calculations were
carried out using the WinGX package (Farrugia, 1999) of
crystallographic programs.
2.2. Multipole refinement
The multipole formalism of Hansen & Coppens (1978) as
implemented in the XD program suite (Koritsanszky et al.,
1997) was applied. The version of XD as modi®ed by Macchi
(Macchi et al., 2001) was used, as this version can utilize
relativistic scattering factors and also incorporates a number
of important corrections related to the treatment of transition
metals. The function minimized in the least-squares procedure
was�w(|Fo| ÿ k|Fc|)2, with only those re¯ections with I > 3�(I)
included in the re®nement. The multipole expansion was
truncated at the hexadecapole level for the Mn atoms and at
the octupole level for C and O atoms. Each pseudoatom was
assigned a core and spherical-valence scattering factor derived
from the relativistic Dirac±Fock wavefunctions of Su &
Coppens (1998) expanded in terms of the single-� functions of
Bunge et al. (1993). The radial ®t of these functions was
optimized by re®nement of the expansion±contraction para-
meter �. The valence deformation functions for the C and O
atoms used a single-� Slater-type radial function multiplied by
the density-normalized spherical harmonics. The radial ®ts
were optimized by re®nement of their expansion±contraction
parameters �0, a single parameter being used for each
elemental type. The radial terms used for the Mn atoms were
either simple Slater functions (for l = 1, 3) or the relevant
order Fourier±Bessel transforms of the Su & Coppens (1998)
wavefunctions (for l = 0, 2, 4). It is well established (Coppens,
1985) that the 3d transition metals present special problems
when re®ning the deformation density because of the signi®-
cantly different radial extentions of the 3d and 4s valence
orbitals. In view of these problems, it is common practice to
treat the 4s density as `core' density (even though it is patently
not so), since the scattering from this density is only signi®cant
for sin �/� < �0.20 (Martin et al., 1982). In the current data set,
only 40 re¯ections satisfy this criterion and hence have a
signi®cant scattering contribution from the 4s density. In view
of this, it is not surprising that attempts to re®ne the 4s
population independently through the l = 0 deformation
function (the second monople) were unsuccessful. All such
models proved unstable or gave physically unrealistic popu-
lations. Models based on the 3d7 electron con®guration were
also initially examined, but these gave signi®cantly worse
residuals and some physically unrealistic model parameters,
and were not considered further. The ®nal model used was
based on the 4s23dn con®guration. This ambiguity in the 4s
population has implications for the de®nition of the atomic
charge discussed below. The rigid-bond criterion of Hirshfeld
(1976) was ful®lled for all CÐO bonds (mean �A,B =
0.7 � 10ÿ3 AÊ 2), except for C1ÐO1 (�A,B = 1.2 � 10ÿ3 AÊ 2).
As we have previously observed for metal±ligand bonds
(Smith et al., 1997), the �A,B value for the MnÐC bonds is
slightly higher (mean value = 1.5 � 10ÿ3 AÊ 2) than the Hirsh-
feld criterion. This discrepancy may re¯ect some inadequacy
in the radial functions used for the Mn atom, incomplete
deconvolution of the thermal parameters or a breakdown in
the applicability of the Hirshfeld criterion for transition metal/
light-atom bonds (BuÈ rgi, 1984).
An isotropic extinction correction (Becker & Coppens,
1974) of Type I with a Gaussian distribution of mosaic spread
and mosaic distribution Type I (mosaic spread = 25.210) was
applied, with g0 re®ning to 0.231 (7). Extinction effects are,
however, very minor in this crystal, with only 15 re¯ections
having y < 0.9. The worst affected re¯ection was (ÿ4 0 ÿ2),
with y = 0.44. A scatterplot of Fobs against Fcalc con®rmed this
lack of extinction effects, but implied that the weakest
re¯ections were systematically overestimated. This is not
apparently due to any �/2 contamination (Kirschbaum et al.,
1997), since hFobs ÿ Fcalci for re¯ections with all indices even is
slightly lower than for those re¯ections with two odd indices.
A scatterplot of Fobs ÿ Fcalc against sin �/� showed little
discernable trend.
In order to gauge the reproducibility and model depen-
dence of the integrated atomic properties calculated by the
TOPXD program (Volkov, Gatti et al., 2000), two different
multipole models were tested in these calculations. MODEL1
is as described above, while MODEL2 was slightly less ¯ex-
ible. The differences in MODEL2 are:
(i) the scattering factors are computed from Clementi±
Roetti wavefunctions rather than the relativistic Dirac±Fock
functions and
(ii) a single-� Slater-type radial function was used for the
Mn atom rather than Hartree±Fock-based functions.
The differences are small and for the monopole-derived
charges q(Pv) they are well within the computed errors. The
precision of numerical integration may be gauged from the
value of the atomic Lagrangian L(), which is proportional to
the integrated ¯ux of the gradient vector ®eld of � at the
interatomic surface and should be equal to zero in the ideal
case. In practice, a reasonable absolute value is considered to
be < �1 � 10ÿ3 a.u. (Volkov, Gatti et al., 2000). The mean
absolute value of L() was 1.3 � 10ÿ3 a.u., with the greatest
value of 4.6 � 10ÿ3 a.u. for the Mn atom. The overall charge
discrepancy (sum of net charges) was 0.03 a.u. for the crys-
tallographically independent Mn(CO)5 unit. This is slightly
higher than expected and is probably due to the complexity of
the interatomic surfaces, especially of the Mn atom. Never-
theless, it represents only 0.03% of the total electron popu-
lation. The total integrated atomic volume per cell (MODEL
1) is 1338.4 AÊ 3, compared with the measured cell volume of
1343.01 (4) AÊ 3, an error of 0.34%. Several recent studies
(Flensburg & Madsen, 2000; Aicken & Popelier, 2000; Volkov,
Gatti et al., 2000; Bytheway et al., 2002) suggest a conservative
estimate of � �5% for the accuracy of the integrated atomic
properties, although some properties, e.g. electron popula-
tions, are much less sensitive to errors than others.
The kinetic energy densities at the b.c.p.'s G(r) given in
Table 2 for the experimental densities were estimated using
the functional approximation of Abramov (1997)
Acta Cryst. (2003). B59, 234±247 Louis J. Farrugia et al. � Charge density in Mn2(CO)10 237
research papers
research papers
238 Louis J. Farrugia et al. � Charge density in Mn2(CO)10 Acta Cryst. (2003). B59, 234±247
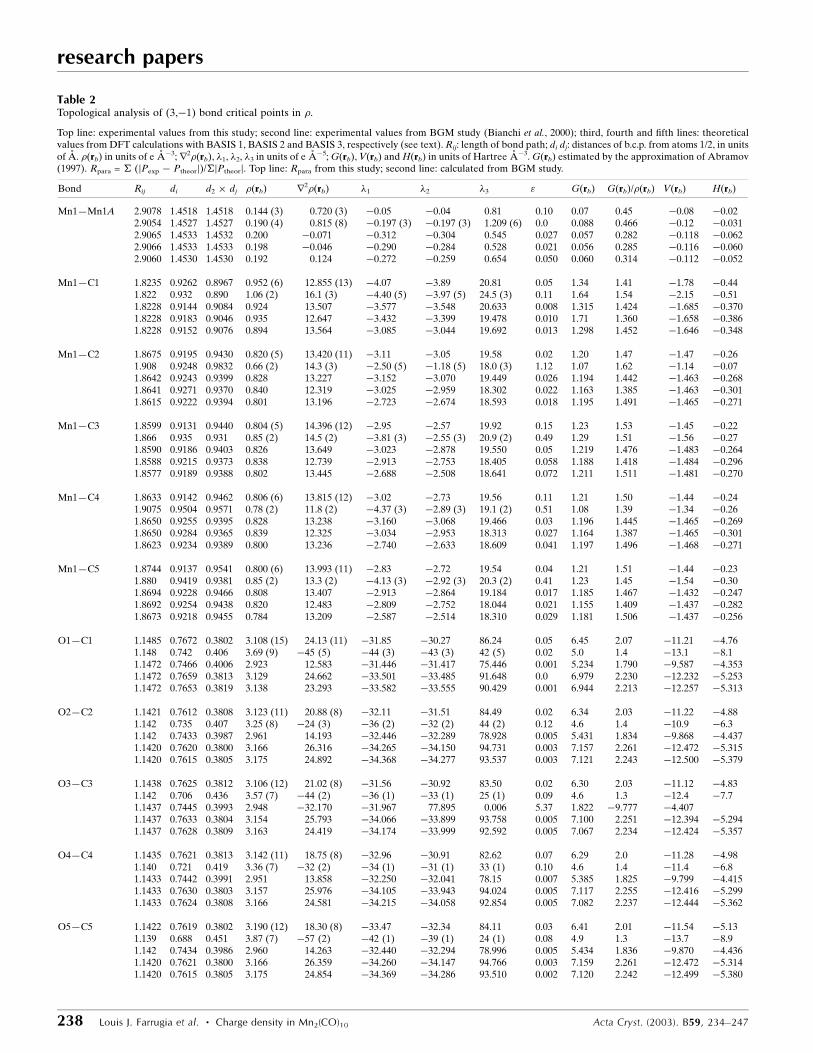
Table 2Topological analysis of (3,ÿ1) bond critical points in �.
Top line: experimental values from this study; second line: experimental values from BGM study (Bianchi et al., 2000); third, fourth and ®fth lines: theoreticalvalues from DFT calculations with BASIS 1, BASIS 2 and BASIS 3, respectively (see text). Rij: length of bond path; di dj: distances of b.c.p. from atoms 1/2, in unitsof AÊ . �(rb) in units of e AÊ ÿ3; r2�(rb), �1, �2, �3 in units of e AÊ ÿ5; G(rb), V(rb) and H(rb) in units of Hartree AÊ ÿ3. G(rb) estimated by the approximation of Abramov(1997). Rpara = � (jPexp ÿ Ptheorj)/�jPtheorj. Top line: Rpara from this study; second line: calculated from BGM study.
Bond Rij di d2 � dj �(rb) r2�(rb) �1 �2 �3 " G(rb) G(rb)/�(rb) V(rb) H(rb)
Mn1ÐMn1A 2.9078 1.4518 1.4518 0.144 (3) 0.720 (3) ÿ0.05 ÿ0.04 0.81 0.10 0.07 0.45 ÿ0.08 ÿ0.022.9054 1.4527 1.4527 0.190 (4) 0.815 (8) ÿ0.197 (3) ÿ0.197 (3) 1.209 (6) 0.0 0.088 0.466 ÿ0.12 ÿ0.0312.9065 1.4533 1.4532 0.200 ÿ0.071 ÿ0.312 ÿ0.304 0.545 0.027 0.057 0.282 ÿ0.118 ÿ0.0622.9066 1.4533 1.4533 0.198 ÿ0.046 ÿ0.290 ÿ0.284 0.528 0.021 0.056 0.285 ÿ0.116 ÿ0.0602.9060 1.4530 1.4530 0.192 0.124 ÿ0.272 ÿ0.259 0.654 0.050 0.060 0.314 ÿ0.112 ÿ0.052
Mn1ÐC1 1.8235 0.9262 0.8967 0.952 (6) 12.855 (13) ÿ4.07 ÿ3.89 20.81 0.05 1.34 1.41 ÿ1.78 ÿ0.441.822 0.932 0.890 1.06 (2) 16.1 (3) ÿ4.40 (5) ÿ3.97 (5) 24.5 (3) 0.11 1.64 1.54 ÿ2.15 ÿ0.511.8228 0.9144 0.9084 0.924 13.507 ÿ3.577 ÿ3.548 20.633 0.008 1.315 1.424 ÿ1.685 ÿ0.3701.8228 0.9183 0.9046 0.935 12.647 ÿ3.432 ÿ3.399 19.478 0.010 1.71 1.360 ÿ1.658 ÿ0.3861.8228 0.9152 0.9076 0.894 13.564 ÿ3.085 ÿ3.044 19.692 0.013 1.298 1.452 ÿ1.646 ÿ0.348
Mn1ÐC2 1.8675 0.9195 0.9430 0.820 (5) 13.420 (11) ÿ3.11 ÿ3.05 19.58 0.02 1.20 1.47 ÿ1.47 ÿ0.261.908 0.9248 0.9832 0.66 (2) 14.3 (3) ÿ2.50 (5) ÿ1.18 (5) 18.0 (3) 1.12 1.07 1.62 ÿ1.14 ÿ0.071.8642 0.9243 0.9399 0.828 13.227 ÿ3.152 ÿ3.070 19.449 0.026 1.194 1.442 ÿ1.463 ÿ0.2681.8641 0.9271 0.9370 0.840 12.319 ÿ3.025 ÿ2.959 18.302 0.022 1.163 1.385 ÿ1.463 ÿ0.3011.8615 0.9222 0.9394 0.801 13.196 ÿ2.723 ÿ2.674 18.593 0.018 1.195 1.491 ÿ1.465 ÿ0.271
Mn1ÐC3 1.8599 0.9131 0.9440 0.804 (5) 14.396 (12) ÿ2.95 ÿ2.57 19.92 0.15 1.23 1.53 ÿ1.45 ÿ0.221.866 0.935 0.931 0.85 (2) 14.5 (2) ÿ3.81 (3) ÿ2.55 (3) 20.9 (2) 0.49 1.29 1.51 ÿ1.56 ÿ0.271.8590 0.9186 0.9403 0.826 13.649 ÿ3.023 ÿ2.878 19.550 0.05 1.219 1.476 ÿ1.483 ÿ0.2641.8588 0.9215 0.9373 0.838 12.739 ÿ2.913 ÿ2.753 18.405 0.058 1.188 1.418 ÿ1.484 ÿ0.2961.8577 0.9189 0.9388 0.802 13.445 ÿ2.688 ÿ2.508 18.641 0.072 1.211 1.511 ÿ1.481 ÿ0.270
Mn1ÐC4 1.8633 0.9142 0.9462 0.806 (6) 13.815 (12) ÿ3.02 ÿ2.73 19.56 0.11 1.21 1.50 ÿ1.44 ÿ0.241.9075 0.9504 0.9571 0.78 (2) 11.8 (2) ÿ4.37 (3) ÿ2.89 (3) 19.1 (2) 0.51 1.08 1.39 ÿ1.34 ÿ0.261.8650 0.9255 0.9395 0.828 13.238 ÿ3.160 ÿ3.068 19.466 0.03 1.196 1.445 ÿ1.465 ÿ0.2691.8650 0.9284 0.9365 0.839 12.325 ÿ3.034 ÿ2.953 18.313 0.027 1.164 1.387 ÿ1.465 ÿ0.3011.8623 0.9234 0.9389 0.800 13.236 ÿ2.740 ÿ2.633 18.609 0.041 1.197 1.496 ÿ1.468 ÿ0.271
Mn1ÐC5 1.8744 0.9137 0.9541 0.800 (6) 13.993 (11) ÿ2.83 ÿ2.72 19.54 0.04 1.21 1.51 ÿ1.44 ÿ0.231.880 0.9419 0.9381 0.85 (2) 13.3 (2) ÿ4.13 (3) ÿ2.92 (3) 20.3 (2) 0.41 1.23 1.45 ÿ1.54 ÿ0.301.8694 0.9228 0.9466 0.808 13.407 ÿ2.913 ÿ2.864 19.184 0.017 1.185 1.467 ÿ1.432 ÿ0.2471.8692 0.9254 0.9438 0.820 12.483 ÿ2.809 ÿ2.752 18.044 0.021 1.155 1.409 ÿ1.437 ÿ0.2821.8673 0.9218 0.9455 0.784 13.209 ÿ2.587 ÿ2.514 18.310 0.029 1.181 1.506 ÿ1.437 ÿ0.256
O1ÐC1 1.1485 0.7672 0.3802 3.108 (15) 24.13 (11) ÿ31.85 ÿ30.27 86.24 0.05 6.45 2.07 ÿ11.21 ÿ4.761.148 0.742 0.406 3.69 (9) ÿ45 (5) ÿ44 (3) ÿ43 (3) 42 (5) 0.02 5.0 1.4 ÿ13.1 ÿ8.11.1472 0.7466 0.4006 2.923 12.583 ÿ31.446 ÿ31.417 75.446 0.001 5.234 1.790 ÿ9.587 ÿ4.3531.1472 0.7659 0.3813 3.129 24.662 ÿ33.501 ÿ33.485 91.648 0.0 6.979 2.230 ÿ12.232 ÿ5.2531.1472 0.7653 0.3819 3.138 23.293 ÿ33.582 ÿ33.555 90.429 0.001 6.944 2.213 ÿ12.257 ÿ5.313
O2ÐC2 1.1421 0.7612 0.3808 3.123 (11) 20.88 (8) ÿ32.11 ÿ31.51 84.49 0.02 6.34 2.03 ÿ11.22 ÿ4.881.142 0.735 0.407 3.25 (8) ÿ24 (3) ÿ36 (2) ÿ32 (2) 44 (2) 0.12 4.6 1.4 ÿ10.9 ÿ6.31.142 0.7433 0.3987 2.961 14.193 ÿ32.446 ÿ32.289 78.928 0.005 5.431 1.834 ÿ9.868 ÿ4.4371.1420 0.7620 0.3800 3.166 26.316 ÿ34.265 ÿ34.150 94.731 0.003 7.157 2.261 ÿ12.472 ÿ5.3151.1420 0.7615 0.3805 3.175 24.892 ÿ34.368 ÿ34.277 93.537 0.003 7.121 2.243 ÿ12.500 ÿ5.379
O3ÐC3 1.1438 0.7625 0.3812 3.106 (12) 21.02 (8) ÿ31.56 ÿ30.92 83.50 0.02 6.30 2.03 ÿ11.12 ÿ4.831.142 0.706 0.436 3.57 (7) ÿ44 (2) ÿ36 (1) ÿ33 (1) 25 (1) 0.09 4.6 1.3 ÿ12.4 ÿ7.71.1437 0.7445 0.3993 2.948 ÿ32.170 ÿ31.967 77.895 0.006 5.37 1.822 ÿ9.777 ÿ4.4071.1437 0.7633 0.3804 3.154 25.793 ÿ34.066 ÿ33.899 93.758 0.005 7.100 2.251 ÿ12.394 ÿ5.2941.1437 0.7628 0.3809 3.163 24.419 ÿ34.174 ÿ33.999 92.592 0.005 7.067 2.234 ÿ12.424 ÿ5.357
O4ÐC4 1.1435 0.7621 0.3813 3.142 (11) 18.75 (8) ÿ32.96 ÿ30.91 82.62 0.07 6.29 2.0 ÿ11.28 ÿ4.981.140 0.721 0.419 3.36 (7) ÿ32 (2) ÿ34 (1) ÿ31 (1) 33 (1) 0.10 4.6 1.4 ÿ11.4 ÿ6.81.1433 0.7442 0.3991 2.951 13.858 ÿ32.250 ÿ32.041 78.15 0.007 5.385 1.825 ÿ9.799 ÿ4.4151.1433 0.7630 0.3803 3.157 25.976 ÿ34.105 ÿ33.943 94.024 0.005 7.117 2.255 ÿ12.416 ÿ5.2991.1433 0.7624 0.3808 3.166 24.581 ÿ34.215 ÿ34.058 92.854 0.005 7.082 2.237 ÿ12.444 ÿ5.362
O5ÐC5 1.1422 0.7619 0.3802 3.190 (12) 18.30 (8) ÿ33.47 ÿ32.34 84.11 0.03 6.41 2.01 ÿ11.54 ÿ5.131.139 0.688 0.451 3.87 (7) ÿ57 (2) ÿ42 (1) ÿ39 (1) 24 (1) 0.08 4.9 1.3 ÿ13.7 ÿ8.91.142 0.7434 0.3986 2.960 14.263 ÿ32.440 ÿ32.294 78.996 0.005 5.434 1.836 ÿ9.870 ÿ4.4361.1420 0.7621 0.3800 3.166 26.359 ÿ34.260 ÿ34.147 94.766 0.003 7.159 2.261 ÿ12.472 ÿ5.3141.1420 0.7615 0.3805 3.175 24.854 ÿ34.369 ÿ34.286 93.510 0.002 7.120 2.242 ÿ12.499 ÿ5.380
G�r� � �3=10��3�2�2=3��r�5=3 � �1=6�r2��r�;while the corresponding potential energy densities at the
b.c.p.'s V(r) were obtained from the local virial relationship
(expressed in a.u.), as shown by Bader (1990)
V�r� � �1=4�r2��r� ÿ 2G�r�:The above approximation for G(r) holds well for closed-shell
interactions, where r2�(r) > 0 (Abramov, 1997), and is a good
approximation for all the covalent bonds in (1) (see x2.3).
2.3. Theoretical calculations
SCF (self-consistent ®eld) calculations used the DFT option
of the GAMESS-UK program suite (Guest et al., 2002).
Wavefunction ®les suitable for direct reading by AIMPAC and
other analysis programs were obtained using the `save aimpac'
option. The topological properties were examined with a
minimal basis 3±21 G (BASIS 1), a more extensive basis using
Alrichs pVDZ parameterization for Mn (BASIS 2) (Schafer et
al., 1992) and a basis set employing diffuse functions with
Wachters parameterization for Mn (BASIS 3). The B3LYP
function (Becke, 1993) was used throughout. The BASIS 3
calculations used a 6-31 + G* basis for C and O and the
Wachters basis with additional f polarization functions for Mn
(Wachters, 1969, 1970). F exponents were obtained from
Bauschlicher et al. (1989). Two additional s- and p-type diffuse
functions were added for Mn with the exponents obtained by
logarithmic extrapolation of the Wachters s and p functions.
Wachters and Ahlrichs basis sets were obtained from the
Extensible Computational Chemistry Environment Basis Set
Database, Version 7/30/02, as developed and distributed by
the Molecular Science Computing Facility, Environmental and
Molecular Sciences Laboratory.
Single-point calculations at the experimental C2 geometry
of the isolated molecule were performed, with no geometry
optimization. Preliminary calculations using the BGM C2
experimental geometry were also undertaken, but gave very
similar results and are not reported further. Atomic properties
were obtained from the theoretical densities using a locally
modi®ed version of the AIMPAC programs (Biegler-KoÈ nig et
al., 1982), AIM2000 (Biegler-KoÈ nig, 2000) or the MORPHY98
program (Popelier, 1998). The integrated charges q() and
topological properties at the bond critical points are given in
Tables 2 and 3, respectively; other properties are deposited as
supplementary material.1 We ®nd only a minor dependency of
q() on the basis set, in line with the observations of
Cioslowski et al. (1990). Critical points in the Laplacian
function, L(r) � ÿr2�(r), in the i-VSCC of the Mn atom were
searched using the BUBBLE algorithm (Krug & Bader, 1990),
for both the theoretical and experimental densities. One of the
12 (3,ÿ1) saddle c.p.'s in the experimental density could not be
found automatically in this way and was obtained from its
approximated position.
3. Results and discussion
3.1. Description of the structure
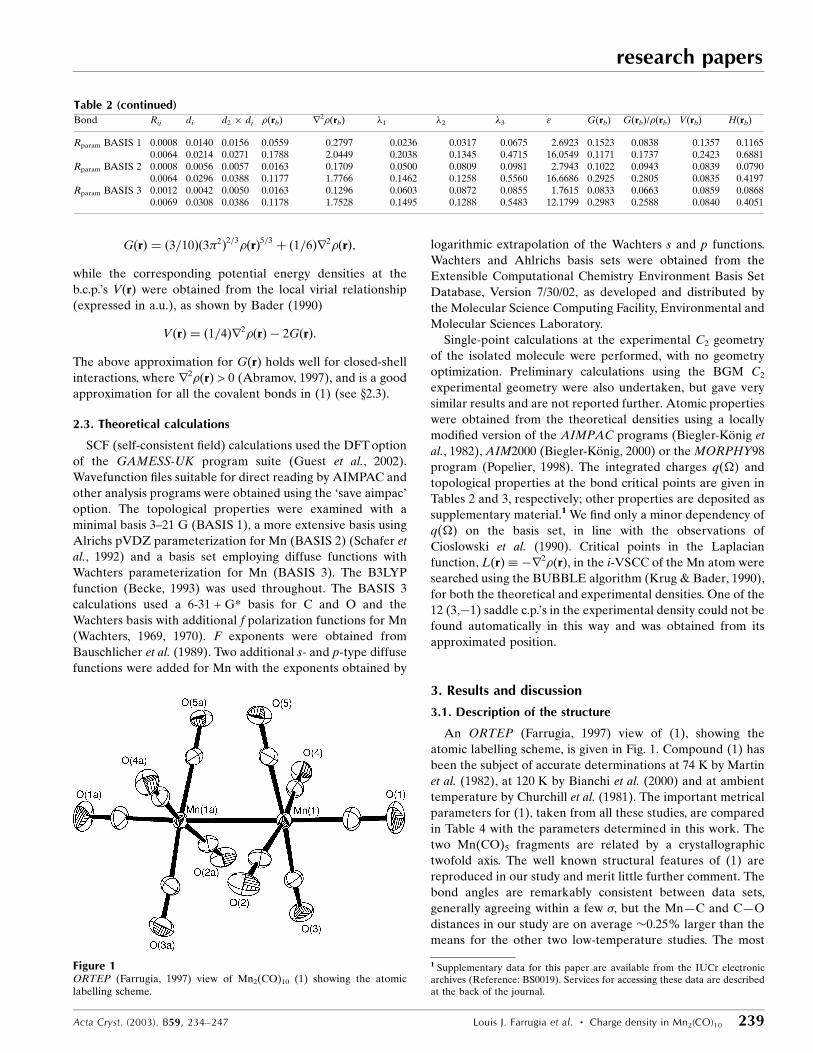
An ORTEP (Farrugia, 1997) view of (1), showing the
atomic labelling scheme, is given in Fig. 1. Compound (1) has
been the subject of accurate determinations at 74 K by Martin
et al. (1982), at 120 K by Bianchi et al. (2000) and at ambient
temperature by Churchill et al. (1981). The important metrical
parameters for (1), taken from all these studies, are compared
in Table 4 with the parameters determined in this work. The
two Mn(CO)5 fragments are related by a crystallographic
twofold axis. The well known structural features of (1) are
reproduced in our study and merit little further comment. The
bond angles are remarkably consistent between data sets,
generally agreeing within a few �, but the MnÐC and CÐO
distances in our study are on average �0.25% larger than the
means for the other two low-temperature studies. The most
Acta Cryst. (2003). B59, 234±247 Louis J. Farrugia et al. � Charge density in Mn2(CO)10 239
research papers
Figure 1ORTEP (Farrugia, 1997) view of Mn2(CO)10 (1) showing the atomiclabelling scheme.
Table 2 (continued)Bond Rij di d2 � dj �(rb) r2�(rb) �1 �2 �3 " G(rb) G(rb)/�(rb) V(rb) H(rb)
Rparam BASIS 1 0.0008 0.0140 0.0156 0.0559 0.2797 0.0236 0.0317 0.0675 2.6923 0.1523 0.0838 0.1357 0.11650.0064 0.0214 0.0271 0.1788 2.0449 0.2038 0.1345 0.4715 16.0549 0.1171 0.1737 0.2423 0.6881
Rparam BASIS 2 0.0008 0.0056 0.0057 0.0163 0.1709 0.0500 0.0809 0.0981 2.7943 0.1022 0.0943 0.0839 0.07900.0064 0.0296 0.0388 0.1177 1.7766 0.1462 0.1258 0.5560 16.6686 0.2925 0.2805 0.0835 0.4197
Rparam BASIS 3 0.0012 0.0042 0.0050 0.0163 0.1296 0.0603 0.0872 0.0855 1.7615 0.0833 0.0663 0.0859 0.08680.0069 0.0308 0.0386 0.1178 1.7528 0.1495 0.1288 0.5483 12.1799 0.2983 0.2588 0.0840 0.4051
1 Supplementary data for this paper are available from the IUCr electronicarchives (Reference: BS0019). Services for accessing these data are describedat the back of the journal.
research papers
240 Louis J. Farrugia et al. � Charge density in Mn2(CO)10 Acta Cryst. (2003). B59, 234±247
likely reason is a small isotropic discrepancy in the unit-cell
dimensions. A signi®cant temperature dependence of the
MnÐMn bond length has been previously noted (Martin et al.,
1982), with the reduction at low temperatures being attributed
(Martin et al., 1982; Veillard & Rohmer, 1992) to the
compressibility of the bond and depopulation of excited
vibrational states. However, as Table 4 shows, the situation is
less clear with the new data. While our value lies between
those reported at 74 and 120 K, it is much closer to the latter.
Moreover, the value at 296 K is less than that at 120 K and we
conclude that there is little evidence for a signi®cant bond
lengthening between 100 and 296 K.
In all the studies the shortest MnÐC bond is Mn1ÐC1 and
the longest CÐO bond is C1ÐO1. These distances have been
suggested as evidence (Churchill et al., 1981) of greater �back-donation from the Mn atom to the axial carbonyl ligand
CO(1) than to either of the mutually trans pairs of equatorial
CO ligands. As previously observed, the Mn(CO)5 fragments
show small deviations from idealized square-pyramidal C4v
symmetry. Thus, the CÐMnÐC angles for both the mutually
trans pairs of equatorial carbonyls deviate signi®cantly from
linearity, bending towards the symmetry-related Mn1A center.
There is an inverse relationship between the deviations from
linearity of the equatorial MnÐCÐO angles and the 1,3
Mn� � �C contact distances. Thus, the MÐCÐO angle which is
closest to linearity, Mn1ÐC2ÐO2 178.96 (9)�, is associated
with the shortest such contact Mn1A� � �C2 3.2579 (3) AÊ , while
the least linear carbonyl Mn1ÐC3ÐO3 175.99 (3)� is asso-
ciated with the longest contact Mn1A� � �C3 3.4595 (3) AÊ . This
observation suggests that these small deviations from linearity
are not due to 1,3 semi-bridging interactions, a conclusion also
borne out by the topology of the electron density (see below),
where no 1,3 Mn� � �C interactions are indicated.
3.2. Thermal motion analysis
The anisotropic displacement parameters (a.d.p.'s) obtained
from a multipole re®nement are, to a large extent, free from
contamination from bonding density effects and thus should
provide a more genuine estimation of the thermal motion of
the corresponding atoms. In the best instances (Iversen et al.,
1996) they are very close to the neutron diffraction values. The
thermal motion in (1) was analysed using the TLS formalism
Table 3Atomic charges (a.u.).
a This study, experimental density using MODEL 1 re®nement; b this study, experimental density using MODEL 2 re®nement; c this study, theoretical DFT density6-311G*(C,O) pVDZ-Ahlrichs(Mn); d from integration using intersecting spheres, taken from Martin et al. (1982); e from � re®nement, taken from Martin et al.(1982); f taken from Bianchi et al. (2000).
Atom q(Pv)a q(Pv) b q()a q()b q()c MRMd MRMe q(Pv)f
Mn1 0.68 (4) 0.74 (4) 1.164 1.084 0.913 ÿ0.16 0.92 ÿ0.2 (3)O1 0.08 (4) 0.06 (4) ÿ1.186 ÿ1.159 ÿ1.195 0.05 0.02 (5) 0.16 (5)O2 0.11 (3) 0.08 (3) ÿ1.164 ÿ1.183 ÿ1.198 ÿ0.09 ÿ0.55 (4) 0.13 (3)O3 0.04 (3) 0.01 (4) ÿ1.220 ÿ1.240 ÿ1.190 ÿ0.01 ÿ0.46 (4) 0.12 (4)O4 0.07 (3) 0.03 (3) ÿ1.211 ÿ1.232 ÿ1.193 ÿ0.05 ÿ0.51 (4) 0.15 (3)O5 0.13 (3) 0.08 (3) ÿ1.167 ÿ1.188 ÿ1.195 0.02 ÿ0.40 (4) 0.23 (3)C1 ÿ0.21 (4) ÿ0.16 (4) 0.991 0.941 1.004 0.01 ÿ0.35 (6) ÿ0.11 (5)C2 ÿ0.18 (4) ÿ0.16 (4) 0.994 1.017 1.007 0.04 0.01 (4) 0.09 (4)C3 ÿ0.26 (4) ÿ0.24 (4) 0.915 0.928 1.013 0.06 ÿ0.06 (5) ÿ0.26 (5)C4 ÿ0.21 (4) ÿ0.19 (4) 0.976 1.049 1.006 0.06 0.10 (4) ÿ0.14 (4)C5 ÿ0.27 (4) ÿ0.24 (4) 0.937 1.013 1.015 0.05 ÿ0.08 (5) ÿ0.16 (4)
Max |L()| ± ± 2.6 � 10ÿ3 4.6 � 10ÿ3 9.2 � 10ÿ3 ± ± ±Error in L()² ± ± 1.3 � 10ÿ3 1.7 � 10ÿ3 3.9 � 10ÿ3 ± ± ±�q 0.00 ÿ0.01 0.030 0.031 ÿ0.013 ÿ0.02 ÿ1.36 0.01
² See Flensburg & Maslen (2000) for de®nition.
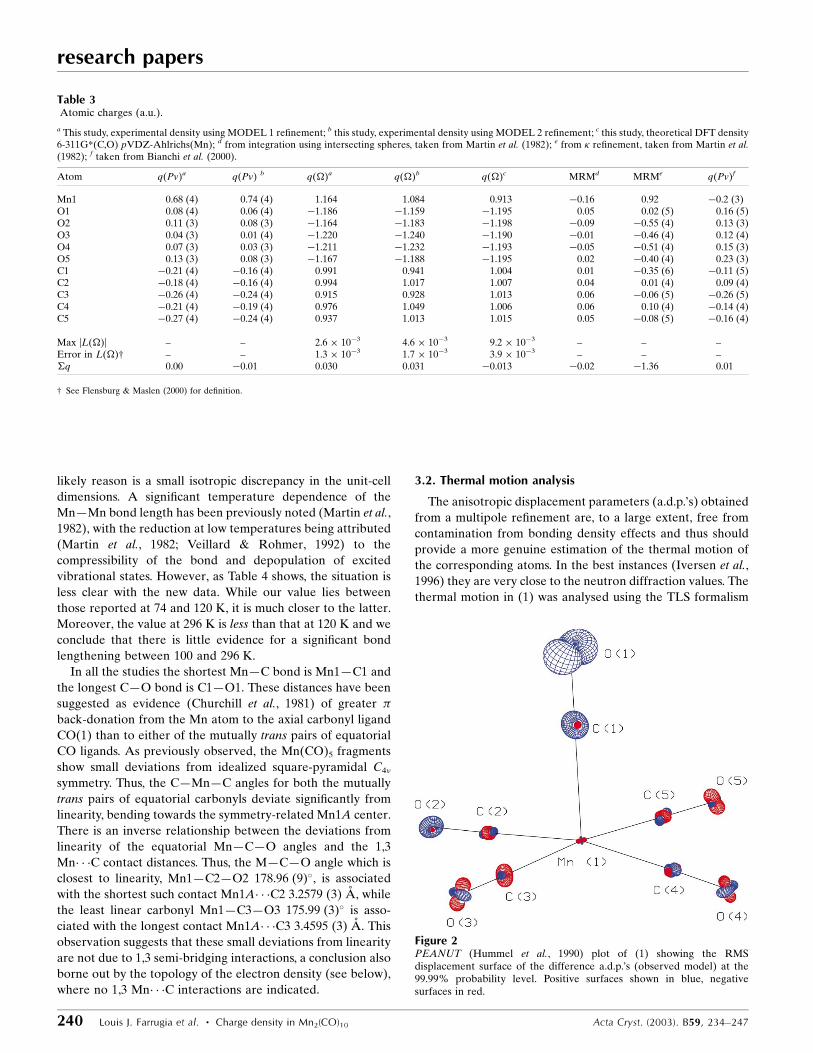
Figure 2PEANUT (Hummel et al., 1990) plot of (1) showing the RMSdisplacement surface of the difference a.d.p.'s (observed model) at the99.99% probability level. Positive surfaces shown in blue, negativesurfaces in red.
(Schomaker & Trueblood, 1968). The crystallographically
independent Mn(CO)5 fragment was treated as a single rigid
group. Table 5 gives the eigenvectors and eigenvalues of the L
and T tensors in the inertial frame of reference. The rigid-body
motion accounts well for the experimental a.d.p.'s (r.m.s. of
w�Uij is 4 � 10ÿ4 AÊ 2, wR = 0.065), with both the L and T
tensors being approximately isotropic. The greatest discre-
pancy is for the axial atoms C1 and especially O1, this extra
motion being attributed to a low energy axial MnÐCÐO
deformation mode. Fig. 2 shows a PEANUT plot (Hummel et
al., 1990), which graphically illustrates the difference between
the experimental and calculated (rigid-body) a.d.p.'s.
3.3. Atomic charges
The atomic charge polarizations which occur on chemical
bonding are of fundamental interest to chemists, but unfor-
tunately the concept of atomic charges has proved dif®cult to
quantify accurately. In part this arises because of the problem
(Wiberg & Rablen, 1993) of experimentally measuring such
charges. Meister & Schwartz (1994) have conducted a prin-
cipal component analysis on the charges derived from some 25
different physical and theoretical methods. They conclude
that, while `there indeed exists something in nature which
corresponds to the vague charge concepts of the chemists and
physicists', the scale of the derived charges can differ by a
factor of �10, depending on the chosen method. In the past,
various schemes have been adopted in charge density studies
(Coppens, 1997) to partition charge to individual atomic
centers, some more arbitary than others (see, for example,
MRM). Within the multipole formalism (Hansen & Coppens,
Acta Cryst. (2003). B59, 234±247 Louis J. Farrugia et al. � Charge density in Mn2(CO)10 241
research papers
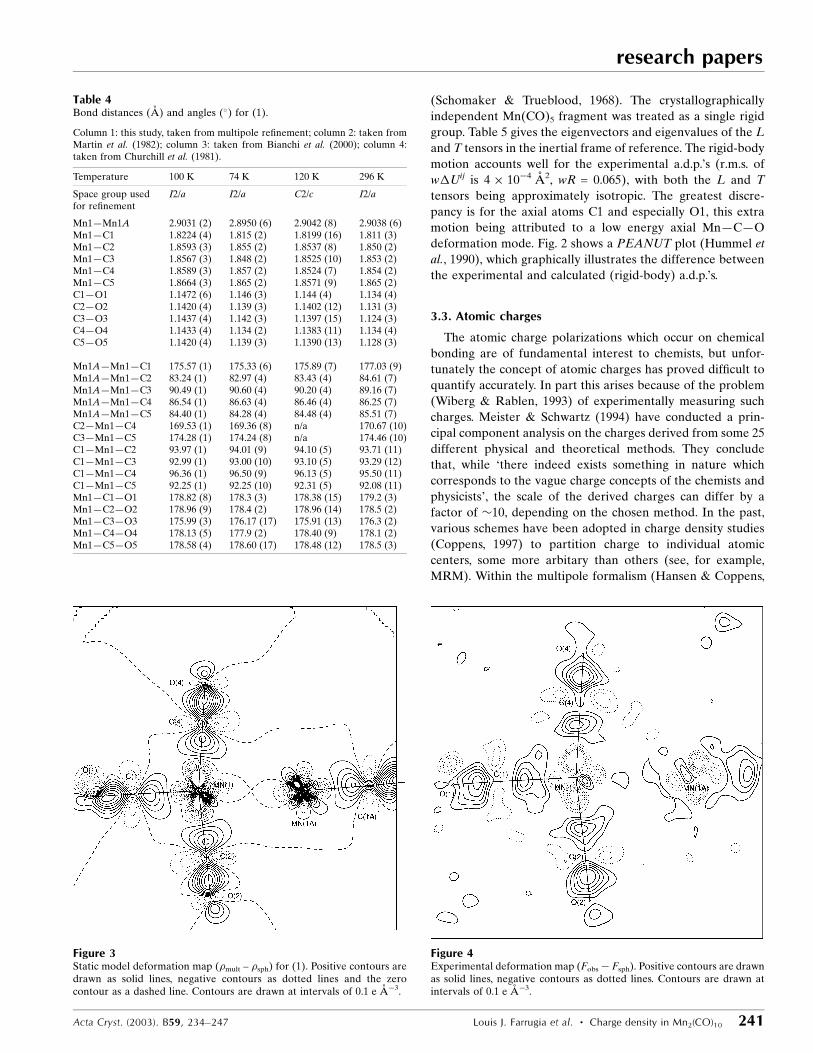
Figure 3Static model deformation map (�mult ± �sph) for (1). Positive contours aredrawn as solid lines, negative contours as dotted lines and the zerocontour as a dashed line. Contours are drawn at intervals of 0.1 e AÊ ÿ3.
Figure 4Experimental deformation map (Fobs ÿ Fsph). Positive contours are drawnas solid lines, negative contours as dotted lines. Contours are drawn atintervals of 0.1 e AÊ ÿ3.
Table 4Bond distances (AÊ ) and angles (�) for (1).
Column 1: this study, taken from multipole re®nement; column 2: taken fromMartin et al. (1982); column 3: taken from Bianchi et al. (2000); column 4:taken from Churchill et al. (1981).
Temperature 100 K 74 K 120 K 296 K
Space group usedfor re®nement
I2/a I2/a C2/c I2/a
Mn1ÐMn1A 2.9031 (2) 2.8950 (6) 2.9042 (8) 2.9038 (6)Mn1ÐC1 1.8224 (4) 1.815 (2) 1.8199 (16) 1.811 (3)Mn1ÐC2 1.8593 (3) 1.855 (2) 1.8537 (8) 1.850 (2)Mn1ÐC3 1.8567 (3) 1.848 (2) 1.8525 (10) 1.853 (2)Mn1ÐC4 1.8589 (3) 1.857 (2) 1.8524 (7) 1.854 (2)Mn1ÐC5 1.8664 (3) 1.865 (2) 1.8571 (9) 1.865 (2)C1ÐO1 1.1472 (6) 1.146 (3) 1.144 (4) 1.134 (4)C2ÐO2 1.1420 (4) 1.139 (3) 1.1402 (12) 1.131 (3)C3ÐO3 1.1437 (4) 1.142 (3) 1.1397 (15) 1.124 (3)C4ÐO4 1.1433 (4) 1.134 (2) 1.1383 (11) 1.134 (4)C5ÐO5 1.1420 (4) 1.139 (3) 1.1390 (13) 1.128 (3)
Mn1AÐMn1ÐC1 175.57 (1) 175.33 (6) 175.89 (7) 177.03 (9)Mn1AÐMn1ÐC2 83.24 (1) 82.97 (4) 83.43 (4) 84.61 (7)Mn1AÐMn1ÐC3 90.49 (1) 90.60 (4) 90.20 (4) 89.16 (7)Mn1AÐMn1ÐC4 86.54 (1) 86.63 (4) 86.46 (4) 86.25 (7)Mn1AÐMn1ÐC5 84.40 (1) 84.28 (4) 84.48 (4) 85.51 (7)C2ÐMn1ÐC4 169.53 (1) 169.36 (8) n/a 170.67 (10)C3ÐMn1ÐC5 174.28 (1) 174.24 (8) n/a 174.46 (10)C1ÐMn1ÐC2 93.97 (1) 94.01 (9) 94.10 (5) 93.71 (11)C1ÐMn1ÐC3 92.99 (1) 93.00 (10) 93.10 (5) 93.29 (12)C1ÐMn1ÐC4 96.36 (1) 96.50 (9) 96.13 (5) 95.50 (11)C1ÐMn1ÐC5 92.25 (1) 92.25 (10) 92.31 (5) 92.08 (11)Mn1ÐC1ÐO1 178.82 (8) 178.3 (3) 178.38 (15) 179.2 (3)Mn1ÐC2ÐO2 178.96 (9) 178.4 (2) 178.96 (14) 178.5 (2)Mn1ÐC3ÐO3 175.99 (3) 176.17 (17) 175.91 (13) 176.3 (2)Mn1ÐC4ÐO4 178.13 (5) 177.9 (2) 178.40 (9) 178.1 (2)Mn1ÐC5ÐO5 178.58 (4) 178.60 (17) 178.48 (12) 178.5 (3)
research papers
242 Louis J. Farrugia et al. � Charge density in Mn2(CO)10 Acta Cryst. (2003). B59, 234±247
1978), it is usual to consider the monopole populations as
de®ning the charge partitioning. However, the AIM approach
(Bader, 1990) offers an alternative and less arbitrary method
of determining atomic charges, albeit at signi®cant computa-
tional cost. The AIM charges are obtained by numerical
integration over the volume enclosed by the zero-¯ux surface
of each atom (the atomic basin). They have been shown to be
relatively insensitive to the choice of basis set (Cioslowski et
al., 1990), but generally lead to larger atomic charges. This is
found to be the case in this study. They also have the
considerable advantage that a direct comparison is possible
between charges derived from the experimental and theore-
tical densities.
The atomic charges determined from the experimental
monopole populations q(Pv) and from atomic basin integra-
tions [the AIM charges q()] of both the experimental and
theoretical densities, as well as those from the MRM & BGM
studies, are shown in Table 3. In view of the differing parti-
tioning schemes used in these methods, it is not surprising that
there are some major disagreements. As determined by the
monopole populations, the O atoms bear small positive
charges and are effectively electro-neutral within experi-
mental error, while the C atoms bear small negative charges.
In contrast, the AIM method produces substantial negative
charges on all O atoms and positive charges on all C atoms,
which is more in keeping with their relative electro-negativ-
ities. In our study, all methods agree in assigning a substantial
positive charge to the metal atom. Moreover, the AIM charges
derived from the experimental and theoretical densities are in
good agreement with each other, despite the fact that the
calculations are based on an isolated molecule. These charges
indicate the chemical bonding between the CO ligands and the
metal results in an average transfer of �0.2 e from the metal to
each carbonyl group. However, the charges depend on several
factors and cannot be taken simply as an indicator of �-back
donation. Experimentally, the charge transfer is greatest for
CO(3) (av. ÿ0.31 e) and least for CO(2) (av. ÿ0.17 e), but the
theoretical study implies the charge transfer is virtually iden-
tical for all CO ligands. Certainly, the AIM charges do not
provide any supporting evidence for the assertion (Churchill et
al., 1981) that �-back donation is greatest for the axial CO(1).
The calculated AIM charge in free CO is �1.1±1.2 a.u.
(MacDougall & Hall, 1990; Cioslowski et al., 1990; HernaÂndez-
Trujillo & Bader, 2000), so these results indicate a small
overall charge transfer to the O atoms. The AIM charges in (1)
are similar to those determined for Cr(CO)6 (MacDougall &
Hall, 1990). The monopole charges reported by BGM are
broadly similar to those obtained in this study. The major
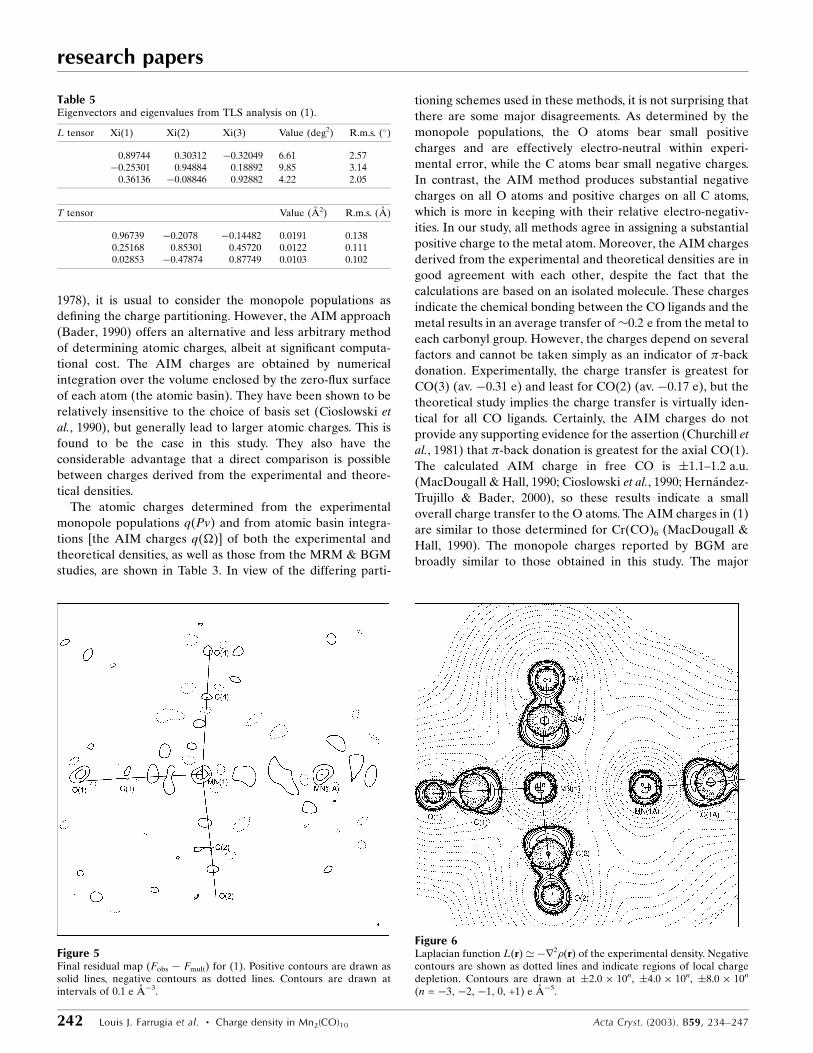
Figure 6Laplacian function L(r) 'ÿr2�(r) of the experimental density. Negativecontours are shown as dotted lines and indicate regions of local chargedepletion. Contours are drawn at �2.0 � 10n, �4.0 � 10n, �8.0 � 10n
(n = ÿ3, ÿ2, ÿ1, 0, +1) e AÊ ÿ5.
Table 5Eigenvectors and eigenvalues from TLS analysis on (1).
L tensor Xi(1) Xi(2) Xi(3) Value (deg2) R.m.s. (�)
0.89744 0.30312 ÿ0.32049 6.61 2.57ÿ0.25301 0.94884 0.18892 9.85 3.14
0.36136 ÿ0.08846 0.92882 4.22 2.05
T tensor Value (AÊ 2) R.m.s. (AÊ )
0.96739 ÿ0.2078 ÿ0.14482 0.0191 0.1380.25168 0.85301 0.45720 0.0122 0.1110.02853 ÿ0.47874 0.87749 0.0103 0.102
Figure 5Final residual map (Fobs ÿ Fmult) for (1). Positive contours are drawn assolid lines, negative contours as dotted lines. Contours are drawn atintervals of 0.1 e AÊ ÿ3.
difference is that the Mn atom has a small negative charge in
BGM, although the s.u. is high.
3.4. d-orbital populations
As shown by Holladay et al. (1983) there is a direct rela-
tionship, for transition metal compounds, between the multi-
pole populations and the d-orbital populations. Table 6 shows
a comparison between our data and a previous analysis on
Mn2(CO)10 (Holladay et al., 1983). Simple ligand ®eld theory
leads to an expected destabilization of the eg over the t2g
orbitals. This is evident from both studies, but is more marked
in ours. In addition, our results show a more marked desta-
bilization of b2 versus a1 than the previous work, and a
signi®cantly lower overall d-orbital population. Nevertheless,
the percentage ratios t2g/eg agree reasonably well. Abramov et
al. (1998) have undertaken a similar analysis on the closely
related molecule HMn(CO)4(PPh3) and ®nd a t2g:eg popula-
tion ratio of 71.5:28.5. The signi®cantly non-zero populations
of the eg set is consistent with covalency in the MnÐC bonds.
3.5. Deformation maps
The static model deformation map in the plane containing
C1ÐC2ÐC4 is shown in Fig. 3. The plot for the corresponding
plane C1ÐC3ÐC5 is similar. As expected, there is signi®cant
charge accumulation into the CÐO and MnÐC bonds and
charge depletion at the Mn center. The midpoint of the Mn±
Mn vector corresponds to an area of zero depletion, indicating
that at this point there is no charge redistribution relative to
the spherical atom model. These features are well reproduced
in the experimental deformation map, Fig. 4, and the ®nal
residual maps (see Fig. 5) show no signi®cant features, with the
largest peak of 0.274 e AÊ ÿ3 close to the Mn centre. As is more
clearly demonstrated in the topological analysis, there is no
signi®cant charge accumulation at the centre of the Mn±Mn
vector, a result which is in good agreement with the previous
studies of Martin et al. (1982) and Bianchi et al. (2000). The
small sharp feature next to the Mn atom may indicate some
minor uncorrected systematic error in the data.
3.6. Topological analysis of electron density
Table 2 lists important topological properties obtained from
this study, compared with those from BGM. Apart from a
signi®cant difference elaborated below, the agreement
between the two studies is reasonable. The expected (3,ÿ1)
bond critical points (b.c.p.) were found between all covalently
bonded atoms. According to Bader (1998), this provides a
universal indicator of bonding between these atoms. No
critical points corresponding to 1,3 Mn� � �C interactions
between the Mn atom and the carbonyl ligands on the
symmetry-related Mn1A atom were detected. However, in a
study on M(�-CO)M systems, Macchi & Sironi (2003)
conclude that although no bond path is observed where the 1,3
M� � �C interaction is weak, these interactions may provide
non-negligible components to bonding, and contribute to the
small MÐM bond orders which are often observed.
Numerous high-level theoretical studies on (1) have been
reported, including AIM analyses on the SCF density (Bo et
al., 1993; MacDougall, 1989) as well as recent DFT studies by
Rosa et al. (1995) and Folga & Ziegler (1993). Since neither of
these DFT studies reported an AIM analysis, we have
undertaken a DFT study of (1) at the 6-311+G* B3LYP level
to provide a reference density. These theoretical results are
reported in Table 2. Not withstanding the fact that our theo-
retical calculations are based on an isolated gas-phase mole-
cule, there is a very reasonable agreement between the
topological properties of the experimental and theoretical
densities. Volkov, Abramov & Coppens (2000) have recently
demonstrated that the effect of the crystal lattice on intra-
molecular topological properties is surprisingly small. A map
of the Laplacian function L(r) ' ÿr2�(r) of the experimental
density through the same molecular plane as previous ®gures
is given in Fig. 6, and that of the theoretical density in the
region of the MnÐMn bond from different basis sets in Fig. 7.
Both our own and the BGM experimental studies give
similar values for the density �(rb) and small positive values
for the Laplacian of the density r2�(rb) at the b.c.p. between
the two Mn centers. In contrast, the theoretical AIM studies of
MacDougall (1989) and Bo et al. (1993), while giving similar
values of �(rb) (0.209 and 0.202 e AÊ ÿ3 respectively), showed
negative values for r2�(rb) (ÿ0.144 and ÿ0.241 e AÊ ÿ5,
respectively). A ¯at region of negative Laplacian at the
midpoint of the Mn centers is reproduced in our theoretical
study when using a relatively limited basis set, see Fig. 7(b).
This island has been attributed (MacDougall, 1989) to the
remains of the fourth shell of charge concentration of both Mn
atoms. However, as previously alluded by Macchi et al. (1998b)
and con®rmed by our own calculations, the sign of r2�(rb) for
the MnÐMn bond is strongly dependent on the basis set
employed. As Fig. 7(a) shows, when an extensive basis with
diffuse functions on the Mn atoms is used, no such island is
observed and we therefore conclude it is an artefact. It should
be emphasized that although this feature is obvious in the
Laplacian functions shown in Fig. 7, the actual difference in
electron density is minimal. At the mid-point of the MnÐMn
bond, the difference in the densities derived from the two
basis sets is less than 10ÿ3 e AÊ ÿ3.
According to Bader (1990) and Cremer & Kraka (1984a,b),
atomic interactions may be characterized according to the
values of �(rb) and r2�(rb) and also the kinetic energy density
G(rb) and the local energy density H(rb) [i.e. G(rb) + V(rb)] at
the (3,ÿ1) bond critical points in electron density. Shared or
open-shell (covalent) interactions, where the potential energy
density V(rb) dominates over the kinetic energy density in the
Acta Cryst. (2003). B59, 234±247 Louis J. Farrugia et al. � Charge density in Mn2(CO)10 243
research papers
Table 6Derived d-orbital populations (a.u.).
This work Holladay et al. (1983)
a1 (dz2) 0.747 (21) 17.3% 0.76 (3) 14.2%b2 (dx2 ÿ y2) 0.309 (18) 7.2% 0.65 (4) 12.1%b1 (dxy) 0.921 (18) 21.3% 1.27 (4) 23.6%e (dxz ) 1.168 (16) 54.2% 2.69 (3) 50.1%
dyz 1.173 (18)Total d population 4.317 5.83
research papers
244 Louis J. Farrugia et al. � Charge density in Mn2(CO)10 Acta Cryst. (2003). B59, 234±247
region of the interatomic surface, are characterized by large
values of �(rb) and negative values of r2�(rb) and H(rb).
Closed-shell (ionic) interactions, where the kinetic energy
density G(rb) dominates over the potential energy density in
the region of the interatomic surface, are characterized by
small values of �(rb), positive values of r2�(rb) and positive,
near-zero values of H(rb). As we (Smith et al., 1997) and others
(Macchi et al., 1998a,b, 1999; Koritsansky & Coppens, 2001;
Macchi & Sironi, 2003) have previously noted, the topological
properties of covalent bonds involving transition metals do
not have the same characteristics as covalent bonds between
®rst-row atoms.
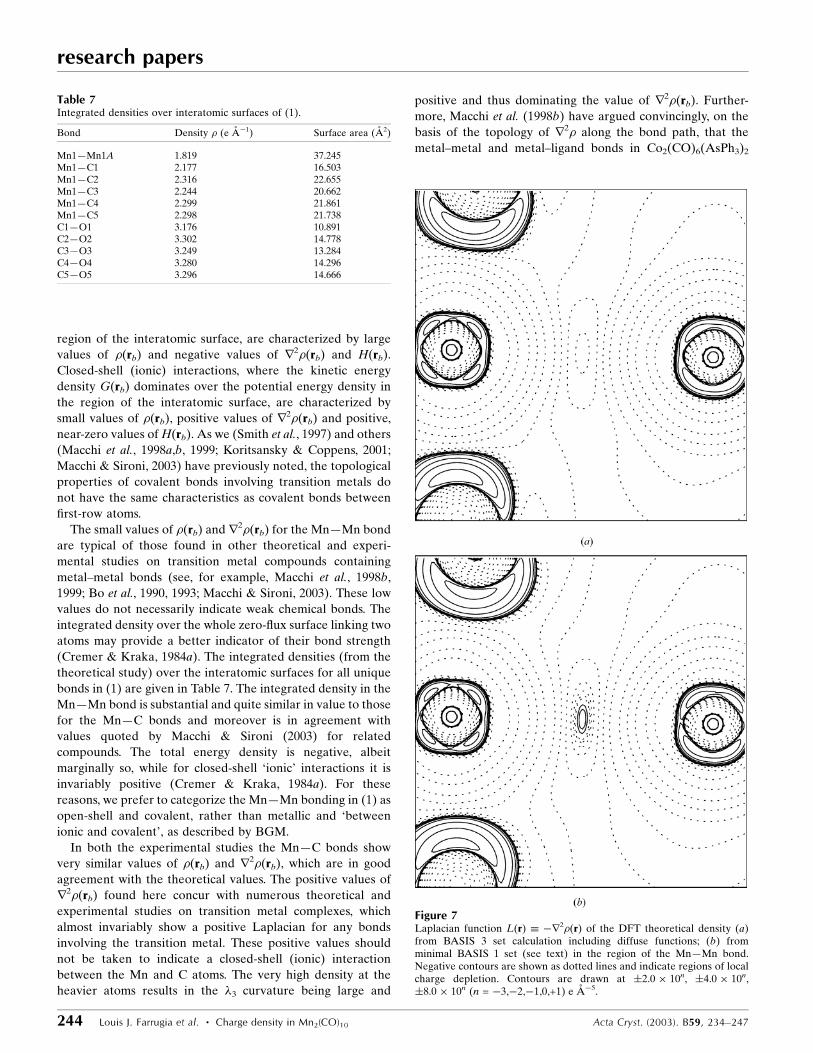
The small values of �(rb) and r2�(rb) for the MnÐMn bond
are typical of those found in other theoretical and experi-
mental studies on transition metal compounds containing
metal±metal bonds (see, for example, Macchi et al., 1998b,
1999; Bo et al., 1990, 1993; Macchi & Sironi, 2003). These low
values do not necessarily indicate weak chemical bonds. The
integrated density over the whole zero-¯ux surface linking two
atoms may provide a better indicator of their bond strength
(Cremer & Kraka, 1984a). The integrated densities (from the
theoretical study) over the interatomic surfaces for all unique
bonds in (1) are given in Table 7. The integrated density in the
MnÐMn bond is substantial and quite similar in value to those
for the MnÐC bonds and moreover is in agreement with
values quoted by Macchi & Sironi (2003) for related
compounds. The total energy density is negative, albeit
marginally so, while for closed-shell `ionic' interactions it is
invariably positive (Cremer & Kraka, 1984a). For these
reasons, we prefer to categorize the MnÐMn bonding in (1) as
open-shell and covalent, rather than metallic and `between
ionic and covalent', as described by BGM.
In both the experimental studies the MnÐC bonds show
very similar values of �(rb) and r2�(rb), which are in good
agreement with the theoretical values. The positive values of
r2�(rb) found here concur with numerous theoretical and
experimental studies on transition metal complexes, which
almost invariably show a positive Laplacian for any bonds
involving the transition metal. These positive values should
not be taken to indicate a closed-shell (ionic) interaction
between the Mn and C atoms. The very high density at the
heavier atoms results in the �3 curvature being large and
positive and thus dominating the value of r2�(rb). Further-
more, Macchi et al. (1998b) have argued convincingly, on the
basis of the topology of r2� along the bond path, that the
metal±metal and metal±ligand bonds in Co2(CO)6(AsPh3)2
Table 7Integrated densities over interatomic surfaces of (1).
Bond Density � (e AÊ ÿ1) Surface area (AÊ 2)
Mn1ÐMn1A 1.819 37.245Mn1ÐC1 2.177 16.503Mn1ÐC2 2.316 22.655Mn1ÐC3 2.244 20.662Mn1ÐC4 2.299 21.861Mn1ÐC5 2.298 21.738C1ÐO1 3.176 10.891C2ÐO2 3.302 14.778C3ÐO3 3.249 13.284C4ÐO4 3.280 14.296C5ÐO5 3.296 14.666
Figure 7Laplacian function L(r) � ÿr2�(r) of the DFT theoretical density (a)from BASIS 3 set calculation including diffuse functions; (b) fromminimal BASIS 1 set (see text) in the region of the MnÐMn bond.Negative contours are shown as dotted lines and indicate regions of localcharge depletion. Contours are drawn at �2.0 � 10n, �4.0 � 10n,�8.0 � 10n (n = ÿ3,ÿ2,ÿ1,0,+1) e AÊ ÿ5.
should be considered as genuine covalent interactions, a result
which has general implications. This view is, of course,
consistent with chemical common sense.
The major area of disagreement between our study and
BGM lies in the topology of the CÐO bonds, and this is a well
recognized issue (Macchi & Sironi, 2003). The b.c.p. in CO lies
very close to the nodal plane in r2� and the CO bond is
classi®ed by Bader (1990) as an intermediate interaction.
Depending on the level and quality of ab initio calculation
(Bader, 1990; Aray & RodrõÂguez, 1996), the values of �(rb)
and r2�(rb) for free CO fall in the ranges 3.31±3.44 e AÊ ÿ3 and
6.48±23.6 e AÊ ÿ5, respectively. In metal carbonyl complexes, it
has been long recognized (MacDougall & Hall, 1990) that the
Laplacian of coordinated CO closely resembles that of the free
ligand and a similar situation arises regarding the position of
the b.c.p. Our experimental values of r2�(rb) for (1) are very
close to the theoretical values, but differ signi®cantly from
those of BGM, in sign as well as magnitude. Moreover, the
position of the b.c.p. relative to the nodal plane, and hence the
magnitude of r2�(rb), is crucially dependent on the defor-
mation valence radial scaling parameters �0 for the O and C
atoms. In other experimental studies, both positive (e.g.
Abramov et al., 1998) and negative values (e.g. Macchiet al.,
1998b) have been found for r2�(rb) in CO bonds and this
parameter must be regarded as rather unreliable.
From Table 2, it can be seen that the approximation of
Abramov (1997) for G(rb) is excellent for the MnÐMn and
MnÐC bonds, and quite reasonable for the CÐO bonds. The
Rpara value (see Table 2 for de®nition) allows a quantitative
comparison of the quality of ®t between the experimental and
theoretical properties. These show that, as expected, the most
extensive basis (BASIS 3) gives the best ®t to the majority of
the experimentally derived properties. Surprisingly, the
minimal basis BASIS 1 provides the best ®t to the individual
eigenvalues of the Hessian �1,2,3, although not to the magni-
tude of r2�(rb). For all bonds, there is excellent agreement
regarding �(rb) and a respectable agreement with r2�(rb). The
worst discrepancies occur for the ellipticity parameter ", but in
virtually all cases Rparam is signi®cantly smaller with our
experimental results than with those of BGM.
3.7. Topological analysis of the Laplacian of the electrondensity
The experimental Laplacian map, L(r) � ÿr2�(r), in the
C1ÐC2ÐC4 plane is shown in Fig. 6 and theoretical maps in
the same plane in Fig. 7. While there are striking similarities
between the two maps, there are two small features of diver-
gence, viz:
(i) the above-mentioned presence of a small rise in L(r) in
the theoretical maps at the center of the MnÐMn bond;
(ii) the torus of charge depletion at the C atoms, normally
observed for CO ligands (Aray & RodrõÂguez, 1996), is more
prominent in the theoretical maps.
As expected for a ®rst-row transition metal (Bader &
Matta, 2001), the Mn atom shows only three shells of charge
Acta Cryst. (2003). B59, 234±247 Louis J. Farrugia et al. � Charge density in Mn2(CO)10 245
research papers
Table 8Properties of critical points in ÿr2�(r) in the i-VSCC of (1).
Experimental values in parentheses.
Rho (e AÊ ÿ3) ÿr2�(r) (e AÊ ÿ5)Distance fromnucleus (AÊ )
(3,ÿ3) critical points 20.20 (19.10) ÿ855.32 (ÿ720.25) 0.339 (0.339)20.14 (20.11) ÿ846.47 (ÿ779.66) 0.338 (0.337)20.27 (19.37) ÿ864.26 (ÿ708.45) 0.338 (0.339)20.06 (19.59) ÿ836.78 (ÿ746.01) 0.339 (0.338)20.16 (20.24) ÿ848.31 (ÿ789.88) 0.338 (0.337)20.26 (19.89) ÿ862.28 (ÿ814.24) 0.339 (0.336)20.11 (19.65) ÿ843.55 (ÿ763.98) 0.338 (0.337)20.27 (19.55) ÿ864.28 (ÿ728.70) 0.338 (0.338)
(3,ÿ1) critical points 18.85 (18.25) ÿ683.79 (ÿ610.32) 0.343 (0.341)18.92 (18.79) ÿ674.50 (ÿ623.44) 0.344 (0.341)18.83 (17.93) ÿ680.66 (ÿ541.07) 0.343 (0.344)18.86 (n/a) ÿ664.01 (ÿ666.73) 0.344 (0.339)18.98 (18.15) ÿ682.34 (ÿ568.71) 0.343 (0.343)18.87 (19.18) ÿ668.23 (ÿ659.54) 0.343 (0.340)18.95 (19.27) ÿ678.78 (ÿ663.54) 0.343 (0.340)18.82 (18.60) ÿ679.52 (ÿ649.56) 0.343 (0.340)18.92 (19.30) ÿ674.78 (ÿ643.11) 0.343 (0.340)18.90 (18.57) ÿ670.94 (ÿ586.01) 0.344 (0.342)18.85 (18.37) ÿ666.39 (ÿ578.33) 0.344 (0.342)18.84 (18.56) ÿ681.52 (ÿ625.25) 0.343 (0.341)
(3,+1) critical points 14.91 (15.84) ÿ189.91 (ÿ240.42) 0.360 (0.352)14.87 (14.15) ÿ187.09 (ÿ126.52) 0.361 (0.360)15.21 (17.63) ÿ197.40 (ÿ337.24) 0.360 (0.349)15.52 (17.11) ÿ234.83 (ÿ314.67) 0.359 (0.350)14.84 (16.15) ÿ183.68 (ÿ254.94) 0.361 (0.351)14.94 (14.81) ÿ193.03 (ÿ172.66) 0.360 (0.356)
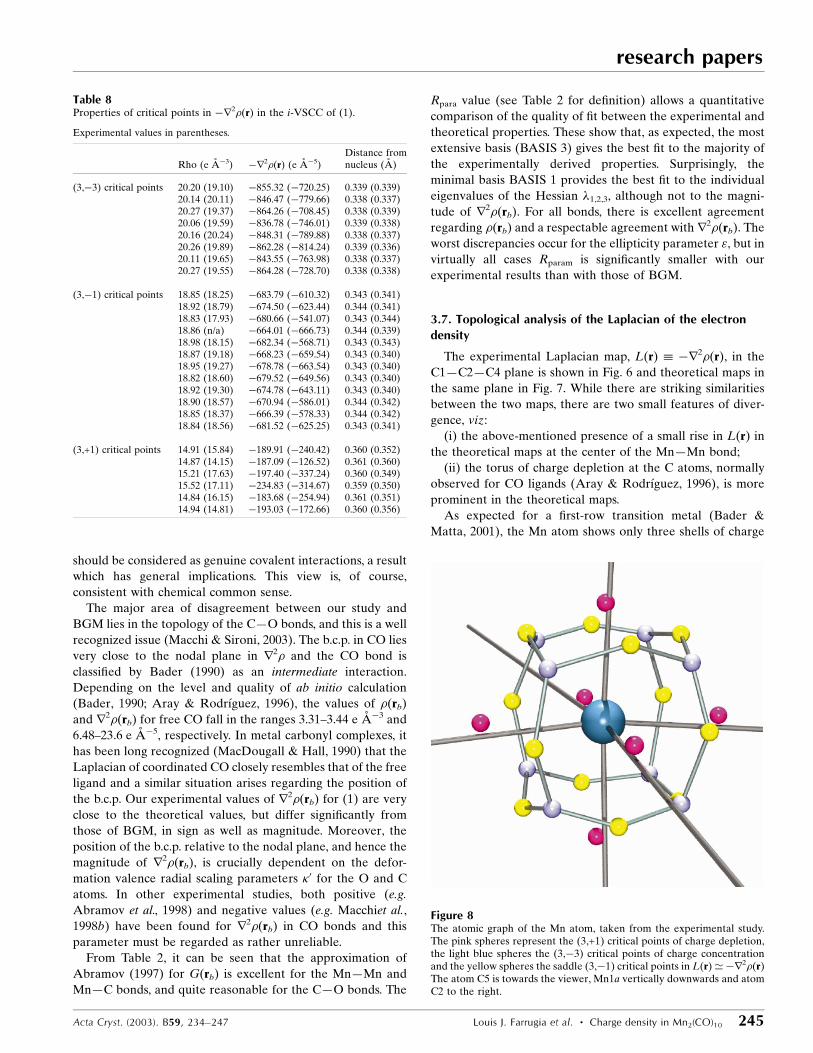
Figure 8The atomic graph of the Mn atom, taken from the experimental study.The pink spheres represent the (3,+1) critical points of charge depletion,the light blue spheres the (3,ÿ3) critical points of charge concentrationand the yellow spheres the saddle (3,ÿ1) critical points in L(r) 'ÿr2�(r)The atom C5 is towards the viewer, Mn1a vertically downwards and atomC2 to the right.
research papers
246 Louis J. Farrugia et al. � Charge density in Mn2(CO)10 Acta Cryst. (2003). B59, 234±247
concentrations in L(r). The 3d electrons are subsumed with
the core 3s and 3p into the inner valence shell charge
concentration (i-VSCC), which is distinctly non-spherical
(Gillespie et al., 1996). A topological analysis of L(r) in the
region of the i-VSCC was undertaken, on both the theoretical
and experimental density. The results, reported in Table 8, are
in reasonable agreement, especially for the (3,ÿ3) and (3,ÿ1)
critical points. These points, in the region of �0.33±0.36 AÊ
from the nucleus, constitute the atomic graph (Bader, 1990) of
the Mn atom, shown in Fig. 8. The graph has the topology of a
cube and is consistent with the octahedral coordination, with
the d-orbital populations and with the qualitative expectations
of ligand ®eld theory, in that the core-like 3d electrons avoid
the charge concentrations of the carbonyl ligands. There are
six (3,+1) critical points of charge depletion in the direction of
the octahedral axes (in the face of the cube), eight (3,ÿ3)
critical points of non-bonded charge concentration in the
center of each face of the octahedron (in the corners of the
cube) and 12 (3,ÿ1) critical points along all the edges of the
cube. Slightly outside the VSCC in the region of Valence Shell
Charge Depletion (VSCD), around 0.51 AÊ from the nucleus,
six (3,+3) critical points of charge depletion are found lying on
the six bond paths emanating from the manganese atom. An
essentially identical atomic graph was obtained by Abramov et
al. (1998) for the closely related molecule HMn(CO)4(PPh3)
in an experimental study. This result supports our view that
the chemical environments of the Mn atoms in (1) and
HMn(CO)4(PPh3), in so far as they are manifest in the atomic
graph of that atom, are closely similar. This result provides
further con®rmation of the covalent nature of the MnÐMn
bond. Theoretical studies on L(r) in the region of the i-VSCC
of the octahedrally coordinated metal atoms in Fe2(CO)9 (Bo
et al., 1993) and Cr(CO)6 (MacDougall & Hall, 1990) also
show identical atomic graphs to those described above. In
contrast, BGM report only six (3,ÿ3) critical points of non-
bonded charge concentration in their study on (1).
4. Conclusions
On a qualitative level, there is good agreement between the
topology of the electron densities observed in our study and
that of BGM. The same set of critical points, with broadly
similar values of �(rb), were obtained. Judging from the lower
residuals and s.u.'s on derived metric parameters, and the
greater internal consistency in the derived multipole para-
meters, the quality of the data obtained using a CCD detector
appears superior to that of the BGM study. Despite some
qualitative differences, particularly in the Laplacian values
r2�(rb) in CO bonds, the level of agreement between the two
studies is encouraging. Moreover, and notwithstanding the
fact that our theoretical calculations are based on an isolated
gas-phase molecule, there is excellent agreement between the
topological properties of our experimental and theoretical
densities. The function proposed by Abramov (1997) for G(r)
at the b.c.p. is shown to give an excellent approximation to
values derived from theory. Previous conclusions about the
bonding in molecule (1) have been con®rmed, particularly the
lack of evidence for 1,3 Mn� � �C interactions. We prefer a
description of the bonding in (1) in terms of covalent inter-
actions, rather than the `closed-shell' description given by
BGM.
We thank the EPSRC for grant GR/M91433 towards the
purchase of a KappaCCD diffractometer and for access to the
Columbus DEC 8400 Superscalar Service (RAL). We espe-
cially thank Professors Piero Macchi (Milano) and Anatoliy
Volkov (Buffalo) for many helpful discussions and advice on
the XD and TOPXD programs.
References
Abramov, Y. A. (1997). Acta Cryst. A53, 264±272.Abramov, Y. A., Brammer, L., Klooster, W. T. & Bullock, R. M.
(1998). Inorg. Chem. 37, 6317±6328.Aicken, F. M. & Popelier, P. L. A. (2000). Can. J. Chem. 78, 415±426.Aray, Y. & RodrõÂguez, J. (1996). Can. J. Chem. 74, 1014±1020.Bader, R. F. W. (1990). Atoms in Molecules: A Quantum Theory.
Oxford: Clarendon Press.Bader, R. F. W. (1998). J. Phys. Chem. A, 102, 7314±7323.Bader, R. F. W. & Matta, C. F. (2001). Inorg. Chem. 40, 5603±5611.Bauschlicher, Jr, C. W., Langhoff, S. R. & Barnes, L. A. (1989). J.
Chem. Phys. 91, 2399±2411.Becke, A. D. (1993). J. Chem. Phys. 98, 5648±5652.Becker, P. J. & Coppens, P. (1974). Acta Cryst. A30, 129±147.Bianchi, R., Gervasio, G. & Marabello, D. (2000). Inorg. Chem. 39,
2360±2366.Bianchi, R., Gervasio, G. & Marabello, D. (2001a). Helv. Chim. Acta,84, 722±734.
Bianchi, R., Gervasio, G. & Marabello, D. (2001b). Acta Cryst. B57,638±645.
Biegler-KoÈ nig, F. (2000). J. Comput. Chem. 12, 1040±1048.Biegler-KoÈ nig, F. W., Bader, R. F. W. & Tang, T.-H. (1982). J. Comput.
Chem. 3, 317±328.Blessing, R. H. (1995). Acta Cryst. A51, 33±38.Blessing, R. H. (1997a). DENZOX. Modi®ed for KappaCCD data by
L. J. Farrugia & K. W. Muir (2001). University of Glasgow.Blessing, R. H. (1997b). J. Appl. Cryst. 30, 421±426.Bo, C., Poblet, J.-M. & BeÂnard, M. (1990). Chem. Phys. Lett. 169, 89±
96.Bo, C., Sarasa, J.-P. & Poblet, J.-M. (1993). J. Phys. Chem. 97, 6362±
6366.Brown, D. A., Chambers, W. J., Fitzpatrick, A. J. & Rawlinson, S. R.
M. (1971). J. Chem. Soc. A, pp. 720±725.Bunge, C. F., Barrientos, J. A. & Bunge, A. V. (1993). At. Data Nucl.
Data Tab. 53, 113±162.BuÈ rgi, H. B. (1984). Trans. Am. Cryst. Assoc. 20, 61±71.Bytheway, I., Figgis, B. N. & Sobolev, A. N. (2001). J. Chem. Soc.
Dalton Trans. pp. 3285±3294.Bytheway, I., Grimwood, D. J. & Jayatilaka, D. (2002). Acta Cryst.
A58, 232±243.Churchill, M. R., Amoh, K. N. & Wasserman, H. J. (1981). Inorg.
Chem. 20, 1609±1611.Cioslowski, J., Hay, P. J. & Ritchie, J. P. (1990). J. Phys. Chem. 94, 148±
151.Coppens, P. (1984). Acta Cryst. A40, 184±195.Coppens, P. (1985). Coord. Chem. Rev. 65, 285±307.Coppens, P. (1997). X-ray Charge Densities and Chemical Bonding.
Oxford: Oxford Science Publications.Coppens, P. (1998). Acta Cryst. A54, 779±788.Cremer, D. & Kraka, E. (1984a). Croat. Chem. Acta, 57, 1259±1281.Cremer, D. & Kraka, E. (1984b). Angew Chem. Int. Ed. Engl. 23, 627±
628.
Farrugia, L. J. (1997). J. Appl. Cryst. 30, 565.Farrugia, L. J. (1999). J. Appl. Cryst. 32, 837±838.Farrugia, L. J. & Mallinson, P. R. (2002). Unpublished observations.Figgis, B. N., Iversen, B. B., Larsen, F. K. & Reynolds, P. A. (1993).
Acta Cryst. B49, 794±806.Flensburg, C. & Madsen, D. (2000). Acta Cryst. A56, 24±28.Folga, E. & Ziegler, T. (1993). J. Am. Chem. Soc. 115, 5169±
5176.Freund, H.-J. & Hohneicher, G. (1979). Theor. Chim. Acta (Berlin),51, 145±162.
Freund, H.-J., Dick, G. & Hohneicher, G. (1980). Theor. Chim. Acta(Berlin), 57, 181±207.
Gillespie, R. J., Bytheway, I., Tang, T.-H. & Bader, R. F. W. (1996).Inorg. Chem. 35, 3954±3963.
Graafsma, H., Svensson, S. O. & Kvick, AÊ . (1997) J. Appl. Cryst. 30,957±962.
Guest, M. F., Kendrick, J., van Lenthe, J. H. & Sherwood, P. (2002).GAMMES-UK, Version 6.3. The DFT module within GAMESS-UK was developed by Dr P. Young under the auspices of EPSRC'sCollaborative Comutational Project No. 1 (CCP1, 1995±1997).
Hansen, N. K. & Coppens, P. (1978). Acta Cryst. A34, 909±921.Herbstein, F. H. (2000). Acta Cryst. B56, 547±557.HernaÂndez-Trujillo, J. & Bader, R. F. W. (2000). J. Phys. Chem. 104,
1779±1794.Hirshfeld, F. L. (1976). Acta Cryst. A32, 239±244.Holladay, A., Leung, P. & Coppens P. (1983). Acta Cryst. A39, 377±
387.Hummel, W., Hauser, J. & BuÈ rgi, H.-B. (1990) J. Mol. Graphics, 8,
214±220.Iversen, B. B., Larsen, F. K., Figgis, B. N. & Reynolds, P. A. (1997). J.
Chem. Soc. Dalton Trans. pp. 2227±2240.Iversen, B. B., Larsen, F. K., Figgis, B. N., Reynolds, P. A. & Schultz,
A. J. (1996). Acta Cryst. B52, 923±931.Kirschbaum, K., Martin, A. & Pinkerton, A. A. (1997). J. Appl. Cryst.30, 514±516.
Koritsanszky, T. S. & Coppens, P. (2001). Chem. Rev. 101, 1583±1627.Koritsanszky, T., Howard, S. T., Su, Z., Mallinson, P. R., Richter, T. &
Hansen, N. K. (1997) XD. Berlin: Free University of Berlin.Krijn, M. P. C. M., Graafsma, H. & Feil, D. (1988). Acta Cryst. B44,
609±616.Krug, P. & Bader, R. F. W. (1990). AIMPAC. Department Chemistry,
McMaster University, Hamilton, Ontario, Canada.Kuntzinger, S., Dahaoui, S., Ghermani, N. D., Lecomte, C. & Howard,
J. A. K. (1999). Acta Cryst. B55, 867±881.Leung, P. C. W. & Coppens, P. (1983). Acta Cryst. B39, 535±542.Low, A. A., Kunze, K. L., MacDougall, P. J. & Hall, M. B. (1991).
Inorg. Chem. 30, 1079±1086.Macchi, P., Garlaschelli, L., Martinego, S. & Sironi, A. (1999). J. Am.
Chem. Soc. 121, 10428±10429.Macchi, P., Proserpio, D. M. & Sironi, A. (1998a). J. Am. Chem. Soc.120, 1447±1455.
Macchi, P., Proserpio, D. M. & Sironi, A. (1998b). J. Am. Chem. Soc.120, 13429±13435.
Macchi, P., Proserpio, D. M., Sironi, A., Soave, R. & Destro, R. (1998).J. Appl. Cryst. 31, 583±588.
Macchi, P., Schultz, A. J., Larsen, F. K. & Iversen, B. B. (2001). J. Phys.Chem. 105, 9231±9242.
Macchi, P. & Sironi, A. (2003). Coord Chem. Rev. In the press.MacDougall, P. J. (1989). PhD Thesis. McMaster University, Ontario,
Canada.MacDougall, P. J. & Hall, M. B. (1990). Trans. Am. Cryst. Assoc. 26,
105±123.Martin, A. & Pinkerton, A. A. (1998). Acta Cryst. B54, 471±477.Martin, M., Rees, B. & Mitschler, A. (1982). Acta Cryst. B38, 6±15.Meister, J. & Schwartz, W. H. E. (1994). J. Phys. Chem. 98, 8245±8252.Nonius (1998). Collect, DENZO(SMN), SCALEPACK, KappaCCD
Program Package. Nonius BV, Delft, The Netherlands.Otwinowski, Z. & Minor, W. (1997). Methods in Enzymology, Vol.
276, Macromolecular Crystallography, edited by C. W. Carter Jr &R. M. Sweet, Part A, pp. 307±326. New York: Academic Press.
Paciorek, W. A., Meyer, M. & Chapuis, G. (1999). Acta Cryst. A55,543±557.
PeÂreÁs, N., Boukhris, A., Souhassou, M., Gavoille, G. & Lecomte, C.(1999). Acta Cryst. A55, 1038±1048.
Popelier, P. L. A. (1998). MORPHY98. Department of Chemistry,UMIST.
Popelier, P. L. A. (2000). Atoms in Molecules: An Introduction.Harlow: Prentice Hall.
Powell, H. M. & Ewens, R. V. G. (1939). J. Chem. Soc. pp. 286±292.Rosa, A., Ricciardi, G., Baerends, E. J. & Stufkens, D. J. (1995). Inorg.
Chem. 34, 3425±3432.Schafer, A., Horn, H. & Ahlrichs, R. (1992). J. Chem. Phys. 97, 2571±
2577.Scherer, W., Hieringer, W., Spiegler, M., Sirsch, P., McGrady, G. S.,
Downs, A. J., Haaland, A. & Pederson, B. (1998). J. Chem. Soc.Chem. Commun. pp. 2471±2472.
Schomaker, V. & Trueblood, K. N. (1968). Acta Cryst. B24, 63±76.Sheldrick, G. M. (1997). SHELXL97. University of GoÈ ttingen,
Germany.Smith, G. T., Mallinson, P. R., Frampton, C. S., Farrugia, L. J.,
Peacock, R. D. & Howard, J. A. K. (1997). J. Am. Chem. Soc. 119,5028±5034.
Su, Z. & Coppens, P. (1998). Acta Cryst. A54, 646±652.Tsirelson, V. G. & Ozerov, R. P. (1996). Electron Density and Bonding
in Crystals. Bristol: Institute of Physics Publishing.Veillard, A. & Rohmer, M.-M. (1992). Int. J. Quantum Chem. 42, 965±
976.Volkov, A., Abramov, Yu. A. & Coppens, P. (2001). Acta Cryst. A57,
272±282.Volkov, A., Abramov, Yu., Coppens, P. & Gatti, C. (2000). Acta Cryst.
A56, 332±339.Volkov, A. & Coppens, P. (2001). Acta Cryst. A57, 395±405.Volkov, A., Gatti, C., Abramov, Yu. & Coppens, P. (2000). Acta Cryst.
A56, 252±258.Wachters, A. J. H. (1969). IBM Tech. Rept. RJ584.Wachters, A. J. H. (1970). J. Chem. Phys. 52, 1033±1036.Wiberg, K. B. & Rablen, P. R. (1993). J. Comput. Chem. 14, 1504±
1518.Zobel, D., Luger, P., Dreissig, W. & Koritsanszky, T. (1992). Acta
Cryst. B48, 837±848.
Acta Cryst. (2003). B59, 234±247 Louis J. Farrugia et al. � Charge density in Mn2(CO)10 247
research papers
428 # 2003 International Union of Crystallography � Printed in Great Britain ± all rights reserved Acta Cryst. (2003). B59, 428
addenda and errata
Acta Crystallographica Section B
StructuralScience
ISSN 0108-7681
addenda and errata
Experimental charge density in thetransition metal complex Mn2(CO)10:a comparative study. Erratum
Louis J. Farrugia,a* Paul R. Mallinsona and Brian Stewartb
aDepartment of Chemistry, University of Glasgow, Glasgow G12 8QQ, Scotland,
and bDepartment of Chemisty and Chemical Engineering, University of Paisley,
Paisley PA1 2BE, Scotland. Correspondence e-mail: [email protected]
A value is missing in the third row of the O3ÐC3 section of
Table 3 on p. 238 of Farrugia et al. (2003). The missing value
which should be in the ®fth column is 13.757, and the
remaining entries should be transfered to the next column
along.
References
Farrugia, L. J., Mallinson, P. R. & Stewart, B. (2003). Acta Cryst. B59, 234±247.
Related Documents