Acta Cryst. (2002). A58, 547–551 Gu et al. Phasing of MIR diffraction data 547 research papers Acta Crystallographica Section A Foundations of Crystallography ISSN 0108-7673 Received 5 July 2002 Accepted 5 August 2002 # 2002 International Union of Crystallography Printed in Great Britain – all rights reserved Direct-method-aided phasing of MIR diffraction data from proteins Y. X. Gu, a W. R. Chang, b T. Jiang, b C. D. Zheng a and H. F. Fan a * a Institute of Physics, Chinese Academy of Sciences, Beijing 100080, People’s Republic of China, and b Institute of Biophysics, Chinese Academy of Sciences, Beijing 100101, People’s Republic of China. Correspondence e-mail: [email protected] Direct methods have successfully been used to break the phase ambiguity intrinsic in the single isomorphous replacement (SIR) data of proteins. Based on this, the procedure ‘direct-method-aided MIR phasing’ (DMIR) has been proposed and applied to the four-derivative multiple isomorphous replacement (MIR) data of a known protein containing 682 amino acid residuals in the asymmetric unit. The data set consists of 14500 unique reflections at 3 A ˚ resolution with F(obs.) greater than 2. Test calculation showed that the phases from conventional MIR phasing could be significantly improved by direct methods leading to obvious improvement in the quality of the resultant Fourier maps. 1. Introduction Attempts have long been made to break the phase ambiguity intrinsic in protein SIR data. This is important since it is not always easy to prepare suitable multiple isomorphous de- rivatives of proteins for diffraction data collection. The solvent-flattening method by Wang (1981, 1985) has been a successful procedure in practice. However, the method works only in the case that the replacing heavy atoms are in a non- centrosymmetric arrangement. Different kinds of direct methods have been proposed to break the phase ambiguity (Coulter, 1965; Fan, 1965; Karle, 1966; Hendrickson, 1971; Hauptman, 1982; Fan & Gu, 1985; Fortier et al., 1985; Klop et al., 1987; Giacovazzo et al. , 1988; Kyriakidis et al. , 1993). Tests with experimental protein data showed that the combination of the direct method (Fan & Gu, 1985) and the solvent-flat- tening procedure (Wang, 1981, 1985) leads to results better than that from solvent flattening alone (Zheng et al., 1997; Liu et al., 1999). Based on this technique, we propose here the direct-method-aided MIR phasing (DMIR) procedure. 2. Direct-method-aided MIR phasing A set of MIR data consists of several sets of SIR data, which correspond to different pairs of isomorphous derivatives. The conventional phasing of MIR data is to combine the bimodal phase distributions of different SIR data sets to give a unique phase indication for individual reflections. Since the contri- bution of replacing heavy atoms to the structure factors need not always be strong, the indication of phase for a consider- able number of reflections may be rather weak. Besides, imperfect isomorphism increases the phase error of reflections in the high-angle region. Hence it would be better to have some ways to improve MIR phases before using them to calculate a traceable Fourier map. Direct methods provide independent phase information without requiring additional experimental data. It can be used to improve phases from conventional MIR phasing. The DMIR (direct-method-aided MIR phasing) procedure is designed for this purpose. The technique is based on both the conventional MIR phasing and the direct-method treatment of SIR data. For details of the latter, the reader is referred to the original papers (Fan & Gu, 1985; Zheng et al., 1997; Liu et al., 1999). The points of the present method are as follows. (i) A few hundreds of reliable MIR phases are selected as the starting phases for direct-method SIR phasing. For conventional MIR phasing, it is not difficult to pick up some hundreds of reliable phases among thousands of reflections. On the other hand, these starting phases can greatly enhance the phasing power of direct methods. (ii) Direct-method phasing is first applied separately to each set of SIR data. The phasing result will be less affected by the imperfect isomorphism in comparison with MIR phasing. (iii) Sources of error in phases resulting from each separate direct-method SIR phasing and from MIR phasing are rather different. On the other hand, either direct-method SIR phasing or MIR phasing is followed by the same density- modification treatment. Resultant phases from each SIR data set and the MIR data set have comparable figures of merit. Hence they can be combined [see equations (1) and (2) below] to give a better estimation of phases. 2.1. Phasing strategy The flow chart of the DMIR procedure is shown in Fig. 1. The main points are:

Welcome message from author
This document is posted to help you gain knowledge. Please leave a comment to let me know what you think about it! Share it to your friends and learn new things together.
Transcript

Acta Cryst. (2002). A58, 547±551 Gu et al. � Phasing of MIR diffraction data 547
research papers
Acta Crystallographica Section A
Foundations ofCrystallography
ISSN 0108-7673
Received 5 July 2002
Accepted 5 August 2002
# 2002 International Union of Crystallography
Printed in Great Britain ± all rights reserved
Direct-method-aided phasing of MIR diffractiondata from proteins
Y. X. Gu,a W. R. Chang,b T. Jiang,b C. D. Zhenga and H. F. Fana*
aInstitute of Physics, Chinese Academy of Sciences, Beijing 100080, People's Republic of China,
and bInstitute of Biophysics, Chinese Academy of Sciences, Beijing 100101, People's Republic of
China. Correspondence e-mail: [email protected]
Direct methods have successfully been used to break the phase ambiguity
intrinsic in the single isomorphous replacement (SIR) data of proteins. Based
on this, the procedure `direct-method-aided MIR phasing' (DMIR) has been
proposed and applied to the four-derivative multiple isomorphous replacement
(MIR) data of a known protein containing 682 amino acid residuals in the
asymmetric unit. The data set consists of 14500 unique re¯ections at 3 AÊ
resolution with F(obs.) greater than 2�. Test calculation showed that the phases
from conventional MIR phasing could be signi®cantly improved by direct
methods leading to obvious improvement in the quality of the resultant Fourier
maps.
1. Introduction
Attempts have long been made to break the phase ambiguity
intrinsic in protein SIR data. This is important since it is not
always easy to prepare suitable multiple isomorphous de-
rivatives of proteins for diffraction data collection. The
solvent-¯attening method by Wang (1981, 1985) has been a
successful procedure in practice. However, the method works
only in the case that the replacing heavy atoms are in a non-
centrosymmetric arrangement. Different kinds of direct
methods have been proposed to break the phase ambiguity
(Coulter, 1965; Fan, 1965; Karle, 1966; Hendrickson, 1971;
Hauptman, 1982; Fan & Gu, 1985; Fortier et al., 1985; Klop et
al., 1987; Giacovazzo et al., 1988; Kyriakidis et al., 1993). Tests
with experimental protein data showed that the combination
of the direct method (Fan & Gu, 1985) and the solvent-¯at-
tening procedure (Wang, 1981, 1985) leads to results better
than that from solvent ¯attening alone (Zheng et al., 1997; Liu
et al., 1999). Based on this technique, we propose here the
direct-method-aided MIR phasing (DMIR) procedure.
2. Direct-method-aided MIR phasing
A set of MIR data consists of several sets of SIR data, which
correspond to different pairs of isomorphous derivatives. The
conventional phasing of MIR data is to combine the bimodal
phase distributions of different SIR data sets to give a unique
phase indication for individual re¯ections. Since the contri-
bution of replacing heavy atoms to the structure factors need
not always be strong, the indication of phase for a consider-
able number of re¯ections may be rather weak. Besides,
imperfect isomorphism increases the phase error of re¯ections
in the high-angle region. Hence it would be better to have
some ways to improve MIR phases before using them to
calculate a traceable Fourier map. Direct methods provide
independent phase information without requiring additional
experimental data. It can be used to improve phases from
conventional MIR phasing. The DMIR (direct-method-aided
MIR phasing) procedure is designed for this purpose. The
technique is based on both the conventional MIR phasing and
the direct-method treatment of SIR data. For details of the
latter, the reader is referred to the original papers (Fan & Gu,
1985; Zheng et al., 1997; Liu et al., 1999). The points of the
present method are as follows.
(i) A few hundreds of reliable MIR phases are selected as
the starting phases for direct-method SIR phasing. For
conventional MIR phasing, it is not dif®cult to pick up some
hundreds of reliable phases among thousands of re¯ections.
On the other hand, these starting phases can greatly enhance
the phasing power of direct methods.
(ii) Direct-method phasing is ®rst applied separately to each
set of SIR data. The phasing result will be less affected by the
imperfect isomorphism in comparison with MIR phasing.
(iii) Sources of error in phases resulting from each separate
direct-method SIR phasing and from MIR phasing are rather
different. On the other hand, either direct-method SIR
phasing or MIR phasing is followed by the same density-
modi®cation treatment. Resultant phases from each SIR data
set and the MIR data set have comparable ®gures of merit.
Hence they can be combined [see equations (1) and (2) below]
to give a better estimation of phases.
2.1. Phasing strategy
The ¯ow chart of the DMIR procedure is shown in Fig. 1.
The main points are:

research papers
548 Gu et al. � Phasing of MIR diffraction data Acta Cryst. (2002). A58, 547±551
51 (i) The conventional MIR phasing is ®rst applied to a set
of MIR data.
(ii) MIR phases with ®gures of merit larger than a certain
limit, say 0.95, are used as starting phases in the direct-method
phasing.
(iii) The MIR data are divided into n sets of SIR data; n is
the number of isomorphous heavy-atom derivatives.
(iv) Direct methods are used to break the phase ambiguity
of each set of SIR data based on the starting phases from the
conventional MIR phasing.
(v) Density modi®cation is applied to the direct-method-
phased SIR Fourier map.
(vi) Combine the resultant phases after density modi®ca-
tion.
(vii) Combine the combined SIR phases with the conven-
tional MIR phases.
The phase combination is performed according to the
following formulas:
'combined � tanÿ1
Pnj�1�mh sin 'best�jPnj�1�mh cos 'best�j
" #; �1�
�mh�combined �
��Pnj�1
�mh sin 'best�j�2
��Pn
j�1
�mh cos 'best�j�2�1=2
n;
�2�
where n is the number of phase sets involved in the combi-
nation. Such a combination can be regarded as a reciprocal-
space equivalent of calculating a sum function of Fourier maps
corresponding to the n sets of phases.
Figure 1The ¯ow chart of the DMIR procedure.
Table 1Summary of the test data from the protein (R)-phycoerythrin.
Space group R3Unit cell a = 189.8, c = 60.1 AÊ
No. of residues in the a.u. 682No. of derivatives 4Replacing atoms Au, Pt, Hg, HgResolution limit 3.0 AÊ
No. of unique re¯ections 14500
Table 2Comparison of MIR phasing and DMIR phasing via phase error[weighted by the product of F(obs.) and the corresponding ®gure ofmerit] for cumulative re¯ection groups.
No. ofre¯ections in
Averaged phase error (�)
the cumulativegroup MIR+dm (CCP4) DMIR+dm (CCP4)
Change fromMIR to DMIR
500 38.57 34.79 ÿ3.781000 42.04 37.47 ÿ4.573000 48.28 43.69 ÿ4.595000 50.32 46.72 ÿ4.057000 51.65 48.05 ÿ3.609000 52.96 49.86 ÿ3.10
11000 53.94 51.13 ÿ2.8113000 54.68 52.15 ÿ2.5314500 55.11 52.72 ÿ2.39
Figure 2A portion of the Fourier map of R-PE around residue 25. (a) Fromconventional MIR phasing; (b) from DMIR phasing. Contour level =1.2�. The ®nal structure model from the PDB ®le is superimposed.
2.2. Data and test results
The known protein (R)-phycoerythrin (R-PE) (Chang et al.,
1996) was used for testing the DMIR procedure. The structure
was originally solved using programs in the CCP4 suite
(Collaborative Computational Project, Number 4, 1994). A
summary of the data is shown in Table 1. The abbreviation a.u.
in the table stands for asymmetric unit.
In our test, the starting
phases for direct-method
phasing were selected from the
original MIR phases according
to their ®gures of merit. The
density modi®cation was
performed using the program
dm in the CCP4 suite (Colla-
borative Computational
Project, Number 4, 1994).
Resultant phases were cumu-
lated in descending order of
F(obs.). Average phase errors
[weighted by the product of
F(obs.) and the corresponding
®gure of merit] of the cumula-
tive groups are listed in Table 2.
As is seen, MIR phases are
clearly improved by the DMIR procedure especially for the
top 5000 strongest re¯ections, which is about one third of the
total re¯ections. This ensures signi®cant improvement in the
quality of the resultant Fourier maps. Table 3 shows the
variation of the averaged phase error against d spacing
(resolution). Signi®cant improvement of MIR phases through
DMIR phasing is observed at the resolution range of 5.0 to
3.5 AÊ . This led to obvious improvement in the connectivity of
the resultant electron-density map. Comparison of the Fourier
map resulting from MIR phasing and that from DMIR phasing
Acta Cryst. (2002). A58, 547±551 Gu et al. � Phasing of MIR diffraction data 549
research papers
Figure 3A portion of the Fourier map of R-PE around residue 38. (a) Fromconventional MIR phasing; (b) from DMIR phasing. Contour level =1.2�. The ®nal structure model from the PDB ®le is superimposed.
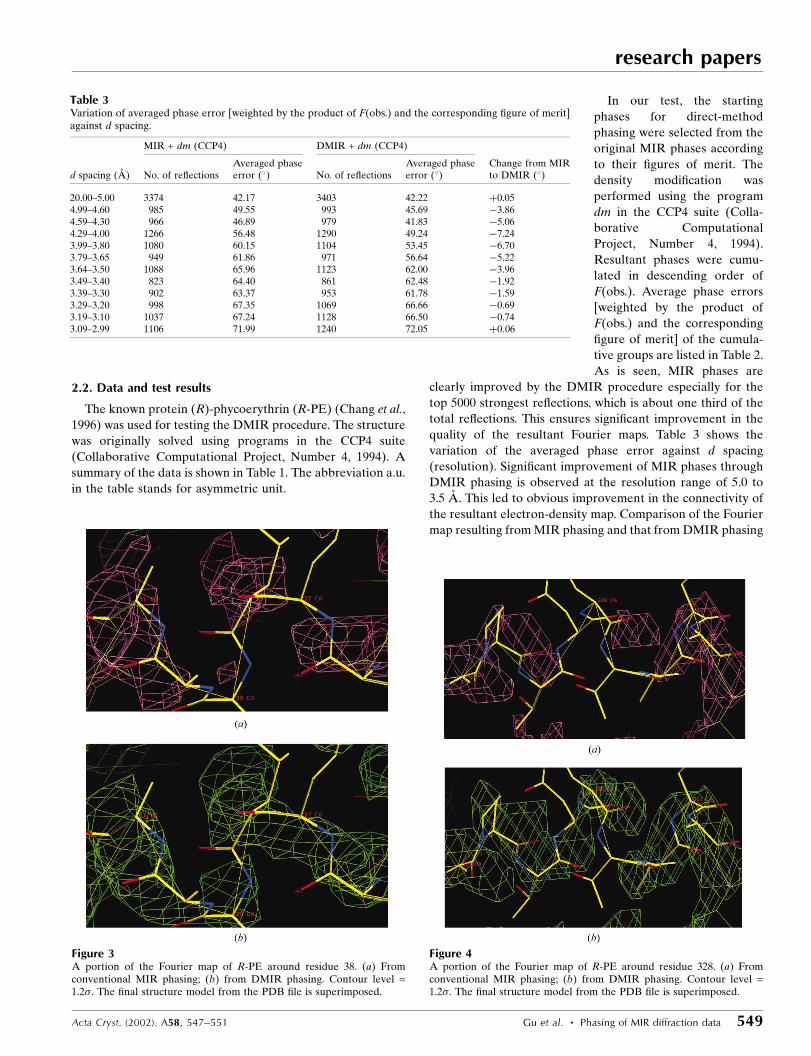
Figure 4A portion of the Fourier map of R-PE around residue 328. (a) Fromconventional MIR phasing; (b) from DMIR phasing. Contour level =1.2�. The ®nal structure model from the PDB ®le is superimposed.
Table 3Variation of averaged phase error [weighted by the product of F(obs.) and the corresponding ®gure of merit]against d spacing.
MIR + dm (CCP4) DMIR + dm (CCP4)
d spacing (AÊ ) No. of re¯ectionsAveraged phaseerror (�) No. of re¯ections
Averaged phaseerror (�)
Change from MIRto DMIR (�)
20.00±5.00 3374 42.17 3403 42.22 �0.054.99±4.60 985 49.55 993 45.69 ÿ3.864.59±4.30 966 46.89 979 41.83 ÿ5.064.29±4.00 1266 56.48 1290 49.24 ÿ7.243.99±3.80 1080 60.15 1104 53.45 ÿ6.703.79±3.65 949 61.86 971 56.64 ÿ5.223.64±3.50 1088 65.96 1123 62.00 ÿ3.963.49±3.40 823 64.40 861 62.48 ÿ1.923.39±3.30 902 63.37 953 61.78 ÿ1.593.29±3.20 998 67.35 1069 66.66 ÿ0.693.19±3.10 1037 67.24 1128 66.50 ÿ0.743.09±2.99 1106 71.99 1240 72.05 �0:06

research papers
550 Gu et al. � Phasing of MIR diffraction data Acta Cryst. (2002). A58, 547±551
shows that within the asymmetric unit there are more than 20
places where the DMIR map is signi®cantly better than the
MIR map. Four examples are shown in Figs. 2 to 5, respec-
tively. In contrast, there are only about 5 places in the asym-
metric unit where the MIR map is better. An example is
shown in Fig. 6.
3. Concluding remarks
The direct-method SIR phasing used in this paper is different
from any kind of existing MIR phasing. It is also different from
various kinds of density modi®cation. Hence, direct-method
SIR phasing can provide independent phase indications and
there exists the opportunity by incorporating the direct
method to improve a set of MIR phases obtained by other
methods. The present test proved that it is true at least for one
example. The test was done with a known protein of moderate
size, which is the biggest one so far treated by direct methods
at a resolution as low as 3 AÊ . The result showed that the
DMIR procedure could signi®cantly improve the MIR phases
of the test sample leading to much better electron densities in
the resultant Fourier map. Hopefully, in some cases when the
conventional MIR technique failed to solve the structure, the
DMIR procedure may be capable of producing a traceable
Fourier map.
This project was initiated according to a very helpful
discussion with Professor Liang Dong-cai. GYX and FHF
thank Professor M. M. Woolfson, Professor E. Dodson and
Dr J. X. Yao for helpful discussions. The project is supported
by the Chinese Academy of Sciences, the British Royal
Society and the Ministry of Science and Technology of China,
grant No. G1999075604.
Figure 5A portion of the Fourier map of R-PE around residue 432. (a) Fromconventional MIR phasing; (b) from DMIR phasing. Contour level =1.2�. The ®nal structure model from the PDB ®le is superimposed.
Figure 6A portion of the Fourier map of R-PE around residue 512. (a) Fromconventional MIR phasing; (b) from DMIR phasing. Contour level =1.2�. The ®nal structure model from the PDB ®le is superimposed.

ReferencesChang, W. R., Jiang, T., Wan, Z. L., Zhang, J. P., Yang, Z. & Liang,
D. C. (1996). J. Mol. Biol. 262, 721±731.Collaborative Computational Project, Number 4 (1994). Acta Cryst.
D50, 760±763.Coulter, C. L. (1965). J. Mol. Biol. 12, 292±295.Fan, H. F. (1965). Acta Phys. Sin. 21, 1114±1118 (in Chinese); Engl.
transl: Chinese Phys. pp. 1429±1435.Fan, H. F. & Gu, Y. X. (1985). Acta Cryst. A41, 280±284.Fortier, S. Moore, N. J. & Fraser, M. E. (1985). Acta Cryst. A41,
571±577.Giacovazzo, C., Cascarano, G. & Zheng, C. (1988). Acta Cryst. A44,
45±51.
Hauptman, H. (1982). Acta Cryst. A38, 289±294.Hendrickson, W. A. (1971). Acta Cryst. B27, 1474±1475.Karle, J. (1966). Acta Cryst. 21, 273±276.Klop, E. A. Krabbendam, H. & Kroon, J. (1987). Acta Cryst. A43,
810±820.Kyriakidis, C. E., Peschar, R. & Schenk, H. (1993). Acta Cryst. A49,
557±569.Liu, Y. D., Gu, Y. X., Zheng, C. D., Hao, Q. & Fan, H. F. (1999). Acta
Cryst. D55, 846±848.Wang, B. C. (1981). Acta Cryst. A37, C11.Wang, B. C. (1985). Methods Enzymol. 115, 90±112.Zheng, X. F., Zheng, C. D., Gu, Y. X., Mo, Y. D., Fan, H. F. & Hao, Q.
(1997). Acta Cryst. D53, 49±55.
Acta Cryst. (2002). A58, 547±551 Gu et al. � Phasing of MIR diffraction data 551
research papers
Related Documents