RESEARCH PAPER Total quality management (TQM) strategy and organisational characteristics: Evidence from a recent WTO member Dinh Thai Hoang a , Barbara Igel b∗ and Tritos Laosirihongthong c a University of Economics, Hochiminh City, Vietnam; b School of Management, Asian Institute of Technology, Pathumthani 12120, Thailand; c Industrial Engineering Department, Faculty of Engineering, Thammasat University, Pathumthani 12121, Thailand This paper presents a comparative study on the relationship between implementing total quality management (TQM) and organisational characteristics (size, type of industry, type of ownership, and degree of innovation) in a newly industrialised country in South East Asia. Vietnam has become the 150th member of the World Trade Organisation (WTO) since January 2007, and this is the first empirical study to examine TQM practices in Vietnam. Analysis through Structural Equation Modelling, t-test and MANOVA of survey data from 222 manufacturing and service companies produced three major findings. First, this study supports previous research findings that TQM can be considered as set of practices. Second, industries in Vietnam have deployed certain TQM practices (customer focus and top management commitment) at much higher levels than others, namely information and analysis system, education and training, employee empowerment, and process management. Finally, MANOVA shows a clear difference in TQM practices by company size, industry type, and degree of innovation. Large companies had higher implementation levels across almost all practices except for teamwork and open organisation when compared to small- and medium-sized companies. TQM practices were statistically more significant in manufacturing companies compared to service companies, and firms having a higher degree of innovation also showed higher levels of TQM practice implementation. In particular, the low deployment of TQM practices in service industries, where TQM has been considered as order- qualifier, highlights the challenges for Vietnam’s service industries that pursue TQM to successfully compete in the global marketplace. Keywords: total quality management; organisational characteristics; Vietnam; WTO; MANOVA; empirical research; Structural Equation Modelling; manufacturing/service company 1. Introduction The introduction of total quality management (TQM) has played an important role in the development of contemporary management. Quality, considered a key strategic factor in achieving business success, is more than ever required for competing successfully in today’s global market place (Dean & Evans, 1994), and it has become the key slogan as organisations strive for a competitive advantage in markets characterised by liberalisa- tion, globalisation and knowledgeable customers (Sureshchandar, Chandrasekharan, & ISSN 1478-3363 print/ISSN 1478-3371 online # 2010 Taylor & Francis DOI: 10.1080/14783363.2010.487680 http://www.informaworld.com ∗ Corresponding author. Email: [email protected] Total Quality Management Vol. 21, No. 9, September 2010, 931–951

Welcome message from author
This document is posted to help you gain knowledge. Please leave a comment to let me know what you think about it! Share it to your friends and learn new things together.
Transcript

RESEARCH PAPER
Total quality management (TQM) strategy and organisationalcharacteristics: Evidence from a recent WTO member
Dinh Thai Hoanga, Barbara Igelb∗ and Tritos Laosirihongthongc
aUniversity of Economics, Hochiminh City, Vietnam; bSchool of Management, Asian Institute ofTechnology, Pathumthani 12120, Thailand; cIndustrial Engineering Department, Faculty ofEngineering, Thammasat University, Pathumthani 12121, Thailand
This paper presents a comparative study on the relationship between implementingtotal quality management (TQM) and organisational characteristics (size, type ofindustry, type of ownership, and degree of innovation) in a newly industrialisedcountry in South East Asia. Vietnam has become the 150th member of the WorldTrade Organisation (WTO) since January 2007, and this is the first empirical studyto examine TQM practices in Vietnam. Analysis through Structural EquationModelling, t-test and MANOVA of survey data from 222 manufacturing and servicecompanies produced three major findings. First, this study supports previousresearch findings that TQM can be considered as set of practices. Second, industriesin Vietnam have deployed certain TQM practices (customer focus and topmanagement commitment) at much higher levels than others, namely informationand analysis system, education and training, employee empowerment, and processmanagement. Finally, MANOVA shows a clear difference in TQM practices bycompany size, industry type, and degree of innovation. Large companies had higherimplementation levels across almost all practices except for teamwork and openorganisation when compared to small- and medium-sized companies. TQMpractices were statistically more significant in manufacturing companies comparedto service companies, and firms having a higher degree of innovation also showedhigher levels of TQM practice implementation. In particular, the low deployment ofTQM practices in service industries, where TQM has been considered as order-qualifier, highlights the challenges for Vietnam’s service industries that pursue TQMto successfully compete in the global marketplace.
Keywords: total quality management; organisational characteristics; Vietnam; WTO;MANOVA; empirical research; Structural Equation Modelling; manufacturing/servicecompany
1. Introduction
The introduction of total quality management (TQM) has played an important role in the
development of contemporary management. Quality, considered a key strategic factor in
achieving business success, is more than ever required for competing successfully in
today’s global market place (Dean & Evans, 1994), and it has become the key slogan
as organisations strive for a competitive advantage in markets characterised by liberalisa-
tion, globalisation and knowledgeable customers (Sureshchandar, Chandrasekharan, &
ISSN 1478-3363 print/ISSN 1478-3371 online
# 2010 Taylor & Francis
DOI: 10.1080/14783363.2010.487680
http://www.informaworld.com
∗Corresponding author. Email: [email protected]
Total Quality Management
Vol. 21, No. 9, September 2010, 931–951

Anantharaman, 2001). Following Millar’s (1987) predictation that there will be two kinds
of company in the future – companies which have implemented total quality and
companies which are out of business, companies worldwide, large and small, both in
the manufacturing and service sectors, have adopted quality strategies, and made
TQM a well accepted part of almost every manager’s ‘tool kit’ (Dow, Swanson, &
Ford, 1999).
The main reason for considering Vietnam as a case study is that this country has
become the 150th member of the World Trade Organisation (WTO), a milestone
expected to launch an era of radical changes as the communist nation enters the
global market place. Being Southeast Asia’s second most populous country after Indo-
nesia, Vietnam expects that the new status as a signatory member of the international
trading system will accelerate rapid economic growth, making it the second biggest
economy in East Asia after China. Under its membership terms, Vietnam needs to
scrap a range of tariffs, subsidies and other barriers that protect local manufacturing
and service industries. In turn, Vietnam, a major exporter of oil, textile, footwear,
rice, seafood, and coffee, will face fewer hurdlers in selling its goods in the global
markets and will have recourse through the WTO in case of trade disputes. In
addition, strengthening its industries through the adoption of international manu-
facturing and operations strategies such as TQM, supply chain management, and
research and development is also crucial for maintaining the nation’s economic
competitiveness.
Numerous Vietnamese companies that could not succeed in international contract
biddings or exports because their products are of unacceptable quality (Hung, 2003)
have recognized the important role TQM can play in facing the challenges of economic
integration and globalisation. As certification statistics show Vietnam’s industries
consider TQM an effective strategy to improve their product and service quality:
by August 2006, 1683 Vietnamese organisations were ISO 9001 certified (Vietnam
Productivity Centre, http://www.vpc.org.vn) and had established an association called
the ‘ISO Club’ to stimulate TQM adoption and share experiences among its members.
Research on TQM in Vietnam, especially the benefits and managerial challenges for
Vietnam’s industries, however, is scarce.
Thus, the purpose of this study is to investigate the relationship between the firm’s
organisational characteristics and TQM implementation in Vietnamese companies. Two
research questions are explored:
a) Can TQM strategy be considered as a set of practices?
b) Are there any differences in implementing TQM between companies according to
size, ownership, type of industry, and degree of innovation (measured by the
number of new products and services)?
It is important to note that we adopt a new perspective when examining the relationship
between TQM and innovation (Prajogo & Sohal, 2003b; Hoang, Igel, & Laosirihongthong,
2006), where the degree of innovation is considered as an organisational characteristic
(independent variable) that influences TQM practices (dependent variable).
The next section reviews literatures about the relationship between TQM and organis-
ational characteristics, followed by the research methodology used in this study. After pre-
senting the analysis of data gathered in the Vietnamese firms and a discussion of the
results, several conclusions on the impact of firm size, industry type and innovation on
TQM practices are drawn.
932 D.T. Hoang et al.

2. Literature review
2.1. TQM as operational strategy
The literature presents so many definitions and descriptions of TQM that sometimes it
seems as if each author has its own definition and each organisation has its own implemen-
tation (Watson & Korukonda, 1995). However, no TQM discussion is complete without
acknowledging the work of the five best known TQM experts, or ‘quality gurus’:
Deming, Juran, Feigenbaum, Crosby and Ishikawa. In a recent study, Reed, Lemark,
and Mero (2000) systematically reviewed the work and ideas of these TQM experts –
Deming (1982, 1986), Juran (1974, 1988, 1989, 1992), Crosby (1979, 1996), Feigenbaum
(1951, 1983, 1991), and Ishikawa (1985) – and pointed out the shared similarities on TQM
elements. This review revealed that they all agreed on the importance of the following six
key elements: customer satisfaction, cost reduction, leadership and top management com-
mitment, training and education, teamwork and organisational culture. In addition to the
complete agreement reflected in the above six elements, Reed et al. (2000) also found
commonly shared differences regarding the other TQM elements. The role statistical
tools play in improving quality control was emphasised by everyone except Crosby
(1996), who implied that the use of statistical control was not a core quality management
issue. Similarly, while Feigenbaum, Ishikawa, and Juran stressed product design, Deming
and Crosby did not. With the exception of Crosby, all mentioned planning, but each dealt
with different aspects of it. Juran covered all facets of planning, Deming was concerned
mostly with the stages of planned action, while Feigenbaum and Ishikawa focused on
feedback and control. Let us take a look at some of the definitions and TQM elements
that other researchers have proposed.
TQM can be defined as a set of techniques and procedures used to reduce or elimin-
ate variation from a production process or service-delivery system in order to improve
efficiency, reliability, and quality (Steingrad & Fitzgibbons, 1993). Vuppalapati,
Ahire, and Gupta (1995) stated that TQM is an integrative philosophy of management
for the continuous improvement of product and process quality in order to achieve
customer satisfaction. According to Dean and Bowen (1994), TQM is a management
philosophy or an approach characterised by principles, practices, and techniques. They
pointed out three principles that most quality frameworks had in common – customer
focus, continuous improvement, and teamwork. Each principle is implemented through
a set of practices, and these practices, in turn, are supported by a broad set of techniques.
Anderson, Rungtusanatham, and Schroeder (1994) identified some core TQM com-
ponents derived from Deming’s 14-point programme using the Delphi method. These
components reflect Deming’s principles and are either explicitly or implicitly similar
to the factors included in the other quality management frameworks. However, its weak-
ness is the lack of a systematic scale development and content validity (Motwani, 2001).
Joseph, Rajendran, and Kamalanabhan (1999) identified the following 10 TQM factors
organisational commitment, human resource management, supplier integration, quality
policy, product design, the role of the quality department, quality information systems,
technology utilisation, operating procedures and training. They also developed a
measurement that can be used to evaluate the extent to which these TQM practices
are deployed in an organisation. According to Motwani (2001), the philosophy of
TQM could be visualised as constructing a house with top management commitment
being the foundation or base. On top of a solid foundation, four pillars are constructed
that include process management, quality measurement and control, employee training,
and customer focus.
Total Quality Management 933

Six studies by Saraph, Benson, and Schroeder (1989), Flynn, Schroeder, and Sakaki-
bara (1994), Powell (1995), Ahire, Golhar, and Waller (1996), Black and Porter (1996),
and Zeitz, Johannesson, and Ritchie (1997) are often cited as examples of a holistic
approach to TQM. Although different in the terminologies used, these authors shared
the common TQM factors in their models: the role of top management, customer satisfac-
tion orientation, teamwork structures, employee empowerment, employee involvement,
employee training, product/service design, supplier management, continuous improve-
ment, process management/operating, quality improvement measurement systems,
quality data and reporting, planning, benchmarking, SPC (statistical process control), cor-
porate quality culture, and strategic quality management. These studies are more compre-
hensive in nature, seem to integrate most of the TQM implementation constructs and have
proposed validating scales that take an integrated approach to TQM (Motwani, 2001).
Dow et al. (1999) developed a TQM model in order to explore the impact of TQM
practices on the firm’s quality performance. They indicated that quality practices can be
categorised into nine dimensions: workforce commitment, shared vision, customer
focus, use of teams, personnel training, cooperative supplier relations, use of benchmark-
ing, advanced manufacturing systems, and use of just-in-time principles. These constructs
were similar with those identified in the six above studies, except for the use of teams, and
just-in-time principles.
Sila and Ebrahimpour (2002) analysed survey-based research on TQM conducted in
different countries that was published in a variety of journals between 1989–2000.
They found that the empirically researched TQM practices could be grouped under 25
categories. The first seven factors are considered to be the major elements of TQM and
Sila and Ebrahimpour (2002) say this concurs with many authors’ ideas. It is not
surprising that issues related to customer focus and satisfaction received the most attention
in the TQM survey literature because of the major push toward a customer satisfaction
orientation in virtually all types of businesses. Two of the seven practices that received
the highest coverage (training and employee involvement) relate to human resource
management, and assign human resources a critical role in the implementation of TQM.
In addition, great attention was paid to the role of leadership and top management commit-
ment as well as to giving authority to employees – that is, empowerment – to make their
own decisions (Spreitzer, 1995; Ahire et al., 1996; Ahmed, 1998; Motwani, 2001).
Furthermore, issues related to quality information and performance measurement were
also embraced by most studies.
Prajogo and Sohal (2003a) investigated the relationship between TQM and organis-
ational performance by exploring six TQM practices proposed by Samson and Terziovski
(1999). These practices are divided into two groups: mechanistic elements and organic
elements. Mechanistic elements include customer focus, process management, strategic
and planning, information and analysis, while the organic elements are leadership and
people management. This categorisation was based on Kruger’s (1998, 2001) proposition
that TQM should include a combination of both people (soft element) and technical
systems (hard element). The mechanistic elements (customer focus, process management,
and so forth) could be considered the hard aspect and the organic elements (that is, leader-
ship and people management) represent the soft aspect. Kruger (1998) emphasised the
human aspect of TQM, because only the humanistic orientation of TQM towards organ-
isational analysis will allow successful TQM in actual practice.
According to Prajogo and Sohal (2003a), justification for using Samson and
Terziovski’s model (1999) is that this model constitutes the criteria of the Malcolm
Baldrige National Quality Award (MBNQA) that has been accepted to represent TQM
934 D.T. Hoang et al.

strategy by several scholars such as Evans and Lindsay (1993), Juran (1995) and Ahire,
Landeros, and Golhar (1995).
In a recent empirical study, Rahman and Bullock (2005) also explored the relationship
between TQM practices and organisational performance using data from 261 Australian
manufacturing companies. Adopted from Dow et al. (1999) and Power, Amrik, and
Rahman (2001), they formed a model with 10 TQM constructs: workforce commitment,
shared vision, customer focus, use of teams, personnel training, cooperative supplier
relations, computer base technologies, just-in-time principles, technology utilisation,
and continuous improvement enablers. The first six constructs were considered as the
soft elements, and the remaining four constructs as the hard elements of TQM. Elements
of soft TQM are essentially dimensions of human resource management, like workforce
commitment, training and so on, while hard elements relate to continuous improvement
or treat organisations as total systems (Rahman & Bullock, 2005). The results of this
study suggested that, in general, the soft TQM dimensions are significantly related to
organisational performance. These findings are broadly similar to that of Samson and
Terziovski (1999), Powell (1995), and Dow et al. (1999). In addition to direct effects,
soft TQM elements also have an indirect effect on performance through their effect on
hard TQM elements. This study also provided evidence that certain hard TQM elements
have a significant impact on performance and suggested that for having such an impact,
hard TQM elements need a support from elements of soft TQM.
2.2. The relationship between TQM and organisational characteristics
Many previous studies reveal that the size of a company (Gagnon & Toulouse, 1996;
Germain, 1996) and principal ownership (Ahire et al., 1995; Swamidass & Kotha,
1998) are related to management practices in implementation of TQM. For example,
organisational culture refers to attitudes, beliefs, and situational interactions. It has been
influenced by different types of ownership. As a result, the degree of TQM use is different.
To examine whether the organisational characteristics are considered important factors
determining investment in TQM, literature reviews are summarised as following.
2.2.1 TQM and size of company
A number of previous studies have been published that directly examine the relationship
between organisational characteristics – company size, ownership, and industry type –
and TQM practices. Almost all studies only considered organisational characteristics as
variables that moderate the relationship between TQM practices and organisation perform-
ance (Choong, 2004). Terziovski and Samson (1999) found that there were significant
differences in the relationship between TQM and organisational performance when the
size of the company was taken into account, particularly the effect on new product devel-
opment. Larger companies tended to benefit more from TQM than smaller firms. These
findings are consistent with some other studies (Garvin, 1988; GAO Study, 1991).
However, Ahire and Golhar (2001) indicated that there were no operational differences
in TQM implementation attributable to firm size, and that small and large firms that pro-
duced high quality products implemented TQM equally effectively. Recently, Haar and
Spell (2008) examined the adoption rates of TQM by New Zealand firms, and the role
that company size plays in determining adoption rates. To predict the TQM adoption,
company size, workplace autonomy, performance standards, use of teams, and group
problem solving were factors used, in which the company size was considered as a
Total Quality Management 935

moderating variable. The study’s results show that firms with higher level of workplace
autonomy, use of performance standards, use of teams, and use of group problem
solving were more likely to adopt TQM, and this was more likely for larger companies
than smaller companies. These findings demonstrated that although most small firms
have some weaknesses such as limited markets, inadequate resources and lack of manage-
rial expertise, they still had advantages in flexibility and innovation that could allow them
to implement TQM as effectively as large firms.
2.2.2 TQM and ownership
Organisational culture or behaviour is influenced by the type of corporate ownership
(Yavas & Rezayat, 2003; Hui, Au, & Fock, 2004). Therefore, management needs to under-
stand how TQM strategy could be implemented effectively. Pun (2001) found no evidence
that culture in Chinese-owned companies influenced employee involvement, which is one
TQM practice. Noronha (2002) studied the impact of cultural values on TQM implemen-
tation in 385 companies in China, Hong Kong and Taiwan. The result of Structural
Equation Modeling (SEM) analysis shows that the underlying Chinese values of abase-
ment, addictiveness, harmony with people, harmony with the universe, interdependence,
and respect for authority influenced the dimensions of TQM. It is also important to link
cultural values (influenced by the different types or ownership) to TQM practice and
business results. Recently, Feng, Prajogo, Tan, and Sohal (2006) compared the experience
of organisations in Australia and Singapore with respect to the multidimensionality of
TQM and its relationship with quality performance and innovation performance. They dis-
covered significant differences of TQM implementation between Australian-owned and
Singaporean-owned companies.
2.2.3 TQM and type of industry
TQM was originally applied in manufacturing firms. Given its great success in manufac-
turing, academics and practitioners have explored the possibility of applying the TQM
strategy to the service sector. Silvestro (1998) contended that although developed in differ-
ent way in the service literature, the core TQM principles are highly relevant to services
area. Woon (2000) also stated that several service sectors, known as mass service, have a
similar process to manufacturing that would let them able to apply TQM practices. More-
over, the development of the ‘soft’ aspect of TQM that emphasises the human elements,
such as empowerment, employee involvement, culture, also stimulated its application in
the service area, the sector that was more applicable for these ‘soft’ elements of TQM
(Prajogo, 2005). Woon (2000) found that there was no significant difference between man-
ufacturing and service companies in the implementation of ‘soft’ TQM elements. Prajogo
(2005) suggested that, with the exception of people management, there is no significant
difference between manufacturing and service firms in terms of TQM practices and
quality performance. He even identified the service sector has having higher scores in
people management than the manufacturing sector. According to Prajogo, the plausible
reason is that manufacturing firms essentially rely on advanced manufacturing technology
to achieve high level of quality (precision) and other operational performance aspects.
In service organisations, on the other hand, human resources play a pivotal role in deter-
mining the product quality, particularly on non-physical dimensions, such customer
responsiveness, courtesy, and empathy. In addition, beyond tools and techniques, TQM
now has developed into a management philosophy that comprises a set of generic core
936 D.T. Hoang et al.
principles applied in different industries (Dean & Bowen, 1994; Grant, Shani & Krishnan,
1994, Sitkin, Sutcliffe, & Schroeder, 1994). This argument shows a fundamental base to
support the applicability of TQM in service firms that can benefit from implementing this
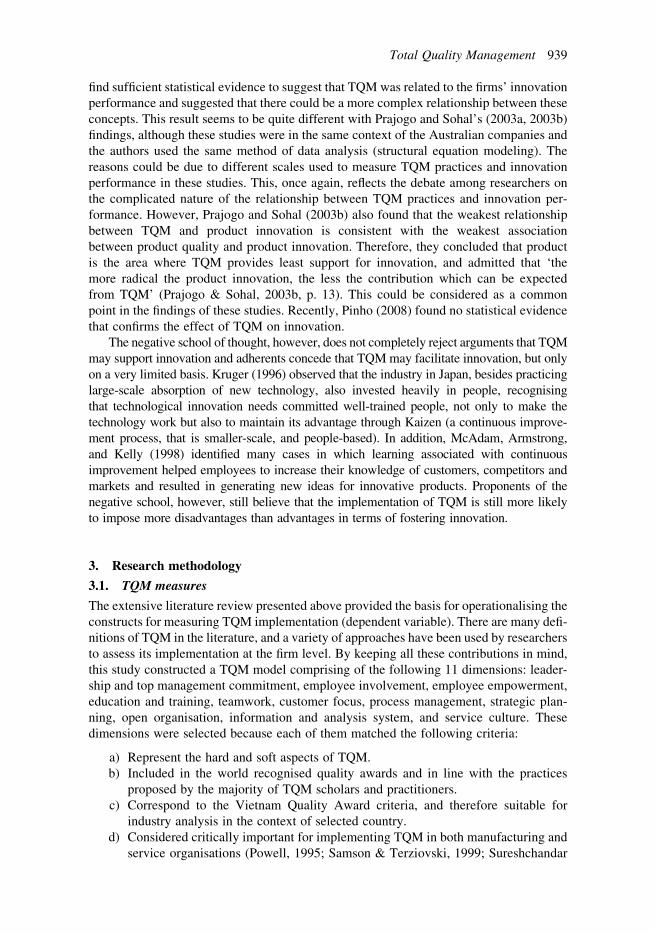
management philosophy (Prajogo, 2005). However, scholars have also noted differences
between manufacturing and service organisations that could limit applying TQM in ser-
vices (Silvestro, 1998; Sureshchandar et al., 2001; Prajogo, 2005). Firstly, compared to
the measurable, standardised characteristics of manufacturing products, the intangibility
and heterogeneity of the service output makes a remarkable difference. Secondly, the
concept of service quality is dominated by non-physical components (courtesy, responsive-
ness, and accessibility) (Zeithaml, Parasuraman, & Berry, 1990) that are more difficult to
define and, therefore, more difficult to measure. Thirdly, the consumption and delivery pro-
cesses in the service organisations usually take place at the same time, making it difficult to
control the quality of services provided. The difference in TQM implementation between
manufacturing and service companies has also been identified in a number of studies.
Compared to manufacturing firms, service organisations generally use fewer quality
tools and show a lower level of TQM implementation, particularly in ‘hard’ TQM elements
such as statistical process control, information analysis, process management (Badri, Davis,
& Davis, 1995; Beaumont, Sohal, & Terziovski, 1997; Woon, 2000). It is remarkable to
note the slight difference with Prajogo’s (2005) results mentioned above. One reason
could be the different sets of variables used to measure TQM implementation. The other
reason could be differences in defining the differences between manufacturing and
service industries. For example, the construction industry contains a large portion of
physical components in its products which can be mostly linked to manufacturing, while
it was classified as service in some studies (Prajogo, 2005).
2.2.4 TQM and degree of innovation
Concerning the relationship between TQM and innovation in the literature, there are two
opposing schools of thought. One school believes that TQM supports innovation, implying
that organisations that implement TQM will be successful in innovation. The alternative
school argues that TQM impedes innovation. The main debatable issue is whether or
not the nature of TQM practices fosters innovation.
The supporting perspective is based on the argument that the TQM practices, in both
its human and technology dimensions, help to create an environment and culture that
support innovation. One of the core components of TQM is customer satisfaction. Com-
panies that implement TQM have to explore and find ways to serve customer needs and
expectations at the best. This creates the impetus for companies to be innovative in devel-
oping and launching new products or services to match the customer’s needs. Several
studies also identified a positive relationship between TQM and innovation in terms of
the speed to market (Flynn et al., 1994), and the level of innovation in organisations
(Baldwin & Johnson, 1996). Terziovski and Samson (2000) tested the strength of the
relationship between TQM practices (independent variables) and organisational perform-
ance (dependent variables) in a large random sample of manufacturing companies in
Australia and New Zealand. They considered innovation as a dependent variable that
represents organisational performance measured by the number of new products produced,
but could not confirm a significantly positive effect on innovation across the whole sample.
However, when co-varied for industry type, the strength of the relationship between TQM
and innovation changed from insignificantly positive to significantly positive, suggesting
Total Quality Management 937

that the relationship between TQM and innovation is strengthened when investigated for a
specific industry type.
In a survey of 194 managers in Australia who worked in both manufacturing and
service companies, although verifying that both mechanistic and organic elements can
coexist under the umbrella of TQM, Prajogo and Sohal (2003a) concluded that each
type of practice (mechanistic versus organic elements) has a different role in determining
different performance measures. They found customer focus and process management
(mechanistic elements) being associated with product quality while leadership and
people management (organic elements) were related to innovation. With another research
framework, Prajogo and Sohal (2003b) also found that TQM had a significantly positive
relationship with all the product quality, process innovation, and product innovation,
although the magnitude of the relationship appeared to be strongest with the product
quality, followed by process innovation, and finally product innovation. Thus, they
suggested that TQM has a higher explanatory power on quality performance than on inno-
vation performance. Moreover, they also found three causal relationships among the three
performance variables, although product quality demonstrated a stronger association with
process innovation rather than with product innovation. They stated that these significant
causal relationships among the three performance variables not only deny the theoretical
proposition suggesting a negative relationship between quality and innovation perform-
ance, but also indicates cross-fertilisation between quality and innovation performance,
particularly that involving process innovation. Their result indicated that process inno-
vation is strongly related to both product quality and product innovation performance
and, therefore, they come to an inference that process innovation mediates the relationship
between the other two performance variables. Prajogo and Sohal (2006) investigate the co-
alignment between TQM and technology/research and development (R&D) management
in predicting an organisation’s quality and innovation performances. They found TQM has
a strong predictive power against quality performance but no significant relationship
against innovation performance. On the other hand, technology and R&D management
shows a significant relationship with both quality and innovation performances. It is
noticeable that while the relationship between technology and R&D management and
quality performance is at a somewhat lower level than that of TQM, a much stronger
relationship with innovation performance was found out. An implication was drawn that
technology/R&D management is an appropriate source to be used in harmony with
TQM to enhance organisational performance, particularly innovation. Feng et al. (2006)
present a comparative analysis on TQM between Australian and Singaporean organisations.
They found the validity of the multidimensionality of TQM in terms of mechanistic and
organic components, and conclude that the more organic practices, such as leadership and
people management, are related to more innovation; and the more mechanistic practices,
such as customer focus and process management, are associated more with quality perform-
ance. Therefore, they suggested that organisations should be concerned with both organic and
mechanistic components of TQM since both innovation and quality performance are needed
for organisational survival in today’s competitive and fast changing market.
Although the above arguments propose a positive relationship between TQM and inno-
vation, there is also an opposing school of thought (represented by Wind & Mahajan,
1997; Tidd, Bessant, & Pavitt, 1997; Slater & Narver, 1998; Kim & Marbougne, 1999),
that claims TQM can actually hinder innovation. Atuahene-Gima (1996) argued that cus-
tomer focus is concerned with product conformance (product quality), but not with product
newness (product innovation). Research from 418 Australian manufacturing firms by
Singh and Smith (2004) seems to confirm these earlier studies. Singh and Smith did not
938 D.T. Hoang et al.
find sufficient statistical evidence to suggest that TQM was related to the firms’ innovation
performance and suggested that there could be a more complex relationship between these
concepts. This result seems to be quite different with Prajogo and Sohal’s (2003a, 2003b)
findings, although these studies were in the same context of the Australian companies and
the authors used the same method of data analysis (structural equation modeling). The
reasons could be due to different scales used to measure TQM practices and innovation
performance in these studies. This, once again, reflects the debate among researchers on
the complicated nature of the relationship between TQM practices and innovation per-
formance. However, Prajogo and Sohal (2003b) also found that the weakest relationship
between TQM and product innovation is consistent with the weakest association
between product quality and product innovation. Therefore, they concluded that product
is the area where TQM provides least support for innovation, and admitted that ‘the
more radical the product innovation, the less the contribution which can be expected
from TQM’ (Prajogo & Sohal, 2003b, p. 13). This could be considered as a common
point in the findings of these studies. Recently, Pinho (2008) found no statistical evidence
that confirms the effect of TQM on innovation.
The negative school of thought, however, does not completely reject arguments that TQM
may support innovation and adherents concede that TQM may facilitate innovation, but only
on a very limited basis. Kruger (1996) observed that the industry in Japan, besides practicing
large-scale absorption of new technology, also invested heavily in people, recognising
that technological innovation needs committed well-trained people, not only to make the
technology work but also to maintain its advantage through Kaizen (a continuous improve-
ment process, that is smaller-scale, and people-based). In addition, McAdam, Armstrong,
and Kelly (1998) identified many cases in which learning associated with continuous
improvement helped employees to increase their knowledge of customers, competitors and
markets and resulted in generating new ideas for innovative products. Proponents of the
negative school, however, still believe that the implementation of TQM is still more likely
to impose more disadvantages than advantages in terms of fostering innovation.
3. Research methodology
3.1. TQM measures
The extensive literature review presented above provided the basis for operationalising the
constructs for measuring TQM implementation (dependent variable). There are many defi-
nitions of TQM in the literature, and a variety of approaches have been used by researchers
to assess its implementation at the firm level. By keeping all these contributions in mind,
this study constructed a TQM model comprising of the following 11 dimensions: leader-
ship and top management commitment, employee involvement, employee empowerment,
education and training, teamwork, customer focus, process management, strategic plan-
ning, open organisation, information and analysis system, and service culture. These
dimensions were selected because each of them matched the following criteria:
a) Represent the hard and soft aspects of TQM.
b) Included in the world recognised quality awards and in line with the practices
proposed by the majority of TQM scholars and practitioners.
c) Correspond to the Vietnam Quality Award criteria, and therefore suitable for
industry analysis in the context of selected country.
d) Considered critically important for implementing TQM in both manufacturing and
service organisations (Powell, 1995; Samson & Terziovski, 1999; Sureshchandar
Total Quality Management 939

et al., 2001; Sila & Ebrahimpour, 2002; Prajogo & Sohal, 2003a, 2003b; Das, Paul,
Swiersek, & Laosirihongthong, 2006; Hoang et al., 2006).
3.2. Organisational characteristics
The organisational characteristics (independent variable) adopted in this study were
company size, ownership, industry type, and degree of innovation (measured by the
number of new products/new services that the firm actually had developed and commer-
cialised over the last three years). For a size of companies, this study refers to the Decree
No. 681/CP/KTN issued by the Vietnamese Government on 20 June 1998, in Vietnam.
Company size is distinguished within three categories: small firms with less than 50
employees, medium size with 50–200 employees, and large firms with more than 200
employees (Ministry of Planning and Investment, 1999). The Ministry does not make
any difference in these measures for the manufacturing and service sectors.
3.3. Data collection
All the companies included in this survey had been ISO 9001 certified for at least 2 years.
This condition ensured that managers in the companies sampled for the questionnaire
survey had sufficient knowledge and experience with quality management practices. As
Carr, Leong, and Sheu (2000) noted, many Asian firms are reluctant to participate in
research surveys without first developing a personal relationship with the researchers.
We encountered the same attitude among our target firms in Vietnam as managers very
often hesitated to reply to the questionnaire sent by mail. For this reason, we had to
select a sample of companies in Hochiminh City and adjacent provinces that offered us
better conditions for data collection since we could rely on existing personal contacts
and relationships with the managers. The majority of Vietnamese organisations that
held the ISO 9001 certificate were located in Hochiminh City (Vietnam Productivity
Centre, http://www.vpc.org.vn). Therefore, our sample chosen from the ISO 9001 certified
firms in Hochiminh City region could be considered as sufficiently representative of
Vietnamese companies that practice quality management.
Questionnaires were sent to the managers of 500 companies, resulting in a total of 222
questionnaires returned, which is a response rate of 44.4% and one and a half times the
average response rate reported by previous research studies (Terziovski & Samson,
2000; Prajogo & Sohal, 2003a, 2003b; Loan, 2004). Due to missing data, 18 questionnaires
had to be excluded, leaving 204 valid questionnaires for the analysis.
In accordance with the classification in Vietnam explained above, the companies in our
sample were categorised into three groups: small firms with less than 50 employees,
medium-sized firms with 50–200 employees, and large firms with more than 200 employ-
ees (Ministry of Planning and Investment, 1999). Characteristics of the company and
respondents are shown in Table 1.
Since the small companies in our sample accounted for such a small share (2.04%), we
finally divided the firms into two groups: small or medium-sized firms with less than or
equal to 200 employees (32% of the sample), and large companies with more than 200
employees (68%). Laosirihongthong, Paul, and Speece (2003) used a similar classification
in their study in Thailand. About 25% of all firms were either foreign-owned or joint
ventures, 56% were state-owned companies and the remaining were privately owned.
About half were in manufacturing, 17% were in the service sector and the remaining
produced both manufactured products and services.
940 D.T. Hoang et al.

In order to assess a possible respondent bias, 30 non-respondent companies were con-
tacted by phone to collect the following information and compare this with the respondent
firms:
. size (number of employees);
. type of industry (manufacturing or service);
. ownership type.
Similar to the respondent sample, the first two above dimensions were categorised
into two groups: small or medium-sized firms and large companies; and manufacturing
and service companies. Ownership was divided into three categories: 100% foreign-
owned and joint venture, state-owned and private companies. The results of the com-
parison between the respondent and non-respondent samples showed a higher share
of large companies, state-owned companies, and manufacturing companies in the
non-respondent sample with 76.7% of the companies being large compared to 67.9%
in the respondent sample; 76.7% being state-owned companies compared with 56.4%
in the respondent sample; and 63.3% in manufacturing compared with 47.3% in the
respondent sample (see Table 2). However, these differences are not large enough
to indicate a substantial difference between respondents and non-respondents. All chi-
squared values for size, type of industry and ownership were smaller than the chi-square
table value for 0.05 significance (3.84 for 1 degree of freedom, and 5.99 for 2 degrees
of freedom), and all p-values were greater than 0.05. Thus, the respondents and non-
respondents can be considered as similar.
4. Data analysis and discussion
4.1. Scale reliability and validity of constructs
To assess the reliability of the collected data, the Cronbach’s alpha reliability test was per-
formed on all TQM constructs. Cronbach’s alpha measures the degree to which a construct
Table 1. Company and respondent characteristics.
Characteristics Description Percentage∗
Company size(number of employees)
Small to medium: ,¼ 200Large: . 200Missing
32.167.9
Ownership Foreign owned, and joint ventureState-owned companyPrivate companyMissing
25.856.417.8
Industry ManufacturingServiceBoth manufacturing and serviceMissing
47.317.235.5
Respondents’ positions Director/Vice DirectorFinance managerMarketing managerTechnical/Production managerResearch and development managerQuality control managerHuman resource manager
9.315.85.522.211.825.89.6
Note: ∗Not including missing and incomplete responses.
Total Quality Management 941
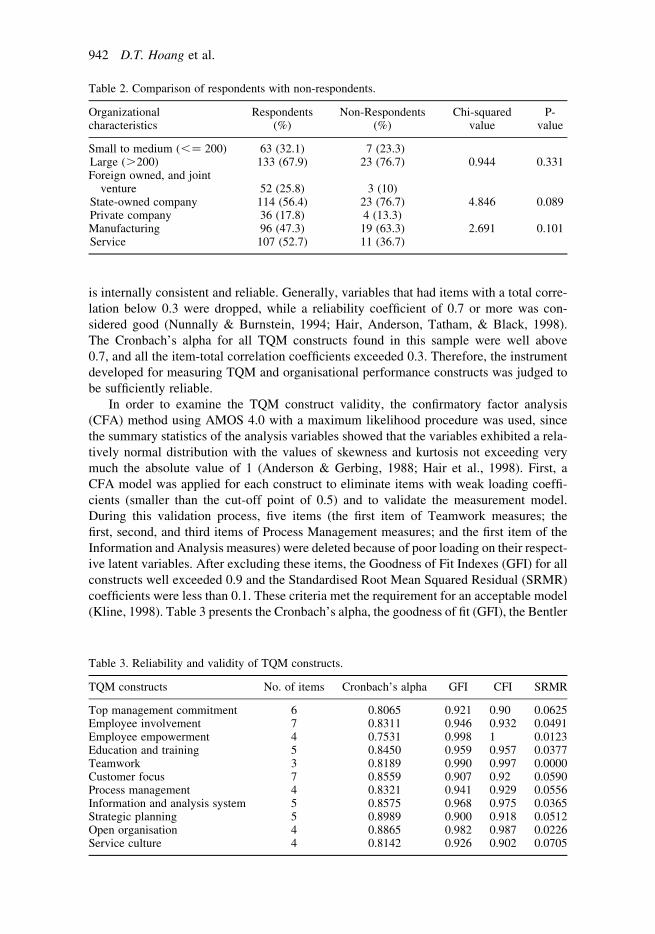
is internally consistent and reliable. Generally, variables that had items with a total corre-
lation below 0.3 were dropped, while a reliability coefficient of 0.7 or more was con-
sidered good (Nunnally & Burnstein, 1994; Hair, Anderson, Tatham, & Black, 1998).
The Cronbach’s alpha for all TQM constructs found in this sample were well above
0.7, and all the item-total correlation coefficients exceeded 0.3. Therefore, the instrument
developed for measuring TQM and organisational performance constructs was judged to
be sufficiently reliable.
In order to examine the TQM construct validity, the confirmatory factor analysis
(CFA) method using AMOS 4.0 with a maximum likelihood procedure was used, since
the summary statistics of the analysis variables showed that the variables exhibited a rela-
tively normal distribution with the values of skewness and kurtosis not exceeding very
much the absolute value of 1 (Anderson & Gerbing, 1988; Hair et al., 1998). First, a
CFA model was applied for each construct to eliminate items with weak loading coeffi-
cients (smaller than the cut-off point of 0.5) and to validate the measurement model.
During this validation process, five items (the first item of Teamwork measures; the
first, second, and third items of Process Management measures; and the first item of the
Information and Analysis measures) were deleted because of poor loading on their respect-
ive latent variables. After excluding these items, the Goodness of Fit Indexes (GFI) for all
constructs well exceeded 0.9 and the Standardised Root Mean Squared Residual (SRMR)
coefficients were less than 0.1. These criteria met the requirement for an acceptable model
(Kline, 1998). Table 3 presents the Cronbach’s alpha, the goodness of fit (GFI), the Bentler
Table 3. Reliability and validity of TQM constructs.
TQM constructs No. of items Cronbach’s alpha GFI CFI SRMR
Top management commitment 6 0.8065 0.921 0.90 0.0625Employee involvement 7 0.8311 0.946 0.932 0.0491Employee empowerment 4 0.7531 0.998 1 0.0123Education and training 5 0.8450 0.959 0.957 0.0377Teamwork 3 0.8189 0.990 0.997 0.0000Customer focus 7 0.8559 0.907 0.92 0.0590Process management 4 0.8321 0.941 0.929 0.0556Information and analysis system 5 0.8575 0.968 0.975 0.0365Strategic planning 5 0.8989 0.900 0.918 0.0512Open organisation 4 0.8865 0.982 0.987 0.0226Service culture 4 0.8142 0.926 0.902 0.0705
Table 2. Comparison of respondents with non-respondents.
Organizationalcharacteristics
Respondents(%)
Non-Respondents(%)
Chi-squaredvalue
P-value
Small to medium (,¼ 200)Large (.200)
63 (32.1)133 (67.9)
7 (23.3)23 (76.7) 0.944 0.331
Foreign owned, and jointventure
State-owned companyPrivate company
52 (25.8)114 (56.4)36 (17.8)
3 (10)23 (76.7)4 (13.3)
4.846 0.089
ManufacturingService
96 (47.3)107 (52.7)
19 (63.3)11 (36.7)
2.691 0.101
942 D.T. Hoang et al.

comparative fit index (CFI), and Standardised Root Mean Squared Residual (SRMR) of
the final TQM constructs that safeguard the reliability and validity of the constructs
under investigation.
Next, a CFA model was used to assess the means of the 11 TQM constructs. According
to Kline (1998), besides the Chi-square to degrees of freedom ratio (x2/df ratio), the widely
used measures of fit for the model include the goodness of fit index (GFI), the Bentler com-
parative fit index (CFI), the Bentler-Bonett non-normed fit index (NNFI), and the standar-
dised root mean squared residual (SRMR). It is desired that the x2/df ratio is less than 3; the
GFI, the CFI, and the NNFI are at least 0.90; and the SRMR is less than 0.1. The standar-
dised estimates and the fit indexes of the CFA model shown in Figure 1 indicate that the
measurement model satisfied these requirements. All variables had high factor loading
coefficients and highly statistical significance (all p-values equal 0). Thus, all variables
that measure latent constructs achieved convergent validity (Anderson & Gerbing,
1988). This indicates the validation of the measurement model, and also demonstrates
that TQM is generally considered as a set of practices, as proven in previous studies
(Ahire et al., 1996; Samson & Terziovski, 1999; Prajogo & Sohal, 2003a). In summary,
these results provide the safeguard for the reliability and validity of the TQM constructs
under investigation.
4.2. MANOVA tests on organisational characteristics
MANOVA tests for the set of TQM practices being the dependent variables were con-
ducted to examine the effects of the organisational characteristics (industry, company
size, type of ownership, and degree of innovation) on TQM practices deployed by the
firm. The key assumption was that the dependent variables were normally distributed
with equal variances. As mentioned above, the variables in the analysis had a relatively
normal distribution. In addition, MANOVA is robust, so small violations of the above
assumption would have little impact (Hair et al., 1998). MANOVA results presented in
Table 4 indicate that innovation, company size, and industry type had an impact on
TQM practices and that extent of innovation in particular had a significant effect.
However, TQM practices did not show any significant differences across the four types
of ownership. As shown in Table 5, all firms, regardless of their ownership had a high
mean score for customer focus and top management commitment, and the lowest rates
were given for the information and analysis system, employee empowerment, education
and training, and process management. However, the mean values for the TQM constructs
were all greater than 3.3. Ranked second after customer focus, with a value of 4.02, top
management generally expressed a high commitment to quality management, followed
by employee involvement, teamwork, open organisation, strategic planning, and service
culture, with mean values ranging from 3.5–3.9. The information and analysis system,
education and training, employee empowerment, and process management were ranked
lowest with values of less than 3.5.
Contrary to our expectations, no difference was discovered. The reason could be that
TQM implementation in Vietnam is still in an early stage, because the national industry
has only recently discovered quality as an imperative in the competition for both domestic
and international markets. Thus among the types of ownership, the pattern has not been
clearly distinguished from each other.
For the degree of innovation, the number of product/service innovations developed by
the sample firms was tested for a normal distribution (Kolmogorov-Smirnov test with
p-value ¼ 0.16), and the mean approximate to 7 was taken as the cut-point to form two
Total Quality Management 943

groups: companies with a high or a low amount of innovation. Table 6 shows that all TQM
constructs were significantly different between these two groups. Highly innovative
companies showed a higher rate of implementation for all TQM constructs compared to
the less innovative companies. This finding suggests that TQM constructs are likely to
facilitate conditions for innovation.
Figure 1. The CFA model of TQM constructs.
944 D.T. Hoang et al.

Table 6. TQM constructs and innovation.
TQM ConstructsANOVA
sig.∗
Low product/service
innovation
High product/service
innovation
Mean S.D. Mean S.D.
Top management commitmentEmployee involvementEmployee empowermentEducation and trainingTeamworkCustomer focusProcess managementInformation and analysis systemStrategic planningOpen organisationService cultureValid N (listwise)
0.000.000.000.000.000.000.000.000.000.000.00
3.523.032.862.783.113.692.912.813.343.193.5454
0.760.740.720.790.820.780.820.830.900.860.69
4.313.873.813.793.894.373.763.664.153.974.1661
0.490.570.620.580.620.440.600.780.540.530.51
Notes: ∗Italicised characters represent significance at 0.05 level. S.D. ¼ standard deviation.
Table 5. Descriptive statistics for implemented TQM constructs.
TQM constructs Mean (ranked) S.D.
Customer focusTop management commitmentService cultureStrategic planningOpen organisationTeamworkEmployee involvementProcess managementEmployee empowermentEducation and trainingInformation and analysis systemValid N (listwise)
4.084.023.883.873.733.663.563.493.493.493.39181
0.690.690.680.790.800.840.750.800.810.850.90
Note: S.D. ¼ standard deviation.
Table 4. MANOVA tests on TQM constructs.
Effect Model F Sig.
Innovation Pillai’s TraceWilks’ Lambda
10.88710.887
0.000∗∗
0.000∗∗
Ownership Pillai’s TraceWilks’ Lambda
0.9750.974
0.5200.522
Company size Pillai’s TraceWilks’ Lambda
1.7471.747
0.067∗
0.067∗
Industry types Pillai’s TraceWilks’ Lambda
1.8591.859
0.048∗
0.048∗
Notes: ∗∗Italicised characters represent significance at 0.05 level; ∗Italicised characters represent significance at0.10 level.
Total Quality Management 945

Large companies scored higher in all quality management practices except for team-
work and open organisation, compared to smaller companies (see Table 7). In terms of
service culture and strategic planning, large companies rated significantly higher than
small- and medium-sized companies. As shown in Table 1, 68% of the companies were
large, which explains the high ranking (third and fourth rank) of service culture and stra-
tegic planning (see Table 5 for the descriptive statistics). It is likely that large companies
would have access to more resources (finance, technology, human) needed in implement-
ing TQM practices than smaller companies. Beaumont and Sohal (1999) found no statisti-
cally significant relationship between company size (measured in terms of number of
employees or total sales) and quality management practices (measured in terms of the
total number of quality management practices used) in the Australian service industry.
However, as the authors admitted, this non-correlation was surprising because a larger
firm would be better equipped with resources to afford investment of resources into
quality management. Nevertheless, the reported use of benchmarking quality practices
was significantly related to company size and found that larger service companies are
more likely to use benchmarking.
Manufacturing companies generally had implemented all quality management prac-
tices to a higher extent than companies in the service sector (see Table 8). Information
and analysis system and customer focus meant manufacturing companies tended to
have a more statistically significant score compared to service companies. This finding
is similar to previous studies, and can be explained by the fact that quality management
practices were developed for and applied in manufacturing companies long before
service organisations adopted TQM. In a survey of United Arab Emirate firms, Badri
et al. (1995) reported that manufacturers were much more inclined than service providers
to use quality management practices. In a study of Australian manufacturing and service
industries, Beaumont et al. (1997) found a statistically significant difference between these
two sectors in the number of quality management practices used: on average, manufac-
turers used more quality management practices than service organisations, even when
techniques specific to the manufacturing companies were not counted. According to the
Table 7. TQM constructs and company size.
TQM constructsANOVAsig.
Small andmediumcompany Large company
Mean S.D. Mean S.D.
Top management commitmentEmployee involvementEmployee empowermentEducation and trainingTeamworkCustomer focusProcess managementInformation and analysis systemStrategic planningOpen organisationService cultureValid N (listwise)
0.3590.4980.8370.9170.6180.5480.1010.7980.039∗∗
0.9010.047∗∗
3.953.513.473.473.714.033.313.363.673.743.7248
0.770.790.820.860.870.650.740.930.970.770.76
4.053.593.503.493.644.103.543.403.943.723.94148
0.660.740.810.850.850.700.830.890.720.820.63
Note: ∗∗Italicised characters represent significance at 0.05 level. Sig ¼ significant.
946 D.T. Hoang et al.

authors, this may be because manufacturers have had more experience with quality man-
agement practices. This wider experience may be because product characteristics in man-
ufacturing are more tangible than those of services or because manufacturers have been
exposed to fiercer competition. In terms of the use of individual quality management prac-
tices, the most significant difference pertains to statistical process control, which was used
by nearly half the manufacturers but only few service providers.
5. Conclusions
This study investigated whether there is a difference in the TQM constructs implemented
by Vietnamese manufacturing and service companies of different ownership, size, indus-
try type, and innovation performance. While MANOVA was the main technique applied,
the measurement model for TQM constructs was examined with the help of structural
equation modeling. Several conclusions can be drawn from the above results.
Fist, in manufacturing and service companies, customer focus and top management
commitment have been implemented at a quite high rate while information and analysis
system, education and training, employee empowerment, and process management were
found to be just average. This result suggests that Vietnamese companies still have a lot
room for improving their TQM strategy.
Second, TQM principles that have been generally considered as a set of practices, in
previous studies, could be confirmed as valid for the industries in Vietnam for both man-
ufacturing and service sectors. Third, the MANOVA results indicate that company size,
industry type, and degree of innovation influenced the degree of TQM implementation.
Large companies showed a higher implementation rate in almost all quality management
practices except for teamwork and open organisation when compared to small- and
medium-sized companies. Particularly, for service culture and strategic planning, large
companies were statistically significantly stronger than small- and medium-sized compa-
nies. Highly innovative companies showed a higher rate of implementation for all TQM
constructs compared to companies with a low innovation performance, which suggests
that TQM supports conditions for innovation. This finding contributes to the literature
Table 8. TQM constructs and industry type.
TQM ConstructsANOVA
Sig.
Manufacturing Service
Mean S.D. Mean S.D.
Top management commitmentEmployee involvementEmployee empowermentEducation & trainingTeamworkCustomer focusProcess managementInformation and analysis systemStrategic planningOpen organisationService cultureValid N (listwise)
0.2170.6070.8710.3640.4580.051∗
0.4970.011∗∗
0.6580.9480.604
4.083.583.473.543.704.193.543.563.893.733.8594
0.610.720.840.790.770.620.810.850.760.750.67
3.963.533.493.433.614.103.463.233.843.723.90107
0.740.780.780.890.900.730.800.930.830.850.70
Notes: ∗∗Italicised characters represent significance at 0.05 level; ∗Bold characters represent significance at 0.10level. S.D. ¼ standard deviation.
Total Quality Management 947
pondering the question whether TQM support the firm’s innovation. This study shows evi-
dence in Vietnam that TQM most likely enhances conditions for innovation to happen.
Therefore, in order to create more product and service innovations, companies may
align innovation projects with their efforts to improve the firm’s TQM strategy.
The small sample size of service companies is the major limitation of the study. In
addition, further research should focus on more innovative industries, such as electronics,
automotive and food industries and should also explore the relationship between TQM
being a competitive manufacturing/operational strategy and other business strategies
such as differentiation and cost leadership. Finally, an industry specific, cross-country
analysis in Southeast Asia could help policy makers in these newly industrialising
countries to understand how to maintain their industries’ competitiveness while facing
increasing global competitions.
References
Ahire, S.L., & Golhar, D.Y. (2001). Quality management in large versus small firms. Journal ofSmall Business Management, 27, 1–13.
Ahire, L.S., Golhar, D.Y., & Waller, M.A. (1996). Development and validation of TQM implemen-tation constructs. Decision Sciences, 27, 23–56.
Ahire, S.L., Landeros, R., & Golhar, D.Y. (1995). Total quality management: A literature review andan agenda for future research. Production and Operations Management, 4(3), 277–306.
Ahmed, P.K. (1998). Culture and climate for innovation. European Journal of InnovationManagement, 1(1), 30–43.
Anderson, J.C., & Gerbing, D.W. (1988). Structural equation modeling in practice: A review andrecommended two-step approach. Psychological Bulletin, 103, 411–423.
Anderson, J.C., Rungtusanatham, M., & Schroeder, R.G. (1994). A theory of quality managementunderlying the Deming management method. Academy of Management Review, 19(3),472–509.
Atuahene-Gima, K. (1996). Market orientation and innovation. Journal of Business Research, 35(2),93–103.
Badri, M.A., Davis, D., & Davis, D. (1995). A study of measuring the critical factors of qualitymanagement. International Journal of Quality & Reliability Management, 2(2), 36–53.
Baldwin, J.R., & Johnson, J. (1996). Business strategies in more and less-innovative firms in Canada.Research Policy, 25(5), 785–804.
Beaumont, N.B., & Sohal, A.S. (1999). Quality management in Australian service industries.Benchmarking: An International Journal, 6(2), 107–124.
Beaumont, N.B., Sohal, A.S., & Terziovski, M. (1997). Comparing quality management practices inthe Australian service and manufacturing industries. International Journal of Quality &Reliability Management, 14(8), 814–833.
Black, A.S., & Porter, L.J. (1996). Identification of the critical factors of TQM. Decision Sciences,27(1), 1–21.
Carr, A.S., Leong, G.K., & Sheu, C. (2000). A study of purchasing practices in Taiwan. InternationalJournal of Operations & Production Management, 20(12), 1427–1445.
Choong, Y.L. (2004). Perception and development of total quality management in small manufac-turers: An exploratory study in China. Journal of Small Business Management, 42(1),102–115.
Crosby, P.B. (1979). Quality is free. New York: McGraw-Hill.Crosby, P.B. (1996). Quality is still free: Making quality certain in uncertain times. New York:
McGraw-Hill.Das, A., Paul, H., Swiersek, F.W., & Laosirihongthong, T. (2006). A measurement instrument for
TQM implementation in the Thai manufacturing industry. International Journal ofInnovation and Technology Management, 3(4), 1–17.
Dean, J.W., & Bowen, D.E. (1994). Management theory and total quality: Improving research andpractice through theory development. Academy of Management Review, 19(3), 392–418.
Dean, J., & Evans, J. (1994). Total quality management, organization and strategy. St Paul, MN:West Publishing.
948 D.T. Hoang et al.

Deming, W.E. (1982). Quality, productivity and competitive position. Cambridge, MA: MIT Press,Massachusetts Institute of Technology, Center for Advanced Engineering Study.
Deming, W.E. (1986). Out of the crisis. Cambridge, MA: Massachusetts Institute of Technology,Center for Advanced Engineering Study.
Dow, D., Swanson, D., & Ford, S. (1999). Exploding the myth: Do all quality management practicescontribute to superior quality performance? Production and Operations Management, 8(1),1–27.
Evans, J., & Lindsay, W. (1993). The management and control of quality (2nd ed.). St Paul, MN:West Publishing.
Feigenbaum, A.V. (1951). Quality control: Principles, practice, and administration. New York:McGraw-Hill.
Feigenbaum, A.V. (1983). Quality control (3rd ed.). New York: McGraw-Hill.Feigenbaum, A.V. (1991). Total quality control, 40th anniversary edition (3 rev ed.). New York:
McGraw-Hill.Feng, J., Prajogo, D.I., Tan, K.C., & Sohal, A.S. (2006). The impact of TQM practices on perform-
ance: A comparative study between Australian and Singaporean organizations. EuropeanJournal of Innovation Management, 9(3), 269–278.
Flynn, B.B., Schroeder, R.G., & Sakakibara, S. (1994). A framework for quality managementresearch and an associated measurement instrument. Journal of Operational Management,11, 339–366.
Gagnon, T., & Toulouse, J. (1996). The behavior of business managers when adopting newtechnologies. Technological Forecasting and Social Change, 52, 59–74.
GAO Study (1991). Report to the House of Representatives on Management Practices, USCompanies Improve Performance through Quality Efforts. United States GeneralAccounting Office, Washington, DC.
Garvin, D.A. (1988). Managing quality: The strategic and competitive edge. New York: The FreePress.
Germain, R. (1996). The role of context and structure in radical and incremental logistics innovationadoption. Journal of Business Research, 35, 117–127.
Grant, R.M., Shani, R., & Krishnan, R. (1994). TQM’s challenge to management theory and practice.Sloan Management Review, 35(2), 25–35.
Haar, J.M., & Spell, C.S. (2008). Predicting total quality management adoption in New Zealand: Themoderating effect of organizational size. Journal of Enterprise Information Management,21(2), 162–178.
Hair, J.F., Anderson, R.E., Tatham, R.L., & Black, W.C. (1998). Multivariate data analysis. UpperSaddle River, NJ: Prentice-Hall International Inc.
Hoang, D.T., Igel, B., & Laosirihongthong, T. (2006). The impact of total quality management oninnovation: Findings from a developing country. International Journal of Quality &Reliability Management, 23(9), 1092–1117.
Hui, M.K., Au, K., & Fock, H. (2004). Empowerment effects across cultures. Journal ofInternational Business Studies, 35(1), 46–60.
Hung, B.N. (2003). Assesement the effect of ISO certificate on performance of companies inHochiminh City. Ho Chi Minh City, Vietnam: Department of Science, Technology, andEnvironment, HCMC.
Ishikawa, K. (1985). What is total quality control? Englewood Cliffs, NJ: Prentice-Hall.Joseph, I.N., Rajendran, C., & Kamalanabhan, T.J. (1999). An instrument for measuring total quality
management implementation in manufacturing-based business units in India. Internal Journalof Production Research, 37, 2201–2215.
Juran, J.M. (1974). Quality control handbook (3rd ed.). New York: McGraw-Hill.Juran, J.M. (1988). Juran on planning for quality. New York: Free Press.Juran, J.M. (1989). Juran on leadership for quality: an executive handbook. New York: Free Press.Juran, J.M. (1992). Juran on quality by design: The new steps for planning quality into goods and
services. New York: Free Press.Juran, J.M. (1995). A history of managing for quality: The evolution, trends and future direction of
managing for quality. Milwaukee, WI: ASQC Quality Press.Kim, W.C., & Marbougne, R. (1999). Strategy, value innovation, and the knowledge economy.
Sloan Management Review, (Spring), 41–54.
Total Quality Management 949

Kline, R.B. (1998). Principles and practice of structural equation modeling. New York: TheGuilford Press.
Kruger, V. (1996). How can a company achieve improved levels of quality performance:Technology versus employees? The TQM Magazine, 8(3), 11–20.
Kruger, V. (1998). Total quality management and its humanistic orientation towards organisationalanalysis. The TQM Magazine, 10(4), 293–301.
Kruger, V. (2001). Main schools of TQM: ‘the big five’. The TQM Magazine, 13(3), 146–155.Laosirihongthong, T, Paul, H., & Speece, M.W. (2003). Evaluation of new manufacturing
technology implementation: And empirical study in the Thai automotive industry.Technovation, 23, 321–331.
Loan, N.T.Q. (2004). Assesment of the quality management system of ISO companies. EconomicDevelopment Review, University of Economics, Ho Chi Minh City, No. 8–9.
McAdam, R., Armstrong, G., & Kelly, B. (1998). Investigation of the relationship between totalquality and innovation: A research study involving small organizations. European Journalof Innovation Management, 1(3), 139–147.
Millar, R.M.G. (1987). In foreword to J. Cullen & J. Hollingham. Implementing total quality.Bedford: IFS Publications.
Ministry of Planning and Investment. (1999). Research report: Improving macroeconomic policyand reforming administrative procedures to promote development of small and mediumenterprises in Vietnam.
Motwani, J. (2001). Critical factors and performance measures of TQM. The TQM Magazine, 13(4),292–300.
Noronha, C. (2002). Chinese cultural values and total quality climate. Managing Service Quality,12(4), 210–223.
Nunnally, J., & Burnstein, I.H. (1994). Pschychometric theory (3rd ed.). New York: McGraw-Hill.Pinho, J.C. (2008). TQM and performance in small medium enterprises: The mediating effect of cus-
tomer orientation and innovation. International Journal of Quality & Reliability Management,25(3), 256–275.
Powell, T.C. (1995). Total quality management as competitive advantage: A review and empiricalstudy. Strategic Management Journal, 16, 15–37.
Power, D.J., Amrik, S.S., & Rahman, S. (2001). Critical success factors in agile supply chain man-agement. International Journal of Physical Distribution and Logistics Management, 31(4),247–265.
Prajogo, D.I. (2005). The comparative analysis of TQM practices and quality performance betweenmanufacturing and service firms. International Journal of Service Industry Management,16(3), 217–228.
Prajogo, D.I., & Sohal, A.S. (2003a). The multidimensionality of TQM practices in determiningquality and innovation performance – an empirical examination. Technovation, 24, 443–453.
Prajogo, D.I., & Sohal, A.S. (2003b). The relationship between TQM practices, quality performance,and innovation performance: An empirical examination. International Journal of Quality &Reliability Management, 20(8), 901–918.
Prajogo, D.I., & Sohal, A.S. (2006). The integration of TQM and technology /R&D management indetermining quality and innovation performance. The International Journal of ManagementScience, Omega, 34, 296–312.
Pun, K.F. (2001). Cultural influences of TQM adoption in Chinese enterprises: An empirical study.Total Quality Management, 12(3), 323–342.
Rahman, S., & Bullock, P. (2005). Soft TQM, hard TQM, and organisational performance relation-ship: An empirical investigation. Omega, 33, 73–83.
Reed, R., Lemark, D.J., & Mero, N.P. (2000). Total quality management and sustainable competitiveadvantage. Journal of Quality Management, 5, 5–26.
Samson, D., & Terziovski, M. (1999). The relationship between total quality management practicesand operational performance. Journal of Operations Management, 17, 393–409.
Saraph, J.V., Benson, G.P., & Schroeder, R.G. (1989). An instrument for measuring the criticalfactors of quality management. Decision Sciences, 20, 810–829.
Sila, I., & Ebrahimpour, M. (2002). An investigation of the total quality management survey basedresearch published between 1989 and 2000 – a literature review. International Journal ofQuality & Reliability Management, 19(7), 902–970.
950 D.T. Hoang et al.

Silvestro, R. (1998). The manufacturing TQM and service quality literatures: Synergistic or conflict-ing paradigms? International Journal of Quality & Reliability Management, 15(3), 303–328.
Singh, P.J., & Smith, A.F.R. (2004). Relationship between TQM and innovation: An empirical study.Journal of Manufacturing Technology Management, 15(5), 394–401.
Sitkin, S.B., Sutcliffe, K.M., & Schroeder, R.G. (1994). Distinguishing control from learning in totalquality management: A contingency perspective. Academy of Management Review, 19(3),537–564.
Slater, S.F., & Narver, J.C. (1998). Customer-led and market-led: Let’s not confuse the two.Strategic Management Journal, 19(10), 1001–1006.
Spreitzer, G.M. (1995). Psychological empowerment in the work place: Dimensions, measurement,and validation. Academy of Management Journal, 38(5), 1442–1465.
Steingrad, D.S., & Fitzgibbons, D.E. (1993). A postmodern deconstruction of total quality manage-ment. Journal of Organization Change Management, 6(5), 27–42.
Sureshchandar, G.S., Chandrasekharan, R., & Anantharaman, R.N. (2001). A conceptual model fortotal quality management in service organizations. Total quality management, 12(3),343–363.
Swamidass, P.M., & Kotha, S. (1998). Explaining manufacturing technology use firm size and per-formance using a multidimensional view of technology. Journal of Operation Management,17, 23–37.
Terziovski, M., & Samson, D. (1999). The link between total quality management practice andorganizational performance. International Journal of Quality & Reliability Management,16(3), 226–237.
Terziovski, M., & Samson, D. (2000). The effect of company size on the relationship between TQMstrategy and organizational performance. The TQM Magazine, 12(2), 144–148.
Tidd, J., Bessant, J., & Pavitt, K. (1997). Managing innovation: Integrating technological, market,and organizational change. Chichester: John Wiley & Sons Ltd.
Vuppalapati, K., Ahire, S.L., & Gupta, T. (1995). JIT and TQM: A case for joint implementation.International Journal of Operations & Production Management, 15(5), 84–94.
Watson, J.G., & Korukonda, A.R. (1995). The TQM jungle: A dialectical analysis. InternationalJournal of Quality & Reliability Management, 12(9), 100–109.
Wind, J., & Mahajan, V. (1997). Issues and opportunities in new product development: An introduc-tion to the special issue. Journal of Marketing Research, 34(1), 1–12.
Woon, K.C. (2000). TQM implementation: comparing Singapore’s service and manufacturingleaders. Managing Service Quality, 10(5), 318–331.
Yavas, B.F., & Rezayat, F. (2003). The impact of culture on managerial perceptions of quality.International Journal of Cross Cultural Management, 3(2), 213–234.
Zeithaml, V.A., Parasuraman, A., & Berry, L.L. (1990). Delivering quality service: Balancingcustomer perceptions and expectations. New York: Free Press.
Zeitz, G., Johannesson, R., & Ritchie, J.E. Jr. (1997). An employee survey measuring total qualitymanagement practices and culture. Group and Organization Management, 22(4), 414–444.
Total Quality Management 951

Copyright of Total Quality Management & Business Excellence is the property of Routledge and its content
may not be copied or emailed to multiple sites or posted to a listserv without the copyright holder's express
written permission. However, users may print, download, or email articles for individual use.
Related Documents