CONSUMER TRUST AND PERCEIVED RISK IN BUSINESS-TO-CONSUMER (B2C) E-COMMERCE Submitted to: Dr. Muhammad Ziaulhaq Mamun Professor Course Instructor: Research Methodology Institute of Business Administration University of Dhaka Submitted by: Samiha Majid Simi (RH 01) Shafqat Aurin Siddiqua (RH 04) Mastura Tasnim (RH 08) Chowdhury Ashiqur Rahman (ZR 24) Joya Chowdhury (RH 26) Muhammad Danial Rafi (ZR 28) Silma Subah Ahmad (ZR 46) Rakib Ibnay Hossain(ZR 47) Tanzir Islam (ZR 51) Shaadman Ahmed Siddiqui (ZR 58) Group 2, Section A, BBA 21 st Batch 13 th June 2015 Institute of Business Administration, Dhaka University

Research Paper: Consumer Trust and Perceived Risk in B2C E Commerce
Aug 08, 2015
Welcome message from author
This document is posted to help you gain knowledge. Please leave a comment to let me know what you think about it! Share it to your friends and learn new things together.
Transcript

CONSUMER TRUST AND PERCEIVED RISK IN BUSINESS-TO-CONSUMER (B2C)
E-COMMERCE
Submitted to:
Dr. Muhammad Ziaulhaq Mamun
Professor
Course Instructor: Research Methodology
Institute of Business Administration
University of Dhaka
Submitted by:
Samiha Majid Simi (RH 01)
Shafqat Aurin Siddiqua (RH 04)
Mastura Tasnim (RH 08)
Chowdhury Ashiqur Rahman (ZR 24)
Joya Chowdhury (RH 26)
Muhammad Danial Rafi (ZR 28)
Silma Subah Ahmad (ZR 46)
Rakib Ibnay Hossain(ZR 47)
Tanzir Islam (ZR 51)
Shaadman Ahmed Siddiqui (ZR 58)
Group 2, Section A, BBA 21st Batch
13th
June 2015
Institute of Business Administration, Dhaka University

i | P a g e
June 13, 2015
Dr. Muhammad Ziaulhaq Mamun
Professor
Institute of Business Administration
University of Dhaka
Sir:
Subject: Letter of transmittal for Research Method course (K301) term paper
With due respect, we would like to present to you our term paper “Consumer Trust and
Perceived Risk in Business to Consumer E-commerce,” which has been completed as part of the
Research Method course (K301). The purpose of this report was to conduct a basic research to
discover the level of consumer trust and perceived risk in e-commerce transactions by users. It
was a learning experience as we had the opportunity to utilize the advanced tools and techniques
introduced to us throughout the Research Method course.
Therefore, we hope that you would accept the term paper and our gratitude for allowing us to
work on this intellectually stimulating report. Thank you.
Sincerely Yours
SamihaMajid Simi (01)
Group Leader
Group 2
Sec: A
Batch: BBA 21st

Consumer trust and perceived risk in B2C e-commerce | ii
ACKNOWLEDGEMENT
In completing the term paper, we had to take the help and guideline of some respected persons,
who deserve our greatest gratitude. We would like to show our gratitude to Dr. Muhammad
Ziaulhaq Mamun, Professor, Institute of Business Administration, University of Dhaka, for
giving us guidance for the term paper throughout numerous consultations. We would also like to
expand our deepest gratitude to all those who have directly and indirectly guided us in writing
this assignment.
Many people, especially our classmates, team members and respondents, have made valuable
comments and suggestions on this report which gave us inspiration to improve and refine our
assignment. We‟d like to thank all these people for their incomparable help – directly and
indirectly – to complete our assignment.
Consumer trust and perceived risk in B2C e-commerce | iii
EXECUTIVE SUMMARY
E-commerce is a relatively new field of business in Bangladesh. It was introduced to the country
in 2009 when Bangladesh Bank allowed online transactions for the first time and by 2013, the
market expanded to BDT 2000 million in worth across the country. The introduction of high
speed internet in recent years and the expansion of mobile technology have played a key role in
increasing the scope of e-commerce usage. Despite this recent upsurge, much research remains
to be done on the consumer trust and perceived risk in business to consumer (henceforth referred
to as B2C) e-commerce transactions. The purpose of this research, thus, is to provide insight and
evaluate the current situation of this new field with particular emphasis on the perceived risks
and trusts placed on it by consumers.
In order to understand this further, the research question of consumer trust and perceived rick on
B2C e-commerce has been narrowed down to broad and specific objectives and three null
hypotheses have been developed: a. brand perception, b. consumer perception of high privacy,
and c. consumer perception of high financial security – each positively affect consumer‟s intent
to purchase online.
With that in mind, extensive literature review was conducted with secondary sources from
renowned journals and research papers which have been referenced throughout the report. For
primary source of information, a detailed survey was conducted with e-commerce consumers as
respondents and this is the main source of data in the report. Due to time, finance and
geographical constraints, the respondents were limited to the area of Dhaka city and non-
probabilistic convenience/accidental and judgmental sampling was used. The key demographic
was nearly equally divided between male and female respondents, with mean age of around
twenty and occupation of undergraduate studies. This is expected as e-commerce users are
skewed towards young, educated, tech-savvy users of the country.
In terms of branding perception, the survey found that, as the e-commerce industry of
Bangladesh in relatively new, user experience of brands is limited, with consumers purchasing
from an average of 2 brands. Furthermore, few brands have captured the consumer attention as
114 respondents collectively prefer 24 brands. Even so, most of the respondents have minimum
and moderate brand loyalty towards their current brand and it appears to be difficult to establish
Consumer trust and perceived risk in B2C e-commerce | iv
brand loyalty in electronic market space. Despite that, one-fifth of respondents showed strong
brand loyalty, which may be a credit to their brand of choice or their internal tendency to stay
loyal to their preferences. On average, consumers feel more secure while purchasing from
reputed brands, which is to be expected from any industry – physical or electronic. Majority of
the people also perceive branded products to be of better quality compared to non-branded
products. However, similar to users in the physical marketplace, e-commerce users perceive that
they are not receiving value for money in their purchases.
In terms of perception regarding privacy of information, the research inquiries revealed that most
online sites require a moderate amount of information from their consumers, and that in majority
of cases only a minimal amount of that information is shared publicly. Nearly half of the
respondents claim that the service providers ask them for their permission before sharing any
information and around 3/5th of this sample population is aware of the privacy policies by their
providers. When asked to rate the effectiveness of this privacy policy on a scale of 1 to 10, the
results were diverse, the highest frequencies occurring between 5 and 9 with 1 being very
ineffective and 10 being very effective. Only 6 out of 114 have a history of privacy violation and
5 out of these 6 respondents have also had corrective measures taken on behalf of them by
providers.
In terms of consumer perception of financial security, a number of key insights were revealed.
Most consumers felt that online transactions incurred a „medium‟ element of over-pricing and
one fifth felt that that element was „high‟. Consumer perception seems to be that online
transactions include some form of over-pricing. In case of freight cost, nearly everyone felt that
fixed freight cost pricing was more preferable to percentage pricing and in general, the
perception regarding freight cost was that it was more or less justified, with a mean and mode of
approximately 5 out of 10. Consumer tendency to prefer fixed freight cost may indicate an
affinity for bulk buying to minimize the cost per transaction. Overall, the perceptions regarding
the pricing system in online transactions are positively skewed in this research.
Taking the survey responses into account, SPSS calculations took place to provide cogent results
to the queries placed at the beginning of the research and the three hypotheses were addressed
respectively.
Consumer trust and perceived risk in B2C e-commerce | v
The first null hypothesis regarding brand perception positively impacting consumer intent to
purchase cannot be rejected. There is a negative correlation between purchasing from branded
and non-branded providers and this indicates that perception of high brand image positively
affects a customer‟s trust.
The second null hypothesis, which states that consumer perception of high privacy can positively
impact intent to purchase, cannot be accepted as the calculations do not fall within the
confidence interval chosen by the research. A consumer‟s perception of high privacy of
information does not positively affect his trust on e-commerce transactions.
The third null hypothesis, which states that consumer perception of financial risk can positive
impact the intent to purchase, cannot be rejected as there is a positive correlation between the
two variables. So it can be concluded that consumer‟s perception of financial security positively
affects trust in e-commerce transactions.
To justify these claims, the research conclusions underwent factor analysis. The KMO measure
of greater 0.5 indicated satisfactory sampling adequacy and the regression factor analysis of
factors indicated positive relationship between consumer perception, consumer trust and risk in
e-commerce transactions.
The research has so far revealed that interesting insights into the consumer mindset of B2C
online customers. They perceive brand and financial risk assessments as a key determinant
during purchasing decisions in e-commerce transactions, whereas privacy of information is not
perceived as an important variable in these sort of decisions. Brand is a powerful motivator in all
markets and it is unsurprising that it would have a similar effect in the online market, no matter
how new the market may be. That consumers pay attention to branding in this developing market
is an important signal for online businesses to refocus on marketing strong brand images to new
consumers so as to gain brand loyalty. Privacy of consumer information may not appear so
important to consumers right now due to the flexible payment methods (i.e. on delivery
payment). Concern over privacy is likely to increase if credit card usage increases in the country
or if, with the increase of e-commerce businesses, cases of criminal activity in e-transactions rise
which causes media uproar. Financial risk assessments also indicate that consumers may be
swayed by price centric marketing and business techniques as a significant portion associate
Consumer trust and perceived risk in B2C e-commerce | vi
online shopping to some extent of overpricing, and it may be important for brands to break that
perception in order to garner loyal customers.
The e-commerce industry is at the growth stage and is rapidly expanding in market size. It will
be interesting to see the many kinds of research conclusions that will be made in the future for
this industry and it is hoped that many of the questions and possibilities raised in this project will
be answered and explained in future years in more thorough and extensive research papers. For
now, these are the conclusions to hypotheses raised by this research and every precaution and
step has been taken to ensure authentic data collection, analysis, and evaluation took place
throughout this research.

Consumer trust and perceived risk in B2C e-commerce | vii
TABLE OF CONTENT
ACKNOWLEDGEMENT .............................................................................................................. ii
EXECUTIVE SUMMARY ........................................................................................................... iii
TABLE OF CONTENT ................................................................................................................ vii
1. INTRODUCTION ...................................................................................................................... 1
1.1 Origin of the Report .............................................................................................................. 1
1.2 Research Background ........................................................................................................... 1
1.3 Problems ............................................................................................................................... 2
1.4 Research Question ................................................................................................................ 3
1.5 Objectives ............................................................................................................................. 3
1.5.1 Broad Objective: ............................................................................................................ 3
1.5.2 Specific Objectives: ....................................................................................................... 3
1.6 Hypotheses ............................................................................................................................ 3
1.7 Rationale ............................................................................................................................... 4
1.8 Scope ..................................................................................................................................... 4
1.9 Limitations ............................................................................................................................ 4
2.0 METHODOLOGY ................................................................................................................... 4
2.1 Data Collection ..................................................................................................................... 4
2.1.1 Primary Sources ............................................................................................................. 5
2.1.2 Secondary Sources ......................................................................................................... 5
2.2 Sampling Methods ................................................................................................................ 5
2.3 Sample Size ........................................................................................................................... 5
2.4 Sample Frame ....................................................................................................................... 5
2.5 Purpose of Research .............................................................................................................. 6
2.6 Questionnaire Development.................................................................................................. 6
2.7. Validity ................................................................................................................................ 7
2.8. Reliability ............................................................................................................................. 8
3.0 LITERATURE REVIEW ....................................................................................................... 10
4. E-COMMERCE PENETRATION AMONG RESPONDENTS .............................................. 12
4.1. Awareness of E-commerce ................................................................................................ 12
Consumer trust and perceived risk in B2C e-commerce | viii
4.2. Usage of E-commerce ........................................................................................................ 12
4.3. Awareness to Usage Ratio ................................................................................................. 12
4.4. Percentage of Shopping Budget for E-commerce .............................................................. 13
5. DEMOGRAPHIC OF E-COMMERCE USERS ...................................................................... 14
5.1. Gender ................................................................................................................................ 14
5.2. Age ..................................................................................................................................... 14
5.3. Education Level ................................................................................................................. 14
5.4. Profession ........................................................................................................................... 14
6. PERCEPTION ON BRAND..................................................................................................... 15
6.1. Number of Brands perUser ................................................................................................ 15
6.2. Most Preferred Brands ....................................................................................................... 16
6.3. Measuring Brand Loyalty .................................................................................................. 17
6.4. Perception on Security ....................................................................................................... 18
6.5. Perception on Product Quality ........................................................................................... 18
6.6. Perception on Service Quality ........................................................................................... 19
6.7. Perception on Value for Money ......................................................................................... 20
6.8. Summary of the Findings ................................................................................................... 21
7. PERCEPTION ON PRIVACY OF INFORMATION .............................................................. 22
7.1. Level of Information Needed ............................................................................................. 22
7.2. Level of Information Shared .............................................................................................. 23
7.3. Customer Control over Information Sharing ..................................................................... 23
7.5. Perception on Effectiveness of Privacy Policy .................................................................. 24
7.6. History of Privacy Violation .............................................................................................. 26
7.7. Measure taken for Privacy Violation ................................................................................. 26
7.8. Summary of the Findings ................................................................................................... 26
8. PERCEPTION ON FINANCIAL RISK ................................................................................... 28
8.1. Perception on being overpriced ......................................................................................... 28
8.2. Preferred Method of Freight Cost ...................................................................................... 28
8.3. Perception on Freight Cost................................................................................................. 29
8.4. Overall Perception on Pricing System ............................................................................... 30
8.5. Summary of Findings ......................................................................................................... 30
9. EFFECT OF BRAND, PRIVACY AND FINANCIAL RISK ON CONSUMER TRUST ..... 31
Consumer trust and perceived risk in B2C e-commerce | ix
Hypothesis 1: Brand image positively affects a consumer‟s trust ............................................ 31
Hypothesis 2: A consumer‟s perception of high privacy of information positively affects his
trust ........................................................................................................................................... 34
Hypothesis 3: A consumer‟s perception of financial security positively affects his trust ........ 35
10. FACTOR ANALYSIS ............................................................................................................ 38
10.1 Factor loading ................................................................................................................... 38
10.2 KMO and Bartlett‟s Test ................................................................................................... 40
10.3 Regression analysis using factors ..................................................................................... 41
10.4 Coefficient of the factors .................................................................................................. 42
10.5 ANOVA test for Significance of the model ...................................................................... 43
11. CONCLUSION ....................................................................................................................... 44
APPENDIX SECTION ................................................................................................................. 46
Appendix I: Questionnaire ............................................................................................................ 46
Consumer trust and perceived risk in B2C E-commerce .............................................................. 46
Respondent Identification details .............................................................................................. 46
A. Respondent‟s orientation to e-commerce ............................................................................. 46
B. Effect of Brand in perceived value and trust ........................................................................ 47
C. Effect of site reputation on buying intent ............................................................................. 48
D. Effects of Privacy in perceived value and trust .................................................................... 48
E. Effects of perceived financial risk ........................................................................................ 50
F. Information about the respondent ......................................................................................... 50
Appendix II: Coordination Schema .............................................................................................. 51
Appendix III: Calculations ............................................................................................................ 53
Appendix IV: Data Analysis for Section 4 ................................................................................... 55
Appendix V: Data Analysis for Section 5..................................................................................... 57
Appendix VI: Data Analysis for Section 6 ................................................................................... 61
Appendix VII: Data Analysis for Section 7 .................................................................................. 70
Appendix VIII: Data Analysis for Section 8 ................................................................................. 77
Appendix X ................................................................................................................................... 84
Bibliography ................................................................................................................................. 85
References ..................................................................................................................................... 85

Consumer trust and perceived risk in B2C e-commerce | x
LIST OF TABLES
1. Reliability Statistics (Cronbach‟s Alpha)………………………………………..8
2. Reliability Statistics (Cronbach‟s Alpha and Split Half Technique)…………….8
3. Number of Brands per Use……………………………………………………..16
4. Level of Information Needed ………………………………………………….22
5. Level of Information Shared ………………………………………………….23
6. Awareness about Privacy Policy……………………………………………….24
7. Effectiveness of Privacy Policy………………………………………………. .24
8. History of Privacy Violation……………………………………………………26
9. Measure taken for Privacy Violation………………………………………….. 26
10. Perception on being overpriced…………………………………………………28
11. Preference of Freight Method ………………………………………………….29
12. Statistics of Hypothesis 1: Brand image positively affects a consumer‟s trust
I. One-Sample Statistics………………………………………………………32
II. One-Sample Test……………………………………………………………32
III. Correlations…………………………………………………………………33
13. Statistics of Hypothesis 2: A consumer‟s perception of high privacy of information
positively affects his trust
I. One-Sample Statistics………………………………………………………34
II. One-Sample Test……………………………………………………………35
14. Statistics of Hypothesis 3: A consumer‟s perception of financial security positively
affects his trust
I. One-Sample Statistics………………………………………………………36
II. One-Sample Test……………………………………………………………36
III. Correlations…………………………………………………………………37
15. Total Variance Explained……………………………………………………….38
16. KMO and Bartlett's Test………………………………………………………...41
17. Regression analysis using factors……………………………………………….41
18. Coefficient of the factors………………………………………………………..42
19. ANOVA………………………………………………………………………...44
1 | P a g e
1. INTRODUCTION
1.1 Origin of the Report
This report titled “Consumer Trust and Perceived Risk in B2C E-commerce” has been prepared
as a requirement for the completion of the course Research Methodology (K301) under the
supervision of our esteemed course instructor Professor Dr. Muhammad ZiaulhaqMamun,
Institute of Business Administration, University of Dhaka.
1.2 Research Background
E-commerce (or electronic commerce) entails the use of marketing and selling products and
services over the internet. It basically delineates the process of buying, selling, transferring, or
exchanging products, services, or information via the medium of the World Wide Web. E-
commerce can be divided into 3 primary categories, namely B2B (Business to Business), B2C
(Business to Consumers), and B2G (Business to Government). For the purpose of this report,
we‟ll focus on B2C only, which refers to the tactics and best practices used by businesses to
promote products and services to consumers online. In e-commerce‟s context, this refers to
marketing products to customers via internet, irrespective of their geographical location. With
the ever dynamic evolution of internet and its widespread usage, e-commerce is becoming one of
the most viable platforms for conducting business, even in Bangladesh. E-commerce started in
Bangladesh in the late 90s, with gift shops targeted towards the Non-Residential Bangladeshis
(NRBs), where people living abroad could buy gifts online and send them to their kin in
Bangladesh. But it officially started in 2009, with Bangladesh Bank allowing online payment in
the country. Another big factor which further propelled e-commerce in Bangladesh to become
the reckoning force that it is today was the lowering of cost of internet usage, and the
introduction of WiMax technology. After this, the Bangladeshi outsourcing community observed
rapid growth. Soon after, online shops and sites of Bangladeshi brands started popping up online,
especially in social media, and after 2013, when Bangladesh Bank gave permission to buy
products and services online using international credit cards, which meant that Bangladeshis
could buy and sell products all over the global marketplace, the sector has only boomed at an
Consumer trust and perceived risk in B2C e-commerce | 2
incredible rate. Ease of transaction, widening markets, and decreased overheads are factors that
make e-commerce solutions more and more attractive, as evident with the growth of online sales.
From governments to multinational companies to one-person start-ups, e-commerce is
increasingly viewed as a key business modality of the future, and with the world becoming
increasingly more digital and tech-savvy, e-commerce.
1.3 Problems
Despite its many advantages, E-commerce in Bangladesh has a host of issues, some of which are
presented below:
(a) Vague or Incorrect Product description: Online stores cannot provide customers with the
option to touch, manipulate, or try on a product before purchasing it; therefore, product
descriptions are paramount. One ecommerce problem occurs when a company fails to
communicate product features that potential customers are interested in. Include size, brand,
dimensions, weight, care instructions, ideas for use, material type information, etc. Make
customers feel confident about the products even though they cannot touch them.
(b) Hidden costs: Some websites or online brands do not mention extra fees or shipping charges
with their products and services. Also, many online companies advertise their products over
social media, but do not mention the price with the products. These additional charges may
infuriate and/or confuse the customers, if they find out about these hidden costs only when
processing their credit card information.
(c) Reactive or zero customer feedback option: With live transactions one has the opportunity to
test out a product, and provide feedback, or ask questions, but online, without the presence of a
FAQ section, or customer feedback tab, it normally cannot be done.
(d) Security and trust: People are cautious to reveal their personal credit information online, or to
conduct transactions through non-secure payment methods. People buy products from online by
placing faith in the sellers, and some businesses don‟t deliver the quality products they promise.
Other issues may include the fear of being hacked, or getting their personal computers virus
infected from business sites.
Consumer trust and perceived risk in B2C e-commerce | 3
These concerns are just the tip of the iceberg when it comes to e-commerce. These, and more,
shall be discussed below.
1.4 Research Question
Is there an effect of consumer trust and perception of risk on buying intent via e-commerce?
1.5 Objectives
1.5.1 Broad Objective:
The broad objective of this research is to investigate consumer trust and perception of risk while
buying via e-commerce.
1.5.2 Specific Objectives:
I. To gauge the effect of known vendors or brands on consumer trust.
II. To measure the effect of perception of privacy of information on a consumer‟s willingness to
buy online.
III. To understand the impact of perceived financial risk on the intent to buy.
1.6 Hypotheses
For specific Objective I Hypothesis 1: Brand image positively affects a consumer‟s intent to buy
For specific Objective II Hypothesis 2: A consumer‟s perception of high privacy of information
positively affects his intention to buy
For specific Objective III Hypothesis 3: A consumer‟s perception of financial security positively
affects his intention to buy

Consumer trust and perceived risk in B2C e-commerce | 4
1.7 Rationale
Since our topic is „consumer trust and perceived risk in B2C e-commerce‟, the research will
provide valuable insights into the main hurdles of trust that consumers face when making an e-
transaction, which ultimately limit consumers choices due to their hesitation to buy online, and
also businesses due to their inability to capture these consumers.
1.8 Scope
Due to a large population of people who may be potential or current consumers via e-
transactions, it will be comparatively easier to access the required sample size. However, our
report only investigates the consumer aspect of the report and this will therefore was limited to
the consumer perspective.
1.9 Limitations
Due to the length and depth of the questionnaire, most respondents did not seem to have
filled the questionnaire attentively, reflected in the missing or hurried answers.
More respondents could not be reached out to due to limitations of time and accessibility.
A lot of respondents approached do not shop online. 114 out of our 140 respondents said that
they were active e commerce users.
Most respondents felt uncomfortable when giving out identification data.
2.0 METHODOLOGY
2.1 Data Collection
The data gathered from the survey results are be the main source of data collection for the report.
The questions of the survey are self-administered and in the cases when the respondents were un-
available due to time or place constraints, they had been contacted via email or telephone, for
their convenience. Reference material for the report has been collected from credible and
qualified journals, articles and reports. Data consolidation has been carried out in numerous
ways, all elucidated below.
Consumer trust and perceived risk in B2C e-commerce | 5
2.1.1 Primary Sources
The primary sources include the first-hand information gathered from the subjected sample
group. The data collected directly from the customers through questionnaires and interviews are
the primary set of information for the report.
2.1.2 Secondary Sources
The secondary sources include a relevant set of sample that would provide information about the
subjected sample. Pertinent data could be collected from sources like e commerce enterprises,
and families. Other information sources include the articles and journals we‟ve used for our
research, of renowned local and foreign origins, and thosewe have used for referencing.
2.2 Sampling Methods
Since the population size is too large and unevenly dispersed, it was very difficult to reach
relevant respondents. So for the purpose of our report, non-probabilistic convenience/accidental
and judgmental sampling method, limited only to Dhaka city, has been used.
2.3 Sample Size
The sampling technique used on a broad scale is non-probabilistic sampling followed by a
combination of judgmental and convenience sampling.
For calculating the sample size, we used statistical techniques (with a level of confidence at 90%
and the precision level at 5%) and found that a theoretical levelof 273 respondents needed to be
interviewed. (Refer to Appendix III: Calculations for detailed calculations of the sample size).
However, due to multiple limitations of time, money and accessibility, we were unable to reach
out to our theoretical sample size, and in the end, we have managed to gather a total of 140
respondents, out of whom 114 actually have been found to conduct purchases over the internet.
2.4 Sample Frame
For the purpose of our research it is impossible to know the sample frame mainly due to the
reason that an extensive portion of the population are internet users, it is improbable to determine
precisely how many may or may not transact over the net. However, as per BTRC (Bangladesh
Consumer trust and perceived risk in B2C e-commerce | 6
Telecommunication Regulatory Commission), there are currently 40,800,000 Internet users in
Bangladesh for June 30, 2014, with a 24.5% internet penetration.
2.5 Purpose of Research
The purpose of the report is to provide insights and evaluate the current situation of B2C e-
commerce in Bangladesh, with an emphasis on the reliability of online transactions, and
consumer perceptions.
2.6 Questionnaire Development
The survey instrument for collecting the data was a questionnaire primarily including mostly
closed-end questions, with a few open-ended ones. The questionnaire consisted of 6 sections.
Part A sought information about the Respondent‟s Orientation to E-commerce. It had been
designed to glean information of whether the respondent is aware of the e-commerce industry in
Bangladesh, and whether he/she uses it, and what is his/her overall perception of trust for it.
Part B was designed to know the Effect of Brand in Perceived Value and Trust. In this section
respondents were asked to indicate specifics about the online brands they purchase from, to rate
the brands, to deduce the percentage spending of respondents for E-commerce out of the total
purchase portfolio, and to mention about their brand preference. Likert scaling was developed
and used in this section to rate opinions regarding branded and non-branded providers, their
quality of products and the service associated with it on an ordinal scale. The Likert scale used is
a 10 point Likert scale(with 1 meaning strongly disagree and 10 meaning strongly agree). The
purpose of constructing a 10 point scale was to eliminate any bias towards central tendency.
Part C was designed to test the Effect of Site Reputation on Buying Intent. In this part there were
two open-ended questions on the name of websites respondents visit and on the percentage of
websites they visit are non-branded. There was also a question where we tested the extent to
which respondents were likely to purchase from a non-branded site, using a Likert scale. It was a
10 point Likert scale.

Consumer trust and perceived risk in B2C e-commerce | 7
In Part D, we looked for Effects of Privacy in Perceived Value and Trust. The information we
sought include what information is shared and preferred to share, what extent of liberty is there
when it comes to share information, if and to what extent the private information is shared by the
providers publicly, if permission is sought by providers before sharing data, if there is any option
to be able to choose which data were to be shared, if the provider has a privacy policy, if the
privacy policy is effective, if there was any experience of victimization due to privacy violation,
if any rectifying measure was taken, if the measure was effective and if the measures are
satisfactory were the prime concern of this part.
In Part E, we looked into the Effects of Perceived Financial Risk. The prime concern for this part
were-
i) if the pricing was found beyond what it should be
ii) to what extent was the delivery charge justified
iii) what delivery charge method was there to follow
iv) what delivery method was actually preferred
v) if the provider allowed changing the product purchased
vi) to what extent does allowing to change the product affect purchasing habits
vii) how trustworthy was the pricing system.
In Part F, we simply sought generic Information about the Respondent. Specifically about their
gender, age, education level, current profession and monthly shopping budget.
2.7. Validity
A measure is valid if it measures what it is supposed to measure. In case of direct measures,
thevalidity is self-evident; and in case of indirect measures it is only approximate, e.g., indexes
and scales. In fact, there is no exact way to guarantee that an indirect measure is valid
formeasuring a concept.
We have used face validity to test the validity of the variables of this research. Face
validityimplies that the items chosen to measure a variable are logically related to it. From
theliterature reviews, we have logically determined the items to measure the variable.
Consumer trust and perceived risk in B2C e-commerce | 8
2.8. Reliability
Table 1: Reliability Statistics (Cronbach’s Alpha)
Cronbach's alpha is a measure of internal consistency that is, how closely related a set ofitems is
as a group. A "high" value of alpha is often used (along with substantive argumentsand possibly
other statistical measures) as evidence that the items measure an underlying (orlatent) construct.
However, a high alpha does not imply that the measure is one-dimensional.
If, in addition to measuring internal consistency, you wish to provide evidence that the scalein
question is one dimensional, additional analyses can be performed. Exploratory factoranalysis is
one method of checking dimensionality. Technically speaking, Cronbach's alpha isnot a
statistical test - it is a coefficient of reliability (or consistency).
A Cronbach‟s Alpha of 0.50 and above is considered to be reliable. Our Cronbach‟s
Alpha(Alpha Coefficient) for the 46 items is 0.502, suggesting that the items have
acceptableinternal consistency among them.
Table 2: Reliability Statistics (Cronbach’s Alpha and Split Half Technique)
Cronbach's Alpha Part 1 Value .879
N of Items 9a
Part 2 Value .733
N of Items 8b
Total N of Items 17
Correlation Between Forms .374
Spearman-Brown Coefficient Equal Length .544
Unequal Length .545
Guttman Split-Half Coefficient .482
Cronbach's Alpha Cronbach's Alpha Based
on Standardized Items
No. of Items
.502 .600 17
Consumer trust and perceived risk in B2C e-commerce | 9
a. The items are: Grade of Service, Likeliness to stick to the Brand in near future,
Branded Providers more reliable, Branded Providers provide better quality, Branded
providers price higher, Branded providers provide better service, Unlikeliness to
purchase from unknown sites, Does keeping from sharing info affects trust?, Liberty of
sharing info affects judgement.
b. The items are: The company keeps info private, The company asks permission before
sharing info, Privacy Policy Effective?, How effective the measures?, How satisfactory
are privacy measures?, How much is the transport charge justified, how do that affect
your trust?, how effective is the pricing system?.
Split half reliability is obtained by taking, at random, half of the variables in the scale,averaging
them into a single variable and then averaging the remaining half, and correlatingthe two
composite variables. The expected value for the random split-half reliability is alpha.It must be
noted that split-half reliability estimate is contingent upon how the items in thetest/scale are
arranged. Reordering of the items and/or regrouping of items in the test/scalecan result in
different reliability estimates using the split-half method. As we can see, thealpha values for the
two halves are .879 and .733 which means the data is reliable (asmentioned before alpha value
should be more than 0.5). Also, the different correlation coefficients suggest that the two halves
are positively correlated and significantly correlated.
Consumer trust and perceived risk in B2C e-commerce | 10
3.0 LITERATURE REVIEW
3.1 E-Commerce in Bangladesh:Bangladesh is a country that has very recently entered the
domain of e-commerce. Naturally, the e-commerce hasn‟t still developed optimally in
Bangladesh, with only 7% penetration, as per population (Mohiuddin, 2014). That being said, e-
commerce is growing at a rapid rate, as evidenced by the increasing transaction from BDT 0.450
million in 2012 to over BDT 2000 million in 2013 ((Mohiuddin, 2014).
3.2 Overview and Features of the E-commerce Industry:To give an insight on how the
current Internet Payments system security works, there are fundamentally two types of electronic
payments, namely the Internet Bank Card Payments System, E-cash internet payments system &
e-purse internet payments system and secondly, the electronic cheque internet payments system
(Jing, 2009). The safety elements are namely the integrity of the information, the validity of
information, the non-repudiation of information, the authenticity of the transaction status, and the
reliability of the system. Also, four different strategies can be considered for strengthening the
different internet payments systems, which are security strategy, legal protection, social moral
norms, and perfect management strategy.
To get a global perspective of countries ranked by e-commerce market size, we analyze
ATKearney‟s The 2013 Global Retail E-Commerce Index. This report lists down top 30
countries of the world in terms of their market size in e-commerce. They argue that countries go
up in the rank mostly because of solid infrastructural strength such as internet penetration,
prevalence of credit cards, and logistics strength for home delivery. However, the report does
recognize that consumers behavior plays a key role in determining the fluctuation in the market
share of e-commerce, e.g. we, Bangladeshis, are traditionally more inclined to shop in shopping
malls, but the increasing product prices and the option of online shopping has made us look
online for “best value” deals. From here, we can infer that perceived risk of e-commerce
transactions too can play a motivating factor for consumers to either opt more or less in the
world of e-commerce. It needs to be noted that the list contains mostly all countries in the world
that have exceptionally strong consumer protection laws.
Consumer trust and perceived risk in B2C e-commerce | 11
3.3 Perceived Risk and Trust factors in E-commerce: To illustrate our claims that security is a
concern for customers, a research paper by Zang and Dran, shows that amongst websites, users
would prefer only e-commerce sites based on howsecure data in the site is. The research paper
discusses the Kano model of customer satisfaction, and further discusses how the Kano Model
can be applicable for Website Quality Model. It explains that for any site to be successful it can‟t
be just only good in one category, but also in other categories that increases the overall quality of
the site.
In our research, we need to very specifically ask consumers that if provided that there is
infrastructural support, would they still be conducting e-commerce transactions in the absence of
strong regulatory or security frameworks. Zang and Dran could have had set up controlled
experiment to evaluate the efficacy of each elements of the websites that determined how high or
low quality a website is, which would have had given a clearer picture whether customer‟s
responses in surveys reflect well in actual websites by looking at their traffic. The ATKearney
report should have included the list of all the countries listed in the United Nations as per the
rankings of their market size of e-commerce. The report was guilty of not evaluating why other
countries are lagging behind in e-commerce, except for a brief case study on India. Thus their
report lacks insight for research on why e-commerce is not doing well in other countries. Jing‟s
suggestion on online security strategy seemed merely assertions, not an analysis on how these
strategies can be applied by e-commerce sites under various contexts, such as national rules and
regulations in countries where they are operating, ease and convenience of usage for consumers
if these strategies are implemented, etc.. Future researches should evaluate legal framework and
consumer trust as a factor for development of e-commerce, and propose newer and more secure
methods of online payment.
From the literature review it is deduced that, in order to measure consumer trust in e-commerce,
three parameters are needed to be considered –
a. Perception of Brand
b. Perception of privacy of information
c. Perceived financial risk
Consumer trust and perceived risk in B2C e-commerce | 12
4. E-COMMERCE PENETRATION AMONG RESPONDENTS
4.1. Awareness of E-commerce
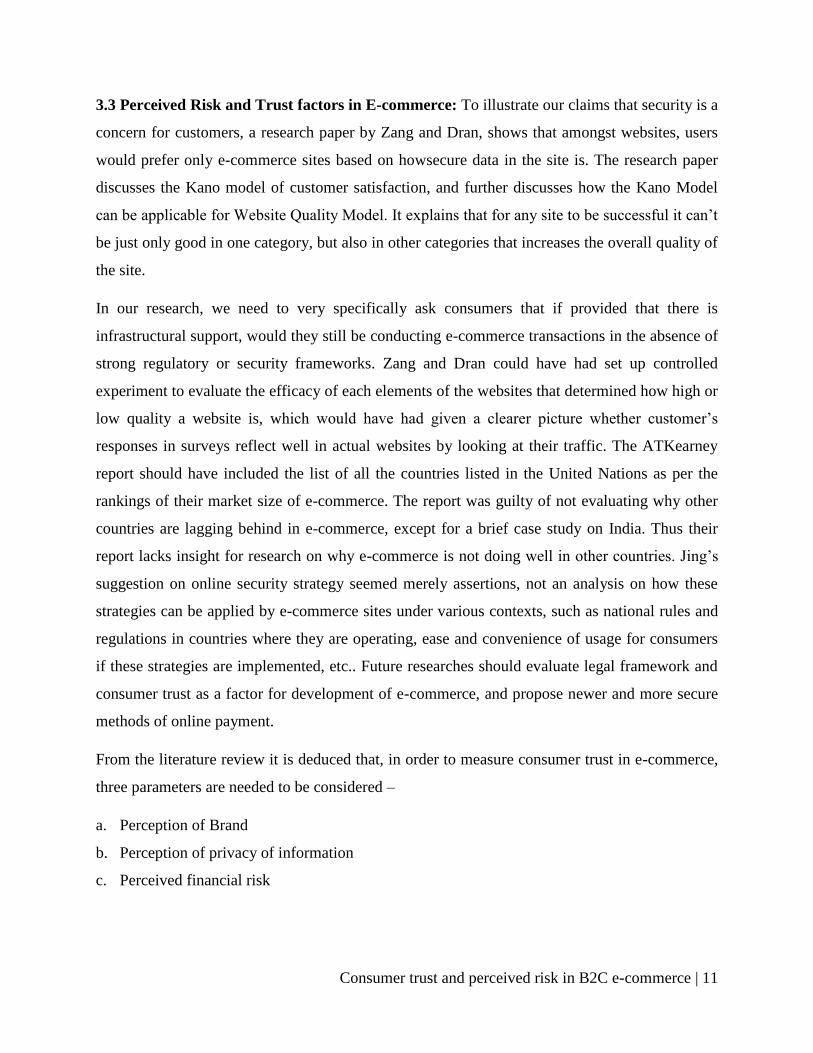
Of the 140 respondents, a grand total of 123 were aware of E-commerce in Bangladesh,
representing a percentage of 87.9%. Only 17 respondents (12.1%) were absolutely unaware of it.
This has been better illustrated in the pie chart below:
4.2. Usage of E-commerce
Majority of the respondents, constituting of 92.7%, are users of e-commerce, whereas 7.3% are
non-users. This is not surprising as e-commerce businesses have only started booming in
Bangladesh in the very recent past, and with the passage of time, the number of users is marked
to grow.
4.3. Awareness to Usage Ratio
From the findings above, we can see that out of our 140 respondents, 123 people are aware of e-
commerce, and 114 of them are users of e-commerce. So, the awareness to usage ratio of e-
commerce, as per our survey, stands at 92.7%, whereas the 9 out of 123 people – who are aware
of e-commerce, but do not avail of it‟s services – comprises only 7.3% of our data set.
Awareness of E-Commerce in Bangladesh
Aware
Unaware
Consumer trust and perceived risk in B2C e-commerce | 13
4.4. Percentage of Shopping Budget for E-commerce
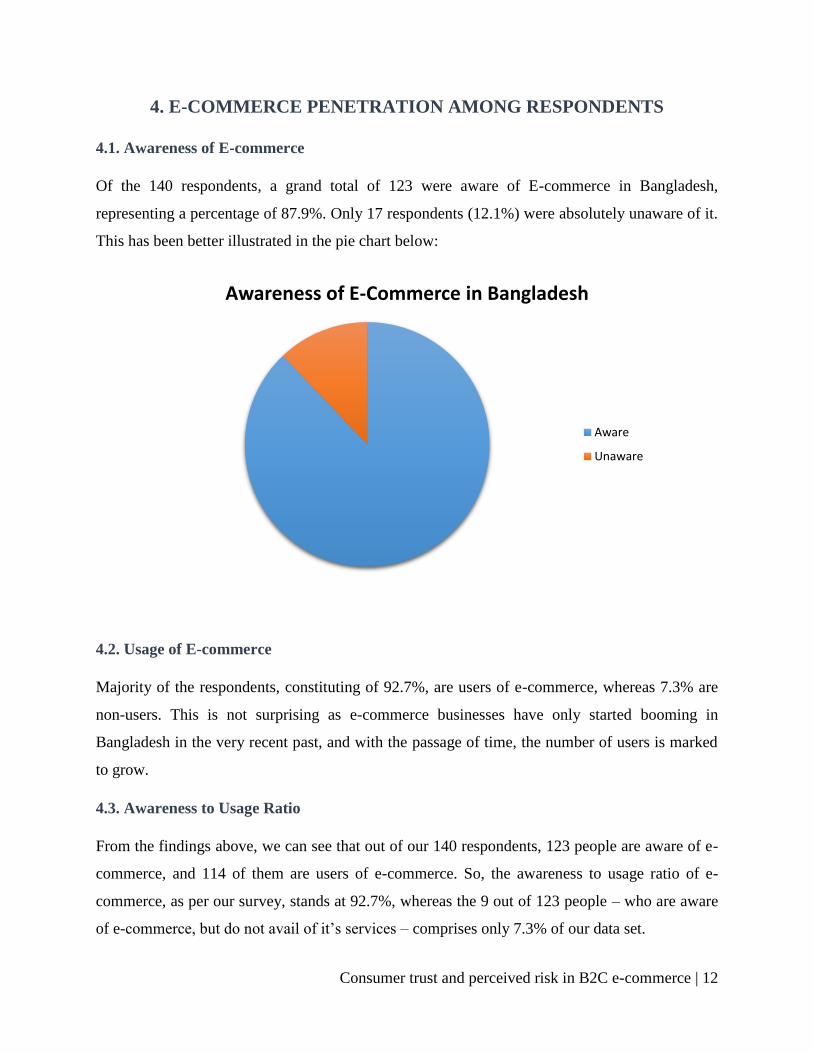
From our survey data, we can infer that the mean shopping budget allocated to e-commerce by
users stands at 14.1% of their total monthly budget, whereas the modal percentage stands a t a far
lower value of only 5%.
This, again, is not unseemly, as people who do actually avail of e-commerce services, are
tentative about trusting this new form of marketing, and a lot of hesitance comes from the
preconceived skepticism about e-commerce.
For the ease of calculation, we have divided our response set into 3 categories of the percentage
of monthly budget spending on e-commerce, classified here as High (More than 70%), Medium
(30% to 70%) and Low (Below 30%). Only 4.6% of our respondents have a high percentage,
compared to 13.8% falling under the medium parameter, and an overwhelming 81.6% with a
monthly e-commerce budget below 30%.(Refer to Appendix IVfor detailed Frequency Analyses
Tables)
Consumer trust and perceived risk in B2C e-commerce | 14
5. DEMOGRAPHIC OF E-COMMERCE USERS
5.1. Gender
About 53.5% of our respondents are female, compared to only 46.5% of male respondents.
5.2. Age
The mean age of our respondents stands at 20.88 years. 11.5% of our respondents are below the
age of 18, whereas 8% are above the age of 24. The rest (80.5%) fall in the 18 to 24 age group.
5.3. Education Level
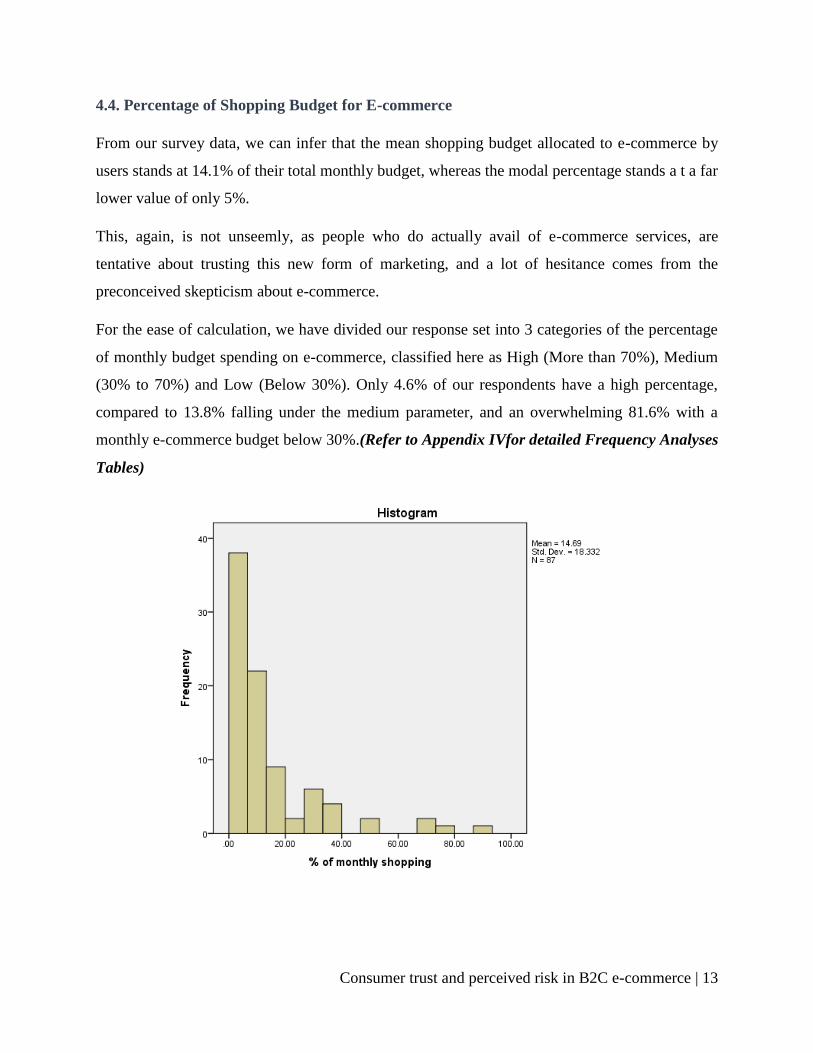
Education wise, 19 of our respondents, comprising 16.7% are non-graduates, i.e. have not
reached the undergraduate level yet. 74.6% are undergraduate students, and 8.8% are graduates.
This is expected, as majority of our respondents fall in the 18 to 24 age demographic, which is
the age group occupied by most undergraduates.
5.4. Profession
In the case of professions occupied by our respondents, a grand total of 76.3% are students,
compared to only 23.7% of jobholders. This is not totally unexpected, because the younger
generation is more technologically savvy than their predecessors; and not only that, as our survey
Education Level Demographic
Non-Graduate
Undergraduate
Graduates
Consumer trust and perceived risk in B2C e-commerce | 15
was completed mostly by non-graduates and undergraduates, it does make sense that most of
them are not officially employed yet.
6. PERCEPTION ON BRAND
Brand is a name, color, symbol, slogan or a combination of these that aims to create a distinct
identity of a particular offering. In terms of e-commerce, the concept of Brand is slightly
different from that of marketplace. Whereas in marketplace Brands usually represent
manufacturing companies, in e-commerce they represent both the manufacturers and the
retailers. For example, a manufacturing Brand like „Bata‟ can open its own webpage, or it can
sell its product through an established retail page like „Ekhanei.com‟.
Section B and section C from the questionnaire concentrated on consumers perceptions on
different aspects of Brands while shopping via e-commerce. Initially, questions related to
consumers‟ Brand orientation were asked to find out their preferences. Afterwards, survey was
performed to find out respondents‟ Brand loyalty, perception on product and service quality and
value for money.
6.1. Number of Brands perUser
Respondents were asked to answer the number of Brands they usually purchase from. Out of 114
e-commerce users, 96 purchases from 3 or less number of Brands, which is 84.2% of the total
respondent. The Mean number of Brands a user purchase from is 2.19 and the Mode is 2 brands
per person (35 respondents), followed by 1 Brand per person (33 respondents) and 3 Brands per
person (20 respondents). No respondent purchases from more than 7 Brands.(Refer to Appendix
VI for detailed Frequency Table with Histogram)

Consumer trust and perceived risk in B2C e-commerce | 16
Table 3: Number of Brands per User
Number of Brands Respondents (In Number) Respondents (In Percentage)
0 8 7
1 33 28.9
2 35 30.7
3 20 17.5
4 9 7.9
5 5 4.4
6 2 1.8
7 2 1.8
Total 114 100
6.2. Most Preferred Brands
According to test results, the most popular e-commerce Brand is „Food Panda‟ (36 respondents),
followed by Rokomari.com (19), Bikroy.com (8) and Hungry Naki (7). Collectively these 4
Brands are preferred to 53% of the respondents. Respondents have mentioned a total of 24
Brands and most of them have insignificant awareness. 14 of the respondents have mentioned
that they do not prefer any particular Brand. The following Pie Chart presents the comparative
share of the Brand preference of 114 user respondents.(Refer to Appendix VI: detailed
Frequency Analyses Table).
Figure 6.1: Most preferred Brands by respondents
36
198
74
33
21
14Food Panda
Rokomari.com
Bikroy.com
Hungry Naki
Ekhanei.com
Akhoni.com
Banglashoppers.com
Others
Consumer trust and perceived risk in B2C e-commerce | 17
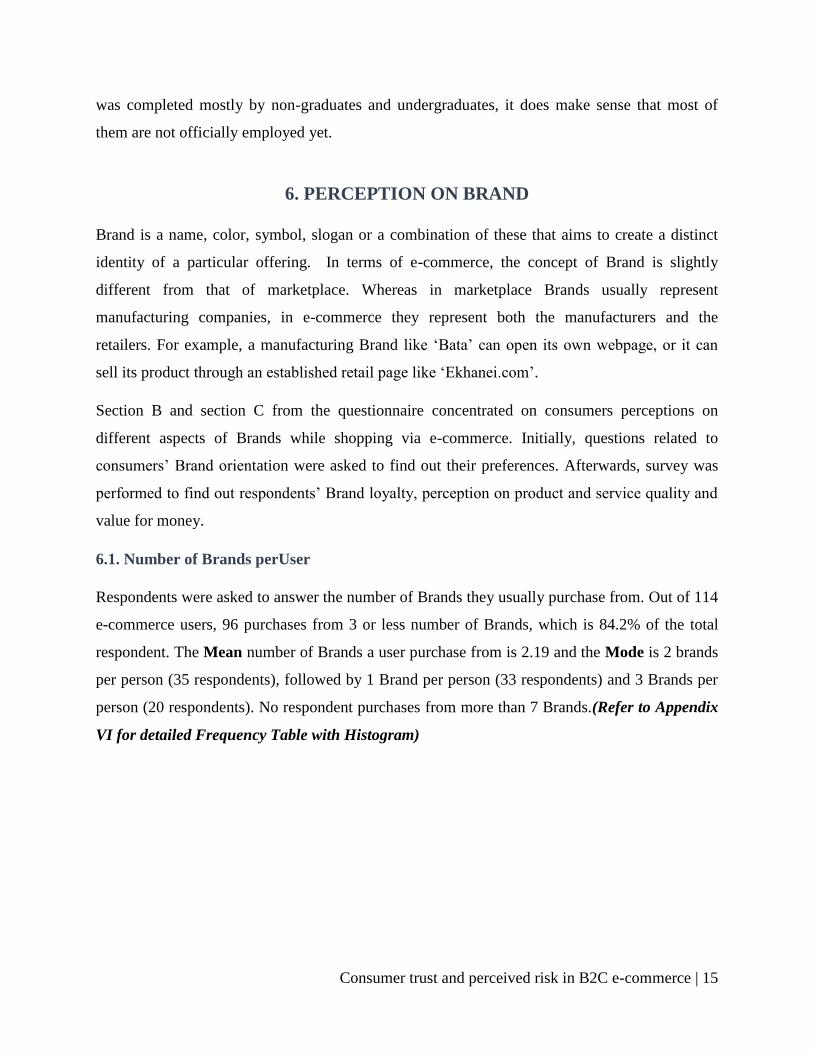
6.3. Measuring Brand Loyalty
Respondents were asked to determine the likeliness of their sticking to the current Brand in the
near future. The question was structured with a „Likert Scale‟ with „Highly Unlikely‟ at 1 and
„High Likely‟ at 10. A higher mark in this question indicates a stronger Brand loyalty. The Mean
score was 4.91 and the Mode was 3. Distribution of the responses shows that there are three
categories of Brand loyalty among respondents. The major portion of the respondents shows a
low brand loyalty; a total of 44% of the respondents scored 4 or lower. The second majority
(around 33%) shows average brand loyalty and they scored 5 to 7. The third category (around
20%) shows strong Brand loyalty. However, these responses are highly subjective. Since the
previous section proves that many brands are operating in the electronic market and users are
mostly associated with 3 or less brands, the role of those particular brands are supposed to play
strong role in these responses. This explains the heterogeneity of the respondents‟ Brand loyalty.
(Refer to Appendix VI: detailed Frequency Analyses Table)
Figure 6.2: Distribution of Brand loyalty
Consumer trust and perceived risk in B2C e-commerce | 18
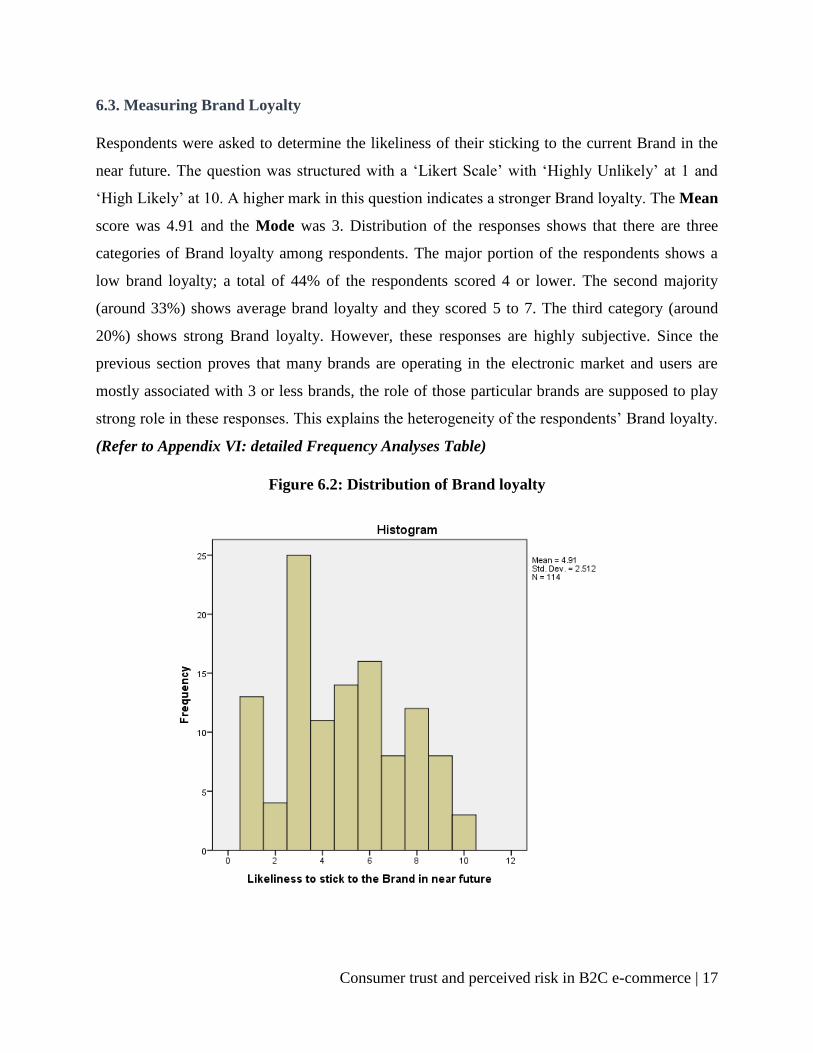
6.4. Perception on Security
Respondents were asked to what extent they feel more secure by purchasing from a brand
compared to a non-branded provider. The question was structured in a „Likert Scale‟. A higher
score will mean that the customer feels more secure while purchasing from a branded provider.
The Mean score was 6.69 and the mode was 9 (28 respondents). Observing the distribution of
marks from the histogram, it is evident that more than 65% of the respondents marked a score 6
or higher. However, 21% of the respondents marked 3 or less. It shows that a portion of the
respondent do not find any difference between a branded providers and non-branded providers in
terms of security.(Refer to Appendix VI: detailed Frequency Analyses Table).
Figure 6.3 Perception of comparative security while purchasing from a Brand
6.5. Perception on Product Quality
This question focuses to track customers‟ perception about the quality of a product while
purchasing from a brand. The question was structured in a „Likert Scale‟. A higher mark means
that the respondent finds the products meeting quality requirements. The Mean of responses is

Consumer trust and perceived risk in B2C e-commerce | 19
6.29 and the Mode is 8. This shows that, overall consumers are moderately satisfied with the
product quality. However, all the consumers are not homogenous in this regard. The major
portion (55.3%) marked 7 or higher. These are the people who can be termed as „satisfied‟. 20%
of the respondents scored 5 and 6. These are the people who are neither satisfied nor dissatisfied
with the quality of product. The rest 23% marked 4 or lower; these are the consumers who are
more dissatisfied with the quality of the product.(Refer to Appendix VI for detailed Frequency
Analyses Table).
Figure 6.4 Perception of product quality while purchasing from a Brand
6.6. Perception on Service Quality
Beside product quality, service quality is another significant measurement in e-commerce. This
section focuses to track customers‟ perception of service quality by „Likert Scale‟. A higher
score represents a more positive perception on service quality while purchasing from e-
commerce brands. The Mean is 6.29 and the Mode is 8. Furthermore,distribution of the scores
show that 65% of the respondents marked 6 or higher. This shows that the overall perception of

Consumer trust and perceived risk in B2C e-commerce | 20
service quality is high in the industry. (Refer to Appendix VI: detailed Frequency Analyses
Table).
Figure 6.5 Perception of service quality while purchasing from a Brand
6.7. Perception on Value for Money
Though consumers are overall satisfied in the product quality and service quality provided by
Brands; they show dissatisfaction when it comes to the question of value for money. The term
„value for money‟ means the perception of getting the appropriate quality product in comparison
to the price paid to purchase it. A higher score in the Likert Scale means higher satisfaction.
According to the responses of 114 users, the Mean score is 4.47 and Mode is 2. This certainly
shows that customers do not feel that they get the value for money. The following Histogram
shows the distribution of the responses.(Refer to Appendix VI: detailed Frequency Analyses
Table).
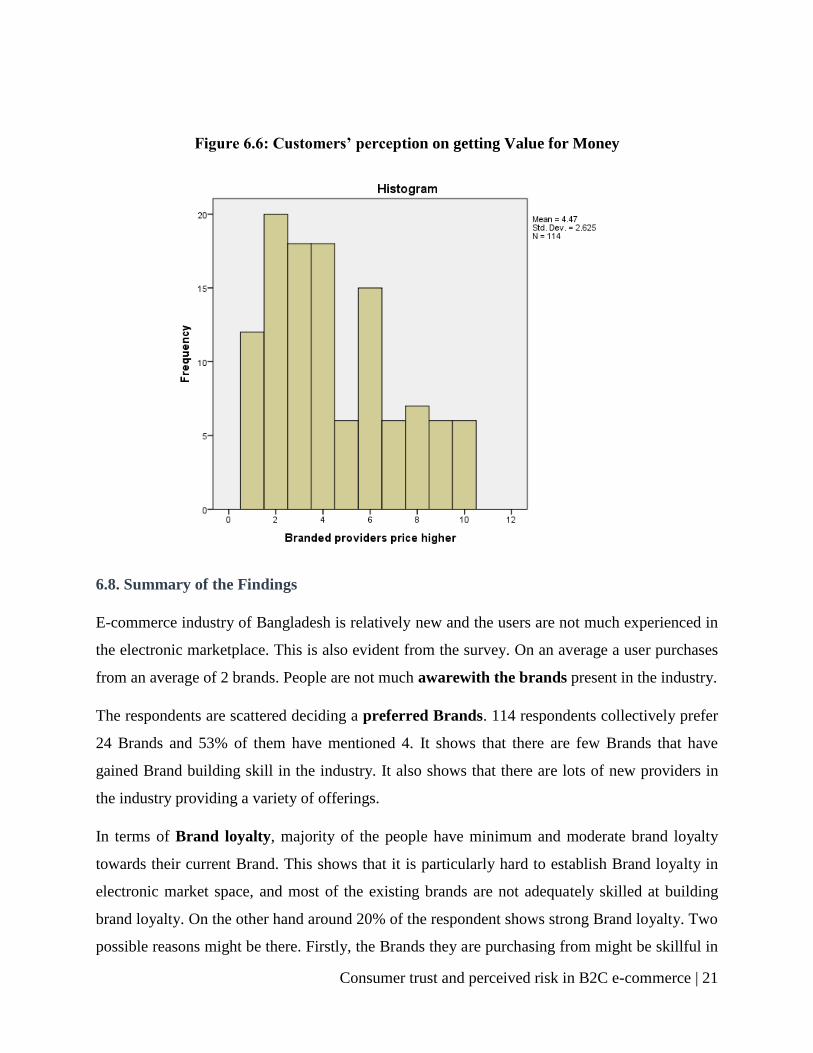
Consumer trust and perceived risk in B2C e-commerce | 21
Figure 6.6: Customers’ perception on getting Value for Money
6.8. Summary of the Findings
E-commerce industry of Bangladesh is relatively new and the users are not much experienced in
the electronic marketplace. This is also evident from the survey. On an average a user purchases
from an average of 2 brands. People are not much awarewith the brands present in the industry.
The respondents are scattered deciding a preferred Brands. 114 respondents collectively prefer
24 Brands and 53% of them have mentioned 4. It shows that there are few Brands that have
gained Brand building skill in the industry. It also shows that there are lots of new providers in
the industry providing a variety of offerings.
In terms of Brand loyalty, majority of the people have minimum and moderate brand loyalty
towards their current Brand. This shows that it is particularly hard to establish Brand loyalty in
electronic market space, and most of the existing brands are not adequately skilled at building
brand loyalty. On the other hand around 20% of the respondent shows strong Brand loyalty. Two
possible reasons might be there. Firstly, the Brands they are purchasing from might be skillful in
Consumer trust and perceived risk in B2C e-commerce | 22
building Brand loyalty. Secondly, to build loyalty it requires a minimum number of purchases,
these people might be used to purchasing from their current Brands for quite some time and more
loyal than other people.
Brand in E-commerce provide customers with a sense of security. On average the respondents
feels more secure while purchasing from a reputed Brand. This is normal for any business in any
form and the role of Brand is proved equally important in electronic market space.
In Product and ServiceQuality, majority of the people perceive Branded products to be of
better quality compared to a non-Brand product. However, though comparatively few in number,
some of the respondents disagree to this common phenomenon. The reason behind that is more
likely to be individual trait. It is established that many people think that they are not influenced
by Brands.
However, similar to usual marketplace e-commerce users perceive that they are not receiving the
appropriate level of value for the money they are paying.This is a general perception of the
consumers and it is same in the e-commerce field.
7. PERCEPTION ON PRIVACY OF INFORMATION
7.1. Level of Information Needed
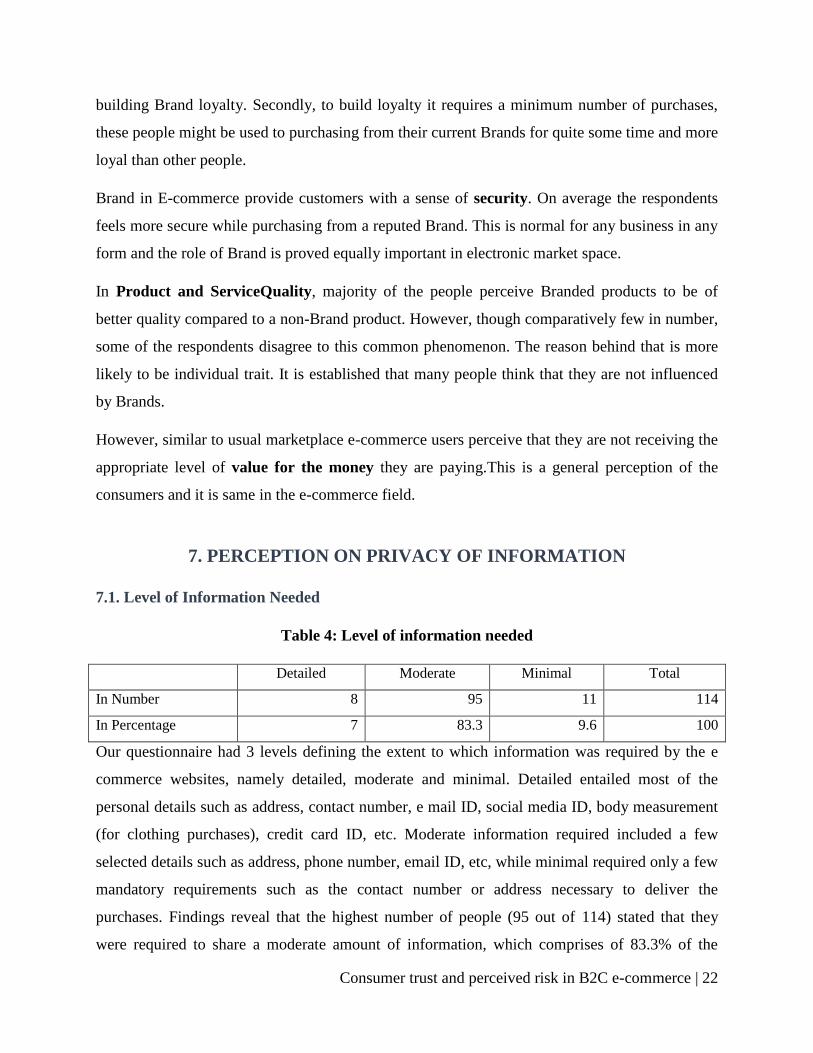
Table 4: Level of information needed
Detailed Moderate Minimal Total
In Number 8 95 11 114
In Percentage 7 83.3 9.6 100
Our questionnaire had 3 levels defining the extent to which information was required by the e
commerce websites, namely detailed, moderate and minimal. Detailed entailed most of the
personal details such as address, contact number, e mail ID, social media ID, body measurement
(for clothing purchases), credit card ID, etc. Moderate information required included a few
selected details such as address, phone number, email ID, etc, while minimal required only a few
mandatory requirements such as the contact number or address necessary to deliver the
purchases. Findings reveal that the highest number of people (95 out of 114) stated that they
were required to share a moderate amount of information, which comprises of 83.3% of the

Consumer trust and perceived risk in B2C e-commerce | 23
respondents. 11 people or 9.6% said they were only asked for a minimal level of information
while 8 respondents or 7% declared that they were required to share details. The mode for this is
therefore number 2 (moderate information), as per the questionnaire arrangement.(Refer to
Appendix VII: detailed Frequency Analyses Table).
7.2. Level of Information Shared
Table 4: Level of Information shared
Detailed Moderate Minimal Total
In Number 6 40 67 113
In Percentage 5.3 35.4 59.4 100
Respondents were asked how much of their information the e commerce companies were sharing
publicly again using the 3 levels of detailed (Photo, Address, Phone no, email, etc), moderate
(Social Media, E mail ID) and minimal (little or no information shared). A majority of the
population replied that minimmal information was shared by the companies, and this is
representative of 67 or 59.4% of the sample population. 40 or 35.4% had moderate information
shared while 6 people or only 5.3% had more information revealed.
7.3. Customer Control over Information Sharing
Seeking of Permission
Yes No N/A Total
In Number 50 23 34 107
In Percentage 45.8 21.5 31.8 100
We asked the respondents if the service providers asked them for their permission before sharing
their information with others, and 45.8% comprising of 50 people, claimed that yes, the
providers did indeed ask for their consent. 21.5% or 23% responded negatively while 31.8% (34
people) marked the question as „not applicable‟. There is however, always a distinct possibility
that the service providers may be providing information to other companies such as insurance or
Consumer trust and perceived risk in B2C e-commerce | 24
telecom companies trying to recruit customers, without the consumers‟ knowledge. .(Refer to
Appendix VII for detailed Frequency Analyses Table)
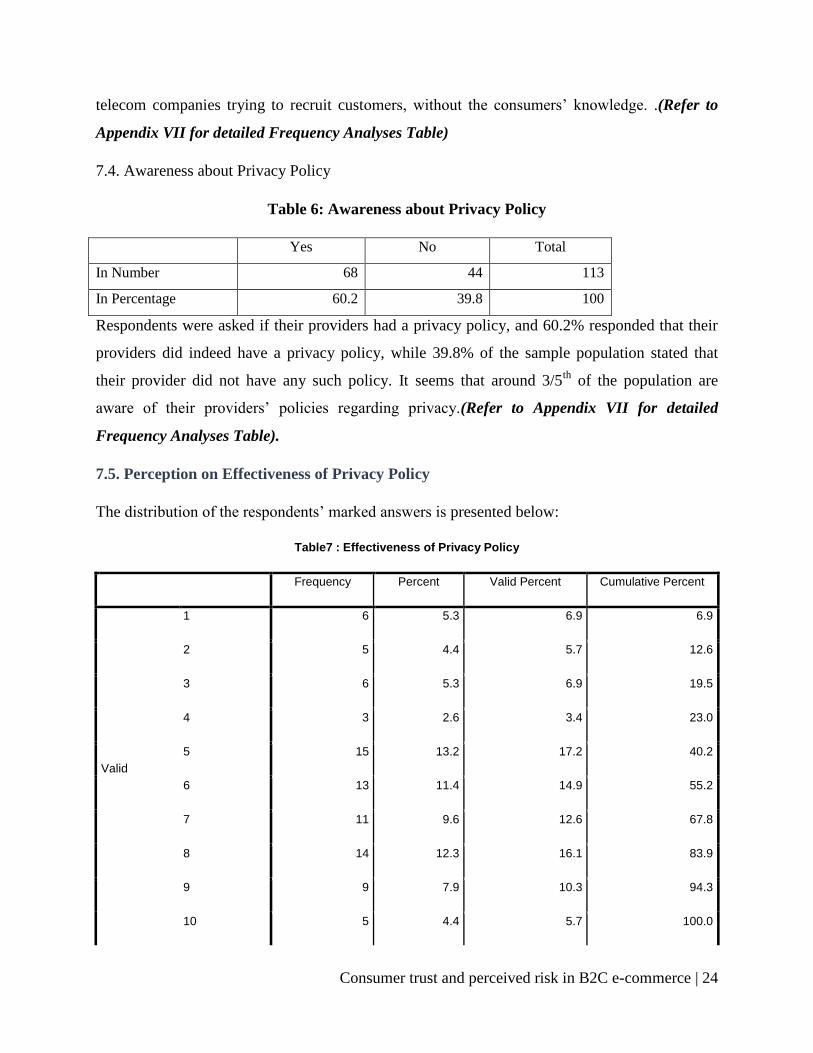
7.4. Awareness about Privacy Policy
Table 6: Awareness about Privacy Policy
Yes No Total
In Number 68 44 113
In Percentage 60.2 39.8 100
Respondents were asked if their providers had a privacy policy, and 60.2% responded that their
providers did indeed have a privacy policy, while 39.8% of the sample population stated that
their provider did not have any such policy. It seems that around 3/5th
of the population are
aware of their providers‟ policies regarding privacy.(Refer to Appendix VII for detailed
Frequency Analyses Table).
7.5. Perception on Effectiveness of Privacy Policy
The distribution of the respondents‟ marked answers is presented below:
Table7 : Effectiveness of Privacy Policy
Frequency Percent Valid Percent Cumulative Percent
Valid
1 6 5.3 6.9 6.9
2 5 4.4 5.7 12.6
3 6 5.3 6.9 19.5
4 3 2.6 3.4 23.0
5 15 13.2 17.2 40.2
6 13 11.4 14.9 55.2
7 11 9.6 12.6 67.8
8 14 12.3 16.1 83.9
9 9 7.9 10.3 94.3
10 5 4.4 5.7 100.0

Consumer trust and perceived risk in B2C e-commerce | 25
Total 87 76.3 100.0
Missing MISSING 27 23.7
Total 114 100.0
When inquiring as to whether the respondents found their providers‟ privacy policies effective,
we provided a likert scale so as to signify the extent to which they thought the privacy policies
were found effective, 1 being very ineffective and 10 being very effective. The mode here is a
rating of 5, by 13.2% of the population, although the mode is not staggeringly distinct. A not too
distant 12.3% rate their providers as 8. 6 people or 5.3% find the policies absolutely ineffective
while 5 people or 4.4% find it very effective. Other statistics are shown in detail in tabulated
form above. The bar chart below demonstrates the same information, showing that most people
have actually rated the effectiveness to be between 5 and 9.
Consumer trust and perceived risk in B2C e-commerce | 26
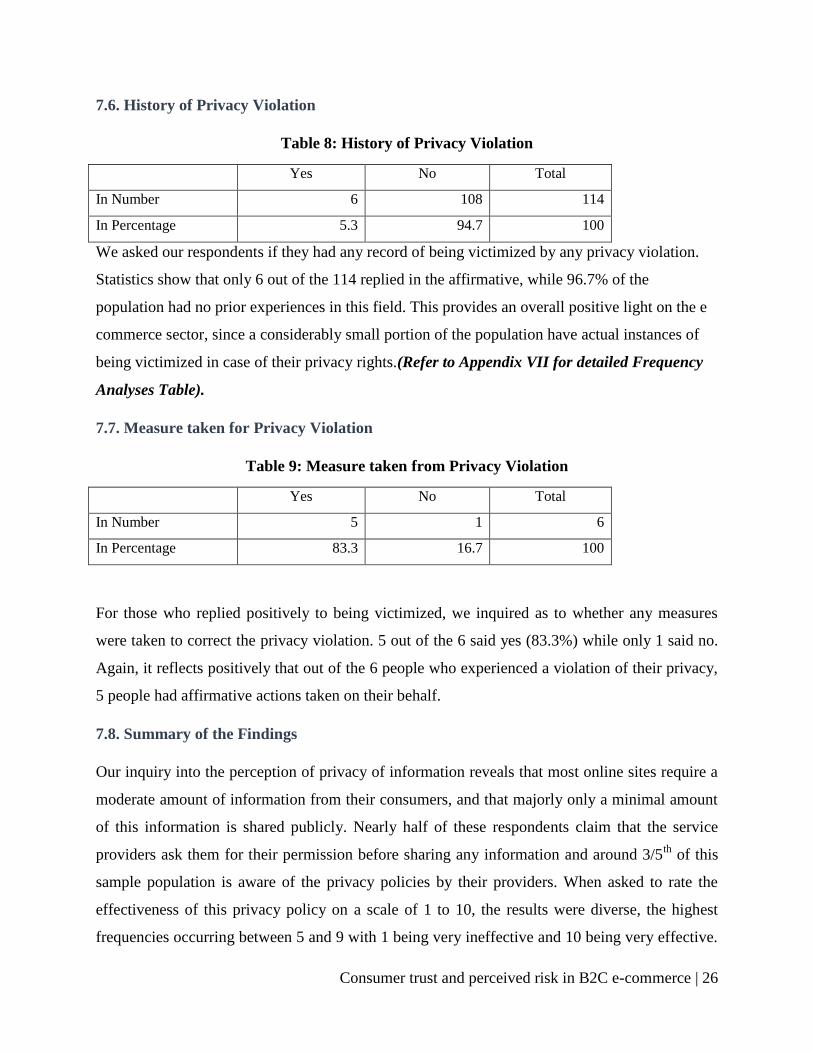
7.6. History of Privacy Violation
Table 8: History of Privacy Violation
Yes No Total
In Number 6 108 114
In Percentage 5.3 94.7 100
We asked our respondents if they had any record of being victimized by any privacy violation.
Statistics show that only 6 out of the 114 replied in the affirmative, while 96.7% of the
population had no prior experiences in this field. This provides an overall positive light on the e
commerce sector, since a considerably small portion of the population have actual instances of
being victimized in case of their privacy rights.(Refer to Appendix VII for detailed Frequency
Analyses Table).
7.7. Measure taken for Privacy Violation
Table 9: Measure taken from Privacy Violation
Yes No Total
In Number 5 1 6
In Percentage 83.3 16.7 100
For those who replied positively to being victimized, we inquired as to whether any measures
were taken to correct the privacy violation. 5 out of the 6 said yes (83.3%) while only 1 said no.
Again, it reflects positively that out of the 6 people who experienced a violation of their privacy,
5 people had affirmative actions taken on their behalf.
7.8. Summary of the Findings
Our inquiry into the perception of privacy of information reveals that most online sites require a
moderate amount of information from their consumers, and that majorly only a minimal amount
of this information is shared publicly. Nearly half of these respondents claim that the service
providers ask them for their permission before sharing any information and around 3/5th
of this
sample population is aware of the privacy policies by their providers. When asked to rate the
effectiveness of this privacy policy on a scale of 1 to 10, the results were diverse, the highest
frequencies occurring between 5 and 9 with 1 being very ineffective and 10 being very effective.

Consumer trust and perceived risk in B2C e-commerce | 27
Only 6 out of 114 have a history of privacy violation and 5 out of these 6 respondents have also
had corrective measures taken on behalf of them by providers.
Consumer trust and perceived risk in B2C e-commerce | 28
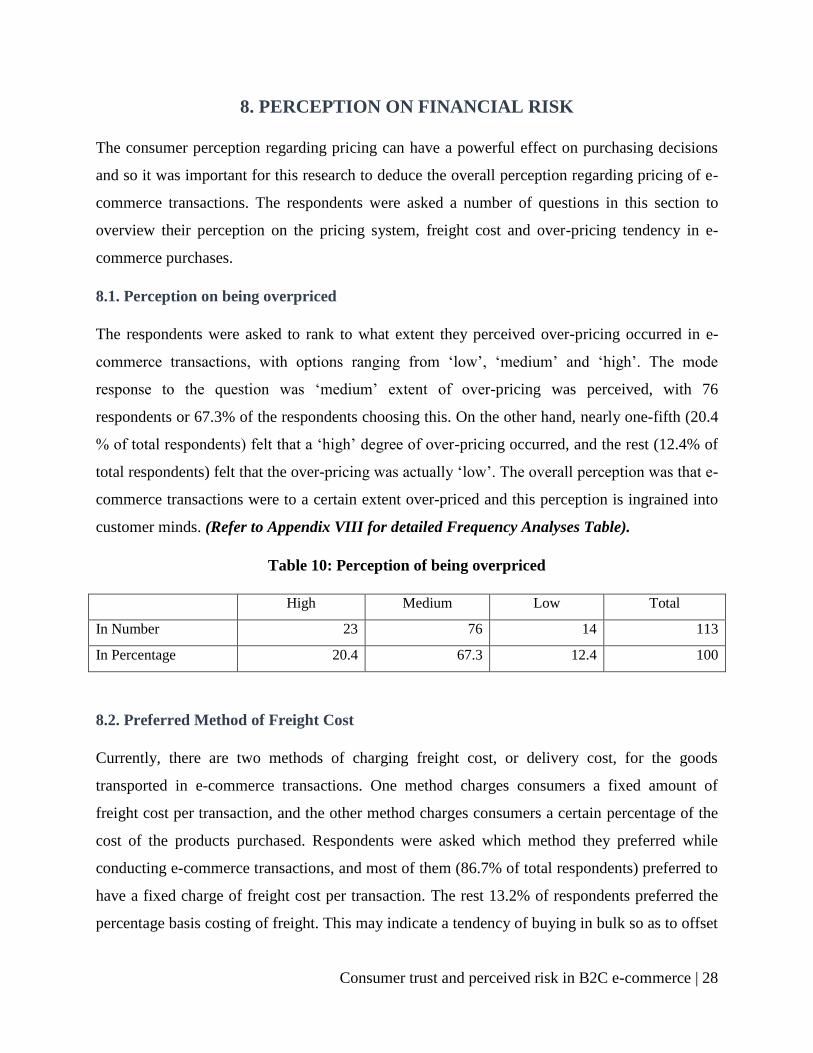
8. PERCEPTION ON FINANCIAL RISK
The consumer perception regarding pricing can have a powerful effect on purchasing decisions
and so it was important for this research to deduce the overall perception regarding pricing of e-
commerce transactions. The respondents were asked a number of questions in this section to
overview their perception on the pricing system, freight cost and over-pricing tendency in e-
commerce purchases.
8.1. Perception on being overpriced
The respondents were asked to rank to what extent they perceived over-pricing occurred in e-
commerce transactions, with options ranging from „low‟, „medium‟ and „high‟. The mode
response to the question was „medium‟ extent of over-pricing was perceived, with 76
respondents or 67.3% of the respondents choosing this. On the other hand, nearly one-fifth (20.4
% of total respondents) felt that a „high‟ degree of over-pricing occurred, and the rest (12.4% of
total respondents) felt that the over-pricing was actually „low‟. The overall perception was that e-
commerce transactions were to a certain extent over-priced and this perception is ingrained into
customer minds. (Refer to Appendix VIII for detailed Frequency Analyses Table).
Table 10: Perception of being overpriced
High Medium Low Total
In Number 23 76 14 113
In Percentage 20.4 67.3 12.4 100
8.2. Preferred Method of Freight Cost
Currently, there are two methods of charging freight cost, or delivery cost, for the goods
transported in e-commerce transactions. One method charges consumers a fixed amount of
freight cost per transaction, and the other method charges consumers a certain percentage of the
cost of the products purchased. Respondents were asked which method they preferred while
conducting e-commerce transactions, and most of them (86.7% of total respondents) preferred to
have a fixed charge of freight cost per transaction. The rest 13.2% of respondents preferred the
percentage basis costing of freight. This may indicate a tendency of buying in bulk so as to offset
Consumer trust and perceived risk in B2C e-commerce | 29
the disadvantages of fixed freight cost.(Refer to Appendix VIII for detailed Frequency Analyses
Table).
Table 11: Preference of Freight method
Fixed Percentage based Total
In Number 99 15 114
In Percentage 86.8 13.2 100
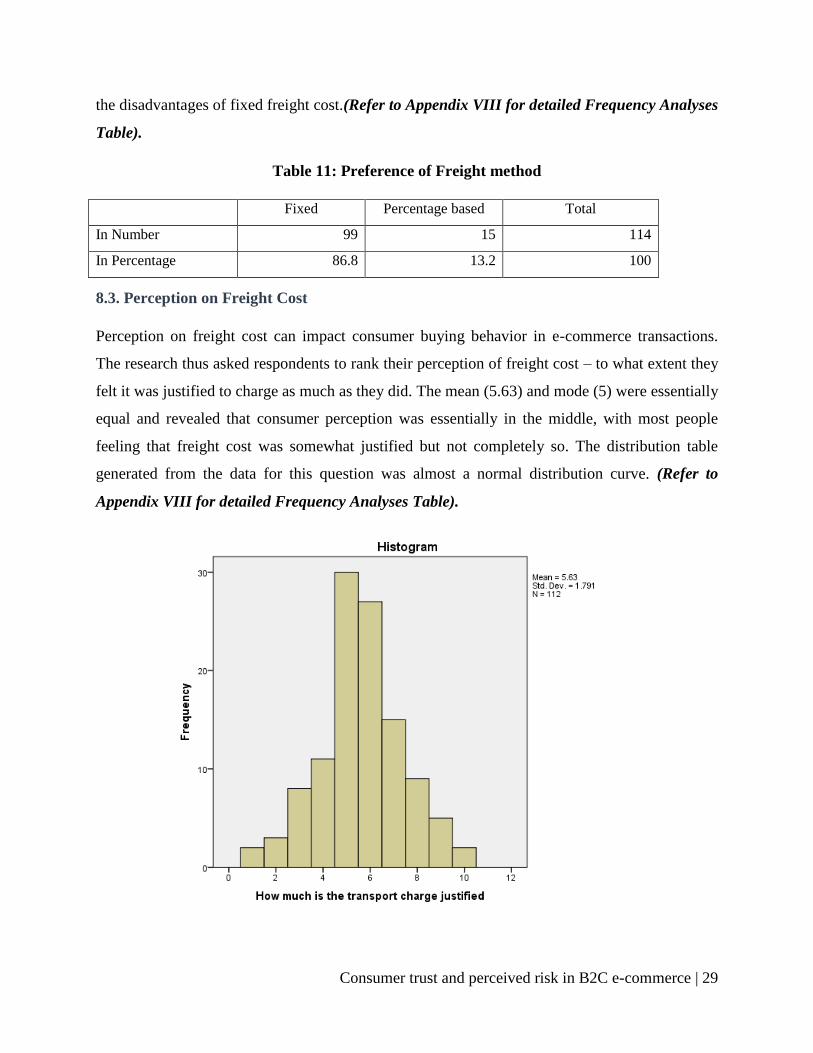
8.3. Perception on Freight Cost
Perception on freight cost can impact consumer buying behavior in e-commerce transactions.
The research thus asked respondents to rank their perception of freight cost – to what extent they
felt it was justified to charge as much as they did. The mean (5.63) and mode (5) were essentially
equal and revealed that consumer perception was essentially in the middle, with most people
feeling that freight cost was somewhat justified but not completely so. The distribution table
generated from the data for this question was almost a normal distribution curve. (Refer to
Appendix VIII for detailed Frequency Analyses Table).
Consumer trust and perceived risk in B2C e-commerce | 30
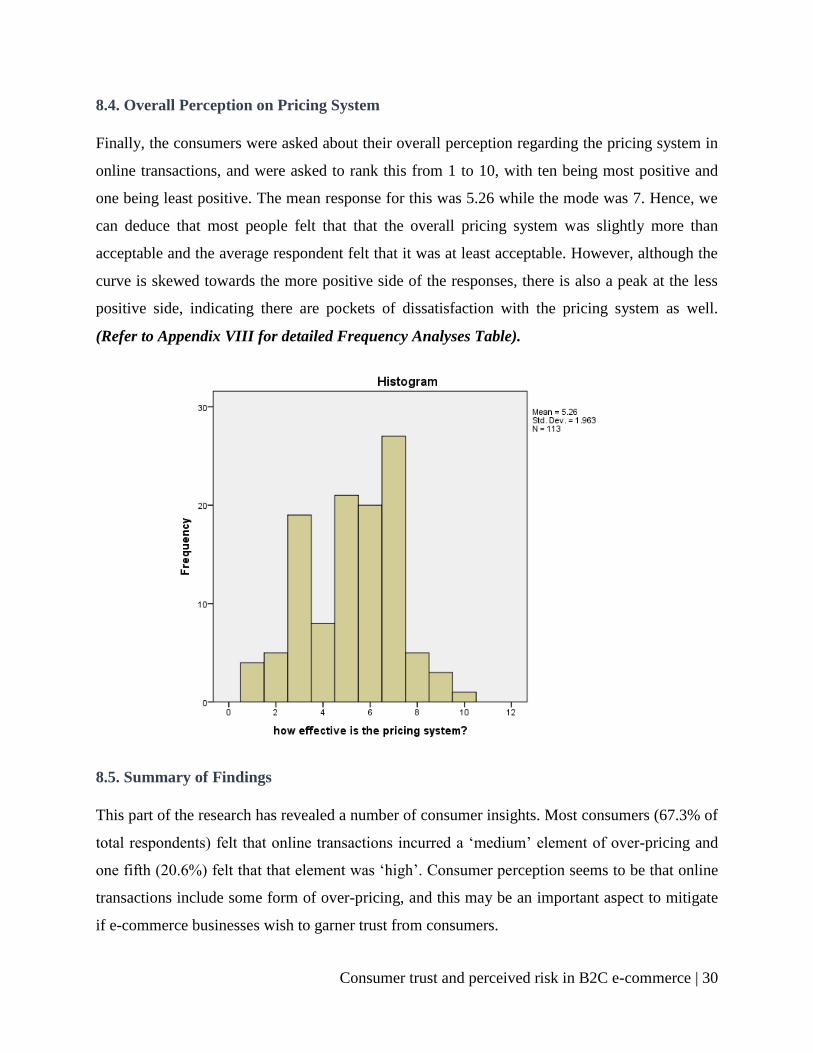
8.4. Overall Perception on Pricing System
Finally, the consumers were asked about their overall perception regarding the pricing system in
online transactions, and were asked to rank this from 1 to 10, with ten being most positive and
one being least positive. The mean response for this was 5.26 while the mode was 7. Hence, we
can deduce that most people felt that that the overall pricing system was slightly more than
acceptable and the average respondent felt that it was at least acceptable. However, although the
curve is skewed towards the more positive side of the responses, there is also a peak at the less
positive side, indicating there are pockets of dissatisfaction with the pricing system as well.
(Refer to Appendix VIII for detailed Frequency Analyses Table).
8.5. Summary of Findings
This part of the research has revealed a number of consumer insights. Most consumers (67.3% of
total respondents) felt that online transactions incurred a „medium‟ element of over-pricing and
one fifth (20.6%) felt that that element was „high‟. Consumer perception seems to be that online
transactions include some form of over-pricing, and this may be an important aspect to mitigate
if e-commerce businesses wish to garner trust from consumers.
Consumer trust and perceived risk in B2C e-commerce | 31
In case of freight cost, nearly everyone (86.8 of total respondents) felt that fixed freight cost
pricing was more preferable to percentage pricing. In general, the perception regarding freight
cost was that it was more or less justified, with a mean and mode of approximately 5 out of 10.
Consumer tendency to prefer fixed freight cost may indicate an affinity for bulk buying to
minimize the cost per transaction.
Overall, the perceptions regarding the pricing system in online transactions are positively
skewed in this research. This is contrary to the perception that a medium extent of over-pricing
exists in e-commerce transactions. This may indicate that consumers expect a certain level of
over-pricing for the benefit of shopping at home, and this may leave room for price sensitive
marketing by online businesses.
9. EFFECT OF BRAND, PRIVACY AND FINANCIAL RISK ON
CONSUMER TRUST
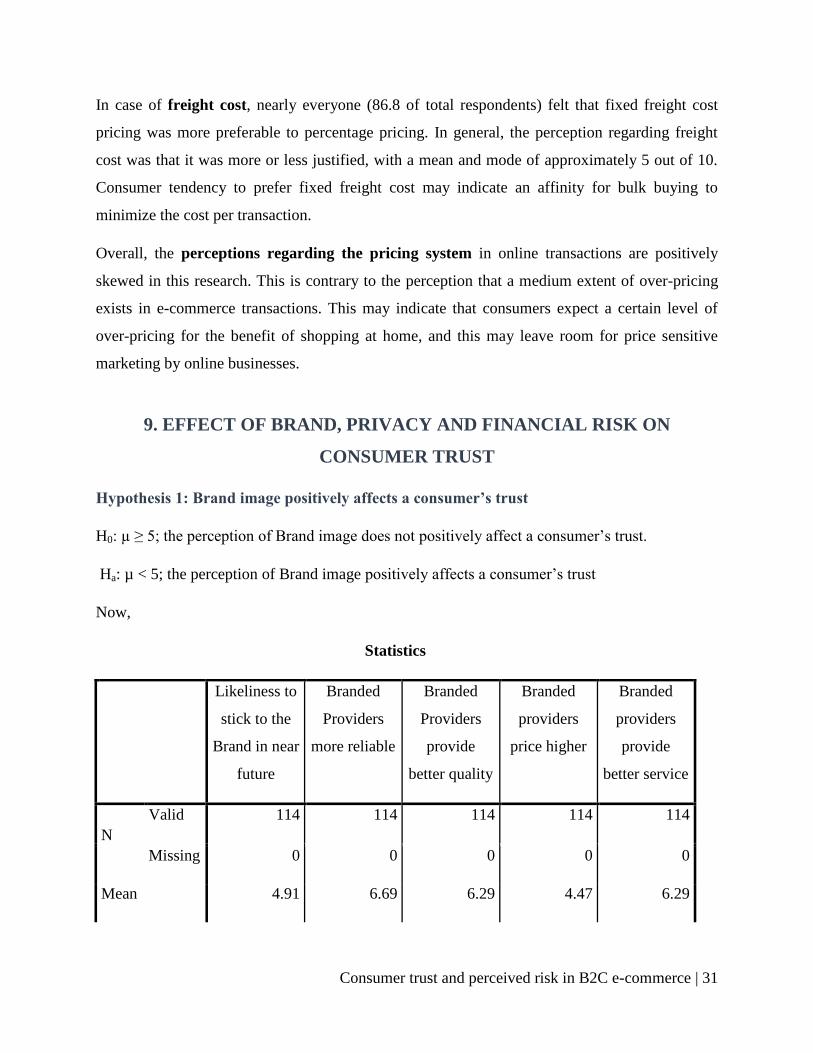
Hypothesis 1: Brand image positively affects a consumer’s trust
H0: µ ≥ 5; the perception of Brand image does not positively affect a consumer‟s trust.
Ha: µ < 5; the perception of Brand image positively affects a consumer‟s trust
Now,
Statistics
Likeliness to
stick to the
Brand in near
future
Branded
Providers
more reliable
Branded
Providers
provide
better quality
Branded
providers
price higher
Branded
providers
provide
better service
N
Valid 114 114 114 114 114
Missing 0 0 0 0 0
Mean 4.91 6.69 6.29 4.47 6.29

Consumer trust and perceived risk in B2C e-commerce | 32
Mode 3 9 8 2 8
Std. Deviation 2.512 2.832 2.541 2.625 2.523
We shorten the four Likert scale variables, take their mean, and from their distribution, derive the
hypothesis test through one sample t test.
One-Sample Statistics
N Mean Std.
Deviation
Std. Error
Mean
Effect of Brand
image in Buying
Intention
5 5.730
0 .97581 .43639
One-Sample Test
Test Value = 5
t df Sig. (2-
tailed)
Mean
Difference
90% Confidence Interval of
the Difference
Lower Upper
Effect of
Brand
image in
Buying
Intention
1.673 4 .170 .73000 -.2003 1.6603
Consumer trust and perceived risk in B2C e-commerce | 33
From t0.10(df=4) = 2.776, and the tcritical = 1.673, so we see that the t critical is well within our
confidence interval. That is, we cannot reject the null hypothesis. Which indicates, A consumer‟s
perception of high brand image positively affects his trust.
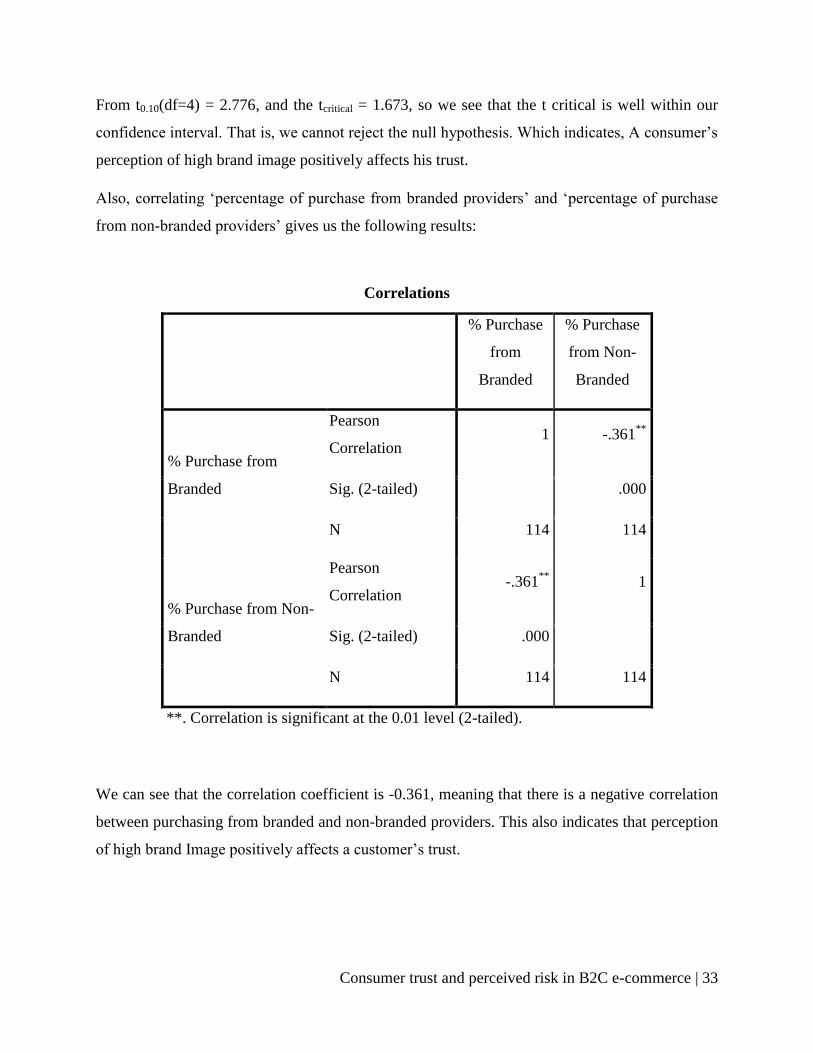
Also, correlating „percentage of purchase from branded providers‟ and „percentage of purchase
from non-branded providers‟ gives us the following results:
Correlations
% Purchase
from
Branded
% Purchase
from Non-
Branded
% Purchase from
Branded
Pearson
Correlation 1 -.361
**
Sig. (2-tailed) .000
N 114 114
% Purchase from Non-
Branded
Pearson
Correlation -.361
** 1
Sig. (2-tailed) .000
N 114 114
**. Correlation is significant at the 0.01 level (2-tailed).
We can see that the correlation coefficient is -0.361, meaning that there is a negative correlation
between purchasing from branded and non-branded providers. This also indicates that perception
of high brand Image positively affects a customer‟s trust.
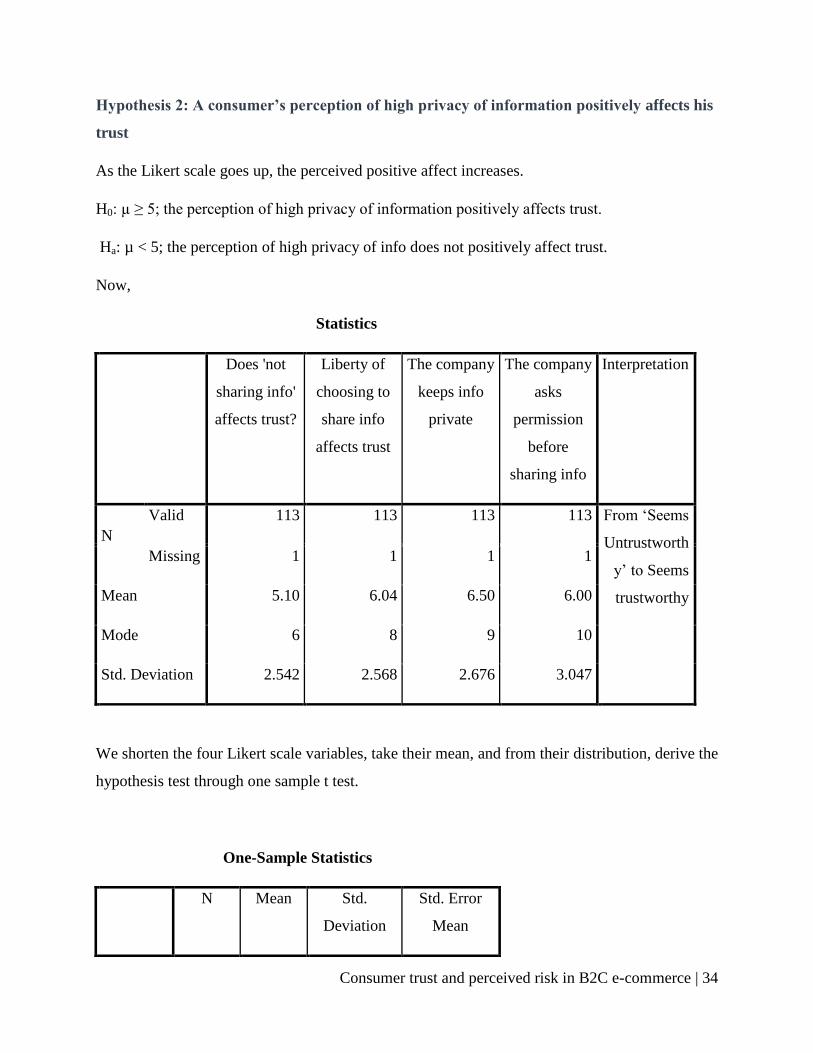
Consumer trust and perceived risk in B2C e-commerce | 34
Hypothesis 2: A consumer’s perception of high privacy of information positively affects his
trust
As the Likert scale goes up, the perceived positive affect increases.
H0: µ ≥ 5; the perception of high privacy of information positively affects trust.
Ha: µ < 5; the perception of high privacy of info does not positively affect trust.
Now,
Statistics
Does 'not
sharing info'
affects trust?
Liberty of
choosing to
share info
affects trust
The company
keeps info
private
The company
asks
permission
before
sharing info
Interpretation
N
Valid 113 113 113 113 From „Seems
Untrustworth
y‟ to Seems
trustworthy
Missing 1 1 1 1
Mean 5.10 6.04 6.50 6.00
Mode 6 8 9 10
Std. Deviation 2.542 2.568 2.676 3.047
We shorten the four Likert scale variables, take their mean, and from their distribution, derive the
hypothesis test through one sample t test.
One-Sample Statistics
N Mean Std.
Deviation
Std. Error
Mean
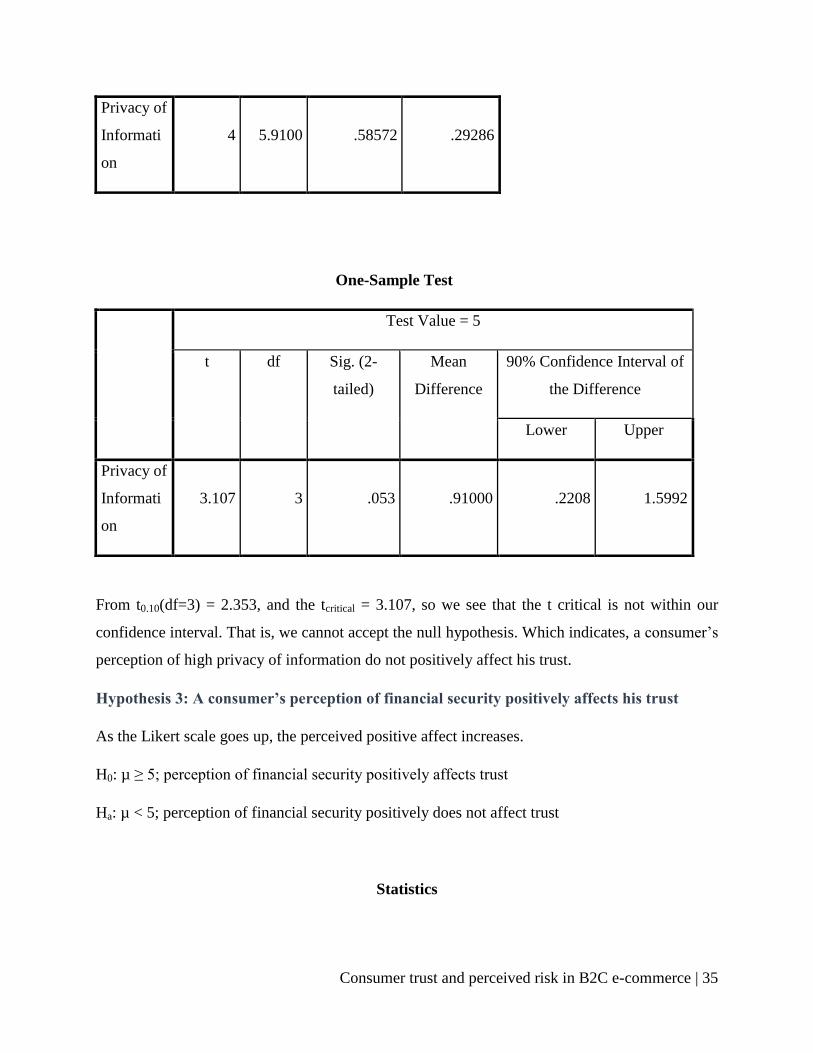
Consumer trust and perceived risk in B2C e-commerce | 35
Privacy of
Informati
on
4 5.9100 .58572 .29286
One-Sample Test
Test Value = 5
t df Sig. (2-
tailed)
Mean
Difference
90% Confidence Interval of
the Difference
Lower Upper
Privacy of
Informati
on
3.107 3 .053 .91000 .2208 1.5992
From t0.10(df=3) = 2.353, and the tcritical = 3.107, so we see that the t critical is not within our
confidence interval. That is, we cannot accept the null hypothesis. Which indicates, a consumer‟s
perception of high privacy of information do not positively affect his trust.
Hypothesis 3: A consumer’s perception of financial security positively affects his trust
As the Likert scale goes up, the perceived positive affect increases.
H0: µ ≥ 5; perception of financial security positively affects trust
Ha: µ < 5; perception of financial security positively does not affect trust
Statistics
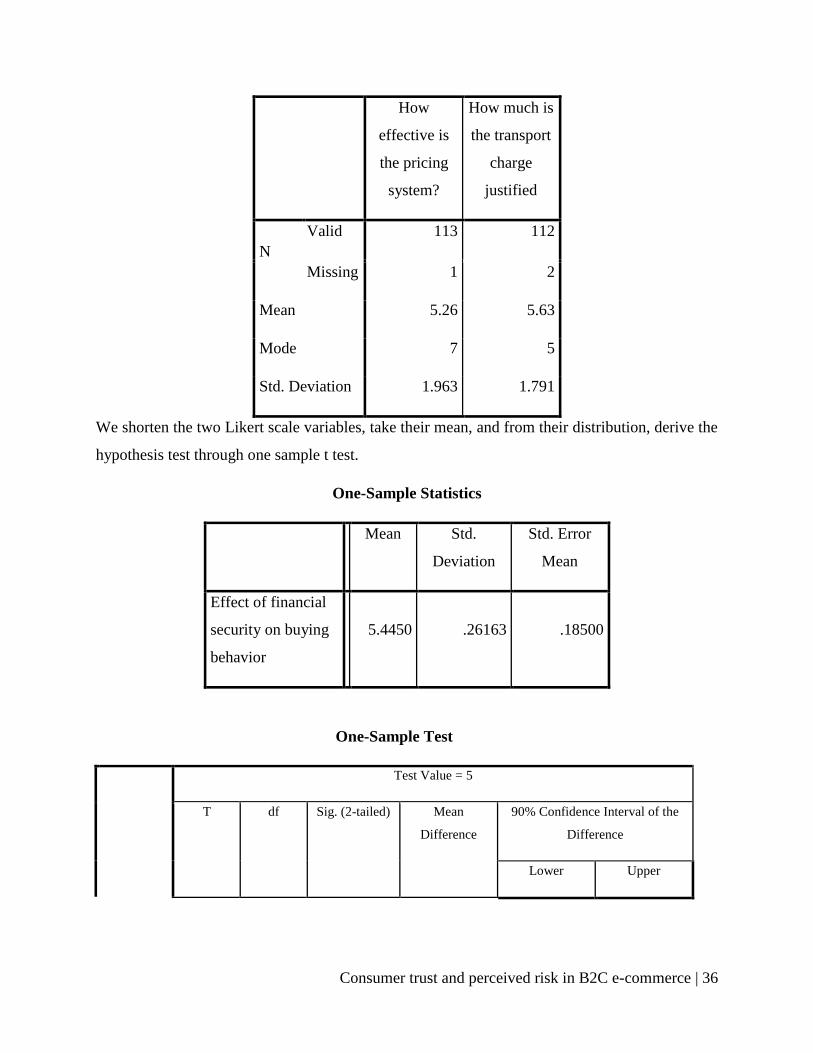
Consumer trust and perceived risk in B2C e-commerce | 36
How
effective is
the pricing
system?
How much is
the transport
charge
justified
N
Valid 113 112
Missing 1 2
Mean 5.26 5.63
Mode 7 5
Std. Deviation 1.963 1.791
We shorten the two Likert scale variables, take their mean, and from their distribution, derive the
hypothesis test through one sample t test.
One-Sample Statistics
N Mean Std.
Deviation
Std. Error
Mean
Effect of financial
security on buying
behavior
2 5.4450 .26163 .18500
One-Sample Test
Test Value = 5
T df Sig. (2-tailed) Mean
Difference
90% Confidence Interval of the
Difference
Lower Upper
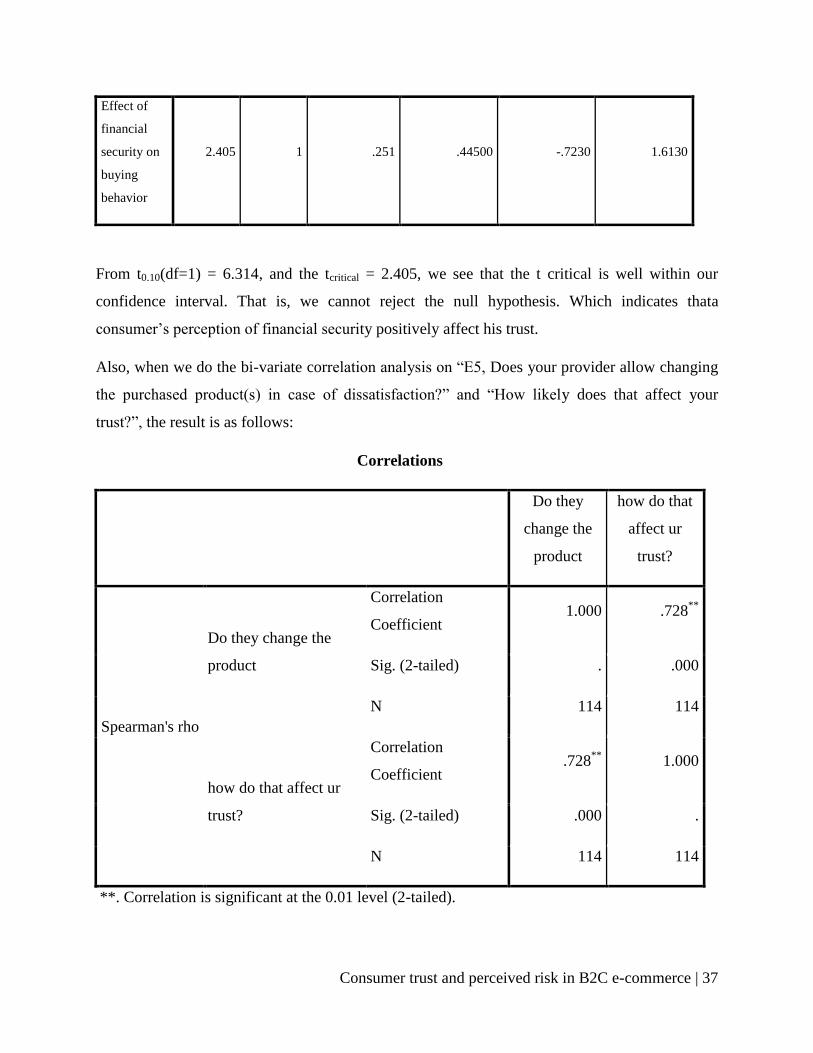
Consumer trust and perceived risk in B2C e-commerce | 37
Effect of
financial
security on
buying
behavior
2.405 1 .251 .44500 -.7230 1.6130
From t0.10(df=1) = 6.314, and the tcritical = 2.405, we see that the t critical is well within our
confidence interval. That is, we cannot reject the null hypothesis. Which indicates thata
consumer‟s perception of financial security positively affect his trust.
Also, when we do the bi-variate correlation analysis on “E5, Does your provider allow changing
the purchased product(s) in case of dissatisfaction?” and “How likely does that affect your
trust?”, the result is as follows:
Correlations
Do they
change the
product
how do that
affect ur
trust?
Spearman's rho
Do they change the
product
Correlation
Coefficient 1.000 .728
**
Sig. (2-tailed) . .000
N 114 114
how do that affect ur
trust?
Correlation
Coefficient .728
** 1.000
Sig. (2-tailed) .000 .
N 114 114
**. Correlation is significant at the 0.01 level (2-tailed).
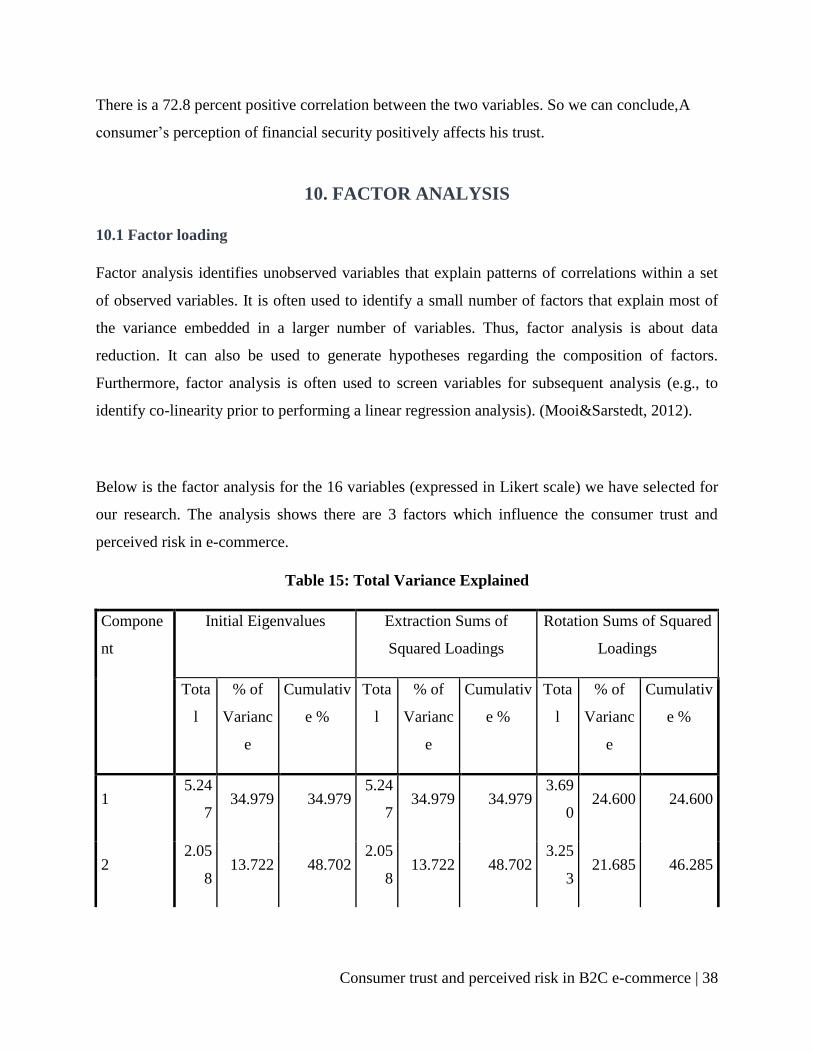
Consumer trust and perceived risk in B2C e-commerce | 38
There is a 72.8 percent positive correlation between the two variables. So we can conclude,A
consumer‟s perception of financial security positively affects his trust.
10. FACTOR ANALYSIS
10.1 Factor loading
Factor analysis identifies unobserved variables that explain patterns of correlations within a set
of observed variables. It is often used to identify a small number of factors that explain most of
the variance embedded in a larger number of variables. Thus, factor analysis is about data
reduction. It can also be used to generate hypotheses regarding the composition of factors.
Furthermore, factor analysis is often used to screen variables for subsequent analysis (e.g., to
identify co-linearity prior to performing a linear regression analysis). (Mooi&Sarstedt, 2012).
Below is the factor analysis for the 16 variables (expressed in Likert scale) we have selected for
our research. The analysis shows there are 3 factors which influence the consumer trust and
perceived risk in e-commerce.
Table 15: Total Variance Explained
Compone
nt
Initial Eigenvalues Extraction Sums of
Squared Loadings
Rotation Sums of Squared
Loadings
Tota
l
% of
Varianc
e
Cumulativ
e %
Tota
l
% of
Varianc
e
Cumulativ
e %
Tota
l
% of
Varianc
e
Cumulativ
e %
1 5.24
7 34.979 34.979
5.24
7 34.979 34.979
3.69
0 24.600 24.600
2 2.05
8 13.722 48.702
2.05
8 13.722 48.702
3.25
3 21.685 46.285
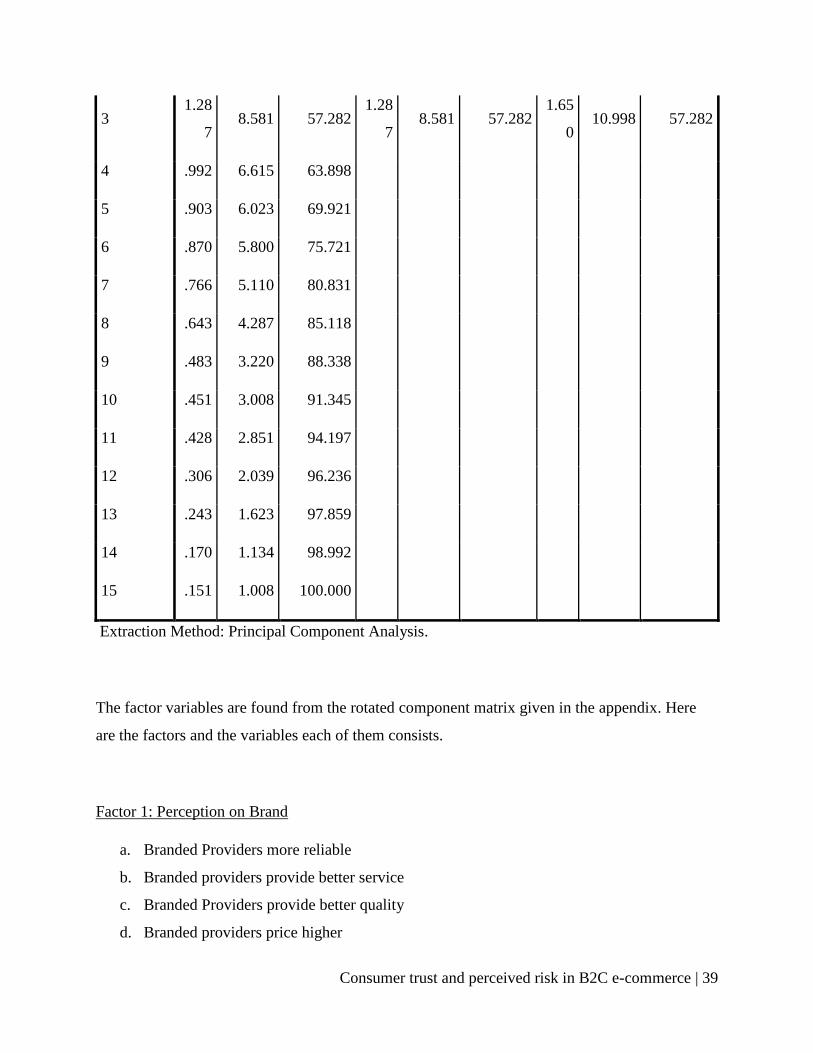
Consumer trust and perceived risk in B2C e-commerce | 39
3 1.28
7 8.581 57.282
1.28
7 8.581 57.282
1.65
0 10.998 57.282
4 .992 6.615 63.898
5 .903 6.023 69.921
6 .870 5.800 75.721
7 .766 5.110 80.831
8 .643 4.287 85.118
9 .483 3.220 88.338
10 .451 3.008 91.345
11 .428 2.851 94.197
12 .306 2.039 96.236
13 .243 1.623 97.859
14 .170 1.134 98.992
15 .151 1.008 100.000
Extraction Method: Principal Component Analysis.
The factor variables are found from the rotated component matrix given in the appendix. Here
are the factors and the variables each of them consists.
Factor 1: Perception on Brand
a. Branded Providers more reliable
b. Branded providers provide better service
c. Branded Providers provide better quality
d. Branded providers price higher
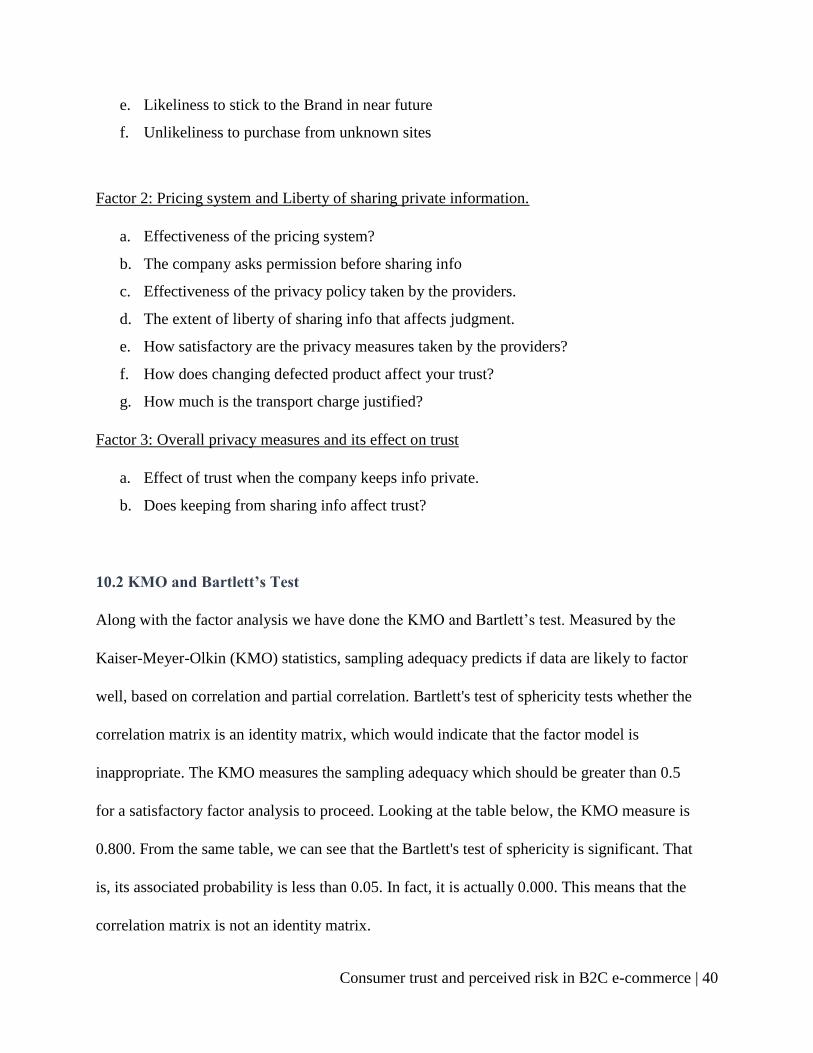
Consumer trust and perceived risk in B2C e-commerce | 40
e. Likeliness to stick to the Brand in near future
f. Unlikeliness to purchase from unknown sites
Factor 2: Pricing system and Liberty of sharing private information.
a. Effectiveness of the pricing system?
b. The company asks permission before sharing info
c. Effectiveness of the privacy policy taken by the providers.
d. The extent of liberty of sharing info that affects judgment.
e. How satisfactory are the privacy measures taken by the providers?
f. How does changing defected product affect your trust?
g. How much is the transport charge justified?
Factor 3: Overall privacy measures and its effect on trust
a. Effect of trust when the company keeps info private.
b. Does keeping from sharing info affect trust?
10.2 KMO and Bartlett’s Test
Along with the factor analysis we have done the KMO and Bartlett‟s test. Measured by the
Kaiser-Meyer-Olkin (KMO) statistics, sampling adequacy predicts if data are likely to factor
well, based on correlation and partial correlation. Bartlett's test of sphericity tests whether the
correlation matrix is an identity matrix, which would indicate that the factor model is
inappropriate. The KMO measures the sampling adequacy which should be greater than 0.5
for a satisfactory factor analysis to proceed. Looking at the table below, the KMO measure is
0.800. From the same table, we can see that the Bartlett's test of sphericity is significant. That
is, its associated probability is less than 0.05. In fact, it is actually 0.000. This means that the
correlation matrix is not an identity matrix.
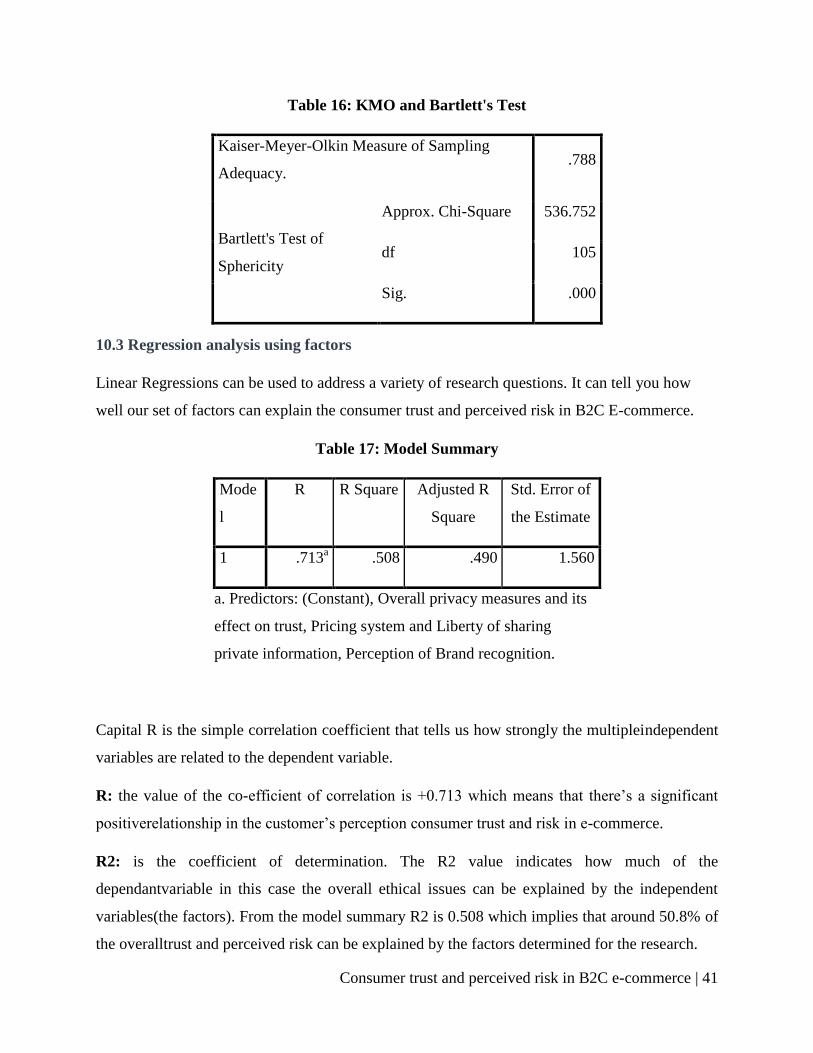
Consumer trust and perceived risk in B2C e-commerce | 41
Table 16: KMO and Bartlett's Test
Kaiser-Meyer-Olkin Measure of Sampling
Adequacy. .788
Bartlett's Test of
Sphericity
Approx. Chi-Square 536.752
df 105
Sig. .000
10.3 Regression analysis using factors
Linear Regressions can be used to address a variety of research questions. It can tell you how
well our set of factors can explain the consumer trust and perceived risk in B2C E-commerce.
Table 17: Model Summary
Mode
l
R R Square Adjusted R
Square
Std. Error of
the Estimate
1 .713a .508 .490 1.560
a. Predictors: (Constant), Overall privacy measures and its
effect on trust, Pricing system and Liberty of sharing
private information, Perception of Brand recognition.
Capital R is the simple correlation coefficient that tells us how strongly the multipleindependent
variables are related to the dependent variable.
R: the value of the co-efficient of correlation is +0.713 which means that there‟s a significant
positiverelationship in the customer‟s perception consumer trust and risk in e-commerce.
R2: is the coefficient of determination. The R2 value indicates how much of the
dependantvariable in this case the overall ethical issues can be explained by the independent
variables(the factors). From the model summary R2 is 0.508 which implies that around 50.8% of
the overalltrust and perceived risk can be explained by the factors determined for the research.
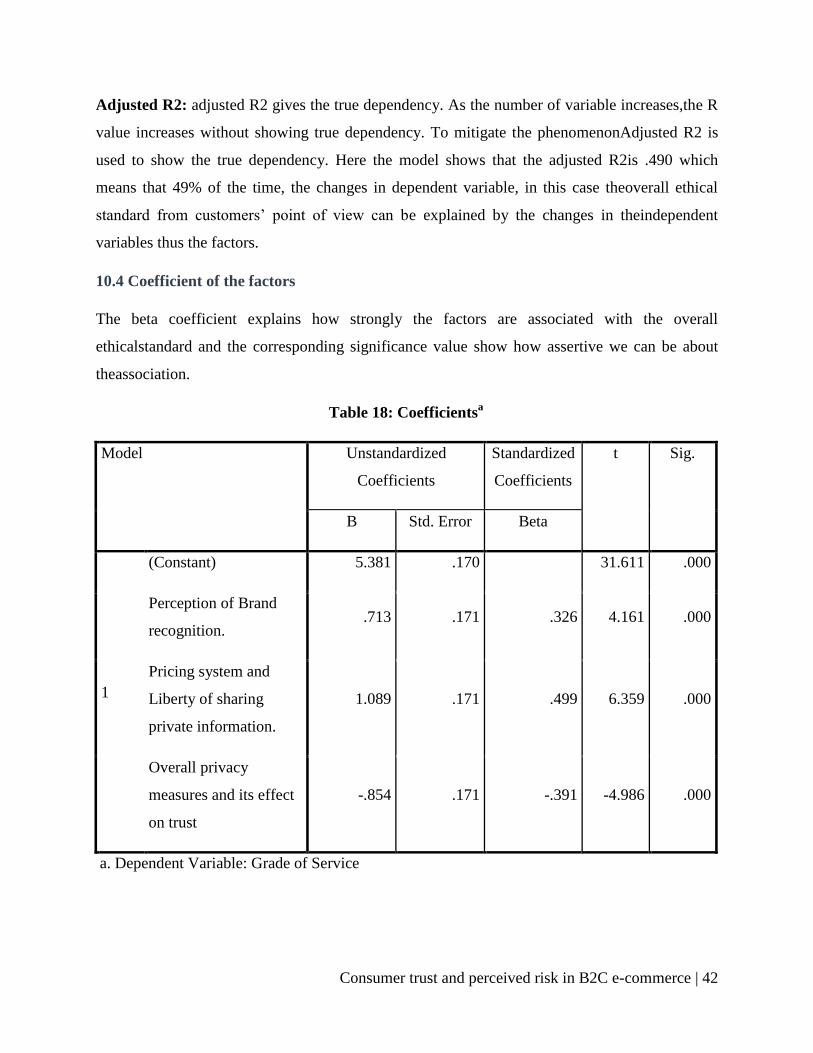
Consumer trust and perceived risk in B2C e-commerce | 42
Adjusted R2: adjusted R2 gives the true dependency. As the number of variable increases,the R
value increases without showing true dependency. To mitigate the phenomenonAdjusted R2 is
used to show the true dependency. Here the model shows that the adjusted R2is .490 which
means that 49% of the time, the changes in dependent variable, in this case theoverall ethical
standard from customers‟ point of view can be explained by the changes in theindependent
variables thus the factors.
10.4 Coefficient of the factors
The beta coefficient explains how strongly the factors are associated with the overall
ethicalstandard and the corresponding significance value show how assertive we can be about
theassociation.
Table 18: Coefficientsa
Model Unstandardized
Coefficients
Standardized
Coefficients
t Sig.
B Std. Error Beta
1
(Constant) 5.381 .170 31.611 .000
Perception of Brand
recognition. .713 .171 .326 4.161 .000
Pricing system and
Liberty of sharing
private information.
1.089 .171 .499 6.359 .000
Overall privacy
measures and its effect
on trust
-.854 .171 -.391 -4.986 .000
a. Dependent Variable: Grade of Service
Consumer trust and perceived risk in B2C e-commerce | 43
According to linear regression model, consumer trust and perceived risk = 5.381 + B −
coefficient × factor value
So, the developed regression model is ,
consumer trust and perceived risk = 5.381 + 0.713 x perception of brand recognition + 1.089 x
perception of price system and liberty of sharing private information - 0.854 x perception on
overall privacy measures and its effect on trust.
10.5 ANOVA test for Significance of the model
ANOVA:
It is the analysis of variance (the deviations in the dependent variable).
There are four basic assumptions used in ANOVA.
the expected values of the errors are zero
the variances of all errors are equal to each other
the errors are independent
they are normally distributed
For testing the significance, let us formulate a hypothesis:
H0: β1 = β2 = β3 = 0; the perception of the factors does not affect a consumer‟s trust or
perceived risk in e-commerce.
Ha: β1 = β2 = β3 = 0; the perception of the factors does not affect a consumer‟s trust or
perceived risk in e-commerce.
We do an ANOVA test in SPSS. The result is as follows.
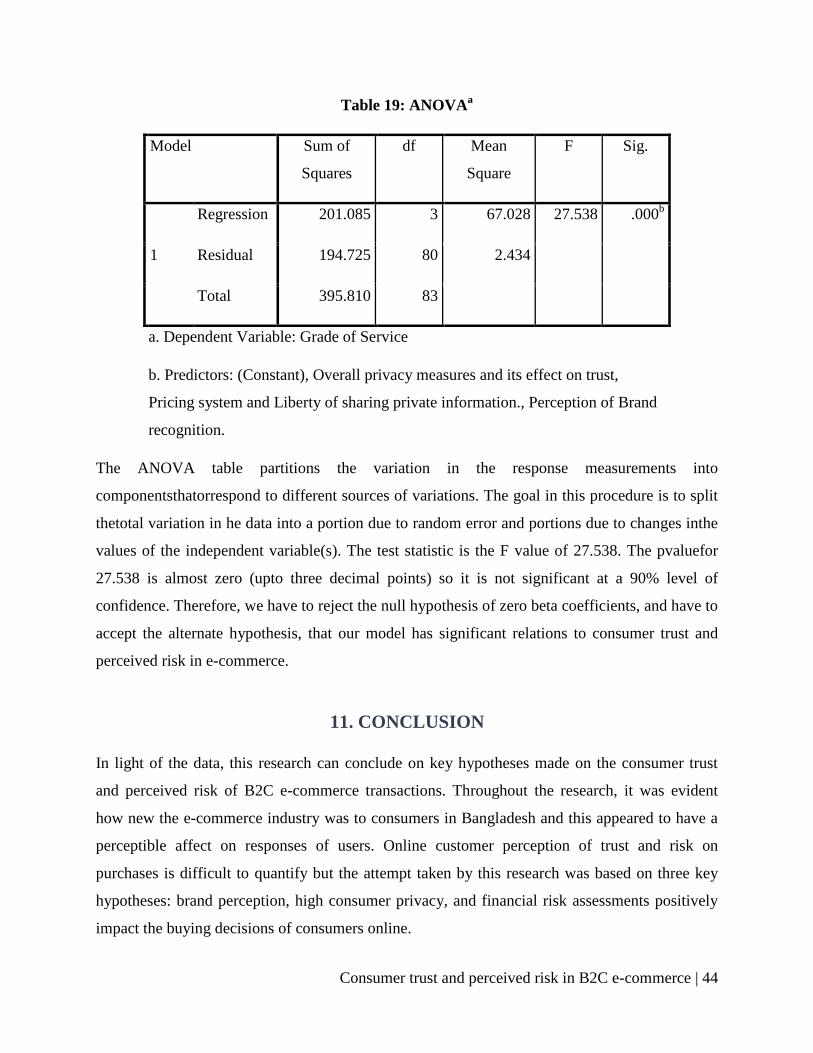
Consumer trust and perceived risk in B2C e-commerce | 44
Table 19: ANOVAa
Model Sum of
Squares
df Mean
Square
F Sig.
1
Regression 201.085 3 67.028 27.538 .000b
Residual 194.725 80 2.434
Total 395.810 83
a. Dependent Variable: Grade of Service
b. Predictors: (Constant), Overall privacy measures and its effect on trust,
Pricing system and Liberty of sharing private information., Perception of Brand
recognition.
The ANOVA table partitions the variation in the response measurements into
componentsthatorrespond to different sources of variations. The goal in this procedure is to split
thetotal variation in he data into a portion due to random error and portions due to changes inthe
values of the independent variable(s). The test statistic is the F value of 27.538. The pvaluefor
27.538 is almost zero (upto three decimal points) so it is not significant at a 90% level of
confidence. Therefore, we have to reject the null hypothesis of zero beta coefficients, and have to
accept the alternate hypothesis, that our model has significant relations to consumer trust and
perceived risk in e-commerce.
11. CONCLUSION
In light of the data, this research can conclude on key hypotheses made on the consumer trust
and perceived risk of B2C e-commerce transactions. Throughout the research, it was evident
how new the e-commerce industry was to consumers in Bangladesh and this appeared to have a
perceptible affect on responses of users. Online customer perception of trust and risk on
purchases is difficult to quantify but the attempt taken by this research was based on three key
hypotheses: brand perception, high consumer privacy, and financial risk assessments positively
impact the buying decisions of consumers online.

Consumer trust and perceived risk in B2C e-commerce | 45
In terms of brand perceptions, it was found that online consumers were aware of fewer brands,
fewer variety of brands, and tended to have low brand loyalty. This indicates a gap in brand
loyalty building and signals that the barrier to entry is low for new brands looking to establish
dominance through brand building strategies. Brands were generally more trusted but were also
considered to be low on value-for-money – a common perception in physical market places as
well. As for the hypothesis, the survey revealed that there was a positive co-relation between
brand perception and purchase decisions and so the hypothesis cannot be rejected.
In terms of consumer privacy of information, the general perception of respondents is that the
privacy policy of their providers is moderately adequate, even though only 3/5th
were aware of
the privacy policy of their providers. Furthermore, the few respondents who faced privacy
violations had providers who took action to mitigate the violation. However, the hypothesis,
which states that high consumer privacy positively impacting the purchasing decisions, cannot be
accepted due to parameters set by the research.
In terms of financial risk assessments, consumer perception regarding online pricing were mostly
positively skewed, although many felt that a certain degree of over-pricing takes place online.
This may be due to lack of transparency, information or clarity in online transactions or it may
also be due to the pricing tactics employed by B2C online businesses currently operating in the
market. Freight cost was mostly preferred to be fixed rather than percentage based and the over-
riding perception was that freight costs were justified in the current market. As for the hypothesis
testing, it was found that financial risk can quite significantly affect purchasing decisions and
thus the third hypothesis cannot be rejected.
As a whole, the advanced factor analysis of the research showed it was valid and reliable in its
testing and calculations over the sample population surveyed upon. The surveys were conducted
with the greatest care to accurate data collection, and analysed and explained to the greatest
extent possible with the aid of secondary material from renowned journals and researches.
The e-commerce industry has a long way ahead and undoubtedly further researchers will find
important, pertinent questions that need to be answered for it to prosper. This research hopes to
scratch at the surface of those queries regarding perceptions of consumers and the impacts they
have on business to consumer online businesses.
Consumer trust and perceived risk in B2C e-commerce | 46
APPENDIX SECTION
Appendix I: Questionnaire
Consumer trust and perceived risk in B2C E-commerce
Respondent Identification details
Date and time of survey:
Name of respondent:
Contact details (phone number, email id, etc):
We, students of 21st Batch, BBA program, at the Institute of Business Administration (IBA),
Dhaka University, are undertaking a survey to determine the Consumer Trust and Risk
Perception in B2C (Business-to-consumer) e-commerce. This is required for the course
Research Method K301. Your response is of the utmost importance to us. Participation is
voluntary and all provided information shall remain confidential.
A. Respondent’s orientation to e-commerce
Tick the appropriate box, or fill in the blanks with appropriate details.
1. Are you aware of the e-commerce industry in Bangladesh?Yes No
2.Have you ever used any of the services provided by the Bangladeshi e-commerce industry?
Yes No
3. If yes, then what is the approximate percentage of total monthly shopping that you do via e-
commerce? ____________________
4. How would you grade the services provided by the e-commerce industry in Bangladesh?
Very Unsatisfactory Very Satisfactory
1 2 3 4 5 6 7 8 9 10
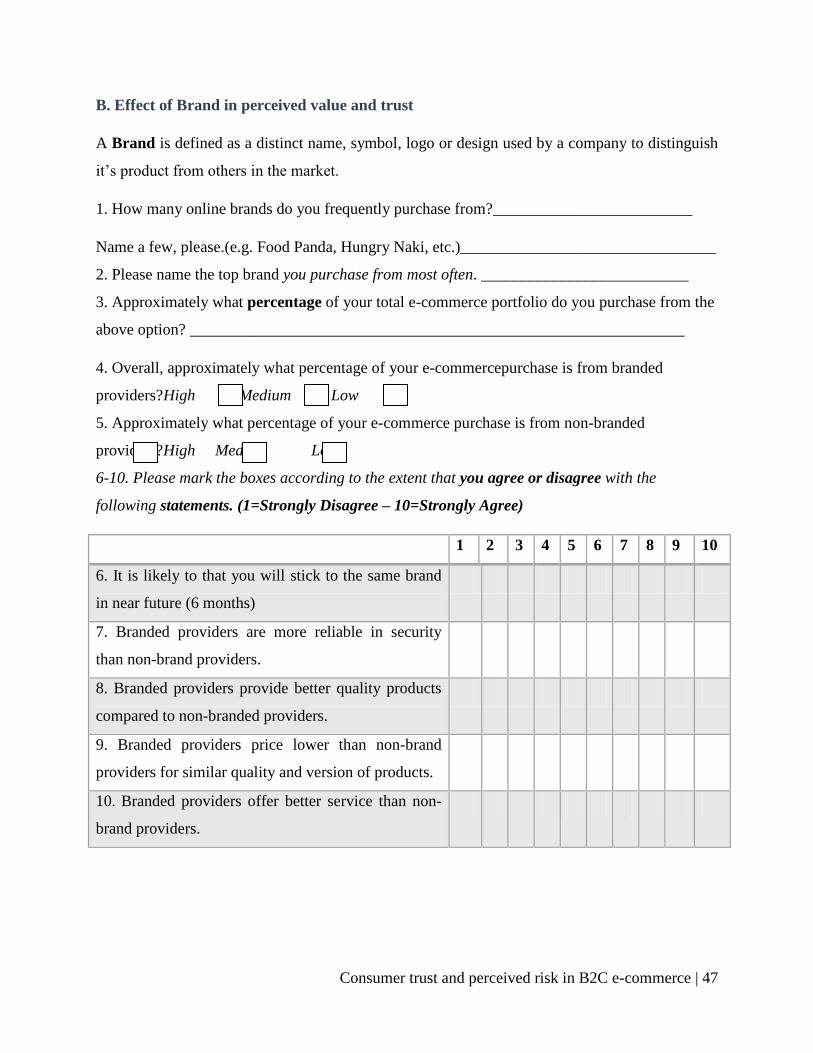
Consumer trust and perceived risk in B2C e-commerce | 47
B. Effect of Brand in perceived value and trust
A Brand is defined as a distinct name, symbol, logo or design used by a company to distinguish
it‟s product from others in the market.
1. How many online brands do you frequently purchase from?_________________________
Name a few, please.(e.g. Food Panda, Hungry Naki, etc.)________________________________
2. Please name the top brand you purchase from most often. __________________________
3. Approximately what percentage of your total e-commerce portfolio do you purchase from the
above option? ______________________________________________________________
4. Overall, approximately what percentage of your e-commercepurchase is from branded
providers?High Medium Low
5. Approximately what percentage of your e-commerce purchase is from non-branded
providers?High Medium Low
6-10. Please mark the boxes according to the extent that you agree or disagree with the
following statements. (1=Strongly Disagree – 10=Strongly Agree)
1 2 3 4 5 6 7 8 9 10
6. It is likely to that you will stick to the same brand
in near future (6 months)
7. Branded providers are more reliable in security
than non-brand providers.
8. Branded providers provide better quality products
compared to non-branded providers.
9. Branded providers price lower than non-brand
providers for similar quality and version of products.
10. Branded providers offer better service than non-
brand providers.
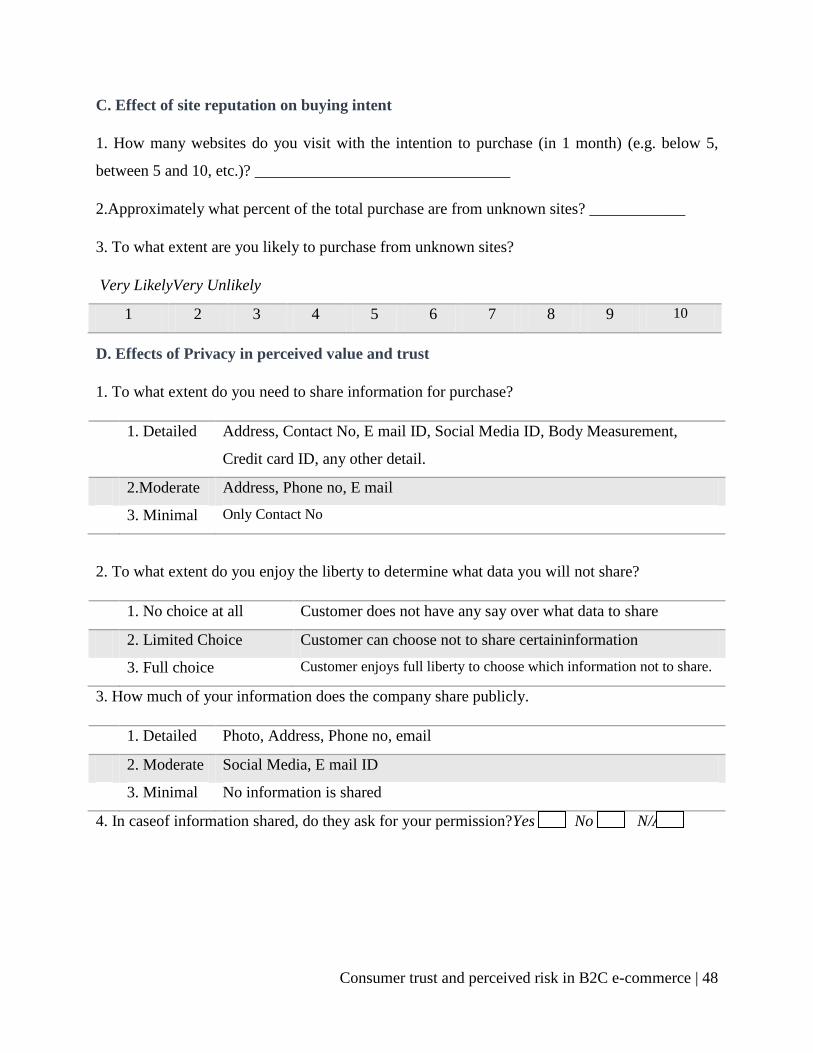
Consumer trust and perceived risk in B2C e-commerce | 48
C. Effect of site reputation on buying intent
1. How many websites do you visit with the intention to purchase (in 1 month) (e.g. below 5,
between 5 and 10, etc.)? ________________________________
2.Approximately what percent of the total purchase are from unknown sites? ____________
3. To what extent are you likely to purchase from unknown sites?
Very LikelyVery Unlikely
1 2 3 4 5 6 7 8 9 10
D. Effects of Privacy in perceived value and trust
1. To what extent do you need to share information for purchase?
1. Detailed Address, Contact No, E mail ID, Social Media ID, Body Measurement,
Credit card ID, any other detail.
2.Moderate Address, Phone no, E mail
3. Minimal Only Contact No
2. To what extent do you enjoy the liberty to determine what data you will not share?
1. No choice at all Customer does not have any say over what data to share
2. Limited Choice Customer can choose not to share certaininformation
3. Full choice Customer enjoys full liberty to choose which information not to share.
3. How much of your information does the company share publicly.
1. Detailed Photo, Address, Phone no, email
2. Moderate Social Media, E mail ID
3. Minimal No information is shared
4. In caseof information shared, do they ask for your permission?Yes No N/A

Consumer trust and perceived risk in B2C e-commerce | 49
5-8. Please mark the boxes according to the extent that they affect your trust on the provider.
Seems untrustworthy seems trustworthy
1 2 3 4 5 6 7 8 9 10
5. To what extent does sharing of information
affect your trust on the provider?
6. The provider allows you the liberty to
determine what data you will not share.
7. To what extent does the amount of
information the company shares publicly.
8. The provider asks for permission before
sharing your information.
9. Does your provider have a privacy policy?Yes No
10. To what extent do you find the privacy policy effective?
Very ineffective Very Effective
1 2 3 4 5 6 7 8 9 10
11. Do you have any record of being victimized by any privacy violation?Yes No
If Yes, please elaborate. If No, please skip to question D14.
______________________________________________________________________________
12. Was any rectifying measures taken by the provider?Yes No Unaware
13. How effective did you find the measure taken by the provider?
Very ineffective Very Effective
1 2 3 4 5 6 7 8 9 10
14. Overall, how satisfactory do you find the general privacy measures of e-commerce sitesin
Bangladesh?
Very Unsatisfactory Very Satisfactory
1 2 3 4 5 6 7 8 9 10
15. In your opinion what measures can the providers initiate to ensure better privacy?
______________________________________________________________________________
______________________________________________________________________________
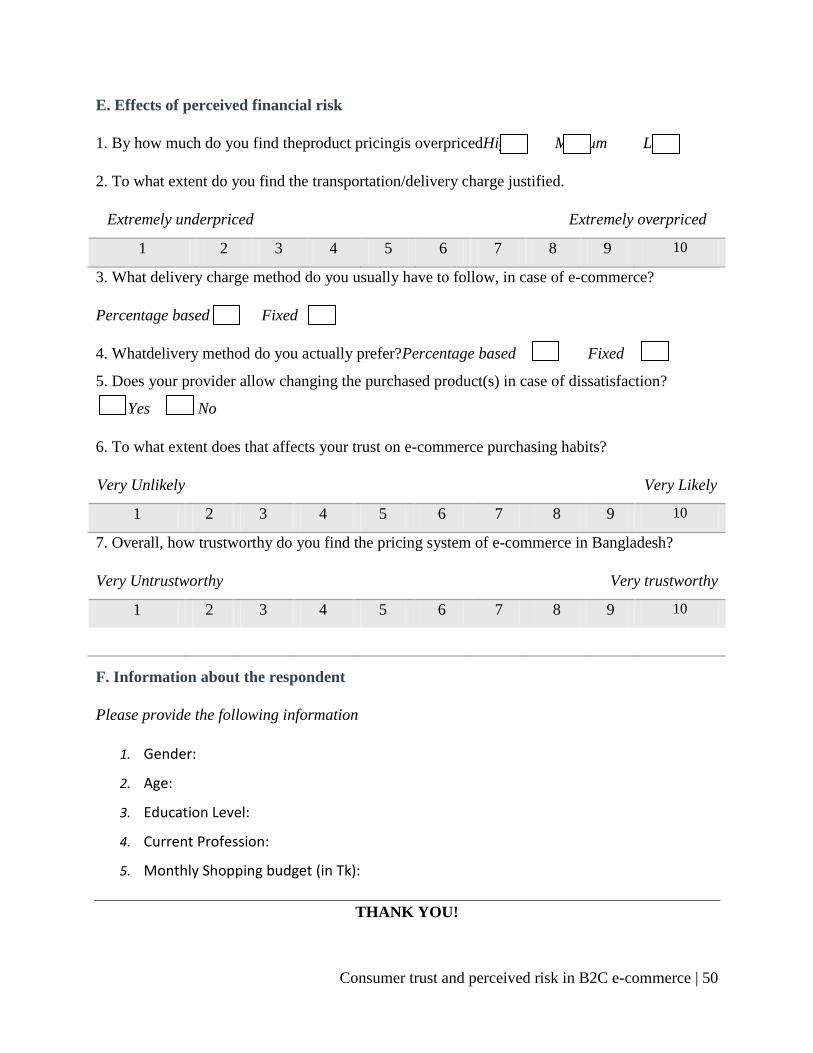
Consumer trust and perceived risk in B2C e-commerce | 50
E. Effects of perceived financial risk
1. By how much do you find theproduct pricingis overpricedHigh Medium Low
2. To what extent do you find the transportation/delivery charge justified.
Extremely underpriced Extremely overpriced
1 2 3 4 5 6 7 8 9 10
3. What delivery charge method do you usually have to follow, in case of e-commerce?
Percentage based Fixed
4. Whatdelivery method do you actually prefer?Percentage based Fixed
5. Does your provider allow changing the purchased product(s) in case of dissatisfaction?
Yes No
6. To what extent does that affects your trust on e-commerce purchasing habits?
Very Unlikely Very Likely
1 2 3 4 5 6 7 8 9 10
7. Overall, how trustworthy do you find the pricing system of e-commerce in Bangladesh?
Very Untrustworthy Very trustworthy
1 2 3 4 5 6 7 8 9 10
F. Information about the respondent
Please provide the following information
1. Gender:
2. Age:
3. Education Level:
4. Current Profession:
5. Monthly Shopping budget (in Tk):
THANK YOU!
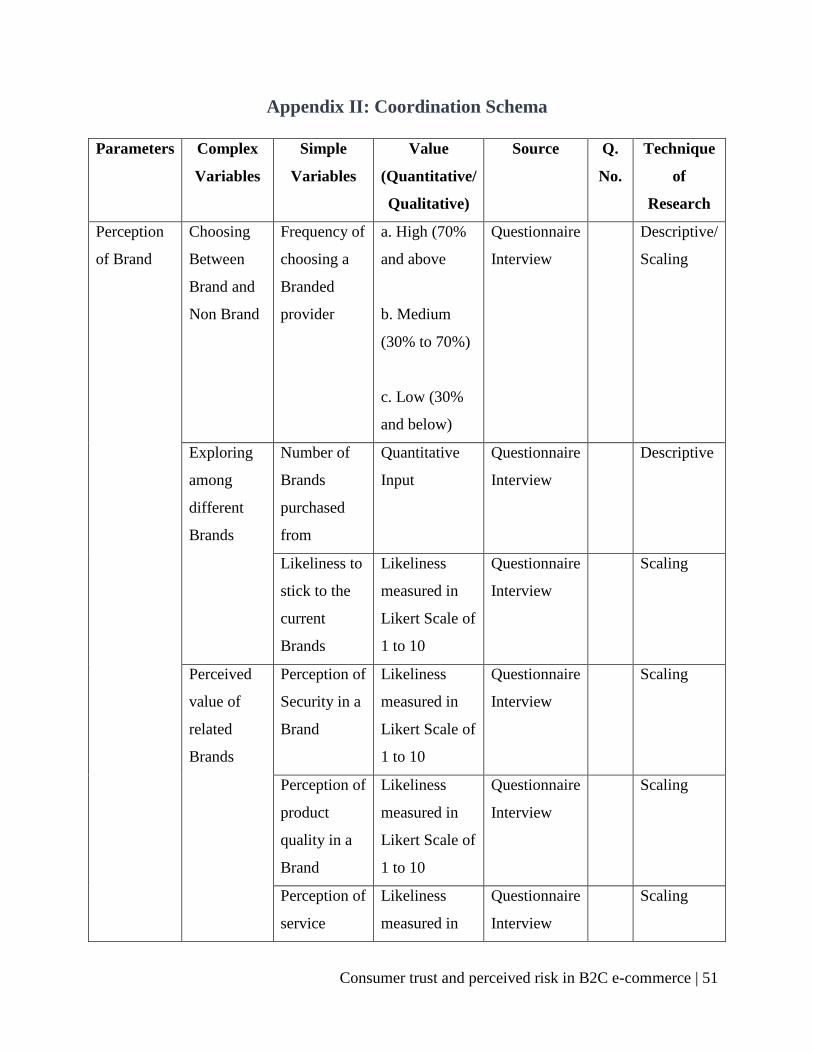
Consumer trust and perceived risk in B2C e-commerce | 51
Appendix II: Coordination Schema
Parameters Complex
Variables
Simple
Variables
Value
(Quantitative/
Qualitative)
Source Q.
No.
Technique
of
Research
Perception
of Brand
Choosing
Between
Brand and
Non Brand
Frequency of
choosing a
Branded
provider
a. High (70%
and above
b. Medium
(30% to 70%)
c. Low (30%
and below)
Questionnaire
Interview
Descriptive/
Scaling
Exploring
among
different
Brands
Number of
Brands
purchased
from
Quantitative
Input
Questionnaire
Interview
Descriptive
Likeliness to
stick to the
current
Brands
Likeliness
measured in
Likert Scale of
1 to 10
Questionnaire
Interview
Scaling
Perceived
value of
related
Brands
Perception of
Security in a
Brand
Likeliness
measured in
Likert Scale of
1 to 10
Questionnaire
Interview
Scaling
Perception of
product
quality in a
Brand
Likeliness
measured in
Likert Scale of
1 to 10
Questionnaire
Interview
Scaling
Perception of
service
Likeliness
measured in
Questionnaire
Interview
Scaling
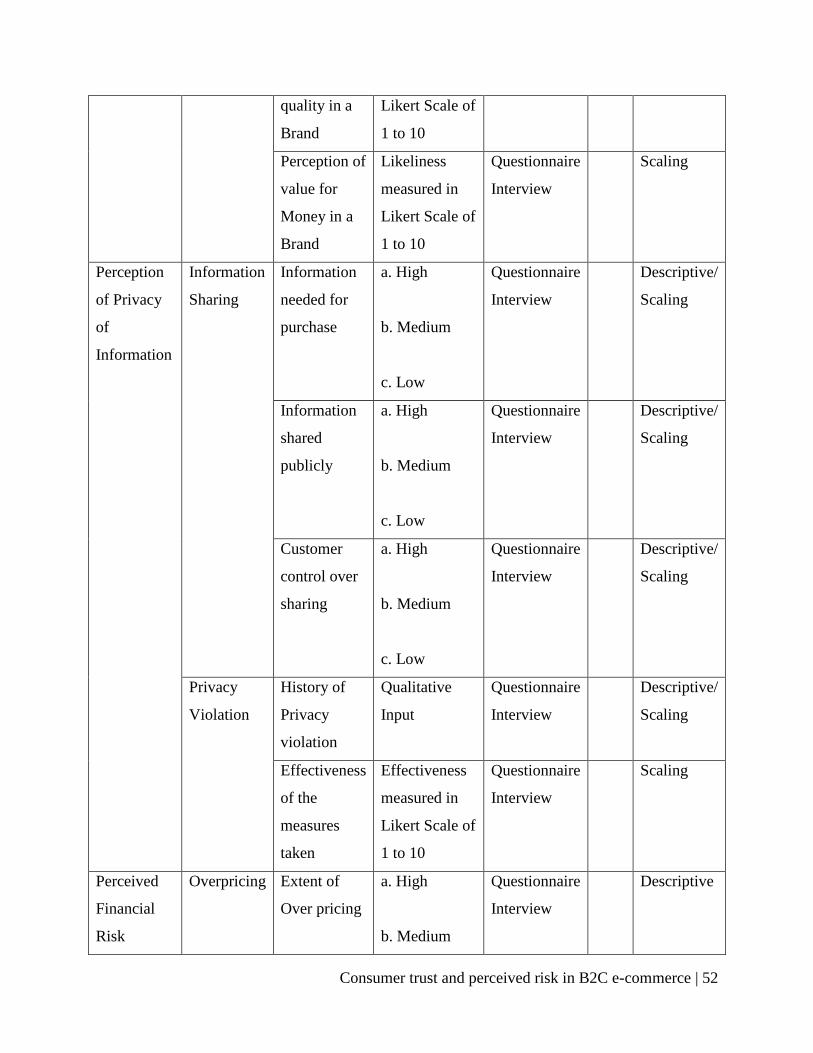
Consumer trust and perceived risk in B2C e-commerce | 52
quality in a
Brand
Likert Scale of
1 to 10
Perception of
value for
Money in a
Brand
Likeliness
measured in
Likert Scale of
1 to 10
Questionnaire
Interview
Scaling
Perception
of Privacy
of
Information
Information
Sharing
Information
needed for
purchase
a. High
b. Medium
c. Low
Questionnaire
Interview
Descriptive/
Scaling
Information
shared
publicly
a. High
b. Medium
c. Low
Questionnaire
Interview
Descriptive/
Scaling
Customer
control over
sharing
a. High
b. Medium
c. Low
Questionnaire
Interview
Descriptive/
Scaling
Privacy
Violation
History of
Privacy
violation
Qualitative
Input
Questionnaire
Interview
Descriptive/
Scaling
Effectiveness
of the
measures
taken
Effectiveness
measured in
Likert Scale of
1 to 10
Questionnaire
Interview
Scaling
Perceived
Financial
Risk
Overpricing Extent of
Over pricing
a. High
b. Medium
Questionnaire
Interview
Descriptive

Consumer trust and perceived risk in B2C e-commerce | 53
c. Low
Freight
Charge
Method
preferred
a. Fixed
b. Percentage
based
Questionnaire
Interview
Descriptive
Justification
of the freight
charge
Measured in
Likert Scale of
1 to 10
Questionnaire
Interview
Scaling
Appendix III: Calculations
The sample size for the purpose of this research has been found out by using the following
formula:
n = (Nz^2pq) / (Nd0^2+z^2pq),
where,
n = sample size N = population
d0 = Precision z = reliability
p = proportion q = 1-p
Now,
n = (Nz^2pq) / (Nd0^2+z^2pq)
OR,
n = (z^2pq)/ {d0^2+ (z^2pq/N)}
Here, (z^2pq/N) is insignificant since N is very large
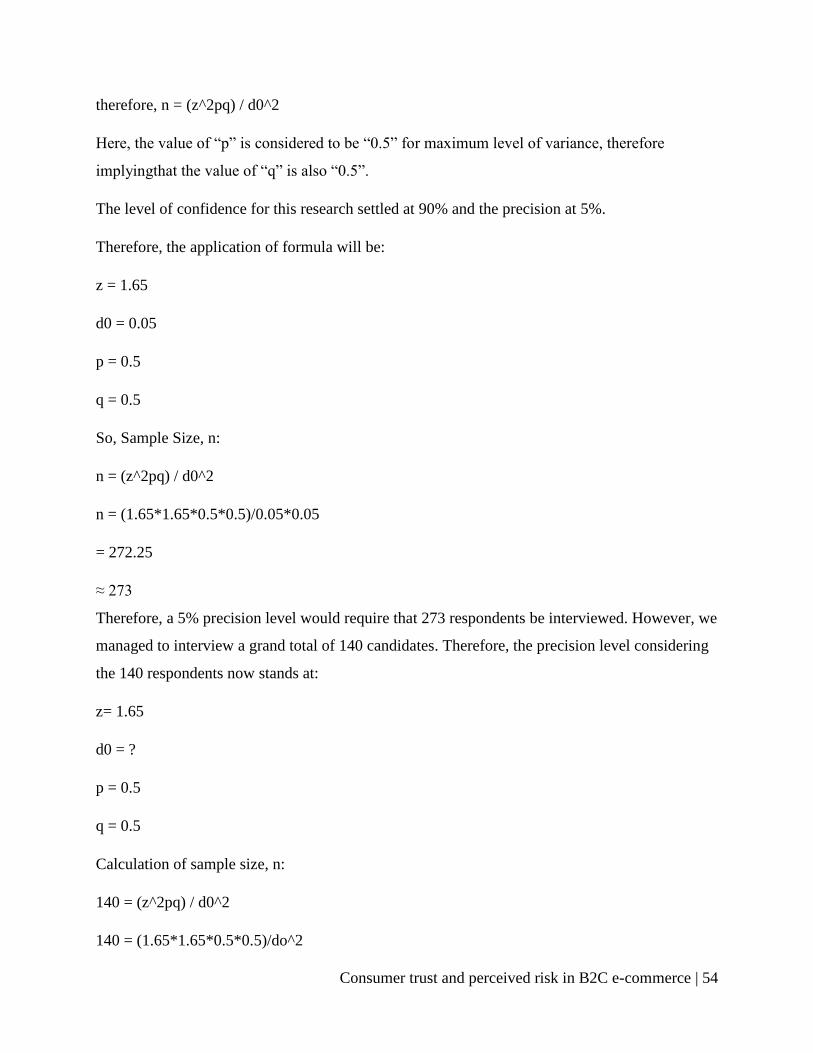
Consumer trust and perceived risk in B2C e-commerce | 54
therefore, n = (z^2pq) / d0^2
Here, the value of “p” is considered to be “0.5” for maximum level of variance, therefore
implyingthat the value of “q” is also “0.5”.
The level of confidence for this research settled at 90% and the precision at 5%.
Therefore, the application of formula will be:
z = 1.65
d0 = 0.05
p = 0.5
q = 0.5
So, Sample Size, n:
n = (z^2pq) / d0^2
n = (1.65*1.65*0.5*0.5)/0.05*0.05
= 272.25
≈ 273
Therefore, a 5% precision level would require that 273 respondents be interviewed. However, we
managed to interview a grand total of 140 candidates. Therefore, the precision level considering
the 140 respondents now stands at:
z= 1.65
d0 = ?
p = 0.5
q = 0.5
Calculation of sample size, n:
140 = (z^2pq) / d0^2
140 = (1.65*1.65*0.5*0.5)/do^2
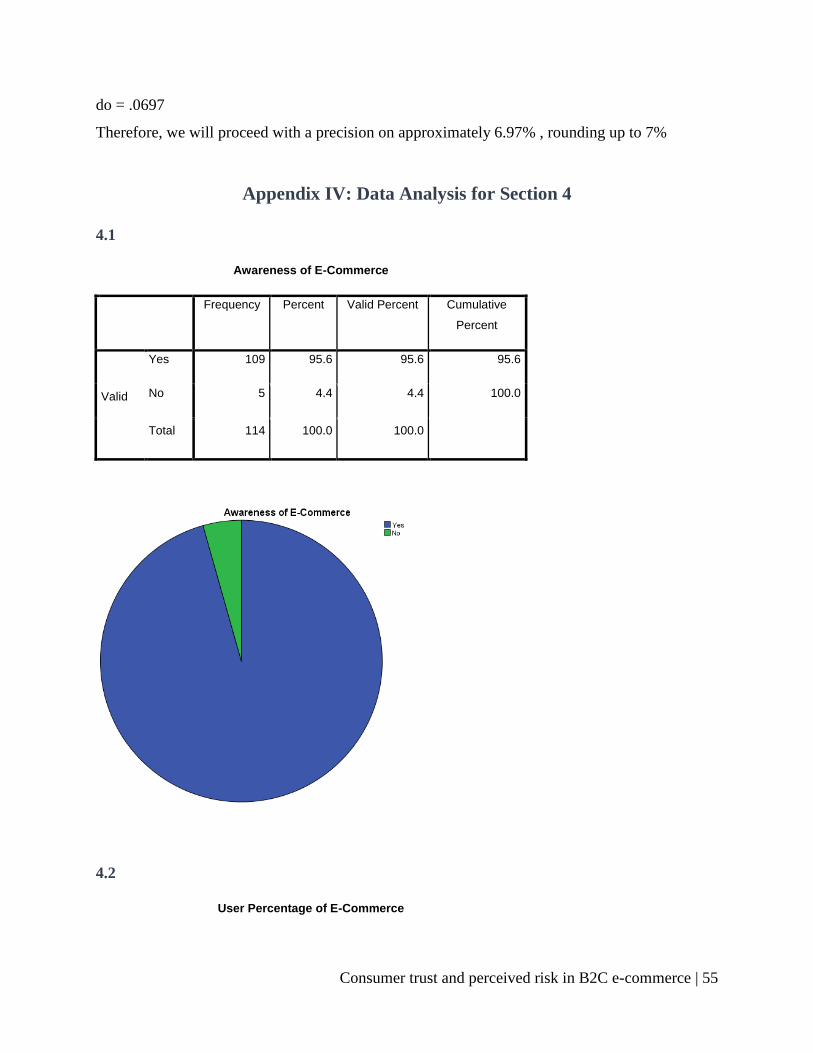
Consumer trust and perceived risk in B2C e-commerce | 55
do = .0697
Therefore, we will proceed with a precision on approximately 6.97% , rounding up to 7%
Appendix IV: Data Analysis for Section 4
4.1
Awareness of E-Commerce
Frequency Percent Valid Percent Cumulative
Percent
Valid
Yes 109 95.6 95.6 95.6
No 5 4.4 4.4 100.0
Total 114 100.0 100.0
4.2
User Percentage of E-Commerce

Consumer trust and perceived risk in B2C e-commerce | 56
Frequency Percent Valid Percent Cumulative
Percent
Valid
Yes 91 79.8 79.8 79.8
No 23 20.2 20.2 100.0
Total 114 100.0 100.0
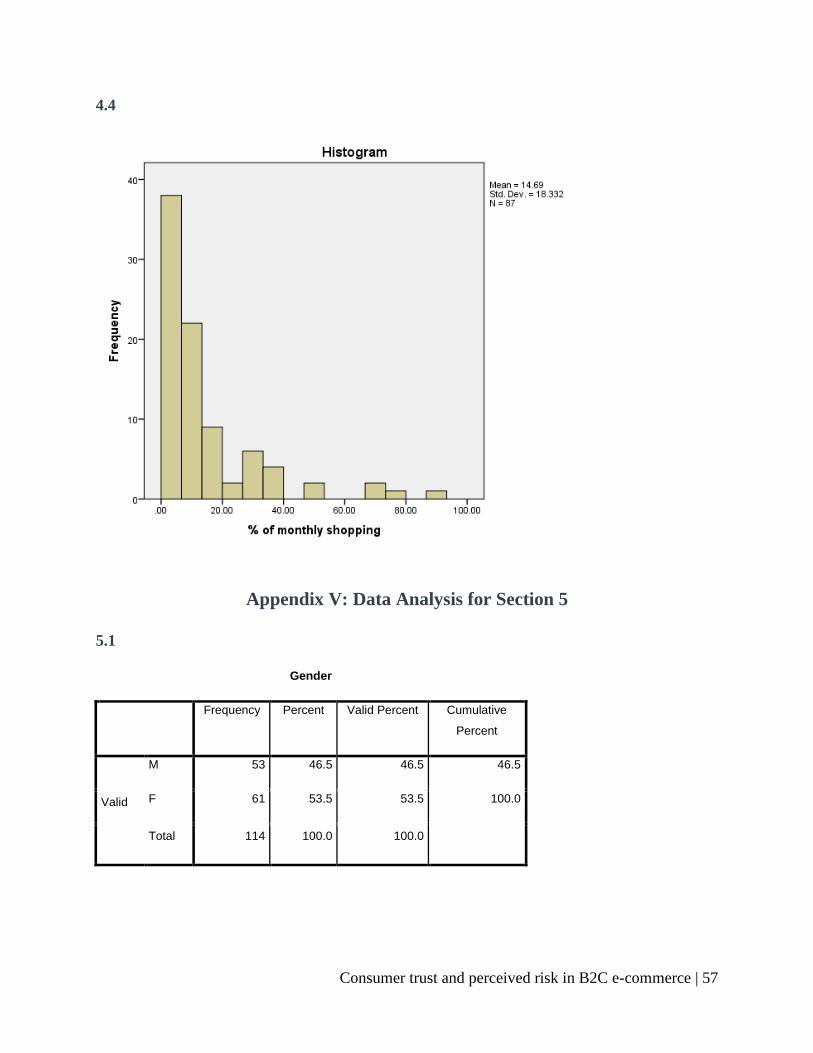
Consumer trust and perceived risk in B2C e-commerce | 57
4.4
Appendix V: Data Analysis for Section 5
5.1
Gender
Frequency Percent Valid Percent Cumulative
Percent
Valid
M 53 46.5 46.5 46.5
F 61 53.5 53.5 100.0
Total 114 100.0 100.0
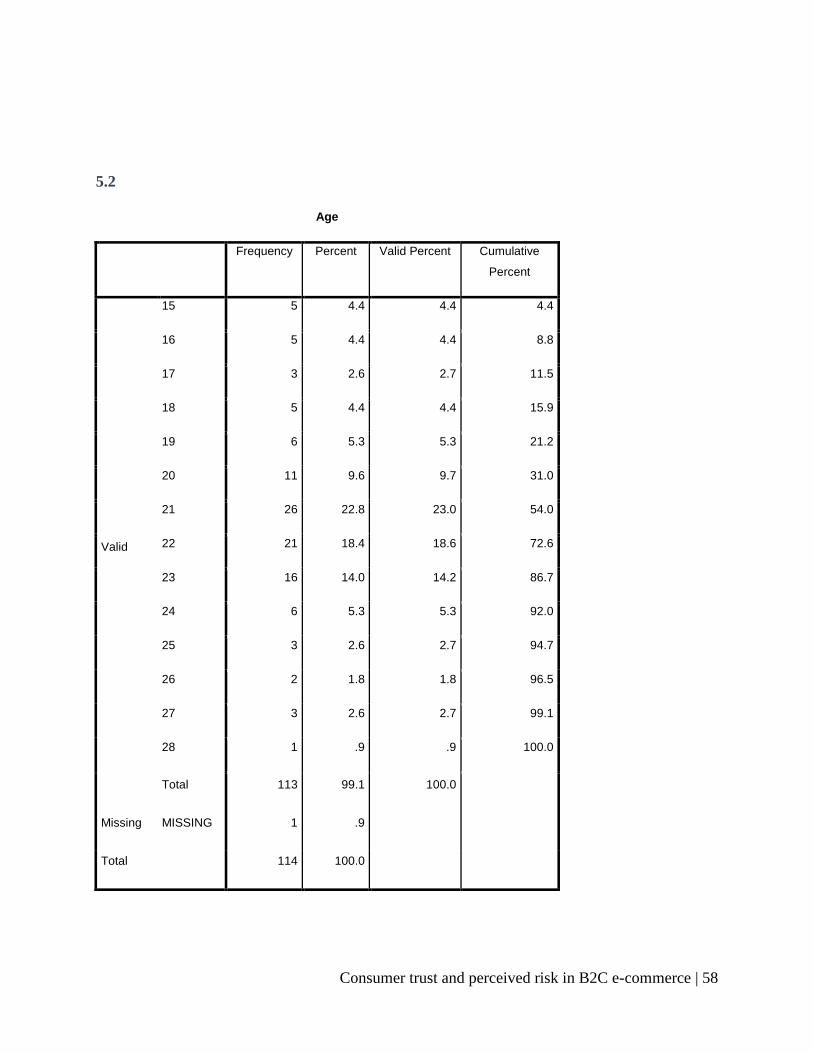
Consumer trust and perceived risk in B2C e-commerce | 58
5.2
Age
Frequency Percent Valid Percent Cumulative
Percent
Valid
15 5 4.4 4.4 4.4
16 5 4.4 4.4 8.8
17 3 2.6 2.7 11.5
18 5 4.4 4.4 15.9
19 6 5.3 5.3 21.2
20 11 9.6 9.7 31.0
21 26 22.8 23.0 54.0
22 21 18.4 18.6 72.6
23 16 14.0 14.2 86.7
24 6 5.3 5.3 92.0
25 3 2.6 2.7 94.7
26 2 1.8 1.8 96.5
27 3 2.6 2.7 99.1
28 1 .9 .9 100.0
Total 113 99.1 100.0
Missing MISSING 1 .9
Total 114 100.0
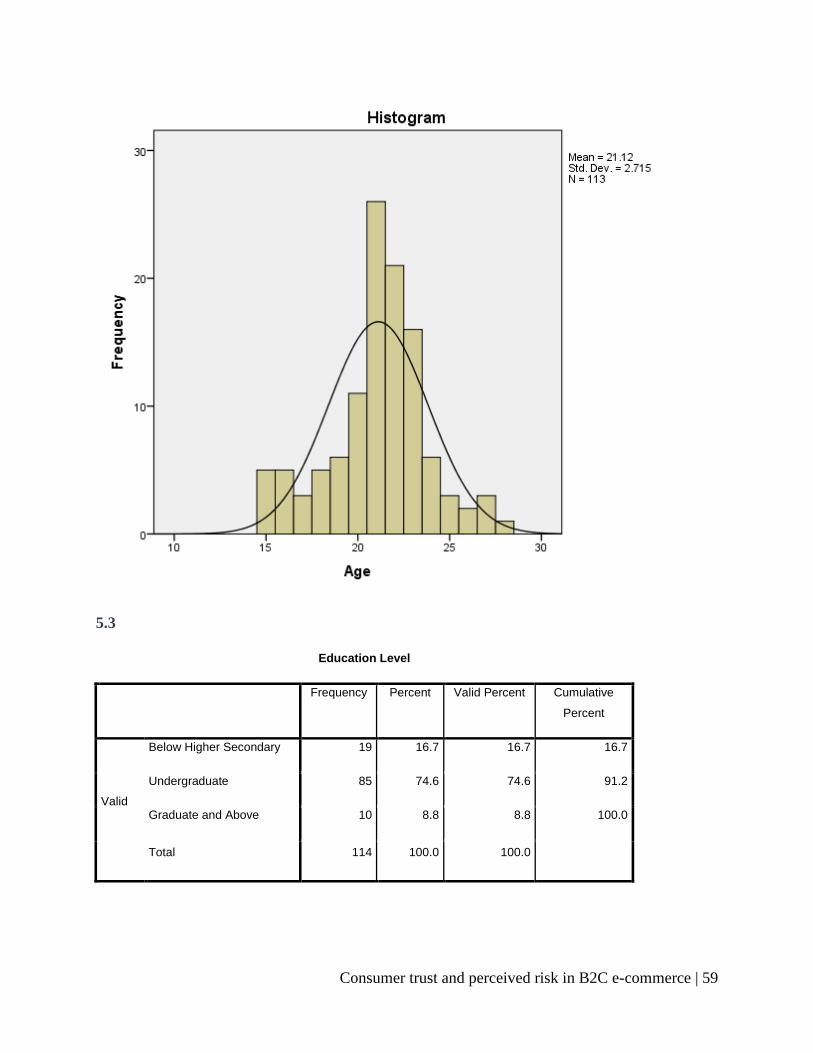
Consumer trust and perceived risk in B2C e-commerce | 59
5.3
Education Level
Frequency Percent Valid Percent Cumulative
Percent
Valid
Below Higher Secondary 19 16.7 16.7 16.7
Undergraduate 85 74.6 74.6 91.2
Graduate and Above 10 8.8 8.8 100.0
Total 114 100.0 100.0

Consumer trust and perceived risk in B2C e-commerce | 60
5.4
Profession
Frequency Percent Valid Percent Cumulative
Percent
Valid
Student 87 76.3 76.3 76.3
Jobholder 27 23.7 23.7 100.0
Total 114 100.0 100.0
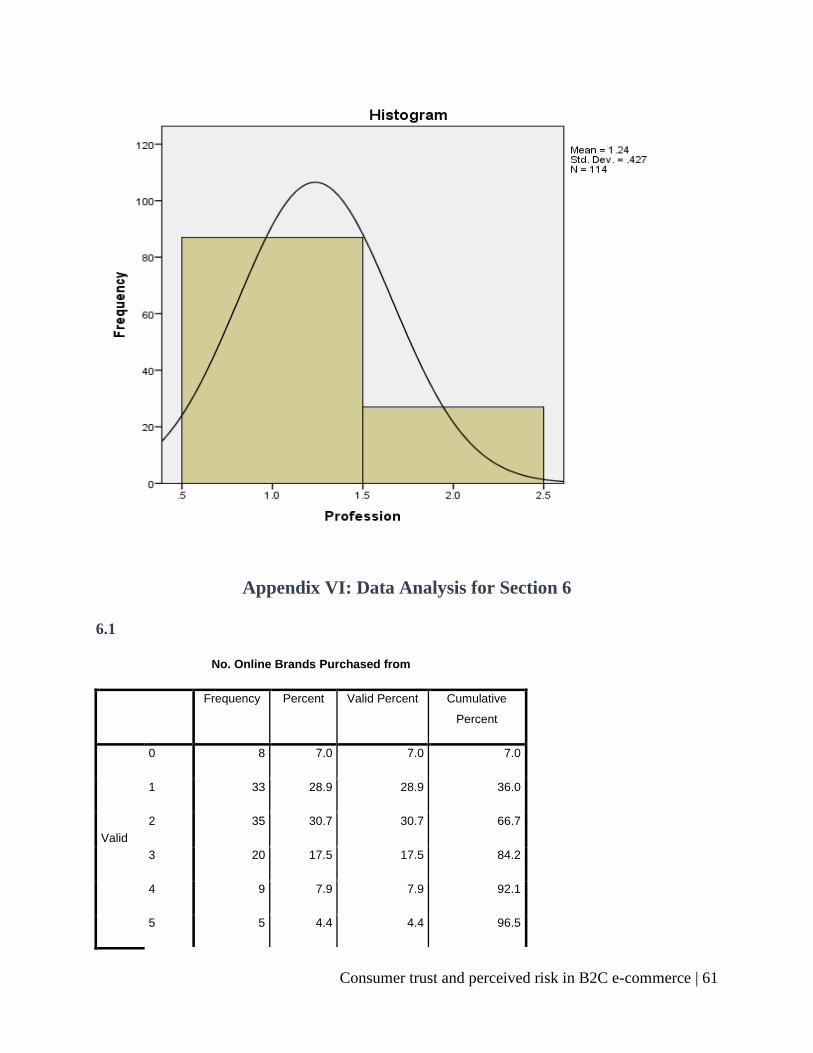
Consumer trust and perceived risk in B2C e-commerce | 61
Appendix VI: Data Analysis for Section 6
6.1
No. Online Brands Purchased from
Frequency Percent Valid Percent Cumulative
Percent
Valid
0 8 7.0 7.0 7.0
1 33 28.9 28.9 36.0
2 35 30.7 30.7 66.7
3 20 17.5 17.5 84.2
4 9 7.9 7.9 92.1
5 5 4.4 4.4 96.5
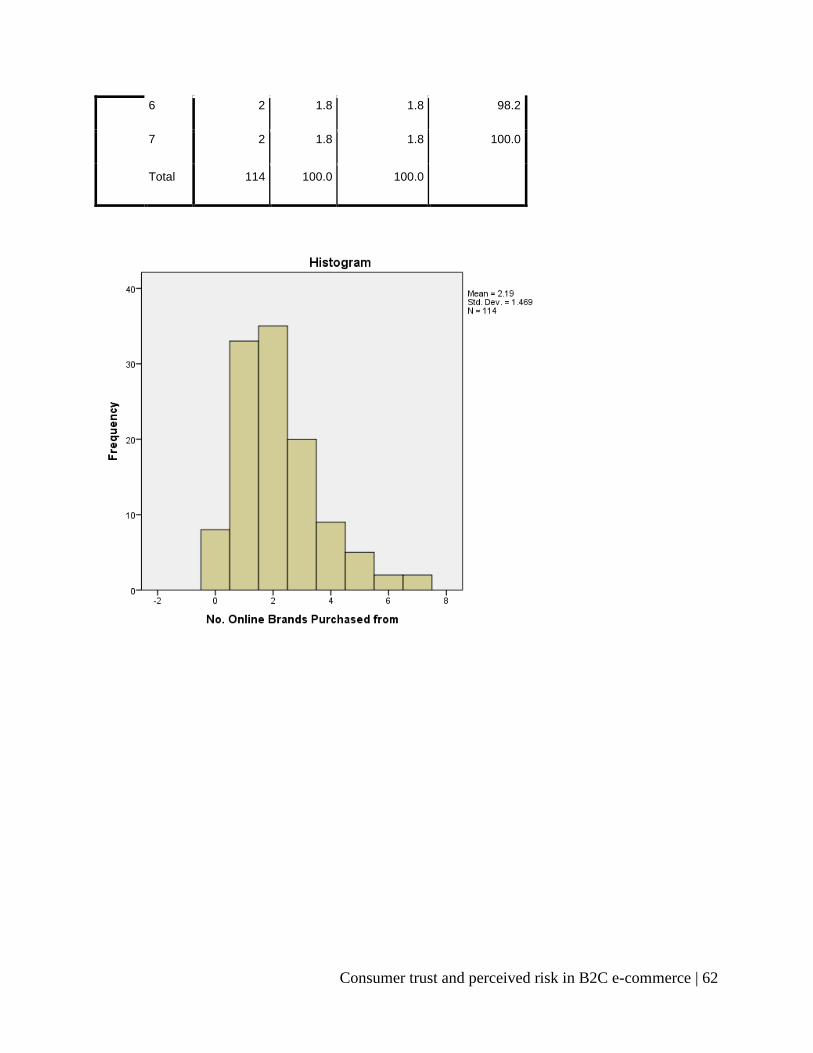
Consumer trust and perceived risk in B2C e-commerce | 62
6 2 1.8 1.8 98.2
7 2 1.8 1.8 100.0
Total 114 100.0 100.0
Consumer trust and perceived risk in B2C e-commerce | 63
6.2
Food Panda 36
Rokomari.com 19
Bikroy.com 8
HungryNaki 7
Ekhanei.com 4
Akhoni.com 3
Banglashoppers.com 3
Chaldal.com 2
Daraz.com 2
Kaymu.com 2
Sports Pavilion 2
Axarobd 1
BadgesCollection 1
Bee Cassette 1
Biponee.com 1
Clickbd.com 1
FastTrack 1
Iferi 1
ImpEx Computers 1
Joyti's Collection 1
La Mode 1

Consumer trust and perceived risk in B2C e-commerce | 64
PC world Rajshahi 1
Rayben 1
Sparkling Emotions 1
No Particular Brand 14
6.3
Likeliness to stick to the Brand in near future
Frequency Percent Valid Percent Cumulative
Percent
Valid
1 13 11.4 11.4 11.4
2 4 3.5 3.5 14.9
3 25 21.9 21.9 36.8
4 11 9.6 9.6 46.5
5 14 12.3 12.3 58.8
6 16 14.0 14.0 72.8
7 8 7.0 7.0 79.8
8 12 10.5 10.5 90.4
9 8 7.0 7.0 97.4
10 3 2.6 2.6 100.0
Total 114 100.0 100.0
Consumer trust and perceived risk in B2C e-commerce | 65
6.4
Branded Providers more reliable
Frequency Percent Valid Percent Cumulative
Percent
Valid
1 5 4.4 4.4 4.4
2 8 7.0 7.0 11.4
3 11 9.6 9.6 21.1
4 7 6.1 6.1 27.2
5 7 6.1 6.1 33.3
6 5 4.4 4.4 37.7
7 10 8.8 8.8 46.5
Consumer trust and perceived risk in B2C e-commerce | 66
8 18 15.8 15.8 62.3
9 28 24.6 24.6 86.8
10 15 13.2 13.2 100.0
Total 114 100.0 100.0
6.5
Branded Providers provide better quality
Frequency Percent Valid Percent Cumulative
Percent
Valid
1 4 3.5 3.5 3.5
2 8 7.0 7.0 10.5
3 10 8.8 8.8 19.3

Consumer trust and perceived risk in B2C e-commerce | 67
4 5 4.4 4.4 23.7
5 17 14.9 14.9 38.6
6 7 6.1 6.1 44.7
7 17 14.9 14.9 59.6
8 22 19.3 19.3 78.9
9 15 13.2 13.2 92.1
10 9 7.9 7.9 100.0
Total 114 100.0 100.0
6.6
Branded providers provide better service
Consumer trust and perceived risk in B2C e-commerce | 68
Frequency Percent Valid Percent Cumulative
Percent
Valid
1 4 3.5 3.5 3.5
2 10 8.8 8.8 12.3
3 7 6.1 6.1 18.4
4 5 4.4 4.4 22.8
5 14 12.3 12.3 35.1
6 13 11.4 11.4 46.5
7 16 14.0 14.0 60.5
8 21 18.4 18.4 78.9
9 16 14.0 14.0 93.0
10 8 7.0 7.0 100.0
Total 114 100.0 100.0
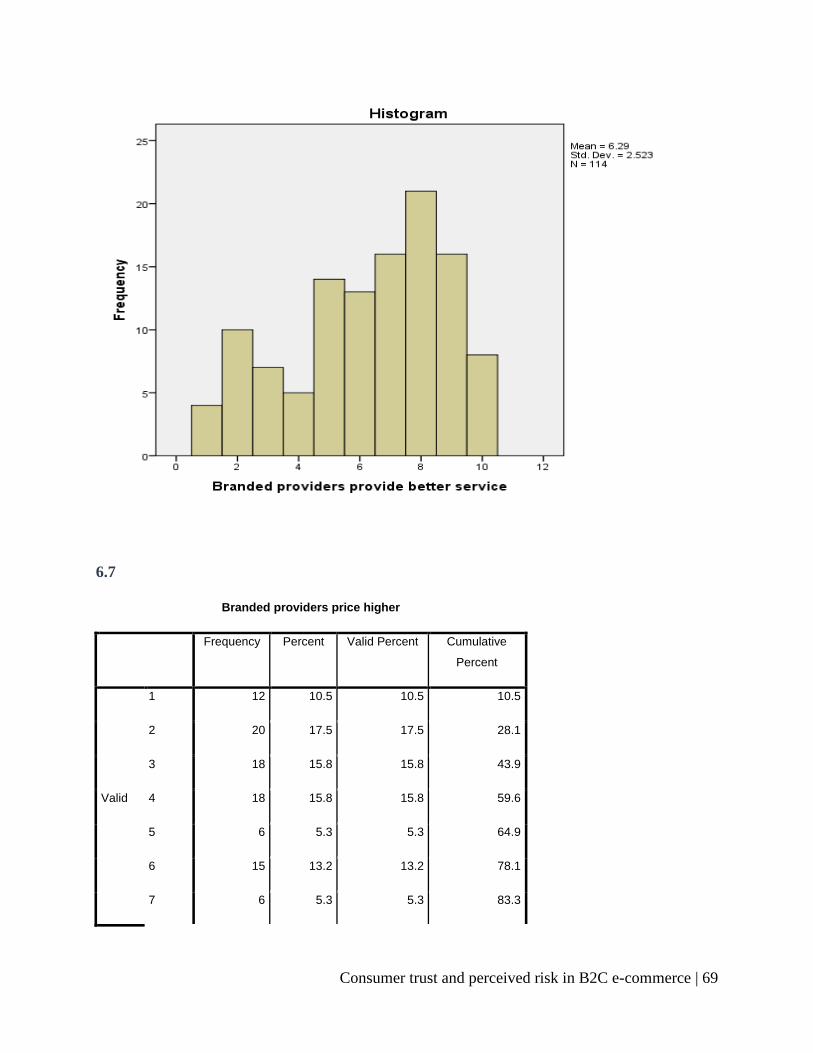
Consumer trust and perceived risk in B2C e-commerce | 69
6.7
Branded providers price higher
Frequency Percent Valid Percent Cumulative
Percent
Valid
1 12 10.5 10.5 10.5
2 20 17.5 17.5 28.1
3 18 15.8 15.8 43.9
4 18 15.8 15.8 59.6
5 6 5.3 5.3 64.9
6 15 13.2 13.2 78.1
7 6 5.3 5.3 83.3

Consumer trust and perceived risk in B2C e-commerce | 70
8 7 6.1 6.1 89.5
9 6 5.3 5.3 94.7
10 6 5.3 5.3 100.0
Total 114 100.0 100.0
Appendix VII: Data Analysis for Section 7
7.1
Statistics
Extent of sharing information
N
Valid 114
Missing 0
Mean 2.03
Mode 2

Consumer trust and perceived risk in B2C e-commerce | 71
Std. Deviation .409
Extent of sharing information
Frequency Percent Valid Percent Cumulative
Percent
Valid
Detailed 8 7.0 7.0 7.0
Moderate 95 83.3 83.3 90.4
Minimal 11 9.6 9.6 100.0
Total 114 100.0 100.0
7.2
Statistics
Info Shared Publicly
N Valid 113
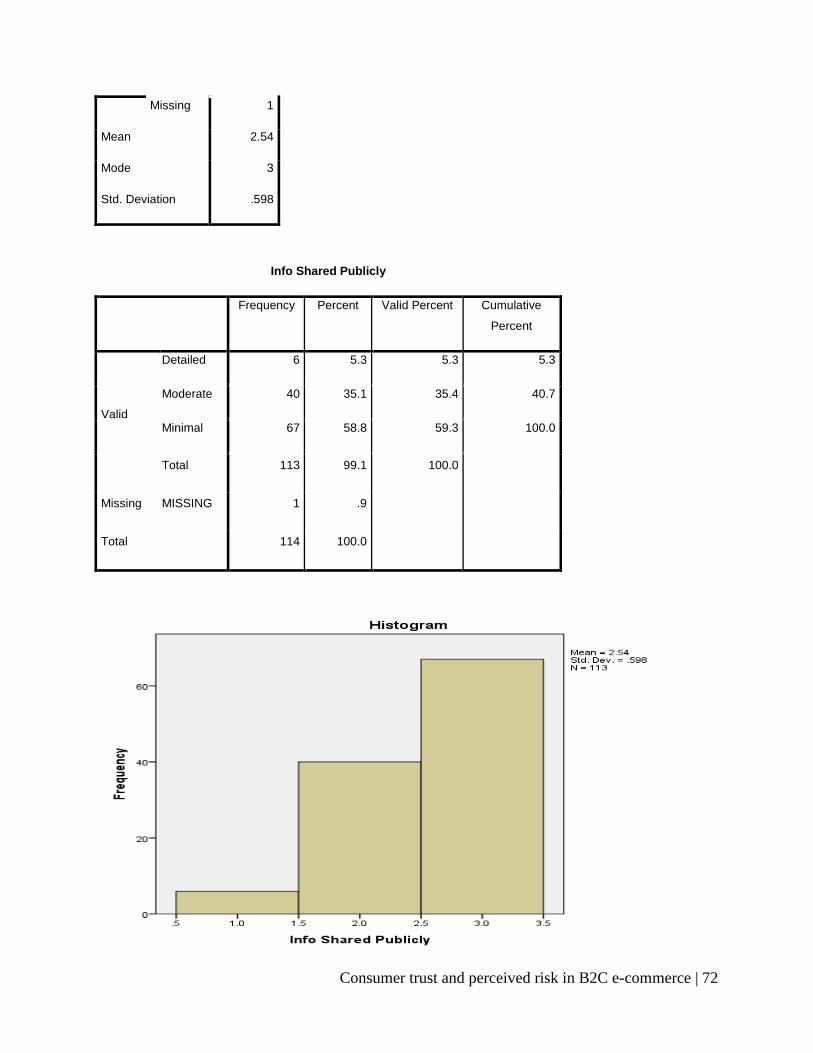
Consumer trust and perceived risk in B2C e-commerce | 72
Missing 1
Mean 2.54
Mode 3
Std. Deviation .598
Info Shared Publicly
Frequency Percent Valid Percent Cumulative
Percent
Valid
Detailed 6 5.3 5.3 5.3
Moderate 40 35.1 35.4 40.7
Minimal 67 58.8 59.3 100.0
Total 113 99.1 100.0
Missing MISSING 1 .9
Total 114 100.0
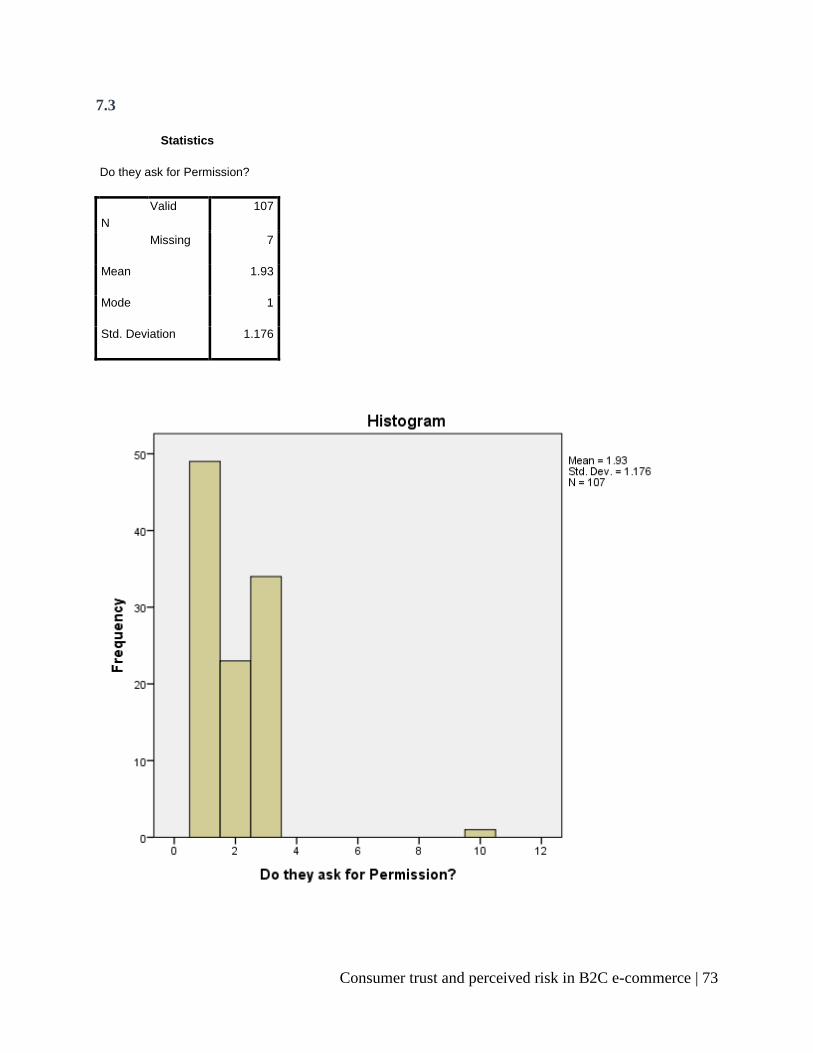
Consumer trust and perceived risk in B2C e-commerce | 73
7.3
Statistics
Do they ask for Permission?
N
Valid 107
Missing 7
Mean 1.93
Mode 1
Std. Deviation 1.176
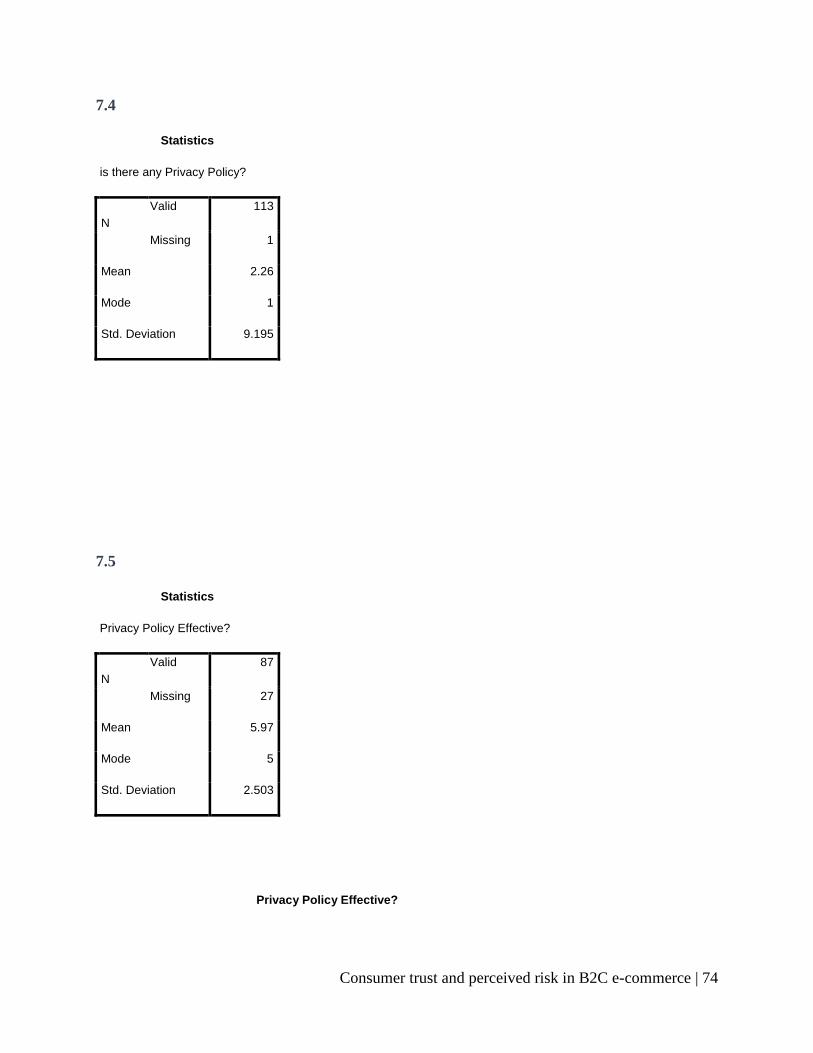
Consumer trust and perceived risk in B2C e-commerce | 74
7.4
Statistics
is there any Privacy Policy?
N
Valid 113
Missing 1
Mean 2.26
Mode 1
Std. Deviation 9.195
7.5
Statistics
Privacy Policy Effective?
N
Valid 87
Missing 27
Mean 5.97
Mode 5
Std. Deviation 2.503
Privacy Policy Effective?
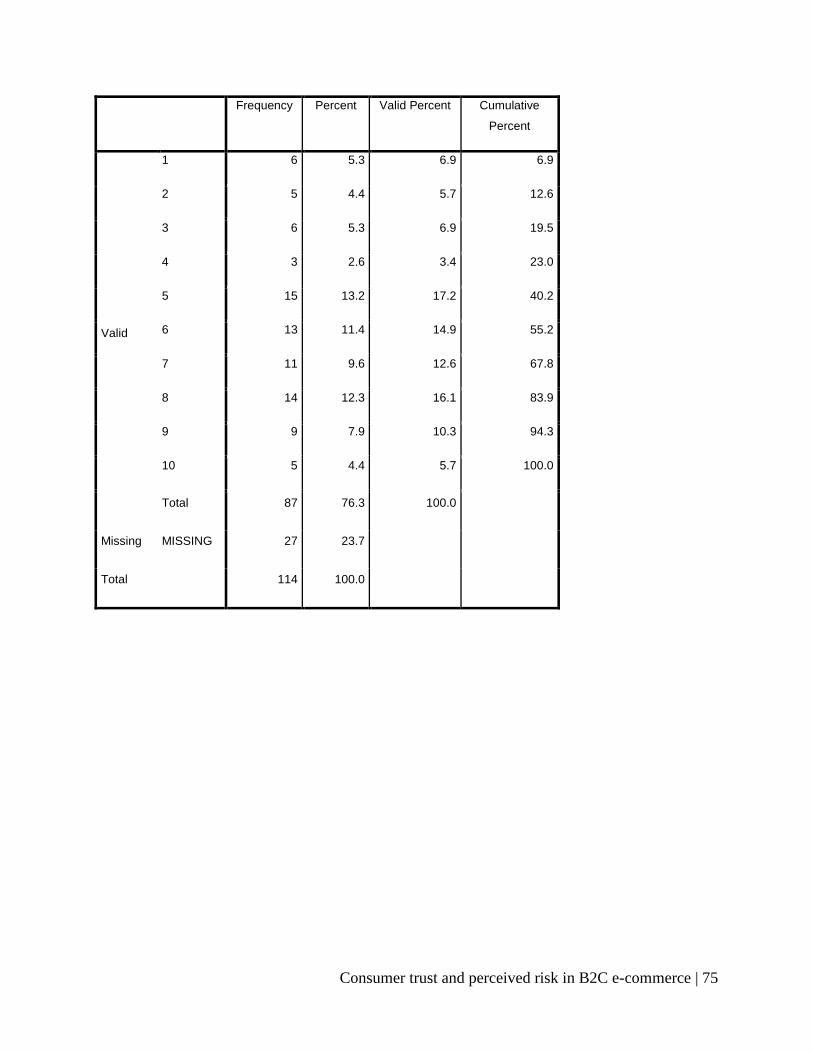
Consumer trust and perceived risk in B2C e-commerce | 75
Frequency Percent Valid Percent Cumulative
Percent
Valid
1 6 5.3 6.9 6.9
2 5 4.4 5.7 12.6
3 6 5.3 6.9 19.5
4 3 2.6 3.4 23.0
5 15 13.2 17.2 40.2
6 13 11.4 14.9 55.2
7 11 9.6 12.6 67.8
8 14 12.3 16.1 83.9
9 9 7.9 10.3 94.3
10 5 4.4 5.7 100.0
Total 87 76.3 100.0
Missing MISSING 27 23.7
Total 114 100.0
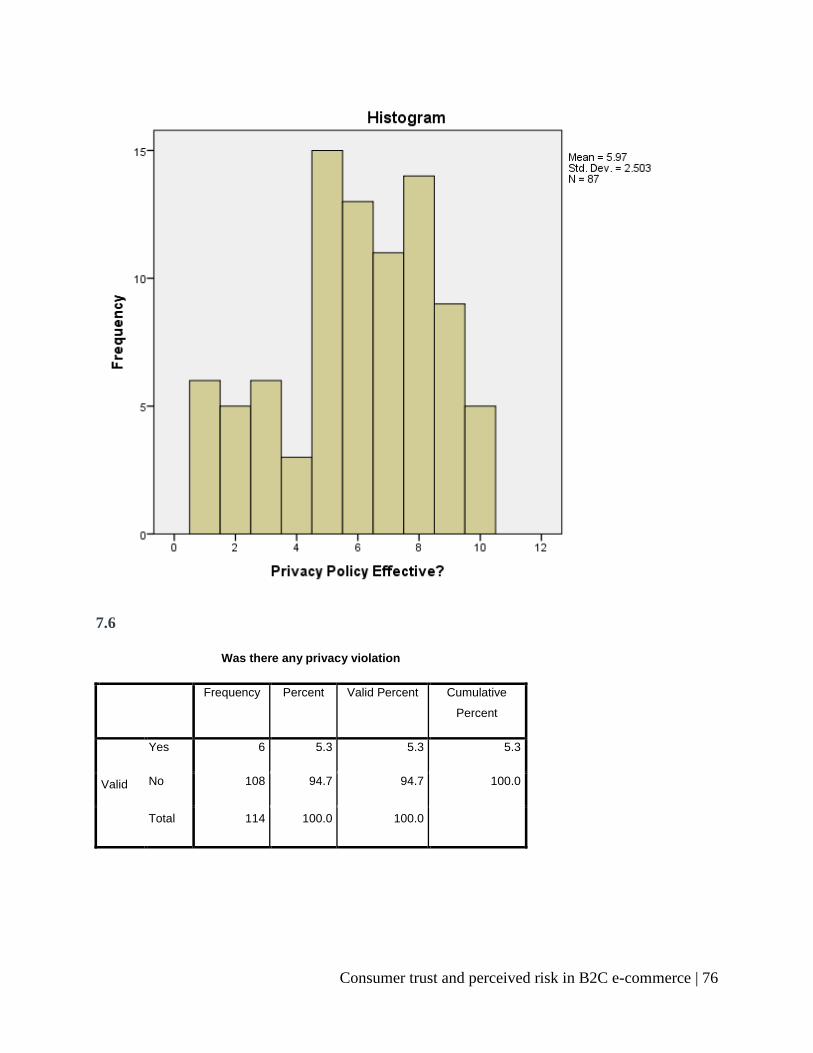
Consumer trust and perceived risk in B2C e-commerce | 76
7.6
Was there any privacy violation
Frequency Percent Valid Percent Cumulative
Percent
Valid
Yes 6 5.3 5.3 5.3
No 108 94.7 94.7 100.0
Total 114 100.0 100.0

Consumer trust and perceived risk in B2C e-commerce | 77
Appendix VIII: Data Analysis for Section 8
8.1
Is it overpriced?
Frequency Percent Valid Percent Cumulative
Percent
Valid
High 23 20.2 20.4 20.4
Medium 76 66.7 67.3 87.6
Low 14 12.3 12.4 100.0
Total 113 99.1 100.0
Missing MISSING 1 .9
Total 114 100.0

Consumer trust and perceived risk in B2C e-commerce | 78
8.2
Delivery Charge Preferred
Frequency Percent Valid Percent Cumulative
Percent
Valid
Percentaged 15 13.2 13.2 13.2
Fixed 99 86.8 86.8 100.0
Total 114 100.0 100.0

Consumer trust and perceived risk in B2C e-commerce | 79
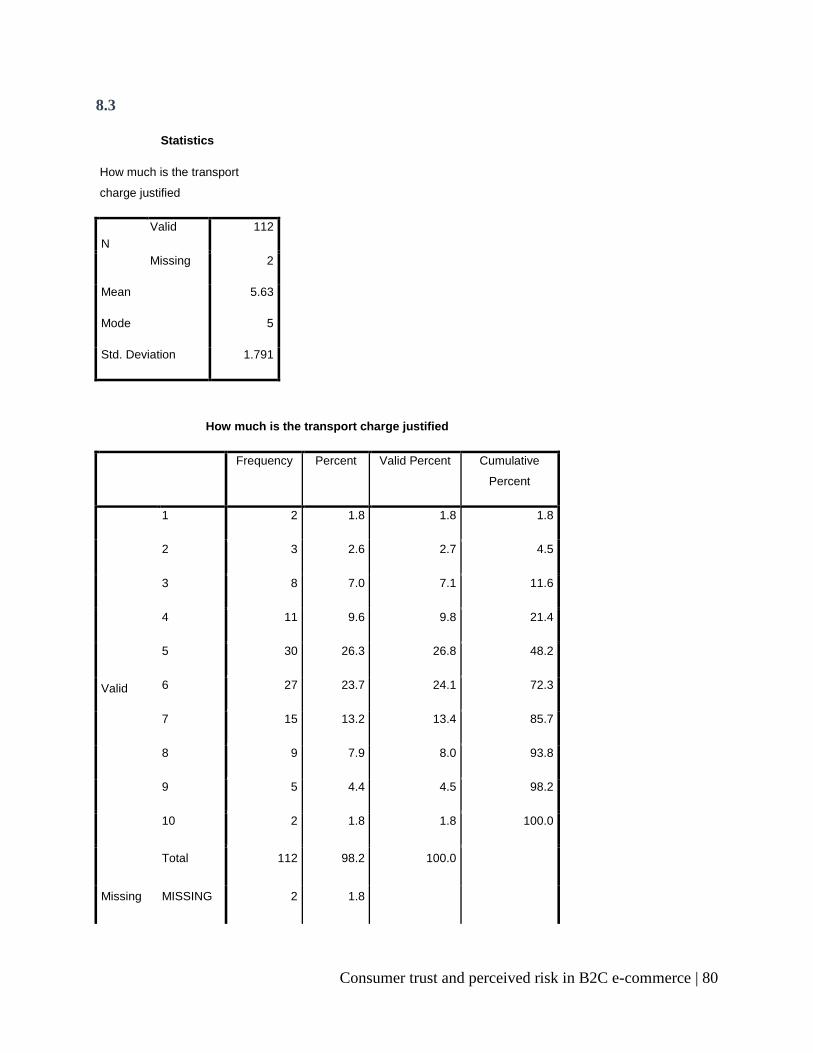
Consumer trust and perceived risk in B2C e-commerce | 80
8.3
Statistics
How much is the transport
charge justified
N
Valid 112
Missing 2
Mean 5.63
Mode 5
Std. Deviation 1.791
How much is the transport charge justified
Frequency Percent Valid Percent Cumulative
Percent
Valid
1 2 1.8 1.8 1.8
2 3 2.6 2.7 4.5
3 8 7.0 7.1 11.6
4 11 9.6 9.8 21.4
5 30 26.3 26.8 48.2
6 27 23.7 24.1 72.3
7 15 13.2 13.4 85.7
8 9 7.9 8.0 93.8
9 5 4.4 4.5 98.2
10 2 1.8 1.8 100.0
Total 112 98.2 100.0
Missing MISSING 2 1.8
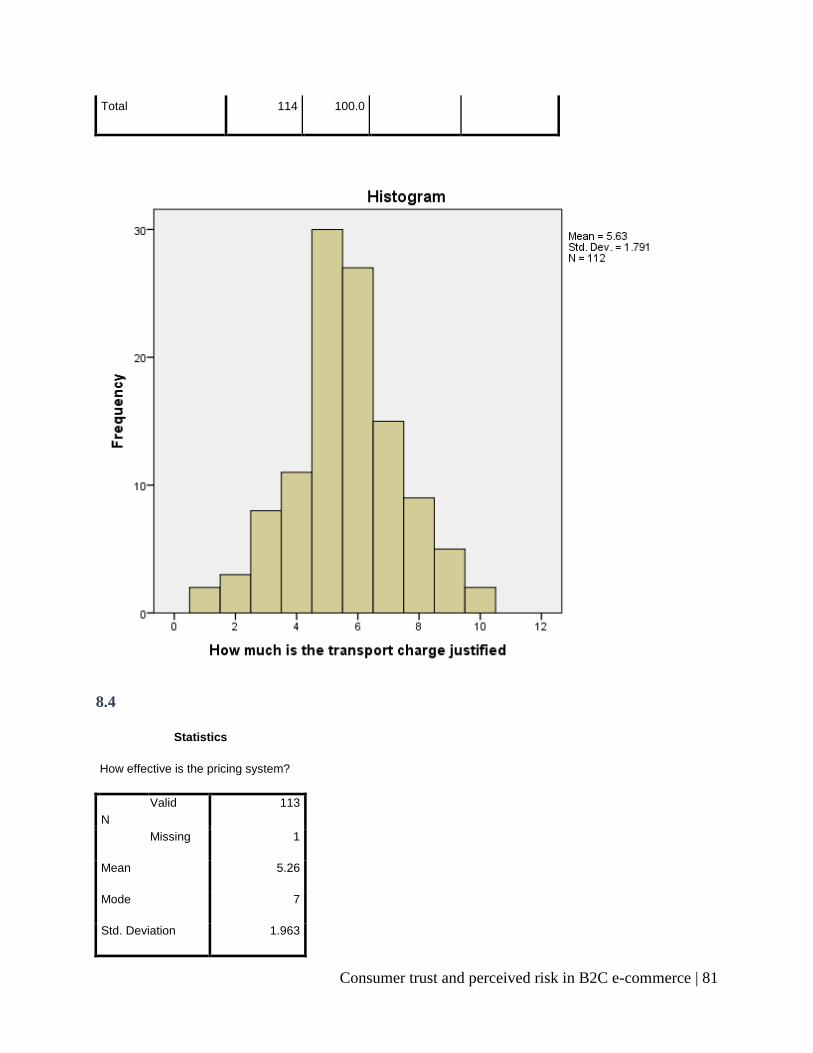
Consumer trust and perceived risk in B2C e-commerce | 81
Total 114 100.0
8.4
Statistics
How effective is the pricing system?
N
Valid 113
Missing 1
Mean 5.26
Mode 7
Std. Deviation 1.963

Consumer trust and perceived risk in B2C e-commerce | 82
How effective is the pricing system?
Frequency Percent Valid Percent Cumulative
Percent
Valid
1 4 3.5 3.5 3.5
2 5 4.4 4.4 8.0
3 19 16.7 16.8 24.8
4 8 7.0 7.1 31.9
5 21 18.4 18.6 50.4
6 20 17.5 17.7 68.1
7 27 23.7 23.9 92.0
8 5 4.4 4.4 96.5
9 3 2.6 2.7 99.1
10 1 .9 .9 100.0
Total 113 99.1 100.0
Missing MISSING 1 .9
Total 114 100.0

Consumer trust and perceived risk in B2C e-commerce | 83
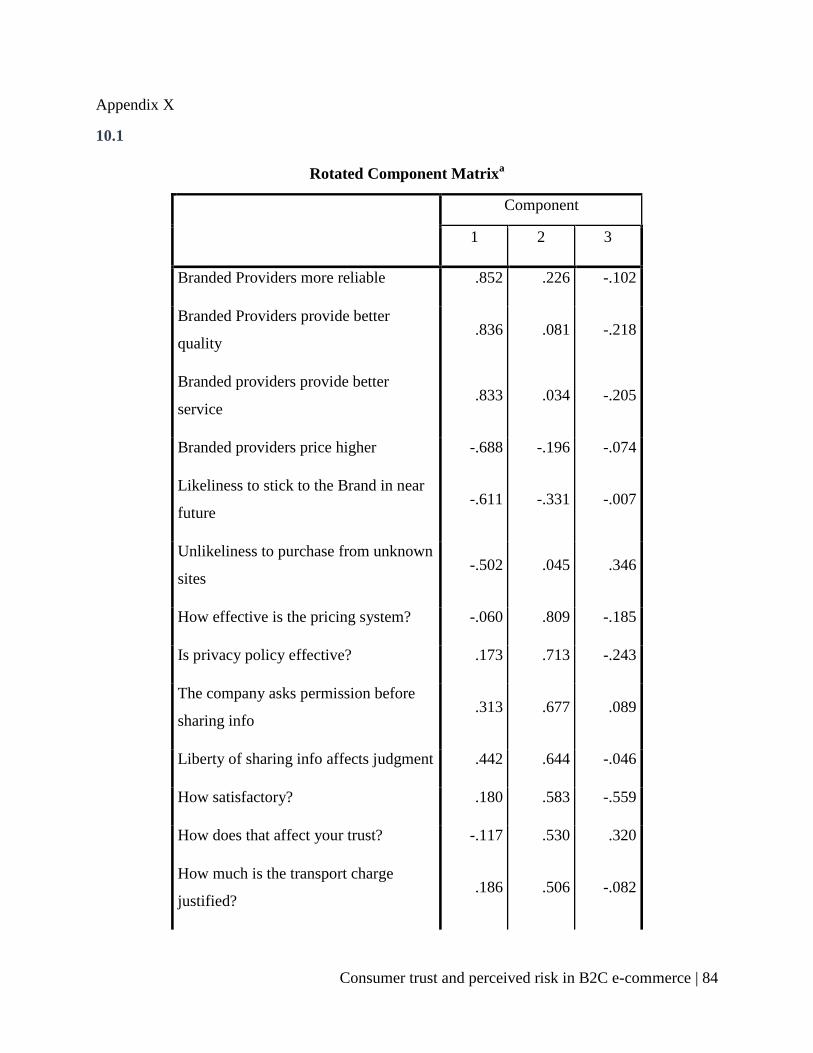
Consumer trust and perceived risk in B2C e-commerce | 84
Appendix X
10.1
Rotated Component Matrixa
Component
1 2 3
Branded Providers more reliable .852 .226 -.102
Branded Providers provide better
quality .836 .081 -.218
Branded providers provide better
service .833 .034 -.205
Branded providers price higher -.688 -.196 -.074
Likeliness to stick to the Brand in near
future -.611 -.331 -.007
Unlikeliness to purchase from unknown
sites -.502 .045 .346
How effective is the pricing system? -.060 .809 -.185
Is privacy policy effective? .173 .713 -.243
The company asks permission before
sharing info .313 .677 .089
Liberty of sharing info affects judgment .442 .644 -.046
How satisfactory? .180 .583 -.559
How does that affect your trust? -.117 .530 .320
How much is the transport charge
justified? .186 .506 -.082
Consumer trust and perceived risk in B2C e-commerce | 85
The company keeps info private -.037 .021 .770
Does keeping from sharing info affects
trust? -.248 -.363 .554
Extraction Method: Principal Component Analysis.
Rotation Method: Varimax with Kaiser Normalization.
a. Rotation converged in 5 iterations.
Bibliography
Jing, Y. (2009). On-Line Payment and Security of E-commerce.Proccedings of the 2009
International Symposium of Web Information Systems and Applications , 46-50.
Mohiuddin, M. (2014). Overview The E-Commerce In Bangladesh . IOSR Journal of Business
and Management (IOSR-JBM) , 01-06.
References
ATKearney 2013, The 2013 Global Retail E-Commerce Index. Website available at:
Wehttp://www.atkearney.com/documents/10192/3609951/Online+Retail+Is+Front+and+Center+
in+the+Quest+for+Growth.pdf/f6693929-b2d6-459e-afaa-3a892adbf33e
Zang, Dran.User Expectations and rankings of Quality Factors in Different Website Domains.
Website available at:
http://citeseerx.ist.psu.edu/viewdoc/download?doi=10.1.1.12.7287&rep=rep1&type=pdf
E-Commerce: An Introduction, Consumer Privacy. 2015. E-Commerce: An Introduction,
Consumer Privacy. [ONLINE] Available at:
http://cyber.law.harvard.edu/olds/ecommerce/privacytext.html.
The European Opinion Research Group. March 2004, „ISSUES RELATING TO BUSINESS
AND CONSUMER E-COMMERCE‟, Special Eurobarometer 60.0/ Wave 201, viewed 8 March
2015
Consumer trust and perceived risk in B2C e-commerce | 86
Masoud.Y 2013, „The Effect of Perceived risk of online shopping in Jordan‟, European
Journal of Business and Management, Vol. 5, no. 6, Viewed 10 March 2015.
Du, Ma, & Wang 2009, „E-Commerce Trust Model Based on Perceived Risk‟, Proceedings of
the Second Symposium International Computer Science and Computational Technology, pp.
175-178, viewed 9th March 2015.
Kim, Ferrin&Rao 2008, „A Trust-Based Consumer Decision Model in Electronic Commerce:
The Role of Trust, Risk, and Their Antecedents‟, Decision Support Systems, Volume 44, Issue 2.
Viewed 10th March 2015
Gustavsson& Johansson 2006, Consumer Trust in E-commerce,‟ Consumer Trust in E-
commerce‟, The Department of Business Studies FEC 685 Bachelor Dissertation, Kristianstad
University.
Related Documents