General rights Copyright and moral rights for the publications made accessible in the public portal are retained by the authors and/or other copyright owners and it is a condition of accessing publications that users recognise and abide by the legal requirements associated with these rights. Users may download and print one copy of any publication from the public portal for the purpose of private study or research. You may not further distribute the material or use it for any profit-making activity or commercial gain You may freely distribute the URL identifying the publication in the public portal If you believe that this document breaches copyright please contact us providing details, and we will remove access to the work immediately and investigate your claim. Downloaded from orbit.dtu.dk on: Dec 01, 2021 Research on regional energy efficiency based on GIS technology and image quality processing Chen, Zhuolun; Wu, Xiaowei Published in: Journal of Visual Communication and Image Representation Link to article, DOI: 10.1016/j.jvcir.2019.06.008 Publication date: 2019 Document Version Publisher's PDF, also known as Version of record Link back to DTU Orbit Citation (APA): Chen, Z., & Wu, X. (2019). Research on regional energy efficiency based on GIS technology and image quality processing. Journal of Visual Communication and Image Representation, 62, 410-417. https://doi.org/10.1016/j.jvcir.2019.06.008

Welcome message from author
This document is posted to help you gain knowledge. Please leave a comment to let me know what you think about it! Share it to your friends and learn new things together.
Transcript
General rights Copyright and moral rights for the publications made accessible in the public portal are retained by the authors and/or other copyright owners and it is a condition of accessing publications that users recognise and abide by the legal requirements associated with these rights.
Users may download and print one copy of any publication from the public portal for the purpose of private study or research.
You may not further distribute the material or use it for any profit-making activity or commercial gain
You may freely distribute the URL identifying the publication in the public portal If you believe that this document breaches copyright please contact us providing details, and we will remove access to the work immediately and investigate your claim.
Downloaded from orbit.dtu.dk on: Dec 01, 2021
Research on regional energy efficiency based on GIS technology and image qualityprocessing
Chen, Zhuolun; Wu, Xiaowei
Published in:Journal of Visual Communication and Image Representation
Link to article, DOI:10.1016/j.jvcir.2019.06.008
Publication date:2019
Document VersionPublisher's PDF, also known as Version of record
Link back to DTU Orbit
Citation (APA):Chen, Z., & Wu, X. (2019). Research on regional energy efficiency based on GIS technology and image qualityprocessing. Journal of Visual Communication and Image Representation, 62, 410-417.https://doi.org/10.1016/j.jvcir.2019.06.008
Accepted Manuscript
Research on Regional Energy Efficiency Based on GIS Technology and ImageQuality Processing
Zhuolun Chen, Xiaowei Wu
PII: S1047-3203(19)30181-6DOI: https://doi.org/10.1016/j.jvcir.2019.06.008Reference: YJVCI 2566
To appear in: J. Vis. Commun. Image R.
Received Date: 18 May 2019Revised Date: 17 June 2019Accepted Date: 19 June 2019
Please cite this article as: Z. Chen, X. Wu, Research on Regional Energy Efficiency Based on GIS Technology andImage Quality Processing, J. Vis. Commun. Image R. (2019), doi: https://doi.org/10.1016/j.jvcir.2019.06.008
This is a PDF file of an unedited manuscript that has been accepted for publication. As a service to our customerswe are providing this early version of the manuscript. The manuscript will undergo copyediting, typesetting, andreview of the resulting proof before it is published in its final form. Please note that during the production processerrors may be discovered which could affect the content, and all legal disclaimers that apply to the journal pertain.
Research on Regional Energy Efficiency Based on GIS Technology and Image Quality Processing
Zhuolun Chen1,2,a and Xiaowei Wu1,b*
1 Architectural Design and Research Institute, School of Architecture, South China
University of Technology, Guangzhou, Guangdong, China
2 Copenhagen Centre on Energy Efficiency, UNEP-DTU Partnership, Department of
Technology, Management and Economics, Technical University of Denmark,
Copenhagen, Denmark
a [email protected], b [email protected]
*Corresponding author
Abstract: Economic development requires energy support, but the economy that relies too much on high energy consumption and high pollution is not sustainable. However, due to blind investment and low-level expansion of some new energy companies, some new energy industry has overcapacity and low production efficiency, slowing down the pace of new energy industry development, and limiting the development space of new energy companies. Thus, this paper is based on the GIS technology and image quality processing design improvement, around this idea, completed the new system simulation analysis, system development, experimental testing and so on. This paper focuses on the evaluation of the distribution efficiency of new energy industry based on image processing. Natural images have their own unique statistical properties, and interference can cause them to deviate from the original "natural statistical state." According to the image itself and the characteristics of the human visual system, the expression of the image is adjusted, which is more conducive to the transmission, storage and understanding of information. Therefore, this paper proposes a new energy industry distribution efficiency evaluation method based on GIS technology and image processing from three aspects of the nature of natural images, the expression of image information and the characteristics of human visual system. The research shows that the method can objectively and effectively evaluate the distribution efficiency of the new energy industry, and has certain practicability, which can effectively alleviate the bottleneck problems faced above.Key words: Deep Learning; GIS Technology; Image Quality Analysis; Model; Quality1. Introduction
New energy industry is a strategic national economy, leading industry, to stimulate economic growth, adjusting the industrial structure, promote industrial restructuring and upgrading, to break through the bottleneck of energy plays an important role [1-4]. The state has focused on the development of new energy industry as a strategic emerging industry. Relevant ministries have launched or plan to launch a series of policy measures to promote the development of new energy industry, and the new energy industry has shown a booming trend [5]. The development of new energy industry is not only an important part of revitalizing strategic emerging industries, but also a fundamental way to transform the economic development mode and improve the core competitiveness of China's industry. A notable feature
of China's economic development is its long-term over-reliance on non-renewable energy sources, and the energy consumption structure is obviously unreasonable [6]. In 2009, China's total fossil energy consumption accounted for about 90% of total primary energy consumption. With coal and oil as the main fuels, leading to serious environmental pollution, coupled with limited fossil energy reserves, it has become unsustainable to continue to rely on non-renewable energy development. At present, China's economic development will highlight the theme of scientific development, pay more attention to the strategic adjustment of the economic structure and the comprehensive, coordinated and sustainable development of society. Accelerating the development and utilization of new energy and renewable energy has important strategic significance for accelerating the transformation of economic development mode, optimizing energy structure, alleviating energy supply and environmental pressure, and promoting stable and rapid economic development [7-8].
The current world economic crisis did not change the trend of China's rapid economic growth [9-11]. China's future economy is still characterized by high savings, high investment, high capital and high speed, My analysis of China's economy is mainly analyzed from three parts: export, real estate and domestic demand. These three parts are called China's troika. At the same time, increasing integration with foreign countries is the mainstream trend of the Chinese economy [12-16]. The development of industry is a smooth growth process, which is closely related to consumption power and demand capacity. The accumulative growth characteristics of the industry make it necessary to have a free and controllable control when dealing with an industry, and not excessively suppress it. However, the changes in China's economic growth trajectory will be slowly started, and the adjustment model has obvious characteristics such as demand-led type and deep internalization of the industry [17]. In addition, the Chinese economy will enter a period of “second-time high-speed economic growth” , and the various growth models that people originally imagined are not as fast as imagined. New energy neighborhoods include the current popular new energy vehicles, geothermal development, solar power generation, biogas utilization, nuclear power, hydropower, and wind power [18].
The research on efficiency of scholars at home and abroad mainly studies how to maintain or improve the operational efficiency of enterprises under the established technical level and exogenous factors [19-21]. In terms of research methods, the main focus is on empirical analysis, and many practical research results have been obtained. The efficiency evaluation originally came from the energy efficiency evaluation and performance evaluation of the production enterprises. Wei YM uses the stochastic boundary method to study the efficiency of iron and steel enterprises from the perspective of global competitiveness, and conducts an in-depth study on the efficiency of steel enterprises. It is possible to effectively improve the technical efficiency of enterprises through scale, privatization and the use of advanced equipment and technology [22]. Eichinger F T used the US steel company sample as panel data and used data envelopment analysis (DEA) to analyze the cost technical efficiency of the US steel industry during the study period [23]. Li Y, Yao G, Zeng H build an evaluation indicator system for input and output selection. The relaxation-based metric model is applied to measure energy efficiency [24]. Hanley N D, Mcgregor P G introduces a balanced energy efficiency cost (LEEC) metric, using relevant energy conservation techniques to implement energy efficiency technologies and total cost cycles generated throughout the life cycle [25]. Qiu (2016) analyzed the regenerative braking system of electric vehicles by energy flow, and proposed the contribution rate parameters of the
two methods of series braking strategy and parallel strategy, and proposed the optimal strategy to improve the energy efficiency of electric vehicles [26]. Backman F participates in the Industrial Energy Efficiency Network (IEEN) to introduce customized energy management practices into SMEs, demonstrate network effects between industrial enterprises, and quantitatively and qualitatively assess network efficiency [27].
This paper is based on the GIS technology and image quality processing design improvement, around this idea, completed the new system simulation analysis, system development, experimental testing and so on. This paper focuses on the evaluation of the distribution efficiency of new energy industry based on image processing. Natural images have their own unique statistical properties, and interference can cause them to deviate from the original "natural statistical state." According to the image itself and the characteristics of the human visual system, the expression of the image is adjusted, which is more conducive to the transmission, storage and understanding of information. Therefore, this paper proposes a new energy industry distribution efficiency evaluation method based on GIS technology and image processing from three aspects of the nature of natural images, the expression of image information and the characteristics of human visual system. The research shows that the method can objectively and effectively evaluate the distribution efficiency of the new energy industry, and has certain practicability, which can effectively alleviate the bottleneck problems faced above.2、Proposed method
2.1 GIS technology(1) Introduction to GIS technologyGeographic Information System (GIS) is short for Geographic Information System
(Geographic Information System). It is an interdisciplinary subject for describing, collecting, storing, managing, calculating, analyzing and applying geospatial information. At the same time, GIS is also a technical system. It is based on geospatial database and uses the method of geographic model analysis to provide dynamic and spatial geographic information timely. It is a geographic research and application. A computer system for geographic decision-making services. Geographic information system deals with and manages a variety of geospatial entity data and their relationships, including spatial positioning data, graphical data, remote sensing image data, attribute data, etc. It is mainly used to analyze and process various phenomena and processes distributed in a certain geographical area, and to solve complex planning problems.
Geographic Information System (GIS) technology is a spatial information analysis technology that has developed rapidly in recent years. It plays a leading role in resource and environmental applications. GIS technology can not only effectively manage various resource and environment information with spatial attributes, but also conduct rapid and repeated analysis and testing of resource environment management and practice modes, which is convenient for making decision-making, conducting scientific and policy standard evaluation, and effectively Dynamic monitoring and analysis of resource and environmental conditions and changes in production activities during the period can also integrate data collection, spatial analysis and decision-making processes into a common information flow, significantly improve work efficiency and economic benefits, and solve resource and environmental problems. Provide technical support for sustainable development.
(2)The advantages of GIS
1) The traditional method has strong complexity and difficulty in collecting regional energy efficiency, and GIS can effectively solve this problem. In addition, the regional energy research work is more systematic, so there are many links and steps involved, especially in the data survey and detection, which requires a lot of manpower and material resources, but the previous purely manual investigation work is far from satisfactory. The actual work needs, we must establish a sound information system to guide the energy efficiency of the entire region, GIS technology can just meet this need, and can form a good fit and trust between the two.
2) GIS technology also has certain developability and can adapt to different working environments. In particular, it can use the secondary development method to superimpose functions and performance, so that the application ability of the technology can be significantly improved, highlighting GIS. Good development prospects for technology. And GIS technology can also tap the potential resource value of regional energy, making the foundation of regional energy efficiency analysis work expand.
(3) Practical application of GIS technology in regional energy efficiency research.1) Application in regional energy efficiency research. The main content of regional energy
efficiency research work is to check the energy quality, area, distribution and utilization status in a specific area, with both technical and management. Applying GIS technology to regional energy efficiency research, the main task is to input, summarize, edit and organize basic information, and to calculate the energy area of the existing area, determine the regional energy efficiency coefficient, etc. These collected data can be used as a basis for regional energy efficiency surveys.
2) Application in regional energy efficiency management. The main content of low-level regional energy efficiency management is to comprehensively record the changes in efficiency. The most difficult point is efficiency adjustment. Applying GIS technology to it can be managed by changing position and changing energy efficiency. Energy efficiency management systems cover a wide range of information, including regional information, energy efficiency rates, efficiency levels, and energy coverage. These information must be subdivided and stored separately. In addition, the system can search and review data at any time, analyze and count data, and also support roaming functions, etc., making the difficulty of regional energy efficiency research work greatly weakened.
3) Application in dynamic monitoring. The purpose of dynamic detection of the area provides the most timely information for energy area division. Therefore, it is necessary to have perfect technology to ensure the accuracy and timeliness of energy dynamic detection. After the completion of the investigation of energy use information, the remote sensing device and the GIS system can be combined to realize real-time monitoring and processing of energy usage, and a special regional energy efficiency evaluation model is established under the guidance of professional technicians to make work. The workload and difficulty of the work will be significantly improved, and the management efficiency will be significantly increased.2.2 Deep learning
The Convolutional Neural Network (CNN) is a type of deep neural network that omits the process of feature extraction and data reconstruction and can directly receive input images. In recent years, the convolutional neural network has developed very rapidly, and its performance in the field of speech analysis and image recognition has become a very hot research object, and it has also been well applied in the fields of handwritten character recognition, face recognition,
pedestrian detection, etc. . Most of the models that have won championships and excellent results in various image recognition contests are the convolutional neural network models applied. The convolutional neural network model has been far ahead in the field of image recognition, and it is a mainstream model that is very suitable for practical needs.
(1)The Structure of Convolutional Neural NetworkThe structure of convolution neural network. Convolutional neural network is a multi-layer
neural network. Each layer contains several two-dimensional planes and each two-dimensional plane is composed of several individual neurons. Convolutional neural network consists of input layer, convolution layer (C), pooling layer (S), full connection layer and output layer. Convolution layer is also called feature extraction layer. Its main operation is convolution. It is mainly used to extract image features. It includes two steps: linear operation and activation function output. If the convolution layer is one layer, the formula for calculating the feature map of the extracted image in one layer is shown in (1). The j-th feature graph of the convolution layer L is expressed by xj
l, f is the activation function in the convolution operation, and the convolution core between the j-th feature graph of the convolution layer L and the i-th feature graph of the upper L-1 layer of the kij
l convolution layer, and bjl is the offset term. Pooling layer, also known as feature
mapping layer, is mainly used to reduce the dimension of feature map. The feature mapping layer uses Sigmoid function as the activation function of convolution network. The function has a small influence function core, and the image after feature mapping has displacement invariance. Because the weights of the neurons in the pooling layer are shared, the number of parameters in the convolutional neural network is greatly reduced, and the complexity of network parameters is also reduced. Each convolution layer in the convolution neural network is followed by a pooling layer for local average or maximization. The neural network structure which alternates convolution layer and pooling layer can not only reduce the dimension of feature map, but also reduce the degree of over-fitting of network, improve the performance of network, and tolerate the distortion of input image when recognizing.
(1))( 1
iMi
lj
lij
li
lj bkxfx
(2)Characteristics of Convolutional Neural NetworksConvolutional neural network is a special deep feedforward neural network that is simpler
to train and has better generalization ability than the fully connected network structure of adjacent layers. Because of these advantages, the neural network is forgotten, convolutional nerve The network has been widely accepted and successful in many fields. Convolutional neural networks have four main characteristics: local interconnect, shared weight, multi-convolution kernel, and downsampling (pooling).
1) Local interconnection. The so-called local connection means that the nodes of the convolutional layer are only
connected to some nodes of the previous layer and are only used to learn local features. People's understanding of things is usually thought to be from local to whole. Similarly, the spatial connection between image pixels is also more closely related to the local and weaker connections to all the distant pixels, so each neuron only needs Learning a local pixel without learning the entire image, and realizing the function of locally acquiring the entire information. The traditional neural network design idea is to let each neuron learn all the pixel features on the image, which will generate a lot of weights, making the neural network difficult to train, so it can
not be well promoted. The principle of local interconnection of convolutional layers in convolutional neural networks is that the adjacent regions in the picture have greater correlation and the correlation is relatively small when the distance is long. Since the size of each neuron convolution kernel corresponds to the number of weights, the number of weights can be greatly reduced by using each neuron to be connected only to a part of the pixels of the corresponding image, which is why local interconnection is utilized.
2) Sharing weights. If there are still many parameters with only partial interconnection, another feature of the
convolutional neural network shares weights to further reduce the number of parameters. The shared weight is designed because the weight of the learned convolution kernel does not change during the convolution process. The same target in an image generally has the same features and has little relationship with the position, so each convolution kernel can be used to extract the features of all the same targets in the image by sharing the weight.
3) Multi-convolution kernel. Different convolution kernels can learn different features, and multiple features of the
image can be extracted by adding multiple convolution kernels. Each convolution kernel extracts the image features into another image.
4) Downsampling/pooling. The image is extracted through the convolution layer to obtain the features of the image,
and then the extracted image features are used to classify the image. However, if the features extracted by the convolution layer are directly classified, the calculation amount is still large. For example, for a 96× 96 pixel image, a feature of 400 images is learned after a convolution operation with a convolution kernel size of 8×8. Each of these features is convoluted with the image, then A 3168400-dimensional convolution feature vector is obtained, which is very difficult to calculate and may also be over-fitting. In order to solve the problem of over-fitting and large amount of calculation, it is proposed to perform aggregation statistics on features at different locations. The solution to aggregate statistics is to achieve the goal of dimensionality reduction by calculating the average value or taking the maximum value of a certain feature, and over-fitting after aggregation statistics is not easy to produce.
(3) Training process of convolutional neural networksThe training algorithm mainly consists of 4 steps, which are divided into two stages:The first phase, the forward propagation phase:1. Take a sample (X, Yp) from the sample set and enter X into the network; 2.Calculate the corresponding actual output Op.At this stage, the information is transformed from the input layer to the output layer. This
process is also the process that the network performs when it is running normally after training.Second stage, backward propagation stage1 calculating the difference between the actual output Op and the corresponding ideal
output Yp;2 Adjust the weight matrix according to the method of minimizing the error.The work of these two stages should generally be controlled by the accuracy requirements,
where Ep is calculated using formula (2).
The error measure of the network for the entire sample set is defined as: 。 EpE
(2)2
1)(
21
m
jpjjpp oyE
In order to more clearly illustrate the training process of the convolutional neural network used herein, it is first assumed that the number of elements of the input layer, the intermediate layer, and the output layer are N, L, and M, respectively. X = (x0, x1, ..., xN) is the input vector added to the network, H = (h0, h1, ..., hL) is the intermediate layer output vector, Y = (y0, y1,... , yM) is the actual output vector of the network, and D=(d0, d1, ..., dM) is used to indicate that the weight of the target output vector output unit i to the hidden element j of each mode in the training group is Vij, and vice versa. Then it is Vji.
Thus, the output of each unit in the middle layer is the formula (3):
(3))(1
0
N
ijiijj xVfh
The output of each unit of the output layer is formula (4):
𝑦𝑘 = 𝑓(𝐿 ‒ 1
∑𝑗 = 0
𝑊𝑛ℎ𝑗 + 𝜃𝑘) (4)
Where f(*) is the excitation function using an sigmoid function, as in equation (5):
(5)kxexf
1
1)(
Under the above conditions, the training process of the network is as follows:1) Select the training group. 300 samples were randomly selected from the sample set as
the training group.2) The weights Vij, Wjk and the thresholds φj, θk are set to a small random value close to
0, and the precision control parameter ε and the learning rate α are initialized.3) Take an input pattern from the training set X is added to the network, its objectives and
the given output vector D.4) using formula (3) calculates an intermediate layer output vector H, the network calculates
the actual output vectors reuse of formula (4) Y.5) The target element dk and yk element vector output vectors are compared to calculate
the error term M outputs of formula (6):
(6))1()( kkkkk yyyd
L error terms are also calculated for the hidden elements of the middle layer, as in equation (7):
(7)
1
0)1(
M
kjkkjjj Whh
6) At the end of the training, save the weights and thresholds in a file. Then you can think of various weights have stabilized, the classifier form. Once again training, training directly from the file export weights and thresholds do not need to be initialized.2.3 Image Processing
On the one hand, digital image processing technology plays a significant role in computer
vision, which help people understand the world. On the other hand, the image can be recognized by human eyes can not be classified by digital image processing pattern recognition techniques. Computer pattern recognition technology can quickly and accurately retrieve, match and identify a variety of things. Digital image processing technology has been widely used in various fields related to national economy and people's livelihood.In the computer, according to how much color and grayscale images can be divided into binary images, gray scale image, the image index and true color RGB images of four basic types. Most image processing software supports four types of images.
(1) Image codingEncoding the image information to meet the requirements of transport and storage.
Encoding can compress the amount of information the image, but the image quality is almost constant. To this end, analog processing techniques can be used, and then encoded by analog-to-digital conversion, but most of them use digital coding techniques. The encoding method has a method of processing an image point by point, and a method of applying a certain transform to an image or encoding based on a region or a feature. Pulse code modulation, differential pulse code modulation, predictive codes, and various transforms are common coding techniques.
(2) Image compressionThe amount of data of an image obtained by digitization is very large, and a typical digital
image usually consists of 500 x 500 or 1000 x 1000 pixels. If it is a dynamic image, it is a larger amount of data. Therefore, image compression is necessary for the storage and transmission of images. There are two types of compression algorithms that lossless and lossy compression. The most common difference in pixel values of adjacent lossless compression algorithms take the time or space, and then encoded. The run code is an example of such a compression code. Lossy compression algorithms mostly use image exchange methods, such as fast Fourier transform or discrete cosine transform on images. The well-known JPEG and MPEG, which have been the international standard for image compression, belong to the lossy compression algorithm. The former is used for still images and the latter for dynamic images. They have been implemented by chips.
(3) Enhanced recoveryThe goal of image enhancement is to improve the quality of the image, such as increasing
contrast, removing blur and noise, correcting geometric distortion, etc. Image restoration is a technique that attempts to estimate the original image when a model of known blur or noise is assumed.The image enhancement method can be divided by a frequency domain method and the spatial domain method. The former image as a kind of two-dimensional signal, its signal based on the two-dimensional Fourier transform enhancement. Low pass filtering (i.e. only low frequency signals) method, a noise figure can be removed; high-pass filtering, edge enhancement and the like may be a high frequency signal, so that the image blur becomes clear. Representative spatial domain algorithms include local averaging and median filtering (taking intermediate pixel values in local neighborhoods), etc., which can be used to remove or attenuate noise. Early digital image restoration also came from the concept of the frequency domain. What modernity takes is an algebraic method of restoring an ideal picture by solving a large system of equations. Image enhancement and restoration for the purpose of improving image quality are widely used for some difficult-to-obtain images or images obtained under severe shooting conditions.
3、Experiments3.1 Image Acquisition
Image acquisition is the conversion of analog image signals into a digital format that can be used by a PC. It is an important part of digital image processing and pattern recognition systems, and is the first link in the system image process. The implementation performance of the image acquisition module limits the performance of each module in the future, and thus determines the performance of the entire system. The main performance requirements of the system for the video acquisition module are: (1) high-speed acquisition (at least 24 frames / sec); (2) the obtained image must have a higher resolution (at least 720X576X24); (3) the computer is completing (1), (2) should take up as little CPU time as possible to leave more CPU time for the computer to do image processing and display.The main properties of the selected image acquisition module performance video card and acquisition software .Performance of the decision, most of the current video card available on the market can satisfy the above three general performance requirements.3.2 Data source and the size of the convolution kernel
This paper uses part of the image data in the ENERGY database as the training set and test set. The convolutional layer has a convolution kernel size of 3 × 3, which is the smallest perceived image quality size, and can be obtained from a point to the center of the pixel. Using a 3x3 minimum convolution kernel size, the output after each convolution process depends only on the spatial content within the local 3x3, and the content outside this range is not convolved.4、Discussion4.1 Energy Area Image Processing
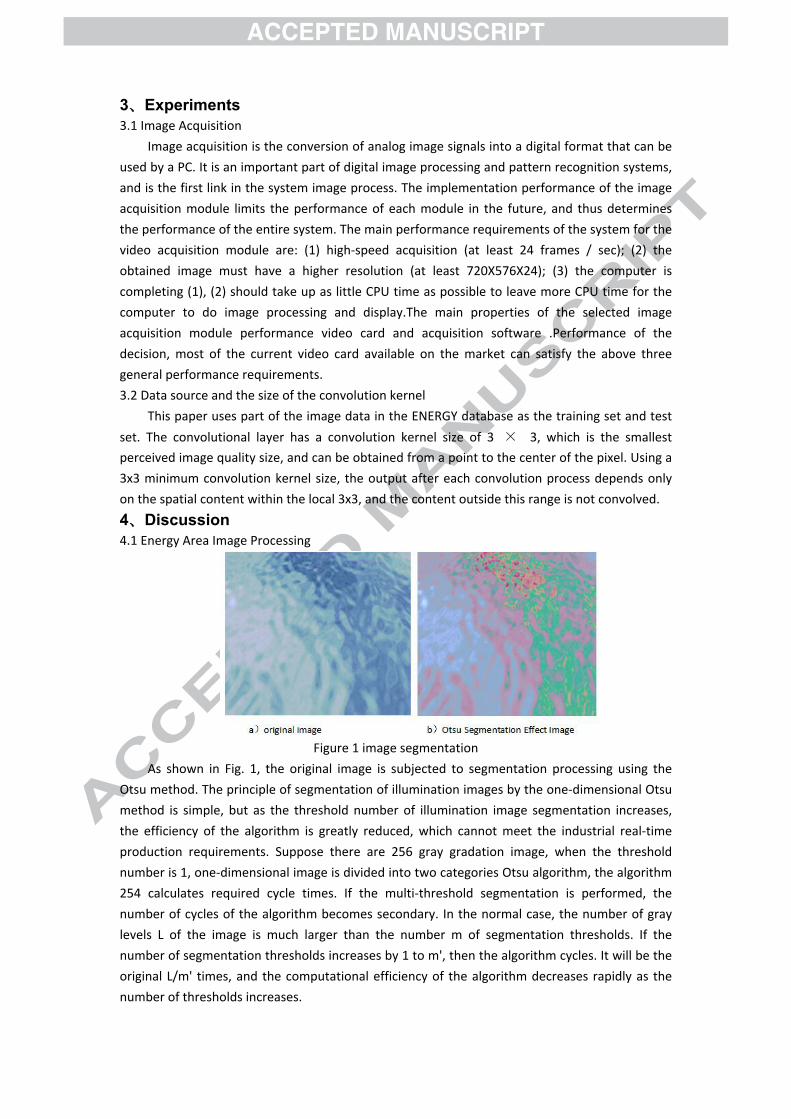
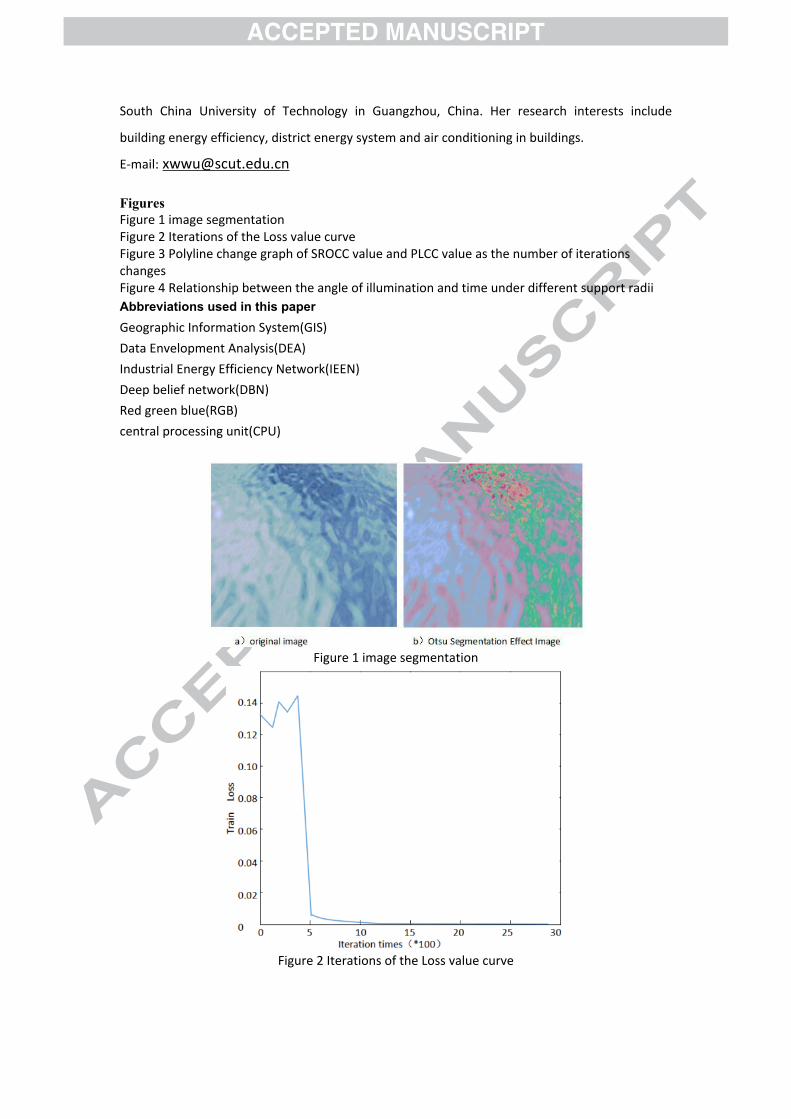
Figure 1 image segmentationAs shown in Fig. 1, the original image is subjected to segmentation processing using the
Otsu method. The principle of segmentation of illumination images by the one-dimensional Otsu method is simple, but as the threshold number of illumination image segmentation increases, the efficiency of the algorithm is greatly reduced, which cannot meet the industrial real-time production requirements. Suppose there are 256 gray gradation image, when the threshold number is 1, one-dimensional image is divided into two categories Otsu algorithm, the algorithm 254 calculates required cycle times. If the multi-threshold segmentation is performed, the number of cycles of the algorithm becomes secondary. In the normal case, the number of gray levels L of the image is much larger than the number m of segmentation thresholds. If the number of segmentation thresholds increases by 1 to m', then the algorithm cycles. It will be the original L/m' times, and the computational efficiency of the algorithm decreases rapidly as the number of thresholds increases.
4.2 Energy Region Quality Evaluation Based on Convolutional Neural Network
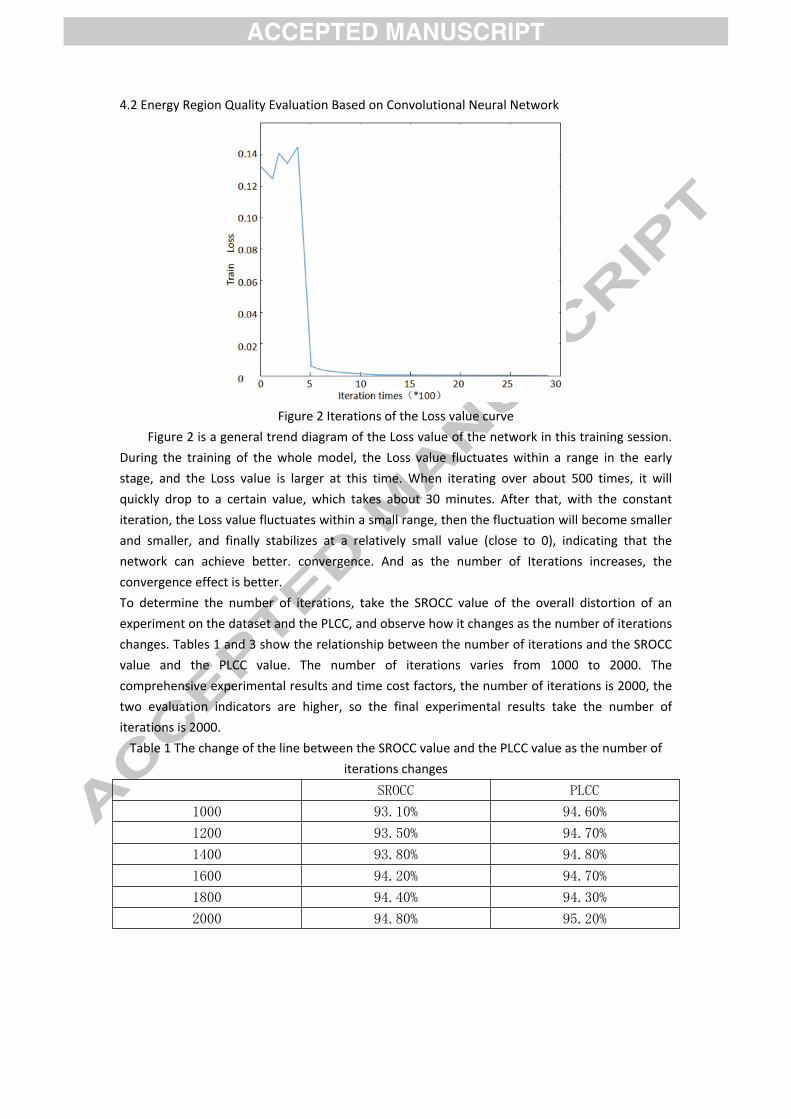
Figure 2 Iterations of the Loss value curveFigure 2 is a general trend diagram of the Loss value of the network in this training session.
During the training of the whole model, the Loss value fluctuates within a range in the early stage, and the Loss value is larger at this time. When iterating over about 500 times, it will quickly drop to a certain value, which takes about 30 minutes. After that, with the constant iteration, the Loss value fluctuates within a small range, then the fluctuation will become smaller and smaller, and finally stabilizes at a relatively small value (close to 0), indicating that the network can achieve better. convergence. And as the number of Iterations increases, the convergence effect is better.To determine the number of iterations, take the SROCC value of the overall distortion of an experiment on the dataset and the PLCC, and observe how it changes as the number of iterations changes. Tables 1 and 3 show the relationship between the number of iterations and the SROCC value and the PLCC value. The number of iterations varies from 1000 to 2000. The comprehensive experimental results and time cost factors, the number of iterations is 2000, the two evaluation indicators are higher, so the final experimental results take the number of iterations is 2000.
Table 1 The change of the line between the SROCC value and the PLCC value as the number of iterations changes
SROCC PLCC
1000 93.10% 94.60%
1200 93.50% 94.70%
1400 93.80% 94.80%
1600 94.20% 94.70%
1800 94.40% 94.30%
2000 94.80% 95.20%
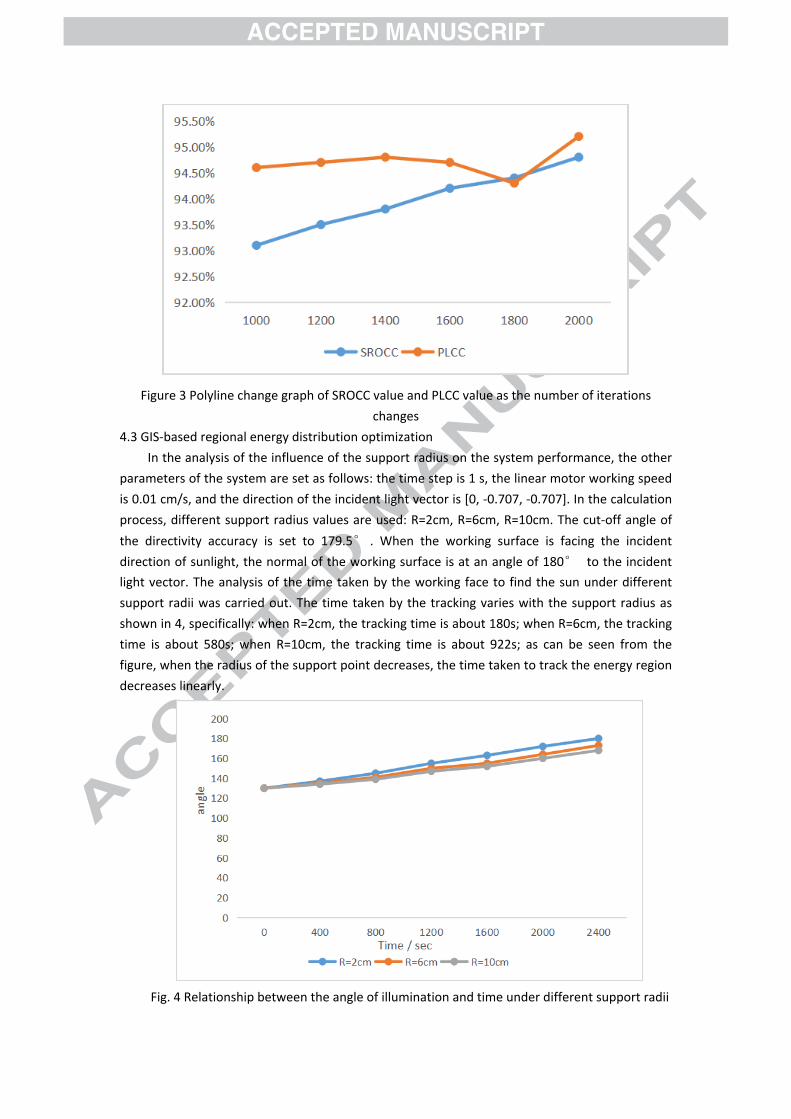
Figure 3 Polyline change graph of SROCC value and PLCC value as the number of iterations changes
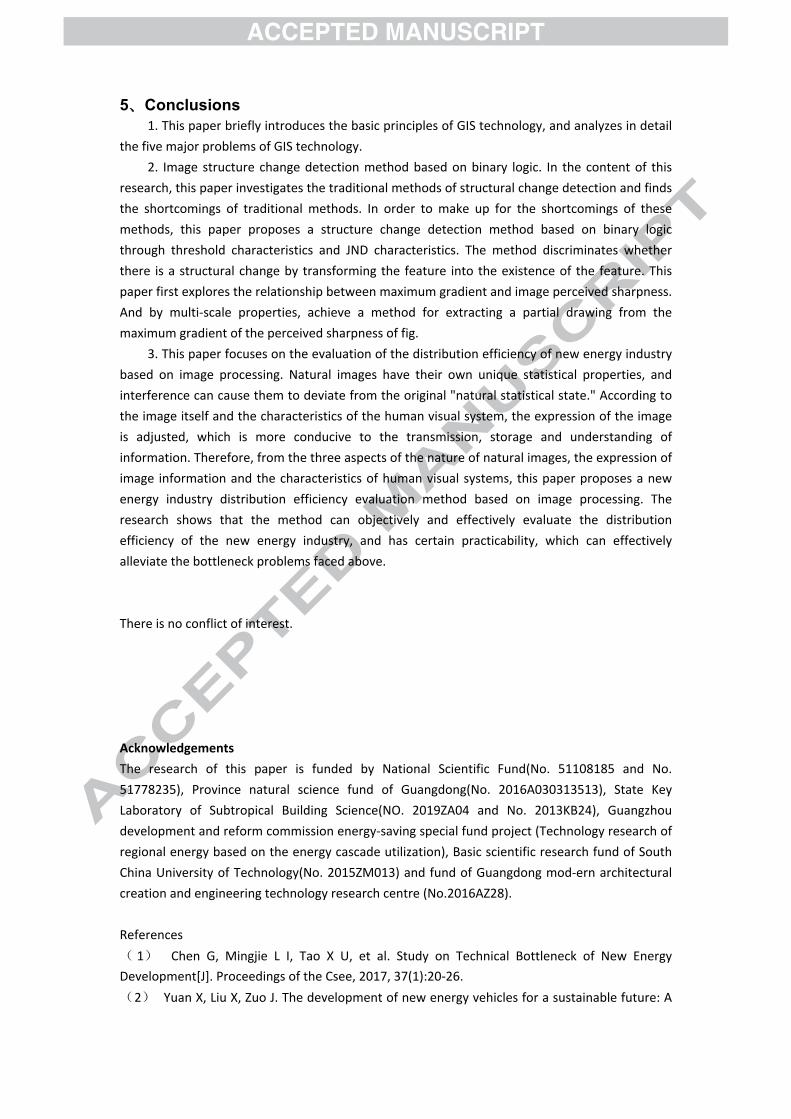
4.3 GIS-based regional energy distribution optimizationIn the analysis of the influence of the support radius on the system performance, the other
parameters of the system are set as follows: the time step is 1 s, the linear motor working speed is 0.01 cm/s, and the direction of the incident light vector is [0, -0.707, -0.707]. In the calculation process, different support radius values are used: R=2cm, R=6cm, R=10cm. The cut-off angle of the directivity accuracy is set to 179.5° . When the working surface is facing the incident direction of sunlight, the normal of the working surface is at an angle of 180° to the incident light vector. The analysis of the time taken by the working face to find the sun under different support radii was carried out. The time taken by the tracking varies with the support radius as shown in 4, specifically: when R=2cm, the tracking time is about 180s; when R=6cm, the tracking time is about 580s; when R=10cm, the tracking time is about 922s; as can be seen from the figure, when the radius of the support point decreases, the time taken to track the energy region decreases linearly.
Fig. 4 Relationship between the angle of illumination and time under different support radii
5、Conclusions1. This paper briefly introduces the basic principles of GIS technology, and analyzes in detail
the five major problems of GIS technology.2. Image structure change detection method based on binary logic. In the content of this
research, this paper investigates the traditional methods of structural change detection and finds the shortcomings of traditional methods. In order to make up for the shortcomings of these methods, this paper proposes a structure change detection method based on binary logic through threshold characteristics and JND characteristics. The method discriminates whether there is a structural change by transforming the feature into the existence of the feature. This paper first explores the relationship between maximum gradient and image perceived sharpness. And by multi-scale properties, achieve a method for extracting a partial drawing from the maximum gradient of the perceived sharpness of fig.
3. This paper focuses on the evaluation of the distribution efficiency of new energy industry based on image processing. Natural images have their own unique statistical properties, and interference can cause them to deviate from the original "natural statistical state." According to the image itself and the characteristics of the human visual system, the expression of the image is adjusted, which is more conducive to the transmission, storage and understanding of information. Therefore, from the three aspects of the nature of natural images, the expression of image information and the characteristics of human visual systems, this paper proposes a new energy industry distribution efficiency evaluation method based on image processing. The research shows that the method can objectively and effectively evaluate the distribution efficiency of the new energy industry, and has certain practicability, which can effectively alleviate the bottleneck problems faced above.
There is no conflict of interest.
AcknowledgementsThe research of this paper is funded by National Scientific Fund(No. 51108185 and No. 51778235), Province natural science fund of Guangdong(No. 2016A030313513), State Key Laboratory of Subtropical Building Science(NO. 2019ZA04 and No. 2013KB24), Guangzhou development and reform commission energy-saving special fund project (Technology research of regional energy based on the energy cascade utilization), Basic scientific research fund of South China University of Technology(No. 2015ZM013) and fund of Guangdong mod-ern architectural creation and engineering technology research centre (No.2016AZ28).
References( 1) Chen G, Mingjie L I, Tao X U, et al. Study on Technical Bottleneck of New Energy Development[J]. Proceedings of the Csee, 2017, 37(1):20-26.(2) Yuan X, Liu X, Zuo J. The development of new energy vehicles for a sustainable future: A
review[J]. Renewable & Sustainable Energy Reviews, 2015, 42(C):298-305.( 3) Javaid N, Abbas Z, Fareed M S, et al. M-ATTEMPT: A New Energy-Efficient Routing Protocol for Wireless Body Area Sensor Networks ☆[J]. International Journal of Distributed Sensor Networks, 2014, 2014(6):224-231.(4) Schot J, Kanger L, Verbong G. The roles of users in shaping transitions to new energy systems[J]. Nature Energy, 2016, 1(5):16054.(5) Koo C, Hong T, Lee M, et al. Development of a new energy efficiency rating system for existing residential buildings ☆[J]. Energy Policy, 2014, 68(5):218-231.(6) Wang Q, Ye H, Sun L, et al. Two-stage innovation efficiency of new energy enterprises in China: A non-radial DEA approach[J]. Technological Forecasting & Social Change, 2016, 112:254-261.(7) Zhu G, Bai P, Chen J, et al. Triboelectric nanogenerators as a new energy technology: From fundamentals, devices, to applications[J]. Nano Energy, 2015, 14:126-138.(8) Zhong L W, Chen J, Long L. Progress in triboelectric nanogenerators as a new energy technology and self-powered sensors[J]. Energy & Environmental Science, 2015, 8(8):2250-2282.( 9) Gong, Huiming, Wang. New energy vehicles in China: policies, demonstration, and progress[J]. Mitigation & Adaptation Strategies for Global Change, 2013, 18(2):207-228.(10) Wang Q, Ye H, Sun L, et al. Two-stage innovation efficiency of new energy enterprises in China: A non-radial DEA approach[J]. Technological Forecasting & Social Change, 2016, 112:254-261.( 11) Liang S, Zhang T. Interactions of energy technology development and new energy exploitation with water technology development in China[J]. Energy, 2011, 36(12):6960-6966.( 12) Kimble C, Wang H. China's new energy vehicles: value and innovation[J]. Journal of Business Strategy, 2013, 34(2):13-20.(13) Lin J, Rosenquist G. Stay cool with less work: China's new energy-efficiency standards for air conditioners[J]. Energy Policy, 2008, 36(3):1090-1095.(14) Zhang J. R&D for Environmental Innovation and Supportive Policy: The Implications for New Energy Automobile Industry in China[J]. Energy Procedia, 2011, 5:1003-1007.(15) Li W, Long R, Chen H. Consumers’ evaluation of national new energy vehicle policy in China: An analysis based on a four paradigm model[J]. Energy Policy, 2016, 99:33-41.( 16) Chen, Liuqin. China's New Energy Vehicle Industry:Problems and Challenges[J]. Electricity, 2012, 33(2):6-9.(17) Liu S, Mao X. Estimation and Comparison of Greenhouse Gas Mitigation Potential of New Energy by Life Cycle Assessment in China[J]. Progressus Inquisitiones De Mutatione Climatis, 2012, 8(1):48-53.(18) Shao W, Lin X. Research on new energy technology patent strategy in China[J]. Energy Procedia, 2011, 5(22):624-628.(19) Xia B, Yang L. Analysis on the Impact of Tax Policy over China's New Energy Industry Development[J]. Physics Procedia, 2012, 25:1277-1284.(20) Xiang Z, Xue B. Incentive policies from 2006 to 2016 and new energy vehicle adoption in 2010–2020 in China[J]. Renewable & Sustainable Energy Reviews, 2017, 70:24-43.(21) Hui S, Wei X P. Market characteristics of new energy supply in China[J]. Procedia Earth & Planetary Science, 2009, 1(1):1712-1716.(22) Wei Y M, Liao H, Fan Y. An empirical analysis of energy efficiency in China's iron and

steel sector[J]. Energy, 2007, 32(12):2262-2270.(23) Eichinger F T, Wagner E D. Blast furnace coal injection: North American market, PCI system design project overview -- Edison Energy/Great Lakes Steel[J]. Fuel & Energy Abstracts, 1996(6):426.(24) Li Y, Yao G, Zeng H, et al. Establishment of evaluation system and primary selection of tree species in ecological riparian shelter forest along Yangtze River in Jiangsu Province.[J]. Journal of Plant Resources & Environment, 2010, 19(3):73-78.(25) Hanley N D, Mcgregor P G, Swales J K, et al. The impact of a stimulus to energy efficiency on the economy and the environment: A regional computable general equilibrium analysis[J]. Renewable Energy, 2006, 31(2):161-171.(26) Qiu C, Wang G. New evaluation methodology of regenerative braking contribution to energy efficiency improvement of electric vehicles[J]. Energy Conversion & Management, 2016, 119:389-398.( 27) Backman F. Local knowledge creation with the use of industrial energy efficiency networks (IEENs): A Swedish case study[J]. Energy Research & Social Science, 2018, 42:147-154.
Zhuolun Chen was born in Guangzhou, China in 1980. He received his Ph.D.
in Building Science and Architectural Engineering from South China University of Technology. His research interests include urban and building energy efficiency, district energy system, energy mapping and planning and integrated building performance for green building.E-mail: [email protected]
Xiaowei Wu received the Bachelor degree from Qinghua University, P.R.
China. She works in the Architectural Design and Research Institute, School of Architecture,
South China University of Technology in Guangzhou, China. Her research interests include
building energy efficiency, district energy system and air conditioning in buildings.
E-mail: [email protected]
FiguresFigure 1 image segmentationFigure 2 Iterations of the Loss value curveFigure 3 Polyline change graph of SROCC value and PLCC value as the number of iterations changesFigure 4 Relationship between the angle of illumination and time under different support radiiAbbreviations used in this paperGeographic Information System(GIS)Data Envelopment Analysis(DEA)Industrial Energy Efficiency Network(IEEN)Deep belief network(DBN)Red green blue(RGB)central processing unit(CPU)
Figure 1 image segmentation
Figure 2 Iterations of the Loss value curve

Figure 3 Polyline change graph of SROCC value and PLCC value as the number of iterations changes
Figure 4 Relationship between the angle of illumination and time under different support radii
Related Documents