Technology and Investment, 2018, 9, 137-153 http://www.scirp.org/journal/ti ISSN Online: 2150-4067 ISSN Print: 2150-4059 DOI: 10.4236/ti.2018.93010 Jul. 31, 2018 137 Technology and Investment Research on Innovation Posture of Automated Driving Technology Based on Patentometrics Zhengang Zhang, Xueyao Chen, Jieming Huang School of Business Administration, South China University of Technology, Guangzhou, China Abstract As an emerging technology that integrates multidisciplinary and multi- technology, Automated Driving is triggering a new round of scientific and technological revolution and industrial transformation, thus attracting the attention of all countries in the world. Based on the Derwent patent database, this paper col- lects relevant patent information related to Automated Driving from 1998 to 2016 by using software tools such as patent measurement and CiteSpace, and empirically analyzes the temporal distribution, structural distribution, hotspot and frontier technologies, and geographical distribution of automated driving. The study found that automated vehicles have rapidly developing in the past 5 years, which indicates that the technical innovation of automated driving is in an emerging stage. There are geographical differences in innovative activities and capabilities in the field of automated driving. The United States has the absolute competitive advantages, while each country has different technologi- cal innovation capabilities in different technical fields. Finally, this paper puts forward some suggestions of our country to develop the technology and in- dustry of automated driving in the future. Keywords Automated Driving, Patentometrics, Knowledge Map, Citespace, Technological Innovation Posture 1. Introduction With the rapid development of information technologies such as Big Data, Ar- tificial Intelligence and Internet of Things, the emerging multi-disciplinary and interdisciplinary emerging technologies are setting off a new wave of technology. Automated Driving is a technology that enables vehicles to travel safely and re- liably on the road with on-board sensors, artificial intelligence, visual compu- How to cite this paper: Zhang, Z.G., Chen, X.Y. and Huang, J.M. (2018) Research on Innovation Posture of Automated Driving Technology Based on Patentometrics. Tech- nology and Investment, 9, 137-153. https://doi.org/10.4236/ti.2018.93010 Received: March 1, 2018 Accepted: July 28, 2018 Published: July 31, 2018 Copyright © 2018 by authors and Scientific Research Publishing Inc. This work is licensed under the Creative Commons Attribution International License (CC BY 4.0). http://creativecommons.org/licenses/by/4.0/ Open Access

Welcome message from author
This document is posted to help you gain knowledge. Please leave a comment to let me know what you think about it! Share it to your friends and learn new things together.
Transcript
Technology and Investment, 2018, 9, 137-153 http://www.scirp.org/journal/ti
ISSN Online: 2150-4067 ISSN Print: 2150-4059
DOI: 10.4236/ti.2018.93010 Jul. 31, 2018 137 Technology and Investment
Research on Innovation Posture of Automated Driving Technology Based on Patentometrics
Zhengang Zhang, Xueyao Chen, Jieming Huang
School of Business Administration, South China University of Technology, Guangzhou, China
Abstract As an emerging technology that integrates multidisciplinary and multi-technology, Automated Driving is triggering a new round of scientific and technological revolution and industrial transformation, thus attracting the attention of all countries in the world. Based on the Derwent patent database, this paper col-lects relevant patent information related to Automated Driving from 1998 to 2016 by using software tools such as patent measurement and CiteSpace, and empirically analyzes the temporal distribution, structural distribution, hotspot and frontier technologies, and geographical distribution of automated driving. The study found that automated vehicles have rapidly developing in the past 5 years, which indicates that the technical innovation of automated driving is in an emerging stage. There are geographical differences in innovative activities and capabilities in the field of automated driving. The United States has the absolute competitive advantages, while each country has different technologi-cal innovation capabilities in different technical fields. Finally, this paper puts forward some suggestions of our country to develop the technology and in-dustry of automated driving in the future.
Keywords Automated Driving, Patentometrics, Knowledge Map, Citespace, Technological Innovation Posture
1. Introduction
With the rapid development of information technologies such as Big Data, Ar-tificial Intelligence and Internet of Things, the emerging multi-disciplinary and interdisciplinary emerging technologies are setting off a new wave of technology. Automated Driving is a technology that enables vehicles to travel safely and re-liably on the road with on-board sensors, artificial intelligence, visual compu-
How to cite this paper: Zhang, Z.G., Chen, X.Y. and Huang, J.M. (2018) Research on Innovation Posture of Automated Driving Technology Based on Patentometrics. Tech-nology and Investment, 9, 137-153. https://doi.org/10.4236/ti.2018.93010 Received: March 1, 2018 Accepted: July 28, 2018 Published: July 31, 2018 Copyright © 2018 by authors and Scientific Research Publishing Inc. This work is licensed under the Creative Commons Attribution International License (CC BY 4.0). http://creativecommons.org/licenses/by/4.0/
Open Access

Z. G. Zhang et al.
DOI: 10.4236/ti.2018.93010 138 Technology and Investment
ting, and global positioning systems that can plan routes and precisely control the steering and speed of the vehicle. The core technologies of automated driving include positioning and navigation, environmental perception, planning control, etc., which have the advantages of predictable behavior, rapid response and ac-curate perception. As a cutting-edge technology with high comprehensiveness and high R & D cost, automated driving can be effectively applied in the fields of intelligent transportation, intelligent logistics, agricultural automation, mining and military and bring huge economic and environmental benefits. In 2015, the State Council issued “Made in China 2025”, clearly pointing out that it is neces-sary to master the overall Automated Driving technology and various key tech-nologies by 2025 [1]. The “13th Five-Year Strategic Industrial Emerging Industry Development Plan” promulgated on December 19, 2016 sets forth the goal of accelerating the application of intelligent technologies in electric vehicles and developing smart automated vehicles [2]. So it’s necessary to accelerate the de-velopment of automated driving technology, to strengthen the top-level design, build a sound system of innovation, speed up technological innovation, and ad-vance the advent of the era of automated driving.
At present, however, most of the research on automated driving focuses on the theory and application research of the technology itself. Few scholars analyze the innovation characteristics and trend of Automated Driving technology from the perspective of patent measurement. As an open technical information re-source, patent data, covering almost 90% of the world’s technical information, is scientific, authoritative and time-efficient, and is the first choice for many scho-lars to analyze current and future technological trends (CHENC, 2006). Based on co-citation analysis theory and routing algorithm, patentometrics measures information in specific fields, analyzes evolution paths and important nodes in specific fields, and explores the dynamic mechanism of knowledge evolution and the forefront trend with visual methods. Besides, FABRY B puts forward the “Relative Patent Position (RPP)—Revealed Patent Advantage (RPA)” as the combination of indicators to evaluate and identify the core competition in the various competitors force, and then to analysis of innovation in specific areas. Therefore, based on the Derwent patent database as the analysis data source, this paper analyzes the patent distribution features of the technology by using pa-tented measurement and CiteSpace software tools and other methods to reveal the development trend of global automated driving technology and the advan-tages and disadvantages of technological innovation in various countries, but al-so provide scientific decision-making basis for the development of automated driving in our country.
2. Data Sources and Research Methods 2.1. Data Sources
The research data of this paper come from Derwent Innovation Index (DII). The reason why choosing this database is that the Derwent Patent Database is a
Z. G. Zhang et al.
DOI: 10.4236/ti.2018.93010 139 Technology and Investment
Web-based patent information database jointly launched by Thomson Derwent and Thomson ISI that incorporates over 40 patent publications agency about more than 30 million pieces of patent information, covering a wide range from 1963 till now [3]. Besides, the patent information covered by this database is highly scientific and highly authoritative. Therefore, using Derwent database as the source of data in this article can ensure the adequacy of data, reliability, re-search rigor and accuracy. Based on the retrieval results of Derwent Patent Index from Web Of Science, the article uses “keyword search” TS = (“Self-Driving car *” OR “Automated car *” OR “Automated vehicle *” OR “Self-piloting automo-bile *” OR “automated car *” OR “automated vehicle *” OR “automated car *” OR “self-driving vehicle *” OR “self-driving automobile *” OR “automated ve-hicle *” OR “self-piloting vehicle *”) as the search content, the “time range” is set as “1998-2016” and the search time is November 27, 2017. And a total of 2137 data were retrieved. The retrieval strategy is shown in Table 1.
2.2. Research Methods 2.2.1. Visual Analysis Based on patented analysis, this study draws a patent map of Automated Driving using CiteSpace, an information visualization tool, to identify and analyze the hot technologies, key technical fields and development trends of Automated Driving. Patent measurement methods can intuitively demonstrate the regular pattern and characteristics of technological innovation [4]. Combining with the scientific knowledge map, it can help researchers and audiences more intuitively understand and predict the development trend in the field of technological in-novation. CiteSpace is an information visualization software developed by using Java language [5].
2.2.2. Patent Portfolio Analysis Then, this study draws on the concept of patent portfolio analysis through the establishment of “Relative Patent Position—Revealed Patent Advantage” of the combination of indicators to monitor and evaluate the automated driving tech-nology in the world countries, identify the core competition in the various com-petitors force, and then to analysis of innovation in specific areas [6]. Among them, the relative patent position (RPP) = the number of patentee’s patent/the Table 1. Automated driving technology patent search strategy.
Data Sources Derwent Innovation Index
Patent Search Terms
TS = (“Self-Driving car*” OR “Automated car*” OR “Automated vehicle*” OR “Self-piloting automobile*” OR “automated car*” OR “automated
vehicle*” OR “automated car*” OR “self-driving vehicle*” OR “self-driving automobile*” OR “automated vehicle*” OR “self-piloting vehicle*”)
Time Range 1998-2016
Bibliographic Data “Full record”
Patents Count 2137
Z. G. Zhang et al.
DOI: 10.4236/ti.2018.93010 140 Technology and Investment
number of the most prolific competitors in the technology area of patent own-ership, used to assess the technical gap with the strongest competitors. The Re-vealed patent advantage (RPA) is used to reveal the technological comparative advantage of the patentee in different technical fields, and is measured by the patentee’s distribution of patent activity in each technical field [7].
100 tanh lnij ij
i
ij ijj ij
RPAP P
P P
× =
∑∑ ∑
.
Pij denotes the patent application amount of the patentee i in the technical field j. When RPA > 0, patentee i has a technological comparative advantage in technic-al area j, and the larger the value, the stronger the patentee’s innovative activities and capabilities in the field [8] [9].
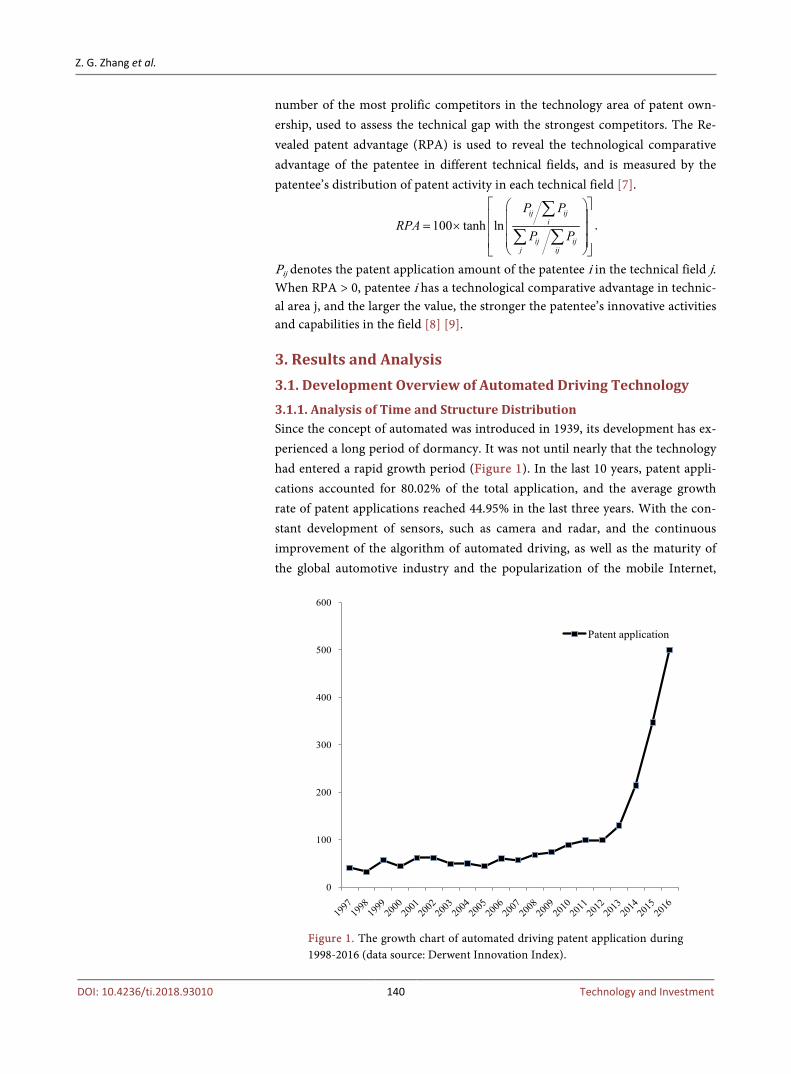
3. Results and Analysis 3.1. Development Overview of Automated Driving Technology 3.1.1. Analysis of Time and Structure Distribution Since the concept of automated was introduced in 1939, its development has ex-perienced a long period of dormancy. It was not until nearly that the technology had entered a rapid growth period (Figure 1). In the last 10 years, patent appli-cations accounted for 80.02% of the total application, and the average growth rate of patent applications reached 44.95% in the last three years. With the con-stant development of sensors, such as camera and radar, and the continuous improvement of the algorithm of automated driving, as well as the maturity of the global automotive industry and the popularization of the mobile Internet,
Figure 1. The growth chart of automated driving patent application during 1998-2016 (data source: Derwent Innovation Index).
0
100
200
300
400
500
600
Patent application

Z. G. Zhang et al.
DOI: 10.4236/ti.2018.93010 141 Technology and Investment
various global enterprises and research institutions have engaged in related technology research and development. All of these have accelerated the indu-strialization of automated driving technology.
According to the results of a patent search and the combination of automated driving related papers, reports and other documents, we classify the automated technology in five technical areas, including: environmental perception, precise positioning, path planning, motion control, network communication, such as the specific interpretation of the Table 2 shows [10].
Specifically, the proportion of patents in each subdivision technology field of automated vehicles is shown in Figure 2. It is not difficult to see that the global technological innovation activities in the field of automated driving are different. The number of patent applications in path planning and precision positioning technology accounts for more than half of the total number of patents. Among them, the technology innovation activities in the field of path planning are more active, accounting for 28% of the patents, which ranks among the top five in the field of automated driving subdivision. The reason may be accompanied by the development of computer algorithm technology, navigation and other technolo-gies. As the central decision-making system of automated vehicles, the path planning has received increasing attention. The proportion of patent in precision positioning technology is 26%, and it is in the position of second. It shows that the importance of centimeter level position estimation based on high precision map in the process of vehicle driving is more and more valued by a company, such as Google, Baidu and Tesla. The number of patent applications in the field of environmental perception, movement control and network communication technology accounted for 19%, 16% and 11% respectively, and the technological innovation activities were relatively stable.
In order to explore the time distribution and evolution process of technologi-cal innovation in the various fields of automated, we analyzed the related patent changes in various fields, such as Figure 3. As can be seen from the figure, 2010 Table 2. Subdivision technical field.
Technical field Meaning
Environmental perception Collection and processing of environmental information, including road boundary monitoring, vehicle detection, pedestrian recognition, etc.
Precise positioning Precise measurement of position through sensor information, GPS, and high-precision maps, etc.
Path planning
Based on the perception and location of environmental information, the route can be planned according to the search algorithm to achieve automated navigation, which is the central decision system of the automated driving vehicle.
Motion control Control the vehicle’s driving track on the basis of path planning, including longitudinal control and lateral control.
Network communication Based on the car network, inter-car network and car-mounted mobile Internet, the wireless communication and information exchange and interconnection are carried out between cars and cars, roads and clouds.

Z. G. Zhang et al.
DOI: 10.4236/ti.2018.93010 142 Technology and Investment
Figure 2. The proportion of patent applications in various technical fields (data source: Derwent Innovation Index).
Figure 3. The trend of patent growth in various technical fields during 1998-2016 (data source: Derwent Innovation Index). is a turning point for automated driving technology activities. Before this, patent filings and patent growth rates in various segments were at a low level. After that, the technological invention activities in various fields showed a surge trend. Among them, the patents in the field of precision positioning started relatively early, mainly due to the fact that GPS and map technologies, as their basic tech-nologies, developed earlier and maintained a leading growth. However, the trend of sharp increase in recent five years may be due to the phased breakthrough achieved by high-precision map technology in recent years, which has promoted the innovation of precision positioning technology. The trend of patent growth in the field of path planning is basically the same as that of precise positioning. On the one hand, the precision positioning has been maturing in recent years as the underlying technology of path planning; on the other hand, the maturity of path search algorithms such as neural networks, fuzzy logic and convolution, has further promoted the development of decision-making and planning technology.
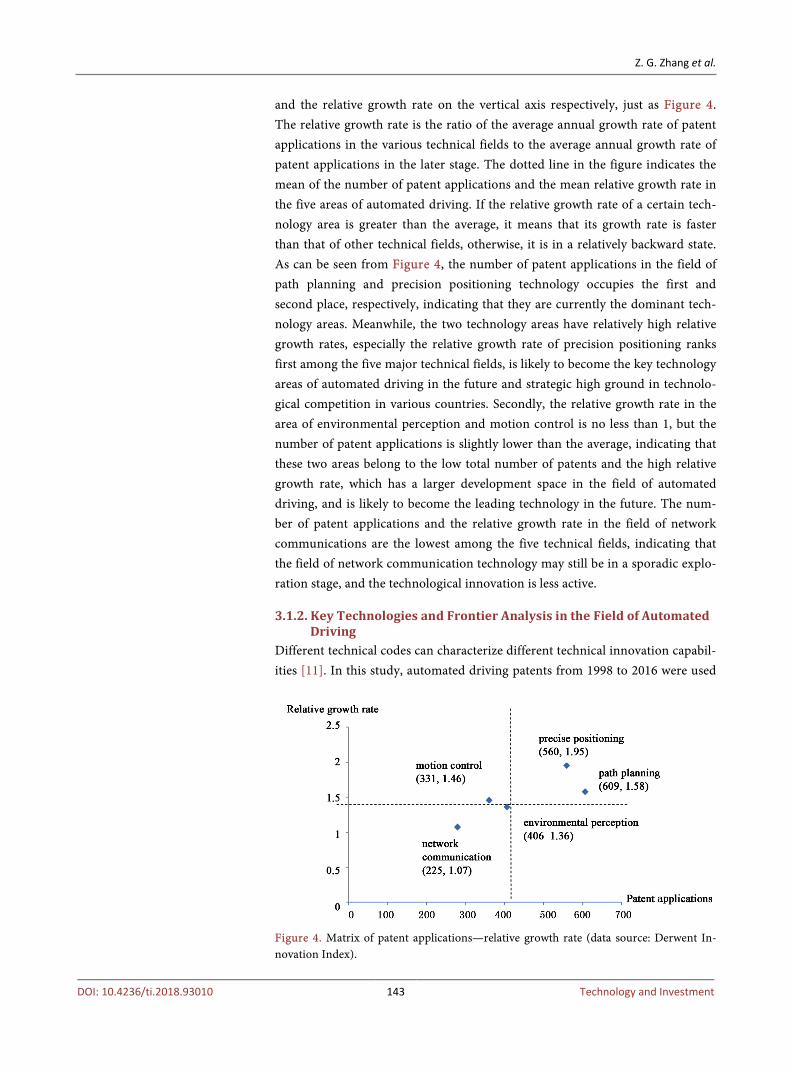
To further analyze the growth of the five major areas of automated driving, we use two-dimensional matrices to analyze the numbers of patent applications and relative growth rates in all areas of automated driving during 2008-2016. We plot the number of patents in each area of automated driving on the horizontal axis
19%
28%
16%
26%
11%environmental perception
path planning
movement control
precision positioning
network communication
0
20
40
60
80
100
120
140
160
180
200
Year
environmental perceptionpath planning
movement control
precision positioningnetwork communication
Patent applications
Z. G. Zhang et al.
DOI: 10.4236/ti.2018.93010 143 Technology and Investment
and the relative growth rate on the vertical axis respectively, just as Figure 4. The relative growth rate is the ratio of the average annual growth rate of patent applications in the various technical fields to the average annual growth rate of patent applications in the later stage. The dotted line in the figure indicates the mean of the number of patent applications and the mean relative growth rate in the five areas of automated driving. If the relative growth rate of a certain tech-nology area is greater than the average, it means that its growth rate is faster than that of other technical fields, otherwise, it is in a relatively backward state. As can be seen from Figure 4, the number of patent applications in the field of path planning and precision positioning technology occupies the first and second place, respectively, indicating that they are currently the dominant tech-nology areas. Meanwhile, the two technology areas have relatively high relative growth rates, especially the relative growth rate of precision positioning ranks first among the five major technical fields, is likely to become the key technology areas of automated driving in the future and strategic high ground in technolo-gical competition in various countries. Secondly, the relative growth rate in the area of environmental perception and motion control is no less than 1, but the number of patent applications is slightly lower than the average, indicating that these two areas belong to the low total number of patents and the high relative growth rate, which has a larger development space in the field of automated driving, and is likely to become the leading technology in the future. The num-ber of patent applications and the relative growth rate in the field of network communications are the lowest among the five technical fields, indicating that the field of network communication technology may still be in a sporadic explo-ration stage, and the technological innovation is less active.
3.1.2. Key Technologies and Frontier Analysis in the Field of Automated Driving
Different technical codes can characterize different technical innovation capabil-ities [11]. In this study, automated driving patents from 1998 to 2016 were used
Figure 4. Matrix of patent applications—relative growth rate (data source: Derwent In-novation Index).
Z. G. Zhang et al.
DOI: 10.4236/ti.2018.93010 144 Technology and Investment
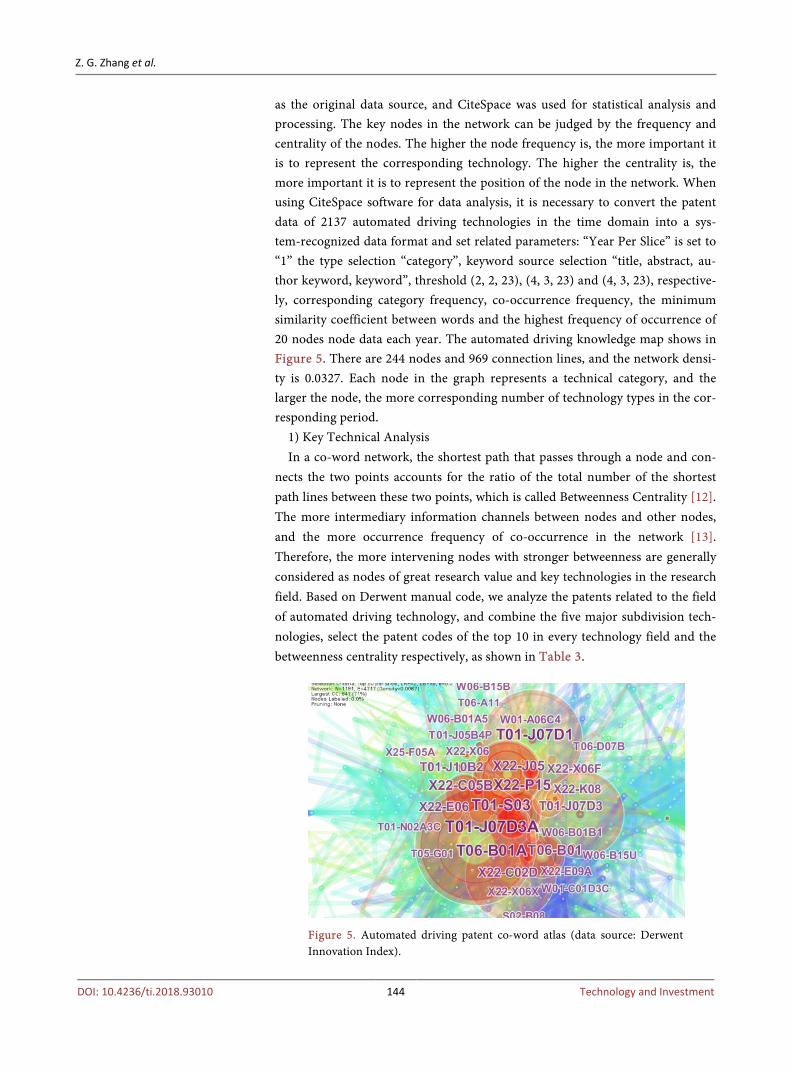
as the original data source, and CiteSpace was used for statistical analysis and processing. The key nodes in the network can be judged by the frequency and centrality of the nodes. The higher the node frequency is, the more important it is to represent the corresponding technology. The higher the centrality is, the more important it is to represent the position of the node in the network. When using CiteSpace software for data analysis, it is necessary to convert the patent data of 2137 automated driving technologies in the time domain into a sys-tem-recognized data format and set related parameters: “Year Per Slice” is set to “1” the type selection “category”, keyword source selection “title, abstract, au-thor keyword, keyword”, threshold (2, 2, 23), (4, 3, 23) and (4, 3, 23), respective-ly, corresponding category frequency, co-occurrence frequency, the minimum similarity coefficient between words and the highest frequency of occurrence of 20 nodes node data each year. The automated driving knowledge map shows in Figure 5. There are 244 nodes and 969 connection lines, and the network densi-ty is 0.0327. Each node in the graph represents a technical category, and the larger the node, the more corresponding number of technology types in the cor-responding period.
1) Key Technical Analysis In a co-word network, the shortest path that passes through a node and con-
nects the two points accounts for the ratio of the total number of the shortest path lines between these two points, which is called Betweenness Centrality [12]. The more intermediary information channels between nodes and other nodes, and the more occurrence frequency of co-occurrence in the network [13]. Therefore, the more intervening nodes with stronger betweenness are generally considered as nodes of great research value and key technologies in the research field. Based on Derwent manual code, we analyze the patents related to the field of automated driving technology, and combine the five major subdivision tech-nologies, select the patent codes of the top 10 in every technology field and the betweenness centrality respectively, as shown in Table 3.
Figure 5. Automated driving patent co-word atlas (data source: Derwent Innovation Index).
Z. G. Zhang et al.
DOI: 10.4236/ti.2018.93010 145 Technology and Investment
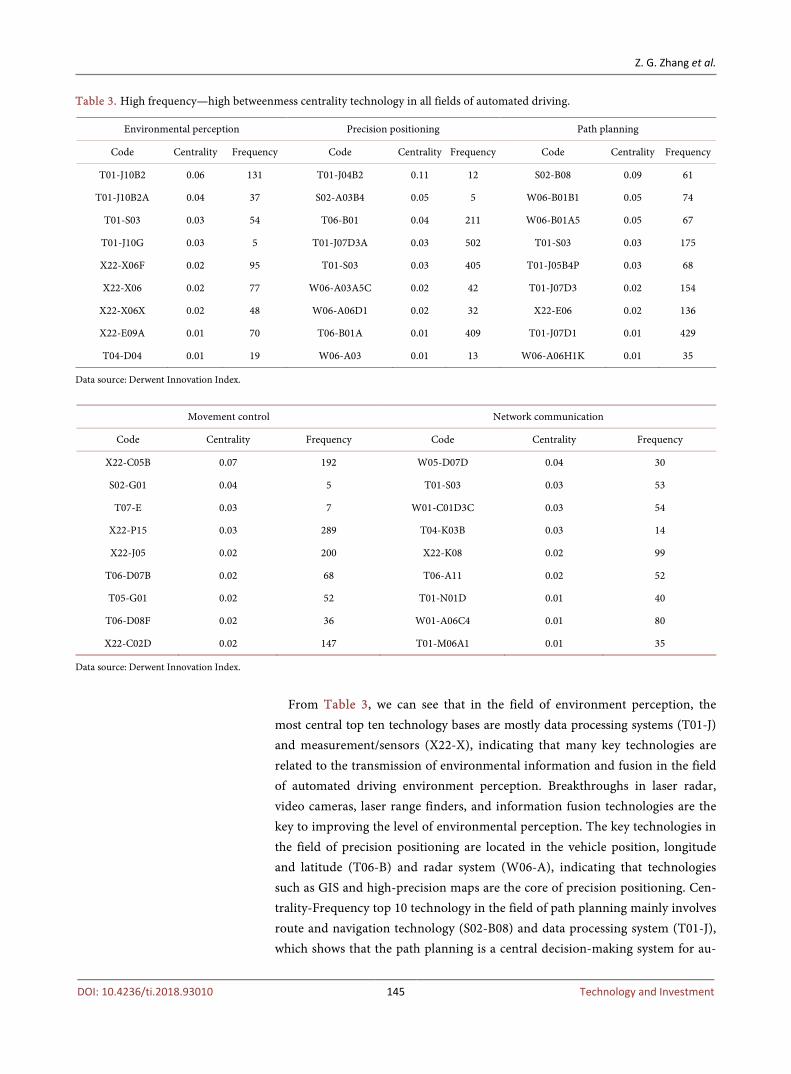
Table 3. High frequency—high betweenmess centrality technology in all fields of automated driving.
Environmental perception Precision positioning Path planning
Code Centrality Frequency Code Centrality Frequency Code Centrality Frequency
T01-J10B2 0.06 131 T01-J04B2 0.11 12 S02-B08 0.09 61
T01-J10B2A 0.04 37 S02-A03B4 0.05 5 W06-B01B1 0.05 74
T01-S03 0.03 54 T06-B01 0.04 211 W06-B01A5 0.05 67
T01-J10G 0.03 5 T01-J07D3A 0.03 502 T01-S03 0.03 175
X22-X06F 0.02 95 T01-S03 0.03 405 T01-J05B4P 0.03 68
X22-X06 0.02 77 W06-A03A5C 0.02 42 T01-J07D3 0.02 154
X22-X06X 0.02 48 W06-A06D1 0.02 32 X22-E06 0.02 136
X22-E09A 0.01 70 T06-B01A 0.01 409 T01-J07D1 0.01 429
T04-D04 0.01 19 W06-A03 0.01 13 W06-A06H1K 0.01 35
Data source: Derwent Innovation Index.
Movement control Network communication
Code Centrality Frequency Code Centrality Frequency
X22-C05B 0.07 192 W05-D07D 0.04 30
S02-G01 0.04 5 T01-S03 0.03 53
T07-E 0.03 7 W01-C01D3C 0.03 54
X22-P15 0.03 289 T04-K03B 0.03 14
X22-J05 0.02 200 X22-K08 0.02 99
T06-D07B 0.02 68 T06-A11 0.02 52
T05-G01 0.02 52 T01-N01D 0.01 40
T06-D08F 0.02 36 W01-A06C4 0.01 80
X22-C02D 0.02 147 T01-M06A1 0.01 35
Data source: Derwent Innovation Index.
From Table 3, we can see that in the field of environment perception, the
most central top ten technology bases are mostly data processing systems (T01-J) and measurement/sensors (X22-X), indicating that many key technologies are related to the transmission of environmental information and fusion in the field of automated driving environment perception. Breakthroughs in laser radar, video cameras, laser range finders, and information fusion technologies are the key to improving the level of environmental perception. The key technologies in the field of precision positioning are located in the vehicle position, longitude and latitude (T06-B) and radar system (W06-A), indicating that technologies such as GIS and high-precision maps are the core of precision positioning. Cen-trality-Frequency top 10 technology in the field of path planning mainly involves route and navigation technology (S02-B08) and data processing system (T01-J), which shows that the path planning is a central decision-making system for au-
Z. G. Zhang et al.
DOI: 10.4236/ti.2018.93010 146 Technology and Investment
tomated driving. And the breakthrough of algorithmic technology will affect the accuracy and intelligence of path planning. High-frequency-high-center technology in motion control mainly belongs to the field of automotive elec-tronics such as braking and steering (X22-C). The key technologies in net-work communication mainly involve data transmission and communication (X22-K08).
2) Cutting-Edge Technology Identification By using the word frequency detection technology provided by CiteSpace
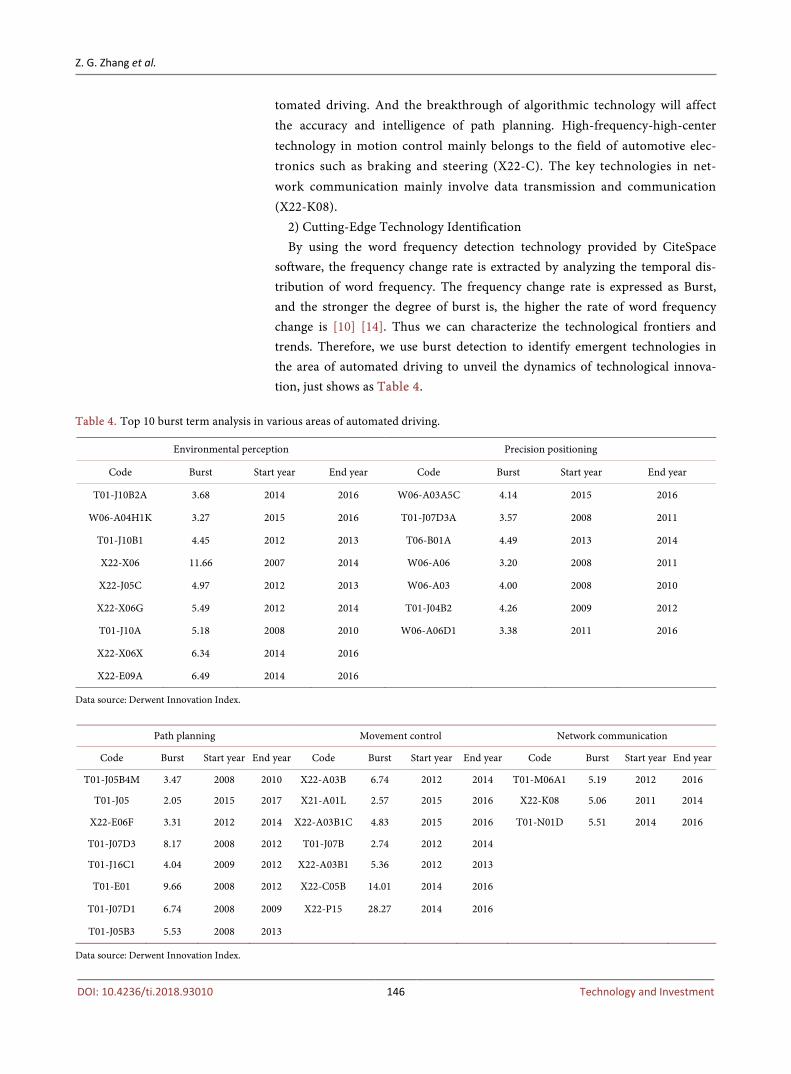
software, the frequency change rate is extracted by analyzing the temporal dis-tribution of word frequency. The frequency change rate is expressed as Burst, and the stronger the degree of burst is, the higher the rate of word frequency change is [10] [14]. Thus we can characterize the technological frontiers and trends. Therefore, we use burst detection to identify emergent technologies in the area of automated driving to unveil the dynamics of technological innova-tion, just shows as Table 4.
Table 4. Top 10 burst term analysis in various areas of automated driving.
Environmental perception Precision positioning
Code Burst Start year End year Code Burst Start year End year
T01-J10B2A 3.68 2014 2016 W06-A03A5C 4.14 2015 2016
W06-A04H1K 3.27 2015 2016 T01-J07D3A 3.57 2008 2011
T01-J10B1 4.45 2012 2013 T06-B01A 4.49 2013 2014
X22-X06 11.66 2007 2014 W06-A06 3.20 2008 2011
X22-J05C 4.97 2012 2013 W06-A03 4.00 2008 2010
X22-X06G 5.49 2012 2014 T01-J04B2 4.26 2009 2012
T01-J10A 5.18 2008 2010 W06-A06D1 3.38 2011 2016
X22-X06X 6.34 2014 2016
X22-E09A 6.49 2014 2016
Data source: Derwent Innovation Index.
Path planning Movement control Network communication
Code Burst Start year End year Code Burst Start year End year Code Burst Start year End year
T01-J05B4M 3.47 2008 2010 X22-A03B 6.74 2012 2014 T01-M06A1 5.19 2012 2016
T01-J05 2.05 2015 2017 X21-A01L 2.57 2015 2016 X22-K08 5.06 2011 2014
X22-E06F 3.31 2012 2014 X22-A03B1C 4.83 2015 2016 T01-N01D 5.51 2014 2016
T01-J07D3 8.17 2008 2012 T01-J07B 2.74 2012 2014
T01-J16C1 4.04 2009 2012 X22-A03B1 5.36 2012 2013
T01-E01 9.66 2008 2012 X22-C05B 14.01 2014 2016
T01-J07D1 6.74 2008 2009 X22-P15 28.27 2014 2016
T01-J05B3 5.53 2008 2013
Data source: Derwent Innovation Index.

Z. G. Zhang et al.
DOI: 10.4236/ti.2018.93010 147 Technology and Investment
It can be seen from Table 4 that in the field of environmental perception, the burst strength of the sensor technology (X22-X06) is the largest with a value of 11.66, and the duration of the burst is longer, which indicates that the research on the technique suddenly increases; The technologies include image acquisition (T01-J10A), lane-sensing bias (X22-X06G), which represent the relative frontier in the field of environmental perception. In the field of precision positioning, the two-dimensional position (T06-B01A), the convolution positioning algorithm (T01-J04B2), and the absolute position determination (W06-A03A5C) have higher burst strength with values of 4.49, 4.26, and 4.14. In the field of path planning, the burst value of data selection and algorithm (T01-E01) is the high-est (9.66), which indicates that there is a great increase in research on the tech-nology related to intelligent decision making, and also reflects that the artificial intelligence-related algorithm technology has drawn much attention in recent years. In the field of motion control, the burst strength of steering technology (X22-C05), speed control (X22-A03B) and vehicle joint control system (X22-P15) reached the maximum at 14.01, 6.74 and 28.27 respectively, shows that due to the complexity of vehicle system, lateral control and longitudinal control as well as collaborative control technology are the technical focus and difficulty in this field, have been widely studied. The burst of network communications is not obvious, mainly including data transmission (T01-N01D), car communication (X22-K08) and portable terminals and wireless networks (T01-M06A1).
3.2. National Distribution of Technological Innovation Activities 3.2.1. Country Analysis of Patent Applications The number of patent applications is one of the indicators to measure the cha-racteristics and innovation ability of a country’s technological innovation activi-ties. From Figure 6, the global patent for automated driving technology is mainly distributed in the United States, Japan, China, South Korea and Europe. The first rank is the United States with 915 patent applications, in a leading
Figure 6. Patent applications in various countries (data source: Derwent Innovation In-dex).
Z. G. Zhang et al.
DOI: 10.4236/ti.2018.93010 148 Technology and Investment
position; Japan ranked second, with 392 patents. China followed closely with 326 patents and ranked the third largest patent application in the world. t is not dif-ficult to find that the output of patents in the field of automated driving is sig-nificantly different from country to country. The United States has obviously taken the first array of technological innovation in the field of automated driv-ing. The reason is that the United States started the research on automated technology earlier. As early as 2009, Silicon Valley companies began to study automated technology. At the same time, thanks to the government and research institutions emphasis on this technology, the United States masters the core technology. In September 2016 and September 2017, the US Department of Transportation issued the “Guide for US Automated Driving Car Policies” and the “Automated Driving Systems (ADS): A Vision for Safety 2.0”, which provide guidance with the performance of automated driving vehicles, the unification of state policies, the National Highway Traffic Safety Administration current man-agement methods, innovations in regulatory measures in the future [15].
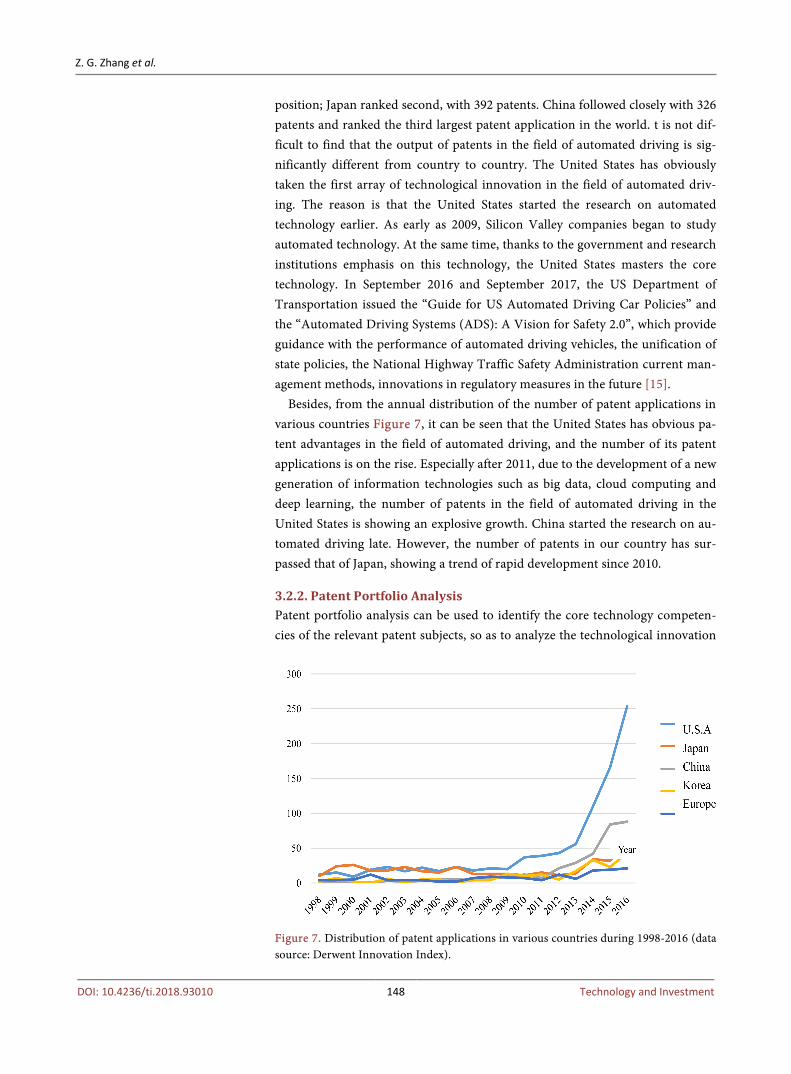
Besides, from the annual distribution of the number of patent applications in various countries Figure 7, it can be seen that the United States has obvious pa-tent advantages in the field of automated driving, and the number of its patent applications is on the rise. Especially after 2011, due to the development of a new generation of information technologies such as big data, cloud computing and deep learning, the number of patents in the field of automated driving in the United States is showing an explosive growth. China started the research on au-tomated driving late. However, the number of patents in our country has sur-passed that of Japan, showing a trend of rapid development since 2010.
3.2.2. Patent Portfolio Analysis Patent portfolio analysis can be used to identify the core technology competen-cies of the relevant patent subjects, so as to analyze the technological innovation
Figure 7. Distribution of patent applications in various countries during 1998-2016 (data source: Derwent Innovation Index).
Z. G. Zhang et al.
DOI: 10.4236/ti.2018.93010 149 Technology and Investment
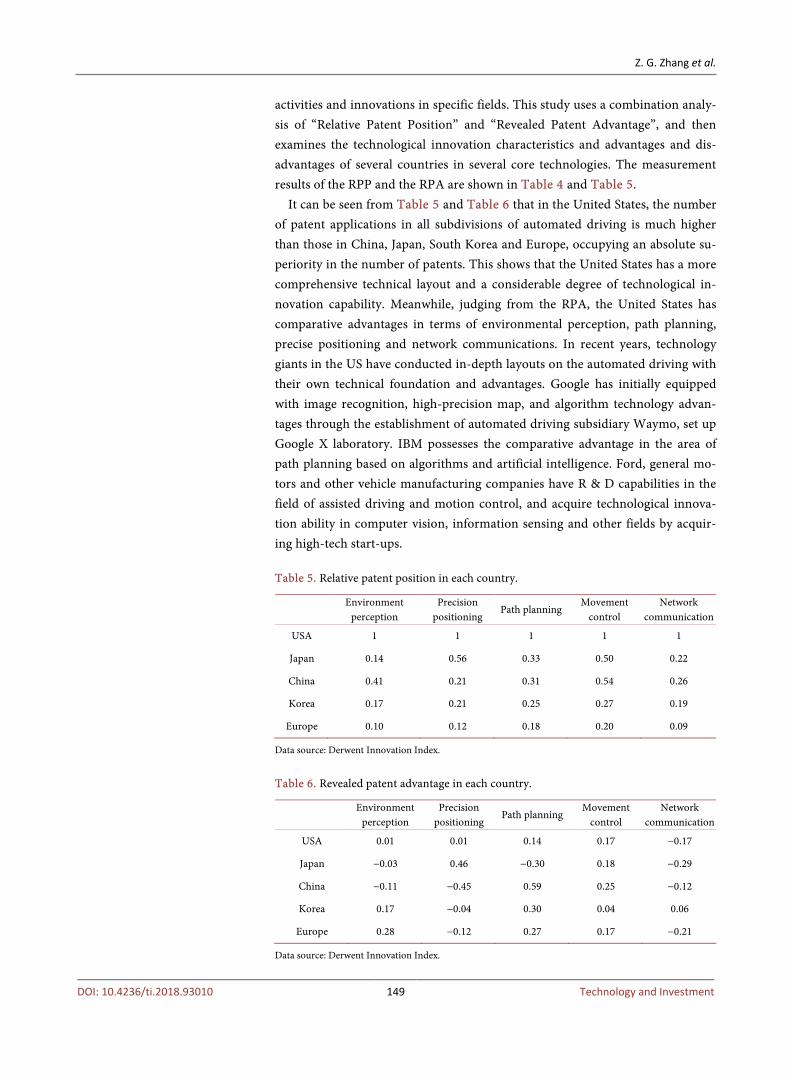
activities and innovations in specific fields. This study uses a combination analy-sis of “Relative Patent Position” and “Revealed Patent Advantage”, and then examines the technological innovation characteristics and advantages and dis-advantages of several countries in several core technologies. The measurement results of the RPP and the RPA are shown in Table 4 and Table 5.
It can be seen from Table 5 and Table 6 that in the United States, the number of patent applications in all subdivisions of automated driving is much higher than those in China, Japan, South Korea and Europe, occupying an absolute su-periority in the number of patents. This shows that the United States has a more comprehensive technical layout and a considerable degree of technological in-novation capability. Meanwhile, judging from the RPA, the United States has comparative advantages in terms of environmental perception, path planning, precise positioning and network communications. In recent years, technology giants in the US have conducted in-depth layouts on the automated driving with their own technical foundation and advantages. Google has initially equipped with image recognition, high-precision map, and algorithm technology advan-tages through the establishment of automated driving subsidiary Waymo, set up Google X laboratory. IBM possesses the comparative advantage in the area of path planning based on algorithms and artificial intelligence. Ford, general mo-tors and other vehicle manufacturing companies have R & D capabilities in the field of assisted driving and motion control, and acquire technological innova-tion ability in computer vision, information sensing and other fields by acquir-ing high-tech start-ups. Table 5. Relative patent position in each country.
Environment
perception Precision
positioning Path planning
Movement control
Network communication
USA 1 1 1 1 1
Japan 0.14 0.56 0.33 0.50 0.22
China 0.41 0.21 0.31 0.54 0.26
Korea 0.17 0.21 0.25 0.27 0.19
Europe 0.10 0.12 0.18 0.20 0.09
Data source: Derwent Innovation Index.
Table 6. Revealed patent advantage in each country.
Environment
perception Precision
positioning Path planning
Movement control
Network communication
USA 0.01 0.01 0.14 0.17 −0.17
Japan −0.03 0.46 −0.30 0.18 −0.29
China −0.11 −0.45 0.59 0.25 −0.12
Korea 0.17 −0.04 0.30 0.04 0.06
Europe 0.28 −0.12 0.27 0.17 −0.21
Data source: Derwent Innovation Index.
Z. G. Zhang et al.
DOI: 10.4236/ti.2018.93010 150 Technology and Investment
Japan has a comparative advantage in the field of precision positioning and motion control. On the one hand, Japan owns major auto companies such as Toyota, Honda and Mitsubishi. The research of these car companies mainly concentrates on the fields of vehicle control or regulation system, vehicle joint control, vehicle radar and navigation accessories, and has accumulated certain technical advantages. On the other hand, the Japanese government also actively promotes research cooperation, builds technology alliances, and encourages car manufacturers joint local university and Matsushita, Hitachi and other suppliers, to set up the Dynamic Map Planning project, force the high precision position-ing map and technology.
According to the relative patent location (RPP), China has a layout in all tech-nical areas of automated driving. However, from the perspective of RPA, China only has comparative advantages in the field of path planning and motion con-trol. This shows that our country has formed a pattern of coordinated develop-ment of the IT enterprises represented by Baidu and the traditional car enter-prises represented by Chang an, BYD and Chery in the field of automated driv-ing. The former mainly focuses on intelligent decision-making and planning. The latter mainly focuses on practical assisted driving control technology. How-ever, the advantages in precision positioning, environment awareness and net-work communications are slightly inadequate. In view of the growth and devel-opment prospects of the various technical fields analyzed in the foregoing, China should step up R & D in the field of precision positioning and environmental perception in order to enhance the capability of technological innovation and maintain the competitive edge in the future.
4. Enlightenment
Automated driving technology was born in the 1930s. Starting from the 90s, au-tomated technology showed substantial growth in the recent five years. Auto-mated driving is still in its early stage of development as an emerging technology for interdisciplinary integration. However, the development of automated is growing rapidly. In order to seize a new round of scientific and technological revolution opportunities and enhance scientific and technological competitive advantages, this paper made some suggestions on China’s future development of automated driving:
Firstly, grasping the development trend of automated driving technology, consolidating the existing technical advantages and strengthening the layout of various technical fields. On the one hand, encouraging auto enterprises represented by SAIC, BAIC and GAC to continuously improve and develop the functions and technologies of driving assistance system, and gradually improve the degree of automation and intelligence of automobiles to continuously develop towards fully automated driving. On the other hand, conducting Tencent, Huawei and other IT enterprises continue to improve the machine learning ability and inde-pendent decision-making ability through advanced Internet technology, sophis-
Z. G. Zhang et al.
DOI: 10.4236/ti.2018.93010 151 Technology and Investment
ticated algorithms and cloud service platform, to further achieve precision posi-tioning, environmental awareness and other technology breakthroughs.
Secondly, to promote integration and innovation. Accelerate the integration and innovation of the automotive industry, mobile communications network, big data, cloud computing, and artificial intelligence industries. Support the re-search and development of vehicles such as Internet cars and automated vehicles to promote the key common technology of automated driving technology breakthroughs and commercial development through building technology al-liances, industry-university-research institutes, building innovation bases and science parks.
Thirdly, accelerate the introduction of automated driving instructional poli-cies and technical routes to provide policy support for R & D, testing and com-mercial application of automated vehicles. And realize the large-scale application of mid- and low-level driver assistance functions based on short-term path plan-ning and motion control technology advantages; realize middle-high-level au-tomated driving supplemented by Internet-based information services in the medium term, And complete long-term complete automated driving functions and industrialization with a certain scale in the long-term.
5. Research Conclusions
Based on the Derwent patent data from 1998 to 2016, this paper analyzes the technical innovation of global automated through the combination of visualiza-tion and patent portfolio. The main conclusions are as follows:
There is uneven development of innovative activities in all technical fields of automated driving. Among them, the areas of precision positioning and path planning have high patented output and high relative growth rate, indicating that they have the highest level of technical activity and have entered a stage of rapid development. They are the leading technical fields of automated driving. Environmental perception and motion control have low patents output and high growth characteristics, indicating that the technology activity is in growth, and it may become the key technology for automated driving in the future. And net-work communications with low-patent output and low growth, reflecting that the fields of the technological innovation activities are relatively stable, are still in the exploratory stage.
There are also differences between the key technologies in automated driving and the frontier hotspot technologies. Environmental perception, precision posi-tioning, path planning and motion control are more obvious burst technologies, software-based algorithm technology, image recognition and analysis, sensor information fusion, high-precision maps and vehicle control technology on be-half of the research hotspots and the future direction of development.
Innovation activities and capabilities of automated driving technology show an uneven geographical distribution. The United States, Japan and China are powers in the field of technology innovation in automated driving. There are al-
Z. G. Zhang et al.
DOI: 10.4236/ti.2018.93010 152 Technology and Investment
so country-specific differences in the capability of technological innovation in all automated driving subdivisions. The United States is in the pre-layout of the field of automated driving, and has the absolute patent status and relative tech-nical advantages of environmental perception, precise positioning, path plan-ning and motion control. Japan is the second with the ability to innovate in au-tomated driving technology and has comparative advantages in precision posi-tioning and motion control. China followed the United States and Japan in the layout of all technical fields of automated driving and possessed the comparative advantages of technology in the field of path planning and motion control.
Acknowledgements
1) Guangdong Provincial Science and technology plan project “Science and Technology Revolution and Technology Foresight Think Tank Construction” (No.2016B07072001).
2) Funded by: Guangzhou City Humanities and Social Science Key Research Base; Guangzhou City Large Enterprise Innovation System Construction Re-search Center.
References [1] State Department (2015) Made in China 2025.
http://www.gov.cn/zhengce/content/2015-05/19/content_9784.htm
[2] State Council (2016) “13th Five-Year” National Strategic Emerging Industries De-velopment Plan. http://www.gov.cn/zhengce/content/201612/19/content_5150090.htm
[3] Han, Z., Shen, J. and Qu, S.S. (2013) Patent Measurement Analysis of RFID Tech-nology Trend and Competition Situation. Research Management, V, 11-16.
[4] Chen, C., Chen, Y., Hou, J.H., et al. (2009) CiteSpace II: Recognition and Visualiza-tion of New Trends and New Dynamics in Scientific Literature. Journal of the Chi-na Society for Scientific and Technical Information, 28, 401-421.
[5] Chen, Y., Chen, C., Liu, Z.Y., et al. (2015) Methodological Function of CiteSpace Knowledge Map. AMIA 2005 Symposium Proceedings, 33, 242-253.
[6] Fabry, B., Ernst, H., Langholz, J., et al. (2006) Patent Portfolio Analysis as a Useful Tool for Identifying R & D and Business Opportunities—An Empirical Application in the Nutrition and Health Industry. World Patent Information, 28, 215-225. https://doi.org/10.1016/j.wpi.2005.10.004
[7] Antonelli, C. (1994) The Technological Specialization of Advanced Countries: Da-niele Archibugi and Mario Pianta. International Journal of Industrial Organization, 12, 292-294. https://doi.org/10.1016/0167-7187(94)90019-1
[8] Hu, M.C. (2012) Technological Innovation Capabilities in the Thin Film Transis-tor-Liquid Crystal Display Industries of Japan, Korea, and Taiwan. Research Policy, 41, 541-555. https://doi.org/10.1016/j.respol.2011.10.013
[9] Guo, L. and Cai, H. (2013) Research on Technology Innovation Capability of China Telecom Industry Based on Patent Portfolio Analysis. Science of Science and Man-agement of Science and Technology, 2013, 77-85.
[10] Waymo (2017) On the Road to Fully Self-driving: Waymo Safety Report. Google,
Z. G. Zhang et al.
DOI: 10.4236/ti.2018.93010 153 Technology and Investment
Santa Clara County.
[11] Guan, J. and Liu, N. (2015) Invention Profiles and Uneven Growth in the Field of Emerging Nano-Energy. Energy Policy, 76, 146-157. https://doi.org/10.1016/j.enpol.2014.11.024
[12] Chen, C. (2006) CiteSpace II: Detecting and Visualizing Emerging Trends and Transient Patterns in Scientific Literature. Journal of the China Society for Scientific & Technical Information, 57, 359-377. https://doi.org/10.1002/asi.20317
[13] Chen, Y., Chen, C. and Hu, Z.G. (2014) Citation Spatial Analysis Principle and Ap-plication. Science Press, Beijing, 18.
[14] Kleinberg, J. (2003) Bursty and Hierarchical Structure in Streams. Data Mining & Knowledge Discovery, 7, 373-397. https://doi.org/10.1023/A:1024940629314
[15] United States Department of Transportation (2017) Automated Driving Systems (ADS): A Vision for Safety 2.0. https://www.nhtsa.gov/sites/nhtsa.dot.gov/files/documents/13069a-ads2.0_090617_v9a_tag.pdf
Related Documents