Research On Exercise Fatigue Estimation Method of Pilates Rehabilitation Based On ECG and sEMG Feature Fusion Dujuan Li North Sichuan Medical College Caixia Chen ( [email protected] ) China West Normal University Research Article Keywords: Exercise fatigue, Surface EMG signal, Electrocardiogram signal, Feature fusion, Particle swarm optimization algorithm Posted Date: November 30th, 2021 DOI: https://doi.org/10.21203/rs.3.rs-1093183/v1 License: This work is licensed under a Creative Commons Attribution 4.0 International License. Read Full License Version of Record: A version of this preprint was published at BMC Medical Informatics and Decision Making on March 18th, 2022. See the published version at https://doi.org/10.1186/s12911-022-01808-7.

Welcome message from author
This document is posted to help you gain knowledge. Please leave a comment to let me know what you think about it! Share it to your friends and learn new things together.
Transcript

Research On Exercise Fatigue Estimation Method ofPilates Rehabilitation Based On ECG and sEMGFeature FusionDujuan Li
North Sichuan Medical CollegeCaixia Chen ( [email protected] )
China West Normal University
Research Article
Keywords: Exercise fatigue, Surface EMG signal, Electrocardiogram signal, Feature fusion, Particle swarmoptimization algorithm
Posted Date: November 30th, 2021
DOI: https://doi.org/10.21203/rs.3.rs-1093183/v1
License: This work is licensed under a Creative Commons Attribution 4.0 International License. Read Full License
Version of Record: A version of this preprint was published at BMC Medical Informatics and DecisionMaking on March 18th, 2022. See the published version at https://doi.org/10.1186/s12911-022-01808-7.

Article 1
Research on exercise fatigue estimation method of Pilates rehabilitation based on 2
ECG and sEMG feature fusion 3
Dujuan Li1,Caixia Chen2 4
1 North Sichuan Medical College, Nanchong 631000, China 5
2 China West Normal University, Nanchong 631000, China 6
* Correspondence: [email protected]; Tel.: +86 15797677791 7
8
ABSTRACT: Purpose. Fatigue estimation is of great significance to improve the 9
accuracy of intention recognition and avoid secondary injury in Pilates rehabilitation. 10
Surface electromyography (sEMG) is used to estimate fatigue with low and unstable 11
recognition rates. To improve the rate, this paper fused electrocardiogram (ECG) signal 12
and sEMG signal under three different states, and the classification model of the 13
improved proved particle swarm optimization support vector machine (IPSO-SVM) 14
algorithm was established. Methods. Twenty subjects performed 150 minutes of Pilates 15
rehabilitation exercise. ECG and sEMG signals were collected at the same time. After 16
necessary preprocessing, the IPSO-SVM classification model based on feature fusion 17
was established to identify three different fatigue states (relaxed, transition, and tired). 18
The model effects of different classification algorithms and different fused data types 19
were compared. Results. Compared with common physiological signal classification 20
methods such as BP neural network algorithm(BPNN), K-nearest neighbor(KNN), and 21
Linear discriminant analysis(LDA), IPSO-SVM had obvious advantages in the 22
classification effect of sEMG and ECG signals, the average recognition rate was 23
87.83%. The recognition rates of sEMG and ECG fusion feature classification models 24
were 94.25%, 92.25%, 94.25%. The recognition accuracy and model performance was 25
significantly improved. Conclusion. The sEMG and ECG signal after feature fusion 26
form a complementary mechanism. At the same time, IPOS-SVM can accurately detect 27
the fatigue state in the process of Pilates rehabilitation. This study establishes technical 28

support for establishing relevant man-machine devices and improving the safety of 1
Pilates rehabilitation. 2
KEYWORDS: Exercise fatigue; Surface EMG signal; Electrocardiogram signal; 3
Feature fusion; Particle swarm optimization algorithm 4
5
6
Highlight: 7
1. The surface electromyography signal and electrocardiogram signal were fused. 8
2. ECG features are helpful to identify interference variables and correct them. 9
3. The IPSO-SVM and ECG/sEMG can establish a more accurate evaluation method of 10
Pilates rehabilitation exercise fatigue. 11
12
13
1 Introduction 14
Pilates is a combination of strength, flexibility, and balance exercises. It focuses 15
on lumbopelvic stabilization, with the activation of the deep muscles of the trunk, and 16
seeks a complete connection of body and mind 1. The core muscles provide balance and 17
strength for Pilates, so exercise plays an important role in women’s postpartum 18
recovery2, prevention of low back pain and rehabilitation3, spinal health correction1. In 19
the process of Pilates exercise, program-controlled human-computer interaction 20
equipment, such as medical rehabilitation robot and exoskeleton robot, is to help 21
patients complete the set movement. However, the muscle fatigue information is rarely 22
used as an influencing factor to adjust the rehabilitation process. that not only has a 23
great impact on the recognition rate of patients’ motor intention but also tends to cause 24
secondary injuries and reduce the rehabilitation effect. 25
Surface electromyography (sEMG) has many achievements in the field of online 26
monitoring and processing of muscle fatigue. Choi Chang et al. developed a computer 27
interface base on sEMG and virtual reality, which can be applied to spinal cord injury 28
patients. They can control the cursor movement by adjusting the level of muscle 29
contraction. Shahmoradi et al. 4 collected the sEMG and Maximum voluntary 30

contraction (MVC) data in the rehabilitation process as inputs of the fatigue state 1
recognition model. The hidden Markov model and artificial neural network were 2
studied for fatigue classification of sEMG. The results show the HMM has a better 3
recognition effect with an accuracy of 95.3%. Because fatigue is a complex 4
phenomenon, the sEMG classification method alone is not stable. To solve the problem 5
of sEMG classification model instability, many scholars combine sEMG with other 6
monitoring methods, electroencephalogram is one of the commonly used techniques 5–7
8. Therefore, the research of the combined monitoring method is worthy of further 8
development. 9
Electrocardiogram (ECG) is one of the most commonly used non-invasive 10
diagnostic tools for recording the physiological activities of the heart over some time. 11
The ECG data 9 contains much information about the human motor function and is 12
widely used in muscle state research and emotion estimation and so on. Considering 13
the muscle fatigue characteristics of the sEMG and ECG, it is of great significance to 14
establish the fatigue state recognition model of the Pilates rehabilitation process by the 15
fusion sEMG and ECG. 16
In response to the above questions, the fatigue degree of the subjects after the 17
Pilates rehabilitation was divided into 6~20 score ranges by the scale for Rating of 18
Perceived Exertion (RPE scale). The segments from 6~10, 13~14, 17~18 scores in the 19
table were identified as easy, excessive, and fatigue. The ECG and sEMG signal at the 20
tibialis anterior muscle and semitendinosus muscle of the lower limbs were collected 21
while doing the established actions of Pilates. A series of preprocessing was performed 22
to extract the feature variables, which were used as the improved particle swarm 23
optimization support-vector. The input volume of the machine classifier, which 24
achieves iterative optimization of the fusion of complex signals, high-dimensional 25
features, and accurate identification of the three motion states. The advantages and 26
disadvantages of this method were analyzed by the recognition effect. 27
28

2 methods 1
2
2.1 data collection 3
4
In this section, the data collection will be described, and analysis methods will be 5
explained in detail. The data has been obtained from 20 physical health subjects (22~26 6
years old; 8 males, 12 females) 7
The experiments were conducted using Trigno Wireless Systems and Smart 8
Sensors. The Trigno Wireless EMG system is a very popular device with simple and 9
reliable performance. Each EMG sensor has a built-in triaxial accelerometer. Its signal 10
can be transmitted in 40 meters and can be detected continuously for 8 hours. The 11
system can transmit the data stream to EMGworks 4. Acquisition and analysis software 12
for generating 16 EMG sensors (37 mm×26 mm×15 mm) and 48 accelerometer analog 13
channels for integration with motion capture and other third-party data acquisition 14
systems. The complete trigger function further expands the possibility of integration 15
with other measurement technologies. The sensor used can respond immediately to the 16
interference detected on the skin surface. 17
18
Figure 1 Sensor placement 19
The North Sichuan Medical College conducted this research project by the ethical 20
code of the World Medical Association.. It was also approved by the Ethics Committee 21
of the North Sichuan Medical College(No. 2020ER(R)017). This paper took 20 22
ch-3
ch-2
ch-1
physical examiners as the research object. Selection criteria: full-time students 1
majoring in Physical Education; aerobics as the main special sport; the subjects were in 2
good physical condition, had no obvious disease, and had no damage to the lower limb 3
muscles and knees. The subjects had an average height of 162.3±1.2 cm, an average 4
body weight of 63.5±2.3 kg, and an age of 21.2±1.1 years. Before the experiment, the 5
experimental process was explained to the subjects. All subjects voluntarily participated 6
in the experiment and signed written informed consent. The test time was September 7
11~25, 2021. 8
According to the physiological structure of the human body, the ECG signal and 9
the sEMG signal at the anterior tibialis muscle and semitendinosus muscle were 10
collected synchronously. The sampling frequency was 2 kHz. The sensor position is 11
shown in Figure 1. Ch-1 is the ECG sensor, ch-2 and ch-3 are the sEMG sensors at the 12
semitendinosus muscle of the right leg and the anterior tibialis muscle of the left leg, 13
respectively. 14
15
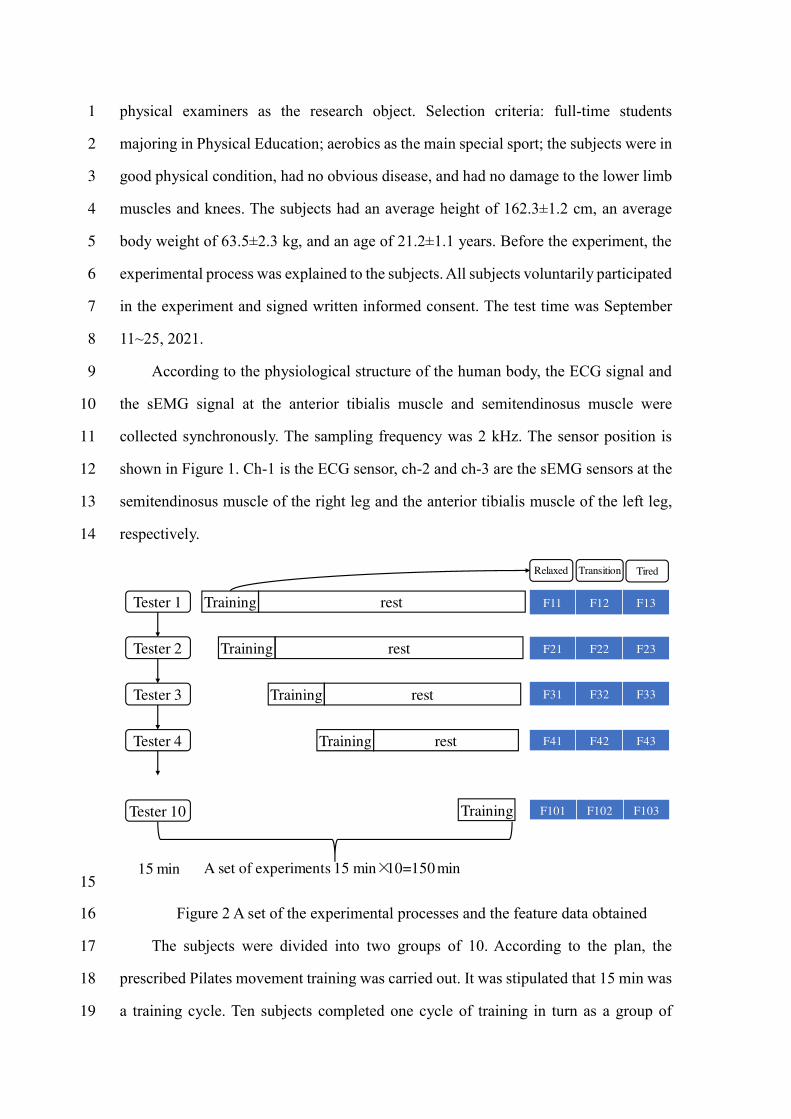
Figure 2 A set of the experimental processes and the feature data obtained 16
The subjects were divided into two groups of 10. According to the plan, the 17
prescribed Pilates movement training was carried out. It was stipulated that 15 min was 18
a training cycle. Ten subjects completed one cycle of training in turn as a group of 19
Tester 1
Tester 2
Tester 3
Tester 4
Tester 10
Training rest
restTraining
Training rest
Training rest
Relaxed Tired
F11 F12 F13
F21 F22 F23
F31 F32 F33
F41 F42 F43
Transition
15 min A set of experiments 15 min×10=150 min
Training F101 F102 F103

experiments. The duration of each experiment was 150 min, and a total of 40 groups of 1
experiments were carried out. The first group finished the test, the second group 2
continued the test, and the first group rested. In each training cycle, the subjects return 3
a calm standing state every 30 s according to the RPE scale10, report their feelings of 4
fatigue state, and mark the fatigue state value at this time (relaxed:-1, transition:0, 5
tired:1) 6
The sEMG and ECG data in three states were marked and saved, and the 7
corresponding training time was recorded. 30 groups of sEMG and ECG data were 8
obtained in each group experiment. According to the corresponding fatigue value, each 9
data was divided into three states, with a total of 90 sEMG and ECG data. After the 10
experiment, 3600 sEMG and ECG data were collected respectively. One set of 11
experimental processes and obtained characteristic data are shown in Figure 2. The 12
signal acquisition and analysis process of all subjects were the same. Here, take one of 13
them as an example. 14
15
2.2 Signal preprocessing and fatigue feature extraction 16
17
The original sEMG and ECG signal contains noise interference, which needs to be 18
preprocessed. Firstly, the original ECG and sEMG signals were filtered by 0~100 Hz 19
and 0~500 Hz low-pass filters to remove high-frequency interference. Secondly, 20
49.5~50 Hz adaptive notch filters were used to filter the power frequency and harmonic 21
interference in the signal. Finally, empirical mode decomposition(EMD) and discrete 22
wavelet transform(DWT) domains were used to reduce the noise11. which reduce the 23
noise from the initial IMFs instead of discarding them completely thus yielding a 24
relatively cleaner ECG signal12. MATLAB 2021a was used to analyze and process the 25
collected data. The time-domain and frequency-domain data processing of ECG and 26
sEMG are shown in Figure 3-6. 27

1
Figure 3 Example of signal preprocessing process about ECG (a) raw signal; (b)low 2
pass filtered signal; (c) EMD; (d) DWT 3
4
5
0.0 0.5 1.0 1.5 2.0 2.5 3.0 3.5 4.0-100
-50
0
50
100
150
200
250
300
Val
ue (μ
V)
Time (s)
0.0 0.5 1.0 1.5 2.0 2.5 3.0 3.5 4.0
-50
0
50
100
150
200
250
Val
ue (μ
V)
Time (s)
0.0 0.5 1.0 1.5 2.0 2.5 3.0 3.5 4.0-100
-50
0
50
100
150
200
250
300
Val
ue (μ
V)
Time (s)
0.0 0.5 1.0 1.5 2.0 2.5 3.0 3.5 4.0-100
-50
0
50
100
150
200
250
300
Val
ue (μ
V)
Time (s)
a. b.
c. d.
0.0 0.5 1.0 1.5 2.0 2.5 3.0 3.5 4.0-100
-50
0
50
100
Val
ue (μ
V)
Time (s)
0.0 0.5 1.0 1.5 2.0 2.5 3.0 3.5 4.0-100
-50
0
50
100
Val
ue (μ
V)
Time (s)
a. b.
100
Val
ue (μ
V)
Val
ue (μ
V)

1
Figure 4 Example of signal preprocessing process about sEMG (a) raw signal; (b)low 2
pass filtered signal; (c) EMD; (d) DWT 3
4
5
Figure 5 Example of signal preprocessing process about frequency-domain signal of 6
ECG (a) raw signal; (b)low pass filtered signal; (c) EMD; (d) DWT 7
8
Val
ue (μ
V)
Time (s)
Val
ue (μ
V)
Time (s)
0.0 0.5 1.0 1.5 2.0 2.5 3.0 3.5 4.0-100
-50
0
50
100
Val
ue (μ
V)
Time (s)
c.
0.0 0.5 1.0 1.5 2.0 2.5 3.0 3.5 4.0-100
-50
0
50
100
Val
ue (μ
V)
Time (s)
d.
0 20 40 60 80 100 120 140
0.00
0.05
0.10
0.15
Am
pli
tude
Frequency (Hz)
0 20 40 60 80 100 120 140
0.00
0.05
0.10
0.15A
mpli
tude
Frequency (Hz)
a. b.
0 20 40 60 80 100 120 140
0.00
0.05
0.10
0.15
Am
plit
ude
Frequency (Hz)
0 20 40 60 80 100 120 140
0.00
0.05
0.10
0.15
Am
plit
ude
Frequency (Hz)
c. d.

1
Figure 6 Example of signal preprocessing process about frequency-domain signal of 2
sEMG (a) raw signal; (b)low pass filtered signal; (c) EMD; (d) DWT 3
4
Table 1 Fatigue-related physiological features of ECG and sEMG 5
Features features description
ECGmean *Mean of the ECG interval sequence
ECGLF Interphase sequence low-frequency band power (0.04~0.15 Hz)
ECGLF/HF ECG interphase sequence with low/high band power ratio
sEMGR-IEMG sEMG of the musculus semitendinosus in the right leg
sEMGR-RMS *The mean square root of sEMGR-IEMG
sEMGR-MPF *The mean power frequency of sEMGR-IEMG
sEMGR-MF *The median frequency of sEMGR-IEMG
sEMGL-IEMG EMG of tibialis anterior in the left leg
sEMGL-RMS The mean square root of sEMGL-IEMG
sEMGL-MPF The mean power frequency of sEMGL-IEMG
0 100 200 300 400 500 600
0.000
0.002
0.004
0.006
0.008
0.010
Am
pli
tude
Frequency0 100 200 300 400 500 600
-0.002
0.000
0.002
0.004
0.006
0.008
0.010
Am
plit
ude
Frequency
0 100 200 300 400 500 600
0.000
0.002
0.004
0.006
0.008
Am
plit
ude
Frequency
0 100 200 300 400 500 600
0.000
0.001
0.002
0.003
0.004
0.005
0.006
0.007
Am
pli
tud
e
Frequency
a. b.
c. d.

sEMGL-MF The median frequency of sEMGL-IEMG
The calculation method of specific parameters with an asterisk in the Table 1 is as 1
follows: 2
mean1
1 M
i
i
ECG RRM
(1) 3
In the above relations, RRi is the duration of ECG interval; M is the total number 4
of periods. 5
2
1
-
1| ( ) | d | ( ) |
Nt T
R IEMGt
k N
sEMG x t t x kFs
(2) 6
2
1
-
S
1 1 1| ( ) | d ( )
N
R
t T
RMSt
k N
sEMG x t t x kN N F
(3) 7
- 0( )d / ( )d
midfR MPFsEMG f P f f P f f
(4) 8
- 0
1( )d
2R MFsEMG P f f
(5) 9
where x(t) is the amplitude of the sEMG signal, x(k) is the amplitude of sEMG 10
signal after discretization, Fs is sampling frequency. N, N1, and N2 are the length of 11
sEMG signal. 12
13
2.3 Improved particle swarm optimization-support vector machine (IPSO-SVM) 14
classifier 15
16
Traditional feature fusion with constant weights attempts to merge multiple feature 17
vectors into a vector, which performs poorly in muscle fatigue recognition since feature 18
weights cannot change with the testing object13. In this study, the multi-class support 19
vector machines (SVMs) are constructed by feature fusion coefficients of particle 20
swarm optimization (PSO) and one-vs-one (OVO) methods to improve the state 21
classifier. The fusion coefficient based on PSO can well represent weight coefficients 22
and trust degrees of weight coefficients, and learn the fusion features via multi-class 23
SVM to achieve state classification; accordingly, the fitness function can be established 24

based on state recognition rate to perform adaptive iterative optimization on the fusion 1
coefficient, finally achieving effective fusion of fatigue characteristics and accurate 2
state classification. The detailed process of fatigue estimation based on improved PSO-3
SVM (IPSO-SVM) classifier is as follows: 4
2.3.1 Constructing the fused feature vectors 5
1 2, , ,i i i iaf f f f L , 1 2, , ,i i i ibe e e e L , 1,2, ,i n L are defined as the feature 6
vectors of ECG and sEMG, where a,b are the vector dimension and n is the number of 7
samples. 1 2, , , a bd d d d L is defined as the fusion coefficient vector, the fused 8
feature vector of ECG and sEMG can be denoted as9
1 1 1 1, , , , ,i i a ia a i a b ibd f d f dx e d e L L , 1,2, ,i n L . Using the fused feature matrix 10
T1 2, , ,n
X x x x L composed of fused coefficient vector d, X can be divided into the 11
training set Xp and the test set XT. Xp is used for training the classifier and XT is used for 12
validating the classification performance. 13
14
2.3.2 Constructing multi-class SVM fatigue state classifier 15
SVM, as a kind of machine learning method based on statistics and the principle 16
of structural risk minimization, performs excellently in addressing nonlinear 17
recognition problems with a small set of samples14. Fatigue estimation based on ECG 18
and sEMG can be regarded as a type of linear inseparable multi-class problem, which 19
is exactly the field of expertise of the one-to-one method(OVO)15. On the classification 20
of class 3 or more, 2 classes are selected and then merged for classification. In this study, 21
OVO was used for constructing 3 binary SVMs to achieve the effective classification 22
of 3 states. 23
It is assumed that the training set Xp contains m samples, T1 2, , ,P m
X x x x L , 24
T1 2, , ,P m
Y y y y L , { 1,0,1}iy . yi can be classified into the following 3 states—25
relaxed state, transition state, and tired state, with the values of -1, 0, and 1, respectively. 26

SVM attempts to seek an optimal classification function so that the distance of the 1
function on the hyperplane and the support vector reaches the maximum. The kernel 2
function φ(x) is used for mapping the sample set to high-dimensional space while 3
satisfying the Mercer condition. The selection of φ(x) can directly determine the 4
classification performance. Owing to favorable performance and application range, 5
radial basis function is selected as the kernel function of SVM in this study, 6
2
2
, expi i
x x x x
(6) 7
In the case of positive definite φ(x,xi), the problem of seeking optimal hyperplane 8
can be converted into the following convex quadratic programming problem: 9
2
, ,1
11min s.t
2 0. 1,2, ,
Ni i i
b i
i i
y x bC
i N
L
(7) 10
where C and i are penalty factor and slack variable, respectively. By 11
introducing the Language coefficient a, the convex quadratic programming problem 12
can be converted into the dual problem according to Eq.(7), and the optimal solution 13
α*,η*, b*can thus be obtained by solving the dual problem: 14
* *
1
,l
i i i j
i
b y y x x
(8) 15
Finally, the SVM classification function based on radial basis function can be 16
expressed as: 17
* *
1
( ) sgn ,N
i i i
i
f x y x x b
(9) 18
The classifier can thus be constructed. 19
20
2.3.3 ECG-sEMG feature fusion based on IPSO-SVM 21
The detailed fusion process of ECG and sEMG signals was described as below. 22
a. Initialization of particle swarms. In this study, the random fusion coefficient 23
matrix T
1 2, , , qD d d d L is defined as the initial particle swarm, in which 24

1 2, , ,j j j ja bd d d d L denotes the fusion coefficient vector, 1
a b
jk
k
d a b
, 1
j=1,2,…,q. The maximum number of initialization iterations, q denotes the size of 2
particle swarm, c1 and c2 learning factors, and ω denotes the inertia weight. 3
b. Training of SVM network and calculation of the particle fitness degree. The 4
characteristic samples are fused with the corresponding fusion coefficients of particles 5
to obtain the feature fusion matrix p TX X X , in which is used for network training 6
to obtain the classification function *. The particle fitness degree can thus be obtained 7
by testing XT with f(x). 8
c. Update of particle swarm (optimization of fusion coefficient matrix D). For the 9
fitness degree h(d) of each group of particles after the above step b, the optimal fitness 10
degrees of both individual particle and population are calculated according to Eq. (10), 11
while both velocity vi+1 and position xi+1 of each particle to generate a new population, 12
in which rand() denotes the random number within a range of [0, 1]. 13
max( (d)), maxp g ph h h h (10) 14
1 1 2rand() ( ) rand() ( )i i p i g iv v c h i x c h i x (11) 15
1 1i i ix x v (12) 16
d. Step b and Step c are repeated until reaching the optimal fitness degree (hg≥he, 17
also referred to as the expected fitness), where D denotes the optimal fusion coefficient 18
matrix. 19
2.3.4 Fatigue estimation based on optimal fusion coefficient feature fusion 20
Using the optimal fusion coefficients, the feature vectors of unknown states are 21
constructed and input to the well-trained SVM network for recognition to achieve 22
accurate classification of fatigue states. 23
24
3 results 25
26

3.1 Analysis of ECG and EMG physiological features under different fatigue states 1
2
Figure 7 shows the ECG signal characteristics of different subjects under different 3
fatigue states. Relaxed and tired states can be easily separated based on ECG signal, 4
but the signal characteristics under transition state overlap with those of the other two 5
states. The characteristics in frequency-domain were particularly intensive than those 6
in the time-domain. Figure 8 shows the sEMG features of the tibialis anterior muscle 7
and semitendinosus of the subjects under different fatigue states. Figure 9 shows sEMG 8
signal features of the left anterior tibialis muscle under different fatigue statesThe 9
sEMG values of muscle integration in the time-domain and root-mean-square (RMS) 10
values show an obvious difference, mean characteristic power frequency and median 11
frequency in frequency-domain overall show obvious tendency; however, the transition 12
state shows a certain overlapping error with the other two states. Both time-frequency 13
characteristics of ECG and sEMG signals in the tired states show obvious fluctuations 14
than those in the other states. Accordingly, the characteristics of ECG and sEMG signals 15
are complementary to some degree. The combination of two types of signals can 16
strengthen the recognition performance of the classifier; however, interference also 17
exists. The characteristic confidence degree, i.e., the fusion coefficient, should be 18
judged and optimized. 19

1
Figure 7 ECG signal features in different fatigue states (a)ECGmean, (b)ECGLF, 2
(c)ECGLF/HF 3
4
5
0 10 20 30 40 500.6
0.8
1.0
1.2
1.4
EC
Gm
ean
Number of features
Relaxed Transition Tired
0 10 20 30 40 500.0
2.0x10⁻¹⁰
4.0x10⁻¹⁰
6.0x10⁻¹⁰
EC
GL
F
Number of features
Relaxed Transition Tired
0 10 20 30 40 50
0
20
40
60
80
EC
GL
F/H
F
Number of features
Relaxed Transition Tired
a. b.
c.
0 10 20 30 40 50
6.0x10⁻⁵
8.0x10⁻⁵
1.0x10⁻⁴
sEM
G R
-IE
MG
Number of features
Relaxed Transition Tired
0 10 20 30 40 50
6.0x10⁻⁵
8.0x10⁻⁵
1.0x10⁻⁴
sEM
GR
-RM
S
Number of features
Relaxed Transition Tired
a. b.
0 10 20 30 40 50
200
300
400
sEM
GR
-MP
F
Number of features
Relaxed Transition Tired
0 10 20 30 40 500
100
200
300
sEM
GR
-MF
Number of features
Relaxed Transition Tired
c. d.

Figure 8 sEMG signal features of the right tibialis anterior muscle under different 1
fatigue states 2
3
Figure 9 sEMG signal features of the left anterior tibialis muscle under different 4
fatigue states 5
6
3.2 Analysis of fusion coefficient optimization process 7
8
The fusion coefficient is the key to establishing the optimal feature vector and 9
enhancing the fatigue recognition rate. To prevent from falling into local optimum of 10
particle fitness degree, the related parameters in PSO including the population size q=2 11
000, the learning factor c1=0.5 c2=0.5, the inertial weight ω=0.8 and the expected fitness 12
degree can be set as 95%, respectively. 1 200 groups of data sets (400 groups for each 13
state) are selected from the collected data for pre-processing and feature extraction; 14
next, the established IPSO-SVM classifier is trained and tested via Monte Carlo cross-15
validation (MCCV). Fig.10 shows the convergence process of the fitness degree of 16
0 10 20 30 40 50
2.0x10⁻⁵
4.0x10⁻⁵
6.0x10⁻⁵
sEM
G L
-IE
MG
Number of features
Relaxed Transition Tired
0 10 20 30 40 50
1x10⁻⁵
2x10⁻⁵
3x10⁻⁵
4x10⁻⁵
sEM
GL
-RM
S
Number of features
Relaxed Transition Tired
0 10 20 30 40 50
100
200
300
400
sEM
GL
-MP
F
Number of features
Relaxed Transition Tired
0 10 20 30 40 50
100
200
300
400sE
MG
L-M
F
Number of features
Relaxed Transition Tired
a. b.
c. d.

particle swarm. It can be found that the convergence rate is great for the population with 1
a size of 2 000 after 120 iterations. 2
3
Figure 10 Convergence process of particle swarm optimal fitness 4
5
3.3 Analysis of fatigue recognition results of using different methods 6
7
Some commonly-used classification methods for physiological signals including 8
IPOS-SVM, BP neural network (BPNN), K-nearest neighbor (KNN), and linear 9
discriminant analysis (LDA) were performed on sEMG and ECG signals for training 10
and testing, as the results are shown in Fig.11. It can be found that the IPOS-SVM 11
algorithm showed obvious advantages in the classification of sEMG and ECG signals, 12
with a mean recognition rate of 87.83%; BPNN, as a hotspot in current classification 13
algorithms, was lower than IPOS-SVEM in mean recognition, with a mean recognition 14
rate of 85.80%; KNN was close to LDA in classification performance, with a mean 15
recognition rate of 80.55% and 79.01%. Overall, sEMG showed a favorable fatigue 16
classification performance than ECG, since sEMG data contained more fatigue state 17
characteristics. ECG was poor in the recognition of transition state, which was 18
consistent with previous research results. Through comparison, IPOS-SVM performed 19
well in fatigue state classification; however, the state recognition rate was still quite 20
0 50 100 150 200 250 30070
80
90
100
Ave
rage
rec
ogni
tion
rat
e (%
)
Number of iterations
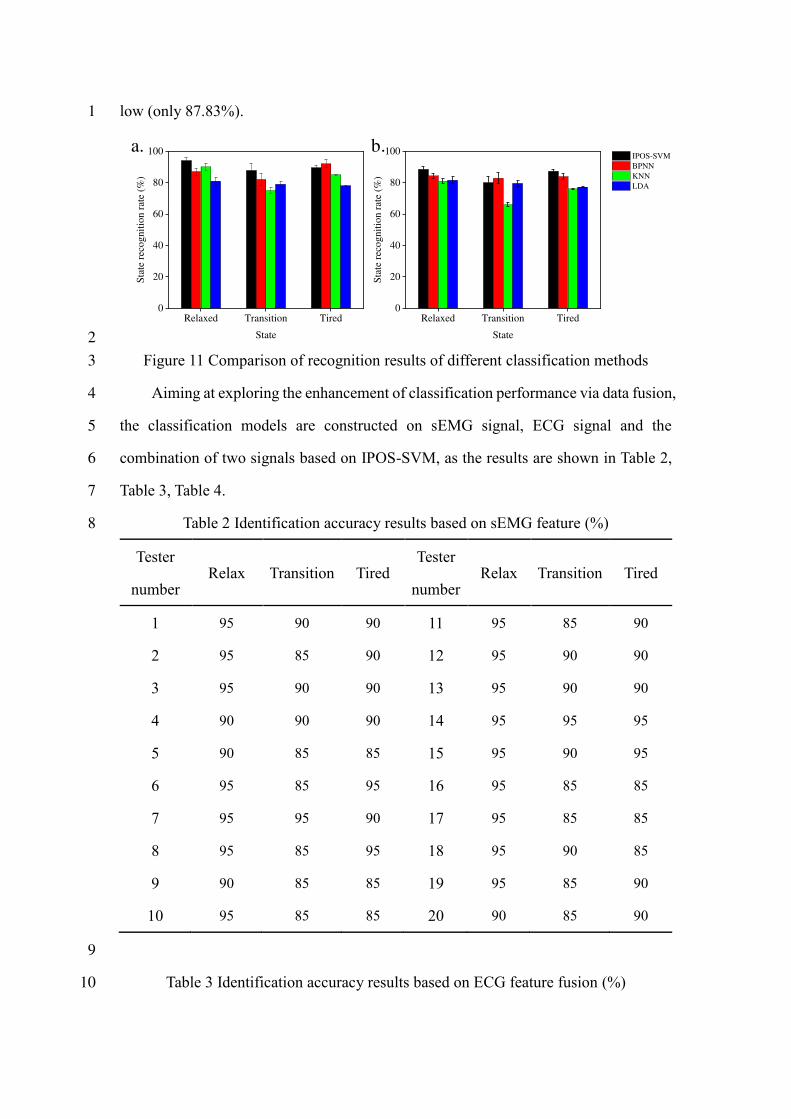
low (only 87.83%). 1
2
Figure 11 Comparison of recognition results of different classification methods 3
Aiming at exploring the enhancement of classification performance via data fusion, 4
the classification models are constructed on sEMG signal, ECG signal and the 5
combination of two signals based on IPOS-SVM, as the results are shown in Table 2, 6
Table 3, Table 4. 7
Table 2 Identification accuracy results based on sEMG feature (%) 8
Tester
number Relax Transition Tired
Tester
number Relax Transition Tired
1 95 90 90 11 95 85 90
2 95 85 90 12 95 90 90
3 95 90 90 13 95 90 90
4 90 90 90 14 95 95 95
5 90 85 85 15 95 90 95
6 95 85 95 16 95 85 85
7 95 95 90 17 95 85 85
8 95 85 95 18 95 90 85
9 90 85 85 19 95 85 90
10 95 85 85 20 90 85 90
9
Table 3 Identification accuracy results based on ECG feature fusion (%) 10
Relaxed Transition Tired0
20
40
60
80
100S
tate
rec
ogni
tion
rat
e (%
)
State
Relaxed Transition Tired0
20
40
60
80
100 IPOS-SVM BPNN KNN LDA
Sta
te r
ecog
niti
on r
ate
(%)
State
a. b.

Tester
number Relax Transition Tired
Tester
number Relax Transition Tired
1 90 85 90 11 90 80 85
2 90 80 85 12 85 85 85
3 90 85 90 13 90 80 95
4 85 75 85 14 90 85 95
5 85 80 85 15 90 80 85
6 95 80 90 16 90 80 85
7 85 80 85 17 90 75 95
8 85 75 90 18 90 80 80
9 85 80 80 19 90 80 90
10 90 80 80 20 85 75 90
1
Table 4 Identification accuracy results based on ECG and sEMG feature fusion(%) 2
Tester
number Relax Transition Tired
Tester
number Relax Transition Tired
1 100 95 95 11 100 90 95
2 100 90 95 12 95 95 95
3 100 95 95 13 100 95 95
4 95 95 95 14 100 95 100
5 95 90 90 15 100 95 95
6 100 90 100 16 100 90 90
7 100 100 95 17 100 90 90
8 100 90 100 18 100 90 90
9 95 90 90 19 100 90 95
10 100 90 90 20 95 90 95
3
The recognition rates of relaxed, transition and tired states only with sEMG signal 4

were 94.00%, 87.75% and 89.5%, respectively, while the recognition rates of relaxed, 1
transition and tired states only with ECG signal were 88.5%, 80.00% and 87.25%, 2
respectively. By contrast, sEMG was more sensitive to fatigue state and rich in fatigue 3
state information. ECG showed a poorly recognition rate of the transition state (only 4
80%). After feature fusion of sEMG and ECG, the recognition rates of the relaxed state, 5
the transition state and the tired state could be remarkably enhanced to 94.25%, 92.25% 6
and 94.25%, respectively. The recognition rate of transition rate exceeded 90%, which 7
can be explained by the following two reasons. Firstly, ECG features can contribute to 8
recognizing interference variables and play the role of correction. Secondly, IPOS-9
SVM can perform distribution based on the trust degrees of high-dimensional 10
characteristics after multiple iterative computations, which can assign appropriate 11
weights in different cases. 12
13
4 discussion 14
15
The fatigue produced in Pilates is a complex phenomenon in rehabilitation 16
exercises. How to enhance the accuracy of fatigue estimation based on feature fusion 17
of multi-source physiological signals appears as an effective mean. However, due to the 18
lack of uniform research paradigm and standards, many studies have been stuck on 19
laboratory or special application scenarios. Both sEMG and ECG are nondestructive 20
body monitoring signals abundant in physical information. Establishing the 21
classification model or quantitative model based on the combination of sEMG and ECG 22
shows huge potential. This study starts from the perspective of fatigue in Pilates and 23
proposes a lower limb fatigue estimation method based on sEMG and ECG to achieve 24
the classification of 3 states (relaxed, transition, and tired states) in the lower limb 25
rehabilitation process. The classification model by integrating ECG and sEMG fatigue 26
features into fatigue states is established with IPOS-SVM. Results also confirm better 27
classification performances of IPSO-SVM than BPNN, KNN and LDA, i.e., the 28

proposed IPSO-SWM is appropriate for the classification of fatigue states based on 1
sEMG and ECG signals. IPSO-SVM classification model based on surface 2
electromyography and ECG fusion features had good processing ability for high-3
dimensional feature information, and can well identify 3 fatigue states with the 4
recognition rates of 94.25%,92.25% and 94.25%, respectively. The mean recognition 5
rate was 93.58%. By comparison with the results based on pure sEMG and pure ECG 6
signals, the model based on feature fusion shows better recognition precision and 7
performance. Conclusively, sEMG and ECG signals can be combined for feature fusion 8
to achieve accurate fatigue detection during the Pilates rehabilitation process, which 9
can lay a solid foundation for further constructing the related man-machine device and 10
enhancing the safety of Pilates rehabilitation. 11
It must be admitted that there are deficiencies in this study. The designed algorithm 12
pays more attention to enhancing the recognition rates of different fatigue states. 13
Compared with single detection means, the operability of operators and the complexity 14
should be further optimized. Meanwhile, this study focused on the recognition of 3 15
discrete states during the rehabilitation process. In future studies, our team will attempt 16
to explore the mapping relations between continuous fatigue states and ECG/sEMG 17
signals to establish a more accurate quantitative model. 18
19
Declarations 20
21
Ethics approval and consent to participate The experimental protocol was 22
established, according to the ethical guidelines of the Helsinki Declaration and was 23
conducted after the authorization of the Ethical Committee of North Sichuan Medical 24
College (No. 2020ER(R)017). All patients included in the study had signed the 25
approved informed consent to participate. 26
Consent for publication All patients included in the study had signed the 27
approved informed consent to allow publication of anonymous data. 28

Availability of data and material The datasets used or analysed during the 1
current study are available from the first author on reasonable request. 2
Competing interests The authors declare no competing interests. 3
Authors' contributions Dujuan Li leaded the method application, experiment 4
conduction and the result analysis. Dujuan Li participated in the data extraction and 5
preprocessing. Caixia Chen participated in the manuscript revision, and provided 6
theoretical guidance and the revision of this paper. All authors read and approved the 7
final manuscript. 8
9
References 10
11
1. Aladro-Gonzalvo AR, Machado-Díaz M, Moncada-Jiménez J, Hernández-12
Elizondo J, Araya-Vargas G. The effect of Pilates exercises on body composition: 13
A systematic review. Journal of Bodywork and Movement Therapies. 14
2012;16(1):109-114. doi:10.1016/j.jbmt.2011.06.001 15
2. Ashrafinia F, Mirmohammadali M, Rajabi H, Kazemnejad A, Sadeghniiat 16
Haghighi K, Amelvalizadeh M. Effect of Pilates exercises on postpartum maternal 17
fatigue. smedj. 2015;56(3):169-173. doi:10.11622/smedj.2015042 18
3. Mazloum V, Sahebozamani M, Barati A, Nakhaee N, Rabiei P. The effects of 19
selective Pilates versus extension-based exercises on rehabilitation of low back 20
pain. Journal of Bodywork and Movement Therapies. 2018;22(4):999-1003. 21
doi:10.1016/j.jbmt.2017.09.012 22
4. Shahmoradi S, Zare A, Behzadipour S. Fatigue Status Recognition in a Post-23
Stroke Rehabilitation Exercise with sEMG Signal. In: 2017 24th National and 2nd 24
International Iranian Conference on Biomedical Engineering (ICBME). IEEE; 25
2017:1-5. doi:10.1109/ICBME.2017.8430264 26
5. Song Y, Du Y, Wu X, Chen X, Xie P. A synchronous and multi-domain feature 1
extraction method of EEG and sEMG in power-assist rehabilitation robot. In: 2014 2
IEEE International Conference on Robotics and Automation (ICRA). IEEE; 3
2014:4940-4945. doi:10.1109/ICRA.2014.6907583 4
6. Arjunan SP, Kumar DK. Fractal features based technique to identify subtle 5
forearm movements and to measure alertness using physiological signals (sEMG, 6
EEG). In: TENCON 2008 - 2008 IEEE Region 10 Conference. IEEE; 2008:1-4. 7
doi:10.1109/TENCON.2008.4766797 8
7. Wei P, Zhang J, Wei P, Wang B, Hong J. Different sEMG and EEG Features 9
Analysis for Gait phase Recognition. In: 2020 42nd Annual International 10
Conference of the IEEE Engineering in Medicine & Biology Society (EMBC). 11
IEEE; 2020:1002-1006. doi:10.1109/EMBC44109.2020.9175655 12
8. Li X, Samuel OW, Zhang X, Wang H, Fang P, Li G. A motion-classification 13
strategy based on sEMG-EEG signal combination for upper-limb amputees. J 14
NeuroEngineering Rehabil. 2017;14(1):2. doi:10.1186/s12984-016-0212-z 15
9. Hong S, Zhou Y, Shang J, Xiao C, Sun J. Opportunities and challenges of deep 16
learning methods for electrocardiogram data: A systematic review. Computers in 17
Biology and Medicine. 2020;122:103801. 18
doi:10.1016/j.compbiomed.2020.103801 19
10. Williams N. The Borg Rating of Perceived Exertion (RPE) scale. Occupational 20
Medicine. 2017;67(5):404-405. doi:10.1093/occmed/kqx063 21
11. Alickovic E, Kevric J, Subasi A. Performance evaluation of empirical mode 22
decomposition, discrete wavelet transform, and wavelet packed decomposition for 23
automated epileptic seizure detection and prediction. Biomedical Signal 24
Processing and Control. 2018;39:94-102. doi:10.1016/j.bspc.2017.07.022 25

12. Karthick PA, Ghosh DM, Ramakrishnan S. Surface electromyography based 1
muscle fatigue detection using high-resolution time-frequency methods and 2
machine learning algorithms. Computer Methods and Programs in Biomedicine. 3
2018;154:45-56. doi:10.1016/j.cmpb.2017.10.024 4
13. Putra DS, Weru YUW, Fitriady. Pattern recognition of electromyography (EMG) 5
signal for wrist movement using learning vector quantization (LVQ). IOP Conf 6
Ser: Mater Sci Eng. 2019;506:012020. doi:10.1088/1757-899X/506/1/012020 7
14. Yu D, Xu Z, Wang X. Bibliometric analysis of support vector machines research 8
trend: a case study in China. Int J Mach Learn & Cyber. 2020;11(3):715-728. 9
doi:10.1007/s13042-019-01028-y 10
15. Liu Y, Bi JW, Fan ZP. A method for multi-class sentiment classification based on 11
an improved one-vs-one (OVO) strategy and the support vector machine (SVM) 12
algorithm. Information Sciences. 2017;394-395:38-52. 13
doi:10.1016/j.ins.2017.02.016 14
15
Related Documents