Research NotedNotes de recherche Representing Canadians: changes in the economic backgrounds of federal politicians, 1965-1984 NEIL GUPPY, SABRINA FREEMAN, and SHARI BUCHAN British Columbia* University of La representativite des politiciens Clus est un element important du processus electoral. Dans cet article, nous Pvaluons I’evolution au cours des deux derniPres decennies des profils professionnels des candidats, deputes et ministres de la Couronne au niveau federal de la politique canadienne. Nous utilisons les donnees des Rapports du Directeur general des elections, pour les elections de 1965 B 1984. Nous montrons que la representation la plus diversifiee des origines socio-Cconomiques se trouve au niveau des candidats, alors que les deputes ont tendance B provenir de groupes a statut professionel plus Cleve. Quant aux ministres de la Couronne, la tendance dominante demeure une appartenance aux secteurs professionnels. This paper examines one central component of the electoral process - the representative- ness of elected politicians. We assess changes over the last two decades in the pre- political occupational backgrounds of candidates, members of Parliament ( MPS), and Cabinet Ministers in Canadian federal politics. Using information from the Chief Electoral Office Reports for the elections between 1965 and 1984, we show that the broadest representation of socio-economic backgrounds occurs for candidates, while MPS have come increasingly from high status occupational backgrounds. For Cabinet Ministers, repre- sentation from professional fields remains overwhelming. * This research was supported by a SSHRCC research grant (482-84-0010). We would like to thank Steve Hart, Cathy Hluchy, and Diane Warriner for help in compiling data. Christine Jackson of Elections Canada has been of continuing assistance. Sugges- tions from Bob Brym, Jim Curtis, Martha Foschi, Ed Grabb, and two CRSA reviewers were very useful. Errors or omissions are our responsibility. This manuscript was received in July 1986 and accepted in November 1986. Rev. canad. SOC. &x Anth. / Canad. Rev. SOC. & Anth. q ( 3 ) 1987

Welcome message from author
This document is posted to help you gain knowledge. Please leave a comment to let me know what you think about it! Share it to your friends and learn new things together.
Transcript

Research NotedNotes de recherche
Representing Canadians: changes in the economic backgrounds of federal politicians, 1965-1984 N E I L G U P P Y , S A B R I N A F R E E M A N , and S H A R I B U C H A N British Columbia*
University of
La representativite des politiciens Clus est un element important du processus electoral. Dans cet article, nous Pvaluons I’evolution au cours des deux derniPres decennies des profils professionnels des candidats, deputes et ministres de la Couronne au niveau federal de la politique canadienne. Nous utilisons les donnees des Rapports du Directeur general des elections, pour les elections de 1965 B 1984. Nous montrons que la representation la plus diversifiee des origines socio-Cconomiques se trouve au niveau des candidats, alors que les deputes ont tendance B provenir de groupes a statut professionel plus Cleve. Quant aux ministres de la Couronne, la tendance dominante demeure une appartenance aux secteurs professionnels.
This paper examines one central component of the electoral process - the representative- ness of elected politicians. We assess changes over the last two decades in the pre- political occupational backgrounds of candidates, members of Parliament ( MPS), and Cabinet Ministers in Canadian federal politics. Using information from the Chief Electoral Office Reports for the elections between 1965 and 1984, we show that the broadest representation of socio-economic backgrounds occurs for candidates, while MPS have come increasingly from high status occupational backgrounds. For Cabinet Ministers, repre- sentation from professional fields remains overwhelming.
* This research was supported by a SSHRCC research grant (482-84-0010). We would like to thank Steve Hart, Cathy Hluchy, and Diane Warriner for help in compiling data. Christine Jackson of Elections Canada has been of continuing assistance. Sugges- tions from Bob Brym, Jim Curtis, Martha Foschi, Ed Grabb, and two CRSA reviewers were very useful. Errors or omissions are our responsibility. This manuscript was received in July 1986 and accepted in November 1986.
Rev. canad. SOC. &x Anth. / Canad. Rev. SOC. & Anth. q ( 3 ) 1987

418 N E I L G U P P Y , S A B R I N A F R E E M A N , A N D S H A R I B U C H A N
As an elected assembly, parliamentary government rests on the principle of representative democracy. Only a small fraction of the population has no voice in selecting representatives and the vast majority of Canadians are themselves eligible to seek office. But while most people can vote, those who serve remain a select group.
Historically, democratically elected representatives have come from privileged backgrounds. Commenting on political recruitment, Weber (1946: 94) pointed to the elite status of lawyers and argued that ‘since the French Revolution, the modern lawyer and modern democracy absolutely belong together. ’ In Canada, Porter (1965: 392) remarked that this direct tie between the legal profession and politicians had ‘increased over time’ in the federal cabinet. Ward (1950: i33), however, reported a growing diversity of occupational representation in the Canadian parliament since Confederation, although in 1945 the legal profession still held ‘approximately one-third of the total membership in the House’.
Contemporary evidence reveals that lawyers have not preserved their one-third share of parliamentary seats. By the late 1960s only 26 per cent of members in the federal House had legal training, and this trend of declining representation continued through to the early 1980s when only 20 per cent of parliamentarians had backgrounds in law (based on Chief Electoral Reports). This apparent erosion of the strong link between lawyers and elected officials in Canada not only runs counter to Weber’s observation, but also raises several questions concerning the democratization of parliament.
Building on a tradition of research (e.g., Marsh, 1940; Ward, 1950; Porter, 1965; Presthus, 1973; Forcese and de Vries, 1977; Ogmundson, 1977; Olsen, 1980; and Fox and Ornstein, 1986), we use federal election information from the last two decades to chart patterns of change in the direct economic representation in federal Canadian politics. Specifically, we ask, have the economic backgrounds of parliamentarians become more heterogeneous, reflecting a widening or democra- tizing of the economic interest groups in the House of Commons? Our data include information on both candidates and elected members. In addition we assess possible changes in the economic backgrounds of Cabinet Ministers.
R E S E A R C H Q U E S T I O N S
To study changes in the economic representativeness of federal politicians, we examine four related dimensions of democratization.
I/ The ’law of increasing disproportion’ (Aberbach, Putnam, and Rockman, 1981) concerns the relationship between socioeconomic status (SES) and elected representatives. This law holds that relative to the distribution of SES in the general population, i) candidates are disproportionately from high SES positions, ii) elected officials are even more disproportionately from high SES backgrounds, and iii) Cabinet Ministers are yet again more disproportionately from high SES origins. We examine the extent of this triple-tiered disproportion and assess whether it has changed in the past two decades.
2/ Marsh and Ward reported little variation between the Liberals and Conservatives with respect to the occupational origins of members. For the 1974 election Forcese and de Vries (1977: 33) claimed that ‘all the political parties’ had

419 E C O N O M I C B A C K G R O U N D S O F F E D E R A L POLITICIANS, 1965-84
disproportionately more upper SES representatives, although the greater number of teachers among NDP candidates and parliamentarians distinguished them somewhat from the Liberals and Conservatives. Over the last two decades, have the major parties been recruiting candidates and MPS of similar SES backgrounds?
3/ Recognizing the regional specialization of the Canadian economy, it is reasonable to ask whether the economic backgrounds of candidates and parliamen- tarians vary accordingly. Marsh (1940: 418) reported that the 'tendency for parties and electors to select lawyers is less evident in Western constituencies, but there is a marked preference for them in Quebec'. To what extent do regional differences persist in the pre-political backgrounds of representatives?
4/ Early observers of Canadian politics were silent on issues of gender differences. Few women pursued political careers and their relative absence raised little critical comment. Given the recent growth in the number of women candidates and MPS, it is important to assess whether their increasing involvement has altered the economic character of political representation.
To examine these interrelated questions we rely on information from official reports of the Chief Electoral Office for the seven elections between 1965 and 1984. 'Occupation' listings were provided by all candidates completing nomination papers ( N = 8,673; excluding by-elections).' We follow Forcese and de Vries (1977) in taking this information at face value.
Occupation was coded into broad socio-economic categories following Pineo, Porter, and McRoberts (1977: 98). The six categories are as follows: i) business owners, self-employed professionals, and top level executives or managers; ii) employed professionals, middle managers and executives; iii) other white collar workers; iv) blue collar workers; v) farmers; and vi) others (including students, retirees, housewives).
We contrast the pre-election careers of all political candidates with comparable distributions of the general population. This required some method of generating equivalent information on occupational distributions for each electoral period. Following Forcese and de Vries (1977) we use Census information as our source and report the distribution of the total population according to the six-fold classification noted above for 1961, 1971, and 1981.3
M E T H O D S A N D A N I L L U S T R A T I V E E X A M P L E
Our central interest is in examining changes in the democratization of parliament. We accomplish this by comparing the occupational distribution of the general population with the pre-political careers of federal candidates and elected MPS. To illustrate our strategy we continue a theme of Weber, Marsh, Ward, and Porter by concentrating on the legal profession.
In 1965 only a fraction of the Canadian population (approximately 0.1 per cent of people aged 18 and over) were members of the legal profession (judges, magistrates, lawyers, and n ~ t a r i e s ) . ~ However, in the 1965 election 143 candidates had legal backgrounds (14.1 per cent of all candidates) and 66 law professionals were elected (24.9 per cent of all elected members). Among candidates, members of the legal profession were overrepresented by a factor of 141 and as elected MPS they were overrepresented by a factor of 249. Lawyers were not only overrepresented,

420 N E I L G U P P Y , S A B R I N A F R E E M A N , A N D S H A R I B U C H A N
but as Aberbach, Putnam, and Rockman’s law maintains, the disproportion increases as the focus shifts from candidates to elected officials.
By 1981 there were 36,105 practising law professionals constituting just under 0.2 per cent of Canadians over the age of 17. The proportion of candidates with law backgrounds seeking office in 1984 had declined to 8.6 per cent (from 14.1 per cent in 1965). The proportion of elected lawyers had also dropped relative to 1965, and stood at 16.3 per cent (down from 24.9 per cent). Individuals with backgrounds in law were still overrepresented as candidates (by a factor of 43) and in parliament (by a factor of 81.5), but over the two decades their dominance had declined. In sum, the overrepresentation of legal professionals was greater among MPS than candidates in both elections although the size of the disproportion had diminished.
This example illustrates our analysis and also highlights the complexity which our strategy encounters. There are two dimensions of change involved in considering representation. The first concerns the growth or decline in the numbers of people in any of our six categories. The second involves growth or decline among either candidates or MPS. Since these processes of growth and decline can work in tandem or in opposition, we need a direct, summary measure of over- or under-representation.
A direct measure of representativeness comes from dividing the percentage of candidates or elected representatives by the corresponding percentage for the general population (at equivalent time periods). For example, in the 1960s, 56.1 per cent of elected officials were in the owner/self-employed professional category, compared to only 4.7 per cent of the general population. These percentages correspond to an overrepresentation by a factor of 11.9 (56.d4.7). Expressed in an alternate manner, these elected officials were represented 11.9 times more frequently than would be expected given the general population distribution. These ratios of candidates or elected officials relative to the general population appear in parentheses in Table I. The size of these numbers directly summarizes the degree of over- or under-representation relative to the distribution of the general population.
RESULTS
We begin by assessing the SES backgrounds of politicians and examining whether there has been any democratization in economic representation in the last two decades. The overall pattern of democratization shows that for candidates there is a very small change toward greater representativeness over time. The percentage of candidates from the first two categories shows this slight decline (from 69.7 per cent in the 1960s to 67.3 per cent in the 1980s). The reason is that more fringe party candidates are running and these candidates are more likely to come from the lower four SES categories.5
For elected MPS exactly the reverse occurs; they have become less representative of the general population. In the 1960s,77.3 per cent of MPS came from the top two SES categories, a percentage which increased by 7.0 points in the 1970s and by a further 3.6 points in the 1980s. Therefore, while candidates for federal political office are coming to represent the Canadian populace more widely, over the past
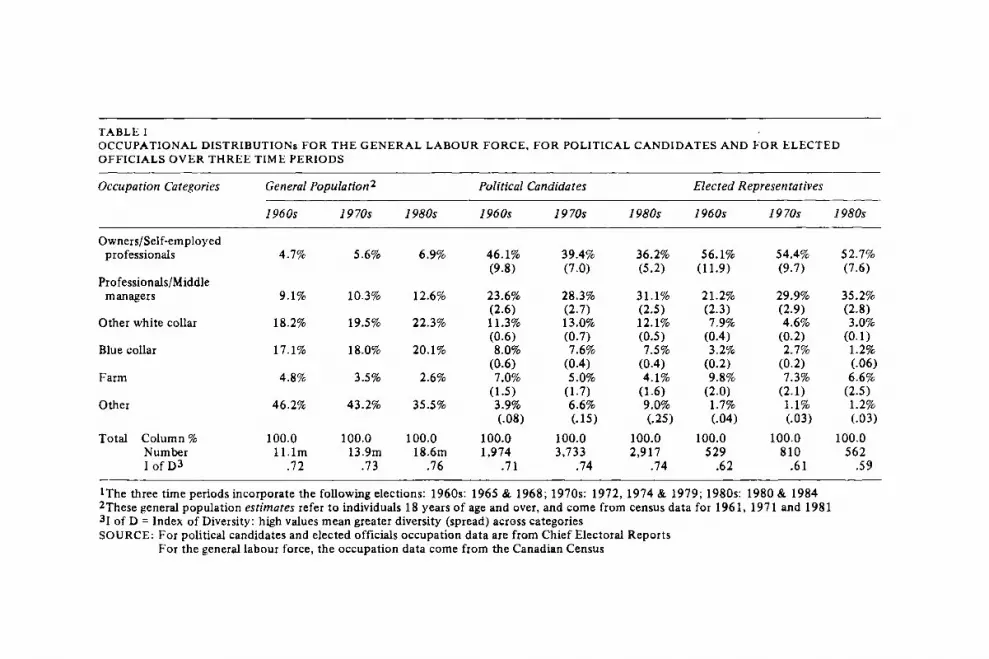
TABLE I OCCUPATIONAL DISTRIBUTIONS FOR THE GENERAL LABOUR FORCE, FOR POLITICAL CANDIDATES AND FOR ELECTED OFFICIALS OVER THREE TIME PERIODS
Occupation Categories General Population2 Political Candidates Elected Representatives ~~~~ ~ ~
1960s 1970s 1980s 1960s I 9 70s 1980s 1960s 1970s 1980s
Owners/Self-employed professionals
Professionals/Middle managers
Other white collar
Blue collar
Farm
Other
Total Column% Number I of ~3
4.7%
9.1%
18.2%
17.1%
4.8%
46.2%
100.0 1 l . lm
.72
5.6%
10.3%
19.5%
18.0%
3.5%
43.2%
100.0 13.9m
.73
6.9%
12.6%
22.3%
20.1%
2.6%
35.5%
100.0 18.6m
.76
46.1% (9.8)
23.6% (2.6) 11.3% (0.6) 8.0%
(0.6) 7.0%
(1.5) 3.9% (.08)
100.0 1,974
.71
39.4% (7.0)
28.3% (2.7) 13.0% (0.7) 7.6%
5.0%
6.6% (.IS)
(0.4)
(1.7)
100.0 3,733
.74
36.2% (5.2)
31.1% (2.5) 12.1% (0.5) 7.5%
4.1% (1.6) 9.0%
(0.4)
(. 25 100.0 2,917
.74
56.1% (1 1.9)
21.2% (2.3) 7.9%
3.2% (0.2) 9.8%
(2.0) 1.7% (.04)
(0.4)
100.0 5 29
.62
54.4% (9.7)
29.9% (2.9) 4.6%
(0.2) 2.7% (0.2) '7.3% (2.1) 1.1% (.03)
100.0 810
.6 1
52.7% (7.6)
35.2% (2.8) 3.0%
(0.1) 1.2% (.06) 6.6%
(2.5) 1.2% (.03)
100.0 562
.59
1The three time periods incorporate the following elections: 1960s: 1965 & 1968; 1970s: 1972,1974 & 1979; 1980s: 1980 & 1984 2These general population estimates refer to individuals 18 years of age and over, and come from census data for 1961, 1971 and 1981 31 of D = lndex of Diversity: high values mean greater diversity (spread) across categories SOURCE: For political candidates and elected officials occupation data are from Chief Electoral Reports
For the general labour force, the occupation data come from the Canadian Census

TABLE 11 PRE-POLITICAL BACKGROUNDS OF CANDIDATES AND ELECTED MEMBERS BY MAJOR POLITICAL PARTY
Background Categories All Candidates
Lib PC NDP
Owners/Self-employed professionals ProfessionalslMiddle managers Other white collar Blue collar Farm Other Total Column%
Number I of D1
56.8% 56.9% 21.5% 23.3% 5.9% 7.2% 1.8% 2.6% 5.8% 7.8% 2.1% 2.2%
100.0 100.0 1898 1900
.59 .6 1
~~
30.5% 37.4% 1 1.9% 9.5% 4.2% 6.5%
100.0 1863
.I4
Elected Representatives
Toral Lib PC NDP Total
48.2% 51.1% 56.1% 34.5% 54.1% 29.3% 32.2% 21.6% 48.0% 29.0% 8.3% 4.8% 4.8% 6.2% 4.9% 4.6% 2.0% 1.6% 6.2% 2.2% 6.0% 2.6% 14.0% 3.4% 7.8% 3.6% 1.3% 1.3% 1.1% 1.4%
100.0 100.0 100.0 100.0 100.0 5661 836 820 171 1833
.5 1 .6 1 .64
11 of D = Index of Diversity: high values mean greater diversity (spread) across categories

423 E C O N O M I C B A C K G R O U N D S O F F E D E R A L P O L I T I C I A N S , 1965-84
two decades elected MPS have increasingly come from selective economic backgrounds.
The opposing temporal patterns for candidates and MPS can be seen by comparing time trends in scores on the Index of Diversity (a measure of how concentrated frequencies are in specific categories [see Bohrnstedt and Knoke, 1982: 75-61). The greater representativeness of candidates across the six categories from the 1960s to the 1980s is seen in diversity scores which grew from . 7 i to .74 (a higher score indicating more diversity, less concentration). Conversely, among MPS the decreasing representativeness is evident in lower diversity scores, declining from .62 to .59. While neither change is large, the opposing directions of movement are consistent across the three periods, underscoring the significance of the percentage changes noted above.
The 'law of increasing disproportion' If the 'law of increasing disproportion' accurately reflects the Canadian experience, then in high SES categories elected officials should be more overrepresented than candidates, who in turn should be disproportionately overrepresented relative to the general population. In lower SES categories the reverse should hold.
Good support exists for this claim. Among the highest SES group, candidates in the 1980 period were overrepresented by a factor of 5.2 while elected officials were overrepresented by a factor of 7.6. This greater disproportional representation also holds for the two earlier periods, although the magnitude of overrepresentation is weakening more quickly for candidates (from 9.8 to 5 .2 - a 47 per cent change) than for MPS (from 11.9 to 7.6 - a 36 per cent change). In the second highest SES category, the rule holds in two out of three cases and almost holds in the third instance.
The only major exception among the lower four SES categories occurs for farmers. While the relative number of farmers in the general population has declined, farmers have been consistently overrepresented among both candidates and elected officials. However, since many of these individuals are probably farm owners, they m a y more accurately be classified as coming from among the ranks of a well-to-do farming elite.
Differences by Political Party One theme in Canadian political commentary is the 'tedious similarity' (McLeod, 1965: 3) among the major parties. We assess this claim by cross-tabulating political party and the pre-political occupations of candidates and elected officials (Table 111).
For candidates, an NDr-other split can be shown by partitioning the chi square (of 524.8) for the entire Table into two components (see Blalock, 1979: 297-9). A first component is formed by comparing Liberal with Conservative candidates. The chi square is 17.1 and suggests relatively little major difference. A second component comes from comparing NDP candidates to those in the other two parties, and yields a chi square of 509.5 showing this to be the major contrast. Among candidates the NDP nominates decidedly more people from outside the top two SES categories.

424 NEIL GUPPY, S A B R I N A F R E E M A N , A N D S H A R l B U C H A N
TABLE 111
GENDER
Background Categories All Candidates Elected Representatives
PRE-POLITICAL BACKGROUNDS OF CANDIDATES A N D ELECTED MEMBERS BY
Women Men Women Men
Owners/Self-employed professionals
Professionals/Middle managers
Other white collar Blue collar Farm Other Total Column%
Number I of D1
20.9%
31.5% 13'.8% 12.0% 0.8%
21.1% 100.0
901 -78
42.1%
27.8% 12.2% 7.2% 5.7% 5.1%
100.0 7222
.72
35.7%
54.3% 2.9% 1.4% 0.0% 5.7%
100.0 70 .5 7
55.1%
28.1% 5.1% 2.5% 8.1% 1 .1%
100.0 1831
.6 1
11 of D = Index of Diversity: high values mean greater diversity (spread) across categories
For elected MPS, there is also a contrast between the NDP and the other two parties. Successful NDP candidates most often come from the employed profession- al and middle management ranks (48.0 per cent), although owners and self- employed professionals are heavily represented (34.5 per cent).6 This contrasts with the pattern of the Liberals and Conservatives. But for the other two parties a much sharper difference exists among elected officials than was the case for their candidates. Although for both these parties officials tend to come from the top two SES categories, MPS from farming backgrounds are much more likely to be found in the Tory caucus than among Liberal M P S . ~
Another key difference between the parties is the degree to which their respective candidates and MPS reflect the diversity among Canadians. While no party perfectly represents the general backgrounds of all Canadians, the NDP nevertheless come the closest, but only with respect to candidates. Notice that New Democrat MPS are as likely as Liberals or Conservatives to come from the top two SES categories. A comparison of the Index of Diversity scores along the bottom row of Table 11 clearly depicts this pattern.
There have also been changes over the past two decades in the recruitment patterns of the major parties. For the Liberals and NDP, in the 1980s more candidates and more MPS came from employed professional or middle management positions. However, for MPS this change has opposite sources in both parties. In the 1960s just over 25 per cent of NDP MPS came from blue collar or lower white collar backgrounds, but in the 1980s this representation had eroded to less than 4 per cent. For the Liberals, the major change occurred among MPS from the top executive or self-employed professional ranks who, although now holding 50 per cent of Liberal seats, had in the 1960s held over 63 per cent of their seats.
For the Progressive Conservative party change has been somewhat less dramatic. Almost one in four Conservative MPS had occupational backgrounds in farming in the 1960s, but this has declined to just under one in ten in the most

425 E C O N O M I C B A C K G R O U N D S O F F E D E R A L P O L I T I C I A N S , 1965-84
recent elections. Some of this apparent decline in the relative fortunes of Conservative MPS from agricultural backgrounds has come because of the party’s success in non-agricultural areas. Nevertheless, there are fewer Conservative farmers in the House in the 1980s than during the late 1960s.
Table I reveals that over the last two decades candidates have become marginally more representative of the Canadian population but that MPS are increasingly from the top two SES categories. Controlling for party and examining the representa- tiveness of MPS in the last two elections, the NDP have a greater proportion of their MPS from the top two SES categories (56 of 61 MPS - 91.8 per cent) than do the Tories (267 of 3x3 - 85.3 per cent). While the Conservatives have held their base among Western farmers, the more recent NDP success has been in urban ridings where their professional members have been elected. Over the last two decades, the greater selectivity in the backgrounds of all MPS is primarily a consequence of the growing professional representation among successful NDP candidates.
Regional Differences Given the manufacturing industries of central Canada and the resource bases of the rest of the country, differences in regional representation might not be surprising. However, the most notable feature of regional comparisons is the remarkable consistency in the dominance of the top SES categories, with the only major exception coming in the larger farm representation from the West. Among candidates, Quebec has a somewhat distinctive profile with an underrepresentation in farming and an overrepresentation in the ’other’ category (as a consequence of greater student participation in federal politics). For MPS the West is the region of difference, largely due to the agricultural representation.8
Gender Differences We turn next to the issue of whether or not the increasing participation of women has introduced any change in the economic representativeness of candidates and MPS. Table 111 shows gender differences in the pre-political careers of both candidates and MPS. While female candidates are more representative of the Canadian population than their male counterparts (compare the Index of Diversity scores), women MPS are a more select group with 90 per cent coming from the top two SES categories (versus 83.2 per cent for men). While women candidates better represent the general population distribution, women MPS do not. Not only is it ’the higher, the fewer’ with respect to the national political participation of women (Bashevkin, 1985; cf., Kopinak, 1985). but also ’the fewer, the higher’ in terms of women and SES. This finding appears to reflect a double standard wherein women must demonstrate greater achievement than men in the economic arena before they can succeed at the polls (see Carroll, 1985: 66-70 for a U.S. comparison).9
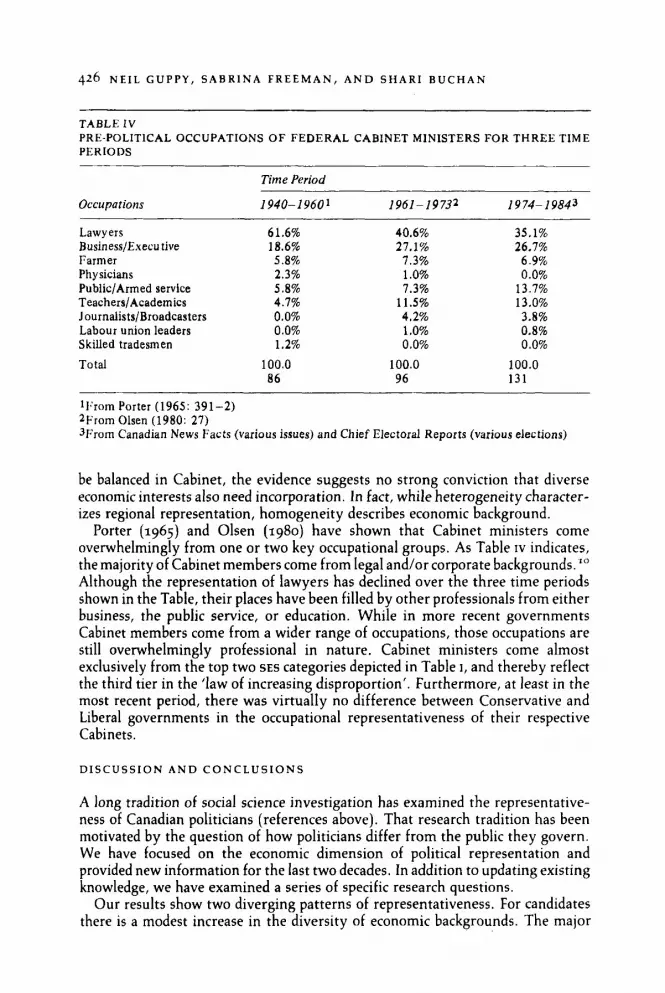
Cabinet Representation One final area in which the issue of representativeness has always been acute is in the composition of the federal Cabinet. Dawson (1948) and Smith (1985) have articulated the theme of Cabinet representativeness, noting that many believe a good Cabinet must represent the key sectoral interests that crosscut Canadian society. But while there appears to be a consensus that geographic interests must
426 NEIL G U P P Y , S A B R I N A F R E E M A N , A N D S H A R I B U C H A N
~ ~~ ~~~~
TABLE I V
PERIODS PRE-POLITICAL OCCUPATIONS OF FEDERAL CABINET MINISTERS FOR THREE TIME
Time Period
Occupations 1940-19601 I961 - I 9 732 1974- 19843 ~ ~~~
Lawyers 61.6% 40.6% 35.1% Business/Execu tive 18.6% 27.1% 26.7% Farmer 5.8% 7.3% 6.9% Physicians 2.3% 1 .O% 0.0% PubliclArmed service 5.8% 7.3% 13.7% Teachers/Academics 4.7% 11.5% 13.0% Journalists/Broadcasters 0.0% 4.2% 3.8% Labour union leaders 0.0% 1 .O% 0.8% Skilled tradesmen 1.2% 0.0% 0.0% Total 100.0 100.0 100.0
86 96 131
1From Porter (1965: 391-2) ?From Olsen (1980: 27) 3From Canadian News Facts (various issues) and Chief Electoral Reports (various elections)
be balanced in Cabinet, the evidence suggests no strong conviction that diverse economic interests also need incorporation. In fact, while heterogeneity character- izes regional representation, homogeneity describes economic background.
Porter (1965) and Olsen (1980) have shown that Cabinet ministers come overwhelmingly from one or two key occupational groups. As Table IV indicates, the majority of Cabinet members come from legal and/or corporate backgrounds.'" Although the representation of lawyers has declined over the three time periods shown in the Table, their places have been filled by other professionals from either business, the public service, or education. While in more recent governments Cabinet members come from a wider range of occupations, those occupations are still overwhelmingly professional in nature. Cabinet ministers come almost exclusively from the top two SES categories depicted in Table I, and thereby reflect the third tier in the 'law of increasing disproportion'. Furthermore, at least in the most recent period, there was virtually no difference between Conservative and Liberal governments in the occupational representativeness of their respective Cabinets.
D I S C U S S I O N A N D C O N C L U S I O N S
A long tradition of social science investigation has examined the representative- ness of Canadian politicians (references above). That research tradition has been motivated by the question of how politicians differ from the public they govern. We have focused on the economic dimension of political representation and provided new information for the last two decades. In addition to updating existing knowledge, we have examined a series of specific research questions.
Our results show two diverging patterns of representativeness. For candidates there is a modest increase in the diversity of economic backgrounds. The major

427 E C O N O M I C B A C K G R O U N D S O F F E D E R A L P O L I T I C I A N S , 1965-84
reason tor this is the growth of fringe parties participating in the electoral process. In addition, the growing participation of women has contributed to a broader representation of political candidates.
For MPS there has been a growing homogeneity of economic background. Over the two decades we examined, the percentage of parliamentarians coming from the top two SES categories has grown from 77.3 to 87.9 per cent. One of the most striking findings here is that a substantial portion of that increase comes from members of the NDP. What makes this finding even more startling is its distinctiveness vis-a-vis other electoral communities. For example, Aberbach, Putnam, and Rockman (1981: 82) note that ’while the secular conservative parties are bastions of those with upper-status backgrounds, the left wing especially seeks people from lower-status backgrounds to present to the electorate’. The absence of this pattern in Canadian federal politics may contribute to the explanation of the relative lack of class voting in this country (Horowitz, 1966).
With respect to Aberbach, Putnam, and Rockman’s (1981) ’law of increasing disproportion,’ we found that for candidates, MPS, and Cabinet Ministers respectively, the higher SES groups were increasingly overrepresented. We did note, however, that this law appears to be weakening. When comparing men and women in federal politics this law has been re-expressed by Bashevkin (1985) as ’the higher, the fewer’. Men, and higher SES groups, are grossly overrepresented in politics.
Regional representation by SES does not appear to differ. In the Cabinet regional representation is carefully balanced, although economic interest groups are not equally represented in this powerful body.
Reflecting on earlier findings, previous commentators (e.g., Marsh, 1940; Ward, 1950; Porter, 1965) have been quick to note that ’there is no essential reason why a Parliament should be an exact microcosm of the occupational structure . . . ‘ (Marsh, 1940: 423). This view would seem to represent the majority opinion among political observers; few have noted that ‘there is no essential reason’ that a highly specialized and privileged fragment of Canadians should represent the views of an economically diverse population.
Marchak (1981: 67-8) suggests that the economic composition of Parliament is important to the question of whether or not ’government is an independent institution representing everyone equally . . .‘ She argues that since politicians come overwhelmingly from upper SES backgrounds, they could not represent the views of the total population, even if they were willing to do so.
The logic of this position rests not on ‘interest group representation’ but on social perspective. As Porter (1965: 391) makes the case:
If we accept Mannheim’s persuasive argument that a person’s beliefs about social reality are shaped by the social milieu to which he [or she] has been exposed, we can see that the definitions of reality which provide the framework for making political deci- sions depend much on the social background and life experiences of politicians. The pre- dominance of some occupational groups and people of one class background means that limited perspectives are brought to bear on public issues.
Whether or not one accepts the force of this position, the fact remains that the homogeneity of economic background on which the argument rests has become

428 N E I L GUPPY, S A B R I N A FREEMAN, A N D S H A R I B U C H A N
even more concentrated since Porter’s remarks. Evidence contrary t o what we have found would have seriously weakened this position.
When we consider voting, a review of the historical record shows the increasing political integration of t h e working class and women. However, with regard to direct economic representation, no significant broadening of participation has occurred. In fact, over the last twenty years federal politicians have come increasingly from the highest SES circles. While lawyers a re now less involved i n politics than Weber (1946: 94) foresaw, i t remains t h e case that a privileged economic elite and modern parliamentarians ‘absolutely belong together’.
NOTES
1 Between 5 and 10 per cent of candidates do not participate in the paid labour force. In the ’occupation’ category on the official nomination paper they would list such statuses as student, housewife, and retired. For 49 candidates no useable ‘occu- pation’ information was listed (e.g., no listing, ‘Thinker,’ ’Dilettante’). Missing data occur mainly among candidates from fringe parties (e.g., Rhinoceros Party). The reliability of self-reports is contentious since some candidates may inflate their occupa- tional credentials believing that candidates from higher SES backgrounds are more successful. Conversely, the blatant exaggeration of one’s job could be very costly if candidates are seen to be running under false pretenses.
2 This six-fold classification of ’occupational categories’ is arrayed from high to low SES.
Alternative coding schemes were tested and our results are consistent across alter- nate coding patterns.
3 For census information we use estimates of the activities of the population 18 years of age and over. This coincides with the age requirements for both electors and candidates.
4 This 1965 estimate is based on 1961 Census data. This estimating procedure is less than ideal, but is the only feasible strategy since accurate occupation distributions for the general population are consistently available only in Census years.
5 Whereas 79.6 per cent of all candidates ran for major parties in the 19605, this had declined to 57.7 per cent by the early 1980s. Furthermore, in the 19805, 81.1 per cent of major party candidates but only 48.4 per cent of other candidates came from thi! top two SES categories.
6 The early example of law reflects part of this NDP-other split. The respective percent- ages for lawyers among Liberal, Conservative, and NDP candidntes is 22.2 , 20.2,
and 4.5 per cent. For all parties, but especially for the NDP, lawyers are more likely than other candidates to be successful. The respective percentages for MPS from legal backgrounds in the three parties are 24.9, 22.9, and 10.1 per cent. A focus on lawyers does, however, underemphasize the high SES backgrounds of most NDP MPS.
7 The overall chi square for the crossclassification of party and pre-political background among MPS is 144.1. For the NDP-other contrast the partitioned chi square is 58.8 whereas the Liberal-Conservative contrast reveals a chi square of 82.7.
8 Marsh’s (1940: 418) early finding of Quebecer’s ’marked preference’ for lawyers is not supported in more recent elections. Among MPS, lawyers predominate in the Atlantic provinces (30.7 per cent) and in Ontario (25.9 per cent). His other finding, however, that in the West electors choose lawyers as political representatives less often, is borne out in the more recent data. Among Western MPS only 14.5 per cent have legal backgrounds. Of Quebec MPS, 20.5 per cent have legal training.

429 E C O N O M I C B A C K G R O U N D S O F F E D E R A L P O L I T I C I A N S , 1965-84
9 We are exploring this particular question in a separate paper focused exclusively on
10 In order to preserve a comparison with the earlier work of Porter (1965) and Olsen gender and electoral success.
(1980), we retain their occupation categories.
REFERENCES
Aberbach, Joel, Robert Putnam, and Bert Rockman 1981 Bureaucrats and Politicians in Western Democracies. Cambridge: Harvard University
Press Bashevkin, Sylvia 1985 Toeing the Lines: Women and Party Politics in English Canada. Toronto: University
Blalock, Hubert 1979 Social Statistics. New York: McGraw-Hill Bohrnstedt, George, and David Knoke 1982 Statistics for Social Data Analysis. Peacock Publishing Carroll, Susan 1985 Women as Candidates in American Politics. Bloomington: Indiana University Press Chief Electoral Office various years Report of the Chief Electoral Officer. Ottawa: Minister of Supply and
Dawson, R.M. 1948 The Government of Canada. Toronto: The University of Toronto Press Forcese, Dennis, and John de Vries 1977 ’Occupation and Electoral Success in Canada: the 1974 Federal Election.’ Canadian
Fox, John, and Michael Ornstein 1986 ‘The Canadian State and Corporate Elites in the Post-War Period.’ Canadian Review
Horowitz, Gad 1966 ’Conservatism, Liberalism, and Socialism in Canada: An Interpretation.’ Canadian
Kopinak, Kathryn 1985 ‘Women in Canadian Municipal Politics: Two Steps Forward, One Step Back.’ Cana-
dian Review of Sociology and Anthropology 22(3): 395-410 Marchak, Pat 1981 Ideological Perspectives on Canada, 2nd ed. Toronto: McGraw-Hill Marsh, Leonard 1940 Canadians In and Out of Work. Oxford University Press McLeod, John T. 1965 ’Party Structure and Party Reform’ in A. Rotstein (ed.), The Prospect of Change:
Ogmundson, Rick 1977 ’A Social Profile of Members of the Manitoba Legislature i950,1960,i970.’ Journal
Olsen, Dennis 1980 The State Elite. Toronto: McClelland and Stewart
of Toronto Press
Services, Cat. SE 1-1
Review of Sociology and Anthropology I&): 331-40
of Sociology and Anthropology z ~ ( 4 ) : 481-506
Journal of Economics and Political Science 32(2)
Proposals for Canada’s Future. Toronto: McGraw-Hill
of Canadian Studies 12(4): 79-84

430 NEIL GUPPY, S A B R I N A F R E E M A N , A N D S H A R I B U C H A N
Pineo, Peter, John Porter, and Hugh McRoberts 1977 'The 1971 Census and the Socioeconomic Classification of Occupations.' Canadian
Review of Sociology and Anthropology 14(1): 91-102 Porter, John 1965 The Vertical Mosaic. Toronto: University of Toronto Press Presthus, Robert 1973 Elite Accommodation in Canadian Politics. Cambridge: Cambridge University Press Smith, David E. 1985 'The Federal Cabinet in Canadian Politics.' In M. Whittington and G. Williams
Ward, Norman 1950 The Canadian House of Commons: Representation. Toronto: University of Toronto
Weber, Max 1946 'Politics as a Vocation.' In H. Gerth and C. Wright Mills (eds.), From Max Weber
(eds.), Canadian Politics in the 19805, 2nd ed. Toronto: Methuen
Press
Essays in Sociology. New York: Oxford University Press
The Canadian 4 7
Welfare State Changes in the Canadian welfare state are tne focus of this collection of essays by leading Canadian Evolution and social scientists.
Transition $30.00 cloth; $15.OO paper
edited by Jacqueline S. lsmael
THE DYNAMICS OF By studying the history of Hutterite soclety and culture, social scientists UnE are offered a rare dimension In anthroDologica1 and sociological An Ana'flica' Approach
- - research.
$27.50 cloth; $16.95 paper Karl A. Peter
The University of Alberta Press a fdrg;Eg;erta T6G 2E8
Related Documents