Research Methodology EPH 7112 LECTURE 6: RESEARCH PLANNING

Research Methodology EPH 7112 LECTURE 6: RESEARCH PLANNING.
Dec 20, 2015
Welcome message from author
This document is posted to help you gain knowledge. Please leave a comment to let me know what you think about it! Share it to your friends and learn new things together.
Transcript
Research Methodology
EPH 7112
LECTURE 6: RESEARCH PLANNING

THE ISSUES
Sometime students are not clear on: 1. How to start 2. What area, what topic 3. How to choose a supervisor 4. What’s the scope 5. How to get data 6. How to analyze
7. When to stop

MATERIALS TO COVER:
PART A: THE PHILOSOPHY
PART B: THE PLANNING
PART C: THE IMPLEMENTATION
Note: the part on “What Your Supervisor Expects from You” is not covered here

THE WHOLE PROCESS OF RESEARCH STUDY
IDENTIFY TOPIC
OBTAINED DATA
IDENTIFY RESEARCH AREA
START
LITERATURE REVIEW
CHOOSE THE SUPERVISOR
DEVELOP STUDY PLAN/MODEL
ANALYZED RESULT
OUTPUT /CONCLUSION
THESIS SUBMISSION
VIVA
THESIS WRITING
EXECUTE RESEARCH
LITERATURE REVIEW

PRODUCING RESULTS
OUTPUT/CONCLUSION
PERFORM ANALYSIS ON
RESULT
START
DATA
RESULT
END
YES
NO
PROCESS GENERATING & COLLECTING DATA
GRAPH, TABLE, CHART

Processes in obtaining data (Quantitative/Qualitative)
Theoretical modeling/Software simulationb. Emulationc. Survey d. Experimental
It’s all about Testing the system under study
Data normally come in the form of Tables
Results normally come in the form of Graphs Charts

Output/Conclusion (the system under study) Working system Product New Process Ingredients Algorithm Programs Formula

Analyzing Results
Results consist of : 1. Presentation of data 2. Analysis Analysis of results must include the explanation on:Design Parameters (Cause) and Performance Parameters (Effects) of the System Under Study.
A comparative analysis is typically required.
SYSTEM UNDER STUDY
DESIGN PARAMETERS
PERFORMANCE PARAMETERS

Output/Conclusion
Conclusion:Targets/Objectives achieved, how much?Which results directly support the conclusion?
Output can be :- 1. Formula 2. Process 3. Algorithm/Program 4. Prototype 5. System

Novelty
1. Theory
2. Process/techniques/fabrications
3. Ingredients/Materials
4. Design/architecture
5. Properties/Characteristics

PART B: THE PLANNING

Study Plan
A Study Plan is a document explaining the plan of the study/research project from its start to the end. It is normally presented in a Gantt chart, and it should clearly show:
1.The research activities2.The continuity of activities3.The period of activities/timeline 4.Deliverables and milestones5.The end goal
Study Plan
It basically addresses the issues of:1. What to do
2. When to do
3. What to achieve
4. When to stop

Deliverables and Milestones
1.All outputs are Deliverables
2.Major outputs are Milestones
A milestone represents an important stage of a project.

A sample study plan
YEAR 2002 2003 2004
MONTH 2 3 4 5 6 7 8 910
11
12 1 2 3 4 5 6 7 8 9
10
11
12 1 2 3 4 5 6
No. Activity
1Literature Review
2Code Development
*
3Computer Simulation
4 Procurements. *
5 Experimentation
6 Result Analysis *
7 Report Writing
Weaknesses of a Study Plan
1. It does not clearly show the structure/scope; depth and width of the project
2. It does not provide the designation of issues under study; general issues,
complementary issues and focused issues
3. It does not adequately indicate the number of results expected of a project
Study Model (K-Chart)
A Study Model is a document explaining the structure, issues and sub-issues under study. It is usually presented in the form of a Tree Diagram. A K-Chart should clearly show:
1. The issues of concern 2. The sub-issues of concern 3. The designation of theory, simulation and experiment 4. The Design and Performance parameters 5. The line of focus 6. The scope (depth and width) of a project

K-Chart should be able to give an idea on:
1. How many results will be obtained.
2. Which results are to be highlighted.
3. How many chapters (and what chapters) will there be.
4. The coverage of the literature review.
5. How many pages the thesis will be.
How to construct a K-Chart
1. Identify the area of study (Main title)2. Identify the main issues under the area of study – these issues
come as branches under the Title3. Identify the sub-issues under the main issues – again as lower
layer branches4. End the issues/sub-issues once you get the required info for you
to decide (which one you want to proceed into the details in)5. Continue step 3 until you reach the data generating methods
(experiment, simulation, survey etc)6. End the structure with a list of Design (DP) and Performance
Parameters (PP) 7. You may have redundant issues and/or redundant DPs/PPs – not
to worry! Whichever way you do, you should end with same results
8. Highlight the tree branches that you want to study/focus
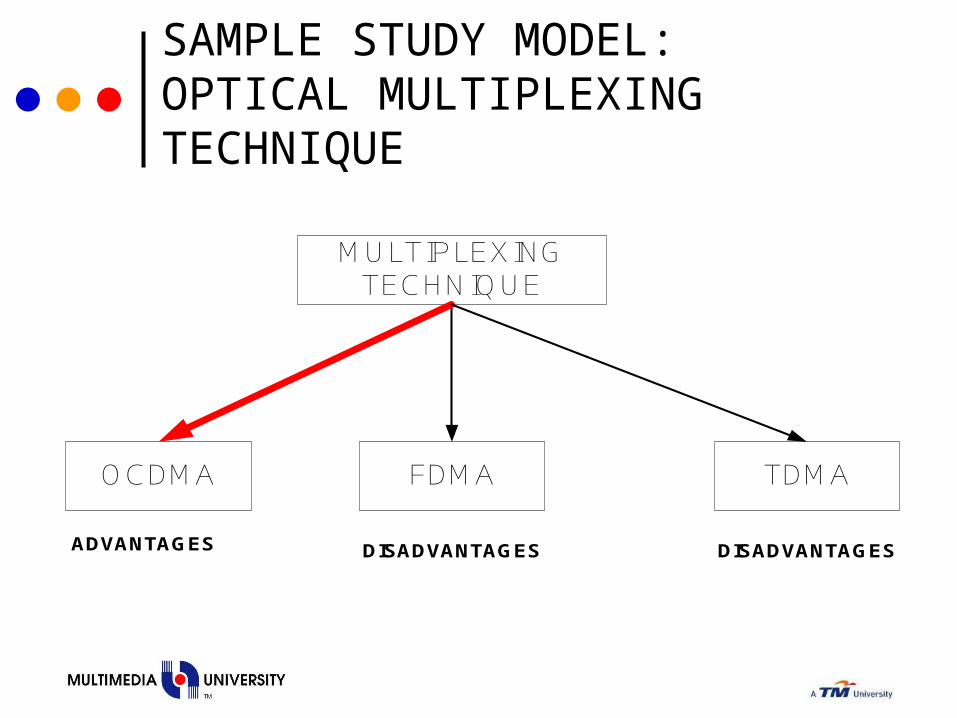
SAMPLE STUDY MODEL:OPTICAL MULTIPLEXING TECHNIQUE
MULTIPLEXING TECHNIQUE
OCDMA FDMA TDMA
ADVANTAGES DISADVANTAGES DISADVANTAGES
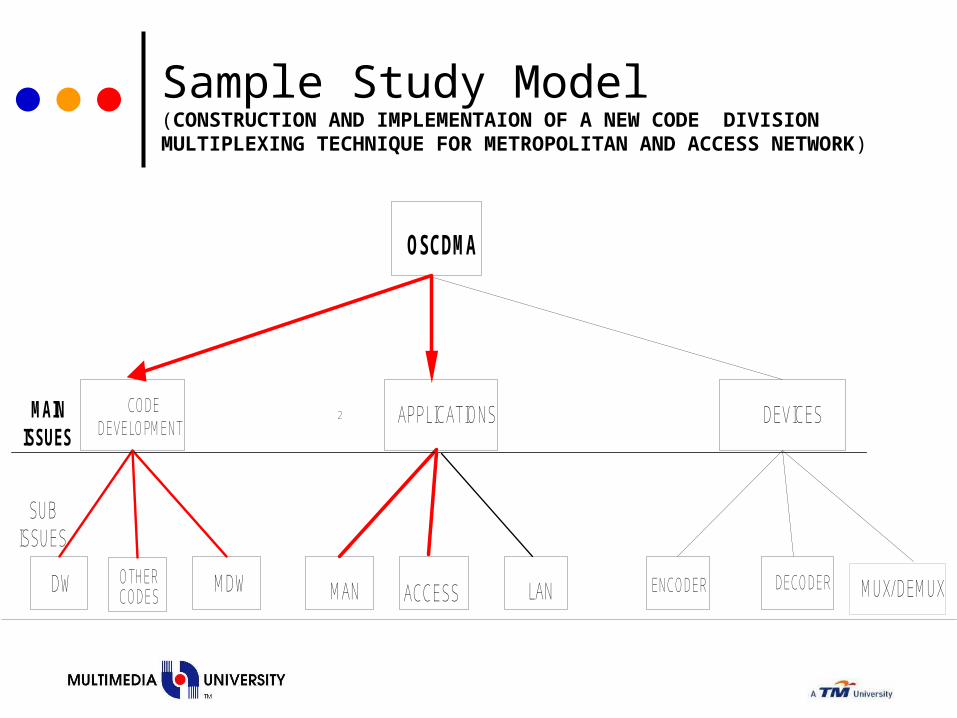
Sample Study Model(CONSTRUCTION AND IMPLEMENTAION OF A NEW CODE DIVISION MULTIPLEXING TECHNIQUE FOR METROPOLITAN AND ACCESS NETWORK)
2
OSCDMA
CODE DEVELOPMENT
APPLICATIONS DEVICES
MAN LAN ACCESS ENCODER DECODEROTHER CODES
MAIN ISSUES
SUB ISSUES
DW MDW MUX/ DEMUX

OS-CDMA APPLICATION
MAN ACCESS
SYSTEM DESIGN(POINT TO POINT )
SYSTEM DESIGN ( POINT
TO MULTIPOINT )
MODULATION TECHNIQUE
SOURCE
SUBTRACTION
TECHNIQUE
DW MDW
MODULATION
TECHNIQUE
SOURCE
SUBTRACTION
TECHNIQUE
APPLICATIONS
MODULATION TECHNIQUE
SOURCE
SUBTRACTION
TECHNIQUE
DW
MDW
MODULATION TECHNIQUE
SOURCE
SUBTRACTION TECHNIQUE
BIT RATEBIT RATE
BIT RATE
BIT RATE
MAIN ISSUE
SUB ISSUES
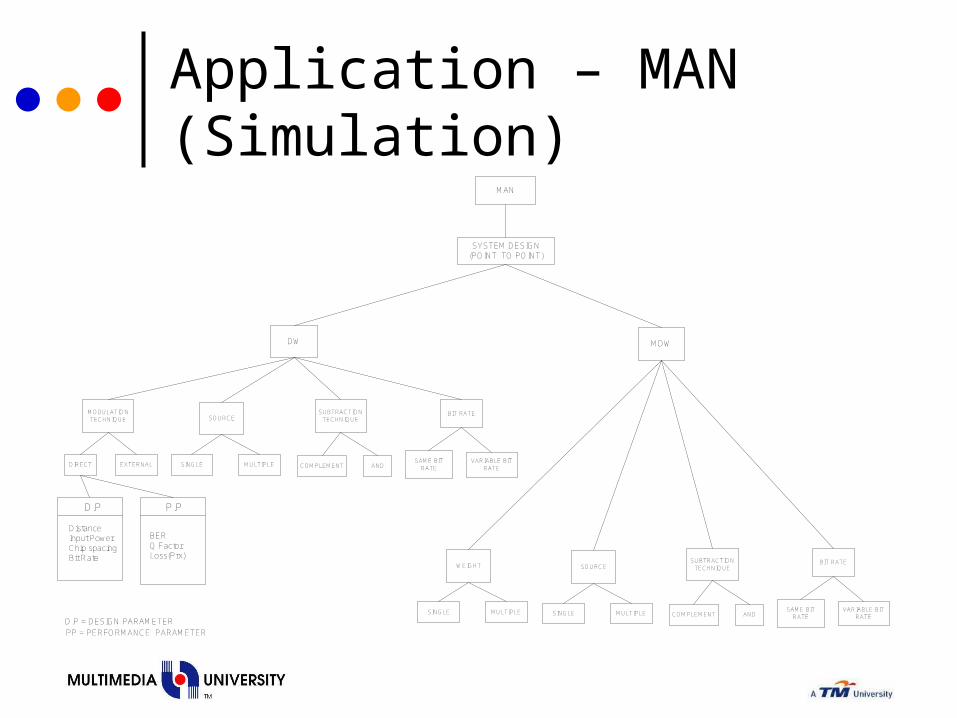
Application – MAN (Simulation)
MAN
SYSTEM DESIGN(POINT TO POINT)
MDW
MODULATION TECHNIQUE SOURCE
SUBTRACTION TECHNIQUE
DW
EXTERNAL SINGLE MULTIPLE COMPLEMENT ANDDIRECT
BIT RATE
SAME BIT RATE
VARIABLE BIT RATE
SOURCESUBTRACTION
TECHNIQUE
SINGLE MULTIPLE COMPLEMENT AND
BIT RATE
SAME BIT RATE
VARIABLE BIT RATE
D.P = DESIGN PARAMETERPP = PERFORMANCE PARAMETER
DistanceInput PowerChip spacingBit Rate
D.P
BERQ FactorLoss(Prx)
P.P
WEIGHT
SINGLE MULTIPLE

MAN
SYSTEM DESIGN( POINT TO POINT)
MODULATION TECHNIQUE SOURCE
SUBTRACTION TECHNIQUE
DW
EXTERNAL SINGLE MULTIPLE COMPLEMENT ANDDIRECT
BIT RATE
SAME BIT RATE
VARIABLE BIT RATE
DistanceInput Power
D.P
BER
Loss ( Prx )
P.P
D. P = DESIGN PARAMETERPP = PERFORMANCE PARAMETER
Application – MAN (Experiment)
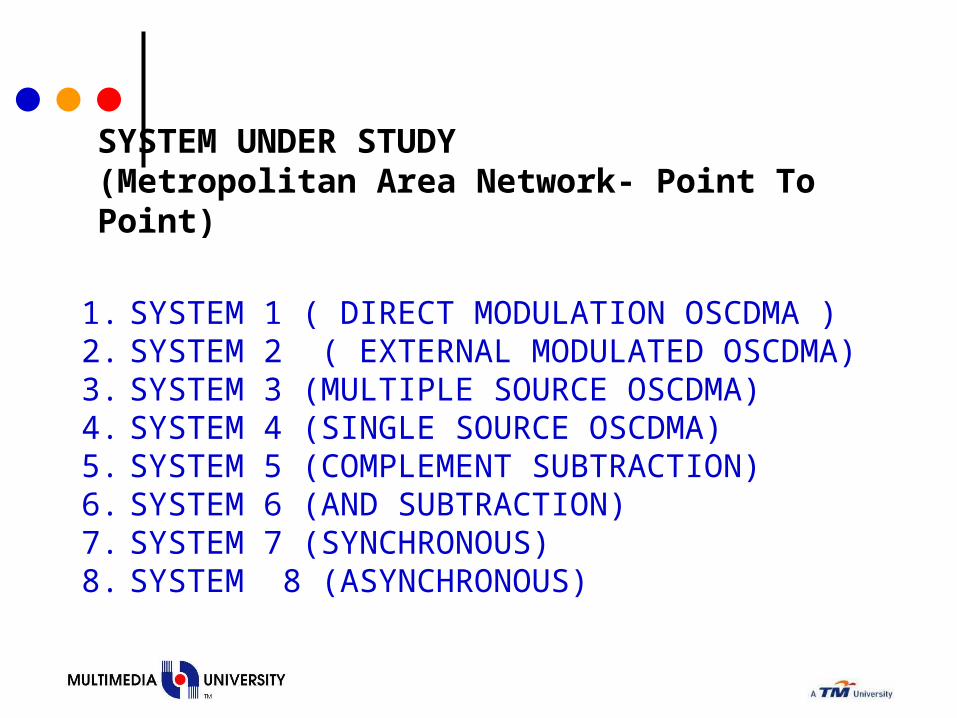
SYSTEM UNDER STUDY(Metropolitan Area Network- Point To Point)
1. SYSTEM 1 ( DIRECT MODULATION OSCDMA ) 2. SYSTEM 2 ( EXTERNAL MODULATED OSCDMA)3. SYSTEM 3 (MULTIPLE SOURCE OSCDMA)4. SYSTEM 4 (SINGLE SOURCE OSCDMA)5. SYSTEM 5 (COMPLEMENT SUBTRACTION)6. SYSTEM 6 (AND SUBTRACTION)7. SYSTEM 7 (SYNCHRONOUS)8. SYSTEM 8 (ASYNCHRONOUS)
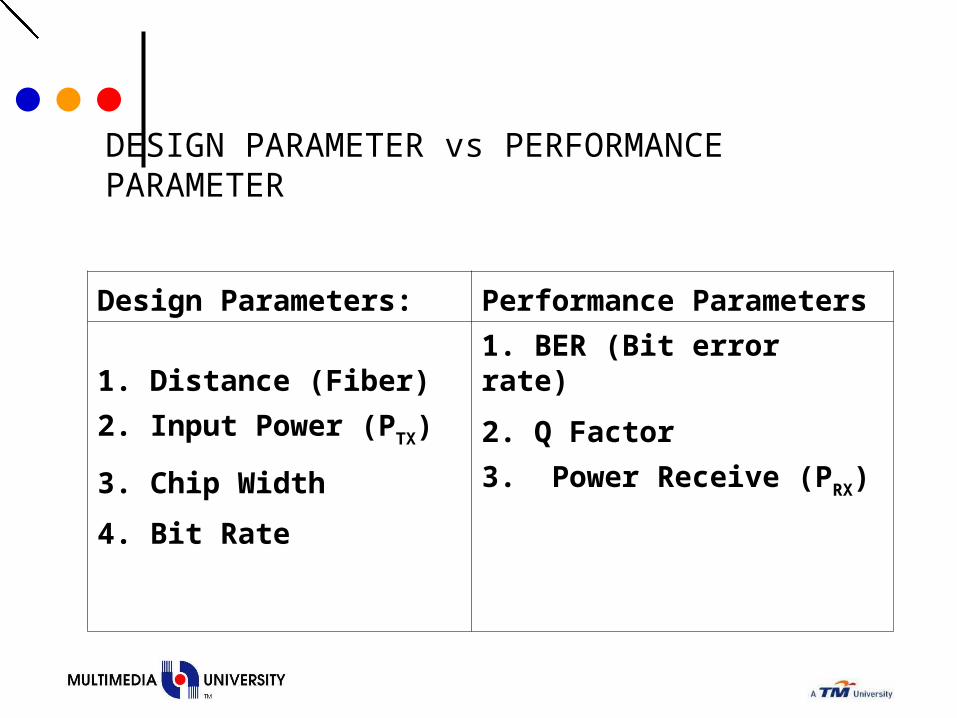
DESIGN PARAMETER vs PERFORMANCE PARAMETER
Design Parameters: Performance Parameters
1. Distance (Fiber) 1. BER (Bit error rate)
2. Input Power (PTX) 2. Q Factor
3. Chip Width 3. Power Receive (PRX)
4. Bit Rate

WHAT STUDY MODELS GIVE US
1. A clear title of project/thesis
2. The scope, and objective (abstract)
3. The un-highlighted issues – Literature reviews (Background reviews, Critical reviews, Problem Statement)
4. Number of results

How to Calculate the Number of Results
No Of Results = No of system x No of Design Parameters x No of Performance Parameters

Example : Total Number Of Results(OSCDMA Project: Metropolitan Area Network Point to Point)
Total Result = 8 (Number Of system) x 4 (Design Parameter) x 3 (Performance Parameter) = 96

PART C: THE IMPLEMENTATIONLITERATURE REVIEWS AND RESULTS ANALYSIS
LITERATURE REVIEWS
Consists of:
1. Background Review (Introduction)
2. Critical Review (throughout the thesis, typically in Problem Statement, conclusions)

LITERATURE REVIEWS
1. Start with text books, white papers, “review’ papers – background review
2. Then, with journal papers (always read more than once, at different times)
3. Review until you have enough info to decide – focus on Advantages & Disadvantages
4. How many references; > 50 for MSc, >100 for PhD
5. Index your references

LITERATURE REVIEWS, con’t
6. Jot down info you get from the references – in your reference note book
7. Focus on strengths/weaknesses of papers

RESULTS PRESENTATION
Typically, engineering research results come in the form of graphs/curves
Graphs: Y vs. X
Y axis – Performance Parameter (Output)
X axis – Design Parameters (Input)

RESULTS PRESENTATION con’t
For Multiple DPs, always present only one at a time. Analyze them individually, then only put them together when necessary (i.e, better presentation)
Note: Many times, students end up producing (too) many results, look different but similar (only realized after going through the analysis). Happens when trying to put multiple DPs at the same time.
RESULTS ANALYSIS, con’t
There are two main elements of analysis:
1. The Trend, 2.The Reason
Trend Parameters: Max, Min, Average (Mean), Slope, Skewness, Mod,Median
Reason: WHY the trend?

Characterization curve (CC) Vs Optimization curve (OC)
CC : Y Vs X1 at Fixed X2
OC : X1 Vs X2 at Fixed Y

THANK YOU
Related Documents