Consumer Preference in Beverage Market RESEARCH METHODOLOGY

Research Methodology
Nov 18, 2014
Consumer Preference in Beveragees Market
Welcome message from author
This document is posted to help you gain knowledge. Please leave a comment to let me know what you think about it! Share it to your friends and learn new things together.
Transcript
Consumer Preference in Beverage Market
RESEARCH METHODOLOGY
Flow of Presentation• Introduction• Research Purpose and Process• Research Objective• Research Design• Data Analysis and Findings• Limitations• Conclusion

Introduction• Beverage market in India is worth $2074.67
million• Major portion of the market dominated by the
carbonated soft drinks but major shift towards the Juice segment
• There was a growth of 31.52% in the Juice segment from 2009 to 2010
• New brands have flooded the market• Need to identify and evaluate the reasons for
the shift in the consumer purchasing pattern
Research Process
• Objective
• Research Design
• Concept, Proposition, Variables, Hypothesis
• Gathering of data
• Analysis of data
• Test, revising of hypothesis
• Conclusion, iteration if necessary

Research Objective• To study the preferences of the people for soft drink beverages, fruit juices, tea, coffee
• To find whether the consumers are aware regarding the adverse effect of soft drinks concerning their health
• To find out the factor(s) that influences the consumer’s consumption of soft drinks
• To test the know-how of the consumers regarding the various existing flavors of soft drinks and fruit juices
•To determine the preference of the consumer in the beverage consumption market

Research Design
Purpose of the Study
•The main aim of this research study is to analyze the preference of people (of different age groups) on consumption patterns of beverages and consumer awareness regarding the health consciousness of consuming each of the beverages.
Concept
1. Stimulus/Option2. Consumers’ beverage preference
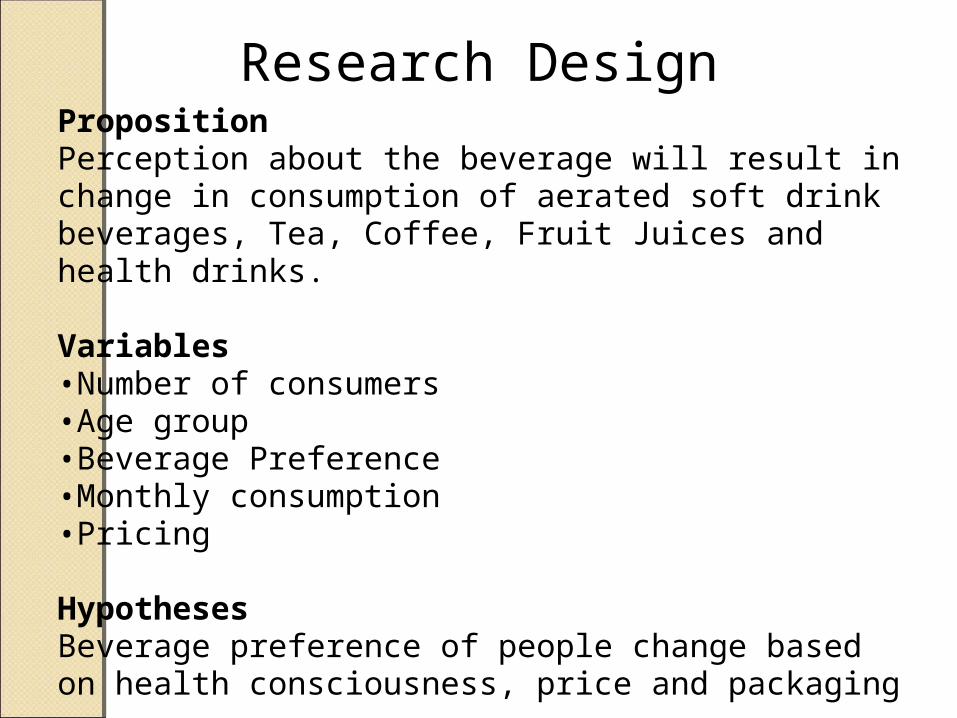
Research DesignPropositionPerception about the beverage will result in change in consumption of aerated soft drink beverages, Tea, Coffee, Fruit Juices and health drinks.
Variables•Number of consumers•Age group•Beverage Preference•Monthly consumption •Pricing
HypothesesBeverage preference of people change based on health consciousness, price and packaging

Research DesignA research design is a framework or blueprint for conducting the marketing research project. It specifies the details of the procedures necessary for obtaining the information needed to structure and/or solve marketing research problem.On the basis of fundamental objectives of the research we have used:
EXPLORATORY RESEARCH
EXPLORATORY RESEARCH
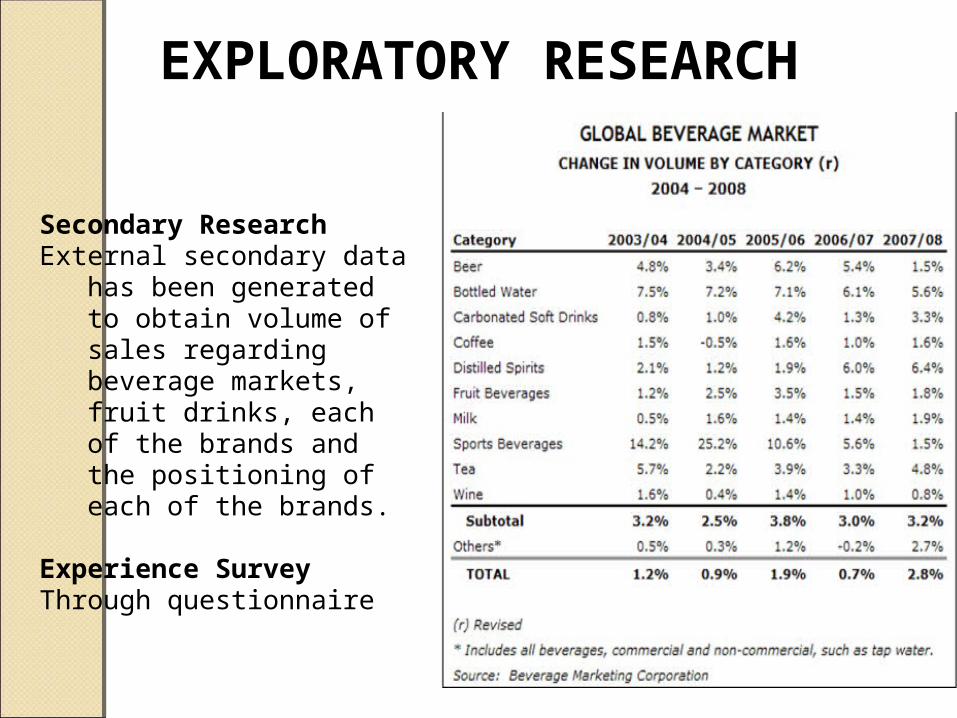
Secondary ResearchExternal secondary data has been
generated to obtain volume of sales regarding beverage markets, fruit drinks, each of the brands and the positioning of each of the brands.
Experience SurveyThrough questionnaire

Conclusion of Exploratory Conclusion of Exploratory researchresearchTetra packing for the product
Selected Fruit Juices over carbonated drinks
Included Milk based Beverages for further research

Sampling TechniqueThis research has used convenience sampling technique.
Convenience sampling technique: Convenience sampling is used in exploratory research where the researcher is interested in getting an inexpensive approximation of the truth. As the name implies, the sample is selected because they are convenient.
SAMPLE SIZE:For the study, a sample size of 88 has been taken
STATISTICAL TOOLS USEDQuestionnairePie ChartsBar Diagrams

Data SourceSOURCES OF DATA COLLECTION:Research will be based on two sources: 1)PRIMARY DATA:
Questionnaire: Primary data was collected by preparing questionnaire and the people were requested to fill them
2) SECONDARY DATA:Secondary data consists of articles, internet and websites
Data Analysis
According to the Data Analysis of people belonging to the different age groups, gender, their beverage preferences, and consumption habits has been carried out
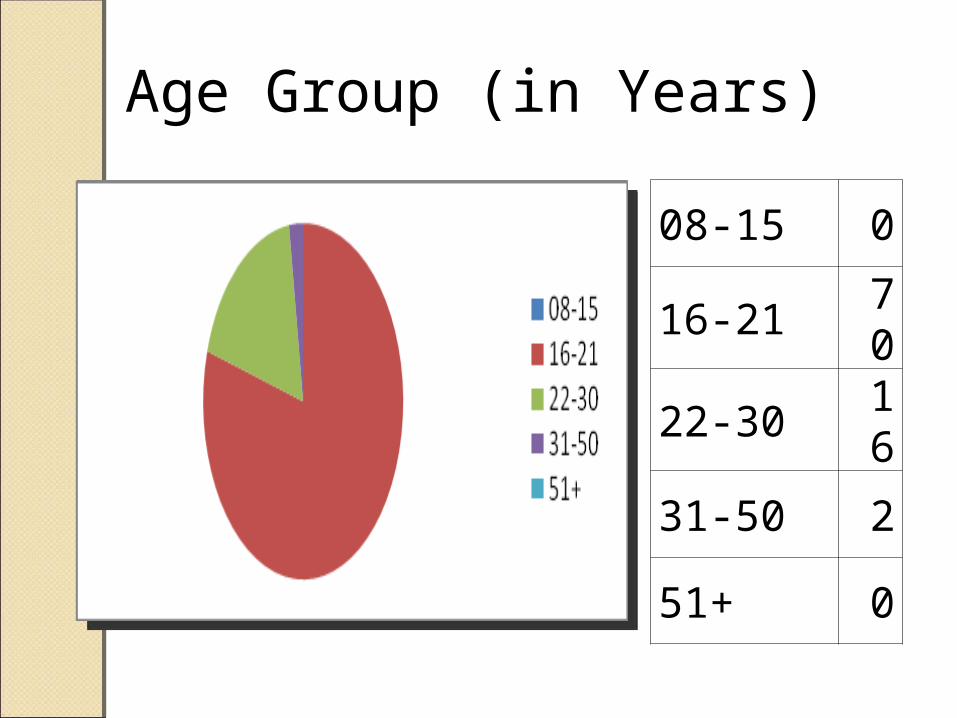
Age Group (in Years)
08-15 0
16-21 70
22-30 16
31-50 2
51+ 0
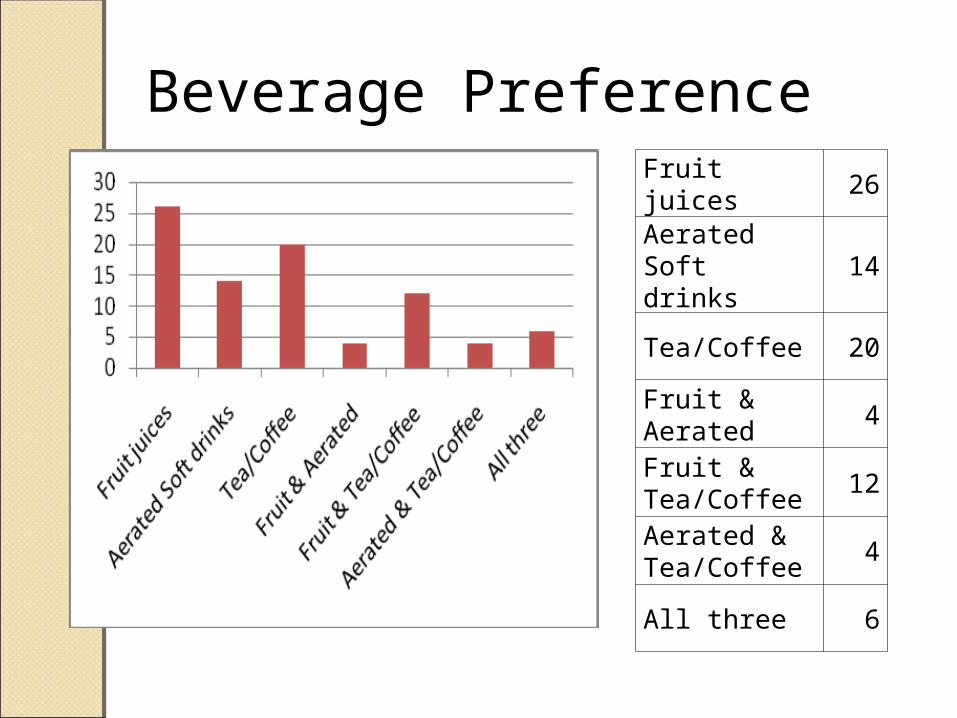
Beverage PreferenceFruit juices 26
Aerated Soft drinks
14
Tea/Coffee 20
Fruit & Aerated
4
Fruit & Tea/Coffee
12
Aerated & Tea/Coffee
4
All three 6
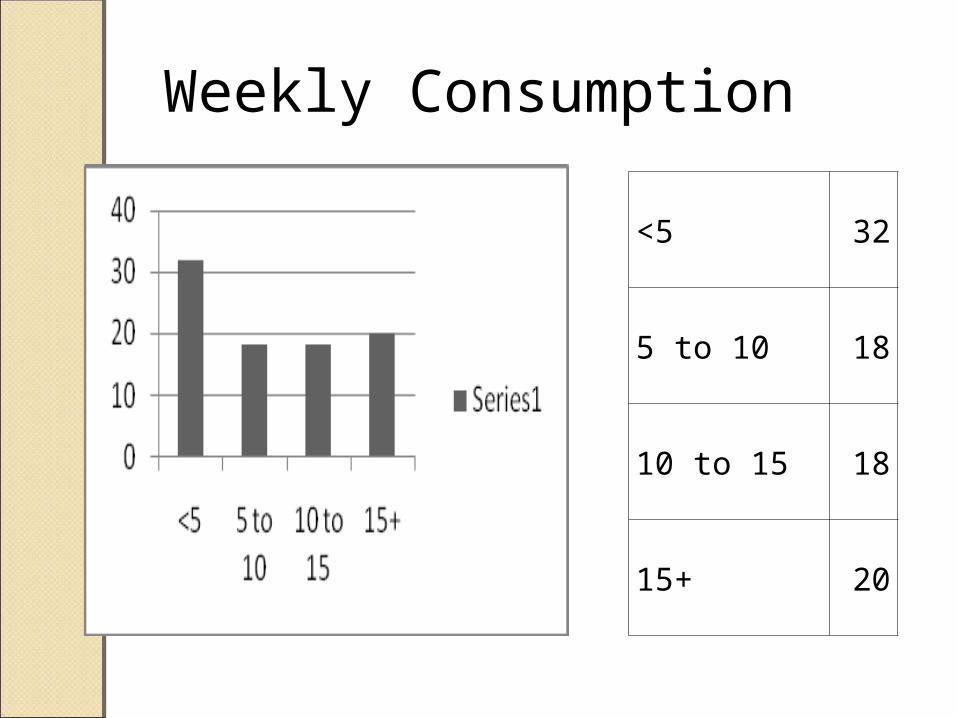
Weekly Consumption
<5 32
5 to 10 18
10 to 15 18
15+ 20
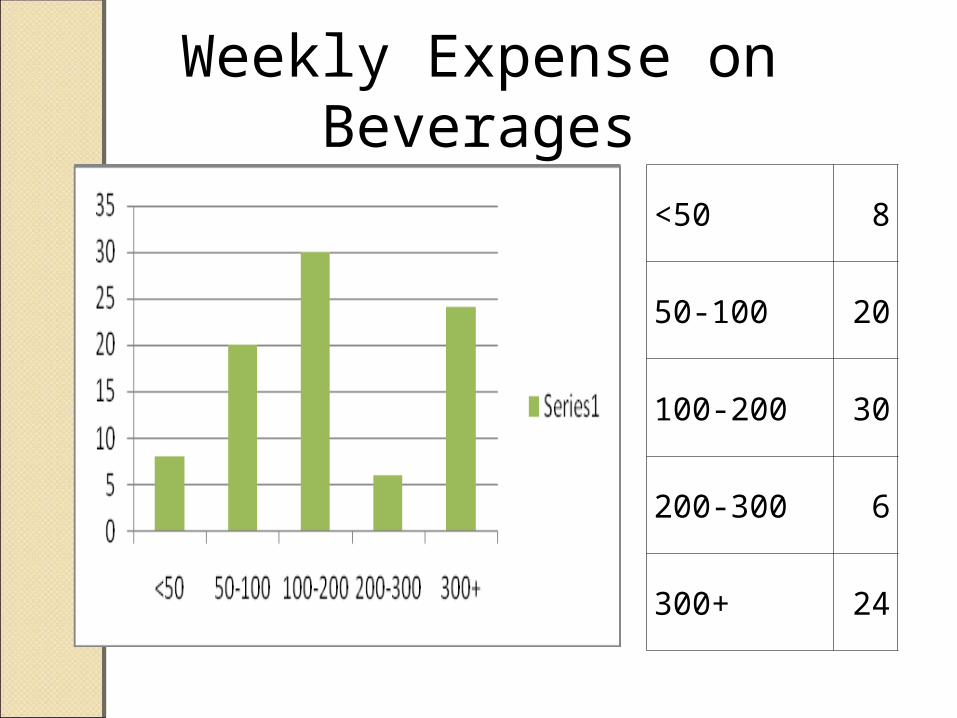
Weekly Expense on Beverages
<50 8
50-100 20
100-200 30
200-300 6
300+ 24
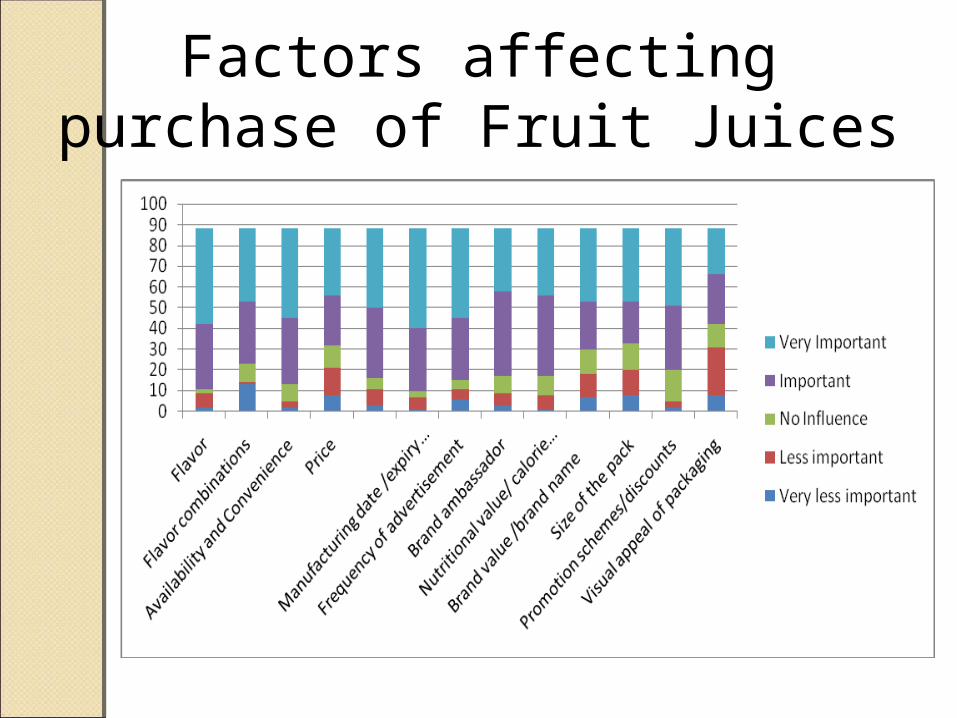
Factors affecting purchase of Fruit Juices

Package size preference for a single one-Package size preference for a single one-time consumption for one individualtime consumption for one individual
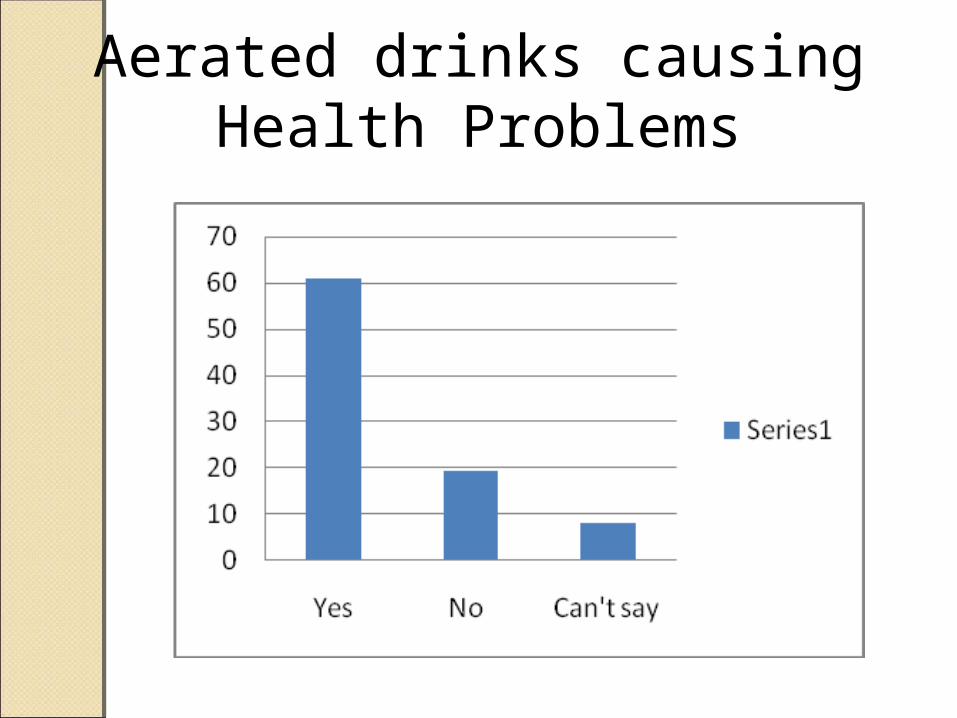
Aerated drinks causing Health Problems

Beverages Packaging Preferences
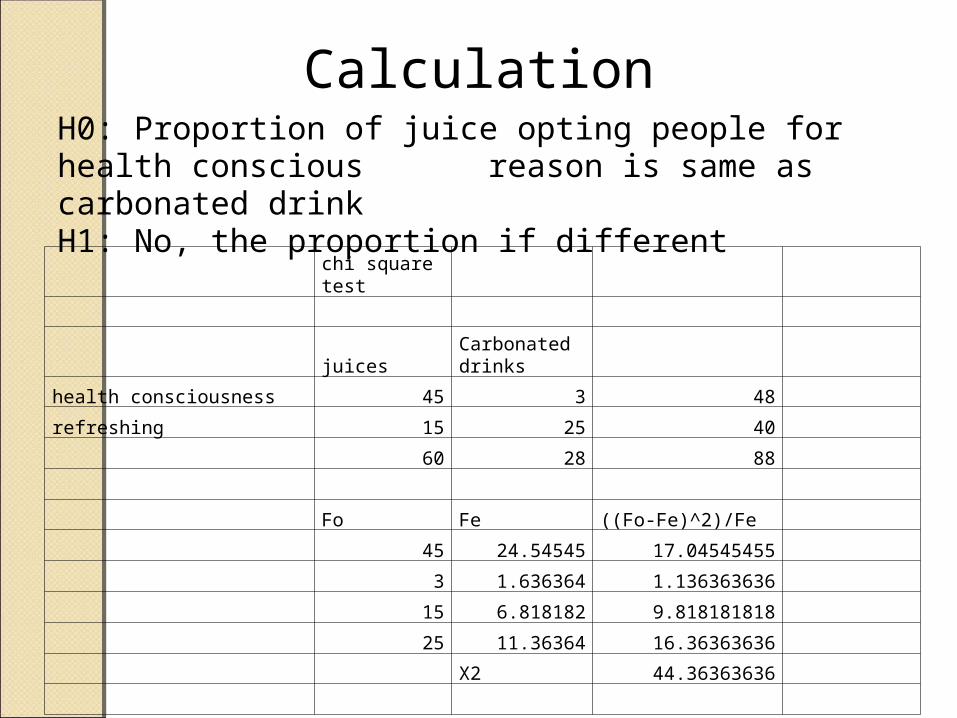
CalculationH0: Proportion of juice opting people for health conscious
reason is same as carbonated drink H1: No, the proportion if different
chi square test
juicesCarbonated drinks
health consciousness 45 3 48
refreshing 15 25 40
60 28 88
Fo Fe ((Fo-Fe)^2)/Fe
45 24.54545 17.04545455
3 1.636364 1.136363636
15 6.818182 9.818181818
25 11.36364 16.36363636
X2 44.36363636
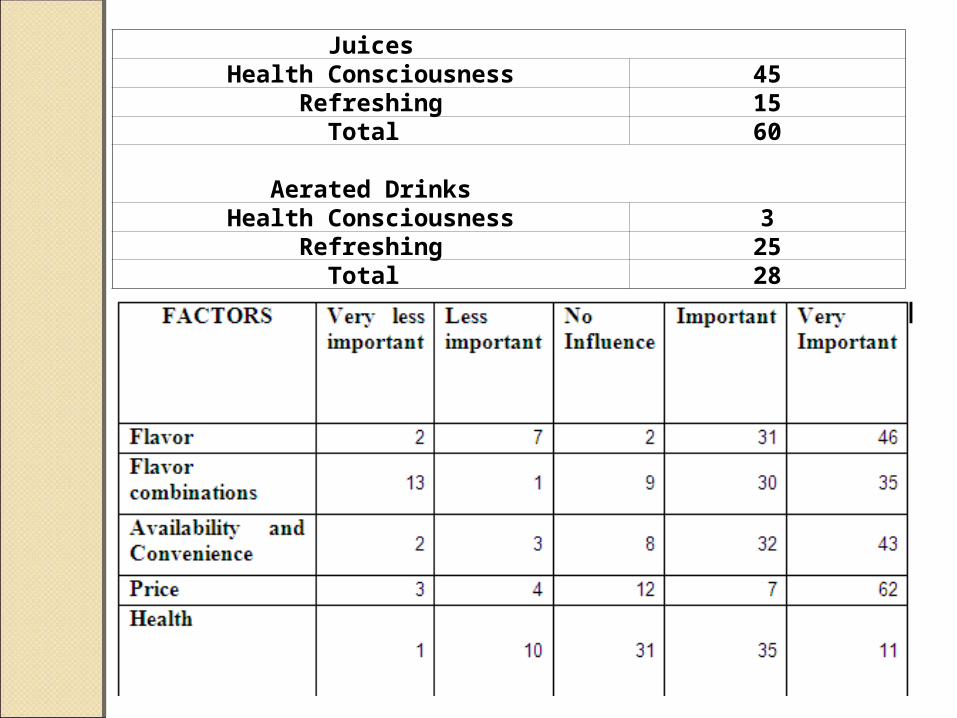
Juices Health Consciousness 45
Refreshing 15Total 60
Aerated Drinks
Health Consciousness 3Refreshing 25
Total 28
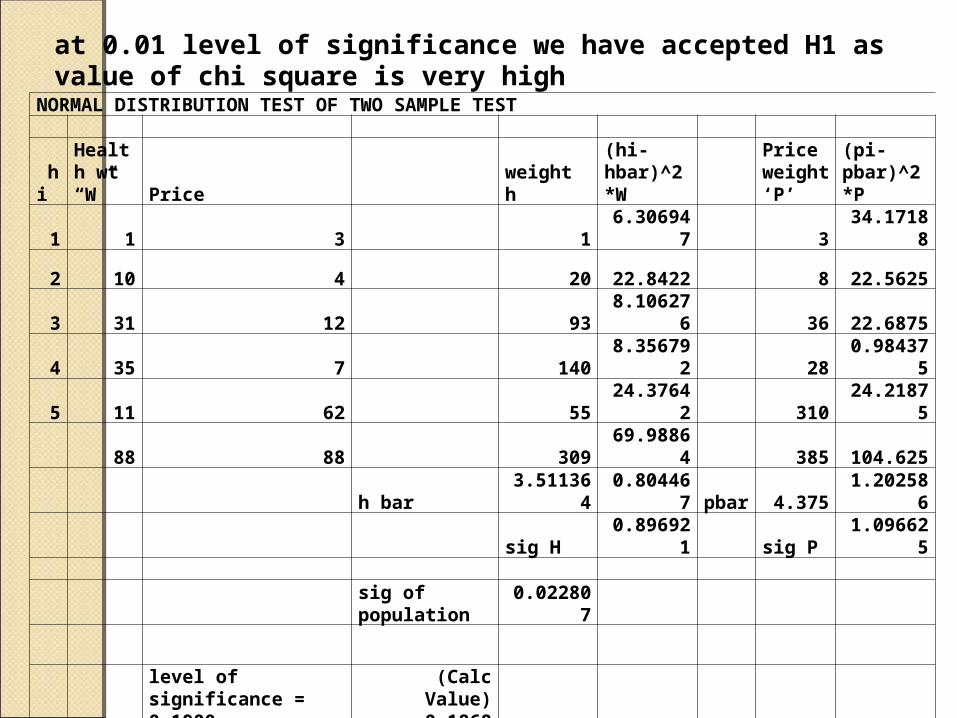
at 0.01 level of significance we have accepted H1 as value of chi square is very high
NORMAL DISTRIBUTION TEST OF TWO SAMPLE TEST
hi
Health wt “W” Price weight h
(hi-hbar)^2 *W
Price weight ‘P’
(pi-pbar)^2*P
1 1 3 1 6.306947 3 34.17188
2 10 4 20 22.8422 8 22.5625
3 31 12 93 8.106276 36 22.6875
4 35 7 140 8.356792 28 0.984375
5 11 62 55 24.37642 310 24.21875
88 88 309 69.98864 385 104.625
h bar 3.511364 0.804467 pbar 4.375 1.202586
sig H 0.896921 sig P 1.096625
sig of population 0.022807
level of significance = 0.1900
(Calc Value) 0.1868
z= 1.322357

H0:mean of pricing is same as that of health consciousness H1:mean of pricing is greater than health consciousness Based on the level of significance of 19% he have accepted H1 as the value of Z is more than critical value of Z at 19%

Suggestions
•Frequent consumption of aerated soft drinks will cause health problems.
•From the survey almost half of the respondents suggested that they prefer use of tetra-packs as packaging
•Advertisement acts as a very important role. So if heavy advertisements are carried out it will definitely increase purchase
Limitations of the Study•The study was confined to city of Mumbai only
•Chances of some biasness could not be eliminated
•Time was the major constrain. Only limited sample size (88) was possible for such a vast research in such a period of time
•Interaction with the respondents was also limited due to their busy work
•Due to the changing life style and preferences, it was not necessary that they will consume same soft drink every time
•There was a chance that respondent will make assumptions while filling the questionnaire
Conclusion•An important finding that emerged out of the survey was that 16% of people like to have soft drinks while 84% prefer juices and other beverages
•A majority of the respondents consume fruit juices to put off thirst or for refreshment
•About half of the respondent felt taking too much of aerated soft drink would cause health problems
•Most of the respondents like non carbonated Maaza since they like Mango flavor
•Price is more important consideration than health consiousness

•http://en.wikipedia.org/wiki/Beverage•www.foodindustryindia.com•http://fnbnews.com/article/detarchive.asp?articleid=25105§ionid=3•http://fnbnews.com/article/detarchive.asp?articleid=24983§ionid=3•http://fnbnews.com/article/detarchive.asp?articleid=24965§ionid=3•http://fnbnews.com/article/detarchive.asp?articleid=24849§ionid=3•http://fnbnews.com/article/detarchive.asp?articleid=25039§ionid=3•http://www.foodindustryindia.com/newfood/detailnews.jsp?n=Xtazy,%20another•%20energy%20drink%20for%20the%20Indian%20market&id=598•http://fnbnews.com/redfr.asp?fn=/other/aboutus.asp&title=About%20Us#Food&b•www.google.com•Zickmund, William G., “Business Research Methods”, Cengage Learning
BIBLIOGRAPHY

Related Documents