187 CHAPTER- 4 RESEARCH METHODOLOGY 4.1 NEED FOR THE STUDY After gone through the different studies conducted earlier there is a need to make a fresh attempt to understand the policyholder behaviour for purchase of insurance services specially life insurance policies. While reviewing the available literature the need for the study is summarized in the following points: 1. Most of the studies reported in literature were conducted in the area of insurance sector have covered various factors such as cost, value, customer satisfaction, delivery pattern of various policies etc. The proposed study aimed at analyzing on factors influencing policyholders’ decision making behaviour for buying life insurance. 2. Around 80 percent of total population is still uninsured (ICMR-VOICE Planman Consulting Insurance Survey) which shows that there is great potential of life insurance in rural and urban India. The research also developed a new understanding about policyholder buying decisions. Therefore, marketers must revitalize there service marketing strategies. 3. With the largest number of life insurance policies enforced in the world, India's insurance sector accounted for 4.1 per cent of GDP in 2006-07, up from 1.2 per cent in 1999-2000 and further increase is expected which reflect insurance sector has immense potential for growth. This study is better reasoning of policyholder decision making because of the wide size of diversified insurance market running on agent based network. 4. This study presented a new insight to the forthcoming researchers, academician and scholars to understand factors affecting purchase decision of insurance.

Welcome message from author
This document is posted to help you gain knowledge. Please leave a comment to let me know what you think about it! Share it to your friends and learn new things together.
Transcript

Chapter 4: Research Methodology
187
CHAPTER- 4
RESEARCH METHODOLOGY
4.1 NEED FOR THE STUDY
After gone through the different studies conducted earlier there is a need to make a
fresh attempt to understand the policyholder behaviour for purchase of insurance
services specially life insurance policies. While reviewing the available literature the
need for the study is summarized in the following points:
1. Most of the studies reported in literature were conducted in the area of insurance
sector have covered various factors such as cost, value, customer satisfaction,
delivery pattern of various policies etc. The proposed study aimed at analyzing on
factors influencing policyholders’ decision making behaviour for buying life
insurance.
2. Around 80 percent of total population is still uninsured (ICMR-VOICE
Planman Consulting Insurance Survey) which shows that there is great
potential of life insurance in rural and urban India. The research also
developed a new understanding about policyholder buying decisions.
Therefore, marketers must revitalize there service marketing strategies.
3. With the largest number of life insurance policies enforced in the world,
India's insurance sector accounted for 4.1 per cent of GDP in 2006-07, up
from 1.2 per cent in 1999-2000 and further increase is expected which reflect
insurance sector has immense potential for growth. This study is better
reasoning of policyholder decision making because of the wide size of
diversified insurance market running on agent based network.
4. This study presented a new insight to the forthcoming researchers, academician and
scholars to understand factors affecting purchase decision of insurance.
Chapter 4: Research Methodology
188
4.2 OBJECTIVES OF THE STUDY
The present study was an in-depth study of micro variables/determinants of
policyholder behaviour. The main purpose of the study was to investigate major
determinants of policyholder behaviour for selecting and buying insurance policy in
Haryana. The main objective of the study was to understand the various external and
internal influences on policyholder decision making. For achieving this main
objective several sub-objectives have been framed:
1. To study the impact of demographic, psychographic and social characteristics
of the sample policyholders on buying decision for purchasing life insurance
policy in Haryana.
2. To identify various needs, motives and stimuli forcing sample policyholders to
buy life insurance policy in Haryana.
3. To identify the gap between policyholder’s perceived benefits and actual
benefits derived from a life insurance policy in Haryana.
4. To find out the dominance of specific determinants on purchase decisions of
sample policyholders for buying life insurance policies in Haryana.
5. To observe the information search process of sample policyholders for buying
an insurance plan in Haryana.
6. To evaluate the factors underlying policyholder perception of rural and urban
policyholders towards the life insurance policies in Haryana.
7. To open new vistas for further researches in Haryana.
4.3 NATURE OF RESEARCH
The adopted research was descriptive in nature as it describes the determinants of
policyholder decision making in general and policyholder behaviour more particular.
The research was an in-depth research of decision making process and study of
factor(s) influencing a purchase decision. This ex post facto research includes survey
and fact finding enquiries.
Chapter 4: Research Methodology
189
This descriptive study was undertaken in order to ascertain and describe the
characteristics of the variables of interest such as age, educational level, job status,
years, work experience, sex compositions, working in the marketing/business system
and such other characteristics. Descriptive study is also undertaken to understand the
characteristics of policyholders that follow certain common practices.
In this study few hypotheses have been also frame and tested since the principle
objective of this work was to find out the impact of demographic, psychographic and
social factors on purchase decisions. For this research a survey of primary sources of
information has been conducted for two reasons. Firstly, analogous situation
(case study) has not been examined as it could have made the scope of the research
very narrow. Secondly, the survey method has the advantages of flexibility and
versatility.
4.4 DATA COLLECTION
The research was basically descriptive in nature but few hypotheses have been tested
for achieving objectives of the research. Therefore both primary and secondary data
have been used. Primary data was collected from selected policy holders through
questionnaires and observations while the secondary data was collected from books,
magazines, news papers, journals, IRDA annual reports, statistical abstract and so on.
Data Required
Primary data was required to know the level of knowledge of sample policyholders,
about different schemes being offered by various insurance corporations to know the
impact of knowledge for selection of a policy and so on to make this study qualitative.
Secondary data was required to study the nature, scope and various types of insurance
policies being opted by policyholders, global insurance practices, development of
insurance sectors in India and global insurance practices in order to make this study
quantitative. The research was designed to find out the determinants of buying
behaviour and policyholders from Haryana were major source of primary data for this
study. The data was collected very carefully as the data increases reliability,
Chapter 4: Research Methodology
190
usefulness, validity, accuracy and importance of statistical analysis. Primary and
secondary data both were collected and used by the researcher for the purpose of
reliability, authenticity and importance of exploratory research.
Primary data: Policyholders from different areas, fields, professions, age groups,
religions and genders have been contacted and interviewed through personal contact
method. Initially the researcher has conducted an informal discussion along with
observation of policyholders and insurance agents only from Gurgaon followed by a
pilot survey and thorough spadework. On the basis of pilot survey conducted in
Gurgaon on 30 policyholders, the researcher has developed a structured
schedule/questionnaire. The Researcher has collected primary data by personally
interviewing policyholders from rural and urban areas with the help of exhaustive
structured schedule/questionnaire consisting 33 questions.
Secondary data: Secondary data was collected from various published books,
reports, web sources, journals, IRDA annual reports, statistical abstract, magazines,
research articles, news papers and printed manuals of the insurance companies. Some
unpublished information has been collected from previous records of insurance
companies. Data was also collected from different units and offices of Insurance
agents.
The questionnaire (schedule): The primary data was collected by personally
interviewing executives with the help of a structured schedule consisting 33 questions.
Where interviewing personally was not possible or allowed, these questionnaires were
distributed to the agents and policyholders in Haryana and collected lately. The
questionnaire consists of open or closed ended questions. The data was collected by
means of a self administrated questionnaire, which was developed in the following stages:
(a) Indentifying variables and developing first draft.
(b) Content validity
(c) Pilot survey
(d) Finalizing the questionnaire
(e) Reliability check
Chapter 4: Research Methodology
191
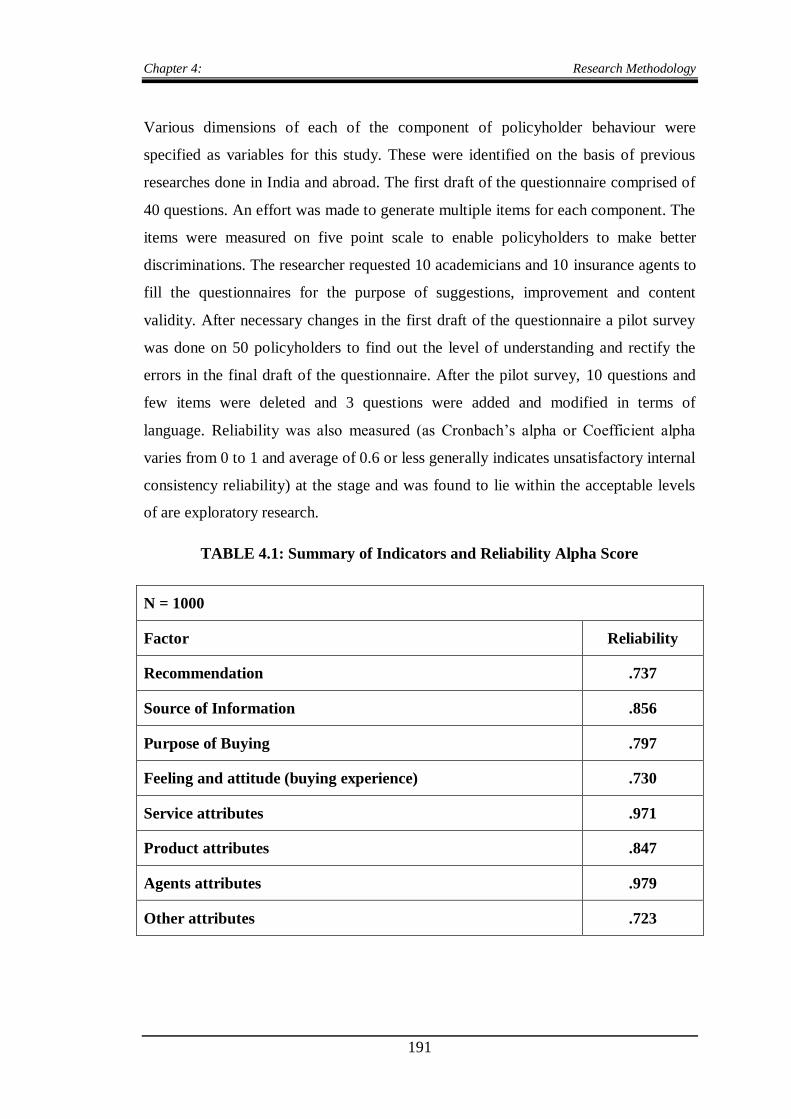
Various dimensions of each of the component of policyholder behaviour were
specified as variables for this study. These were identified on the basis of previous
researches done in India and abroad. The first draft of the questionnaire comprised of
40 questions. An effort was made to generate multiple items for each component. The
items were measured on five point scale to enable policyholders to make better
discriminations. The researcher requested 10 academicians and 10 insurance agents to
fill the questionnaires for the purpose of suggestions, improvement and content
validity. After necessary changes in the first draft of the questionnaire a pilot survey
was done on 50 policyholders to find out the level of understanding and rectify the
errors in the final draft of the questionnaire. After the pilot survey, 10 questions and
few items were deleted and 3 questions were added and modified in terms of
language. Reliability was also measured (as Cronbach’s alpha or Coefficient alpha
varies from 0 to 1 and average of 0.6 or less generally indicates unsatisfactory internal
consistency reliability) at the stage and was found to lie within the acceptable levels
of are exploratory research.
TABLE 4.1: Summary of Indicators and Reliability Alpha Score
N = 1000
Factor Reliability
Recommendation .737
Source of Information .856
Purpose of Buying .797
Feeling and attitude (buying experience) .730
Service attributes .971
Product attributes .847
Agents attributes .979
Other attributes .723
Chapter 4: Research Methodology
192
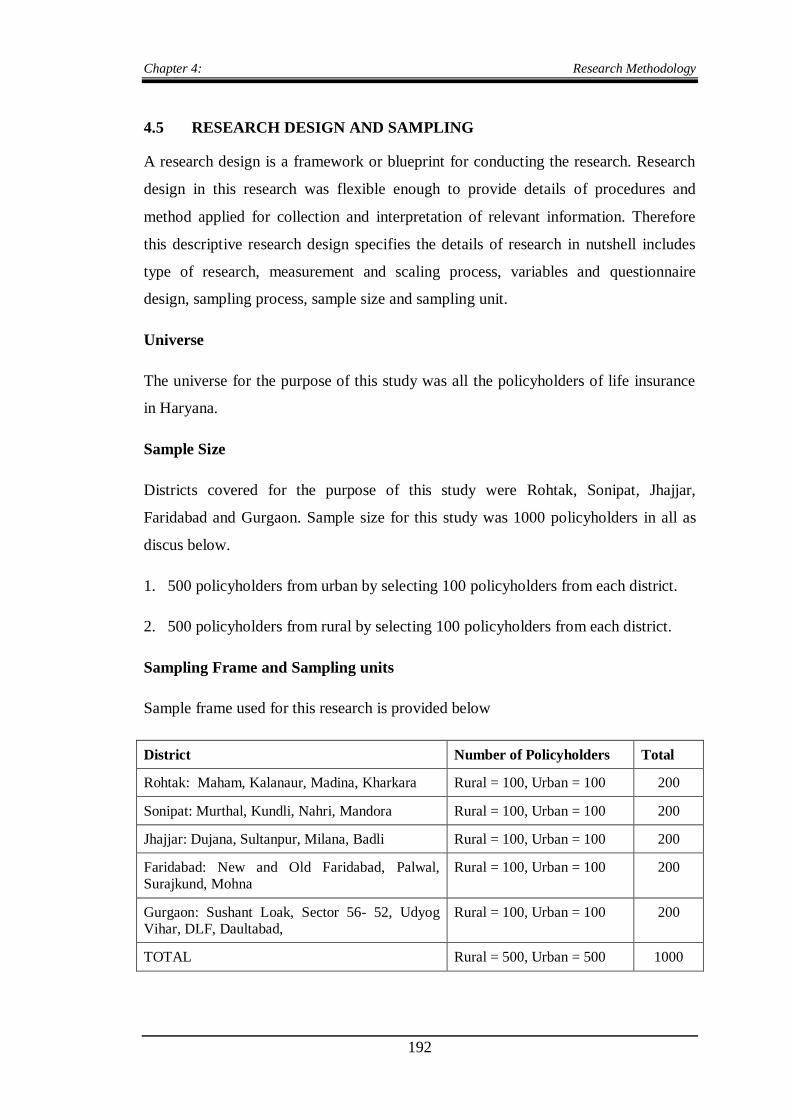
4.5 RESEARCH DESIGN AND SAMPLING
A research design is a framework or blueprint for conducting the research. Research
design in this research was flexible enough to provide details of procedures and
method applied for collection and interpretation of relevant information. Therefore
this descriptive research design specifies the details of research in nutshell includes
type of research, measurement and scaling process, variables and questionnaire
design, sampling process, sample size and sampling unit.
Universe
The universe for the purpose of this study was all the policyholders of life insurance
in Haryana.
Sample Size
Districts covered for the purpose of this study were Rohtak, Sonipat, Jhajjar,
Faridabad and Gurgaon. Sample size for this study was 1000 policyholders in all as
discus below.
1. 500 policyholders from urban by selecting 100 policyholders from each district.
2. 500 policyholders from rural by selecting 100 policyholders from each district.
Sampling Frame and Sampling units
Sample frame used for this research is provided below
District Number of Policyholders Total
Rohtak: Maham, Kalanaur, Madina, Kharkara Rural = 100, Urban = 100 200
Sonipat: Murthal, Kundli, Nahri, Mandora Rural = 100, Urban = 100 200
Jhajjar: Dujana, Sultanpur, Milana, Badli Rural = 100, Urban = 100 200
Faridabad: New and Old Faridabad, Palwal, Surajkund, Mohna
Rural = 100, Urban = 100 200
Gurgaon: Sushant Loak, Sector 56- 52, Udyog Vihar, DLF, Daultabad,
Rural = 100, Urban = 100 200
TOTAL Rural = 500, Urban = 500 1000
Chapter 4: Research Methodology
193
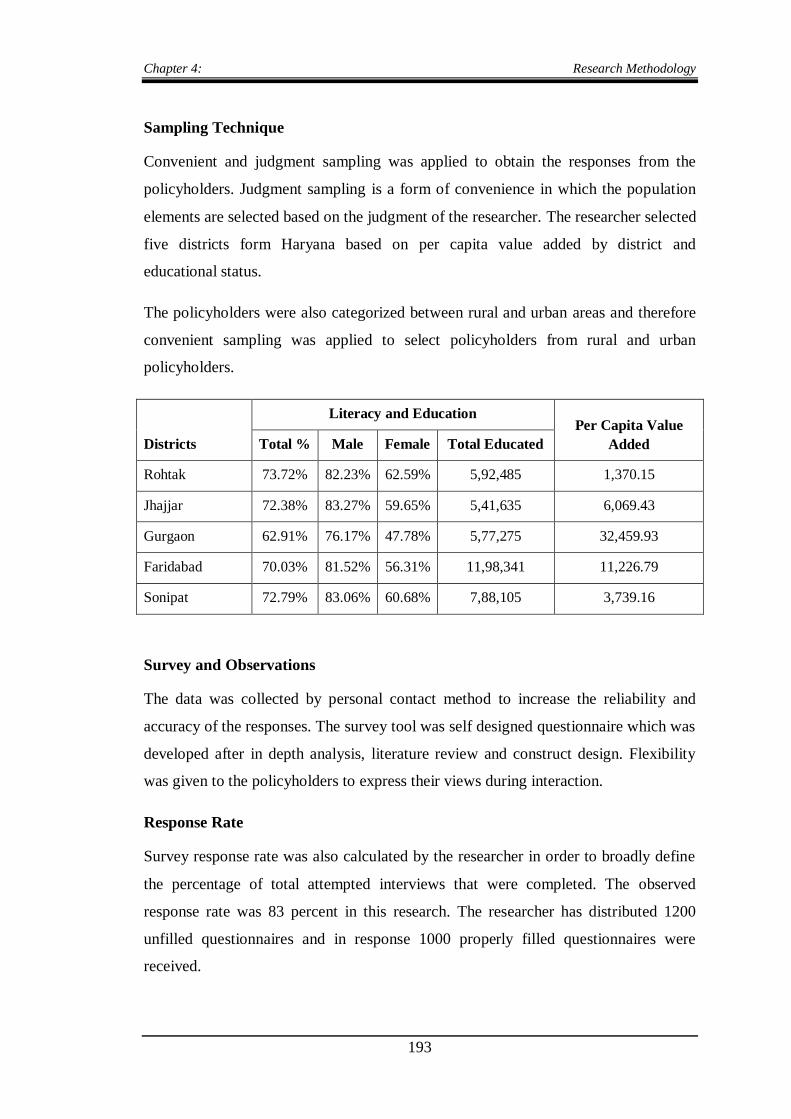
Sampling Technique
Convenient and judgment sampling was applied to obtain the responses from the
policyholders. Judgment sampling is a form of convenience in which the population
elements are selected based on the judgment of the researcher. The researcher selected
five districts form Haryana based on per capita value added by district and
educational status.
The policyholders were also categorized between rural and urban areas and therefore
convenient sampling was applied to select policyholders from rural and urban
policyholders.
Districts
Literacy and Education Per Capita Value
Added Total % Male Female Total Educated
Rohtak 73.72% 82.23% 62.59% 5,92,485 1,370.15
Jhajjar 72.38% 83.27% 59.65% 5,41,635 6,069.43
Gurgaon 62.91% 76.17% 47.78% 5,77,275 32,459.93
Faridabad 70.03% 81.52% 56.31% 11,98,341 11,226.79
Sonipat 72.79% 83.06% 60.68% 7,88,105 3,739.16
Survey and Observations
The data was collected by personal contact method to increase the reliability and
accuracy of the responses. The survey tool was self designed questionnaire which was
developed after in depth analysis, literature review and construct design. Flexibility
was given to the policyholders to express their views during interaction.
Response Rate
Survey response rate was also calculated by the researcher in order to broadly define
the percentage of total attempted interviews that were completed. The observed
response rate was 83 percent in this research. The researcher has distributed 1200
unfilled questionnaires and in response 1000 properly filled questionnaires were
received.

Chapter 4: Research Methodology
194
Data Analysis
The data was collected, processed, edited, tabulated and then interpreted for the purpose
of summarizing the results and findings. The statistical tools were also used to simplify
the raw data like percentages, averages, frequency distribution, mean scores, correlations,
regression and confirmatory factor analysis to find out the crux of the study.
4.6 MEASUREMENT AND SCALING TECHNIQUES
Measurement is a relatively complex and demanding task, especially so when it
concerns qualitative or abstract phenomena. By measurement we mean the process of
assigning numbers to objects or observations, the level of measurement being a
function of the rule under which the numbers were assigned.
Measurement is a process of mapping aspects of a range according to some rule of
correspondence. In measuring we devise some form of scale in the range. Scales of
measurement can be considered in terms of their mathematical properties. For this
study nominal and ordinal scales were used.
For this study Likert scale was developed and five point rating scale was applied
using numerical scores ranging from 1 to 5 for questions. When using this technique it
is important to use consistent scoring therefore the responses were framed from
strongly disagree to strongly agree. In this scale higher scale denotes high
agreeableness of the policyholders.
For construct designing and for reducing set of items, it is important to use multi item
scales specially likert scale. A brief outline of hypothesis statements, variables and
scales developed for the study is provided below:
4.7 HYPOTHESIS
Any assumption cannot be converted into hypothesis without applying statistical
techniques. No empirical research can be complete without testing a primary
hypothesis statement. Statistical tools such as correlations, regression and t-tests were
used for testing hypothesis for the purpose of this research. Following hypothesis
Chapter 4: Research Methodology
195
statements were tested to increase the reliability of assumptions made for this
descriptive research.
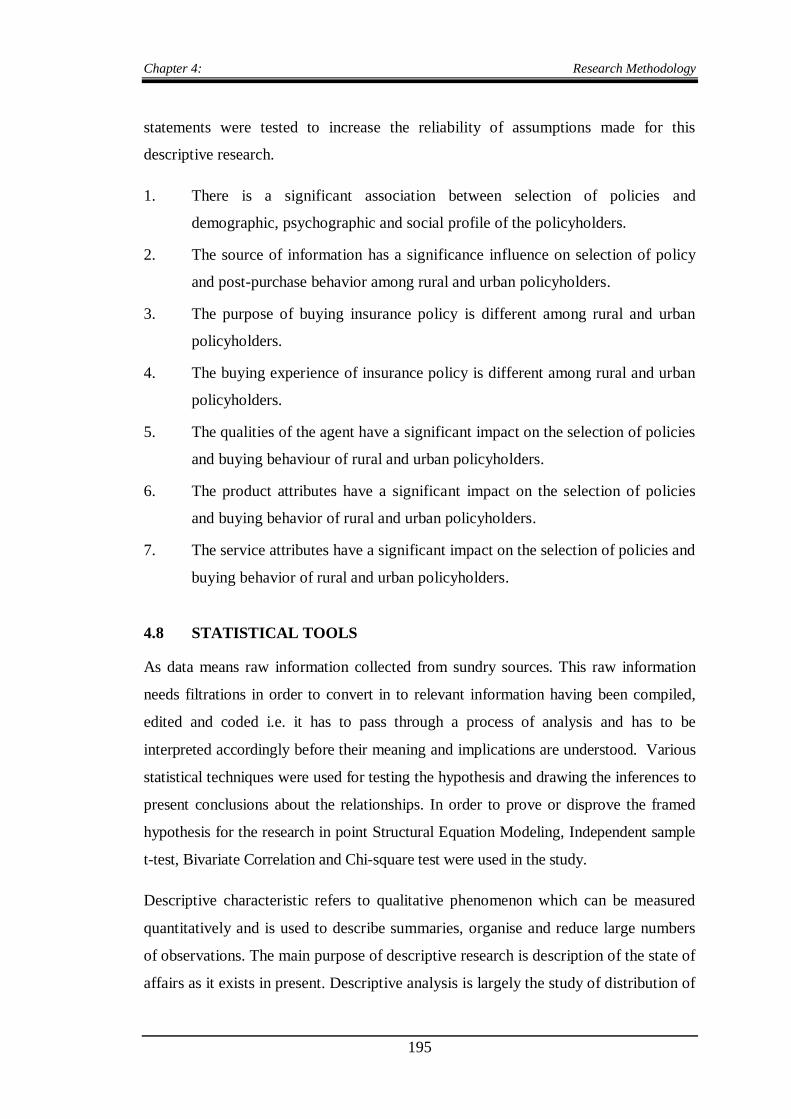
1. There is a significant association between selection of policies and
demographic, psychographic and social profile of the policyholders.
2. The source of information has a significance influence on selection of policy
and post-purchase behavior among rural and urban policyholders.
3. The purpose of buying insurance policy is different among rural and urban
policyholders.
4. The buying experience of insurance policy is different among rural and urban
policyholders.
5. The qualities of the agent have a significant impact on the selection of policies
and buying behaviour of rural and urban policyholders.
6. The product attributes have a significant impact on the selection of policies
and buying behavior of rural and urban policyholders.
7. The service attributes have a significant impact on the selection of policies and
buying behavior of rural and urban policyholders.
4.8 STATISTICAL TOOLS
As data means raw information collected from sundry sources. This raw information
needs filtrations in order to convert in to relevant information having been compiled,
edited and coded i.e. it has to pass through a process of analysis and has to be
interpreted accordingly before their meaning and implications are understood. Various
statistical techniques were used for testing the hypothesis and drawing the inferences to
present conclusions about the relationships. In order to prove or disprove the framed
hypothesis for the research in point Structural Equation Modeling, Independent sample
t-test, Bivariate Correlation and Chi-square test were used in the study.
Descriptive characteristic refers to qualitative phenomenon which can be measured
quantitatively and is used to describe summaries, organise and reduce large numbers
of observations. The main purpose of descriptive research is description of the state of
affairs as it exists in present. Descriptive analysis is largely the study of distribution of

Chapter 4: Research Methodology
196
one variable. The study provides us with profile of companies, work groups, persons
and other subjects or any multitude of characteristics such as size, composition,
efficiency and preferences.
The sort of analysis may be in respect of one variable (described as unidimensional
analysis), or in respect of two variables (described as bivariate analysis) or in respect
of more than two variables (described as multivariate analysis). In this context we
work out various measures that show the size and shape of a distribution (s) along
with the study or measuring relationship between two or more variables.
Such classification of one or more than one variable can be simple classification or
manifold classification. In manifold classification, we consider two or more attributes
simultaneously and divide the data into a number of classes. When data are collected,
the observations must be organized in such a fashion to allow the researcher to
interpret the data correctly and trace underlying trends. This method is commonly
used to provide grouped data for frequency distributions, measures of central
tendency such as mean, skewness, measure of variability such as the standard
deviation, a numerical index that indicates the average variability of the scores from
the mean.
Statistics Measures: The important statistical measures were used to summaries the
survey/ research data such as frequency distribution, tabulation, measure of central
tendency, measure of asymmetry, measure of dispersion and measure of relationship.
Frequency distribution: Frequency distribution is a summary from the data
presented in class intervals and frequencies.
Measure of central tendency: The central tendency is a single value which is used to
represent an entire set of data. It is a typical value around which most of the other
values cluster. In other words, the tendency of the observations to concentrate around
a central point is known as central tendency. Statistical measures that indicate the
location or positions of a central value to describe the central tendency of the entire
data are called the measures of central tendency. Statistical average or measurement
of central tendency tells us the point about which items have a tendency to cluster.

Chapter 4: Research Methodology
197
Such a measure is considered as the most representative figure for entire mass of data.
Measure of central tendency is also known as statistical averages (Mean, Mode and
Median). In statistics there are various types of measures of central tendency, some of
which can be broadly classified as follows:
1. Mathematical Averages (Arithmetic mean, Harmonic mean and Geometric mean).
2. Positional Averages (Median, Mode, Quartiles, Deciles, Percentiles).
Mean is arithmetical average and is the most popular measure of central tendency and
may be defined as the value which we get by dividing the total of the values of
various given items in a series by total number of items.
Median is the simplest measurement of central tendency and is a widely used
measure. It is used in summarizing the essential features of a series and enabling data
to be compared.
Mode is the most commonly occurring value in a series. Standard deviation
represents total variations in mean.
Measurement of Asymmetry (Skewness): When the data is normally distributed we
get a perfectly bell shaped curve and skewness is altogether absent. Positive skew
represents asymmetry of data set and negative skew also represents heterogeneity
(asymmetry) of data set. Kurtosis is the measure of flat- toppedness of a curve.
Measure of Dispersion: An average can represent a series only as best as a single
figure can, but it certainly cannot reveal the entire story of any phenomenon under
study. In order to measure the scatter of the values of items of a variable in the series
around the true value of average, measures of dispersion such as range, variance,
mean deviation and standard deviation are calculated. The greater the standard
deviation, the greater the magnitude of the values from their mean value. Smaller the
standard deviation, greater the uniformity in the observations made.
The Mean and the Median: Measures of central tendency refer to the summary
measures used to describe the most ‘typical’ value in a set of values. The two most
common measures of central tendency are the median and the mean. The mean of a

Chapter 4: Research Methodology
198
sample or a population is computed by adding all of the observations and dividing by
the number of observations using the following equations:
Population mean = μ = ΣX / N OR Sample mean = x = Σx / n
Where ΣX is the sum of all the population observations, N is the number of population
observations, Σx is the sum of all the sample observations and n is the number of
sample observations. When statisticians talk about the mean of a population, they use
the Greek letter μ to refer to the mean score. When they talk about the mean of
a sample, statisticians use the symbol x to refer to the mean score. As measures of
central tendency, the mean and the median each have advantages and disadvantages.
Some pros and cons of each measure are summarized below. The median may be a
better indicator of the most typical value if a set of scores has an outlier. An outlier is
an extreme value that differs greatly from other values. However, when the sample
size is large and does not include outliers, the mean score usually provides a better
measure of central tendency. Mode is the most commonly occurring value in a series.
Standard deviation represents total variations in mean.
The Standard Deviation: The standard deviation is the square root of the variance.
Thus, the standard deviation of a population is:
σ = √ [ σ2 ] = √ [ Σ ( Xi - μ )2 / N ]
Where σ is the population standard deviation, σ2 is the population variance, μ is the
population mean, Xi is the ith element from the population and N is the number of
elements in the population.
Measure of Relationship: It is important in a study to determine relation between
variables. Different methods can be used for measuring relationship among variables
such as correlation, multiple regression and time series Analysis.
Correlation was used when we have data on two or more than two variables or we
have bivariate/multivariate population. In case of bivariate population, simple
correlation such as Charles Spearman’s coefficient of correlation and Karl Pearson’s
coefficient of correlation, simple regression and two way ANOVA, can be used. In
Chapter 4: Research Methodology
199
case of multivariate population, coefficient of multiple correlation and coefficient of
partial correlation, multiple regression and multi ANOVA, can be used.
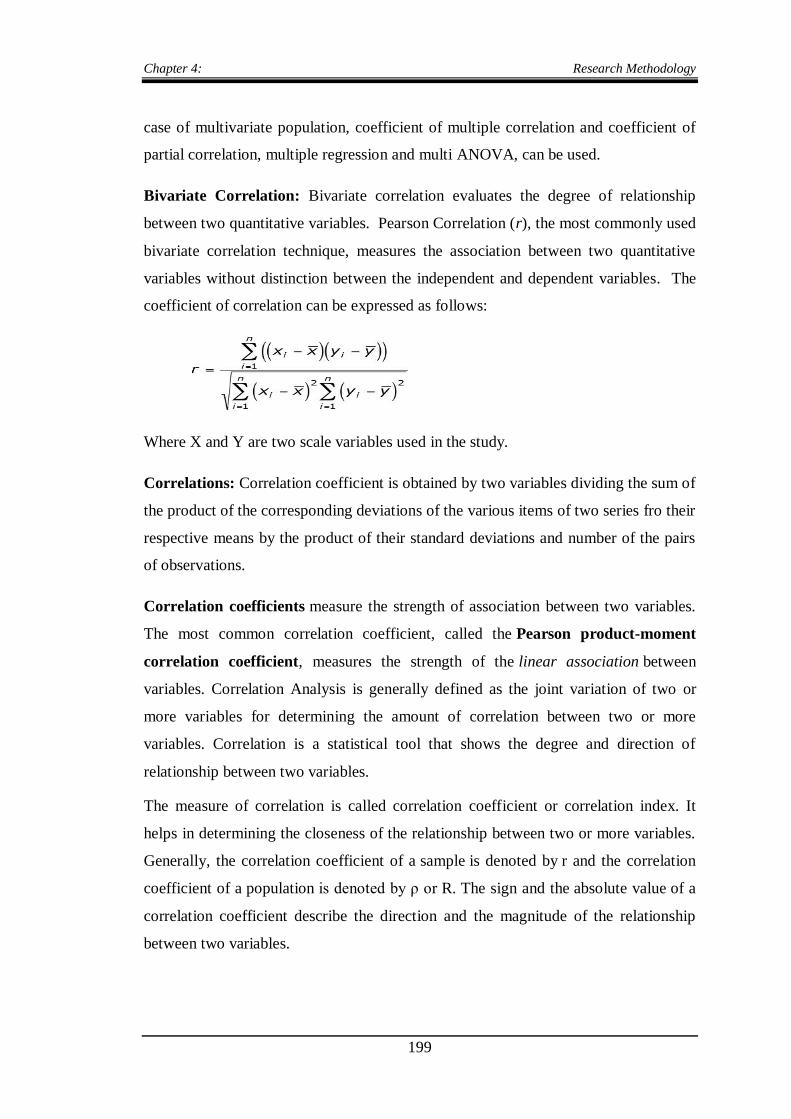
Bivariate Correlation: Bivariate correlation evaluates the degree of relationship
between two quantitative variables. Pearson Correlation (r), the most commonly used
bivariate correlation technique, measures the association between two quantitative
variables without distinction between the independent and dependent variables. The
coefficient of correlation can be expressed as follows:
Where X and Y are two scale variables used in the study.
Correlations: Correlation coefficient is obtained by two variables dividing the sum of
the product of the corresponding deviations of the various items of two series fro their
respective means by the product of their standard deviations and number of the pairs
of observations.
Correlation coefficients measure the strength of association between two variables.
The most common correlation coefficient, called the Pearson product-moment
correlation coefficient, measures the strength of the linear association between
variables. Correlation Analysis is generally defined as the joint variation of two or
more variables for determining the amount of correlation between two or more
variables. Correlation is a statistical tool that shows the degree and direction of
relationship between two variables.
The measure of correlation is called correlation coefficient or correlation index. It
helps in determining the closeness of the relationship between two or more variables.
Generally, the correlation coefficient of a sample is denoted by r and the correlation
coefficient of a population is denoted by ρ or R. The sign and the absolute value of a
correlation coefficient describe the direction and the magnitude of the relationship
between two variables.

Chapter 4: Research Methodology
200
The value of a correlation coefficient ranges between -1 and 1.
The greater the absolute value of a correlation coefficient, the stronger
the linear relationship.
The strongest linear relationship is indicated by a correlation coefficient of -1 or 1.
The weakest linear relationship is indicated by a correlation coefficient equal to 0.
A positive correlation means that if one variable gets bigger, the other variable
tends to get bigger.
A negative correlation means that if one variable gets bigger, the other
variable tends to get smaller.
The Pearson product-moment correlation coefficient only measures linear
relationships. Therefore, a correlation of does not mean zero relationship between two
variables; rather, it means zero linear relationship. (It is possible for two variables to
have zero linear relationship and a strong curvilinear relationship at the same time.)
Product-moment correlation coefficient. The correlation r between two variables is:
r = Σ (xy) / √ [ ( Σ x2 ) * ( Σ y
2 ) ]
Where Σ is the summation symbol, x = xi - x, xi is the x value for observation i, xi is
the mean x value, y = yi - y, yi is the y value for observation i and y is the mean y
value.
The value of r lies between +- 1. Positive values or r indicate positive correlation
between variables whereas negative values indicate negative correlation between
variables. A zero value indicates no correlation between variables. The value of ‘r’
nearer to +1 and -1 indicates high degree of correlation between the two variables.
Where r = +1, perfectly positive correlation
Where r = >+0.75 but < +1, High degree of positive correlation.
Where r = > +0 but <+0.75, Moderate degree of positive correlation
Where r = 0 No correlation
Chapter 4: Research Methodology
201
Where r = >-o but <-0.75, Moderate degree of negative correlation
Where r = >-0.75 but <-1 High degree of negative correlation
Where r = -1 perfectly negative correlation
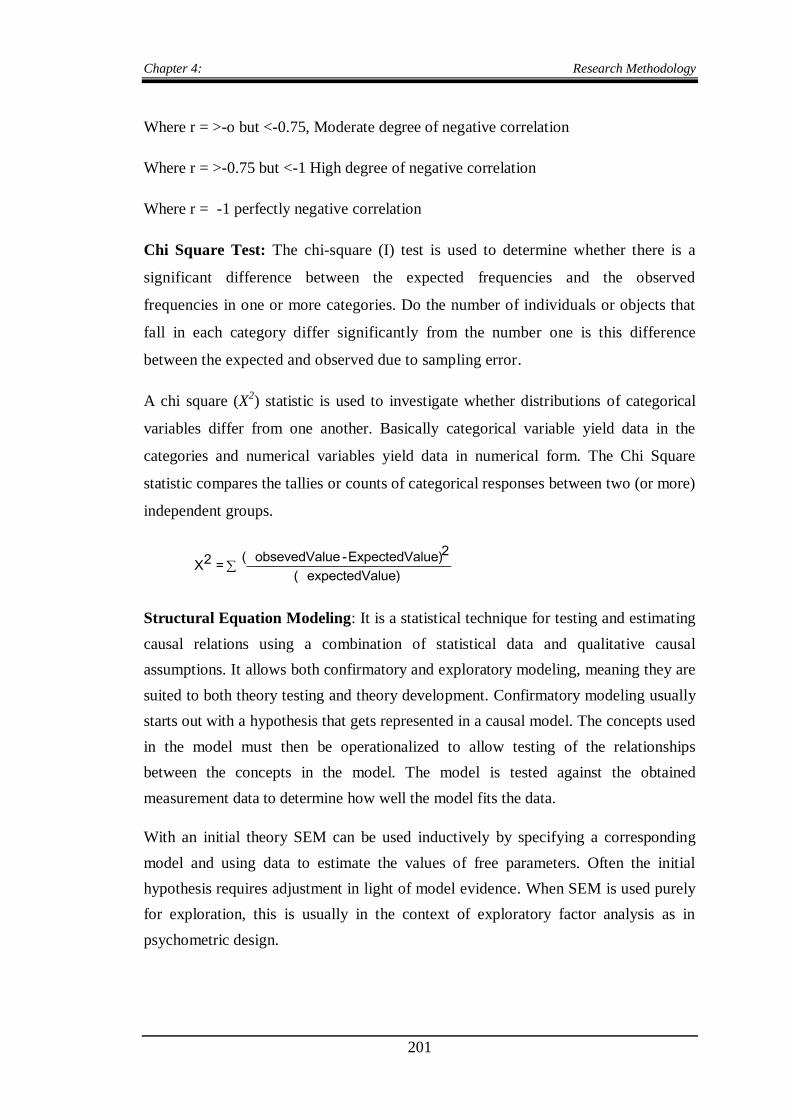
Chi Square Test: The chi-square (I) test is used to determine whether there is a
significant difference between the expected frequencies and the observed
frequencies in one or more categories. Do the number of individuals or objects that
fall in each category differ significantly from the number one is this difference
between the expected and observed due to sampling error.
A chi square (X2) statistic is used to investigate whether distributions of categorical
variables differ from one another. Basically categorical variable yield data in the
categories and numerical variables yield data in numerical form. The Chi Square
statistic compares the tallies or counts of categorical responses between two (or more)
independent groups.
2(obsevedValue -ExpectedValue)2X =(expectedValue)
Structural Equation Modeling: It is a statistical technique for testing and estimating
causal relations using a combination of statistical data and qualitative causal
assumptions. It allows both confirmatory and exploratory modeling, meaning they are
suited to both theory testing and theory development. Confirmatory modeling usually
starts out with a hypothesis that gets represented in a causal model. The concepts used
in the model must then be operationalized to allow testing of the relationships
between the concepts in the model. The model is tested against the obtained
measurement data to determine how well the model fits the data.
With an initial theory SEM can be used inductively by specifying a corresponding
model and using data to estimate the values of free parameters. Often the initial
hypothesis requires adjustment in light of model evidence. When SEM is used purely
for exploration, this is usually in the context of exploratory factor analysis as in
psychometric design.

Chapter 4: Research Methodology
202
Among the strengths of SEM is the ability to construct latent variables: variables
which are not measured directly, but are estimated in the model from several
measured variables each of which is predicted to 'tap into' the latent variables. This
allows the modeler to explicitly capture the unreliability of measurement in the
model, which in theory allows the structural relations between latent variables to be
accurately estimated. Factor analysis, path analysis and regression all represent
special cases of SEM. In SEM, the qualitative causal assumptions are represented by
the missing variables in each equation, as well as vanishing Covariance’s among
some error terms. These assumptions are testable in experimental studies and must be
confirmed judgmentally in observational studies.
Independent Sample T test: In the study the behavior of rural and urban
policyholders is to be considered. The independent samples (or two-sample) t-test is
used to compare the means of two independent samples (rural and urban). The
assumption of the test is:
- The dependent variable is normally distributed.
- The two groups have approximately equal variance on the dependent variable.
The two groups are independent of one another.
The formula for the t-test is a ratio. The top part of the ratio is just the difference
between the two means or averages. The bottom part is a measure of the variability or
dispersion of the scores. The t statistic in the independent sample t test can be
calculated as follows:
Where, x1 and x2 are the means of two independent samples, s1 and s2 are the
standard deviations of the two samples, n1 and n2 are the sample size of the samples.
Software Used: MS Excel, AMOS 18 and SPSS 18 were used for the purpose of data
analysis.

Chapter 4: Research Methodology
203
4.9 RELEVANT VARIABLES STUDIED IN CONSUMER BEHAVIOUR
STUDY
In this study 33 Variables were grouped in two parts of the questionnaire.
Part A of questionnaire consists of general demographic information and Part B of
questionnaire consists of information related to policyholder behaviour. Research was
primarily based on primary data hence significant scales have been used for different
questions. Variables were coded and appropriate scales were assigned for the
variables defined separately. For studying the nature of independent variable and
effect of dependent variables and important dependent variables were selected.
(A) Demographic and life style variables
(B) External Determinants of policyholder behaviour
Sometimes some variables are not directly observable. At the Other times variables
are known to the marketers but their exact nature and relative strength of influence is
not apparent. In these circumstances, it is useful to understand the above mentioned
concepts and how the policyholders behave, so that their decision making process can
be predicted to a reasonable extent. The human mind being as complex as it is, the
understanding of the buying behaviour of the policyholders becomes a continuous
activity of application of various theories and concepts by the marketers. The study of
policyholder behaviour is quite complex, because of many variables involved and
their tendency to interact with and influence each other. These variables are divided
into three major sections that have been identified as the most important general
influences on Policyholder Behaviour. Imagine three concentric circles, one at the
outer most, one in the middle and one at the inner most and they represent the
following:
1. Individual Determinants of Behaviour: The major individual determinants
of Policyholder Behaviour are human mind and its attributes which are
portrayed in middle ring. These variables are personal attributes of a
policyholder and they are influenced by the below stated external factors.
These factors influence policyholders to take decision about the purchase
of insurance product. These determinants are age, education, economic
status, life cycle, personality, attitude, self-concept, religion, language,
motives, motivation, perception and learning and memory.
Chapter 4: Research Methodology
204
2. External Determinants/ Environmental Variables Influencing Behaviour :
External variable factors are controlled by external environments. The
following external variables influences the customers minds are culture,
sub-culture, social Class, social group, family, personal influences,
religion, background, beliefs, values, norms in the society and traditions.
The family is a life long-term association which influences purchase
decisions as per the social status and the culture of the family members.
Family life cycle has also a significant influence on the buying behaviour
as per the need and requirement of the products and services.
3. Situational Determinants/Other Influences in the environment: Other
influences are not categorised by any of the above cited factors (like
geographical, political, economical, religious environment, etc.). The
situational influence, policyholder decision making. The buying decision
comes as a product of the complex interaction of the external factors and
the personal attributes. The inner most circle denotes the policyholder
decision making process regarding products and services, whose major
steps are problem recognition, information search, evaluation, purchase
decision and post-purchase behaviour.
The List of variables under different clusters is provided below:
Demographic
Gender
Age group
Religion
Owner / head of family
Occupation
Regionality
Psycho-graphical
Earning members in family
Educational qualifications
Children in family

Chapter 4: Research Methodology
205
Life style
Life stage/ Personal status
Income group
Owner’s wealth
Home ownership
Type of vehicle
Type of bank account
Own property
Debit/credit card
Insurer Details
Name of the insurer
Satisfaction level
Amount Insured
Bajaj
ICICI
LIC
HDFC
INGVS
TATAAIG
SBILIFE
BIRLASUNLIFE
RELIANCELIFE
AVIVA
SAHARA
KOTAK
HSBC
MAXNY
METLIFE
AMPSN
SRIRAMLIFE
OTHER
Features of Insurance Policy
C1 = Whole Life Scheme
C2 = Endowment Scheme
C3 = Term Insurance Plan
C4 = Periodic Money Back Plan
C5 = Medical Benefits Linked Insurance
C6 = Children Plan

Chapter 4: Research Methodology
206
C7 = Joint Life Plan
C8 = Capital Market Limited Plan
C9 = Group Schemes
C10 = Social Security
C11 = Education Plan
C12 = Pension Plan
C13 = Growth Plan
C14 = Unit Linked Plan
C15 = Systematic Investment Plan
C16 = Individual Plan
C17 = Money Back Plan
C18 = Special Plan
C19 = Health Plan
C20 = Multiplier Plan
C21 = Plan with Flexible Investment Option
Selection Criteria
A1 = Nobody influenced me, it was my own decision.
A2 = My employer’s suggestion.
A3 = Recommended by family member
A4 = My Friend’s suggestion
A5 = Insurance agent’s suggestion.
A6 = My spouse’s suggestion.
A7= Recommended during advertisement
Sources of Information
B1 = News paper /magazines
B2 = Television
B3 = Internet /E-mails
B4 = Agent
B5 = Office/Workplace Circular/Notices
B6 = Spouse/children
B7 = Friends
B8 = Insurance Experts/advisors
B9 = Word of mouth
B10 = Bankers
B11 = Promotional telephone call/sms
Chapter 4: Research Methodology
207
Purpose of Buying
D1 = To provide myself with some extra money at the time of my retirement.
D2 = To provide my dear ones with some extra money at the time of my retirement.
D3 = To provide myself with some extra money in case of emergency (illness, accident).
D4 = To avoid incurring unnecessary costs of insurance in future
D5 = To invest/save money to maintain same life style over years
D6 = To provide death protection for family members in case of any untoward incident
D7 = To provide financial support to spouse
D8 = To save tax
Benefits derived from Insurance
F1 = Security
F2 = Security and critical pension
F3 = ULIP
F4 = Systematic Investment Plan
F5 = Saving
F6 = Risk Disability
F7 = Critical Pension
F8 = Security Illness
F9 = Annuity Insurance
F10 = Flexible Investment Portfolio
F11 = Payer's Benefit
F12 = Risk Coverage
F13 = Investment in equity funds
F14 = Investment in growth funds
F15 = Investment in debts funds
F16 = Investment in liquid funds
F17 = Maturity safety switch options
F18 = Auto fund rebalancing
F19 = Milestone withdrawals
F20 = Partial withdrawals
F21 = Settlement options
F1 = Revival of Policy
F1 = Security
Service Attributes
GS1 = Reputation and loyalty
GS2 = Ambience and experience
GS3 = Comfort and promptness
GS4 = Quality of services offered
GS5 = Hassel free paper work and documentation
Chapter 4: Research Methodology
208
GS6 = Presentation, appearance and surroundings
GS7 = Clarity of contract and terms in document
GS8 = SMS/Reminders about premium payment
GS9 = SMS/Reminder alerts about new products
GS10 = Information brochures, leaflets and letters
GS11 = Application of latest technology in providing services
GS12 = Company is having memorable advertisement
Product Attributes
GP1 = Type of insurance plan(pension, growth, term)
GP2 = Risk coverage
GP3 = Premium or cost of coverage
GP4 = Variety and associated range of products
GP5 = Tax benefits
GP6 = Payment option (mode of payment)
GP7 = Product flexibility (surrender, loan, revival)
GP8 = Maturity period and grace period
GP9 = Growth and benefits
Agents Attributes
GA1 = Agent provides error free services
GA2 = Committed to fulfil promises timely
GA3 = Perform the service right in first instance
GA4 = Provides accuracy (such as payment record)
GA5 = Providing satisfactory services.
GA6 = Prompt, responsive and reliable.
GA7 = Cooperative and friendly.
GA8 = Known and trustworthy.
GA9 = Properly remind about the due premium.
GA10 = Explain features, advantages and benefits of the policy
GA11 = Thoroughness of follow up on questions/ enquiries/ requests prior to purchase decision
GA12 = Attire of the agent is acceptable
GA13 = Attitude of agent towards policyholders is good
GA14 = Behaviour of agent is good with policyholders
GA15 = Agent have enough past experience in the field
GA16 = Attention focused on your priorities
GA17 = Awareness about terms and conditions of policy.
Other Attributes
GO1 = The State financial policy and interest rates
GO2 = Novelty products on the insurance market.
GO3 = Details of insurance terms and conditions.
GO4 = Legal aspects of the policy I consider.

Chapter 4: Research Methodology
209
Post purchase Behaviour
HA1 = Agent shown sound knowledge and efficiency
AG
EN
T
HA2 = Cooperation was extended by the agent
HA3 = Agent has impartial attitude about policies
HA4 = Comfort was created by agent during conversation
HA5 = Agent shown enough respect and support
HA6 = Agent clarified problems on the basis of his past experienced
HA7 = Agent shown individual consideration and maintain confidentiality
HA8 = Less waiting time was given by the agent for advise
HA9 = Agent was easily available to me/policyholders
HB1 = Company have a good reputation in market
PR
OD
UC
T HB2 = The insurer offer additional benefits to loyal customers (payer benefits)
HB3 = For policyholders who buy more products of the same company discount is
offered
HB4 = The policy is designed with policyholders involvement
HB5 = Insurance plan is flexibility to change mode of payment/type of
plan/investment portfolio
HB6 = Company maintain healthy relationship with customers
HC1 = Tax benefits are given according to Law
PA
YM
EN
T
MO
DE
HC2 = Cost/premium of insurance is adequate and affordable.
HC3 = Policy document delivered to me on time
HC4 = Mode of payment is explained properly (a) Yearly (b) half yearly (c)
monthly
HC5 = Mode of premium is explained properly (a) Regular premium (b) single
premium
HD1=Only company I want to associate myself
PO
ST
PU
RC
HA
SE
HD2=Purchase more policies from the same company
HD3=Recommend friends and family the same company and its new offerings
HD4=I will deposit all my due premium on time
Chapter 4: Research Methodology
210
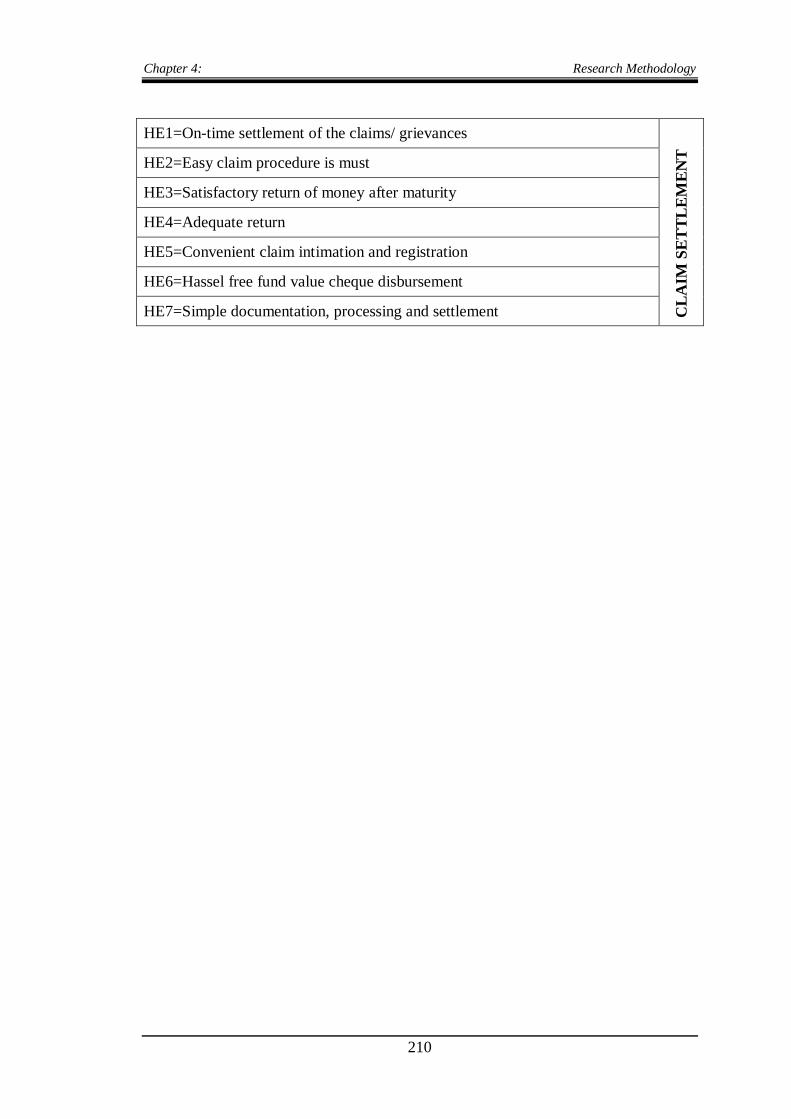
HE1=On-time settlement of the claims/ grievances
CL
AIM
SE
TT
LE
ME
NT
HE2=Easy claim procedure is must
HE3=Satisfactory return of money after maturity
HE4=Adequate return
HE5=Convenient claim intimation and registration
HE6=Hassel free fund value cheque disbursement
HE7=Simple documentation, processing and settlement
Related Documents