Welcome message from author
This document is posted to help you gain knowledge. Please leave a comment to let me know what you think about it! Share it to your friends and learn new things together.
Transcript


Research Journal of Social andLife Sciences
Half Yearly, Bilingual (English Edition)A National Registered Reviewed/ Refereed
Research JournalIndexed & Listed at: Ulrich's Periodicals Directory ©, ProQuest,
U.S.A. Title Id : 715205
Volume- XIV-II English Edition Year- 07 June-2013
Journal of Centre for Research StudiesRewa (M.P.) India
Registered under M.P. Society Registration Act, 1973, Reg.No. 1802Year, 1997
www.researchjournal.in
Centre fo
r Res
earch
Stud
ies
, Bichhiya, Rewa-486001 (M.P.) India Reg.No.1802
Chief EditorProf. Braj Gopal
Honoured wi th Prestigious Bhartendu Harishchand Award
Honorary EditorDr. S. Akhilesh
Honored with Prest igious Pt. G.B. Pant Award Govt. of India 1997, 1998,
2000, 2004 & 2008 and Bhartendu Harishchand Award in 2006
Dr. Sandhya ShuklaProfessor and Head
Depar tment of Poli tical Science
Govt. T. R. S. College, Rewa (M.P.)
EditorDr. Gayatri Shukla
Joint DirectorCentre for Research Studies
RNI NO. MP BIL 01034/12/1/2005-TC ISSN 0973-3914

© Centre for Research StudiesSingle Copy Rs. 500
Membership fee-Term For Individual For Institutional
Five years Rs. 1200 Rs. 2000Life Member (15 years) Rs. 3000 Rs. 5000
Opinions expressed in this journal do not reflect the policies orviews of this organisation, but of the individual contributors.
The authors are solely responsible for the details and statements in theirResearch papers.The Judicial Jurisdiction will be Rewa (M.P.)
GAYATRI PUBLICATIONS41/42, Raghuwans Sadan, Shantikunj
Bichhiya, Rewa 486 001 (M.P.) Phone - (07662) 255177, 9425186437E-mail [email protected],[email protected],
Subject Experts/ Advisory Board01. Dr. O.P. Parmeswaran, Chandigarh 02. Dr. Rajesh Mishra, Lucknow03. Dr. A. P. Onkarappa, Karnataka 04. Dr. Gautam Gyanendra, Bhopal05. Dr. Archana Ambhore, Akola 06. Dr. Arvind Joshi, Varanasi07. Dr. R. C. Gupta, Bina 08. Dr. Amita, Saudi Arabiya09. Dr. A.P. Mishra, Rewa 10. Dr. A.K. Shrivastava, Rewa11. Dr. N.P. Pathak, Rewa 12. Dr. L. S. Gajpal, Raipur13. Dr. V. L. Bhangdia, Amravati 14. Dr. G.K. Sharma, Ujjain15. Dr. N.P. Tripathi, Rewa 16. Dr. R. S. Topandasani, Junagadh17. Dr. B.P. Badola, Dharamshala 18. Dr. Minaxi Patel, Rajkot19. Dr. Bal Gopal Singh, Banshatli 20. Dr. Suneeta Dwivedi, Gwalior21. Dr. Prahlad Mishra, Jabalpur 22. Dr. N. Sundaram, Vellore23. Dr. B.C.M. Patnaik, Odisha 24. Dr. Umesh Shukla, Agra25. Dr. Narendrasingh, Ahmedabad 26. Dr. Geeta Nair, Mumbai
Mode of payment-• The DD be drawn in favor of GAYATRI PUBLICATIONS, REWA payable at
SBI Rewa City Branch (IFS Code : SBIN 0004667).• The amount may be deposited in the account number 30016445112 of GAYATRI
PUBLICATIONS, SBI Rewa City Branch (IFS Code : SBIN 0004667). In thiscase please add Rs. 25 as bank charge. Please inform on Mobile (9425186437)after depositing money.
• If any member wants each vol. by reg. post please deposit extra Rs. 100 for oneyear, Rs. 500 for five years and Rs. 1500 for 15 years.

India is one of the developing nations of the modern world. It hasbecome an independent country, a republic, more than a half centuryago. During this period the country has been engaged in efforts to attaindevelopment and growth in various areas such as building infrastructure,production of food grains, science and technology and spread of education.The life expectancy has increased and many diseases have been controlled.However, there are many areas in which Indian society is experiencing avariety of problems. Some of these problems have their roots in our colonialpast while others are related to demographic changes, socio-politicalconditions and cultural processes. The Indian society consists of peoplefrom different religious, linguistic and ethnic backgrounds. Since longthere has been cultural give and take between the people from India andother countries. Since 1947 when India gained Political Independencethe country has been engaged in the gigantic task of nation building.Efforts have been made to put nation on the path of socio-economicdevelopment. The transformation of nation as a self sufficient and cohesivepolitical entity has proved to be a difficult challenge. The colonial past,socio-economic disparities in the society and raised aspirations haveculminated in a complex situation.
Social evils in Indian society have become a serious concern in thepresent day world. It is gradually affecting the roots of our culture and isblocking its rapid growth on the global chart. Unemployment, illiteracy,corruption, urbanization, gender discrimination, domestic violence,poverty, population explosion, and lust for money are all social evilsprevailing in the country. Moreover, decline of values and decline ofcommunity has further shaken the society. There are many factors andcauses that have contributed in the creating as well as inflating theseevils. In the recent years many pathological social conditions have arisedue to which the social problems in India have become even worse. Someof the common causes of social evils are differentiation of interest, growthof civilization, challenges in social behavior and social systems, lack ofrequired changes in religious beliefs, malfunctioning of economic system,defective execution of political systems, and an ever-increasing lust formoney. Further to that, the biggest cause contributing to the increasingsocial evils in Indian society is a developed insight or an improved vision.
EDITORIAL

Prof. Braj GopalChief Editor
This caters to development of human in all fields of life. People today arebecoming modernized leaving behind the facts and essence of society,culture, and religion. This approach towards life is becoming practicaland scientific. Every phase of life is now judged by a developed insight tohave a scientific and rational solution to all issues of life. India is a secularrepublic and the constitution guarantees equal rights to all its citizenswithout any discrimination. The Indian constitution provides many legalsafeguards to the minority community and special provisions are madefor their social and economic growth. Despite these, minorities in Indiaface all types of inequity in the public sphere. Even the violence andhuman right violations of the minority community in India is a commonphenomenon. In this context, the note of UN Special Report on Freedomand Religious Belief Ms. Asma Jahangir, is pertinent when she praisedIndia's secularism, human right activism, and strong legal protection forreligious minorities at the national level but also made the point that dueto the federal structure of Indian state the implementation of law variesfrom states to states. She said, "Organized groups claiming roots inreligious ideologies have unleashed an all-pervasive fear of mob violencein many parts of the country". Asma Jahangir, was making specialreference to the violence in Orissa, where Hindu fundamentalists attackedChristian and tribal communities. The violence in Khandamal region ofOrissa continued for a long period, despite massive protest by activistsand secular organizations. Some of the grave issues related to the minoritycommunity are highlighted in the report. Considering the hugegeographic size and vast population it is not possible to keep track ofevery issue. Still the figures and facts mentioned in the report are evidenceenough to understand the present situation of the minority communityin India. Things have changed from last decades, but a long road is aheadleaders behaviour needs attention.
Date:

1. History of Scientific Techniques and its Application in 09ArchaeologyAmita Gupta, Yogambar Singh Farswan
2. Panchayat Raj Members and Awareness of Rural Development 35Programme - Experience from South KarnatakaChandrashekar. E.
3. 73rd Constitutional Amendment Act and Women 49Participation in Panchayati Raj Institutions in HaryanaSunita, Desraj Sabharwal
4. Social Problems of Child Labour with Special Reference to 59Rewa CityAkhilesh Shukla, Tajammul Hussain Mir
5. Intensity and Magnitude of Dowry Related Violence 63Against WomanS. P. Shukla
6. Meal Time Behavior of Intellectually Disabled Children and 75Adolescent: A Study in Raipur CityRachana Saxena, Aruna Palta
7. Female Sex Ratio in India: A Sociological Study as per 79Census 2011Akhilesh Shukla
8. Social Problems in Aged Rural Male and Female 86Neha SharmaShireen Sharma, Urmila Sharma
9. Geo- Strategic Location of India in South Asia and Its Presence in 89SAARCMonika Kannan
10. Anthropogenic Impact on North- West Himalayan Region 94B. P. Singh, Gulzar Qadir Ganaie
11. The e-waste Problem and Recycling 98Anita Sarin, Dipti Jha
12. Impact of Globalization and Devolution of power on Local 101Communities: A case study of Dudhwa National ParkSarika Shukla, Sugandha Shanker
Contents

13. Yogic Mantra "OM": The Mantra of Universal Harmony and 110Potent Tonic of The Human OrganismArvind Malik, Sonia Malik, Vishal Dahiya
14. Knowledge Management - An Emerging Business Tool 118Razaullah Khan, Khan Uzma
15. Contribution of E Commerce in Business Development 124Chandresh L.Usadadiya
16. Interpretation The Point of Taxation Rules 2012-13 (Service Tax) 119R. C. Gupta, S. K. Panthi
17. Recent Trends of Human Resources Management 131Nayana Keshavlal Gondalia
18. A Comparative study of the power and politics in Shakesper's 123'Macbeth' and Karnad's TughlaqPravinkumar N. Rathod
19. A Study of Myths in the Burden and Fulfillment of Tyagaraja 140Paramasiva KailasamBhanu Pratap Singh
20. Computer Aided Language Learning: It's Impact on 143Rural StudentsAmit Purushottam
21. Emotional Sensitivity as a Factor in Managerial Effectiveness: 149A Study of Development and Validation of EmotionalSensitivity TrainingSakshi Mehrotra
22. Effect of Plyometric Training on Selected Motor Components 157Among College Girls StudentsNeeta N. Chauhan
23. A Study of Classroom Interaction of Physics Teachers at 162Secondary Level on the Basis of Their Experience andQualificationRakhee Trivedi, M. P. Sharma
24. Importance of Computer and English in Education 165Rajkumar S. Topandasani
25. Self- Concept in Relation to Emotional Intelligence and Self- 169Esteem of Visually Challenged and Sighted School StudentsDinesh Kumar, Raj Kumar

26. Youth & Environment- A Case Study of Library Science 183Students of Kumaun University, NainitalRajesh Chandra Paliwal
27. Women's Education in India 189Kavita Parvanda
28. A Comparative Study of Personality factors of Trained and 192Untrained School teachers in SaranRenu Kumari
29. An Adverse Effect of Ergogenic Aids on Athletes 198Kamleshkumar P. PatelNarendrasingh R. Kshatriya
30. A Comparative Study of Self Concept Among College Level 202Players of Gujarat UniversityParixitsinh D . Mandora
31. Abuse of Steroids in Sports Performance 207Hasan Mehdi, Lilly Pushpam Isaac
32. Kinesiology - The Science of Energy Balancing 210Jignasa J. Vaghela
33. Effect of Temperature on Mycelial Growth of Keratinophilic Fungi 215Mamta Gupta
34. Studies on Spotted wilt Virus Disease of Tomato 218(Lycopersicon Esculentum Mill)Shyam Govind Singh
35. Evaluation of Morpho- Physiological Parameters of Potato to 221(Solanum Tuberosum L.) Cultivars in Tarai Region UttrakhandL.P. Yadav, V.K. Bhatnagar, N.P. Singh
36. Study on Ganado-Somatic and Fecundity Relationship of 225Channa Punctatus from Son River Shahdol, District (M.P.)Kirti Tiwari
37. Hydroxysteroid Dehydrogenase Activity in the Caput, 230Corpus and Cauda Epididymis of Taphozous MelanopogonMelanopogon Temmnick (Microchiroptera : Mammalla)Umesh Shukla
38. Flow of Non - Newtonian fluids and Lubrication Problem 233S. S. Shukla

39. Estimation of some Amino Acids, Thiouria and Sugars using 238Pentavalent Vanadium on Micro ScaleAnupama Dwivedi, Nagmani Manikpuri
40. Assessment of The Water Quality and Pollution Status of 241The Gauri Pond, Bhind City, District Bhind (M.P.)Mamta Bhadoria, Dinesh Kumar Chaturvedi
41. Construction of Soak Pits and Awareness Regarding 246Sanitation and HygieneAnjali Pahad, Nidita Karkare, Chaitali Patel
42. Importance of Social Participation in Adoption of 255New Technology for Sustainable Rural DevelopmentJitendra Singh "Bhadauria"
43. Health Related Problems of Single Living Male and Female in 260Bhopal Town due to taking Food outside HomePoonam Muktawat, Nilima Verma
44. Effect of Heavy Metals on Fish and Amphidia with Various 264Histochemical ChangesMukesh Kumar Napit
45. An Assessment of Ethno botanically Important Ferns from 271Dehradun District of UttrakhandChhaya Singh, Satish Garkoti, H. C. Pande

Research Journal of Social and Life SciencesISSN 0973-3914, Vol.-XIV- II, Year-07, June-2013
History of Scienti fic Techniques and itsApplication in Archaeology
* Amita Gupta** Yogambar Singh Farswan
==========================================================Abstract- Science has developed many models and approaches forstudying the natural world. Each of these has been referred to at varioustimes as "The Scientific Method". Whether there exists one agreed methodor not and whether this method reflects "How Science Works", is a matterof debate. It is useful to consider briefly how science has developed overthe past 2000 years and how this may enlighten our approach to theprocess of science and science teaching today. Three periods may beconsidered as significant in the history of science: a) The ancient GreekPhilosophers and their attempts to explain science from a naturalisticstandpoint; b) the Baconian Revolution in science and the developmentof Inductive reasoning and the major developments of the twentiethcentury with the work of Thomas Kuhn, Karl Popper and PaulFeyerabend.==========================================================
===========================* Department of History and Archaeology, H.N.B. Garhwal University, Srinagar
Garhwal (Uttarakhand)** Department of History and Archaeology, H.N.B. Garhwal University, Srinagar
Garhwal (Uttarakhand)
The Greek Naturalistic Movement- The Greek philosopher, Thales ofMiletus (circa 624 BC-546 BC) is often credited as an originator of ‘TheScientific Method’ and a founder of the school of natural philosophy. Ratherthan rely on a supernatural explanation of observed phenomena, i.e. the causalexplanation for everything being ‘the Gods’, Thales and the Greek naturalphilosophers, searched for naturalistic explanations. For Thales, there musthave been a primary substance or primary principle from which all thingsoriginated. His conclusion was that this primary principle was water. His problemwas explaining how everything originated from water and how, eventually,everything returns to water. Thales’ ideas that the Earth, to which he gaveproperties similar to wood, could then float on a cosmic ocean. The region isalso well known for its volcanic activity and the observation of ‘lighter thanwater’ rocks, such as pumice stone, common in Mediterranean areas, may

Research Journal of Social and Li fe Sciences, ISSN 0973-3914, Vol .-XIV- II, Year-07, June-201310
also have prompted Thales’ notion of a lighter-than-water Earth.Some 200years after Thales, Aristotle (384 BC–322 BC), one of history’s most prolificnatural philosophers, made countless observations of nature, especially thehabits and attributes of plants and animals and focused on categorizing things.He also made many observations on the large-scale workings of the Universe,which led to the development of a comprehensive theory of physics. His methodof working included the implementation of questions and answers in order toarrive at ‘truths’ or axioms. He applied this logical method at deriving ‘truths’to his many observations and developed ‘laws of reasoning’ to arrive atconclusions about the nature of his observations and, more importantly,explanations for those observations. Some people make such assertionsdeliberately, using logic that seems valid to persuade others of their case.The Scientific Revolutio- Sir Francis Bacon (1561–1626) is one of the primefigures of the so-called ‘Scientific Revolution’. Although Bacon gave sciencea way of working, he was not primarily an experimental scientist. Baconpromoted the study of science from a position of gathering data and then, byinference or inductive reasoning, coming to conclusions. In inductive reasoningthe initial premises may support the conclusion, but do not ensure that theconclusion is correct. We can ‘infer’ from the premises that something iscorrect. The more observations (premises) that you base your conclusion on,the stronger your inductive reasoning. The above example is an example ofstrong induction. There are also weak inductive arguments, often made fromweak premises.Feyerabend anarchistic theory of Science - Paul Feyerabend (1924–94)argued against the notion of any scientific method. He later conceded that hehad merely introduced another rigid concept, perhaps even another form ofscientific method. Science, for Feyerabend, is an anarchistic enterprise, hisidea being that theoretical anarchism is more humanitarian and more likely toencourage progress than any ‘law-and-order’ alternative This, he believed,was shown both by an examination of historical episodes and by an abstractanalysis of the relation between ideas and actions. The only principle that didnot inhibit progress for Feyerabend was ‘anything goes’.The scientific method and school science- Neither Bacon, Popper, Kuhnnor Feyerabend provides us with an uncontroversial picture of what science isor, indeed, how it works. By reading their views on science we can gain amuch deeper understanding. Scientists are not all Baconian observers; theymay indeed ‘become Baconian’ when they describe their observations in theirpublished work. Scientists are rigorous in how they present and finally publishtheir work. Data are the currency of science and they are always treated withgreat regard and respect. Should data have been found to be improperlygenerated or reported, it rightly would have shocked the community and wouldhave brought harsh penalties on those who perpetrate scientific fraud.

Research Journal of Social and Li fe Sciences, ISSN 0973-3914, Vol .-XIV- II, Year-07, June-2013 11
Scientists do not have to falsify their own theories; there are many others whowill oblige and attempt to falsify a rival’s theory. Although Kuhn’s notion ofscientific revolutions may suggest wholesale step changes in how we view theworkings of the world around us, scientific progress is, perhaps, moreincremental than revolutionary. The science of the twentieth century hasundoubtedly provided more explanation and more detailed understanding ofnatural phenomena than the explanations for those same phenomena putforward in the seventeenth and eighteenth centuries. It is almost a foregoneconclusion that as the twenty-first century progresses so too will our knowledgeand understanding progress. The move from Newtonian physics to Einsteinianphysics was a revolution, but science and, indeed, the physics textbooks havenot thrown out all of Newton’s ‘laws’ and neither should they.
The fundamental question of whether or not there is one agreed ‘ScientificMethod’ and that this is indeed ‘How science works’ appears to have nosimple answer. Indeed Alan Chalmers, in his book What is this Thing CalledScience (1990), says that, ‘…the reconstructions of philosophers bear littleresemblance to what actually goes on in science’ his reaction to this being thatwe should ‘give up altogether the idea that science is a rational activity operatingaccording to some special method or methods. The use of scientific methodsdoes not make archaeology into a science. The many scientific techniquesthat may be applied more or less directly to the investigation of sites or objectsfall into a sub-discipline generally known as archaeological science. On adeeper level, a ‘scientific’ attitude of mind rejects individual observations orsubjective conclusions, and demands that questions about the past should beposed in the form of hypotheses that can be tested. In this manner,archaeological research should ideally proceed as a series of laboratoryexperiments designed to verify or refute these hypotheses. However, thisanalogy contains a flaw: archaeological experiments are rarely (if ever)repeatable under laboratory conditions, because no two sites or artifacts areever exactly the same. In practice, there are few questions about the past thatwould not benefit from investigation with the help of the natural or biologicalsciences; indeed, many questions may only be answered with the assistanceof scientific methods.The examination of objects and raw material- Any archaeological objectwhether found casually or during a controlled excavation, poses questions aboutits date, origin, function and method of manufacture. Scientific analysis offersmany insights into ancient objects, but, as with dating methods, there must befull cooperation and communication between archaeologists and laboratoryscientists to ensure that the most appropriate methods are applied to suitablesamples. There is little point in conducting analyses without clear questions inmind, and those questions should be the result of archaeological research.Occasionally an archaeologist will only require a straightforward ‘yes’ or ‘no’;

Research Journal of Social and Li fe Sciences, ISSN 0973-3914, Vol .-XIV- II, Year-07, June-201312
the course of further scientific investigation might depend entirely on the answer.In the case of the ‘Ice Man’ found in the Alps (Spindler 1994; Barfield 1994),it was important to know the composition of a metal axe found with the body.Whereas the typological form of the axe suggested a date in the early BronzeAge, radiocarbon dates indicated that the man died in the late Neolithic period.Fortunately, metallurgical analysis was able to reveal very quickly that the axewas made of pure copper, which was acceptable at this early date, rather thanbronze, an alloy of copper and other metals that was not introduced until theearly Bronze Age.Microscopic examination- Not all questions of scientific analysis requirecomplex analytical methods; traditional study by microscope allows manyaspects of stone or metal artifacts to be examined. Geologists have usedmicroscopes to enhance visual observations for several centuries, andmetallurgists may still learn a lot about a metal object by examining a magnifiedcross-section. Archaeologists now use microscopes in use-wear analysis ofartifacts, in particular tools, for patterns of wear or damage on working surfacesmay suggest how a tool was used. Evidence for manufacturing techniquesmay also be revealed by microscopic examination; decorated metal objectswere frequently ornamented by means of a range of engraving tools whoseshapes may be identified when magnified. Visual examination in use-wearstudies is enhanced dramatically by a scanning electron microscope (SEM),which projects a magnified image onto a screen (Olsen 1988). An SEM sweepsa band of electrons over a surface to provide images that possess a depth offocus unobtainable from conventional microscopes (see fig. 5). This, combinedwith a dramatic increase in the power of magnification, reveals not only tracesof use-wear on tools, but also traces of tissues from animal or starches fromplants that were cut by them. SEM photomicrographs of cross-sections ofpottery are also very informative, for they reveal the texture and structure ofclays and glazes with remarkable clarity, revealing techniques of manufactureand decoration.Petrology- Besides the more sophisticated analytical techniques describedbelow, traditional geological methods have much to offer the archaeologist,whether in the context of early prehistoric cultures that relied heavily on theuse of stone for tools, or in more sophisticated societies where fine buildingstone was transported over long distances. Petrology involves the examinationunder a microscope of thin sections cut from samples of stone many mineralsmay be identified by eye, and distinctive rocks are recognizable without thehelp of spectrographic analysis to measure their elements. Axes made in stonefrom volcanic outcrops in western Britain were distributed all over England inthe Neolithic period, and more than 7500 examples were studied by petrologicalmicroscope from the 1940s onwards (Clough 1988). However, the majority ofneolithic (and earlier) stone axes, along with other stone tools, were made

Research Journal of Social and Li fe Sciences, ISSN 0973-3914, Vol .-XIV- II, Year-07, June-2013 13
from flint, which has such a uniform appearance that its source can only betraced with difficulty by spectrometry; inspection under a microscope is of nohelp. Petrological study is helped by the fact that amphorae are occasionallyfound still bearing hand-written inscriptions, written in black ink before theirshipment, giving details of their contents and origin.Metallography- It was realized long ago that, before bronze was made,unalloyed copper was used, because (like gold) it occurs naturally, and can beworked to a certain extent without smelting. However, all but the simplestartifacts required the metal to be poured molten into a mould. Their form, andsurface traces left by flaws in the casting, usually makes it clear if this happened,but a metallurgist is able to determine the kind of mould used (metal, stone orclay) and to distinguish cold worked from cast objects by examining a cross-section under a microscope (fig.1). The crystalline structure of cold-workedobjects is severely distorted and flattened by hammering. Because these tracesare more difficult to detect than minerals in a petrological sample, the sectionhas to be polished and etched to enhance the edges of crystals, and it may benecessary to use SEM magnification to reveal subtle distinctions. Iron objectsalso reveal their production techniques when studied in section. Since cast irondid not appear until the medieval period in Europe, all the traces visible inearlier iron objects are the result of laborious hammering by smiths. Treatmentof the surface to harden it by quenching in water or roasting in charcoal wasimportant in the production of iron weapons, and it also leaves visible tracesthat can be confirmed by analysis of their carbon content. Large or complexobjects were constructed from several pieces, and their joins are more easilystudied in X-ray photographs
Fig: 1 The structure of metals, seen under a microscope. (Vera Bird/JanetLong, British Museum)
than by the destructive process of cutting sections for microscopicinspection; this is also necessary for badly corroded objects.Analysis and characterization- Trace elements are extremely helpful intracing the origins of raw materials, and this approach has been very useful incharacterization studies. Characterization aims to provide individual‘fingerprints’ for sources of raw materials (whether stone, metal ores or clay

Research Journal of Social and Li fe Sciences, ISSN 0973-3914, Vol .-XIV- II, Year-07, June-201314
deposits) by detecting significant trace elements. The results normally requirecomplicated statistical processing to determine whether a distinctivecombination of elements found at one source genuinely differs from that foundat all other sources; if so, the figures can be plotted onto reference graphs.Obviously, a large number of specimens from known sources must be analyzedbefore any artifacts of unknown origin are tested.
An important consideration in the choice of analytical methods is thesize and nature of the sample that is required. Traditional geological andmetallurgical examination under a microscope involves the removal of portionof an object sufficiently large to be ground flat and mounted on a microscopeslide; many stone axes on display in museums show visible traces of this kindof sampling. Most spectrographic techniques based on radioactivity (such asneutron activation analysis) are conducted on very small samples drilledfrom an unobtrusive part of an artifact. X-ray fluorescence is completelynon-destructive, but it only detects the composition of the surface. Thus, thechoice of technique must depend on full consultation between a museum curatoror archaeologist and the laboratory where an analysis will be performed. Manymajor museums have their own laboratories; the British Museum in London isa leading centre for programmes of researchinvolving active cooperation between themuseum’s staff and scientists that benefit bothsidesObsidian- This volcanic glass occurs widely inboth the New and Old Worlds, and it hasattracted considerable attention fromarchaeological scientists. Like flint, it hasexcellent working properties for chip-ping,flaking and grinding into tools with sharp cuttingedges (fig. 2). In some parts of the world, suchas New Zealand, straightforward visualinspection or microscopic examination hasproved sufficient to isolate different sources.Around the Mediterranean and the AmericanCordillera, however, there are numerousvarieties of obsidian that require more subtle differentiation. Most analyseshave attempted to study patterns of prehistoric trade by identifying sourcesthat supplied sites; this has been particularly successful in the Near East andaround the Mediterranean (fig. 3). Their distribution patterns provide insightsinto extensive connections between early Neolithic sites in the Near East asearly as the seventh and sixth millennia BC.
This valuable information about undocumented cultures could not havebeen gained without the use of scientific analysis. However, the interpretation
Fig: 2 Obsidian, a naturalvolcanic glass (HancockMuseum, University ofNewcastle upon Tyne)

Research Journal of Social and Li fe Sciences, ISSN 0973-3914, Vol .-XIV- II, Year-07, June-2013 15
of the results in human terms remains an archaeological problem. Geologymay reveal the sources of obsidian, but archaeologists must attempt to explainwhy any particular site should have received its raw material from one sourcerather than another. Analysis will not indicate whether artifacts arrived on asite as finished objects, or if blocks of raw obsidian were broken up and fashionedinto tools on each site. Experienced archaeological observers may answer thisquestion by looking for waste flakes chipped off cores during the manufacturingprocess. The nature of ‘trade’ is also a matter for archaeological interpretation,with the help of economic anthropologists: was the raw material bartered forother goods in a commercial manner, or was there an elaborate system of gift-exchange conducted on a ceremonial basis?Bronze Age metallurgy- Bronze usually consists of copper alloyed with tin,and varying percentages of other metals. The composition of an artifact madeof copper or bronze is usually examined by a technique known as atomicabsorption spectrophotometry. It requires a small sample drilled from theartifact, which is tested by repeatedly burning parts of the sample, and shininga beam characteristic of each element’s wavelength through the flame. Thequantity of an element is indicated by the amount of light absorbed by atoms ofthat element in the sample, to an accuracy as precise as five parts per millionif necessary; this allows trace elements to be measured along with the principalmetals. It is theoretically possible to use trace elements to identify areas fromwhich ores came, by analyzing ores and products in a manner similar to thestudy of obsidian. Unfortunately it was normal practice for scrap objects to beused as a source of metal, in addition to freshly quarried or mined ores. Theresulting mixtures obviously confuse any attempt to pinpoint the sources ofmetal alloys. Programmes of analysis of finished objects have been carriedout since the 1930s in Europe and elsewhere, and a clear general pattern hasemerged, although the changes took place at different dates in different areas,according to the availability of metal ores. Pure copper (i.e. with only naturallyoccurring impurities) and copper alloyed with arsenic were soon supersededby ‘true’ bronze made by adding tin to the copper.
This change was normally accompanied by the use of more sophisticatedmoulds that required less further work to be carried out to finish the artifactafter casting. In some areas (at various dates) lead was also included as amajor constituent along with tin. This required a balance to be achieved betweentwo conflicting factors: lead made the metal easier to cast into long elaborateswords axes with hollow sockets, but it could make it weaker in actual use. InEgypt, the alloys of copper used for making axes were carefully matched totheir function (fig.4). Those used as weapons were primarily tin bronze, whiletools might be copper or arsenical copper; lead bronze was only utilized foraxes that were decorative rather than functional.

Research Journal of Social and Li fe Sciences, ISSN 0973-3914, Vol .-XIV- II, Year-07, June-201316
Fig 4 Analysis of the composition of metal alloys reveals interestingchanges over time. (Sandra Hooper, after Cowell & La Niece 1991)Isotopic analysis- Individual elements can be examined in more detail toestablish which isotopes (elements with an abnormal number of electrons) arepresent, and in what proportions. The same procedure is used in AMSradiocarbon dating, where the proportion of carbon-14 in a sample relative tocarbon- 12 is measured. Studies of stable isotopes now assist in the study ofGreek and Roman architecture and sculpture. Although some forms of marblemay be distinguished visually or under a microscope, the fine white marbles ofItaly, Greece and Asia Minor have always presented difficulties. Analysis ofthe oxygen and carbon isotopes contained in their chemical structure nowprovides a method of separating them, and it allows styles of carving to berelated to the areas where stone was quarried and prepared for use. As in thecase of obsidian, isotopic analysis had to begin with samples taken from quarriesknown to have been in use in the past, to characterize each of the main sources,before their products could be identified. In cases where quarries are notdistinguishable by means of stable isotopes, trace elements provide a successfulalternative approach. Isotopic studies of metals show some promise for theexamination of ancient trade. Four different isotopes occur naturally in lead,and their ratios have been used to characterize the sources of lead ores, andthose of copper that contained natural lead impurities. The technique workswell on ingots of metal that were lost before use, or objects that were madefrom fresh lead or bronze. It may even be possible to extend the technique toother artifacts that contained lead, but its usefulness will always be limited bythe same problem of mixing scrap metal from several sources that alsocomplicates the characterization of trace elements in bronze.Provenance by date- Scientific dating and analysis occasionally converge.For example, geologists are able to determine the age of deposits of obsidianformed by volcanic activity by means of fission track dating. If fragments ofobsidian found on an archaeological site are examined by the same method,

Research Journal of Social and Li fe Sciences, ISSN 0973-3914, Vol .-XIV- II, Year-07, June-2013 17
the dates obtained do not apply to the artifacts themselves, but to the formationof the raw material at its volcanic source. This date can then be matched to adeposit of obsidian formed at a corresponding date. As in obsidiancharacterization studies, accuracy depends on how many potential sourceshave been sampled and tested. Potassium-argon dating has been used in asimilar way to identify the origins (rather than the date) of hones andwhetstones found on Viking period sites in Britain; again, threw material hasbeen matched with volcanic rocks of the same type and geological age inNorway.Conservation- Although conservation is one of the most important aspectsof archaeological science experienced by Visitors to sites and museums, it iseasily overlooked.Ancient objects- Whenever an ancient object is removed from the groundduring an excavation it is immediately placed at risk, for the stable environmentthat has protected it from total decay since its burial has been lost. Objects inmuseum collections also require constant attention, whether during storage orin public displays. It is essential that an exact identification of the compositionand structure of an object is made before conservation begins. The structuremay sometimes be revealed by visual inspection, using a microscope if necessary,but a particularly complex artifact (or one that has become encased in a thicklayer of corrosion) may require X-ray radiography to understand it (figs 3).Further analysis may be necessary to find out exactly which metals or othersubstances are involved, for these will dictate the form of treatment to beemployed. The most important task of conservation is to neutralize decay,whether caused by the corrosion of metals or the rotting of organic matter, andthis requires a detailed knowledge of chemistry. The next stage is to stabilizethe object so that decay will not start up again; even when treated successfully,objects that are intended for display in a museum will have to be monitoredcarefully to ensure that changes in temperature and humidity do not triggerfurther deterioration. Ethical issues are involved in conservation; a responsiblearchaeologist must plan the finance and facilities necessary for the preservationof finds and no excavation is complete without at least ‘first aid’ facilities tominimize the onset of decay until full treatment is carried out. This is particularlyimportant in the case of waterlogged or desiccated sites where artifacts madeof wood, leather or textiles are likely to be found, for these organic materialsdecompose extremely quickly once they have been removed from a stableenvironment. The restoration of artifacts is also sensitive from an ethical pointof view. A severely corroded or damaged object has little commercial value,but cleaning, stabilization and repair not only improve its display quality for amuseum, but also increase its monetary value in the antiquities trade. Since theborderline between a heavily restored genuine artifact and a fake is sometimesdifficult to draw, conservators must keep detailed records and photographs of

Research Journal of Social and Li fe Sciences, ISSN 0973-3914, Vol .-XIV- II, Year-07, June-201318
all work that they have carried out. This is also important in cases wherefurther treatment may be required later, or where researchers need to knowthe original form of the object. Video recordings now provide a convenientadditional medium for recording conservation work.
Fig: 5, 6, 7 Conservation of archaeological finds and their presentation forarchaeological display involves many scientific and practical skills. (EnglishHeritage/Cathy Haith, British Museum)Historic buildings and archaeological sitesNewly excavated structures soon suffer from exposure, and require permanentsupervision if they are to be left on display. Wind, rain, frosts, plant growth andhuman erosion (by visitors or vandals) soon destroy apparently sound masonrystructures. Buildings that have been visible for hundreds of years are increasinglyvulnerable, for ancient stonework is easily damaged by air pollution in modernurban environments. Famous monuments have been disfigured by deposits ofdirt, while fine details of their carvings have disappeared since accuratedrawings and photographs. These problems will only be solved by a combinationof science and good environmental management.The Environment- The tendency to treat environmental archaeology as aseparate discipline obscures the diversity of specialist skills that it draws upon.For example, an archaeologist engaged in studies of the early Stone Age requiresa detailed knowledge of the plant and animal resources available to hunter-gatherers, an understanding of the prevailing climatic conditions, and informationabout human diet, diseases and life expectancy. Only rarely did excavationextend beyond the principal dwelling house to its barns and animal sheds, letalone to a full examination of excavated animal bones and plant remain.The survival of environmental evidence- The bones are normally found intremendous numbers on most archaeological sites, with the addition of shellsnear coasts, damp acidic soils are likely to destroy everything except burntbone. The most favorable conditions are alkaline sub soils and well-drainedsands or gravels. Arid, waterlogged or permanently frozen conditions also assistthe preservation of other organic materials besides bones, and whole bodies ofhumans and animals have been preserved in many parts of the world. The lateNeolithic ‘Ice Man’ from the Alps, has been found complete with clothing and

Research Journal of Social and Li fe Sciences, ISSN 0973-3914, Vol .-XIV- II, Year-07, June-2013 19
personal possessions that would have decayed completely under normalconditions. Amongst the Ice Man’s property were a bag of dried mushroomsand some sloes, which indicate the good potential for the survival of verydelicate substances. Plant remains are also preserved in arid or wet conditions:wood survives well, as do pips, seeds, and the fibrous matter from leaves,stalks, etc. A surprising amount of information may still be gained from siteswith ordinary soils, too. It has become common to employ ‘flotation’ techniqueson excavations to improve the recovery of very small bones from rodents,birds, reptiles and fish, as well as small shells and the remains of insects andplants. Burning may convert plants into charcoal under the right conditions,and many species of wood, grain, and other plant material may be identified.All of these have considerable significance for the final interpretation of theeconomy and environment of a site or other discovery. Leather and textiles(some made from animal hair, others from plant fibers) were important rawmaterials in the past, but finds are absent from most sites. The study of thosethat have survived is therefore particularly significant if a fuller understandingof the exploitation of natural resources is to be achieved. Every archaeologistshould make regular visits to a museum of ethnography or folk-life, and takenote of the large number of significant items that would not survive on a normalarchaeological site. Hairstyles, body paint, head-dresses and costume all playan important role in the identity of cultures and personal status (even incontemporary urban civilization).Climate- Long-term climatic change has been a fundamental factor in humandevelopment, seen at its most dramatic during the periods of extensiveglaciations that have been known to geologists for more than 200 years. Recentresearch has not only confirmed the dates of major Ice Age episodes, but hasalso given accurate indications of global temperatures. Evidence over ageological time scale comes from variations in oxygen isotopes in sea-beddeposits, while more recent indications are derived from annual layers in ice-sheet cores. Ice layers overlap with records from tree rings and the resultscan be correlated with precise documentary evidence in recent centuries. Whilelong-term change is obviously important from an archaeological point of view,short-term fluctuations may have had an important impact on human life in thepast—especially in farming communities. Ice-sheet cores are very interestingin this respect, for they contain clear records of volcanic eruptions, representedby layers containing high levels of dust and acidity. Volcanic ash in the upperatmosphere may cause severe disturbances to the weather by blocking solarradiation, and if these circumstances were prolonged for many years theycould lead to changes in settlement patterns.Vegetation is an important measure of regional climatic change that has directarchaeological implications. Plants are very sensitive to temperature andmoisture, and most species produce pollen. Fortunately, pollen grains resist

Research Journal of Social and Li fe Sciences, ISSN 0973-3914, Vol .-XIV- II, Year-07, June-201320
decay well, so that cores taken from bogs or lake beds contain excellent recordsof wind-blown pollen. The general pattern of change since the last Ice Agehas been well known since the 1920s, but samples are now dated by radiocarbonto produce a detailed history of vegetation on a regional level. The interpretationof pollen analysis as an indicator of human, as opposed to climatic, influenceswill also be examined below.Rocks and soils- The earlier the period of archaeology that is being studied,the more important geology is likely to be particularly in phases related to IceAges. Geology and geomorphology are essential for understanding the presentlandscape and its past configurations, along with changes in sea level, erosionand the deposition of new land by sedimentation or volcanic activity. Thisinformation not only influences our concepts about the environmental contextof human activities in the past, but also provides vital insights into the likelihoodof finding sites and artifacts. The significance of early finds of bones and flinttools in deep gravel beds was only fully appreciated when geologists had studiedtheir formation and understood the principles of stratification. In cases such asthe hand-axes discovered at Hoxne or in the Somme valley, the artifacts andthe bones ‘associated’ with them had been eroded from their original restingplaces and redeposit in river gravels.Soil Science- Knowledge of geomorphology is also vital for reconstructingthe wider environment of ancient sites in terms of natural resources. Surfacedeposits and outcrops of rock, combined with evidence for rivers and lakes;dictate the forms of vegetation and animal life available to hunter-gatherers orearly farmers. An understanding of soils adds further detail, for soils withdiffering colours, textures and other characteristics are formed and changedboth by natural and human activities. Maps of modern soils and their presentagricultural potential are published in many countries, but they are not a reliableindicator of their state in the past. Soil scientists need to take deep samplesand are particularly keen to examine deposits that have been cut through byerosion or modern construction. When forests on hills are cleared for cultivationor grazing, an increase in erosion normally leads to the deposition of sedimentsin valleys, covering up earlier phases of valley-floor cultivation and settlement.Archaeological earthworks such as ramparts or burial mounds usually preservean earlier ground surface that may also provide samples of pollen and/ormollusks. Buried soils in these situations give important information about thevegetation or form of cultivation that took place immediately before they werebuilt. Other characteristics of soils give clear indications of concentrations ofsettlement and agriculture, notably high phosphate content (above, p. 50).Samples taken systematically over a wide area may help to define the limits ofa settlement without extensive excavation; measurement of the levels of tracemetals offers an addition or alternative to phosphate testing. The acidity of asoil is a useful guide to the prospects for the survival of pollen and mollusks; if

Research Journal of Social and Li fe Sciences, ISSN 0973-3914, Vol .-XIV- II, Year-07, June-2013 21
it is unfavorable, time need not be spent on fruitless collection and processingof inadequate samples.
Soils also provide evidence of past climate through soil micromorphology, which is based on microscopic analyses of soil structures. Thesizes and shapes of soil particles deposited by water during damp periods maybe distinguished from wind-blown material that accumulated during periods oflow rainfall. Soils are classified into types that provide interesting insights intohuman disturbance of the environment. A good example is provided by ‘podsols’ characteristic of heath and moorland. They only support a thin surfacelayer of vegetation, and overlie a layer of leached soil from which rain waterhas washed iron and humus down to the surface of the subsoil. However, thesoils found under prehistoric earthworks erected on what is now moorland arefrequently ‘brown earths’ typical of woodland, not pod sols. Brown earths arestable when covered by trees, but when woodland is cleared, rainfall causesdeterioration to poorer pod sols. The destruction of the world’s rain forests inthe twentieth century is leading to a similar result, as the stable recycling ofnutrients by trees is brought to an end, and alternations of extreme wet and dryconditions break down the structure of the soil.Plant remains- The conditions that favor the survival of plant remains havebeen indicated above. The larger the sample, the more reliable the results oftheir study are likely to be. Botanical identifications are time-consuming andexpensive, but they are extremely important to the interpretation of an individualsite or vegetation in general. Nineteenth century botanists concentrated onlarge fragments of plants, but the focus in the twentieth century moved tomicroscopic pollen grains. Large items such as seeds and pips remain important,however, for they not only reveal the existence of plant species but also giveinsights into the collection and processing of wild fruits or crops fromdomesticated plants. Finds of particular species of cereal grains have implicationsfor farming and harvesting methods, and further enlightenment about soilconditions is gained from studying seeds of weeds that grew amongst cerealcrops. One spectacular example of the study of plant remains is the investigationof the gardens of Pompeii, where the volcanic eruption of AD 79 sealedvineyards, orchards, vegetable plots and ornamental gardens under a thicklayer of ash. Grape pips, nuts and fruit stones were recovered, but a bonusdiscovery was the existence of cavities in the earth where the roots of treesand other large plants had decayed. It was possible to pour plaster into theseholes and then excavate the root system, which could be identified from itssize and pattern. One open area once thought to have been a cattle marketwas found to have been filled with vines and olive trees, and to have had open-air dining couches amongst the foliage. In contrast, indirect evidence of plantsis also recovered in surprising ways. Impressions of grain are occasionallypreserved on pottery; damp clay vessels were dried before firing, and their

Research Journal of Social and Li fe Sciences, ISSN 0973-3914, Vol .-XIV- II, Year-07, June-201322
bases frequently picked up fragments of straw or grain from dry material thatwas probably spread out to prevent them from sticking. The organic matterburnt out completely during firing, leaving hollow voids from which casts canbe taken with latex or plaster. These are examined under a microscope toidentify the species present. Pottery can also be examined to detect food residuesabsorbed into the clay during cooking..Pollen analysis- The most productive technique that has been applied toarchaeological plant remains is undoubtedly palynology—the study of pollen.All hay-fever sufferers know that the air is full of wind-borne pollen during thesummer months. Fortunately for archaeologists each minute grain of pollenhas a tough outer shell of a different shape for each species (fig. 9). Theseshells survive well in soils whose acidity is sufficiently high to reduce the bacterialactivity that would normally cause them to decay. The loss of pollen fromalkaline soils, such as those of the densely occupied and farmed chalk lands ofthe toughness of pollen grains allows them to be separated from samples ofsoil collected on sites by straightforward laboratory methods, but they mustthen be identified and counted under a microscope by an experiencedpalynologist—a very time-consuming task. Most grains are less than 100th ofa millimeter in diameter. Their abundance makes counting a tedious procedure,but it has the advantage that statistically significant quantities are easily obtainedfrom small samples of soil.
Since palynology is able to monitor general changes in climate andvegetation over long periods, it is of considerable interest to climatologists,ecologists, botanists and geographers as well as to archaeologists. Samples ofpollen taken from cores bored from deep peat bogs or lake sediments arestratified, with the earliest part lying deepest. A deposit that has formed overthousands of years should reflect overall changes from tundra to forest orfrom forest to farmland, and indicate fluctuations in the prominence of individualplant species (fig. 10). Sufficient analyses have been made to give a fairlyclear picture of the major changes of vegetation since the last Ice Age, and todefine a series of climatic ‘zones’ that formed a valuable form of dating beforethe arrival of the radiocarbon technique. These zones of climate and vegetationprovide a general context for human activities, such as early Stone Age huntingon the open tundra, or mesolithic hunting and gathering in forests. When apicture of background vegetation is added to other plant remains, artifacts andanimal bones from an excavated settlement, there is an increased possibility ofaccurate interpretation of past economies and the functions of tools andweapons. The application of palynology is world-wide, and its value is notrestricted to prehistoric times. It can be used to examine the environment ofindividual sites or regions in periods before documents provided such informationinsufficient detail.
One key issue that may be studied through pollen analysis is the

Research Journal of Social and Li fe Sciences, ISSN 0973-3914, Vol .-XIV- II, Year-07, June-2013 23
appearance of the first settled Neolithic farming communities. It represents amomentous stage in human development, both in terms of exploitation of theenvironment and social organization. The Neolithic economy requiredpermanent buildings to be erected and for land to be cleared of trees for pastureand arable land. Different plant species have distinctive pollen grains whosetough outer shells can be identified by specialists in the laboratory. This drawingshows important trees found in postglacial deposits: alder, birch, hazel, hornbeam,oak, elm, lime, beech and pine. A change in the ratio of tree-pollen (TP) tonontree-pollen (NTP) in stratified deposits; thus, even if no neolithic sites havebeen discovered in a particular region, the pollen record may indicate theirexistence. TP declines, NTP rises, and tell-tale species of grasses and cerealsappear, together with ‘weeds of cultivation’ that thrived in the new conditions.Fine particles of charcoal may also be detected, showing that forest clearanceinvolved burning. The appearance of signs of a Neolithic economy in a pollensample can be dated by radiocarbon, and their presence may provide a spur tofieldwork to locate the settlement sites that belonged to the first farmingcommunities. In comparison with their use in prehistoric archaeology,environmental approaches to historical periods are still in their infancy, buthave great potential.
Fig: 10 Pollen diagrams are not easy to interpret, but the method of presentationis similar to that of serration in that the thickness of the line for each individualspecies reflects its relative importance. (Audio Visual Centre, University ofNewcastle)
Because most pollen is deposited within a few miles of its source, it canprovide a picture of the plant population in the immediate surroundings of anindividual site. A site that occupied a small clearing in a forest would have ahigh proportion of tree pollen (TP) to non-tree-pollen (NTP), whereas asettlement in open country would show the reverse. TP and NTP may also beexamined in terms of individual species or groups of related plants. NTP mayhighlight different proportions of grasses and cereals that indicate the relative

Research Journal of Social and Li fe Sciences, ISSN 0973-3914, Vol .-XIV- II, Year-07, June-201324
importance of grazing and grain production in the economy of a site, whilepollen from plants such as legumes, flax and hemp may indicate other forms offood production and raw materials for textiles. Samples of pollen taken fromsoil buried beneath mounds or ramparts may tell the archaeologist whether theland was forested or covered with scrub before its occupation. The soil thatformed after the abandonment of a site may show whether the land returnedto scrub and then forest, or remained open, perhaps as part of the farmland ofanother settlement nearby. Further questions of direct relevance to an excavatormay be answered by palynology. Mounds and ramparts can be examined tosee if their material was dug from the subsoil, in which case it will contain amixture of contemporary and older fossil pollen, or whether they were formedby scraping up turf or topsoil from the surface. This kind of information mayhelp in the interpretation of ditches, pits, etc., on a complex site, and clarifytheir relationships to the construction of earthwork features.Tree-rings- Besides their value for dating, tree rings provide a continuousannual record of climate. The correlation between modern meteorologicalrecords of temperature and precipitation and the width of individual rings seemssufficiently close to allow them to be used to make estimates of conditions inthe past before such records began , but caution is still advised (Baillie 1992).At the opposite end of the scale, the pattern of tree-rings in an individual trunkis influenced by the location of the tree. Minor fluctuations in the immediatelocality, such as fire damage, insect attack, clearance of surrounding trees,drought or flooding, may all leave tell-tale indications in the rings. A usefulresult of this degree of sensitivity is that timbers used in a building or a shipreflects the nature of the woodland where they grew. Trees from dense forestsdisplay different ring patterns from those that grew in open spaces orhedgerows, for example. Ring patterns characteristic of a particular area allowthe origins of wood to be determined, revealing.
An unexpected by-product of tree-ring dating is the detection of phasesof exploitation of the landscape, reflected by the age of tree trunks preservedin river silts. During the Roman occupation of southern Germany, very largenumbers of trunks from mature trees up to 400 years old ended up in theDanube. It is likely that agriculture was intensified in response to the presenceof Roman forts and towns, and that there was an increased demand for timber,both for building purposes and fuel. These factors led to woodland clearanceand soil erosion, resulting in an increase in the amount of sediment that waswashed into rivers. This caused flooding that swept away mature trees growingsome distance from the normal course of the river. Many other precisely datedclimatic episodes are suggested by tree-rings. That they are so closely datedprovides an invitation for archaeologists to scrutinize all sorts of evidence toseek wider evidence for changes caused by climatic phenomena. Even majorchanges, such as the transition from hunting and gathering to farming in the

Research Journal of Social and Li fe Sciences, ISSN 0973-3914, Vol .-XIV- II, Year-07, June-2013 25
British Isles, may prove to have been associated with climatic events revealedby tree-rings.Animal remainsAnimal bones- The principal task of a zoologist confronted with a collectionof ancient bones is to identify the species that are represented. The zoologistmust have experience of archaeological samples, and may need to consultreference collections of bones from other excavations. Domesticated animalsin particular differ considerably from their modern counterparts, and closelyrelated animals like sheep and goats are difficult to separate from each other.Another important task is to estimate the number of animals involved. It is notsufficient simply to count the bones, for while some animals may be representedby just one bone, there may be many from others. It is customary to countspecific bones to estimate the minimum and maximum number of individualanimals required to produce the sample; the larger the collection available, themore accurate these estimates will be. The approximate ages of individualanimals may be ascertained by examining the state of ossification of particularbone structures, the eruption of teeth in jaw bones, and the amount of wear onteeth. Sex is more difficult to establish, but statistical studies of large samplesof bones may help to divide them into groups of different sizes, of which thesmaller is likely to represent females.Interpretation It is important to understand the nature of any context fromwhich bones have been recovered. Other finds, such as datable pot-shreds,may indicate whether it formed over a long or short period, and the conditionof the bones themselves may also tell something about the circumstances offormation. Weathered, broken bones with signs of damage from rodents orscavenging animals are readily distinguishable from those that were buriedimmediately, and this information will of course be valuable to the excavatoras well as the bone specialist. Obviously, it would be a waste of a specialist’stime to interpret bones from a disturbed deposit. It may be necessary to conductscientific tests to check the consistency of early prehistoric deposits that lackclosely datable finds.
The most important aspect of the study of bones is that the nature of anexcavated context must always be looked at very closely. Bones found onsites reflect living populations of hunted or domesticated animals in differentways, and a sample recovered from an excavation may not be representativeof the whole site. Besides identifying species and calculating the number ofanimals represented by a collection of bones, and their sex and age, specialistsmay be able to glean further information from bones. Hunting techniques maybe deduced from injuries, and butchery practices are sometimes revealed byways that the bones were cut or broken. The exploitation of animals for transportand traction has important social implications. DNA recovered from animalbones offers great potential for confirming difficult identifications of species

Research Journal of Social and Li fe Sciences, ISSN 0973-3914, Vol .-XIV- II, Year-07, June-201326
or sex, and for studying the processes of domestication by examining the geneticlinks between wild and domesticated animals (Brown 1992, 19). Anotherfascinating line of research is offered by the fact that animal blood and hairsmay sometimes be found on prehistoric tools. As with indirect evidence forplants, DNA study of these traces extends the range of information aboutanimals to the stages of food processing and consumption.
Fig 12 Photomicrographs taken with a scanning electron microscope (SEM)provide images with a depth of focus that allows artifact surfaces, plant remains,etc. (Dr J-P Wild/W Cooke, Manchester Ancient Textile Unit)Fish bones- Sieving and flotation techniques have improved the recovery ofbones from small mammals, birds, reptiles, amphibians and fish. Unlike all theothers, fish bones appear on archaeological sites on dry land as a direct resultof human activity. Unfortunately fish bones have a much lower chance ofsurvival than animal bones because of their small size and cartilaginousconsistency. Interesting (if rather distasteful) experiments have been conductedon the survival of modern fish bones that have passed through the digestivesystems of pigs, dogs and humans. Less than 10% of the bones of mediumsized fish survived, with the implication that the importance of fish in the dietwill be underestimated on many sites, even when small fragments have beenrecovered by sieving. If rats were common on a site, bones that they gnawedand digested could disappear altogether.Shells- Shells found in archaeological deposits fall into two distinct categories.Some were brought to settlements from the sea-shore and discarded aftertheir contents had been eaten, and are informative about diet and the exploitationof marine resources. Others belonged to land mollusks that lived on the site;many of these are extremely small and can only be separated from samples ofsoil under laboratory conditions, but they provide valuable insights into thelocal environment.Marine shells- Large mounds of discarded shells (middens) are found alongmany coastlines, providing evidence of extensive marine exploitation in the

Research Journal of Social and Li fe Sciences, ISSN 0973-3914, Vol .-XIV- II, Year-07, June-2013 27
past. The food potential of shells is fairly simple to calculate, but deeper insightsmay be gained by more detailed observations. The size and shape of commonspecies, such as the limpet, show whether they were collected at random orwhether particularly large examples were chosen at low tide; a limpet shell’sshape varies according to how far below the high water mark it lived. Non-random collection would obviously imply planned exploitation, perhaps indicatinga greater dependence on shellfish than on other food sources. Measurementof oxygen isotopes present in the edges of shells reveals whether collectingtook place all year round or only seasonally. Since the proportions of theseisotopes vary according to the prevailing temperature, middens associated withsummer camps should show uniform proportions, while permanent sites shouldcontain the range found in a whole year. As an alternative to isotopic study,seasonal growth patterns can be seen in cross-sections of the shells of somespecies. Oxygen isotope analysis of samples from deeply stratified sites mayalso document longer term climatic fluctuations that can be checked againstthe presence or absence of particular species that are sensitive to temperatureconditions. First-order radiocarbon dating provides a useful means of datingshell deposits found during fieldwork, at a fraction of the cost of conventionalmethods.
Sea shells are not always evidence of diet, particularly when found inland.Large examples may act as containers, spoons and even tools, while theMediterranean murex provided purple dye. Other exotic uses, such as charms,jewellery and even ceremonial trumpets, have been recorded by archaeologistsand ethnographers. Strontium isotope dating has demonstrated that spondylusshells found widely throughout Neolithic Europe really were modern specimensgathered around the Mediterranean coasts, rather than fossil examples collectedfrom geological deposits. These examples demonstrate again that the scientificskills of marine biologists are needed to identify shell species and subject themto various forms of analysis, but, as with other scientific and technicalinformation, the results require careful interpretation by archaeologists.Land molluscs- Land molluscs (mainly snails: Evans 1973) range from largeedible species to forms only visible and identifiable with the help of a microscope.Species recovered from ancient soils or geological deposits reflect variationsin the climate during successive Ice Ages and warmer periods. They mirrorchanges in temperature in the same way as vegetation, and their distributionsin the past may be compared with their modern habitats in exactly the samemanner. Of more direct relevance to archaeology is that hundreds of smallshells may be recovered from layers of soil. Samples are sorted into groups ofspecies that prefer grassland or woodland, open or shaded localities, etc. Thus,the snail species found in a ground surface buried beneath a structure such asa rampart or burial mound will indicate whether it was erected on open heath(if light-loving grassland species are dominant) or in freshly cleared forest (if

Research Journal of Social and Li fe Sciences, ISSN 0973-3914, Vol .-XIV- II, Year-07, June-201328
species that live in dark and damp woodland conditions are more numerous.The snail species found inside a skull favoured a damp dark habitat, but not anunderground one, implying that the body had not been buried, but had rottedwhere it lay in the over-grown ditch. A further advantage of land snails is thatthey survive well on calcareous soils that do not favour the preservation ofpollen. In practice, they reflect a much more local environment, for pollen isscattered over many miles by wind. Ideally, both sources of evidence shouldbe examined together to establish the general and immediate environment of asite.Human remains- The questions asked about human remains tend to be ratherdifferent from those asked about animal bones or shells, which were normallydisposed of along with domestic rubbish. Evidence for early prehistoric peopleis very fragmentary, especially the fossil bones from the geological deposits inEast Africa that are so important for tracing the emergence of modern species.Human remains were regularly treated with more respect 35,000 years ago,and even at this date complete bodies were buried with ‘grave goods’. Objectsplaced in graves help to date burials and may indicate ritual activities or hint atthe social status of the deceased. Where soil conditions allow, burials allowcomplete skeletons to be recovered for study, and this offers the possibility ofestablishing the cause of death, which demands the expertise of a pathologist.The study of well-preserved bodies is like an excavation itself, involving X-rayexamination, dissection and the study of all the materials encountered, whetherfibers of clothing, skin tissues, or food remains (fig. 13).
Multiple burials are common, where bodies have been jumbled togetherin collective tombs over long periods, or where cremated bones were emptiedinto burial chambers in irretrievable confusion. To complicate matters further,incomplete bodies were sometimes buried after the corpse had been exposedto the elements and scavenging birds and mammals. Burials where the bodywas cremated and the surviving fragments of bone were crushed and placedinto an urn or other container, are less favorable for scientific study.
Given reasonably well-preserved remains, the techniques employed inthe study of human bones are very similar to those applied to animal remains.Age may be estimated from a number of osteological developments, such asthe fusion of the skull bones and the growth of teeth. Sex may be determined(with some difficulty) from the sizes of various parts of the skeleton, whilestature may be estimated from comparisons with modern people—althoughdiscrepancies of several centimeters exist between different systems ofmeasurement. Pathologists examine deformities and evidence of disease rangingfrom malnutrition, arthritis and dental decay to the erosion of bone throughleprosy, as well as injuries, whether healed or fatal. Diet may be investigatedthrough the analysis of carbon isotopes, or trace elements such as strontium,contained in bones; their ratios or levels may indicate a preponderance of

Research Journal of Social and Li fe Sciences, ISSN 0973-3914, Vol .-XIV- II, Year-07, June-2013 29
seafood, maize or rice. Samples derived from bone collagen limit analysis tothe last 10,000 years, but studies of tooth enamel may allow these techniquesto be extended to early hominids.
Fig: 13 the ghostly image on the left, a computer generated stacked-image axial scan of an Egyptian mummy, was produced using medicalequipment. (Liz Watson, Hancock Museum; Michael Myres, Royal VictoriaInfirmary, Newcastle upon Tyne)
Archaeologists need to scrutinize evidence provided by the examinationof human bones particularly closely. It is very difficult to estimate the agestructure and physical well-being (or otherwise) of a population because it isimpossible to tell whether burials recovered from a particular culture (if soilconditions allow their preservation) represent the dead of all levels of society,or simply a social élite. Were primitive people tall, healthy, ‘noble savages’, ordiseased, short-lived, stunted individuals for whom life was ‘nasty, brutish, andshort’? Only very rarely do archaeologists uncover a large number of bodiesthat might represent a true cross-section of society. Even then there is alwaysa high chance that young able bodied individuals had already made their escape.Genetics- Work is progressing rapidly on the recovery of DNA and bloodproteins from bones or (when preserved) other body tissues. At a basic level,DNA indicates the sex of a deceased individual—not always possible fromskeletal remains. It also offers the possibility of studying whether bodies foundin a cemetery come from related family groups. Like existing studies of bloodgroups, this information might prove useful on a broader scale in charting ethniccontinuity or change-over periods when artifacts seem to indicate the arrivalof external influences. Change may result from peaceful contact and trade, ormigrations by invaders and settlers. Great difficulties are involved, for it willtake many years before sufficient samples have been studied to definerecognizable groups in historical periods; the situation may be slightly easier inprehistoric populations that have not yet undergone too much confusinginteraction. Studies of DNA demand extreme care in the selection, preservation

Research Journal of Social and Li fe Sciences, ISSN 0973-3914, Vol .-XIV- II, Year-07, June-201330
and handling of specimens to avoid modern contamination (Hedges and Sykes1992). Furthermore, ‘the interpretation must of course take into account thewhole range of archaeological evidence pertaining to the question being asked,and should also consider ancient bimolecular other than DNA.The study of coprolites- Human coprolites (solid excreta) preserved on aridsites in the south-western United States, Mexico and South America havemade a notable contribution to research into the natural resources available toearly native American cultures. The arid conditions ensure the preservation offibrous matter that has passed through the human digestive system, includingfragments of bone, skin, scales, hair, feathers and meat, as well as pieces ofinsects, parasites and their eggs. Plant fibers and seeds are also found, togetherwith microscopic pollen and ‘plant opals’ (distinctively shaped silica crystalsformed by some plants). Even soft tissues from plants and animals can beextracted and identified by careful processing and sieving of rehydratedcoprolites. Large collections recovered from latrine deposits allow detailedsurveys of the diet of the occupants of a site to be made. If deposits of differentdates are recorded from a particular site or area, long-term changes of dietmay be charted and related to variations in the availability of foodstuffs.Coprolites may also contain eggs of parasitic worms that once infested thedigestive tract of a living human. Conversely, where environmental conditionsdo not favour the survival of coprolites, soil samples can be analyzed to detectparasite eggs, whose presence may help to explain the function of latrines orpits.Statistics- Archaeology is full of intuitive statements based on experiencerather than calculation. Simple statistics are useful for checking almost anystatements that involve comparisons, such as claims that the dimensions of atype of artifact change over time, or that settlement sites of a particular periodtend to occupy one particular kind of soil. Probability testing is appropriatein these circumstances. In the latter case, the number of sites located on eachsoil type should be counted, and a simple statistical analysis will compare thetotals with the numbers that would have occurred if the distribution had beenentirely random. The results are expressed as a significance level; mostsciences demand a level of at least 0.05, at which the figures observed haveonly a 1 in 20 probability of occurring by chance. Statistical tests also takeaccount of the size of a sample, and data may have to be rejected if the sampleis too small. Similar tests may also be conducted on the distribution patterns ofsites or artifacts, and again the basis is a measurement of the difference froma random scatter. An understanding of probability is of growing importance inradiocarbon dating, for the calculation of dates from laboratory samples alwaysinvolves estimates of error. This has to be taken into account when a calendardate is calculated from a calibration curve, for it has a built-in margin of error.Correlation is another common statistical measure used by archaeologists.

Research Journal of Social and Li fe Sciences, ISSN 0973-3914, Vol .-XIV- II, Year-07, June-2013 31
The relationship between any two sets of numerical variables may be testedby plotting them on a scatter diagram, and observing the pattern that results. Asimple example might be to plot the length and breadth of Anglo-Saxon timberbuildings to test the uniformity of their ratio. A straight line on the graph wouldindicate that the builders shared a uniform concept of proportions, irrespectiveof size, whereas a wide scatter of variables would indicate that buildings wereconstructed without any such guiding principles. Various factors, such as theheight of pots or their decorative motifs, were found to be significant in waysthat would not have been noticed without a careful numerical analysis.Scientific analyses carried out for purposes such as the characterization ofobsidian or clay produce bewildering columns of figures that can only be clarifiedby means of statistical methods. Multivariate procedures have been designedto look for significant relationships or contrasts between elements or mineralsto define groups that may bring some order into the data (see fig.3). Multivariatestatistics, notably cluster analysis, also lie behind some computerized exercisesin the typological classification of artifacts or the seriation of assemblagesfound in stratified contexts or graves. The ready availability of powerfulmicrocomputers facilitates and speeds up statistical analysis, so that a mass ofconfusing detail can be weighed up absolutely consistently.Computers- Computers are so well integrated into archaeology, fromprospecting and discovery to storage and publication, that it is no longernecessary to discuss computing as a separate topic. Most scientific datingmethods, along with techniques used in the analysis of artifacts, employapparatus linked directly to computers that monitor the operation of theequipment and record and process the results. Computers not only save thetime of skilled laboratory staff, but are faster and more reliable. Their importanceis obvious in the estimation of the margin of error involved in measurements ofradioactivity in samples of ancient carbon, and the subsequent calibration ofdates. The 1993 issue of Radiocarbon included not only a revised calibrationcurve, but also a floppy disk with a computer program to help with thesecomplex calculations! Computers are also an integral part of the technicalequipment involved in processing aerial photographs and readings recordedduring geophysical surveys. The adjustment of oblique aerial photographs tofit an image on to a uniform horizontal scale involves extraordinarily complicatedmathematical procedures. Besides their involvement in statistics, laboratoryscience and cartography, the principal function of computers in archaeology isto record, store and retrieve large quantities of information, such as excavationrecords or museum archives; this is a question of management rather thanscience. However, geographical information systems (GIS) are a rathermore scientific application of computing that combines maps, environmentaland archaeological data with statistical calculations to produce graphicvisualizations of relationships between these categories of information. GIS

Research Journal of Social and Li fe Sciences, ISSN 0973-3914, Vol .-XIV- II, Year-07, June-201332
promise to provide major advances in the analysis and interpretation of ancientlandscapes.Experimental archaeology- One welcome by-product of a scientificapproach to archaeology has been the increasingly frequent use of practicalexperiments to test hypotheses. Most have been one-off tests of specific ideas,but a few, for example the Butser Ancient Farm Project, have developed intolong-term programmes observing a whole range of variables over severaldecades. The strict definition of an experiment employed in the scientific worldis rarely fulfilled in an archaeological context, for many factors are difficult tocontrol or measure, let alone replicate on another occasion. Even when theyare demonstrations or simulations rather than true experiments, they may stillproduce valuable information.Artifacts- Experimental archaeology is a useful companion to scientific analysisin the study of artifacts, for their composition and structure may suggestmethods of manufacture. Ancient technology has been explored byreconstructions of metal casting procedures, the making and firing of pottery,and various forms of stone working. If one particular manufacturing techniquesuggested by an archaeologist is found to be successful in practice, theexperiment only confirms that it could have been used in the past, not that itactually was. For this reason it is important to adopt a more scientific approach;a single demonstration of one method of firing ancient pottery is of limitedvalue without a series of comparative firings carried out using different fuels,kiln structures, methods of arranging the pots in the kiln, etc. Again, it willnever be proved that the technique found to be most effective today was theone employed in the past, but the possibility of gross misinterpretation will bereduced if some unsatisfactory techniques are ruled out. It is essential thatappropriate techniques, materials and equipment known to have been in use inthe relevant society are employed.Conclusion- How science works does, to some extent, depend on the sciencethat you are ‘doing’. The theoretical physicist will work differently from thechemist, who in turn will differ in their working from a biologist or geologist.The scientific methods employed in archaeological research now impinge uponmost areas of the subject. The relationship between archaeology and scienceremains clear. However, science supplies increasingly detailed and preciseinformation upon which improved archaeological interpretations can be based.Furthermore, the use of scientific evidence and an awareness of scientificmethods enhance the design and conduct of archaeological research.Archaeologists and historians ignore scientific evidence at their peril, if theywish to understand the chronological framework of the past, or the materialresources available to ancient societies, and the natural environments wherethey lived. The development of new techniques, and the inevitable errors thatthey will contain at the outset, provides an opportunity for interaction between

Research Journal of Social and Li fe Sciences, ISSN 0973-3914, Vol .-XIV- II, Year-07, June-2013 33
science and archaeology when disagreements arise, for both must re-examinetheir own particular forms of data and analysis. ‘For is it not, these days, adefining characteristic of real science that it is testable?…That archaeologicalscience should sometimes give wrong answers, and that these can later beshown to be indeed erroneous, must be counted one of the subject’s greatstrengths’ (Renfrew 1992).======================References-1. Aitken M J 1985,Thermoluminescence Dating, London, Academic Press2. Aitken M J 1990, Science-based Dating in Archaeology, London, Longman3. Bryson, B. (2003) A Short History of Nearly Everything, 1st edition, Doubleday,
London4. Cattaneo C et al1991, ‘Identification of ancient blood and tissue-ELISA and
DNA analysis’, Antiquity 65 878-815. Chalmers, A.F. (1999) what is this thing called science? 3rd edition, Open
University Press, Milton Keynes6. Cole J M 1979, Experimental Archaeology, London, Academic Press7. Cowell M & La Niece S 1991,‘Metalwork: artifice and artistry’, in Bowman S,
Science and the Past, London, British Museum 74–988. Drury P J (ed) 1982, Structural Reconstruction: Approaches to the
interpretation of the excavated remains of buildings,Ox- ford, Brit ArchaeolRep 110
9. Evershed P et al 1992, ‘the survival of food residues: new methods of analysis,interpretation and application’, in Pollard A M, New Developments inArchaeological Science, Oxford, Clarendon 187–208
10. Evans J G 1973, Land Snails in Archaeology, London, Seminar Press11. Feyerabend, P. (1999) Against Method, 3rd edition, Verso Books, London12. Fieller N R J et al (ed) 1985, Palaeoenvironmental Investigations: Research
design, methods and data analysis, 2 vols: Oxford, Brit Archaeol Rep S258,S266
13. Gale N H & Stos-Gale Z A 1992, ‘Lead isotope studies in the Aegean (theBritish Academy project)’, in Pollard A M, New Developments inArchaeological Science, Oxford, Clarendon 63–108
14. Glover E Glover I & Vita-Finzi C1990, ‘First-order 14C dating of marine molluscsin archaeology’, Antiquity 64 562–6
15. Graslund B 1987, The Birth of Pre- historic Chronology: Dating methods anddating systems inn i n e t e n t h - c e n t u r y Scandinavian archaeology,Cambridge Univ Press
16. Grayson D K 1984, Quantitative Zooarcahaeology: Topics in the analysis ofarchaeological fau- nas, London, Acad Press
17. Gribbin, J. (2002) Science: A History 1543–2001, Penguin, Allen Lane, London18. Hawkes J 1982, Mortimer Wheeler: Adventurer in archaeology, London,
Weidenfeld & Nicolson19. Klein R G & Cruz-Uribe K 1984, The Analysis of Animal Bones from
Archaeological Sites, Chicago Univ Press20. Henderson J (ed) 1989, Scientific Analysis in Archaeology, Oxford, Oxford

Research Journal of Social and Li fe Sciences, ISSN 0973-3914, Vol .-XIV- II, Year-07, June-201334
Univ Committee Archaeol21. Kuhn, TS. (1996) the Structure of Scientific Revolutions, 3rd Edition, Chicago
University Press, Chicago22. Malina J & Vas?íc?ek Z 1990, Archaeology Yesterday and To- day: The
development of archaeology in the sciences and humanities , Cambridge UnivPress
23. Parkes P A 1986, Current Scientific Techniques in Archaeology, London,Routledge
24. Popper, K. (2002) Conjectures and Refutations, Routledge and Keagan Paul,London from Schick, T (ed) (2000) Readings in the Philosophy of Science,Mayfield Publishing Company, Mountain View, CA
25. Renfrew C 1992, ‘The identity and future of archaeological science’, in PollardA M, New Developments in Archaeological Science, Oxford, Clarendon 285–93
26. Renfrew C & Bhan P 1991, archaeology theories, methods and practice,London, Thames and Hudson
27. Zeuner F E 1946, dating the Past: An introduction to geochr oncology, London,Methue
28. Zimmerman L J 1989, ‘Made radical by my own: an archaeologist learns toaccept reburial’, in Lay ton R, Conflict in the Archaeology of Living Traditions,Lon- don, Unwin Hyman, One World Archaeology 8 60–7
29. Zivanovic S 1982, Ancient Diseases: The elements of palaeopathology,London, Routledge.

Research Journal of Social and Life SciencesISSN 0973-3914, Vol.-XIV- II, Year-07, June-2013
Panchayat Raj Members and Awareness of RuralDevelopment Programme - Experience from South
Karnataka
* Chandrashekar. E.==========================================================Abstract- Self-employment is the best employment and entrepreneurshipis the most important mode of self employment. A holistic programmecovering all aspects of self employment was introduced by the Governmentof India in 1999, which is popularly known as Swaranjayanti GramSwarozgar Yojana [SGSY].Generation of self- employment for the poorin rural areas is one of the important components of anti- poverty andrural development strategy adopted by the Ministry of RuralDevelopment.). The Panchayat members have to play important role inrural development by implementing the various rural developmentprogrammes. Hence, it is important to study the knowledge level,participation and problems of members of Gram Panchayat implementingand monitoring of SGRY. It becomes clear that the elected member ofPRI, could play a significant role in Sampoorna Grameen Rozagar Yojanaprogramme. "Ex-post facto design" was employed in the present researchstudy as the events have already occurred and design was consideredappropriate. The study was conducted in Shimoga district of Karnatakastate during the year 2008- 09. The Shimoga district has been purposivelyselected for the study because of high, medium and low literacy level inrural.==========================================================
===========================* Assistant Professor, Department of Sociology/ Adult Continuing Education,
Extension and Field Out-reach, Kuvempu University, Shankaraghatta-577451,Shimoga Dist., Karnataka.
Introduction- In 1993, the Government of India passed a series of constitutionalreforms, which were intended to empower and democratise India’s ruralrepresentative bodies – the Panchayats. The 73rd Amendment to theConstitution formally recognised a third tier of government at the sub-Statelevel, thereby creating the legal conditions for local self-rule – or PanchayatiRaj. Since this time, the process of decentralisation has been highly variable,ranging from ambitious attempts at Gram Swaraj (or village self-rule) inMadhya Pradesh to political re-centralisation in Karnataka. Early experienceshave also revealed considerable uncertainty and confusion about the precise

Research Journal of Social and Li fe Sciences, ISSN 0973-3914, Vol .-XIV- II, Year-07, June-201336
political, administrative and fiscal powers Panchayats have in relation to theStates, line ministries, and local user groups. This, in part, reflects the fact thatthe 73rd Amendment gave the State governments considerable autonomy tointerpret and implement the constitutional reforms.
Rural Development in India is one of the most important factors for thegrowth of the Indian economy. India is primarily an agriculture-based country.Agriculture contributes nearly one-fifth of the gross domestic product in India.In order to increase the growth of agriculture, the Government has plannedseveral programs pertaining to Rural Development in India. The Ministry ofRural Development in India is the apex body for formulating policies, regulationsand acts pertaining to the development of the rural sector. Agriculture,handicrafts, fisheries, poultry, and diary are the primary contributors to therural business and economy. Rural development in India has witnessed severalchanges over the years in its emphasis, approaches, strategies and programmes.It has assumed a new dimension and perspectives as a consequence. Ruraldevelopment can be richer and more meaningful only through the participationof clienteles of development. Just as implementation is the touchstone forplanning, people’s participation is the centre-piece in rural development. People’sparticipation is one of the foremost pre-requisites of development process bothfrom procedural and philosophical perspectives. For the development plannersand administrators it is important to solicit the participation of different groupsof rural people, to make the plans participatory.
The even after being in existence for about four decades, the PanchayatRaj Institutions (PRI’s) could not acquire the status and dignity as viable unitsof self government and responsive people’s besides. Several factors wereresponsible for impending the growth of the panchayat. Among the system oftop down approach where the programmes were planned without muchinvolvement of villagers, was the most important factor for poor performanceof the panchayat, (Santhanam et al., 1984). Besides, some rural developmentprogrammes, including agriculture, were implemented through the district levelline departments/agencies under the overall supervision and control of the districtcollector/district magistrate. All these programmes were totally under thebureaucrats dominance and the PRIs had to be contented with back seat driving.The Panchayat Raj has come into existence with the sole aim of decentralizationof government power for the welfare of rural people. After independence, thePanchayat Raj has become a backbone of Indian democracy. In three tiersystem of Panchayat Raj, the non officials are playing an important role inestablishing linkage between official, and the beneficiaries. The governmentof India expected to plan and implement the development programmes likeIRDP, DWCRA, TRYSEM, GKY, NREGA and MWS have been integratedinto one programme known as Swarnajayanti Gram Swarojgar Yojana (SGSY)and EAS and JGSY have been integrated into one programme known as

Research Journal of Social and Li fe Sciences, ISSN 0973-3914, Vol .-XIV- II, Year-07, June-2013 37
Sampoorna Grameen Rozagar Yojana (SGRY). The Panchayat members haveto play important role in rural development by implementing the various ruraldevelopment programmes. Hence, it is important to study the knowledge level,participation and problems of members of Gram Panchayat. Therefore, thepresent study was undertaken on SGRY programme.Sampoorna Grameen Rozagar Yojana (SGRY)- The SGRY was launchedall over the country on 25th Sept, 2001. SGRY aimed to create the need basedrural infrastructure at the village level. These programmes contributed to agreat extent in alleviating rural poverty and in improving quality of rural life.The objective under SGRY is to provide additional wage employment in ruralareas as also food security along side the creation of durable community. Socialand economic infrastructure in the rural areas. The programme is self targetingin nature with special emphasis to provide wage employment to women,scheduled castes, scheduled tribes and parents of children withdraw fromhazardous occupation. Under the SGRY scheme 50 lakh tonnes of food grainsamounting to about Rs. 5,000 crores is being provided every year at free ofcost to the State Government and Union Territory Administration and Rs. 5,000crore has been kept to meet the cash component of wages and material cost.SGRY is being implemented at the district level through Zilla parishad, at thetaluk level the panchayat samiti and at the village level the Gram panchayat. Inthe Gram panchayat, the selection of beneficiaries is being done by gram sabha.The programmes are regularly monitored by the Department of RuralDevelopment. The SGRY a centrally sponsored scheme is being implementedwith the total out lay of Rs. 10,000 crores. In the SGRY, no development cantake place unless there is an active participation of the people. Every memberof the PRI is responsible for involving common people in process ofdevelopment. Officials are catalytic agents. They are important, no doubt, butmore important is people’s representation.
On the back drop of the foregoing discussion, it becomes clear that theelected member of PRI, could play a significant role in Sampoorna GrameenRozagar Yojana programme. However, their success and efficiency dependupon the knowledge possessed by them about Sampoorna Grameen RozagarYojana programme. This aspect has not been studied so far, in much detail,especially under South Karnataka. So that the present study on “Knowledgelevel of Gram panchayat member about Sampoorna Grameen Rozagar Yojanain Shimoga district of Karnataka” was designed with the following specificobjectives.1. To study the personal, socio-economic and psychological profile of Gram
Panchayat members.2. To know the knowledge of Gram Panchayat members regarding
Sampoorna Grameen Rojagar Yojana programme.3. To study the extent of participation of Gram Panchayat members in

Research Journal of Social and Li fe Sciences, ISSN 0973-3914, Vol .-XIV- II, Year-07, June-201338
Sampoorna Grameena Rojagar Yojana Programme4. To ascertain the problems faced by the Gram Panchayat members in
implementation of programme and their suggestions for futureimprovement of programme.
Review Literature- Chandrashekhar and Inabanathan (1991) from their studyin Karnataka reported that most of Mandal Panchayat women members havegot less knowledge about panchayat and they were less interested in partypolitics than the males. Shivaramu and Channegowda (1991) found that therewas no significant difference between the male and female members of MandalPanchayat with respect to their knowledge on the functions of Mandalpanchayat. Sinha (1991) analysed women’s participation and involvement inthe election and reported that with regard to the political awareness only fourper cent of women had correct knowledge of more than three fourth of thecontesting candidates. Pushpakumari (1993) indicated that majority of therespondents in the high participation category were more knowledgeable onMandal panchayat, as compared to the respondents of low participation groupand there was significant association between the level of knowledge of functionsof Mandal Panchayat and extent of participation.
Wankhede (1994) in his study on “Role performance of elected membersin Gram panchayat”, observed that majority of the members (55.00%) had‘medium’ knowledge about the Gram panchayat activities and 23.34 per centmembers had ‘high’ knowledge about the Gram panchayat and 21.66 per centmembers had ‘low’ knowledge. Mahadik (1995) observed that majority ofGram panchayat members (86.21%) had ‘medium’ knowledge level, followedby ‘low’ (10.34%) and high (3.45%) about agricultural developmentprogrammes. Further, the study revealed that the members of PRIs hadknowledge of only a handful of schemes. Shivaramu et al. (1995) in theirstudy on “Knowledge, attitude and problems of Mandal Panchayat membersrevealed that low knowledge of Mandal Panchayat was acquired by 18.30 percent members, while 48.40 per cent and 33.33 per cent of members had mediumknowledge and high knowledge respectively. Singh and Gill (1995) found that95.00 per cent of the respondents were not aware of the Amendments inPRIs. Ninety per cent of elected leaders were not fully aware of legislative,judicial, administrative and financial powers provided under PRIs.
Kamble (1998) observed the role performance of Gram panchayatmembers was high in the fields of dairy development, social welfare and publichealth. The role performance was low in the field of agriculture and education.At overall level, 56.76 per cent of the Gram panchayat members were havingmedium role performance, followed by 74.32 and 18.92 per cent belonging tohigh and low role performance, respectively. From the above reviews, it isclear that members participation in the SGRY programme is a key factor for itsuccess. Creation of employment generation and food security in effective
Research Journal of Social and Li fe Sciences, ISSN 0973-3914, Vol .-XIV- II, Year-07, June-2013 39
planning and implementation of programme and to achieve the objectives.Research Methodology- “Ex-post facto design” was employed in the presentresearch study as the events have already occurred and design was consideredappropriate. The study was conducted in Shimoga district of Karnataka stateduring the year 2008- 09. The Shimoga district has been purposively selectedfor the study because of high, medium and low literacy level in rural, lack ofknowledge about Rural Development Programme and also as per theconvenience and familiarity of the researcher with the study area. In Shimogadistrict, totally there are six taluks viz., Shimoga,Bhadravatii,Soraba,Sagara,Shikaripura and Hosanagara. Of these, three taluksviz.,Shimoga,Bhadravati and Shikaripurar were selected based on thecriteria of more number of gram panchayat. From each of the selected taluks,four gram panchayats were selected based on higher number of members.The maximum number of members observed were fifty one (including thepresident and vice-president) so, keeping this as criteria, ten members fromeach selected gram panchayat were randomly selected as respondents. Allthe Male and female members were selected randomly from each gramPanchayat to make a sample size of 120.
The dependent and independent variables for the study were selectedbased on the available literature and opinion of the experts in the field ofextension. Knowledge level of gram panchayat members about SampoornaGrameen Rozgar Yojana was considered as dependent variable. English andEnglish (1958) defined knowledge as a body of information possessed by anindividual which is in accordance with established fact. In the present study,knowledge referred to the Sampoorna Grameen Rozagar Yojana programmefunctions understood by the members of gram panchayat. Based on knowledgeof Gram panchayat members about SGRY, nearly 20 questions were framedin the form of interview schedule covering various aspects of the SGRYprogramme. This was done by consulting the concerned programme specialist.Each question was having two choices and out of which one was correct.There were 20 questions administered to the respondents. Each question carriedone mark for correct answer and zero mark for incorrect answer, the scoreranged from minimum of zero to maximum of 20.Categorization of the respondents in their level of knowledge- Theknowledge scores were added together and mean, standard deviation werecalculated based on mean and standard deviation value. The respondents werecategorized as under:
Category Range of score Low knowledge level 11.57 Medium knowledge level 11.57 – 17.80 High knowledge level 17.80 and above Extent of participation was operationalised as the degree to which the

Research Journal of Social and Li fe Sciences, ISSN 0973-3914, Vol .-XIV- II, Year-07, June-201340
beneficiaries were actually involved in different functions of SGRY programme.The procedure developed by Ramanna (1999) was followed in the presentstudy. 10 items were identified and the responses were collected on the threepoint continuum viz., fully participated, partially participated and not participatedin the activity and the score was assigned 2, 1, 0 for each response, respectively.Accordingly, the total score obtained from all the steps constituted the totalextent of participation of respondents in SGRY programme. Thus aftercomputing extent of participation scores the respondents were grouped intohigh, medium and low categories by considering the mean and standarddeviation.Results and Discussion- The results of the study comprising knowledge ofGram panchatyat members about Sampoorna Grameena Rojgar Yojana inrelation to their personal, socio-economic and psychological characters arepresented under the following major heads in accordance with the objectivesof the study.Personal, Socio-Economic and Psychological Profile of Gram PanchayatMembers- The results pertaining to personal, socio-economic and psychologicalcharacteristics of the Gram panchayat members are depicted in Table 1. Thedata in Table 1 revealed that 80.84 per cent of the members were male andthe remaining 19.16 per cent were female. The data indicated that 40.84 percent of the respondents belonged to general category followed by SC/STcategory (30.00%) and backward class category (29.16%). Majority of themembers (57.50%) belonged to middle age group followed by young (25.00%)and old (17.50%) age group. The results of pooled data revealed that 47.50per cent of the members were illiterate followed by middle school (19.16%),high school (13.34%) and same proportion of the members in the category ofprimary school and higher secondary school (10.00%), respectively. It wasobserved that majority (87.50%) of the respondents were members of theGram panchayat followed by vice president (7.50%) and president (5.00%).Table 1 indicated that, at overall level, the high percentage of Gram panchayatmembers came from joint (65.00%) and nuclear (35.00%) families.
Table 1Personal, Socio-Economic and Psychological Characteristics of
Grama Panchayat Members
Sl. No. Variable Frequency Percentage 1. Sex
Male 97 80.84 Female 23 19.16
2. Caste Gram Panchayat 49 40.84 OBC 35 29.16 SC/ST 36 30.00

Research Journal of Social and Li fe Sciences, ISSN 0973-3914, Vol .-XIV- II, Year-07, June-2013 41
3. Age Young Age (<35) 30 25.00 Middle Age (36-45) 69 57.50 Old Age (>45) 21 17.50 Mean = 37.616 SD = 6.996 4. Education Illiterate 57 47.50 Primary School 12 10.00 Middle School 23 19.16 Higher School 16 13.34 Higher Secondary School 12 10.00 Mean = 1.283 SD = 1.4211 5. Position in Panchayat President 06 05.00 Vice-President 09 07.50 Members 105 78.50 6. Type of Family Nuclear Family 42 35.00 Joint Family 78 65.00 7. Family Size Small (upto 4 members) 13 10.84 Medium (5-7 members) 32 26.66 Big (> 7 members) 75 62.50 8. Family Occupation Dairy 02 01.66 Business 08 06.68 Agriculture 110 91.66 9. Land Holding Marginal Farmer (upto 2.5 acre) 16 13.34 Small Farmers (2.51-5.00 acre) 23 19.16 Semi-medium Farmers (5.01-10.00 acres) 28 23.34 Medium Farmers (10.01-15 acres ) 41 34.16 Big Farmers (> 25 acre) 12 10.00 Mean = 8.9883 SD = 9.7305 It was noticed from the pooled data of Table 1 that the majority (62.50%)
of the Gram panchayat members belonged to big size of the family followedby medium (26.66%) and small (10.84%) family size. the major occupation ofthe Gram panchayat members respondents was farming (91.66%) followedby business (6.68%) and dairy (1.66%).34.16 per cent of the respondentswere having medium (10.01 – 25 acres) land holdings, whereas 23.34 per centof them possessed semi-medium (5.01 – 10.00 acres) farm size and 19.16 percent of members had small land holdings (2.51 – 5.00 acres), whereas 13.34and 10.00 per cent of members had marginal and big farmers, respectively. Itwas observed from Table overall level, majority (60.84%) of the respondentswere from medium (Rs. 22001 – 50000) income group, followed by low (20%)i.e., <Rs. 21000 and high i.e., (Rs. 50001 and above (19.16%), respectively.Mass media participation of respondents-It is noticed from the data of

Research Journal of Social and Li fe Sciences, ISSN 0973-3914, Vol .-XIV- II, Year-07, June-201342
Table 2 that at overall level, more than half of the respondents (54.16%) hadmedium mass media participation, whereas, 25.0 per cent and 20.84 per centof them had low and high mass media participation, respectively.
Table 2Mass Media Participation of Respondents
Mass Media Subscriber Listening/Viewing/Reading Behaviour Regular Occasional Never
Freq. % Freq. % Freq. % Freq. % Radio 77 64.16 37 30.08 76 63.30 07 05.80 Television 87 72.50 28 23.30 88 73.30 04 03.30 News Paper 56 46.66 51 42.50 10 08.30 59 49.10 Magazine/ Journals 07 05.80 07 05.83 00 00.00 113 94.16
From the data presented in Table 2, it is observed that at overall level,majority (64.16%) and (72.50%) of the respondents possessed radio andtelevision, respectively. Among them majority (63.30%) and (73.30%) wereoccasional listeners and viewers of radio and television, respectively for generalprogrammes. The regular listeners of the radio were 30.08 per cent andtelevision viewer were 23.30 per cent, with respect to general programme.Further, 5.80 and 3.30 per cent of the respondents were never listeners andviewers of the radio and television, respectively. Regarding subscription to thenewspaper, it was 46.6 per cent and of magazines was 5.83 per cent,respectively. Whereas, 42.50 and 5.83 per cent of the respondents were readingnewspapers and magazines regularly and 8.30 per cent of the respondentswere reading newspaper occasionally. A large number of the respondents(49.10%) and (71.70%) had never read newspaper and magazines, respectively.Extension participation- It is noticed from Table 3 that at overall level, morethan half of the respondents (60.84%) had medium extension participationfollowed by high (21.66%) and low (17.50%). It is observed from the Table 3that 48.00 per cent of the members regularly participated and 42.00 per centoccasionally participated in village level training programmes.
Table 3Extension participation of the respondents (n=120)
Extension Activity Regular Occasional Never Freq. % Freq. % Freq. %
Village level training programme
58 48.00 50 42.00 12 10.00
Guest Lecture 09 07.50 63 53.00 48 40.00 Demonstrations 26 19.00 75 62.50 22 18.30 Meeting with concerned officer of SGRY
06 05.00 32 27.00 82 68.00
Participated in Krishimela
01 00.80 15 21.20 94 78.00
In case of extension participation, guest lecture was attended 7.50 and

Research Journal of Social and Li fe Sciences, ISSN 0973-3914, Vol .-XIV- II, Year-07, June-2013 43
53.00 per cent on regular and occasional basis, respectively. In participation ofdemonstration, 19.20 and 62.50 per cent were regular and occasional,respectively, 5.00 and 27.00 per cent were regular and occasional in meetingwith concerned officer of SGRY. In participation of Krishimela 0.8 and 21.00per cent of the members participated regularly and occasionally, respectively.Extension contact- It could be seen from Table 1, more than half of therespondents (66.84%) had medium extension contact whereas, 21.66 and 17.50per cent of them had high and low extension contact, respectively. From thedata presented in Table 4, it is observed that 10.83, 48.33 and 17.50 per cent ofthe members contacted with the Agricultural Assistants weekly, biweekly andmonthly, respectively. Regarding contact with Horticulture Assistant, 15.83and 20.83 per cent of the members contacted biweekly and monthly, respectively.A very low per cent of the respondents had contact with Assistant Director ofAgriculture, biweekly (4.16%), monthly (7.50%), respectively.
Table 4Extension contact of the respondents (n=120)
Extension contact Weekly Frequency of contact Biweekly Monthly Never
Freq. % Freq. % Freq. % Freq. % Agricultural Assistants 13 10.83 58 48.33 21 17.50 18 23.33 Horticultural Assistants 00 00.00 19 15.83 25 20.83 76 63.33 ADA 00 00.00 05 04.16 09 07.50 106 88.33 Subject matter specialists (State Agricultural Detp.)
00 00.00 03 02.50 10 08.33 107 89.16
With regard to contact with subject matter specialists, 2.5 and 8.33 percent of the Gram panchayat members contact biweekly and monthly,respectively.Knowledge of Gram Panchayat Members Regarding SampoornaGrameena Rojgar Yojana -The information in Table 5, depict that theknowledge level of the Gram panchayat members about SGRY in general.The results indicated that majority 65.83 per cent of the members had mediumlevel of knowledge. Whereas, 18.33 and 15.84 per cent of them had low andhigh level of knowledge, respectively. between selected personal and socio-economic and psychological characteristics of Gram panchayat members andtheir knowledge level about Sampoorna Grameen Rojgar Yojana.
Table 5Overall Knowledge Level of Panchayat Member (n=120)
Knowledge Categories Frequency Percentage Low (11.57) 22 18.33 Medium (11.57 – 17.80) 79 65.83 High (17.81 and above) 19 15.84

Research Journal of Social and Li fe Sciences, ISSN 0973-3914, Vol .-XIV- II, Year-07, June-201344
Correlation of knowledge level of SGRY with the selected personal,socio-economic and psychological characters of Gram panchayatmembers- The findings in this regard are presented in Table 6. It was observedthat out of 14 variables, six variables namely age, education, position inpanchayat, mass media participation, extension participation and extensioncontact showed positive and significant relation with the knowledge level ofthe respondents. The other variables namely caste, type of family, family size,family occupation, land holding, annual income, leadership ability andachievement motivation did not exhibit significant relationship with theknowledge of the respondents.
Table 6Correlation of knowledge level of SGRY with the selected personal,
socio-economic and psychological characters of Gram panchayatmembers
Code No. Characters Correlation Coefficient (r Value) X1 Age 0.2090* X2 Education 0.2336* X3 Caste 0.0372 NS X4 Position in panchayat 0.2026* X5 Type of family 0.1256 NS X6 Family size 0.0375 NS X7 Family occupation 0.0241 NS X8 Land holding 0.0700 NS X9 Annual family income 0.0682 NS X10 Mass media participation 0.1840* X11 Extension participation 0.2146* X12 Extension contact 0.2080* X13 Leadership ability 0.1180 NS * Significant at 5% level. NS = Non-significant
Extent of Participation of Gram Panchayat Members in SampoornaGrameena Rojgar YojanaActivity-wise participation of Gram panchayat members in SGRYprogramme- A perusal of Table 7 presents the data obtained regardinginvolvement of Gram panchayat members in different activities of SGRYprogramme. Regarding selection of beneficiaries of SGRY programme, majority(57.00%) of the respondents had partially participated followed by fullyparticipated (34%) and remaining (9.10%) of them said that they did notparticipate. Data further indicated that, 70 per cent of the respondents hadpartially participated in selection of work pertaining to rural development,whereas 7.00 and 23.00 per cent of them had full and no participation,respectively. Regarding participation with allocation of funds for different work,63.00 per cent of the respondents had non-participation. Whereas, 37.00 and0.83 per cent of them expressed that they partially and fully participated inallocation of fund, respectively. Regarding participation with deciding wages

Research Journal of Social and Li fe Sciences, ISSN 0973-3914, Vol .-XIV- II, Year-07, June-2013 45
of employees, 59.00 per cent of the respondents opined partial participation.Whereas, 28.00 and 13.0 per cent of them expressed full and partial participation,respectively. More than half of the respondents (53%) had not participated ininitiation of different work under SGRY. Whereas, 42.00 and 5.80 per cent ofthem expressed partial and full participation, respectively.
Table 7Extent of Participation of Gram Panchayat Member in
Implementation of SGRY Programme (n=120)
Extension activity Fully
participated Partially
participated Not participated
Freq. % Freq. % Freq. % Selection of beneficiaries for SGRY
41 34.00 68 57.00 11 09.10
Selection of work pertaining to rural development
08 07.00 84 70.00 28 23.00
Allocation of funds for different work
01 00.83 44 37.00 75 63.00
Deciding wages of employees
34 28.00 71 59.00 15 13.00
Initiation of different work under SGRY
07 05.80 50 41.00 63 53.00
Approval of different works under SGRY by TP and ZP officials
36 30.00 19 16.00 65 54.00
Monitoring and evaluation on different work executed
04 03.30 37 31.00 79 66.00
Meeting with local bodies
49 41.00 58 48.00 12 10.00
Consulting officials of SGRY
60 50.00 41 34.00 19 16.00
Overall participation of respondents in SGRY programme- The overallextent of participation of respondent in SGRY programme is depicted in Table8. It is observed from the Table 8 that majority of the respondents (65.84%)exhibited medium participation, while low participation was exhibited by 19.16per cent of the respondents followed by high participation (15%).
Table 8Participation in SGRY programme of the Gram Panchayat members
(n=120)
Knowledge Categories Frequency Percentage Low (<11.57) 23 19.16 Medium (11.57 – 17.80) 79 65.84 High (17.81 and above) 18 15.00
Problems Faced By the Gram Panchayat Members in Implementationof the Programme and Their Suggestion for Future Improvement of

Research Journal of Social and Li fe Sciences, ISSN 0973-3914, Vol .-XIV- II, Year-07, June-201346
Programme- Data about the nature of the problems faced by the panchayatmembers in implementation of the SGRY programme is presented in Table 9,the most important problems of the respondent was delay in sanctioning of thefund (86.66%), lack of training facilities and less honorarium to the panchayatmember (74.17%) as the major problems followed by lack of training facilities(75.83%) was the second major problem. The third major problem was lesshonorarium to the panchayat members (74.17%) followed by lack of co-operation from the villager (68.33%), non-availability of proper building forpanchayat (65.00%), lack of time and adequate guidance (50.00%),respectively.
Table 9Problems faced by the Gram Panchayat members in implementing
the SGRY programme (n=120)
Code No. Problems Frequency Percentage 1 Delaying in sanctioning of fund 104 86.66 2 Lack of training facility 91 75.83 3 Less honorarium to the panchayat
members 89 74.17
4 Lack of co-operation from the villagers 82 68.33 5 Non-availability of proper building for
the panchayat 78 65.00
6 Lack of time for adequate guidance 60 50.00
Conclusion- India is a country of villages, where 74.00 per cent of thepopulation lives in villages (1991 census). Amongst majority of them are engagedin agriculture. Under the PRIs, the gram panchayat is the bottom or villagelevel institution seeking actual and active representations of the villages. Grampanchayat s the best instrument to meet the needs of people as the programmeof the masses at local level. The active involvement of the Gram panchayatmembers in the planning will provide a better climate for people’s participationin the implementation of the plan. A condition crucial to its success, Genuineparticipation takes place when people are empowered to analyse their ownsituation and take their own decision. The 73rd constitutional amendment hasprovided an opportunity for governance to be carried out by the direct andactive participation of the people and also provided scope for grass root levelplanning. Now, Gram panchayats are expected to plan, design and implementthe programme for developing the Rural People. It is therefore, expected thatthe knowledge of SGRY and other Rural Development Programme shouldpercolate through a panchayat members to beneficiaries. The beneficiariesare convinced to a greater extent by them. However, their success and efficiencydepend upon the knowledge possessed by Gram panchayat members aboutSGRY programme.

Research Journal of Social and Li fe Sciences, ISSN 0973-3914, Vol .-XIV- II, Year-07, June-2013 47
The major findings of the study are as follows- Majority of the Grampanchayat members were male (80.84%) and (19.16%) were female. Majorityof the Gram panchayat was dominated by general category (40.84%). Thebackward and low categories (SC/ST) were accounted to 29.16 and 30.00 percent, respectively. It was seen from the result that more than half (57.50%) ofthe members were from middle age group between 36 to 45 years. Illiteratemembers was found predominant in Gram panchayat (47.50%). It wasobserved from the result that 87.50 per cent of respondents were memebrs ofGram panchayat members. Majority (65.00%) of the Gram panchayat memberscame from joint family.Majority (62.50%) of the Gram panchayat memberswere from big size family (>7 members). Majority (91.66%) of the respondentsbelonged to the families having farming as the main occupation, followed bybusiness (6.68%) and dairy (1.66). It was seen from the results that aboutless than half (34.16%) of the Gram panchayat members were from medium(10.01 – 25 acre) land holding category. • Majority (60.84%) of the membersbelonged to medium (Rs. 22001 – 50000) income group. More than half(54.16%) of the respondents were having medium mass media participation.Further, the radio and televisions were possessed by 64.16 and 72.50 percentof the respondents, respectively. However, only 30.08 per cent listened radioand 23.30 per cent viewed the television regularly for general programme. •More than half (60.84%) of the respondents had medium level of extensioncontact. More than half of the respondents (62.50%) had medium leadershipability, followed by high (20.00%) and low (17.50%) leadership abilityrespectively. Majority of the respondents (68.34%) had medium achievementmotivation.
Taking into consideration, the nature of the problems faced by thepanchayat members, the most important problems perceived by the memberswere delaying in sanction of fund (86.66%), lack of training facilities (75.83%),less honorarium to the panchayat members (74.17%), lack of co-operativesfrom the villages (68.33%) and non-availability of proper building to panchayat(65.00%) as expressed by the respondents.======================References-1. ABRAHAM, R., 1993, Socio-economic status and political status of panchayat.
Kurukshetra, 41(4): 15-19.2. ADISESHAIAH, M. S.1989, Panchayat Raj malady and remedy. Yojana, p. 29.3. ANONYMOUS, 1992, Ministry of Rural Development-Circular No. 280/12/16/
91-IRD-III (Vo.II), dated 15th November 1991. Gramin Vikas Newsletter, 8(1):14-20.
4. BHAMBU, S., 1997, Training needs of rural women for Panchayat Raj system.M. Sc. (Agri.) Thesis, CCS Haryana Agricultural University, Hisar.
5. BHARGAVA, B. S. AND VAIDYA, K. C., 1992, Position of women in politicalinstitutions. Journal of Rural Development, 11(5):601-628

Research Journal of Social and Li fe Sciences, ISSN 0973-3914, Vol .-XIV- II, Year-07, June-201348
6. BHARGAVA, B. S. AND VIDYA, K. C., 1992, Position of women in politicalinstitutions. Journal of Rural Development, 2(5): 19-25.
7. BIRADAR, N. B., 1997, Effectiveness of teaching methods in communicatingnutritional knowledge to rural women – An experimental study. Ph. D. Thesis,University of Agricultural Sciences, Dharwad.
8. CHANDRASEKHAR, B. K. AND INBANATHAN, A., 1991, Profile andparticiaption of women Zilla Parishad and Mandal Panchayat member - Thecase of Karnataka. Journal of Rural Development, 10(5): 575-589.
9. DESHPANDE, 1989,Participation of women in political systems. Kurukshetra,37(5): 56-57.
10. GHOSH ARVIND, 1996, Panchayats and rural development in West Bengal.Journal of Rural Development, 15(4): 533-54l.
11. GOVINDA GOWDA, S., DHANDAVE, M. S. AND SRINIVAS GOWDA, M. V.,1996, Development role of women members of Panchayat Raj institutions : Astudy in Karnataka. Journal of Rural Development, 15(2) : 249-259.
12. HIREMATH, D., 1992, Women’s in grass-root politics. Journal of Social Welfare,44 (2): 7-12.
13. JAYALAXMI, T., 1997, Sankolegala Madhya Adhikara Hidida Mahileyaru, UmaPrachar, 5(3-4) : 14-19.
14. KADAM, K. R. AND VALUNJ, D. R., 1982, Role of performance of GramPanchayat members in village development activities. Maharashtra Journalof Extension Education, 1: 37-41.
15. KHARE, Y.R., KHARE, N.K. AND DUBEY, M.K., 1998, Role perception of villagePanchayat Sarpanch in agricultural development. Madhya Journal of ExtensionEducation, 1(1): 49-52.

Research Journal of Social and Life SciencesISSN 0973-3914, Vol.-XIV- II, Year-07, June-2013
73rd Constitutional Amendment Act and WomenParticipation in Panchayati Raj Insti tutions in
Haryana* Sunita
** Desraj Sabharwal==========================================================Abstract-The study shows that democratic decenterlization has improvedthe quality of life of women in Haryana, because they are exercisingdecision making power in Panchayati Raj Institutions. The data showsthat 54.24 per cent members of Panchayat Samiti and 55.56 per centmembers of Zilla Parishad admitted that there is change in the life ofwomen due to Panchayati Raj Act, 1994. It was also observed during thefield work that educated women were actively participating in everyactivity of Panchayati Raj Institutions. At the Zilla parishad level 44.44per cent Women feel changes and 38.89 per cent feel empowered andresponsible person. It was also found that many Women have to observePurdha during Panchyat meetings. Feeling of shy and hesitation is there,but now some are getting change. Now, women are attending the meetingwithout Purdha. Majority of Women i.e. 85 per cent are in favour ofproper training programme regarding panchayat raj institutions.Womenpanchs and sarpanchs favoured that govt. agencies must organizedtraining programme at their respective areas. They admitted that, throughthese training they will come to know about role and responsibility andalso acquire skill to fulfill the respective roles. The present study alsoshows that purdah system, male dominated society, illteracy, ignorance,lack of communication skills etc. are the major barrier in their sociallife.==========================================================
===========================* Research Scholar,Department of Sociology, M.D.University, Rohtak (Haryana)** Professor, Department of Sociology, M.D.University, Rohtak (Haryana)
Introducation- The present system of bureaucracy in India is inherited fromthe British rulers and is entrusted with the functions and responsibilities ofrural development. Community Development Program (CDP) was launchedto bring about socio-economic transformation of rural areas. The central ideabehind the program was to develop self-reliance and self- help for both individualrural elite and the rural community as a whole. However, the program failed toachieve its Objectives and it became a government program for want of people’s

Research Journal of Social and Li fe Sciences, ISSN 0973-3914, Vol .-XIV- II, Year-07, June-201350
participation in the development process. As a result, Panchayati Raj systemwas established, and the administrative
Machinery evolved for Community Development Program wasassociated with the Panchayati Raj Institutions in order to make the ruraldevelopment administration responsive to the elected representatives of people.In real sense, the draft outline of First Five Year Plan made the firmrecommendation in favour of carving out a block of 50 to 60 villages with apopulation of about 25,000-30,000. The block was recognized as the focalpoint of planning and administration, and it became the single most importantunit of both Community Development Program as well as Panchayati Raj.Thus, block emerged as the basic unit of development administration headedby a Block Development Officer.The emergence of Community Development Program and Panchayati Rajbrought the bureaucracy and elected representatives in close contact witheach other. Further, it was argued that success of local institutions as theinstruments of development rested on the ability of political and administrativeleadership to cooperate with each other and to resolve the tensions arisingfrom the social environment. Panchayati Raj has made the local administrationdevelopment oriented and democratic one. It has created new strains andstresses, new pulls and pressures and new tensions and conflicts in theinterpersonal relationship between local bureaucracy and elected leaders atthe different levels of Panchayati Raj Institutions. Thus, new kind of bureaucraticculture has emerged in the process of rural local administration in the country.This new culture has made it necessary for the rural local bureaucracy tochange their behavioural pattern so that they can be adjusted to the newenvironment generated by the emergence of Panchayati Raj Institutions. It isimportant to note that the attitude/behavioral patterns of bureaucrats andPanchayati Raj leaders, the two partners responsible for bringing about ruraldevelopment, has always been different from each other because of theirdifferent socio-economic and educational backgrounds. The relationshipbetween rural bureaucrats and elected leaders of PR has always been subjectof debate and controversy since its inception in India (Ghildyal, 1978)
The empowerment of rural women is crucial for the development ofrural India. Bringing women in to the mainstream of development is a majorconcern for the Government of India. The constitutional 73rd Amendments,Act 1992 provides for reservation of selective posts for women. The constitutionhas placed enormous responsibility on the Panchayats to formulate and executevarious programmes of economic development and social justice and a numberof Centrally Sponsored Schemes are being implemented through Panchayats.Thus, women Members and Chairpersons of Panchayats, who are basicallynew entrants in Panchayats, have to acquir the required skill and be givenappropriate orientation to assume their rightful roles as leaders and decision

Research Journal of Social and Li fe Sciences, ISSN 0973-3914, Vol .-XIV- II, Year-07, June-2013 51
makers. To impart training for elected representatives of Panchayati RajInstitution is primarily the responsibility of the State Government/Union TerritoryAdministrations. Ministry of rural Development also extends some financialassistance to the States/UTs with a view to improve the training programmesand to catalyze capacity building initiatives for the Panchayati Raj Institutionselected members and functionaries.It has been an established belief thatensuring partnership of women with the Panchayati Raj Institutions will certainlyenable them to participate effectively and independently in decision-makingprocess as of the implementation and initiation of various rural developmentprogrammes and social welfare activities. In view of achieving improvementsin socio-economic status of women, the partnership of rural women in grassroot political system has been constitutionally assured through introducing areservation policy in their favour in different tier of Panchayats. The Act hasprovides them an opportunity to deliberate, debate and decide important policymatter. The involvement and claim of women have also been ensured in theprocess of planning, policy formulation, execution of rural developmentprogrammes, fund allotment for different schemes and programmes and tocontrol and supervise over the activities and functioning of twenty nineGovernment departments located in rural areas, such as land reforms,agriculture, elementary education, health care, drinking water, sanitation animalhusbandry etc. Representation of women in Panchayati Raj Institutions alsoprovide them an opportunity to take part in public life, social and culturalceremonies and function, interact with different sections of rural population,develop personnel and higher level of leadership quality without the considerationof traditional social and cultural barriers (Pattanaik,2010).
The 73rd Constitutional Amendment Act asked the states to devolvepowers to panchayats to prepare plans for economic development and socialjustice, which they did. Significantly, a new ‘Eleventh Schedule’ was insertedhaving all sort of major functions covering all the agricultural and allied activitiessuch as small and cottage industries, rural housing and electrification, drinkingwater, non-conventional energy, poverty alleviation, primary and secondaryeducation, health and family welfare schemes, irrigation, public distributionsystem, welfare schemes for weaker sections of the society and the likewise.Out of these 29 items mentioned in the Eleventh Schedule, Haryana Governmenthas handed over sixteen departments to Panchayati Raj Institutions. Theseinstitutions have been assigned the job of supervising, coordinating and advisingthese departments concerning activities relating to the rural affairs. However,the responsibility to execute these activities would be of the concerneddepartmental officials and they have been entrusted with the requisite powersto discharge their responsibilities ( Singh,1995).There are several sectionsprovided in The Haryana Panchayati Raj Act, 1994, which empower the stategovernment/ bureaucracy with overwhelming powers and thus, undermine the

Research Journal of Social and Li fe Sciences, ISSN 0973-3914, Vol .-XIV- II, Year-07, June-201352
role of Panchayati Raj Institutions in the state. The Act specifies a number ofways through which the government/bureaucracy would exercise control overthe Panchayati Raj Institutions. The Act empowers DC/Director of Panchayatsto remove Panches and Sarpanches from their offices on certain grounds.Government/Director of Panchayats may suspend the members andchairpersons of Panchayat Samitis and Zilla Parishads if any criminal offenceis established against them. However, it is not democratic to authorize an officialto remove an elected representative. Further, Government/ Bureaucracy havebeen empowered to withhold the implementation of any resolution passed byany of Panchayati Raj Institutions in public interest. However, what constitutespublic interest is not defined anywhere in the Act and thus, it may allow possiblemanipulation of the clause by the state government for the political ends. TheAct also provides powers to the government officials for inspection andsupervision of all the activities of Panchayati Raj Institutions. Such powers willhamper the smooth functioning of panchayats and can be misused by thegovernment. It indicates the lack of political will of the state leadership andreluctance of bureaucracy to devolve powers to these institutions in real sense.The Act empowers powerful (bureaucracy) rather than powerless (the people)and bureaucracy is given upper hand in these bodies. even after enactment ofthe 73rd Constitutional Amendment Act, the bureaucratic dominance is againstthe letter and spirit of democratic decentralization and it has become merely apopular slogan of each government in power, whereas, real situation differsfrom the theory (Gangrade, 1995).
In Haryana, there is no separate cadre for officials of Panchayati RajInstitutions. The state government can place the services of its employees atthe disposal of these institutions to discharge the duties and functions as assignedto them from time to time. The powers of recruitment, transfer, promotion anddiscipline of these opticians are vested in the state government and theseinstitutions have routine administrative control over the activities of theseemployees. The activities of Panchayati Raj Institutions are coordinated at thestate, district and block levels. Deputy Commissioner, who is the head of therevenue, development and general administration in the district, is also thechairperson of District Rural Development Agency (DRDA). Governmentcan assign/ delegate any power relating to the supervision over PanchayatiRaj Institutions to the DC concerned. He is also empowered to suspend/removea sarpanch or a panch, if a case of criminal offence is under investigation orinvolve moral turpitude or during course of enquiry pending against him afterproviding adequate opportunity to explain his position.Methodology- To study the participation of women in Panchayati RajInstitutions we have taken women representative in PRIs as our unit of study.For present study random sampling was employed. There are 21 districts inHaryana. We have selected Jhajjar district by lottery method. There are 249

Research Journal of Social and Li fe Sciences, ISSN 0973-3914, Vol .-XIV- II, Year-07, June-2013 53
panchayats in Jhajjar District. Jhajjar district comprises of five blocks i.e. Jhajjar,Bahadurgarh, Beri, Salhawas and Matanhail. There are 71 panchayats in Jhajjarblock, 36 panchayats in Salhawas block, 43 panchayats in Matanhail block, 63in Bahadurgarh block and 36 panchayats in Beri Block. In the present studyfour women headed panchayats are randomly selected from each block. Thus,twenty women headed panchayat are selected in the present study. all theformer and present elected members of panchayat samities and zilla Parishadsare also interviewed. all the women who had been elected members ofPanchayati Raj Institutions since a period of 1999, 2004, and 2009 areinterviewed. So total 398 women representatives have been selected as asample. Therefore, an attempt has been made in this paper to examine theimpact of 73rd Amendment Act on women participation in Panchayati RajInstitutions.
Table 1Official Linkage of Respondents with BDPO
Nature of officials linkage
Gram Panchayat Panchayat Samiti Members
Zilla Parishad Members
Total Panch Sarpanch
Only During meeting
62(25.62) 12(60) 38(32.20) 10(55.56) 122(30.65)
As and when required
32(13.22) 8(40) 80(67.80) 8(44.44) 128(32.16)
Never 148(61.16) - - - 148(37.19) Total 242(100) 20(100) 118(100) 18(100) 398(100)
* Figures in the Brackets Represent PercentageThe table 1 shows that 30.65 per cent respondents contact with BDPO
during meeting, followed by 37.19 per cent who never contact with BDPO,32.16 per cent meet with BDPO as and when required. Similarly at the GramPanchayat level, Panches & sarpanches have direct relationship with BDPOthey have contacted them to solve their official problems like financial allocation,seek help to deal particular problems like water, electricity, construction,knowledge about different policies. Majority of panches 61.16 per cent nevermeet with BDPO because all the village development official work is done bythe sarpanch that is why all sarpanches contacted with keep BDPO official. itmay be concluded that BDPO is one of the chief official with whom allPanchayat Raj Institutions representatives have to contact with them. Thedata suggest that most of Panchayati Raj Institutions women representativekeep links with district administration when they feel need to resolve theirproblem. It is also observed that most of women representative of PanchayatiRaj Institutions rarely contact with administration to solve their problems.

Research Journal of Social and Li fe Sciences, ISSN 0973-3914, Vol .-XIV- II, Year-07, June-201354
Table 2Perception of Respondents about Women Empowerment
Perception about women
empowerment
Gram Panchayat Panchayat Samiti
Members
Zilla Parishad Members
Total Panch Sarpanch
Feel changes 85(35.12) 4(20) 48(40.68) 8(44.44) 145(36.43) Don’t feel change 65(26.86) 5(25) 16(13.56) 3(16.67) 89(22.36) Empowered and have become responsible person
60(24.79) 8(40) 53(44.92) 7(38.89) 128(32.16)
Frustration 32(13.22) 3(15) 1(0.85) - 36(9.05) Total 242(100) 20(100) 118(100) 18(100) 398(100) *Figures in the Brackets Represent Percentage
The table 2 reveals that 22.36 per cent women leader of PRIs don’t feelEmpower, 32.16 per cent feel empowered and responsible person, 36.43 feelchange and remaining 9.05 per cent women respondents remain frustrated.26.86 per cent panches don’t feel any change, 24.79 per cent feel empoweredand responsible, 35.12 per cent felt changes and rest 13.22 per cent panchesfeel frustrated after being a PRIs representative. 40 per cent women sarpanchesfeel empowered and responsible person. At the Panchayat Samiti level 40.68per cent women member feel change while 16.67 percent don’t feel any typeof changes after joining in Panchayati Raj Institutions. At the Zilla parishad44.44 per cent members feel changes and 16.67 per cent members don’t feelany change while 38.89 per cent members feel empowered and responsibleperson. The study shows that majority of elected women feel change in theirsocial life. It was also observed during the field work that educated womenwere actively participating in every activity of Panchayati Raj Institutions
Table 3Exercise of Decision-Making Power by Women
Exercising decision making
power
Gram Panchayat Panchayat Samiti
Members
Zilla Parishad Members
Total Panch Sarpanch
Yes 76(31.40) 10(50) 36(30.50) 10(55.56) 132(33.17) No 86(35.34) 3(15) 22(18.65) - 111(27.89) Sometime 80(33.06) 7(35) 60(50.85) 08(44.44) 155(38.94) Total 242(100) 20(100) 118(100) 18(100) 398(100)
*Figures in the Brackets Represent PercentageTable No. 3 reveals that 38.94 per cent women of the sample exercise
decision making power some time, 33.17 per cent women always exercisedecision making power in Panchayati Raj Institutions. 27.89 per cent womendo not take decision themselves. 35.54 per cent panches, 15 per cent sarpanches,18.65 per cent Panchayat Samiti members do not have any involvement indecision making.The present study shows that women are more active as

Research Journal of Social and Li fe Sciences, ISSN 0973-3914, Vol .-XIV- II, Year-07, June-2013 55
Sarpanch, Panchayat Samiti members and Zilla Parishad member as compareto panches. It was also found that majority of educated women as sarpanchexercising decision making power in Panchayati Raj Institutions. It is expectedthat from Haryana Panchayati Raj Act 1994 will definitely improve the statusof women in rural Haryana. Taking this factor into account, we have tried tocollect the response of the women leader about their expectation from HaryanaPanchayati Raj Act 1994.
Table 4Expectation of Respondents from Haryana PRI Act, 1994
Expectation Gram Panchayat Panchayat Samiti
Members
Zilla Parishad Members
Total
Panch Sarpanch Improve the quality of life
90(37.19) 9(45) 64(54.24) 10(55.56) 173(43.47)
If decision making opportunity is given situation can change
75(30.99) 6(30) 26(22.03) 2(11.11) 109(27.39)
There is no change 77(31.82) 5(25) 28(23.73) 6(33.33) 116(29.15) Total 242(100) 20(100) 118(100) 18(100) 398(100) *Figures in the Brackets Represent Percentage
The table 4 shows that 43.47 per cent respondents believe that newPanchayati Raj Institutions Act would improve the quality of life of rural masses,29.15 per cent women are not hopeful and feel there will be no change, 27.39per cent women believe that it will improve decision making power. Similarlyat Gram Panchayat level, 37.19 per cent Panches and 45 per cent sarpanchesreported that new PRIs Act will improve the quality of life, while 30.99 percent Panches and 30 per cent sarpanches agree that if decision making poweris delegated among women it will bring a radical change in life of women. Thedata shows that 54.24 per cent members of Panchayat Samiti and 55.56 percent members of Zilla Parishad admitted that there is change in the life ofwomen due to Panchayati Raj Act,1994. The study shows that democraticdecenterlization has improved the quality of life of women in Haryana, becausethey are exercising decision making power in Panchayati Raj Institutions.
Table 5Venue of Training preferred by Women
Preferred Venue
Gram Panchayat Panchayat Samiti Members
Zilla Parishad Members
Total Panch Sarpanch
Village 201(83.06) 12(60) 60(50.85) - 273(68.59) District - 5(25) 20(16.95) 11(61.11) 36(9.05) Block - 3(15) 38(32.20) 7(38.89) 48(12.06) No Reply 41(16.94) - - - 41(10.30) Total 242(100) 20(100) 118(100) 18(100) 398(100)
*Figures in the Brackets Represent Percentage

Research Journal of Social and Li fe Sciences, ISSN 0973-3914, Vol .-XIV- II, Year-07, June-201356
The table 5 shows that 68.59 per cent respondents are interestedtraining venue their own respective villages, 12.06 per cent Women preferblock level and 9.05 per cent prefer district level as venue of their training. AtGram Panchayat level 83.06 per cent panches and 60 per cent Sarpanchesand 50.85 per cent Panchayat Samiti members favour to have training at theirown villages. 61.11 per cent Zilla Parishad members want venue in their owndistrict. The data suggests that majority of women favour that training must beorganized at village and block level. most of women Panch and Sarpanchadmitted that govt. agencies must organize training programme at their respectivearea.
Table 6Classification of Respondents Regarding Extent of Satisfaction from
various training programmeSatisfaction
level Gram Panchayat Panchayat
Samiti Members
Zilla Parishad Members
Total
Panch Sarpanch Fully satisfied
175(72.31) 5(25) 38(32.20) 5(27.78) 223(56.03)
Partially Satisfied
67(27.69) 15(75) 80(67.80) 13(72.22) 175(43.97)
Total 242(100) 20(100) 118(100) 18(100) 398(100) *Figures in the Brackets Represent Percentage
Table 6 shows that 43.97 per cent women are partially satisfied, while56.03 per cent women are fully satisfied with training programme. Whereas72.31 per cent panches, 25 per cent sarpanches, 32.20 per cent Zilla Parishadmembers are fully satisfied with their training programme and 27.69 per centPanches, 75 per cent Sarpanches, 67.80 per cent Panchaayat Samiti membersand 72.22 percent Zilla Parishad members are found partially satisfied. It wasobserved in the field that proper training for elected women regarding PanchayatiRaj Institutions and their functioning is the need of present time.Conclusions- The present study shows that most of elected women ofPanchayati Raj Institutions wish to subordinate the officials so that theseinstitutions can be made more efficient and accountable to the people. However,it is not easy to do so as most of the elected women leaders particularly atGram Panchayat level are illiterate and not highly educated. It was observedthat most of women representative contact with other women colleagues onlyduring meeting. The involvement of women representatives at panchayat samitiand zilla parishad level is satisfactory because they are more educated andpolitically aware. The elected Women of Panchayat Samiti and Zilla Parishadmembers met Block Development Officer & Block Development andPanchayat Officer for the purpose of guidance and other official purpose. Itmay conclude that BDO & BDPO is one of the chief official with whom allPanchayati Raj Institutions representatives have to contact with him. Most of

Research Journal of Social and Li fe Sciences, ISSN 0973-3914, Vol .-XIV- II, Year-07, June-2013 57
women representatives contacted with district Administration when they feelneeds to resolve their problem. It is also observed that most of women Panchrarely contact with administration to solve their problems. Mostly womenSarpanches, Panchayat Samiti members and Zilla Parishad members meetwith Deputy commissioner as and when required. It is observed that most ofwomen elected representatives at the village level and block level and zillalevel have contact with women and child development department as and whenrequired. Most of women sarpanch, block samiti members and zilla parishadwomen members are aware about fund allotted source of Panchayati RajInstitutions and most of women panches have no idea about source of fund ofPanchayati Raj Institutions. Women have to observed Purdha during PRIsmeetings also. Feeling of shy has and hesitation is there, but now some aregetting change. Now, women are attending the meeting without Purdha. Mostof women admitted that male members support and help the female whileremaining in the meeting. Most of elected women don’t think the PRIs workas burdensome. It was also observed that lack of people’s participation andbureaucratic apathy are major factor of declining role performance ofPanchayati Raj Institutions women leaders. 32.16 per cent women feelempowered after elected in Panchayati Raj Institutions. Further it was alsoobserved that majority of elected women feel change in their social life. majorityof women i.e. 38.94 per cent take a decision independently. The data alsoindicates that women are more active as Sarpanch, Panchayat Samiti membersand zilla parishad member as compare to panch.
The data suggests that 44 per cent women believed that new PRI Actwould improve the quality of life or rural masses, about 28 per cent womenleaders believed that it has improved decision making power. Majority of Womeni.e. 85 per cent are in favour of proper training programme regarding panchayatraj institutions. They admitted that, through these training they will come toknow about role and responsibility and also acquire skill to fulfill the respectiveroles. The present study also shows that purdah system, male dominated society,illiteracy, ignorance, lack of communication skills etc. are the major barrier intheir social life. They are also ignorant about the complexity of the functioningof Panchayati Raj Institutions for which they are elected. Majority of womenfavored that training must be organized at village and block levels. Womenpanchs and sarpanchs admitted that govt. agencies must organized trainingprogramme at their respective areas. The study also reveals that spouse ofwomen participate directly in Panchayati Raj Institutions functioning. It wasobserved during the field work that educated women were actively participatingin every activity of Panchayati Raj Institutions.======================References-1. Abraham, francis (1974), Dynamics of Leadership in Villages in India, Indian

Research Journal of Social and Li fe Sciences, ISSN 0973-3914, Vol .-XIV- II, Year-07, June-201358
International publication, Allahabad.2. Bhasker Manu (2000), Women and Grass-root Politics: Theoretical Issues and
local Concern of Kerala Women, South-Asian Journal of Socio-PoliticalStudies, Vol. 1(1).
3. Baviskar, B.S. and George Mathew (2009), Inclusion and Exclusion in LocalGovernance: Field studies from Rural India, Sage Publications, New Delhi.
4. Biju, M.R. (1998), Dynamics of Nell’ Panchayati Raj System, Kanishkapublication, New Delhi.
5. Bongiwar, L.N. (1971), Report of the Committee on Panchayati Raj,Government of Maharashtra, Department of Cooperation and RuralDevelopment.
6. Chattopadhyay, Raghabendra and Esther Duflo (2012), ‘Impact of Reservationin Panchayati Raj-Evidence from a National wise Randomized Experiment,” InT.R. Reghunandan (ed.), Decentralization and local Governments. The IndianExperience, Orient Blackswan Publication.
7. Damle,Y.B. (1987), “Bureaucracy and Non-Officials: A Study of MutualAssessment,” In R.N. Haldipur and V.R. Paramhanse (eds.), Local GovernmentInstitutions in Rural India: Some Aspects, NIRDj Hyderabad.
8. Gangrade, K.D. (1995), “Power to the Powerless-Down of ParticipatoryDemocracy,” Kurukshetra, Vol. XLIII, No.7, April.
9. Ghildyal,U.C. (1978) , “Political Executive and Local Government with ParticularReference to India” In A Awasthin and Ramesh K. Arora (eds.), Bureaucracyand Development India Perspective Associated, Delhi.
10. Mehta,G.S. (2002), Participation of women in the Panchayati Raj System,Kaniska Publication, New Delhi.
11. Malcom, S. Adiseshiah (1994), Decentralized Planning and Panchayati Raj,Concept publication, New Delhi.
12. Pattanaik, S.N. (2010), Rural Women Panchayati Raj and Development, ArisePublication New Delhi.
13. Reghunandan,T.R.(2012), Decentralization and local Governments. The IndianExperience, Orient Blackswan Publication, New Delhi.
14. Reddy, G Ram (1977), Patterns of Panchayati Raj in India, Macmillanpublication, Delhi.
15. Singh, Hosihar (1995), Administration of Rural Development in India, SterlingPublication, New Delhi.

Research Journal of Social and Life SciencesISSN 0973-3914, Vol.-XIV- II, Year-07, June-2013
Social Problems of Child Labour with SpecialReference to Rewa City
* Akhilesh Shukla** Tajammul Hussain Mir
==========================================================Abstract- Social norms and economic realities mean that child labour iswidely accepted and common in India. Many families really on the incomegenerated by their children for their survival, so child labour is highlyvalued. Additionally, employers often prefer top children to be morecomplaint and an obedient than adults. When children are forced to work,they are often denied their rights to education, leisure and play. Theyalso exposed to situations that make them vulnerable to traffking, abuse,violence and exploitation. Child Labour may be defined as a person whois below the age of 14 years and is working for an earning.Key Words- Social problems, Child labour, Education, Work==========================================================
===========================* Department of Sociology, Government T. R. S. College Rewa (M.P.)** M.Phil Sociology, Second Semester, Government T. R. S. College Rewa (M.P.)
Introduction- Child labour is any work by children that interferes with theirfull physical development, their opportunities for a desirable minimum ofeducation or their needed recreation. Every child male or female is born withright and gradually grows and develops with social responsibilities. About thissocial and cultural myths and conscience reveal that today’s children,tomorrow’s good citizens in political sense. In most of the under developedand the developing countries, children of inappropriate age are forced to takepart in productive activities due to economic distress. Parents of poor classsend their children’s for work to increase family income while the employersof various business establishments employ children to maximize their profits.The result is economic exploitation of children, this economic exploitationcontinues both in the organized and unorganized sectors. A large number ofchildren below the age of 12-14 are made to work as Labour”s in many placesespecially in the agricultural and industrial areas. The physical, educationaland medical needs of these working children are conveniently ignored. Thesechildren’s are made to work for long hours. They are often battered by theiremployers and harassed by their senior colleagues. Unlike the adult Labour”s,
Research Journal of Social and Li fe Sciences, ISSN 0973-3914, Vol .-XIV- II, Year-07, June-201360
these child Labour”s have no unions of their own to fight for their rights andsafeguard their interests. Hence their exploitation continues without any protest.Neither the govt. nor the public is serious enough to make organized efforts tocombat this problem. Child labour is a social problem of far reachingconsequences. No outside observe can imagine and understand the complexityand magnitude of the problem has different facts also. Without the properappraisal of the problem is serious cannot be understood.Study Area- Rewa is located at 240320 north 810 180 east 24.530 north 81.30
east 24.530, 81.360 it has an average elevation 275 meters (902 fed). Thepresent study focuses on “Social Problems of child labour in district Rewa(M.P.) so the sample of ‘Child labour’ has been mostly taken from Rewatown. Rewa had population about 2,363,744 in census 2011 in which male are1,2249,18 and female 1,38,8626, Rewa has an average literacy rate of 73.42%male literacy 62.49% Rewa City has population 235, 442 as per census 2011male constitute 124,634 and females, 110,788. Rewa city has total 185291,literates in which male 103,599 and female 81,692 approx. average literacy87.74% male 92.91% and female 81.95%.Objectives of the Study- The purpose of the study is to reduce problems ofchild laborers by educational programs and social awareness building capacities.The immediate objectives of the study are as follow:a. To know the social and working environmental problems of the child
laborers in Rewa city;b. To explore why the children poor families are becoming or engaging in
the private labor force;c. To know and identify whether public, private and voluntary organizations
work to reduce the problems of child laborers and their related familiesor not;
d. To design and suggest holistic approach in which is effective to identifyand reduce the problems.
Methodology and Materials of the Study- In this study, total numbers of10child labourers were interviewed by the author during May to August 2013From Rewa City in India. To data collect well-organized questionnaire preparedand using interview schedule and face-to-face interviewed from therespondents. Simple random sampling techniques were used. Various socio-economic and demographic variables were considered at the time of datacollection. But in this paper only socio-economic variables are used. In addition,secondary data also used from various child labour relevant books, articles,documents, and officials through Internet browsing.Analysis of data- Clear and easy statics method has adopted fopr analysis ofdata provided by respondents through interview method, to present correctthoughts of respondents behaviors’ and mentality, that has made in the form ofsimple and under stable through of tabulation for the analysis of data. The

Research Journal of Social and Li fe Sciences, ISSN 0973-3914, Vol .-XIV- II, Year-07, June-2013 61
whole research has divided in to three chapters first chapter reveals introductiontherefore second chapter magnitude of the problem, third chapter related toworking conditions of the child labour and the last chapter is passed on theconclusion.Nature of Child Labour :Magnitude of the problem- The problem of child labour has become acolossal one. India has a largest number of child labourers in the world whoare engaged in both organised and unorganized sectors. According to planningcommission estimate, there were around 15.70 million child labourers in theage group of 10-14, as early as in the 1983. Of these, 14.03 million wereworking in rural areas and 1.67 million were engaged in urban areas.Different facts of the problem- Child labour is a social problem of far-reaching consequences. No outside observer can imagine and understand thecomplexity and the magnitude of the problem. The problem has different factsalso. Without identifying the problems of child Labour”s like economic, social,and the legal facts one couldn’t stop this evil.(a) Child lobour in organised sector- In the organised sector, child labouris mainly found in the rural areas, tea and coffee estates, and mining sectorsand even in urban areas.(b) Child Labour in Rural Areas- a large number of children found to beworking in rural areas, it s estimated more than 60% of them are below theage of ten years.In The Mining operations also, boys below 12 years are preferred to carrythings inside the tunnels without bending their head. It is said that in the miningsector, 56%workers are children below 15 years.
Table No.-1Occupation Frequency %
Motor Mechanic 2 15 Hotel Boy 4 20 Sales Man 3 35 Carpenter 1 20
Total 10 100 This table shows that the children are engaged in occupation to earn
money for the backup of their parents.Working Conditions of Child Labour”s- Not only working children arefound throughout India, but even horrible working conditions exist everywhere.Horrible Working Conditions in Urban and Industrial Areas- Childrenworking in small industrial units and mining industries are faced with hygienicproblems. Some work in dangerously polluted factories while a few others toilnear furnaces which burn at a temperature of 1400o centigrade. They handledangerous chemicals like arsenic and potassium. Continuous inhaling of impure

Research Journal of Social and Li fe Sciences, ISSN 0973-3914, Vol .-XIV- II, Year-07, June-201362
air adversely affects their lungs and creates diseases like tuberculosis.Sad picture of working children in urban industrial units: A large numberof children working in leather, glass and brassware industries in slate industriesand fireworks etc have sunken chests, and thin bone frames which give thema diseased look.
Table No.-2
Health Hazardous Frequency % Yes 7 85 No 3 15
Total 10 100
This table shows that the maximum number of children is facing manyhealth problems. They do not have any kind of facilities with which they cansave their physical standard.Conclusion- The problem of the child labour has more pronounced now thanbefore. Now it has increased tremendously band became national issue. As apart of volunerable section of people, child labour has some sufferings in thesociety. they want to get rid of these painful experiences and deserve helpfrom the nation of enjoy the rest of their life. As per the finding of the presentstudy will be identify the effective services and formulate a policy and plan forthe child labour in Rewa. Most will agree that eliminating child labour is clearlya goal in the long run. However, in poverty-stricken countries, work andeducation are often viewed as mutually exclusive in the lives of children. Culturalvalues and political environments of most developing countries continue tosupport the use of child labour, and these posses’ tough challenges fororganizations and individuals engaged in controlling its use.======================References-1. Ram Ahuja, Social Problems in India.2. C.N. Shankar Rao, Sociology Of Indian Society S.Chand and company Ltd.
Ram nagar, New Delhi, 7th edition.3. Dr. Kumar, Sociological Essays.4. Ali, M.Z (Zoo, April 2005 ), Asian economic crises and its Social impact on
Child Labour.

Research Journal of Social and Life SciencesISSN 0973-3914, Vol.-XIV- II, Year-07, June-2013
Intensity and Magnitude of Dowry RelatedViolence Against Woman
* S. P. Shukla==========================================================Abstract- Dowry has escalated to an extent to become a social enigma.The concept of the dowry has been translated into a series of demandwith a endless series of ceremonies associated with the girl after marriage.The practice of giving gifts to the bride's In-Law has become as epidemic,that may account to the mental, psychological torture and even the life ofthe bride. The gifts are no longer a taken of affection from the parents tothe daughter but instead an elaborate demand from the marital family.Dowry is being considered as weighing the status of the bride's as wellas the In-Laws family. The consequence of the menace has taken theform of a social hazard for the young brides. Though, the dowryprohibition Act. 1961 has banned the practice of dowry, in reality it isunheard. A large number of incidence of violence are not reported as itmay escalate the risk of well being, the life and limb of the daughters intheir husband's family. It is not often that we hear of a husband or hisfamily being sued for insisting on taking a dowry. Though dowry is notalways a cause behind the marital discord, but one of the major factorsresponsible for domestic violence. At a modest estimate the figure fordeath in India that occur due to non payment or partial payment of dowrycould be placed around 5000 for one year.Key Words- Subservient role, Scape-goat Syndrome, Homicide==========================================================
===========================* Professor, Political Science, Govt. College of Excellence, Rewa (M.P.)
The Problem- Dowry is one on the most prominent causes of domestic violenceand most commonly experienced familial violence in India. In recent yearthere had been alarming increase in dowry related violence. Almost all thecases coming into police, family courts, counseling cells and helpline centers,some or the other way bears the stains of dowry related violence. Duringvisits to family counseling centers and help line centers it was revealed by theofficials that a large number of complaint filed by the victims were the complaintsregarding the torture on dowry. It was also revealed that not all the violence isDowry related violence. Victims willingly include the incidents of Dowry torturesin all the incidents of violence against them, whatever be it’s nature. The causesof such reactionary response of the victim is to provide intensity and strength

Research Journal of Social and Li fe Sciences, ISSN 0973-3914, Vol .-XIV- II, Year-07, June-201364
to the perpetrators in order to get them punished. It is therefore not an easytask for the officials to locate a particular case as a case of dowry. Thecontention is that some cases of dowry violence are fabricated and engineered.It further doesn’t mean that the menace of Dowry is least expressed incidenceof violence. Dowry is one of the most common incidents of domestic violencewhich is ignored in general cases, it comes into notice only when the casebecomes very serious. The cultural norms in Indian society to socialize thegirls to be submissive and subservient to her In-Laws family prepares theground for dowry related crimes. It has also been observed that the compromisesin the courts and family counseling cell do not result into a permanent settlementof the matter. A complaint by a women victim is taken as a challenge to themasculinity of husband and as a disgrace and dishonor to In-Laws family.Consequently the dowry torture is repeated and sometimes become more violentresulting into the death of the bride, suicidal attempt or suicide. In a very fewcases the compromise between the two parties results into a permanentsettlement.Objectives- The objectives of the study is –• To investigate the causes, intensity, nature and magnitude of Dowry
related violence in India.• To analyze the social attitude towards Dowry in India.• To evaluate the impact of Dowry related violence on family specially on
the woman.• To analyze the social & institutional response towards Dowry related
violence in India.Methodology- The proposed study is based on secondary sources of data,collected from reference books, journals, periodicals, Internet News papersand reports of National Crime reports bureau.The Hypothesis formulated in the Research Paper are that Dowry is a socialmenace that prepares ground of different kind of domestic abuse well hiddenfrom public. The legal and Institutional response to Dowry related violence isnot an effective deterrence due to it’s being very private discourse.The Description- Dowry has been defined under sec. 2 of the dowryprohibition Act 1961 as-”Any property or valuable security given or agreed tobe given either directly or indirectly, by one party to a marriage to the otherparty to the marriage. The practice of dowry in ancient India included the giftsprovided to the bride in the forms of cloths, valuables and others things by theparent’s of the bride at their pleasure that was a symbolic of honor and respectto the bride’s In-Laws and affection towards their daughters In thecontemporary, the demand for social scenario.Though many dowry homicidesget unreported the number of those that are reported is enough to unnerve oursociety. Such incidents have their origin in social economic and psychologicalfactors too deep rooted to tackle by amending the law. The greed for money,

Research Journal of Social and Li fe Sciences, ISSN 0973-3914, Vol .-XIV- II, Year-07, June-2013 65
the aggressiveness increased by resistance to the demand and the ease withwhich the weaker sex can be exploited all combine to encourage familymembers to take the bride’s life2. Rashtriya Mahila of the National Commissionfor the women in India reports- ‘Everyday almost every 6 hours somewhereat some place in India a young married women is being burnt alive or eaten todeath or being pushed to commit suicide’3. Social factors for the menace ofdowry can be understood through the sociological model of dowry deaths givenby Natrajan Mangai4.
Sociological Model of Dowry by Natrajan Mangai
Patriarchal
Dowry system
Social groups, urban, middle class,
Wives family several daughters less influential less well of
Husband’s family large family, powerful
in community (In terms of being a father
of a son) ambitions parents, commitment
Family needs many off daughters conserve Resources prestige
Get money for daughter’s marriage pay debt incurred on son’s education general economic necessity
Arranged marriage large, dowry settlement of non cash items marriage broker used
Wife’s characteristics submissive young less educated
Husband’s character is
his weak and low confidence
emotionally dependent older well- educated
Wife’s reaction tolerance, sacrifice
for her siblings; inferiority complex, feeling of rejection
Husband’s reaction
dissatisfied with work and marriage
unfaithful, alcohol/ drug/gambling
Living situation after marriage joint family; wife unemployed; not trained in house work
incompatibility in marriage; wife in laws
Dowry murder suicide
Dr. Mangai has drawn this model to show the evils of dowry that has anadverse effect on the status of a married woman in a family at the differentlevels. In his 9 model diagram he tries to prove how the menace of Dowrybecomes responsible for incidents of abetment to suicide or killings on dowry.

Research Journal of Social and Li fe Sciences, ISSN 0973-3914, Vol .-XIV- II, Year-07, June-201366
The model reveals that the problem of dowry frequently arises within urban,middle class and traditional families. The socio-economic status or socialmobilization has got nothing to do with the system of dowry which has got thelegal and social sanction.
In Indian tradition husbands family is in dominant position by virtue ofbeing the bride-grooms family. This upper hand provides them an opportunityto dictate their terms with respect to dowry whereas the wives family is weakerin the sense they have to get their daughter married to the bride-grooms family.The structure of dowry is thus male centered they have to conserve resourcesto meet with the requirement to level the honour and prestige of the groomsfamily. Model 5 & 6 as given by Mangai reveals that the economic drives ofboth the families are important. The husband’s family may be trying to obtainresources through the dowry by capitalizing on husband’s earning power. Thewife’s family may be trying to protect the resources. The relative status of thefamilies are also relevant with the husband’s family being more influential.Model 7 & 8 deals with the personal characteristics of the wife and the husband.Wives are more likely to be victimized if they are submissive, young and lesseducated. Husband’s are more likely to be perpetrators, if they are weak andemotionally dependent. Husbands who are older and better educated thantheir wives are more likely to dominate in there spousal relation and commitviolent acts. Model 9 describes the possibility of misunderstanding on non-payment of the amount of the dowry at the time of marriage or on the quantityof goods supplied. In a joint family system when the wife is unemployed andless educated she may be subjected to harassment getting no support from theparents or the neighbours. Even if the girls family are supportive they can notall the times come to her help. The case of bride burning in urban areas happensand it comes into notice of the neighbours when the incidents have occurred.The consequence of quarrelsome family on the issue of violence is that a wifeis forced to bear the torture without intimating the guardians so as not to bringany shame on them. Her dependence on her husband both emotionally andeconomically, tend her to loose her confidence. The husband on the other handbeing dissatisfied at work and in his married life may indulge in other activitieslike extra marital relations, alcoholism or drug abuse. The climax of thesesituations thus result in dowry murder, bride burning, suicide or abetment tosuicide.
Marriages in India are celebrated as a ceremony and in Hindu mythologyit is considered a religious sacrament but in the emerging global society whichhas given way to marketization it has become more a monitory exchange inwhich the father of a daughter is the most deprived and pitiable creature whohas to under go a number of compromises to settle the marriage of his daughterin accordance with the satisfaction of groom’s family. The later has leastaccountability and responsibility towards the prestige and honour of the bride’s

Research Journal of Social and Li fe Sciences, ISSN 0973-3914, Vol .-XIV- II, Year-07, June-2013 67
parents. This is a very pathetic paradox of the cotemporary society in India.Dowry harassment cases that erode the entire base of womanhood in India inseveral cases culminating in suicide or homicide are part of the tragic dramaof domestic violence being enacted everyday in some part of the country5.Everyday almost every 6 hours somewhere at some place a young marriedwoman is being burnt alive. Over the past few years the cases of bride burninghas registered a sharp increase throughout India. Apart from these statisticsquoted by Rashtriya Mahila Feb. 2000, Publication of the National Commissionfor Women in India, a large number of girls are reported as being tortured andharrassed6. Most of the cases of tortures on dowry, abetment to suicide, brideburning, dowry killing have some psychological factor that may be termed as–• Psycho-paternal (Masculine factor)• Psycho-social factor
It is evident that domestic violence is committed by men on women. It isinfluenced by psycho-paternal or Masculine factor. Masculinity demands powerand control over the weaker sex; whereas the latter is placed at an inferiorplace, a subject of obedience to the former. Expression of autonomy by a wifeposes a challenge to Masculinity. Being man is being endowed with a right tocompromise on his own terms. Demand of dowry is simply a manifestation ofMasculinity. A wife after marriage is expected to serve the husband’s family,prove her worth as a subservient and docile lady. She also becomes a meansof communication for the supply of the demands made by the husband’s familythat she has to convey to her parents. Her failure in communication and servingthe purpose of the husband’s family becomes the root cause of violence againsther. The menace of dowry has become a social enigma. The social attituderefuses to recognize women as equal human beings. In fact the low status ofwomen along with arising consumerism and greater inequality seems to refuelthe taking and demanding dowry. Giving and taking dowry is now beingconsidered as a matter of status and social prestige of not only the groom’sfamily also for the bride’s family. This psycho-social factor has given impetusto the menace of dowry. With the rise of industrial capitalism andcommercialization of economy and consequent wealth based competition, dowryis serving as a means to a family to make a public display of their social statuson the occasion of daughters’ marriage7. Not only the groom’s family but eventhe bride’s family is responsible for the menace of dowry because both theparties take the dowry as a matter of display of their social and economicstatus. Marriage is thus a comparative weighing of the status factor; that isbuilt into process. A woman takes heavy dowry along with her to minimize herdependency status8. But the practice results in adversaries to woman in turn.In the contemporary society prevalence of dowry as status symbol exert socialpressure and expectations of groom’s family to mount high to enforce theparents of the bride to yield more and more dowry. The most pernicious effect

Research Journal of Social and Li fe Sciences, ISSN 0973-3914, Vol .-XIV- II, Year-07, June-201368
of the dowry is that it is not a one time demand or payment. Instead, It opensa series of expensive rituals, gift giving, customary honour to groom and hiskins which continue even long after marriage on different occasions. Onemore anomaly of dowry is it’s misappropriation and unwanted wastage inextraordinary display, decoration, pomp and show. Neither the bride’s familynor the bride can claim any control on dowry paid at the time of the marriage.Each and every items obtained in dowry is minutely evaluated, scrutinized andtasted. The families failing to fulfill or not falling in line with expected demandswill have to face the anger and frustration from the groom’s family. A numberof cases of repeated demands of dowry causing violence against bride andsometimes amounting to murder, suicide or abetment to suicide or filed in thepolice and the courts.The frustration and anger against the bride’s family beginswith a murmer or verbal exchange that bursts into thrashing, beating, isolating,neglecting and sometimes to dowry killing. Identifying the specific context ofdowry practice that give rise to the persecution of women is rather difficult asseveral other factor may be responsible for the crises of torture related todowry such as personality of the spouse, their unrealistic expectations,differences in the socio-economic background of the spouse, alcohol, jealousyetc. The NCRB report gives a clue of the dowry incidence.Incidence of dowry related crimes against women from 2006-20109
S.No Year Total Crimes
Crimes under section 302/304 dowry deaths
Crimes under dowry harassment (Act 1961)
Incidence Percentage Incidence Percentage 1 2006 164765 7618 4.6 504 2.73 2 2007 185312 8093 4.36 5623 3.03 3 2008 195856 8172 4.17 5555 2.83 4 2009 203804 8383 4.11 5650 2.78 5 2010 213585 8391 3.92 5182 2.52 The incidence of total crimes committed against women has shown
increase during every year, though the crimes committed under sec. 302/304IPC shows a decreasing trend, similar trend is seen in the crimes under Dowryharassment act 1961 as per records of NCRB,Crimes against women under section 302/304 and dowry harassment

Research Journal of Social and Li fe Sciences, ISSN 0973-3914, Vol .-XIV- II, Year-07, June-2013 69
Incidence of torture on dowry under sec. 498-A IPC has been increasingsince 2006 that can be seen in the following diagram.Year wise (reported) Incidence of torture on dowry (Sec. 498-A IPC)
The data collected from the NCRB 2010 reveals that the crimes againstwoman has increased at the National level. The same trend is noticed in thestates and in the Mega cities. This trend can be anticipated with our socialattitude towards the Institution of dowry which has changed during the precedingyears. The economic progress and changing pattern of life style hasovershadowed the emotional bond between husband and wife. The institutionof family as a source of love, affection and peace has been changed into aplace of conflict and crime. The cost of love and security for the girls haveincreased and this has confined the space for the girls in the society. Therelationships, modesty, morality are fast loosing their sense.
Dasgupta and his associates observed that dowry related problemsusually arise out of three context viz. failure to pay the remaining part ofdowry, inability to fulfill extra demand made by the bride-groom’s family or thegeneral dissatisfaction of groom’s family about the gifts or items given by thebride’s parents10. Since the dowry related crimes are committed behind thepremises of the household the exact figure of the incidents do not get registered.Most of the cases in the remote rural areas get unreported either due toincapacity of the bride’s family in their access to law and police. It has alsobeen observed that in maximum number of cases the crimes do not get reportedas both the parties live in anticipation of some solution of the problem. Eventhe bride hesitates to report the incident of violence due to dowry to her parents.Such cases come in to notice when a heinous crime like suicide, bride burning,dowry murder or abetment to suicide takes place. However the number ofcases reported regarding the crimes on dowry are sufficient to unnerve oursociety. Such incidents have their origin in socio-economic and psychological

Research Journal of Social and Li fe Sciences, ISSN 0973-3914, Vol .-XIV- II, Year-07, June-201370
factors. It is so deep rooted in the customs and traditions of the society that itcan not be tackle by the police or the law11. Since most of the dowry homicidesoccur in the privacy of the husbands house and with the collusion of the familymembers; the courts therefore admit their inability to decide the matter for thelack of evidence. In the different studies it has been revealed that the percentageof conviction in the cases of dowry related incidents are not satisfactory. Lawsthus have proved a poor deterrence against this phenomenon. Dowry hasbecome a wide spread evil cutting across the education, economic status ofthe bride’s or the bride-groom’s family. The common experience is that - themore is the economic status, the more will be the demand for dowry. Evenhighly educated and employed girls have to suffer the tortures of dowry. Thewell settled and employed boys are commonly considered a blank cheque thattheir parents wish to en-cash at the time of marriage. Most of the parents takedowry as a compensation for all the expenses they have done in upbringing theboy and the money spend in their education.
In a case an IAS officer was reported to have been arrested on thegrounds of persistently torturing his wife for more money. The wife was denieda full meal, often beaten up badly with no access to medical facility. The fatherof the bride was a leading congress leader in Andhra Pradesh who claimed tohave given 150 Tola of jewelry, a Flat worth Rs. 25 Lakh, A Car worth Rs. 4Lakh and households articles worth Rs. 25 Lakh as dowry. (Total amountingabout 1 crores ) but even more was wanted by the officer husband12. TheHindustan Times, May 7 2002 reported the illegal confinement (Captivity) of awomen in a small dingy room by her husband for 10 years for failing to bring amotorcycle along with the dowry13. This is the inhuman face of the society. Ithas been observed that the cases of dowry tortures come to the courts onlywhen there is no other option left with the bride’s parents. In general no brideare her parents would like to file a case against their In-Laws as it is taken ascontrary to the prestige and honor of the family as well as the safety and wellbeing of the daughter whom they married. Law commission has identifiedcertain factual components of dowry death such as the bride’s are mostlyyoung, dependent on husband. In majority of the cases the incidents of deathor reported suicide of the brides or registered as accidents in kitchen. In majorityof cases use of kerosene has been reported for the commitment of the suicideor murder of the bride; although other modes of the murder or commission ofsuicide such as strangulating, burning, hanging, poisoning, drowning is verycommon in Indian society. The most traumatic experience of dowry violencein the contemporary society is that the nature of atrocities against woman arebecoming more ruthless and brutal to an extent to be called inhuman, heinousand Barbarian. In a number of cases the married girls were killed and hackedin to pieces. The perpetrators in dowry related violence against the bride’s aremostly mother’s-In-Laws, husbands and siblings of the husband. though in

Research Journal of Social and Li fe Sciences, ISSN 0973-3914, Vol .-XIV- II, Year-07, June-2013 71
maximum number of cases mother’s In-Laws and sister’s In-Laws had beeninvolved in dowry related crimes as Preetish Nandi, a noted journalist assertsthat–‘even man’s cruelty towards women is no match for the cruelty of awoman towards a woman14.
A.R. Wadia holds –‘the greatest enemy and the only one, ultimately counts forwomen’s emancipation is women herself15. K.L. Sharma observes –‘it hasbeen observed that it is a women who obstruct the path of other women evenmore than a man do16’. It may be assumed that intro-gender nature of women’soppression is a manifestation of ‘the scape-goat syndrome’ a women whohas herself been made a scape goat earlier, searches another to target thefrustration of her life situation; Thus a young bride becomes an easy prey forher frustration; this is not mere assumption but bears a truth when we analyzethe common perception about the mother In-Law, sister In-Law V/s daughterIn-Law phenomenon. Ruth vanita argues – ‘every oppressed groupperpetrates its own oppression17’
A few instances may be mentioned in which the perpetrators or themain culprit had been the women (Mother In-Law). In Bhagwat Singh V/sCommissioner of Police Delhi, the mother In-Law was held responsible forthe murder of Gurvindar Kaur aged 22 for dowry who deceased due to excessiveburns in kerosene fire18. In Nirmala Devi case the mother In-Law was heldguilty of abeting to suicide under 306 of IPC and In Rajkumar and other’s V/s State of Punjab, the strained relations with the mother In-Law becameresponsible for the suicide of the daughter in law. In Rajkumar & others v/sState of Punjab the strained relation’s with the mother In-Law becameresponsible for the suicide of the daughter In-Law19. In state (Delhiadministration) v/s Laxman Kumar, the strained relation on dowry betweenthe daughter In-Law and mother In-Law were held responsible for the deathof the deceased bride. In Lichama Devi v/s State of Rajasthan, the deceasedbride Pushpa was set a fire by her mother In-Law. In Satya Narain v/sSaundryavalli, the husband and the mother In-Law were found guilty of crueltyunder section 498-A IPC. In P. Vikshapati and others v/s State of AndhraPradesh the deceased has fallen prey to ill treatment of her husband and hermother In-Law. There are a large No. of instances of the so-called scape-goat syndrome in which mothers In-Law were responsible for committedbrutality and ruthlessness resulting into the death of the young brides; the familialaffection, values, emotions has been kept aside in committing the henious crimesagainst the married girls. The incidence of dowry deaths (Sec-304 B IPC)cruelty on dowry by husbands & relatives (Sec. 498 A IPC) and the casesRegistered under dowry prohibition Act. In the 07 major states is being givenas under –

Research Journal of Social and Li fe Sciences, ISSN 0973-3914, Vol .-XIV- II, Year-07, June-201372
Intensity and Magnitude of Dowry tortures in States NCRB 201020
S.No. Name of states
Total No. of crimes 2010
Dowry deaths 304 B IPC
Tortures for Dowry 498 A- IPC
Dowry prohibition Act. 1961
1 Andhra Pradesh
27244 588 12080 1186
2 Assam 11555 175 5410 37 3 Madhya
Pradesh 16468 892 3756 67
4 Maharashtra 15737 393 7434 40 5 Rajasthan 18182 462 11145 03 6 Uttar Pradesh 20169 2217 7978 115 7 West Bengal 26125 507 17798 53 Total 135480 5234 65601 1501 All India total with UTS 213585 9891 94041 5182 Dowry deaths in a large number get unreported; Specially in remote
rural areas, where people have no easy access to police or judicial system.The people who have to face the heavy burden of poverty can not afford theiraccessibility to police or judiciary or otherwise avoid going to police or judiciary;the cries of the women succumbs to the pressure of destitute. It is not an easytask to detect the exact cause of the death of a women taking place in the fourwalls of the household. The neighbors or the society rarely responds to thecries behind the doors, & the windows are kept shut. Even the best enactedlaws fail to provide any remedy in such a situation in want of proper responseand adequate evidence to prove the crime committed to the young brides.
In a study of 150 dowry victims Ranjana Kumari concluded that –”¼The victims were murdered, 61.3% were thrown out of their husbands house.Surprisingly, in 69.3% cases parents send their daughters back to the husbandswhile being fully aware of the torment they were undergoing of these, 77.9%returned only to be deserted and 11.5% to be murdered21". Different studieshave revealed that dowry deaths took place within one or two years of marriage.Kitchen fires are the most frequent method of bride killing. It has been observedthat there is an involvement of the entire family in the incidents of bride killing.In most of the cases the incidents of bride burning it is moulded in the form ofan accident or an incident of suicide. Due to lack of evidential proof and witness,the perpetrators easily escape punishment; this is the reason of very low rateof conviction in such type of cases.
However to argue that Dowry is not always a cause behind maritaldiscord is not to ignore the fact the fact that it is one of the major factors forDomestic violence. While keeping this fact in mind, it is necessary to worktowards a fuller understanding of the institution of Dowry and it’s impact oninter-family relationships. To quote Madhu Kishwar- ‘oppression of wives forbringing inadequate Dowry is only another excuse for using violence againstthem’22. How to curve the menace of torture on Dowry? What should be theinstitutional response? How can the laws be made an effective tool to curvethe evil is a matter of discourse for many of us. We have the Laws but theirenforcement is too weak to prove an effective deterrence in matters of Dowrytortures or dowry deaths. ‘Sec. 304-B & 498-A, need to be made more

Research Journal of Social and Li fe Sciences, ISSN 0973-3914, Vol .-XIV- II, Year-07, June-2013 73
deterrent in nature with the stern punishment measures. The maximumpunishment for Dowry murders is 7 years imprisonment or in rare cases lifeimprisonment. ‘ The Supreme Court held in Lichhamadevi- that a person whoperpetrates a crime without a human consideration must be given an extremepenalty of death sentence.23’
Effective implementation of Laws regarding Dowry offences under ‘sec.304-B & 498-A’ IPC as well as the provisions of Dowry prohibition act 1961is still needed. Demand of Dowryis not an offence under IPC though It is anoffence under Dowry prohibition act. Hence it shoulkd made an offence undersec. 498-B IPC. Procedural complexities of remedial measures should beremoved so as to ensure victim’s easy access to remedies. Special exclusivecourts with woman judges should be constituted to ensure speedy trail anddispensation of justice in cases of dowry violence. Economic empowermentof woman to make them economically least dependent on husbands andprovision of financial aid in the situation of judicial separation should be ensured.Gender-sensitization programs and socialization of family in proper mannermay prove worthful in cases of Dowry violence. The state and legalfunctionaries have responded well to the problems of woman in their differentperspective with the enactment of Protection of Woman From DomesticViolence- Act, 2005 and other remedial measures. The need is to ensure thelevel of their implementation.======================References-1. Ahuja, Ram- 1998 Violence against Women, Rawat Publication, Jaipur p.26-272. Mishra, Preet-, 2007 Domestic Violence Against Woman - Legal Control and
Judicial Response, Deep and Deep Publications New Delhi, P. 1233. Quoted from Natrajan Mangai, Victimisation Of Woman-Atheoretical
Perspective Of Dowry in India, international Website P. 124. Mishra, Preeti, op. cit. p. 1225. Ahuja, Ram opcit. p.26-276. Manish Bahl- 2007 Violence on Women by Men, Cyber-Tech Publication, New
Delhi, p.897. Ibid p. 908. Ibid p.919. NCRB 201010. Mishra, Preeti, op.cit. p. 12511. The Statesman Dec. 16, 2001, p.812. The Hinduatan Times, May 7,2002 p.513. Manish Bahl op.cit. p.9814. Ibid15. Ibid16. Mishra, Preeti op.cit.P.122,17. AIR 1983 SC 82618. Mishra, Preeti,op.cit. P. 122

Research Journal of Social and Li fe Sciences, ISSN 0973-3914, Vol .-XIV- II, Year-07, June-201374
19. Ranjana Kumari- Brides are not for burning, Dowry victims in India,1989 Quotedby Mishra, Preeti,op.cit. P.136
20. NCRB 201021. Sinha B.S.- 2007 Law of Torts, Eastern Book Co.Lko. p. 1722. Madhu Kishwar- Dowry to ensure her happiness or to Disinherit her- Manushi
(A research Journal) 34:2, 1986, P. 2-1323. Sharma Vinay- 2007 Dowry Deaths, Legal Provisions and Judicial
Interpretations, Deep & Deep Publications, New Delhi P.23
izks- cztxksiky 'kqDy41@42] j?kqoa'k lnu] fcfN;k] jhok (e-iz-)& 486001
Phone - (07662) 255177, 9425186437 E-mail - [email protected] [email protected]
lsUVj QkWj fjlpZ LVMht] jhok }kjk fjlpZ tjuy vkWQ vkV~Zl eSustesUV ,.M lks'ky lkbalsl
ds fo'ks"kkad ds :i esa fuEufyf[kr nks lanHkZ iqLrdksa dk izdk'ku uoEcj] 2013 esa fd;k tk jgk gSA
mDr lanHkZ iqLrdksa esa izdk'ku gsrq vki viuk rF; ijd ,oa rdZ ;qDr 'kks/k i= Hkstdj bl vdknfed dk;Z esa lg;ksx dj ldrs gSaA fgUnh Hkk"kk esa 'kks/k i= ,e-,l- oMZ esa QkUV df̀rnso 010] djsDVj lkbt 14] Mcy Lis'k_
vaxzsth Hkk"kk esa VkbEl U;w jkseu QkUV lkbt 14] Mcy Lis'k esa HkstsaA
(vkbZ-,l-ch-,u- 978&81&87364&59&7)
(ISBN 978-81-87364-60-3)
ledkyhu Hkkjrh; lekt ,oa laLÏfr
Contemporary Indian Society and Culture
ISSN 0975-4083

Research Journal of Social and Life SciencesISSN 0973-3914, Vol.-XIV- II, Year-07, June-2013
Meal Time Behavior of Intel lectually DisabledChildren and Adolescent: A Study in Raipur City
* Rachana Saxena** Aruna Palta
==========================================================Abstract- An estimated 10% of the world's population experiences someform of disability or impairment (WHO Action Plan 2006-2011)..Intellectual disability, also referred to as mental retardation, is adisability that begins in childhood. It is a generalized disability appearingbefore adulthood, characterized by significantly impaired cognitivefunctioning and deficits in two or more adaptive behavior historicallybeen defined as an Intelligence Quotient score under 70 .==========================================================
===========================* Dietitian and Research Scholar, Raipur (C.G.)** Principal, Dr. R. B. Government Naveen Girls College, Raipur (C.G.)
To assess the mealtime behavior of intellectually disabled children astudy was performed amongst 100 intellectually disabled children (age 7-16years) of Raipur city. A self designed pretested meal time behavior assessmentschedule was used for the collection of informations about meal time behavior.It consisted of informations about the behavior during meals, and practice ofpersonal hygiene at mealtime. The study revealed that severely retarded andhyperactive children showed more disruptive behavior like aggression, foodrefusal, moving around during mealtime etc. Percentage of children who showedunhygienic practices was also very high among these children. Findings of thestudy suggests that problematic mealtime behaviors displayed by children andadolescents with intellectual disabilities can lead to malnutrition and result inserious health problems.Introduction- Intellectual disability is a disability characterized by significantlimitations both in intellectual functioning such as learning reasoning problemsolving and so on and adaptive behavior which covers many every day socialand practical skills .The disability originates before the age of 18. Feeding andmealtime behavior problems are commonly observed among individuals withintellectual developmental disabilities. These problems include, but are not limitedto, food refusal, food selectivity, mealtime aggression, rumination, pica, andinsufficient feeding skills. Individuals diagnosed with intellectual disability have

Research Journal of Social and Li fe Sciences, ISSN 0973-3914, Vol .-XIV- II, Year-07, June-201376
a higher prevalence of comorbid disorders and behavior problems than thegeneral population (Borthwick&Duffy, 1994; Matson & Barrett, 1993). In1983 Linscheid described 10 mealtime problems including, tantrums, bizarrefood habits, multiple food dislikes, food-texture selectivity, delay or difficulty inchewing, sucking, or swallowing, delay in self feeding, pica, excessiveovereating, too little food eaten, and rumination. Eating behavior is reported tohave a significant influence on nutritional status both in biochemical andanthropomeatric parameters in Intellectually disabled children and biochemicalparameters were also influenced by variation of socio-economic status (Sanchezet al 2002) .The factors contributing to the nutritional disorders in Intellectuallydisabled children also include inadequate nutrient intake due to poor feedingtechniques; gross motor self-feeding impairment, swallowing difficulties,regurgitation, and gastro-esophageal reflux; limited appetite, food aversion andfood refusal; and coughing, choking or vomiting during eating. (Marais &Labadarios2000). Kerwin, et al (2005) reported that although more than 60%of parents surveyed indicated that their children with Autism spectrum disorder(some times associated with intellectual disability) had strong food preferences,only 6.7% of these parents described their children as havingfeeding problems. Williams et al. (2000) reported a similar rate of 67% of surveyrespondents describing their children as being picky eaters. Schreck et al.(2004) found that participants on the autism spectrum ate a more restrictedrange of foods and had higher rates of food refusal than did theirneurotypical peers. Participants also had more utensil requirements andstringent mealtime requirements such as specific food presentation. Sinceproblematic meal time behavior may reduce food consumption initellectuallydisabled children, dietary counseling of the parents and other family membersmay be useful to counter the intake deficit.Methodology- An observational study was planned to understand themealtime behavior of intellectually disabled children. The study was carriedout amongst intellectually disabled children (aged 6 to 16 years) of Raipurcity.100 intellectually disabled children were selected for the study as sampleusing random sampling. A self designed pretested mealtime behavior assessmentschedule was administered among parents and caregiver of these children.Mealtime behavior assessment schedule consisted of informations aboutbehavior during meals like moving around during meal time, aggressive behavior,food refusal etc and practice of personal hygiene at meal time . To avoid anyerror and to get a good response rate the information were collected personallyfrom the respondents. Simple statistics in terms of frequency &percentagewas calculated from the collected data.Results and Discussions- The informations and data obtained are tabulatedand presented in Table no.1 and Table no.2.
Table no.1 depicts behavior of intellectually disabled children during meal

Research Journal of Social and Li fe Sciences, ISSN 0973-3914, Vol .-XIV- II, Year-07, June-2013 77
time. Among them18% always hanged on the use of fingers instead of spoonwhereas 35% of them were those who showed this behavior occasionally but47% never hanged on the use of fingers instead of spoon . 40% children werethose who move around during meal time occasionally and 50% never movearound but 10% children always move around during meal time .8% childrenalways talk with mouthful while 38% children occasionally and 54% childrennever talk with mouthful .12% children always need help while eating63%children do not need any assistance while eating .30% children always rejectdisliked food .55% children do not accept disliked food .86% children werealways able to indicate when hungry .34% children always showed aggressivebehavior at mealtime while 53% occasionally and 13 % children never showedthe same behavior .
Table No.1:Mealtime behavior of selected subjectsBehaviour Always Sometimes Never
Hang on the use of fingers instead of spoon 18 35 47 Move around during mealtime 10 40 50 Talk with mouthful 8 38 54 Do not eat without help 12 25 63 Do not accept disliked food 30 55 15 Do not treat foods clean 20 42 38 Able to indicate when hungry 86 14 0 Able to indicate when full 86 14 0 Aggressive behavior at meal time 34 53 13 Table no 2 shows the practice of personal hygiene during meal time
.60% children were found to be agree for washing their hands before andafter meal while 32% were agree for sometimes. 8% never agree for handwash before and after meal.48% children were always agree for brushingtheir teeth and 36% children sometimes agree for brushing .20% children neveragree for cleaning spilled foods while 43% children agree for sometimes .37%an were always agree for cleaning the spilled foods .
Table No. 4 : practice of personal hygiene during mealtimeBehaviour Always Sometimes Never
Agree for hand wash before meal 60 32 08 Agree for hand wash after meal 60 32 08 Agree for brush teeth after meal 48 36 16 Agree for clean spilled foods 37 43 20 Conclusion- In the present study it can be concluded that problematic mealtime
behavior displayed by intellectually disabled children may put extra burden oncaregiver and parents in maintaing good nutritional and health status of thesechildren . Since problematic meal time behavior may reduce food consumption,dietary counseling of the parents and other family members and proper trainingof communication skills may be useful to counter the intake deficit.Acknowledgement- With great delight and profound regards I would like to

Research Journal of Social and Li fe Sciences, ISSN 0973-3914, Vol .-XIV- II, Year-07, June-201378
express my heartfelt gratitude to my supervisor Dr. Aruna palta, Principal Dr.R.B. Naveen Girls' College Raipur (C.G.) for her meticulous supervision, superbguidance, constructive suggestions and sympathetic attitude. I express mysincere thanks to Dr Meeta mukarji, co coordinator and Smt Sheela pillai,principal of the school for mentally challenged children AKANKSHA. I expressmy gratitude to mrs.Sangeeta jaggi principal, Bal jeewan jyoti for givingpermission to carry out this study in their schools.I am also very thankful toDr.Simi shrivastava ,consultant psychological couseller for her valuablesuggestions. I am highly indebted to all the caretakers and parents of the childrenwho patiently co-operated me in the entire course of my study.======================References-1. Borthwick-Duffy, S. A. (1994). Epidemiology and prevalence of
psychopathology in people with mental retardation. Journal of Consultingand Clinical Psychology, 62, 17-27.
2. J. L. Matson (Ed.), Handbook of behavior modification with the mentally retarded(2nd edition) . 225-251. New York, N.Y.: Plenum Press.
3. Kerwin, M. E., Eicher, P. S., & Gelsinger, J. (2005). Parental report of eatingproblems and gastrointestinal symptoms in children with pervasivedevelopmental disorders. Children's Health Care, 34(3), 217-234.[CrossRef]
4. Linscheid, T. R. (1983). Eating problems in children. In C. E. Walker & M. C.Roberts (Eds.), Handbook of clinical child psychology 616-639. New York:Wiley.
5. Marais ML, Labadarios D. The mentally disabled - a responsibility and achallenge. SAJ Clin Nutr 2000;13:4
6. Sanchez-Lastres JM, Eiris Punal J, Otero-Cepeda JL, Pavon-Belinchon P, Castro-Gago M. The impact of sociofamilial factors on nutritional status in mentallyretarded children. Rev Neurol 2002; 34:1001-1009.
7. Williams, P. G., Dalrymple, N., & Neal, J. (2000). Eating habits of children withautism. Pediatric Nursing, 26(3), 259-264.
8. Schreck, K. A., Williams, K., & Smith, A. F. (2004). A comparison of eatingbehaviors between children with and without autism. Journal of Autism andDevelopmental Disorders, 34 (4), 433-438.

Research Journal of Social and Life SciencesISSN 0973-3914, Vol.-XIV- II, Year-07, June-2013
Female Sex Ratio in India: A Sociological Study asper Census 2011
* Akhilesh Shukla==========================================================Abstract- Female sex ratio commonly known as sex ratio is the number offemales per every 1000 males in a given place. It, again, is recalculatedbased on the age groups like 0 years to 6 years or 6 years and above.The number of female in the age group of 0 years to 6 years is termed aschild sex ratio. As per the latest Census in the year 2011, the total femalesex ratio in India is 940 per 1000 males and the female child sex ratio is944 girl children per every 1000 boy children of the same age group.The overall female sex ratio has increased by 0.75 % in the Census 2011as compared to the previous Census of 2001.==========================================================
===========================* Department of Sociology, Government T. R. S. College Rewa (M.P.)
Female sex ratio commonly known as sex ratio is the number of femalesper every 1000 males in a given place. It, again, is recalculated based on theage groups like 0 years to 6 years or 6 years and above. The number of femalein the age group of 0 years to 6 years is termed as child sex ratio. As per thelatest Census in the year 2011, the total female sex ratio in India is 940 per1000 males and the female child sex ratio is 944 girl children per every 1000boy children of the same age group. The overall female sex ratio has increasedby 0.75 % in the Census 2011 as compared to the previous Census of 2001. Female Sex Ratio - As per the provisional report generated by the Census ofIndia, Ministry of Home Affairs, some of the Union Territories like Dadra andNagar Haveli and Daman and Diu has shown a negative trend in respect ofthe female sex ratio. The state and Union Territories showing a negative trendin Census 2011 are:• Jammu & Kashmir: 1.01 %• Daman and Diu: 4.56 %• Dadra and Nagar Haveli: 12.96 %
The Census 2011 report even reflects that some of the major parts ofIndia are at an alarming position. This includes one state and four unionterritories. The report was published based on the available data till 0:00 hoursof 31st March, 2011 in India. The details of the bottom five states or UnionTerritories showing a decrease in the female sex ratio can be checked fromthe following table:

Research Journal of Social and Li fe Sciences, ISSN 0973-3914, Vol .-XIV- II, Year-07, June-201380
S.No. State/UT Female sex ratio as per Census 2011 1 Haryana 877 2 Delhi 866 3 Chandigarh 818 4 Dadra and Nagar Haveli 775 5 Daman and Diu 618 Delhi though has shown a positive trend of 5.48 %, still got featured in
the list of states, which have lowest female sex ratio in India. Same withChandigarh, where the female sex ratio increased by 5.28 %, but still isconsidered as one of the bottom contributor in the field of female sex ration inthe nation. Besides these, the Indian states and Union Territories like Andaman& Nicobar Islands, Mizoram and many more grew by 4 %. The five states orUnion Territories that showed a good registered growth of the female sexratio in India are shown in the following table.
S. No. State/UT Female sex ration as per Census 2011 1 Chhattisgarh 991 2 Andhra Pradesh 922 3 Tamil Nadu 995 4 Puducherry 1038 5 Kerala 1084
We can compare the female sex ratio as per census reports of 2001 and2011 in Indian States. The figures are given in the following table.
S.No. Name of State Census 2001 Census 2011 Increase or decrease in percentage
1 Andhra Pradesh 978 992 1.43% 2 Arunachal Pradesh 893 920 3.02% 3 Assam 935 954 2.03% 4 Bihar 919 916 -0.33% 5 Chhattisgarh 989 991 0.20% 6 Goa 961 968 0.73% 7 Gujarat 920 918 -0.22% 8 Haryana 861 877 1.86% 9 Himachal Pradesh 968 974 0.62% 10 Jammu & Kashmir 892 883 -1.01% 11 Jharkhand 941 947 0.64% 12 Karnataka 965 968 0.31% 13 Kerala 1058 1084 2.46% 14 Madhya Pradesh 919 930 1.20% 15 Maharashtra 922 925 0.33% 16 Manipur 974 987 1.33% 17 Meghalaya 972 986 1.44% 18 Mizoram 935 975 4.28% 19 Nagaland 900 931 3.44% 20 Orissa 972 978 0.62% 21 Punjab 876 893 1.94% 22 Rajasthan 921 926 0.54%

Research Journal of Social and Li fe Sciences, ISSN 0973-3914, Vol .-XIV- II, Year-07, June-2013 81
23 Sikkim 875 889 1.60% 24 Tamil Nadu 987 995 0.81% 25 Tripura 948 961 1.37% 26 Uttar Pradesh 898 908 1.11% 27 Uttarakhand 962 963 0.10% 28 West Bengal 934 947 1.39%
Union Territories of India-S.No. Name of Union
Territory Census
2001 Census
2011 Increase or decrease
in percentage 1 Andaman & Nicobar
Islands 846 878 3.78%
2 Chandigarh 777 818 5.28% 3 Dadra & Nagar Haveli 812 775 -4.56% 4 Daman & Diu 710 618 -12.96% 5 Lakshadweep 948 946 -0.21% 6 NCT of Delhi 821 866 5.48% 7 Puducherry 1001 1038 3.70% On the whole, while the national sex ratio is 940 per 1,000 men, in
Haryana, Punjab, Chandigarh and Delhi, it is below 900. This shows that themenace has reached alarming proportions even in urban areas. The Law I tis a matter of grave concern that today in India we are discussing a thing likefemale foeticide. This term in itself envelopes myriads of meanings, it smacksof the fact that (a) a girl is killed before she is born; (b) that sex of a foetus isdetermined to be that of a female; (c) it acknowledges that there is technologyprivy to this heinous crime; (d) there are doctors involved in first determiningthe sex of the baby, then carrying out abortion; and (e) there is crime involvedin violating not one but many laws: the Pre Natal Diagnostic Techniques(Regulation and Prevention of Misuse) 1994 Act, the Section 307 IPC (ofattempt to murder) and along with crime of abetment of murder etc. THESupreme Court’s directive to the government to implement the provisions ofthe Pre-Natal Diagnostic Techniques (Regulation and Prevention of Misuse)Act banning sex determination tests and sex selection to prevent female foeticideis timely. The court has been closely monitoring the implementation of its variousorders passed since May, 2001, regarding the ban on the use of ultrasoundscanners for conducting such tests. Subsequently, it had sought status reportsfrom all states and Union Territories. It had ordered compulsory registration ofall diagnostic centres across the country. There was impasse in Parliamentover the Bill on sex determination tests. The Indian Radiologists’ Associationwanted a clear distinction between clinics, which were engaged in diagnosisfor gynaecological purposes, and those for non-gynaecological purposes suchas kidney and liver problems. Parliament finally passed the Bill. However,doubts are bound to be raised on the effectiveness of the legislation as theissue mainly relates to people’s attitudes and preferences. The desire for a

Research Journal of Social and Li fe Sciences, ISSN 0973-3914, Vol .-XIV- II, Year-07, June-201382
son, for instance, is deep-rooted in both rural and urban areas. The problem ofdowry and the choice of a son for social security have also contributed to themalady. However, these have led to serious gender discrimination and adversedemographic implications in many states. For instance, according to an estimate,parts of Haryana have witnessed a dip in sex ratio - 618 girls for 1,000 boys.On the whole, while the national sex ratio is 933 per 1,000 men, in Haryana,Punjab, Chandigarh and Delhi, it is below 900. This shows that the menacehas reached alarming proportions even in urban areas. prohibits determinationand disclosure of the sex of foetus. It also prohibits any advertisements relatingto pre-natal determination of sex. Following the apex court’s orders earlier,appropriate authorities with powers of civil court have been appointed. Thesewere empowered to prosecute the clinics and the doctors if they used ultrasoundtechnique for sex determination. A committee has also been constituted at thenational level to monitor the enforcement of the Act through field visits. Howeverwelcome these provisions are, legislation alone will not help check femalefoeticide. What is of utmost importance is a change in the people’s attitude.The preference for a son must go if the larger problem of female foeticide is tobe tackled. It speaks of a whole system gone corrupt, a whole society involvedin conspiracy against women, against destruction of half the population ofsociety, at the hands of monstrous practices becoming more and more rampantin a society fast losing its secular, social, and humanistic fabric. In today’smaterialistic world a woman is fast being relegated to the rank of a commodityand marriage has become more of a business alliance than a sacred bondbetween two people. The Act prohibits determination and disclosure of thesex of foetus. It also prohibits any advertisements relating to pre-nataldetermination of sex. Following the apex court’s orders earlier, appropriateauthorities with powers of civil court have been appointed. These wereempowered to prosecute the clinics and the doctors if they used ultrasoundtechnique for sex determination. A committee has also been constituted at thenational level to monitor the enforcement of the Act through field visits. Howeverwelcome these provisions are, legislation alone will not help check femalefoeticide. What is of utmost importance is a change in the people’s attitude.The preference for a son must go if the larger problem of female foeticide is tobe tackled. It speaks of a whole system gone corrupt, a whole society involvedin conspiracy against women, against destruction of half the population ofsociety, at the hands of monstrous practices becoming more and more rampantin a society fast losing its secular, social, and humanistic fabric. In today’smaterialistic world a woman is fast being relegated to the rank of a commodityand marriage has become more of a business alliance than a sacred bondbetween two people.
Amniocentesis first started in India in 1974 as a part of a sample surveyconducted at the All India Institute of Medial Sciences (AIIMS), New Delhi,

Research Journal of Social and Li fe Sciences, ISSN 0973-3914, Vol .-XIV- II, Year-07, June-2013 83
to detect foetal abnormalities. These tests were later stopped by the IndianCouncil of Medical Research (ICMR), but their value had leaked out by thenand 1979 saw the first sex determination clinic opening in Amritsar, Punjab.Even though women organizations across the country took up cudgels to put astop to this new menace, but were helpless because of the Medical Terminationof Pregnancy Act. This is because the amniocentesis test was claimed to beused for detection of foetal abnormalities, which were permitted by the MTPAct. According to the MTP Act, if any abnormality is detected between 12 to18 weeks of gestational period in the foetus, an abortion can be legally carriedout up to 20 weeks of pregnancy. In the absence of any law, all that thegovernment could do was to issue circulars prior to 1985, banning the misuseof medical technology for sex determination in all government institutions. This,however, led to the mushrooming of private clinics all over the country. In1986, the Forum Against Sex Determination and Sex Pre-selection (FASDSP),a social action group in Mumbai, initiated a campaign. Succumbing to publicpressure, the Maharashtra government enacted the Maharashtra Regulationof Pre-Natal Diagnostic Techniques Act1988, the first anti sex determinationdrive in the country. This was followed by a similar Act being introduced inPunjab in May 1994. Amniocentesis first started in India in 1974 as a part of asample survey conducted at the All India Institute of Medial Sciences (AIIMS),New Delhi, to detect foetal abnormalities. These tests were later stopped bythe Indian Council of Medical Research (ICMR), but their value had leakedout by then and 1979 saw the first sex determination clinic opening in Amritsar,Punjab. Even though women organizations across the country took up cudgelsto put a stop to this new menace, but were helpless because of the MedicalTermination of Pregnancy Act. This is because the amniocentesis test wasclaimed to be used for detection of foetal abnormalities, which were permittedby the MTP Act. According to the MTP Act, if any abnormality is detectedbetween 12 to 18 weeks of gestational period in the foetus, an abortion can belegally carried out up to 20 weeks of pregnancy. In the absence of any law, allthat the government could do was to issue circulars prior to 1985, banning themisuse of medical technology for sex determination in all government institutions.This, however, led to the mushrooming of private clinics all over the country.In 1986, the Forum Against Sex Determination and Sex Pre-selection(FASDSP), a social action group in Mumbai, initiated a campaign. Succumbingto public pressure, the Maharashtra government enacted the MaharashtraRegulation of Pre-Natal Diagnostic Techniques Act1988, the first anti sexdetermination drive in the country. This was followed by a similar Act beingintroduced in Punjab in May 1994.
Both these were however repealed by the enactment of a centrallegislation, the Pre-Natal Diagnostic Techniques (Regulation and Preventionof Misuse) Act, 28 September1994, which banned sex determination tests all
Research Journal of Social and Li fe Sciences, ISSN 0973-3914, Vol .-XIV- II, Year-07, June-201384
over the country. This Act carries a three-year imprisonment and Rs10, 000fine for offenders. The implementation of this act initially faced problems asmonitoring agencies had to be identified at all levels. It was therefore only in1997 when the responsibility was delegated, that actual implementation of theact began. There is still social complacency among all sections of society,which needs to be addressed. Since the advent of ultrasound and detectiontechnique for sex-determination 10 million female foetuses have been abortedin India, according to a study conducted recently in India, the first systematicstudy on female foeticide by an Indo-Canadian team. A shocking pictureemerges-every year, about 50,000 unborn girls-one in every 25-are abortedand as a result the number of girls has actually gone down drastically in India.In 1997 UNPFA report “India towards Population and Development Goals”,estimates that 48 million women were ‘missing’ from India’s population. Thereport states “If the sex ratio of 1036 females per 1000 males observed insome states of Kerala in 1991 had prevailed in the whole country, the numberof would be 455 million instead of the 407 million (in the 1991 census). Thus,there is a case of between 32 to 48 million missing females in the Indiansociety as of 1991 that needs to be explained.
“It is very sad that in our society, the girl child is being killed even beforebeing born. This is a shame on our society,” Singh said addressing the nationfrom the Red Fort on the 63rd Independence Day. “As soon as possible wehave to remove this blot. Our progress will be incomplete till women becomeequal partners in the growth,” he said. Asserting that the government wascommitted towards providing 33 per cent reservation in the Parliament, Singhsaid, “We are trying to make a law through which women will be given 50 percent reservation in rural and local bodies so that they get equal representation”.The Prime Minister also announced the launch of a National Female LiteracyMission with an aim to reduce female illiteracy by half. He said special carewould be taken of needs of women and children and added that the Governmenthas decided to extend the benefit of ICDS to every child below the age of sixyears by March.======================References-1. Sabu M. George and Ranbir S., “Female Foeticide in Rural Haryana,” Dahiya
Economic and Political Weekly, Vol. 33, No. 32 (Aug. 8-14, 1998), pp. 2191-2198http://www.jstor.org/stable/4407077
2. “UNICEF India”. UNICEF.3. Arnold, Fred, Kishor, Sunita, & Roy, T. K. (2002). “Sex-Selective Abortions in
India”. Population and Development Review 28 (4): 759–785. doi:10.1111/j.17284457.2002.00759.x. JSTOR 3092788.
4. http://news.bbc.co.uk/1/hi/world/south_asia/4592890.stm5. The Pre-conception and Prenatal Diagnostic Techniques (Prohibition of Sex
Selection) Act, 1994: Answers to Frequently Asked Questions. A Handbook

Research Journal of Social and Li fe Sciences, ISSN 0973-3914, Vol .-XIV- II, Year-07, June-2013 85
for the Public6. Dube L (1983) Misadventures in amniocentesis. Economic and Political Weekly
40 (2): 279-80.7. Kollor T M (1990) Female infanticide: A Psychological analysis. Grass Roots
Action, Special issue on Girl child April 3, and pp 3.8. Kumari R (1995) Rural female adolescence: Indian scenario. Social Change 25
(2): 177-88.9. Mane P N (1991) Socialization of Hindu women in their childhood: An analysis
of Literature. The Journal of Family Welfare 52 (1): 81-96.10. Puri N (1998) The girl child in India. The Journal of Family Welfare 44 (3): 1-8.11. Rai U (1992) Female infanticide rampant in Salem. Indian Express, July 4. Pp. 412. Srivastava R D (2000) Girls are second-class citizens everywhere. The Times of
India, January 17: 3.13. Yadav S and Badari V S (1999) Gender Preference and Anxiety of Pregnant
Women. The Indian Journal of Social Work 60 (4): 538-51.14. The Tribune, Chandigarh 2003/09/1215. Manjeet Rathe,”Eradicate Scourge of Female Foeticide”,People’s Democracy,Vol
XXV,No 39,September 3016. Manmeet Kaur,”Female Foeticide:A Sociological Perspective”, The Journal of
Family Welfare,Vol 39(1),March 199317. Sangeeta Cheetu,”Growing Menace of Female Foeticide in Indai”,Indian Socio-
Legal Journal,Vol XVII (1 and 2),199118. Pre-natal Diagnostics Techniques (Regulation and Prevention of Misuse) Act
1994.19. The Pre-birth Elimination of Females in India, Ending the Practice: Changing
the Mindset, A National Advocacy Strategy Draft, June 17,2002.20. Gautam Chikermane,”To Save the Girl Child Invest” Indian Express, March
30,2006.21. Pamela Philipose,”Women versus Girls”, Indian Express, April 5, 2006

Research Journal of Social and Life SciencesISSN 0973-3914, Vol.-XIV- II, Year-07, June-2013
Social Problems in Aged Rural Male and Female
* Neha Sharma**Shireen Sharma, ***Urmila Sharma
==========================================================Abstract- As we know in all societies, families provide the majority supportfor older people who require help. However, with development, the practiceof co-residency among several generations has started to decline. Weare facing the challenges of providing social protection for older peoplewho are unable to earn a living and are alone and vulnerable. In oursociety, older people who need assistance tend to rely on family supportand personal savings. Older people who live in rural areas with fewersupport services available need special attention in this regard.Urbanization and the migration of younger people in search of jobs mayleave older people isolated in rural areas with little means of supportand little or no access to health and social services. Safe adequate housingis especially important for the wellbeing of older adults. Location,including proximity to family members' services and transportation canmean the difference between positive social interaction and isolation.Statistical analysis of 75 aged male and 75 aged female from rural areasof Rewa District reveals that 41.33% of aged male fall in the category ofhigh social problem and 12.6% fall in the category of very high socialproblems. Compared to this 10.67% of aged female fall in the categoryof high social problem and 17.33% fall in the category of very highsocial problems.==========================================================
===========================* Research Scholar** P.G. Scholar, Social and Preventive Medicine, Index Medical College, Indore*** Professor of Home Science, Government Girls' College, Rewa (M.P.)
Introduction- Rural can be defined in many ways, such as by populationdensity, by geographic location basic civic amenities. Due to large number ofchoices in the definition parties may often disagree with one another on whichdefinition to use. Social problem with advancing age, most people sufferincreasing social loss or social or social disengagement - a process of mutualwithdrawal of the aged form the social environment. Social disengagement as‘Biren’ has explained, involved four elements of “load shedding”, lessinvolvement with other people, a reduction in the variety of social roles played,

Research Journal of Social and Li fe Sciences, ISSN 0973-3914, Vol .-XIV- II, Year-07, June-2013 87
a greater use of mental ability, and less participation in physical activity.Retirement from active work does not simply mean loss of income; it alsomeans loss of contact. The aged person is now socially cut off and is separatedfrom the hitherto held network of occupational relationships. Unemploymentand enforced retirement are dreaded because they alter ones ties in society.As one grows older, one loses loved ones in death, and this is a painful loss.One also needs to accept the eventual death of oneself. According to“ERICKSON”, the crisis that older adults go through is “integrity versusdespair” integrity here means the capacity to accept ones past history and toface death without great fear. The negative way of resolving this stage of lifeis through what is called despair here.The person get’s frustrated and discouraged about the past and the presentand may seek death as way of ending a miserable existence or else dread itand live a very unhappy life in bitterness. The paper discusses social problemsfaced by rural aged males and females.Data Collection and Methods- To determine degree of social problems 75aged males and 75 aged females were randomly selected from the rural regionscoming under the Gram Panchayat of Rewa District. The region were Godhar,Ramkui, Karahiya, Babupur, Khairi, Nai Basti, Khobar, Chorhata andPaipakhara.Procedure adopted in the study- After studying the earlier related literatureand experts opinion, a questionnaire related to old age social problems of rural(Male V/s Female) areas was prepared. The data were collected individually.Questionnaire was thoroughly explained to each respondent. Then they wereasked to give their responses on the questionnaire as quickly as possible. Thequestionnaire (in Hindi) given to each responded is appended in the late part ofthis paper. (Appendix-I) In the study coping strategies were also included inthe above self made questionnaire. The Social Problem has 14 questions outof which question no. 4,10,12 and 13 were selected. 1 marks was allotted forevery no answer in these questions. For the remaining questions 1 mark wasgiven for each of the yes response.Result and Conclusion- The distribution of the subjects with regard to therural (Male v/s Female) of the subjects under different categories of the degree/level of Social Problems of Aged.
Sr. No.
Degree/Level of Social Problems
Rural (n=150) Male n=75
% Female n=75
%
1. 0-2 (Very low) 01 1.34 15 20.00 2. 3-5 (low) 12 16.00 16 21.33 3. 6-8 (Moderate) 22 29.33 23 30.67 4. 9-11(High) 31 41.33 08 10.67 5. 12-14 (Very High) 09 12.00 13 17.33
Total - 75 100.00 75 100.00

Research Journal of Social and Li fe Sciences, ISSN 0973-3914, Vol .-XIV- II, Year-07, June-201388
1 .3 4
20 .00
16 .00
21 .33
29 .3330 .6 7
4 1.3 3
10. 67 12 .00
1 7.3 3
0.00
5.00
1 0.00
1 5.00
2 0.00
2 5.00
3 0.00
3 5.00
4 0.00
4 5.00
Pe
rce
nta
ge
of
Cas
es
0 -2 (V ery Low ) 3 -5 (L ow ) 6-8 (Moderate) 9 -11 (High) 12 -14 (V ery High)
Deg ree/L e v el of S ocia l P roblems
Male
F ema le
The data shows that the percentage of Rural Old Aged Males facing high(41.33%) and very high (12.00%) were more than female counterparts facinghigh Social problems (10.67%) and very high degree of Social problems(17.33%). It shows that with regard to the social problems of Old age RuralMale were found to have greater degrees of problems than their Femalecounterparts.Thus, it can be concluded from the study that the social problemwas found more prevalent in Rural Aged Male than in Females. It shows thatthe males face higher degree of social problems whereas the females facecomparatively less social problems.======================References-1. Antonucci Toni (1974) on the relationship between values and adjustment in
old man. International Journal of Aging and Human Development Vol. 5 No.12. Boskin, M.J. (1977) Social Security and retirement decisions. Economic Inquiry
15 (1) 1-25.3. Broadhead W. Etal (1983) the epidemiologic evidence of relationship between
social support and health am. jr. of 117, 521-53.4. Chatfield, W (1974) "Economical and Sociological factors influencing life
satisfaction of the aged "Journal of Gerontology, 32 (4) 593-95.5. Crawford, V.P. and Hilien, D.M. (1981) Social security and retirement decision.
Quarterly Journal of Economics 96(3) : 505-529.6. Kimmel, D.C., (1980). Adulthood and aging. John Wiley and Sons : New York,
P.No. 1-186.7. Kishore S., Garg B.S. (1997) Socio-medical problems of aged population in rural
area of Wardha Maharashtra. Indian Journal of Public Health, 41 (2) 43-48.8. Neuganten, B.L. (1973) : "Pattern of Aging : Past, Present and Future." Social
service review : Quarterly Journal (Chicago : Univ. of Chicago) Vol.-4, P.572.9. Singh, C.P. (2005) Socio-economic status and Health conditions of landless
Rural Aged in Haryana in Help Age India - Research & Development Journal,Vol. 11, No.,-1.
10. Varma, Sunil K. (2008) working and non working rural and urban elderly:Subjective well -being and quality of life. Indian journal of Gerontology 22(1):107-118.

Research Journal of Social and Life SciencesISSN 0973-3914, Vol.-XIV- II, Year-07, June-2013
Geo- Strategic Location of India in South Asia andIts Presence in SAARC
*Monika Kannan==========================================================Abstract- The present political environment in South Asia moves aroundIndian ocean, 'The life line of this region' where countries like Pakistan,Bangladesh, Iran, Maldives, Indonesia, Malaysia etc are strategicallydependent on the Ocean for their resources, fuel, transport, market etc.The SAARC territory has been gradually shaping up in this region toaccelerate economic progress and maintain economic stability here. TheSAARC nations- Bangladesh, Bhutan, India, the Maldives, Nepal,Pakistan, Sri Lanka and Afghanistan are dependent on ocean too as itconnects the western world to the eastern via Suez Canal. The Indiansub-continent, is characterized by great diversity in its physical, cultural,social and political arenas being an active member of the organizationand has a very important geo-strategic location in the ocean too. TheSAARC nations suffer from international and internal conflicts and are akey venue for international piracy. Though India has several trade pactswith Maldives, Nepal, Bhutan and Sri Lanka, similar trade agreementswith Pakistan and Bangladesh have been stalled due to political andeconomic concerns on both sides. In 1993, SAARC countries signed anagreement to gradually lower tariffs within the region devising the SouthAsia Free Trade Agreement which created a framework for theestablishment of a free trade area covering 1.6 billion people. The FTAs(Free Trade Agreements) signed between India- Iran, India-Dijibouti,India- Mauritius and others indicate the recent efforts on India's part togradually prove its presence in the region.==========================================================
===========================* Sophia Girls College Ajmer, Rajasthan
The Study Region- The Indian Ocean is the third largest of the world’soceanic divisions, covering about 20% of the earth’s water surface. as shownin Fig 1 below . It is bounded on the north by Asia (including the Indiansubcontinent, after which it is named); on the west by Africa; on the east byIndo-China, the Sunda Islands, and Australia; and on the south by the SouthernOcean (or, traditionally, by Antarctica).

Research Journal of Social and Li fe Sciences, ISSN 0973-3914, Vol .-XIV- II, Year-07, June-201390
0
10
20
30
40
50
60
70
Area covered in millions
P aci f i c O At l ant ic O I ndi an O Ant a rct ic O Arct ic O
Fig:1 Oceans of the worldIndian Ocean is delineated from the Atlantic Ocean by the 20° east
meridian running south from Cape Agulhas, and from the Pacific by the 147°east meridian. The northernmost extent of the Indian Ocean is approximately30° north latitude in the Persian Gulf and thus has asymmetric ocean circulation.This ocean is nearly 10,000 kms wide at the southern tips of Africa andAustralia; its area is 73,556,000 square kms, including the Red Sea and thePersian Gulf.Economic Importance- There is increasing realization that Indian ocean hasan important role to play in SAARC territory and the entire IOR (Indian oceanregion) and our living in various ways.• Living resources like fisheries, coral reefs and the like• Non-living resources like minerals and hydrocarbons• The territorial sea provides offshore oil wealth• Ocean is a gateway to many nuclear weapons to and fro the ocean

Research Journal of Social and Li fe Sciences, ISSN 0973-3914, Vol .-XIV- II, Year-07, June-2013 91
Map 1 : Map of Indian Ocean• Harmful and toxic chemicals are also transported via sea which at time
causes destruction due to ship wrecks and oil spillage ruining the marineand coastal life.
• Energy potentials like tides, waves, and thermal energy conversion.• The role of the oceans in climate regulation and temperature control.
The Phenomenon of monsoon as witnessed in India and neighboringcountries is the contribution of the seas.
• Oceans provide a means of transport that is much cheaper and convenientthan other forms of transport.
• Development of coastal and island regions that derive their means oflivelihood from the oceans.
The Major Threat Areas-Figure : 2 Is Diego Garcia a threat to Indian Ocean?
0102030405060
OPINION OF SURVEYED PERSONS
VERYTRUE
POSSIBLE NEVER
VIEWSFears of a naval vacuum in the Indian Ocean has led to the increase of
foreign navies in the IOR. The Russian Navy started showing its flag in theIndian Ocean, partly to fill the naval vacuum, partly to counter the AmericanNavy and partly to demonstrate to the littoral states that the Russian Navywas a force to contend with. In 2006, about 40 British and 1,000 U.S. militarypersonnel, and 2,400 support workers of various nationalities (primarily Filipinoand Sri Lankan) reside there. Just to mark the fact, the ICBMs deployed herecan destroy our national capital New Delhi in 8 minutes any moment.Malacca Strait- It’s the major link between Europe, Africa, South West Asiaand South Asia to South East Asia, China and Japan. There is continuouspassage of goods and commodities including oil vessels, drugs, nuclear weapons,security sensitive items etc to and fro. There has been hardly any restrictionover this passage. As it’s the shortest route between the above mentionedcountries, problem of traffic congestion persists here. SAARC will have toextend the present properties of SAFTA, from free trade amongst South Asiannations to the maintenance of peace and security in this region.

Research Journal of Social and Li fe Sciences, ISSN 0973-3914, Vol .-XIV- II, Year-07, June-201392
Discussion and Analysis- Threats are no less in the region, these are a fewto be mentioned here. What is required, is a strong and prominent role to beplayed by an organization towards beniffiting and uniting the entire region.Thefollowing results reveal that there are various geopolitical limitations in SouthAsia with reference to Indian ocean region. The SAARC Territory includesBangladesh, Bhutan, India, the Maldives, Nepal, Pakistan, and Sri Lanka andAfghanistan which includes the major countries of South Asia.
Table 1: Descriptive statistics to measure the ImportantGeopolitical Factors in Indian ocean
N Mean Standard Deviation
Coefficient
Limitation of India in the present Geopolitics
100 3.43 3.22 0.98
Whoever control Indian Ocean, Controls the passage between the Atlantic and pacific ocean
100 4.15 4.1 0.98
These results emphasis the fact SAARC has to play in this region. The
following suggestions should be taken under consideration,• A strong RIM Association should be formed in the IOR, which decides
upon the territorial laws and EEZ for each South Asian nation.• Effective security systems should be planned and implemented in the
region, to protect the bordering countries from foreign attacks , suspectsand even their unsafe activities going on in the sea.
• Strict laws to be framed against movement of nuclear arms and weaponsto and fro the Malacca Strait. Permissions and checking should be seekedfrom the governing bodies of the organization. Presently South Asia hasno control over these passages which is causing a feeling of discomfortfor all of us.
• South Asian Free Trade Area-This Agreement creates a framework forthe creation of a free trade area covering 1.6 billion people in India,Pakistan, Nepal, Sri Lanka, Bangladesh, Bhutan and the Maldives withzero customs duty on the trade of practically all products in the regionby end 2016. SAFTA should expand its scope to even taking actionsagainst naval piracy, oil spillage, fisherman killing and many more issuesin the Indian ocean region.
Conclusion- Maritime Affairs and Fisheries Minister Fadel Muhammad saidin his opening remark that the government saw the Atlantic Ocean as the past,the Pacific Ocean as today and the Indian Ocean as the future in its developmentpolicy. My study proves that ‘Whoever controls the Indian ocean will controlthe passage between Pacific and Atlantic oceans in the 21st century’, becauseof the growing importance of Indian ocean as shown in the figure above.

Research Journal of Social and Li fe Sciences, ISSN 0973-3914, Vol .-XIV- II, Year-07, June-2013 93
South Asia being the bordering region will have to initiate in developing theregion. SAARC should expand its territory and highlight the importance of thisregion.======================References-1. Anand, R. (1983). Origin and development of the law of the sea. The Hague:
Kluwer Law International.2. uergenthal, T. & Murphy, S. (2007). Public international law in a nutshell, 4e.
NY: Thomson/West Group.3. Choudhury, T. (2006). Mitra's legal and commercial dictionary. UK: Eastern
Law House.4. Keyuan, Z. (2005). Law of the sea in East Asia. NY: Routledge.5. O'Connell, D. (1982/1984). The international law of the sea: Vol I and II. NY:
Oxford Univ. Press.6. Vallar, C. (2008). "Pirates and Privateers: A history of maritime piracy." URL at
http://www.cindyvallar.com/modernresources.html
ISSN 0975-4083
A Registered Reviewed Research JournalSix monthly Bi-lingual Journal (English/Hindi Editions)
Please address all Communications -Prof. Braj Gopal Shukla
Chief Editor Research Journal Social and Life Sciences
41/42, Raghuwans Sadan, Shantikunj, Bichhiya, Rewa 486 001 (M.P.) Phone - (07662) 255177, 9425186437
E-mail - [email protected] [email protected]
The Aims & Objectives-
Guidelines & Member Ship Fee
To provide a plateform for the publication of original unpublished Research Papers, Summary of Research Project, Thesis and Book review relating to all subjects of Social & Life Sciences and to promote interdisciplinary research work. Book Review can be published on receipt of two copies of concerned book.
-Authors/ Researchers can contact in the Registered Office given below-
Indexed & Listed at: Ulrich’s International Periodicals Directory ©, ProQuest, U.S.A. Title Id : 715204
Volume-IX, Coming in September, 2013

Research Journal of Social and Life SciencesISSN 0973-3914, Vol.-XIV- II, Year-07, June-2013
Anthropogenic Impact on North- West HimalayanRegion
* B. P. Singh** Gulzar Qadir Ganaie
==========================================================Abstract- "The impact of human activities on the bio-geophysical andsocio-economic environment of the north western Himalayan region ofIndia is analysed.Economic changes and population increase are creatinga threatening danger to the ecological conditions in the area.this articleprovides an analysis of environmental destruction scenario under varyingintensities of anthropogenic pressure”.==========================================================
===========================* Professor, Department of Geography, Government T. R. S. College Rewa (M.P.)** M.Phil Geography, Second Semester, Government T. R. S. College Rewa (M.P.)
Methodology- The paper is totally worked out on the secondary data. Mostefforts were made to collect recent data.Objectives- The main objectives are:-(a) To acess the anthropogenic impact geographically.(b) To describe the various human activities causing major problems in the
region.(c) To analyse the anthropogenic impact on various components of ecosystem
of the region.Introduction- The north-western Himalayan region of India comprises of aseries of ranges of greater, lesser and foot Himalayas such as Karakoram,Ladakh Zanskar ,Pirpanchal etc.This is the region of two northern states,jammu and Kashmir and Himachal Pradesh of India. The region is bestowedwith a huge resource of flora and fauna. Besides this the region is also a storehouse of various glaciers, rivers and wet lands among which, Baltoroo, Siachen,Nibra, Bispa (glaciers),Indus, satluj, Jehlum, shyok, Neelam, Chenab(rivers)and wular, Dal, Pangong, Tso,Tso Moriri (wet Lands),Which are famousthroughout the world. Mostly the region is well known for its scenic beauty, asit comprises some of the valleys like Kashmir, Neelam, Kashtiwar, Kull, Kinuralso.But the region has been cited as one of the nine hot spot bio-diversityregions named on 2nd Feb.2005,Which implies that it has not had the advantageof receiving the conversation attention. Particularly it is the man who has beenresponsible to a large extent for the environmental deterioration of the region.

Research Journal of Social and Li fe Sciences, ISSN 0973-3914, Vol .-XIV- II, Year-07, June-2013 95
As he strives for the industrialization, modernization and so called higher standardof living.Anthropogenic activities causing serious damage: Geo-dynamically activeand sensitive north – western Himalayan region of India is confronted with arange of problems of anthropogenic origin. The main man induced activitieswhich have caused a serious damage and threatened the equilibrium of theregion are stated as: Unplanned land use, cultivation on steep slopes, overgrazing, major engineering activities, over exploitation of village and communityforests, deforestation, shifting cultivation, monoculture in forests, mining andconstruction of roads and railway network.Impact on Topography: The above mentioned anthropogenic activities havecaused a serious destruction to the topography of the region. Deforestation ininaccessible areas and for employment of horticulture have increased thedesertification in the lesser and greater Himalayan region, as presently theseconditions are prevailing in the 41,500 sq.km. and are increasing. Roadconstruction and railway network have increased the rate of soil erosion andlandslides. The railway track example of Kashmir Valley is of keen interestthat it has created a great loss both to the mountains and the famous saffronKarewas of Kashmir. The lush green meadows, which were once inaccessible,are now covered in the market and recreational places due to tourism, pilgrimageand exploration, industrialization and mining.Impact on Flora and Fauna: The region is comprising of 20%-25% of theplant species of India, out of which 95% are becoming endangered. 10% ofthe forest cover in Himachal Pradesh has been decreased in last 15 years. InJ & K total forest cover in 2001 was 24324 sq.kms and at present (2011) theforest cover is only 20230 sq.Kms, which suggests that there is a decrease of4094 sq.Kms only in 10 years. Similarly the wild life of the region is also ingreat threat. The world famous species like Musk Deer, Antelope, Ibex, Baharaland Red Deer are decreasing in number and are now called the endemicspecies of the region. Mostly Musk deer and Snow Leopard are now underthe threat partially due to changes in their habitat.
Total Decrease in forest area in J & K state (2001-2011)Year Total Forest Area
Square Kilometer Decrease
Square Kilometer 2001 24324 ---- 2003 24214 110 2005 23360 854 2007 22144 1216 2009 20441 1703 2011 20230 211
Source: Statistical digest dept.of forest J & K
Impact on glaciers and wet lands- Due to anthropogenic activities the average

Research Journal of Social and Li fe Sciences, ISSN 0973-3914, Vol .-XIV- II, Year-07, June-201396
temperature increase in the region has been recorded since 1970.67% of theglaciers in the region are retreating at a startling rate mainly attributed to climatechange. The glacial area has decreased from 173 sq.Kms to 140 sq.Kmsduring 2001-2004, only in baspa basin Kinnour district of Himachal Pradesh.The average temp. recorded in Kinnour from 1991-94 was 19.8°c, 1996-2000was 20.10 and 2001-2004 was 21.6°c . The increase is much higher during thelast 5 years. The Baltroo glacier in Baltistan is moving about 6 feet per day.Similar is case with Parachik, Kalhoi, Nobra and Hispur glaciers. The impactof anthropogenic activities is quite adverse on the wet lands. Experts havepredicted that the wet lands of the region will vanish in less than eight years ifthey continue to neglect. Wular Lake was once considered as the largest freshwater lake in the Asia with an area of 204 sq. Km. about 100 years ago, whichis now estimated only to 24 sq.kms, similarly the famous dal lake is encroachingat a very fast rate. Many other wetlands like Anchar, Nigeen etc. are veryclose to vanish from the region.
Overview of decrease in area of major glaciers of NWHimalayas in 30 years
Glacier Location 1980 sq,kms 2010 sq.kms Kalhoi Kashmir 4.25 2.63 Baspa Kinnour 260 140
Siachen Ladakh 300 148 Baltroo Baltistan 156 93 Hispur Baltistan 135 90
Source: Dept. of geology and geo-physics, University of Kashmir
Conclusion- Taking an overview of the fact it may be concluded that manhimself is destroying his environment for his vested interest and greed and thatwe may have to face an ecological crises of a vast magnitude, making humansurvival impossible on the earth, If this rate of degradation continues. Althoughastoundingly reaching natural wealth, the north western Himalayan region ofIndia has lost 70 % of its original Habitat and its flora and fauna are in greatdanger. Several species have been probably lost to the world for ever andpopulation of several others is rapidly reducing threatened by anthropoenicimpacts.======================References-1. Sinha,A.: "A study of snow and glaciers oh Himalayas". A research Paper
published by ISRO Hyderabad.2. Ahmad Afroz, Rawat J.S. & Rai S.C, " An analysis of the Himalayan
environment", Springlink publishers Chandigarh.3. Shaheen h., Qureshi R. l. & Khan Zabta, "Structural diversity, vegetational
dynamics and anthropogenic impact on lesser Himalayan forests of Baghdistrict Kashmir " published by department of plant sciences Q.I.A. UniversityPak.

Research Journal of Social and Li fe Sciences, ISSN 0973-3914, Vol .-XIV- II, Year-07, June-2013 97
4. Mason K. "Indus Floods and Shyok glaciers" Himalayan journal 1929.5. Romshu Shakeel," An overview of Himalayan glaciers J & K glaciers", Dept. of
geology and geo-physics ,University of Kashmir.6. CEEH, " Geography of Himachal Pradesh" CEEH publishers Shimla.7. Dept. of forests ," Digest of Statistics-2001,2005,2010".8. Hussain Majid, " Geography of J & K " Rawat publications, Jaipur.
Please address all Communications -Prof. Braj Gopal Shukla
Chief Editor Research Journal Social and Life Sciences
41/42, Raghuwans Sadan, Shantikunj, Bichhiya, Rewa 486 001 (M.P.) Phone - (07662) 255177, 9425186437
E-mail - [email protected] [email protected]
The Aims & Objectives-
Guidelines & Member Ship Fee
To provide a plateform for the publication of original unpublished Research Papers, Summary of Research Project, Thesis and Book review relating to all subjects of Social & Life Sciences and to promote interdisciplinary research work. Book Review can be published on receipt of two copies of concerned book.
-Authors/ Researchers can contact in the Registered Office given below-
A Registered Reviewed Research JournalSix monthly Bi-lingual Journal (English/Hindi Editions)
Indexed & Listed at: Ulrich’s International Periodicals Directory ©, ProQuest, U.S.A. Title Id : 715205

Research Journal of Social and Life SciencesISSN 0973-3914, Vol.-XIV- II, Year-07, June-2013
===========================* Dr. R. B. Government Navin Girls College, Raipur (C.G.)** Dr. R. B. Government Navin Girls College, Raipur (C.G.)
The e-waste Problem and Recycling
* Anita Sarin**Dipti Jha
==========================================================Abstract- Institutional infrastructures, including e-waste collection,transportation, treatment, storage, recovery and disposal, need to beestablished at national and /or regional levels for the environmentallysound management of e-wastes. Model facilities employingenvironmentally sound technologies and methods for recycling andrecovery are to be established. Criteria are to be developed for recoveryand disposal of e- Wastes policy level interventions should includedevelopment of e-waste regulation, control of import and export of e-wastes and facilities in development of infrastructure. An effective takeback program providing incentives for producers to design products thatare less waste full. Contain fewer toxic components and are easier todisassemble, reuse and recycle may help in reducing wastes.==========================================================
Electronic waste, e-waste or waste electrical and electronic equipmentdescribes discarded electrical or electronic devices. The current practices ofe-waste management in India suffer from a number of drawbacks. Informalprocessing of electronic waste in developing countries may causes serioushealth and pollution problems though these countries are also most likely toreuse and repair electronics. “Electronic waste” may also be defined asdiscarded computers, office electronic equipment entertainment deviceelectronics, mobile phones, television sets and refrigerators. It is an emergingproblem as well as a business opportunity of in increasing significance, giventhe volumes of e-waste being generated and the content of both toxic andvaluable materials in them. The fraction including iron, copper, aluminum, goldand other metals in e-waste is over 60%. While plastics account for othermetals in e-waste is over 60%, while plastics account for about 30% and thehazardous pollutants comprise only about 2.70%. It is estimated that the totalnumber of obsolete Personal Computers emanating each year from businessand individual households in India will be around 1.38 million. According to areport of confederation of Indian industries the total waste generated by broken

Research Journal of Social and Li fe Sciences, ISSN 0973-3914, Vol .-XIV- II, Year-07, June-2013 99
down electronic and electrical equipment in India has been estimated to be1,46,000 tons per year. The low-income house holds use the PC for 5.94 Years,TV for 8.16 years and the mobile phones for 2.34 years while the upper incomeclass uses the PC for 3.21 years, TV for 5.13 years and mobile phones for1.63 years. The public awareness on e- wastes and the willingness of thepublic to pay for e-waste management as assessed during the study based onan organized questionnaire revealed that about 50% of the public are aware ofenvironment and health impacts of the electronic items. The use of computers,televisions and other electronics continues to grow. As demand increases andtechnology evolves older electronics are replaced and the volume of electronicwaste that is generated increases.Impacts of e-wastes- Electronic wastes can cause widespread environmentaldamage due to the use of toxic materials in the manufacture of electronicgoods. Hazardous materials such as lead, Mercury and hexavalent chromiumin one form or the other are present in such wastes primarily consisting ofcapacitors, Batteries, liquid crystal displays, cartridges from photocopyingmachines and electrolytes. All electronic equipments contain printed circuitboards which are hazardous because of their content of lead, brominates flameretard us and antimony oxide, which is also present as a flame retardant. Thecadmium from one mobile phone battery is enough to pollute 600m3 of water.It is a livelihood for unorganized recyclers and due to lack of awareness; theyare risking their health and the environment as well. The valuable fractions areprocessed to directly reusable components and to secondary raw materials ina variety of refining and conditioning processes. No sophisticated machineryor personal protective equipment is used for the extraction of different materialsWaste components which does not have any resale or reuse value are openlyburnt or disposed off in open dumps. Pollution problems associated with suchbackyard smelting using crude processes are resulting in fugitive emissionsand slag containing heavy metals or health concern. They use strong acids toretrieve precious metals such as gold. Working in poorly ventilated enclosedareas without masks and technical expertise results in exposure to dangerousand slow poisoning chemicals benefits of recycling . Recycling raw materialsfrom end –of-life electronics is the most effective solution to the growing e-waste problem. Most electronic devices contain a variety of materials, includingmetals that can be recovered for future uses. By dismantling and providingreuse possibilities, intact natural resources are conserved and air and waterpollution caused by hazardous disposal is avoided. Additionally, recycling reducesthe amount of greenhouse gas emissions caused by manufacturing of newproducts. Benefits of recycling are extended when responsible recyclingmethods are used. Environmentally sound recycling of e-waste are requiressophisticated technology and processes, which are not only very expensive,but also need specific skills and training for the operation proper recycling of

Research Journal of Social and Li fe Sciences, ISSN 0973-3914, Vol .-XIV- II, Year-07, June-2013100
complex materials requires the expertise to recognize or determine the presenceof hazardous or potentially hazardous constituents as well as desirableconstituents and then be able to apply the company’s capabilities and processsystems to properly recycle both of these streams. Guidelines are to bedeveloped for environmentally sound recycling of e- waste. Private sector iscoming forward to invest in the e- waste projects once they are sure of thereturns. The future of e-waste management depends not only on theeffectiveness of local government, the operator of recycling services, but alsoon the attitude of citizens, and on the key role of manufactures and bulkconsumers to shape and develop community participation. Lack of civic senseand awareness among city residents will be a major hurdle to keep e-wasteout of municipal waste stream. Consumers to be educated to buy only necessaryproducts that utilize some of the emerging technologies to be identified througheco-labeling. Awareness raising programmes and activities on issues relatedto the environmentally sound management (ESM), health and safety aspectsof e-waste in order to encourage better management practices should beimplemented for different target groups, Technical guidelines for the ESM ofe-waste should be developed as soon as possible.Conclusion- Reduce the consumption of products that ultimately become e-waste by maintaining older equipment or purchasing higher quality products.Reuse products by selling them or donating them to others, especially computereuse organizations extending their useful life and keeping them out of thewaste stream. Institutional infrastructures, including e-waste collection,transportation, treatment, storage, recovery and disposal, need to be establishedat national and /or regional levels for the environmentally sound managementof e-wastes. Model facilities employing environmentally sound technologiesand methods for recycling and recovery are to be established. Criteria are tobe developed for recovery and disposal of e- Wastes policy level interventionsshould include development of e-waste regulation, control of import and exportof e-wastes and facilities in development of infrastructure. An effective takeback program providing incentives for producers to design products that areless waste full. Contain fewer toxic components and are easier to disassemble,reuse and recycle may help in reducing wastes.
**

Research Journal of Social and Life SciencesISSN 0973-3914, Vol.-XIV- II, Year-07, June-2013
===========================***
Impact of Globalization and Devolution of poweron Local Communities: A case study of Dudhwa
National Park
* Sarika Shukla**Sugandha Shanker
==========================================================Abstract- Nurturing harmony among man and nature in a way that thevital needs of people are met sustainably without damaging the resourceis probably the biggest challenge humanity is facing in our time. Rapidlyrising human population and animal populations, industrialization,urbanization and globalization are posing serious danger to ecologyand environment in the form of over exploitation of natural resource.Therefore, need to conserve natural resources like forest and wildlifewas felt tremendously by the Indian governments. It made severalregulations and policy taking natural resource management undergovernment control.Keywords- Nurturing, Tradition, Paradigm Shift, Dudhwa, Perception==========================================================
===========================* Lecturer, I.T. P.G. College Lucknow (U.P.)** I.C.S.S.R. Research Fellow University of Lucknow (U.P.)
Natural resources management conventionally characterised by absolutecontrol of government agencies, lack local participation and complete restrictionover the use of resource by the community. The last two decades havewitnessed a paradigm shift in conservation and natural resource management(NRM) away from costly state-centred control towards approaches in whichlocal people play a much more active role (Shackleton etal 2002) profoundtransformations are occurring in this sphere in terms of who has access toand control over resources. Recently rights of local communities over naturalresources have been reinforced either through power-sharing agreements withthe state, increased legal access to natural resources or decentralization withinnational agencies.Understanding the impacts of these institutional changes isimportant both for government and other stakeholders not only for bettermanagement and conservation of the resource (Shyamsundar,2005) but alsofor the preservation of local culture and traditional knowledge. Consideringthe case of Dudhawa tiger reserve which was declared a national park 1861,since then it is under strict government controls. Later some national and

Research Journal of Social and Li fe Sciences, ISSN 0973-3914, Vol .-XIV- II, Year-07, June-2013102
international N.G.O like CEE, WWF and Keidanren Nature ConservationFund, Japan and educational institution like Bhatia vidhyapeeth haveconsiderable contribution in the area. These agencies facilitated the processof devolution which brought about changes in the local community by exposingthem to globalization.This lead to the slow and unidentified changes in thelifestyle of the local community transforming their local culture, dress, foodrituals and architecture. Which resulted in loss of their tribal identity?Introduction- Before the advent of the British rule in India, forest were ownedand managed by local communities. Forest management was taken over bycolonial rulers. They primarily viewed them as source of revenue or as sourcefor the supply of railway sleepers at nominal prices or wood for the ship buildingindustry of England. The management of forest was totally monopolised bystate forest department. This resulted in an unfortunate disjunction betweenpeople and forest. The contractor system was exploitative and driven by profit.Many forest areas were taken over for crop cultivation; illegal felling andencroachment also took place. The traditional rights of the community gotcontained, restricted and in some cases eliminated. (Dhar and Gupta,2008)This lead to degradation of forest and adverse relationships betweencommunity and administration emerged.
The last two decades have witnessed a paradigm shift in conservationand natural resource management (NRM) away from costly state-centredcontrol towards an approaches where local people play a much more activerole(Shackleton etal 2002). This happened because of the following reasons:• Limited effectiveness of the state in managing natural resources,
especially at the local level.• Inability to effectively enforce law and policies.• Lack of local participation during policy formation and undermined local
institutions that were managing the resources.• Lack of transparency and communication among various stake holders• Government agencies had difficulty in monitoring the use of extensive
forest or rangeland areas.• Inconsideration of local knowledge while planning this policy
All these lead to local and international resistance to strict protectedarea program and failure of state run conservation programs. Some socio-economic research, including ethnographic studies and models, found that localusers can have an advantage over government agents for several reasons.Local users often have intimate knowledge of the resource. This provided acomparative advantage over government agencies in monitoring resource useand rule compliance. Furthermore, because their livelihoods depend on theresource, local users are often assumed to have the greatest incentives tomaintain the resource base over time. With growing pressures to use resourcesmore efficiently, equitably, and sustainably, optimism that communities or user

Research Journal of Social and Li fe Sciences, ISSN 0973-3914, Vol .-XIV- II, Year-07, June-2013 103
groups may be able to manage the resources more effectively than governmentagencies forms the basis for many programs that attempt to create or recreatelocal common property management regimes (World Bank, 1996). Thesefactors generate interest in devolution which is defined by World BankEnvironmental Department as the transfer of rights and responsibilitiesto user groups at the local level. Devolution policies are consistent withthese trends because they transfer decision-making from government“outsiders” to users who are directly affected. Devolution opened channelsfor rural dwellers to communicate their priorities to government decision-makersand in some places improved community-government relations (in many sitessuspicion continued to exist, e.g. Zambia, Zimbabwe, India) Although thetheoretical advantages of user management have been convincing and theimpetus for devolution policies was strong but, the actual outcomes of devolutionprograms in various sectors and countries have been mixed. Both theapproaches, the government run programs and devolution based programshave their set off pit falls but in both case the local community was the effectedthe most. Initially it was thought that community development and providingalternative livelihood to the people and giving them power in the decision makingprocess can be a very effective tool for development but if we observe thecase of Dudhwa forest reserve we clearly see that these changes havecompletely transformed the local culture, traditions dress, food and identity ofthe tribal people.Therefore Dudhwa tiger reserve was taken as a baseline forthis research. It sets out a clear example of government run conservationprograms and devolution. Local community participation and how they havebeen benefited from the process both positively and negatively.Study area- Dudhwa forest reserve is selected as the study area ((Map 1)for this paper because it is the only National park in U.P. covering the maximumforest with considerable presence of Tharu tribe which is the only tribe ofU.P.,

Research Journal of Social and Li fe Sciences, ISSN 0973-3914, Vol .-XIV- II, Year-07, June-2013104
Geographical location- Dudhwa National park lies in the Keheri District ofUttar Pradesh. The Park lies between 28^18’N and 28^42’N latitudes and80^28’E and 80^57’E longitudes. The Dudhwa national park is spread overthe geographical area of 883.7390sq.km with Core 490.2919sq.km and Buffer190.0372sq.km (Map 2)
Objective of the study-• To study if devolution was taking place in time memorable• To investigate who were the stake holders in the process and what
were their roles• To analysis how and in what ways has the local community benefited
from the process• To evaluate the factors responsible for change in culture and traditions
of the local people.Methodology- This is an empirical study primary data was collected with thehelp of key informants from the field visit, focus group discussion carried outin the Tharu villages. Semi structured interviews were conducted withrepresentatives and officials of national and international N.G.O. andgovernment agencies.
Filed study, participant and non participant observation as well asSecondary data analysis of various working and non working papers in thefields form the basis of this research .(Plate I)Findings-Conservation history of the park- A small area known as the SonaripurSanctuary was demarked in 1958 for the conservation of the rare kind of deerin order to save the rest of the existent inhabitants. Afterwards, the area ofSonaripur Sanctuary was extended to 212 sq. km. and was renamed as theDudhwa National Park. The area of the park was further stretched over anarea of 614 sq. km. and was stated a National Park in 1977. Much later, after11 years, in 1988, Dudhwa National Park became a major part of the TigerProject. Later on, the full area of the Kishanpur Sanctuary was added tocreate the Dudhwa Tiger Reserve. About 150 years earlier, these forests had

Research Journal of Social and Li fe Sciences, ISSN 0973-3914, Vol .-XIV- II, Year-07, June-2013 105
been the habitation of rhinoceros. Along with a project on the swamp deers, arhinoceros project was also started in 1984.Major conservation projects in the park-• Conservation of the Swamp Deer or the largest types of Great IndianDeer were considerably waning in their numbers due to loss in their naturalhabitation. A small area known as the Sonaripur Sanctuary was demarked in1958 for the conservation of this rare kind of deer in order to save the rest ofthe existent inhabitants. Afterwards, the area of Sonaripur Sanctuary wasextended to 212 sq. km. and was renamed as the Dudhwa National Park• The area of the park was further stretched over an area of 614 sq. km.and was stated a National Park in 1977• Along with a project on the swamp deers, a rhinoceros project was alsostarted in 1984• The project “Community Driven Natural Resource Management forBiodiversity Conservation in Dudhwa Nation Park” was initiated by CEE withthe support of Keidanren Nature Conservation Fund, Japan in the year 2005.The overall objective of the project is to strengthen protected area managementby involving local communities to conserve biodiversity efficiently• During the field survey it was found that Dudhwa tiger reserve is understrict government control for a very long period of time. Lately some NGOand educational institutions have tried to bring in the process of devolution butcould not be implemented very successfully in the area. This happened becausethe government institutions have restricted the use of forest to the localcommunity and had provided them with alternative sources of livelihood underthe policy for the upliftment of schedule caste and schedule tribes. Thesepolicies have been successful in terms that pressures on the resources havebeen reduced but on the other hand it has lost the local culture traditions andtraditional knowledge of proper resource conservation .• Stake holder or actors in this process- Devolution does not takeplace in isolation. There are a number of institutional actors involved in naturalresource management: government bureaucracies, local government bodies,and the private sector, as well as the user groups. The structure of interactionsbetween these is important. Dick & Knox,( 1999) When the state retains alarge role in resource management, in conjunction with an expanded role forusers, it may be referred to as joint management or co-management. The jointco management started in the park very early when international agencieslike WWF introduced project tiger, project rhino etc and later agencies likeCentre for Environmental Education and Bhatia Vidayapeeth a researchuniversity introduced community based programs in the area. Slowlyinterweaving the process of devolution and co management techniques now acharacteristic of Dudhawa forest reserve involves a number of stake holders.• Government

Research Journal of Social and Li fe Sciences, ISSN 0973-3914, Vol .-XIV- II, Year-07, June-2013106
• National and international non-governmental organization• Local Community ( mainly Tharu tribes )• As it can be seen in the Figure I the Dudhwa tiger reserve shares a verystrong interaction with all the stake holders and also this process leads tocommunity benefits and natural resource management.
Indigenous people are on the threshold of the crisis in sustainabledevelopment. These communities are concrete examples of sustainablesocieties which historically evolved in diverse ecosystems. Today, they facethe challenges of extinction or survival in a globalised world. The impact ofglobalization is strongest on these populations and they have no voice, therefore,easily swept aside by the invisible hand of the market and its proponents.Pratheep, (2010).The field survey, interviews and interactions with various authorities and thetribal group present in the area revealed the facts that after Dudhwa wasdeclared a reserve forest and later national park there was strict governmentcontrol which is still present in core areas. People have limited rights in thecore area. However the buffer zone is more flexible because Tharu villagesare present in this zone. Limited excess to the forest products has been givento local people and efforts were made by the government agencies to providealternative mode of employment to them so that, their dependence on theforest for basic need of fuel, fodder and food is reduced.
The intervention of community based programs from various NGO andeducational ‘institution opened channels for communication between localcommunity specially the Tharu tribes and authorities. These agencies helpedthe local people to get better awareness about the rights, duties and latestschemes and policy. The process of devolution was clearly visible the mainemphasis was to reduce the pressure from the protected areas by making thecommunities more self dependent. Training programmes are organized regularly

Research Journal of Social and Li fe Sciences, ISSN 0973-3914, Vol .-XIV- II, Year-07, June-2013 107
on sustainable energy options and promotion of the tribal handicraft (plate 2).These programmes were done in partnership with government departmentsworking in the field of promotion of non-conventional energy appliances. SchoolEducation programme in Dudhwa was also initiated where CEE worked withselected cluster of schools. A teachers training programme was organized toinitiate the biodiversity conservation. (CEE, 2008)
All these activities over a period of time have helped in the developmentof the basic infrastructure, sanitations, hygiene and schooling etc in the tribalarea. In this process tribal people were exposed to globalization and newschemes were launched to provide them with alternative means of employment.This process of devolution brought with it globalization which slowly impactedevery sphere of tribal life. The following dimensions of tribal lifestyle weremainly affected from this change, language, dress, culture. Food, perception,education, rituals and ethnicity. During the field work and interviews we couldobserve that tribes/local communities appeared like city dwellers wearingnormal cloths speaking Hindi and some bits of English. This was somewhatunusual for us because the place was in remote forest area. We were expectingtribal communities to speak at least some bits of their native language but thatwas also missing completely.
Most seriously impacted was the attire. Not even a single young womenin all the five villages was dressed traditionally. In one village an old lady waswearing traditional Tharu dress but most females were dressed in modern daynight gown or Sari. When questioned about the traditional dress and jewelleryladies told us that the dress is only wore on special occasions and festivalsthey also showed us the photographs (Plate3).When we requested to see thedress we were told that now only few elderly ladies posses this dress.Thisclearly indicates lack of spur among young people about their traditional dress.During the conversation it was also reviled that the art of making this traditionalattire is disappearing very fast because the new generation does not like wearingit neither they have any interest and charm of learning how to make this attire.
When we questions about rituals, songs folk stories etc most respondentin all the villages replied that they no longer remember the traditional songsand ritual. Only few elderly ladies from the village Nighasan were able torecall bits and pieces of traditional songs. They have even forgotten about thetraditional rituals and have started practising new rituals like Holi, Diwali,Navrat etc which were introduced to them by television and family memberswho come back from the cities .When questioned about food most people toldus that they eat foods like dal chawal, fish, chicken and roti etc they werealso exposed to carbonated drinks (Fanta, coke) and packed foods .Initiallyno one could recall about traditional food most people said that they eatcommon food and eating and catching fish was one traditional activity performedby them . After long discussion one very elderly lady described about some

Research Journal of Social and Li fe Sciences, ISSN 0973-3914, Vol .-XIV- II, Year-07, June-2013108
specific kind of food called Anadi ka Chawal which has completely disappearedand no one in the younger generation has seen it. It is also not grown nowbecause it was very difficult to prepare and involves a lot of time and effort .Today’s generation is more exposed to foods like Maggi, Pepsi, coke, Fantaetc which is the result of globalization. This indicated how deep globalizationhas impacted these people’s culture and traditions. Another drastic changewas in the architecture of the area traditionally they used to build mud houseswith beautiful patters allowing air and light to pass through but this is very fastbeing replaced with modern day brick houses.(plates 3&4) The main factorwhich contributed to this transformation was that the females in the Tharucommunity have the responsibility of working in the field because of twosocial reasons firstly men have migrated to different cities in search of jobsand secondly men consume alcohol and other such stuff making them lessavailable for the muscular work .
This leaves the female with more responsibility and less time to learntraditional crafts . Some people may argue that this was the traditional set upand females were always the working force in Tharu. This is true to someextent but ,the presence of men helped them to take care of children andother household choirs leaving them with more time and energy however,now the absence of male members has left little time with them. Nevertheless,today the exposure to new sources and means of entertainment like television,mobile phones, radios etc and education facilities leaves little time with themto interact with elderly people and learn about their traditions, rituals, art andcraft. Secondly, they have been exposed to globalization through television,books and magazine. They feel their traditional dress is out of fashion and ifthey wear them they will not be accepted and will not be able to be part of themodern day globalized society tribal identity. Thirdly one thing which came tolight was that the young people who have gone out to cities for higher educationand jobs when came back home discouraged there family members to weartraditional dress or follow traditions. This also played a very important role in

Research Journal of Social and Li fe Sciences, ISSN 0973-3914, Vol .-XIV- II, Year-07, June-2013 109
changing traditional patterns.
Conclusion- Through this study it was seen that people, at the local levelhave benefited in terms of access to education, health services and alsomonetary incentives from the process of globalization and strict governmentcontrol . Which brough with it projects like project tiger , project rhino etc, anddevelopment of infrastructure and alternative livelihood options.However thishas lead to serious destruction of local culture and changed their identity localTharu people have lost their cultural heritage they no longer wear their traditionalcloths, they have forgotten about their traditional foods, even they do notspeak their native language. This raises a serious question is this kind resourceprotection and culture loss sustainable?======================References-1. Centre for Environmental Education, Dudhwa National Park, CEE, Lucknow,
viewed 6th December 2011, <http://www.ceeindia.org/cee/project_pages/dudhwa.html>
2. Dhar, T.N & Gupta S.P.,2008, Greening Imperative forestry and tree cover inU.P, Indian Institute of Public administration U.P. Region, Lucknow.pp.4,10,66
3. Dick,RM & knox,A 1999, 'collective action, property rights, and devolution ofnatural resource management: a conceptual framework'. Environmentaleconomics series part ii. plenary session, DSE/ZEL, Feldafing, Germany, pp.43
4. IHPL, Conservation History of Dudhwa National Park, Indian Holiday PrivateLimited, New Delhii, Viewed 12th November 2011,<http://www.indianholiday.com/india-wildlife-holidays/dudhwa/conservation-history.html>
5. Pratheep, P.S 2010, Globalisation, Identity and Culture: Tribal Issues, LSCACProceedings Thailand ,pp.153.
6. shackleton,S Ncampbell,BO Wollenbergs,E & Edmunds,D 2002 , 'Naturalresource perspective devolution and community based natural resourcemanagement creating space for local people participation and benefits'. NaturalResource Perspective, The Overseas Development Institute, 111 WestminsterBridge Road, London, No76, 1-2
7. Shyamsundar, P Araral, E Weeraratne, S 2005, ' Devolution of Resource Rights,Poverty, and Natural Resource Management - An Overview', environmentaleconomics series the world bank environmental department paper no. 104, pp.1

Yogic Mantra "OM": The Mantra of Universal Harmonyand Potent Tonic of The Human Organism
* Arvind Malik** Sonia Malik, ***Vishal Dahiya
==========================================================Abstract- Today from celebrities to general public - people from all walksof life are interested in Yoga, an integrated system of health for the holisticdevelopment of a person. Aum (or as Westerners like to spell it: om) is avital part of the science of yoga. To many people, aum is just a wordchanted in meditation or as a closing prayer in yoga practice. However,according to Bhagavad Gita " All speech and thought are derived fromone sound aum. It expresses the ultimate reality." Yoga teacher B.K.S.Iyengar describes the various meanings of aum as "The letter A symbolizesthe conscious or waking state, the letter U the dream state, and the letterM the dreamless sleep state of the mind and spirit." Aum became thesacred word "hum" of the Tibetans, "amin" of the Muslems, and "amen"of the Egyptians, Greeks, Romans, and Christians. "Amen" in Hebrewmeans "sure, faithful." Aum is a way of deepening the concentration ofthe mind, which leads to realization of the divine. Yogic mantra "om" issymbol of communal harmony and moreover its deep roots among differentcivilizations had made it a relatively cost-effective universal mantra ofmental and physical health benefits.==========================================================
===========================* Associate Professor, Department of Physical Education, Kurukshetra
University, Kurukshetra, Haryana.** Associate Professor, A.K.M.V. Shahabad(M), Haryana.*** Research Scholar, Department of Physical Education, Ch. Devi Lal University,
Sirsa. Haryana.
Introduction- Yoga is an ancient Indian body of knowledge that dates backmore than 5000 years ago. The word “Yoga” came from the Sanskrit word“yuj” which means “to unite or integrate.” Today, interest in heathconsciousness is attracting people from all over the world to earn better healthin body and contentment in mind. Now a day’s people are looking towardsnatural ways of approach in health & happiness. This search has broughtYOGA in our daily life. The great religious reformer and philosopher SwamiVivekananda, while presenting at the Chicago Parliament of Religions in 1893,

Research Journal of Social and Li fe Sciences, ISSN 0973-3914, Vol .-XIV- II, Year-07, June-2013 111
described yoga is an accessible system for health based upon the followingkey principles: relaxation (savasana), physical movements (asana), breathingpractices (pranayama), and meditation/ positive thinking (dyhana). The mantraOm (or Aum) has been handed down to us by the Himalayan sages. It is themost important mantra of Yoga. According to tradition, every ‘thing’ manifestcomes from Primordial Vibration, which is symbolised by Om: all materialobjects, all living beings, including each of us, all spiritual teachings, includingYoga, all languages, including Sanskrit, all scriptures, including the Vedas,everything. Everything has come out of Primordial Vibration, which isrepresented by Om. This concurs with modern scientific thinking which saysthat everything - every atom and molecule in every nook and corner of thisuniverse - is formed out of energy vibration. Einstein formulated his famousequation E = mc² indicates that matter (m) is but an expression of Energy (E).Every atom, at-Om, comes out of the Primordial Vibration which is symbolisedby Om. Om as a sound, syllable (Om or Aum) and glyph (P) all symbolise thefact that all material objects, all phenomena and all thought patterns, both on amicrocosmic and macrocosmic level, are states of energy vibration.Om in Sanatan Dharma- Indian mystical and philosophical thinking isimpregnated with Om, mentioned widely in the Upanishads , Tantras , Puranas,Samkhyas and in specialised Vedantic texts such as the Yoga Vashishta. Itsymbolises the essence of Sanatan Dharma (the Eternal Way), commonlyknown as Hinduism - the tolerant and profound conglomeration of spiritualthinking and practice from which Yoga has come. Om is widely known as the‘Mahat Mantra’ - ‘the great mantra’. Om is not directly mentioned in RigVeda , probably because it was considered too sacred to utter or even writedown. Om is first mentioned, albeit indirectly, in the Yajur Veda in verse 1:1where it is known as the ‘pranava’ – ‘the humming sound’- or ‘udgita’ – ‘theelevating chant’. Interestingly, no graphic representation of Om has yet beenfound in the extensive excavations of the so called Indus Valley civilisation(circa 3000 BC, though probably much older). The reason may be either thatOm was considered too sacred to be graphically represented, or that it had notyet been realised and brought into mainstream spiritual practice. The oldestdirect references and descriptions of Om are to be found in the Upanishadswhich are considered to contain the essential teachings of the Vedas.Aum (Om) in ancient Egypt- It seems that the ancient Egyptians knew ofAum as Amen or Amun. It seems that Amen or Amen-Ra was a primordialcreation deity, the name of the supreme God who was considered the creatorand ruler of the other gods, and to have no beginning and no end. Possibly,Aum was deified as Amen. Certainly, this description ties up with Aum in thatPrimordial Energy is the source of all things, including gods, and indeed iswithout beginning and end, since it is the very source of time itself. In anycase, this word can be seen in the names of some of the Pharaohs, such as in

Research Journal of Social and Li fe Sciences, ISSN 0973-3914, Vol .-XIV- II, Year-07, June-2013112
Tut-ankh-amen which literally means ‘The Living Image of Amen’. Therewas even a temple in the ancient city of Thebes called ‘Amen-Re’ or theTemple of Amen.’ It was located at the ‘navel’ of Egypt; that is, at its exactgeographical centre. Also, it is interesting to note that ovoidal-shaped stonemarkers called Om-pholos (a Greek word which literally means ‘navel’) wereplaced throughout Egypt as a means by which the land was delineated andsurveyed. Moreover, each ompholos indicated that the god Amen was presentthere. Possibly, and this is pure speculation, Om was symbolically placed in theform of these ompholos’ marker-monuments all over Egypt to indicate thatthat which Om represents is everywhere – in a word, Om-nipresent! The godThoth (the God of Wisdom, known by the Greeks as Hermes) is believed tohave created the world by his Voice (Primordial Vibration) alone; this againhints at Om. These parallels should not really surprise us because it is becomingmore and more evident that the ancient Egyptians had enormous commercial,cultural and religious exchange with India. Possibly, in the mists of time, theyshared a common culture or a common heritage. And in passing, we wouldlike to point out that some people say that the massive pyramids wereconstructed, not using present-day construction techniques, but the power ofsound. As we develop our understanding of sound we may re-discoverknowledge that the ancient Egyptians had known and used. Who knows?Om in Islam- A few centuries after Christ, Amen was adopted into Islam asAmin or Alm. The Arabic letter ‘l’ is pronounced like ‘u’ when it appearsbefore a consonant which means that Alm automatically become Aum.Moreover, in exactly the same way as most traditional Indian spiritual texts,the Koran starts with Aum in the form of Alm! Here we see an extraordinaryparallel between Islam and Yoga, as well as mainstream Indian mystical thinking.Everything starts with Aum. Vibratory Difference between Aum and Amen:The science of linguistics reveals that Amen has evolved from Aum (Om). Ifyou chant Aum for some time and then Amen you will see that there is avibratory difference: Aum is deeper and resonates in the belly and, in fact, inthe whole body; whereas, Amen vibrates in the head and throat. Therefore,the vibrations of Aum tend to take us beyond the fetters of the intellect, whereas,Amen, tends to encourage ‘thinking’ and the intellectual processes. Amensymbolises intellect (which characterises much of western culture as well thegrowth of Christianity and Judaism) whereas Aum (Om) symbolises ‘being’which has always been the essence of eastern religious and mystical systems.Om in English Words- Is it a coincidence that various English words derivedfrom Latin, some of which have important philosophical meanings, start withOm? Take Om-niscience and Om-nipotence. Can it be a coincidence thatOm, symbolising the universal sound vibration that contains all sounds andvibrations, is also contained in the word Om-nipresent! Note also the wordsOm-nifarious and Om-en. The Latin root word omni means ‘universal’. Isn’t

Research Journal of Social and Li fe Sciences, ISSN 0973-3914, Vol .-XIV- II, Year-07, June-2013 113
it strange (or perhaps logical!) that the last letter of the Greek alphabet isOmega? Possibly Om has influenced our culture, via the Greeks and Romans,more than we think, especially on a philosophical level. Lastly, the Englishword ombudsman (which comes from Norwegian) means ‘a person who judgeson intractable disputes or problems’. Is it a coincidence that one can breakdown the word so that it conveys the ancient role of Ombudsman? ‘Om-buds-man’ could mean ‘Om’ + ‘buddhi’ + ‘manas’ - using the power of Om toawaken the buddhi (Sanskrit, ‘our discriminatory faculty’) over manas (Sanskrit,‘the conceptual mind’) . As most of you will know, both the terms ‘buddhi’ and‘manas’ are widely used in Yogic paradigms of the mind and its functioning. Symbolism of the Syllables of AUM- A, U and M, both as syllables and assounds, as well as the silence after chanting Aum, symbolise a number ofdifferent things as follows:• Aum can be chanted by feeling the resonance of ‘A’ in the abdomen,then allowing the ‘U’ to resonate in the chest and finally feeling the ‘M’ vibrationin the head.
A = abdomen, U = chest/throat, M = headAfter the sound of Aum there is silence; this symbolises that which is
‘above’ the head (i.e. beyond thinking), the ineffable: Spirit, or Consciousness.• According to the Mandukya Upanishad, the syllables of Aum representthe following realms of experience:
A = jagrat (waking state), U = swapna (dreaming state), M = shushupti(deep sleep state)
After chanting Aum there is silence; this symbolises the spirituallyawakened state, which transcends the previous three states.• The three syllables of Aum symbolise the three levels of mind as follows: A = conscious, U = subconscious, M = unconscious
After chanting Aum there is silence; this represents the Super-consciousness state which transcends the previous three states.• According to Yoga, Tantra, Samkhya and Vedanta, the whole of nature,including the human mind and body, is made up of the three gunas (Sanskrit,‘guna’, qualities): sattwa (harmony, clarity and light); rajas (passion anddynamism); and tamas (ignorance, darkness and inertia). The three syllablesof Aum symbolize these three gunas as follows: A = tamas, U = rajas, M = sattwa
After chanting Aum there is silence; this symbolises the state of trigunatita(Sanskrit, tri, three; atita, beyond) - that which transcends the three gunas, i.e.Pure Consciousness.• The three syllables of AUM symbolise the three principles of existencesymbolised by Brahma, the creative; Vishnu, the sustaining; and Shiva, thedestructive: A = Brahma U = Vishnu M = Shiva

Research Journal of Social and Li fe Sciences, ISSN 0973-3914, Vol .-XIV- II, Year-07, June-2013114
After chanting Aum there is silence; this symbolises underlying Realitywhich is the substratum behind, and beyond, creation (Brahma), sustenance(Vishnu) and destruction (Shiva).• The three syllables of AUM symbolise the three realms of time: past,present and future: A = Present, U = Past, M = Future
After chanting Aum there is silence; this symbolises underlying Realitywhich underlies and yet is beyond past, present and future; the Timeless out ofwhich time emerges.Benefits of AUM Chanting- In our accomplishment-driven society, the humanbrain constantly receives and processes countless pieces of information fromthe outside world that are contradictory, opposing, and threatening to theorganism. As a result, the brain commands a stress response in the body thatrecruits defence mechanisms and demands high expenditure of energyresources that can severely tax the body in the long run. It is now recognizedthat cognitive stress is linked to accelerated cellular aging and DNAdegeneration. During meditation, the restorative mechanisms of the body arestrengthened and down regulate the uncontrolled function for survival. Life-promoting hormones such as human growth factor are secreted and moreglucose is directed to the brain to fuel more efficient neuronal pathways thatresult in a feeling of well-being, while old habits and the neurons sustainingthem “die out”. Few benefits of chanting mantra “om” are summarised asunder:• AUM chanting is a potent tonic which increases the efficiency of the
human organism in a profound manner.• A few studies have reported that the mantra “om” has been shown to
synchronize respiratory signals, cardiovascular rhythms, and cerebralblood flow.
• By chanting this word OM or AUM one can achieve ultimate self-realization.
• The repetition of Aum leads to excellent mental and physical health.• This chant helps to improve the production of endorphin so making you
fell relaxed and refreshed every time.• Scientific studies on Om suggest that the mental repetition of Om results
in physiological alertness and increased sensitivity to sensorytransmission.
• It has positive effect for cardiac vascular health lowering blood pressureand increasing efficiency of all the cells and organs in the body.
• In essence AUM relaxes and rejuvenates the mind increasingconcentration and memory therefore the ability to learn.
• By chanting the aum, the divine vibration, we can increase the body’ssupply of cosmic energy and even direct it as a healing force to any part

Research Journal of Social and Li fe Sciences, ISSN 0973-3914, Vol .-XIV- II, Year-07, June-2013 115
of the body, mind, and soul. • It helps in cleansing the mind. Controlling the emotions.• It relives the stress levels by supplying more oxygen to the body. So you
get relive from stress related headaches• Charges the surrounding atmosphere.• AUM can be seen through the eyes, listened to via ears and chanted via
tongue. It is some what simpler to concentrate on the above 3 senseorgans, so it is easy to concentrate the mind directly on the object.
• This is achieved by fixing AUM as a target for meditation on which 3sense organs are focused. In addition to this the chanting of AUM hastranquilizing effect on the mind, which helps concentrate easily.
• Musically it is also held that the term OM or AUM is made up by threebase notes ‘A’ ‘U’ ‘M’ or the basic ‘Sa’ ‘Pa’ of the fundamental scaleand again Sa (the base note) of the immediately higher scale. When onepronounces these notes in continuity, all the basic notes from SA to Nialso sound.
• Similarly when one pronounces AUM correctly, all the basic soundsalso echo. It is believed to be the traditional way of clearing all theimpediments in the vocal chord to make one chant the hymns correctly.
• Their unison makes one not only sound sonorous but also acts as thenecessary preparation to chant a Mantra (Incantation) correctly. It isfor this reason that all Vedic Mantras have ‘OM’ or ‘AUM’ as the firstterm.
• It is said that 12,000 recitations of aum remove all sins, while 12,000recitations daily for a period of one year bring realization of the Absolute(brahman).
Systematic Method of Chanting OM/AUM- The OM is to be chanted in amost comfortable posture. The OM is to be chanted during exhalation afterdeep inhalation. The OM is composed of two vowels A, U & one alphabet M.The total timing of 10 seconds for chanting of one AUM is divided as follows: A - 2 seconds , U - 3 seconds, M - 5 seconds• A - is to be pronounced for 2 seconds with open lips• U - is to be pronounced for 3 seconds while partially closing the lips.• M - is to be pronounced for 5 seconds while lips completely closed.Complete 1 repetition of AUM is as follows:
1. Deep inhalation in 5 seconds. 2. Exhaling pronounce A for 2 secondswith lips open.3. Exhaling pronounce U for 3 seconds with lips partially closed.4. Exhaling pronounce M for 5 seconds with lips completely closed.
This complete repetition takes 15 seconds and it can be repeated for asmany times as you want. You may find it difficult to inhale in 5 seconds andexhale in 10 seconds initially, so you have to adjust the timing as per yourcapacity in the beginning. But keep in mind that you have to achieve the ideal

Research Journal of Social and Li fe Sciences, ISSN 0973-3914, Vol .-XIV- II, Year-07, June-2013116
timings. If we follow the correct technique of chanting mantra “om” you willget all the benefits of AUM/Om.Conclusion- In summary, the practice of mantra “om” may provide uniquebenefits that complement a lifestyle with balanced physical exercise, goodnutrition, and a nourishing environment. It provides a conscious process ofself-regulation that tempers the flow of thoughts, emotions, and automaticbehaviors in the body and mind. In our accomplishment-driven society, thehuman brain constantly receives and processes countless pieces of informationfrom the outside world that are contradictory, opposing, and threatening to theorganism. As a result, the brain commands a stress response in the body thatrecruits defense mechanisms and demands high expenditure of energyresources that can severely tax the body in the long run. It is now recognizedthat cognitive stress is linked to accelerated cellular aging and DNAdegeneration. Chanting AMU/OM is one of a few interventions that havebeen shown to effectively strengthen self-control and character developmentsimultaneously.======================References-1. Arias AJ, Steinberg K, Banga A, Trestman RL. Systematic review of the efficacy
of meditation techniques as treatments for medical illness. J Altern ComplementMed. 2006;12:817-32.
2. Astin JA, Shapiro SL, Eisenberg DM, Forys KL. Mind-body medicine: State ofthe science, implications for practice. J Am Board Fam Pract. 2003;16:131-47.
3. Andresen J. Meditation meets behavioural medicine: the story of experimentalresearch on meditation. J Consciousness Stud.2000;7(1112):17-73.
4. Bali Y, Nagarathna R, Ebnezar J, and Nagendra HR,.Complimentary effect ofyogic sound resonance relaxation technique in patients with common neckpain. Int J Yoga. 2010 Jan-Jun; 3(1): 18-25.
5. Bernardi L, Sleight P, Bandinelli G, Cencetti S, Fattorini L, WdowczycSzulc J, etal. Effect of rosary prayer and yoga mantras on autonomic cardiovascularrhythms: Comparative study. Br Med J.2001;323:22-9
6. Iyengar BK. New York City: Harper Collins Publishers; 2001. Light on Yoga;pp. 413-34.
7. Iyengar BK. Yoga-The Path to Holistic Health. London, England: DorlingKindersley; 2001. p. 25.
8. Kaplan S. Meditation, restoration, and the management of mental fatigue.Environ Behav. 2001;33(4):480-506.
9. Nagarathna R, Nagendra HR. Kempegowda Nagar, Bangalore: SwamiVivekananda Yoga Prakashana; 2001. Integrated Approach of Yoga Therapyfor Positive Health; pp. 2-6.
10. Patel Nalini. Correlation Between Personality and Emotional Intelligence.Research Link. March - 2012;96, Vol - XI(1):106-08.
11. Pilkington K, Kirkwood G, Rampes H, Richardson J. Yoga for depression: Theresearch evidence. Journal of Affective Disorders. 2005;89:13-24.
12. Sanjay K, Nagendra HR, Manjunath NK and Shirley T. Meditation on OM:

Research Journal of Social and Li fe Sciences, ISSN 0973-3914, Vol .-XIV- II, Year-07, June-2013 117
Relevance from ancient texts and contemporary science. Int J Yoga. 2010 Jan-Jun; 3(1): 2-5.
13. Sripada Swamy DS, Vasudha MS. dissertation for MSc., Yoga; onN?d?nusand?na. Bangalore: Swami Vivekananda Yoga Prakashana; 2006.
14. Sivananda Swami Japa Yoga A comprehensive treatise on Mantra-Sastra.Himalayas, India: A Divine Life Society Publication; 2005: 45-9.
15. Telles S, Desiraju T. Recording of auditory middle latency evoked potentialsduring the practice of meditation with the syllable 'OM' Indian J Med Res.1993;98:237-9.
16. Telles S, Nagarathna R, Nagendra HR. Alterations in auditory middle latencyevoked potentials during meditation on a meaningful symbol 'OM' Int J Neurosci.1994;76:87-93.
17. Wilson HB. The specific effects model: relaxation and meditation effects oncognitive and somatic anxiety [dissertation]. Columbus, OH: Ohio StateUniversity; 2000.
RNI No. MP BIL 01034/12/1/2005-TC ISSN 0973-3914
izks- cztxksiky 'kqDy41@42] j?kqoa'k lnu] fcfN;k] jhok (e-iz-)& 486001
Phone - (07662) 255177, 9425186437 E-mail - [email protected] [email protected]
lsUVj QkWj fjlpZ LVMht] jhok }kjk fjlpZ tjuy vkWQ vkV~Zl eSustesUV ,.M lks'ky lkbalsl
ds fo'ks"kkad ds :i esa fuEufyf[kr nks lanHkZ iqLrdksa dk izdk'ku uoEcj] 2013 esa fd;k tk jgk gSA
mDr lanHkZ iqLrdksa esa izdk'ku gsrq vki viuk rF; ijd ,oa rdZ ;qDr 'kks/k i= Hkstdj bl vdknfed dk;Z esa lg;ksx dj ldrs gSaA fgUnh Hkk"kk esa 'kks/k i= ,e-,l- oMZ esa QkUV df̀rnso 010] djsDVj lkbt 14] Mcy Lis'k_
vaxzsth Hkk"kk esa VkbEl U;w jkseu QkUV lkbt 14] Mcy Lis'k esa HkstsaA
(vkbZ-,l-ch-,u- 978&81&87364&59&7)
(ISBN 978-81-87364-60-3)Contemporary Indian Society and Culture

Research Journal of Social and Life SciencesISSN 0973-3914, Vol.-XIV- II, Year-07, June-2013
Knowledge Management - An Emerging BusinessTool
* Razaullah Khan**Khan Uzma
==========================================================Abstract- Knowledge is essential in everyday work. Everyone knows howto carry out his work and this knowledge can be reused later in similartasks by adopting this knowledge to new situations. The general purposeof Knowledge Management (KM) is to make knowledge usable for morethan one individual, e.g. for an organisation as a whole; i.e, to share it.New knowledge-based views on organisations suggest that it is knowledgethat holds organisations together [Brown and Duguid 1998]. KM hasexisted and has been used for a long time, although it was neither calledby this name nor necessarily recognised as what it is until a few yearsago [Davenport and Prusak 1998]. The way of making knowledgeavailable for others has evolved with time. With the coming up ofteamwork, people were supposed to work closer together to benefit fromthe synergy of their joint knowledge. Knowledge Management helps theorganizations adapt change with time thereby increasing the efficiency.==========================================================
===========================* Associate Professor, Department of Commerce and Management Science,
Maulana Azad College of Arts, Science and Commerce, Dr. Rafiq ZakariaCampus, Auranagabad, Maharashtra
** Assistant Professor , Department of M.C.A, Millenium Insititute ofManagment, Dr. Rafiq Zakaria Campus, Aurangabad, Maharashtra.
Data, Information, Knowledge Hierarchy- Before beginning to understandknowledge management (KM), one must start by clearly defining the meaningof the word “knowledge”. It is important to understand the distinction betweendata, information and knowledge.
DATA
INFORMATION
KNOWLEDGE
Figure 1 : Data Information &Knowledge Hierarchy

Research Journal of Social and Li fe Sciences, ISSN 0973-3914, Vol .-XIV- II, Year-07, June-2013 119
Data : Data is comprised of the basic, unrefined, and generally unfilteredinformation. Thierauf (1999) defined data as : “unstructured facts and Figureuresthat have the least impact on the typical manager.” For example “ The price ofcrude oil is Rs. 50 “Information: Information is defined as organized or processed data that aretimely and accurate. For data to become information, it must be contextualized,categorized, calculated and condensed (Davenport & Prusak 2000).Knowledge: Knowledge resides in the user and happens only when humanexperience and insight is applied to data and information. The knowledgepossessed by each individual is a product of his experience, and encompassesthe norms by which he evaluates new inputs from his surroundings (Davenport& Prusak 2000).Types of knowledge- In KM knowledge is categorised in two types namelyexplicit and tacit knowledge. The former refers to codified knowledge, suchas that found in documents, while the latter refers to non codified and oftenpersonal/experience-based knowledge.Explicit Knowledge-This type of knowledge is formalized and codified, andis sometimes referred to as know-what (Brown & Duguid 1998). It is thereforefairly easy to identify, store, and retrieve (Wellman 2009). Explicit knowledgeis found in: databases, memos, notes, documents, etc.Tacit Knowledge (Embodied Knowledge)- This type of knowledge wasoriginally defined by Polanyi in 1966. It is sometimes referred to as know-how(Brown & Duguid 1998) and refers to intuitive, hard to define knowledge thatis largely experience based. Tacit knowledge is also regarded as being themost valuable source of knowledge, and the most likely to lead to breakthroughsin the organization (Wellman 2009). Tacit knowledge is found in: the minds ofhuman stakeholders. It includes cultural beliefs, values, attitudes, mental models,etc. as well as skills, capabilities and expertise (Botha et al 2008).Organizational knowledge and Learning- Organizational knowledge isdefined as all the knowledge resources within an organization that can berealistically tapped by that organization. It can therefore reside in individualsand groups, or exist at the organizational level. Hatch (2010) defines it as:“When group knowledge from several subunits or groups is combined andused to create new knowledge, the resulting tacit and explicit knowledge canbe called organizational knowledge.” Others present a broader perspective:“individual knowledge, shared knowledge, and objectified knowledge aredifferent aspects or views of organizational knowledge” (Ekinge & Lennartsson2000).
On the other side learning is the way we create new knowledge andimprove ourselves. Organizational learning is based on applying knowledgefor a purpose and learning from the process and from the outcome. Brownand Duguid (1991) describe organisational learning as “the bridge between

Research Journal of Social and Li fe Sciences, ISSN 0973-3914, Vol .-XIV- II, Year-07, June-2013120
working and innovating.”What is Knowledge Management?
Knowledge Management is the collection of processes that govern thecreation, dissemination, and utilization of knowledge. KM is about making theright knowledge available to the right people. It is about making sure that anorganization can learn, and that it will be able to retrieve and use its knowledgeassets in current applications as they are needed. Davenport & Prusak (2000),states that KM “is managing the corporation’s knowledge through asystematically and organizationally specified process for acquiring, organizing,sustaining, applying, sharing and renewing both the tacit and explicit knowledgeof employees to enhance organizational performance and create value.” Itinvolves the understanding of:• where and in what forms knowledge exists;• how to make the right knowledge available to the right people;• what the organization needs to know;• how to best generate or acquire new relevant knowledge;• how to promote a culture conducive to learning, sharing, and knowledge
creation;• how to manage all of these factors so as to enhance performance in
light of the organization’s strategic goals and short term opportunitiesand threats.
The Knowledge Management Process- Knowledge management is theconcept of taking data and turning it into useful and applicable knowledge in abusiness environment. There is no one specific way that is to be done, andthere’s no one specific definition of the process or the concept. No matterhow complex the organization’s KM concept may be but few general stepsare carried out in any KM process
Data Capture
Data Storage
Knowledge Creation
Data Organization
Data Analysis
Knowledge Sharing

Research Journal of Social and Li fe Sciences, ISSN 0973-3914, Vol .-XIV- II, Year-07, June-2013 121
Figure 2 : The Knowledge Management ProcessData Capture: Raw data must be collected somehow before it can be turnedinto knowledge, or wisdom as the last step in the process is often called.Data Storage: There has to be a place to keep the collected information.Data storage for most businesses and even individuals today is digital, buteven a filing cabinet is a data storage solution.Data Organization: Once the data is collected it has to be organized intosome kind of a useful structure. For instance, a piece of paper that containsraw data like sales Figureures numbers, number of employees, prices ofproducts, employee attendance numbers and last quarter’s profits is full ofraw data, but it’s a collection that’s not organized and can’t be easily used inthis format.Data Analysis: This often melds in with the organization step, as the act oforganizing data often requires analysis. Once the data is analyzed, then it’smore likely to be knowledge than just raw information because the way theinformation works together and things like cause and effect become moreobvious. Patterns become obvious, and those can be used to illustrate generalconcepts. This turns the information into useful knowledge.Knowledge Creation : At this stage the analysis brings into light certaintrends and pattern. This leads to knowledge creation.Knowledge Sharing:At this point, the raw data has become useful knowledgeor wisdom. While this is an improvement over raw, unorganized data, it’snecessary to determine the best way to share this wisdom with employees tomake it truly useful on a daily basis, and to use it to reach organizational goals.The Knowledge Management System- Knowledge Management System(KM System) refers to a system for managing knowledge in organizations.KMS, is a concept usually enabled by Information Technology, it is an ITbased system for managing knowledge in companies for supporting the creation,acquisition, storage and dispersion of information. The main purpose of a KMSis to allow a company’s employees to readily access documented archives offacts, information sources, and results. One of the main goals of knowledgemanagement systems is simply to make it easier for businesses and otherorganizations to share information and to make sure organizational knowledgeis freely available to those who need it.Knowledge Management for Reducing the Knowledge Gap inOrganization- Change is the mother of inventions. With the passage of timemany internal and external factors influence organizations to incorporate newtools, techniques and strategies towards increasing organizational benefits.Success in the competitive market depends on organizations ability to adaptchange with time .Implementation and adaptation of new techniques developsa knowledge gap in organization hence it becomes necessary reduce thisknowledge gap. KM is one such strategy which helps the organizations to

Research Journal of Social and Li fe Sciences, ISSN 0973-3914, Vol .-XIV- II, Year-07, June-2013122
reduce this gap.
Rate of change
Rate of learning
Knowledge Gap
TimeFigure 3 : The knowledge gap with respect to Time and Change
In order to reduce this knowledge gap, KM must therefore be involvedacross the entire knowledge spectrum. It must help knowledge developmentat all levels and facilitate & promote its diffusion to individuals, groups, and/oracross the entire firm, in accordance with the organization’s requirements.KM must manage organizational knowledge storage and retrieval capabilities,and create an environment conducive to learning and knowledge sharing.Similarly, it must be involved in tapping external sources of knowledge wheneverthese are necessary for the development of the organizational knowledgeresources. Knowledge management plays important role in OrganizationalLearning . KM emphasises on following points :1. One must understand how to create the ideal organizational learning
environment2. One must be aware of how and why something has been learned.3. One must try to ensure that the learning that takes place is useful to the
organizationTechnology - An enabler of KM- Information technology plays an importantrole in developing an efficient KMS. There are various tools available in markettoday which help KM to fulfil its goals. Following are few IT based tools tochoose from, which fall into one of the following categories (adapted fromGupta and Sharma 2005, in Bali et al 2009):• Groupware systems• The intranet and extranet• Data warehousing,data mining, & OLAP• Decision Support Systems• Content management systems• Document management systems• Artificial intelligence tools• Simulation tools

Research Journal of Social and Li fe Sciences, ISSN 0973-3914, Vol .-XIV- II, Year-07, June-2013 123
KM should not be confused as technological discipline it is more aboutmanaging as people, culture, and organizational practices & structures. EffectiveKM initiatives are therefore never technology driven. However, if IT is usedright - as a supporting and enhancing mechanism for sound, existing KMpractices - it can be a very valuable tool indeed.Conclusion- The knowledge management (KM) is very important in the 2000’sbecause it helps organizations to gain competitive advantage and effectiveworking through sharing and re-using knowledge. In the market place of e-business, KM initiatives are used to systematically leverage information andexpertise to improve organizational responsiveness, innovation, competencyand efficiency. There are many reasons why knowledge should be managedproperly especially using the collaborative technology. Among these areinformation overload, technology advancement, increased professionalspecialization, competition, workforce mobility and turnover, and capitalizationof organizational knowledge. The Km based system are being deployed as atool for organizational excellence and improved business system.======================References-1. Dr. B. Rathan Reddy. "Knowledge Management [Tools for Business
Development], First Edition, Mumbai, Himalaya Publishing House,2007.2. Bryan Bergeron, "Essentials of Knowledge Management", John Wiley & Sons,
Inc., Hoboken, New Jersey.3. Dr. Dimitris Karagiannis, Basics of Knowledge Management: Basic Aspects of
Knowledge Management, Lecture notes, University of Vienna, Trieste, Italy.4. Steffen P. Raub & Bhushan Sthapit, Towards a Taxanomy of Approaches for
Measuring Organizational Knowledge, Research and Practices in Humanresource Management, Vol 9, pp. 139-155, 2001.
5. Gerald, Ryam, Gururajan, "The effects of culture on knowledge managementpractice :A qualitative case study of MSC status companies" , kayaan MalaysiaVol., XXIV No. 1 & 2, 2006, Malaysia.
6. Micheal DeMarco, Eric Lesser, Scott Smith, People and Innovation: Gettingideas on the table, IBM White Paper.

Research Journal of Social and Life SciencesISSN 0973-3914, Vol.-XIV- II, Year-07, June-2013
Contribution of E Commerce in BusinessDevelopment
*Chandresh L.Usadadiya==========================================================Abstract- E-commerce stands for electronic commerce and pertains totrading in goods and services through the electronic medium. B2B, B2C,C2C and similar opportunity help consumer preferences and consumermarkets developing electronic infrastructure for challenges of the future.E-commerce has revolutionized business, changing the shape ofcompetition with internet (The NET) ,the computer communication networkcreating a e-commerce market place for consumers and business . Withdevelopments in the Internet and Web-based technologies, distinctionsbetween traditional markets and the global electronic marketplace-suchas business capital size, among others-are gradually being narroweddown. India is showing tremendous growth in the Ecommerce. The lowcost of the PC and the growing use of the Internet is one of reasons forthat. There is a growing awareness among the business community inIndia about the opportunities offered by ecommerce. The present papermainly aims to discuss the Role of E-commerce in Today’s Business.==========================================================
===========================* Associate Professor and Head, Shri S.M.Jadeja Arts and Commerce College
Kutiyana District-Porbandar
Introduction- Electronic commerce is the application of communication andinformation sharing technologies among trading partners to the pursuit ofbusiness objectives. E-Commerce can be defined as a modern businessmethodology that addresses the needs of organizations, merchants, andconsumers to cut costs while improving the quality of goods and services andincreasing the speed of service delivery. E-commerce is associated with thebuying and selling of information, products and services via computer networks.Key element of e-commerce is information processing. The effects of e-commerce are already appearing in all areas of business, from customer serviceto new product design. It facilitates new types of information based businessprocesses for reaching and interacting with customers – online advertisingand marketing, online-order taking and on-line customer service etc. It canalso reduce costs in managing orders and interacting with a wide range ofsuppliers and trading partners, areas that typically add significant overhead tothe cost of products and services.

Research Journal of Social and Li fe Sciences, ISSN 0973-3914, Vol .-XIV- II, Year-07, June-2013 125
Role of E-Commerce in Business Development- Commerce is animportant word, which has related to business. Now the concept of E-Commerce has come which is very popular. E- Commerce is an importantword, which is connecting to business. That concern to sell or buy goods andservices in large scale to explore business, for the transferring of goods andservices from one place to another and receiving payment for all this, this hasdone on net which provide business concern a wider market than manualmarket, E-Commerce brings a new revaluation in the business world.1. Exploitation of New Busines- Broadly speaking, electronic commerce
emphasizes the generation and exploitation of new .business opportunitiesand to use popular phrases: “generate business value” or “do more withless”.
2. Enabling the Customers- Electronic Commerce is enabling thecustomer to have an increasing say in what products are made, howproducts are made and how services are delivered (movement from aslow order fulfillment process with little understanding of what is takingplace inside the firm, to a faster and rt1ore open process with customershaving greater control.
3. Improvement of Business Transaction- Electronic Commerceendeavors to improve the execution of business transaction over variousnetworks.
4. Effective Performance- It leads to more effective performance i.e.better quality, greater customer satisfaction and better corporate decisionmaking.
5. Greater Economic Efficiency- We may achieve greater economicefficiency (lower cost) and more rapid exchange (high speed, accelerated,or real-time interaction) with the help of electronic commerce.
6. Execution of Information- It enables the execution of information-laden transactions between two ore more parties using inter connectednetworks. These networks can be a combination of ‘plain old telephonesystem’ (POTS), Cable TV, leased lines and wireless. Information basedtransactions are creating new ways of doing business and even newtypes of business.
7. Incorporating Transaction- Electronic Commerce also inco11’oratestransaction management, which organizes, routes, processes and trackstransactions. It also includes consumers making electronic paymentsand funds transfers.
8. Increasing of Revenue- Firm use technology to either lower operatingcosts or increase revenue. Electronic Commerce has the Potential toincrease revenue by creating new markets for old products, creating

Research Journal of Social and Li fe Sciences, ISSN 0973-3914, Vol .-XIV- II, Year-07, June-2013126
new information-based products, and establishing new service deliverychannels to better serve and interact with customers. The transactionmanagement aspect of electronic commerce can also enable firms toreduce operating costs by enabling better coordination in the sales,production and distribution processes and to consolidate operations aridreduce overhead.
9. Reduction of Friction- Electronic Commerce research and itsassociated implementations is to reduce the “friction” in on linetransactions frictions is often described in economics as transaction cost.It can arise from inefficient market structures and inefficientcombinations of the technological activities required to make a transaction.Ultimately, the reduction of friction in online commerce will enablesmoother transaction between buyers, intermediaries and sellers.
10. Facilitating of Network Form- Electronic Commerce is also impactingbusiness .to business interactions. It facilitates the network form oforganization where small flexible firms rely on other partner, companiesfor component supplies and product distribution to meet changingcustomer demand more effectively. Hence, an end to end relationshipmanagement solution is a desirable goal that is needed to manage thechain of networks linking customers, workers, suppliers, distributors andeven competitors. The management of “online transactions” in the supplychain assumes a central roll.
11. Facilitating for Organizational Model- It is facilitating anorganizational model that is fundamentally different from the past. It is acontrol organization to the information based organization. The emergingforms of techno-organizational structure involve changes in managerialresponsibilities, communication and information flows and work groupstructures.
======================References-1. Humeau, Philippe; Jung, Matthieu (2012-09-10) (PDF). In depth comparison of
8 ecommerce solutions2. Chaudhury, Abijit; Jean-Pierre Kuilboer (2002). e-Business and e-Commerce
Infrastructure. McGraw-Hill. ISBN 0-07-247875-6.3. Frieden, Jonathan D.; Roche, Sean Patrick (2006-12-19). ”E-Commerce: Legal
Issues of the Online Retailer in Virginia”(PDF). Richmond Journal of Law andTechnology 13 (2)
4. Graham, Mark (2008). ”Warped Geographies of Development: The Internet andTheories of Economic Development” (PDF).

Research Journal of Social and Life SciencesISSN 0973-3914, Vol.-XIV- II, Year-07, June-2013
Interpretation The Point of Taxation Rules 2012-13(Service Tax)
*R. C. Gupta**S. K. Panthi
==========================================================Abstract- Service tax is a tax levied on the transaction of certain specifiedservices by the central government under the finance Act, 1994. It is anindirect tax, In witch normally the service provider pays, tax and recoversthe amount from the recipient of service. The central Excise Departmentadministers the service Tax Law The Customs, Excise and Service taxappellate Tribunal[CESTAT] was constituted on the 11thoct,1982.CESTATwas created to provide an independent forum to hearthe appeals against orders and decisions passed by the commissionersof customs and excise under the custom Act,1962 central excise Act1944,Finance Act 94, relating to service tax. Exemption the mattersrelating to classification and valuation of goods, the tribunal is the finalAppellate Authority through a reference to the High Court can be madeon a question of law In classification and valuation matters the appealagainst the orders of the tribunal lies only to the Honorable SupremeCourt.==========================================================
===========================* Professor & Head, Department of Commerce, Govt. P. G. College, Bina , Sagar** Guest faculty Commerce, Govt. P. G. College, Bina , Sagar (M.P.)
Concept- Service tax has grown manifold over last 18 years and in view of itscontribution to economy and tax revenue. Government deemed it proper tointroduce point of Taxation rules to harmonies tax practices, bring in efficiencyand move a step forward towards introduction of goods and service tax innear future. It was with effect from 1st April 2011 with the notification no 18/2001. Need – Before the point of taxation rules, the revenue was recognizedat the time of rendering of services, but the service tax was taken only at thetime of receipt of consideration. This made a mismatch between the accrualbasis of accounting and the receipt basis of service tax law. To avoid thishavoc the government came up with the Point of Taxation Rules. This majorchange was proposed to introduce clarity and certainty in the matter of levyand collection of service tax particularly in situations of change in effectiverate of service tax or imposition of service tax on new services. This makes iteasier for the service provider to match its revenue with the service tax levied.

Research Journal of Social and Li fe Sciences, ISSN 0973-3914, Vol .-XIV- II, Year-07, June-2013128
The GST regime is likely to follow this practice and it is necessary to align theservice tax regime with it so that transition to GST will be smooth.This centralGovernment hereby makes the following rules further to amend the point ofTaxation rules, 2011, namely.(1) These rules may be called the point of Taxation (Amendment) Rules,
2012.(2) They shall come into force on the 1st day April, 2012.(3) Rate change (Rules 4) 10% to 12% and a few others from 01/03/
2012.The Union budget 2012-13 has proposed a paradigm shift in the taxation
of service. Accordingly, taxation of services will be based on the concept of“Negative list of services” if an activity meets the characteristics of a service,it is taxable unless specified in the Negative list (comprising 17 heads listed inproposed new section 66D), or otherwise exempted by a notification issuedunder sec 93 of the Act.Rules 2A :- Date of payment – For the purposes of these rules date ofpayment shall be the earlier of the dates on which the payment is entered inthe books of account or is credited to the bank account of the person liable topay tax provided that –(A) The date of payment shall be the date of credit in the account
when(1) There is a change in effective rate of tax or when a service tax is taxed
for the first time during the period between such entry in books of accountand its credit in the bank account; and
(2) The credit in the bank account is after four working days from the datewhen there is change in effective rate of tax or a service is taxed for thefirst time; and
(3) The payment is made by way of an instrument which is credited to abank account.
(B) If any rule requires determination of the time or date of paymentreceived, the expression, date of payment, shall be construed to meansuch date on which the payment is received.
Rule 3 :- Determination of point of Taxation in general cases :- For thepurpose of these rules, unless otherwise provided, point of taxation shall be –(1) The time when the invoice for the service provided or agreed to be
provided is issued. Provided that where the invoice is not issued withinthe time period specified in rule 4A of the service tax Rules,1994, i.e. 30days the point of taxation shall be the date of completion of provision ofthe service.
(2) In a case, where the person providing the service, receives a paymentbefore the time specified in clause the time, when he receives suchpayment, to the extent of such payment. In case of continuous supply of

Research Journal of Social and Li fe Sciences, ISSN 0973-3914, Vol .-XIV- II, Year-07, June-2013 129
service where the provision of the whole or part of the service isdetermined periodically on the completion of an event in terms of acontract, which requires the receiver of service to make any payment toservice provider, the date of completion of each such event as specifiedin the contract shall be deemed to be the date of completion of provisionof service.
(3) Wherever the provider of taxable service receives a payment up torupees one thousand in excess of the amount indicated in the invoice,the point of taxation to the extent of such excess amount, at the optionof the provider of taxable service, shall be determined in accordancewith the provisions of clause [a]
Rule 4 :- Determination of point of taxation in case of Change ineffective tax rate-(a) In case a taxable service has been provided before the change ineffective
rate-(1) where the invoice for the same has been issued and the payment received
after the change in effective rate of tax, the point of taxation shall be thedate of payment or issuing of invoice, whichever is earlier, or
(2) Where the invoice has also been issued prior to change in effective rateof but the payment is received after the change in effective rate of tax,the point of taxation shall be the date of issuing of invoice, or
(3) Where the payment is also received before the change in effective rateof tax, but the invoice for the same has been issued after the change ineffective rate of tax, the point of taxation shall be the date of payment.
(b) In case of taxable service has been provided after the change ineffective rate of tax-
(1) Where the payment for the invoice is also made after the change ineffective rate of tax but the invoice has been issued prior to the changein effective rate of tax, the point of taxation shall be the date of payment;or
(2) Where the invoice has been issued and the payment for the invoicereceived before the change in effective rate of tax, the point of taxationshall be the date of receipt of payment or date of issuance of invoice,whichever is earlier; or
(3) Where the invoice has also been raised after the change in effectiverate of tax but the payment has been received before the change ineffective rate tax, the point of taxation shall be date of issuing of invoice.
Rule 5:- Payment of tax in cases of new services:-Where a service, not being a service covered by rule 6, is not taxed for thefirst time, then-(a) No tax shall be payable to the extent the invoice has been issued and the
payment received against such invoice before such service become

Research Journal of Social and Li fe Sciences, ISSN 0973-3914, Vol .-XIV- II, Year-07, June-2013130
taxable.(b) No tax shall be payable if the payment has been received before the
service become taxable and invoice has been issued within 14 days ofthe date when the service is taxed for the first time.
Rule 6:- Omitted:-Rule 7:- Determination of taxation in case of specified services orpersons:-Not with standing anything contained in these rules, the point of taxation inrespect of the persons required to pay tax as recipients of service under therules made in this regard in respect of services notified under sub-section (2)of section 68 of Act, shall be the date on which payment is made:(1) Provided that, where the payment is not made within a period of six
months of the date of invoice, the point of taxation shall be determinedas if this rule does not exist.
(2) Provided further that in case of “Associated Enterprises”, wherethe person providing the service is located outside India, the point oftaxation shall be the date of debit in the books of account of the personreceiving the service or date of making the payment whichever is earlier.
(3) Individuals, proprietorships and partnership firms providing specifiedservices (Chartered Accountant, Cost Accountant, Company Secretary,Architect, Interior Decorator, Legal, Scientific and Technical consultancyservices.) The benefit shall not be available in case of any other servicealso supplied by the person concerned along with the specified services.
Rule 8:- Determination of point of taxation in case of copyrights, etc.Where consideration not ascertainable at the time of performance it will bedeemed to have been provided each time when,Payment is received by the provider, or Invoice is issued by theprovider, whichever is earlier.
Where the point of taxation cannot be determined as per these rules asthe date of invoice or the date of payment or both are not available, the CentralExcise officer, may, require the concerned person to produce such accounts,documents or other evidence as he may deem necessary and after taking intoaccount such material and the effective rate of tax prevalent at different pointsof time, shall, by an order in writing, after giving an opportunity of being heard,determine the point of taxation to the best of his judgment.Finance Bill Act 2013:- After Finance Bill Act 2013 have been passedRevenue department officer will have to right to arrest those person who havenot paid the service tax and sentence to jail for seven year and penalty up toone lacks in such case only superintendent level Central Excise officer cantake this action first time service tax rules have been amended where theCRPC rules have on forced.
***

Research Journal of Social and Life SciencesISSN 0973-3914, Vol.-XIV- II, Year-07, June-2013
Recent Trends of Human Resources Management
*Nayana Keshavlal Gondalia==========================================================Abstract- Human resource is a relatively modern management term havingbeen coined in the 1960 s. The origins of the function arose in thoseorganizations which introduced 'welfare management' practices and alsoin those that adopted the principles of 'scientific management. Due toglobalization Indian scenario began to change. Human resource becameone of crucial driver for crucial development and change. As the viewpointof management towards its employees began to change, role andcontribution of human resource as a talent pool also become so vital thatmost of the organizations started to focus their vision and missionstatements on the people who work for them. Newer and newer ways ofattracting, recruiting and managing tenant in the companies also startedto emerge. This paper tries to identify recent trends which came intoexistence as a result of globalization. The present day economy has beentitled as "Knowledge economy". In such an economy, it is people whomake all the difference.In political economy capital or market wasimportant. Talent occupies centre stage in the Indian workplace. In viewof this, managing and retaining manpower is becoming crucial to anorganization's success. To achieve this, companies across sectors arefocusing on some of the more critical HR practices.==========================================================
===========================* I/C Principal, Associate Professor, Shri Mahila Arts and Commerce College,
Joshipura, Junagadh (Gujarat)
Introduction- Human Resource is a term used to describe the individualswhich comprises the workforce of an organization, although it is also applied inlabor economics, for example, business sectors or even whole nation. HumanResource is also the name of the function within an organization charged withthe overall responsibility for implementing strategies and polices relating to themanagement of individuals (i.e. the human resources). This function title isoften innervated to the initials ‘HR’. Human resource is a relatively modernterm having been coined in the 1960s. The origins of the function are in thoseorganizations which introduced ‘welfare management’ practices and also inthose that adopted the principles of ‘scientific management. The use of theterm, ‘human resources’ by organizations to describe theworkforce capacity, is available to devote to the achievement of its strategies.In the simplest term, the objective of an organization’s human resource

Research Journal of Social and Li fe Sciences, ISSN 0973-3914, Vol .-XIV- II, Year-07, June-2013132
management strategy is to maximize the return on investment from theorganization’s human capital and minimize financial risk. Human Resourceseeks to achieve this by aligning the supply of skilled and qualified individualsand the capabilities of the current workforce, with the ongoing and futurebusiness plan and requirement of the organization in order to maximize returnon investment and seeks to secure the future survival and success of theentity. In ensuring such objective are achieved, the human resource functionpurpose in this context is to implement the organization’s human resourcerequirement effectively but also pragmatically, taking account of legal, ethicaland as far as is practical in manner which retains the support and respect ofthe workforce.What is “management practices”?- The term management practices hasbeen used to describe how works in a particular environment. Following are the some management practices-• Recruitment and selection• Organizational design and development.• Business transformation and change management.• Performance, conduct and behavior management.• Industrial and employee relations.• Human resources analysis and the management workforce Personal
data.• Compensation, rewards and benefits management.• Training & development. • Man power planning.• Employee welfare.• Industrial safety.• General administration.• Management Information System. (MIS)Recent Trends in Human Resource Management Practices- Humanresource management is a process of bringing people and organizations togetherso that the goals of each other are met. The role of HR manager is shiftingfrom that of a protector and screener to the role of planner and change agentpersonnel directors are the new corporate heroes. The name of the gametoday in business is personnel. Now days it is not possible to show a goodfinancial or operating report unless your personnel relations are in order Overthe years highly skilled and knowledge based jobs are increasing while lowskilled jobs are decreasing. This calls for future skill mapping through properHRM initiatives.Indian organizations are also witnessing a change in systems,management cultures and philosophy due to the global alignment of Indianorganization. There is a need for multi skill development. Role of HRM Isbecoming all the more important.Some of the recent trends that are being observed are as follows;

Research Journal of Social and Li fe Sciences, ISSN 0973-3914, Vol .-XIV- II, Year-07, June-2013 133
• The recent quality management standers ISO 9001 and ISO 9004 of2000 focus more on people centric organization.Organisation now needto prepare themselves in order to address people centered issues withcommitment from the top management, with renewed thrust on HRissues, more particularly on training.
• Charles Handy also advocated future organizational models likeShamrock, Federal and Triple I. Such organizational models also refocuson people centric issues and call for redefining the future role of HRprofessionals.
• To leapfrog ahead of competition in this world of uncertainty,organizations have introduced six-sigma practices. Six-sigma uses rigorousanalytical tools with leadership from the top and develops a method forsustainable improvement. These practices improve organizational valuesand helps in creating defect free product or services at minimum cost.
• Human resource outsourcing is a new accession that makes a traditionalHR department redundant in an organization. Exult, the internationalpioneer in HR BPO already roped in Bank of America, internationalplayers BP Amoco & over the years plan to spread their business tomost of the Fortune 500 companies.
• With the increase of global job mobility, recruiting competent people isalso increasingly becoming difficult, especially in India. Therefore bycreating an enabling culture, organizations are also required to work outa retention strategy for the existing skilled manpower.
HR Managers should do the following things to Ensure success-• Use workforce skills and abilities in order to exploit environmental
opportunities and neutralize threats.• Employ innovative reward plans that recognize employee contribution
and grant enhancements.• Indulge in continuous quality improvement through TQM and HR
contributions like training, development, counseling, etc.• Utilize people with distinctive capabilities to create unsurpassed
competence in an area, e.g. LEBEN Labotories, Curex etc.• Decentralize operations and rely on self-managed teams to deliver goods
in difficult times .e.g. Priest pharma etc• Lay off workers in smooth way explaining facts to unions, workers and
other affected groups e.g. LEBEN Lebotories,Glaxo etc.HR Managers Today are focusing attention of the following-• Policies- HR policies based on trust, openness, equity and consensus.• Motivation- Create conditions in which people are willing to work with
zeal, initiative and enthusiasm; make people feel like winners.• Relation- Fair treatment of people and prompt redress of grievances
would pave the way for healthy work-place relations.

Research Journal of Social and Li fe Sciences, ISSN 0973-3914, Vol .-XIV- II, Year-07, June-2013134
• Change agent- prepares workers to accept technological changes byclarifying doubts
• Quality consciousness- commitment to quality in all aspects ofpersonnel administration will ensure success.Due to recent trends in HR, in a nutshell the HR manager should treat
people as resources, reward them equitably, and integrate their aspirationswith corporate goals through suitable HR policies.Conclusion-Human resource Management practices will be the key area offocus in 21st century as in Private and government organization. In theknowledge era and a skill-based economy, it has become imperative that humanresources become one of the most essential ingredients of success. As wealready know that Human Resource Management of the organization dealswith the individuals putting their hard work to meet the organizations goals.Managing people is the toughest element of any organization than land,machinery of finances. Every human has its own degree of preferences, likingsand attitude. So, HR Managers have to take care of all these things in mindwhile dealing with the number of people working in the organization. Hence,the Organization has been devising newer personnel management/HRtechniques which specifically meet the needs of pharmaceutical industry. Themain reason for this is high standards of education and professional trainingrequired for this pharmaceutical industry. Secondly, there is an excessive jobdemand for developed countries in this sector and high wage standards. So,HR managers mainly in developing countries find it very difficult to retain andrecruit their manpower. Hence, it can be concluded that recent HR trends ofindustry are quite different from the old economy industry. Hence, the IndianGovernment must allow the Industry to meet international competition anddesired environment in respect of Labor Laws and financial rules must beliberalized for this Indian pharmaceutical Industry. Moreover, HR managers inpharmaceutical Industry must keep the sensitive nature of professionals andstate of greater opportunities outside in mind for devising HR policies for theirorganizations.======================References-1. The process of management WH Newman, E.Kirby warren. Prentice Hall.2. Industrial management. Rustom S. Davar Khanna Publication3. Ashwathapa K. (2005) Human Resource Management Tata Mc Graw Hills,
Fifth edition.4. Mamoria C.B. and Gankar S.B. (2005) personnel Management Himalaya
Publishing House, Twenty Fifth editions.5. Pareek, U and T.V. Rao, 1981, "Designing and Managing Human Resource
Systems ", Oxford and IBH publishing Co, New Delhi.6. Rao, T.V. and Pereira, E.A., "A Survey of HRD practices in INDIAN Industry, in
Rao, T.V. and Pereira, D.F., Recent Experiences in HRD, New Delhi, OXFORD &IBH, 1985.

Research Journal of Social and Life SciencesISSN 0973-3914, Vol.-XIV- II, Year-07, June-2013
A Comparative study of the power and poli tics inShakesper's 'Macbeth' and Karnad's Tughlaq
*Pravinkumar N. Rathod==========================================================Abstract- 'Macbeth' is a play written by William Shakespears and 'Tughlaq'is an Indian play written by Girish Karnad. The common factor of theseplays is ambition for power. They kill everyone whoever stands asobstacles before them. Even they do not hesitate to kill their trustworthyfriend and Kinsmen. The Killings, Murder, Injustice and Chaos are onlyfor the sake of power. To obtain Crown Victorious and TrustworthyGeneral becomes enemy of the king Duncan. And To retain power Tughlaq,an intelligent and well read Sultan becomes the Intriguer and Murderer.They play politics for the power. But they are not satisfied after committingill acts. The past acts, killing dreams and ghost murder and death of theinnocent people haunt Macbeth and Tughlaq.==========================================================
===========================* Department of English, G.N.A. College of Arts Commerce and Science,
Barshitakli, Dist. Akola (M.S.)
Introduction- The play Macbeth was published in 1605 or 1606 and Tughlaqwas written in 1964 and staged in 1965. Although, the plays touch historicalthemes and events, the fact and fiction are intermixed in these plays. The play‘Macbeth’ is based on an actual Scottish king. Shakespeare’s Macbeth isdifferent from other historical kings. The Scottish king was honest and good.Macbeth and Banquo were two of the Scottish king’s Generals. King Duncanwas respected even by enemies, honored by the church, beloved by Scottishpeople. Hence, he was an ideal King. Shakespeare’s all major tragedies likeMacbeth, King Lear, Hamlet and Othello, we have a hero who gives the namesto the play and who comes to utter ruin and disaster because of a defective inhis character. Every hero is of strong personality with noble qualities, but hasone weakness. Lear is passionate, Hamlet is incapable of action, Othello isjealous and Macbeth is over-ambitious. Fate conspires so that every one ofthem is tempted on his weak side Macbeth fails because of his uncompromisingambition, and this play is designed to show that there is great temptation for aman who is ambitious. The play ‘Tughlaq’ is a historical play which is writtenby Girish Karnad. Tughlaq was a king of fourteenth century. He was also anidealist. He wanted Hindu-Muslim brotherhood. The shifting of his capital from

Research Journal of Social and Li fe Sciences, ISSN 0973-3914, Vol .-XIV- II, Year-07, June-2013136
Delhi to Daulatabad, the introduction of Copper coin equal in value to SilverDinar etc. show his idealistic thinking.
Macbeth and Tughlaq both belong to different country and from particularatmosphere. The common quality of both was their ambition for Power. The‘Hamartia’ or the shortcomings of the Macbeth and Tughlaq was their overambitiousness. The former wanted to be a king of Scotland and the later wantedto eliminate all his enemies to retain his kingship. He commited patricide,Fratricide and wipes off the religious and political leaders. Macbeth and Banquowere two Courageous, Strong and good Generals in Duncans army. Threewitches prophecied about the great Macbeth as the Thane of Glamis, as theThane of Cowder and as the King. After the defeating the king of Norway, theWitches appeared on the heath and prophecies that Macbeth would be theThane of Glamis and Cowder and latter will be the king. They are trustworthyGenerals of King Duncan. But Macbeth killed his trustworthy friend and GeneralBanquo for power. Even the dearest King Duncan was also murdered byMacbeth.Tughlaq was a democrat and not a tyrant. There was a starvationand hunger throughout the country. In order to have a firm grip over his StateTughlaq adopts to trickery, politeness, firmness and wickedness. To retain hiskingship he commits one murder after the other. He was charged with patricideand fratricide. He orders his step mother to be dragged and stoned to deathand commited matricide. Like Macbeth’s most trustworthy friend and hiscollegue was murdered, Tughlaq also stabed his most trusted lieutenant,Shihabuddin, Sheik Immamudin also murdered. His soldiers killed the Amirsand Aazam who talked against sultan Tughlaq. Vizier Mohammad Najib whowas most trustworthy adviser and politician of the Tughlaqwas also killed. Hisdead body was lying in bed. One after another murders took place in thekingdom. The subjects in the kingdom of the Tughlaq and Macbeth were nothappy. There was chaos in the kingdom. The stepmother of sultan was muchconcerned about the health and welfare of Tughlaq. In Macbeth, Duncan waskilled by his trusted leighnent and in Tughlaq the step-mother of Tughlaq wassentenced to death by the Son. There was no value for relation for the powerhungry men. Power make the man blind and their ambition turned them tohatch plot against the people whoever comes in their way.
Tughlaq was an idealist, religious and a politician. But he plays doublerole in the play. He was a tyrant as well as democrat. The mighty and mostpowerful Tughlaq fell at the feet of Dhobi masquerading as Abbasid Ghiyasuddin.The greatest idealist and religious man fell at the feet of a dhobi taking dust onhis head, a very common man’s dust. The characters were well marked for itscontrasting behaviour. They stood for good and evil. There was a fight of evilagainst good. All charecters divided themselves into groups and we could knowthem by contrast. In Tughlaq, the characters are not either all good or all bad.They are mixture of opposites – Vices and virtues. Sultan Muhammad is

Research Journal of Social and Li fe Sciences, ISSN 0973-3914, Vol .-XIV- II, Year-07, June-2013 137
foremost among the others characters. The common people hold contradictoryopinion about him. He is an irreligious, anti-Islam at the same time idealist andtrue religious. There is ambiguity in the character of Tughlaq. Sheikh Imamuddinwho was a great saint of India resembled the Sultan. He stirred the people torebel against the Sultan. But soon he put on the robes of the sultan’s emissaryto go and seek peace with Ain-Ul-Mulk. Shihabuddin was faithful and loyal toMuhamomad Tughlaq. Tughlaq invited him to look after the administration ofDelhi in the absence of king during war against Ain-Ul-Mulk.
Shihabuddin had respect for the Sultan, but agreed to the plan of murderingSultan during the prayer. Sultan knew the treacherous moves of the Amir andShihabuddin and Shihab. They mercilessly stabbed by Tughlaq and began tocry for Shihab. So Tughlaq was a character who for his own sake turned a foeinto a friend. So there is a duality and doubleness in the characters. Sultan isan amalgam of contrasting elements. The mother and step mother of Sultanalso have double faces.
Najib is a politician and Barani is a historian. Both are contrastingcharacters Vizier Muhammad Najib is a one of the most favorite advisers ofthe Sultan who is suspected by the stepmother of Sultan as well as Barani.The step mother of Tughlaq hated him from within and poisoned to get rid ofhim and to stop king Tughlaq from violence in the country. But Barani dealtpeople without any prejudice. The contrasting thinking of Aaziz and Aazamenhances the interest of the play. Both Aaziz and Aazam acts on the orders ofMuhammad Tughlaq Aaziz are a dhobi and Aazam is pickpocket and deftthief. We find contrast between the idealism and practice, between religionand politics in the play. In Macbeth, Macbeth is a cousin of King Duncan. Hisheart filled with doubts, his anxious mind is a mixture of hope and fear. LadyMacbeth also advises him to be friendly to king Duncan and hatches a plotagainst him. She incites him to do the murder of the king. Macbeth arguedwith her but his wife screw up his courage. As soon as the murder discovers,he straight go to Duncan’s room and kills the two drunkard servants, to showthat no one but they killed the king. Here we find irony in the scene. Reality isdifferent but Macbeth behaves as if he is innocent. Malcom and Donalbainknew that the killer of their father is Macbeth.
Tughlaq and Macbeth are highly ambitious characters. Macbeth isambitious for the personal power and glory of a kingship. Tughlaq can verywell be compared with Christopher Marlows Dr. Faustus, who also has a lustfor learning. He also desires of power of honour and of omnipotence. Thelearning and intelligence of Tughlaq was acknowledged by everyone. He wantedto be a king, worthy to wear the royal robes, to be loved by the people of hisstate to gain their confidence. In his kingdom he expected to have love andpeace, but he got hatred, contempt and revolt. Even his mother did not talk tohim and step mother suspected him.

Research Journal of Social and Li fe Sciences, ISSN 0973-3914, Vol .-XIV- II, Year-07, June-2013138
Macbeth’s wife also ambitious, but for the power of Macbeth. Shenever thought of herself. Her aim was unselfish and all for his success. Thereis a striking contrast between Lady Macbeth and the two wicked daughters ofKing Lear. They are mere types, without any personal attributes. This isachieved by making them completely wicked and without a redeeming point ofcharacter. This shows that Shakerpear’s deep knowledge of humanity, no manor woman is of same kind. The best man has faults and the wicked has somegood points. In Macbeth, Lady Macbeth is a wicked but is truly humancharacter. In Tughlaq, the characters are not either good or all bad. They area mixture of opposites of vices and virtues. Tughlaq himself has many goodqualities but he is intriguer, murderer and over-ambitious. There are two ormore opinions about themselves. Muhammad is chief amongst them. The oldpeople find him irreligious, antiIslam and a romantic. The young opine that heis truly religious, human and idealist. Hence, he is an ambiguous and dominatingcharacter. When Macbeth and Banquo were returning from great battle, theymeet three witches. They made a prophecy and announced that the Macbethshall be the king of Scotland. He amazed at the prophetic greeting. He knewthat while the king’s son was alive he could not see the dream of the throne.Then they turned toward Banquo and announced him in a sort of riddling termto be lesser than Macbeth and greater, not so happy, but much happier.Witches’s prophesied that though he should never reign, yet his son after himshould be king of Scotland. In contrast, Tughlaq was much learned person,deep knowledge and a philosopher. He hears his own inner voice. He iswhimsical type of a person that is why he is called ‘Mad Muhammad’. Hehimself made intrigue and murder one by one. Tughlaq’s inner mind incitedhim but Macbeth is stirred by his wife. In this way their ambition craves forpower and glory. The Witches plants seed of wicked ambition in Macbeth’s mind and theinfluence of their words are seen in all the events that follow. Lady Macbeth isa very ambitious woman more cruel and determined than her husband. Thequickest way to become a king is to murder king Duncan.He not only murderthe king Duncan but also the two servants. When Malcom and Donalbainknew the guilty of the crime was Macbeth. However, he pretended that thetwo servants killed the king and innocent servants were murdered by Macbeth.Lady Macbeth was a woman of determined mind. She was the motive power,endowed with all the ruthless points of nature and iron resolution which herhusband did not possess. She had the willpower and no fears. Both are ambitiousin nature and their ambition was for the power. Tughlaq was statecraft. He didnot encounter any witches and ghost. He was a visionary and idealist. He hadhis own ideas which he wanted to translate into action. He was aware ofinjustice, killings, hatred in the kingdom. People had been facing the droughtand famine stalking the land and die unnoticed and unheard. There was riot for

Research Journal of Social and Li fe Sciences, ISSN 0973-3914, Vol .-XIV- II, Year-07, June-2013 139
food. He was ambitious and to retain his crown he commited murder one afteranother. Whenever he had in problems, he played chess and bends himselfseriously over the game. In Macbeth, Lady Macbeth helped to Macbeth to doany crime, but Tughlaq himself did all his acts. Macbeth killed four people-Duncan and his two servants and Banquo then he prepare to kill others inorders to protect his own safety. Only one could suspect his crime and he wasMacduff, the Thane of Fife. In fact, King Duncan was a well wisher andguest of Macbeth. He was a honoured guest who was murdered. In Tughlaq,Abbasiad Ghiyasuddin Muhammad was also guest of Sultan. He was alsomurdered by the host. So both Duncan and Abbasid Ghiyasuddin were murderedby their host. Both characters are highly ambitions and for the sake of crownthey do anything and everything. Whoever comes in the way they killed them.They commit crime after crime but they are not satisfied. Macbeth and Tughlaqare mentally disturbed and afraid of the secrets. Macbeth dreams of Banquo’sghost. His talking in dreams symbolizes the metal disturbances of Macbeth.Tughlaq after doing ill acts and injustices with the people was still not satisfied.He constantly thinks of past. He open and closes his eyes and appearsfrightened. He becomes a living body with a dead soul.Conclusion- Macbeth and Tughlaq are plays based on history. These menare ambitious in nature and for their own benefit they commit murder. Eventhey kill their kinsmen, trustworthy friend for the power. They play politics inthe kingdom their extraordinary willpower make them king but they falls.Macbeth is killed by Macduff and Tughlaq is helpless at the end of the play.There are a lot of similar qualities between the two characters. The Hamartiaof the two is their over ambitiousness.In Aristotelian term,Due to their tragicflaw they falls.======================References-1. Coville,Brook, ‘William Shakespear’s Macbeth’, Dial Books, NewYork,2004.2. Brooke,Nicholas, ‘Introduction in Brooke Nicholas’sMacbeth’, Oxford
University Press,2008.3. Babu, Sarath M, ‘The Rescue Triangle in Tughlaq,in the Plays of Girish Karnad’
(Edi) Jaydipsingh Dodiya,Sangan Books,New Delhi,1999.4. Punam Pandey, ‘The Plays of Girish Karnad -A Study in Existentialism’ Sarup
Pub.New Delhi, 2010.

Research Journal of Social and Life SciencesISSN 0973-3914, Vol.-XIV- II, Year-07, June-2013
A Study of Myths in the Burden and Fulfi l lment ofTyagaraja Paramasiva Kailasam
* Bhanu Pratap Singh==========================================================Abstract- The play 'fulfilment' has beautifully concealed the conflict ofhigh-born and low-born behind the curtain of the struggler for supremacyin archery. However, as the play belongs to pre independent India, thesecan be identified certain hints and suggestion of colonial expansion andthe exploitation of the have not like Eklavya.==========================================================
===========================* Departmentof English Govt. Maharaja P.G.College, Chhatarpur (M.P.)
Tyagaraja Paramasiva Kailasam has revealed himself as a greatplaywright of Indian dramas. Ancient Indian literature has lured him since hischildhood. He used to show keen interest in the stories of Mahabharata andRamayana told by his parents. As a result, his dramas are crowded with Indianlegendary characters. His plays are beautiful representation of themes takenfrom ancient Indian English literature. He has very intelligently taken up histhemes and characters from the Ramayana and the Mahabharata , two greatepics of India . It is because of his mythological themes that his plays writtenin English ,figure prominently in Indian drama in English of presentation insuch as they become a source of inspiration for the generation of today. Onthis aspect of T.P. Kailasam’s plays, K.R. Srinivasa Iyengar remarks, “ course, these are certain perennial situation that transcend place time and language.Thus T.P.Kailasam’s English plays –unlike his Kannada plays- are inspires bypuranic themes, but renders them brilliantly in the intellectual idiom of our onday”1. Kailasam’s English plays include The Burden(1933) , Fulfillment, ThePurpose, The Curse or Karna (1946) and Keechaka (1949) .All these fiveplays of Kailasam are based on various myths from the two epics of India-theRamayana and The Mahabharata. The play The Burden takes its theme andcharacters from the Ramayana . in the Valmiki Ramayana Bharata,Shatrughana’s returns from their grandfather’s place after the death ofDasaratha’s has been plainly narrated, but Kailasam has elevated this incidentto tragic heights in the Burden. The Burden “has a power and beauty of itsown.”2 While returning from their grandfather’s place to Ayodhya, Bharataand Shatrughana notice certain changes in the behavior and appearance of

Research Journal of Social and Li fe Sciences, ISSN 0973-3914, Vol .-XIV- II, Year-07, June-2013 141
people. By seeing the dimlit royal path they scent some catastrophe in thecapital.3 They first meet two aged chamberlains –at-court, who when enquired,stand tongue –tied. At last with great difficulty they get at the terrible truth thattheir father Dasaratha is dead and their brother Crown Prince Rama has beenbanished for fourteen years. They are totally upset. Bharata is so enraged thathe becomes wrathful “against his evil mother” and takes even the Royal PriestVasistha to task Son of Dasaratha, your duty is clear:
Learned and pious all,Kings and grey rained men assembled,Desire you to take the chair of stateFor due maintenance of lawAnd eternal dharma as in the dayOf your great father gone to Heaven.The chair of state is actually a ‘Burden’ that fate has placed on the
shoulders of Bharata.Kailasam has very significantly used myth of Bharatwho denounces his real mother Kaikeyi for manipulating kingship in his favouras well as renounces such kingship and kingdom. The ideal character of Bharatamust have been projected by the dramatist with a view to teaching a lesson tothose English lords and petty Indian rulers who were struggling hard andconspiring for their supremacy and selfish motives during the years of
Indians struggle for independence. Inspite of the limited scope fordelineation of character in this play, Bharata is exalted by Kailasam.4 There isa fine portrayal of Bharata, love for all, respect for elders and his superhumanattitude towards worldly affairs in the play.
Kailasam’s another play ‘Fulfilment ’ is almost the crown of his dramaticbeauty . It presents the terrible act of Krishna’s murdering of Eklavya and hismother too only in order to fulfill the purpose. Eklavya, a myth symbolizingdevotion to one’s teacher and dedication to one’s work, has been acclaimedand accepted as the most loyal pupil in history of the world. When rejected byGuru Drone for being his student on the ground of his belonging to the lowcaste of the Nisadha’s , Eklavya learns archery by the blessings of the clayimage of Guru Drone .He becomes an outstanding archer who stuns evenDrona and Arjuna by his unique feats. At the instance of Arjuna ,Guru Dronademands Eklavya‘s right thumb as his “Gurudakshina.” He does so instantly.Even after all this he is not spared to act according to his own will. He is goingto join the Kauravas on the eve of the Kurukshetra war. Krishna knows wellthe consequences of his shaking hands with Duryodhana. He tries to dissuadehim from doing so. But Eklavya is firm at his decision and says:
Nothing will stop me.......why with Partha’s bow trained against mybeloved Gurujee, my place is in the very van of the fray …….Partha , thesnake that has set out to sting the very one that taught it to sting does not thatGurujee’s other pupil is alive . But he soon will ! With my shafts will I put out

Research Journal of Social and Li fe Sciences, ISSN 0973-3914, Vol .-XIV- II, Year-07, June-2013142
eyes that irreverently aim arrows at Gurujee. ! I will slither the arms that raisea bow against Gurujee ! (in a final burst of frenzied fury ) stop me ! Nothingwill stop me.5 These words of Eklavya are expressive of his loyalty and sincerityto his “Gurujee” and his anger and desire for Vengeance upon Arjuna. Whenfailed to convince him, Krishna engages him in a debate about first and lastthings, about man’s duty, about good and evil, about courage and cowardice.At last, while Eklavya goes on narrating the story of the Bird’s Tree, Krishnastabs him at the back, and them reveals him his divine nature. He likes Eklavyato protect Arjuna. And he will kill many others too for the sake of Arjuna.When Eklavya asks him why he has killed him stealthily, Krishna justifies hisact of killing with the words, “It is the purpose of killing, and not the manner ofthe killing that decides the fairness of the killing.” He knows well that Arjunamust be protected at all costs for the benefit of the mankind. He is the destinyof both Arjuna and Eklavya, but in order to protect the former he kills thelatter. This intention of Krishna is shrouded in divine mystery. He puts an andto the life of Eklavya not to take revenge but to fulfill his destiny Eklavyarealizing it well feels himself fortunate to have been killed by Lord Krishnahimself. However dying he requests Krishna to save his mother from the painand pangs of her son’s death. He fulfills this purpose also by murdering mothertoo. Krishna fulfils the purpose of protecting Arjuna, sending Eklavya to Heavenand saving his mother from even a moment’s misery of losing her son. Thepurpose is fulfilled.
The play ‘fulfilment’ has beautifully concealed the conflict of high-bornand low-born behind the curtain of the struggler for supremacy in archery.However, as the play belongs to pre independent India, these can be identifiedcertain hints and suggestion of colonial expansion and the exploitation of thehave not like Eklavya.======================References-1. K R. Shrinivasa Iyengar,Indian Writing in English,(New Delhi:Sterling Publishers
Private Limited), p.2362. Ibid.p2363. Valmiki,The Ramayana4. S.Krishna Bhatta, “Kailasam’s English Plays”,Perspectives on Indian Drama in
English,Edited by M.K.Naik et al. (Madras:Oxford University Press,1977) p.875. T.P.Kailasam, Fulfilment.

Research Journal of Social and Life SciencesISSN 0973-3914, Vol.-XIV- II, Year-07, June-2013
Computer Aided Language Learning: It's Impact onRural Students
* Amit Purushottam==========================================================Abstract- The widespread use of computer courseware in numerous fieldsand domains has given quite an impact on education especially on thesecond and foreign language education. With the advent of technologies,courseware with multimedia elements and interactive contents haveemerged to assist English language teaching. Since teachers areconsidered as the guardians of the classrooms, it is important to lookinto another alternative as a potential assistance to language learningthat courseware can offer.==========================================================
===========================* Assistant Professor, Department of English (Humanities) University College
of Engg. And Tech.Vinoba Bhave University, Hazaribagh
The possibility of using computers in the teaching of grammar hasdominated discussions of many educationists and applied linguistics especiallyin the field of computer-aided language learning (CALL). Many studies havebeen conducted on CALL, but they are still inadequate to support the idea thatCALL is effective in all aspects of language teaching including the teaching ofgrammar by using computer. These studies concentrated mostly on perceptionsof teachers and students, attitudes and motivation towards CALL. The use ofcomputer is fast developing in language learning. Language educationists havebeen integrating the use of computer in teaching. Many educational coursewareare developed to help teaching and learning of English. Authoring tools as theyare termed are used to develop courseware and various media elements to beintegrated in the courseware to enable effective teaching by using computers.Levy states that “Computer-assisted language learning (CALL) has beendefined as the study of applications on the computer in language teaching andlearning”. These application and courseware can be delivered through CDROM, intranet or internet. Today computer assisted language learning exploitsimproved technology to produce highly interactive learning environments,providing effective support for the acquisition of listening, speaking, readingand writing skills. This research has been undertaken to make the rural studentsof Jharkhand comprehend the complex structures and the rules of grammar as

Research Journal of Social and Li fe Sciences, ISSN 0973-3914, Vol .-XIV- II, Year-07, June-2013144
they find it very difficult to comprehend the grammatical elements of the Englishlanguage in the traditional method of teaching. So, computers were introducedto assist language learning to the students and there was a marked improvement.They were more enthusiastic, passionate and zealous to learn the language.They were able to comprehend the grammatical elements and the scores weremuch better when compared to the traditional method of teaching grammar.This paper presents results from two experiments which used computer-basedgrammar and teacher-driven grammar (chalk and talk) instructional methods.Each method involves teaching verb tenses using two deductive approaches(a) the initial rule-oriented approach (involves initial presentation of explicitrules followed by illustrative examples) and (b) the structure-guessing approach(involves explicit presentation of rules in response to structure guessingexercises). The effectiveness of these methods and approaches are comparedbased on the results obtained from the post-test administered at the end of theexperiment. The results reveal significant differences between the groups infavour of the computer-based grammar instructional method. The proficiencylevel was much higher and the students were able to perform much better inthe test.
Although computer-based grammar instruction offers many potentialbenefits, the use of computers to teach grammar has not received the sameamount of attention as communicative CALL. Although it is currently impossiblefor the computer to engage learners in authentic two way communication, it is,in fact, possible for CALL to provide rich input in the form of integratedmultimedia programmes and to provide explicit grammar explanations that canbe viewed and reviewed at the learner’s own pace. In this research on the useof multimedia to teach a variety of subjects, it was found that, in general,multimedia instruction reduces learning time by 30% compared to traditionalinstruction. They further demonstrated that features of multimedia instruction,such as learner interactivity and learner control over programmes, produceimproved outcomes in achievement. Students find chances for improvementin a CALL environment which is unavailable in traditional L2 classrooms.Learners can receive immediate feedback about their answers and correcttheir errors from the system. CALL also allows each student to work at hisown pace. The present study examined whether computer-based grammar isas effective as teacher driven grammar instruction for rural high school studentsof Jharkhand. It also aimed to compare two deductive approaches: (a) initialrule-oriented approach that involves initial presentation of explicit rules followedby illustrative examples and (b) structure-guessing approach that involves thepresentation of explicit rules in response to structure-guessing exercises. Thecomputer-based structure guessing instruction involved a programme thatprovided the learners with the rules after the time given to thinking and guessing,whereas, the computer-based initial rule-oriented grammar instruction involved

Research Journal of Social and Li fe Sciences, ISSN 0973-3914, Vol .-XIV- II, Year-07, June-2013 145
presenting the rules followed by illustrative examples and applications.The study focused on the relative effects of structure-guessing and initial
rule-oriented deductive approaches on the acquisition of English verb tenses incomputerized and traditional (teacher-driven) settings. This study addressedthe following questions:1. Are there any significant differences between the groups of learners
due to method of instruction (computer-based grammar instruction vs.teacher-driven grammar instruction)?
2. Are there any significant differences between the groups of learnersdue to teaching approach (structure-guessing grammar instruction vs.initial rule-oriented grammar instruction?
3. Are there any significant differences between the individual verb tensesdue to method of instruction (computer-based grammar instruction vs.teacher-driven grammar instruction), and teaching approach (structure-guessing grammar instruction vs. initial rule-oriented grammarinstruction)?
4. Do computer-based structure-guessing and initial rule-orientedinstructional treatments have an effect on acquisition of verb tenses asmeasured by the post-test?
5. Do teacher-driven structure-guessing and initial rule-oriented instructionaltreatments have an effect on acquisition of verb tenses as measured bythe post-test? This study was conducted at a high school in Ranchi. Thesample of the study consisted of 40 students from class 10This course aimed to train students in basic sentence structure with
gradation moving from the simple to the complex. Emphasis was also laid onthe extensive use of exercises and sentences in the classroom. However, thepresent study was limited to the following verb tenses: simple present, simplepast, present perfect, present continuous and simple future. The sample of thestudy was divided into four groups taught by the same instructor forming twoexperiments based on the teaching method:• Group 1: Computer-based structure-guessing instruction,• Group 2: Computer-based initial rule-oriented instruction,• Group 3: Teacher-driven structure-guessing instruction, and• Group 4: Teacher-driven initial rule-oriented instruction.
The purpose of having two experiments was to examine the acquisitionof verb tenses in English in computer-based and teacher-drivenenvironments.The researcher of the present study designed software forteaching the material using PowerPoint programme. It was chosen because itis available with Windows system and easy to use. The computer-basedinstructional software provided the students with help about how to use theprogramme, applications about the rules, formative evaluation with questionshyperlinked to model answers, more information which provides feedback such

Research Journal of Social and Li fe Sciences, ISSN 0973-3914, Vol .-XIV- II, Year-07, June-2013146
as enrichment activities, post-test, and useful links that included links relatedwebsites. In addition, the programme included sound, graphics, and animationto make the material clear and interesting. The material was presented in twoversions: a printed version for the teacher-driven groups (3 & 4) and acomputer-based version for the computer-based groups (1 & 2). In eachversion, the material was presented using two deductive approaches: structureguessing grammar teaching and initial rule-oriented grammar teaching. Bothversions were identical in terms of the verbs, sentences and dialogues used,except for the difference in the feedback the students receive. The instructorprovided feedback in the printed version and the computer programme providedfeedback in the computer-based version. The material was authentic, and theactivities were communicative and task-based. The verbs were practiced incontext. The researcher has designed the material and tailored it to suit thepurpose of the study. That is, the training material for Group 1 and Group 3was presented according to the structure-guessing deductive approach in whichthe rules were preceded by clarifying examples, exercises and a test. Thestudents were then required to elicit the grammatical rules before they had anaccess to the answer. However, the training material for Group 2 and group 4was presented differently. The rules were presented first, followed by clarifyingexamples, exercises and a test. The exercises and tests were followed byfeedback about the students’ answers. Each verb tense was presentedseparately; however, the exercises and quizzes or tests were mixed. Forexample, two verb tenses were included in the exercises or quizzes, and morethan two tenses were included in the tests. Presentation of the verb tensesincluded real-life situations, such as dialogues. Different types of exercisesand practice such as fill-in-the-blank, click the correct answer, match sentenceand tense, and multiple-choice questions. Illustrative pictures were added tomake the context clear. A pre-test was used to measure the subjects’ knowledgein verb tenses and to find out if there were any significant differences amongthe groups before and after the treatment. The test was about the courseobjectives related to the five English verb tenses: simple present, presentcontinuous, simple past, present perfect, and simple future. Ten multiple-choicequestions were dedicated for each of the tenses. Each question was followedby four choices; one is the model answer and the others are distracters. Thetenses were all mixed into the same context, so students have to choose betweendifferent tenses. The pre-test was administered two days prior to the beginningof the treatment. The purpose of the pre-test was to see if all the four groupswere equal in terms of their English verb tense knowledge so that any significantdifferences found at the time of the post-test will be due to the effect of thetreatment. The results of the pre-test showed that there were no significantdifferences between the four groups participating in the experiment. At theend of the experiment, after four weeks, the same test was used as the post

Research Journal of Social and Li fe Sciences, ISSN 0973-3914, Vol .-XIV- II, Year-07, June-2013 147
test. The computer-based grammar instruction groups took a computerizedtest, whereas the teacher-driven grammar instruction groups took a paper-based test. All students in the four groups were taught the same verbs tenseswhich were presented differently, however, they were given the same activities.Students first practiced each tense in isolation. Group 1 studied and practicedgrammar according to the structure-guessing deductive computer approach.Computer-based structure-guessing grammar instruction refers to presentinggrammar items in context (e.g., a dialogue). Students could read and listen tothe sentences and dialogues, and they were asked to elicit the grammaticalrules from examples and applications given previously. The instructor used tosend the students a file which contained examples and applications illustratedby sound, graphics, and animation. Students were divided into small groups,and they were asked to discuss the examples to arrive at the rules/forms.Each group reported their answer, and then the instructor asked them to clickthe icon on the screen that provided them with the rules/forms. More exampleswere then presented. Finally, they were asked to do some activities whichprovided them with immediate feedback regarding their answers along withan explanation. On the other hand, the same structure-guessing deductiveapproach was adopted in teaching Group 3, but by the teacher-driven methodwhere the same training material was presented to the students, but on paper.However, Group 2 did the same activities according to the initial rule-orienteddeductive computer approach. Computer-based initial rule-oriented grammarinstruction refers to presenting rules to learners followed by samples of thegrammar items in context. Students can read and listen to the sentences anddialogues. They were also divided into small groups, who did some of theexercises collaboratively, and each group reported their answers, and then theinstructor asked them to click the icon on the screen that provided them withfeedback. Similarly, Group 4 was taught according to the initial rule-orienteddeductive approach, but by the teacher-driven method where the same trainingmaterial was presented to the students, but on paper and the teacher providedthe feedback. In the post test there was a significant difference in theperformance of the students who were taught using computers. Grammarwas usually taught by using traditional method before the availability of computerin the classroom teaching. Grammar lessons were always viewed as complexto students, and teaching grammar was challenging. Teachers always rely onblackboard and poster as their teaching aids. With the finding on theeffectiveness of computer in grammar teaching, computer with all the multimediacan be effectively used for teaching of grammar. Graphic images, clear photo,sound and videos can be used to help teachers in grammar teaching. Grammarlesson will become more effective, motivating and interesting. However tomake teaching of grammar more effective, it should be supported with suitableteaching method with teacher themselves skilled in computer. The role of

Research Journal of Social and Li fe Sciences, ISSN 0973-3914, Vol .-XIV- II, Year-07, June-2013148
language teacher should change when multimedia is going to be introduced inclassroom. Therefore, the training of teacher in teaching using computer shouldbe done on a regular basis. This means that the school administration mustcome up with systematic training courses to prepare the teachers for this newchallenge in classroom teaching. Training of teachers in the use of computer inclassroom and the methodology of teaching by using computer can be carriedout as a preparation for the full force use of computer in school. Schooladministrators can now confidently plan the integration of computer in grammarteaching. They must equip their schools with computer facilities to make surethat every teacher and student has the opportunity to have technological-basedteaching and learning environment. Teachers can play a more active role incomputer-based classrooms. Instead of being merely the instructors, they canalso be the designers of their own instructions by producing a customizedcourseware which could cater to the students’ needs. They can alwayscreatively design the content of the courseware in making teaching and learningmore meaningful. Students can use courseware to study grammar and withthe guidance from a skilled teacher, grammar can be learned effectively andinterestingly. The courseware to teach grammar can be strengthened withother multimedia elements like video and animations and these will help studentsto understand complex concepts in grammar.======================References-1. Levy, M. Computer-Assisted Language Learning: Context and
Conceptualization. New York: Oxford University Press, 1997.2. Nutta, J. ''Is Computer-Based Grammar Instruction as Effective as Teacher-
Directed Grammar Instruction for Teaching L2 Structures?'', CALICOJournal,1998.
3. Smith, Patricia and Ragan, Tillman. Instructional Design. New York: John Wiley& Sons, 1993.

Research Journal of Social and Life SciencesISSN 0973-3914, Vol.-XIV- II, Year-07, June-2013
Emotional Sensitivi ty as a Factor in ManagerialEffectiveness: A Study of Development andValidation of Emotional Sensitivi ty Training
* Sakshi Mehrotra==========================================================Abstract- The current study aimed at framing and administering anemotional sensitivity training program to enhance the managerialeffectiveness of middle line managers. The training module was basedon guidelines of Consortium for research on emotional intelligence. Thismodule was administered to a sample of 50 male, married bank managersin the age group of 35- 45 years who had low baseline scores on emotionalsensitivity and follow up scores were taken after 15 days and 1 month ofthe training program. The pre- training and post- training scores onemotional sensitivity and managerial effectiveness were compared usingANCOVA to judge the efficacy of the emotional sensitivity training module.The results showed a significant improvement in emotional sensitivity andmanagerial effectiveness scores of the middle line bank managers,implying the effectiveness of training module adapted on guidelines ofConsortium for research on emotional intelligence on the sample of Indianmanagers in raising their emotional sensitivity and managerialeffectiveness.==========================================================
===========================* Assistant Professor, Amity Institute of Psychology and Allied Sciences, Amity
University. Noida
Introduction- Contemporary management scientists and behaviourpsychologists have been constantly challenged in understanding the role of‘emotions’ in organisational behaviour and its subsequent importance toorganisational leadership. With the emergence of emotional intelligence therehave been changes in organizational backcloth having led emotions to emergefrom the shadows and come to the centre stage. With the advent of EI as anew resource for organizational development, emotions have been transformedfrom negative and irrational to positive critical success factors, and EI hasbeen touted as vital to leadership effectiveness (Goleman, 1998). The demandsand expectations from the people working in organizations have taken a 180degrees turn. With the advent of emotional intelligence, the pro- emotionorganizational arena including organizational psychologists and human resource

Research Journal of Social and Li fe Sciences, ISSN 0973-3914, Vol .-XIV- II, Year-07, June-2013150
developers have given as much importance to EQ as has been given to IQ andtechnical know-how for effective functioning at all levels of workforce,maximally for those who lead the pack. Dalip Singh (2003) defines Emotionalintelligence as “the ability of an individual to appropriately and successfullyrespond to a vast variety of emotional stimuli being elicited from the inner selfand immediate environment. According to him Emotional intelligence constitutesthree psychological dimensions- emotional competency, emotional maturity andemotional sensitivity, which motivate an individual to recognize truthfully,interpret honestly and handle tactfully the dynamics of human behaviour. Thefirst step to achieving emotional intelligence lies in Emotional sensitivity- towardsself and others. Only a manager who is emotionally sensitive can acquire theskill of further managing emotions of one’s own self and those around. Thecurrent research examines the role of sensitivity training in enhancingmanagerial effectiveness of employees in an organization.Emotional Sensitivity constitutes understanding threshold of emotional arousal,managing the immediate environment, maintaining rapport, harmony andcomfort with others. It involves being honest in interpersonal dealings,interpreting emotional cues truthfully, and realizing communicability of emotions,moods and feelings. It is about having an insight into how others evaluate andrelate to you. A detail description of the sub components is given below:Understanding the threshold of emotional arousalMangers should be in a position to respond to stimuli of low intensity. Equallyimportant is the ability to be aware of the relationship between feelings andactions.Empathy- Empathy is the ability to sense how other people feel. It is theability to share and accept another person’s feelings. It is also the ability to beable to distinguish between what others do or say and one’s own personalreactions and judgments.Improving interpersonal relations- The key to good interpersonal relationsis the belief in basic elements of trust, confidence and reliance. Researchshows that the basic cause of failure among executives is poor inter relationsat work, resulting in stress and anxiety and lack of trust in othersCommunicability of emotions- The influence of emotions is contagious adis communicated from one person to another instantaneously. A cheerfulmanager communicates a message of confidence and self respect. In contrast,expressions of negative feeling by a manager communicate a message ofpessimism, bitterness, suspicion and inferiority. Hence, managers should learnhow to communicate positive emotions through verbal and non verbal mediums.It has been accepted that sensitivity about one’s strength and weaknessfacilitates personal as well as managerial effectiveness.McClleland (1998) did a study on leaders in 30 different organizations. Itwas found that the three most powerful leadership differentiators were

Research Journal of Social and Li fe Sciences, ISSN 0973-3914, Vol .-XIV- II, Year-07, June-2013 151
developing others, adaptability and influence (components of EQ) includingothers .In a study of relationship between EI strengths of the division heads ofa global food and beverage company and business results, it was found thatdivisions of the leaders with a critical mass of strengths in EI competenciesoutperformed yearly revenue targets by a margin of 15 to 20 percent. On theother hand, the divisions of the leaders weak in EI competencies underperformed by about the same margin (Goleman, 1998).Johnson (1999)focused on the consequences of emotional insensitivity of managers in theorganizations. It was found that emotionally dumb managers not only destroytheir team but also incur losses to the organizations, loose momentum andbecome ineffective.Witt, Burke, Barrick and Mount (2002) Meta-analytic studies have shownthat conscientiousness and emotional stability have been the most consistentpredictors of job performance across diverse job families. In 5 of 7 independentsamples of employees, those high in conscientiousness who were also low inagreeableness (interpersonal awareness and interpersonal skills) receivedsignificantly lower overall ratings of job performance compared to those highin agreeableness.Aim- The current study aimed at framing and administering an emotionalsensitivity training program to enhance the emotional sensitivity and subsequentlythe managerial effectiveness of middle line managers.Hypotheses-• It was expected that emotional sensitivity of experimental group would
significantly increase from pre to post-training period.• It was expected that managerial effectiveness of the experimental group
would significantly increase from pre to post-training periodMethodology-Sample: Employees of private sector banks were targeted for the study. Thedemographic variables that were controlled for the study were the gender(males), age of the managers (35-45 years), marital status (married).Averagemonthly income of the managers (35000INR) and work experience (varyingfrom 8 to 10 years) was also controlled. Fifty managers (5 groups of 10 each)were randomly allotted the experimental group. The experimental groups weretrained on emotional sensitivity for 2 days. Follow ups were done at regularinterval of 15 days and 1 month.Tools:Emotional Intelligence Scale (Chadha and Singh, 2003)- The EmotionalIntelligence Scale (Chadha and Singh, 2003) is based on the operationaldefinition proposed by Dalip Singh (2003) that ‘emotional intelligence is theability of an individual to appropriately and successfully respond to a vast varietyof emotional stimuli being elicited from the inner self and immediateenvironment. Emotional intelligence constitutes three psychological dimensions,

Research Journal of Social and Li fe Sciences, ISSN 0973-3914, Vol .-XIV- II, Year-07, June-2013152
emotional sensitivity, emotional maturity and emotional competency, whichmotivate an individual to recognize truthfully, interpret honestly and handletactfully the dynamics of human behavior’. The test is designed in such a waythat it measures all the three dimensions. This test includes 22 situations thatmeasure an individual’s usage of emotional skills in personal and professionallives. The subjects are provided with multiple- choice answer type questions.Scores are available on components of emotional sensitivity, emotional maturity,and emotional competency as well as a composite emotional intelligence score.Percentile norms are available for interpretation. For the current study onlythe scores on emotional sensitivity were used. This test has beenstandardized for professional managers, businessmen, bureaucrats, artists andgraduate students. The test has a test- retest reliability of 0.94 and split- halfreliability of 0.89. The validity of the test is 0.89.Managerial Effectiveness Questionnaire (Pareek, 2002)- This scale hasbeen developed by Pareek and it covers three factors and has 15 statements.Pareek has used personal effectiveness and managerial effectiveness in thesame sense and meaning. According to Pareek, if a person is effective on thisscale, he will be an effective manager. This scale has three important aspectsrelated to the attitude and behaviour of a manager in job namely self disclosure,openness to feedback, and perceptiveness. There are 15 situations to be ratedon a 5 point scale. Item 1, 3,4,5,6,10,11,12 and 15 have reversed scoring.Cronbach’s co-efficient alpha of the test for health managers is 0.90.Procedure- The procedure of the study was in two steps:• Designing the Emotional Sensitivity Training Module• Administering and testing the efficacy of the module.The module comprised of preparation and training phases. Preparation phasecomprised of• Assessing the individual• Encouraging people to participate• Adjusting expectations• Gauging readinessTraining was based on guidelines provided by Consortium for Research onEmotional Intelligence (Cherniss and Goleman, 1998) focused on:• Fostering a positive relationship between the trainers and learners• Setting clear goals• Breaking goals into manageable steps• Making change self directed• Providing opportunity to practice• Giving performance feedback• Using models, experiential methods, case studies etc.Preparation- For the preparation stage, visits were made to the organizationsto assess their specific needs in context of their work culture and climate,
Research Journal of Social and Li fe Sciences, ISSN 0973-3914, Vol .-XIV- II, Year-07, June-2013 153
work relations; work structure etc. Emotional intelligence and Managerialeffectiveness questionnaire was administered to managers to assess theirbaseline levels of emotional sensitivity and managerial effectiveness. Feedbackwas given to them about their scores. As much was possible, they were allowedto decide whether or not they wanted to participate in the development process.Training- Following was the flow of the training that spanned over 2 days.Day-1 SESSION 1 (Introductory)Objectives:• Getting to know each other• Understand the concept of emotional competence• Study the goals of the training program• Express the expectations from the training programContents:• Introduction of the trainer.• Ice breaker exercises• Conceptual framework of emotional competence.• Listing of expectations through brain storming session.
Method- Group exercises, power point presentation, use of white boardDAY-1 SESSION 2: SELF AWARENESS (Getting closer to one’s emotions)Objectives:• Identify emotions.• Insight into one’s emotions at workplace• Know how to appraise the effect of emotional reactions to situations.• Frame alternate responses to same or similar situationsContents:• Exercises to throw light on one’s prominent emotional reactions at
workplace.• Activities to identify feelings.• Exercises to identify signals of emotional upheavals.Method: Self report method, simulation exercises, group discussions, feedbacktechnique.DAY 2:EMPATHY (Sensitivity to others’ emotions)Objectives:• Ability to be an active listener.• Gauging emotional expressions• Identify gaps between the expressed and the received emotions of others.• Acquisition of skills to empathetically understand others.Contents:• Recognizing emotions of individuals and accurately labeling them.• Developing sensitivity to other’s point of view

Research Journal of Social and Li fe Sciences, ISSN 0973-3914, Vol .-XIV- II, Year-07, June-2013154
• Genuine and active listening in workplace.Method- Group discussion, self report, simulation exercise, role play, powerpoint presentation.Statistical Analysis: The efficacy of the training was tested by taking prepost emotional sensitivityscores and managerial effectiveness scores of thesubjects. ANCOVA was calculated to find out the significance of differencebetween the pre training and the post training scores.Results and DiscussionTABLE 1 Showing Means and SD of experimental group for Time 1
and Time 2 of evaluation on Emotional SensitivityCOMPONENT PRE TEST POST TEST 1 POST TEST 2
MEAN SD MEAN SD MEAN SD EMOTIONAL TREATMENT 49.5 9.46 70.75 14.14 79.087 11.29 SENSITIVITY CONTROL 52.3 6.484 51.34 6.48 51.81 6.15
TABLE 2: Summary Table of ANCOVA on EQ and ManagerialEffectiveness
COMPONENT VARIABLE SUM OF SQUARES Df MEAN SQUARE F Post Test 1 Covariate 3065.005 1 3065.005 33.81 EMOTIONAL Group 9143.065 1 9143.065 100.856** SENSITIVITY Error 8793.495 97 90.655 Post Test 2 Covariate 3991.397 1 3991.397 94.13 Group 18061.805 1 18061.805 425.955** Error 4113.103 97 42.403 Post Test 1 Covariate 990.524 1 990.524 250.841 MANAGERIAL Group 1548.835 1 1548.835 392.227** EFFECTIVENESS Error 383.036 97 3.949 Post Test 2 Covariate 854.021 1 854.021 127.792 Group 2046.96 1 2046.96 306.299** Error 648.239 97 6.683
** Significant at p<0.01The ANCOVA for emotional sensitivity was significant in time1 and
time 2 evaluations (F= 100.856, p<.001) and (F= 425.955, p<.001) respectivelyas shown in Table-23 and Table- 24.
This reveals that the experimental group who were subjected to theEmotional Sensitivity Training showed a significant improvement in scores ofemotional sensitivity as compared to control group who did not receive anytraining during time1 of evaluation and sustained those significant enhancementsduring time 2 of evaluation. The training module has clearly had an impact onthe training group and has led to an enhancement in their abilities to understandtheir emotions as well as those of others around- be it their boss, co worker orcustomer. There has been a boost in their capacity to understand sub thresholdemotions that play a very critical role in communication at workplace. Beingempathetic towards others’ feelings and accepting them as they are is a criticalfactor in team effectiveness which is one of the indices of managerialeffectiveness. A better emotional sensitivity is the first step to have effectiveself-regulation in one’s response towards varied situations. The emotional

Research Journal of Social and Li fe Sciences, ISSN 0973-3914, Vol .-XIV- II, Year-07, June-2013 155
sensitivity leads to conscious use of self in a controlled manner and regulateone’s emotional involvement and attachment to varied situations. Emotionalsensitivity towards others leads to the betterment of interpersonal relations atwork (Sosik and Megerian, 1999; Mathur, 2000). Besides the literatureon emotional intelligence training effectiveness that is made up of subcomponents like emotional sensitivity, emotional maturity and emotionalcompetence, there are research studies that support the above mentioned ideathat emotional sensitivity training specifically leads to an increased self esteem,self control, understanding, social support and communication (William andWilliam, 2001). The emotional sensitivity training of the sample has not onlyled to a significant increase in emotional sensitivity scores but also managerialeffectiveness scores (The ANCOVA for managerial effectiveness wassignificant both during time1 and time 2 periods (F= 392.227, p<.001) and (F=306.299, p<.001) ) which shows that in an organization, the individual’s level ofemotional sensitivity would make a lot of impact on his effectiveness as amanager. the training group had an enhancement across the elements ofmanagerial effectiveness namely self disclosure, openness to feedback andperceptiveness. The participants in the training group developed an ease inexpressing their feelings at workplace. They reported that they found the trainingto be helpful in getting them closer to their group hence promoted a more frankapproach towards other colleagues. The reservations in organizationalcommunication that the managers felt before participating in the training werelowered to an extent. They also improved their receptivity towards feedbackof other people in the organization. The training facilitated an enhancement intheir ability to listen carefully to opinion of others and be patient about others’opinion about them too. They showed an increased interest in seeking feedbackfrom superiors and subordinates about their style, behaviour etc.
It can be concluded that being emotionally competent contributes to anindividual’s managerial effectiveness. Looking at the corporate work conditionsin today’s time, emotional competency training has become more of a necessityrather than a choice. The current study paves way for further research ontraining and development of managers for a successful and productive worklife.======================References-1. Chadha, N.K. (2001) Emotional Quotient intelligence Test. In Singh, D. Emotional
intelligence at work : A Professional Guide. New Delhi: Sage.2. Cherniss,C. & Goleman,D.(2003) “Guidelines for Best Practice”, available at
www.eiconsortium.org3. Goleman, D, (1998b). What Makes a Leader. Harvard Business Review.
November-December, pp. 93-104. Johnson, L. (October, 1999). Emotional Intelligence. Executive Excellence.

Research Journal of Social and Li fe Sciences, ISSN 0973-3914, Vol .-XIV- II, Year-07, June-2013156
5. Mathur, D.M. (2000) Emotional Intelligence in Effective Management. HumanCapital, 39(11), 19-21
6. McClelland, D. C. (1998). Identifying competencies with behavioral-eventinterviews. Psychology Science, 9, 331-340
7. Pareek, U. (2001) Training instruments in HRD & OD. New Delhi: Sage, 34-408. Singh,D.( 2003).Emotional Intelligence at Work: A Professional Guide,2nd ed.
New Delhi: Sage.9. Sosik, J.J., & Megerian, L.A. (1999). Understanding leader emotional intelligence
and performance: The role of self other agreement on transformationalleadership perceptions. Group and Organization Management, 24(3), 367–390
10. Witt, L., Burke, L., Barrick, M. & Mount, M. (2002). The interactive effects ofconscientiousness and agreeableness on job performance. Journal of AppliedPsychology, 87, 164-169
izks- cztxksiky 'kqDy41@42] j?kqoa'k lnu] fcfN;k] jhok (e-iz-)& 486001
Phone - (07662) 255177, 9425186437 E-mail - [email protected] [email protected]
lsUVj QkWj fjlpZ LVMht] jhok }kjk fjlpZ tjuy vkWQ vkV~Zl eSustesUV ,.M lks'ky lkbalsl
ds fo'ks"kkad ds :i esa fuEufyf[kr nks lanHkZ iqLrdksa dk izdk'ku uoEcj] 2013 esa fd;k tk jgk gSA
mDr lanHkZ iqLrdksa esa izdk'ku gsrq vki viuk rF; ijd ,oa rdZ ;qDr 'kks/k i= Hkstdj bl vdknfed dk;Z esa lg;ksx dj ldrs gSaA fgUnh Hkk"kk esa 'kks/k i= ,e-,l- oMZ esa QkUV df̀rnso 010] djsDVj lkbt 14] Mcy Lis'k_
vaxzsth Hkk"kk esa VkbEl U;w jkseu QkUV lkbt 14] Mcy Lis'k esa HkstsaA
(vkbZ-,l-ch-,u- 978&81&87364&59&7)
(ISBN 978-81-87364-60-3)Contemporary Indian Society and Culture
ISSN 0975-4083

Research Journal of Social and Life SciencesISSN 0973-3914, Vol.-XIV- II, Year-07, June-2013
Effect of Plyometric Training on Selected MotorComponents Among College Girls Students
* Neeta N. Chauhan==========================================================Abstract- The purpose of the study was to find out the effect of plyometrictraining on selected motor components among college girls students. Toachieve the purpose of the study 40 girls students were selected fromUma girls college, Ahmedabad and their age ranged between 17 to 21years. The selected subjects were divided into two equal groups of twentysubjects in each. One was treated as experimental group and the secondone was control group. The experimental group were underwent trainingwith a set of different plyometric exercises for 3 days a week for theduration of 6 weeks. The control group was not involved in any training.The pre test and post test means of each group was calculated by applyingT- test. It was concluded that plyometric training improves the selectedcomponents of experimental group in the comparison to the control group.This training is more effective for the development of explosive powerthan speed and abdominal muscular strength of college level girls student.==========================================================
===========================* P.E. Teacher, HBK High School, Ahmedabad.
Introduction:- Sports performance is the result and expression of the totalpersonality of the sportsmen’s physical fitness, techniques and tactics. In additionto this given the nature of sports athletes and sports champions have variousneeds, priorities and preferences in terms of physical fitness and motor fitnessstatus. In other words, all sports hold individual requirements in strength,endurance, power, flexibility and speed, or a combination of them. Which varyfrom one sport to other. Developing as individual physical fitness is one of themajor objective of the process of the physical education. Physical fitness isone of the potential characteristics of every human being.It is widely acceptedthat regular physical exercises enable the individual to stay physically fit and tosustain the average individual in his daily activities. However anybody whowishes to participate successfully in games and sports, aspires to be a championor to reach at the top level he must go beyond the single rules of regularphysical exercises. Sports training is a systematic process extending over along period. For best result the system of training has to be based and conducted

Research Journal of Social and Li fe Sciences, ISSN 0973-3914, Vol .-XIV- II, Year-07, June-2013158
on scientific facts and lines where it is not possible to that, the training has tobe based on the result of sports. Plyometric refers to exercises that enables amuscle to reach maximal strength in as short time as possible. Such exercisesusually involve some form of jumping, but other models of exercise exist. Theelements ply and metrics come from Latin roots for “increase” and “measure”the combination thus means “measurable increase”. This exercise are especiallyuseful in sports that require speed strength include track and field event likejumping, throwing and sprinting, volleyball, basketball and diving, blocking andtackling in football. This training is a very popular and effective organizationalform of doing physical exercise. In plyometric training, numbers of exercisesare done in the form of jumping. It can be used for the improvement of technicaland tactical elements or for the improvement of conditional abilities. But it isshown that plyometric training is particularly effective for improvement of thespeed, and muscular strength and explosive power. It is needed to find out theeffect of plyometric training on selected motor components for the purpose todevelop the physical fitness of college girls. It was hypothesized that this trainingsignificantly improves speed, abdominal muscular strength and explosive powerof college girls. And this training significantly improves explosive power in thecomparison to the speed and abdominal muscular strength. The study has itssignificance as finding of this research study would give a basic knowledge tothe trainers and fitness leaders to investigate and conduct further research invarious training methods, training programmes, and training intensity to enhancethe performance of college students and players. This study would give anopportunity to encourage interested coaches and physical educationalist toconduct further studies for different aspects of plyometric training.Materials and Methodology-Subject- The study was conducted on 40 girls students of Uma girls college,Ahmedabad. Their age ranged between 17 to 21 years . the subjects wereequally divided into two groups one as experimental group and one as controlgroup.Data collection- The pre test and post test was conducted to collect data byadministrating the test as per the standardized procedures before and after thesix weeks of the training programme. The data of selected variables like speed,abdominal muscular strength and explosive power has been collected from50m run, bent knee sit ups and standing broad jump test.
No. variable Test Measurement Unit 1 Speed 50m Run Time is measured up to hundredth
of a second 2 Abdominal
Muscular strength
Sit ups Counts is measured for 30 seconds
3 Explosive power
Standing broad jump
Distance is measured in meters and centimetres.

Research Journal of Social and Li fe Sciences, ISSN 0973-3914, Vol .-XIV- II, Year-07, June-2013 159
Administration of training- The training for the experimental group wasadministrated 3 days a week for duration of 6 weeks. The control group wasnot involved to any training. The training session was of 60 minutes durationwith additional thirty minutes for warm up and cool down. The trainingprogramme was scheduled for the evening between 5.00 to 6.30 p.m.Statistical techniques- In this study, for data analysis Student –t statisticaltechniques is used to find out the effect of six week plyometric training. Thelevel of significance was taken at 0.05.Result- The result of the study is presented in tabular form :
TEST MEAN OF EXPERIMENTAL
GROUP
MEAN OF CONTROL
GROUP
MEAN DIFFERENCE T- VALUE
PRE TEST
POST TEST
PRE TEST
POST TEST
EXPERIMENTAL GROUP
CONTROL GROUP
EXP. GROUP
CTRL GROUP
50M RUN 9.79 8.96 9.82 9.84 0.83 0.02 3.94 0.09
SIT UPS 10.95 12.10 10.25 10.35 1.15 0.10 3.80 0.16
STANDING BROAD JUMP
1.39 1.53 1.39 1.39 0.14 - 4.14 0.02
LEVEL OF SIGIFICANCE AT 0.05 *From this table it becomes clear that to find out the effect of plyometric
training on selected variables the pre test and post test mean of 50m run test ofexperimental group is 9.79 and 8.96 respectively. The mean difference is 0.83,‘T’ - value is 3.94. While pre test and post test mean of control group is 9.82and 9.84 respectively. The mean difference is -0.02, ‘T’ –value is 0.16. So the‘T’ value of experimental group is more than 1.96 indicates significant effectof training on speed.
The pre test and post test mean of sit ups test of experimental group is10.95 and 12.10 respectively. The mean difference is 1.15, ‘T’- value is3.80.while pre test and post test mean of control group is 10.25 and 10.35respectively. The mean difference is -0.10, ‘T’- value is 0.16. so the ‘T’-value of experimental group is more than 1.96 indicates significant effect oftraining on abdominal muscular strength. The pre test and post test mean ofstanding broad jump test of experimental group is 1.39 and 1.53 respectively.The mean difference is 0.14, ‘T’- value is 4.14. While pre test and post testmean of control group is 1.39 and 1.39 respectively. Mean difference is notfound, ‘T’- value is 0.02. so the ‘T’- value of experimental group is more than1.96 indicates significant effect of training on explosive power.Graphical representation of pre test and post test mean achieved on50M Run, sit ups and Standing broad jump test of experimental and

Research Journal of Social and Li fe Sciences, ISSN 0973-3914, Vol .-XIV- II, Year-07, June-2013160
control group.
Discussion:-1. From this table it becomes clear that there is a significant improvement
on speed of experimental group as compared to control group by applying50 M run test. So plyometric training indicates significant effect of trainingon speed.
2. The experimental group shown significant difference as compared tocontrol group in abdominal muscular strength by applying sit up test.Thus the result indicates significant effect of plyometric training onabdominal muscular strength.
3. The experimental group was shown significant difference as comparedto control group on explosive power by applying standing broad jumptest. Thus result indicates significant effect of plyometric training onexplosive power.
4. From the analysis of the statistical data by compare the T- value ofthree variables, plyometric training is more effective for the developmentof explosive power than speed and abdominal muscular strength.
Conclusion- The statistical analysis of 50M Run test, Sit ups test and standingbroad jump test indicates the clear improvement of experimental group in thecomparison to the control group in speed, muscular endurance and explosivepower respectively. And also it is clearly indicates that this training is moreeffective for the development of explosive power than speed and muscularendurance. It can be concluded that this improvement was noticed due to theplyometric training.Recommendations- Based on the result of the study, the followingrecommendations were drawn,1. It is recommended that the more studies may be conducted to verify
these results using longer period of training duration.2. It is recommended that researches also may be conducted on the
different age group and sex.

Research Journal of Social and Li fe Sciences, ISSN 0973-3914, Vol .-XIV- II, Year-07, June-2013 161
3. The similar study may be conducted on men students as subjects.4. The similar study may be conducted with large number of samples.
It is recommended that researches also may be conducted to find outthe result of plyometric training on motor components related to various games.======================References-1. Arnold Peter; ''Education, Physical Education and Development''. London :
Heinemann Educational Book,1992.2. Clarke H. Harrison, "Application of measurement to health and physical
education": Eaglewood cliffs, New Jersey : Prenticc Hall. Inc 1976.3. H William; "Physical Education and Sports in changing Society"; New Delhi,
Surjeet publication; 1980.4. Singh Hardayal, "SCIENCE OF SPORTS TRAINING" New Delhi: DVS
Publications,1991.5. Siff, M.C. & Verkhoshansky, Y.V. Supertraining. Denver, Colorado: Super training
International.1993.6. Turner, AM., Owings, M., and schwane, J.A.,"Improvement in running economy
after 6 weeks of plyometric training", journal of strength and research;2003.7. www.wikipedia. org8. www. pubmed.com9. www.plyometric training.com
ISSN 0975-4083
A Registered Reviewed Research JournalSix monthly Bi-lingual Journal (English/Hindi Editions)
Please address all Communications -Prof. Braj Gopal Shukla
Chief Editor Research Journal Social and Life Sciences
41/42, Raghuwans Sadan, Shantikunj, Bichhiya, Rewa 486 001 (M.P.) Phone - (07662) 255177, 9425186437
E-mail - [email protected] [email protected]
The Aims & Objectives-
Guidelines & Member Ship Fee
To provide a plateform for the publication of original unpublished Research Papers, Summary of Research Project, Thesis and Book review relating to all subjects of Social & Life Sciences and to promote interdisciplinary research work. Book Review can be published on receipt of two copies of concerned book.
-Authors/ Researchers can contact in the Registered Office given below-
Indexed & Listed at: Ulrich’s International Periodicals Directory ©, ProQuest, U.S.A. Title Id : 715204
Volume-IX, Coming in September, 2013

Research Journal of Social and Life SciencesISSN 0973-3914, Vol.-XIV- II, Year-07, June-2013
A Study of Classroom Interaction of PhysicsTeachers at Secondary Level on the Basis of Their
Experience and Quali fication
* Rakhee Trivedi**M. P. Sharma
==========================================================Abstract- Classroom(CR) interaction plays a very important role in effectiveteaching. It helps students to interact with the teacher as well as fellowbeings. It is a means and measure to improve the quality of teachinglearning process. The researcher studied the class room interaction ofteacher of physics in standard X and examined various effects on them.The study was restricted to Udaipur city only. The sample under studychosen by random sample technique included 11 teachers. The tool usedwas an observation schedule. The study showed more experiencedteachers give more time to lecturing as compared to less experiencedones. The study suggested that proper learning atmosphere should becreated in class and teacher should focus on the basic objectives ofphysics teaching.==========================================================
===========================* Research Scholar, Mewar University, Gangrar** Director G.I.E.S., Vidya Bhawan Society, Udaipur
Introduction- It is well said “The destiny of India is being shaped in itsclassroom”. Most of the teaching learning takes place in the class room. Theteacher plays an important role in the class room teaching learning process.Hence it is important to focus on the effectiveness of teacher. The scholarthus was interested to evaluate the CR interaction on the basis of teacher‘squalification and experience.Objectives-• To examine the CR interaction of teachers of physics.• To examine the student talk ratio.• To examine the teacher talk ratio.• To examine the direct and indirect effect of teachers in the CR.Hypotheses- There is no significant difference between the teaching of moreexperienced and less experienced teachers. There is no significant differencein student and teacher talk of more experienced and less experienced teachers.

Research Journal of Social and Li fe Sciences, ISSN 0973-3914, Vol .-XIV- II, Year-07, June-2013 163
There is no significant difference in teaching of PGT’s and TGT’s. There is nosignificant difference in student and teacher talk of PGT’s and TGT’s.Delimitations- The present study is restricted to teachers of CBSE basedprivate schools of Udaipur city only.Sample- Random sampling technique was used to select the sample. Out of11 teachers 6 were males and 5 were females.Tool- Observation schedule was prepared to study the effectiveness ofteachers. Help of FlandersInteraction Analysis Category System was also taken.Data Collection- The research scholar sat in the classroom to observe CRtransaction. The duration of each teaching period was approximately 35-40minutes. The researcher divided her tool into several areas and items relatedto each area were observed on and evaluated on a 3 point scale i. e. excellentgood and average.Data Analysis and Classification- Having prepared pairs of observationthe researcher prepared a matrix of the pairs for analyzing the collected data.Here the Flanders Interaction Analysis Category System(FIACS)which gives10 components of CR behavior are used. To prepare matrix, a table in whichthe numbers of all 10 components are written horizontally and vertically. Thedata is analyzed as belowTeacher talk= sum of no 1 to 7 of matrixStudent talk = sum of 8 and 9 of matrixDirect effect = sum of 5 to 7 of the matrixIndirect effect = sum of no. 1 to 4 of the matrixSubject contribution = sum of 4 and 5Incidents of silence or confusion = sum of no.10
On the basis of experience
On the basis of experience
< 15 Years >15 Years < 15 Years
>15 Years
1. Teacher talk 62.8% 82.6% 75% 87% 2. Students talk 27.2% 14.5% 19.8% 8% 3. Direct effect 50.9% 67.8% 62% 69% 4. Indirect effect 11.8% 14.6% 13.4% 18% 5. Subject
Contribution 51.4% 71% 63.8% 72%
Conclusions-On the basis of experience* The more experienced teachers comparably use more time in lecturing
in the CR* The less experienced teachers give more time to students to speak.* Direct effect which should be less is found high in more experienced
teachers.* Indirect effects of the category are not so high.

Research Journal of Social and Li fe Sciences, ISSN 0973-3914, Vol .-XIV- II, Year-07, June-2013164
* The more experienced teachers comparably devote more time to subjectcontent delivery in CR.
On the basis of qualification* The post graduate teachers(PGT) use more time lecturing than
graduate(TGT)* The TGT’s give more time to students to speakin class.* There is a very high significant difference in the student talk of PGT’s
and TGT’s.* Both the category use less time in accepting feelings and ideas of the
students and encouraging them to ask questions.* The PGT’s devote more time in contributing to subject content.Suggestions- The above study is beneficial to the curriculum developers,administrators principals and teachers.Suggestions to curriculum framers, administrators and principals- Theyshould be familiar with the CR interaction methods and try to improve CRinteraction with modern approach and arrange for different programmers’ onCR developmentSuggestions to the teachers- Every teacher should be well versed with CRinteraction analysis method and should improve his/her own teaching approach.The teacher should motivate students for self study and self learning and developthe art to understand the pupils’ feelings. The teacher should leave the habit ofcriticizing the system and student. He/she should develop student centeredtechniques rather than talking himself. The teacher should create democraticatmosphere in classroom. The approach of teaching should be interesting andmotivating enough to make students initiate.======================References-1. Aggarwal J.C. Development and Planning of Modern Education, Vikas
Publishing House, New Delhi, 1982.2. Bagchi,J.P. (1993 ). Students' attitude towards science: the impact of different
educational practices. Journal of Indian Education, Vol. XIX (4-5),50-563. Bala Madhu,Classroom Interaction, S.S. Publication, New Delhi,1995.4. Banerjee, A (1997). Effect of lecture and cooperative learning strategies on
achievement in chemistry in undergraduate students. International Journal ofScience Education, Vol. 19 (8), 903-910
5. Best John and James Kalen, v.1089, Research in education 6th edition, PrenticeHall of India Pvt. Ltd. New Delhi,987
6. Bhattacharya, B. (1996). Qualitative learning of science students in the Indiancontext: Some determinates and their implications. Journal of Indian Education,Vol. 21 (4), 57-64
7. Ray Spangenbburg and Diane Kit Moser. Vol 1 "The Birth of science" 2010,Viva Books, New Delhi.

Research Journal of Social and Life SciencesISSN 0973-3914, Vol.-XIV- II, Year-07, June-2013
Importance of Computer and English in Education
* Rajkumar S. Topandasani==========================================================Abstract- We are living in the cyber age. No field of life is untouched bythe computers. Before twenty years it was considered as a machine forthe class but it has become, now, the talk of the mass and most of theurban and educated people take it as an essential domestic commodity. Ithas been accepted as a subject to be taught at primary. Secondary, highersecondary and higher level of education .Its importance has beendiscussed so many times in so many seminars, journals, magazines,newspapers etc. In the countries like India, it cannot reach at the level atwhich it should have reached. Why? Let's see the reasons and Why theneed to learn English as a language?==========================================================
===========================* Associate Professor & Head, Department of accountancy Arts & Commerce
College, Mendaeda.
We are living in the cyber age. No field of life is untouched by thecomputers. Before twenty years it was considered as a machine for the classbut it has become, now, the talk of the mass and most of the urban and educatedpeople take it as an essential domestic commodity. It has been accepted as asubject to be taught at primary. Secondary, higher secondary and higher levelof education .Its importance has been discussed so many times in so manyseminars, journals, magazines, newspapers etc. In the countries like India, itcannot reach at the level at which it should have reached. Why? Let’s see thereasons.1. Lack of awareness of the people.2. Cost of the computer.3. Low standard of living of most of the people.4. Improper computer syllabi in the schools.5. Lack of resourceful teachers in the schools.6. Rapid changes in the computer system.7. Scarcity of infrastructure.8. Improper government policies regarding internet etc.9. Wrong belief- that the users must have full knowledge of the English
language.10. And above all, the main, well-known and the population.

Research Journal of Social and Li fe Sciences, ISSN 0973-3914, Vol .-XIV- II, Year-07, June-2013166
Though the above mentioned reasons are the main obstacles that slowdown the pace of the growth of computers in the country, by the end of currentdecade the computer will be the first requirement of the family like tv, due tothe following advantages:1. We can play video and audio CDs/Pen drives through computers.2. One can get the print of the photographs through computer if those are
clicked by digital camera.3. One can maintain the account of the family expense.4. Worldwide communication can be done faster and at cheaper rate
through computers if it is connected to the internet.5. Live and telephone talk can be done through Internet at cheaper rate.6. Cheaper internet connection will be possible in coming years due to the
cable lines.7. Multiple use of cable- internet-connection.8. Students can do their assignment works in any main languages of the
country.9. Availability of easily operative software.10. Children can play videos games on computer.11. Rapidly increasing storing capacity of the computer.12. Self and interactive study can be done through computers by using
educational software.13. People will be able to transact with their respective banks, insurance
companies and other institutions if proper infrastructure will be developed.14. Rail and air booking will be available through the internet to the public.15. Pupil can learn, on line, different subjects though the computers.
Besides these many other facilities ‘are’ or ‘will be’ available on thecomputers that will make our life more comfortable. Now the question that“should the computer education be compulsory or not at the schools?” is,according to my opinion, meaningless because computer has become the partof our life and the education at the school must reflect the necessity of thesociety. Most of the private and many of the government schools of the countryhave been making their pupils learn computer. Even some of the schools teachthe computer subject to the students of first grade (standard) also. But it isobserved that most of the schools are not much serious in teaching computersystematically due to one or other reasons. Most of the granted private schoolshave no fund for paying the expert computer teachers. Government schoolsare suffering from the problem of low staff. Computer subject is given no orless weight age in measuring the progress of the students at school level.These reasons make the computer education less fruitful. To make the computereducation more effective following steps should be taken.1. Expert computer teachers should be appointed in the schools.2. Computer education must be compulsory for the teacher trainees.

Research Journal of Social and Li fe Sciences, ISSN 0973-3914, Vol .-XIV- II, Year-07, June-2013 167
3. All the teacher should teach their own subjects through the computersat least once in the month.
4. All the school must have internet facility.5. At lest twice a week, students should be allowed to do practical work on
the computer.6. Syllabus of the computer education must be flexible. It should be revised
after two or three years or all the government and private schools shouldbe given freedom to decide their own syllabus for the computer education.
7. Theoretical and practical exams should be conducted separately.8. The government should give relaxation to the school, which have internet
facilities for the students, in telephone and electricity charge.9. Teachers should be given subsidy in purchasing computer and computer
peripherals.10. Seminars, workshops and special practical sessions should be organized
once in couple of the years for the school teachers and those should bemade compulsory for all the school teachers.
11. Such programmes should be run throughout the academic year in whichdifferent groups of the teachers participate at different time period ofthe year.
12. This work can be assigned to the teacher training colleges.13. Teacher should be directed their written work on computers only.14. Government should provide enough grant to the grantable schools to
fulfill basic requirements for the computer education.15. More part of the local, state or national budget should be provided to the
education field.16. Government must take serious steps to control the population growth
rate of the country.There is no doubt of making most of the people computer literate if the
above mentioned steps will be taken for the country’s sake. The statementthat making the people educated is a long-term investment for any country isaccepted universally. The developed countries are developed because of theeducated people. Such countries provide enough fund for the betterment ofthe education system and they accept the new trends of the education in notime. We in our country still cannot change our examination system thoughdifferent education committees and commission have suggested for the same.
It is an inevitable fact that the educated people will be known as educatedilliterate if they will remain unable to operate the computer.Why the need to learn English as a language? English is a global language.English is a language to help in trade, travel, communication and success beyondnational boundaries. It has become a yardstick to measure the performance ofemployees in many industries and a key element for employability in others.Why Gujarat should devoid of riding on the bandwagon of language proficiency

Research Journal of Social and Li fe Sciences, ISSN 0973-3914, Vol .-XIV- II, Year-07, June-2013168
when it is emerging as fastest growing state, signing MoUs worth thousandsof cores of rupees and creating more employment opportunities for its youth.To avail of enormous opportunities these situation have generated, a need wasfelt for a stat nodal agency to equip Gujarat youth with English language(listening, reading, speaking and grammar) along with other essential skills.The main spirit behind concept of SCOPE is “neither dominance nordisinclination” for English.Case Study of SCOPE(society for creation of opportunity throughproficiency in English)- Keeping in view the aforesaid mission, SCOPE(society for creation of opportunity through proficiency in English) has beensetup by government of Gujarat in February , 2007 and registered as a societyunder societies registration act, 1860, to build English language proficiency inthe youth of Gujarat and thereby creating employment opportunities for them.SCOPE, being a language flagship body of government focusing only on Englishlanguage skill, has already tied up with university of Cambridge, UK forproviding international certificate to its students. Since its inception, SCOPEhas already witnessed an enrolment of more than 3,00,000 candidates .
Scope (society for creation of opportunity through proficiency in English)in its journey under the protégé of commissioner, higher Education of morethan 5 years since its inception in July, 2007, has successfully engineered amongmore than three hundred thousands of young people in Gujarat , the spreadand development of the critical skill of proficiency in English and bestowed inthem the much desired competitive edge to capitalize upon the multitude ofopportunities available in vibrant Gujarat.Conclusion- The importance of English language and computer skill becamevery much important. There is one common issue that occupies every youngmind is the need to empower themselves with linguistic abilities that can standby themselves. It would be appropriate therefore to dwell briefly upon thelanguage teaching scène, with special reference to gobal winds blowing inINDIA======================References-1. Gujarat journal of psychology vol.no.13, 20122. KaleidoSCOPE vol.no.5, 2012

Research Journal of Social and Life SciencesISSN 0973-3914, Vol.-XIV- II, Year-07, June-2013
Self- Concept in Relation to Emotional Intel l igenceand Self- Esteem of Visually Challenged and
Sighted School Students* Dinesh Kumar
**Raj Kumar==========================================================Abstract- Students with visual impairments form a disadvantaged lot interms of their information and awareness due to their visual perceptualloss. Their limited experience and lack of environmental stimulation hasa direct bearing on their self-concept, emotional intelligence and self-esteem. Present study focuses on the relationship between self-concept,emotional maturity and self-esteem visually challenged and sighted schoolstudents. It was hypothesized that there exists a there will be a positivecorrelation between self-concept and emotional intelligence and self-esteem of visually challenged and sighted students. Mean self-concept,emotional intelligence and self-esteem scores of sighted students will bemore than that of visually challenged students. A purposive sample of200 students (100 visually challenged and 100 sighted) studying in XIand XII standard were selected from the schools situated in Delhi,Chandigarh and Haryana state. Self-concept, emotional intelligence andself-esteem of visually challenged and sighted students were measured.Self-concept and emotional intelligence of visually challenged andsighted students were found to be significantly related. There existsignificant relationship between self-concept and self-esteem of visuallychallenged and sighted students. The sighted school students haveexhibited better self-concept, emotional intelligence and self-esteem thanthe visually challenged students.Key words- Self-Concept, Emotional Intelligence and Self-Esteem, VisuallyChallenged and Sighted School Students==========================================================
===========================* Assistant Professor, Ch. Devi Lal College of Education, Bhagwangarh, Buria
Road, Jagadhri, Yamuna Nagar-135101 (Haryana)** Research Scholar, DBHPS, Chennai
Introduction- Every individual in democracy has a fundamental right to receiveeducation. Teachers, social workers and general public should not only beconcerned with the education of able bodied but also with the differently abled.Students with special needs have a right to live and participate fully in settings

Research Journal of Social and Li fe Sciences, ISSN 0973-3914, Vol .-XIV- II, Year-07, June-2013170
and programmes in school, at home, in workplace and in the community.Individuals with special needs have the right to become independent, contributingmember of the society and a better human resource. Special education aims athelping children and adults with special needs learn how to increase the levelof decision-making, their functioning and self-concept, to achieve their goalsand to have control over their own lives.Self-Concept- The commonality which exists in an individual’s various roleperformances is related to his self-concept. Self-concept is an individual’sevaluation of his or her own abilities and attributes. It includes all aspects of anindividual’s personality of which s/he is aware. Although some authors havedrawn distinctions between self-concept and self-esteem (Damon and Hart1982), the terms are frequently used interchangeably. Several theoretical modelsof self-concept exist in the literature e.g. Harter (1982) found that self-conceptcan be broken down into three specific components i.e. cognitive, social andphysical competence, and a general self-worth factor. Children with a positiveself-concept are described as imaginative, confident in their own judgmentsand abilities, assertive, able to assume leadership roles, less preoccupied withthemselves and able to devote more time to others and to external activities.On the other hand, children with a negative self-concept are described asquiet unobtrusive, unoriginal, lacking initiative, withdrawn and doubtful aboutthemselves (Coppersmith, 1967). School progress and academic achievementare influenced by self-concept, as is vocational and educational choice. Self-concept is an important concept of any child’s development. As children developa sense of self and interact with and gain experience in the world, their self-concept is affected. Self-concept is defined as the value that an individualplaces on his or her own characteristics, qualities, abilities, and actions (Woolfolk,2001).Emotional Intelligence- The idea of emotional intelligence lies in a handfulof basic principles. Emotional intelligent people, Goleman says, have the abilityto marshal their emotional impulses (or, at least, more so than those who arenot. emotionally intelligent); they have the self-awareness to know what theyare feeling, and are able to think about and express those things; they haveempathy for the feelings of others and insight into how others think; they cando things like delay gratification; they are optimistic and generally positive;they understand easily the dynamics of a given group, and, most important,where they fit inside that group.Definitions of Emotional Intelligence- According to Goleman (1995)emotional intelligence is “The capacity for recognising our own feelings andthose of others for motivating ourselves and for managing emotions well inourselves and in our relationships”. Salovey (1995) “Emotional intelligencemay be defined as the capacity to reason with emotion in four areas: to perceiveemotion, to integrate it in thought, to understand it and to manage it.” Based on

Research Journal of Social and Li fe Sciences, ISSN 0973-3914, Vol .-XIV- II, Year-07, June-2013 171
these, we may understand one’s emotional intelligence as a unitary ability (relatedto, but independent of standard intelligence) helpful in knowing, feelings andjudging emotions in close co-operation with one’s thinking process to behavein a proper way, for the ultimate realize of the happiness and welfare of theself in tune with others.Self-Esteem- An individual’s core sense of self-esteem is cultivated frombirth, as a baby receives the attention and affection provided by the caretaker.When an infant’s cry is comforted, her hunger nourished, her smiles met withsmiles, the message is conveyed. The original definition presents self-esteemas a ratio found by dividing one’s successes in areas of life of importance to agiven individual by the failures in them or one’s “success / pretensions”. Problemswith this approach come from making self-esteem contingent upon success:this implies inherent instability because failure can occur at any moment. Inthe mid 1960s Morris Rosenberg and social-learning theorists defined self-esteem in terms of a stable sense of personal worth or worthiness, measurableby self-report testing. This became the most frequently used definition forresearch, but involves problems of boundary-definition, making self-esteemindistinguishable from such things as narcissism or simple bragging. Brieflyself-esteem defined as “the experience of being competent to cope with thebasic challenges of life and being worthy of happiness” (Nathanial, 1969).This two-factor approach, as some have also called it, provides a balanceddefinition that seems to be capable of dealing with limits of defining self-esteemprimarily in terms of competence or worth alone. Self-esteem as an automaticand inevitable consequence of the sum of individuals’ choices in using theirconsciousness something experienced as a part of, or background to, all of theindividual’s thoughts, feelings and actions.Need and Significance of the Study- Vision is the most actively used senseby man. Cognition depends upon one’s visual experiences to a great extent.Impairment imposes basic limitations on the individual. Visually impaired childrenare deprived in terms of range and variety of experiences. They are unable tocontrol their own environment and themselves in relation to it. Although socialattitudes are changing towards the visually impaired yet there are certainstereotypes which are reflected in terms of their attitudes and responses. Peoplestill believe that visually challenged person is nothing, can do nothing and benothing. Some young children with disabilities have negative self-images; theymay view themselves as failures, have negative thoughts about themselves,depending on their parents and others, and may have difficulties with socialskills. To develop self-concept, adolescents with disabilities may need specificinstructions, such as making eye contact and facing individuals when theycommunicate.“The self-concept and intelligence are the influential part of thepersonality and influence an individual goals, achievements, aspirations,motivation and adjustment”. Individual behaviour is always goal oriented and

Research Journal of Social and Li fe Sciences, ISSN 0973-3914, Vol .-XIV- II, Year-07, June-2013172
these goals can be met only in the environment and in day-to-day life. Todevelop the innate powers of an individual certain external forces are quiteresponsible. Self-concept and intelligence also play an important role in realizingthe objectives/goals of an individual.
Self-esteem also plays a significant role in learners’ development. A kidneeds to have self-esteem. Good self-esteem is important because it helps thechild to hold head high and feel proud and what can do. It gives the courage totry new things and the power to believe in him. Having good self-esteem isalso the ticket to making good choices about mind and body. Maybe kids withlow self-esteem who don’t think very highly of themselves or seem tocriticize themselves too much or maybe low selfesteem and don’t alwaysfeel very good about himself. Sometimes a kid will have low self-esteem if hismother or father doesn’t encourage him enough or if there is a lot of yelling athome. Other times, a kid’s self-esteem can be hurt in the classroom. A teachermay make a kid feel dumb or perhaps there is a bully who says hurtful things.So, environmental condition of the school is very crucial to develop high selfesteem. It depends on teachers, parents and peers to promote high self-esteem.So far as the children with visual impairment and hearing impairment isconcerned, parental attitude in the home and teachers behavior in the schoolplays a significant role in developing high self-esteem. So, the researcher intendsto study to get a suitable educational setting for these children.
The proposed study is also aimed to find out the relationship betweenself-concept with emotional intelligence and self-esteem of visually impairedand sighted school students because such an exploration will be helpful inenhancing their selfconcept evaluating selfesteem and emotional intelligence.Due to impairment, visually impaired children may have a low-self concept,poor personality makeup, low need for achievement and adjustment than sightedpeers. As a result of which their educational, emotional, social development isaffected. Review of literature indicates that there is a dearth of researchstudies pertaining to the self-concept, self-esteem and emotional intelligenceof the visually impaired especially in the Indian context. Also in view of thelegislative implications, the study acquires importance. The Persons withDisability Act (1995) mandates that children with special needs be taught ininclusive settings. Hence, more and more visually impaired children will bethere in regular schools in the coming times. The placement of individuals withdisabilities, here visual impairment, in the common schools, where they will bestudying amidst heterogeneous group of students, will also likely to have animpact on their self-concept, adjustment, social skills and emotional intelligenceetc. Hence, a study needs to be carried out so that appropriate educationalprogrammes can be chalked out for them. So, the proposed study was designedto see the relationship of self-concept with emotional intelligence and self-esteem. At the same time the difference between visually impaired and sighted

Research Journal of Social and Li fe Sciences, ISSN 0973-3914, Vol .-XIV- II, Year-07, June-2013 173
in terms of their self-concept, emotional intelligence and self-esteem will alsobe studied.Objective of the Study- The objectives of the study were:1. To study the relationship of self-concept with emotional intelligence of
visually challenged and sighted students.2. To study the relationship of self-concept with self-esteem of visually
challenged and sighted students.3. To study the difference between self-concept of visually challenged and
sighted students.4. To study the difference between emotional intelligence of visually
challenged and sighted students.5. To study the difference between self-esteem of visually challenged and
sighted students.Hypotheses-1. There will be a positive correlation between self-concept and emotional
intelligence of visually challenged and sighted students.2. There will be a positive correlation between self-concept and self-esteem
of visually challenged and sighted students.3. Mean self-concept scores of sighted students will be more than that of
visually challenged students.4. Mean emotional intelligence scores of sighted students will be more
than that of visually challenged students.5. Mean self-esteem scores of sighted students will be more than that of
visually challenged students.Delimitations of the Study-1. The study was restricted to one disability area i.e. visual impairment
only;2. The study was confined to visually challenged and sighted students
studying in XI and XII standard only;3. The study was delimited to the schools situated in Delhi, Chandigarh
and Haryana state only.Research Method- The proposed study is the relationship study in nature.Therefore, the investigator intended to find out the relationship among schooladjustment with emotional intelligence and self-esteem of visually challengedand sighted students. Keeping in mind, the nature and objectives, co- relationalsurvey method was employed in the present investigation.Populations and Sample- The target population for the study is visuallychallenged and sighted students studying in Senior Secondary Schools situatedin Delhi, Chandigarh and Haryana state.
A purposive sample of 200 students (100 visually challenged and 100sighted) studying in XI and XII standards were selected from the schoolssituated in Delhi, Chandigarh and Haryana state.

Research Journal of Social and Li fe Sciences, ISSN 0973-3914, Vol .-XIV- II, Year-07, June-2013174
Tools Used- After selection of the sample the next step was to select thereliable and valid tools for the collection of data. For the present study, followingtools were used for collecting data:1. Children’s Self-Concept Scale by Ahluwalia (2002).2. Mangal’s Emotional Intelligence Inventory Mangal and Mangal (2004).3. Battle’s Self–Esteem Inventory by Kumar (1988).Statistical Techniques Employed-The analysis of the data was done bycomputing Mean, Standard Deviation (S.D.), t-ratio and Pearson’s productmoment coefficient of correlation.Results and Discussions- In order to find out the relationship betweenvariables i.e. self-concept, emotional intelligence and self-esteem of visuallychallenged and sighted students co-efficient of correlation “r” was computed.t-ratio was calculated to see the significance of difference between meanscores of visually challenged and sighted student’s self-concept, emotionalintelligence and self-esteem. The analysis and interpretation of the data hasbeen presented below:
Table-1Co-Efficient of Correlation Between Self-Concept and Emotional
Intelligence of Visually Challenged Students
Variables df Co-efficient of correlation “r”
Level of significance
Self-concept 98 -0.207* P>0.05 Emotional
Intelligence
*Significant at 0.05 level of significance at T.V.=0.195Table 1show that the calculated “r” value is -0.207 of self-concept and
emotional intelligence of visually challenged students is negatively significantat 0.05 level of significance. This shows that there exist significant relationshipbetween self-concept and emotional intelligence of visually challenged students.Further, the self-concept of visually impaired students is related with emotionalintelligence. Hence, the hypothesis No. 1a which is stated earlier that therewill be positive correlation between self-concept and emotional intelligence ofvisually challenged students is not retained.
Table-2Co-Efficient of Correlation Between Self-Concept and Emotional
Intelligence of Sighted Students
Variables df Co-efficient of correlation “r”
Level of significance
Self-concept 98 -0.926* P>0.01 Emotional
Intelligence

Research Journal of Social and Li fe Sciences, ISSN 0973-3914, Vol .-XIV- II, Year-07, June-2013 175
*Significant at 0.01 level of significance at T.V. =0.254
Table 2 depicts that the calculated “r” value is -0.926 between self-concept and emotional intelligence of sighted students is negatively significantat 0.01 level of significance. This shows that there exist significant relationshipbetween self-concept and emotional intelligence of sighted students. Further,the self-concept is found to be related with emotional intelligence of sightedstudents. Hence, the hypothesis No.1b which is stated earlier that there will bepositive correlation between self-concept and emotional intelligence of sightedstudents is retained.
Table-3Co-Efficient of Correlation Between Self-Esteem of Visually
Challenged Students
Variables df Co-efficient of correlation “r”
Level of significance
Self-concept 98 0.325* P>0.01 Self-Esteem
*Significant at 0.01 level of significance at T.V. =0.254
It seems from above Table 3 that the calculated “r” value is 0.325between self-concept and self-esteem of visually challenged students issignificant at 0.01 level of significance. This shows that there exist significantrelationship between self-concept and self-esteem of visually challengedstudents. Further, the self-concept is independently related with self-esteemof visually challenged students. Hence, the hypothesis No. 2a which is statedearlier that there will be positive correlation between self-concept and self-esteem of visually challenged students is retained.
Table-4Co-Efficient of Correlation Between Self-Concept and Self-Esteem
of Sighted Students
Variables df Co-efficient of correlation “r”
Level of significance
Self-concept 98 0.335* P>0.01 Self-Esteem
*Significant at 0.01 level of significance at T.V. =0.254
It indicates from above Table 4 that the calculated “r” value is 0.335between self-concept and self-esteem of sighted students is significant at 0.01level of significance. This shows that there exist a significant relationshipbetween self-concept and self-esteem of sighted students. Further, the self-concept is found to be independently related with self-esteem of sightedstudents. Hence, the hypothesis No. 2b which is stated earlier that there will

Research Journal of Social and Li fe Sciences, ISSN 0973-3914, Vol .-XIV- II, Year-07, June-2013176
be positive correlation between self-concept and self-esteem of sighted studentsis retained.
Table-5Significance of Difference between Mean Self-Concept scores of
Visually Challenged and Sighted Students
Group N Mean S. D. S. Ed. t-ratio Level of significance
Visually Challenged 100 44.77 5.4 0.722 2.27* P>0.01 Sighted 100 46.41 4.8
*Significant at df/198 at 0.05 level of significance=1.97It is revealed from the Table 5 that the mean scores of visually challenged
and sighted students on self-concept are 44.77, 46.41 with S.D.’s of 5.4 and4.8 respectively. The obtained t-value is 2.27 which is significant at 0.01 levelof significance. This means two groups differ significantly over the self-concept.Again the mean self-concept scores of sighted students are higher than thevisually impaired students; it indicates that sighted students studying in regularschools were better in self-concept of visually impaired students studying inspecial schools. Thus, the hypothesis No. 3 that mean self-concept scores ofsighted students will be more than that of visually challenged students is notretained. Further, the mean scores of visually challenged and sighted studentson self-concept as presented in the Table 5 is also depicted in Fig.1:
Figure-1Showing Comparison of Mean and S.D. Values of Self-Concept of
Visually Challenged and Sighted Students

Research Journal of Social and Li fe Sciences, ISSN 0973-3914, Vol .-XIV- II, Year-07, June-2013 177
Table-6Significance of Difference between mean Emotional Intelligence
Score of Visually Challenged and Sighted Students
Group N Mean S. D. S. Ed. t-ratio Level of significance
Visually Challenged 100 142.07 14.06 2.31 2.06* P>0.05 Sighted 100 146.83 18.37
*Significant at df/198 at 0.05 level of significance=1.97It is revealed from the Table 6 that the mean scores of visually challenged
and sighted students on emotional intelligence are 142.07 and 146.83 withS.D.s 14.06 and 18.37 respectively. The t-ratio came out to be 2.06 which issignificant at 0.05 level of significance. That means there is significant differencebetween visually challenged and sighted students on emotional intelligence.Again the mean scores of sighted students are higher than the visuallychallenged students; it indicates that sighted students studying in regular schoolswere better in emotional intelligence of visually challenged students than thestudents studying in special schools. Thus, the hypothesis No. 4 that meanemotional intelligence scores of sighted students will be more than visuallychallenged students is retained. The mean scores of visually challenged andsighted students on emotional intelligence as presented in the Table 6 is alsodepicted in Fig.2:
Figure-2Showing Comparison of mean and S.D. Values of Emotional
Intelligence of Visually Challenged and Sighted Student

Research Journal of Social and Li fe Sciences, ISSN 0973-3914, Vol .-XIV- II, Year-07, June-2013178
Table-7Significance of Difference between mean Self-Esteem Scores of
visually Challenged and Sighted Students
Group N Mean S. D. S. Ed. t-ratio
Level of significance
Visually Challenged 100 33.10 5.23 0.75 4.52* P>0.01 Sighted 100 36.49 5.34
*Significant at df/198 at 0.01 level of significance=2.60
It is revealed from the Table 7 that visually challenged and sighted studentson self-esteem are 33.10 and 36.49 with S.D.s 5.23 and 5.34 respectively. Thet-ratio came out to be 4.52 which is significant at 0.01 level of significance.That means there is significant difference between visually challenged andsighted students on self esteem. Again the mean scores of sighted studentsare higher than the visually challenged students; it indicates that sighted studentswere better in self esteem than the visually challenged students studying inspecial schools. Thus, the hypothesis No. 6 that ‘mean self-esteem scores ofsighted students will be more than that of visually challenged students is retained.The mean scores of visually challenged and sighted students studying in onself-esteem as presented in the Table 7 is also depicted in Fig.3:
Figure-3Showing Comparison of mean and S.D. Values of Self-Esteem of
visually Challenged and Sighted Student

Research Journal of Social and Li fe Sciences, ISSN 0973-3914, Vol .-XIV- II, Year-07, June-2013 179
Main Findings1. There exist significant relationship between self-concept and emotional
intelligence of visually challenged students. Further, the self-concept ofvisually impaired students is found to be related with emotional intelligence.
2. There exist a significant relationship between self-concept and emotionalintelligence of sighted students. Further, analysis of data reveals thatself-concept is related with emotional intelligence of sighted students.
3. There exist significant relationship between self-concept and self-esteemof visually challenged students. Further, the self-concept is found to beindependently related with self-esteem of visually challenged students.
4. There exist a significant relationship between self-concept and self-esteemof sighted students. Further, the self-concept is found to be independentlyrelated with self-esteem of sighted students.
5. There is significant difference between visually challenged and sightedstudents on emotional intelligence. Again the mean scores of sightedstudents are higher than the visually challenged students; it indicatesthat sighted students studying in regular schools were better in emotionalintelligence of visually challenged students than the students studying inspecial schools.
6. There is significant difference between visually challenged and sightedstudents on self esteem. Again the mean scores of sighted students arehigher than the visually challenged students; it indicates that sightedstudents were better in self esteem than the visually challenged studentsstudying in special schools.
7. There is significant difference between visually challenged and sightedstudents on self esteem. Again the mean scores of sighted students arehigher than the visually challenged students; it indicates that sightedstudents were better in self esteem than the visually challenged studentsstudying in special schools.
Educational Implications- The subject of the study was of much importancein the present context as there is a growing realization of focusing attention onthe students’ self-concept, emotional intelligence and self-esteem includingtheir management of teaching and learning as well as dealing with students inan effective and efficient ways. These implications are providing directionsfor the policy makers, administrators, teachers and other rehabilitationprofessional working for education of students with special educational needs.The following implications have been drawn from the findings of the presentstudy:1. The investigation has first of all helped the investigator to gain more
knowledge regarding self concept, emotional intelligence and self-esteemof visually impaired and sighted students. This will help an investigatorto carry a study on some other sample. This will help the students to

Research Journal of Social and Li fe Sciences, ISSN 0973-3914, Vol .-XIV- II, Year-07, June-2013180
develop their personality as a whole to become worthy citizen oftomorrow.
2. In order to develop their self-concept among girls and boysencouragement, incentives, rewards should be given to who participatein the adventurous activities in the school.
3. Self-concept has direct relation with academic achievement. So, schoolshould make provisions for good training program for good personalitydevelopment. Individuals counselling can serve as an effectiveintervention to improve their self-concept.
4. In the studies by psychologists, it has been clearly confirmed that theself-concept, emotional intelligence and self-esteem are powerful factorsin the learning habits and personality development of the students withspecial educational needs.
5. Emotional intelligence essentially reflects our ability to deal successfullywith other people and with our own feelings and thus ensures that anindividual be able to attain heights in his personal as well as professionallife.
6. The present study point out that emotional intelligence was correlatedwith self-concept of students. Thus, teachers are to take intoconsideration the emotional intelligence and self-concept in educationalsettings.
7. Teachers should understand and identified child’s self esteem toencourage and generate confidence among visually challenged studentsstudying in special schools. Counseling practice should be given toencourage the level of self esteem among students with vision impairmentstudying in special schools.
8. Healthy and sympathetic teacher student relationship should be made toupgrade the level of academic self esteem of students with visualimpairment.
9. Emphasis should be given on social cognitive development of the studentswith vision impairments to increase the level of self esteem.
10. Feeling of belongingness should be developing to encourage the level ofself esteem.
======================References-1. Aggarwal, Y. P. (1998). The science of educational research. A source book.
Kurukshetra: Nirmal Book Agency.2. Ahluwalia, S.P. (2002). Manual for Children’s Self- Concept Scale. Agra:
National Psychological Corporation.3. AL-Yagon, M. (2007). Socio-emotional and behavioral adjustment among
school age children with learning disabilities. Journal of special education,40(4), 205-217.

Research Journal of Social and Li fe Sciences, ISSN 0973-3914, Vol .-XIV- II, Year-07, June-2013 181
4. Best, J. W., Kahn, J. V. (2006). Research in education. New Delhi: Prentice Hallof India Pvt. Ltd.
5. Billings, J. M. (1997). The relationship of intelligence with self-concept, social-skills, school achievement & academic performance for gifted & non-giftedstudents. Dissertation Abstracts International, 58(6).
6. Bong, M., & Clark, R. E. (1999). Comparison between self-concept and self-efficacy in academic motivation research. Educational Psychologist, 34(3),139-153.
7. Christopher, J. M. (2006). Self-esteem Research, Theory, and Practice: Towarda Positive Psychology. New York: Springer Publishing Co.
8. Coopersmith, S. (1981). The antecedents of self-esteem. Palo Alto, CA:Consulting Psychologists Press.
9. Damon, W. and Hart, D. (1982). The Development of Self-understanding fromInfancy Through Adolescence. Child Development, 53, 4 (Aug., 1982), 841-864.
10. Garrett, H. E. (1973). Statistics in Psychology and Education. Bombay: Vakils,Feffer & Simons Pvt. Ltd.
11. Goleman, D. (1996). Emotional intelligence. Why it can matter more than IQ.New York: Bantan Books.
12. Hallahan, D. P., and Kauffman, J. M. (1991). Exceptional children-Introductionto special education (5th ed.). Boston: Allyn and Bacon.
13. Harter, S. (1982). The Perceived Competence Scale for Children. ChildDevelopment, 53, 1 (Feb., 1982), 87-97.
14. Harter, S. (1993). Causes and consequences of low self-esteem in children andadolescents. In R.F. Baumeister (Ed.), Self-esteem: The puzzle of low self-regard. New York: Plenum Press.
15. Heward, W.L. & Orlansky, M. D. (1988). Exceptional children: An introductorysurvey of special education (3rd ed.). Columbus, OH: Merrill PublishingCompany.
16. Kaushik, N. & Singh, K. (2006). Adjustment and self concept of hearing impairedand normal children. Disabilities and impairments, 20(2), 85-88.
17. Koul, L. (1984). Methodology of Educational Research. New Delhi: VikasPublishing House Pvt. Ltd., p. 511.
18. Kumar, A. (1988). Battle’s Self Esteem Inventory for Children (SEIC) –Indianadaptation. Varanasi: Prasad Psychological Corporation.
19. Mangal, S. K. and Mangal, S. (2004). Emotional Intelligence Inventory. Agra:National Psychological Corporation.
20. Mayer, J.D. and Salovey, C. (2000). Emotional intelligence meet traditionalstandards for intelligence. Intelligence, 27(4), 267-298.
21. Ministry of Law Justice and Company Affairs. (1996). The Persons withDisabilities (Equal Opportunities, Protection of Rights and FullParticipation) Act, 1995, Government of India. India.
22. National Curriculum Framework for School Education (2000). New Delhi:National Council of Educational Research and Training.
23. NCERT (1987). Project Integrated Education for the Disabled (PIED). NewDelhi: National Council of Educational Research and Training.
24. Punani, B. & Rawal, N. (2000). Visual Impairment Handbook. Ahmedabad:Blind’s People’s Association.

Research Journal of Social and Li fe Sciences, ISSN 0973-3914, Vol .-XIV- II, Year-07, June-2013182
25. Richman, C. L., Clark, M. L., & Brown, K. P. (1985). General and specific self-esteem in late adolescent students: Race, gender and SES effects. Adolescence,20, 555-566.
26. Salovey, P., Mayer, John, D. (1989). Emotional Intelligence. Imagination,Cognition and Personality, 9 (3): 185–211.
27. Sharma, S.K., (2004). Comparative study of self-concept and self-esteem ofblinds students studying in integrated and special school setting. New Delhi:Ph.D. thesis, I.A.S.E, Faculty of Education, Jamia Millia Islamia University,
28. Sibusiso, N., Andile, M. and Candice, C. (2008). A comparative study of theself-esteem of adolescent boys with and without learning disabilities in aninclusive school. International Journal of Special Education, 23(2), 75-84.
29. Twenge, J.M. & Campbell, W.K. (2001). Age and birth cohort differences inself-esteem: A cross-temporal meta-analysis. Personality and SocialPsychology Review, 5(4), 321-344.
30. Woolfolk, A. H. (2010). Educational Psychology. New Delhi: PearsonEducation.
Please address all Communications -Prof. Braj Gopal Shukla
Chief Editor Research Journal Social and Life Sciences
41/42, Raghuwans Sadan, Shantikunj, Bichhiya, Rewa 486 001 (M.P.) Phone - (07662) 255177, 9425186437
E-mail - [email protected] [email protected]
The Aims & Objectives-
Guidelines & Member Ship Fee
To provide a plateform for the publication of original unpublished Research Papers, Summary of Research Project, Thesis and Book review relating to all subjects of Social & Life Sciences and to promote interdisciplinary research work. Book Review can be published on receipt of two copies of concerned book.
-Authors/ Researchers can contact in the Registered Office given below-
A Registered Reviewed Research JournalSix monthly Bi-lingual Journal (English/Hindi Editions)
Indexed & Listed at: Ulrich’s International Periodicals Directory ©, ProQuest, U.S.A. Title Id : 715205

Research Journal of Social and Life SciencesISSN 0973-3914, Vol.-XIV- II, Year-07, June-2013
Youth & Environment- A Case Study of LibraryScience Students of Kumaun University, Nainital
*Rajesh Chandra Paliwal==========================================================Abstract- The study shows that the students are very much aware of thevarious environmental problems and they are also very keen to comeforward and join the hands to protect the environment but there is a needto organize workshops, seminar and conferences at the regular intervalsto aware and trained the youth, society and the whole nation to comeforward and join hand to protect the mother earth. We can adopt manyconservation measures to contribute the global efforts. One may preferto Walk, or bike or ride in public transport to reduce the emissions.==========================================================
===========================* Assistant Professor, Political Science B.S.M.P.G.College, Roorkee (Haridwar)
Introduction- The whole world is facing the problem of environment relatedissues as a result of human being attitude and concern towards the environmentand exploitation of natural resources by human beings in unmindful andthoughtless way. To save the environment and to keep the whole world saveand happier planet, it’s the human being sole responsibility to create awarenessand conserve and nurture the natural resources. To save the environment,there is a need to create awareness among the youth towards the environmentas the youth are the agent of social change. Today environmental awarenessis a very important topic for discussion and lots of conferences and seminarsare being held at various levels. The environment and energy related problemscannot be solved unless students are aware of them, because the students arethe future citizens of our country. It is an essential need for each individual todevelop an awareness of protection and preservation of the environment. Youthrepresents the dynamic character of human society. Youth has the capacity toabsorb new challenges and evolve new values in a fast changing society. Thus,through its youth, a society copes with new challenges and demands, andpasses from a traditional mould to modernity. Youth is an alternative word tothe scientifically-oriented adolescent and the common American terms of teenand teenager. Another common title for youth is young person or young people.Youth generally refers to a time of life that is neither childhood nor adulthood,but rather, somewhere in-between. Youth are broadly those who belong to the

Research Journal of Social and Li fe Sciences, ISSN 0973-3914, Vol .-XIV- II, Year-07, June-2013184
age-group of 15-24 and 24-34 can be variously classified in terms of residence,sex, traditional background and so on so forth. In the modern era of technology& development and the process of industrialization, urbanization and adoptionof modern technologies in agriculture, environmental problems have becomingthe concerning issues for the Human Society. The environment related problemcannot be solved unless the youth are aware of them as the youth are thefuture citizen of the country. So there is need to create awareness among theyouth regarding the various problem and causes of environment pollution.Keeping all these facts in mind an attempt has been made in the present studyto assess the awareness level of the youth towards environmentObjective of the Study- The main objective of the present study is to assessthe environmental awareness level among the library science students ofKumaun University, Nainital.Methodology of Study- The present study focuses to assess the environmentalawareness level of the youth. To assess the awareness level of the youth thestudy has been confined to students of Library Science of Kumaun University,Nainital. For the purpose of sampling, 21 library science students are randomlyselected for the study.Tools used in the Study- A structured questionnaire has been used to collectdata from the randomly selected students. A total of five questions pertainingto various dimensions of environment and its problems were selected in theform of questionnaire.Findings of the Study-The major findings of the study are presented in thefollowing sub-heads.Polythene bags causing harm to the environment- Polythene is veryharmful to the environment. Plastic, such as plastic grocery bags, are usedextensively around the world, which have a very real negative impact on theenvironment. Many plastic bags are not recycled and as such they end up inlandfill sites where they use up precious space. Another way that plastic bagsharm the environment is that they are light and easily get blown from bins intothe wider environment. This means that they end up in the countryside, rivers,lakes and sea where they cause death and injury to thousands of animals andbirds every year. One solution to this problem is to universally introducebiodegradable plastic bags. There is currently a debate, however, as to whetherthis in turn will introduce a new set of environmental problems. One of the keyconcerns about biodegradable bags is that, if they are not disposed of correctly,the decomposition action will not take place. Some biodegradable bags will notdecompose if they are not exposed to light or oxygen which means they maynot decompose in landfills. The atmospheric conditions may also impact the waya bag decomposes. There are also reports that some biodegradable bags doleave traces of metals and other minerals in the environment. Keeping allthese facts in mind a statement was put behind the students to assess the

Research Journal of Social and Li fe Sciences, ISSN 0973-3914, Vol .-XIV- II, Year-07, June-2013 185
awareness level of the students.100 percent of the students are fully agreedwith the statement that polythene bags causing harm to the environment. Allthe students were in the age group of 21- 30 years out of which 6 were maleand 15 were female students. This shows that the students are fully awarewith the negative impact of polythene bags on environment.The vehicular emission make the breathing air dirty- A compressed-airvehicle (CAV) is powered by an air engine, using compressed air, which isstored in a tank. Instead of mixing fuel with air and burning it in the engineto drive pistons with hot expanding gases, compressed-air vehicles usethe expansion of compressed air to drive their pistons. Compressed-airpropulsion may also be incorporated in hybrid systems, such as with batteryelectric propulsion. This kind of system is called hybrid-pneumatic electricpropulsion. Additionally, regenerative braking can also be used inconjunction with this system.Like other non-combustion energy storage technologies, an air vehicledisplaces the emission source from the vehicle’s tail pipe to the centralelectrical generating plant. Where low emissions sources are available,net production of pollutants can be reduced. Emission control measuresat a central generating plant may be more effective and less costly thantreating the emissions of widely dispersed vehicles. Since the compressedair is filtered to protect the compressor machinery, the air discharged hasless suspended dust in it, though there may be carry-over of lubricantsused in the engine. The principal disadvantage is the indirect use of energy.Energy is used to compress air, which - in turn - provides the energy to runthe motor. Any conversion of energy between forms results in loss. Forconventional combustion motor cars, the energy is lost when oil isconverted to usable fuel - including drilling, refinement, labor, storage,eventually transportation to the end-user. For compressed-air cars, energyis lost when electrical energy is converted to compressed air. Regardingthis statement 100 percent of the students are fully agreed with thestatement that the vehicular emission make the breathing air dirty. All thestudents were in the age group of 21- 30 years out of which 6were maleand 15 were female students. This show that the students are fully awarewith the negative impact of vehicle emission and they said that we use toprefer walking instead of Scooters/Motorcycles.Construction of a Building at High Terrain is a good thinking- Hills inNainital area are unstable and many landslides have cause havoc in the past.New construction in most of the hills are prohibited yet, unauthorizedcommercial as well as domestic construction continue, posing danger to thenatural drainage system as well as the stability of slopes. Keeping the abovefacts a statement were put to assess the awareness level of the youth regardingthe various risk factors of constructing a building at high terrain. A mix response

Research Journal of Social and Li fe Sciences, ISSN 0973-3914, Vol .-XIV- II, Year-07, June-2013186
was obtained regarding the statement, out of 21 students, 2 female agreedwith the statement & 11 (7 female and 4 male) disagree and 8 students (6female and 2 male) were neutral. The mix response shows that they areunaware of the construction of a Building at High Terrain is a good thinking.The findings shows that the youth are still unaware of the various risk whichmay be caused to the heavy construction on the high terrainUnusual change in Climate is due to Global Warming- Today, the entireworld community is facing a problem of global environmental change causedby the global warming. The rapid growth of industries, urbanization andincreasing consumerism are the major causes of this problem which arereleasing increasing quantities of greenhouse gases and leading to the intensityof the problem. The international community is under the threat of adverseimpacts of global warming and climate change. There is an urgent need tounderstand the nature of the problem, its causes and consequences. Thecatastrophic impacts are not limited to any of the region, community or thenation, but are to be faced by the entire life forms on the earth. These changesare not new for the earth, but are threatening to the existence of all types offlora and fauna.
Burning of fossil fuels like coal, oil and natural gas release carbon dioxidegas into the atmosphere. Release of green house gases from various gasesincrease the global temperature by trapping the reflected and outgoing longwave heat radiation from the terrestrial region which ultimately result in theglobal warming. This warming of the earth’s atmosphere changes the climate.Other human activities, such as cutting down forests, and growing rice, andraising cattle, add to this effect. Global warming and very rapid climate changecould result in disastrous effects. 100 percent of the students are fully agreedwith the statement that unusual change in Climate is due to Global Warming.All the students who were agreed with the statement were in the age group of21- 30 years out of which 6 were male and 15 were female students. Thisshow that the students are fully aware with the negative impact of Globalwarming on climate change.Modern Diseases are a result of changing flora & fauna- The humanhealth is likely to affect by increase in diseases like fever, deaths by cold andheat waves. The fertilization effect can be experienced due to increased carbondioxide. The cooler temperatures will be experienced in the North Atlanticregions. The human society is likely to get affected by climatic changes. Therecan be increase in the epidemics of malaria in Africa; new cases in Turkeyand elsewhere. The possibilities of increased cerebral cardiovascular conditionsin China have been predicated by many scientists. The increased heat wavesare likely to lead to the deaths in European regions may be due to increasedcases of typhoid fever, vibrio vulnificus, ostreopsis ovata, Congo Crimeahemorrhagic fever and other human diseases. The spread of fever like dengue

Research Journal of Social and Li fe Sciences, ISSN 0973-3914, Vol .-XIV- II, Year-07, June-2013 187
fever is likely to increase in south-east Asia. The World Health Organizationhas predicted that about 150,000 deaths and 5 million illnesses per yearattributable to global warming; numbers expected to double by 2030.Out of twenty one students, fourteen (10 female and 4 male) agreed with thestatement and seven (5 female and 2 male) disagreed with the statement. Theresult shows that majority of the students i.e. fourteen agree and seven disagreewith the statement.The Concluding Remark- The study shows that the students are very muchaware of the various environmental problems and they are also very keen tocome forward and join the hands to protect the environment but there is aneed to organize workshops, seminar and conferences at the regular intervalsto aware and trained the youth, society and the whole nation to come forwardand join hand to protect the mother earth. We can adopt many conservationmeasures to contribute the global efforts. One may prefer to Walk, or bike orride in public transport to reduce the emissions. We can make sure our vehiculartires are fully inflated and your car tuned up. We can lower our water heater,home thermostats and use solar heaters. Avoid preheating the oven. Reduceyour shower length and temperature. We can run our dishwasher with fullloads. We can buy locally produced food. We can follow some tips like unplugappliances not in use to save energy, turn off lights when leaving a room, userecycled paper, reuse or recycle as much as you can and cut down onconsumerism. Basically, we have to cut down our energy usages. At least wecan follow simple tips for energy efficiency like reduce your home’s heat andenergy loses, replace incandescent lights with fluorescents, replace yourappliances with “energy star” rated appliances and buy a hybrid car. We canstart using renewable energy sources. Prefer to recycling whenever andwherever it is possible. At least for fulfilling our daily energy needs, installrenewable energy systemsbased on biogas, wind, solar, geothermal, efficient biomass conversions systems.Use bio-fuels and conserve fossil fuels. The phenomenon of Global warmingand subsequent climate change is in progress. Most of the global warming isprobably the result of human activities. There can be several and long lastingadverse impacts of global warming. The costs to mitigate global warming willbe high and may not work effectively. It is better to take preventive measuresimmediately to avoid the future impacts. If the human society is committed atindividual level to the international level, the phenomenon can be controlled.Recommendations• Students, the most powerful stratum of the society, know the importanceof environment and nature sustainability. So there is a need to create moreawareness among the students by organizing Seminar, workshop & play atregular interval.• Individual Actions can support the mitigation practices by participating

Research Journal of Social and Li fe Sciences, ISSN 0973-3914, Vol .-XIV- II, Year-07, June-2013188
in conservation, in increasing the consumption efficiency with controlled releaseof greenhouse gases, by preferring and promoting the use of renewableresources and being always involved in the mitigation and remedial processUniversally introduce biodegradable plastic bags.======================References-1. Chakravarty, T.K. 1998. 'Students Attitude towards Interact Marriage', Australian
Journal of Sociology.2. Devendra, Agochiya. 2005. 'Youth Development Programme at Cross-road',
Journal of Youth Development. Vol.1. July- Dec, 2005.3. Dube, S.C. 1973. Contemporary India and its Modernization. Delhi: Vikas
Publishing House.4. Paliwal, Deepak & Paliwal, Rajesh.2011 'Youth, modernization & Social
Transformation', Language in India.
izks- cztxksiky 'kqDy41@42] j?kqoa'k lnu] fcfN;k] jhok (e-iz-)& 486001
Phone - (07662) 255177, 9425186437 E-mail - [email protected] [email protected]
lsUVj QkWj fjlpZ LVMht] jhok }kjk fjlpZ tjuy vkWQ vkV~Zl eSustesUV ,.M lks'ky lkbalsl
ds fo'ks"kkad ds :i esa fuEufyf[kr nks lanHkZ iqLrdksa dk izdk'ku uoEcj] 2013 esa fd;k tk jgk gSA
mDr lanHkZ iqLrdksa esa izdk'ku gsrq vki viuk rF; ijd ,oa rdZ ;qDr 'kks/k i= Hkstdj bl vdknfed dk;Z esa lg;ksx dj ldrs gSaA fgUnh Hkk"kk esa 'kks/k i= ,e-,l- oMZ esa QkUV df̀rnso 010] djsDVj lkbt 14] Mcy Lis'k_
vaxzsth Hkk"kk esa VkbEl U;w jkseu QkUV lkbt 14] Mcy Lis'k esa HkstsaA
(vkbZ-,l-ch-,u- 978&81&87364&59&7)
(ISBN 978-81-87364-60-3)Contemporary Indian Society and Culture
ISSN 0975-4083

Research Journal of Social and Life SciencesISSN 0973-3914, Vol.-XIV- II, Year-07, June-2013
Women's Education in India
*Kavita Parvanda==========================================================Abstract- "When we educate one man we educate one person, but educatea woman we educate whole civilization". Education is one of the firstdeclaration on Human Right. Article aims to probe the role of educationin the improvement of women in India. Women in India constitute 50%of the country human resource and their contribution are vital for thenation's progress. But the magnitude of illiteracy among women is veryhigh. Only 65.46% of women are literate, as per 2011 census. Eventhough the education system expanded, the gender gap in literary remainconspicuous. A woman's lack of education also has a negative impact onthe health and well being of her children. In recent survey we found that,infant mortality was inversely related to mothers educational level.Additionally the lack of an educated population can be impediment tothe country economic development. Constitution of India confers onwomen. Equal rights and opportunities in all fields. The Government ofIndia has expressed their strong commitment towards education for all.In spite of it women in India have not been able to take full advantage oftheir rights and opportunities. Empowerment through education hasemerged as the only way to put an end to the horrors of dowry,childmarriage, discrimination b/w girl and boy and so on.==========================================================
===========================* Principal , Rama Krishna College of Commerce & Science, Satna (M.P.)
Introduction- Women in India constitute 50% of the countries human resourceand their contribution are vital for the nation progress. Although literary levelsare low there has been progress in improving educational attainment for boththe sexes in India over the last several decades . In 1991, 39% of women and64% of men were literate but in 2011, 65.46% of women and 82.14 % of menwere literate. Thus there has been a large increase in the proportion of womenwho are literate in just 20 years. Despite of improvement, there continues tobe a large gap b/w the literacy levels of men and women. The link b/w femaleliterary rates and development, is obvious. For example – Rajasthan whichhas a very low female literary rate is still burden with widespread practiceslike “Sati” and child marriage. On the other hand Kerala, which has a highfemale literary rate. Is almost devoid of all these practices.

Research Journal of Social and Li fe Sciences, ISSN 0973-3914, Vol .-XIV- II, Year-07, June-2013190
Methodology- This research is based on observations and secondary datawhich is obtained from various government reports. Reports from Ministry ofHuman Resource Development, Report on selected education statistics , Forthis research refered various websites and journals of national and internationallevels.Factors Responsible for low literary Rate among women- The literaryrate in the country has increased from 18.33% in 1951 to 74.04 % is 2011census. The female literary rate has also increased from 8.86%(in1951) to65.46% in 2011. It is noticed that female literary rate during the period 2001-2011 has increased from 53.26% in 2001 to 65.46% in 2011 whereas maleliterary has rose from 75.26% in 2001 to 82.14% in 2011. literary rate haverose by 11.79% still 34.54% of women are illiterate in India.There are several factors for the low level of female literary rate is India areidentified as-• High level of poverty• Inadequate school facilities• Gender based inequality• Social discrimination and economic exploitation• Low enrollment of girls in school• Low retention rate and high dropout rate• Orthodox mind set of society• No proper sanitation and drinking water facility in schools
As a result of these factors, women are caught in a vicious selfperpetuating cycle and their inability to pursue education again reinforces thestereotype jobs, among women.Government initiatives to improve literacy rate of women in India-The government has initiated many projects to improve the literacy rate ofwomen in India. Some of them are –Sakshaar Bharat Mission for female literary- This was launched in 2001to prevent the drop in female education.Indian Shiksha Karmi Project- This project tries to preach the ignorantIndian population that woman too can rise to be on the top after acquiringeducation.Training of Female teachers- Training women to educate the nation is alsoanother forte of the ‘Indian Shiksha Karmi Project”. This plan educates themabout all the technical know – how’s that are required to become a teacher.Scholarship for her- The ignorant section of the society always roots for theeducation of their sons. Due to several biases they ignore the education oftheir daughter. Several scholarship have been introduced by the central aswell as by state government for the girls.Mahila Samakhya Program- This initiative was taken by the government in1988. In accordance with the New Education policy of 1968. This group was

Research Journal of Social and Li fe Sciences, ISSN 0973-3914, Vol .-XIV- II, Year-07, June-2013 191
launched as a rural wing of the Sarva Siksha Abhiyan. It was launched mainlyto help and empower the weaker section of rural woman.Kasturba Gandhi Balika Vidyalaya Scheme- It was launched in the monthof July in 2004. Its main aim is to serve girls from back word classes and thosehaving financial difficulties.National Program for Education of Girls at Elementary level- This isalso another wing of SSA. It reaches to the remote places where the SSAcannot reach.Beside these government forms many committees to ensureproper utilization of funds allotted to improve the literary rate.Conclusion- “The right of every individual to educate” is one of the firstprovisions of the Human Rights. Recently education has received greater priorityas planners and policy makes recognized it as a key factor is determining thepace of development. Education being the most powerful instrument forempowering women assumes special priority in the recent plans andprogrammes of national and international action.Many women from thebackward provinces of India now have primary education. People who earlierthought that educating women was a waste of time and money, are now havingsecond thoughts. In spite of these still there is a wide gap b/w male and femaleliteracy level in India. Keeping this is view the programme of action for futurehas to be formulated so as to reduce the gender gap as well as illiteracy rateamong girls and women.======================References-1. Census of India 1951, 2001, 20112. Planning commission 1992 - 20123. Woman's education in India by Victoria A.Velkoff. International Programme
Center-October 19984. International Educational Journal. Volume I, Issue II, Page 205Website Consulted1. www.google.com2. www.planindia.org3. www.indiaonlinepage.com/populationofindia4. www.glad1bawaman.com/empowerment/education5. www.n/m. nic.in/women.htm.

Research Journal of Social and Life SciencesISSN 0973-3914, Vol.-XIV- II, Year-07, June-2013
A Comparative Study of Personali ty factors ofTrained and Untrained School teachers in Saran
*Renu Kumari==========================================================Abstract- The discussion of the finding will be done in the context oftheories and researcher so far carries out on this field moreover. Thefinding will be illustrated in the context of wider social and culturalbackground of India.==========================================================Statement of the Research Problem- Bihar has been a pioneer in theeducational scheme and programmes. Having the above points, in view and totrained teachers, the Government of Bihar has setup District Institute ofEducation and Training ( DIET) in each district of the State. The BiharGovernment also established teachers Training schools and colleges to skillthe teachers in their teaching profession in general and for the school teachingin particular.The teachers are the salt of the earth. Teachers in general and theschool teachers in Particular, lay down the foundation for the nation , and thecountry will go to the dogs if the weak foundation is laid, So, for the strongfoundation for the nation, teachers in general and the school teachers in particularmust have the acquired professional knowledge and skills through Teacher’sTraining Programmes.In spite of the rapid economic growth and development,teaching is still the best choice. Some adopted teaching profession as theirchoice of career, particularly in schools as completed teacher’s Trainingprogramme before joining the teaching profession. Training means, thesystematic series of activities- instructions, practice, review, examinations etc-to which the individuals being trained in subjected. Training makes a man perfect,prospective and successful in his or her profession.In fact, Pestolozzi in said tobe the first educator who tried to psychologies education and revolutionizedteachers training programme by placing an emphasis upon education as aprocess of drawing out of the individuals ( Mouly:1968). His main contributionis the impetus and directions which he gave to teacher training Programmeaims to develop positive attitudes towards teaching professions and providesthe prospective teachers with the necessary competencies to meet the class-room challenges ( Mouly:1968). Teachers Training Programmes develop
===========================* Assistant Professor, Solanki B.Ed. T. T. College Telpa, Chapra

Research Journal of Social and Li fe Sciences, ISSN 0973-3914, Vol .-XIV- II, Year-07, June-2013 193
confidence in trainees to face the problems and adoptability to deal withunexpected problems in daily class-room teaching. Training Colleges provideknowledge of organizing the subject matter in sequential order which suits theneed of the class. The Trainees are acquainted with the teachinques ofmotivating children in learning. The trainees are acquainted with the hazardsof teaching as profession and how to maintain mental health of himself and ofhis students.Training and learning process is directly or indirectly related withthe education and educational psychology, and the main objective of theeducation and educational Psychology is to develop necessary skills andcompetencies in the prospective teachers to enable him to understand, controland predict the behavior of learners in educative process of different levels(Stones;1984) Many of things we do perform day-to-day life are often influencedby our previous experience of training or learning. Training or learning in onesituation influences our performance in some other situation. This influence isusually referred to the carry-over of learning or training from one task toother. Not only the skill or learning or training from one task to other. Not onlythe skill or learning of the tricks of a trade or knowledge and skill acquired in aparticular subject is transferred to the other situation, but also the habits, interests,attitudes, behaviors get transferred and try to influence the activities of theindividuals in future. According to Crow and Crow (1973) the carry-over ofhabits of thinking, feeling of working, of knowledge, or of skills from one learningarea to another usually is referred to as the transfer of training Sore some(1964) and Bigge (1968) gave the same concept about training and its transfer.Infact, to be a successful doctor, one must have the required professionalknowledge and skills as well as the knowledge about the nature of the patientwhom he wants to treat. In the same way, if one wants to be a successfulteacher, he must be trained and skilled his profession and he must know aboutthe science of behavior.At last, regarding the training it may be said that the Training to the teachermakes him or her prospective and a successful teacher. Training not onlyinfluences the behavior of a person but also influences the personality of theindividual as a whole. No doubt, personality is a common word and peopleoften talk about personality that consisted only of appealing, admirable traits:affection, charm, honesty. But in fact, to psychologist, personality is muchmore complex that the ordinary use of the word implies. Personality includesnegative as well as positive personal qualities. In fact, it is difficult to give abroad definition of personality, partly because personality is not onecharacteristic or ability, but a whole range of them. According to Morris (1981)personality is a person’s psychological signature: the behavior, attitudes, motives,tendencies, out looks, and emotions with which he or she responds to theworld. Personality, however, is not just individuality. It is a consistent ofindividuality. It is reflected in our usual behavior.Life is not as predictable as a

Research Journal of Social and Li fe Sciences, ISSN 0973-3914, Vol .-XIV- II, Year-07, June-2013194
television serial, but does aspect a degree of consistency, a pattern of behaviorwhich reflect the personality and the behavioral patterns are reflected by thedifferent traits. And these tr4aits are called the personality factors. We cannotsee traits directly, but we can infer a trait from how a person behaves. Accordingto the different traits theorists, traits are relatively permanent and consistentbehavior patterns (All port; 1948, 1961, Catelli; 1963, Eysenck; 1970).
One person is differing from other person in respect of their personalityfactors and the personality of a person is reflected in their behavioral patterns.The behavior of a person is influenced by the training. In the present researchwe have to see the influence of training on some important personality factors,such as: - Self-concept, achievement motivation and locus of control. In anotherwords we have to find out that, how trained teachers are differ from theiruntrained counterpart in the different schools in Bihar in respect of theirbehavioral patterns as well as their personality factors. In this regard a briefdescription of the aforesaid personality factors is warranted.Self-concept- Rainy (1943) viewed that self-concept serves as an executiveis that it represents for the individual to way to make a variety of decisionswith some consistency. According to Rogers (1951) self-concept is an organizedconfiguration of perception of the self which are admissible to awareness.Rogers suggested that self-concept is the nuclear concept of the personality.By the self-concept each person is the best one able to find ways to solving hisor her problem. Thus, self-concept is one of the important personality factorswhich assume to play key role in realization of one’s potentials, abilities, and inreal sense key to one’s success. In the present research, we have to investigatethe influence of training on the self-concept of the individual as a factor ofpersonality.Achievement Motivation: - Like self-concept motivation is important personalityfactor and the behavioral patterns of the individual are influenced by thedifferent motivational aspects. The psychologists studied that different aspectsof human motivation such as; Achievement-Motivation, difference motivation,affiliation motivation and dominance motivation.
Among significant contribution to our understanding of human motivation,particularly the achievement motivation, a number of studies conducted by McCleland & his colleagues (1949, 1953, 1958, 1961, 1965, 1969). The achievementmotivation may be defined as a concern for excellence in performance asreflected in a competition with the standard set by others or self, uniqueaccomplishment of long term involvement. In other words achievementmotivation may be described as the tendency to strive for success or theattainment of a desired end. Deckhouse (1967) said that achievement motivationis the striving to increase, or keep as high as possible one’s own capability in allactivities in which a standard of excellence is sought to apply……….Davis(1950) and Mehta (1952) also described the achievement motivation. In the

Research Journal of Social and Li fe Sciences, ISSN 0973-3914, Vol .-XIV- II, Year-07, June-2013 195
present research we have to see how the training influences the individual’slevel of achievement motivation.Locus of Control: - Locus of control is an important personality characteristicwhich is reflected by the behavioral pattern of the individual. Locus of Controlrefers to the general expectation that people hold about the major cause ofevents and results. The cause could either be their own behavior or qualities(internal locus of control) or could be fate, chance and other powerful people(external locus of control) Marino and white (1985) described locus of controlas an important factor. It is a personality structure related to believe held bypeople about desired outcomes. Locus of Control has been treated as a trait,where persons with high control are said to be potent and assertive, while theexternal are held as helpless and incompetent (Cohen et al. 1976), Ratter(1966), 1971 left court (1976), 1981, Strickland (1977) gave detail descriptionabout the internal and external locus of control, Piston and Sing (1981) representthe locus of control in their researches.Johan (1989) observed that studentswho offered skill training programmed where programmed where moreinternally controlled as compared to those who did not offer any of theseprogrammers.Review of Litrature- Education is synonymous to learning, instruction,teaching, acquiring knowledge and guidance. The success of our educationalsystem depends on good teachers. We cannot replace the teacher with anyother type of instructional material (Hanif & Saba, 2002). Teacher is a rolemodel for students. He/She is that person who transfers his knowledge instudents’ mind in a systematic way. The importance of the role of the teacheras an agent of change, promoting understanding and tolerance, has never beenmore obvious than today (Delors, Mufti, Amagi, Carneiro, Chung, Geremek,Gorham, Kornhauser, Manley, Quero, Savane, Singh, Stavenhagen, Suhr, Won,& Nanzhao,1996). According to Charis (1989), effective teaching is essentiallyconnected with how best to bring about the desired pupil learning by someeducational activity. Many people teach, some are effective, they maintainstudent interest in subject matter and then a few are truly great they havespent much time in learning to be effectively. Effective teaching is bail ofbright future whereas ineffective depress the environment (Hanif & Saba,2002). Some evidence suggested that factors like class size, teacher qualification,school size and other school variables may play an environmental role instudent’s achievement (Linad, 1999). The mathematics teacher must be ableto motivate his students, he must be able to guide them to discover ideas andhe must be able to evaluate the achievement of his students.(Mayor, 2005).Skills of teaching and good qualities can not be developed in teacher within ashort span of training. Training say reorientation of higher education and teacherwill help the prospective teachers to understand the environment of the learnerand how to modify it (Panda, 1997). According to Moore (2004), teachers are

Research Journal of Social and Li fe Sciences, ISSN 0973-3914, Vol .-XIV- II, Year-07, June-2013196
trained in the acquisition of certain competencies related to aspects of classroommanagement, long-term medium-term and short-term planning, recording andreporting students’ work leading to the achievement of prescribed, assessableand (presumably) acquired-for-life ‘standards’.Aim and Objective of the Present Research- No doubt, research in acontinuous process and each finding may yield a new dimension. The aim andobjective of the present research is to find out that how the training programmersinfluence the behavioral pattern as well as the personality of the individual asa whole. In the present research we have to find out that, how; the trainedteachers in the different schools in Bihar are differ from their untrainedcounterparts in respect of their personality factors such as ;self concept,achievement, motivation and locus of control. Training makes a person perfect,prospective, goal oriented in his or her profession. The findings of such anEndeavour will serve as guide line for the institutions, for the organizations andultimately for the Governments before appointing a person for a particular job.The finding of the present research will also serve as the guide line for properguidance, proper counseling and proper training to the employ before service& in service for the fruitful and positive result and for the positive behavioralpatterns of the employees.Hypostheses-Since no studies are available on the problem to be undertakenhave for the study. So, the present investigator finds no direction with respectto the differences among two types of groups on various personality factors,hence, there is no option except to adopt null hypotheses. These proposehypotheses for empirical testing are given below:1. There will be no significance of difference between trained -untrained
school teachers on the variable of self-concept.2. There will be no significance of difference between the two groups of
school teachers on achievement motivation.3. There will be no significance of difference between trained teachers
and their counterparts on the locus of control.4. There will be no significance of difference among the male & female
teachers wreck of there self-concept loves off control.Sample- Data of the present research will be collected from the differentPrimary and Secondary schools from the different district of Bihar. A studywill be conducted on a sample of total (600) six hundred Primary & Secondaryschool teachers. 300 (three hundred) trained & 300 (three hundred) untrainedteachers posted in the different school in saran.Tests and Tools- Keeping in mind purpose studies adequate test of themeasurement following tools will be used the gather information for securingfuture reliability and validity of the obtained data of the randomly selectedsubject will be informally interviewed.1. Self-concept test by Dr. Mohsin.

Research Journal of Social and Li fe Sciences, ISSN 0973-3914, Vol .-XIV- II, Year-07, June-2013 197
2. Achievement motivation test by Mukharjee.3. Locus of control (External-Internal scale by Romapal.4. Biographical information Blank (BIB)will be used for taping demographic
characteristics viz; age, sex, educational qualification, pay scale, maritalstatus, religion, caste, job experience, promotion etc of the respondents.
Analysis of the Data- Analysis of the data and result correlation, ratio, ranketc. appropriate statistics will be utilized. Discussion and Conclusion- The discussion of the finding will be done inthe context of theories and researcher so far carries out on this field moreover.The finding will be illustrated in the context of wider social and culturalbackground of India.======================References-1. Farooq, S., Husain, A., & Mehmood, A. (2005) Comparison of impact
of activity based and traditional methods of teaching on achievement inmathematics. Bulletin of Education and Research. 27(2). pp. 57-64.Lahore: University of the Punjab.
2. Hanif, A., & Saba, K. (2000). A study of effectiveness of trained anduntrained teachers at elementary level. Lahore: Unpublished masterthesis, University of the Punjab
3. Mayor, J., R. (2005). Mathematical education notes. Massachusetts:University of Massachusetts.
4. Panda, B. N., & Tewari A.D. (1997). Teacher education. New Delhi:A.P.H. Publishing Corporation.
5. Linad, D. (l999). Teacher quality and student achievement a reviewof state policy evidence.
6. Gardner, H., & Mansilla, V. (1994). Teaching for understanding in thedisciplines and beyond. Teachers’ College Record, 96(2): pp 198-218
7. Delors, J., Mufti, L., Amagi, I., Carneiro, R., Chung, F., Geremek, B.,Gorham, W., Kornhauser, A., Manley, M., Quero, M.P., Savane, M.A.,Singh, K., Stavenhagen, R., Suhr, M.W., Won, M. & Nanzhao, Z. (1996).Learning: The treasure within: Report to UNESCO of theinternational commission on education for the twenty first century.Paris: UNESCO.

Research Journal of Social and Life SciencesISSN 0973-3914, Vol.-XIV- II, Year-07, June-2013
An Adverse Effect of Ergogenic Aids on Athletes
*Kamleshkumar P. Patel**Narendrasingh R. Kshatriya
==========================================================Abstract-Over one million American seek short cuts to larger musclesand greater endurance with anabolic steroids and other performanceenhancing drugs. Steroids have many negative effects; they have manyneeded medical purposes. Cocaine is psychologically addictive. Heavyusers often come to treat it is an emotional crutch, exhibiting “behavioraldependence”. Most people smoke marijuana to experience euphoricproperties, including relaxation, intensification of perception, and visualfantasies. Males who take large doses of anabolic steroids typicallyexperience changes in sexual characteristics. Teenagers are usuallyimpatient and will resort to anything that they think will help them. Withouteducation in these subjects they will be left to make uniformed choicesand most likely do permanent damage to their bodies without knowing ituntil it is too late.==========================================================
===========================* Associate Professor, M. D. Samajseva Mahavidiyalaya, Gujarat Vidyapith,
Ashram Road, Ahmedabad.** Assistant Professor, Smt. R. D. Shah Arts and Smt, V. D. Shah Commerce
College, Dholka, Ahmedabad
Introduction- Drugs have been a problem in our society for many years.They have been used and abused by many groups, including professional athletes.It is certainly quite common to hear about or read about athletes and drug use.Although drugs have a lengthy history of use by athletes, they have variedeffects on the body and different preventions. Much of the world’s supply ofcocaine is produced in South America. Thousands of year’s age, the ancientIncas of Peru chewed coca leaves because they made it possible for them towork in the high mountains of the land for longer periods of time. In the 1880’sBolivian soldiers were given the drug to help them gain endurance and overcomefatigue. One hundred years later as many as 90 percent of the natives of theAndes Mountains in Peru regularly chewed coca leaves. It wasn’t until theearly years of the 20th century that cocaine increased in popularity amongathletes.Cocaine: - Cocaine is a naturally occurring alkaloid, extracted from the leaves

Research Journal of Social and Li fe Sciences, ISSN 0973-3914, Vol .-XIV- II, Year-07, June-2013 199
of the coca plant. It is an excellent local anesthetic and a widely abused illicitdrug. Cocaine is an odorless, white powder. The many street names of cocaineinclude “cock”. “Lady” and “gold dust”. Street cocaine consists of cocainehydrochloride that is mixed or “cut” with a number of other white, powderysubstances. These include procaine, sugars like lactose and dextrose, stimulantssuch as Dexedrine and caffeine, and other substances including cornstarch,talcum powder, and flour. Cocaine is not an addictive drug in a strictly physicalsense. The body does not develop a physical dependence on it nor is therewithdrawal when a user stops taking it. Cocaine increases body temperature,heart rate and blood pressure and it curbs the appetite. Prolonged use cancause the septum, which divides the nostrils, to collapse. On the other hand,cocaine is psychologically addictive. Heavy users often come to treat it is anemotional crutch, exhibiting “behavioral dependence”. Users usually have lowself-esteem and suffer spells of depression. This has been demonstrated inlaboratory tests where monkeys starved themselves to death so as to keepgetting cocaine.Coca Story- Charles White, a Heisman trophy winner, was tripped out of hismind on August 21, 1987 at 12.10 p.m. in Brea, California. The Los AngelesRams were to flying to San Diego that afternoon, but white was going to missthe flight. White had spent the nine hours from 3 a.m. to noon smoking cocainethrough a pipe in an unlit, abandoned warehouse. White and his friend werealone, and he felt that many were trying to kill him. He ran out of the warehouseand grabbed a garbage lid to hold in front of him like a shield. He ran into abusiness screaming. “Someone is trying to kill me!” After about thirty seconds,he ran out and went to a vacant lot, He then saw five policemen coming at himwith guns drawn. He screamed, “Don’t kill me!” White broke a few tacklesbefore the cops laid him out. He fought so hard that both of his wrists werepermanently scarred by the handcuffs.Marijuana- Marijuana was first smoked as a medicine as early as 2737 B.C.in China. Marijuana is a mixture of leaves, stems and flowering tops of thehemp plant. The hemp plant has the highest cannabinoid concentration foundin the flowering tops. Marijuana is referred to as grass, pot, tea or weed. Thehemp plant grows wild through most of the world and can be cultivated in anyarea with a hot season. It grows best in central Asia. The main psychoactivecompound in marijuana is delta-9-tetrahydrocannibinal, better known as THC.Marijuana is by far the most frequently used illicit drug in the United States.Most people smoke marijuana to experience euphoric properties, includingrelaxation, intensification of perception, and visual fantasies. Some athletesuse marijuana following a sporting event because it allows them to feel relaxedand at peace. However, marijuana has some immediate negative effects. Almostimmediately after marijuana is smoked, a user’s heart rate increases up to 50percent higher than normal. Also the tiny blood vessels in the eyes dilate, and

Research Journal of Social and Li fe Sciences, ISSN 0973-3914, Vol .-XIV- II, Year-07, June-2013200
the whites of the eyes take a reddish hue Many people who get high reportthat they become very hungry or extremely drowsy within fifteen minutes ofsmoking can also cause the throat and mouth to become dry. People under theinfluence of marijuana perform poorly on physical tasks. Marijuana causesmany different mental problems. Marijuana can produce a “chronic cannabissyndrome.” The syndrome consists of loss of energy, reduced levels of driveand ambition, apathy, depression, agitation and withdrawal from previousinterests. Marijuana is the biggest drug problem in sports.Anabolic Steroids- Steroids are man-made derivatives of testosterone, themale hormone. For performance enhancement, anabolic-androgenic steroidsare today’s sports drugs of choice. Steroids are a family of synthetic compounds.Anabolic refers to the ability of steroids to build up muscle tissue. Testosteronecame into use in the sporting arena by Russian weight lifters in the 1940’s and1950’s. Despite all the tragic physical effects steroids have on the body, athletescontinue to use it one of the most alarming is the threat of AIDS, which can betransmitted if needles are shared. Males who take large doses of anabolicsteroids typically experience changes in sexual characteristics. Some possibleside effects are shrinking of testicles, reduced sperm count, impotence, balding,difficulty in urinating, development of breasts, and enlarged prostate. Femalesmay experience masculinization as well as other problems. They experiencegrowth of facial hair, changes in or cessation of the menstrual cycle, enlargementof the clitoris, deepened voice, and breast reduction. Although there are manydifferent effects on the male and female, both may suffer from acne, jaundice,trembling, swelling of feet or ankles and bad breath. There are also psychologicaleffects caused by steroids. Many athletes report “feeling good” aboutthemselves. The user will suffer wide mood swings ranging from violentperiods, even homicidal, episodes known as “rold rages” to bouts of depression.They also suffer from paranoid jealousy, extreme irritability, delusions andimpaired judgment stemming from feelings of invincibility. A few examples ofprofessional athletes that use steroids are Brian bus worth, ArnoldSchwarzenegger, and john Karmic. American Danny Harris ranked numberone in the hurdles in 1991, failed a drug test, and could be suspended for fouryears. The most famous suspension for steroid use was a Canadian sprinter,BEN JOHNSON, During the 1988 Olympics, Ben won the 100 meter dashin a world-record 9.79 seconds. He then hand his title revoked when he testedpositive after the race.Conclusion- This aspect of needing quick help is also a problem with teenager,because their bodies aren’t always done growing. Thus, there is a drug problemamong professional athletes today. Although, it has existed for many years dueto a variety of circumstances efforts are being made to eradicate its use bymaking people aware of the harmful effects that drugs can have. Many athletesneed to learn to say “no.” for the price of not saying.....”NO,” IS THE

Research Journal of Social and Li fe Sciences, ISSN 0973-3914, Vol .-XIV- II, Year-07, June-2013 201
HIGHEST PRICE OF ALL.======================References-1. Anabolic Steroids." NIDA: Research Report Series 1991:1-9.2. "Charles White's Story." Sports Illustrated 29 Aug. 1988:52-57.3. "Coca." World Book Encyclopedia. 1990 ed.4. Lend, Joe. "Drug Abuse." Reader's Digest Jan. 1987:24-25.5. "Marijuana." World Book Encyclopedia. 1990 ed.6. Meer, Jeff. Drugs and Sports. New York: McMillan House 1990.7. Olshevsky, Boris. "Stopping an Athlete Killer." Soviet Life July1991:52-54.
ISSN 0975-4083
A Registered Reviewed Research JournalSix monthly Bi-lingual Journal (English/Hindi Editions)
Please address all Communications -Prof. Braj Gopal Shukla
Chief Editor Research Journal Social and Life Sciences
41/42, Raghuwans Sadan, Shantikunj, Bichhiya, Rewa 486 001 (M.P.) Phone - (07662) 255177, 9425186437
E-mail - [email protected] [email protected]
The Aims & Objectives-
Guidelines & Member Ship Fee
To provide a plateform for the publication of original unpublished Research Papers, Summary of Research Project, Thesis and Book review relating to all subjects of Social & Life Sciences and to promote interdisciplinary research work. Book Review can be published on receipt of two copies of concerned book.
-Authors/ Researchers can contact in the Registered Office given below-
Indexed & Listed at: Ulrich’s International Periodicals Directory ©, ProQuest, U.S.A. Title Id : 715204
Volume-IX, Coming in September, 2013

Research Journal of Social and Life SciencesISSN 0973-3914, Vol.-XIV- II, Year-07, June-2013
A Comparative Study of Self Concept AmongCollege Level Players of Gujarat University
* Parixitsinh D . Mandora==========================================================Abstract- The purpose of the study was to compare the self concept amongcollege level players of Gujarat University. For the purpose of the study60 college level players which consist of 30 volleyball players and 30basketball players were randomly selected as the subjects for the study.The variable selected for this study was self concept. Self concept wasassessed by the total scores in self concept scale developed by Dr. J .H.Shah with the help of the questionnaire related to self concept. Necessarydata were collected from this questionnaire. Data were collected withregards to self concept variable from 60 college level players in theirrespective colleges. The data was analyzed by applying descriptivestatistic. i.e Mean, Standard Deviation, standard Error of Mean. Thelevel of significance was set at 0.05. The finding of the study in relationto self concept showed higher level of self concept in overall male playersin comparison to overall female players. On the basis of the finding ofthe study the following conclusion are drawn. Male volleyball playersand basketball players were found high level of self concept than femalevolleyball players and basketball players.==========================================================
===========================* Associate Professor, Swaminarayan Arts college, Ahmedabad. Gujarat.
Affiliation for PhD Research : JJT University, Jhunjhunu, Rajasthan, India.
Introduction- Self concept is broadly defined as a person’s perception ofhimself. These perceptions are formed through one’s environment and areinfluenced especially by reinforcements evaluations by significant others andonce attributes for one’s own behaviour. Physical education and sports plays avital role in building society. Physical educators and sports psychologists beganto give attention to the idea and value of self concept through the belief thatnon cognitive variables have role in the overall personality traits of the individualplayers. The self concept is composed of relatively permanent self assessment,such as personality characterises, knowledge of one’s skill and abilities, one’sinterest and hobbies and awareness of physical variables. According toencyclopaedia of psychology the self concept is the totally of individualsattitudes, judgements and values of an individual relating to his behaviour abilities

Research Journal of Social and Li fe Sciences, ISSN 0973-3914, Vol .-XIV- II, Year-07, June-2013 203
and qualities, self concept embraces awareness of these variables and theirevaluation. Self concept means what an individual thinks about himself. It isone’s own conception of his intelligence, abilities academic status, behaviour,mental qualities and socio economic status. Each behaviour of an individualsimple and complex is influenced by how he or she sees himself and herself. Ifan individual feels he is accepted socially, he will act more friendly and expresshis interest for the activity. Research studies have supported the belief thatthere is significant relation between self concept and performance in sports.As the self concept is dominant element in personality traits, the measurementof self concept becomes very essential for further development of playersperformances.Objectives:• The main objective of this study was to find out differences between
male volleyball players and male basketball players, female volleyballplayers and female basketball players as well as between the overallvolleyball players and basketball players on the self concept.
• To find out the differences between male and female volleyball players,male and female basketball players, as well as between overall maleand female players on self concept.
Hypothesis:• There would be significant differences between male volleyball players
and male basketball players, female volleyball players and femalebasketball players as well as between overall volleyball players andbasketball players on self concept.
• There would be significant differences between male and femalevolleyball players, as well as between overall male and female basketballplayers on self concept.
Methodology-Subjects-This study was conducted to find out the different level of self conceptamong college level volleyball and basketball players. This study was conductedon 60 college level players of Gujarat University. This all subjects wereparticipated at Inter university level in volleyball and basketball. Out of 60subjects 30 were volleyball players (15 male and 15 female) and 30 werebasketball players (15 male and 15 female).and their age ranged from 17 to 21years.Data collection- For the purpose of this study the data was collected fromthe questionnaire related to self concept developed by Dr. J .H. Shah Ahmedabadwas administrated. The test retest reliability of this scale was 0.73.Statistical design- The collected data was statistically analyzed and Mean,SD and T- value were obtained to find out the significant differences betweenthe groups of volleyball players and basketball players. Male volleyball playersand male basketball players, female volleyball players and female basketball

Research Journal of Social and Li fe Sciences, ISSN 0973-3914, Vol .-XIV- II, Year-07, June-2013204
players, male and female volleyball players and male and female basketballplayers as well as between overall male and overall female players.
Result and Discussion Table -1,
Mean, SD and T-value regarding volleyball and basketball players onself concept
No Group Mean SD SEM T-value
1 Volleyball 32.37 15.10 2.64 3.67* 2 basketball 45.52 9.97 1.78 It is evident from the results of table-1 that volleyball players group had
lower mean score 32.37 and SD 15.10 as compared to basketball group whohad the mean value of 45.52 and SD 9.97. The differences between these twogroups were found significant at 0.01 levels. T- Value was found 3.67* so thevolleyball group denotes low level of self concept as compared to basketballgroup.
Table-2Mean, SD and T-Value regarding male volleyball players and male
basketball players.No Group Mean SD SEM T-value 1 (Male)
volleyball 27.50 12.58 3.05 4.54*
2 (Male) basketball
41.51 10.29 2.31
It is evident from the result of table-2 that two groups of male volleyballplayers and male basketball players had mean value of 27.50 and 41.51respectively, where SD of these groups were 12.58 and 10.29 respectively.There were significant differences between male volleyball players and malebasketball players at 0.01 levels. The T- Value was found 4.54*. The malebasketball group found high level of self concept as compared to male volleyballgroup.
Table-3Mean, SD and T- Value regarding female volleyball players and
female basketball players.No Group Mean SD SEM T-value 1 (Female)
volleyball 25.81 11.70 2.54 3.78* 2 (Female)
basketball 38.25 9.74 2.39 From the statistical analysis of table-3 it is evident that the female volleyball

Research Journal of Social and Li fe Sciences, ISSN 0973-3914, Vol .-XIV- II, Year-07, June-2013 205
group had mean scores of 25.81 and the female basketball group found meanscore of 38.25. These two groups had SD value 11.70 and 9.74 respectively.The calculated T- Value were not found to be significant.
Table-4Mean, SD and T- Value regarding gender differences within
volleyball players.No Group Mean SD SEM T-value
1 (Male) volleyball 36.82 13.80 3.30
3.10* 2 (Female)
volleyball 24.55 11.97 3.05 The result presented in table-4 indicates that two gender group i.e the
male and female volleyball group had the mean value of 36.82 and 24.55respectively. Where the SD for these groups were 13.80 and 11.97 respectively.The T- Value was found 3.10*. This indicates significant difference betweentwo gender groups. The male volleyball group revealed more self concept ascompared to female volleyball group.
Table-5Mean, SD, and T- Value regarding gender differences within
basketball players.No Group Mean SD SEM T-value
1 (Male) basketball 40.97 9.26 2.42
0.25* 2 (Female)
basketball 40.57 9.16 2.38 It is evident from the result of table-5 that the male basketball players
had mean score of 40.97 and SD 9.26, where as the female basketball grouphad mean score of 40.57 and SD 9.16. The differences between the twogender groups of basketball were not found significant at 0.01 levels becausethe T- value for these groups was found 0.25. So the both group did not foundsignificant differences.
Table-6Mean, SD and T- value regarding overall male and female players.No Group Mean SD SEM T-value
1 Overall Male 42.61 11.97 2.05
2.75* 2 Overall
Female 34.61 14.54 2.45 It is evident from the result of table-6 that overall male players had
higher score of mean 42.61 and SD was 11.97. Where the mean score ofoverall female was found 34.61 and SD was 14.54. the difference betweenthese two groups were found to significant at 0.05 levels. The overall male

Research Journal of Social and Li fe Sciences, ISSN 0973-3914, Vol .-XIV- II, Year-07, June-2013206
group demonstrated significantly the higher level of self concept as comparedto the overall female group.Conclusion- Among the male players the male basketball players found higherlevel of self concept in the comparison to the volleyball players. Among thefemale players the female basketball players found high level of self conceptas compared to female volleyball players. Overall male players were foundhigh level of self concept as compared to female players.The result of thestudy has undoubtedly revealed that participation in sports results in significanthigh level of self concept among college level players. The finding of this studystrongly supports the view that participation in games and sports significantlydevelops the personality traits of the individual.======================References-1. Bolus R., & Shavelson R.J. 1982. Self concept; the interplay of theory and
methods.2. Broota S& Phukan, M 1999, A comparative study of self concept of orphan
children and children with natural parents.3. Deshmukh N.H. 2000, A study of anxiety, achievement, motivation and academic
achievement of junior college students with high and low level self concept.4. Holl C.1993, principles of behaviour, New York, Appleton century ,p-87-91.5. Journal of educational psychology,74,3-17.6. www.sportsquest.com

Research Journal of Social and Life SciencesISSN 0973-3914, Vol.-XIV- II, Year-07, June-2013
Abuse of Steroids in Sports Performance
*Hasan Mehdi**Lilly Pushpam Isaac
==========================================================Abstract- We have been searching for a long period, who could improvethe demonstration of the players. Steroids may improve the show of theplayers but temporarily and they prove hazardous in the long run. Theyare addictive. Steroids are freely used in athletics, world -wide. Sometime these steroids are favourable to demonstrate the game but in somecases. Players take steroids and special diet to make their games bestand afterwards they ruin their health. If any one of the athletes issuccessful then these steroids are used freely among the players, withoutknowing its side-effects.==========================================================
===========================* Lecturer, Department of Physical Education, Maulana Azad Institute of
Humanities Science and Technology, Mahmudabad, Sitapur.** Assistant Professor, Department of Physical Education, Tamil Nadu Physical
Education and Sports University Chennai-60012
Anabolic steroids are synthetic derivatives of testosterone. Theirappropriate use is indicated for many medical conditions. Anabolic steroidshave been shown to increase sports performance. These effects have beenfound to enhance the appearance and performance of the athlete. The playersshould take adequate knowledge of steroids before taking it. They should takethe steroids under the supervision of the experts and do not take beyond theprescribed doses. But the players exceed the limit for their best performanceand title and suffer afterward by the dangerous side effects of these steroids.When they are used improperly, they may cause serious health problemssuch as high blood pressure and heart disease; liver damage and cancers; andstroke and blood clots. Other side effects of steroids include: nausea andvomiting, increased risk of ligament and tendon injuries, headaches, achingjoints, muscle cramps, diarrhoea, sleep problems and severe acne etc.Whilethe total impact of anabolic steroid abuse is not known, health care providershave observed the following problems:Blood- Development of cholesterol patterns associated with coronary heartdisease, obstructed blood vessels, or strokeHeart- Increased cholesterol, increased blood pressure
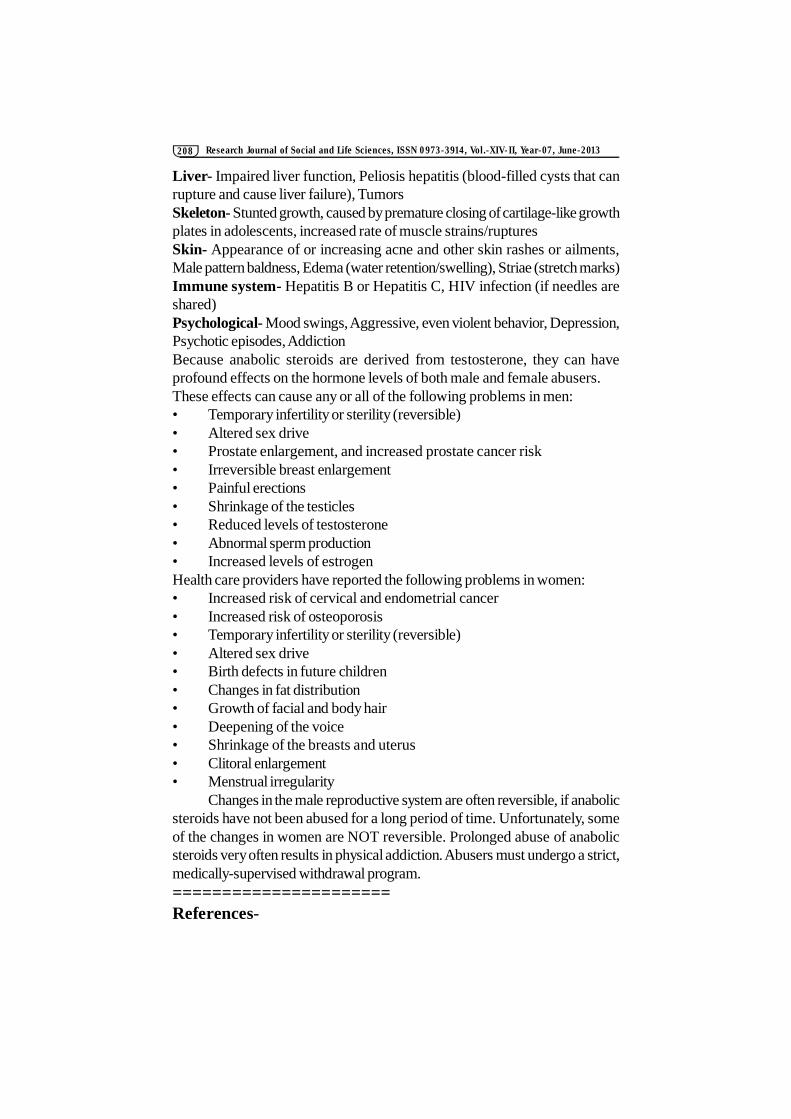
Research Journal of Social and Li fe Sciences, ISSN 0973-3914, Vol .-XIV- II, Year-07, June-2013208
Liver- Impaired liver function, Peliosis hepatitis (blood-filled cysts that canrupture and cause liver failure), TumorsSkeleton- Stunted growth, caused by premature closing of cartilage-like growthplates in adolescents, increased rate of muscle strains/rupturesSkin- Appearance of or increasing acne and other skin rashes or ailments,Male pattern baldness, Edema (water retention/swelling), Striae (stretch marks)Immune system- Hepatitis B or Hepatitis C, HIV infection (if needles areshared)Psychological- Mood swings, Aggressive, even violent behavior, Depression,Psychotic episodes, AddictionBecause anabolic steroids are derived from testosterone, they can haveprofound effects on the hormone levels of both male and female abusers.These effects can cause any or all of the following problems in men:• Temporary infertility or sterility (reversible)• Altered sex drive• Prostate enlargement, and increased prostate cancer risk• Irreversible breast enlargement• Painful erections• Shrinkage of the testicles• Reduced levels of testosterone• Abnormal sperm production• Increased levels of estrogenHealth care providers have reported the following problems in women:• Increased risk of cervical and endometrial cancer• Increased risk of osteoporosis• Temporary infertility or sterility (reversible)• Altered sex drive• Birth defects in future children• Changes in fat distribution• Growth of facial and body hair• Deepening of the voice• Shrinkage of the breasts and uterus• Clitoral enlargement• Menstrual irregularity
Changes in the male reproductive system are often reversible, if anabolicsteroids have not been abused for a long period of time. Unfortunately, someof the changes in women are NOT reversible. Prolonged abuse of anabolicsteroids very often results in physical addiction. Abusers must undergo a strict,medically-supervised withdrawal program.======================References-

Research Journal of Social and Li fe Sciences, ISSN 0973-3914, Vol .-XIV- II, Year-07, June-2013 209
1. Kanayama G, Pope H: Illicit use of androgens and other hormones; recentadvances. Current Opin Endocrinol Diabetes Obes 2012 June;19(3):211-9.
2. Baumann G: Growth hormone doping in sports: a critical review of use anddetection strategies. Endocr Rev 2012 Apr;33(2):155-86.
3. Nikolopoulos D, Spiliopoulou C, Theocharis S: Doping and musculoskeletalsystem: short-term and long-lasting effects of doping agents. Fundam ClinPharmacol 2011 Oct;25(5):535-63.
4. Dinshaw sensei farokh.Fighting fit forever. The marine sports publishingdivision Bombay,1977
5. Ghosh aloke. Hand book of Sports Medicine and Physical Fitness. Allied BookAgency. Calcutta 1980.
6. Klaps carl E. and Arnheim Daniel D. Modern Principles of Athletic Training.The C.V.Mosby company, London,1981.
7. Shaven Larry G.Essentials of Exercise Physiology. Surjeet Publication Delhi-1982.
8. Wilmore jack H. Athletic Training and Physical Fitness, Allyu and Bacon, Inc.Boston, London, Sydnay,1977.World Anti-Doping Code. World Anti-Doping Agency, January 1, 2009.Available at: http://www.wada-ama.org/Documents/World_Anti-Doping_Program/WADP-The- Code/WADA_Anti-Doping_CODE_2009_EN.pdf
Please address all Communications -Prof. Braj Gopal Shukla
Chief Editor Research Journal Social and Life Sciences
41/42, Raghuwans Sadan, Shantikunj, Bichhiya, Rewa 486 001 (M.P.) Phone - (07662) 255177, 9425186437
E-mail - [email protected] [email protected]
The Aims & Objectives-
Guidelines & Member Ship Fee
To provide a plateform for the publication of original unpublished Research Papers, Summary of Research Project, Thesis and Book review relating to all subjects of Social & Life Sciences and to promote interdisciplinary research work. Book Review can be published on receipt of two copies of concerned book.
-Authors/ Researchers can contact in the Registered Office given below-
A Registered Reviewed Research JournalSix monthly Bi-lingual Journal (English/Hindi Editions)
Indexed & Listed at: Ulrich’s International Periodicals Directory ©, ProQuest, U.S.A. Title Id : 715205

Research Journal of Social and Life SciencesISSN 0973-3914, Vol.-XIV- II, Year-07, June-2013
Kinesiology - The Science of Energy Balancing
* Jignasa J. Vaghela==========================================================Abstract- Kinesiology is the most holistic of all the natural therapies and,like traditional Maori medicine, recognizes the importance of body, mindand spirit in health and healing. Kinesiology enables people to detectand correct imbalances that relate to stress, nutrition, learning problems,minor injuries, and other issues they meet in their daily life. A non-invasivemethod, Kinesiology is grounded in the study of anatomy and physiologyand uses muscles as monitors of stress and imbalance within the body. Afundamental premise of kinesiology is that the body has innate healingenergy and is always doing its best to care for itself, but sometimes needsto be helped into a better position to achieve this care.==========================================================
===========================* P.E. Teacher, Shreyas High School, Ahmedabad.
Introduction- Kinesiology recognizes the flows of energy within the body notonly relate to the muscles but to every tissue and organ that make the body aliving, feeling being. These energy flows can be evaluated by testing the functionof the muscles, which in turn reflect the body’s overall state of structural,chemical, or emotional balance. In this way Kinesiology taps into energies thatthe more conventional modalities overlook. Kinesiology looks beyond symptomsand does not treat named diseases nor does it diagnose them. Kinesiology isconcerned with imbalances in the body’s energy. In this respect, kinesiologyhas close links with the acupuncture concept of energy flow. Where, as theresult of injury, emotional trauma, nutritional or other unresolved stress, theenergy flow is interrupted, the whole body is affected. The exact nature ofblockage in the energy flow can be more closely identified by muscle testing.Acupressure massage, light touch and other simple correction skills are usedto restore muscle balance, which has a flow-on effect into total body energy.Kinesiology is not limited to dealing with ailments. Energy balancing brings aperson closer to achieving any goal of their choice - in sport, relationships,learning or coping with life generally.Definitions of KinesiologyThe Leadership Vision 2000 Kinesiology Group comprised of kinesiologistauthors and leaders from the many, diverse branches of Kinesiology, producedtwo new definitions of kinesiology.Easy Definition Put simply, kinesiology is

Research Journal of Social and Li fe Sciences, ISSN 0973-3914, Vol .-XIV- II, Year-07, June-2013 211
a non-invasive method using muscle feedback and body awareness, that canhelp you to reduce stress and pain, improve performance at school, work andhome, in sports, in relationships, and promote health and well-being.ProfessionalDefinition Kinesiology is an educational bioenergetic model using musclemonitoring as a primary tool to obtain feedback from the whole being’s innatewisdom to allow self-regulation for their highest good.The Kinesiology Practitioners Accreditation Board (KPAB), the legalentity which worked with the New Zealand Qualifications Authority (NZQA)to produce the NZ National Diploma in Kinesiology, says Kinesiology is anatural approach to wholeness and creative living. They define it this way:“Kinesiology is defined primarily as the use of muscle testing to identifyimbalances in the body’s structural, chemical, emotional or other energy, toestablish the body’s priority healing needs, and to evaluate energy changesbrought about by a broad spectrum of both manual and non-manual therapeuticprocedures.”Applied Kinesiology (AK)- The PKP kinesiology programme grew originallyfrom Applied Kinesiology (AK) a system using muscle testing as a functionalneurological evaluation which itself grew out of chiropractic. Dr Dewe trainedin Applied Kinesiology but noted that year by year it became more orientatedtowards the medical model. Dr. Dewe was more interested in the ‘energy’model of medicine and the effects of thoughts, emotions and spiritual aspirationson human function and structure. So PKP has moved away from AK and theNewtonian model to the quantum model of physics and energy. AK wasfounded and developed by Dr. George Goodheart, Jr.DC, a chiropractor whodescribes AK as a diagnostic system using muscle testing to augment normalexamination procedures. Further advances have been made by members ofthe International College of Applied Kinesiology. The methodology of AK isconcerned primarily with neuromuscular function as it relates to the structural,chemical and mental physiologic regulatory mechanisms. Although AKoriginated within the chiropractic profession, it is an approach to clinical practice,with multidisciplinary applications.
The different procedures developed by Dr. Goodheart and others in theInternational College of Applied Kinesiology are derived from many disciplinesincluding chiropractic, osteopathy, medicine, dentistry, acupuncture, biochemistry,etc.., and are currently being used by doctors of chiropractic, osteopathy,homeopathy, dentistry and medicine. Applied Kinesiology is performed by healthcare professionals. They must be a medical doctor, osteopath, chiropractor ora dentist. They then study Applied Kinesiology in a post graduate setting usuallyin weekend classes. The basic course takes over 100 hours of classroomstudy and many hours of study and practice at home. A basic proficiency inApplied Kinesiology is tested for at the end of this basic class. Continuingclasses are taken to reach the next step where a diplomat exam, a complete

Research Journal of Social and Li fe Sciences, ISSN 0973-3914, Vol .-XIV- II, Year-07, June-2013212
understanding as shown by a written and oral test, is taken. To attain this level,over 300 hours of classroom study are required along with the writing of atleast two research papers. Less than 10% of people attend chiropractors forreasons other than physical or rheumatic complaintsHow does Kinesiology work?
Kinesiology is the most comprehensive of the modern natural therapies. Itis, however, very easy to learn some kinesiology techniques to boost your ownenergy or help you handle day-to-day stress situations. Have you ever come infrom shopping with tired feet, felt your energy at an all time low and wish youcould get a quick energy boost? Try the walking gait reflexes for yourself andfeel your energy rise.Energy Boost with Foot Reflex Points- This is a quick energy boost. Ifyou come in from shopping with tired feet, feel your energy at an all-time lowand wish you could get a quick energy boost try the kinesiology technique thatDr Bruce Dewe uses. Simply rub the Walking Gait Reflexes on your feet foryourself and feel your energy rise! The special reflexes in the feet associatedwith walking are called gait reflexes. One of the many factors involved intiredness could be a disturbance in our walking gait. This is an imbalance inthe normal co-ordination of the muscles used in walking. When the synergisticand antagonistic muscles are not working in an integrated, synchronised manner,walking becomes tiring.Gait reflex imbalance can be related to situations such as: tiredness, unevenshoe-wear, poor co-ordination, brain fog or confusion, dyslexia or learningproblems. A Professional Kinesiology Practitioner would also considermetaphysical factors such as: anxiety in terms of stepping out, fear of change,not moving ahead in your life.Walking is meant to have an energizing, de-stressing and integrating influence on the human body. A brisk walk, evenwhen we are tired, can lift our spirits and can help us to feel refreshed again.Sometimes, however, it doesn’t seem to work. We take a walk or go to thegym but our energy remains low and it requires effort to motivate ourselves.We return more tired than when we started. Rubbing our gait reflexes canprovide a much needed lift at times like this.First assess your energy:1. Walk around the room.2. Make an assessment of your energy level on ascale of 0 - 10Rub the Gait Reflexes (between the foot bones)1. Look at the diagram of your Walking GaitReflexes:2. Rub all points with firm pressure (They may betender).Now reassess your energy level:

Research Journal of Social and Li fe Sciences, ISSN 0973-3914, Vol .-XIV- II, Year-07, June-2013 213
1. Walk around the room.Make a new assessment of your energy level on a scale of 0-10.Stressed out to the max? Hold your ESR points for 30 - 90 seconds and
marvel like we did that a simple reflex from Chinese medicine can have sucha profound effect.Kinesiology is a therapy with a difference-It does not treat the symptomsor signs of named diseases. Kinesiologists look at the whole person and thinkin terms of a triad of health. They place equal emphasis on all sides of thetriangle. Some health care systems emphasize nutrition, some concentrate onnutritional, chemical, mental or psychological aspects of ill health. Still otherslook only at structure or the exercise component. The result is an unbalancedtriangle or one-sided view of health or disease. Each of us is special, uniqueand different. Inside our head we all have our own personal bio-computer thathas been programmed by both our genetic makeup and our life experiences.Our body is the like VDU (visual display unit) or monitor for our bio-computerand lets us (and everyone else) see how well bio-computer is coping with life.People-watching is a favourite game for most of us. Each one of us looks atsubtle cues when we meet people. Body posture is a reflection of muscleactivity. The way we stand or stoop, the way we walk or amble, the tense,uptight shoulders or the down-turn of the lips speak louder than any wordsabout our life experience. Different healing professions have their own way ofworking with unequal muscle activity.
Usually this expresses itself as pain or a knotted-up muscle.Chiropractors manipulate the spine, Osteopaths do more subtle spinaladjustments, Physiotherapists and Massage Therapists work more directly onthe muscles themselves. All these professions aim to relax the knotted-upmuscle. Medical Doctors use pain relieving drugs or anti-inflammatorymedication (NSAIDs) to relieve the inflammatory process in the knotted-upmuscle. Kinesiologists, acupuncturist and other energy-based body-workers work from the perspective that knottedup muscles relate toimbalances in body energy.
If the diagrams to the left were of a swingdoor with two springs attached to the wall, anengineer would note that one spring was knotted-up and the other overstretched.
He would replace the weak overstretchedspring in figure 2 and the door would hang inthe middle of the door frame. Because bothsprings were pulling equally, the knotting-up fromthe second spring disappears. Kinesiology workswith muscle activity in a similar manner to theengineer and the door. Instead of trying to relax

Research Journal of Social and Li fe Sciences, ISSN 0973-3914, Vol .-XIV- II, Year-07, June-2013214
the knotted muscle like other healing professions,kinesiology works on the weakened muscle.When a kinesiologist is faced with pain or aknotted-up muscle they test several muscles forequality of strength on either sides of a joint (orthe spine). If they test and find a muscle testsweak on one side of the body compared with thesame muscle on the other side, they work withbody energy reflexes to restring then theweak muscle. Kinesiologists call this “muscle balancing”.
Kinesiologists have found that many things (including mental stress orfears, our diet and daily exercise) affect muscle balance and hence our energylevels, posture and the way we function and feel. When all aspects of our livesare balanced, the best results follow and we function at our vital best.Health Benefits of Kinesiology- Kinesiology has a significant impact on awide range of health and well-being issues. Kinesiology can:• Enhance learning• Boost sports performance• Eliminate emotional, physical and mental stress• Help with finances and decision making• Pin-point and eliminate allergic reactions (IMRs)• Help overcome past trauma• Identify nutritional deficiency or excess• Help overcome fears and phobias• Aid the healing of muscle injuriesConclusion- From the evidence of sports science and reviews of doctors ofsports field it is necessary to understand the basic principles and benefits ofkinesiology to enhance sports performance as well as to achieve individualgoal of high level of performance in games and sports. Physical educationalistand coaches could be able to make implementation of applied kinesiology.======================References-1. American Kinesiology Association". Americankinesiology.org. 2001-01-06.
Retrieved 2009-07-25.2. Dr. Michael Yessis (2006). Build A Better Athlete. Ultimate Athlete Concepts.3. Haas M, Cooperstein R, Peterson D. Disentangling manual muscle testing and
Applied Kinesiology2007.4. Hoffman, S. J. Shirl J. Hoffman, ed. Introduction to Kinesiology (in English) (3
ed.). Human Kinetics2008.5. www.appliedkinesiology.com6. Tributes to Dr George Goodheart Jr.,(2008). International College of Applied
Kinesiology7. www.teachpe.com

Research Journal of Social and Life SciencesISSN 0973-3914, Vol.-XIV- II, Year-07, June-2013
Effect of Temperature on Mycelial Growth ofKeratinophil ic Fungi
* Mamta Gupta==========================================================Abstract- Effect of temperature on the growth of Four Keratinophilicfungi. i.e. , Arthroderma benhaniae, Chrysosporium indicum,Malbranchea aurantiaca and Microsporum gypseum. Maximum 80 mmvegetative growth was recorded in M. gypseum at 30 0C after 12 days ofincubation. Growth rate decreases by the gradual increase in temperatureup to 40 0C. Little growth was noted at 40 0CKey words- Keratinophilic, Sabouraud’s dextrose agar.==========================================================
===========================* Department of Botany, M.J.S. Govt.P.G.College, Bhind (M.P.)
Introduction- Environmental factors effective for the growth of an organismdepends upon the sensitivity of an organism and its resistance to a particularfactor. Temperature effects the rate of all the process occuring during thegrowth of the micro-organisms and this may determine the type of reproduction,the morphology of the organism and also their nutritional requirements. Forany particular organism, four important temperatures, may be defined. Thermaldeath point, the minimum (10o - 15 oc), optimum (24o - 40 oc) and maximum(35o - 45 oc) f temperature. The minimum and maximum are the lowest andhighest temperatures, respectively, at which growth occurs and the growthrate is the lower. The minimum, optimum and maximum temperature areknown as the cardinal temperature or points of a particular organism.Materials and Methods- In the present investigation effect of temperatureon the mycelial growth of four fungi i,.e., A. benhamiae, C. Indicum, M.aurantiaca and M. gypseum was evaluated and discussed. Sabouraud’s dextroseagar medium was sterlized at 15 Ibs pressure for 15 minutes. Twenty five mlof medium was poured in petridishes. The dishes were inoculated with aloopful sporse suspension having 2x10⁶ spore ml-1 in 0.1% Tween 80 of thetest fungi. Inoculated dishes were kept for incubation at 30 oC, 35 oC and 40oC temperature. The radial mycelial growth was recorded after 3, 6, 9 and 12days of incubation.Results and Discussion- A perusal of the data showed that a maximum 66,70, 72 and 80 mm vegetative growth was recorded in M. aurantaca, A.

Research Journal of Social and Li fe Sciences, ISSN 0973-3914, Vol .-XIV- II, Year-07, June-2013216
benhamiae, C. indicum and M. gypseum, respectively at 30 oC after 12 days ofincubation. A gradual growth reteradation occured at higher temperature i.e.,above 30 oC. M. aurantiaca and M. gypseum showed 6 mm and 8 mm growthat 40 oC after 12 days of incubation. A benhaniae and C. indicum showedsimilar pattern of growth recorded was some what more in C. indicum (46mm) than in A. benhamiae (15 mm) at 20 oC after 12 days of incubation.Maximum growth in both the above, fungi was noted at 30 oC . A benhamiaeand C. Indicum showed 70 mm and 72 mm grwoth, respectively. Poor growthwas noted at 40 oC. M. gypseum also grew fast at 30 oC. These findingsclosely reesemble to the radial extension of some other Keratinophilic fungi asobserved by pugh et al. (1970). Grwoth rate decrease by the gradual increasein temperature up to 40 oC. Little growth was noted at 40 oC. Temperaturehas a marked effect on the rate of any chemical reaction involved in the cellmetabolism and hence on the growth rate. In most of the mesophilic fungi thegrowth retard with the increase in temperature above the optimum, resultsfrom enzyme inactivation due to the heat denaturation of protein.
Table:1Effect of temperature on the growth of different incubation periods (Colony
diameter in mm)Temperature
A. benhamiae C. indicum M. aurantiaca M. gypseum DAYS OF INCUBATION
3 6 9 12 3 6 9 12 3 6 9 12 3 6 9 12 20 oC 10 18 34 15 08 16 26 46 12 15 20 40 10 18 28 36 25 oC 10 18 36 40 10 16 40 46 12 24 36 48 10 28 50 60 30 oC 10 30 36 70 14 26 48 72 14 24 50 66 12 30 60 80 35 oC 08 12 16 18 06 12 14 16 06 12 14 16 08 12 14 16 40 oC 0 0 0 0 0 0 0 0 0 05 05 06 0 0 04 08
Each datum given in the table is an average of two replicates.
It is a well known fact that temperature plays an important role in mostof the fungal activities. Therefore, temperature could be expected to influencegreatly, the rate of growth. Since an important part of the growth process liesin the enzymatic activities generally there enzymatic reactions behave in relationto the temperature in a similar manner just like ordinary chemical reactions.Probably higher temperature causes the inactivation of enzymatic reaction inmicro-organism and hence a decrease in mycelial growth occur. Luxuriantgrowth in most of the test organisms was noted in between 25oC and 30 oCtemperature. Hazen (1957) found the maximum growth of Microsporumaudovini in the medium containing glucose, asparagine and yeast extract at 27oC. Nieder pruem (1963) have also reported that carbon i.e., glucose andnitrogen source (asparagine) and temperature at 27 oC are quite favourablefor the sprophore formation in most of fungi. According to Lewis and Hopper(1941) the presence of dextrose in the sabourauds dextrose agar favors theproduction of diffusible pigment in most of the keratinophilic fungi includingMicrosporum Canis and Trichophyton rubrum. Pugh and Evans (1970) in their

Research Journal of Social and Li fe Sciences, ISSN 0973-3914, Vol .-XIV- II, Year-07, June-2013 217
study also recorded the maximum vegetative growth in several keratinophilicfungi at 27 oC. Fungi causing systemic mycoses generally grew well at 37 oCbut optimum have not been recorded (Cochrane, 1958)======================References-1. Cochrane, V.M. (1958). Physiology of fungi. John Wiley New York, 1-524 PP.2. Hzen, E.L. (1957). Effect of temperature and nutritional upon macroconidial
formation of Microsporum audovine Mycologia, 49: 11-19.3. Lewis, G.M. and Hopper, M.E. (1941). Pigment production of Fungi. Nutritive
rqeuirements. Arch. Dermatol, Syphilol, 44: 453-460.4. Niederpruem, D.J. (1963). J. Bact, 88: 1300-1308.5. Pugh, G.J.F. and Evans, M.D. (1970a). Keratinophilic fungi associated with
birds. I. Fungi isolated from feathers, nests and soils. TRans. Br. Mycol. Soc.,54: 233-240.
6. Pugh, G.J.F. and Evans, M.D. (1970b). Keratinophilic fungi associated withbirds. II. Physiology studies. Trans. Br. Mycol. Soc., 54 (2): 241-250.
izks- cztxksiky 'kqDy41@42] j?kqoa'k lnu] fcfN;k] jhok (e-iz-)& 486001
Phone - (07662) 255177, 9425186437 E-mail - [email protected] [email protected]
lsUVj QkWj fjlpZ LVMht] jhok }kjk fjlpZ tjuy vkWQ vkV~Zl eSustesUV ,.M lks'ky lkbalsl
ds fo'ks"kkad ds :i esa fuEufyf[kr nks lanHkZ iqLrdksa dk izdk'ku uoEcj] 2013 esa fd;k tk jgk gSA
mDr lanHkZ iqLrdksa esa izdk'ku gsrq vki viuk rF; ijd ,oa rdZ ;qDr 'kks/k i= Hkstdj bl vdknfed dk;Z esa lg;ksx dj ldrs gSaA fgUnh Hkk"kk esa 'kks/k i= ,e-,l- oMZ esa QkUV df̀rnso 010] djsDVj lkbt 14] Mcy Lis'k_
vaxzsth Hkk"kk esa VkbEl U;w jkseu QkUV lkbt 14] Mcy Lis'k esa HkstsaA
(vkbZ-,l-ch-,u- 978&81&87364&59&7)
(ISBN 978-81-87364-60-3)Contemporary Indian Society and Culture
ISSN 0975-4083

Research Journal of Social and Life SciencesISSN 0973-3914, Vol.-XIV- II, Year-07, June-2013
Studies on Spotted wil t Virus Disease of Tomato(Lycopersicon Esculentum Mi l l)
* Shyam Govind Singh==========================================================Abstract- Tomato spotted wilt virus was studies during the presentinvestigation with respect to its symptomatology, transmission, host-rangeand physical properties. The virus causing thickening of the veins ofyoung leaves. The lamina is usually curled down ward or upward .In thelater stages yellowish mottling may develop. The older spot turn brownuntil the entire leaf is killed or droped. Similar brown spot or streakoccur on stem and petioles. The entire plant is dwarf and with its leavesdropped. Thus, the tomato plants resemble a plant affected by wilt. Yellowspots or cencentic rings develop on the fruits. Severly infected plants arekilled causing heavy damage to the crop.Keywords- Disease, Spotted wilt virus Tomato.==========================================================
===========================* Department of Botany, Agra College Agra (U.P.)
Introduction- Tomato (Lycopersicone sculentum Mill.) is an important annualfruit vegitable belongs to family Solanaceae .Tomatoes are cultivated throughoutthe world for its edible fruits .The tomato crop is subjected in nature toseveral biotic agent s like fungi, viruses ,bacteria , mycoplasma and nematodes.Which inhibit its growth ,reduce yield and thus degrade its potential to menkind.Out of all the diseases, viral melodies cause maximum damage to the crop.There are about 36 viruses and their strains, 4mycoplasma (Martyn1968 )and one viroid (potato spindle tuber) which affect tomato and induce one orthe other disease alone and in combination. Spotted wilt virus is the importantvirus that causes the wilt disease in tomato resulting the crop loss. The tomatofields were visited during 2000-2002 in Agra and its adjoining areas .the diseasecharacterised by the thickening of the vein with few chloritic spot. Downwardcurling of leaves was observed as .The disease advanced the leaves developbronzing symptoms with brown necrotic spots. Due to severe necrosis, sometime young growing buds are killed. The symptoms resembled those reportedfor tomato spotted wilt virus (Best 1968), which is widespread on groundnut inAndra Pradesh (Ghanekar et al; 1979). The sporadic occurrence of this diseasewas first reported from Nilgirs (Todd et al;). Many of the earlier workers

Research Journal of Social and Li fe Sciences, ISSN 0973-3914, Vol .-XIV- II, Year-07, June-2013 219
reported spotted wilt disease on tomato (Rao et al; 1982, Sastry 1982,).Singhand Gupta (1994) have observed tomato spotted wilt virus on pea in UttarPrades. Therefore, in the Present study were conducted on the, symptomatlogy,transmission, Host-rang, and physical-properties in vitro.Material & Method- The culture of the virus was obtained from naturallyinfected plant of tomato and was maintained in an insect proof polythene caseby mechanical inoculation on tomato. The standard virus inoculum wasprepared by crushing the young leaves(5.0gms.) in 1ml of phosphate buffer(Ph-7.0) in ordinary mortar with the help of pastel for about 10-15 minutesand then further diluted 5ml .The suspention obtained was filtered throughcheese cloth and then used for inoculation purpose. Carborundom power(600 mesh ) was uniformly dusted on the upper surface of the leaves andthen inoculums was applied on the surface with the help of fore finger. Theexcess of inoculums on the leaf surface was wiped off by a moist sterilizedcotton pad. For the transmission of the virus by grafting, the cleft graft andleaf graft method, as develop by Bos (1967) were followed. 30 days old healthyseedling of tomato were taken as stock. There top were cut just above therequired node and a vertical incision ( 2.0-2.5 cm in length ) was made.Apical shoot of the disease plants of tomato were used as scion .Test plants,inoculated mechanically were observed 9 days after inoculation and thoseshowing symptoms on inoculated plants.Result-Symptoms- Under polythene cage conditions, the tomato spotted wilt virusproduced first symptom within 9 days after inoculations. The first sign ofsymptom appeared young leaves as thickening of veins with few chloroticspots. Downward curling of leaves was also observed. As the disease advancedthe leaves developed characteristic bronzing symptoms with brown necroticspots. Due to severe necrosis, sometimes the young growing buds are killed.This leads to die back the branch. Infected Plants remain dwarf, flowering isalso inhibited. However, plants infected at later on stage produce few flowersand few fruits. Fruits such plants were small, distorted with pale red, yellow orbleached area and sometimes showed distinct concentric ring on them.Host-Rang- Mechanical sap inoculation method was used in these studies.Vinca rosea L., Stellaria media L., Chenopodium album L., C.Amaranticolor Coste & Reyn., Spinacea oleracea L., Pisum sativum L.,Vicia faba L., Datura stramonium L., Nicotiana tobacum.Physical-Properties- The virus was infective upto 1:10000. The thermalinactivation point of the virus was 45-50oC. The longvity of the virus wasfound to be 1-2 hrs at room temperature (10-28oC).Thrips Transmission- Nymph of scirtothrips dorsalis exposed to infectedtomato plants, transmitted the disease 4 out 20 plants tested.Seed Transmission- The seeds were collected from disease tomato plants

Research Journal of Social and Li fe Sciences, ISSN 0973-3914, Vol .-XIV- II, Year-07, June-2013220
.The plants raised from disease seeds, and observed regularly from date ofgermination till the maturity. The virus was not transmitted through seedscollected from the spotted wilt virus infected tomato plants.Discussion- Symptoms observed on tomato such as severe necrosis andbronzing were very similar to those of TSWV (Best 1968; Todd at al; 1975;Das and Ray chaudhaury 1953; Rao et al; 1980). The virus produced necrosison many host plants tested. The result of host rang were similar to thosereported for TSWV, causing bud necrosis disease of groundnut (Ghanerkar etal; 1979). The TSWV on Tomato was reported to be transmitted by thripstabaci (Todd et al., 1975) and bud necrosis disease of ground nut byFrankliniella schultzeri and Scirothrips dorsalis (Chaneker et al., 1979).The virus in the Present study is transmitted by Scirothrips dorsalis collectedfrom Tomato fields.======================References-1. Best, R.J. (1968) Tomato spotted wilt virus Adv.Vir.Res. 13 :66-148.2. Bos L., (1967). Some problems in the identification of a necrosis virus of pea
(Pisum sativum L.,) Plant Virol. Proc. 6th Confr. czech. Plant virol. pp. 253-262.3. Ganekar, A. M; D. V. R. Reddy, et al; (1979). Bud necrosis of groundnut in India
cause by tomato spotted wilt virus. Ann. Appl. Biol. 93: 173-179.4. Martyn, E.V. (1968). Plant virus names. Phytopath., 9: 1-4.5. Todd, J.M; S. Ponniah and C.P. Subramanyam (1975). First record of TSWV
from the Nilgiris in India. Madras Agric. J.62: 162-163.6. R.V. J. Prasad Rao (1980) Occurrence of Tomato spotted wilt virus on tomato in
Andhra Pradesh India. Indian Phytopath. 33 (3 ):436-439.7. Singh B. R. and S . P. Gupta (1994 ). Tomato spotted wilt virus on Pea in Uttar
Pradesh India .Indian J. Virology; Vol. 10 ,NO.1 PP 53-54.8. Sastry, K.S. (1982). Occurance of tomato spotted wilt virus on tomato in
Karnataka. Current Research 11 (9/10): 94.

Research Journal of Social and Life SciencesISSN 0973-3914, Vol.-XIV- II, Year-07, June-2013
Evaluation of Morpho- Physiological Parameters ofPotato to (Solanum Tuberosum L.) Cultivars in
Tarai Region Uttrakhand
* L.P. Yadav**V.K. Bhatnagar, ***N.P. Singh
==========================================================Abstract- The study was conducted at Horticulture centre, Patharchattaof GB Pant University of Agriculture & Technology, Pant Nagar (U.K.)India from 2007-08 to 2008-09 to assess the growth yield and otherparameters of potato ten cultivars were tested in completely randomizeddesign with three replications in the experimental area. Significantlyhigher survival percentage was recorded in CV Kufri. Badshah whichwas recorded in Kufri Lalima and Kufri Sindhuri, where as significantlylowest survival percentage was recorded in Kufri Navtal. Growthparameters viz. Plant height, number of leaves, number of tubers, specificgravity, TSS, ascorbic acid, nitrogen content, crude protein, cooking,chips quality and good keeping quality can be cultivated there forchipping.==========================================================
===========================* Department of Botany, Devta P.G. College Morna Bijnor 246761 U.P., India.** Head, Department of Botany, Devta P.G. College Morna Bijnor 246761 U.P.*** Head, Department of Vegetable Science G.B. Pant Agriculture University &
Technology Pant Nagar UK, India
Introduction- Among the various factors responsible for higher yield selectionof regional cultivars are of great significant large number of improve varietiesand cultivars are available in our country . However these cultivars/ varietiesdiffer from one to another with respect to their morpho-physiological charactersidentification and utilization of these characters help in selection of suitablevarieties/ cultivars for yield processing, quality as well as their suitability forstorage and under room temperature decided to evaluation of potato cultures/varieties for processing and cooking and as well as storage quality under Taraicondition in Western UP or Uttrakhand.Material and Methods- Potato is an important cash crop in Western UP.Replicated field trials were conducted at Horticulture, Research Center,Pattherchatta of GB Pant University of Agriculture & Technology, Pant Nagar

Research Journal of Social and Li fe Sciences, ISSN 0973-3914, Vol .-XIV- II, Year-07, June-2013222
(U.K.) India, during 2007-08 to 2008-09, using randomized complete blockdesign by planting in the last week of October. Each block consisted of threerows 30 tubers having, plant to plant distance of 20 cm and row to row distance60 cm recommended cultural practices were followed. The crops weredehaulmed at 90 days to allow time for tuber skin curing. The storageexperiments with the autumn crop harvest was conducted from March andwith the spring crop harvested from second week of April in both the years.Ten kilogram cleaned and uniform size tubers of each of the ten cultivars werepacked individually in cloth bags. Three such replications were kept at roomtemperature. The number of tubers in each bag was recorded at the beginningof the experiment. Besides, four randomly selected tubers in each bag wereindividually marked and numbered. The initial weight of each marked tuberwas recoded. These marked tubers were again weight at the end of experimentof determine physiological weight loss. The bags containing tuber materialwere stored for 90 days in ordinary room in dark allowing sufficient space forour movement between bags. The maximum and minimum temperature andrelatively were recorded every day.Result and Discussion- Total percent nitrogen in tuber was determined atharvest Table-1 reveal significant differences with respect of total nitrogencontent of potato cultures / varieties.A perusal of data indicates that in themean of two years (2007-08 to 2008-09), percent nitrogen content in tuberwas significantly the highest in V10 , V9 and V1 while poorer nitrogenpercentage were V8 and V3 . Where as crude protein content in tubers wasfound maximum in V10 followed by V9 while lowest values were recorded inV2 and V6. The data regarding the specific gravity of tubers in differentcultures are presented in Table-1. The perusal of data reveals that there weresignificant differences in specific gravity of tubers in different cultures/ varieties.The significant higher specific gravity was recorded in V8 followed by V1, V8, V9 and V10 while it was poorest in V7 . The data on total soluble solids wererecorded at 75 days from planting Table- 1, significant differences among thecultures were observed in both the years at both stages. Total soluble solidpercentage reached maximum in all cultures at 75 days, while at later stagethere was reduction in the characters in all cultures. The cultures which hadgreater percentage of total soluble solid at 75 days (Table-1) were V3, V4,and V7, while V10, were poorest in this respect. The maximum tuber yieldwas recorded with culture V2 which was statistically higher than all othervarieties/ cultures (Table-1) followed by V7 and V9 while V5 producedsignificantly lowest tuber yield.

Research Journal of Social and Li fe Sciences, ISSN 0973-3914, Vol .-XIV- II, Year-07, June-2013 223
Observation on percent tuber dry matter accumulation were recorded ( Table-2) during both the years, percent dry matter accumulation by several potatocultures were significantly higher both the years. It reached maximum in V2followed by V3. Cooking quality of boiled potatoes was tested and marksawarded by a group of persons who evaluated them in terms of grade (Table-2). V3 was found best in cooking quality followed by V10, V9, V2 and V1,while V6 and V10 were poorest in this respect . The probable reason forcooking quality in V2 might be due to high dry matter content. Chips werefried in refined oil at specific temperature then they were tested by a group ofpersons and evaluation was made in terms of grade (Table-2). The Chipsquality was found best in V3 followed by V1, V5, V7 and V10 while browningand poorest quality was recorded in V6 and V10.These findings are inaccordance of potato cultures and reported that best quality of chips obtaineddue to high dry matter and starch contents in tubers. Keeping quality wasstudied in term of percent number of tubers rotted at two stage during storageperiod. It is evident from the data shown in table-2 that the statistically non-significant difference were found after 8 the week of storage whereassignificant difference among the cultures was recorded at/ after 10th week ofstorage. The minimum rottage was observed in V9, V10, V3 and V4 andmaximum was recorded in V5 after 8th week of storage. However, theminimum rottage after 10th weak of storage was observed in V3 which at parwith V10, V3 and V9 but significantly lower than the remaining culture. Themaximum rottage was recorded in V5 followed by V6.This higher rottage
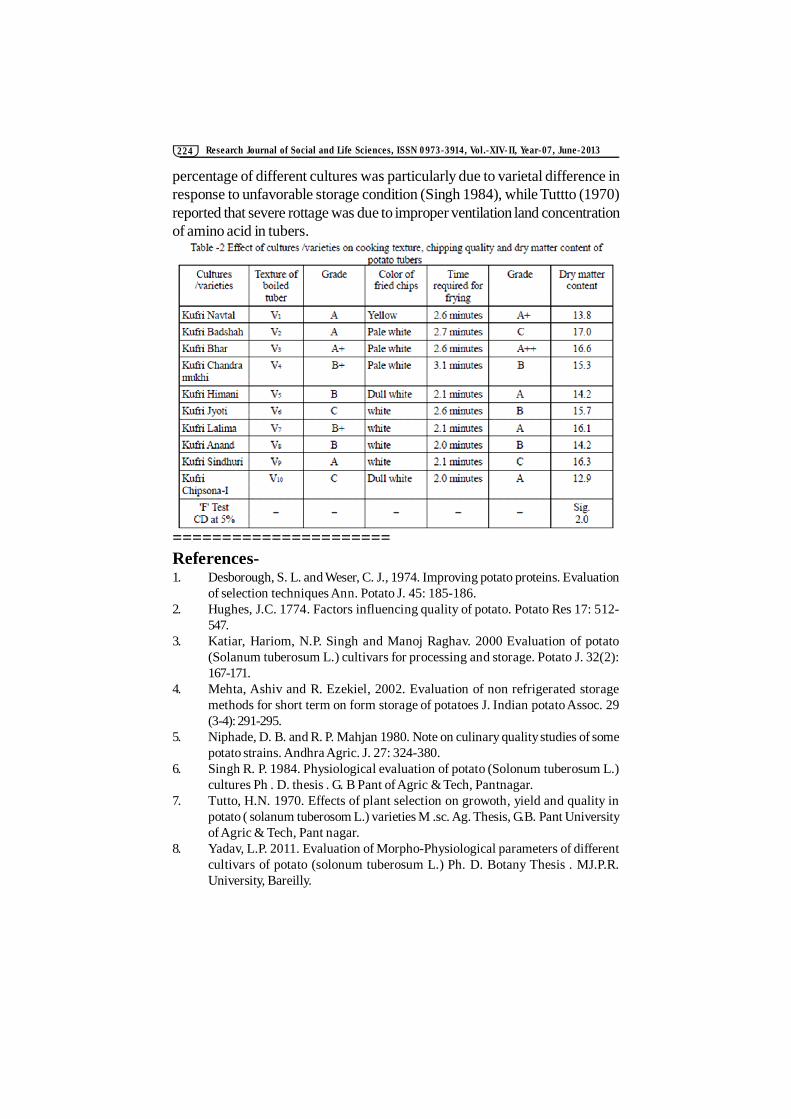
Research Journal of Social and Li fe Sciences, ISSN 0973-3914, Vol .-XIV- II, Year-07, June-2013224
percentage of different cultures was particularly due to varietal difference inresponse to unfavorable storage condition (Singh 1984), while Tuttto (1970)reported that severe rottage was due to improper ventilation land concentrationof amino acid in tubers.
======================References-1. Desborough, S. L. and Weser, C. J., 1974. Improving potato proteins. Evaluation
of selection techniques Ann. Potato J. 45: 185-186.2. Hughes, J.C. 1774. Factors influencing quality of potato. Potato Res 17: 512-
547.3. Katiar, Hariom, N.P. Singh and Manoj Raghav. 2000 Evaluation of potato
(Solanum tuberosum L.) cultivars for processing and storage. Potato J. 32(2):167-171.
4. Mehta, Ashiv and R. Ezekiel, 2002. Evaluation of non refrigerated storagemethods for short term on form storage of potatoes J. Indian potato Assoc. 29(3-4): 291-295.
5. Niphade, D. B. and R. P. Mahjan 1980. Note on culinary quality studies of somepotato strains. Andhra Agric. J. 27: 324-380.
6. Singh R. P. 1984. Physiological evaluation of potato (Solonum tuberosum L.)cultures Ph . D. thesis . G. B Pant of Agric & Tech, Pantnagar.
7. Tutto, H.N. 1970. Effects of plant selection on growoth, yield and quality inpotato ( solanum tuberosom L.) varieties M .sc. Ag. Thesis, G.B. Pant Universityof Agric & Tech, Pant nagar.
8. Yadav, L.P. 2011. Evaluation of Morpho-Physiological parameters of differentcultivars of potato (solonum tuberosum L.) Ph. D. Botany Thesis . MJ.P.R.University, Bareilly.

Research Journal of Social and Life SciencesISSN 0973-3914, Vol.-XIV- II, Year-07, June-2013
Study on Ganado-Somatic and FecundityRelationship of Channa Punctatus from Son River
Shahdol, District (M.P.)
* Kirti Tiwari==========================================================Abstract- Studies have been carried out on maturity of oocyte (egg) inChanna panctatus. Development of oocytes was measured with the helpof Oculometer and maturity stage of gonad found varies according todifferent breeding phases. More number (30.7% ) of oocytes (eggs),observed in pre-spawning and spawning period, where as less number(0.99% ) oocytes (eggs), observed post-spawning period. Gono-SomaticIndex.GSI- (18.40%) and Fecundity noticed (30.6 %) as maximum to therespective weight.Key word- Oocyte, Channa Punctatus, Spawning==========================================================
===========================* Department of Zoology, Government T.R.S. College, Rewa (M.P.)
Introduction- Channa Punctatus is common fresh water minor crop whichbeing a good table fish has economic value too. Fish body weight and weightof gonad gives the Ganado-Somatic Index (GSI).The term “fecundity” can beexpressed as the number of eggs laid in a single in one season by the species.In order to assess the population stock of any species the accurate estimationof the fecundity is essential. This will to understand that whether fish hasattain the maturity and able to produce number of eggs in the spawning period.The relation between G.S.I and fecundity also studied by [1,2]. Present studyinsured that the growth of fish body weight and gonadal development alongwith egg laying capacity (fecundity) and when the fish attains its firstmaturity.Very limited work has been done on the spawning season and fecundityof this species (Delhidrai 1976 and Rao 1980) in this study observation madeon fecundity and GSI of this species from Son river, Shahdol district (M.P.)Material and Method- Mature female (10) 17.0 cm. long were collectedfrom April 2011 to April 2012 from Son river, Shahdol.Collection of Samples: For the estimation fecundity gravimetric method wasapplied. Fresh gonads were removed from the fish within a few hours ofcapture and their sex and stage of reproductive maturity determined using amacroscopic staging system. Gonads obtained from recreational fishers couldusually be weighed in fish (gm). Two or three transverse cuts were then made

Research Journal of Social and Li fe Sciences, ISSN 0973-3914, Vol .-XIV- II, Year-07, June-2013226
through each gonad to ensure proper fixation.Fresh Samples- Length (cm) and weight (gm) are measured in each fish.Total length (TL) is measured to the tip of mouth to the end of tail.
Development of matured oocytes were measured with the help ofOculometer and found vary according to breeding phase. Ganado-SomaticIndex and fecundity have been calculated during the study -
Fecundity (F) = eofsubsamplWtytofoTotalWeigh
.var
× No. of mature eggs (ova) in sub
sampleGanado-Somatic Index (GSI) is measured by using following formula :
GSI(%)= shWeightoffinadWeightofgo
×100
Result and Discussion-Seasonal fluctuation in gonado somatic index from April 2011 to April
2012 are pre sented in figure 1 in 2011 the gonado somatic index was noticedfrom January to May while in 2012 from June to September with highestduring October - November and in 2012 from June onwards.
The specimen (total length 17 cm and body weight 51 gm) found caring420,000 eggs and the smallest sized fish (total length - 12.5 cm and bodyweight 23.0 gm) caring eggs199, 980. But variation was found in the fecundityin fish of equal length of fish group. Increased diameter of oocyte (ovum)tends to the maturity of ovary.
C .Punctatus follows the normal gonad development and possessesnormal reproductive behavior even in adverse water medium. Gonado - SomaticIndex was observed high in the same month July (18.40) (Table 1) and low inDecember.

Research Journal of Social and Li fe Sciences, ISSN 0973-3914, Vol .-XIV- II, Year-07, June-2013 227
Table No.1Showing Gonado Somatic Index in Channa Punctatus
S.N. Month Water Temperature (0C) during
months
Average Weight of Fish (gms)
Average Weight of Ovaries (gms)
Gono - Sonatic Index (GSI)
% 1 January 17.5 22.89 2.65 11.57 2 February 18.0 22.91 2.79 12.17 3 March 19.0 23.00 2.99 13.00 4 April 21.7 23.88 3.98 16.66 5 May 24.2 24.01 4.11 17.11 6 June 25.4 24.03 4.12 17.14 7 July 23.2 24.13 4.44 18.40 8 August 22.6 24.15 4.62 19.13 9 September 21.8 23.23 2.10 9.04
10 October 23.5 22.63 2.02 8.92 11 November 18.5 22.62 2.01 8.88 12 December 18.3 22.60 2.00 8.84
Table No. 2- Regression Coefficient (b-slope) intercepts (a) and
correlation coefficient (r) in the F/TL, F/TW, F/GL and F/GWrelationships in Channa Panctatus
Fecundity (X)
Total Length (Y)
Value of SD
of X
Value of SD
of Y
Values of
Regression
Coefficient (b)
Value of
Intercept (a)
Values of
correlation
coefficient (r)
Significant at 5%
F TL 30.7 15.0 2.9 9.2 0.8 ** F TW 30.0
6 33.7 3.64 26.42 0.7 **
F GL 3.0 6.1 3.1 0.1 0.87 ** F GW 11.3
8 14.9 3.1 8.7 0.8 **
** ModerateTable No.3
Showing Fecundity in Channa Punctatus during spawningMonth Average
Length of Fish (Cm)
Average Weight of Fish (gm)
Average Weight of ovary (gm)
Average Length of Ovary (Cm)
Fecundity (%)
January 17.0 40.1 2.0 3.9 0.99

Research Journal of Social and Li fe Sciences, ISSN 0973-3914, Vol .-XIV- II, Year-07, June-2013228
February 14.5 33.2 3.8 4.1 4.96 March 14.2 32.2 4.0 1.9 3.46 April 13.0 26.3 5.8 3.0 4.05 May 12.5 23.4 7.9 2.0 30.7 June 14.0 24.0 8.8 1.9 30.06 July 14.9 30.0 8.18 0.07 25.8 August 12.0 31.0 3.2 2.0 3.7 September 13.0 33.0 3.42 3.4 3.71 October 14.7 33.7 3.35 1.9 12.96 November 15.0 45.0 3.3 2.8 3.6 December 17.0 50.1 4.0 3.9 3.2
22.89
2.65
22.91
2.79
23
2.99
23.88
3.98
24.01
4.11
24.03
4.12
24.13
4.44
24.15
4.62
23.23
2.1
22.63
2.02
22.62
2.01
22.62
0
10
20
30
40
50
60
GSI (%)
January February March April May June July August September October November December
GSI in Channa Punctatus Average Fish Weight(gm)
Average OvaryWeight (gm)
Figure 1. : Showing GSI % in Channa Panctatus
Fecunduty in (%) Channa Punctatus
0
2040
60
80
100
Janu
ary
Febr
uary
March Ap
ril
May
June July
Augu
st
Sept
embe
r
Octob
er
Nove
mber
Dece
mber
Fecundity (%)
Average Weightof Fish (gm)
Figure 2. : Showing Fecundity % in Channa Panctatus
Conclusion- The ratio between the body weight and the weight of the gonadshowing the status of the ovary in terms of maturity and denotes the phase ofreproductive cycle. GSI of fish found increased (18.40) with the maturation ofthe fish and gonad. Where the GSI was found lowest (6.0) during post spawning

Research Journal of Social and Li fe Sciences, ISSN 0973-3914, Vol .-XIV- II, Year-07, June-2013 229
phase and was highest at the peak of maturity during spawning phase. In thepresent investigation and the graphical representation shows there is the intimaterelationship between the length of ovary and its relative weight. On the graphicalrepresentation, in the month of August and the high values of gonad weightand fecundity were concluded.
Fecundity was studied for capture management and potential of stockregarding the number of eggs laid by the female during spawning season.Studies were carried on the development of oocyte (eggs) in C. Panctatus.More number of oocytes observed in pre-spawning and spawning periodwhereas less number were observed in post spawning period shown in theform of fecundity. Gonado Somatic Index signifies the varied number of oocytesobserved during study. The peak of breeding phase was observed during June- July whereas the rest of months deserved for low egg production.======================References-1. Dehadrai P. V. 1976 , Culture of air breathing fishes in derelict waters. All India
Co-ordinated Research Project on Air-Breathing fish culture (CIFRI),Barrackpore, pp. 1-8
2. Rao 1.11 1980, “Studies on the taxonomy of the fishes and on the biology ofHeteropneuates/ar, rt 7U (Bloch 1794) of lake Kolleru in Andhra Pradesh”, Ph.D. Thesis, Andhra University Wallair.
3. Arifa A., M.D. Hossain, M. Kobil Hossain, R. Afza and A.S. Bhuyian, 2007. Thefecundity of Hilsa ilisha from the river Padma near Godagari of Rajshai district;Uni. J. Zool. Rajshahi Uni., 26:41-44
4. Arifa A., M.D. Hossain, M. Kobil Hossain, R. Afza and A.S. Bhuyian, 2007. Thefecundity of Hilsa ilisha from the river Padma near Godagari of Rajshai district;Uni. J. Zool. Rajshahi Uni., 26:41-44
5. Doha, S. and M.A. Hye, 1970. Fecundity of Padma river hilsa (H. ilisha). Pak. J.Sci., 22:176-184
6. Lagler, K.F., J.F.Z. Bardach and R.R. Miller, 1967. Ichthyology: John Wiley andSons. Inc, New York, London, Sydney, pp: 59-301
7. Mookerjee, H.K. and S.R. Majumder, 1946. On the life history, breeding andrearing of Anabas testudineus (Bloch): Dept. of Sci., Calcata Uni., 2: 180-230
Research Journal of Social and Life SciencesISSN 0973-3914, Vol.-XIV- II, Year-07, June-2013
Hydroxysteroid Dehydrogenase Activityin the Caput, Corpus and Cauda Epididymis of
Taphozous Melanopogon Melanopogon Temmnick(Microchiroptera : Mammalla)
* Umesh Shukla==========================================================Abstract- Histochemical studies on the distribution of -hydroxysteroiddehydrogenase (-HSDH) activity in the caput, corpus and caudaepididymis of sexually mature Taphozous melanopogon melanopogonTemmnick revealed the presence of cellular sites in the epididymal segmentsthat have the ability of utilizing dehydroepiandrosterone. Spermatozoashowed an increasing order of enzyme activity from caput via corpus tocauda.==========================================================
===========================* Assistant Professor, Department of Zoology, Agra College, Agra (U.P.)
Introduction : - Mammalian epididymis forms the longest excurrent ductsystem of the male genitalia, where intricate morphological, biochemical, andphysiological changes take place in the spermatozoa during their transit,endowing them with fertilizing abilities. The physiological integrity of theepididymal segments is dependent on circulating titres of androgen and on thepopulation of spermatozoa contained in the tubules1-2. Although there isconsiderable ifnormation on the occurrence of various classes cf phosphatases,dehydregenases and oxidases in the epididymis of rodents, primates, lagomorphaand ungulates, there is little tangible ifnormation of Chiroptera3-9. The presentreport concerns the histochemical site and pattern of distribution of -hydroxysteroid dehydrogeanse (-HSDH) in the caput, corpus and caudaepididymis of sexually mature Taphozous melanopogon melanopogonTemmnick.Materials and Methods :- Males of T.m.melanopgon were netted locallyat dusk during October-December. Animals weighing ca. 25.0 g were used.Surgical procedures for recovering epididymis were as described earlier.6Fresh forzen sections of caput, corpus and cauda epididymis were cut at 10M.-HSDH activity was histochemically localised according to the techniqueof Wattenbeg10 by incubating sections in a medium containing NAD, tetrazoliumsalt and dehydroepiandrosterone (3-hydroxy-5androstan-17 one, Sigma

Research Journal of Social and Li fe Sciences, ISSN 0973-3914, Vol .-XIV- II, Year-07, June-2013 231
sample). The period of incubation was 30 min at 37ºC. Blue formazon depositsindicated the site of enzyme activity. Controls were incubated in substratedeficient medium. Enzyme activity in the various histological constituents ofthe epididymal segments was visually appraised and graded as describedearlier6.Observations and Discussion :- The paired epididymis of T. m.melanopogon are distinctly divisible into three well defined regions of caput,corpus and cauda epidiymis. Several histological variations were noticed in theepididymal segments pertainign to shape, size of the tubules and the populationof spermatozoa oriented in a characteristic manner.
-HSDH activity was uniformly present in the caput and corpusepididymis, while the cauda displayed a relatively intense enzyme reaction.Some lack of uniformity was also discerned in the enzyme profile of tubulesconstituting the epididymal regions. The tubules were engorged with varyingpopulations of spermatozoa. Spermatozoa exhibited gradually stronger enzymeactivity as the pass down the epididymal duct and reach the cauda. Luminalfluid manifested negative enzyme reaction.
The results clearly show the varying abilities of the epidiymal epitheliumto serve as the cellular sites for steroid biosynthesis and conversion, thusgenerating a characteristic hormonal milieu promoting maturational changesto occur in the male gamete. Further, the positive enzyme reaction also distinctlyestablishes the capacity of spermatozoa to utilize dihydroepiandro-sterone. Thisobservation is also in consonance with the suggestion that androgens presentwithin the epididymis are apparently essential for the acquisition of fertility byspermatozoa, and also that spermatozoa have the capacity to synthesize andconvert steriod hormones11-13. Thus, it seems that the activity of tubuleepithemlum and the population of spermatozoa may be one of the key factorsdetermining the androgen environment within the epididymis. Our studies areat variance with the epdidymal -HSDH of monkey5, rabbit, ram, rat,bull, and mouse 4,14,16. These findings reinforce the concept of species-specificcharacteristic of epidiymal steroid dehydrogenases in mammals.======================References-1. Hamilton, D.W. (1972), “Mammalian epididymis,” In Reproductive Biology,
eds. H. Balin and S. Glaser, Excerpta Medica, Amsterdan, p. 268.2. Moniem, K.A. (1972), J. Reprod. Fert., 28, 461.3. McGadey, J., Baillie, A.H. and Ferguson, M.M. (1966), Histochemie, 7, 2011.4. Inano, H., Machino, A. and Tamocki, B.J. (1969), Endorinology, 84, 997.5. Dinakar, N., A., Dinakar, R., Kumar, P. Talesra, C.L. and Prasad, M.R.N. (1977),
Indian J., Exp. Biol., 15, 865.6. Bhardwaj, J.C., Jaroli, D.P. and Lall, S.B. (1977), Ibid..7. Bhardwaj, J.C., Jaroli, D.P. and Lall, S.B. (1979), Ibid..8. Bhardwaj, J.C., Jaroli, D.P. and Lall, S.B. (1979), Ibid..

Research Journal of Social and Li fe Sciences, ISSN 0973-3914, Vol .-XIV- II, Year-07, June-2013232
9. Swami, D.R. and Lall, S.B. (1979), Curr. Sci.,.10. Wattenberg. L. W. (1958), J. Histochem. Cytochem., 6, 225.11. Balquier, J.A., Ferguson, M.M. and Hart, D.M. (1966), Developments in Steroid
Histochemistry, A.P. Lond., N.Y., p. 8.12. Orgebin-Crist, M.C., Dyson, A. L. M. and Davies, J. (1972), Fendite et Sterilite
du Male, Acquisitions recentes, ed. C. Thiabutt, Masson, Paris, p. 22.13. Franket, A.I. and Eik-Nes, K.B., Endorinol., 1970, 87, 646.14. Vreeberg, J.T.H. and Aafies, J. H. (1972), “Dehyrotestosterone (5-13-01-3one)
in the epididymis of rats,” In Current Problems in Fertility, eds. A. Ignleman-Sundberg, and N.O. Lunell Plenum Press, N.Y., p. 203.
15. Galena, H.J., Pillai, A. K. and Turner, C.J. (1974), Endocrinology, 63, 223.16. Voglmayr, J. K. (1971), Acta Endocr., 68, 793.
ISSN 0975-4083
A Registered Reviewed Research JournalSix monthly Bi-lingual Journal (English/Hindi Editions)
Please address all Communications -Prof. Braj Gopal Shukla
Chief Editor Research Journal Social and Life Sciences
41/42, Raghuwans Sadan, Shantikunj, Bichhiya, Rewa 486 001 (M.P.) Phone - (07662) 255177, 9425186437
E-mail - [email protected] [email protected]
The Aims & Objectives-
Guidelines & Member Ship Fee
To provide a plateform for the publication of original unpublished Research Papers, Summary of Research Project, Thesis and Book review relating to all subjects of Social & Life Sciences and to promote interdisciplinary research work. Book Review can be published on receipt of two copies of concerned book.
-Authors/ Researchers can contact in the Registered Office given below-
Indexed & Listed at: Ulrich’s International Periodicals Directory ©, ProQuest, U.S.A. Title Id : 715204
Volume-IX, Coming in September, 2013

Research Journal of Social and Life SciencesISSN 0973-3914, Vol.-XIV- II, Year-07, June-2013
Flow of Non - Newtonian fluids and LubricationProblem
*S. S. Shukla==========================================================Abstract- In this Paper I would like to present the solution of the equationsof non-Newtonian fluid represented by a second order fluid and by aBingham material. Srivastava [1] has given dimensional analysis of themotion of a second -order fluid following the constitutive equation (1)and also discussed the flow and heat transfer when such a liquid isconfined between two plates one rotating and other at rest .==========================================================
===========================* Associate Professor, Department of Mathematics, D.B.S.P.G. College, Kanpur
(U. P.)
Equation of motion of the second –order fluid- The equation of the motion of a second –order fluid represented by constitutive equation.
……………….….. (1)
Where
This relation is a correction of reiner Rivlin fluid .Above equation (1) can be
written as -
…….…………… (2)
+
Where
2 S= .………….. (3)

Research Journal of Social and Li fe Sciences, ISSN 0973-3914, Vol .-XIV- II, Year-07, June-2013234
and are velocity and vorticity vectors, respectively, is the density, L is
the typical length of the system, and U is the velocity comparable to actual
velocity. Inspectional
Analysis reveals that the second- order effect will be important if A or B or
both>> 1 where A= This condition for a particular fluid can be
fulfilled either making U large or L small, so that velocity gradient U/L is
large. Hence if such a liquid has to pass through fine gaps or is sheared
between two plates rotating with respect to each other and the distance
between them is small, the second order ( non-Newtonian ) effects will pay a
very significant role in determining the nature of the flow.
Flow between two parallel plates when one plate rotates.
Consider the motion of a second order fluid filling the space between
two Infinite plates , one of which (z=0) is rotating with a constant angular
velocity about an axis r = 0 perpendicular to its own plane and the other
plate (z = d) is stationary. Taking u, v, w to be the velocity components in the
direction of r, , z respectively, in cyllndrical polar coordinates, the boundary
conditions in this problem can be written as.
u=0 v=r , w=0 at z=0 …………… (4)
u=0, v=0 w=0 at z=d.
The velocity components and the pressure at any point in the fluid can be
taken as
…………… (5)
P=
Where

Research Journal of Social and Li fe Sciences, ISSN 0973-3914, Vol .-XIV- II, Year-07, June-2013 235
For small values of Reynolds number
R= the solution of equation is
V=
,
w= -d …..………. (6)
………..….. (7)
Stresses developed in rotation between plates
The average normal force on the circular portion of radius a of non-
rotating plate(neglecting the edge effect) is
…..……….. (8)
Substituting the velocity components in (1) and then from (1) we
get this force as
……….……. (9)
Where is the value of pressure at
Hence the factionary plate experiences suction or thrust according as
…………… (10)
Markovitz showed that 6.8% solution of poly-isobutylene at be heve a
second order fluid, and material constants are 60, -1.6, 7.4 in GCS
units.
Flow of a Bigham Material fed as a Lubricant in a Thrust Bearing-
Singleterry and stone have shown that as a first approximation grease can

Research Journal of Social and Li fe Sciences, ISSN 0973-3914, Vol .-XIV- II, Year-07, June-2013236
be treated as a Bigham material. In thrust bearing the flow of the lubricant is
due to
i. Relative rotation of the thrust bearing and
ii. Radial flow caused by feeding the lubricant at the centre. Slibar and
Paslay [3] have solved the flow of grease fed as a lubricant in thrust
bearing taking rotational velocity to be dominant. Geometry of thrust
bearing is shown in the figure 1. Where h is half thickness of the thrust
bearing , is the radius of entrance of the film, is the radius at
filmoutlet and upper and
lower plates. Constitutive equation suggested by Oldroyd [4] mentioned
has been used . R.G. Lerner & Trigg [5]as a first approximation
tangential velocity and shearing stress were given as:
…………… (11)
I is the value of yield stress.
The secondary flow were expanded in power of r giving and
………………… (12)
……….……….. (13)
Where q is the volume flow per unit of time fed into the bearing and is the
atmospheric pressure.
The load capacity w is given by
W= -2 ….……………. (14)
=

Research Journal of Social and Li fe Sciences, ISSN 0973-3914, Vol .-XIV- II, Year-07, June-2013 237
The external torque required to rotate the bearing to maintain the constant
angular velocity is given by Edward D. Polik & Ghosh [6]
T= =
……………… (15)
The power P to feed the lubricant is equal to the product of the volume of the
grease supplied and the pressure drop to feed the flow is given as
P=
……………… (16)
It has been concluded that the load capacity W decreases with the increases
of
======================References-1. A.C. Srivastava , AIAA Journal Vol. 2(1964)749.2. C.R. Singleterry and E.E.Stone., J.Coll. Sci. Vol. 6 (1951) 171.3. A. Slibar and P.R. Paslay , Trans. ASME vol. 79( 1957) 1229.4. J. Oldroyd, Proc. Camb. Phill. Soc. Vol. 43 (1947) 100.5. Encyclopaedia of Physics ( 2nd Edition) R.G. Lerner, G.L. Trigg, (1991) ISBN(VHC
lnc) 0- 89573- 752.36. Edward D. Palik & Ghosh G (1998) Hand book optical constants of solids,
London U.K. Academic press.

Research Journal of Social and Life SciencesISSN 0973-3914, Vol.-XIV- II, Year-07, June-2013
Estimation of some Amino Acids, Thiouria and Sugarsusing Pentavalent Vanadium on Micro Scale
* Anupama Dwivedi** Nagmani Manikpuri
==========================================================Abstract-Estimation of some Amino Acids, Thiouria and sugars usingPentavalent Vanadium on Micro Scale has been done in this researchwork.Key words- Amino acids,Thiouria,Vanadium,Sample.==========================================================
===========================* Guest Faculty, Department of Chemistry, Govt. College-Pali, India** Assistant Professor, Department of Chemistry, Govt N.P.G.College Burhar
India
Introduction: Vanadium is transmission metal and hence its penaltimete shellis not compete and posses a vacant “d” orbital. The outer electronicconfiguration of vanadium is 3d3 , 4s2 , it shows oxidants states of +1, +2, +3,+4, +5, 0, -1. The most common oxidation states are +5 and most uncommonare -1 and 0.
Vanadium pentaoxide is the most important among all the vanadium oxidesand it is generally obtained during the extraction of vanadium from differentores. It is generally obtained by heating chromium metavanadate in laboratory.Analytically pare vanadium pentaoxide can also be prepared by decomposingtwice crystallized ammonium metavanadate in platinum crucible in the presenceof air at 4000C – 4500C and strong the material in a desicater.
Thiouria are generally used as preservatives, insecticides, rodenticidesand in the pharmaceutical preparation. Many Thiouria derivatives possessantibacterial and antipyretic properties.
They are great value in the characterisation of organic compounds andare also used in dyes, photographic films, plastic and textile industry and forthe manufacture of chemical deposited radiation, detector materials.
In all these operation it is often necessary know the purity of particularThiouria derivatives employ and therefore a suitable method for their easywould be of great value.
“William” proposed a method for determining the thio using sodiumcyanide complex as the reagent. The sample is boiled with reagent for five

Research Journal of Social and Li fe Sciences, ISSN 0973-3914, Vol .-XIV- II, Year-07, June-2013 239
minutes, silver sulphide was filtered off and amount of cyanide ions wasdetermined by titration with standard solution of silver nitrate.APPROCH OF THE REACTION: For testing the quantitative validity atthe reaction. Thiouria was taken as the test sample. A possible course at reactioncondition developed for Thiouria the determination of its derivatives was carriedout. The effect of interfering substance was also studied, in case of abnormalresults. The reaction condition was suitably modified and possible explanationwas given.EFFECT OF VARIATION: Effect of following variables was studied todevelop a suitable method for the micro determination of Thiourea, phenylThiourea, x-naphthyl Thiourea thiosemicarboxidry allythiourea and O-ditotylThiourea.EFFECT OF TEMPRTURE: Effect of temperature on the recovery of thethiourea with 0.3N vanadium[v] reagent.
Aliquots taken [ml] Amount present[mg] Temperature
[°C]
Amount Recovered
[mg] % of error
2 2.0000 27 1.0900 -0.50 2 2.0000 35 1.0930 -0.35 2 2.0000 40 2.0110 +0.55 2 2.0000 45 2.0180 +0.90 2 2.0000 50 2.0196 +0.98
In each case three determinations were done.Effect of reaction time on the recovery of thiourea with 0.3 N vanadium [v]reagent.
Aliquots Taken[ml]
Amount present[mg]
Reaction time
[min.]
Amount Recovered
[mg] % of error
2 2.0000 1 1.0638 -1.81 2 2.0000 5 1.0830 -0.85 2 2.0000 10 1.0930 -0.35 2 2.0000 15 2.0010 +0.05 2 2.0000 20 2.0088 +0.44 2 2.0000 25 2.0110 +0.55
In each case three determinations were done.Effect of virgin of concentration V [v] reagent on the recovery of thiourea.
Aliquots taken [ml]
Amount present [mg]
Strength of V [v] N
Amount recovered [mg] % of error
2 2.0000 0.10 1.0880 -0.600
2 2.0000 0.20 1.0220 -0.016
2 2.0000 0.30 2.0010 +0.050
2 2.0000 0.40 2.0135 +0.670 Stoichiometric ratio of thiourea and its few derivatives with 0.3N V[v]
reagent

Research Journal of Social and Li fe Sciences, ISSN 0973-3914, Vol .-XIV- II, Year-07, June-2013240
Sample Deserved molar of
Ratio of compound V[v] Per Mole
Thiourea 8.0342 7.9820 7.9733 8.0024 Phenyl Thiourea 8.0018 8.0202 8.0022 7.9998 a- naphthyl Thiourea 8.0020 8.0100 8.0076 7.9988 Thio semi carbazide 12.0321 11.9932 12.0340 12.0080 Allyl Thiourea 7.9998 7.9990 8.0003 8.0020 O-ditolyd thiourea 16.0020 16.0070 15.9998 16.0020 GENERAL PROCEDURE:- Aliquots containing 1-5 mg of the sample were
taken in a 100ml Erlenmeyer flask followed by the addition of 5ml of 0.3 V[v]reagent and 5ml of 10N H2 SO4. The reaction cements were shaken gentlyand kept on a boiling water bath for 20 minutes after the reaction was over.The reaction mixture was cooled to room temperature. The unconsumedVanadium[v] reagent was titrated against 0.025N ferrous ammonium sulphateusing N-phenyl anthranilic acid as an indicator. A blank experiment was alsorun under identical conditions using all the reagents except the sample. Recoveryof the sample was calculated by following expression.
Mg. of sample = M × N [ B – S ] n
Where:-M = Molecular weight of the sample.N = Molarity of Ferrous ammonium sulphate.B = Volume of Ferrous ammonium sulphate consumed to titrate the blank
experiment.S = Volume of Ferrous ammonium sulphate consumed to titrate the sample
experiment.n = Number of Moles of Vanadium[v] reagent consumed per mole of the
sample.======================References-1. URBANSKL,S Chem, analit. [Warzawa, 5, 687] [1960].2. UDALCOVA, N.L. Zhur. Anal. Khim., 17,476, [1962].3. RAO, G.G. and SASTRI, T.P. Z. anal. Cheim., 167,1[1959].4. ZVENIGOROOSKAYA, V.M. and Zhur. Anal. Khim., 14,457, [1959].5. UPOR, E., FEKETE, L. AN NAGY, G. Magyar Kemikusok Lapja, 13, 305 [1958].6. MORACHEVESKII, J.V. Zhur. Anal. Khim., 13, 337, [1958] and
CHERKOVNITSKAYA, I.A.7. ESKEVCH, V.F. AND KOMAROVA, L.A. Zhur. Anal. Khim., 15, 84, [1960].8. RAO, G.G., RAO, P.V. and VENKATAMMA, N.C. Z. Anal. Chem., 150, 178,
[1956].9. TSUBAKI, L. Japan Analyst, 4, 77[1955].10. STEPIN, V.V. Zarodskaya Lab, 8, 262 [1939].

Research Journal of Social and Life SciencesISSN 0973-3914, Vol.-XIV- II, Year-07, June-2013
Assessment of The Water Qual i ty and Pol lution Status ofThe Gauri Pond, Bhind City, Distr ict Bhind (M.P.)
* Mamta Bhadoria** Dinesh Kumar Chaturvedi
==========================================================Abstract-Water, the most vital resource for all kind of life on this planet isalso the resource, adversely effected both quantitatively and quantitativelyby all kinds of human activities on land in air and in water. The presentstudy is aimed at studying the nature and impact of effluent discharge inGauri Pond. It is situated in the Bhind City district Bhind (M.P.). Thesamples were collected and analyzed during APR.2012 to MAR 2013 forthe various Physico-chemical parameters including colour, odour, pH,turbidity, nitrate, T.D.S., T.S.S., D.O., B.O.D, C.O.D., Calcium, Magnesiumand Phosphorus from the results, it has been observed the pond and thesurrounding area were polluted severly.Keywords- T.D.S., T.S.S., B.O.D., D.O., C.O.D.==========================================================
===========================* Department of Chemistry, M.J.S. Govt. P.G. College, Bhind (M.P.)** Department of Zoology, M.J.S. Govt. P.G. College, Bhind (M.P.)
Introduction- The water, one of the essentials for life and nothing is morefundamental to it on earth. It occupies relatively a small portion of earth surface.These are of the greatest interest to man, because they provide more convenientand cheapest source of water for domestic and industrial needs and also themost convenient waste disposal system. It is a natural home of innumerableliving things, many of them harmless or even beneficial, some of them directlyor indirectly injurious to man. The environmental pollution effects the generalquality of our surroundings and possess risk to our health and well-being, wasreported by Parimalam.et al. (1994). According to the W.H.O. about 80% ofall the diseases of human being are caused by water. The waste water fromthe industries and domestic area effect the water quality by their colour, nature,high organic contents, pH, presence of heavy metals and other pollutants,(Bhuvaneshwari and Devika, 2005). So, a thorough monitoring of dangerousconcentration of hazardous materials such as heavy metals and toxic compoundin the heart of city, with special reference to water and soil is the crying needof time. Keeping the above mentioned facts in view the present study has

Research Journal of Social and Li fe Sciences, ISSN 0973-3914, Vol .-XIV- II, Year-07, June-2013242
been taken up to assess the Physico-chemical characteristics of Gauri Pond,polluted by industrial effluents and domestic sewage outlets.Topography of Bhind District- The Bhind district is situated in the northernpart of the Madhya Pradesh and covers an area of about 4459 sq. km. It liesbetween N Latitude 25Ú55’ and 26Ú45’ and E longitude 78Ú12’ and 79Ú05’and falling in survey of India topo sheet nos 54J 8N. It is bounded in the Northand East by Utter Pradesh, in the south by the Gwalior & Datia districts, in theWest by the district Morena.Morphology of the Pond- It is situated near Vankhandeshwar temple. It issaid that the temple and pond were established by Rajpoot King Prithvi rajChauhan in 12th centuary. Gauri pond is about 22ha (i.e. 2.2 sq.km.) incircumference, remains always filled with water by rain water during monsoonseason. The depth of water varies 10 to 45 ft. in different seasons of the year.The bottom of pond is muddy with submerged vegetation. The water of thepond possesses a large number of organic substances. Several drainages alsopresent in the locality.Material and Methods- For the present study, water samples were collectedfrom the Gauri Pond located in Bhind City. Twelve water samples were collectedfrom selecting four different sites of the Pond from Apr 2012 to Mar 2013.The Physico chemical characteristics of water determined not only at all thefour sites but also from the surface and bottom layer of the Pond. Collection ofthe samples were done mostly between 11 A.M. to 12 P.M. throughout theperiod of investigation collection of the samples were done in sterile bottlesfrom the Pond. Samples were brought to the laboratory for determining thePhysico-Chemical characteristics, for the estimation of oxygen content watersamples were collected in separate reagent bottle. Other chemical parameterwere estimated by following standard methods (APHA,1999).Results and Discussion- The results of Physico- Chemical analysis of waterof Gauri Pond are depicted in table -1.
Table : 1Physico-chemical characteristics of water of Gauri Pond, Bhind City
(M.P.) from Apr. 2012 to Mar 2013.
S. No. Studied Parameters Sample Details Physical Parameters
1 Colour Brownish or Colourless 2 Odour Unpleasant 3 Turbidity 100 NTU 4 Temperature 31.5˚C

Research Journal of Social and Li fe Sciences, ISSN 0973-3914, Vol .-XIV- II, Year-07, June-2013 243
Chemical Parameters 1 pH 8.5 2 B.O.D. (mg/l) 10240 3 D.O. (mg/l) 2.75 4 C.O.D. (mg/l) 90,210 5 T.D.S. (mg/l) 21122 6 T.S.S. (mg/l) 1105 7 Calcium (mg/l) 1182 8 Magnesium (mg/l) 542 9 Nitrate (mg/l) 9.21
10 Phosphorus (mg/l) 0.10 Temperature and Turbidity- The temperature was 31.5ÚC and turbidity
100 N.T.U. it will affect the oxygen combining capacity there by indirectlyeffecting the dissolved oxygen in water (Goel,2000). Turbidity in the water ofGauri Pond has been found beyond permissible limit. Higher turbidity makesthe water unfit for domestic purpose, food and beverage industries and manyother industrial uses.Colour and Odour- The colour of the water brownish or colourless and odourwas unpleasant due to the presence of various chemical being added for washingdomestic materials and industrial effluents.pH- The pH of water was in the range of basic level. Higher value of pH wasrecorded 8.5. It is an important environmental factor influencing the speciesand metabolism of all animal and plant inhabiting in it. Significant changes inpH occur due to disposal of industrial waste, drainage etc. in pond water, pHalso changes diurnally and seasonally due to variation in photosynthetic activitywhich increases the pH due to consumption of CO2 in the process. pH hasnodirect adverse effect of health, however, low pH is harmful to fishes.According to Swingle (1967), pond water having values of pH below 5 above9.5 are not suitable.Dissolved Oxygen- The value of D.O. reflects the physical and biologicalprocesses prevailing in the water. Its presence is essential to maintain thehigher forms of biological life in the water and the effects of waste dischargein a water body are largely determined by the oxygen balance of the system.Low oxygen in water can kill fish and other organism present in water. Herethe value of D.O. was 2.75 mg/l which is indicate relatively varying organicpollution.Bio-Chemical Oxygen Demand- B O D is the amount of oxygen utilized bymicro-organism in stabilizing to the amount of organic waste to be degradedaerobically. It is highly important to know the amount of organic matter presentin the waste treatment system and that the quantity of oxygen required for itsstabilization. Here maximum value of BOD was 10240 mg/l which may bedue to high rate of organic and inorganic matter due to the inflow of sewage.The value of BOD was indicate high organic pollution.Chemical Oxygen Demand- COD is the oxygen required by the organic

Research Journal of Social and Li fe Sciences, ISSN 0973-3914, Vol .-XIV- II, Year-07, June-2013244
substances in water to oxidize them by a strong chemical oxidant. In presentstudy, revealed that higher value of COD in the water sample (90210mg/l)crossed the limits of standard prescribed in to land surface water (COD levelsof 250 mg/l).Total Dissolved Solids- Dissolved solids denote mainly the various kind ofminerals present in the water value of TDS was found (21,122 mg/l) to behigher than permissible limits. Higher the value of dissolved. Solids greater willbe the amount of ions in water of Gauri Pond.Other Parameters- Parameters like Nitrates, Phosphate, Calcium andmagnesium were also determined. Values of the various parameters indicatethe effects of industrial effluents and domestic sewage outlet. They crossedthe limit of standard (CPCB, 1995). Higher concentration of Nitrates is knownto cause respiratory deficiencies in aquatic animals (Liu and Kuo, 1994). Highconcentration of magnesium may be cathartic and diuretic(Lehr et. al, 1980)for the initial user but a tolerance is developed in some high concentrationcombined with sulphate acts as laxative to human beings. Calcium as suchhas no hazardous effects on human health. In fact, it is one of the importantnutrients required by the organisms. Concentration up to 1800 mg/l have beenfound not to impair any physiological reaction in man (Lehr et al, 1980). Thehigher concentration of phosphorus was indicative of pollution in water ofGauri Pond.Conclusion- From the above investigations, it is clear that the Physico-chemicalparameters such as turbidity, BOD, COD, TDS and TSS of industrial effluentsand domestic sewage outlet were found to be higher and surpassed thepermissible limits of CPCB (1995). Release of such effluents into the waterresources will cause water pollution and effects aquatic organism drastically.Hence the effluents should be treated properly before discharge.Recommendation- It is important that a continuous assessment Physico-chemical character of water of Gauri Pond may be helpful in understandingthe status of water which is either polluted or in the beginning stage ofdegeneration.Acknowledgement- The authors are thankful to the Head, Deptt. OfChemistry, M.J.S. Govt. P. G. College, Bhind for providing all the facilitiesduring the course of this work. We are also thankful to Mr. B.P. Thapak ofP.H.E. Deptt., Bhind for the support during completing this manuscript.======================References-1. APHA, 1995 Standard methods for the examination of water and wast water.
19th edition Washington, D.C., Newyork.2. Goel, P.K. 2000, Chemical and Biological methods for water pollution standards
environmental publications, karad, India.3. Mishra, S.P.and Saxena, D.N. 1993 Planktonic Fauna in relation to Physico-

Research Journal of Social and Li fe Sciences, ISSN 0973-3914, Vol .-XIV- II, Year-07, June-2013 245
chemical Characteristics of Gauri Tank at Bhind, M.P., India dvance in limnologyNarendra Publishing House, New Delhi, PP,57-61.
4. Raina, V. Shah, A.R. and Shakti, R.Ahmed, 1984. Pollution studies on RiverJhelum an assessment of water quality. Indian J. environ. Hith., 26(3).
5. Trivedy, R.K. and Goel, P.K.1984. Chemical and Biological methods for waterpollution studies. Environmental publications, Karad, India.
6. Staub, R. Applying J.W. Hofstider, A.M. and Hass, I.J. (1970). The effects ofindustrial waste of Memphis and Shelby country on Primary plankton producers.Bioscience. 20:905-912.
7. Ghost, S.K. (1998) : Pollution management in industries, Environmentalpublication, Karad, India 82-89.
8. Tiwari, J.N.and Manzoor, A.(1988). Water quality of Indian rivers, In: Ecologyand pollution of Indian rivers (R.K. Trivedy, Ed.) Aashish publishing House,New Delhi: 271-286
9. Manivaskam, N. (2005). Physico chemical examination of water sewage andindustrial effluents. 5th Ed. Pragati Prakashan, Meerut.
10. Maiti, S. K. (2001). Hand book of methods in environmental studies, water andwaste water analysis, Vol.1 ABD Publishers, Jaipur, India.
11. Khanna, S.S an introduction to fishes.
Please address all Communications -Prof. Braj Gopal Shukla
Chief Editor Research Journal Social and Life Sciences
41/42, Raghuwans Sadan, Shantikunj, Bichhiya, Rewa 486 001 (M.P.) Phone - (07662) 255177, 9425186437
E-mail - [email protected] [email protected]
The Aims & Objectives-
Guidelines & Member Ship Fee
To provide a plateform for the publication of original unpublished Research Papers, Summary of Research Project, Thesis and Book review relating to all subjects of Social & Life Sciences and to promote interdisciplinary research work. Book Review can be published on receipt of two copies of concerned book.
-Authors/ Researchers can contact in the Registered Office given below-
A Registered Reviewed Research JournalSix monthly Bi-lingual Journal (English/Hindi Editions)
Indexed & Listed at: Ulrich’s International Periodicals Directory ©, ProQuest, U.S.A. Title Id : 715205
Research Journal of Social and Life SciencesISSN 0973-3914, Vol.-XIV- II, Year-07, June-2013
Construction of Soak Pits and AwarenessRegarding Sanitation and Hygiene
*Anjali Pahad, **Nidita Karkare***Chaitali Patel
===========================* Professor, Department of Extension & Communication, Faculty of Family &
Community Sciences, Maharaja Sayajirao University, Vadodara, Gujarat** Teaching Assistant, Department of Extension & Communication, Faculty of
Family & Community Sciences, Maharaja Sayajirao University, Vadodara,Gujarat
*** Research Scholar, Department of Extension & Communication, Faculty ofFamily & Community Sciences, Maharaja Sayajirao University, Vadodara,Gujarat
==========================================================Abstract- Sanitation and hygiene are the basic prerequisites for thedevelopment of any community. They ensure healthy life for all, which inturn becomes social and economic concern for increasing productionand promoting good life. Though India is speedily escalating towardsdevelopment, we need to realize that it is unaffordable for us to ignorethe concerns of maintaining sanitation and hygiene. India is still laggingfar behind many countries in the field of environmental sanitation. Mostof the problems in the country are due to defective environment, which inturn rob people of their health, destroy their livelihoods and underminetheir overall development potential. Keeping in mind the importance ofhealth and sanitation for family and nation , an action project was plannedwith an objective To create awareness regarding personnel, family andcommunity hygiene amongst the villagers and constriction of sock pitsfor villagers of Borbar village, Gujarat. Project conducted in differentphases. First preliminary survey was done to find out the generalawareness level of the villagers. Based on survey planning and executionof the project was done.for reaction purpose observation were recordedfrom the different key leaders of the village. After the completion of thewhole project in borbar village, it was found that People become awareand sensitize towards the hygiene and sanitation and their importance inpersonal, family and community level.The numbers of villagers fallingsick due to unhygienic condition were low as per the health worker'sobservation. People are using toilets and not defeat in open.==========================================================

Research Journal of Social and Li fe Sciences, ISSN 0973-3914, Vol .-XIV- II, Year-07, June-2013 247
Introduction-The UNESCO defines sanitation as ‘maintaining clean, hygieniccircumstances that helps to avoid disease through services such as wastecollection and waste water removal’. “Sanitation is not a programme, but away of life. We must make a sincere commitment to ourselves to ensure aclean environment in the villages and thus contribute to a healthy and prosperoussociety”, NarendraModi, Chief Minister of Gujarat (2009).Gandhiji (1963, p.180) expressed that: “we have dung heap in our villages.The approach to many villages is not refreshing experience. Often we wouldlike to shut one’s eyes and stuff one’s nose such is the surrounding, dirt andoffending smell.” Realizing the dire need of improving the hygienic and sanitationconditions of the various part of our country. Government of India has madeconstant attempts to improve the sanitations. The aspect of sanitation wasgiven importance by keeping the major objectives of the 5yr plan (1971, p.4)as: “To raise the standard of living of the people and to open them ofopportunities for a richer and varied life.”Importance of Sanitation and Hygiene- According to WHO report(2011)entitled “Water supply, sanitation and hygiene development, water sanitationhealth.” emphasizes almost fifty per cent of the developing world’s population– 2.5 billion people – lack improved sanitation facilities, and over 884 millionpeople still use unsafe drinking water sources. Inadequate access to safe waterand sanitation services, coupled with poor hygiene practices, kills and sickensthousands of children every day, and leads to impoverishment and diminishedopportunities for thousands more.Status of Sanitation and Hygiene in Developing Countries like India-According to WHO report(2011) entitled “Water supply, sanitation and hygienedevelopment, water sanitation health.”highlighted about 2.5 billion people globallylive under highly unsanitary conditions and have such poor hygiene behaviorsthat their exposure to risks of incidence and spread of infectious diseases, areenormous. Water stored at home is frequently contaminated by inadequatewater management in the home. These issues are receiving increasing attention,but considering the huge backlog within the sector there is still a need forgreater mobilization of resources and involvement of decision-makers at alllevels.
India is still lagging far behind many countries in the field of environmentalsanitation. Most of the problems in the country are due to defective environment,which in turn rob people of their health, destroy their livelihoods and underminetheir overall development potential. The environmental sanitation is still anignored issue in India. To raise the overall standard of living the issue ofenvironmental sanitation must be tackled seriously. It is essential to take somestricter steps to raise the current state of environmental sanitation in India. Foran example in Nigeria (2008), the state government of Lagos has set up asanitation court, which will prosecute offenders arrested for violating the state

Research Journal of Social and Li fe Sciences, ISSN 0973-3914, Vol .-XIV- II, Year-07, June-2013248
environmental sanitation exercise. The state is also planning to set up fiveadditional mobile courts in this connection. Offenders could be any form ofenvironmental pollution such as those concerning noise, water, air, littering orerecting posters and billboards without necessary approval. Such steps takenby the governmental authorities certainly create an impact in the attitude ofthe community. In India, similar type of arrangements will be helpful in raisingthe current state of environmental sanitation. Keeping in mind the importanceof Sanitation and Hygine in Developing Countries an action project was plannedwith an objective To create awareness regarding personnel, family andcommunity hygiene amongst the villagers of Borbar village of Gujarat.Objectives-Major objective:1. To create awareness regarding personnel, family and community hygiene
amongst the villagers of Borbar village.2. To construct the soak-pits in Borbar village.Specific Objectives:1. To develop awareness regarding the personnel, family and community
hygiene amongst the villagers from Borbar village.2. To develop awareness regarding the benefits of soak pits, maintenance
of soak pits amongst the villagers from Borbar Village.3. To encourage the construction and use of soaked pits by the villagers in
Borbar Village.4. To obtain the reactions of the selected villagers regarding the awareness
progamme.Justification for the Project- India stands second amongst the worst placesin the world for sanitation, around 40 million people reside in slums withoutadequate water supply and sanitation, an estimated 55 per cent of all Indiansor close to 6oo million people, still do not have access to any kind of toilet.Moreover, India is losing billions of dollars each year because of poor sanitationfacilities; illnesses prove to be costly for the poor families, and for the economyas a whole in terms of productivity losses and expenditures on medicines,health care, and funerals. These are only few of the several statistics thatreveal the darker side of the story.
Sanitation and hygiene are the basic prerequisites for the developmentof any community. They ensure healthy life for all, which in turn becomessocial and economic concern for increasing production and promoting goodlife. Though India is speedily escalating towards development, we need torealize that it is unaffordable for us to ignore the concerns of maintainingsanitation and hygiene.The village Borbar of Dabhoi District is selected by project worker for theproject because the Government of Gujarat identified some villages which areconsider in the Total Sanitation Project and the Borbar village is one amongst

Research Journal of Social and Li fe Sciences, ISSN 0973-3914, Vol .-XIV- II, Year-07, June-2013 249
them. In Borbar village, there is one community “Navinagari” which has nofacility of sanitation and for these reasons the village was not declared as“Nirmal Gram”. So fulfillment of this need or making the village model andhelping village to get award of “Nirmal Gram Puraskar” project workerapproached the Borbar village. Hence the project worker decided to contributein the development of the nation therefore selected one village of Gujarat forthis project.Procedure for Conducting the Project- An action project is undertakenwith an aim to promote the development of people for whom the action isintended, a project through which an action is under taken among the peoplefor adoption of a new practices which help them to develop. These types ofprojects can become models for the people in changing their values and thereby their total outlook.The project was undertaken with the village people to construct the soak pitsand create awareness regarding hygiene and sanitation for the villagers ofBorbar Village.
The steps followed during the project were discussed under the followingheadings:
Steps for Planning of the Project-Collection of Information regarding Hygiene, Sanitation and Soak Pits-In order to carry out the project successfully, it was essential to have completeinformation regarding hygiene, sanitation and soak pits. Project worker referredR & D centre of the Department of Extension and Communication, Faculty offamily and community sciences, The Maharaja Sayajirao University of Baroda,Smt. Hansa Mehta Library, referred government and various organization’sreports on hygiene and sanitation, and also visited websites for getting valuablecontent for the project. Project worker also visited District Rural DevelopmentAgency (DRDA), Vadodara to get more and clear information regarding theseaspects.Selection of Village- After preparing the plan of the project it was necessaryto select the village. For this purpose project worker collected informationfrom District Rural Development Agency (DRDA). After studying reports ofDRDA project worker visited two villages and started project in both the village.Project worker finally decided the Borbar village for the project. On the basis

Research Journal of Social and Li fe Sciences, ISSN 0973-3914, Vol .-XIV- II, Year-07, June-2013250
of the following criteria:Criteria for Selection of Village.
Formulation of Group- Initially the sarpanch and village leaders wereapproached. The entire project was discussed with the sarpanch as well aswith the other members of the panchayat. The village leaders wereapproached with the help of the sarpanch. In this meeting they wereconvinced for the implementation of the project. The sarpanch and villageleaders agreed and were whole heartedly ready to support the project.Training of the Project Worker- Project worker learnt the details ofconstruction of the soak pits and the method of maintaining it. Projectworker contacted architect and engineer for the guidance in the designingof soak pits. The information gathered from them proved to be very usefulto her in experimenting in the project. Project worker also contacted oneprofessor from the Faculty of Technology, the M.S. University of Barodawho guided the project worker extensively for the details of theconstruction of soak pits.Plan of Activities Under Taken for the Project-Preliminary Survey and their Findings- Preliminary survey was conductedfor knowing the hygiene and sanitation status of the community, thesanitation and hygiene practices they already apply and the ones of whichthe people need to be informed check better adoption. It was found thatvillagers did not encounter problems with regards to the language andresponse systems of the tool. After conducting the preliminary survey theproject worker got the idea of the awareness level of villagers regardingpersonal, family and community hygiene and sanitation.Development of Teaching Learning Materials under the Project- Thereference materials from various organizations were referred by the project

Research Journal of Social and Li fe Sciences, ISSN 0973-3914, Vol .-XIV- II, Year-07, June-2013 251
worker. Most of the information available was in printed form. After selectingthe group of Borbar village, project worker found that the people living in thesecommunities and all those who were covered under the project were literate,very few were illiterate. They could understand things and read materialsslowly. Therefore, it was thought that the written information and materialwould also be used with the help of illustrations for people to understand theawareness on hygiene and sanitation and construction of soak pits. Therefore,it was decided to prepare following teaching aids/ materials which would beeffective in developing their understanding about the project. All the teachingmaterials were prepared by project worker:Teaching Materials were prepared by Project Worker.
Budget of the Project- The project worker developed project proposal forcollaboration with the agencies for the funding. Every project requires finance.So, project worker contacted the District Rural Development Agency (DRDA)and the Lions Club of Baroda. Finally project worker convinced the directorof the Lions Club and they were impressed to hear the ideas and concept ofthe awareness programme and agreed to give funds for the project and passedthe budget of 15,000/- for the construction of soak pits, rest of expenditure forthe project was bored by the project worker.Steps of Execution of the Project-Rapport Building with the Target Group- Motivational activity helped theproject worker to have a closer association with the group. Motivationalactivities were actually executed to break the monotony and also make learningfun and enjoyable. For this motivational game/ activities were conducted.Project worker planned some motivational activities to break the ice betweenproject worker and villagers. The activities were as follows:

Research Journal of Social and Li fe Sciences, ISSN 0973-3914, Vol .-XIV- II, Year-07, June-2013252
· Identity game.· Playing one minute act game.All these games were played systematically, questions were decided beforeround started by the project worker.Discussion with the Sarpanch and Panchayat Members- After forming agroup and rapport building, project worker had informal meetings with theSarpanch and Panchayat members. Project worker discussed about the projectof creating awareness on hygiene and sanitation through constructing of soakpits and details about the activities to be carried out under the whole programme.Project worker had arranged discussions amongst them and they shared theirideas, knowledge, thoughts and views regarding this project.Steps of Implementation of the Awareness Programme.
Construction of Soak Pits- For Construction of Soak pits the project workergot training and after that made a list of materials, references and diagramsfor understanding the location and infrastructure of the Soak pits. Project workerdemonstrated the construction of the Soak pits. Through diagrams, villagersunderstood and were motivated for constructing the soak pits and using thesoak pit facility in their household for improving their hygiene and sanitationpractices.Steps of Construction of Soak Pits.
Follow Up- Project worker went to the village and met the key leaders for

Research Journal of Social and Li fe Sciences, ISSN 0973-3914, Vol .-XIV- II, Year-07, June-2013 253
doing follow up of the project. It was observed that most of the participantsadopted hygienic practices which were good and healthy sign in the community.Evaluation of the Project- The project worker constructed the reaction scaleto obtain the reactions of the villagers regarding the construction of soak pitsand awareness programmeon hygiene and sanitation. Change in the behaviorand in practices amongst the villagers was measured by the observation ofkey leaders like;• Observations of Sarpanch.• Observations of Panchayat member.• Observations of member of MahilaMandal.• Observations of Medical Practitioners.• Observation of Mantri of GramyaShinchaiSahakareeMandali limited.
Constructed observation schedules to got the observation and obtain thesuggestion of the key leaders regarding the awareness programme on hygieneand sanitation and construction of Soak pits.Outcomes of the Project- People become aware and sensitize towards thehygiene and sanitation and their importance in personal, family and communitylevel.The numbers of villagers falling sick due to unhygienic condition werelow as per the health worker’s observation. People are using toilets and notdefeat in open. All the respondents had not attended such awarenessprogrammein the past so they interested to learn about the sanitation and hygiene.All the respondents were ready to construct soak pits for improving thesanitation. Majority of the respondents were aware about the personal, familyand community hygiene and sanitation. Practices of the hygiene and sanitationhad changed drastically. Villagers started using toilet facilities. Majority of theproblems related to the hygienic and sanitary were solved due to the usage ofsoak pits. Majority of the villagers reacted that constriction of soak pits was aneasy exercise and is also a good solution to maintain hygiene and sanitation inthis village.
This reflects that project was well accepted by the villagers and theywere satisfied with the construction of the soak pits.======================References-1. Sharma, P. Personal Hygiene and environmental sanitation of selected pupils
and their mothers of sevasi village, Department of Education and ExtensionEducation, Faculty of Home Science, The Maharaja Sayajirao University ofBaroda, Thesis (M.Sc.), April,1978.
2. Patel, C. An action project on income generation through Rakhi making amongstGirls and Women of Manjalpur areas in Vadodara, Department of Extensionand Communication, Faculty of Family and Community Scieneces, TheMaharaja Sayajirao University of Baroda, Action Project (PG), March, 2010.
3. Hadial, P. An action project on constructing check- dam to create sustainablesource of water for people in Kumetha Village Vadodara District, Department of

Research Journal of Social and Li fe Sciences, ISSN 0973-3914, Vol .-XIV- II, Year-07, June-2013254
Extension and Communication, Faculty of Family and Community Scieneces,The Maharaja SayajiraoUniversity of Baroda Thesis (M.Sc.), April,2009.
4. Pathak, A. An action project on awareness generation programme on importanceof institutional delivery for the community volunteers and Pregnant Women ofThree Selected Villages, Namely MotaFofaliya , Zanzad and Barkal ofSinorTaluka, Vadodara, Department of Extension and Communication, Facultyof Family and Community Scieneces, The Maharaja Sayajirao University ofBaroda, Thesis (M.Sc.), April,2010.
5. Bhatnagar, S. Knowledge and practice in household Sanitation as reported ofvillage Asoj in Gujarat, Department of Education and extension education,Faculty of Home Science, The Maharaja Sayajirao University of Baroda, Thesis(M. Sc), 1967.
6. Pandse, S. Knowledge and Practice of urban housewives in householdsanitation, Department of Education and extension education, Faculty of HomeScience, The Maharaja Sayajirao University of Baroda, Thesis (M. Sc), 1969.
7. Kumar, R. Environmental pollution & Health Hazards in India, Ashish Publishinghouse, New Delhi, 1987.
Website1. h t t p : / / g o i n d i a . a bou t . com / od / a n n oya n c es i n con ven i e n c e s / p /
indiasanitation.htm2. http://www.unicef.org/wash/index_hygiene.htm3. http://www.unicef.org/wash/index_hygiene.html4. http://www.ncbi.nlm.nih.gov/pubmed/127753765. http://www.unicef.org/india/reallives_5789.htm6. http://www.ruraldev.gujarat.gov.in/tsc.html7. http://www.unicef.org/india/resources_1208.htm8. http://wedc.lboro.ac.uk/resources/conference/34/Vyasa_V_-_269.pdf9. http://www.wsp.org/wsp/sites/wsp.org/files/publications/wsp-esi-india.pdf

Research Journal of Social and Life SciencesISSN 0973-3914, Vol.-XIV- II, Year-07, June-2013
Importance of Social Participation in Adoption ofNew Technology for Sustainable Rural
Development
* Jitendra Singh "Bhadauria"==========================================================Abstract- The study determined farmers adoption of improved agriculturaltechnologies disseminated via Uttar Pradesh Diversified Support Project(UPDASP) in District Baghpat, Uttar Pradesh State, India. An interviewschedule was used to collect data from a sample of 200 farmers. Out of200 farmers 100 were adoptores and other 100 were non-adopters. Resultsshow that 15 percent adopters and 8 percent non-adopters wereparticipating in social organization having representation or membership.10 percent adopters and 7 percent non-adopters were belonging to themembership of educational organization. 7 percent adopters and 10percent non- adopters were the member of cultural organization. 4 percentadopters and 3 percent non -adopters were the member of economicorganization. 6 percent adopters and 7 percent non-adopters were memberof political organization. 58 percent adopters and 5 percent non-adopterswere the member of Self Help Groups (SHG) where as 60 percent of therespondents of non-adopters was having no membership of anyorganization. Study also revealed that Social participation significantlyinfluenced adoption of improved agricultural technologies disseminatedvia. Uttar Pradesh Diversified Support Project (UPDASP) in DistrictBaghpatUttarpradesh.==========================================================
===========================* Assistant Professor & Head, Department of Agricultural Extension, Janata
Mahavidyalaya Ajitmal, Distt. Auraiya (UP)
Introduction - Participation in social activities is an important element ofpeople’s well-being and their ability to socialize with others. Being sociallyconnected with other people and with social institutions, such as clubs andorganizations, fosters social interaction, helps increase people’s sense ofbelonging and provides balance in people’s lives. Belonging to socialnetworks can also provide a number of tangible benefits, including information,access to goods and service, adoption of new technology and business contacts,as well as emotional support. Whether we live in the crowded bustle of aninner city or in a quieter, less populated rural area, most of us are part of the

Research Journal of Social and Li fe Sciences, ISSN 0973-3914, Vol .-XIV- II, Year-07, June-2013256
community in which we live. Social participation refers to people’s socialinvolvement and interaction with others. Activities such as volunteering, makingdonations, participating in sports, and recreational activities are all forms ofsocial participation. Social participation improves their own and the community’swell-being. Social participation includes participation in political activities andparticipation in social activities. Measures of factors that influence socialparticipation include social networks, sense of belonging, and level of trust.Social Participation is engagement in a variety of roles with others. Socialroles include domestic roles of home-maintainer and caregiver, interpersonalroles of friend and family member, major life roles as student, worker andvolunteer, and community roles such as participant in social organizations,religious participant, hobbyist, & political participants such as representation inGram panchayat, Block panchayat & District panchayat.Methodology: District ‘Baghpat’ of western Uttar Pradesh was selectedpurposively to investigate different aspects of adoption of new technology viaUttar Pradesh Diversified Agricultural Support Project (UPDASP). Socialparticipation is one of them. Two blocks namely Baghpat and Pilana wereselected by using simple random method of sampling. Ten villages were selectedfrom each block using simple random method of sampling. Thus a total oftwenty villages were selected for this study. Lists of villagers were obtainedfrom the V.D.O. for the selection of respondents. These lists of villagers dividedinto two parts, adopters and non-adopters. Five adopters and five non-adopterswere selected randomly from each village, total ten respondents from eachvillage selected. Thus only one hundred adopters and one hundred non-adopterswere selected for the study.
Social participation was treated as the degree to which an individualwas involved in social, educational, political, cultural and economicalorganizations. The allotments of scores for participation were following.
Table - 1Showing alloted scores of organisational participation of the respondents
Member of organizations Scores Social organisation (NGO, Rotary club, Youth Club, farmers club, Kisan sabha etc.)
1
Educational organisation (School, College, Technical Institute, Training school etc. )
2
Cultural organisation (Religious Trust, Societies, and Clubs, Religious council etc.)
3
Economical organisation ( Cooprative societies, Banks )
4
Political organisation (Gram Panchayat, Block Panchayat, Zila Panchayat, Assembaly, Parliament, Political Parties etc.)
5
Member of Self Help Group (SHG) 6
Member of none organization 0

Research Journal of Social and Li fe Sciences, ISSN 0973-3914, Vol .-XIV- II, Year-07, June-2013 257
Data were collected by personal interview method with the help of pre-tested structured schedule. Data thus collected were tabulated, analyzed andinterpreted in the light of the objectives set up for the present study. Descriptiveand inferential statistics were used for analysis of the data. The descriptivestatistics include percentage and mean etc. standard deviation, variance, ’t’test, Pearson’s Coefficient of correlation, spearman brown formula for reliabilityof the schedule, were used at different stages in the study as inferential statistics.To test the significant difference between adopters and non-adopters regardingsocial participation variables used in this study, null hypothesis (Ho) was tested.Result and Discussion : The social participation was operationalized as theparticipation of the respondents in social organization for leading to others ingeneral way and specific in particular way by holding the post of member orofficials in such organization. Following table shows the social participation ofthe respondents in various organizations.
Table : 2Showing distribution of social participation of the respondents in
various organizationS.N. Organisation Adopters
Percent Non
adopters Percent
1 Social organization
15 15 8 8
2 Educational organization
10 10 7 7
3 Cultural organization
7 7 10 10
4 Economical organization
4 4 3 3
5 Political organization
6 6 7 7
6 Member of Self Help Group (SHG)
58 58 5 5
7 No participation Nil Nil 60 60 8 Total 100 100 100 100 Above table shows 15 percent adopters and 8 percent non-adopters
were participating in social organization having membership. 10 percent adoptersand 7 percent non-adopters were belonging to the membership of educationalorganization. 7 percent adopters and 10 percent non- adopters were the memberof cultural organization. 4 percent adopters and 3 percent non -adopters werethe member of economic organization. 6 percent adopters and 7 percent non-adopters were member of political organization. 58 percent adopters and 5percent non-adopters were the member of Self Help Groups (SHG) whereas 60 percent of the respondents of non-adopters were not the member of anyorganization. To test the significant difference between the adopters and non–

Research Journal of Social and Li fe Sciences, ISSN 0973-3914, Vol .-XIV- II, Year-07, June-2013258
adopters regarding social participation in an organization following null Hypothesiswas formed.Null Hypothesis (Ho): There were no significant difference in socialparticipation of organization between adopters and non- adopters.
Table no. 3 shows the total score, mean score, standard deviation,variance and ‘t’ value for social participation of the respondents.
Table : 3Showing score, mean score, standard deviation, variance and ‘t’
value of social participation of the respondentsS.N. Particulars Adopters Non adopters
1 Total score 450 129
2 Mean score 4.50 1.29
3 Standard deviation 1.97 1.91
4 Variance 3.95 3.65
5 Calculated ‘t’ value 11.46
From above table the calculated value of ‘t’ found 11.46, that wasmore than table value of ‘t’ (1.75) at the .05% level of significance. Thereforenull hypothesis was rejected. Hence there were significant difference in socialparticipation in various organizations regarding adoption of technology betweenadopters and non-adopters.Conclusion - All of the respondents those were adopters of new farmingtechnology via Uttar Pradesh Diversified Agricultural Support Project belongingto the representation of various organizations means those farmers participatedin any type of organization adopted new technology because of few non-adopters were having the representation of the various organization. The studywas also revealed that there were significant difference between adoptersand non-adopters regarding their social participation in various organizations.Hence, conclusion drawn from the study that social participation payed veryimportant role in the adoption of new technology for development of people inrural areas.======================References-1. Agwu AE (2000). Diffusion of Improved Cowpea Production Technologies
among Farmers in the Northeast Savana zone of Nigeria. Ph.D Thesis,Department of Agricultural Extension, University of Nigeria, Nsukka.
2. Agwu AE (2004). Factors influencing adoption of improved cowpeaproductiontechnologies in Nigeria. J. Int. Agric. Ext. Educ. 11(1): 81-89
3. A. E. Agwu, J. N. Ekwueme and A. C. Anyanwu (2008) Adoption of improvedagricultural technologies disseminated via radio farmer programme by farmersin Enugu State, Nigeria African Journal of Biotechnology Vol. 7 (9), pp. 1277-

Research Journal of Social and Li fe Sciences, ISSN 0973-3914, Vol .-XIV- II, Year-07, June-2013 259
1286, 2 May, 2008.4. Bose, S.P. (1965). Socio cultural Factors in farm Efficiency, Indian Journal of
Extension Education, Vol. 1, No. 3.5. Chitamber, J.B. (1990). Introductory Rural Sociology. Wiley Eastern Ltd., New
Delhi.6. Gajanayak. J (1984). People Participation in rural development. The rationale
and significance Indian Journal of Agricultural Economics - 41 (3) 289 - 297.7. Ghurye, G.S. (1957). Caste and class in India, Popular Book Depot, Bombay.8. Gill, S. S. & Singh Ajit (1992) A study of adoption & status of recommended
practices in Panjab. Indian Journal of Extension9. Hooda, R. S. (1992) Role of socio-economic factors on the adoption of sprinkler
irrigation in Bhiwani district (Haryana) India. International Journal of TropicalAgriculture, 10:3, pp. 214-218.
10. Ilbery, B. (1985), Agricultural Geography, Oxford University Press, Oxford.11. Jaiswal, N.K. (1968) A study of adoption behaviour of tribal and non-tribal
farmers. Journal of Bihar Agricultural College, Sabour, Vol. 7, pp. 9 - 13.12. Jodha, N. S. (1986), "Research and Technology for Dryland Farming in India:
Some Issues for the future strategy", Indian Journal of Agricultural Economics,Vol. 41, No. 3, July - September, pp. 234 -247.
13. Joshi, P. K. Laxmi Tewari and P. S. Brithal (2006), "Diversification and its Impacton small holders : Evidence from a study on Vegetable Production", AgriculturalEconomics Research Review, Vol. 19, No. 2 (Forth coming)
14. Josi, V. D. (1985). Factors associated with small farmers extent of adoption ofsugarcane production technology. Maharashtra Journal of Extension Education,Vol. V.
15. Mac-Iver , R.M. and Page C.H., (1977). Society : An Introductory Analysis.TheMac Millan Co. of India Ltd. Bombay.
16. Hannah N (1991). The information technology revolution development.WorldBank economic Discussion Paper. Washington D.C.,U.S.A., p. 120.

Research Journal of Social and Life SciencesISSN 0973-3914, Vol.-XIV- II, Year-07, June-2013
Health Related Problems of Single Living Male and Femalein Bhopal Town due to taking Food outside Home
* Poonam Muktawat** Nilima Verma
==========================================================Abstract- The present study was made to assess the health related problemsof single living male and female by taking food outside home. The studywas conducted in various areas of Bhopal town. A sample of 300 singleliving male and female (Widow/Widower, Divorcee, Unmarried andSeparated) aged 25-45 years were selected randomly for the study. Themultistage stratified purposive technique was used for the selection ofthe sample. On taking food outside home, majority of respondents (73%)did not face any kind of health related problem.5.74%male and 13.8%female respondentsfaced gastric and acidity as well as 7.37% males and5.61% females suffered from vomiting.==========================================================
===========================* Department of Home Science, Sri R.D.A.K.(P.G.) Girls College Hathras (U.P.)** Department of Home Science Govt. M.L.B. (P.G.) Girls College Bhopal (M.P.)
Introduction- The food pattern of single living male and female is dependentupon the psychological as well as sociological condition. So it is needed to notedown how and why psychological as well as sociological conditions areresponsible for the intake of food by single living male and female and thechange in their food pattern. This study is focused upon only single living maleand female. The single living male and female come under these categoriesi.e. unmarried, divorcee, widowed and separated. Vijay Kumar et.al. (1992)conducted a survey in Thiruvananthapuram city of Kerala to assess the healthand functional status of the persons. Out of the 650 persons covered 20.15%of male and 68.1% of females were widowed. The women were found to bepoorer suffering a lot having more morbidity than the men in spite of theirgreater life expectancy. The diagnosed illness included hypertension (18.4%)arthritis and joint complaints (12.1%) chronic bronchitis (11.7%) Diabetes(9.5%) and coronary heart Disease (5.7%). Chronic bronchitis and Diabeteswere more among the males whereas hypertension was more among thefemales 20.9% of men and 32.8% of women were habituated to chewing ofbetel leaves. Perceived morbidity was higher among the females than men.The social and economic marginalization has an impact on the health of widows

Research Journal of Social and Li fe Sciences, ISSN 0973-3914, Vol .-XIV- II, Year-07, June-2013 261
(Chen and Dreze 1995).health in widowhood and divorce becoming morecommon in many societies (Kari Hemminki and Xinjun Li 2003). The evidencerelating widowhood to poor health status and negative health behaviour isinconsistent (Sara Wilcox et al.2003). According to article “Nutrition” food isbasic to survival and people have built in mechanisms in their bodies that workto control how much they eat, when they eat.Research Methods- The data were collected with the help of questionnairecum interview technique. A pretested and predesigned questionnaire havingall relevant informations were collected from 300 single living male and femaleaged 25-45 years. These respondents were selected from 8 representive areasof Bhopal town. Purposive multistage stratified sampling technique wasemployed for selection of single living male and female respondents. The presentstudy highlighted that the single living male and female were taking food outsidehome and faced health related problems. An interview schedule to elicit theinformation of the respondents was requested to fill the Performa with fullassurance about his confidentially and anonymity of his information. Therespondents were assured that the data would be used only research purposeof the study.Research Finding and Discussion- The findings obtained from the presentstudy have been discussed under the following subheads: (i)General information regarding the respondents: General informationregarding the respondents as age group and their percent participation ispresented in table 1 .Table 1: Age group wise distribution of single living male and female.
Age group (years)
Male Female Total No. % No. % No. %
25-30 10 8.20 6 3.37 16 5.33 30-35 35 28.69 46 25.84 81 27.00 35-40 29 23.77 50 28.09 79 26.33 40-45 48 39.34 76 42.70 124 41.34 Total 122 40.67 178 59.33 300 100.00
c2 = 4.083, df = 3, p >0.05It was noted from table 1 that all 300 single living males and females
participated in this study. It was noted that out of all 300 respondents of thisstudy, 122 single living male and 178 single living female were interviewed.Out of 122 single living male respondents, 8.20% male were of age group 25- 30 years, 28.69% male were noted in age group 30 -35 years, 23.77% maleof age group and 39.34% male of age group 40-45 years participated in thispresent study. Out of 178 single living female respondents, 3.37 female wereof age group25 - 30 years, 25.84% female of age group 30 -35 years, 28.09%female of age group 35- 40 years and 42.70% female were of age group 40-45 years in this study. It was noted that 40.67% single living male respondentsand 59.33% single living female respondents from all four age group participated

Research Journal of Social and Li fe Sciences, ISSN 0973-3914, Vol .-XIV- II, Year-07, June-2013262
in this study. Statistically, no significant difference was observed regarding theage groups between single living male and female.(c2= 4.083, df = 3, p>0.05).The marital status of male and female respondents and their percentileparticipation is presented in table 2.
Table 2:Status and marital category of single living male and female.
Category Male Female Total No. % No. % No. %
Unmarried 70 57.38 69 38.76 139 46.33 Widow 14 11.47 45 25.29 59 19.67
Divorcee 32 26.23 62 34.83 94 31.33 Separated 6 4.92 2 1.12 8 2.67
Total 122 40.67 178 59.33 300 100.00 c2 = 18.851, df = 3, p<0.05
Table 2 shows the distribution of all three hundred single living maleand female respondents according to their status and marital category. Allmale and female respondents were divided into two category i.e. unmarriedand married. The married category was further divided into widowed, divorceeand separated sub categories. Out of 122 single living male respondents 57.38%were unmarried. In married category of male respondents, 11.47% were widow,26.23% were divorcee and 4.92% were separated. In 178 single living femalerespondents of this study, 38.76% were of unmarried category. 25.29%widowed, 34.83% divorcee and 1.12% separated female respondents were ofmarried class. 46.33% unmarried male and female respondents participatedin this study while 19.67% widowed, 31.33% divorcee and 2.67% separatedmale and female of married class were included for study. Statistically,significant difference was observed regarding the marital status between singleliving male and female (c2 = 18.851, df = 3, p<0.05).Health related problems regarding the respondents: when single livingmale and female respondents took food outside home, some of them facedhealth related problems. The results are presented in table 3
Table 3: Health related problems by taking food outside home bysingle living male and female.
Health problem Male Female Total Statistical value No % No % No % 2 df P
Gastric/ acidity 7 5.74 24 13.58 31 10.34 5.071 4 >0.05 Vomiting 9 7.37 10 5.61 19 6.33 Fever 5 4.10 8 4.49 13 4.33 Constipation 7 5.74 11 6.17 18 6.00 None 94 77.05 125 70.22 219 73.00 Total 122 40.67 178 59.33 300 100.00 Table 3 shows the distribution of single living male and female respondents
according to their health problems by taking food outside home. Out of 300single living respondents, 73.00% respondents denied for any health problemby taking food outside, 10.34% respondents had gastric/acidity. problems, 6.33%

Research Journal of Social and Li fe Sciences, ISSN 0973-3914, Vol .-XIV- II, Year-07, June-2013 263
respondents suffered from vomiting, 4.33% respondents were suffering fromfever due to intestinal infection etc.6.00% respondents had constipation. Outof 122 single living male respondents, 77.05% male respondents denied formany health problems, 5.74% males had gastric / acidity and constipation problemin each. 7.34% male respondents had vomiting, 4.10% males suffered fromfever by taking food outside home. Out of 178 single living female respondents,70.22% female respondents denied for any health problems. 13.58 % femalehad gastric/acidity problem, 5.61 % females had vomiting 4.49% femalerespondents suffered from fever and 6.17% females had constipation problemby taking food outside home. Statistically, insignificant difference was observedregarding the heath related problems by taking food outside home betweensingle living male and female (c2=5.071,df=4,p>0.0. In relation to heath problemof single living males and females when outside food was taken, the resultsindicated that majority of respondents (73.00%) did not face any health relatedproblems. Only 10.34% respondents had gastric or acidity problem due tooutside food. It was due to oily outside food or indigestion problem. Fewrespondents faced constipation, fever or vomiting. Higher percentage of malerespondents (77.05%) than female (70.22%) revealed that males were morehabitual than females to take outside food due to many reasons. More femalesthan males faced health related problem by food outside home due to theirlimited outgoing, morning walk and less physical exercise as well as moremental tension.Conclusion- Statistically, significant difference was not observed regardinghealth problem by outside food between single living males and females(p>0.05).The present study was restricted only to the single living males andfemales in Bhopal town. It was suggested that a study may be conducted onthe health related problems. Majority of the respondent i.e.73.00 % deniedany health related problems by taking food outside home. Remainingrespondents faced gastric, vomiting, fever, constipation health related problems.======================References-1. 1992: K. Vijay Kumar, et. al., "Life and health of theelderly in a community in
transition", Result of a survey in thirivananthapuram city.2. 1995: Marty Chen and Dreze Jeam, "Recent research on widows in India",
(Workshop and conference report), Economic Political Weekly, 30 sept., p-2425-50.
3. 2003: Kari Hemminki et.al., "Life style and cancer : Effect of widowhood anddivorce", CancerEpidemiology Biomarkers & Prevention, American Associationfor Cancer Research, vol.12, p-899-904.
4. 2003: Sara Wilcox et.al., "The effect of widowhood on physical and mentalhealth, health behaviours and health outcomes : The Women's Health InitiativeHealth Psychology American Psychology Association, vol.2(5), p-513-522
5. Nutrition: http://www.foods.org/health/Healthy-living-VI/Nutrition.htm.

Research Journal of Social and Life SciencesISSN 0973-3914, Vol.-XIV- II, Year-07, June-2013
Effect of Heavy Metals on Fish and Amphidia withVarious Histochemical Changes
* Mukesh Kumar Napit==========================================================Abstract- Studies on the toxicity of common metals, pesticides Herbicides,Fungicides and some industrial pollutants on Fish and amphibian specieshave been reviewed. Pollutants such as heavy metals, pesticides causedisease, morphological, behavioral and genetical abnormalities in Fishand amphibian (Aquatic species). Physiological malformation,histological, haematological and biochemical changes have also beenobserved in Fish and amphibian. Heave metal significantly affect theearly life stages of Aquatic animals. Toxic effects of heavy metals andpesticides very in different organs of Fish and amphibian. Liver, gill,Kidney are t issue that can accumulate high level of pollutants.Accumulation of pollutants in tissues of Fish and amphibian is dependentupon exposure duration and concentration of pollutants as well as otherFactors, such as salanity temperature , hardness turbidity, PH , OD, COD,BOD and TDS etc.Key Words- Fish and Amphibian Fauna, Variation, Toxicity, Heavy Metals==========================================================
===========================* Department of Zoology, Swami Vivekanand Govt. College Berasia, Bhopal
(M.P.)
Introduction- Industrial waste has long been recognized as serious pollutantof the aquatic environment. Heavy metals have toxic effect in the exposedorganism. The presence of metals and pesticides beyond permissible limits inwater has been reported world wide. Our study Focuses on the toxic effect ofheavy metals and pesticides on Fish and amphibian Fauna and their variations.
In India, steps have been taken to monitoring of heavy metals and otherpollutants level in water sample of major rivers. Monitoring of pollutants hasbeen done in India, Ganga action plan, Rajiv Gandhi National drinking watermission and integrated environmental programme on heavy metals. (IEPHM).
Water Samples collected from various sources in different sites of copra,sunar, Viyarma rivers and ponds of Damoh District, were analysed and leadwas found within the permissible level.
Lead concentration in submerged plants, Fish and amphibian at varioussites of river copra sunar viyarma were observed only down stream sites and

Research Journal of Social and Li fe Sciences, ISSN 0973-3914, Vol .-XIV- II, Year-07, June-2013 265
Fish and amphibian species collected at Damoh, which was possible due todischarge of lead containing influent from Narsingarh mycem cement Industriesalong site of the copra and sunar river in Damoh District.
All the chemicals of Industrial waste are toxic to aquatic animals andmany cases of death of sub-lethal pathology of liver, Kidney, reproductivesystem, Nervous system of aquatic organism have been reported.
By discharge from the effluent inflows, amount of heavy metal andpesticides in water show an increase. They are present in water in dissolvedcondition from only at low levels, since heavy metal compounds have lowsolubility, Mineral suspension and precipitation substances are able to storeheavy metal ions on their outer surface. Heavy metals and pesticides can alsobe found in water organism. They can be taken up by higher organism throughthe Food chain and sink to bottom as sediment.
Damoh is known as city of lakes it is embedded with 8 different lakesand 3 rivers. These wet lands are of utter importance as they are the good anduseful sources to mankind in different ways. Some are used for irrigation,some for potable water supply, raw water supply , recreation, fisheries, washingetc. With rapid urbanization, constant, changes in demographic structurespecially during second half of last century , all these water bodies have beensubjected to various environmental problems. The resulted in deterioration ofwater quality through inflow of sewage, solid waste dumping other anthropogenicactivities thus affecting the biodversity.
In this study all the 8 lakes and 3 rivers of Dahom were used for differentpurposes. The output of this study would some how lead to the betterenvironmental management and help to save our water bodies.Material and Methods-The water samples were collected during July 2011-June 2012. The Method of collection, preservation and enumeration of Plankton,fish and amphibian were as per standard method. Eleven Physico-chemicalparameters were analysed and planktons fish and amphibian population weregrouped accordingly.
Fish collected seasonally, from all polluted and non polluted selectedsites by hand picking or fishing nets and would be preserved in 5-10%formaldehyde in glass or plastic bottle. Authentic keys for identification andclassification of fish, would be used. Days fauna. (1958), fish identification byH.R. Singh, Jhingaran ( 1985).
The key for identification of amphibian is available in ZSI Jabalpur andCalcutta would be taken. Boulenger; G.A. (1990), the amphibian fauna ofBritish India. Annandale; N. (1918); S.K. Dutta; (1997); etc would be soughtfor amphibian identification.Results and Discussion-Heavy metals- Heavy metals are those, of which specific gravity (density) ismore than about 5g/cm2 . Heavy metals and their salts and organic compounds

Research Journal of Social and Li fe Sciences, ISSN 0973-3914, Vol .-XIV- II, Year-07, June-2013266
are found to be used in various industrial processes, agriculture, manufactureof batteries and electroplating etc. Fraction of them may enter into effluents.Many industries contributing heavy metal wastewater stream are pesticides,mining wastewater stream are pesticides, mining, electroplating, textile, printingetc. Heavy metals are stable elementals, they can not be metabolized by bodyand bio-accumulation is passed through the food chain to humans. Some metalsare naturally found in the body and are essential to health. Iron for exampleprevents anemia, zinc is cofactor in over 100 enzyme reactions. Some metalssuch as Mercury. Aluminum, Arsenic, Cadmium, Nickel etc. that act as poison,interfere the enzyme system and metabolism of body.Copper- Copper is a semi-precious metal and often used in the electricalindustry. The toxic effect of copper compounds are applied as algaecides andfungicides Copper is toxic even in low amount for all water organisms such asbacteria, algae, fish. Copper is significant as most important trace element fororganism metabolism but high concentration damages health.Zinc - Zinc is present in most rocks and which is weathered out and depositsinto soil. Zinc is released in thermal outgasing and other volcanic events. Zincis used in electroplating, smelting are processing. Zinc is an essential elementin organisms. Zinc is essential for growth & development of foetus. Zineaccumulates particularly in mollusks such as snails and mussels.Cadmium- Cadmium is naturally occurring element, it is rarely found s a puremetal in nature. Cadmium is thrown in the water as a by-product of extractionof Pb, Zn and Cu from their respective. Low level chronic exposure to cadmiumcan cause adverse health effect including gastrointestinal, hematological,musculoskeletal, renal, neurological and reproductive disorders. The main targetorgan for cadmium exposure is the kidney.Behavioural Abnormalities- Heavy metals directly influence the behaviorof the fish and amphibian by impairing mental and neurological function Metalsinfluence neurotransmitter production and alter numerous metabolic processes.
Behavior abnormalities in various fish and amphibian species on exposureto heavy metals have been reported by several researches Frequent surfacingwith irregular opercular movement in fishes exposed to cadmium. Others alsoreported the lethargic response and frequent surfacing in copper exposedHetropneustes fossilis and Rana tigrina.
Lethargy and loss of equilibrium may be due to depletion of energy inthe body of animal. Cyprinion watsoni when exposed to copper showed littlebehavior change in low concentration Lethargy and loss of equilibrium wasobserved in high concentration of copper The impairment of carbohydratemetabolism was reported which resulted in the depletion of energy. The releaseof corticosterol hormone in Sockeys Salmon. Oncorhynchus nerka whentreated with copper Loss of equilibrium, frequent surfacing, sinking and outburstof erratic swimming in mercury exposed fish and amphibian was also reported.

Research Journal of Social and Li fe Sciences, ISSN 0973-3914, Vol .-XIV- II, Year-07, June-2013 267
Bioaccumulation- Heavy metals enter and accumulate in body tissue fasterthan body detoxification path ways and gradual build up of these toxins occurs.Many studies have shown that fish are able to accumulate and retain heavymetal from their environment. Considerable difference in mercury concentrationin muscles of different fishes amphibian from Sunar and Kopra River in DamohDistrict was observed. Copper and Zinc accumulation in liver and spleen ofCyprinus carpio collected from the Bhadbhada Dam and lake Rajnagar.
It has been observed that accumulation of metal in the tissue of fish isdependent upon exposure concentration and duration as well as environmentsfactors such as salinity , temperature. hardness and metabalism of animal.Environmental factors effect on the accumulation of copper, has beeninvestlgated. On Oreochromis mossambica concentration and duration ofexposure effect the accumulation of copper on Lepidocephlicthys gunteaand Bufo bufo.
Accumulation of metal varies in various tissues of fish and amphibian.Tissue wise accumulation varies for metal Hg. on Tinca tinca. They alsoobserved the general accumulation in the order for metal Hg <Cd < Pb. Highestlead concentration was in gill followed by kidney and liver in Oreochromismossambica and Rana tigrina.
Heavy metal accumulate to great extent in gill followed by liver andmuscle in decreasing order, except for cadmium which is higher is liver thangill and muscle.
Effect of temporal factor on accumulation of Zinc metal in organs andtissues was observed. The highest Zinc concentration in fish and amphibianorgans and tissues were detected in summer and autumn. They also reportedthat highest Zinc load were found in kidney and liver and lower in muscle offish and amphibian.Biochemical Abnormality- Nutritionally heavy metals are directly antagonisticto essential trace elements. Heavy metals compete with nutrient elements forbinding site on transport and storage of proteins, metal enzymes and receptors,Disruption of metabolic balance of nutrient elements result in marked aberrationsin metabolism of carbohydrate, proteins, amino acid, lipid, neurotransmittersand hormones.
In Clarias batrachus exposed to 2.5 ppm CdSO4 recorded the value ofglucose gradual fall was whereas cholesterol, total protein, create nine, ureaand potassium values showed a regular increase. Effect of textile mill effluentsand dyes on hematological parameters was observed . Workers reportedhypoglycemic conditions in air breathing fish due to cadmium and chromiumcontamination. Biochemical alteration hyperglycemia in lead exposed Barbusconchonius has been reported.
Enzyme and most of hormones are made up of proteins. Proteins aresensitive and early indicator of heavy metal poisoning. Enhancement of protein

Research Journal of Social and Li fe Sciences, ISSN 0973-3914, Vol .-XIV- II, Year-07, June-2013268
content due to heavy metal contamination was reported. Reduced protein.lipid and cholesterol contents of liver and overy in Notopterus notopterusexposed to Hgcl2 and Cdcl2 and combination of both metals was observedCadmium, lead, copper, arsenic, Mercury and chromium exposed Channapunctatus showed decrease in protein and RNA contents. When Channapunctatus fingerlings were exposed to Zinc sulfate solution for 30 days alteredthe concentration of electrolyte in blood. Bronchial NaK. ATPase activity wasinhibited approximately by 40% after 48h of lead exposure on Oreochromismossambica.Developmental Abnormality- Early life stages of fish and amphibian suchas egg and larval stages are generally more sensitive period on life-cycle. Fishand amphibian embryo is less sensitive to metal than larvae due to protectionoffered by chorion. Cadimium has been found to be very toxic to early stagesof fish. Cadmium and Zinc can cross the chorion of egg. These metals effectthe development of embryo , Zinc has been reported to be less toxic thancadmium to fish eggs. A relatively low concentration of 2 Mg/1. Zinc alteredegg incubation time and caused eye, jaw and spinal abnormalities. Egg larvaemortality from cadmium exposure has been attributed due to number ofmechanisrns. These include gill damage, mucus accumulation on the gills oflarvae, cadmium was highly toxic to early life stage of fish. Significant mortalityof egg and delay in hatching time of Cyprinous carpio when exposed to lowconcentration of cadmium metal was seen94. Abnormal hatching, spinaldeformity and anisophthalmia was observed in Rana tigrina embryos exposedto leach ate (waste disposal), hatchability was also inhibited58 and vitellogenesisand unknown proteins were induced in the sera of male Rana tigrina exposedto the diluted leach ate solution.Haematological Abnormality- Effect of heavy metal on physiology of bloodserum has also been studied because blood is a good path physiological indicator.Blood is also good bio-indicator or diagnostic tool to study the problem in organfunction . Various changes in red blood cells of various fish species due todifferent concentration of copper metal and time of exposure have been reported.Increase in hemoglobin concentration in 25mg/1 copper exposed fishHeteropneustes fossilis. Decrease in number of erythrocyte in blood of Labeorohita after 24h exposure to copper.Histological Abnormality- Change in histological structure of specific vitalorgans due to exposure of sub-lethal concentration of metal in various fisheshave been reported by several researchers. The gills are primary respiratoryorgan of the fish. The gill epithelium of fish is major site of gaseous exchange,acid base balance, ionic regulation and excretion of nitrogenous wastes. Gillsare the target. organs of water born toxicant such as metal. Low concentrationof metal disturbs ionic regulation which in turn effect the gill function andstructure.

Research Journal of Social and Li fe Sciences, ISSN 0973-3914, Vol .-XIV- II, Year-07, June-2013 269
Tissue necrosis, prominent rupture and fusion of secondary lamellae ingill in copper sulfate exposed Labeo rohita Alteration of the epithelial surfaceof gill in copper exposed Danio dangila. Histological changes have beenreported in gills of exposed fish Catla catla and Labeo rohita to heavy metals..Mercury and cadmium exposed Lepidocephalichthys guntea showed lesionsin ovary and impairment of vitellogenesis. The changes in gill filament.proliferation of chloride cells in Zinc treated Catla catla and Labeo rohita.Liver plays major role in metabolism of excretion, digestion and storage ofvarious substances including some toxic substance to fish.Conclusion- Heavy metals and pesticides have long been recognized asserious pollutants of aquatic environment. Heavy metals affect organism directlyby accumulation in their body. They cause serious impairment in metabolic,physiological and structural system. Heavy metals may affect an organismindirectly by transfer to the next trophic level of food chain. The accumulationof heavy metal in the tissues of an organism can result in chronic illness andcause potential damage of population. Fish are able to accumulate and retainheavy metal and other pollutants from their environment. Accumulation ofmetals and pesticides in the tissue of fish is dependent upon exposureconcentration as well as other factors such as salinity, temperature, hardnessand metabolism of organism2.
Heavy metals effect on specific vital organs such as liver, gill and kidney.Liver contains the highest metal concentration because it is an organ of storageand detoxification of metals8. Liver has also an important role in storage,redistribution. Detoxification, and also act as an active site of pathologicaleffects, induced by contaminants. Different degree of metal accumulation invarious tissues depends upon the biochemical characteristic of metal. Fish andamphibian may accumulate heavy metals by absorption through gills has beenobserved the concentration of metal in gill reflect the concentration of metal inwater in which fish and amphibian species live.======================References-1. AHAMD AND DATTA MUNSHI, J.S. (1987) Variation of copper toxicity on
the fingerlings of fresh water Indian carps, Catla catla and Laleo rohita. Biol.Bull. Indian 9 (3). 185-189.
2. ALLEN P (1995) Chronic accumulation of cadmium in the adible tissue ofOreochromus aureus Modification by mercury and lead. Arch. Environ cotamToxicol 29. 8-14.
3. ANAND KUMAR A. TRIPATHY, A.P. AND TRIPATH. N.K. (2001) Effect ofdirnecron on the blood parameters of Heferopneustes fossilis J. Environ Bio.22(4) , 297-298.
4. AVENANT-OLDWAGE AAND MARX; H.M. (2000). Bloaccumulation ofchromium, copper and iron in the organs and tissue of Clarias gariepinus inOlifant River kruger National park water SA 26: 269-582.

Research Journal of Social and Li fe Sciences, ISSN 0973-3914, Vol .-XIV- II, Year-07, June-2013270
ISSN 0975-4083
A Registered Reviewed Research JournalSix monthly Bi-lingual Journal (English/Hindi Editions)
Please address all Communications -Prof. Braj Gopal Shukla
Chief Editor Research Journal Social and Life Sciences
41/42, Raghuwans Sadan, Shantikunj, Bichhiya, Rewa 486 001 (M.P.) Phone - (07662) 255177, 9425186437
E-mail - [email protected] [email protected]
The Aims & Objectives-
Guidelines & Member Ship Fee
To provide a plateform for the publication of original unpublished Research Papers, Summary of Research Project, Thesis and Book review relating to all subjects of Social & Life Sciences and to promote interdisciplinary research work. Book Review can be published on receipt of two copies of concerned book.
-Authors/ Researchers can contact in the Registered Office given below-
Indexed & Listed at: Ulrich’s International Periodicals Directory ©, ProQuest, U.S.A. Title Id : 715204
Volume-IX, Coming in September, 2013
5. BARLAS, P.S. AND RANI A.U. (2003) Cadmium Induced antioxident defensemechanism in fresh water teleost Oreochromis mossambicus (tilapia) Ecotoxiecology and Environment safety 56. (2) 216-221.
6. BEENA S. VISWARANJAN, S. (1987) Effect of cadmium and mercury on thehematological parameters of fish Cyprinus carpio, Environ. Eco. 4. 726-732.
7. Boulenger, G.A. (1990) Amphibia in India, Record of Amphibia Zoological Surveyof India 83(1-2); pp123-127.
8. CHANDRA , SMITA, RAM, R.N., SINGH, J (2001) Toxic effect of carbofuranon certain hematological parameter in yearlings of Cyprinus carpio Aquacult.2(2) 137-140.
9. CUSIMANO, R. F. BRAKKED. F. AND CHARMAN, G.A. (1985) Effect of pHthe toxicities of cadmium copper and zinc to steelhead trout, (Salmo gairdner)Can . J. Fish Aquat. Sci. 43. 1497-1503.
10. CYRIAC, P.J. ANTONY, A AND NAMBISAN P.N.K. (1989) Hemoglobin andHaematocrit values in the fish, Oreochromis mossambicus (Peters) after shortterm exposure to copper and mercury, Bull Environ. Contam, Toxicol 43: 315-320.
11. DATTA, S. SINGH, H. DAS R. C. (2003) Influence of soil sediment factors onacute Toxicity , of inorganic mercurry to Catla-catla, Environment and Ecology.21. 3 pp 542-551.
12. Days. F. (1958); Fresh water fish fauna of British India. Vol. 1,2,-3.13. Dutta S.K. (1997); Amphibian of India and Sri Lanka (Checklist and Bibliography)
odyssey Publishing House , Bhubaneshwar.14. Singh H.R. and Jhingran V.G. (1985); Freshwater fishes of Indian region, India,
Narendra Publishing House, New Delhi.
Research Journal of Social and Life SciencesISSN 0973-3914, Vol.-XIV- I, Year-07, June-2013
An Assessment of Ethno botanical ly ImportantFerns from Dehradun District of Uttrakhand
* Chhaya Singh** Satish Garkoti
*** H. C. Pande==========================================================Abstract- Dehradun is located in the crest of Shivalik hills and the outerscrap of Himalayas. The ethno botanical studies assumes great importancein enhancing our knowledge about plants grown and used by native/tribal people, the rich diversity assembled by them for their sustenanceand different means adopted by them for its preservation / conservation.The study is based on the field survey and published literature on medicinalplants of Garhwal Himalaya and Dehradun. Remote villages of the areawere surveyed in the year 2008-2012 and ethnobotanical informationwere collected by interacting with local people, medicine men andexperienced people. In all 51 ferns are used in ethnobotanical practicesin the district.Key words- Fern flora, Ecological observations, Dehradun.==========================================================
===========================* Department of Life Sciences, Shri Guru Ram Rai Institute of Technology and
Sciences, Patel Nagar, Dehradun, Uttrakhand** Ministry of Environment and Forest, CGO Complex, New Delhi*** Botanical Survey of India, 192 Kaulagarh Road, Dehradun, Uttrakhand
Introduction- Dehradun is located in the crest of Shivalik hills and the outerscrap of Himalayas. It is an irregular parallelogram with its longer axis lyingalmost North-West and South-East. The total area of the district is 3016 km2,out of which 479km2 is the forest land. The climate is mostly monsoon typewith heavy rainfall during rainy season. The altitude of the district varies from250m-2850m due to variation in the altitude, the district represents uniquecomposition of vegetation which supporto large number of different plantspecies. The vegetation of the tract is important and possesses great potentialas a raw material of the plant kingdom. The ethno botanical studies assumesgreat importance in enhancing our knowledge about plants grown and used bynative/ tribal people, the rich diversity assembled by them for their sustenanceand different means adopted by them for its preservation / conservation. Thusit aims to document, describe and explain complex relationship between culture

Research Journal of Social and Li fe Sciences, ISSN 0973-3914, Vol .-XIV- II, Year-07, June-2013272
and (use of) plants. 75% of the folk population in India is still using herbalmedicines because these are easily available in nature and the people havestrong faith in traditional medicine (Kaushik & Dhiman 1995, 2000; Khullar,2009, Vyas and Sharma, 2009). The ethnobiological knowledge of people andlisting of plants of particular region are important tools that may help inunderstanding human environment interactions (Gangwar et al., 2010). Theimportance of plants in ethnobotany has been great awakening for the need ofethnobotanical investigations in India. Number of workers viz. Theophrastus327-287 BC Dioscorides 50AD,Uddinet al., 1998, Singh 1999, Ramesh et.al2001, Goswami 2009b, Kumar and Kaushik 1999. The work on ethnobotanicalimportance of flora of Garhwal Himalaya has been put forward by Bir, 1982,Dixit, 1975, Pandeet.al 1989, Negi& Gaur, 1991,R.D.Gaur & B.P.Bhatt 1994,Joshi, Pramila 1997. A significant work has been done in angiosperms of regionbut the useful aspect of pteridophytes is yet neglected as compared to that ofangiosperm. Hence it is an attempt to bring out indigenous and ethnomedicallyimportant pteridophytes and proper documentation of their useful aspects.Theinformation and documentation gathered is based on interaction with folkloreof the area .The verification of information was further done through theliterature viz. Gaur and Painuli 1993., H.C.Pande, et al1997., H. C et.al 2000.,S .D Rout, T. Pande&N. Mishra 2009.and Singh et.al 2011.Methodology- The study is based on the field survey and published literatureon medicinal plants of Garhwal Himalaya and Dehradun. Remote villages ofthe area were surveyd in the year 2008-2012 and ethnobotanical informationwere collected by interacting with local people, medicine men and experiencedpeople.Result- In all 51 ferns are used in ethnobotanical practices in the district. Theethnobotanical categories of ferns from the study area are shown in the followingtable no 1:-
Table-1S.No Utility of ferns No. of species1. Ferns used for food, feed and delicacies - (16 species)2. Ferns used as fodder - (06 species)4. Ferns used in ornamental purposes (11 species)5. Ferns used in medicines - (46 species)6. Ferns used in other domestic utilities e.g for (07 species)
Manure formation, fencing, bedding and coushio-ning of cattle (Gau-shalas), for ornamentation, fordecoration, for thatching, roofing, etc
The ferns species used for different purposes form the study area areshown in table no 2:-

Research Journal of Social and Li fe Sciences, ISSN 0973-3914, Vol .-XIV- II, Year-07, June-2013 273
Fern species Uses Fo
od
Fodd
er
Med
icin
e
Oth
er u
se
Orn
amen
tal
1. Adiantum capillus-veneris L. + + 2. Adiantum edgeworthii L. + + 3. Adiantum incisum Forssk. + + 4. Adiantum philippense L. + + 5. Adiantum venustum D. Don + 6. Amelopteris prolifera (Retz.) Copel. + + 7. Araoistegia pseudocystopteris (Kunze) Copel. + 8. Asplenium adiantum–nigrum L. + 9. Asplenium dalhousiae Hook. + 10. Asplenium trichomanes L. + 11. Athyrium attenuatum (Cl.) Tagawa. + 12. Athyrium pectinatum (Wall. ex Mett) T. Moore. + + 13. Athyrium schimperi Moug.ex Fee + + 14. Athyrium strigillosum (T. Moore ex E. J. Lowe) T. Moore ex Salom.
+ +
15. Botrychium ternatum (Thunb.) Sw. + + 16. Botrychium lunaria (L.) Sw. + 17. Botrychium lanuginosus (Wall. ex Hook. et Grev.) Holub
+ +
18. Cystopteris fragilis (L.) Benth. + 19. Diplazium esculentum (Retz.) Sw. + + + + 20. Diplazium maximum (D. Don) C. Chr + 21. Drynaria mollis Bedd. + + 22. Dryopteris caroli-hopei Fraser- Jenk. + 23. Dryopteris chrysocoma (H. Christ) C. Chr + 24. Dryopteris cochleata (Ham. ex D. Don) C. Chr + + + 25. Dryopteris juxtaposita H. Christ + 26. Equisteum ramosissimum Desf. + 27. Hypodematium crenatum (L.) Hook + + 28. Hypolepis polypodiodes (Bl.) Nakai. + 29. Lygodium flexosum (L.) Sw. + 30. Lygodium japonicum (Thunb.) Sw. + + 31. Leucostegia truncata (D. Don) Fraser-Jenk + 32. Marseila minuta L. + 33. Microsorum membranecum (D. Don) Ching + 34. Nephrolepis auriculata (L.) Trimen. + + + 35. Oleandra wallichii (Hook.) C. Presl + 36. Onychium siliculosum (Desv.) C. Chr + + 37. Ophioglossum reticulatum L. + + 38. Ophioglossum petiolatum Hook. + 39. Osmunda regalis L. + 40. Polypodium lachnopus (Wall. ex Hook.) Ching + 41. Polystichum squarrosum (D. Don.) Fee + + 42. Pronephrium penangianum (Hook.) Haltt. +

Research Journal of Social and Li fe Sciences, ISSN 0973-3914, Vol .-XIV- II, Year-07, June-2013274
Note- 1. Food, 2. Fodder, 3. Medicinal, 4. Ornamental, 5.OthersThe ethnobotanically important ferns of Dehra Dun, their utilities are describedin detail in alphabetical order. For each the botanical name, part(s) used, utilityare provided.1. Adiantum capillus-veneris L.
Part used: Rhizome, Stipe, and Lamina.Medicinal use: It is diuretic and leaves extract used for throat pain and
bronchitis. It has anti cancerous, hypoglycemia, aphrodisiac, antifungalantibacterial and antiviral prosperities.2. Adiantum edgeworthii L.
Part used: FrondMedicinal use: Used in mouth blisters.
3. Adiantum incisum Forssk.Part used: Frond, leaves.Medicinal use: Infusion of young fronds is used in treatment against
malaria and bronchial disease. The leaves are useful against diabetes. Theleaves are used in controlling herpes a viral infection marked by appearanceof blisters.4. Adiantum philippense L.
Part used: Rhizome, Leaf, Root, Frond, Sporophyll.Medicinal use: The sporophyll is used in leprosy. The paste of frond and
rhizome is used for centipede bite. The rhizome is prescribed for strangely andin fever due to elephantiasis.5. Adiantum venustum D. Don
Part used: Whole plantMedicinal use: It helps in healing of wounds, fever, cough, asthma and
tumors, inflammatory disease of chest, emetic. It has antimicrobial activity.6. Amelopteris prolifera (Rtez.) Copel.
Part used: young frondFood: Young and tender frond are used as vegetable.Fodder: Along with grasses used as fodder.Medicinal use: It posses antiviral properties .
7. Araoistegia pseudocystopteris (Kunze) Copel.Part used: Frond.
1. Pteridium aquilinium (L.) Kuhn + + + + 2. Pteris biaurita L. + 3. Pteris cretica L. + + + 4. Pteris multifida Poiret. + + 5. Pteris vittata L. + + + 6. Selaginella involvens (Sw.) Spring + + 7. Odontosoria chinensis (L.) J. Sm + + 8. Tectaria coaudnata (Smith ) C. Chr + + 9. Woodwardia ungiemmata C. Presl. + +

Research Journal of Social and Li fe Sciences, ISSN 0973-3914, Vol .-XIV- II, Year-07, June-2013 275
Medicinal use: Decoction of fronds used as vermifuge.8. Asplenium adiantum –nigrum L.
Part used: Fronds, Leaves and RhizomeMedicinal use: Frond extract with honey is used for eye problems. The
leaves and rhizome is also used for treating jaundice and problems relating tospleen.9. Asplenium dalhousiae Hook.
Part used: Frond.Medicinal use: Used for mastitis.
10. Asplenium trichomanes L.Part used: Whole plant.Medicinal use: Leaf is smoked for cold, in head and chest, also used as
expectorant.11. Athyrium attenuatum (Cl.) Tagawa.
Parts used: Rhizome, frond.Medicinal use: decoction fronds are given in serious disorders of spleen
12. Athyrium pectinatum (Wall. ex Mett) T. Moore.Parts used: Leaves, Rhizome, Young frond.Food: Young fronds are used as vegetable.Fodder: Frond is used as fodder for cattle.Medicinal use: Rhizome is used as antiheleminthic.
13. Athyrium schimperi Moug.ex FeeParts used: frond.Food: Young frond is used as vegetable.Fodder: Frond as fodder for cattle.
14. Athyrium strigillosum (T. Moore ex E. J. Lowe) T. Moore exSalom.
Parts used: Leaves, Rhizome, young frond.Food: Young fronds are used as vegetable.Fodder: Frond is used as fodder for cattle.Medicinal use: Rhizome is used as antiheleminthic.
15. Botrychium ternatum (Thunb.) Sw.Parts used: Root, Young frondsFood: Young fronds are used as vegetables.Medicinal use: Decoction of roots is used in dysentery, Promotes the
healing of wounds.16. Botrychium lunaria (L.) Sw.
Parts used: Frond.Medicinal use: Decoction of frond is used in dysentery
17. Botrychium lanuginosus (Wall. ex Hook. etGrev.) HolubParts used: Whole plant.Food: Green fronds are utilized in vegetables

Research Journal of Social and Li fe Sciences, ISSN 0973-3914, Vol .-XIV- II, Year-07, June-2013276
Medicinal use: Plant is antidysentric and antibacterial. Rhizome paste isapplied on burns.18. Cystopteris fragilis (L.) Benth.
Parts used: RhizomeMedicinal use: decoction of rhizome is used in anthelmintic enema.
19. Diplazium esculentum (Retz.) Sw.Parts used: Root, Rhizome, Young frond, StipeFood : Boiled fronds are cut and fried in cooking oil with spices such as
seeds of Cleome viscosa L. Young fronds are used as green vegetables andalso used as salad or cooked as vegetables.
Fodder: It is also used as fodder.Medicinal use: The rhizome is used in tuberculosis. Juice of rhizome and
stipe is effective against cuts and burns.Other use: Dried frond is used as animal bedding material during winters.
The rhizomes are kept in the granaries to check them from insect and pests.20. Diplazium maximum (D. Don) C. Chr.
Parts used: Young frondFood: Young frond is used as vegetable.
21. Drynaria mollis Bedd.Parts used: RhizomeMedicinal use: A paste of rhizome is applied to treat backaches.Other use: In animals it used to washthe areas around dislocated bones
to relieve pain.22. Dryopteris caroli-hopei Fraser- Jenk.
Parts used: RhizomeMedicinal use: Rhizome is antihelminthic
23. Dryopteris chrysocoma (H. Christ) C. ChrParts used: Lamina, rhizomeMedicinal use: Juice of the rhizome is applied to cut and wounds. Lamina
after crushing works as antihelminthic24. Dryopteris cochleata (Ham. ex D. Don) C. Chr
Parts used: Rhizome and Young frondsFood: Young leaves are used as vegetablesMedicinal use:Whole plant extract is given in snake bite. Aqueous rhizome
extract is used for the treatment of gonorrhea.25. Dryopteris juxtaposita H. Christ
Parts used: FrondsMedicinal use: The frond enhances digestion.
26. Equisteum ramosissimum Desf.Parts used: Whole plantMedicinal use: It is used as diuretic, haemostatic, haemorpritic, and
possesantirheumatic, antifungal, antidiabetic, antiseptic and antiviral properties

Research Journal of Social and Li fe Sciences, ISSN 0973-3914, Vol .-XIV- II, Year-07, June-2013 277
27. Hypodematium crenatum (L.) HookParts used: Young fronds, Stipe baseFood: Stipe base and young fronds are used as vegetable during summerMedicinal use: Young fronds are used in relief from injury and insect
bite.28. Hypolepis polypodiodes (Bl.) Nakai.
Parts used: FrondsMedicinal use: Fronds are used for poultice boils.
29. Lygodium flexosum (L.) Sw.Parts used: Rhizome, Fronds, LeavesMedicinal use: Leaf powder mixed with milk given to children to increase
their memory Leaf paste is applied to fix fractured bone.30. Lygodium japonicum (Thunb.) Sw.
Parts used: Rhizome, Fronds, LaminaFodder: Used as cattle feedMedicinal use: Rhizome powder along with cow’s urine is effective as
antibacterial, antispasmodic.It is also used for rheumatism, disease of lungsand kidney.31. Leucostegia truncata (D. Don) Fraser-Jenk.
Parts used: RhizomeMedicinal use: Rhizome is used for constipation and is also antibacterial.
32. Marseila minuta L.Parts used: Leaves, Whole plantMedicinal use: It is used in epilepsy and behavior disorder. (Chaterjee
and Parkashi, 1991).It is also used in sleeping disorder and Hypertension (Sujanand Enayat, 2009)33. Microsorum membranecum (D. Don) Ching
Parts used: RhizomeMedicinal use: Rhizome is used for Ulcer, haematuria, dysuria, sore boil,
swelling and inflammation of red.34. Nephrolepis auriculata (L.) Trimen.
Parts used: Tubers, Rhizome, young shootsFood: Fresh tubers are eatenMedicinal use: Extract of frond helps in rheumatism, chest congestion,
nose blockage and loss of appetites, styptic, antifungal. It is also used in brainfever and headache by apply locally.
Ornamental: Plants are found in gardens of houses and offices.35. Oleandra wallichii(Hook.) C. Presl
Parts used: RhizomeMedicinal use: Rhizome is antidote. The paste of rhizome is used to
treat headache and dislocation of bones,36. Onychium siliculosum (Desv.) C. Chr

Research Journal of Social and Li fe Sciences, ISSN 0973-3914, Vol .-XIV- II, Year-07, June-2013278
Parts used: FrondsFodder: It is used as fodder for goats in high altitude.Medicinal use: Decoction of fronds help in dysentery.
37. Ophioglossum reticulatum L.Parts used: Leaves, frondsFood: Leaves are use as salad.Medicinal use: The paste of fresh leaf act as cooling agent on burns and
in treatment of wounds and inflammation38. Ophioglossum petiolatum Hook.
Parts used: Rhizome, TuberMedicinal use: Fresh rhizome and tuber paste is effective against hair
fall.39. Osmunda regalis L.
Parts used: Whole plantMedicinal use: Whole plant is used in treatment of rickets, rheumatism
and intestinal disorders.40. Polypodium lachnopus (Wall. ex Hook.) Ching
Parts used: RhizomeMedicinal use: Rhizome is purgative in nature.
41. Polystichum squarrosum (D. Don.) FeeParts used: Sporophyll, Rhizome.Medicinal use: The sporophyll extract is an anti antibacterial agent.
Rhizome decoction is used against pyloric disease.42. Pronephrium penangianum (Hook.) Haltt.
Parts used: Rhizome.Medicinal use: The Rhizome is used as astringent, detoxifier, in dysentery,
red eyes, acute conjunctivitis.43. Pteridium aquilinium (L.) Kuhn
Parts used: Rhizome, frondsFood: Rhizome is used as food.Fodder: Green fronds are used as fodder.Medicinal use: Frond and rhizome decoction is used in treatment of
worms. Rhizome is also effective against inflammation.Other use: Rhizome decoction is drunk as herbal tea.
44 Pteris biaurita L.Parts used: Frond, RhizomeMedicinal use: Frond juice is applied on cuts and bruises. Decoction of
rhizome and frond is given in chronic disorder45. Pteris cretica L.
Parts used: Frond, Whole plantMedicinal use: Fronds possess antibacterial properties. It also helps in
leprosy.

Research Journal of Social and Li fe Sciences, ISSN 0973-3914, Vol .-XIV- II, Year-07, June-2013 279
Other use: The whole plant is given to livestock during cough.Ornamental: Plant is also found in gardens.
46. Pteris multifida Poiret.Parts used: Frond and RhizomeMedicinal use: The roasted paste of rhizome helps to cure skin infections
in children’s.47. Pteris vittata L.
Parts used: Rhizome leaves and plantMedicinal use: Paste of leaves and fresh rhizome is effective against
glandular swelling. Fern of Pterisvittata have been used for carcinogenic activity(Siman et al., 2000; Somvanshi and Sharma, 2005).
Other use: Large fronds are used for thatching of roofOrnamental: Plant is also found in gardens.
48. Selaginella involvens (Sw.) SpringParts used: Whole plant.Medicinal use: Plants were dried and powder (1 teaspoon) is given orally
with milk for indigestion.49. Odontosoria chinensis (L.) J. Sm
Family: LindsaeaceaeParts used: Fronds, Pinnae and LeavesMedicinal use: Tender leaves helps in toothache. Fronds are found
effective in chronic enteritis.Other use: Pinnae is used as tea. Red dye is obtained from it after
drying50. Tectaria coaudnata (Smith ) C. Chr
Parts used: Fronds, Rhizome, Stipe and LeavesFodder: Leaves and tender fronds are used as fodder.Medicinal use: Decoction of leaves is used in asthma and bronchitis.
Plant decoction useful in colitis. Stipe is given in stomach pain.51. Woodwardia unigemmata C. Presl.
Parts used: Rhizome, Stipe and LaminaMedicinal use: Fronds are used during dysentery.Other use: Thatching of roofs is done by old stipes and fronds.
Acknowldgements- The authors are grateful to Dr. P. Singh, Director,Botanical Survey of India, Kolkata for providing facilities to work andencouragement.======================References-1. Gangwar, K.K., Deepali and Gangwar, R.S. (2010) Ethnomedicinal Plant Diversity
in Kumaun Himalaya of Uttarakhand, India.Nature and Science, 8(5):66-782. Gaur, R.D. and Bhatt, B.P. (1994) Folk utilization of some pteridophytes of
Deoprayag area in Garhwal Himalaya: India Econ. Bot., 48(2): 146-151.

Research Journal of Social and Li fe Sciences, ISSN 0973-3914, Vol .-XIV- II, Year-07, June-2013280
3. Gaur, R. D. and Painuli, P. (1993a) Some little known Pteridophytes from GarhwalHimalaya.Indian J.For.,16(1): 88-90.
4. Goswami, H.K. (2009b) Non angiospermic plants are also ancient medicinalplants: Conserve and explore them! Bionature 29: 95-107
5. Joshi, Pramila (1997) Ethonobotany of Pteridophytes of Hilly districts of U.P.India Indian fern J., 14: 14-18.
6. Kaushik, P. and Dhiman, A.K. (1995) Common Medicinal Pteridophytes, IndianFern J. 12:139-145.
7. Khullar S. P., Chadha J, Baghla, A. and Verma Sunil (2010 [2009]). Annotatedinventory of the pteridophytes of Sirmour district, Himachal Pradesh IndianFern J, 26:79—106.
8. Negi, K.S., Tiwari, J.K. and Gaur, R.D. (1987-88) A contribution to the flora ofKhatling glacier in the Garhwal Himalaya (District Tehri) U.P.J. Bomb. Nat.Hist. Soc. 84: 585-598.
9. Pande, P.C., Joshi, G.C. and Kandpal, M. M. (1989) Ethnobotany of KumaonHimalaya In: Himalaya: Enviroment Resource & Development (eds.) Singh,N.C. et al., Publishers Shree Almora Book. Depot.Almora (U.A) Pp 285-294.
10. Pande, H.C., Datt, B. and Pande, P.C. (2000) Notes on the Ethnomedicinal aspectof some common Pteridophytes of Almora district of KumaonHimal.(Uttaranchal), Ethnobotany, 56-59.
11. Ramesh, N, Vishwanathan M. B, Saraswathy A, Balakrishna K, Brindha and P,Lakshmanaperumalsamy P. (2001). Phytochemical and antimicrobial studies onDrynariaquercifolia.Fitoterapia,72: 934-6.
12. Rout, S.D., Panda T. and Mishra, N. (2009) Ethnomedicinal studies on somepteridophytes of Simlipal Biosphere Reserve, Orissa, India. InternationalJournal of Medicine and Medicinal Sciences, 1(5): 192 – 197.
13. Srivastava, K. (2007) Ethnobotanical Studies of some important FernsEthnobotanical leaflets 11: 231-234
14. Uddin, M.G. Mirza, M.M. and Pasha, M.K. (1998) The medicinal uses ofpteridophytes of Bangladesh.Bangladesh J. Plant Taxon. 5(2): 29-41.
15. Vyas, M.S. and Sharma, B.D. (2009) Ethnobotanical importance of ferns ofRajasthan In P.Kaushik (Ed) Indigenous Medicinal Plant Including Microbesand Fungipp 273-2802nd Enlarged Edition: Today and Tomoorrow’s Printerand publisher New Delhi.

Related Documents